EQUITY RESIDENTIAL
10-Ks and 10-Qs
|
|
|
|
|
|
|
|
|
|
|
|
|
|
|
|
|
|
|
|
|
|
|
|
|
|
|
|
|
|
|
|
|
|
|
|
|
|
|
|
|
|
|
|
|
|
|
|
|
|
|
|
|
UNITED STATES
SECURITIES AND EXCHANGE COMMISSION
Washington, D.C. 20549
FORM 10-K
x
ANNUAL REPORT PURSUANT TO SECTION 13 OR 15(d) OF
THE SECURITIES EXCHANGE ACT OF 1934
For the Fiscal Year Ended
DECEMBER 31, 2015
OR
¨
TRANSITION REPORT PURSUANT TO SECTION 13 OR 15(d) OF
THE SECURITIES EXCHANGE ACT OF 1934
For the transition period from
to
Commission File Number: 1-12252 (Equity Residential)
Commission File Number: 0-24920 (ERP Operating Limited Partnership)
EQUITY RESIDENTIAL
ERP OPERATING LIMITED PARTNERSHIP
(Exact name of registrant as specified in its charter)
|
Maryland (Equity Residential)
|
13-3675988 (Equity Residential)
|
|
Illinois (ERP Operating Limited Partnership)
|
36-3894853 (ERP Operating Limited Partnership)
|
|
(State or other jurisdiction of incorporation or organization)
|
(I.R.S. Employer Identification No.)
|
|
|
|
|
Two North Riverside Plaza, Chicago, Illinois 60606
|
(312) 474-1300
|
|
(Address of principal executive offices) (Zip Code)
|
(Registrant's telephone number, including area code)
|
Securities registered pursuant to Section 12(b) of the Act:
|
Common Shares of Beneficial Interest, $0.01 Par Value (Equity Residential)
|
New York Stock Exchange
|
|
7.57% Notes due August 15, 2026 (ERP Operating Limited Partnership)
|
New York Stock Exchange
|
|
(Title of each class)
|
(Name of each exchange on which registered)
|
Securities registered pursuant to Section 12(g) of the Act:
None (Equity Residential)
Units of Limited Partnership Interest (ERP Operating Limited Partnership)
(Title of each class)
Indicate by check mark if the registrant is a well-known seasoned issuer, as defined in Rule 405 of the Securities Act.
|
Equity Residential Yes
x
No
¨
|
ERP Operating Limited Partnership Yes
x
No
o
|
Indicate by check mark if the registrant is not required to file reports pursuant to Section 13 or Section 15(d) of the Act.
|
Equity Residential Yes
¨
No
x
|
ERP Operating Limited Partnership Yes
¨
No
x
|
Indicate by check mark whether the registrant (1) has filed all reports required to be filed by Section 13 or 15(d) of the Securities Exchange Act of 1934 during the preceding 12 months (or for such shorter period that the registrant was required to file such reports), and (2) has been subject to such filing requirements for the past 90 days.
|
Equity Residential Yes
x
No
¨
|
ERP Operating Limited Partnership Yes
x
No
¨
|
Indicate by check mark whether the registrant has submitted electronically and posted on its corporate Web site, if any, every Interactive Data File required to be submitted and posted pursuant to Rule 405 of Regulation S-T (§ 232.405 of this chapter) during the preceding 12 months (or for such shorter period that the registrant was required to submit and post such files).
|
Equity Residential Yes
x
No
¨
|
ERP Operating Limited Partnership Yes
x
No
¨
|
Indicate by check mark if disclosure of delinquent filers pursuant to Item 405 of Regulation S-K (§ 229.405 of this chapter) is not contained herein, and will not be contained, to the best of registrant’s knowledge, in definitive proxy or information statements incorporated by reference in Part III of this Form 10-K or any amendment to this Form 10-K.
|
Equity Residential
x
|
ERP Operating Limited Partnership
x
|
Indicate by check mark whether the registrant is a large accelerated filer, an accelerated filer, a non-accelerated filer, or a smaller reporting company. See the definitions of “large accelerated filer,” “accelerated filer” and “smaller reporting company” in Rule 12b-2 of the Exchange Act.
|
Equity Residential:
|
|
|
Large accelerated filer
x
|
Accelerated filer
¨
|
|
Non-accelerated filer
¨
(Do not check if a smaller reporting company)
|
Smaller reporting company
¨
|
|
ERP Operating Limited Partnership:
|
|
|
Large accelerated filer
¨
|
Accelerated filer
¨
|
|
Non-accelerated filer
x
(Do not check if a smaller reporting company)
|
Smaller reporting company
¨
|
Indicate by check mark whether the registrant is a shell company (as defined in Rule 12b-2 of the Act).
|
Equity Residential Yes
¨
No
x
|
ERP Operating Limited Partnership Yes
¨
No
x
|
The aggregate market value of Common Shares held by non-affiliates of the Registrant was approximately $25.2 billion based upon the closing price on
June 30, 2015
of $70.17 using beneficial ownership of shares rules adopted pursuant to Section 13 of the Securities Exchange Act of 1934 to exclude voting shares owned by Trustees and Executive Officers, some of whom may not be held to be affiliates upon judicial determination.
The number of Common Shares of Beneficial Interest, $0.01 par value, outstanding on
February 19, 2016
was 365,141,603.
2
DOCUMENTS INCORPORATED BY REFERENCE
Part III incorporates by reference certain information that will be contained in Equity Residential's Proxy Statement relating to its
2016
Annual Meeting of Shareholders, which Equity Residential intends to file no later than 120 days after the end of its fiscal year ended
December 31, 2015
, and thus these items have been omitted in accordance with General Instruction G(3) to Form 10-K. Equity Residential is the general partner and
96.2%
owner of ERP Operating Limited Partnership.
3
EXPLANATORY NOTE
This report combines the annual reports on Form 10-K for the year ended
December 31, 2015
of Equity Residential and ERP Operating Limited Partnership. Unless stated otherwise or the context otherwise requires, references to “EQR” mean Equity Residential, a Maryland real estate investment trust (“REIT”), and references to “ERPOP” mean ERP Operating Limited Partnership, an Illinois limited partnership. References to the “Company,” “we,” “us” or “our” mean collectively EQR, ERPOP and those entities/subsidiaries owned or controlled by EQR and/or ERPOP. References to the “Operating Partnership” mean collectively ERPOP and those entities/subsidiaries owned or controlled by ERPOP. The following chart illustrates the Company's and the Operating Partnership's corporate structure:
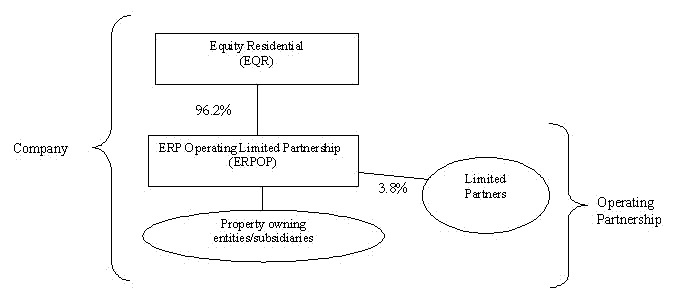
EQR is the general partner of, and as of
December 31, 2015
owned an approximate
96.2%
ownership interest in, ERPOP. The remaining
3.8%
interest is owned by limited partners. As the sole general partner of ERPOP, EQR has exclusive control of ERPOP's day-to-day management.
The Company is structured as an umbrella partnership REIT (“UPREIT”) and EQR contributes all net proceeds from its various equity offerings to ERPOP. In return for those contributions, EQR receives a number of OP Units (see definition below) in ERPOP equal to the number of Common Shares it has issued in the equity offering. Contributions of properties to the Company can be structured as tax-deferred transactions through the issuance of OP Units in ERPOP, which is one of the reasons why the Company is structured in the manner shown above. Based on the terms of ERPOP's partnership agreement, OP Units can be exchanged with Common Shares on a one-for-one basis. The Company maintains a one-for-one relationship between the OP Units of ERPOP issued to EQR and the Common Shares.
The Company believes that combining the reports on Form 10-K of EQR and ERPOP into this single report provides the following benefits:
|
•
|
enhances investors' understanding of the Company and the Operating Partnership by enabling investors to view the business as a whole in the same manner as management views and operates the business;
|
|
•
|
eliminates duplicative disclosure and provides a more streamlined and readable presentation since a substantial portion of the disclosure applies to both the Company and the Operating Partnership; and
|
|
•
|
creates time and cost efficiencies through the preparation of one combined report instead of two separate reports.
|
Management operates the Company and the Operating Partnership as one business. The management of EQR consists of the same members as the management of ERPOP.
The Company believes it is important to understand the few differences between EQR and ERPOP in the context of how EQR and ERPOP operate as a consolidated company. All of the Company's property ownership, development and related business operations are conducted through the Operating Partnership and EQR has no material assets or liabilities other than its investment in ERPOP. EQR's primary function is acting as the general partner of ERPOP. EQR also issues equity from time to time and guarantees certain debt of ERPOP, as disclosed in this report. EQR does not have any indebtedness as all debt is incurred by the Operating Partnership. The Operating Partnership holds substantially all of the assets of the Company, including the Company's ownership interests in its joint ventures. The Operating Partnership conducts the operations of the business and is structured as a partnership with no publicly traded equity. Except for the net proceeds from equity offerings by EQR, which are contributed to the capital of ERPOP in exchange for additional partnership interests in ERPOP (“OP Units”) (on a one-for-one Common Share per OP Unit basis) or additional preference units in ERPOP (on a one-for-one preferred share per preference unit basis), the
4
Operating Partnership generates all remaining capital required by the Company's business. These sources include the Operating Partnership's working capital, net cash provided by operating activities, borrowings under its revolving credit facility and/or commercial paper program, the issuance of secured and unsecured debt and equity securities and proceeds received from disposition of certain properties and joint ventures.
Shareholders' equity, partners' capital and noncontrolling interests are the main areas of difference between the consolidated financial statements of the Company and those of the Operating Partnership. The limited partners of the Operating Partnership are accounted for as partners' capital in the Operating Partnership's financial statements and as noncontrolling interests in the Company's financial statements. The noncontrolling interests in the Operating Partnership's financial statements include the interests of unaffiliated partners in various consolidated partnerships and development joint venture partners. The noncontrolling interests in the Company's financial statements include the same noncontrolling interests at the Operating Partnership level and limited partner OP Unit holders of the Operating Partnership. The differences between shareholders' equity and partners' capital result from differences in the equity issued at the Company and Operating Partnership levels.
To help investors understand the differences between the Company and the Operating Partnership, this report provides separate consolidated financial statements for the Company and the Operating Partnership; a single set of consolidated notes to such financial statements that includes separate discussions of each entity's debt, noncontrolling interests and shareholders' equity or partners' capital, as applicable; and a combined Management's Discussion and Analysis of Financial Condition and Results of Operations section that includes discrete information related to each entity.
This report also includes separate Part II, Item 9A. Controls and Procedures sections and separate Exhibits 31 and 32 certifications for each of the Company and the Operating Partnership in order to establish that the requisite certifications have been made and that the Company and the Operating Partnership are compliant with Rule 13a-15 or Rule 15d-15 of the Securities Exchange Act of 1934 and 18 U.S.C. §1350.
In order to highlight the differences between the Company and the Operating Partnership, the separate sections in this report for the Company and the Operating Partnership specifically refer to the Company and the Operating Partnership. In the sections that combine disclosure of the Company and the Operating Partnership, this report refers to actions or holdings as being actions or holdings of the Company. Although the Operating Partnership is generally the entity that directly or indirectly enters into contracts and joint ventures and holds assets and debt, reference to the Company is appropriate because the Company is one business and the Company operates that business through the Operating Partnership.
As general partner with control of ERPOP, EQR consolidates ERPOP for financial reporting purposes, and EQR essentially has no assets or liabilities other than its investment in ERPOP. Therefore, the assets and liabilities of the Company and the Operating Partnership are the same on their respective financial statements. The separate discussions of the Company and the Operating Partnership in this report should be read in conjunction with each other to understand the results of the Company on a consolidated basis and how management operates the Company.
5
EQUITY RESIDENTIAL
ERP OPERATING LIMITED PARTNERSHIP
TABLE OF CONTENTS
|
|
|
PAGE
|
|
|
PART I.
|
|
||
|
Item 1.
|
|||
|
Item 1A.
|
|||
|
Item 1B.
|
|||
|
Item 2.
|
|||
|
Item 3.
|
|||
|
Item 4.
|
|||
|
PART II.
|
|
|
|
|
Item 5.
|
|
||
|
Item 6.
|
|||
|
Item 7.
|
|||
|
Item 7A.
|
|||
|
Item 8.
|
|||
|
Item 9.
|
|||
|
Item 9A.
|
|||
|
Item 9B.
|
|||
|
PART III.
|
|
|
|
|
Item 10.
|
|||
|
Item 11.
|
|||
|
Item 12.
|
|||
|
Item 13.
|
|||
|
Item 14.
|
|||
|
PART IV.
|
|
|
|
|
Item 15.
|
|||
6
General
Equity Residential (“EQR”), a Maryland real estate investment trust (“REIT”) formed in March 1993, is an S&P 500 company focused on the acquisition, development and management of high quality apartment properties in top United States growth markets. ERP Operating Limited Partnership (“ERPOP”), an Illinois limited partnership, was formed in May 1993 to conduct the multifamily residential property business of Equity Residential. EQR has elected to be taxed as a REIT. References to the “Company,” “we,” “us” or “our” mean collectively EQR, ERPOP and those entities/subsidiaries owned or controlled by EQR and/or ERPOP. References to the “Operating Partnership” mean collectively ERPOP and those entities/subsidiaries owned or controlled by ERPOP.
EQR is the general partner of, and as of
December 31, 2015
owned an approximate
96.2%
ownership interest in, ERPOP. All of the Company's property ownership, development and related business operations are conducted through the Operating Partnership and EQR has no material assets or liabilities other than its investment in ERPOP. EQR issues public equity from time to time but does not have any indebtedness as all debt is incurred by the Operating Partnership. The Operating Partnership holds substantially all of the assets of the Company, including the Company's ownership interests in its joint ventures. The Operating Partnership conducts the operations of the business and is structured as a partnership with no publicly traded equity.
As of
December 31, 2015
, the Company, directly or indirectly through investments in title holding entities, owned all or a portion of
394
properties located in
12
states and the District of Columbia consisting of
109,652
apartment units. The ownership breakdown includes (table does not include various uncompleted development properties):
|
Properties
|
Apartment Units
|
|||||
|
Wholly Owned Properties
|
367
|
|
98,608
|
|
||
|
Master-Leased Properties – Consolidated
|
3
|
|
853
|
|
||
|
Partially Owned Properties – Consolidated
|
19
|
|
3,771
|
|
||
|
Partially Owned Properties – Unconsolidated
|
3
|
|
1,281
|
|
||
|
Military Housing
|
2
|
|
5,139
|
|
||
|
|
394
|
|
109,652
|
|
||
The Company's corporate headquarters is located in Chicago, Illinois and as of
December 31, 2015
, the Company also operated property management offices in each of its core markets and two of its non-core markets. As of
December 31, 2015
, the Company had approximately
3,500
employees who provided real estate operations, leasing, legal, financial, accounting, acquisition, disposition, development and other support functions.
Certain capitalized terms used herein are defined in the Notes to Consolidated Financial Statements. See also Note 17 in the Notes to Consolidated Financial Statements for additional discussion regarding the Company’s segment disclosures.
Available Information
You may access our Annual Report on Form 10-K, our Quarterly Reports on Form 10-Q, our Current Reports on Form 8-K and any amendments to any of those reports we file with the SEC free of charge at our website,
www.equityresidential.com
. These reports are made available at our website as soon as reasonably practicable after we file them with the SEC. The information contained on our website, including any information referred to in this report as being available on our website, is not a part of or incorporated into this report.
Business Objectives and Operating and Investing Strategies
The Company invests in high quality apartment communities located in strategically targeted markets with the goal of maximizing our risk adjusted total return (operating income plus capital appreciation) on invested capital.
We seek to maximize the income and capital appreciation of our properties by investing in markets that are characterized by conditions favorable to multifamily property operations and appreciation. We are focused on the six core coastal, high barrier to entry markets of Boston, New York, Washington D.C., Southern California (including Los Angeles, Orange County and San Diego), San Francisco and Seattle. These markets generally feature one or more of the following characteristics that allow us to increase rents:
7
|
▪
|
High barriers to entry where, because of land scarcity or government regulation, it is difficult or costly to build new apartment properties, creating limits on new supply;
|
|
▪
|
High home ownership costs;
|
|
▪
|
Strong economic growth leading to job growth and household formation, which in turn leads to high demand for our apartments;
|
|
▪
|
Urban core locations with an attractive quality of life leading to high resident demand and retention; and
|
|
▪
|
Favorable demographics contributing to a larger pool of target residents with a high propensity to rent apartments.
|
Our operating focus is on balancing occupancy and rental rates to maximize our revenue while exercising tight cost control to generate the highest possible return to our shareholders. Revenue is maximized by attracting qualified prospects to our properties, cost-effectively converting these prospects into new residents and keeping our residents satisfied so they will renew their leases upon expiration. While we believe that it is our high-quality, well-located assets that bring our customers to us, it is the customer service and superior value provided by our on-site personnel that keeps them renting with us and recommending us to their friends.
We use technology to engage our customers in the way that they want to be engaged. Many of our residents utilize our web-based resident portal which allows them to sign and renew their leases, review their accounts and make payments, provide feedback and make service requests on-line.
Acquisitions and developments may be financed from various sources of capital, which may include retained cash flow, issuance of additional equity and debt, sales of properties and joint venture agreements. In addition, the Company may acquire properties in transactions that include the issuance of partnership interests in the Operating Partnership (“OP Units”) as consideration for the acquired properties. Such transactions may, in certain circumstances, enable the sellers to defer, in whole or in part, the recognition of taxable income or gain that might otherwise result from the sales. The Company may acquire land parcels to hold and/or sell based on market opportunities as well as options to buy more land in the future. The Company may also seek to acquire properties by purchasing defaulted or distressed debt that encumbers desirable properties in the hope of obtaining title to property through foreclosure or deed-in-lieu of foreclosure proceedings.
Over the past several years, the Company has done an extensive repositioning of its portfolio from low barrier to entry/non-core markets to high barrier to entry/core markets. Since 2005, the Company has sold nearly
168,000
apartment units primarily in its non-core markets for an aggregate sales price of approximately
$16.6 billion
, acquired over
68,000
apartment units primarily in its core markets for approximately
$19.8 billion
and began approximately
$5.7 billion
of development projects primarily in its core markets. We are currently seeking to acquire and develop assets in the following six core coastal metropolitan areas: Boston, New York, Washington D.C., Southern California, San Francisco and Seattle. The sale of the Starwood portfolio described below combined with the other 2016 dispositions will complete the Company's planned exit from the South Florida, Denver and Phoenix markets as well as certain New England submarkets. See further discussion below regarding the Company's 2016 disposition activity.
As part of its strategy, the Company purchases completed and fully occupied apartment properties, partially completed or partially occupied properties and takes options on land or acquires land on which apartment properties can be constructed. We intend to hold a diversified portfolio of assets across our target markets. As of
December 31, 2015
, no single market/metropolitan area accounted for more than
17.6%
of our NOI, though NOI concentration has increased in 2016 following the sale of the Starwood portfolio.
We endeavor to attract and retain the best employees by providing them with the education, resources and opportunities to succeed. We provide many classroom and on-line training courses to assist our employees in interacting with prospects and residents as well as extensively train our customer service specialists in maintaining our properties and improvements, equipment and appliances. We actively promote from within and many senior corporate and property leaders have risen from entry level or junior positions. We monitor our employees' engagement by surveying them annually and have consistently received high engagement scores.
We have a commitment to sustainability and consider the environmental impacts of our business activities. Sustainability and social responsibility are key drivers of our focus on creating the best apartment communities for residents to live, work and play. We have a dedicated in-house team that initiates and applies sustainable practices in all aspects of our business, including investment activities, development, property operations and property management activities. With its high density, multifamily housing is, by its nature, an environmentally friendly property type. Our recent acquisition and development activities have been primarily concentrated in pedestrian-friendly urban locations near public transportation. When developing and renovating our
8
properties, we strive to reduce energy and water usage by investing in energy saving technology while positively impacting the experience of our residents and the value of our assets. We continue to implement a combination of irrigation, lighting, HVAC and renewable energy improvements at our properties that will reduce energy and water consumption. The Company was named the 2015 Global Residential Sector Leader by the Global Real Estate Sustainability Benchmark ("GRESB") survey, a globally recognized analysis of the sustainability indicators of more than 700 real estate portfolios worldwide. For additional information regarding our sustainability efforts, see our December
2015
Corporate Social Responsibility and Sustainability Report at our website,
www.equityresidential.com
. For 2016, we have added an express company-wide goal regarding enhanced sustainability efforts. Employees, including our executives, will have their performance against this goal evaluated as part of our annual performance review process.
Competition
All of the Company's properties are located in developed areas that include other multifamily properties. The number of competitive multifamily properties in a particular area could have a material effect on the Company's ability to lease apartment units at its properties and on the rents charged. The Company may be competing with other entities that have greater resources than the Company and whose managers have more experience than the Company's managers. In addition, other forms of rental properties and single family housing provide housing alternatives to potential residents of multifamily properties. See Item 1A.
Risk Factors
for additional information with respect to competition.
Starwood Transaction
Following the approval by the Company's Board of Trustees, the Company executed an agreement with controlled affiliates of Starwood Capital Group ("Starwood") on October 23, 2015 to sell a portfolio of 72 operating properties consisting of 23,262 apartment units located in five markets across the United States for $5.365 billion (the "Starwood Transaction"). On January 26 and 27, 2016, the Company closed on the sale of all of the portfolio described above. The sale of the Starwood portfolio, combined with other planned 2016 dispositions, will result in the Company's planned exit from the South Florida, Denver and Phoenix markets as well as certain New England submarkets. The Company intends to use the majority of the proceeds from the Starwood Transaction and other planned 2016 dispositions to pay two special dividends to its shareholders and holders of OP Units of between $10.00 and $12.00 per share/unit in the aggregate. On February 22, 2016, the Board of Trustees declared a special dividend of $8.00 per share/unit to be paid on March 10, 2016 to shareholders/unitholders of record as of March 3, 2016. The Company expects to pay an additional special dividend of approximately $2.00 to $4.00 per share/unit later in 2016. All future dividends remain subject to the discretion of the Company's Board of Trustees. The Company used and expects to use the majority of the remaining proceeds to reduce aggregate indebtedness in order to make the transaction leverage neutral. The Company has retired approximately $1.7 billion in secured and unsecured debt prior to scheduled maturity in early 2016 and expects to retire an additional $271.2 million at par at maturity in March 2016 using cash from these sales. See Notes 4, 11 and 18 in the Notes to Consolidated Financial Statements for further discussion.
Archstone Transaction
On February 27, 2013, the Company, AvalonBay Communities, Inc. (“AVB”) and certain of their respective subsidiaries completed their previously announced acquisition (the "Archstone Acquisition" or the "Archstone Transaction") from Archstone Enterprise LP ("Archstone" or "Enterprise") (which subsequently changed its name to Jupiter Enterprise LP), an affiliate of Lehman Brothers Holdings Inc. (“Lehman”) and its affiliates, of all of the assets of Enterprise (including interests in various entities affiliated with Enterprise), constituting a portfolio of apartment properties and other assets (the “Archstone Portfolio”). As a result of the Archstone Acquisition, the Company owns assets representing approximately 60% of the Archstone Portfolio. The consideration paid by the Company in connection with the Archstone Acquisition consisted of cash of approximately $4.0 billion (inclusive of $2.0 billion of Archstone secured mortgage principal paid off in conjunction with the closing), 34,468,085 Common Shares (which shares had a total value of $1.9 billion based on the February 27, 2013 closing price of EQR common shares of $55.99 per share) issued to the seller and the assumption of approximately $3.1 billion of mortgage debt (inclusive of a net mark-to-market premium of $127.9 million) and approximately 60% of all of the other assets and liabilities related to the Archstone Portfolio. See Note 4 in the Notes to Consolidated Financial Statements for further discussion.
EQR issues public equity from time to time and guarantees certain debt of ERPOP. EQR does not have any indebtedness as all debt is incurred by the Operating Partnership. In addition, ERPOP issues OP Units and preference interests ("Preference Units") from time to time.
9
Please refer to Item 7,
Management’s Discussion and Analysis of Financial Condition and Results of Operations,
for the Company’s and the Operating Partnership's Capital Structure charts as of
December 31, 2015
.
Major Debt and Equity Activities for the Years Ended
December 31, 2015
,
2014
and
2013
During
2015
:
|
▪
|
The Company repaid
$368.5 million
of mortgage debt.
|
|
▪
|
The Company repaid
$300.0 million
of
6.584%
unsecured notes at maturity.
|
|
▪
|
The Company issued
$450.0 million
of ten-year
3.375%
fixed rate public notes, receiving net proceeds of
$447.5 million
before underwriting fees, hedge termination costs and other expenses, at an all-in effective interest rate of
3.81%
after termination of various forward starting swaps in conjunction with the issuance (see Note 9 in the Notes to Consolidated Financial Statements for further discussion).
|
|
▪
|
The Company issued
$300.0 million
of thirty-year
4.50%
fixed rate public notes, receiving net proceeds of
$298.9 million
before underwriting fees and other expenses, at an all-in effective interest rate of
4.55%
.
|
|
▪
|
The Company issued 1,456,363 Common Shares pursuant to its Share Incentive Plans and received net proceeds of approximately $59.5 million.
|
|
▪
|
The Company issued 68,462 Common Shares pursuant to its Employee Share Purchase Plan and received net proceeds of approximately $4.4 million.
|
|
▪
|
The Company repurchased and retired 254,400 of its Series K Cumulative Redeemable Preferred Shares with a par value of $12.7 million for total cash consideration of approximately $16.3 million inclusive of premiums and accrued dividends through the redemption date.
|
During
2014
:
|
▪
|
The Company assumed $28.9 million of mortgage debt on one property.
|
|
▪
|
The Company repaid $100.7 million of mortgage debt.
|
|
▪
|
The Company repaid $500.0 million of 5.250% unsecured notes at maturity.
|
|
▪
|
The Company repaid its $750.0 million unsecured term loan facility in conjunction with the note issuances discussed below.
|
|
▪
|
The Company issued $450.0 million of five-year 2.375% fixed rate public notes, receiving net proceeds of $449.6 million before underwriting fees and other expenses, at an all-in effective interest rate of 2.52% and swapped the notes to a floating interest rate in conjunction with the issuance (see Note 9 in the Notes to Consolidated Financial Statements for further discussion).
|
|
▪
|
The Company issued $750.0 million of thirty-year 4.50% fixed rate public notes, receiving net proceeds of $744.7 million before underwriting fees, hedge termination costs and other expenses, at an all-in effective interest rate of 4.57% after termination of various forward starting swaps in conjunction with the issuance (see Note 9 in the Notes to Consolidated Financial Statements for further discussion).
|
|
▪
|
The Company issued 2,086,380 Common Shares pursuant to its Share Incentive Plans and received net proceeds of approximately $82.6 million.
|
|
▪
|
The Company issued 68,807 Common Shares pursuant to its Employee Share Purchase Plan and received net proceeds of approximately $3.4 million.
|
|
▪
|
The Company repurchased and retired 31,240 of its Common Shares at a price of $56.87 per share for total consideration of $1.8 million (all related to the vesting of employee restricted shares). See Note 3 in the Notes to Consolidated Financial Statements for further discussion.
|
During
2013
:
|
▪
|
The Company assumed as part of the Archstone Transaction,
$2.2 billion
of mortgage debt held in two Fannie Mae loan pools, consisting of
$1.2 billion
collateralized by
16
properties with an interest rate of
6.256%
and a maturity date of
November 1, 2017
("Pool 3") and $963.5 million collateralized by
15
properties with an interest rate of
5.883%
and a maturity date of
November 1, 2014
("Pool 4").
|
|
▪
|
The Company paid down $825.0 million of Pool 3 mortgage debt and repaid $963.5 million of Pool 4 mortgage debt.
|
|
▪
|
The Company assumed as part of the Archstone Transaction,
$346.6 million
of tax-exempt bonds on
four
properties with interest rates ranging from SIFMA plus
0.860%
to SIFMA plus
1.402%
and maturity dates through
November 15, 2036
.
|
10
|
▪
|
The Company assumed as part of the Archstone Transaction,
$339.0 million
of other mortgage debt on
three
properties with fixed interest rates ranging from
0.100%
to
5.240%
and maturity dates through
May 1, 2061
.
|
|
▪
|
The Company assumed as part of the Archstone Transaction,
$34.1 million
of other mortgage debt on
one
property with a variable rate of LIBOR plus
1.75%
and a maturity date of
September 1, 2014
.
|
|
▪
|
The Company obtained an
$800.0 million
secured loan from a large insurance company which matures on
November 10, 2023
, is interest only and carries a fixed interest rate of
4.21%
and was used in part to pay down Pool 3.
|
|
▪
|
The Company repaid
$400.0 million
of
5.200%
unsecured notes at maturity.
|
|
▪
|
The Company issued
$500.0 million
of ten-year
3.00%
fixed rate public notes, receiving net proceeds of
$495.6 million
before underwriting fees and other expenses, at an all-in effective interest rate of
3.998%
.
|
|
▪
|
The Company entered into a senior unsecured
$750.0 million
delayed draw term loan facility which was fully drawn on February 27, 2013 in connection with the Archstone Acquisition. The maturity date of January 11, 2015 was subject to a one-year extension option exercisable by the Company. The interest rate on advances under the term loan facility generally was LIBOR plus a spread (
1.20%
), which was dependent on the credit rating of the Company's long-term debt. The facility was paid off in the second quarter of 2014.
|
|
▪
|
The Company issued 34,468,085 Common Shares to an affiliate of Lehman having a value of
$1.9 billion
(based on the February 27, 2013 closing price of EQR Common Shares of
$55.99
per share) as partial consideration for the portion of the Archstone Portfolio acquired by the Company. Lehman has since sold all of these Common Shares.
|
|
▪
|
The Company issued 586,017 Common Shares pursuant to its Share Incentive Plans and received net proceeds of approximately $17.3 million.
|
|
▪
|
The Company issued 73,468 Common Shares pursuant to its Employee Share Purchase Plan and received net proceeds of approximately $3.4 million.
|
EQR and ERPOP currently have an active universal shelf registration statement for the issuance of equity and debt securities that automatically became effective upon filing with the SEC on July 30, 2013 and expires on July 30, 2016. Per the terms of ERPOP's partnership agreement, EQR contributes the net proceeds of all equity offerings to the capital of ERPOP in exchange for additional OP Units (on a one-for-one Common Share per OP Unit basis) or preference units (on a one-for-one preferred share per preference unit basis).
Credit Facilities
EQR does not have any indebtedness as all debt is incurred by the Operating Partnership. EQR guarantees the Operating Partnership’s revolving credit facility up to the maximum amount and for the full term of the facility.
On January 11, 2013, the Company replaced its existing $1.75 billion facility with a $2.5 billion unsecured revolving credit facility maturing April 1, 2018. The Company has the ability to increase available borrowings by an additional $500.0 million by adding additional banks to the facility or obtaining the agreement of existing banks to increase their commitments. The interest rate on advances under the facility will generally be LIBOR plus a spread (currently
0.95%
) and the Company pays an annual facility fee (currently
15 basis points
). Both the spread and the facility fee are dependent on the credit rating of the Company's long-term debt.
On
February 2, 2015
the Company entered into an unsecured commercial paper note program in the United States. The Company may borrow up to a maximum of
$500.0 million
under this program subject to market conditions. The notes will be sold under customary terms in the United States commercial paper note market and will rank pari passu with all of the Company's other unsecured senior indebtedness. As of
February 19, 2016
, no amounts were outstanding under this program. As of
December 31, 2015
, there was a balance of
$387.3 million
on the commercial paper program (
$387.5 million
in principal outstanding net of an unamortized discount of
$0.2 million
). The notes bear interest at various floating rates with a weighted average of
0.56%
for the year ended
December 31, 2015
and a weighted average maturity of
19
days as of
December 31, 2015
.
As of
February 19, 2016
, no amounts were outstanding and the amount available on the revolving credit facility was
$2.44 billion
(net of
$64.5 million
which was restricted/dedicated to support letters of credit). As of
December 31, 2015
, the amount available on the revolving credit facility was
$2.07 billion
(net of
$45.1 million
which was restricted/dedicated to support letters of credit and net of
$387.5 million
outstanding on the commercial paper program). During the year ended
December 31, 2015
, the weighted average interest rate on the revolving credit facility was
1.07%
. As of
December 31, 2014
, the amount available on the revolving credit facility was
$2.12 billion
(net of
$43.8 million
which was restricted/dedicated to support letters of credit and net of the
$333.0 million
outstanding on the revolving credit facility). During the year ended
December 31, 2014
, the weighted average interest rate on the revolving credit facility was
0.95%
.
11
Environmental Considerations
See Item 1A.
Risk Factors
for information concerning the potential effects of environmental regulations on our operations.
General
References to "EQR" mean Equity Residential, a Maryland real estate investment trust ("REIT"), and references to "ERPOP" mean ERP Operating Limited Partnership, an Illinois limited partnership. Unless otherwise indicated, when used in this section, the terms “Company,” “we,” “us” or “our” mean collectively EQR, ERPOP and those entities/subsidiaries owned or controlled by EQR and/or ERPOP and the term “Operating Partnership” means collectively ERPOP and those entities/subsidiaries owned or controlled by ERPOP. This Item 1A. includes forward-looking statements. You should refer to our discussion of the qualifications and limitations on forward-looking statements included in Item 7.
The occurrence of the events discussed in the following risk factors could adversely affect, possibly in a material manner, our business, financial condition or results of operations, which could adversely affect the value of our common shares of beneficial interest or preferred shares of beneficial interest (which we refer to collectively as “Shares”), Preference Units, OP Units, restricted units (formerly known as Long-Term Incentive Plan ("LTIP") Units) and our public unsecured debt. In this section, we refer to the Shares, Preference Units, OP Units, restricted units and public unsecured debt together as our “securities” and the investors who own such securities as our “security holders”.
Our performance and securities value are subject to risks associated with the real estate industry.
General
Real property investments are subject to varying degrees of risk and are relatively illiquid. Numerous factors may adversely affect the economic performance and value of our properties and the ability to realize that value. These factors include changes in the global, national, regional and local economic climates, local conditions such as an oversupply of multifamily properties or a reduction in demand for our multifamily properties, the attractiveness of our properties to residents, competition from other multifamily properties and single family homes and changes in market rental rates. Our performance also depends on our ability to collect rent from residents and to pay for adequate maintenance, insurance and other operating costs, including real estate taxes, all of which could increase over time. These operating expenses could rise faster than our revenues causing our income to decline. In circumstances where we buy or sell portfolios of properties, including large portfolios, overhead (property management expense and general and administrative expense) may not increase/decrease proportionally with the associated changes in revenue. Sources of labor and materials required for maintenance, repair, capital expenditure or development may be more expensive than anticipated. Also, the expenses of owning and operating a property are not necessarily reduced when circumstances such as market factors and competition cause a reduction in income from the property.
We may be unable to renew leases or relet units as leases expire.
When our residents decide to leave our apartments, whether because they decide not to renew their leases or they leave prior to their lease expiration date, we may not be able to relet their apartment units. Even if the residents do renew or we can relet the apartment units, the terms of renewal or reletting may be less favorable than current lease terms. If we are unable to promptly renew the leases or relet the apartment units, or if the rental rates upon renewal or reletting are significantly lower than expected rates, then our results of operations and financial condition will be adversely affected. If residents do not experience increases in their income, we may be unable to increase rent and/or delinquencies may increase. Occupancy levels and market rents may be adversely affected by national and local economic and market conditions including, without limitation, new construction and excess inventory of multifamily and single family housing, increasing portions of single family housing stock being converted to rental use, rental housing subsidized by the government, other government programs that favor single family rental housing or owner occupied housing over multifamily rental housing, governmental regulations, slow or negative employment growth and household formation, the availability of low-interest mortgages or the availability of mortgages requiring little or no down payment for single family home buyers, changes in social preferences and the potential for geopolitical instability, all of which are beyond our control. In addition, various state and local municipalities are considering and may continue to consider rent control legislation or take other actions which could limit our ability to raise rents. Finally, the federal government's policies, many of which may encourage home ownership, can increase competition and possibly limit our ability to raise rents. Consequently, our cash flow and ability to service debt and make distributions to security holders could be reduced.
12
The retail/commercial space at our properties primarily serves as an additional amenity for our residents. The long term nature of our retail/commercial leases (generally five to ten years with market based renewal options) and the characteristics of many of our tenants (generally small, local businesses) may subject us to certain risks. We may not be able to lease new space for rents that are consistent with our projections or for market rates. Also, when leases for our existing retail/commercial space expire, the space may not be relet or the terms of reletting, including the cost of allowances and concessions to tenants, may be less favorable than the current lease terms. Our properties compete with other properties with retail/commercial space. The presence of competitive alternatives may affect our ability to lease space and the level of rents we can obtain. If our retail/commercial tenants experience financial distress or bankruptcy, they may fail to comply with their contractual obligations, seek concessions in order to continue operations or cease their operations which could adversely impact our results of operations and financial condition. The revenues from our retail/commercial space represent approximately 4% of our total rental income.
We have increased our concentration of properties in our core markets, which could have an adverse effect on our operations if a particular market is adversely affected by economic or other conditions.
Over the past ten years, the Company has exited its low barrier to entry/non-core markets as part of its strategy to reposition its portfolio to high barrier to entry/core markets, leaving the Company highly concentrated in its six core markets. If any one or more of our core markets (Boston, New York, Washington D.C., Southern California, San Francisco and Seattle) is adversely affected by local or regional economic conditions (such as business layoffs, industry slowdowns, changing demographics and other factors) or local real estate conditions (such as oversupply of or reduced demand for multifamily properties), such conditions may have an increased adverse impact on our results of operations than if our portfolio was more geographically diverse.
Because real estate investments are illiquid, we may not be able to sell properties when appropriate.
Real estate investments generally cannot be sold quickly. We may not be able to reconfigure our portfolio promptly in response to economic or other conditions. We may be unable to consummate such dispositions in a timely manner, on attractive terms, or at all. This inability to reallocate our capital promptly could adversely affect our financial condition and ability to make distributions to our security holders.
New acquisitions, development projects and/or rehabs may fail to perform as expected and competition for acquisitions may result in increased prices for properties.
We intend to actively acquire, develop and rehab multifamily properties for rental operations as market conditions dictate. We may also acquire multifamily properties that are unoccupied or in the early stages of lease up. We may be unable to lease up these apartment properties on schedule, resulting in decreases in expected rental revenues and/or lower yields due to lower occupancy and rates as well as higher than expected concessions or higher than expected operating expenses. We may not be able to achieve rents that are consistent with expectations for acquired, developed or rehabbed properties. We may underestimate the costs necessary to bring an acquired property up to standards established for its intended market position, to complete a development property or to complete a rehab. Additionally, we expect that other real estate investors with capital will compete with us for attractive investment opportunities or may also develop properties in markets where we focus our development and acquisition efforts. This competition (or lack thereof) may increase (or depress) prices for multifamily properties. We may not be in a position or have the opportunity in the future to make suitable property acquisitions on favorable terms. We have acquired in the past and intend to continue to pursue the acquisition of properties and portfolios of properties, including large portfolios, that could increase our size and result in alterations to our capital structure. The total number of apartment units under development, costs of development and estimated completion dates are subject to uncertainties arising from changing economic conditions (such as the cost of labor and construction materials), competition and local government regulation.
In connection with such government regulation, we may incur liability if our properties are not constructed and operated in compliance with the accessibility provisions of the Americans with Disabilities Act, the Fair Housing Act or other federal, state or local requirements. Noncompliance could result in fines, subject us to lawsuits and require us to remediate or repair the noncompliance.
Development and construction risks could affect our profitability.
We intend to continue to develop multifamily properties. These activities can include long planning and entitlement timelines and can involve complex and costly activities, including significant environmental remediation or construction work in high-density urban areas. We may abandon opportunities that we have already begun to explore for a number of reasons, including changes in local market conditions or increases in construction or financing costs, and, as a result, we may fail to recover expenses already incurred in exploring those opportunities. The occupancy rates and rents at a property may fail to meet our original expectations for a number of reasons, including changes in market and economic conditions beyond our control and the development
13
by competitors of competing properties. We may be unable to obtain, or experience delays in obtaining, necessary zoning, occupancy, or other required governmental or third party permits and authorizations, which could result in increased costs or the delay or abandonment of opportunities.
We own certain properties subject to ground leases that may limit our use of the properties, restrict our ability to finance, sell or otherwise transfer our interests in these properties and expose us to loss of the properties if such agreements are breached by us or terminated.
The Company owns the building and improvements and leases the land underlying the improvements under several long-term ground leases. These ground leases may impose limitations on our use of the properties, restrict our ability to finance, sell or otherwise transfer our interests in the properties or restrict the leasing of the properties. These restrictions may limit our ability to timely sell or exchange the properties, impair the properties' value or negatively impact our ability to find suitable residents for the properties. In addition, we could lose our interests in the properties if the ground leases are breached by us or terminated. Certain of these ground leases have payments subject to annual escalations and/or periodic fair market value adjustments which could adversely affect our financial condition or results of operations.
Our investments in joint ventures could be adversely affected by our lack of sole decision-making authority regarding major decisions, our reliance on our joint venture partners' financial condition, any disputes that may arise between us and our joint venture partners and our exposure to potential losses from the actions of our joint venture partners.
We currently do and may continue in the future to develop and acquire properties in joint ventures with other persons or entities when we believe circumstances warrant the use of such structures. A portion of the assets acquired in the Archstone Transaction were acquired through joint ventures with AVB that neither we nor AVB control solely. We have several joint ventures with other real estate investors. Joint venture investments, including the joint ventures with AVB, involve risks not present with respect to our wholly owned properties, including the following:
|
•
|
our joint venture partners might experience financial distress, become bankrupt or fail to fund their share of required capital contributions, which may delay construction or development of a property or increase our financial commitment to the joint venture;
|
|
•
|
we may be responsible to our partners for indemnifiable losses;
|
|
•
|
our joint venture partners may have business interests or goals with respect to a property that conflict with our business interests and goals, which could increase the likelihood of disputes regarding the ownership, management or disposition of the property;
|
|
•
|
we may be unable to take actions that are opposed by our joint venture partners under arrangements that require us to share decision-making authority over major decisions affecting the ownership or operation of the joint venture and any property owned by the joint venture, such as the sale or financing of the property or the making of additional capital contributions for the benefit of the property;
|
|
•
|
our joint venture partners may take actions that we oppose;
|
|
•
|
our ability to sell or transfer our interest in a joint venture to a third party may be restricted without prior consent of our joint venture partners;
|
|
•
|
we may disagree with our joint venture partners about decisions affecting a property or the joint venture, which could result in litigation or arbitration that increases our expenses, distracts our officers and disrupts the day-to-day operations of the property, including by delaying important decisions until the dispute is resolved; and
|
|
•
|
we may suffer losses as a result of actions taken by our joint venture partners with respect to our joint venture investments.
|
At times we have entered into agreements providing for joint and several liability with our partners. We also have in the past and could choose in the future to guarantee part of or all of certain joint venture debt. Frequently, we and our partners may each have the right to trigger a buy-sell arrangement, which could cause us to sell our interest, or acquire our partners' interest, at a time when we otherwise would not have initiated such a transaction. Any of these risks could materially and adversely affect our ability to generate and recognize attractive returns on our joint venture investments, which could have a material adverse effect on our results of operations, financial condition and distributions to our shareholders.
14
Several of the assets we acquired in the Archstone Transaction along with certain preferred interests acquired in joint ventures with AVB as part of the Archstone Transaction are subject to tax protection agreements, which could limit our flexibility with respect to our ownership of such assets or cause us to incur material costs.
Several of the assets we acquired in the Archstone Transaction were contributed to Archstone subject to various agreements limiting the ability of the owner of the property to take actions that would trigger income tax liability for the contributing owner of the property, including a taxable disposition of the property. In addition, we will also be required to maintain a certain amount of qualified nonrecourse financing on the tax protected properties during their respective restricted periods. Our obligations relating to the tax protected properties may affect the way in which we conduct our business, including whether, when and under what circumstances we sell properties or interests therein and the timing and nature of our financings and refinancing transactions. As a result, we may not be able to dispose of or refinance the tax protected properties when to do so may have otherwise been favorable to us and our shareholders, which could have a material adverse effect on our results of operations and financial condition. Certain preferred interests acquired in joint ventures with AVB as part of the Archstone Transaction have complex tax requirements that, if violated, may cause us to be required to indemnify the preferred stockholders or AVB for certain tax protection costs.
Changes in market conditions and volatility of share prices could adversely affect the market price of our Common Shares.
The stock markets, including the New York Stock Exchange, on which we list our Common Shares, have experienced significant price and volume fluctuations over time. As a result, the market price of our Common Shares could be similarly volatile, and investors in our Common Shares may experience a decrease in the value of their shares, including decreases unrelated to our operating performance or prospects. The market price of our Common Shares may decline or fluctuate significantly in response to many factors, including but not limited to the following:
|
•
|
general market and economic conditions;
|
|
•
|
actual or anticipated variations in our guidance, quarterly operating results or dividends;
|
|
•
|
changes in our funds from operations, normalized funds from operations or earnings estimates;
|
|
•
|
difficulties or inability to access capital or extend or refinance debt;
|
|
•
|
large portfolio acquisitions or dispositions;
|
|
•
|
decreasing (or uncertainty in) real estate valuations;
|
|
•
|
rising crime rates in markets where our primarily urban portfolio is concentrated;
|
|
•
|
a change in analyst and/or credit ratings;
|
|
•
|
adverse market reaction to any additional debt we incur in the future;
|
|
•
|
governmental regulatory action, including changes or proposed changes to the mandates of Fannie Mae or Freddie Mac, and changes in tax laws;
|
|
•
|
the payment of our planned special dividends;
|
|
•
|
the issuance of additional Common Shares, or the perception that such issuances might occur, including under EQR's At-The-Market ("ATM") share offering program; and
|
|
•
|
the resale of substantial amounts of our common shares, or the anticipation of the resale of such shares, by large holders of our securities.
|
We may not have sufficient cash flows from operations after capital expenditures to cover our distributions and our dividend policy may lead to quicker dividend reductions.
We generally consider our cash flows provided by operating activities after capital expenditures to be adequate to meet operating requirements and payment of regular distributions to our security holders. While our current dividend policy makes it less likely that we will over distribute, it will also lead to a dividend reduction more quickly should operating results deteriorate or large portfolio sales occur. However, whether due to changes in the dividend policy or otherwise, there may be times when we experience shortfalls in our coverage of distributions, which may cause us to consider reducing our distributions and/or using the proceeds from property dispositions or additional financing transactions to make up the difference. Should these shortfalls occur for lengthy periods of time or be material in nature, our financial condition may be adversely affected and we may not be able to maintain our current distribution levels. See Item 7 (page 55) for additional discussion regarding our dividend policy.
15
The value of investment securities could result in losses to the Company.
From time to time, the Company holds investment securities and/or cash investments that have various levels of repayment and liquidity risk, including government obligations and bond funds, money market funds or bank deposits. On occasion we also may purchase securities of companies in our own industry as a means to invest funds. There may be times when we experience declines in the value of these investment securities, which may result in losses to the Company and our financial condition or results of operations could be adversely affected. Sometimes the cash we deposit at a bank substantially exceeds the FDIC insurance limit or we invest cash in money market or similar type funds with investment management institutions that may be subject to, now or in the future, liquidity restrictions, resulting in risk to the Company of loss or lack of immediate availability of funds if these banks or institutions fail to meet their obligations.
Any weaknesses identified in our internal control over financial reporting could have an adverse effect on our share price.
Section 404 of the Sarbanes-Oxley Act of 2002 requires us to evaluate and report on our internal control over financial reporting. If we identify one or more material weaknesses in our internal control over financial reporting, we could lose investor confidence in the accuracy and completeness of our financial reports, which in turn could have an adverse effect on our share price.
The occurrence of cyber incidents, or a deficiency in our cybersecurity, could negatively impact our business by causing a disruption to our operations, a compromise or corruption of our confidential information, and/or damage to our reputation and business relationships, all of which could negatively impact our financial results.
A cyber incident is considered to be any adverse event that threatens the confidentiality, integrity or availability of our information resources. More specifically, a cyber incident is an intentional attack or an unintentional event that can include gaining unauthorized access to systems to disrupt operations, corrupt data or steal confidential information, including information regarding our residents and employees. As our reliance on technology has increased, so have the risks posed to our systems, both internal and those we have outsourced to third party service providers. In addition, information security risks have generally increased in recent years due to the rise in new technologies and the increased sophistication and activities of perpetrators of cyber attacks. Our primary risks that could directly result from the occurrence of a cyber incident include operational interruption, damage to our reputation, damage to our business relationships and private data exposure. We have implemented processes, procedures and controls to help mitigate these risks, but these measures, as well as our increased awareness of a risk of a cyber incident, do not guarantee that our financial results will not be negatively impacted by such an incident.
Changes in laws and litigation risk could affect our business.
We are generally not able to pass through to our residents under existing leases any real estate or other federal, state or local taxes. Consequently, any such tax increases may adversely affect our financial condition and limit our ability to make distributions to our security holders.
We may become involved in legal proceedings, including but not limited to, proceedings related to consumer, shareholder, employment, environmental, development, condominium conversion, tort and commercial legal issues that, if decided adversely to or settled by us, could result in liability material to our financial condition or results of operations.
Environmental problems are possible and can be costly.
Federal, state and local laws and regulations relating to the protection of the environment may require a current or previous owner or operator of real estate to investigate and clean up hazardous or toxic substances or petroleum product releases at such property. The owner or operator may have to pay a governmental entity or third parties for property damage and for investigation and clean-up costs incurred by such parties in connection with the contamination. These laws typically impose clean-up responsibility and liability without regard to whether the owner or operator knew of or caused the presence of the contaminants. Even if more than one person may have been responsible for the contamination, each person covered by the environmental laws may be held responsible for all of the clean-up costs incurred. In addition, third parties may sue the owner or operator of a site for damages and costs resulting from environmental contamination emanating from that site.
Substantially all of our properties have been the subject of environmental assessments completed by qualified independent environmental consulting companies. While these environmental assessments have not revealed, nor are we aware of, any environmental liability that our management believes would have a material adverse effect on our business, results of operations, financial condition or liquidity, there can be no assurance that we will not incur such liabilities in the future.
16
We are aware that some of our properties have lead paint and have implemented an operations and maintenance program at each of those properties. While we do not currently anticipate that we will incur any material liabilities as a result of the presence of lead paint at our properties, there can be no assurance that we will not incur such liabilities in the future.
There have been a number of lawsuits against owners and managers of multifamily properties alleging personal injury and property damage caused by the presence of mold in residential real estate. While we have adopted programs designed to minimize the existence of mold in any of our properties as well as guidelines for promptly addressing and resolving reports of mold to minimize any impact mold might have on our residents or the property, should mold become an issue in the future, our financial condition or results of operations may be adversely affected.
We cannot be assured that existing environmental assessments of our properties reveal all environmental liabilities, that any prior owner of any of our properties did not create a material environmental condition not known to us, or that a material environmental condition does not otherwise exist as to any of our properties.
Insurance policies can be costly and may not cover all losses, which may adversely affect our financial condition or results of operations.
As of
December 31, 2015
, the Company's property insurance policies provide for a per occurrence deductible of $250,000. Any earthquake and named windstorm losses in critical areas are subject to a deductible of 5% of the values of the buildings involved in the losses. The Company also typically self-insures a substantial portion of the first $50 million of a property loss in excess of these base deductibles. Should a claim exceed these amounts, it would be 100% covered by insurance. Furthermore, the Company purchased additional coverage in the event that the Company suffers multiple non-catastrophic occurrences with losses from $25 million to $50 million within the same policy year. The Company's general liability and worker's compensation policies at
December 31, 2015
provide for a $2.0 million and $1.0 million per occurrence deductible, respectively. These higher deductible and self-insured retention amounts do expose the Company to greater potential for uninsured losses. The Company also has become more susceptible to large losses as it has transformed its portfolio, becoming more concentrated in fewer, more valuable assets over a smaller geographical footprint. Furthermore, the potential impact of climate change, increased severe weather or earthquakes could cause a significant increase in insurance premiums and deductibles, or a decrease in the availability of coverage, either of which could expose the Company to even greater uninsured losses which may adversely affect our financial condition or results of operations.
The Company also has $750.0 million in terrorism insurance coverage, with a $100,000 deductible. This coverage excludes losses from nuclear, biological and chemical attacks. In the event of a terrorist attack impacting one or more of our properties, we could lose the revenues from the property, our capital investment in the property and possibly face liability claims from residents or others suffering injuries or losses.
As of
December 31, 2015
, the Company's cyber liability insurance policy provides for a $5.0 million policy aggregate limit and a per occurrence deductible of $250,000. Cyber liability insurance generally covers costs associated with the wrongful release, through inadvertent breach or network attack, of personally identifiable information such as social security or credit card numbers. This cyber policy would cover the cost of victim notification, credit monitoring and other crisis response expenses.
The Company relies on third party insurance providers for its property, general liability and worker's compensation insurance. While there has yet to be any non-performance by these major insurance providers, should any of them experience liquidity issues or other financial distress, it could negatively impact the Company. In addition, the Company annually assesses its insurance needs based on the cost of coverage and other factors. We may choose to self insure a greater portion of this risk in the future or may choose to have higher deductibles or lesser policy terms.
Damage from catastrophic weather and other natural events and climate change could result in losses to the Company.
Certain of our properties are located in areas that may experience catastrophic weather and other natural events from time to time, including fires, snow or ice storms, windstorms or hurricanes, earthquakes, flooding or other severe weather. These adverse weather and natural events could cause substantial damages or losses to our properties which could exceed our insurance coverage. In the event of a loss in excess of insured limits, we could lose our capital invested in the affected property, as well as anticipated future revenue from that property. We could also continue to be obligated to repay any mortgage indebtedness or other obligations related to the property. Any such loss could materially and adversely affect our business and our financial condition and results of operations.
To the extent that significant changes in the climate occur in areas where our properties are located, we may experience
17
extreme weather and changes in precipitation and temperature, all of which may result in physical damage to or a decrease in demand for properties located in these areas or affected by these conditions. Should the impact of climate change be material in nature, including destruction of our properties, or occur for lengthy periods of time, our financial condition or results of operations may be adversely affected.
In addition, changes in federal and state legislation and regulation on climate change could result in increased capital expenditures to improve the energy efficiency of our existing properties and could also require us to spend more on our new development properties without a corresponding increase in revenue.
The inability of Lehman to fulfill its indemnification obligations to us under the purchase agreement for the Archstone Transaction could increase our liabilities and adversely affect our results of operations and financial condition.
In addition to certain indemnification obligations of each party to the purchase agreement for the Archstone Transaction relating to breaches of fundamental representations and warranties and breaches of covenants and certain other specified matters, we negotiated as a term in the purchase agreement that Lehman retain responsibility for and indemnify us against damages resulting from certain third-party claims or other liabilities. These third-party claims and other liabilities include, without limitation, costs associated with various litigation matters. Lehman filed for bankruptcy protection under Chapter 11 of the Bankruptcy Code in September 2008 and is currently in the process of post-petition liquidation. If Lehman completes its liquidation prior to the termination of their indemnity obligations to us under the purchase agreement, or otherwise distributes substantially all of its assets to its creditors prior to such time, Lehman may not be able to satisfy its obligations with respect to claims and retained liabilities covered by the purchase agreement. The failure of Lehman to satisfy such obligations could have a material adverse effect on our results of operations and financial condition because claimants may successfully assert that we are liable for those claims and/or retained liabilities. In addition, we expect that certain obligations of Lehman to indemnify us will terminate upon expiration of the applicable indemnification period (generally no more than four years following the closing). The assertion of third-party claims after the expiration of the applicable indemnification period, or the failure of Lehman to satisfy its indemnification obligations, could have a material adverse effect on our results of operations and financial condition.
Non-performance by our operating counterparties could adversely affect our performance.
We have relationships with and, from time to time, we execute transactions with or receive services from many counterparties. As a result, defaults by counterparties could result in services not being provided, or volatility in the financial markets could affect counterparties' ability to complete transactions with us as intended, both of which could result in disruptions to our operations that may adversely affect our business and results of operations.
Debt financing and preferred shares/preference units could adversely affect our performance.
General
Please refer to Item 7,
Management's Discussion and Analysis of Financial Condition and Results of Operations
, for the Company's total debt and unsecured debt summaries as of
December 31, 2015
.
In addition to debt, we have a liquidation value of $37.3 million of outstanding preferred shares of beneficial interest/preference units with a dividend preference of 8.29% per annum as of
December 31, 2015
. Our use of debt and preferred equity financing creates certain risks, including the following:
Disruptions in the financial markets could adversely affect our ability to obtain debt financing and impact our acquisitions and dispositions.
Dislocations and liquidity disruptions in capital and credit markets could impact liquidity in the debt markets, resulting in financing terms that are less attractive to us and/or the unavailability of certain types of debt financing. Should the capital and credit markets experience volatility and the availability of funds again become limited, or be available only on unattractive terms, we will incur increased costs associated with issuing debt instruments. In addition, it is possible that our ability to access the capital and credit markets may be limited or precluded by these or other factors at a time when we would like, or need, to do so, which would adversely impact our ability to refinance maturing debt and/or react to changing economic and business conditions. Uncertainty in the credit markets could negatively impact our ability to make acquisitions and make it more difficult or not possible for us to sell properties or may adversely affect the price we receive for properties that we do sell, as prospective buyers may experience increased costs of debt financing or difficulties in obtaining debt financing. Potential continued disruptions in the financial markets could also have other unknown adverse effects on us or the economy generally and may cause the price of our securities to fluctuate significantly and/or to decline.
18
Potential reforms to Fannie Mae and Freddie Mac could adversely affect our performance.
Through their lender originator networks, Fannie Mae and Freddie Mac (the "Government Sponsored Enterprises" or "GSEs") are significant lenders both to the Company and to buyers of the Company's properties. The GSEs have a mandate to support multifamily housing through their financing activities. Any changes to their mandates, reductions in their size or the scale of their activities or loss of key personnel could have an impact on the Company and may, among other things, lead to lower values for our assets and higher interest rates on our borrowings. Disruptions in the floating rate tax-exempt bond market (where interest rates reset weekly) and in the credit market's perception of the GSEs, which guarantee and provide liquidity for many of these bonds, have been experienced in the past and may be experienced in the future and could result in an increase in interest rates on these debt obligations. These bonds could also be put to our consolidated subsidiaries if the GSEs fail to satisfy their guaranty obligations. While this obligation is in almost all cases non-recourse to us, this could cause the Company to have to repay these obligations on short notice or risk foreclosure actions on the collateralized assets.
Non-performance by our financial counterparties could adversely affect our performance.
Although we have not experienced any material counterparty non-performance, disruptions in financial and credit markets could, among other things, impede the ability of our counterparties to perform on their contractual obligations. There are multiple financial institutions that are individually committed to lend us varying amounts as part of our revolving credit facility. Should any of these institutions fail to fund their committed amounts when contractually required, our financial condition could be adversely affected. Should several of these institutions fail to fund, we could experience significant financial distress.
The Company also has developed assets with joint venture partners which were financed by financial institutions that have experienced varying degrees of distress in the past and could experience similar distress as economic conditions change. If one or more of these lenders fail to fund when contractually required, the Company or its joint venture partner may be unable to complete construction of its development properties.
A significant downgrade in our credit ratings could adversely affect our performance.
A significant downgrade in our credit ratings, while not affecting our ability to draw proceeds under the revolving credit facility, would cause our borrowing costs to increase under the revolving credit facility, impact our ability to borrow secured and unsecured debt, impair our ability to access the commercial paper market or otherwise limit our access to capital. In addition, a downgrade below investment grade would require us to post cash collateral and/or letters of credit in favor of some of our secured lenders to cover our self-insured property and liability insurance deductibles or to obtain lower deductible insurance compliant with the lenders' requirements at the lower ratings level.
Scheduled debt payments could adversely affect our financial condition.
In the future, our cash flow could be insufficient to meet required payments of principal and interest or to pay distributions on our securities at expected levels.
We may not be able to refinance existing debt, including joint venture indebtedness (which in virtually all cases requires substantial principal payments at maturity) and, if we can, the terms of such refinancing might not be as favorable as the terms of existing indebtedness. If principal payments due at maturity cannot be refinanced, extended or paid with proceeds of other capital transactions, such as new equity capital, our operating cash flow will not be sufficient in all years to repay all maturing debt. As a result, certain of our other debt may cross default, we may be forced to postpone capital expenditures necessary for the maintenance of our properties, we may have to dispose of one or more properties on terms that would otherwise be unacceptable to us or we may be forced to allow the mortgage holder to foreclose on a property. Foreclosure on mortgaged properties or an inability to refinance existing indebtedness would likely have a negative impact on our financial condition and results of operations.
Please refer to Item 7,
Management's Discussion and Analysis of Financial Condition and Results of Operations
, for the Company's debt maturity schedule as of
December 31, 2015
.
Financial covenants could adversely affect the Company's financial condition.
The mortgages on our properties may contain customary negative covenants that, among other things, limit our ability, without the prior consent of the lender, to further mortgage the property and to reduce or change insurance coverage. In addition, our unsecured credit facility contains certain restrictions, requirements and other limitations on our ability to incur debt. The indentures under which a substantial portion of our unsecured debt was issued also contain certain financial and operating covenants
19
including, among other things, maintenance of certain financial ratios, as well as limitations on our ability to incur secured and unsecured debt (including acquisition financing), and to sell all or substantially all of our assets. Our credit facility and indentures are cross-defaulted and also contain cross default provisions with other material debt. While the Company believes it was in compliance with its unsecured public debt covenants for both the years ended
December 31, 2015
and
2014
, should it fall out of compliance, it would likely have a negative impact on our financial condition and results of operations.
Some of the properties were financed with tax-exempt bonds or otherwise contain certain restrictive covenants or deed restrictions, including affordability requirements. The Company, and from time to time its consultants, monitor compliance with the restrictive covenants and deed restrictions that affect these properties. If these compliance requirements restrict our ability to increase our rental rates to low or moderate-income residents, or eligible/qualified residents, then our income from these properties may be limited. While we generally believe that the interest rate benefit attendant to properties with tax-exempt bonds more than outweighs any loss of income due to restrictive covenants or deed restrictions, this may not always be the case. Some of these requirements are complex and our failure to comply with them may subject us to material fines or liabilities.
Our degree of leverage could limit our ability to obtain additional financing.
Our degree of leverage could have important consequences to security holders. For example, the degree of leverage could affect our ability to obtain additional financing in the future for working capital, capital expenditures, acquisitions, development or other general corporate purposes, making us more vulnerable to a downturn in business or the economy in general. Our consolidated debt-to-total market capitalization ratio was 26.2% as of
December 31, 2015
. In addition, our most restrictive unsecured public debt covenants are as follows:
|
December 31,
2015 |
December 31,
2014 |
|||||
|
Total Debt to Adjusted Total Assets (not to exceed 60%)
|
38.5
|
%
|
39.2
|
%
|
||
|
Secured Debt to Adjusted Total Assets (not to exceed 40%)
|
16.5
|
%
|
18.4
|
%
|
||
|
Consolidated Income Available for Debt Service to
|
|
|
|
|
||
|
Maximum Annual Service Charges
|
|
|
|
|
||
|
(must be at least 1.5 to 1)
|
3.67
|
|
3.38
|
|
||
|
Total Unsecured Assets to Unsecured Debt
|
|
|
|
|
||
|
(must be at least 150%)
|
336.8
|
%
|
336.5
|
%
|
||
Rising interest rates could adversely affect cash flow.
Advances under our credit facility bear interest at a variable rate based upon LIBOR at various interest periods, plus a spread dependent upon the Operating Partnership's credit rating, or based upon bids received from the lending group. Borrowings under our commercial paper program also bear interest at variable rates. Certain public issuances of our senior unsecured debt instruments may also, from time to time, bear interest at floating rates or be swapped to a floating rate of interest. We may also borrow additional money with variable interest rates in the future. Increases in interest rates would increase our interest expense under these debt instruments and would increase the costs of refinancing existing debt and of issuing new debt. Accordingly, higher interest rates could adversely affect cash flow and our ability to service our debt and make distributions to security holders.
Derivatives and hedging activity could adversely affect cash flow.
In the normal course of business, we use derivatives to manage our exposure to interest rate volatility on debt instruments, including hedging for future debt issuances. At other times we may utilize derivatives to increase our exposure to floating interest rates. We may also use derivatives to manage our exposure to foreign exchange rates or manage commodity prices in the daily operations of our business. There can be no assurance that these hedging arrangements will have the desired beneficial impact. These arrangements, which can include a number of counterparties, may expose us to additional risks, including failure of any of our counterparties to perform under these contracts, and may involve extensive costs, such as transaction fees or breakage costs, if we terminate them. No strategy can completely insulate us from the risks associated with interest rate, foreign exchange or commodity pricing fluctuations.
We depend on our key personnel.
We depend on the efforts of the Chairman of our Board of Trustees, Samuel Zell, and our executive officers, particularly David J. Neithercut, our President and Chief Executive Officer (“CEO”). If they resign or otherwise cease to be employed by us, our operations could be temporarily adversely affected. Mr. Zell has entered into retirement benefit and noncompetition agreements
20
with the Company.
Shareholders' ability to effect changes in control of the Company is limited.
Provisions of our declaration of trust and bylaws could inhibit changes in control.
Certain provisions of our Declaration of Trust and Bylaws may delay or prevent a change in control of the Company or other transactions that could provide the security holders with a premium over the then-prevailing market price of their securities or which might otherwise be in the best interest of our security holders. This includes the 5% Ownership Limit described below. While our existing preferred shares/preference units do not have these provisions, any future series of preferred shares/preference units may have certain voting provisions that could delay or prevent a change in control or other transactions that might otherwise be in the interest of our security holders. Our Bylaws require certain information to be provided by any security holder, or persons acting in concert with such security holder, who proposes business or a nominee at an annual meeting of shareholders, including disclosure of information related to hedging activities and investment strategies with respect to our securities. These requirements could delay or prevent a change in control or other transactions that might otherwise be in the interest of our security holders.
We have a share ownership limit for REIT tax purposes.
To remain qualified as a REIT for federal income tax purposes, not more than 50% in value of our outstanding Shares may be owned, directly or indirectly, by five or fewer individuals at any time during the last half of any year. To facilitate maintenance of our REIT qualification, our Declaration of Trust, subject to certain exceptions, prohibits ownership by any single shareholder of more than 5% of the lesser of the number or value of any outstanding class of common or preferred shares. We refer to this restriction as the “Ownership Limit.” Absent any exemption or waiver granted by our Board of Trustees, securities acquired or held in violation of the Ownership Limit will be transferred to a trust for the exclusive benefit of a designated charitable beneficiary, and the security holder's rights to distributions and to vote would terminate. A transfer of Shares may be void if it causes a person to violate the Ownership Limit. The Ownership Limit could delay or prevent a change in control and, therefore, could adversely affect our security holders' ability to realize a premium over the then-prevailing market price for their Shares. To reduce the ability of the Board to use the Ownership Limit as an anti-takeover device, the Company's Ownership Limit requires, rather than permits, the Board to grant a waiver of the Ownership Limit if the individual seeking a waiver demonstrates that such ownership would not jeopardize the Company's status as a REIT. We have issued several of these waivers in the past.
Our preferred shares may affect changes in control.
Our Declaration of Trust authorizes the Board of Trustees to issue up to 100 million preferred shares, and to establish the preferences and rights (including the right to vote and the right to convert into common shares) of any preferred shares issued. The Board of Trustees may use its powers to issue preferred shares and to set the terms of such securities to delay or prevent a change in control of the Company, even if a change in control were in the interest of security holders.
Inapplicability of Maryland law limiting certain changes in control.
Certain provisions of Maryland law applicable to real estate investment trusts prohibit “business combinations” (including certain issuances of equity securities) with any person who beneficially owns ten percent or more of the voting power of outstanding securities, or with an affiliate who, at any time within the two-year period prior to the date in question, was the beneficial owner of ten percent or more of the voting power of the Company's outstanding voting securities (an “Interested Shareholder”), or with an affiliate of an Interested Shareholder. These prohibitions last for five years after the most recent date on which the Interested Shareholder became an Interested Shareholder. After the five-year period, a business combination with an Interested Shareholder must be approved by two super-majority shareholder votes unless, among other conditions, holders of common shares receive a minimum price for their shares and the consideration is received in cash or in the same form as previously paid by the Interested Shareholder for its common shares. As permitted by Maryland law, however, the Board of Trustees of the Company has opted out of these restrictions with respect to any business combination involving Mr. Zell and certain of his affiliates and persons acting in concert with them. Consequently, the five-year prohibition and the super-majority vote requirements will not apply to a business combination involving us and/or any of them. Such business combinations may not be in the best interest of our security holders.
Our status as a REIT is dependent on compliance with federal income tax requirements.
Our failure to qualify as a REIT would have serious adverse consequences to our security holders.
We believe that we have qualified for taxation as a REIT for federal income tax purposes since our taxable year ended December 31, 1992 based, in part, upon opinions of tax counsel received whenever we have issued equity securities or engaged
21
in significant merger transactions. We plan to continue to meet the requirements for taxation as a REIT. Many of these requirements, however, are highly technical and complex. We cannot, therefore, guarantee that we have qualified or will qualify as a REIT in the future. The determination that we are a REIT requires an analysis of various factual matters that may not be totally within our control. For example, to qualify as a REIT, our gross income must generally come from rental and other real estate or passive related sources that are itemized in the REIT tax laws. We are also required to distribute to security holders at least 90% of our REIT taxable income excluding net capital gains. The fact that we hold our assets through the Operating Partnership further complicates the application of the REIT requirements. Even a technical or inadvertent mistake could jeopardize our REIT status; however, the REIT qualification rules permit REITs in certain circumstances to pay a monetary penalty for inadvertent mistakes rather than lose REIT status. There is also risk that Congress and the IRS might make changes to the tax laws and regulations, and the courts might issue new rulings that make it more difficult, or impossible, for us to remain qualified as a REIT. We do not believe, however, that any pending or proposed tax law changes would jeopardize our REIT status.
If we fail to qualify as a REIT, we would be subject to federal income tax at regular corporate rates. Also, unless the IRS granted us relief under certain statutory provisions, we would remain disqualified from taxation as a REIT for four years following the year in which we failed to qualify as a REIT. If we fail to qualify as a REIT, we would have to pay significant income taxes. We therefore would have less money available for investments or for distributions to security holders. This would likely have a significant adverse effect on the value of our securities. In addition, we would no longer be required to make any distributions to security holders. Even if we qualify as a REIT, we are and will continue to be subject to certain federal, state and local taxes on our income and property. In addition, various business activities which generate income that is not qualifying income for a REIT are conducted through taxable REIT subsidiaries and will be subject to federal and state income tax at regular corporate rates to the extent they generate taxable income.
We could be disqualified as a REIT or have to pay taxes if our merger partners did not qualify as REITs.
If any of our prior merger partners had failed to qualify as a REIT throughout the duration of their existence, then they might have had undistributed “Subchapter C corporation earnings and profits” at the time of their merger with us. If that were the case and we did not distribute those earnings and profits prior to the end of the year in which the merger took place, we might not qualify as a REIT. We believe, based in part upon opinions of legal counsel received pursuant to the terms of our merger agreements as well as our own investigations, among other things, that each of our prior merger partners qualified as a REIT and that, in any event, none of them had any undistributed “Subchapter C corporation earnings and profits” at the time of their merger with us. If any of our prior merger partners failed to qualify as a REIT, an additional concern would be that they could have been required to recognize taxable gain at the time they merged with us. We would be liable for the tax on such gain. We also could have to pay corporate income tax on any gain existing at the time of the applicable merger on assets acquired in the merger if the assets are sold within ten years of the merger.
Compliance with REIT distribution requirements may affect our financial condition and our shareholders' liquidity.
Distribution requirements may increase the indebtedness of the Company.
We may be required from time to time, under certain circumstances, to accrue as income for tax purposes interest and rent earned but not yet received. In such event, or upon our repayment of principal on debt, we could have taxable income without sufficient cash to enable us to meet the distribution requirements of a REIT. Accordingly, we could be required to borrow funds or liquidate investments on adverse terms in order to meet these distribution requirements.
Tax elections regarding distributions may impact future liquidity of the Company or our shareholders.
In past years we have made, and under certain circumstances may consider making again in the future, a tax election to treat future distributions to shareholders as distributions in the current year. This election, which is provided for in the Internal Revenue Code, may allow us to avoid increasing our dividends or paying additional income taxes in the current year. However, this could result in a constraint on our ability to decrease our dividends in future years without creating risk of either violating the REIT distribution requirements or generating additional income tax liability.
The Internal Revenue Service has published several rulings that allow REITs to offer shareholders the choice of stock or cash with respect to the receipt of a dividend (an "elective stock dividend"). However, REITs are also permitted to limit the amount of cash paid to all shareholders to 20% of the total dividend paid. Therefore, it is possible that the total tax burden to shareholders resulting from an elective stock dividend may exceed the amount of cash received by the shareholder.
22
Federal Income Tax Considerations
General
The following discussion summarizes the federal income tax considerations material to a holder of common shares. It is not exhaustive of all possible tax considerations. For example, it does not give a detailed discussion of any state, local or foreign tax considerations. The following discussion also does not address all tax matters that may be relevant to prospective shareholders in light of their particular circumstances. Moreover, it does not address all tax matters that may be relevant to shareholders who are subject to special treatment under the tax laws, such as insurance companies, tax-exempt entities, financial institutions or broker-dealers, foreign corporations, persons who are not citizens or residents of the United States and persons who own shares through a partnership or other entity treated as a flow-through entity for federal income tax purposes.
The specific tax attributes of a particular shareholder could have a material impact on the tax considerations associated with the purchase, ownership and disposition of common shares. Therefore, it is essential that each prospective shareholder consult with his or her own tax advisors with regard to the application of the federal income tax laws to the shareholder's personal tax situation, as well as any tax consequences arising under the laws of any state, local or foreign taxing jurisdiction.
The information in this section is based on the current Internal Revenue Code, current, temporary and proposed Treasury regulations, the legislative history of the Internal Revenue Code, current administrative interpretations and practices of the Internal Revenue Service, including its practices and policies as set forth in private letter rulings, which are not binding on the Internal Revenue Service, and existing court decisions. Future legislation, regulations, administrative interpretations and court decisions could change current law or adversely affect existing interpretations of current law. Any change could apply retroactively. Thus, it is possible that the Internal Revenue Service could challenge the statements in this discussion, which do not bind the Internal Revenue Service or the courts, and that a court could agree with the Internal Revenue Service.
Recent legislation
On December 18, 2015, President Obama signed into law the Consolidated Appropriations Act, 2016, an omnibus spending bill, with a division referred to as the Protecting Americans from Tax Hikes Act of 2015 (the “PATH Act”). The PATH Act modifies a number of important rules regarding the taxation of REITs and their shareholders, none of which however should materially impact us or our operations. The relevant rules are incorporated in the following sections.
Our taxation
We elected REIT status beginning with the year that ended December 31, 1992. In any year in which we qualify as a REIT, we generally will not be subject to federal income tax on the portion of our REIT taxable income or capital gain that we distribute to our shareholders. This treatment substantially eliminates the double taxation that applies to most corporations, which pay a tax on their income and then distribute dividends to shareholders who are in turn taxed on the amount they receive. We elected taxable REIT subsidiary status for certain of our corporate subsidiaries engaged in activities which cannot be performed directly by a REIT, such as condominium conversion and sale activities. As a result, we will be subject to federal income tax on the taxable income generated by these activities in our taxable REIT subsidiaries.
We will be subject to federal income tax at regular corporate rates upon our REIT taxable income or capital gains that we do not distribute to our shareholders. In addition, we will be subject to a 4% excise tax if we do not satisfy specific REIT distribution requirements. We could also be subject to the “alternative minimum tax” on our items of tax preference. In addition, any net income from “prohibited transactions” (i.e., dispositions of property, other than property held by a taxable REIT subsidiary, held primarily for sale to customers in the ordinary course of business) will be subject to a 100% tax. We could also be subject to a 100% penalty tax on certain payments received from or on certain expenses deducted by a taxable REIT subsidiary if any such transaction is not respected by the Internal Revenue Service. If we fail to satisfy the 75% gross income test or the 95% gross income test (described below) but have maintained our qualification as a REIT because we satisfied certain other requirements, we will still generally be subject to a 100% penalty tax on the taxable income attributable to the gross income that caused the income test failure. If we fail to satisfy any of the REIT asset tests (described below) by more than a
de minimis
amount, due to reasonable cause, and we nonetheless maintain our REIT qualification because of specified cure provisions, we will be required to pay a tax equal to the greater of $50,000 or the highest marginal corporate tax rate multiplied by the net income generated by the non-qualifying assets. If we fail to satisfy any provision of the Internal Revenue Code that would result in our failure to qualify as a REIT (other than a violation of the REIT gross income or asset tests described below) and the violation is due to reasonable cause, we may retain our REIT qualification but we will be required to pay a penalty of $50,000 for each such failure. Moreover, we may be subject to taxes in certain situations and on certain transactions that we do not presently contemplate.
23
We believe that we have qualified as a REIT for all of our taxable years beginning with 1992. We also believe that our current structure and method of operation is such that we will continue to qualify as a REIT. However, given the complexity of the REIT qualification requirements, we cannot provide any assurance that the actual results of our operations have satisfied or will satisfy the requirements under the Internal Revenue Code for a particular year.
If we fail to qualify for taxation as a REIT in any taxable year and the relief provisions described herein do not apply, we will be subject to tax on our taxable income at regular corporate rates. We also may be subject to the corporate “alternative minimum tax.” As a result, our failure to qualify as a REIT would significantly reduce the cash we have available to distribute to our shareholders. Unless entitled to statutory relief, we would not be able to re-elect to be taxed as a REIT until our fifth taxable year after the year of disqualification. It is not possible to state whether we would be entitled to statutory relief.
Our qualification and taxation as a REIT depend on our ability to satisfy various requirements under the Internal Revenue Code. We are required to satisfy these requirements on a continuing basis through actual annual operating and other results. Accordingly, there can be no assurance that we will be able to continue to operate in a manner so as to remain qualified as a REIT.
Ownership of Taxable REIT Subsidiaries by Us
. The Internal Revenue Code provides that REITs may own greater than ten percent of the voting power and value of the securities of a “taxable REIT subsidiary” or “TRS”, provided that the aggregate value of all of the TRS securities held by the REIT does not exceed 25% of the REIT's total asset value (20% for taxable years beginning January 1, 2018). TRSs are corporations subject to tax as a regular “C” corporation that have elected, jointly with a REIT, to be a TRS. Generally, a taxable REIT subsidiary may own assets that cannot otherwise be owned by a REIT and can perform impermissible tenant services (discussed below), which would otherwise taint our rental income under the REIT income tests. However, the REIT will be obligated to pay a 100% penalty tax on some payments that we receive or on certain expenses deducted by our TRSs if the economic arrangements between us, our tenants and the TRS are not comparable to similar arrangements among unrelated parties. A TRS may also receive income from prohibited transactions without incurring the 100% federal income tax liability imposed on REITs. Income from prohibited transactions may include the purchase and sale of land, the purchase and sale of completed development properties and the sale of condominium units.
TRSs pay federal and state income tax at the full applicable corporate rates. The amount of taxes paid on impermissible tenant services income and the sale of real estate held primarily for sale to customers in the ordinary course of business may be material in amount. The TRSs will attempt to reduce, if possible, the amount of these taxes, but we cannot guarantee whether, or the extent to which, measures taken to reduce these taxes will be successful. To the extent that these companies are required to pay taxes, less cash may be available for distributions to shareholders.
Share Ownership Test and Organizational Requirement
. In order to qualify as a REIT, our shares of beneficial interest must be held by a minimum of 100 persons for at least 335 days of a taxable year that is 12 months, or during a proportionate part of a taxable year of less than 12 months. Also, not more than 50% in value of our shares of beneficial interest may be owned directly or indirectly by applying certain constructive ownership rules, by five or fewer individuals during the last half of each taxable year. In addition, we must meet certain other organizational requirements, including, but not limited to, that (i) the beneficial ownership in us is evidenced by transferable shares and (ii) we are managed by one or more trustees. We believe that we have satisfied all of these tests and all other organizational requirements and that we will continue to do so in the future. In order to ensure compliance with the 100 person test and the 50% share ownership test discussed above, we have placed certain restrictions on the transfer of our shares that are intended to prevent further concentration of share ownership. However, such restrictions may not prevent us from failing these requirements, and thereby failing to qualify as a REIT.
Gross Income Tests
. To qualify as a REIT, we must satisfy two gross income tests:
|
(1)
|
At least 75% of our gross income for each taxable year must generally be derived directly or indirectly from rents from real property, interest on obligations secured by mortgages on real property or on interests in real property, gain from the sale or other disposition of non-dealer real property and shares of REIT stock, dividends paid by another REIT and from some types of temporary investments (excluding certain hedging income).
|
|
(2)
|
At least 95% of our gross income for each taxable year must generally be derived from sources qualifying under the 75% test described in (1) above, non-REIT dividends, non-real estate mortgage interest and gain from the sale or disposition of non-REIT stock or securities (excluding certain hedging income).
|
To qualify as rents from real property for the purpose of satisfying the gross income tests, rental payments must generally be received from unrelated persons and not be based on the net income of the resident. Also, the rent attributable to personal property must not exceed 15% of the total rent. We may generally provide services to residents without “tainting” our rental
24
income only if such services are “usually or customarily rendered” in connection with the rental of real property and not otherwise considered “impermissible services”. If such services are impermissible, then we may generally provide them only if they are considered de minimis in amount, or are provided through an independent contractor from whom we derive no revenue and that meets other requirements, or through a taxable REIT subsidiary. We believe that services provided to residents by us either are usually or customarily rendered in connection with the rental of real property and not otherwise considered impermissible, or, if considered impermissible services, will meet the
de minimis
test or will be provided by an independent contractor or taxable REIT subsidiary. However, we cannot provide any assurance that the Internal Revenue Service will agree with these positions.
If we fail to satisfy one or both of the gross income tests for any taxable year, we may nevertheless qualify as a REIT for the year if we are entitled to relief under certain provisions of the Internal Revenue Code. In this case, a penalty tax would still be applicable as discussed above. Generally, it is not possible to state whether in all circumstances we would be entitled to the benefit of these relief provisions and in the event these relief provisions do not apply, we will not qualify as a REIT.
Asset Tests
. In general, on the last day of each quarter of our taxable year, we must satisfy four tests relating to the nature of our assets:
|
(1)
|
At least 75% of the value of our total assets must consist of real estate assets (which include for this purpose shares in other real estate investment trusts) and certain cash related items;
|
|
(2)
|
Not more than 25% of the value of our total assets may consist of securities other than those in the 75% asset class;
|
|
(3)
|
Except for securities included in item 1 above, equity investments in other REITs, qualified REIT subsidiaries (i.e., corporations owned 100% by a REIT that are not TRSs or REITs), or taxable REIT subsidiaries: (a) the value of any one issuer's securities owned by us may not exceed 5% of the value of our total assets and (b) we may not own securities representing more than 10% of the voting power or value of the outstanding securities of any one issuer; and
|
|
(4)
|
Not more than 25% of the value of our total assets may consist of securities of one or more taxable REIT subsidiaries (20% for taxable years beginning January 1, 2018).
|
The 10% value test described in clause (3)(b) above does not apply to certain securities that fall within a safe harbor under the Code. Under the safe harbor, the following are not considered “securities” held by us for purposes of this 10% value test: (i) straight debt securities, (ii) any loan of an individual or an estate, (iii) certain rental agreements for the use of tangible property, (iv) any obligation to pay rents from real property, (v) any security issued by a state or any political subdivision thereof, foreign government or Puerto Rico only if the determination of any payment under such security is not based on the profits of another entity or payments on any obligation issued by such other entity, or (vi) any security issued by a REIT. The timing and payment of interest or principal on a security qualifying as straight debt may be subject to a contingency provided that (A) such contingency does not change the effective yield to maturity, not considering a
de minimis
change which does not exceed the greater of ¼ of 1% or 5% of the annual yield to maturity or we own $1,000,000 or less of the aggregate issue price or value of the particular issuer's debt and not more than 12 months of unaccrued interest can be required to be prepaid or (B) the contingency is consistent with commercial practice and the contingency is effective upon a default or the exercise of a prepayment right by the issuer of the debt. If we hold indebtedness from any issuer, including a REIT, the indebtedness will be subject to, and may cause a violation of, the asset tests, unless it is a qualifying real estate asset or otherwise satisfies the above safe harbor. We currently own equity interests in certain entities that have elected to be taxed as REITs for federal income tax purposes and are not publicly traded. If any such entity were to fail to qualify as a REIT, we would not meet the 10% voting stock limitation and the 10% value limitation and we would, unless certain relief provisions applied, fail to qualify as a REIT. We believe that we and each of the REITs we own an interest in have and will comply with the foregoing asset tests for REIT qualification. However, we cannot provide any assurance that the Internal Revenue Service will agree with our determinations.
If we fail to satisfy the 5% or 10% asset tests described above after a 30-day cure period provided in the Internal Revenue Code, we will be deemed to have met such tests if the value of our non-qualifying assets is
de minimis
(i.e., does not exceed the lesser of 1% of the total value of our assets at the end of the applicable quarter or $10,000,000) and we dispose of the non-qualifying assets within six months after the last day of the quarter in which the failure to satisfy the asset tests is discovered. For violations due to reasonable cause and not willful neglect that are in excess of the
de minimis
exception described above, we may avoid disqualification as a REIT under any of the asset tests, after the 30-day cure period, by disposing of sufficient assets to meet the asset test within such six month period, paying a tax equal to the greater of $50,000 or the highest corporate tax rate multiplied by the net income generated by the non-qualifying assets and disclosing certain information to the Internal Revenue Service. If we cannot avail ourselves of these relief provisions, or if we fail to timely cure any noncompliance with the asset tests, we would cease to qualify as a REIT.
25
Annual Distribution Requirements
. To qualify as a REIT, we are generally required to distribute dividends, other than capital gain dividends, to our shareholders each year in an amount at least equal to 90% of our REIT taxable income. These distributions must be paid either in the taxable year to which they relate, or in the following taxable year if declared before we timely file our tax return for the prior year and if paid with or before the first regular dividend payment date after the declaration is made. We intend to make timely distributions sufficient to satisfy our annual distribution requirements. To the extent that we do not distribute all of our net capital gain or distribute at least 90%, but less than 100% of our REIT taxable income, as adjusted, we are subject to tax on these amounts at regular corporate rates. We will be subject to a 4% excise tax on the excess of the required distribution over the sum of amounts actually distributed and amounts retained for which federal income tax was paid, if we fail to distribute during each calendar year at least the sum of: (1) 85% of our REIT ordinary income for the year; (2) 95% of our REIT capital gain net income for the year; and (3) any undistributed taxable income from prior taxable years. A REIT may elect to retain rather than distribute all or a portion of its net capital gains and pay the tax on the gains. In that case, a REIT may elect to have its shareholders include their proportionate share of the undistributed net capital gains in income as long-term capital gains and receive a credit for their share of the tax paid by the REIT. For purposes of the 4% excise tax described above, any retained amounts would be treated as having been distributed.
Ownership of Partnership Interests By Us
. As a result of our ownership of the Operating Partnership, we will be considered to own and derive our proportionate share of the assets and items of income of the Operating Partnership, respectively, for purposes of the REIT asset and income tests, including its share of assets and items of income of any subsidiaries that are partnerships or limited liability companies.
State and Local Taxes
. We may be subject to state or local taxation in various jurisdictions, including those in which we transact business or reside. Generally REITs have seen increases in state and local taxes in recent years. Our state and local tax treatment may not conform to the federal income tax treatment discussed above. Consequently, prospective shareholders should consult their own tax advisors regarding the effect of state and local tax laws on an investment in common shares.
Taxation of domestic shareholders subject to U.S. tax
General
. If we qualify as a REIT, distributions made to our taxable domestic shareholders with respect to their common shares, other than capital gain distributions and distributions attributable to taxable REIT subsidiaries, will be treated as ordinary income to the extent that the distributions come out of earnings and profits. These distributions will not be eligible for the dividends received deduction for shareholders that are corporations nor will they constitute “qualified dividend income” under the Internal Revenue Code, meaning that such dividends will be taxed at marginal rates applicable to ordinary income rather than the special capital gain rates currently applicable to qualified dividend income distributed to shareholders who satisfy applicable holding period requirements. In determining whether distributions are out of earnings and profits, we will allocate our earnings and profits first to preferred shares and second to the common shares. The portion of ordinary dividends which represent ordinary dividends we receive from a TRS, will be designated as “qualified dividend income” to REIT shareholders. These qualified dividends are eligible for preferential tax rates if paid to our non-corporate shareholders.
To the extent we make distributions to our taxable domestic shareholders in excess of our earnings and profits, such distributions will be considered a return of capital. Such distributions will be treated as a tax-free distribution and will reduce the tax basis of a shareholder's common shares by the amount of the distribution so treated. To the extent such distributions cumulatively exceed a taxable domestic shareholder's tax basis, such distributions are taxable as gain from the sale of shares. Shareholders may not include in their individual income tax returns any of our net operating losses or capital losses.
Dividends declared by a REIT in October, November, or December are deemed to have been paid by the REIT and received by its shareholders on December 31 of that year, so long as the dividends are actually paid during January of the following year. However, this treatment only applies to the extent of the REIT's earnings and profits existing on December 31. To the extent the shareholder distribution paid in January exceeds available earnings and profits as of December 31, the excess will be treated as a distribution taxable to shareholders in the year paid. As such, for tax reporting purposes, January distributions paid to our shareholders may be split between two tax years.
A REIT may make an election under the Internal Revenue Code to treat certain dividends that are paid in a taxable year, as being made by the REIT in the previous taxable year. A shareholder is required to include the amount of the dividend in the taxable year that it is paid by the REIT.
Distributions made by us that we properly designate as capital gain dividends will be taxable to taxable domestic shareholders as gain from the sale or exchange of a capital asset held for more than one year. This treatment applies only to the extent that the designated distributions do not exceed our actual net capital gain for the taxable year or the amount of distributions
26
treated as dividends for the taxable year. It applies regardless of the period for which a domestic shareholder has held his or her common shares. Despite this general rule, corporate shareholders may be required to treat up to 20% of certain capital gain dividends as ordinary income.
Generally, our designated capital gain dividends will be broken out into net capital gains distributions (which are taxable to taxable domestic shareholders that are individuals, estates or trusts at a maximum rate of 20% for individual taxpayers in the highest tax bracket) and unrecaptured Section 1250 gain distributions (which are taxable to taxable domestic shareholders that are individuals, estates or trusts at a maximum rate of 25%).
Certain U.S. shareholders that are taxed as individuals, estates or trusts may also be required to pay an additional 3.8% tax on, among other things, dividends on and capital gains from the sale or other disposition of shares.
If, for any taxable year, we elect to designate as capital gain dividends any portion of the dividends paid or made available for the year to holders of all classes of shares of beneficial interest, then the portion of the capital gains dividends that will be allocable to the holders of common shares will be the total capital gain dividends multiplied by a fraction. The numerator of the fraction will be the total dividends paid or made available to the holders of the common shares for the year. The denominator of the fraction will be the total dividends paid or made available to holders of all classes of shares of beneficial interest.
We may elect to retain (rather than distribute as is generally required) net capital gain for a taxable year and pay the income tax on that gain. If we make this election, shareholders must include in income, as long-term capital gain, their proportionate share of the undistributed net capital gain. Shareholders will be treated as having paid their proportionate share of the tax paid by us on these gains. Accordingly, they will receive a tax credit or refund for the amount. Shareholders will increase the basis in their common shares by the difference between the amount of capital gain included in their income and the amount of the tax they are treated as having paid. Our earnings and profits will be adjusted appropriately.
In general, a shareholder will recognize gain or loss for federal income tax purposes on the sale or other disposition of common shares in an amount equal to the difference between:
|
(a)
|
the amount of cash and the fair market value of any property received in the sale or other disposition; and
|
|
(b)
|
the shareholder's adjusted tax basis in the common shares.
|
The gain or loss will be capital gain or loss if the common shares were held as a capital asset. Generally, the capital gain or loss will be long-term capital gain or loss if the common shares were held for more than one year.
In general, a loss recognized by a shareholder upon the sale of common shares that were held for six months or less, determined after applying certain holding period rules, will be treated as long-term capital loss to the extent that the shareholder received distributions that were treated as long-term capital gains. For shareholders who are individuals, trusts and estates, the long-term capital loss will be apportioned among the applicable long-term capital gain rates to the extent that distributions received by the shareholder were previously so treated.
Taxation of domestic tax-exempt shareholders
Most tax-exempt organizations are not subject to federal income tax except to the extent of their unrelated business taxable income, which is often referred to as UBTI. Unless a tax-exempt shareholder holds its common shares as debt financed property or uses the common shares in an unrelated trade or business, distributions to the shareholder should not constitute UBTI. Similarly, if a tax-exempt shareholder sells common shares, the income from the sale should not constitute UBTI unless the shareholder held the shares as debt financed property or used the shares in a trade or business.
However, for tax-exempt shareholders that are social clubs, voluntary employee benefit associations, supplemental unemployment benefit trusts, and qualified group legal services plans, income from owning or selling common shares will constitute UBTI unless the organization is able to properly deduct amounts set aside or placed in reserve so as to offset the income generated by its investment in common shares. These shareholders should consult their own tax advisors concerning these set aside and reserve requirements which are set forth in the Internal Revenue Code.
In addition, certain pension trusts that own more than 10% of a “pension-held REIT” must report a portion of the distributions that they receive from the REIT as UBTI. We have not been and do not expect to be treated as a pension-held REIT for purposes of this rule.
27
Taxation of foreign shareholders
The following is a discussion of certain anticipated United States federal income tax consequences of the ownership and disposition of common shares applicable to a foreign shareholder. For purposes of this discussion, a “foreign shareholder” is any person other than:
|
(a)
|
a citizen or resident of the United States;
|
|
(b)
|
a corporation or partnership created or organized in the United States or under the laws of the United States or of any state thereof; or
|
|
(c)
|
an estate or trust whose income is includable in gross income for United States federal income tax purposes regardless of its source.
|
Distributions by Us
. Distributions by us to a foreign shareholder that are neither attributable to gain from sales or exchanges by us of United States real property interests nor designated by us as capital gains dividends will be treated as dividends of ordinary income to the extent that they are made out of our earnings and profits. These distributions ordinarily will be subject to withholding of United States federal income tax on a gross basis at a 30% rate, or a lower treaty rate, unless the dividends are treated as effectively connected with the conduct by the foreign shareholder of a United States trade or business. Please note that under certain treaties lower withholding rates generally applicable to dividends do not apply to dividends from REITs. Dividends that are effectively connected with a United States trade or business will be subject to tax on a net basis at graduated rates, and are generally not subject to withholding. Certification and disclosure requirements must be satisfied before a dividend is exempt from withholding under this exemption. A foreign shareholder that is a corporation also may be subject to an additional branch profits tax at a 30% rate or a lower treaty rate.
We expect to withhold United States income tax at the rate of 30% on any such distributions made to a foreign shareholder unless:
|
(a)
|
a lower treaty rate applies and any required form or certification evidencing eligibility for that reduced rate is filed with us; or
|
|
(b)
|
the foreign shareholder files an IRS Form W-8ECI with us claiming that the distribution is effectively connected income.
|
If such distribution is in excess of our current or accumulated earnings and profits, it will not be taxable to a foreign shareholder to the extent that the distribution does not exceed the adjusted basis of the shareholder's common shares. Instead, the distribution will reduce the adjusted basis of the common shares. To the extent that the distribution exceeds the adjusted basis of the common shares, it will give rise to gain from the sale or exchange of the shareholder's common shares. The tax treatment of this gain is described below.
We intend to withhold at a rate of 30%, or a lower applicable treaty rate, on the entire amount of any distribution not designated as a capital gain distribution. In such event, a foreign shareholder may seek a refund of the withheld amount from the IRS if it is subsequently determined that the distribution was, in fact, in excess of our earnings and profits, and the amount withheld exceeded the foreign shareholder's United States tax liability with respect to the distribution.
Any capital gain dividend with respect to any class of our stock which is “regularly traded” on an established securities market, will be treated as an ordinary dividend described above, if the foreign shareholder did not own more than 10% of such class of stock at any time during the one year period ending on the date of the distribution. Foreign shareholders generally will not be required to report such distributions received from us on U.S. federal income tax returns and all distributions treated as dividends for U.S. federal income tax purposes, including any capital gain dividends, will be subject to a 30% U.S. withholding tax (unless reduced or eliminated under an applicable income tax treaty), as described above. In addition, the branch profits tax will no longer apply to such distributions.
Distributions to a foreign shareholder that we designate at the time of the distributions as capital gain dividends, other than those arising from the disposition of a United States real property interest, generally will not be subject to United States federal income taxation unless:
|
(a)
|
the investment in the common shares is effectively connected with the foreign shareholder's United States trade or business, in which case the foreign shareholder will be subject to the same treatment as domestic shareholders, except that a shareholder that is a foreign corporation may also be subject to the branch profits tax, as discussed above; or
|
28
|
(b)
|
the foreign shareholder is a nonresident alien individual who is present in the United States for 183 days or more during the taxable year and has a “tax home” in the United States, in which case the nonresident alien individual will be subject to a 30% tax on the individual's capital gains.
|
Under the Foreign Investment in Real Property Tax Act, which is known as FIRPTA, distributions to a foreign shareholder that are attributable to gain from sales or exchanges of United States real property interests will cause the foreign shareholder to be treated as recognizing the gain as income effectively connected with a United States trade or business. This rule applies whether or not a distribution is designated as a capital gain dividend. Accordingly, foreign shareholders generally would be taxed on these distributions at the same rates applicable to U.S. shareholders, subject to a special alternative minimum tax in the case of nonresident alien individuals. In addition, a foreign corporate shareholder might be subject to the branch profits tax discussed above, as well as U.S. federal income tax return filing requirements. We are required to withhold 35% of these distributions. The withheld amount can be credited against the foreign shareholder's United States federal income tax liability.
Although the law is not entirely clear on the matter, it appears that amounts we designate as undistributed capital gains in respect of the common shares held by U.S. shareholders would be treated with respect to foreign shareholders in the same manner as actual distributions of capital gain dividends. Under that approach, foreign shareholders would be able to offset as a credit against their United States federal income tax liability their proportionate share of the tax paid by us on these undistributed capital gains. In addition, if timely requested, foreign shareholders might be able to receive from the IRS a refund to the extent their proportionate share of the tax paid by us were to exceed their actual United States federal income tax liability.
Foreign Shareholders' Sales of Common Shares.
Gain recognized by a foreign shareholder upon the sale or exchange of common shares generally will not be subject to United States taxation unless the shares constitute a “United States real property interest” within the meaning of FIRPTA. The common shares will not constitute a United States real property interest so long as we are a domestically controlled REIT. A domestically controlled REIT is a REIT in which at all times during a specified testing period less than 50% in value of its stock is held directly or indirectly by foreign shareholders. We believe that we are a domestically controlled REIT. Therefore, we believe that the sale of common shares will not be subject to taxation under FIRPTA. However, because common shares and preferred shares are publicly traded, we cannot guarantee that we will continue to be a domestically controlled REIT. In any event, gain from the sale or exchange of common shares not otherwise subject to FIRPTA will be subject to U.S. tax, if either:
|
(a)
|
the investment in the common shares is effectively connected with the foreign shareholder's United States trade or business, in which case the foreign shareholder will be subject to the same treatment as domestic shareholders with respect to the gain; or
|
|
(b)
|
the foreign shareholder is a nonresident alien individual who is present in the United States for 183 days or more during the taxable year and has a tax home in the United States, in which case the nonresident alien individual will be subject to a 30% tax on the individual's capital gains.
|
Even if we do not qualify as or cease to be a domestically controlled REIT, gain arising from the sale or exchange by a foreign shareholder of common shares still would not be subject to United States taxation under FIRPTA as a sale of a United States real property interest if:
|
(a)
|
the class or series of shares being sold is “regularly traded,” as defined by applicable IRS regulations, on an established securities market such as the New York Stock Exchange; and
|
|
(b)
|
the selling foreign shareholder owned 10% or less of the value of the outstanding class or series of shares being sold throughout the five-year period ending on the date of the sale or exchange.
|
If gain on the sale or exchange of common shares were subject to taxation under FIRPTA, the foreign shareholder would be subject to regular United States income tax with respect to the gain in the same manner as a taxable U.S. shareholder, subject to any applicable alternative minimum tax, a special alternative minimum tax in the case of nonresident alien individuals and the possible application of the branch profits tax in the case of foreign corporations. The purchaser of the common shares would be required to withhold and remit to the IRS 15% of the purchase price.
Exception to FIRPTA for Qualified Shareholders.
For dispositions and distributions after December 18, 2015, stock of a REIT held (directly or through partnerships) by a “qualified shareholder” will not be treated as United States real property interest, and capital gain dividends from such a REIT will not be treated as gain from the sale of a United States real property interest. This exception does not apply to persons that hold an interest, taking into account applicable constructive ownership rules, more than 10% of the stock of the REIT (unless that interest is solely as a creditor (an “applicable investor”)). If the qualified shareholder has such an “applicable investor,” the portion of REIT stock indirectly owned through the qualified shareholder by
29
the applicable investor will be treated as gains from the sale of United States real property interests. For these purposes, a “qualified shareholder” is a foreign person which is in a treaty jurisdiction and satisfies certain publicly traded requirements, is a “qualified collective investment vehicle” and maintains records on the identity of certain 5% owners. A “qualified collective investment vehicle” is a foreign person that is eligible for a reduced withholding rate with respect to ordinary REIT dividends even if such person holds more than 10% of the REIT’s stock, a publicly traded partnership that is a withholding foreign partnership that would be a United States real property holding corporation if it were a United States corporation, or is designated as a qualified collective investment vehicle by the Secretary of the Treasury and is either fiscally transparent within the meaning of the Code or required to include dividends in its gross income but entitled to a deduction for distribution to its investors. Finally, capital gain dividends and nondividend redemption and liquidating distributions to a qualified shareholder that are not allocable to an applicable investor will be treated as ordinary dividends.
Exception to FIRPTA Withholding for Qualified Foreign Pension Funds.
For distributions or disposition of REIT stock after December 18, 2015, “qualified foreign pension funds” and entities that are wholly owned by a qualified foreign pension fund are exempted from FIRPTA withholding. For these purposes, a “qualified foreign pension fund” is any trust, corporation, or other organization or arrangement if (i) it was created or organized under foreign law, (ii) it was established to provide retirement or pension benefits to participants or beneficiaries that are current or former employees (or persons designated by such employees) of one or more employers in consideration for services rendered, (iii) it does not have a single participant or beneficiary with a right to more than 5% of its assets or income, (iv) it is subject to government regulation and provides annual information reporting about its beneficiaries to the relevant tax authorities in the country in which it is established or operates, and (v) under the laws of the country in which it is established or operates, either contributions to such fund which would otherwise be subject to tax under such laws are deductible or excluded from the gross income of such fund or taxed at a reduced rate, or taxation of any investment income of such fund is deferred or such income is taxed at a reduced rate.
Information reporting requirement and backup withholding
We will report to our domestic shareholders and the Internal Revenue Service the amount of distributions paid during each calendar year and the amount of tax withheld, if any. Under certain circumstances, domestic shareholders may be subject to backup withholding. Backup withholding will apply only if such domestic shareholder fails to furnish certain information to us or the Internal Revenue Service. Backup withholding will not apply with respect to payments made to certain exempt recipients, such as corporations and tax-exempt organizations. Domestic shareholders should consult their own tax advisors regarding their qualification for exemption from backup withholding and the procedure for obtaining such an exemption. Backup withholding is not an additional tax. Rather, the amount of any backup withholding with respect to a payment to a domestic shareholder will be allowed as a credit against such person's United States federal income tax liability and may entitle such person to a refund, provided that the required information is timely furnished to the Internal Revenue Service.
Withholding on foreign financial institutions and non-U.S. shareholders
The Foreign Account Tax Compliance Act (“FATCA”) imposes a U.S. withholding tax at a 30% rate on dividends and on proceeds from the sale of our shares paid beginning January 1, 2019 to “foreign financial institutions” (as defined under FATCA) and certain other foreign entities if certain due diligence and disclosure requirements related to U.S. accounts with, or ownership of, such entities are not satisfied or an exemption does not apply. If FATCA withholding is imposed, non-U.S. beneficial owners that are otherwise eligible for an exemption from, or a reduction of, U.S. withholding tax with respect to such distributions and sale proceeds would be required to seek a refund from the Internal Revenue Service to obtain the benefit of such exemption or reduction. Any payment made by us that is subject to withholding under FATCA or otherwise will be net of the amount required to be withheld.
None.
30
As of
December 31, 2015
, the Company, directly or indirectly through investments in title holding entities, owned all or a portion of
394
properties located in
12
states and the District of Columbia consisting of
109,652
apartment units. See Notes 4, 11 and 18 in the Notes to Consolidated Financial Statements for discussion of the Starwood Transaction and the significant dispositions which occurred subsequent to December 31, 2015. The Company’s properties are summarized by building type in the following table:
|
Type
|
Properties
|
Apartment Units
|
Average
Apartment Units
|
||||||
|
Garden
|
200
|
|
55,435
|
|
277
|
|
|||
|
Mid/High-Rise
|
192
|
|
49,078
|
|
256
|
|
|||
|
Military Housing
|
2
|
|
5,139
|
|
2,570
|
|
|||
|
394
|
|
109,652
|
|
|
|
||||
The Company’s properties are summarized by ownership type in the following table:
|
Properties
|
Apartment Units
|
|||||
|
Wholly Owned Properties
|
367
|
|
98,608
|
|
||
|
Master-Leased Properties – Consolidated
|
3
|
|
853
|
|
||
|
Partially Owned Properties – Consolidated
|
19
|
|
3,771
|
|
||
|
Partially Owned Properties – Unconsolidated
|
3
|
|
1,281
|
|
||
|
Military Housing
|
2
|
|
5,139
|
|
||
|
|
394
|
|
109,652
|
|
||
The following table sets forth certain information by market relating to the Company's properties at
December 31, 2015
:
|
Portfolio Summary
|
|||||||||||||
|
Markets/Metro Areas
|
Properties
|
Apartment Units
|
% of
Stabilized
NOI (1)
|
Average
Rental
Rate (2)
|
|||||||||
|
Core:
|
|||||||||||||
|
New York
|
40
|
|
10,835
|
|
17.6
|
%
|
$
|
4,112
|
|
||||
|
Washington D.C.
|
57
|
|
18,656
|
|
17.0
|
%
|
2,212
|
|
|||||
|
San Francisco
|
53
|
|
13,656
|
|
15.1
|
%
|
2,704
|
|
|||||
|
Los Angeles
|
61
|
|
13,313
|
|
12.3
|
%
|
2,339
|
|
|||||
|
Boston
|
35
|
|
8,018
|
|
9.5
|
%
|
2,885
|
|
|||||
|
Seattle
|
44
|
|
8,756
|
|
7.6
|
%
|
2,045
|
|
|||||
|
Orange County, CA
|
12
|
|
3,684
|
|
3.1
|
%
|
1,907
|
|
|||||
|
San Diego
|
13
|
|
3,505
|
|
3.1
|
%
|
2,089
|
|
|||||
|
Subtotal – Core
|
315
|
|
80,423
|
|
85.3
|
%
|
2,606
|
|
|||||
|
Non-Core:
|
|||||||||||||
|
South Florida
|
35
|
|
11,435
|
|
7.2
|
%
|
1,708
|
|
|||||
|
Denver
|
19
|
|
6,935
|
|
4.6
|
%
|
1,565
|
|
|||||
|
Inland Empire, CA
|
9
|
|
2,751
|
|
1.9
|
%
|
1,631
|
|
|||||
|
All Other Markets
|
14
|
|
2,969
|
|
1.0
|
%
|
1,226
|
|
|||||
|
Subtotal – Non-Core
|
77
|
|
24,090
|
|
14.7
|
%
|
1,599
|
|
|||||
|
Total
|
392
|
|
104,513
|
|
100.0
|
%
|
2,372
|
|
|||||
|
Military Housing
|
2
|
|
5,139
|
|
—
|
|
—
|
|
|||||
|
Grand Total
|
394
|
|
109,652
|
|
100.0
|
%
|
$
|
2,372
|
|
||||
Note: Projects under development are not included in the Portfolio Summary until construction has been completed.
|
(1)
|
% of Stabilized NOI includes actual 2015 NOI for stabilized properties and projected annual NOI at stabilization (defined as having achieved 90% occupancy for three consecutive months) for properties that are in lease-up.
|
|
(2)
|
Average rental rate is defined as total rental revenues divided by the weighted average occupied apartment units for the last month of the period presented.
|
The Company’s properties had an average occupancy of approximately
94.3%
(
95.7%
on a same store basis) at
December 31, 2015
. Certain of the Company’s properties are encumbered by mortgages and additional detail can be found on
31
Schedule III – Real Estate and Accumulated Depreciation. Resident leases are generally for twelve months in length and can require security deposits. The garden-style properties are generally defined as properties with two and/or three story buildings while the mid-rise/high-rise are defined as properties with greater than three story buildings. These two property types typically provide residents with amenities, such as a clubhouse and swimming pool. Certain of these properties offer additional amenities such as saunas, whirlpools, spas, sports courts and exercise rooms or other amenities. In addition, many of our urban properties have parking garage and/or retail components. The military housing properties are defined as those properties located on military bases.
The distribution of the properties throughout the United States reflects the Company’s belief that geographic diversification helps insulate the portfolio from regional influences. At the same time, the Company has sought to create clusters of properties within each of its core markets in order to achieve economies of scale in management and operation. The Company may nevertheless acquire additional multifamily properties located anywhere in the United States and internationally.
The consolidated properties currently in various stages of development and lease-up at
December 31, 2015
are included in the following table:
|
Development and Lease-Up Projects as of December 31, 2015
|
|||||||||||||||||||||||||||||||||||
|
(Amounts in thousands except for project and apartment unit amounts)
|
|||||||||||||||||||||||||||||||||||
|
Projects
|
Location
|
No. of
Apartment Units |
Total
Capital Cost (1) |
Total
Book Value to Date |
Total Book
Value Not Placed in Service |
Total
Debt |
Percentage
Completed |
Percentage
Leased |
Percentage
Occupied |
Estimated
Completion Date |
Estimated
Stabilization Date |
||||||||||||||||||||||||
|
Projects Under Development:
|
|||||||||||||||||||||||||||||||||||
|
Potrero 1010
|
San Francisco, CA
|
453
|
|
$
|
224,474
|
|
$
|
174,741
|
|
$
|
174,741
|
|
$
|
—
|
|
75
|
%
|
—
|
|
—
|
|
Q2 2016
|
Q3 2017
|
||||||||||||
|
Vista 99 (formerly Tasman)
|
San Jose, CA
|
554
|
|
214,923
|
|
191,153
|
|
116,624
|
|
—
|
|
94
|
%
|
20
|
%
|
16
|
%
|
Q2 2016
|
Q2 2018
|
||||||||||||||||
|
Altitude (formerly Village at Howard Hughes)
|
Los Angeles, CA
|
545
|
|
193,231
|
|
153,993
|
|
153,993
|
|
—
|
|
74
|
%
|
—
|
|
—
|
|
Q3 2016
|
Q2 2017
|
||||||||||||||||
|
The Alton (formerly Millikan)
|
Irvine, CA
|
344
|
|
102,331
|
|
75,416
|
|
75,416
|
|
—
|
|
58
|
%
|
—
|
|
—
|
|
Q3 2016
|
Q3 2017
|
||||||||||||||||
|
340 Fremont (formerly Rincon Hill)
|
San Francisco, CA
|
348
|
|
287,454
|
|
218,851
|
|
218,851
|
|
—
|
|
82
|
%
|
—
|
|
—
|
|
Q3 2016
|
Q1 2018
|
||||||||||||||||
|
One Henry Adams
|
San Francisco, CA
|
241
|
|
172,337
|
|
89,907
|
|
89,907
|
|
—
|
|
44
|
%
|
—
|
|
—
|
|
Q1 2017
|
Q4 2017
|
||||||||||||||||
|
455 I St
|
Washington, DC
|
174
|
|
73,157
|
|
28,977
|
|
28,977
|
|
—
|
|
13
|
%
|
—
|
|
—
|
|
Q3 2017
|
Q2 2018
|
||||||||||||||||
|
855 Brannan (formerly 801 Brannan)
|
San Francisco, CA
|
449
|
|
304,035
|
|
100,482
|
|
100,482
|
|
—
|
|
19
|
%
|
—
|
|
—
|
|
Q3 2017
|
Q1 2019
|
||||||||||||||||
|
2nd & Pine (2)
|
Seattle, WA
|
398
|
|
214,742
|
|
95,681
|
|
95,681
|
|
—
|
|
34
|
%
|
—
|
|
—
|
|
Q3 2017
|
Q2 2019
|
||||||||||||||||
|
Cascade
|
Seattle, WA
|
483
|
|
172,486
|
|
67,704
|
|
67,704
|
|
—
|
|
28
|
%
|
—
|
|
—
|
|
Q3 2017
|
Q2 2019
|
||||||||||||||||
|
Projects Under Development
|
3,989
|
|
1,959,170
|
|
1,196,905
|
|
1,122,376
|
|
—
|
|
|||||||||||||||||||||||||
|
Completed Not Stabilized (3):
|
|||||||||||||||||||||||||||||||||||
|
Prism at Park Avenue South
|
New York, NY
|
269
|
|
245,161
|
|
239,992
|
|
—
|
|
—
|
|
91
|
%
|
90
|
%
|
Completed
|
Q1 2016
|
||||||||||||||||||
|
170 Amsterdam (4)
|
New York, NY
|
236
|
|
111,892
|
|
111,609
|
|
—
|
|
—
|
|
76
|
%
|
71
|
%
|
Completed
|
Q2 2016
|
||||||||||||||||||
|
Azure (at Mission Bay)
|
San Francisco, CA
|
273
|
|
187,390
|
|
183,455
|
|
—
|
|
—
|
|
71
|
%
|
70
|
%
|
Completed
|
Q2 2016
|
||||||||||||||||||
|
Junction 47 (formerly West Seattle)
|
Seattle, WA
|
206
|
|
67,112
|
|
66,115
|
|
—
|
|
—
|
|
79
|
%
|
75
|
%
|
Completed
|
Q3 2016
|
||||||||||||||||||
|
Odin (formerly Tallman)
|
Seattle, WA
|
301
|
|
81,777
|
|
79,909
|
|
—
|
|
—
|
|
57
|
%
|
52
|
%
|
Completed
|
Q4 2016
|
||||||||||||||||||
|
Projects Completed Not Stabilized
|
1,285
|
|
693,332
|
|
681,080
|
|
—
|
|
—
|
|
|||||||||||||||||||||||||
|
Completed and Stabilized During the Quarter:
|
|||||||||||||||||||||||||||||||||||
|
Residences at Westgate II (formerly Westgate III)
|
Pasadena, CA
|
88
|
|
54,287
|
|
52,083
|
|
—
|
|
—
|
|
99
|
%
|
99
|
%
|
Completed
|
Stabilized
|
||||||||||||||||||
|
Parc on Powell (formerly 1333 Powell)
|
Emeryville, CA
|
173
|
|
87,500
|
|
82,975
|
|
—
|
|
—
|
|
98
|
%
|
97
|
%
|
Completed
|
Stabilized
|
||||||||||||||||||
|
Projects Completed and Stabilized During the Quarter
|
261
|
|
141,787
|
|
135,058
|
|
—
|
|
—
|
|
|||||||||||||||||||||||||
|
Total Development Projects
|
5,535
|
|
$
|
2,794,289
|
|
$
|
2,013,043
|
|
$
|
1,122,376
|
|
$
|
—
|
|
|||||||||||||||||||||
|
Land Held for Development
|
N/A
|
N/A
|
$
|
168,843
|
|
$
|
168,843
|
|
$
|
—
|
|
||||||||||||||||||||||||
|
Note: All development projects listed are wholly owned by the Company.
|
|||||||||||||||||||||||||||||||||||
|
(1)
|
Total capital cost represents estimated cost for projects under development and/or developed and all capitalized costs incurred to date plus any estimates of costs remaining to be funded for all projects, all in accordance with GAAP.
|
||||||||||||||||||||||||||||||||||
|
(2)
|
2nd & Pine – Includes an adjacent land parcel on which certain improvements including a portion of a parking structure will be constructed as part of the development of this project. The Company may eventually construct an additional apartment tower on this site or sell a portion of the garage and the related air rights.
|
||||||||||||||||||||||||||||||||||
|
(3)
|
Properties included here are substantially complete. However, they may still require additional exterior and interior work for all apartment units to be available for leasing.
|
||||||||||||||||||||||||||||||||||
|
(4)
|
170 Amsterdam – The land under this project is subject to a long term ground lease.
|
||||||||||||||||||||||||||||||||||
32
The Company is party to a housing discrimination lawsuit brought by a non-profit civil rights organization in April 2006 in the U.S. District Court for the District of Maryland. The suit alleges that the Company designed and built certain of its properties in violation of the accessibility requirements of the Fair Housing Act and Americans With Disabilities Act. The suit seeks actual and punitive damages, injunctive relief (including modification of non-compliant properties), costs and attorneys’ fees. The Company believes it has a number of viable defenses, including that a majority of the named properties were completed before the operative dates of the statutes in question and/or were not designed or built by the Company. Accordingly, the Company is defending the suit vigorously. Due to the pendency of the Company’s defenses and the uncertainty of many other critical factual and legal issues, it is not possible to determine or predict the outcome of the suit or a possible loss or a range of loss, and no amounts have been accrued at
December 31, 2015
. While no assurances can be given, the Company does not believe that the suit, if adversely determined, would have a material adverse effect on the Company.
The Company does not believe there is any other litigation pending or threatened against it that, individually or in the aggregate, may reasonably be expected to have a material adverse effect on the Company.
Not applicable.
33
Common Share Market Prices and Dividends (Equity Residential)
The following table sets forth, for the years indicated, the high, low and closing sales prices for and the distributions declared on the Company’s Common Shares, which trade on the New York Stock Exchange under the trading symbol EQR.
|
|
Sales Price
|
|
||||||||||||||
|
|
High
|
Low
|
Closing
|
Distributions
|
||||||||||||
|
2015
|
|
|
|
|
|
|
|
|
||||||||
|
Fourth Quarter Ended December 31, 2015
|
$
|
82.39
|
|
$
|
74.38
|
|
$
|
81.59
|
|
$
|
0.5525
|
|
||||
|
Third Quarter Ended September 30, 2015
|
$
|
81.98
|
|
$
|
61.90
|
|
$
|
75.12
|
|
$
|
0.5525
|
|
||||
|
Second Quarter Ended June 30, 2015
|
$
|
79.23
|
|
$
|
69.94
|
|
$
|
70.17
|
|
$
|
0.5525
|
|
||||
|
First Quarter Ended March 31, 2015
|
$
|
82.53
|
|
$
|
72.06
|
|
$
|
77.86
|
|
$
|
0.5525
|
|
||||
|
2014
|
|
|
|
|
|
|
|
|
||||||||
|
Fourth Quarter Ended December 31, 2014
|
$
|
74.72
|
|
$
|
61.47
|
|
$
|
71.84
|
|
$
|
0.5000
|
|
||||
|
Third Quarter Ended September 30, 2014
|
$
|
67.91
|
|
$
|
60.44
|
|
$
|
61.58
|
|
$
|
0.5000
|
|
||||
|
Second Quarter Ended June 30, 2014
|
$
|
63.54
|
|
$
|
57.19
|
|
$
|
63.00
|
|
$
|
0.5000
|
|
||||
|
First Quarter Ended March 31, 2014
|
$
|
59.41
|
|
$
|
51.55
|
|
$
|
57.99
|
|
$
|
0.5000
|
|
||||
The number of record holders of Common Shares at
February 19, 2016
was approximately 2,500. The number of outstanding Common Shares as of
February 19, 2016
was 365,141,603.
Unit Dividends (ERP Operating Limited Partnership)
There is no established public market for the Units (OP Units and restricted units).
The following table sets forth, for the years indicated, the distributions declared on the Operating Partnership's Units.
|
Distributions
|
||||||||
|
2015
|
2014
|
|||||||
|
Fourth Quarter Ended December 31,
|
$
|
0.5525
|
|
$
|
0.5000
|
|
||
|
Third Quarter Ended September 30,
|
$
|
0.5525
|
|
$
|
0.5000
|
|
||
|
Second Quarter Ended June 30,
|
$
|
0.5525
|
|
$
|
0.5000
|
|
||
|
First Quarter Ended March 31,
|
$
|
0.5525
|
|
$
|
0.5000
|
|
||
The number of record holders of Units in the Operating Partnership at
February 19, 2016
was approximately 500. The number of outstanding Units as of
February 19, 2016
was 379,843,736.
Unregistered Common Shares Issued in the Quarter Ended
December 31, 2015
(Equity Residential)
During the quarter ended
December 31, 2015
, EQR issued 26,554 Common Shares in exchange for 26,554 OP Units held by various limited partners of ERPOP. OP Units are generally exchangeable into Common Shares on a one-for-one basis or, at the option of ERPOP, the cash equivalent thereof, at any time one year after the date of issuance. These shares were either registered under the Securities Act of 1933, as amended (the “Securities Act”), or issued in reliance on an exemption from registration under Section 4(2) of the Securities Act and the rules and regulations promulgated thereunder, as these were transactions by an issuer not involving a public offering. In light of the manner of the sale and information obtained by EQR from the limited partners in connection with these transactions, EQR believes it may rely on these exemptions.
34
Equity Compensation Plan Information
The following table provides information as of
December 31, 2015
with respect to the Company's Common Shares that may be issued under its existing equity compensation plans.
|
Number of securities
to be issued upon
exercise of
outstanding options,
warrants and rights
|
Weighted average
exercise price of
outstanding
options, warrants
and rights
|
Number of securities
remaining available
for future issuance
under equity
compensation plans
(excluding securities
in column (a))
|
||||
|
Plan Category
|
||||||
|
|
(a) (1)
|
(b) (1)
|
(c) (2)
|
|||
|
Equity compensation plans approved by shareholders
|
5,734,365
|
$48.04
|
10,922,570
|
|||
|
Equity compensation plans not approved by shareholders
|
N/A
|
N/A
|
N/A
|
|||
|
(1)
|
The amounts shown in columns (a) and (b) of the above table do not include
522,150
outstanding Common Shares (all of which are restricted and subject to vesting requirements) that were granted under the Company's 2011 Share Incentive Plan, as amended (the "2011 Plan") and outstanding Common Shares that have been purchased by employees and trustees under the Company's ESPP.
|
|
(2)
|
Includes
7,952,498
Common Shares that may be issued under the 2011 Plan, of which only 33% may be in the form of restricted shares/units, and
2,970,072
Common Shares that may be sold to employees and trustees under the ESPP.
|
Any Common Shares issued pursuant to EQR's incentive equity compensation and employee share purchase plans will result in ERPOP issuing OP Units to EQR on a one-for-one basis, with ERPOP receiving the net cash proceeds of such issuances.
|
Item 6.
|
Selected Financial Data
|
The following tables set forth selected financial and operating information on a historical basis for the Company and the Operating Partnership. The following information should be read in conjunction with all of the financial statements and notes thereto included elsewhere in this Form 10-K. The historical operating and balance sheet data have been derived from the historical financial statements of the Company and the Operating Partnership. Certain capitalized terms as used herein are defined in the Notes to Consolidated Financial Statements.
35
|
EQUITY RESIDENTIAL
|
||||||||||||||||||||
|
CONSOLIDATED HISTORICAL FINANCIAL INFORMATION
|
||||||||||||||||||||
|
(Financial information in thousands except for per share and property data)
|
||||||||||||||||||||
|
|
Year Ended December 31,
|
|||||||||||||||||||
|
|
2015
|
2014
|
2013
|
2012
|
2011
|
|||||||||||||||
|
OPERATING DATA:
|
|
|
|
|
|
|
|
|
|
|
||||||||||
|
Total revenues from continuing operations
|
$
|
2,744,965
|
|
$
|
2,614,748
|
|
$
|
2,387,702
|
|
$
|
1,747,502
|
|
$
|
1,525,220
|
|
|||||
|
Interest and other income
|
$
|
7,372
|
|
$
|
4,462
|
|
$
|
5,283
|
|
$
|
151,060
|
|
$
|
8,413
|
|
|||||
|
Net gain on sales of real estate properties
|
$
|
335,134
|
|
$
|
212,685
|
|
$
|
—
|
|
$
|
—
|
|
$
|
—
|
|
|||||
|
Income (loss) from continuing operations
|
$
|
907,621
|
|
$
|
657,101
|
|
$
|
(168,174
|
)
|
$
|
160,298
|
|
$
|
(72,941
|
)
|
|||||
|
Discontinued operations, net
|
$
|
397
|
|
$
|
1,582
|
|
$
|
2,073,527
|
|
$
|
720,906
|
|
$
|
1,008,138
|
|
|||||
|
Net income
|
$
|
908,018
|
|
$
|
658,683
|
|
$
|
1,905,353
|
|
$
|
881,204
|
|
$
|
935,197
|
|
|||||
|
Net income available to Common Shares
|
$
|
863,277
|
|
$
|
627,163
|
|
$
|
1,826,468
|
|
$
|
826,212
|
|
$
|
879,720
|
|
|||||
|
Earnings per share – basic:
|
|
|
|
|
|
|
|
|
|
|
||||||||||
|
Income (loss) from continuing operations
available to Common Shares
|
$
|
2.37
|
|
$
|
1.73
|
|
$
|
(0.47
|
)
|
$
|
0.45
|
|
$
|
(0.28
|
)
|
|||||
|
Net income available to Common Shares
|
$
|
2.37
|
|
$
|
1.74
|
|
$
|
5.16
|
|
$
|
2.73
|
|
$
|
2.98
|
|
|||||
|
Weighted average Common Shares outstanding
|
363,498
|
|
361,181
|
|
354,305
|
|
302,701
|
|
294,856
|
|
||||||||||
|
Earnings per share – diluted:
|
|
|
|
|
|
|
|
|
|
|
||||||||||
|
Income (loss) from continuing operations
available to Common Shares
|
$
|
2.36
|
|
$
|
1.72
|
|
$
|
(0.47
|
)
|
$
|
0.45
|
|
$
|
(0.28
|
)
|
|||||
|
Net income available to Common Shares
|
$
|
2.36
|
|
$
|
1.73
|
|
$
|
5.16
|
|
$
|
2.70
|
|
$
|
2.98
|
|
|||||
|
Weighted average Common Shares outstanding
|
380,620
|
|
377,735
|
|
354,305
|
|
319,766
|
|
294,856
|
|
||||||||||
|
Distributions declared per Common Share
outstanding
|
$
|
2.21
|
|
$
|
2.00
|
|
$
|
1.85
|
|
$
|
1.78
|
|
$
|
1.58
|
|
|||||
|
BALANCE SHEET DATA
(at end of period):
|
|
|
|
|
|
|
|
|
|
|
||||||||||
|
Real estate, before accumulated depreciation
|
$
|
25,182,352
|
|
$
|
27,675,383
|
|
$
|
26,800,948
|
|
$
|
21,008,429
|
|
$
|
20,407,946
|
|
|||||
|
Real estate, after accumulated depreciation
|
$
|
20,276,946
|
|
$
|
22,242,578
|
|
$
|
21,993,239
|
|
$
|
16,096,208
|
|
$
|
15,868,363
|
|
|||||
|
Real estate held for sale
|
$
|
2,181,135
|
|
$
|
—
|
|
$
|
—
|
|
$
|
—
|
|
$
|
—
|
|
|||||
|
Total assets
|
$
|
23,157,328
|
|
$
|
22,950,614
|
|
$
|
22,834,545
|
|
$
|
17,201,000
|
|
$
|
16,659,303
|
|
|||||
|
Total debt
|
$
|
10,968,498
|
|
$
|
10,844,861
|
|
$
|
10,766,254
|
|
$
|
8,529,244
|
|
$
|
9,721,061
|
|
|||||
|
Redeemable Noncontrolling Interests –
Operating Partnership
|
$
|
566,783
|
|
$
|
500,733
|
|
$
|
363,144
|
|
$
|
398,372
|
|
$
|
416,404
|
|
|||||
|
Total shareholders’ equity
|
$
|
10,470,368
|
|
$
|
10,368,456
|
|
$
|
10,507,201
|
|
$
|
7,289,813
|
|
$
|
5,669,015
|
|
|||||
|
Total Noncontrolling Interests
|
$
|
225,987
|
|
$
|
339,320
|
|
$
|
337,995
|
|
$
|
237,294
|
|
$
|
193,842
|
|
|||||
|
OTHER DATA:
|
|
|
|
|
|
|
|
|
|
|
||||||||||
|
Total properties (at end of period)
|
394
|
|
391
|
|
390
|
|
403
|
|
427
|
|
||||||||||
|
Total apartment units (at end of period)
|
109,652
|
|
109,225
|
|
109,855
|
|
115,370
|
|
121,974
|
|
||||||||||
|
Funds from operations available to Common
Shares and Units – basic (1) (3) (4)
|
$
|
1,323,786
|
|
$
|
1,190,915
|
|
$
|
872,421
|
|
$
|
993,217
|
|
$
|
752,153
|
|
|||||
|
Normalized funds from operations available to
Common Shares and Units – basic (2) (3) (4)
|
$
|
1,317,802
|
|
$
|
1,196,446
|
|
$
|
1,057,073
|
|
$
|
883,269
|
|
$
|
759,665
|
|
|||||
|
Cash flow provided by (used for):
|
|
|
|
|
|
|
|
|
|
|
||||||||||
|
Operating activities
|
$
|
1,356,499
|
|
$
|
1,324,073
|
|
$
|
868,916
|
|
$
|
1,046,155
|
|
$
|
800,467
|
|
|||||
|
Investing activities
|
$
|
(678,471
|
)
|
$
|
(644,666
|
)
|
$
|
(6,977
|
)
|
$
|
(261,155
|
)
|
$
|
(197,208
|
)
|
|||||
|
Financing activities
|
$
|
(675,832
|
)
|
$
|
(692,861
|
)
|
$
|
(1,420,995
|
)
|
$
|
(556,331
|
)
|
$
|
(650,746
|
)
|
|||||
36
|
ERP OPERATING LIMITED PARTNERSHIP
|
||||||||||||||||||||
|
CONSOLIDATED HISTORICAL FINANCIAL INFORMATION
|
||||||||||||||||||||
|
(Financial information in thousands except for per Unit and property data)
|
||||||||||||||||||||
|
|
Year Ended December 31,
|
|||||||||||||||||||
|
|
2015
|
2014
|
2013
|
2012
|
2011
|
|||||||||||||||
|
OPERATING DATA:
|
|
|
|
|
|
|
|
|
|
|
||||||||||
|
Total revenues from continuing operations
|
$
|
2,744,965
|
|
$
|
2,614,748
|
|
$
|
2,387,702
|
|
$
|
1,747,502
|
|
$
|
1,525,220
|
|
|||||
|
Interest and other income
|
$
|
7,372
|
|
$
|
4,462
|
|
$
|
5,283
|
|
$
|
151,060
|
|
$
|
8,413
|
|
|||||
|
Net gain on sales of real estate properties
|
$
|
335,134
|
|
$
|
212,685
|
|
$
|
—
|
|
$
|
—
|
|
$
|
—
|
|
|||||
|
Income (loss) from continuing operations
|
$
|
907,621
|
|
$
|
657,101
|
|
$
|
(168,174
|
)
|
$
|
160,298
|
|
$
|
(72,941
|
)
|
|||||
|
Discontinued operations, net
|
$
|
397
|
|
$
|
1,582
|
|
$
|
2,073,527
|
|
$
|
720,906
|
|
$
|
1,008,138
|
|
|||||
|
Net income
|
$
|
908,018
|
|
$
|
658,683
|
|
$
|
1,905,353
|
|
$
|
881,204
|
|
$
|
935,197
|
|
|||||
|
Net income available to Units
|
$
|
897,518
|
|
$
|
651,994
|
|
$
|
1,901,746
|
|
$
|
864,853
|
|
$
|
920,500
|
|
|||||
|
Earnings per Unit – basic:
|
|
|
|
|
|
|
|
|
|
|
||||||||||
|
Income (loss) from continuing operations
available to Units
|
$
|
2.37
|
|
$
|
1.73
|
|
$
|
(0.47
|
)
|
$
|
0.45
|
|
$
|
(0.28
|
)
|
|||||
|
Net income available to Units
|
$
|
2.37
|
|
$
|
1.74
|
|
$
|
5.16
|
|
$
|
2.73
|
|
$
|
2.98
|
|
|||||
|
Weighted average Units outstanding
|
377,074
|
|
374,899
|
|
368,038
|
|
316,554
|
|
308,062
|
|
||||||||||
|
Earnings per Unit – diluted:
|
|
|
|
|
|
|
|
|
|
|
||||||||||
|
Income (loss) from continuing operations
available to Units
|
$
|
2.36
|
|
$
|
1.72
|
|
$
|
(0.47
|
)
|
$
|
0.45
|
|
$
|
(0.28
|
)
|
|||||
|
Net income available to Units
|
$
|
2.36
|
|
$
|
1.73
|
|
$
|
5.16
|
|
$
|
2.70
|
|
$
|
2.98
|
|
|||||
|
Weighted average Units outstanding
|
380,620
|
|
377,735
|
|
368,038
|
|
319,766
|
|
308,062
|
|
||||||||||
|
Distributions declared per Unit outstanding
|
$
|
2.21
|
|
$
|
2.00
|
|
$
|
1.85
|
|
$
|
1.78
|
|
$
|
1.58
|
|
|||||
|
BALANCE SHEET DATA
(at end of period):
|
|
|
|
|
|
|
|
|
|
|
||||||||||
|
Real estate, before accumulated depreciation
|
$
|
25,182,352
|
|
$
|
27,675,383
|
|
$
|
26,800,948
|
|
$
|
21,008,429
|
|
$
|
20,407,946
|
|
|||||
|
Real estate, after accumulated depreciation
|
$
|
20,276,946
|
|
$
|
22,242,578
|
|
$
|
21,993,239
|
|
$
|
16,096,208
|
|
$
|
15,868,363
|
|
|||||
|
Real estate held for sale
|
$
|
2,181,135
|
|
$
|
—
|
|
$
|
—
|
|
$
|
—
|
|
$
|
—
|
|
|||||
|
Total assets
|
$
|
23,157,328
|
|
$
|
22,950,614
|
|
$
|
22,834,545
|
|
$
|
17,201,000
|
|
$
|
16,659,303
|
|
|||||
|
Total debt
|
$
|
10,968,498
|
|
$
|
10,844,861
|
|
$
|
10,766,254
|
|
$
|
8,529,244
|
|
$
|
9,721,061
|
|
|||||
|
Redeemable Limited Partners
|
$
|
566,783
|
|
$
|
500,733
|
|
$
|
363,144
|
|
$
|
398,372
|
|
$
|
416,404
|
|
|||||
|
Total partners' capital
|
$
|
10,691,747
|
|
$
|
10,582,867
|
|
$
|
10,718,613
|
|
$
|
7,449,419
|
|
$
|
5,788,551
|
|
|||||
|
Noncontrolling Interests – Partially Owned
Properties
|
$
|
4,608
|
|
$
|
124,909
|
|
$
|
126,583
|
|
$
|
77,688
|
|
$
|
74,306
|
|
|||||
|
OTHER DATA:
|
|
|
|
|
|
|
|
|
|
|
||||||||||
|
Total properties (at end of period)
|
394
|
|
391
|
|
390
|
|
403
|
|
427
|
|
||||||||||
|
Total apartment units (at end of period)
|
109,652
|
|
109,225
|
|
109,855
|
|
115,370
|
|
121,974
|
|
||||||||||
|
Funds from operations available to Units –
basic (1) (3) (4)
|
$
|
1,323,786
|
|
$
|
1,190,915
|
|
$
|
872,421
|
|
$
|
993,217
|
|
$
|
752,153
|
|
|||||
|
Normalized funds from operations available to
Units – basic (2) (3) (4)
|
$
|
1,317,802
|
|
$
|
1,196,446
|
|
$
|
1,057,073
|
|
$
|
883,269
|
|
$
|
759,665
|
|
|||||
|
Cash flow provided by (used for):
|
|
|
|
|
|
|
|
|
|
|
||||||||||
|
Operating activities
|
$
|
1,356,499
|
|
$
|
1,324,073
|
|
$
|
868,916
|
|
$
|
1,046,155
|
|
$
|
800,467
|
|
|||||
|
Investing activities
|
$
|
(678,471
|
)
|
$
|
(644,666
|
)
|
$
|
(6,977
|
)
|
$
|
(261,155
|
)
|
$
|
(197,208
|
)
|
|||||
|
Financing activities
|
$
|
(675,832
|
)
|
$
|
(692,861
|
)
|
$
|
(1,420,995
|
)
|
$
|
(556,331
|
)
|
$
|
(650,746
|
)
|
|||||
|
(1)
|
The National Association of Real Estate Investment Trusts (“NAREIT”) defines funds from operations (“FFO”) (April 2002 White Paper) as net income (computed in accordance with accounting principles generally accepted in the United States (“GAAP”)), excluding gains (or losses) from sales and impairment write-downs of depreciable operating properties, plus depreciation and amortization, and after adjustments for unconsolidated partnerships and joint ventures. Adjustments for unconsolidated partnerships and joint ventures will be calculated to reflect funds from operations on the same basis. The April 2002 White Paper states that gain or loss on sales of property is excluded from FFO for previously depreciated operating properties only. Once the Company commences
|
37
the conversion of apartment units to condominiums, it simultaneously discontinues depreciation of such property.
|
(2)
|
Normalized funds from operations (“Normalized FFO”) begins with FFO and excludes:
|
|
▪
|
the impact of any expenses relating to non-operating asset impairment and valuation allowances;
|
|
▪
|
property acquisition and other transaction costs related to mergers and acquisitions and pursuit cost write-offs;
|
|
▪
|
gains and losses from early debt extinguishment, including prepayment penalties, preferred share/preference unit redemptions and the cost related to the implied option value of non-cash convertible debt discounts;
|
|
▪
|
gains and losses on the sales of non-operating assets, including gains and losses from land parcel and condominium sales, net of the effect of income tax benefits or expenses; and
|
|
▪
|
other miscellaneous non-comparable items.
|
|
(3)
|
The Company believes that FFO and FFO available to Common Shares and Units / Units are helpful to investors as supplemental measures of the operating performance of a real estate company, because they are recognized measures of performance by the real estate industry and by excluding gains or losses related to dispositions of depreciable property and excluding real estate depreciation (which can vary among owners of identical assets in similar condition based on historical cost accounting and useful life estimates), FFO and FFO available to Common Shares and Units / Units can help compare the operating performance of a company’s real estate between periods or as compared to different companies. The Company also believes that Normalized FFO and Normalized FFO available to Common Shares and Units / Units are helpful to investors as supplemental measures of the operating performance of a real estate company because they allow investors to compare the Company’s operating performance to its performance in prior reporting periods and to the operating performance of other real estate companies without the effect of items that by their nature are not comparable from period to period and tend to obscure the Company’s actual operating results. FFO, FFO available to Common Shares and Units / Units, Normalized FFO and Normalized FFO available to Common Shares and Units / Units do not represent net income, net income available to Common Shares / Units or net cash flows from operating activities in accordance with GAAP. Therefore, FFO, FFO available to Common Shares and Units / Units, Normalized FFO and Normalized FFO available to Common Shares and Units / Units should not be exclusively considered as alternatives to net income, net income available to Common Shares / Units or net cash flows from operating activities as determined by GAAP or as a measure of liquidity. The Company’s calculation of FFO, FFO available to Common Shares and Units / Units, Normalized FFO and Normalized FFO available to Common Shares and Units / Units may differ from other real estate companies due to, among other items, variations in cost capitalization policies for capital expenditures and, accordingly, may not be comparable to such other real estate companies.
|
|
(4)
|
FFO available to Common Shares and Units / Units and Normalized FFO available to Common Shares and Units / Units are calculated on a basis consistent with net income available to Common Shares / Units and reflects adjustments to net income for preferred distributions and premiums on redemption of preferred shares/preference units in accordance with accounting principles generally accepted in the United States. The equity positions of various individuals and entities that contributed their properties to the Operating Partnership in exchange for OP Units are collectively referred to as the “Noncontrolling Interests – Operating Partnership”. Subject to certain restrictions, the Noncontrolling Interests – Operating Partnership may exchange their OP Units for Common Shares on a one-for-one basis.
|
Note: See Item 7 for a reconciliation of net income to FFO, FFO available to Common Shares and Units / Units, Normalized FFO and Normalized FFO available to Common Shares and Units / Units.
|
Item 7.
|
Management’s Discussion and Analysis of Financial Condition and Results of Operations
|
The following discussion and analysis of the results of operations and financial condition of the Company and the Operating Partnership should be read in connection with the Consolidated Financial Statements and Notes thereto. Due to the Company's ability to control the Operating Partnership and its subsidiaries, the Operating Partnership and each such subsidiary entity has been consolidated with the Company for financial reporting purposes, except for three unconsolidated operating properties and our military housing properties. Capitalized terms used herein and not defined are as defined elsewhere in this Annual Report on Form 10-K for the year ended
December 31, 2015
.
Forward-Looking Statements
Forward-looking statements in this Item 7 as well as elsewhere in this Annual Report on Form 10-K are intended to be made pursuant to the safe harbor provisions of the Private Securities Litigation Reform Act of 1995. These statements are based on current expectations, estimates, projections and assumptions made by management. While the Company's management believes the assumptions underlying its forward-looking statements are reasonable, such information is inherently subject to uncertainties and may involve certain risks, which could cause actual results, performance or achievements of the Company to differ materially from anticipated future results, performance or achievements expressed or implied by such forward-looking statements. Many of these uncertainties and risks are difficult to predict and beyond management's control. Forward-looking statements are not guarantees of future performance, results or events. The forward-looking statements contained herein are made as of the date hereof and the Company undertakes no obligation to update or supplement these forward-looking statements. Factors that might cause such differences include, but are not limited to the following:
38
|
▪
|
We intend to actively acquire, develop and rehab multifamily properties for rental operations as market conditions dictate. We may also acquire multifamily properties that are unoccupied or in the early stages of lease up. We may be unable to lease up these apartment properties on schedule, resulting in decreases in expected rental revenues and/or lower yields due to lower occupancy and rates as well as higher than expected concessions or higher than expected operating expenses. We may not be able to achieve rents that are consistent with expectations for acquired, developed or rehabbed properties. We may underestimate the costs necessary to bring an acquired property up to standards established for its intended market position, to complete a development property or to complete a rehab. Additionally, we expect that other real estate investors with capital will compete with us for attractive investment opportunities or may also develop properties in markets where we focus our development and acquisition efforts. This competition (or lack thereof) may increase (or depress) prices for multifamily properties. We may not be in a position or have the opportunity in the future to make suitable property acquisitions on favorable terms. We have acquired in the past and intend to continue to pursue the acquisition of properties and portfolios of properties, including large portfolios, that could increase our size and result in alterations to our capital structure. The total number of apartment units under development, costs of development and estimated completion dates are subject to uncertainties arising from changing economic conditions (such as the cost of labor and construction materials), competition and local government regulation;
|
|
▪
|
Debt financing and other capital required by the Company may not be available or may only be available on adverse terms;
|
|
▪
|
Labor and materials required for maintenance, repair, capital expenditure or development may be more expensive than anticipated;
|
|
▪
|
Occupancy levels and market rents may be adversely affected by national and local economic and market conditions including, without limitation, new construction and excess inventory of multifamily and single family housing, increasing portions of single family housing stock being converted to rental use, rental housing subsidized by the government, other government programs that favor single family rental housing or owner occupied housing over multifamily rental housing, governmental regulations, slow or negative employment growth and household formation, the availability of low-interest mortgages or the availability of mortgages requiring little or no down payment for single family home buyers, changes in social preferences and the potential for geopolitical instability, all of which are beyond the Company's control; and
|
|
▪
|
Additional factors as discussed in Part I of this Annual Report on Form 10-K, particularly those under “Item 1A.
Risk Factors
”.
|
Forward-looking statements and related uncertainties are also included in the Notes to Consolidated Financial Statements in this report.
Overview
Equity Residential (“EQR”), a Maryland real estate investment trust (“REIT”) formed in March 1993, is an S&P 500 company focused on the acquisition, development and management of high quality apartment properties in top United States growth markets. ERP Operating Limited Partnership (“ERPOP”), an Illinois limited partnership, was formed in May 1993 to conduct the multifamily residential property business of Equity Residential. EQR has elected to be taxed as a REIT. References to the “Company,” “we,” “us” or “our” mean collectively EQR, ERPOP and those entities/subsidiaries owned or controlled by EQR and/or ERPOP. References to the “Operating Partnership” mean collectively ERPOP and those entities/subsidiaries owned or controlled by ERPOP.
EQR is the general partner of, and as of
December 31, 2015
owned an approximate
96.2%
ownership interest in, ERPOP. All of the Company's property ownership, development and related business operations are conducted through the Operating Partnership and EQR has no material assets or liabilities other than its investment in ERPOP. EQR issues equity from time to time but does not have any indebtedness as all debt is incurred by the Operating Partnership. The Operating Partnership holds substantially all of the assets of the Company, including the Company's ownership interests in its joint ventures. The Operating Partnership conducts the operations of the business and is structured as a partnership with no publicly traded equity.
The Company’s corporate headquarters is located in Chicago, Illinois and as of
December 31, 2015
, the Company also operated property management offices in each of its core markets and two of its non-core markets. As of
December 31, 2015
, the Company had approximately
3,500
employees who provided real estate operations, leasing, legal, financial, accounting, acquisition, disposition, development and other support functions.
39
Business Objectives and Operating and Investing Strategies
The Company invests in high quality apartment communities located in strategically targeted markets with the goal of maximizing our risk adjusted total return (operating income plus capital appreciation) on invested capital.
We seek to maximize the income and capital appreciation of our properties by investing in markets that are characterized by conditions favorable to multifamily property operations and appreciation. We are focused on the six core coastal, high barrier to entry markets of Boston, New York, Washington D.C., Southern California (including Los Angeles, Orange County and San Diego), San Francisco and Seattle. These markets generally feature one or more of the following characteristics that allow us to increase rents:
|
▪
|
High barriers to entry where, because of land scarcity or government regulation, it is difficult or costly to build new apartment properties, creating limits on new supply;
|
|
▪
|
High home ownership costs;
|
|
▪
|
Strong economic growth leading to job growth and household formation, which in turn leads to high demand for our apartments;
|
|
▪
|
Urban core locations with an attractive quality of life leading to high resident demand and retention; and
|
|
▪
|
Favorable demographics contributing to a larger pool of target residents with a high propensity to rent apartments.
|
Our operating focus is on balancing occupancy and rental rates to maximize our revenue while exercising tight cost control to generate the highest possible return to our shareholders. Revenue is maximized by attracting qualified prospects to our properties, cost-effectively converting these prospects into new residents and keeping our residents satisfied so they will renew their leases upon expiration. While we believe that it is our high-quality, well-located assets that bring our customers to us, it is the customer service and superior value provided by our on-site personnel that keeps them renting with us and recommending us to their friends.
We use technology to engage our customers in the way that they want to be engaged. Many of our residents utilize our web-based resident portal which allows them to sign and renew their leases, review their accounts and make payments, provide feedback and make service requests on-line.
Acquisitions and developments may be financed from various sources of capital, which may include retained cash flow, issuance of additional equity and debt, sales of properties and joint venture agreements. In addition, the Company may acquire properties in transactions that include the issuance of partnership interests in the Operating Partnership (“OP Units”) as consideration for the acquired properties. Such transactions may, in certain circumstances, enable the sellers to defer, in whole or in part, the recognition of taxable income or gain that might otherwise result from the sales. The Company may acquire land parcels to hold and/or sell based on market opportunities as well as options to buy more land in the future. The Company may also seek to acquire properties by purchasing defaulted or distressed debt that encumbers desirable properties in the hope of obtaining title to property through foreclosure or deed-in-lieu of foreclosure proceedings.
Over the past several years, the Company has done an extensive repositioning of its portfolio from low barrier to entry/non-core markets to high barrier to entry/core markets. Since 2005, the Company has sold nearly
168,000
apartment units primarily in its non-core markets for an aggregate sales price of approximately
$16.6 billion
, acquired over
68,000
apartment units primarily in its core markets for approximately
$19.8 billion
and began approximately
$5.7 billion
of development projects primarily in its core markets. We are currently seeking to acquire and develop assets in the following six core coastal metropolitan areas: Boston, New York, Washington D.C., Southern California, San Francisco and Seattle. The sale of the Starwood portfolio combined with the other 2016 dispositions will complete the Company's planned exit from the South Florida, Denver and Phoenix markets as well as certain New England submarkets. See further discussion below regarding the Company's 2016 disposition activity.
As part of its strategy, the Company purchases completed and fully occupied apartment properties, partially completed or partially occupied properties and takes options on land or acquires land on which apartment properties can be constructed. We intend to hold a diversified portfolio of assets across our target markets. As of
December 31, 2015
, no single market/metropolitan area accounted for more than
17.6%
of our NOI, though NOI concentration has increased in 2016 following the sale of the Starwood portfolio.
We endeavor to attract and retain the best employees by providing them with the education, resources and opportunities to succeed. We provide many classroom and on-line training courses to assist our employees in interacting with prospects and residents as well as extensively train our customer service specialists in maintaining our properties and improvements, equipment and appliances. We actively promote from within and many senior corporate and property leaders have risen from entry level or
40
junior positions. We monitor our employees' engagement by surveying them annually and have consistently received high engagement scores.
We have a commitment to sustainability and consider the environmental impacts of our business activities. Sustainability and social responsibility are key drivers of our focus on creating the best apartment communities for residents to live, work and play. We have a dedicated in-house team that initiates and applies sustainable practices in all aspects of our business, including investment activities, development, property operations and property management activities. With its high density, multifamily housing is, by its nature, an environmentally friendly property type. Our recent acquisition and development activities have been primarily concentrated in pedestrian-friendly urban locations near public transportation. When developing and renovating our properties, we strive to reduce energy and water usage by investing in energy saving technology while positively impacting the experience of our residents and the value of our assets. We continue to implement a combination of irrigation, lighting, HVAC and renewable energy improvements at our properties that will reduce energy and water consumption. The Company was named the 2015 Global Residential Sector Leader by the Global Real Estate Sustainability Benchmark ("GRESB") survey, a globally recognized analysis of the sustainability indicators of more than 700 real estate portfolios worldwide. For additional information regarding our sustainability efforts, see our December 2015 Corporate Social Responsibility and Sustainability Report at our website,
www.equityresidential.com
. For 2016, we have added an express company-wide goal regarding enhanced sustainability efforts. Employees, including our executives, will have their performance against this goal evaluated as part of our annual performance review process.
Current Environment
Following the approval by the Company's Board of Trustees, the Company executed an agreement with controlled affiliates of Starwood Capital Group ("Starwood") on October 23, 2015 to sell a portfolio of 72 operating properties consisting of 23,262 apartment units located in five markets across the United States for $5.365 billion (the "Starwood Transaction"). On January 26 and 27, 2016, the Company closed on the sale of all of the portfolio described above. The sale of the Starwood portfolio, combined with other planned 2016 dispositions, will result in the Company's planned exit from the South Florida, Denver and Phoenix markets as well as certain New England submarkets. The Company intends to use the majority of the proceeds from the Starwood Transaction and other planned 2016 dispositions to pay two special dividends to its shareholders and holders of OP Units of between $10.00 and $12.00 per share/unit in the aggregate. On February 22, 2016, the Board of Trustees declared a special dividend of $8.00 per share/unit to be paid on March 10, 2016 to shareholders/unitholders of record as of March 3, 2016. The Company expects to pay an additional special dividend of approximately $2.00 to $4.00 per share/unit later in 2016. All future dividends remain subject to the discretion of the Company's Board of Trustees. The Company used and expects to use the majority of the remaining proceeds to reduce aggregate indebtedness in order to make the transaction leverage neutral. The Company has retired approximately $1.7 billion in secured and unsecured debt prior to scheduled maturity in early 2016 and expects to retire an additional $271.2 million at par at maturity in March 2016 using cash from these sales. The Company may also sell certain other assets in core markets in 2016 with the intention of reinvesting the proceeds from those sales in other assets in our core markets. These sales will narrow the Company's focus, which will now be entirely directed towards our high barrier to entry/core markets, and will essentially complete the Company's portfolio reconfiguration which started approximately ten years ago. We believe the assets being sold will have lower long-term returns (as compared to investments in our high barrier to entry/core markets) and that we can sell them now for prices that we believe are favorable. Given the very strong bids for multifamily assets in our high barrier to entry/core markets from many different segments of the investment community, the Company believes the best risk-adjusted use of the sale proceeds is to distribute a portion to our shareholders and repay outstanding debt. The planned 2016 dispositions discussed above, other than the Starwood Transaction, are subject to certain closing conditions, and there can be no assurance that such sales will occur.
During the year ended
December 31, 2015
, the Company acquired
four
consolidated rental properties consisting of
625
apartment units for
$296.0 million
and
three
contiguous land parcels for
$27.8 million
. The Company sold
eight
consolidated rental properties consisting of
1,857
apartment units for
$513.3 million
(which included a 193,230 square foot medical office building adjacent to our Longfellow Place property in Boston with a sales price of approximately $123.3 million) during the year ended
December 31, 2015
. The Company currently budgets consolidated rental acquisitions of approximately $600.0 million during the year ending
December 31, 2016
to be funded with proceeds from rental dispositions. The Company currently budgets consolidated rental dispositions of approximately $7.4 billion during the year ending
December 31, 2016
, which includes the sale of the Starwood portfolio and the other planned 2016 dispositions discussed above.
During the year ended
December 31, 2015
, the Company started construction on
two
projects representing
623
apartment units totaling approximately
$377.2 million
of development costs and substantially completed construction on seven projects representing 1,546 apartment units totaling approximately $835.1 million of development costs. The Company significantly increased its development starts in 2014 as compared to preceding years, and while construction activity remained elevated in 2015, starts have returned to more historical levels (approximately $300.0 million to $500.0 million on average annually). The
41
Company has budgeted starting approximately $350.0 million of new development projects in 2016. We currently budget spending approximately $600.0 million on development costs during the year ending
December 31, 2016
. We expect that this capital will be primarily sourced with excess operating cash flow, disposition proceeds, expected debt offerings in 2016 and borrowings on our revolving credit facility and/or commercial paper program.
We currently have access to multiple sources of capital including the equity markets as well as both the secured and unsecured debt markets. In February 2015, the Company entered into a $500.0 million commercial paper program, which allows for daily, weekly or monthly borrowings at low floating rates of interest. We believe this commercial paper program allows the Company to continue to reduce its already low cost of capital and we will use the program to replace a portion of the amount that otherwise would have been outstanding under our revolving line of credit. In May 2015, the Company completed a $450.0 million unsecured ten year note offering with a coupon of 3.375% and an all-in effective interest rate of approximately 3.81% as well as a $300.0 million unsecured thirty year note offering with a coupon of 4.5% and an all-in effective interest rate of approximately 4.55%. The Company used the proceeds from these offerings to repay the outstanding balance on its revolving credit facility and commercial paper program. The Company has budgeted $200.0 million to $250.0 million of secured or unsecured debt offerings during
2016
, excluding usage of the commercial paper program.
We believe that cash and cash equivalents, securities readily convertible to cash, current availability on our revolving credit facility and commercial paper program, expected debt offerings and disposition proceeds for
2016
will provide sufficient liquidity to meet our funding obligations relating to asset acquisitions, debt maturities, existing development projects and special dividends through
2016
. We expect that our remaining longer-term funding requirements will be met through some combination of new borrowings, equity issuances, property dispositions, joint ventures and cash generated from operations.
Through their lender originator networks, Fannie Mae and Freddie Mac (the “Government Sponsored Enterprises” or “GSEs”) are significant lenders both to the Company and to buyers of the Company's properties. The GSEs have a mandate to support multifamily housing through their financing activities. Any changes to their mandates, reductions in their size or the scale of their activities or loss of key personnel could have an impact on the Company and may, among other things, lead to lower values for our assets and higher interest rates on our borrowings. The Company has access to multiple other forms of public and private capital and over time, we would expect that other lenders, including banks, the commercial mortgage-backed securities market and life insurance companies, will become larger sources of debt capital to the multifamily market, particularly as it relates to the Company's high quality apartment properties.
Same store revenues increased 5.1% during the year ended
December 31, 2015
as compared to the same period in
2014
, which was above the high end of our original guidance range of 3.75% to 4.50% that we provided in February
2015
. Strong demand and continued strength in occupancy levels drove the outperformance during
2015
, which should continue into
2016
. In addition, improving labor markets, robust household formation and declining single family home ownership levels should keep demand for rental housing high and produce above trend growth for
2016
. We anticipate same store revenue increases ranging from 4.50% to 5.25% and same store NOI increases ranging from 5.00% to 6.50% for
2016
as compared to
2015
.
As noted above, demand for our apartments has been strong, with high occupancy and low turnover. In general, new supply continues to be absorbed in an orderly fashion with lease-ups occurring faster than expected and only minimal impact on rents at nearby stabilized assets. For
2016
, we currently anticipate three groupings of same store revenue growth, with San Francisco, Seattle, Los Angeles, San Diego and Orange County producing 5% or higher, New York and Boston producing 3% to 5% and Washington D.C. producing 1% to 1.3% growth.
Washington D.C., which is our largest market, has seen record absorption despite anemic job growth in 2014 and 2015. However, we have noted recent improvements in professional services hiring. We expect continued slow improvement in the Washington D.C. market throughout 2016, but growth will still lag the remainder of the Company's portfolio due to continuing substantial deliveries of new supply in the market combined with modest but recently improving job growth due to weakness in government hiring and spending. Despite the issues noted in Washington D.C., our business in general continues to perform well because of the combined forces of demographics, household formations and increasing consumer preference for the flexibility of rental housing, all of which should ensure a continued strong demand for rental housing.
Same store expenses increased 2.5% during the year ended
December 31, 2015
as compared to the same period in
2014
, which was at the low end of our original guidance range of 2.5% to 3.5% that we provided in February
2015
, primarily due to a decline in the price of commodities and high temperatures which resulted in a decrease in utility costs due to declines in natural gas, electricity and heating oil. The Company anticipates that
2016
same store expenses will increase 2.5% to 3.5%, with increases in real estate taxes expected to approximate 5.25% for the full year
2016
. The anticipated increase in real estate taxes is primarily due to rate and value increases in certain states and municipalities, reflecting those states' and municipalities' continued economic challenges and the dramatic improvement in apartment values and fundamentals as well as the contractual annual reduction in the
42
benefits of 421a tax abatements in New York City. We expect minimal growth, if any, in full year utility costs due to lower commodity costs. We anticipate same store payroll costs to grow 2.5% to 3.0% in
2016
over
2015
. The Company expects overhead costs (property management expense and general and administrative expense) to decline slightly in 2016 over 2015 while it expects total revenues to decline more significantly as a result of the Starwood Transaction and other planned 2016 dispositions. As certain of the Company's overhead costs are fixed and/or not quickly scalable, the Company anticipates overhead costs as a percentage of total revenues will increase in 2016 as compared to 2015.
We believe that the Company is well-positioned as of
December 31, 2015
because our properties are geographically diverse, were approximately
94.3%
occupied (
95.7%
on a same store basis) and the long-term demographic picture is positive. We believe certain of our core markets/metro areas, especially Washington D.C., Boston and Seattle, will see substantial near term multifamily supply and there will likely be periods of disruption as new development projects lease up. We believe over the longer term that our core markets will absorb future supply without material marketwide disruption because of the strong demand in these markets as exhibited by our current high occupancy levels and increasing household formations. We have seen evidence of this in Seattle as supply has been absorbed and rental rates continue to grow. We believe our strong balance sheet and ample liquidity will allow us to fund our debt maturities and development costs in the near term and should also allow us to take advantage of investment opportunities in the future.
The current environment information presented above is based on current expectations and is forward-looking.
Results of Operations
In conjunction with our business objectives and operating strategy, the Company continued to invest in apartment properties located in our high barrier to entry/core markets and sell apartment properties located in our low barrier to entry/non-core markets during the years ended
December 31, 2015
and
December 31, 2014
. In summary, we:
Year Ended
December 31, 2015
:
|
▪
|
Acquired four consolidated apartment properties consisting of 625 apartment units for $296.0 million at a weighted average cap rate (see definition below) of 4.5% and three contiguous land parcels for $27.8 million; and
|
|
▪
|
Sold eight consolidated apartment properties consisting of 1,857 apartments units as well as a 193,230 square foot medical office building for $513.3 million at a weighted average cap rate of 5.3% generating an unlevered internal rate of return ("IRR"), inclusive of indirect management costs, of 13.4%.
|
Year Ended
December 31, 2014
:
|
▪
|
Acquired four consolidated apartment properties consisting of 1,011 apartment units for $363.2 million at a weighted average cap rate of 4.8% and two land parcels for $28.8 million;
|
|
▪
|
Acquired two consolidated apartment properties, one that had just completed lease up and the other which was still in lease up, consisting of 342 apartment units for $106.6 million and are expected to stabilize at a 6.4% yield on cost and a 4.9% yield on cost, respectively;
|
|
▪
|
Acquired the 95% equity interest it did not own in one previously unconsolidated development project with a stabilized real estate value of
$87.5 million
and an adjusted purchase price of $64.2 million;
|
|
▪
|
Sold ten consolidated apartment properties consisting of 3,092 apartments units for $467.0 million at a weighted average cap rate of 6.1% generating an unlevered IRR, inclusive of management costs, of 8.9% and three land parcels for $62.6 million; and
|
|
▪
|
Sold one unconsolidated property for $62.5 million (sales price listed is the gross sales price and EQR owned an 85% interest).
|
The Company's primary financial measure for evaluating each of its apartment communities is net operating income (“NOI”). NOI represents rental income less direct property operating expenses (including real estate taxes and insurance) as well as an allocation of indirect property management costs. The Company believes that NOI is helpful to investors as a supplemental measure of its operating performance because it is a direct measure of the actual operating results of the Company's apartment communities. The cap rate is generally the first year NOI yield (net of replacements) on the Company's investment.
Properties that the Company owned and were stabilized (see definition below) for all of both
2015
and
2014
(the “
2015
Same Store Properties”), which represented
96,286
apartment units, impacted the Company's results of operations. Properties that the Company owned for all of both
2014
and
2013
as well as the 18,465 stabilized apartment units acquired in the Archstone
43
Acquisition that are owned and managed by the Company (the “
2014
Same Store Properties”), which represented
97,911
apartment units, also impacted the Company's results of operations. Both the
2015
Same Store Properties and
2014
Same Store Properties are discussed in the following paragraphs.
The following tables provide a rollforward of the apartment units included in Same Store Properties and a reconciliation of apartment units included in Same Store Properties to those included in Total Properties for the year ended
December 31, 2015
:
|
Year Ended
|
||||||
|
December 31, 2015
|
||||||
|
Properties
|
Apartment
Units
|
|||||
|
Same Store Properties at December 31, 2014
|
365
|
|
97,911
|
|
||
|
2013 acquisitions, excluding Archstone
|
1
|
|
322
|
|
||
|
2015 dispositions
|
(8
|
)
|
(1,857
|
)
|
||
|
Lease-up properties stabilized
|
1
|
|
188
|
|
||
|
Properties removed from same store (1)
|
(1
|
)
|
(285
|
)
|
||
|
Other
|
—
|
|
7
|
|
||
|
Same Store Properties at December 31, 2015
|
358
|
|
96,286
|
|
||
|
Year Ended
|
||||||
|
December 31, 2015
|
||||||
|
Properties
|
Apartment
Units
|
|||||
|
Same Store
|
358
|
|
96,286
|
|
||
|
Non-Same Store:
|
||||||
|
2015 acquisitions
|
4
|
|
625
|
|
||
|
2014 acquisitions
|
4
|
|
1,011
|
|
||
|
2014 acquisitions not yet stabilized (2)
|
2
|
|
342
|
|
||
|
2013 acquisitions not managed by the Company (3)
|
3
|
|
853
|
|
||
|
Lease-up properties not yet stabilized (2)
|
16
|
|
3,829
|
|
||
|
Unconsolidated properties
|
3
|
|
1,281
|
|
||
|
Properties removed from same store (1)
|
1
|
|
285
|
|
||
|
Other
|
1
|
|
1
|
|
||
|
Total Non-Same Store
|
34
|
|
8,227
|
|
||
|
Military Housing (not consolidated)
|
2
|
|
5,139
|
|
||
|
Total Properties and Apartment Units
|
394
|
|
109,652
|
|
||
Note: Properties are considered "stabilized" when they have achieved 90% occupancy for three consecutive months. Properties are included in Same Store when they are stabilized for all of the current and comparable periods presented.
|
(1)
|
Represents one property containing 285 apartment units (Playa Pacifica in Hermosa Beach, CA) which was removed from the same store portfolio due to a major renovation in which significant portions of the property are being taken offline for extended time periods. As of
December 31, 2015
, the property had 129 apartment units removed from service and an occupancy of only 27.9%. This property will not return to the same store portfolio until it is stabilized for all of the current and comparable periods presented.
|
|
(2)
|
Includes properties in various stages of lease-up and properties where lease-up has been completed but the properties were not stabilized for the comparable periods presented.
|
|
(3)
|
Includes three properties containing 853 apartment units acquired on February 27, 2013 in conjunction with the Archstone Acquisition that are owned by the Company but the entire projects are master leased to a third party corporate housing provider and the Company earns monthly net rental income.
|
The Company's acquisition, disposition and completed development activities also impacted overall results of operations for the years ended
December 31, 2015
and
2014
. The impacts of these activities are discussed in greater detail in the following paragraphs.
Comparison of the year ended
December 31, 2015
to the year ended
December 31, 2014
For the year ended
December 31, 2015
, the Company reported diluted earnings per share/unit of
$2.36
compared to
$1.73
44
per share/unit for the year ended
December 31, 2014
. The difference is primarily due to approximately $122.3 million in higher gains on property sales as well as improved operations in
2015
vs.
2014
.
For the year ended
December 31, 2015
, income from continuing operations increased approximately
$250.5 million
when compared to the year ended
December 31, 2014
. The increase in continuing operations is discussed below.
Revenues from the
2015
Same Store Properties increased
$125.3 million
primarily as a result of an increase in average rental rates charged to residents, higher occupancy and a decrease in turnover. Expenses from the
2015
Same Store Properties increased
$20.5 million
primarily due to increases in real estate taxes, repairs and maintenance expenses and payroll/property management costs, partially offset by lower utility costs. The following tables provide comparative same store results and statistics for the
2015
Same Store Properties:
|
2015 vs. 2014
|
||||||||||||||||||||||
|
Same Store Results/Statistics for 96,286 Same Store Apartment Units
|
||||||||||||||||||||||
|
$ in thousands (except for Average Rental Rate)
|
||||||||||||||||||||||
|
|
Results
|
Statistics
|
||||||||||||||||||||
|
Average
Rental
Rate (1)
|
||||||||||||||||||||||
|
Description
|
Revenues
|
Expenses
|
NOI
|
Occupancy
|
Turnover
|
|||||||||||||||||
|
2015
|
$
|
2,566,705
|
|
$
|
837,880
|
|
$
|
1,728,825
|
|
$
|
2,314
|
|
96.1
|
%
|
54.5
|
%
|
||||||
|
2014
|
$
|
2,441,390
|
|
$
|
817,337
|
|
$
|
1,624,053
|
|
$
|
2,208
|
|
95.8
|
%
|
54.9
|
%
|
||||||
|
Change
|
$
|
125,315
|
|
$
|
20,543
|
|
$
|
104,772
|
|
$
|
106
|
|
0.3
|
%
|
(0.4
|
%)
|
||||||
|
Change
|
5.1
|
%
|
2.5
|
%
|
6.5
|
%
|
4.8
|
%
|
|
|
||||||||||||
(1)
Average rental rate is defined as total rental revenues divided by the weighted average occupied apartment units for the period.
The following table provides comparative same store operating expenses for the
2015
Same Store Properties:
|
2015 vs. 2014
|
||||||||||||||||||
|
Same Store Operating Expenses for 96,286 Same Store Apartment Units
|
||||||||||||||||||
|
$ in thousands
|
||||||||||||||||||
|
% of Actual
2015 Operating Expenses |
||||||||||||||||||
|
Actual
2015 |
Actual
2014 |
$
Change |
%
Change |
|||||||||||||||
|
Real estate taxes
|
$
|
296,484
|
|
$
|
282,487
|
|
$
|
13,997
|
|
5.0
|
%
|
35.4
|
%
|
|||||
|
On-site payroll (1)
|
174,950
|
|
171,706
|
|
3,244
|
|
1.9
|
%
|
20.9
|
%
|
||||||||
|
Utilities (2)
|
118,986
|
|
123,296
|
|
(4,310
|
)
|
(3.5
|
%)
|
14.2
|
%
|
||||||||
|
Repairs and maintenance (3)
|
104,033
|
|
98,168
|
|
5,865
|
|
6.0
|
%
|
12.4
|
%
|
||||||||
|
Property management costs (4)
|
77,001
|
|
73,242
|
|
3,759
|
|
5.1
|
%
|
9.2
|
%
|
||||||||
|
Insurance
|
21,335
|
|
23,909
|
|
(2,574
|
)
|
(10.8
|
%)
|
2.6
|
%
|
||||||||
|
Leasing and advertising
|
10,370
|
|
10,605
|
|
(235
|
)
|
(2.2
|
%)
|
1.2
|
%
|
||||||||
|
Other on-site operating expenses (5)
|
34,721
|
|
33,924
|
|
797
|
|
2.3
|
%
|
4.1
|
%
|
||||||||
|
Same store operating expenses
|
$
|
837,880
|
|
$
|
817,337
|
|
$
|
20,543
|
|
2.5
|
%
|
100.0
|
%
|
|||||
|
(1)
|
On-site payroll – Includes payroll and related expenses for on-site personnel including property managers, leasing consultants and maintenance staff.
|
|
(2)
|
Utilities – Represents gross expenses prior to any recoveries under the Resident Utility Billing System (“RUBS”). Recoveries are reflected in rental income.
|
|
(3)
|
Repairs and maintenance – Includes general maintenance costs, apartment unit turnover costs including interior painting, routine landscaping, security, exterminating, fire protection, snow removal, elevator, roof and parking lot repairs and other miscellaneous building repair costs.
|
|
(4)
|
Property management costs – Includes payroll and related expenses for departments, or portions of departments, that directly support on-site management. These include such departments as regional and corporate property management, property accounting, human resources, training, marketing and revenue management, procurement, real estate tax, property legal services and information technology.
|
|
(5)
|
Other on-site operating expenses – Includes ground lease costs and administrative costs such as office supplies, telephone and data charges and association and business licensing fees.
|
The following table presents a reconciliation of operating income per the consolidated statements of operations and comprehensive income to NOI for the
2015
Same Store Properties:
45
|
|
Year Ended December 31,
|
|||||||
|
|
2015
|
2014
|
||||||
|
|
(Amounts in thousands)
|
|||||||
|
Operating income
|
$
|
1,008,820
|
|
$
|
921,375
|
|
||
|
Adjustments:
|
||||||||
|
Non-same store operating results
|
(107,606
|
)
|
(103,123
|
)
|
||||
|
Fee and asset management revenue
|
(8,387
|
)
|
(9,437
|
)
|
||||
|
Fee and asset management expense
|
5,021
|
|
5,429
|
|
||||
|
Depreciation
|
765,895
|
|
758,861
|
|
||||
|
General and administrative
|
65,082
|
|
50,948
|
|
||||
|
Same store NOI
|
$
|
1,728,825
|
|
$
|
1,624,053
|
|
||
For properties that the Company acquired and were stabilized prior to January 1,
2015
and that the Company expects to continue to own through
December 31, 2016
, the Company anticipates the following same store results for the full year ending
December 31, 2016
:
|
2016 Same Store Assumptions
|
||
|
Physical occupancy
|
|
96.0%
|
|
Revenue change
|
|
4.50% to 5.25%
|
|
Expense change
|
|
2.50% to 3.50%
|
|
NOI change
|
|
5.00% to 6.50%
|
The Company anticipates consolidated rental acquisitions of $600.0 million and consolidated rental dispositions of $7.4 billion (which includes the sale of the Starwood portfolio and other planned 2016 dispositions discussed above) and expects that acquisitions will have a 0.75% lower cap rate than dispositions for the full year ending
December 31, 2016
.
These
2016
assumptions are based on current expectations and are forward-looking.
Non-same store operating results increased approximately $4.5 million and consist primarily of properties acquired in calendar years
2014
and
2015
as well as operations from the Company’s completed development properties. This increase primarily resulted from:
|
▪
|
Development and newly stabilized development properties in lease-up of $27.8 million;
|
|
▪
|
Operating properties acquired in
2014
and
2015
of $18.1 million;
|
|
▪
|
Operating activities from other miscellaneous operations; and
|
|
▪
|
Was mostly offset by lost NOI from
2014
and
2015
dispositions of $41.8 million as well as a decrease in operating activities from other miscellaneous properties (including three master-leased properties from the Archstone Acquisition) of $2.2 million.
|
See also Note 17 in the Notes to Consolidated Financial Statements for additional discussion regarding the Company’s segment disclosures.
Fee and asset management revenues, net of fee and asset management expenses, decreased approximately
$0.6 million
or
16.0%
primarily as a result of lower revenue earned on management of the Company's military housing ventures at Fort Lewis and McChord Air Force base and lower fees earned on management of the Company's unconsolidated development joint ventures, partially offset by lower expenses.
Property management expenses from continuing operations include off-site expenses associated with the self-management of the Company’s properties as well as management fees paid to any third party management companies. These expenses increased approximately
$1.5 million
or
1.9%
. This increase is primarily attributable to an increase in payroll-related costs and education/conferences fees.
Depreciation expense from continuing operations, which includes depreciation on non-real estate assets, increased approximately
$7.0 million
or
0.9%
primarily as a result of additional depreciation expense on properties acquired in 2014 and 2015, development properties placed in service and capital expenditures for all properties owned, partially offset by no depreciation
46
or a partial period of depreciation expense during the year ended
December 31, 2015
for properties sold in 2015 and 2014 and properties classified as held for sale at December 31, 2015.
General and administrative expenses from continuing operations, which include corporate operating expenses, increased approximately
$14.1 million
or
27.7%
primarily due to an increase in payroll-related costs, including an additional $8.0 million related to the Company's revised executive compensation program. The Company anticipates that general and administrative expenses will approximate $54.0 million to $56.0 million for the year ending
December 31, 2016
, excluding charges of approximately $1.4 million related to the Company's revised executive compensation program. The above assumption is based on current expectations and is forward-looking.
Interest and other income from continuing operations increased approximately
$2.9 million
or
65.2%
primarily due to the settlement of various litigation/insurance claims during the year ended
December 31, 2015
. The Company anticipates that interest and other income will approximate $2.5 million to $3.5 million for the year ending
December 31, 2016
. The above assumption is based on current expectations and is forward-looking.
Other expenses from continuing operations decreased approximately
$6.1 million
or
67.6%
primarily due to litigation settlement costs recorded during the year ended
December 31, 2014
that did not reoccur in 2015 as well as a reduction in the reserve for a litigation matter recorded during the year ended
December 31, 2015
, partially offset by an increase in the expensing of overhead (pursuit cost write-offs) as a result of a more active focus on sourcing new development opportunities.
Interest expense from continuing operations, including amortization of deferred financing costs, decreased approximately
$13.4 million
or
2.9%
primarily as a result of the repayment of $300.0 million of 6.584% unsecured notes in April 2015, the repayment of $500.0 million of 5.25% unsecured notes in September 2014, the repayment of the Company's $750.0 million unsecured term loan facility in June 2014, mortgage payoffs and higher capitalized interest, partially offset by interest expense on $750.0 million of unsecured notes that closed in May 2015 and $1.2 billion of unsecured notes that closed in June 2014. During the year ended
December 31, 2015
, the Company capitalized interest costs of approximately $59.9 million as compared to $52.8 million for the year ended
December 31, 2014
. This capitalization of interest primarily relates to consolidated projects under development. The effective interest cost on all indebtedness for the year ended
December 31, 2015
was 4.72%
as compared to 4.74% for the year ended
December 31, 2014
. The Company anticipates that interest expense from continuing operations, excluding debt extinguishment costs/prepayment penalties, will approximate $354.6 million to $370.8 million and capitalized interest will approximate $47.0 million to $53.0 million for the year ending
December 31, 2016
. The above assumptions are based on current expectations and are forward-looking.
Income and other tax expense from continuing operations decreased approximately
$0.5 million
or
34.2%
primarily due
to decreases in estimated taxes related to properties sold and/or operated by the Company's TRS in 2015 vs. 2014. T
he Company anticipates that income and other tax expense will approximate $1.0 million to $1.5 million for the year ending
December 31, 2016
. The above assumption is based on current expectations and is forward-looking.
Income from investments in unconsolidated entities increased approximately
$23.0 million
primarily due to gains on the sale of certain assets owned by the Company's joint ventures with AVB and due to $18.6 million in favorable litigation settlements, neither of which occurred during the year ended
December 31, 2014
.
Net gain on sales of real estate properties increased approximately
$122.4 million
or
57.6%
as a result of higher gains on the sale of eight consolidated apartment properties during the year ended
December 31, 2015
as compared to ten consolidated property sales during the year ended
December 31, 2014
, all of which did not meet the new criteria for reporting discontinued operations. See Note 11 in the Notes to Consolidated Financial Statements for further discussion.
Net gain on sales of land parcels decreased approximately
$5.3 million
due to the gain on sale of three land parcels during the year ended December 31, 2014 as compared to no land sales during the year ended
December 31, 2015
.
Discontinued operations, net decreased approximately
$1.2 million
or
74.9%
between the periods under comparison. This decrease is primarily due to the Company's adoption of the new discontinued operations standard effective January 1, 2014. None of the properties sold during the years ended
December 31, 2015
and 2014 met the new criteria for reporting discontinued operations and as a result, the amounts included in discontinued operations for the years ended
December 31, 2015
and 2014 represent trailing activity for properties sold in 2013 and prior years. See Note 11 in the Notes to Consolidated Financial Statements for further discussion.
47
Comparison of the year ended December 31, 2014 to the year ended December 31, 2013
For the year ended December 31, 2014, the Company reported diluted earnings per share/unit of $1.73 compared to $5.16 per share/unit for the year ended December 31, 2013. The difference is primarily due to approximately $1.8 billion in higher gains on property sales in 2013 vs. 2014, partially offset by $69.6 million of higher merger-related expenses incurred in 2013 vs. 2014 in connection with the Archstone Acquisition, $122.8 million of higher debt extinguishment costs incurred in 2013 vs. 2014 in connection with early debt extinguishment of existing mortgage notes payable to manage the Company's post Archstone 2017 maturities profile and higher depreciation in 2013 as a direct result of in-place residential lease intangibles acquired in the Archstone Transaction.
For the year ended December 31, 2014, income from continuing operations increased approximately $825.3 million when compared to the year ended December 31, 2013. The increase in continuing operations is discussed below.
Revenues from the 2014 Same Store Properties increased $101.6 million primarily as a result of an increase in average rental rates charged to residents, higher occupancy and a decrease in turnover. Expenses from the 2014 Same Store Properties increased $14.8 million primarily due to increases in real estate taxes and utilities, partially offset by lower property management costs. The following tables provide comparative same store results and statistics for the 2014 Same Store Properties:
|
2014 vs. 2013
|
||||||||||||||||||||||
|
Same Store Results/Statistics for 97,911 Same Store Apartment Units
|
||||||||||||||||||||||
|
$ in thousands (except for Average Rental Rate)
|
||||||||||||||||||||||
|
|
Results
|
Statistics
|
||||||||||||||||||||
|
Average
Rental
Rate (1)
|
||||||||||||||||||||||
|
Description
|
Revenues
|
Expenses
|
NOI
|
Occupancy
|
Turnover
|
|||||||||||||||||
|
2014
|
$
|
2,475,933
|
|
$
|
830,697
|
|
$
|
1,645,236
|
|
$
|
2,202
|
|
95.8
|
%
|
55.0
|
%
|
||||||
|
2013
|
$
|
2,374,350
|
|
$
|
815,865
|
|
$
|
1,558,485
|
|
$
|
2,119
|
|
95.4
|
%
|
55.5
|
%
|
||||||
|
Change
|
$
|
101,583
|
|
$
|
14,832
|
|
$
|
86,751
|
|
$
|
83
|
|
0.4
|
%
|
(0.5
|
%)
|
||||||
|
Change
|
4.3
|
%
|
1.8
|
%
|
5.6
|
%
|
3.9
|
%
|
|
|
||||||||||||
Note: Same store results/statistics include the stabilized apartment units acquired in the Archstone Acquisition that are owned and managed by the Company.
(1)
Average rental rate is defined as total rental revenues divided by the weighted average occupied apartment units for the period.
The following table provides comparative same store operating expenses for the 2014 Same Store Properties:
|
2014 vs. 2013
|
||||||||||||||||||
|
Same Store Operating Expenses for 97,911 Same Store Apartment Units
|
||||||||||||||||||
|
$ in thousands
|
||||||||||||||||||
|
% of Actual
2014 Operating Expenses |
||||||||||||||||||
|
Actual
2014 |
Actual
2013 |
$
Change |
%
Change |
|||||||||||||||
|
Real estate taxes
|
$
|
287,214
|
|
$
|
271,888
|
|
$
|
15,326
|
|
5.6
|
%
|
34.6
|
%
|
|||||
|
On-site payroll (1)
|
174,273
|
|
174,589
|
|
(316
|
)
|
(0.2
|
%)
|
21.0
|
%
|
||||||||
|
Utilities (2)
|
125,235
|
|
119,253
|
|
5,982
|
|
5.0
|
%
|
15.1
|
%
|
||||||||
|
Repairs and maintenance (3)
|
100,496
|
|
100,319
|
|
177
|
|
0.2
|
%
|
12.1
|
%
|
||||||||
|
Property management costs (4)
|
74,278
|
|
78,354
|
|
(4,076
|
)
|
(5.2
|
%)
|
8.9
|
%
|
||||||||
|
Insurance
|
24,354
|
|
24,626
|
|
(272
|
)
|
(1.1
|
%)
|
2.9
|
%
|
||||||||
|
Leasing and advertising
|
10,802
|
|
12,072
|
|
(1,270
|
)
|
(10.5
|
%)
|
1.3
|
%
|
||||||||
|
Other on-site operating expenses (5)
|
34,045
|
|
34,764
|
|
(719
|
)
|
(2.1
|
%)
|
4.1
|
%
|
||||||||
|
Same store operating expenses
|
$
|
830,697
|
|
$
|
815,865
|
|
$
|
14,832
|
|
1.8
|
%
|
100.0
|
%
|
|||||
|
(1)
|
On-site payroll – Includes payroll and related expenses for on-site personnel including property managers, leasing consultants and maintenance staff.
|
|
(2)
|
Utilities – Represents gross expenses prior to any recoveries under the Resident Utility Billing System (“RUBS”). Recoveries are reflected in rental income.
|
|
(3)
|
Repairs and maintenance – Includes general maintenance costs, apartment unit turnover costs including interior painting, routine landscaping, security, exterminating, fire protection, snow removal, elevator, roof and parking lot repairs and other miscellaneous building repair costs.
|
48
|
(4)
|
Property management costs – Includes payroll and related expenses for departments, or portions of departments, that directly support on-site management. These include such departments as regional and corporate property management, property accounting, human resources, training, marketing and revenue management, procurement, real estate tax, property legal services and information technology.
|
|
(5)
|
Other on-site operating expenses – Includes ground lease costs and administrative costs such as office supplies, telephone and data charges and association and business licensing fees.
|
The following table presents a reconciliation of operating income per the consolidated statements of operations and comprehensive income to NOI for the 2014 Same Store Properties:
|
|
Year Ended December 31,
|
|||||||
|
|
2014
|
2013
|
||||||
|
|
(Amounts in thousands)
|
|||||||
|
Operating income
|
$
|
921,375
|
|
$
|
512,322
|
|
||
|
Adjustments:
|
||||||||
|
Archstone pre-ownership operating results
|
—
|
|
55,694
|
|
||||
|
Non-same store operating results
|
(81,940
|
)
|
(47,445
|
)
|
||||
|
Fee and asset management revenue
|
(9,437
|
)
|
(9,698
|
)
|
||||
|
Fee and asset management expense
|
5,429
|
|
6,460
|
|
||||
|
Depreciation
|
758,861
|
|
978,973
|
|
||||
|
General and administrative
|
50,948
|
|
62,179
|
|
||||
|
Same store NOI
|
$
|
1,645,236
|
|
$
|
1,558,485
|
|
||
Non-same store operating results increased approximately $34.5 million and consist primarily of properties acquired in calendar years 2013 and 2014 as well as operations from the Company’s completed development properties, but exclude the 18,465 stabilized apartment units acquired in the Archstone Acquisition that are owned and managed by the Company. This increase primarily resulted from:
|
▪
|
Development and newly stabilized development properties in lease-up of $20.6 million;
|
|
▪
|
Operating properties acquired in 2013 and 2014 of $13.8 million
(excluding operating properties acquired in the Archstone Acquisition)
;
|
|
▪
|
Other miscellaneous properties (including three master-leased properties acquired in the Archstone Acquisition) of $1.7 million; and
|
|
▪
|
Partially offset by a decrease in operating activities from other miscellaneous operations.
|
See also Note 17 in the Notes to Consolidated Financial Statements for additional discussion regarding the Company’s segment disclosures.
Fee and asset management revenues, net of fee and asset management expenses, increased approximately $0.8 million or 23.8% primarily as a result of higher revenue earned on management of the Company's military housing ventures at Fort Lewis and McChord Air Force base and lower expenses, partially offset by lower fees earned on management of the Company’s unconsolidated development joint ventures.
Property management expenses from continuing operations include off-site expenses associated with the self-management of the Company’s properties as well as management fees paid to any third party management companies. These expenses decreased approximately $4.7 million or 5.6%. This decrease is primarily attributable to a decrease in payroll-related costs, office rent, education/conferences and legal and professional fees.
Depreciation expense from continuing operations, which includes depreciation on non-real estate assets, decreased approximately $220.1 million or 22.5% primarily as a result of in-place residential lease intangibles which are generally amortized over a six month period and can significantly elevate depreciation expense following an acquisition, especially during 2013 as a direct result of the Archstone Acquisition, partially offset by additional depreciation expense on properties acquired in 2014, development properties placed in service and capital expenditures for all properties owned.
General and administrative expenses from continuing operations, which include corporate operating expenses, decreased approximately $11.2 million or 18.1% primarily due to a decrease in payroll-related costs and office rent.
49
Interest and other income from continuing operations decreased approximately $0.8 million or 15.5% primarily due to proceeds received from the sale of certain investment securities during the year ended December 31, 2013 that did not reoccur in 2014, partially offset by proceeds received from various insurance/litigation settlements totaling $2.8 million during the year ended December 31, 2014 that did not occur in 2013.
Other expenses from continuing operations decreased approximately $20.6 million or 69.4% primarily due to the closing of the Archstone Acquisition during the year ended December 31, 2013 and the significant decline in transaction activity during the year ended December 31, 2014.
Interest expense from continuing operations, including amortization of deferred financing costs, decreased approximately $140.8 million or 23.1% primarily as a result of $122.8 million of higher debt extinguishment costs incurred on early debt prepayments and write-offs of unamortized deferred financing costs in 2013 vs. 2014 related to managing the Company's post Archstone 2017 maturities profile and higher capitalized interest in 2014. During the year ended December 31, 2014, the Company capitalized interest costs of approximately $52.8 million as compared to $47.3 million for the year ended December 31, 2013. This capitalization of interest primarily relates to consolidated projects under development. The effective interest cost on all indebtedness for the year ended December 31, 2014 was 4.74% as compared to 4.91% (excluding $107.6 million in net debt extinguishment costs) for the year ended December 31, 2013.
Income and other tax expense from continuing operations increased approximately $0.2 million or 19.2% primarily due to increases in estimated taxes related to properties sold by the Company's TRS in 2014 vs. 2013, partially offset by a reduction and timing of all other taxes.
Loss from investments in unconsolidated entities decreased by $50.2 million or 86.3% primarily due to indirect costs incurred in 2013 from the Archstone Acquisition through the Company's joint ventures with AVB such as severance and retention bonuses that have significantly decreased in 2014.
Net gain on sales of real estate properties increased $212.7 million as a result of the sale of ten consolidated apartment properties during the year ended December 31, 2014 that did not meet the new criteria for reporting discontinued operations. See Note 11 in the Notes to Consolidated Financial Statements for further discussion.
Net gain on sales of land parcels decreased approximately $7.0 million or 56.8% due to the gain on sale of three land parcels during the year ended December 31, 2014 as compared to seven land sales during the year ended December 31, 2013.
Discontinued operations, net decreased approximately $2.1 billion or 99.9% between the periods under comparison. This decrease is primarily due to substantially higher sales volume during the year ended December 31, 2013 compared to the same period in 2014 and due to the Company's adoption of the new discontinued operations standard effective January 1, 2014. See Note 11 in the Notes to Consolidated Financial Statements for further discussion.
Liquidity and Capital Resources
EQR issues public equity from time to time and guarantees certain debt of the Operating Partnership. EQR does not have any indebtedness as all debt is incurred by the Operating Partnership.
As of January 1,
2015
, the Company had approximately
$40.1 million
of cash and cash equivalents and it had $2.12 billion available under its revolving credit facility (net of $43.8 million which was restricted/dedicated to support letters of credit and net of $333.0 million outstanding). After taking into effect the various transactions discussed in the following paragraphs and the net cash provided by operating activities, the Company’s cash and cash equivalents balance at
December 31, 2015
was approximately
$42.3 million
and the amount available on its revolving credit facility was
$2.07 billion
(net of
$45.1 million
which was restricted/dedicated to support letters of credit and net of
$387.5 million
outstanding on the commercial paper program).
During the year ended
December 31, 2015
, the Company generated proceeds from various transactions, which included the following:
|
▪
|
Disposed of eight consolidated properties and a 193,230 square foot medical office building, receiving net proceeds of approximately $504.7 million;
|
|
▪
|
Issued $450.0 million of ten-year 3.375% fixed rate public notes, receiving net proceeds of $447.5 million before underwriting fees, hedge termination costs and other expenses, at an all-in effective interest rate of 3.81%;
|
|
▪
|
Issued $300.0 million of thirty-year 4.50% fixed rate public notes, receiving net proceeds of $298.9 million before
|
50
underwriting fees and other expenses, at an all-in effective interest rate of 4.55%;
|
▪
|
Received approximately $51.0 million in distributions from the Residual JV as a result of the winddown/sale of remaining assets owned by the Residual JV and litigation settlements received by the Residual JV; and
|
|
▪
|
Issued approximately 1.5 million Common Shares related to share option exercises and ESPP purchases and received net proceeds of $63.9 million, which were contributed to the capital of the Operating Partnership in exchange for additional OP Units (on a one-for-one Common Share per OP Unit basis).
|
During the year ended
December 31, 2015
, the above proceeds along with net cash flow from operations and availability on the Company's revolving line of credit and commercial paper program were primarily utilized to:
|
▪
|
Acquire four consolidated properties and three contiguous land parcels for approximately $331.3 million;
|
|
▪
|
Invest $653.9 million primarily in development projects;
|
|
▪
|
Repay $368.5 million of mortgage loans;
|
|
▪
|
Repay $300.0 million of 6.584% unsecured notes at maturity; and
|
|
▪
|
Repurchase and retire 254,400 Series K Preferred Shares with a par value of $12.7 million for total cash consideration of approximately $16.3 million, inclusive of premiums and accrued dividends through the redemption date (See Note 3 in the Notes to Consolidated Financial Statements).
|
In September 2009, EQR announced the establishment of an At-The-Market (“ATM”) share offering program which would allow EQR to sell Common Shares from time to time into the existing trading market at current market prices as well as through negotiated transactions. Per the terms of ERPOP’s partnership agreement, EQR contributes the net proceeds from all equity offerings to the capital of ERPOP in exchange for additional OP Units (on a one-for-one Common Share per OP Unit basis). EQR may, but shall have no obligation to, sell Common Shares through the ATM share offering program in amounts and at times to be determined by EQR. Actual sales will depend on a variety of factors to be determined by EQR from time to time, including (among others) market conditions, the trading price of EQR’s Common Shares and determinations of the appropriate sources of funding for EQR. On July 30, 2013, the Board of Trustees approved an increase to the amount of shares which may be offered under the ATM program to 13.0 million Common Shares and extended the program maturity to July 2016. EQR has not issued any shares under this program since September 14, 2012. Through February 19, 2016, EQR has cumulatively issued approximately 16.7 million Common Shares at an average price of $48.53 per share for total consideration of approximately $809.9 million.
Depending on its analysis of market prices, economic conditions and other opportunities for the investment of available capital, EQR may repurchase its Common Shares pursuant to its existing share repurchase program authorized by the Board of Trustees. Effective July 30, 2013, the Board of Trustees approved an increase and modification to the Company's share repurchase program to allow for the potential repurchase of up to 13.0 million shares. EQR repurchased approximately $1.8 million (31,240 shares at a price of $56.87 per share) of its Common Shares (all related to the vesting of employees' restricted shares) during the year ended December 31, 2014. No open market repurchases have occurred since 2008. As of February 19, 2016, EQR has remaining authorization to repurchase an additional 12,968,760 of its shares. See Note 3 in the Notes to Consolidated Financial Statements for further discussion.
Depending on its analysis of prevailing market conditions, liquidity requirements, contractual restrictions and other factors, the Company may from time to time seek to repurchase and retire its outstanding debt in open market or privately negotiated transactions.
The Company’s total debt summary and debt maturity schedules as of
December 31, 2015
are as follows:
51
|
Debt Summary as of December 31, 2015
|
|||||||||||||
|
(Amounts in thousands)
|
|||||||||||||
|
Weighted
Average Maturities (years) |
|||||||||||||
|
Weighted
Average Rates (1) |
|||||||||||||
|
Amounts (1)
|
% of Total
|
||||||||||||
|
Secured
|
$
|
4,704,870
|
|
42.9
|
%
|
4.23
|
%
|
6.9
|
|
||||
|
Unsecured
|
6,263,628
|
|
57.1
|
%
|
4.73
|
%
|
8.2
|
|
|||||
|
Total
|
$
|
10,968,498
|
|
100.0
|
%
|
4.51
|
%
|
7.6
|
|
||||
|
Fixed Rate Debt:
|
|||||||||||||
|
Secured – Conventional
|
$
|
3,997,930
|
|
36.5
|
%
|
4.86
|
%
|
5.3
|
|
||||
|
Unsecured – Public
|
5,423,012
|
|
49.4
|
%
|
5.30
|
%
|
9.2
|
|
|||||
|
Fixed Rate Debt
|
9,420,942
|
|
85.9
|
%
|
5.10
|
%
|
7.6
|
|
|||||
|
Floating Rate Debt:
|
|||||||||||||
|
Secured – Conventional
|
7,985
|
|
0.1
|
%
|
0.13
|
%
|
18.1
|
|
|||||
|
Secured – Tax Exempt
|
698,955
|
|
6.3
|
%
|
0.64
|
%
|
15.5
|
|
|||||
|
Unsecured – Public (2)
|
453,340
|
|
4.2
|
%
|
0.93
|
%
|
3.5
|
|
|||||
|
Unsecured – Revolving Credit Facility
|
—
|
|
—
|
|
1.07
|
%
|
2.3
|
|
|||||
|
Unsecured – Commercial Paper Program (3)
|
387,276
|
|
3.5
|
%
|
0.56
|
%
|
—
|
|
|||||
|
Floating Rate Debt
|
1,547,556
|
|
14.1
|
%
|
0.75
|
%
|
8.1
|
|
|||||
|
Total
|
$
|
10,968,498
|
|
100.0
|
%
|
4.51
|
%
|
7.6
|
|
||||
|
(1)
|
Net of the effect of any derivative instruments. Weighted average rates are for the year ended
December 31, 2015
.
|
|
(2)
|
Fair value interest rate swaps convert the $450.0 million 2.375% notes due July 1, 2019 to a floating interest rate of 90-Day LIBOR plus 0.61%.
|
|
(3)
|
As of
December 31, 2015
, the weighted average maturity on the Company's outstanding commercial paper was
19
days.
|
Note: The Company capitalized interest of approximately $59.9 million and $52.8 million during the years ended
December 31, 2015
and
2014
, respectively.
Note: The Company recorded approximately $8.6 million and $2.8 million of net debt discount/deferred derivative settlement amortization as additional interest expense during the years ended
December 31, 2015
and
2014
, respectively.
|
Debt Maturity Schedule as of December 31, 2015
|
|||||||||||||||||||||
|
(Amounts in thousands)
|
|||||||||||||||||||||
|
Weighted
Average Rates on Fixed Rate Debt (1) |
Weighted
Average Rates on Total Debt (1) |
||||||||||||||||||||
|
Fixed
Rate (1) |
Floating
Rate (1) |
||||||||||||||||||||
|
Year
|
Total
|
% of Total
|
|||||||||||||||||||
|
2016
|
$
|
965,341
|
|
$
|
387,472
|
|
(2)
|
$
|
1,352,813
|
|
(3)
|
12.3
|
%
|
5.33
|
%
|
4.06
|
%
|
||||
|
2017
|
1,347,390
|
|
456
|
|
1,347,846
|
|
(3)
|
12.3
|
%
|
6.16
|
%
|
6.16
|
%
|
||||||||
|
2018
|
82,802
|
|
97,659
|
|
|
180,461
|
|
1.7
|
%
|
5.59
|
%
|
3.07
|
%
|
||||||||
|
2019
|
806,705
|
|
474,422
|
|
1,281,127
|
|
11.7
|
%
|
5.48
|
%
|
3.75
|
%
|
|||||||||
|
2020
|
1,678,623
|
|
809
|
|
1,679,432
|
|
15.3
|
%
|
5.49
|
%
|
5.49
|
%
|
|||||||||
|
2021
|
1,195,251
|
|
856
|
|
1,196,107
|
|
10.9
|
%
|
4.63
|
%
|
4.63
|
%
|
|||||||||
|
2022
|
228,924
|
|
905
|
|
229,829
|
|
2.1
|
%
|
3.16
|
%
|
3.17
|
%
|
|||||||||
|
2023
|
1,327,965
|
|
956
|
|
1,328,921
|
|
12.1
|
%
|
3.74
|
%
|
3.74
|
%
|
|||||||||
|
2024
|
2,497
|
|
1,011
|
|
3,508
|
|
0.0
|
%
|
4.97
|
%
|
5.14
|
%
|
|||||||||
|
2025
|
452,625
|
|
1,069
|
|
453,694
|
|
4.1
|
%
|
3.38
|
%
|
3.39
|
%
|
|||||||||
|
2026+
|
1,319,792
|
|
641,228
|
|
1,961,020
|
|
17.9
|
%
|
4.87
|
%
|
3.41
|
%
|
|||||||||
|
Premium/(Discount)
|
13,027
|
|
(59,287
|
)
|
(46,260
|
)
|
(0.4
|
%)
|
N/A
|
|
N/A
|
|
|||||||||
|
Total
|
$
|
9,420,942
|
|
$
|
1,547,556
|
|
$
|
10,968,498
|
|
100.0
|
%
|
4.97
|
%
|
4.35
|
%
|
||||||
|
(1)
|
Net of the effect of any derivative instruments. Weighted average rates are as of
December 31, 2015
.
|
|
(2)
|
Represents the principal outstanding on the Company's unsecured commercial paper program. The Company may borrow up to a maximum of $500.0 million under this program subject to market conditions. No amounts remain outstanding under this program as of
February 19, 2016
.
|
|
(3)
|
Following completion of the debt extinguishment activities in 2016 and repayment of all outstanding commercial paper balances, the Company will have approximately $336.6 million and $605.0 million in debt maturing in 2016 and 2017, respectively. See Note 18 in the Notes to Consolidated Financial Statements for further discussion.
|
52
The following table provides a summary of the Company’s unsecured debt as of
December 31, 2015
:
|
Unsecured Debt Summary as of December 31, 2015
|
||||||||||||||||
|
(Amounts in thousands)
|
||||||||||||||||
|
Unamortized
Premium/ (Discount) |
||||||||||||||||
|
Coupon
Rate |
Due
Date |
Face
Amount |
Net
Balance |
|||||||||||||
|
Fixed Rate Notes:
|
||||||||||||||||
|
5.125%
|
03/15/16
|
(5)
|
$
|
500,000
|
|
$
|
(9
|
)
|
$
|
499,991
|
|
|||||
|
5.375%
|
08/01/16
|
(5)
|
400,000
|
|
(108
|
)
|
399,892
|
|
||||||||
|
5.750%
|
06/15/17
|
(5)
|
650,000
|
|
(763
|
)
|
649,237
|
|
||||||||
|
7.125%
|
10/15/17
|
(5)
|
150,000
|
|
(116
|
)
|
149,884
|
|
||||||||
|
2.375%
|
07/01/19
|
(1)
|
450,000
|
|
(315
|
)
|
449,685
|
|
||||||||
|
Fair Value Derivative Adjustments
|
(1)
|
(450,000
|
)
|
315
|
|
(449,685
|
)
|
|||||||||
|
4.750%
|
07/15/20
|
600,000
|
|
(2,060
|
)
|
597,940
|
|
|||||||||
|
4.625%
|
12/15/21
|
(5)
|
1,000,000
|
|
(2,254
|
)
|
997,746
|
|
||||||||
|
3.000%
|
04/15/23
|
500,000
|
|
(3,226
|
)
|
496,774
|
|
|||||||||
|
3.375%
|
06/01/25
|
450,000
|
|
(2,331
|
)
|
447,669
|
|
|||||||||
|
7.570%
|
08/15/26
|
(5)
|
140,000
|
|
—
|
|
140,000
|
|
||||||||
|
4.500%
|
07/01/44
|
750,000
|
|
(5,009
|
)
|
744,991
|
|
|||||||||
|
4.500%
|
06/01/45
|
300,000
|
|
(1,112
|
)
|
298,888
|
|
|||||||||
|
5,440,000
|
|
(16,988
|
)
|
5,423,012
|
|
|||||||||||
|
Floating Rate Notes:
|
||||||||||||||||
|
07/01/19
|
(1)
|
450,000
|
|
(315
|
)
|
449,685
|
|
|||||||||
|
Fair Value Derivative Adjustments
|
07/01/19
|
(1)
|
3,655
|
|
—
|
|
3,655
|
|
||||||||
|
453,655
|
|
(315
|
)
|
453,340
|
|
|||||||||||
|
Line of Credit and Commercial Paper:
|
||||||||||||||||
|
Revolving Credit Facility
|
LIBOR+0.95%
|
04/01/18
|
(2)(3)
|
—
|
|
—
|
|
—
|
|
|||||||
|
Commercial Paper Program
|
(4)
|
(4)
|
(2)
|
387,472
|
|
(196
|
)
|
387,276
|
|
|||||||
|
387,472
|
|
(196
|
)
|
387,276
|
|
|||||||||||
|
Total Unsecured Debt
|
$
|
6,281,127
|
|
$
|
(17,499
|
)
|
$
|
6,263,628
|
|
|||||||
|
(1)
|
Fair value interest rate swaps convert the $450.0 million 2.375% notes due July 1, 2019 to a floating interest rate of 90-Day LIBOR plus 0.61%.
|
|
(2)
|
Facility/program is private. All other unsecured debt is public.
|
|
(3)
|
Represents the Company's $2.5 billion unsecured revolving credit facility maturing April 1, 2018. The interest rate on advances under the credit facility will generally be LIBOR plus a spread (currently 0.95%) and an annual facility fee (currently 15 basis points). Both the spread and the facility fee are dependent on the credit rating of the Company's long-term debt. As of
December 31, 2015
, there was approximately
$2.07 billion
available on this facility (net of
$45.1 million
which was restricted/dedicated to support letters of credit and net of
$387.5 million
outstanding on the commercial paper program). As of
February 19, 2016
, there was approximately
$2.44 billion
available on this facility (net of
$64.5 million
which was restricted/dedicated to support letters of credit).
|
|
(4)
|
Represents the Company's unsecured commercial paper program. The Company may borrow up to a maximum of $500.0 million under this program subject to market conditions. The notes bear interest at various floating rates with a weighted average of
0.56%
for the year ended
December 31, 2015
and a weighted average maturity of
19
days as of
December 31, 2015
. No amounts remain outstanding under this program as of
February 19, 2016
.
|
|
(5)
|
All or a portion of these notes were repaid in conjunction with the debt extinguishment activities in 2016. See Note 18 in the Notes to Consolidated Financial Statements for further discussion.
|
EQR and ERPOP currently have an active universal shelf registration statement for the issuance of equity and debt securities that automatically became effective upon filing with the SEC on July 30, 2013 and expires on July 30, 2016. Per the terms of ERPOP’s partnership agreement, EQR contributes the net proceeds of all equity offerings to the capital of ERPOP in exchange for additional OP Units (on a one-for-one Common Share per OP Unit basis) or preference units (on a one-for-one preferred share per preference unit basis).
The Company’s “Consolidated Debt-to-Total Market Capitalization Ratio” as of
December 31, 2015
is presented in the following table. The Company calculates the equity component of its market capitalization as the sum of (i) the total outstanding Common Shares and assumed conversion of all Units at the equivalent market value of the closing price of the Company’s Common Shares on the New York Stock Exchange and (ii) the liquidation value of all perpetual preferred shares outstanding.
53
|
Equity Residential
|
|||||||||||||||||
|
Capital Structure as of December 31, 2015
|
|||||||||||||||||
|
(Amounts in thousands except for share/unit and per share amounts)
|
|||||||||||||||||
|
Secured Debt
|
$
|
4,704,870
|
|
42.9
|
%
|
||||||||||||
|
Unsecured Debt
|
6,263,628
|
|
57.1
|
%
|
|||||||||||||
|
Total Debt
|
10,968,498
|
|
100.0
|
%
|
26.2
|
%
|
|||||||||||
|
Common Shares (includes Restricted Shares)
|
364,755,444
|
|
96.2
|
%
|
|||||||||||||
|
Units (includes OP Units and Restricted Units)
|
14,427,164
|
|
3.8
|
%
|
|||||||||||||
|
Total Shares and Units
|
379,182,608
|
|
100.0
|
%
|
|||||||||||||
|
Common Share Price at December 31, 2015
|
$
|
81.59
|
|
||||||||||||||
|
30,937,509
|
|
99.9
|
%
|
||||||||||||||
|
Perpetual Preferred Equity (see below)
|
37,280
|
|
0.1
|
%
|
|||||||||||||
|
Total Equity
|
30,974,789
|
|
100.0
|
%
|
73.8
|
%
|
|||||||||||
|
Total Market Capitalization
|
$
|
41,943,287
|
|
100.0
|
%
|
||||||||||||
|
Equity Residential
|
|||||||||||||||||
|
Perpetual Preferred Equity as of December 31, 2015
|
|||||||||||||||||
|
(Amounts in thousands except for share and per share amounts)
|
|||||||||||||||||
|
Annual
Dividend Per Share |
Annual
Dividend Amount |
||||||||||||||||
|
Redemption
Date |
Outstanding
Shares |
Liquidation
Value |
|||||||||||||||
|
Series
|
|||||||||||||||||
|
Preferred Shares:
|
|||||||||||||||||
|
8.29% Series K (1) (2)
|
12/10/26
|
745,600
|
|
$
|
37,280
|
|
$
|
4.145
|
|
$
|
3,091
|
|
|||||
|
Total Perpetual Preferred Equity
|
745,600
|
|
$
|
37,280
|
|
$
|
3,091
|
|
|||||||||
|
(1)
|
Effective January 26, 2015, the Company repurchased and retired 196,400 Series K Preferred Shares with a par value of $9.82 million for total cash consideration of approximately $12.7 million. As a result of this partial redemption, the Company incurred a cash charge of approximately $2.8 million which was recorded as a premium on the redemption of Preferred Shares.
|
|
(2)
|
Effective November 12, 2015, the Company repurchased and retired 58,000 Series K Preferred Shares with a par value of $2.9 million for total cash consideration of approximately $3.6 million. As a result of this partial redemption, the Company incurred a cash charge of approximately $0.7 million which was recorded as a premium on the redemption of Preferred Shares.
|
The Operating Partnership’s “Consolidated Debt-to-Total Market Capitalization Ratio” as of
December 31, 2015
is presented in the following table. The Operating Partnership calculates the equity component of its market capitalization as the sum of (i) the total outstanding Units at the equivalent market value of the closing price of the Company’s Common Shares on the New York Stock Exchange and (ii) the liquidation value of all perpetual preference units outstanding.
|
ERP Operating Limited Partnership
|
||||||||||||||||
|
Capital Structure as of December 31, 2015
|
||||||||||||||||
|
(Amounts in thousands except for unit and per unit amounts)
|
||||||||||||||||
|
Secured Debt
|
$
|
4,704,870
|
|
42.9
|
%
|
|||||||||||
|
Unsecured Debt
|
6,263,628
|
|
57.1
|
%
|
||||||||||||
|
Total Debt
|
10,968,498
|
|
100.0
|
%
|
26.2
|
%
|
||||||||||
|
Total outstanding Units
|
379,182,608
|
|
||||||||||||||
|
Common Share Price at December 31, 2015
|
$
|
81.59
|
|
|||||||||||||
|
30,937,509
|
|
99.9
|
%
|
|||||||||||||
|
Perpetual Preference Units (see below)
|
37,280
|
|
0.1
|
%
|
||||||||||||
|
Total Equity
|
30,974,789
|
|
100.0
|
%
|
73.8
|
%
|
||||||||||
|
Total Market Capitalization
|
$
|
41,943,287
|
|
100.0
|
%
|
|||||||||||
54
|
ERP Operating Limited Partnership
|
|||||||||||||||||
|
Perpetual Preference Units as of December 31, 2015
|
|||||||||||||||||
|
(Amounts in thousands except for unit and per unit amounts)
|
|||||||||||||||||
|
Annual
Dividend Per Unit |
Annual
Dividend Amount |
||||||||||||||||
|
Redemption
Date |
Outstanding
Units |
Liquidation
Value |
|||||||||||||||
|
Series
|
|||||||||||||||||
|
Preference Units:
|
|||||||||||||||||
|
8.29% Series K (1) (2)
|
12/10/26
|
745,600
|
|
$
|
37,280
|
|
$
|
4.145
|
|
$
|
3,091
|
|
|||||
|
Total Perpetual Preference Units
|
745,600
|
|
$
|
37,280
|
|
$
|
3,091
|
|
|||||||||
|
(1)
|
Effective January 26, 2015, the Operating Partnership repurchased and retired 196,400 Series K Preference Units with a par value of $9.82 million for total cash consideration of approximately $12.7 million, in conjunction with the concurrent redemption of the corresponding Company Preferred Shares. As a result of this partial redemption, the Operating Partnership incurred a cash charge of approximately $2.8 million which was recorded as a premium on the redemption of Preference Units.
|
|
(2)
|
Effective November 12, 2015, the Operating Partnership repurchased and retired 58,000 Series K Preference Units with a par value of $2.9 million for total cash consideration of approximately $3.6 million, in conjunction with the concurrent redemption of the corresponding Company Preferred Shares. As a result of this partial redemption, the Operating Partnership incurred a cash charge of approximately $0.7 million which was recorded as a premium on the redemption of Preference Units.
|
The Company generally expects to meet its short-term liquidity requirements, including capital expenditures related to maintaining its existing properties and scheduled unsecured note and mortgage note repayments, through its working capital, net cash provided by operating activities and borrowings under the Company’s revolving credit facility and commercial paper program. Under normal operating conditions, the Company considers its cash provided by operating activities to be adequate to meet operating requirements and payments of distributions.
The Company has a flexible dividend policy which it believes will generate payouts closely aligned with the actual annual operating results of the Company’s core business and provide transparency to investors. Beginning in 2014, the Company began paying its annual dividend based on 65% of the midpoint of the range of Normalized FFO guidance customarily provided as part of the Company's fourth quarter earnings release. The Company's 2015 annual dividend payout was $2.21 per share/unit and the Company paid four quarterly dividends of $0.5525 per share/unit in 2015. The Company expects the 2016 annual regular dividend payout will be $2.015 per share/unit and the Company intends to pay four quarterly dividends of $0.50375 per share/unit in 2016. Due to the continued execution of its disposition strategy, the Company's anticipated 2016 regular annual dividend will decrease by approximately 8.8% as compared to 2015. In addition to the regular quarterly dividends, the Company anticipates paying two special dividends to its shareholders and holders of OP Units of between $10.00 and $12.00 per share/unit in the aggregate. On February 22, 2016, the Board of Trustees declared a special dividend of $8.00 per share/unit to be paid on March 10, 2016 to shareholders/unitholders of record as of March 3, 2016. The Company expects to pay an additional special dividend of approximately $2.00 to $4.00 per share/unit later in 2016 from the proceeds of additional asset sales. All future dividends remain subject to the discretion of the Board of Trustees. The above assumptions are based on current expectations and are forward-looking.
While our current dividend policy makes it less likely that we will over distribute, it will also lead to a dividend reduction more quickly should operating results deteriorate or large portfolio sales occur. However, whether due to changes in the dividend policy or otherwise, there may be times when the Company experiences shortfalls in its coverage of distributions, which may cause the Company to consider reducing its distributions and/or using the proceeds from property dispositions or additional financing transactions to make up the difference. Should these shortfalls occur for lengthy periods of time or be material in nature, the Company's financial condition may be adversely affected and it may not be able to maintain its current distribution levels. The Company believes that its expected
2016
operating cash flow will be sufficient to cover capital expenditures and regular dividends/distributions, while net sales proceeds will cover the anticipated special dividends.
The Company also expects to meet its long-term liquidity requirements, such as lump sum unsecured note and mortgage debt maturities, property acquisitions, financing of construction and development activities through the issuance of secured and unsecured debt and equity securities, including additional OP Units, proceeds received from the disposition of certain properties and joint ventures and cash generated from operations after all distributions. In addition, the Company has significant unencumbered properties available to secure additional mortgage borrowings in the event that the public capital markets are unavailable or the cost of alternative sources of capital is too high. The fair value of and cash flow from these unencumbered properties are in excess of the requirements the Company must maintain in order to comply with covenants under its unsecured notes, line of credit and commercial paper program. Of the $28.5 billion in investment in real estate on the Company’s balance sheet at
December 31, 2015
(inclusive of $3.4 billion of real estate held for sale), $20.8 billion (inclusive of real estate held for sale) or 72.9% was unencumbered. However, there can be no assurances that these sources of capital will be available to the Company in the future
55
on acceptable terms or otherwise.
ERPOP's long-term senior debt ratings and short-term commercial paper ratings as well as EQR's long-term preferred equity ratings as of February 19, 2016 are as follows:
|
Standard & Poor's
|
Moody's
|
Fitch
|
||||
|
ERPOP's long-term senior debt rating
|
A-
|
Baa1 (1)
|
A-
|
|||
|
ERPOP's short-term commercial paper rating
|
A-2
|
P-2
|
F-2
|
|||
|
EQR's long-term preferred equity rating
|
BBB
|
Baa2 (2)
|
BBB
|
|||
|
(1)
|
Moody's rated ERPOP's long-term senior debt with a positive outlook.
|
|
(2)
|
Moody's rated EQR's long-term preferred equity with a positive outlook.
|
The long-term credit ratings listed above reflect the one-level upgrades by Standard & Poor's ("S&P") and Fitch effective April 30, 2015 and April 28, 2015, respectively. As a result of the S&P upgrade, the interest rate spread on advances under the Company's revolving credit facility was lowered from 1.05% to 0.95% effective April 30, 2015. The long-term credit ratings listed above were reaffirmed following the Company's announcement of the Starwood Transaction and other planned 2016 dispositions. EQR does not have short-term credit ratings.
On January 11, 2013, the Company replaced its existing $1.75 billion facility with a $2.5 billion unsecured revolving credit facility maturing April 1, 2018. The Company has the ability to increase available borrowings by an additional $500.0 million by adding additional banks to the facility or obtaining the agreement of existing banks to increase their commitments. The interest rate on advances under the facility will generally be LIBOR plus a spread (currently 0.95%) and the Company pays an annual facility fee (currently 15 basis points). Both the spread and the facility fee are dependent on the credit rating of the Company’s long-term debt.
On February 2, 2015, the Company entered into an unsecured commercial paper note program in the United States. The Company may borrow up to a maximum of $500.0 million under this program subject to market conditions. The notes will be sold under customary terms in the United States commercial paper note market and will rank pari passu with all of the Company's other unsecured senior indebtedness. As of February 19, 2016, no amounts were outstanding under this program.
As of
February 19, 2016
, no amounts were outstanding and the amount available on the revolving credit facility was
$2.44 billion
(net of
$64.5 million
which was restricted/dedicated to support letters of credit). This facility may, among other potential uses, be used to fund property acquisitions, costs for certain properties under development and short-term liquidity requirements.
See Note 18 in the Notes to Consolidated Financial Statements for discussion of the events which occurred subsequent to
December 31, 2015
.
Capitalization of Fixed Assets and Improvements to Real Estate
Our policy with respect to capital expenditures is generally to capitalize expenditures that improve the value of the property or extend the useful life of the component asset of the property. We track improvements to real estate in two major categories and several subcategories:
|
▪
|
Replacements
(inside the apartment unit)
. These include:
|
|
•
|
flooring such as carpets, hardwood, vinyl or tile;
|
|
•
|
appliances;
|
|
•
|
mechanical equipment such as individual furnace/air units, hot water heaters, etc;
|
|
•
|
furniture and fixtures such as kitchen/bath cabinets, light fixtures, ceiling fans, sinks, tubs, toilets, mirrors, countertops, etc; and
|
|
•
|
blinds.
|
All replacements are depreciated over a five to ten-year estimated useful life. We expense as incurred all make-ready maintenance and turnover costs such as cleaning, interior painting of individual apartment units and the repair of any replacement item noted above.
56
|
▪
|
Building improvements
(outside the apartment unit)
. These include:
|
|
•
|
roof replacement and major repairs;
|
|
•
|
paving or major resurfacing of parking lots, curbs and sidewalks;
|
|
•
|
amenities and common areas such as pools, exterior sports and playground equipment, lobbies, clubhouses, laundry rooms, alarm and security systems and offices;
|
|
•
|
major building mechanical equipment systems;
|
|
•
|
interior and exterior structural repair and exterior painting and siding;
|
|
•
|
major landscaping and grounds improvement; and
|
|
•
|
vehicles and office and maintenance equipment.
|
All building improvements are depreciated over a five to fifteen-year estimated useful life. We capitalize building improvements and upgrades only if the item: (i) exceeds $2,500 (selected projects must exceed $10,000); (ii) extends the useful life of the asset; and (iii) improves the value of the asset.
For the year ended
December 31, 2015
, our actual improvements to real estate totaled approximately $182.1 million. This includes the following (amounts in thousands except for apartment unit and per apartment unit amounts):
|
Capital Expenditures to Real Estate
|
|||||||||||||||||||||||||||
|
For the Year Ended December 31, 2015
|
|||||||||||||||||||||||||||
|
Total
Apartment Units (1) |
Replacements
(2) |
Avg. Per
Apartment Unit |
Building
Improvements (3) |
Avg. Per
Apartment Unit |
Total
|
Avg. Per
Apartment Unit |
|||||||||||||||||||||
|
Same Store Properties (4)
|
96,286
|
|
$
|
98,120
|
|
$
|
1,019
|
|
$
|
75,294
|
|
$
|
782
|
|
$
|
173,414
|
|
$
|
1,801
|
|
|||||||
|
Non-Same Store Properties (5)
|
6,946
|
|
1,870
|
|
335
|
|
6,293
|
|
1,127
|
|
8,163
|
|
1,462
|
|
|||||||||||||
|
Other (6)
|
—
|
|
302
|
|
234
|
|
536
|
|
|||||||||||||||||||
|
Total
|
103,232
|
|
$
|
100,292
|
|
$
|
81,821
|
|
$
|
182,113
|
|
||||||||||||||||
|
(1)
|
Total Apartment Units – Excludes 1,281 unconsolidated apartment units and 5,139 military housing apartment units for which repairs and maintenance expenses and capital expenditures to real estate are self-funded and do not consolidate into the Company's results.
|
|
(2)
|
Replacements – Includes new expenditures inside the apartment units such as appliances, mechanical equipment, fixtures and flooring, including carpeting. Replacements for same store properties also include $60.6 million spent in 2015 on apartment unit renovations/rehabs (primarily kitchens and baths) on 6,499 same store apartment units (equating to about $9,300 per apartment unit rehabbed) designed to reposition these assets for higher rental levels in their respective markets.
|
|
(3)
|
Building Improvements – Includes roof replacement, paving, amenities and common areas, building mechanical equipment systems, exterior painting and siding, major landscaping, vehicles and office and maintenance equipment.
|
|
(4)
|
Same Store Properties – Primarily includes all properties acquired or completed and stabilized prior to January 1, 2014, less properties subsequently sold.
|
|
(5)
|
Non-Same Store Properties – Primarily includes all properties acquired during 2014 and 2015, plus any properties in lease-up and not stabilized as of January 1, 2014. Per apartment unit amounts are based on a weighted average of 5,582 apartment units.
|
|
(6)
|
Other – Primarily includes expenditures for properties sold and properties under development.
|
For the year ended December 31, 2014, our actual improvements to real estate totaled approximately $186.0 million. This includes the following (amounts in thousands except for apartment unit and per apartment unit amounts):
|
Capital Expenditures to Real Estate
|
|||||||||||||||||||||||||||
|
For the Year Ended December 31, 2014
|
|||||||||||||||||||||||||||
|
Total
Apartment
Units (1)
|
Replacements (2)
|
Avg. Per
Apartment
Unit
|
Building
Improvements (3) |
Avg. Per
Apartment
Unit
|
Total
|
Avg. Per
Apartment
Unit
|
|||||||||||||||||||||
|
Same Store Properties (4)
|
97,911
|
|
$
|
85,045
|
|
$
|
869
|
|
$
|
93,988
|
|
$
|
960
|
|
$
|
179,033
|
|
$
|
1,829
|
|
|||||||
|
Non-Same Store Properties (5)
|
5,000
|
|
236
|
|
60
|
|
5,513
|
|
1,410
|
|
5,749
|
|
1,470
|
|
|||||||||||||
|
Other (6)
|
—
|
|
920
|
|
|
|
255
|
|
|
|
1,175
|
|
|
|
|||||||||||||
|
Total
|
102,911
|
|
$
|
86,201
|
|
|
|
$
|
99,756
|
|
|
|
$
|
185,957
|
|
|
|
||||||||||
|
(1)
|
Total Apartment Units – Excludes 1,281 unconsolidated apartment units and 5,033 military housing apartment units for which repairs and maintenance expenses and capital expenditures to real estate are self-funded and do not consolidate into the Company’s results.
|
57
|
(2)
|
Replacements – Includes new expenditures inside the apartment units such as appliances, mechanical equipment, fixtures and flooring, including carpeting. Replacements for same store properties also include $51.4 million spent in 2014 on apartment unit renovations/rehabs (primarily kitchens and baths) on 6,111 same store apartment units (equating to about $8,400 per apartment unit rehabbed) designed to reposition these assets for higher rental levels in their respective markets.
|
|
(3)
|
Building Improvements – Includes roof replacement, paving, amenities and common areas, building mechanical equipment systems, exterior painting and siding, major landscaping, vehicles and office and maintenance equipment.
|
|
(4)
|
Same Store Properties – Primarily includes all properties acquired or completed and stabilized prior to January 1, 2013, less properties subsequently sold. Also includes 18,465 stabilized apartment units acquired in the Archstone Acquisition that are owned and managed by the Company.
|
|
(5)
|
Non-Same Store Properties – Primarily includes all properties acquired during 2013 and 2014, plus any properties in lease-up and not stabilized as of January 1, 2013, but excludes 18,465 stabilized apartment units acquired in the Archstone Acquisition that are owned and managed by the Company. Per apartment unit amounts are based on a weighted average of 3,911 apartment units.
|
|
(6)
|
Other – Primarily includes expenditures for properties sold.
|
Based on the approximately 70,000 apartment units expected to be included in same store properties by December 31, 2016, the Company estimates that it will spend approximately $2,200 per apartment unit of capital expenditures, inclusive of apartment unit renovation/rehab costs, or $1,600 per apartment unit excluding apartment unit renovation/rehab costs during 2016. In
2016
, the Company expects to spend approximately $40.0 million for all unit renovation/rehab costs (primarily on same store properties) at a weighted average cost of $10,000 per apartment unit rehabbed. These anticipated amounts represent an increase in the cost per unit over 2015, but a decline in the absolute dollar amounts, which is primarily driven by the Company's more valuable urban apartment footprint. We will continue to create value from our properties by doing those rehabs that meet our investment parameters. The above assumptions are based on current expectations and are forward-looking.
During the year ended
December 31, 2015
, the Company’s total non-real estate capital additions, such as computer software, computer equipment, and furniture and fixtures and leasehold improvements to the Company’s property management offices and its corporate offices, were approximately $4.0 million. The Company expects to fund approximately $4.1 million in total non-real estate capital additions in
2016
. The above assumption is based on current expectations and is forward-looking.
Capital expenditures to real estate and non-real estate capital additions are generally funded from net cash provided by operating activities and from investment cash flow.
Derivative Instruments
In the normal course of business, the Company is exposed to the effect of interest rate changes. The Company seeks to manage these risks by following established risk management policies and procedures including the use of derivatives to hedge interest rate risk on debt instruments. The Company may also use derivatives to manage its exposure to foreign exchange rates or manage commodity prices in the daily operations of the business.
The Company has a policy of only entering into contracts with major financial institutions based upon their credit ratings and other factors. When viewed in conjunction with the underlying and offsetting exposure that the derivatives are designed to hedge, the Company has not sustained a material loss from these instruments nor does it anticipate any material adverse effect on its net income or financial position in the future from the use of derivatives it currently has in place.
See Note 9 in the Notes to Consolidated Financial Statements for additional discussion of derivative instruments at
December 31, 2015
.
Other
Total distributions paid in January
2016
amounted to $209.4 million (excluding distributions on Partially Owned Properties), which included certain distributions declared during the fourth quarter ended
December 31, 2015
.
Off-Balance Sheet Arrangements and Contractual Obligations
The Company has various unconsolidated interests in certain joint ventures. The Company does not believe that these unconsolidated investments have a materially different impact on its liquidity, cash flows, capital resources, credit or market risk than its consolidated operating and/or other activities.
58
Operating Properties
The Company has a
75%
equity interest in the Wisconsin Place joint venture. The project contains a mixed-use site located in Chevy Chase, Maryland consisting of residential, retail, office and accessory uses, including underground parking facilities. The joint venture owns the
432
unit residential component, but has no ownership interest in the retail and office components. The joint venture also retains an unconsolidated interest in an entity that owns the land underlying the entire project and owns and operates the parking facility. At
December 31, 2015
, the basis of this investment was
$49.4 million
. The Company does not have substantive kick-out or participating rights in the entity. As a result, the entity that owns the land and owns and operates the parking facility is unconsolidated and recorded using the equity method of accounting.
The Company has a
20%
equity interest in the Waterton Tenside joint venture which owns a
336
unit apartment property located in Atlanta, Georgia and had a basis of
$3.9 million
at
December 31, 2015
. The partner is the managing member and developed the project. The project is encumbered by a non-recourse mortgage loan that has a current outstanding balance of
$29.4 million
, bears interest at
3.66%
and matures December 1, 2018. The Company does not have substantive kick-out or participating rights. As a result, the entity is unconsolidated and recorded using the equity method of accounting.
The Company has a
20%
equity interest in each of the Nexus Sawgrass and Domain joint ventures. The Nexus Sawgrass joint venture owns a
501
unit apartment property located in Sunrise, Florida and had a basis of
$5.1 million
at
December 31, 2015
. The Domain joint venture owns a
444
unit apartment property located in San Jose, California and had a basis of
$10.0 million
at
December 31, 2015
. Nexus Sawgrass and Domain were completed and stabilized during the quarters ended September 30, 2014 and March 31, 2015, respectively. Construction on both projects was predominantly funded with long-term, non-recourse secured loans from the partner. The mortgage loan on Nexus Sawgrass has a current unconsolidated outstanding balance of
$48.6 million
, bears interest at
5.60%
and matures January 1, 2021. The mortgage loan on Domain has a current unconsolidated outstanding balance of
$96.8 million
, bears interest at
5.75%
and matures January 1, 2022. While the Company is the managing member of both of the joint ventures, was responsible for constructing both of the projects and gave certain construction cost overrun guarantees, the joint venture partner has significant participating rights and has active involvement in and oversight of the ongoing projects. As a result, the entities are unconsolidated and recorded using the equity method of accounting. The Company currently has no further funding obligations related to these projects. The Company's strategy with respect to these ventures was to reduce its financial risk related to the development of the properties.
Other
On February 27, 2013, in connection with the Archstone Acquisition, subsidiaries of the Company and AVB entered into three limited liability company agreements (collectively, the “Residual JV”). The Residual JV owned certain non-core Archstone assets and succeeded to certain residual Archstone liabilities/litigation. The Residual JV is owned
60%
by the Company and
40%
by AVB. The Company's initial investment was
$147.6 million
and the Company's basis at
December 31, 2015
was a net obligation of
$0.3 million
. The Residual JV is managed by a Management Committee consisting of two members from each of the Company and AVB. Both partners have equal participation in the Management Committee and all significant participating rights are shared by both partners. As a result, the Residual JV is unconsolidated and recorded using the equity method of accounting.
During the years ended December 31, 2015, 2014 and 2013, the Company received approximately
$51.0 million
,
$83.5 million
and
$18.9 million
, respectively, in distributions from the Residual JV as a result of the winddown/sale of assets owned by the Residual JV and litigation settlements received by the Residual JV. The Company's pro rata share of the proceeds/distributions that have been repatriated to the Residual JV and received by the Company as a result of the German dispositions and winddown activity was approximately
$3.5 million
,
$79.6 million
and
$18.9 million
during the years ended December 31, 2015, 2014 and 2013, respectively. The Company's pro rata share of the proceeds related to the sale of other real estate assets owned by the Residual JV was approximately
$30.7 million
and
$3.9 million
, respectively, during the years ended December 31, 2015 and 2014. The Company’s pro rata share of the litigation settlements received by the Residual JV was approximately
$16.8 million
during the year ended December 31, 2015. As of December 31, 2015, the Residual JV has sold all of the real estate assets that were acquired as part of the Archstone Acquisition, including all of the German assets.
On February 27, 2013, in connection with the Archstone Acquisition, a subsidiary of the Company and AVB entered into a limited liability company agreement (the “Legacy JV”), through which they assumed obligations of Archstone in the form of preferred interests, some of which are governed by tax protection arrangements. During the year ended
December 31, 2015
, the Legacy JV distributed
$27.9 million
to its preferred interests holders for accrued and unpaid dividends, of which the Company's pro rata share was approximately
$16.7 million
. At
December 31, 2015
, the remaining preferred interests had an aggregate liquidation value of
$42.2 million
, our share of which is included in other liabilities in the accompanying consolidated balance sheets. Obligations of the Legacy JV are borne
60%
by the Company and
40%
by AVB. The Legacy JV is managed by a Management Committee consisting of two members from each of the Company and AVB. Both partners have equal participation
59
in the Management Committee and all significant participating rights are shared by both partners. As a result, the Legacy JV is unconsolidated and recorded using the equity method of accounting.
As of
December 31, 2015
, the Company has
10
wholly owned projects totaling
3,989
apartment units in various stages of development with estimated completion dates ranging through
September 30, 2017
, as well as other completed development projects that are in various stages of lease up or are stabilized. See also Note 16 in the Notes to Consolidated Financial Statements for additional discussion regarding the Company's development projects.
See also Notes 2 and 6 in the Notes to Consolidated Financial Statements for additional discussion regarding the Company’s investments in partially owned entities.
The following table summarizes the Company’s contractual obligations for the next five years and thereafter as of
December 31, 2015
:
|
Payments Due by Year (in thousands)
|
||||||||||||||||||||||||||||
|
Contractual Obligations
|
2016
|
2017
|
2018
|
2019
|
2020
|
Thereafter
|
Total
|
|||||||||||||||||||||
|
Debt:
|
|
|
|
|
|
|
|
|
|
|
|
|
|
|
||||||||||||||
|
Principal (a) (e)
|
$
|
1,352,813
|
|
$
|
1,347,846
|
|
$
|
180,461
|
|
$
|
1,281,127
|
|
$
|
1,679,432
|
|
$
|
5,126,819
|
|
$
|
10,968,498
|
|
|||||||
|
Interest (b) (e)
|
450,115
|
|
402,278
|
|
332,680
|
|
283,556
|
|
222,463
|
|
1,601,388
|
|
3,292,480
|
|
||||||||||||||
|
Operating Leases:
|
|
|
|
|
|
|
|
|
|
|
|
|
|
|
||||||||||||||
|
Minimum Rent Payments (c)
|
15,723
|
|
15,721
|
|
15,712
|
|
15,567
|
|
15,158
|
|
839,521
|
|
917,402
|
|
||||||||||||||
|
Other Long-Term Liabilities:
|
|
|
|
|
|
|
|
|
|
|
|
|
||||||||||||||||
|
Deferred Compensation (d)
|
1,387
|
|
1,724
|
|
1,724
|
|
1,130
|
|
1,080
|
|
4,797
|
|
11,842
|
|
||||||||||||||
|
Total
|
$
|
1,820,038
|
|
$
|
1,767,569
|
|
$
|
530,577
|
|
$
|
1,581,380
|
|
$
|
1,918,133
|
|
$
|
7,572,525
|
|
$
|
15,190,222
|
|
|||||||
|
(a)
|
Amounts include aggregate principal payments only.
|
|
(b)
|
Amounts include interest expected to be incurred on the Company’s secured and unsecured debt based on obligations outstanding at
December 31, 2015
and inclusive of capitalized interest. For floating rate debt, the current rate in effect for the most recent payment through
December 31, 2015
is assumed to be in effect through the respective maturity date of each instrument.
|
|
(c)
|
Minimum basic rent due for various office space the Company leases and fixed base rent due on ground leases for 12 properties.
|
|
(d)
|
Estimated payments to the Company's Chairman, Vice Chairman and one former CEO based on actual and planned retirement dates.
|
|
(e)
|
In connection with the Starwood Transaction and the anticipation of other planned 2016 dispositions, the Company has retired approximately $1.7 billion in secured and unsecured debt prior to scheduled maturity in early 2016 and expects to retire an additional $271.2 million at par at maturity in March 2016. See Note 18 in the Notes to Consolidated Financial Statements for further discussion.
|
Critical Accounting Policies and Estimates
The preparation of financial statements in conformity with accounting principles generally accepted in the United States requires management to use judgment in the application of accounting policies, including making estimates and assumptions. If our judgment or interpretation of the facts and circumstances relating to various transactions had been different or different assumptions were made, it is possible that different accounting policies would have been applied, resulting in different financial results or different presentation of our financial statements.
The Company’s significant accounting policies are described in Note 2 in the Notes to Consolidated Financial Statements. These policies were followed in preparing the consolidated financial statements at and for the year ended
December 31, 2015
and are consistent with the year ended
December 31, 2014
.
The Company has identified five significant accounting policies as critical accounting policies. These critical accounting policies are those that have the most impact on the reporting of our financial condition and those requiring significant judgments and estimates. With respect to these critical accounting policies, management believes that the application of judgments and estimates is consistently applied and produces financial information that fairly presents the results of operations for all periods presented. The five critical accounting policies are:
Acquisition of Investment Properties
The Company allocates the purchase price of properties to net tangible and identified intangible assets acquired based on their fair values. In making estimates of fair values for purposes of allocating purchase price, the Company utilizes a number of sources, including independent appraisals that may be obtained in connection with the acquisition or financing of the respective property, our own analysis of recently acquired and existing comparable properties in our portfolio and other market data. The Company also considers information obtained about each property as a result of its pre-acquisition due diligence, marketing and
60
leasing activities in estimating the fair value of the tangible and intangible assets acquired.
Impairment of Long-Lived Assets
The Company periodically evaluates its long-lived assets, including its investments in real estate, for indicators of impairment. The judgments regarding the existence of impairment indicators are based on factors such as operational performance, market conditions and legal and environmental concerns, as well as the Company’s ability to hold and its intent with regard to each asset. Future events could occur which would cause the Company to conclude that impairment indicators exist and an impairment loss is warranted.
Depreciation of Investment in Real Estate
The Company depreciates the building component of its investment in real estate over a 30-year estimated useful life, building improvements over a 5-year to 15-year estimated useful life and both the furniture, fixtures and equipment and replacement components over a 5-year to 10-year estimated useful life, all of which are judgmental determinations.
Cost Capitalization
See the
Capitalization of Fixed Assets and Improvements to Real Estate
section for a discussion of the Company’s policy with respect to capitalization vs. expensing of fixed asset/repair and maintenance costs. In addition, the Company capitalizes an allocation of the payroll and associated costs of employees directly responsible for and who spend their time on the execution and supervision of major capital and/or renovation projects. These costs are reflected on the balance sheets as increases to depreciable property.
For all development projects, the Company uses its professional judgment in determining whether such costs meet the criteria for capitalization or must be expensed as incurred. The Company capitalizes interest, real estate taxes and insurance and payroll and associated costs for those individuals directly responsible for and who spend their time on development activities, with capitalization ceasing no later than 90 days following issuance of the certificate of occupancy. These costs are reflected on the balance sheets as construction-in-progress for each specific property. The Company expenses as incurred all payroll costs of on-site employees working directly at our properties, except as noted above on our development properties prior to certificate of occupancy issuance and on specific major renovations at selected properties when additional incremental employees are hired.
During the years ended
December 31, 2015
,
2014
and
2013
, the Company capitalized
$22.3 million
,
$22.4 million
and
$16.5 million
, respectively, of payroll and associated costs of employees directly responsible for and who spend their time on the execution and supervision of development activities as well as major capital and/or renovation projects.
Fair Value of Financial Instruments, Including Derivative Instruments
The valuation of financial instruments requires the Company to make estimates and judgments that affect the fair value of the instruments. The Company, where possible, bases the fair values of its financial instruments, including its derivative instruments, on listed market prices and third party quotes. Where these are not available, the Company bases its estimates on current instruments with similar terms and maturities or on other factors relevant to the financial instruments.
Funds From Operations and Normalized Funds From Operations
For the year ended
December 31, 2015
, Funds From Operations (“FFO”) available to Common Shares and Units / Units and Normalized FFO available to Common Shares and Units / Units increased
$132.9 million
, or
11.2%
, and increased
$121.4 million
, or
10.1%
, respectively, as compared to the year ended
December 31, 2014
. For the year ended
December 31, 2014
, FFO available to Common Shares and Units / Units and Normalized FFO available to Common Shares and Units / Units increased
$318.5 million
, or
36.5%
, and increased
$139.4 million
, or
13.2%
, respectively, as compared to the year ended
December 31, 2013
.
The following is the Company's and the Operating Partnership's reconciliation of net income to FFO available to Common Shares and Units / Units and Normalized FFO available to Common Shares and Units / Units for each of the five years ended
December 31, 2015
:
61
|
Funds From Operations and Normalized Funds From Operations
|
||||||||||||||||||||
|
(Amounts in thousands)
|
||||||||||||||||||||
|
|
Year Ended December 31,
|
|||||||||||||||||||
|
|
2015
|
2014
|
2013
|
2012
|
2011
|
|||||||||||||||
|
Net income
|
$
|
908,018
|
|
$
|
658,683
|
|
$
|
1,905,353
|
|
$
|
881,204
|
|
$
|
935,197
|
|
|||||
|
Net (income) loss attributable to Noncontrolling Interests – Partially Owned Properties
|
(3,657
|
)
|
(2,544
|
)
|
538
|
|
(844
|
)
|
(832
|
)
|
||||||||||
|
Preferred/preference distributions
|
(3,357
|
)
|
(4,145
|
)
|
(4,145
|
)
|
(10,355
|
)
|
(13,865
|
)
|
||||||||||
|
Premium on redemption of Preferred Shares/Preference Units
|
(3,486
|
)
|
—
|
|
—
|
|
(5,152
|
)
|
—
|
|
||||||||||
|
Net income available to Common Shares and Units / Units
|
897,518
|
|
651,994
|
|
1,901,746
|
|
864,853
|
|
920,500
|
|
||||||||||
|
Adjustments:
|
||||||||||||||||||||
|
Depreciation
|
765,895
|
|
758,861
|
|
978,973
|
|
560,669
|
|
506,175
|
|
||||||||||
|
Depreciation – Non-real estate additions
|
(4,981
|
)
|
(4,643
|
)
|
(4,806
|
)
|
(5,346
|
)
|
(5,519
|
)
|
||||||||||
|
Depreciation – Partially Owned Properties
|
(4,332
|
)
|
(4,285
|
)
|
(6,499
|
)
|
(3,193
|
)
|
(3,062
|
)
|
||||||||||
|
Depreciation – Unconsolidated Properties
|
4,920
|
|
6,754
|
|
3,661
|
|
—
|
|
—
|
|
||||||||||
|
Net (gain) on sales of unconsolidated entities – operating assets
|
(100
|
)
|
(4,902
|
)
|
(7
|
)
|
—
|
|
—
|
|
||||||||||
|
Net (gain) on sales of real estate properties
|
(335,134
|
)
|
(212,685
|
)
|
—
|
|
—
|
|
—
|
|
||||||||||
|
Discontinued operations:
|
||||||||||||||||||||
|
Depreciation
|
—
|
|
—
|
|
34,380
|
|
124,323
|
|
157,353
|
|
||||||||||
|
Net (gain) on sales of discontinued operations
|
—
|
|
(179
|
)
|
(2,036,505
|
)
|
(548,278
|
)
|
(826,489
|
)
|
||||||||||
|
Net incremental gain (loss) on sales of condominium units
|
—
|
|
—
|
|
8
|
|
(11
|
)
|
1,993
|
|
||||||||||
|
Gain on sale of Equity Corporate Housing (ECH)
|
—
|
|
—
|
|
1,470
|
|
200
|
|
1,202
|
|
||||||||||
|
FFO available to Common Shares and Units / Units (1) (3) (4)
|
1,323,786
|
|
1,190,915
|
|
872,421
|
|
993,217
|
|
752,153
|
|
||||||||||
|
Adjustments:
|
||||||||||||||||||||
|
Asset impairment and valuation allowances
|
—
|
|
—
|
|
—
|
|
—
|
|
—
|
|
||||||||||
|
Property acquisition costs and write-off of pursuit costs
|
(11,706
|
)
|
8,248
|
|
79,365
|
|
21,649
|
|
14,557
|
|
||||||||||
|
Debt extinguishment (gains) losses, including prepayment penalties, preferred share/
|
||||||||||||||||||||
|
preference unit redemptions and non-cash convertible debt discounts
|
5,704
|
|
(1,110
|
)
|
121,730
|
|
16,293
|
|
12,300
|
|
||||||||||
|
(Gains) losses on sales of non-operating assets, net of income and other tax expense
|
||||||||||||||||||||
|
(benefit)
|
(2,883
|
)
|
(1,866
|
)
|
(17,908
|
)
|
(255
|
)
|
(6,976
|
)
|
||||||||||
|
Other miscellaneous non-comparable items
|
2,901
|
|
259
|
|
1,465
|
|
(147,635
|
)
|
(12,369
|
)
|
||||||||||
|
Normalized FFO available to Common Shares and Units / Units (2) (3) (4)
|
$
|
1,317,802
|
|
$
|
1,196,446
|
|
$
|
1,057,073
|
|
$
|
883,269
|
|
$
|
759,665
|
|
|||||
|
FFO (1) (3)
|
$
|
1,330,629
|
|
$
|
1,195,060
|
|
$
|
876,566
|
|
$
|
1,008,724
|
|
$
|
766,018
|
|
|||||
|
Preferred/preference distributions
|
(3,357
|
)
|
(4,145
|
)
|
(4,145
|
)
|
(10,355
|
)
|
(13,865
|
)
|
||||||||||
|
Premium on redemption of Preferred Shares/Preference Units
|
(3,486
|
)
|
—
|
|
—
|
|
(5,152
|
)
|
—
|
|
||||||||||
|
FFO available to Common Shares and Units / Units (1) (3) (4)
|
$
|
1,323,786
|
|
$
|
1,190,915
|
|
$
|
872,421
|
|
$
|
993,217
|
|
$
|
752,153
|
|
|||||
|
Normalized FFO (2) (3)
|
$
|
1,321,159
|
|
$
|
1,200,591
|
|
$
|
1,061,218
|
|
$
|
893,624
|
|
$
|
773,530
|
|
|||||
|
Preferred/preference distributions
|
(3,357
|
)
|
(4,145
|
)
|
(4,145
|
)
|
(10,355
|
)
|
(13,865
|
)
|
||||||||||
|
Normalized FFO available to Common Shares and Units / Units (2) (3) (4)
|
$
|
1,317,802
|
|
$
|
1,196,446
|
|
$
|
1,057,073
|
|
$
|
883,269
|
|
$
|
759,665
|
|
|||||
|
(1)
|
The National Association of Real Estate Investment Trusts (“NAREIT”) defines funds from operations (“FFO”) (April 2002 White Paper) as net income (computed in accordance with accounting principles generally accepted in the United States (“GAAP”)), excluding gains (or losses) from sales and impairment write-downs of depreciable operating properties, plus depreciation and amortization, and after adjustments for unconsolidated partnerships and joint ventures. Adjustments for unconsolidated partnerships and joint ventures will be calculated to reflect funds from operations on the same basis. The April 2002 White Paper states that gain or loss on sales of property is excluded from FFO for previously depreciated operating properties only. Once the Company commences the conversion of apartment units to condominiums, it simultaneously discontinues depreciation of such property.
|
(2) Normalized funds from operations (“Normalized FFO”) begins with FFO and excludes:
|
▪
|
the impact of any expenses relating to non-operating asset impairment and valuation allowances;
|
|
▪
|
property acquisition and other transaction costs related to mergers and acquisitions and pursuit cost write-offs;
|
|
▪
|
gains and losses from early debt extinguishment, including prepayment penalties, preferred share/preference unit redemptions and the cost related to the implied option value of non-cash convertible debt discounts;
|
|
▪
|
gains and losses on the sales of non-operating assets, including gains and losses from land parcel and condominium sales, net of the effect of income tax benefits or expenses; and
|
|
▪
|
other miscellaneous non-comparable items.
|
62
|
(3)
|
The Company believes that FFO and FFO available to Common Shares and Units / Units are helpful to investors as supplemental measures of the operating performance of a real estate company, because they are recognized measures of performance by the real estate industry and by excluding gains or losses related to dispositions of depreciable property and excluding real estate depreciation (which can vary among owners of identical assets in similar condition based on historical cost accounting and useful life estimates), FFO and FFO available to Common Shares and Units / Units can help compare the operating performance of a company’s real estate between periods or as compared to different companies. The Company also believes that Normalized FFO and Normalized FFO available to Common Shares and Units / Units are helpful to investors as supplemental measures of the operating performance of a real estate company because they allow investors to compare the Company’s operating performance to its performance in prior reporting periods and to the operating performance of other real estate companies without the effect of items that by their nature are not comparable from period to period and tend to obscure the Company’s actual operating results. FFO, FFO available to Common Shares and Units / Units, Normalized FFO and Normalized FFO available to Common Shares and Units / Units do not represent net income, net income available to Common Shares / Units or net cash flows from operating activities in accordance with GAAP. Therefore, FFO, FFO available to Common Shares and Units / Units, Normalized FFO and Normalized FFO available to Common Shares and Units / Units should not be exclusively considered as alternatives to net income, net income available to Common Shares / Units or net cash flows from operating activities as determined by GAAP or as a measure of liquidity. The Company’s calculation of FFO, FFO available to Common Shares and Units / Units, Normalized FFO and Normalized FFO available to Common Shares and Units / Units may differ from other real estate companies due to, among other items, variations in cost capitalization policies for capital expenditures and, accordingly, may not be comparable to such other real estate companies.
|
|
(4)
|
FFO available to Common Shares and Units / Units and Normalized FFO available to Common Shares and Units / Units are calculated on a basis consistent with net income available to Common Shares / Units and reflects adjustments to net income for preferred distributions and premiums on redemption of preferred shares/preference units in accordance with accounting principles generally accepted in the United States. The equity positions of various individuals and entities that contributed their properties to the Operating Partnership in exchange for OP Units are collectively referred to as the “Noncontrolling Interests – Operating Partnership”. Subject to certain restrictions, the Noncontrolling Interests – Operating Partnership may exchange their OP Units for Common Shares on a one-for-one basis.
|
Market risks relating to the Company’s financial instruments result primarily from changes in short-term LIBOR interest rates and changes in the Securities Industry and Financial Markets Association ("SIFMA") index for tax-exempt debt. The Company also has foreign exchange exposure related to undistributed cash remaining after the sale of its interests in German residential real estate that were acquired as part of the Archstone Transaction but the Company estimates this exposure is now less than $5.0 million.
The Company’s exposure to market risk for changes in interest rates relates to the unsecured revolving credit facility and commercial paper program, the floating rate tax-exempt debt and the fair value hedges that convert fixed rate debt to floating rate debt as well as exposure on the refinancing of its debt. The Company typically incurs fixed rate debt obligations to finance acquisitions while it typically incurs floating rate debt obligations to finance working capital needs and as a temporary measure in advance of securing long-term fixed rate financing. The Company continuously evaluates its level of floating rate debt with respect to total debt and other factors, including its assessment of the current and future economic environment. To the extent the Company carries substantial cash balances, this will tend to partially counterbalance any increase or decrease in interest rates.
The Company also utilizes certain derivative financial instruments to manage market risk. Interest rate protection agreements are used to convert floating rate debt to a fixed rate basis or vice versa as well as to partially lock in rates on future debt issuances. Derivatives are used for hedging purposes rather than speculation. The Company does not enter into financial instruments for trading purposes. See also Note 9 to the Notes to Consolidated Financial Statements for additional discussion of derivative instruments.
The fair values of the Company’s financial instruments (including such items in the financial statement captions as cash and cash equivalents, other assets, accounts payable and accrued expenses and other liabilities) approximate their carrying or contract values based on their nature, terms and interest rates that approximate current market rates. The fair value of the Company’s mortgage notes payable and unsecured debt (including its commercial paper) were approximately
$4.6 billion
and
$6.5 billion
, respectively, at
December 31, 2015
.
At
December 31, 2015
, the Company had total outstanding floating rate debt of approximately
$1.5 billion
, or
14.1%
of total debt, net of the effects of any derivative instruments. If market rates of interest on all of the floating rate debt permanently increased by 8 basis points (a 10% increase from the Company’s existing weighted average interest rates), the increase in interest expense on the floating rate debt would decrease future earnings and cash flows by approximately $1.2 million. If market rates of interest on all of the floating rate debt permanently decreased by 8 basis points (a 10% decrease from the Company’s existing weighted average interest rates), the decrease in interest expense on the floating rate debt would increase future earnings and cash flows by approximately $1.2 million.
63
At
December 31, 2015
, the Company had total outstanding fixed rate debt of approximately
$9.4 billion
, or
85.9%
of total debt, net of the effects of any derivative instruments. If market rates of interest permanently increased by 51 basis points (a 10% increase from the Company’s existing weighted average interest rates), the estimated fair value of the Company’s fixed rate debt would be approximately $8.6 billion. If market rates of interest permanently decreased by 51 basis points (a 10% decrease from the Company’s existing weighted average interest rates), the estimated fair value of the Company’s fixed rate debt would be approximately $10.5 billion.
At
December 31, 2015
, the Company’s derivative instruments had a net asset fair value of approximately $3.0 million. If market rates of interest permanently increased by 17 basis points (a 10% increase from the Company’s existing weighted average interest rates), the net asset fair value of the Company’s derivative instruments would be approximately $1.8 million. If market rates of interest permanently decreased by 17 basis points (a 10% decrease from the Company’s existing weighted average interest rates), the net asset fair value of the Company’s derivative instruments would be approximately $4.2 million.
At
December 31, 2014
, the Company had total outstanding floating rate debt of approximately $1.5 billion, or 14.0% of total debt, net of the effects of any derivative instruments. If market rates of interest on all of the floating rate debt permanently increased by 9 basis points (a 10% increase from the Company’s existing weighted average interest rates), the increase in interest expense on the floating rate debt would decrease future earnings and cash flows by approximately $1.4 million. If market rates of interest on all of the floating rate debt permanently decreased by 9 basis points (a 10% decrease from the Company’s existing weighted average interest rates), the decrease in interest expense on the floating rate debt would increase future earnings and cash flows by approximately $1.4 million.
At
December 31, 2014
, the Company had total outstanding fixed rate debt of approximately $9.3 billion, or 86.0% of total debt, net of the effects of any derivative instruments. If market rates of interest permanently increased by 52 basis points (a 10% increase from the Company’s existing weighted average interest rates), the estimated fair value of the Company’s fixed rate debt would be approximately $8.5 billion. If market rates of interest permanently decreased by 52 basis points (a 10% decrease from the Company’s existing weighted average interest rates), the estimated fair value of the Company’s fixed rate debt would be approximately $10.4 billion.
At
December 31, 2014
, the Company’s derivative instruments had a net liability fair value of approximately $12.2 million. If market rates of interest permanently increased by 24 basis points (a 10% increase from the Company’s existing weighted average interest rates), the net liability fair value of the Company’s derivative instruments would be approximately $7.2 million. If market rates of interest permanently decreased by 24 basis points (a 10% decrease from the Company’s existing weighted average interest rates), the net liability fair value of the Company’s derivative instruments would be approximately $17.4 million.
These amounts were determined by considering the impact of hypothetical interest rates on the Company’s financial instruments. The foregoing assumptions apply to the entire amount of the Company’s debt and derivative instruments and do not differentiate among maturities. These analyses do not consider the effects of the changes in overall economic activity that could exist in such an environment. Further, in the event of changes of such magnitude, management would likely take actions to further mitigate its exposure to the changes. However, due to the uncertainty of the specific actions that would be taken and their possible effects, this analysis assumes no changes in the Company’s financial structure or results.
The Company cannot predict the effect of adverse changes in interest rates on its debt and derivative instruments and, therefore, its exposure to market risk, nor can there be any assurance that long-term debt will be available at advantageous pricing. Consequently, future results may differ materially from the estimated adverse changes discussed above.
See Index to Consolidated Financial Statements and Schedule on page F-1 of this Form 10-K.
None.
Equity Residential
(a) Evaluation of Disclosure Controls and Procedures:
Effective as of
December 31, 2015
, the Company carried out an evaluation, under the supervision and with the participation
64
of the Company’s management, including the Chief Executive Officer and Chief Financial Officer, of the effectiveness of the Company’s disclosure controls and procedures pursuant to Exchange Act Rules 13a-15 and 15d-15. Based on that evaluation, the Chief Executive Officer and Chief Financial Officer concluded that the disclosure controls and procedures are effective to ensure that information required to be disclosed by the Company in its Exchange Act filings is recorded, processed, summarized and reported within the time periods specified in the SEC’s rules and forms.
(b) Management’s Report on Internal Control over Financial Reporting:
Equity Residential’s management is responsible for establishing and maintaining adequate internal control over financial reporting, as such term is defined in Rule 13a-15(f) under the Exchange Act. Under the supervision and with the participation of management, including the Company’s Chief Executive Officer and Chief Financial Officer, management conducted an evaluation of the effectiveness of internal control over financial reporting based on the framework in Internal Control – Integrated Framework issued by the Committee of Sponsoring Organizations of the Treadway Commission (2013 framework).
Because of its inherent limitations, internal control over financial reporting may not prevent or detect misstatements. Therefore, even those systems determined to be effective can only provide reasonable assurance with respect to financial statement preparation and presentation.
Based on the Company’s evaluation under the framework in Internal Control – Integrated Framework, management concluded that its internal control over financial reporting was effective as of
December 31, 2015
. Our internal control over financial reporting has been audited as of
December 31, 2015
by Ernst & Young LLP, an independent registered public accounting firm, as stated in their report which is included herein.
(c) Changes in Internal Control over Financial Reporting:
There were no changes to the internal control over financial reporting of the Company identified in connection with the Company’s evaluation referred to above that occurred during the fourth quarter of
2015
that have materially affected, or are reasonably likely to materially affect, the Company’s internal control over financial reporting.
ERP Operating Limited Partnership
(a) Evaluation of Disclosure Controls and Procedures:
Effective as of
December 31, 2015
, the Operating Partnership carried out an evaluation, under the supervision and with the participation of the Operating Partnership's management, including the Chief Executive Officer and Chief Financial Officer of EQR, of the effectiveness of the Operating Partnership's disclosure controls and procedures pursuant to Exchange Act Rules 13a-15 and 15d-15. Based on that evaluation, the Chief Executive Officer and Chief Financial Officer concluded that the disclosure controls and procedures are effective to ensure that information required to be disclosed by the Operating Partnership in its Exchange Act filings is recorded, processed, summarized and reported within the time periods specified in the SEC's rules and forms.
(b) Management’s Report on Internal Control over Financial Reporting:
ERP Operating Limited Partnership's management is responsible for establishing and maintaining adequate internal control over financial reporting, as such term is defined in Rule 13a-15(f) under the Exchange Act. Under the supervision and with the participation of management, including the Chief Executive Officer and Chief Financial Officer of EQR, management conducted an evaluation of the effectiveness of internal control over financial reporting based on the framework in Internal Control – Integrated Framework issued by the Committee of Sponsoring Organizations of the Treadway Commission (2013 framework).
Because of its inherent limitations, internal control over financial reporting may not prevent or detect misstatements. Therefore, even those systems determined to be effective can only provide reasonable assurance with respect to financial statement preparation and presentation.
Based on the Operating Partnership's evaluation under the framework in Internal Control – Integrated Framework, management concluded that its internal control over financial reporting was effective as of
December 31, 2015
. Our internal control over financial reporting has been audited as of
December 31, 2015
by Ernst & Young LLP, an independent registered public accounting firm, as stated in their report which is included herein.
(c) Changes in Internal Control over Financial Reporting:
There were no changes to the internal control over financial reporting of the Operating Partnership identified in connection with the Operating Partnership's evaluation referred to above that occurred during the fourth quarter of
2015
that have materially affected, or are reasonably likely to materially affect, the Operating Partnership's internal control over financial reporting.
65
None.
66
|
Items 10, 11, 12, 13 and 14.
|
|
Trustees, Executive Officers and Corporate Governance; Executive Compensation; Security Ownership of Certain Beneficial Owners and Management and Related Stockholder Matters; Certain Relationships and Related Transactions, and Trustee Independence; and Principal Accounting Fees and Services.
The information required by Item 10, Item 11, Item 12, Item 13 and Item 14 is incorporated by reference to, and will be contained in, Equity Residential's Proxy Statement, which the Company intends to file no later than 120 days after the end of its fiscal year ended
December 31, 2015
, and thus these items have been omitted in accordance with General Instruction G(3) to Form 10-K. Equity Residential is the general partner and
96.2%
owner of ERP Operating Limited Partnership.
67
(a) The following documents are filed as part of this Report:
|
(1)
|
Financial Statements: See Index to Consolidated Financial Statements and Schedule on page F-1 of this Form 10-K.
|
|
(2)
|
Exhibits: See the Exhibit Index.
|
|
(3)
|
Financial Statement Schedules: See Index to Consolidated Financial Statements and Schedule on page F-1 of this Form 10-K.
|
68
SIGNATURES
Pursuant to the requirements of Section 13 or 15(d) of the Securities Exchange Act of 1934, each registrant has duly caused this report to be signed on its behalf by the undersigned thereunto duly authorized.
|
EQUITY RESIDENTIAL
|
|||
|
By:
|
/s/ David J. Neithercut
|
||
|
David J. Neithercut
President and Chief Executive Officer
(Principal Executive Officer)
|
|||
|
Date:
|
February 25, 2016
|
||
|
ERP OPERATING LIMITED PARTNERSHIP
BY: EQUITY RESIDENTIAL
ITS GENERAL PARTNER
|
|||
|
By:
|
/s/ David J. Neithercut
|
||
|
David J. Neithercut
President and Chief Executive Officer
(Principal Executive Officer)
|
|||
|
Date:
|
February 25, 2016
|
||
EQUITY RESIDENTIAL
ERP OPERATING LIMITED PARTNERSHIP
POWER OF ATTORNEY
KNOW ALL MEN/WOMEN BY THESE PRESENTS, that each person whose signature appears below, hereby constitutes and appoints David J. Neithercut, Mark J. Parrell and Ian S. Kaufman, or any of them, his or her attorneys-in-fact and agents, with full power of substitution and resubstitution for him or her in any and all capacities, to do all acts and things which said attorneys and agents, or any of them, deem advisable to enable the company to comply with the Securities Exchange Act of 1934, as amended, and any requirements or regulations of the Securities and Exchange Commission in respect thereof, in connection with the company’s filing of an annual report on Form 10-K for the company’s fiscal year
2015
, including specifically, but without limitation of the general authority hereby granted, the power and authority to sign his or her name as a trustee or officer, or both, of the company, as indicated below opposite his or her signature, to the Form 10-K, and any amendment thereto; and each of the undersigned does hereby fully ratify and confirm all that said attorneys and agents, or any of them, or the substitute of any of them, shall do or cause to be done by virtue hereof.
Pursuant to the requirements of the Securities Exchange Act of 1934, this report has been signed below by the following persons on behalf of each registrant and in the capacities set forth below and on the dates indicated:
|
Name
|
|
Title
|
|
Date
|
|
|
|
|
|
|
|
/s/ David J. Neithercut
|
|
President, Chief Executive Officer and Trustee
|
|
February 25, 2016
|
|
David J. Neithercut
|
(Principal Executive Officer)
|
|||
|
|
|
|
|
|
|
/s/ Mark J. Parrell
|
|
Executive Vice President and Chief Financial Officer
|
|
February 25, 2016
|
|
Mark J. Parrell
|
(Principal Financial Officer)
|
|||
|
|
|
|
|
|
|
/s/ Ian S. Kaufman
|
|
Senior Vice President and Chief Accounting Officer
|
|
February 25, 2016
|
|
Ian S. Kaufman
|
(Principal Accounting Officer)
|
|||
|
|
|
|
|
|
|
/s/ John W. Alexander
|
|
Trustee
|
|
February 25, 2016
|
|
John W. Alexander
|
||||
|
|
|
|
|
|
|
/s/ Charles L. Atwood
|
|
Trustee
|
|
February 25, 2016
|
|
Charles L. Atwood
|
||||
|
|
|
|
|
|
|
/s/ Linda Walker Bynoe
|
|
Trustee
|
|
February 25, 2016
|
|
Linda Walker Bynoe
|
||||
|
/s/ Connie K. Duckworth
|
|
Trustee
|
|
February 25, 2016
|
|
Connie K. Duckworth
|
||||
|
/s/ Mary Kay Haben
|
Trustee
|
February 25, 2016
|
||
|
Mary Kay Haben
|
||||
|
/s/ Bradley A. Keywell
|
|
Trustee
|
|
February 25, 2016
|
|
Bradley A. Keywell
|
||||
|
/s/ John E. Neal
|
|
Trustee
|
|
February 25, 2016
|
|
John E. Neal
|
||||
|
|
|
|
|
|
|
/s/ Mark S. Shapiro
|
|
Trustee
|
|
February 25, 2016
|
|
Mark S. Shapiro
|
||||
|
|
|
|
|
|
|
/s/ Stephen E. Sterrett
|
Trustee
|
February 25, 2016
|
||
|
Stephen E. Sterrett
|
||||
|
/s/ B. Joseph White
|
|
Trustee
|
|
February 25, 2016
|
|
B. Joseph White
|
||||
|
|
|
|
|
|
|
/s/ Gerald A. Spector
|
|
Vice Chairman of the Board of Trustees
|
|
February 25, 2016
|
|
Gerald A. Spector
|
||||
|
|
|
|
|
|
|
/s/ Samuel Zell
|
|
Chairman of the Board of Trustees
|
|
February 25, 2016
|
|
Samuel Zell
|
||||
INDEX TO CONSOLIDATED FINANCIAL STATEMENTS AND SCHEDULE
EQUITY RESIDENTIAL
ERP OPERATING LIMITED PARTNERSHIP
|
|
|
PAGE
|
|
FINANCIAL STATEMENTS FILED AS PART OF THIS REPORT
|
|
|
|
|
|
|
|
Report of Independent Registered Public Accounting Firm (Equity Residential)
|
|
|
|
Report of Independent Registered Public Accounting Firm (ERP Operating Limited Partnership)
|
|
|
|
Report of Independent Registered Public Accounting Firm on Internal Control Over Financial
Reporting (Equity Residential)
|
|
|
|
Report of Independent Registered Public Accounting Firm on Internal Control Over Financial
Reporting (ERP Operating Limited Partnership)
|
||
|
Financial Statements of Equity Residential:
|
|
|
|
Consolidated Balance Sheets as of December 31, 2015 and 2014
|
|
|
|
|
|
|
|
Consolidated Statements of Operations and Comprehensive Income
for the years ended December 31, 2015, 2014 and 2013
|
|
|
|
|
|
|
|
Consolidated Statements of Cash Flows for the years ended
December 31, 2015, 2014 and 2013
|
|
|
|
|
|
|
|
Consolidated Statements of Changes in Equity for the years ended
December 31, 2015, 2014 and 2013
|
|
|
|
Financial Statements of ERP Operating Limited Partnership:
|
||
|
|
|
|
|
Consolidated Balance Sheets as of December 31, 2015 and 2014
|
||
|
Consolidated Statements of Operations and Comprehensive Income
for the years ended December 31, 2015, 2014 and 2013
|
||
|
Consolidated Statements of Cash Flows for the years ended
December 31, 2015, 2014 and 2013
|
||
|
Consolidated Statements of Changes in Capital for the years ended
December 31, 2015, 2014 and 2013
|
||
|
Notes to Consolidated Financial Statements of Equity Residential and ERP Operating
Limited Partnership
|
|
|
|
|
|
|
|
SCHEDULE FILED AS PART OF THIS REPORT
|
|
|
|
|
|
|
|
Schedule III – Real Estate and Accumulated Depreciation of Equity Residential and ERP Operating
Limited Partnership
|
|
|
All other schedules have been omitted because they are inapplicable, not required or the information is included elsewhere in the consolidated financial statements or notes thereto.
REPORT OF INDEPENDENT REGISTERED PUBLIC ACCOUNTING FIRM
To the Board of Trustees and Shareholders
Equity Residential
We have audited the accompanying consolidated balance sheets of Equity Residential (the “Company”) as of
December 31, 2015
and
2014
and the related consolidated statements of operations and comprehensive income, changes in equity and cash flows for each of the three years in the period ended
December 31, 2015
. Our audits also included the financial statement schedule listed in the Index at Item 15(a). These financial statements and schedule are the responsibility of the Company’s management. Our responsibility is to express an opinion on these financial statements and schedule based on our audits.
We conducted our audits in accordance with the standards of the Public Company Accounting Oversight Board (United States). Those standards require that we plan and perform the audit to obtain reasonable assurance about whether the financial statements are free of material misstatement. An audit includes examining, on a test basis, evidence supporting the amounts and disclosures in the financial statements. An audit also includes assessing the accounting principles used and significant estimates made by management, as well as evaluating the overall financial statement presentation. We believe that our audits provide a reasonable basis for our opinion.
In our opinion, the consolidated financial statements referred to above present fairly, in all material respects, the consolidated financial position of Equity Residential at
December 31, 2015
and
2014
and the consolidated results of its operations and its cash flows for each of the three years in the period ended
December 31, 2015
, in conformity with U.S. generally accepted accounting principles. Also, in our opinion, the related financial statement schedule, when considered in relation to the basic consolidated financial statements taken as a whole, presents fairly, in all material respects, the information set forth therein.
As discussed in Note 11 to the consolidated financial statements, the Company changed its method for reporting discontinued operations as a result of the adoption of Accounting Standards Update No. 2014-08, "Reporting Discontinued Operations and Disclosures of Disposals of Components of an Entity," effective January 1, 2014.
We also have audited, in accordance with the standards of the Public Company Accounting Oversight Board (United States), Equity Residential’s internal control over financial reporting as of
December 31, 2015
, based on criteria established in Internal Control – Integrated Framework issued by the Committee of Sponsoring Organizations of the Treadway Commission (2013 framework) and our report dated
February 25, 2016
expressed an unqualified opinion thereon.
|
/s/ ERNST & YOUNG LLP
|
|
|
ERNST & YOUNG LLP
|
|
|
Chicago, Illinois
|
|
|
February 25, 2016
|
|
F-2
REPORT OF INDEPENDENT REGISTERED PUBLIC ACCOUNTING FIRM
To the Partners
ERP Operating Limited Partnership
We have audited the accompanying consolidated balance sheets of ERP Operating Limited Partnership (the “Operating Partnership”) as of
December 31, 2015
and
2014
and the related consolidated statements of operations and comprehensive income, changes in capital and cash flows for each of the three years in the period ended
December 31, 2015
. Our audits also included the financial statement schedule listed in the Index at Item 15(a). These financial statements and schedule are the responsibility of the Operating Partnership's management. Our responsibility is to express an opinion on these financial statements and schedule based on our audits.
We conducted our audits in accordance with the standards of the Public Company Accounting Oversight Board (United States). Those standards require that we plan and perform the audit to obtain reasonable assurance about whether the financial statements are free of material misstatement. An audit includes examining, on a test basis, evidence supporting the amounts and disclosures in the financial statements. An audit also includes assessing the accounting principles used and significant estimates made by management, as well as evaluating the overall financial statement presentation. We believe that our audits provide a reasonable basis for our opinion.
In our opinion, the consolidated financial statements referred to above present fairly, in all material respects, the consolidated financial position of ERP Operating Limited Partnership at
December 31, 2015
and
2014
and the consolidated results of its operations and its cash flows for each of the three years in the period ended
December 31, 2015
, in conformity with U.S. generally accepted accounting principles. Also, in our opinion, the related financial statement schedule, when considered in relation to the basic consolidated financial statements taken as a whole, presents fairly, in all material respects, the information set forth therein.
As discussed in Note 11 to the consolidated financial statements, the Operating Partnership changed its method for reporting discontinued operations as a result of the adoption of Accounting Standards Update No. 2014-08, "Reporting Discontinued Operations and Disclosures of Disposals of Components of an Entity," effective January 1, 2014.
We also have audited, in accordance with the standards of the Public Company Accounting Oversight Board (United States), ERP Operating Limited Partnership's internal control over financial reporting as of
December 31, 2015
, based on criteria established in Internal Control – Integrated Framework issued by the Committee of Sponsoring Organizations of the Treadway Commission (2013 framework) and our report dated
February 25, 2016
expressed an unqualified opinion thereon.
|
/s/ ERNST & YOUNG LLP
|
|
|
ERNST & YOUNG LLP
|
|
|
Chicago, Illinois
|
|
|
February 25, 2016
|
|
F-3
REPORT OF INDEPENDENT REGISTERED PUBLIC ACCOUNTING FIRM
ON INTERNAL CONTROL OVER FINANCIAL REPORTING
To the Board of Trustees and Shareholders
Equity Residential
We have audited Equity Residential’s (the “Company”) internal control over financial reporting as of
December 31, 2015
, based on criteria established in Internal Control - Integrated Framework issued by the Committee of Sponsoring Organizations of the Treadway Commission (2013 framework) (the COSO Criteria). Equity Residential’s management is responsible for maintaining effective internal control over financial reporting, and for its assessment of the effectiveness of internal control over financial reporting included in the accompanying Management's Report on Internal Control over Financial Reporting. Our responsibility is to express an opinion on the Company’s internal control over financial reporting based on our audit.
We conducted our audit in accordance with the standards of the Public Company Accounting Oversight Board (United States). Those standards require that we plan and perform the audit to obtain reasonable assurance about whether effective internal control over financial reporting was maintained in all material respects. Our audit included obtaining an understanding of internal control over financial reporting, assessing the risk that a material weakness exists, testing and evaluating the design and operating effectiveness of internal control based on the assessed risk, and performing such other procedures as we considered necessary in the circumstances. We believe that our audit provides a reasonable basis for our opinion.
A company’s internal control over financial reporting is a process designed to provide reasonable assurance regarding the reliability of financial reporting and the preparation of financial statements for external purposes in accordance with generally accepted accounting principles. A company’s internal control over financial reporting includes those policies and procedures that (1) pertain to the maintenance of records that, in reasonable detail, accurately and fairly reflect the transactions and dispositions of the assets of the company; (2) provide reasonable assurance that transactions are recorded as necessary to permit preparation of financial statements in accordance with generally accepted accounting principles, and that receipts and expenditures of the company are being made only in accordance with authorizations of management and directors of the company; and (3) provide reasonable assurance regarding prevention or timely detection of unauthorized acquisition, use or disposition of the company’s assets that could have a material effect on the financial statements.
Because of its inherent limitations, internal control over financial reporting may not prevent or detect misstatements. Also, projections of any evaluation of effectiveness to future periods are subject to the risk that controls may become inadequate because of changes in conditions, or that the degree of compliance with the policies or procedures may deteriorate.
In our opinion, Equity Residential maintained, in all material respects, effective internal control over financial reporting as of
December 31, 2015
, based on the COSO Criteria.
We also have audited, in accordance with the standards of the Public Company Accounting Oversight Board (United States), the consolidated balance sheets of Equity Residential as of
December 31, 2015
and
2014
and the related consolidated statements of operations and comprehensive income, changes in equity and cash flows for each of the three years in the period ended
December 31, 2015
and our report dated
February 25, 2016
expressed an unqualified opinion thereon.
|
/s/ ERNST & YOUNG LLP
|
|
|
ERNST & YOUNG LLP
|
|
|
Chicago, Illinois
|
|
|
February 25, 2016
|
|
F-4
REPORT OF INDEPENDENT REGISTERED PUBLIC ACCOUNTING FIRM
ON INTERNAL CONTROL OVER FINANCIAL REPORTING
To the Partners
ERP Operating Limited Partnership
We have audited ERP Operating Limited Partnership's (the “Operating Partnership”) internal control over financial reporting as of
December 31, 2015
, based on criteria established in Internal Control – Integrated Framework issued by the Committee of Sponsoring Organizations of the Treadway Commission (2013 framework) (the COSO Criteria). ERP Operating Limited Partnership's management is responsible for maintaining effective internal control over financial reporting, and for its assessment of the effectiveness of internal control over financial reporting included in the accompanying Management’s Report on Internal Control over Financial Reporting. Our responsibility is to express an opinion on the Operating Partnership's internal control over financial reporting based on our audit.
We conducted our audit in accordance with the standards of the Public Company Accounting Oversight Board (United States). Those standards require that we plan and perform the audit to obtain reasonable assurance about whether effective internal control over financial reporting was maintained in all material respects. Our audit included obtaining an understanding of internal control over financial reporting, assessing the risk that a material weakness exists, testing and evaluating the design and operating effectiveness of internal control based on the assessed risk, and performing such other procedures as we considered necessary in the circumstances. We believe that our audit provides a reasonable basis for our opinion.
A company’s internal control over financial reporting is a process designed to provide reasonable assurance regarding the reliability of financial reporting and the preparation of financial statements for external purposes in accordance with generally accepted accounting principles. A company’s internal control over financial reporting includes those policies and procedures that (1) pertain to the maintenance of records that, in reasonable detail, accurately and fairly reflect the transactions and dispositions of the assets of the company; (2) provide reasonable assurance that transactions are recorded as necessary to permit preparation of financial statements in accordance with generally accepted accounting principles, and that receipts and expenditures of the company are being made only in accordance with authorizations of management and directors of the company; and (3) provide reasonable assurance regarding prevention or timely detection of unauthorized acquisition, use or disposition of the company’s assets that could have a material effect on the financial statements.
Because of its inherent limitations, internal control over financial reporting may not prevent or detect misstatements. Also, projections of any evaluation of effectiveness to future periods are subject to the risk that controls may become inadequate because of changes in conditions, or that the degree of compliance with the policies or procedures may deteriorate.
In our opinion, ERP Operating Limited Partnership maintained, in all material respects, effective internal control over financial reporting as of
December 31, 2015
, based on the COSO Criteria.
We also have audited, in accordance with the standards of the Public Company Accounting Oversight Board (United States), the consolidated balance sheets of ERP Operating Limited Partnership as of
December 31, 2015
and
2014
and the related consolidated statements of operations and comprehensive income, changes in capital and cash flows for each of the three years in the period ended
December 31, 2015
and our report dated
February 25, 2016
expressed an unqualified opinion thereon.
|
/s/ ERNST & YOUNG LLP
|
|
|
ERNST & YOUNG LLP
|
|
|
Chicago, Illinois
|
|
|
February 25, 2016
|
|
F-5
EQUITY RESIDENTIAL
(Amounts in thousands except for share amounts)
|
December 31, 2015
|
December 31, 2014
|
|||||||
|
ASSETS
|
||||||||
|
Investment in real estate
|
|
|
|
|
||||
|
Land
|
$
|
5,864,046
|
|
$
|
6,295,404
|
|
||
|
Depreciable property
|
18,027,087
|
|
19,851,504
|
|
||||
|
Projects under development
|
1,122,376
|
|
1,343,919
|
|
||||
|
Land held for development
|
168,843
|
|
184,556
|
|
||||
|
Investment in real estate
|
25,182,352
|
|
27,675,383
|
|
||||
|
Accumulated depreciation
|
(4,905,406
|
)
|
(5,432,805
|
)
|
||||
|
Investment in real estate, net
|
20,276,946
|
|
22,242,578
|
|
||||
|
Real estate held for sale
|
2,181,135
|
|
—
|
|
||||
|
Cash and cash equivalents
|
42,276
|
|
40,080
|
|
||||
|
Investments in unconsolidated entities
|
68,101
|
|
105,434
|
|
||||
|
Deposits – restricted
|
55,893
|
|
72,303
|
|
||||
|
Escrow deposits – mortgage
|
56,946
|
|
48,085
|
|
||||
|
Deferred financing costs, net
|
54,004
|
|
58,380
|
|
||||
|
Other assets
|
422,027
|
|
383,754
|
|
||||
|
Total assets
|
$
|
23,157,328
|
|
$
|
22,950,614
|
|
||
|
LIABILITIES AND EQUITY
|
||||||||
|
Liabilities:
|
|
|
||||||
|
Mortgage notes payable
|
$
|
4,704,870
|
|
$
|
5,086,515
|
|
||
|
Notes, net
|
5,876,352
|
|
5,425,346
|
|
||||
|
Line of credit and commercial paper
|
387,276
|
|
333,000
|
|
||||
|
Accounts payable and accrued expenses
|
187,124
|
|
153,590
|
|
||||
|
Accrued interest payable
|
85,221
|
|
89,540
|
|
||||
|
Other liabilities
|
366,387
|
|
389,915
|
|
||||
|
Security deposits
|
77,582
|
|
75,633
|
|
||||
|
Distributions payable
|
209,378
|
|
188,566
|
|
||||
|
Total liabilities
|
11,894,190
|
|
11,742,105
|
|
||||
|
Commitments and contingencies
|
||||||||
|
Redeemable Noncontrolling Interests – Operating Partnership
|
566,783
|
|
500,733
|
|
||||
|
Equity:
|
|
|
||||||
|
Shareholders’ equity:
|
|
|
||||||
|
Preferred Shares of beneficial interest, $0.01 par value;
|
|
|
||||||
|
100,000,000 shares authorized; 745,600 shares issued and
outstanding as of December 31, 2015 and 1,000,000 shares issued and outstanding as of December 31, 2014 |
37,280
|
|
50,000
|
|
||||
|
Common Shares of beneficial interest, $0.01 par value;
|
|
|
||||||
|
1,000,000,000 shares authorized; 364,755,444 shares issued
and outstanding as of December 31, 2015 and 362,855,454 shares issued and outstanding as of December 31, 2014 |
3,648
|
|
3,629
|
|
||||
|
Paid in capital
|
8,572,365
|
|
8,536,340
|
|
||||
|
Retained earnings
|
2,009,091
|
|
1,950,639
|
|
||||
|
Accumulated other comprehensive (loss)
|
(152,016
|
)
|
(172,152
|
)
|
||||
|
Total shareholders’ equity
|
10,470,368
|
|
10,368,456
|
|
||||
|
Noncontrolling Interests:
|
||||||||
|
Operating Partnership
|
221,379
|
|
214,411
|
|
||||
|
Partially Owned Properties
|
4,608
|
|
124,909
|
|
||||
|
Total Noncontrolling Interests
|
225,987
|
|
339,320
|
|
||||
|
Total equity
|
10,696,355
|
|
10,707,776
|
|
||||
|
Total liabilities and equity
|
$
|
23,157,328
|
|
$
|
22,950,614
|
|
||
See accompanying notes
F-6
EQUITY RESIDENTIAL
(Amounts in thousands except per share data)
|
|
Year Ended December 31,
|
|||||||||||
|
|
2015
|
2014
|
2013
|
|||||||||
|
REVENUES
|
|
|
|
|
|
|
||||||
|
Rental income
|
$
|
2,736,578
|
|
$
|
2,605,311
|
|
$
|
2,378,004
|
|
|||
|
Fee and asset management
|
8,387
|
|
9,437
|
|
9,698
|
|
||||||
|
Total revenues
|
2,744,965
|
|
2,614,748
|
|
2,387,702
|
|
||||||
|
EXPENSES
|
|
|
||||||||||
|
Property and maintenance
|
479,160
|
|
473,098
|
|
449,427
|
|
||||||
|
Real estate taxes and insurance
|
339,802
|
|
325,401
|
|
293,999
|
|
||||||
|
Property management
|
81,185
|
|
79,636
|
|
84,342
|
|
||||||
|
Fee and asset management
|
5,021
|
|
5,429
|
|
6,460
|
|
||||||
|
Depreciation
|
765,895
|
|
758,861
|
|
978,973
|
|
||||||
|
General and administrative
|
65,082
|
|
50,948
|
|
62,179
|
|
||||||
|
Total expenses
|
1,736,145
|
|
1,693,373
|
|
1,875,380
|
|
||||||
|
Operating income
|
1,008,820
|
|
921,375
|
|
512,322
|
|
||||||
|
Interest and other income
|
7,372
|
|
4,462
|
|
5,283
|
|
||||||
|
Other expenses
|
(2,942
|
)
|
(9,073
|
)
|
(29,630
|
)
|
||||||
|
Interest:
|
|
|
|
|
|
|
||||||
|
Expense incurred, net
|
(444,069
|
)
|
(457,191
|
)
|
(586,854
|
)
|
||||||
|
Amortization of deferred financing costs
|
(10,801
|
)
|
(11,088
|
)
|
(22,197
|
)
|
||||||
|
Income (loss) before income and other taxes, income (loss) from investments
in unconsolidated entities, net gain (loss) on sales of real estate properties and land parcels and discontinued operations |
558,380
|
|
448,485
|
|
(121,076
|
)
|
||||||
|
Income and other tax (expense) benefit
|
(917
|
)
|
(1,394
|
)
|
(1,169
|
)
|
||||||
|
Income (loss) from investments in unconsolidated entities
|
15,025
|
|
(7,952
|
)
|
(58,156
|
)
|
||||||
|
Net gain on sales of real estate properties
|
335,134
|
|
212,685
|
|
—
|
|
||||||
|
Net (loss) gain on sales of land parcels
|
(1
|
)
|
5,277
|
|
12,227
|
|
||||||
|
Income (loss) from continuing operations
|
907,621
|
|
657,101
|
|
(168,174
|
)
|
||||||
|
Discontinued operations, net
|
397
|
|
1,582
|
|
2,073,527
|
|
||||||
|
Net income
|
908,018
|
|
658,683
|
|
1,905,353
|
|
||||||
|
Net (income) loss attributable to Noncontrolling Interests:
|
|
|
|
|
|
|
||||||
|
Operating Partnership
|
(34,241
|
)
|
(24,831
|
)
|
(75,278
|
)
|
||||||
|
Partially Owned Properties
|
(3,657
|
)
|
(2,544
|
)
|
538
|
|
||||||
|
Net income attributable to controlling interests
|
870,120
|
|
631,308
|
|
1,830,613
|
|
||||||
|
Preferred distributions
|
(3,357
|
)
|
(4,145
|
)
|
(4,145
|
)
|
||||||
|
Premium on redemption of Preferred Shares
|
(3,486
|
)
|
—
|
|
—
|
|
||||||
|
Net income available to Common Shares
|
$
|
863,277
|
|
$
|
627,163
|
|
$
|
1,826,468
|
|
|||
|
Earnings per share – basic:
|
|
|
|
|
|
|
||||||
|
Income (loss) from continuing operations available to Common Shares
|
$
|
2.37
|
|
$
|
1.73
|
|
$
|
(0.47
|
)
|
|||
|
Net income available to Common Shares
|
$
|
2.37
|
|
$
|
1.74
|
|
$
|
5.16
|
|
|||
|
Weighted average Common Shares outstanding
|
363,498
|
|
361,181
|
|
354,305
|
|
||||||
|
Earnings per share – diluted:
|
|
|
|
|
|
|
||||||
|
Income (loss) from continuing operations available to Common Shares
|
$
|
2.36
|
|
$
|
1.72
|
|
$
|
(0.47
|
)
|
|||
|
Net income available to Common Shares
|
$
|
2.36
|
|
$
|
1.73
|
|
$
|
5.16
|
|
|||
|
Weighted average Common Shares outstanding
|
380,620
|
|
377,735
|
|
354,305
|
|
||||||
|
Distributions declared per Common Share outstanding
|
$
|
2.21
|
|
$
|
2.00
|
|
$
|
1.85
|
|
|||
See accompanying notes
F-7
EQUITY RESIDENTIAL
CONSOLIDATED STATEMENTS OF OPERATIONS AND COMPREHENSIVE INCOME (Continued)
(Amounts in thousands except per share data)
|
Year Ended December 31,
|
||||||||||||
|
|
2015
|
2014
|
2013
|
|||||||||
|
Comprehensive income:
|
|
|
|
|
|
|
||||||
|
Net income
|
$
|
908,018
|
|
$
|
658,683
|
|
$
|
1,905,353
|
|
|||
|
Other comprehensive income (loss):
|
||||||||||||
|
Other comprehensive income (loss) – derivative instruments:
|
|
|
|
|
|
|
||||||
|
Unrealized holding gains (losses) arising during the year
|
2,219
|
|
(33,306
|
)
|
18,771
|
|
||||||
|
Losses reclassified into earnings from other comprehensive income
|
18,244
|
|
16,868
|
|
20,141
|
|
||||||
|
Other comprehensive income (loss) – other instruments:
|
|
|
|
|
|
|
||||||
|
Unrealized holding gains arising during the year
|
—
|
|
—
|
|
583
|
|
||||||
|
(Gains) realized during the year
|
—
|
|
—
|
|
(2,122
|
)
|
||||||
|
Other comprehensive (loss) income – foreign currency:
|
||||||||||||
|
Currency translation adjustments arising during the year
|
(327
|
)
|
(552
|
)
|
613
|
|
||||||
|
Other comprehensive income (loss)
|
20,136
|
|
(16,990
|
)
|
37,986
|
|
||||||
|
Comprehensive income
|
928,154
|
|
641,693
|
|
1,943,339
|
|
||||||
|
Comprehensive (income) attributable to Noncontrolling Interests
|
(38,668
|
)
|
(26,728
|
)
|
(76,204
|
)
|
||||||
|
Comprehensive income attributable to controlling interests
|
$
|
889,486
|
|
$
|
614,965
|
|
$
|
1,867,135
|
|
|||
See accompanying notes
F-8
EQUITY RESIDENTIAL
(Amounts in thousands)
|
|
Year Ended December 31,
|
|||||||||||
|
|
2015
|
2014
|
2013
|
|||||||||
|
CASH FLOWS FROM OPERATING ACTIVITIES:
|
|
|
|
|
|
|
||||||
|
Net income
|
$
|
908,018
|
|
$
|
658,683
|
|
$
|
1,905,353
|
|
|||
|
Adjustments to reconcile net income to net cash provided by operating activities:
|
|
|
|
|
|
|
||||||
|
Depreciation
|
765,895
|
|
758,861
|
|
1,013,353
|
|
||||||
|
Amortization of deferred financing costs
|
10,801
|
|
11,088
|
|
22,425
|
|
||||||
|
Amortization of above/below market leases
|
3,382
|
|
3,222
|
|
898
|
|
||||||
|
Amortization of discounts and premiums on debt
|
(9,492
|
)
|
(13,520
|
)
|
(156,439
|
)
|
||||||
|
Amortization of deferred settlements on derivative instruments
|
18,075
|
|
16,334
|
|
19,607
|
|
||||||
|
Write-off of pursuit costs
|
3,208
|
|
3,607
|
|
5,184
|
|
||||||
|
(Income) loss from investments in unconsolidated entities
|
(15,025
|
)
|
7,952
|
|
58,156
|
|
||||||
|
Distributions from unconsolidated entities – return on capital
|
4,741
|
|
5,570
|
|
2,481
|
|
||||||
|
Net (gain) on sales of investment securities and other investments
|
(526
|
)
|
(57
|
)
|
(4,203
|
)
|
||||||
|
Net (gain) on sales of real estate properties
|
(335,134
|
)
|
(212,685
|
)
|
—
|
|
||||||
|
Net loss (gain) on sales of land parcels
|
1
|
|
(5,277
|
)
|
(12,227
|
)
|
||||||
|
Net (gain) on sales of discontinued operations
|
—
|
|
(179
|
)
|
(2,036,505
|
)
|
||||||
|
Realized/unrealized loss (gain) on derivative instruments
|
3,055
|
|
(60
|
)
|
70
|
|
||||||
|
Compensation paid with Company Common Shares
|
34,607
|
|
27,543
|
|
35,474
|
|
||||||
|
Changes in assets and liabilities:
|
|
|
|
|
|
|
||||||
|
(Increase) decrease in deposits – restricted
|
(1,794
|
)
|
(1,740
|
)
|
3,684
|
|
||||||
|
Decrease in mortgage deposits
|
258
|
|
1,452
|
|
1,813
|
|
||||||
|
(Increase) decrease in other assets
|
(41,803
|
)
|
21,773
|
|
3,742
|
|
||||||
|
(Decrease) increase in accounts payable and accrued expenses
|
(1,667
|
)
|
17,797
|
|
6,229
|
|
||||||
|
(Decrease) increase in accrued interest payable
|
(4,319
|
)
|
11,231
|
|
(9,219
|
)
|
||||||
|
Increase in other liabilities
|
12,269
|
|
8,437
|
|
15,401
|
|
||||||
|
Increase (decrease) in security deposits
|
1,949
|
|
4,041
|
|
(6,361
|
)
|
||||||
|
Net cash provided by operating activities
|
1,356,499
|
|
1,324,073
|
|
868,916
|
|
||||||
|
CASH FLOWS FROM INVESTING ACTIVITIES:
|
|
|
|
|
|
|
||||||
|
Acquisition of Archstone, net of cash acquired
|
—
|
|
—
|
|
(4,000,875
|
)
|
||||||
|
Investment in real estate – acquisitions
|
(331,336
|
)
|
(469,989
|
)
|
(108,308
|
)
|
||||||
|
Investment in real estate – development/other
|
(653,897
|
)
|
(530,387
|
)
|
(377,442
|
)
|
||||||
|
Capital expenditures to real estate
|
(182,113
|
)
|
(185,957
|
)
|
(135,816
|
)
|
||||||
|
Non-real estate capital additions
|
(3,991
|
)
|
(5,286
|
)
|
(4,134
|
)
|
||||||
|
Interest capitalized for real estate and unconsolidated entities under development
|
(59,885
|
)
|
(52,782
|
)
|
(47,321
|
)
|
||||||
|
Proceeds from disposition of real estate, net
|
504,748
|
|
522,647
|
|
4,551,454
|
|
||||||
|
Investments in unconsolidated entities
|
(23,019
|
)
|
(15,768
|
)
|
(66,471
|
)
|
||||||
|
Distributions from unconsolidated entities – return of capital
|
51,144
|
|
103,793
|
|
25,471
|
|
||||||
|
Proceeds from sale of investment securities and other investments
|
2,535
|
|
57
|
|
4,878
|
|
||||||
|
Decrease in deposits on real estate acquisitions and investments, net
|
17,874
|
|
33,004
|
|
143,694
|
|
||||||
|
(Increase) decrease in mortgage deposits
|
(531
|
)
|
798
|
|
7,893
|
|
||||||
|
Consolidation of previously unconsolidated properties
|
—
|
|
(44,796
|
)
|
—
|
|
||||||
|
Net cash (used for) investing activities
|
(678,471
|
)
|
(644,666
|
)
|
(6,977
|
)
|
||||||
See accompanying notes
F-9
EQUITY RESIDENTIAL
CONSOLIDATED STATEMENTS OF CASH FLOWS (Continued)
(Amounts in thousands)
|
|
Year Ended December 31,
|
|||||||||||
|
|
2015
|
2014
|
2013
|
|||||||||
|
CASH FLOWS FROM FINANCING ACTIVITIES:
|
|
|
|
|
|
|
||||||
|
Debt financing costs
|
$
|
(6,425
|
)
|
$
|
(10,982
|
)
|
$
|
(16,526
|
)
|
|||
|
Mortgage deposits
|
(8,588
|
)
|
(7,699
|
)
|
(5,631
|
)
|
||||||
|
Mortgage notes payable:
|
|
|
|
|
|
|
||||||
|
Proceeds
|
—
|
|
—
|
|
902,886
|
|
||||||
|
Lump sum payoffs
|
(359,244
|
)
|
(88,788
|
)
|
(2,532,682
|
)
|
||||||
|
Scheduled principal repayments
|
(9,275
|
)
|
(11,869
|
)
|
(12,658
|
)
|
||||||
|
Notes, net:
|
|
|
|
|
|
|
||||||
|
Proceeds
|
746,391
|
|
1,194,277
|
|
1,245,550
|
|
||||||
|
Lump sum payoffs
|
(300,000
|
)
|
(1,250,000
|
)
|
(400,000
|
)
|
||||||
|
Line of credit and commercial paper:
|
|
|
|
|
|
|
||||||
|
Line of credit proceeds
|
3,770,000
|
|
7,167,000
|
|
9,832,000
|
|
||||||
|
Line of credit repayments
|
(4,103,000
|
)
|
(6,949,000
|
)
|
(9,717,000
|
)
|
||||||
|
Commercial paper proceeds
|
3,931,227
|
|
—
|
|
—
|
|
||||||
|
Commercial paper repayments
|
(3,545,028
|
)
|
—
|
|
—
|
|
||||||
|
(Payments on) settlement of derivative instruments
|
(13,938
|
)
|
(758
|
)
|
(44,063
|
)
|
||||||
|
Proceeds from Employee Share Purchase Plan (ESPP)
|
4,404
|
|
3,392
|
|
3,401
|
|
||||||
|
Proceeds from exercise of options
|
59,508
|
|
82,573
|
|
17,252
|
|
||||||
|
Common Shares repurchased and retired
|
—
|
|
(1,777
|
)
|
—
|
|
||||||
|
Redemption of Preferred Shares
|
(12,720
|
)
|
—
|
|
—
|
|
||||||
|
Premium on redemption of Preferred Shares
|
(3,486
|
)
|
—
|
|
—
|
|
||||||
|
Payment of offering costs
|
(79
|
)
|
(41
|
)
|
(1,047
|
)
|
||||||
|
Other financing activities, net
|
(49
|
)
|
(49
|
)
|
(48
|
)
|
||||||
|
Acquisition of Noncontrolling Interests – Partially Owned Properties
|
—
|
|
(5,501
|
)
|
—
|
|
||||||
|
Contributions – Noncontrolling Interests – Partially Owned Properties
|
—
|
|
5,684
|
|
27,660
|
|
||||||
|
Contributions – Noncontrolling Interests – Operating Partnership
|
3
|
|
3
|
|
5
|
|
||||||
|
Distributions:
|
|
|
|
|
|
|
||||||
|
Common Shares
|
(784,748
|
)
|
(776,659
|
)
|
(681,610
|
)
|
||||||
|
Preferred Shares
|
(3,357
|
)
|
(4,145
|
)
|
(4,145
|
)
|
||||||
|
Noncontrolling Interests – Operating Partnership
|
(30,869
|
)
|
(30,744
|
)
|
(27,897
|
)
|
||||||
|
Noncontrolling Interests – Partially Owned Properties
|
(6,559
|
)
|
(7,778
|
)
|
(6,442
|
)
|
||||||
|
Net cash (used for) financing activities
|
(675,832
|
)
|
(692,861
|
)
|
(1,420,995
|
)
|
||||||
|
Net increase (decrease) in cash and cash equivalents
|
2,196
|
|
(13,454
|
)
|
(559,056
|
)
|
||||||
|
Cash and cash equivalents, beginning of year
|
40,080
|
|
53,534
|
|
612,590
|
|
||||||
|
Cash and cash equivalents, end of year
|
$
|
42,276
|
|
$
|
40,080
|
|
$
|
53,534
|
|
|||
See accompanying notes
F-10
EQUITY RESIDENTIAL
CONSOLIDATED STATEMENTS OF CASH FLOWS (Continued)
(Amounts in thousands)
|
|
Year Ended December 31,
|
|||||||||||
|
|
2015
|
2014
|
2013
|
|||||||||
|
SUPPLEMENTAL INFORMATION:
|
|
|
|
|
|
|
||||||
|
Cash paid for interest, net of amounts capitalized
|
$
|
436,748
|
|
$
|
443,125
|
|
$
|
722,963
|
|
|||
|
Net cash paid for income and other taxes
|
$
|
1,264
|
|
$
|
1,517
|
|
$
|
1,152
|
|
|||
|
Real estate acquisitions/dispositions/other:
|
|
|
|
|
|
|
||||||
|
Mortgage loans assumed
|
$
|
—
|
|
$
|
28,910
|
|
$
|
—
|
|
|||
|
Amortization of deferred financing costs:
|
|
|
|
|
|
|
||||||
|
Investment in real estate, net
|
$
|
—
|
|
$
|
—
|
|
$
|
(152
|
)
|
|||
|
Deferred financing costs, net
|
$
|
10,801
|
|
$
|
11,088
|
|
$
|
22,577
|
|
|||
|
Amortization of discounts and premiums on debt:
|
|
|
|
|
|
|
||||||
|
Mortgage notes payable
|
$
|
(13,126
|
)
|
$
|
(15,904
|
)
|
$
|
(158,625
|
)
|
|||
|
Notes, net
|
$
|
2,557
|
|
$
|
2,384
|
|
$
|
2,186
|
|
|||
|
Line of credit and commercial paper
|
$
|
1,077
|
|
$
|
—
|
|
$
|
—
|
|
|||
|
Amortization of deferred settlements on derivative instruments:
|
|
|
|
|
|
|
||||||
|
Other liabilities
|
$
|
(169
|
)
|
$
|
(534
|
)
|
$
|
(534
|
)
|
|||
|
Accumulated other comprehensive income
|
$
|
18,244
|
|
$
|
16,868
|
|
$
|
20,141
|
|
|||
|
Write-off of pursuit costs:
|
||||||||||||
|
Investment in real estate, net
|
$
|
2,804
|
|
$
|
2,541
|
|
$
|
4,956
|
|
|||
|
Deposits – restricted
|
$
|
330
|
|
$
|
—
|
|
$
|
25
|
|
|||
|
Other assets
|
$
|
74
|
|
$
|
1,066
|
|
$
|
203
|
|
|||
|
(Income) loss from investments in unconsolidated entities:
|
||||||||||||
|
Investments in unconsolidated entities
|
$
|
(17,340
|
)
|
$
|
4,610
|
|
$
|
53,066
|
|
|||
|
Other liabilities
|
$
|
2,315
|
|
$
|
3,342
|
|
$
|
5,090
|
|
|||
|
Distributions from unconsolidated entities – return on capital:
|
||||||||||||
|
Investments in unconsolidated entities
|
$
|
4,606
|
|
$
|
5,360
|
|
$
|
2,448
|
|
|||
|
Other liabilities
|
$
|
135
|
|
$
|
210
|
|
$
|
33
|
|
|||
|
Realized/unrealized loss (gain) on derivative instruments:
|
|
|
|
|
|
|
||||||
|
Other assets
|
$
|
(3,573
|
)
|
$
|
10,160
|
|
$
|
(17,139
|
)
|
|||
|
Notes, net
|
$
|
2,058
|
|
$
|
1,597
|
|
$
|
(1,523
|
)
|
|||
|
Other liabilities
|
$
|
2,351
|
|
$
|
21,489
|
|
$
|
(39
|
)
|
|||
|
Accumulated other comprehensive income
|
$
|
2,219
|
|
$
|
(33,306
|
)
|
$
|
18,771
|
|
|||
|
Acquisition of Archstone, net of cash acquired:
|
||||||||||||
|
Investment in real estate, net
|
$
|
—
|
|
$
|
39,929
|
|
$
|
(8,687,355
|
)
|
|||
|
Investments in unconsolidated entities
|
$
|
—
|
|
$
|
(33,993
|
)
|
$
|
(225,568
|
)
|
|||
|
Deposits – restricted
|
$
|
—
|
|
$
|
—
|
|
$
|
(528
|
)
|
|||
|
Escrow deposits – mortgage
|
$
|
—
|
|
$
|
—
|
|
$
|
(37,582
|
)
|
|||
|
Deferred financing costs, net
|
$
|
—
|
|
$
|
—
|
|
$
|
(25,780
|
)
|
|||
|
Other assets
|
$
|
—
|
|
$
|
(2,586
|
)
|
$
|
(215,622
|
)
|
|||
|
Mortgage notes payable
|
$
|
—
|
|
$
|
—
|
|
$
|
3,076,876
|
|
|||
|
Accounts payable and accrued expenses
|
$
|
—
|
|
$
|
(146
|
)
|
$
|
16,984
|
|
|||
|
Accrued interest payable
|
$
|
—
|
|
$
|
—
|
|
$
|
11,305
|
|
|||
|
Other liabilities
|
$
|
—
|
|
$
|
(3,204
|
)
|
$
|
117,299
|
|
|||
|
Security deposits
|
$
|
—
|
|
$
|
—
|
|
$
|
10,965
|
|
|||
|
Issuance of Common Shares
|
$
|
—
|
|
$
|
—
|
|
$
|
1,929,868
|
|
|||
|
Noncontrolling Interests – Partially Owned Properties
|
$
|
—
|
|
$
|
—
|
|
$
|
28,263
|
|
|||
|
Interest capitalized for real estate and unconsolidated entities under development:
|
||||||||||||
|
Investment in real estate, net
|
$
|
(59,885
|
)
|
$
|
(52,717
|
)
|
$
|
(45,533
|
)
|
|||
|
Investments in unconsolidated entities
|
$
|
—
|
|
$
|
(65
|
)
|
$
|
(1,788
|
)
|
|||
|
Investments in unconsolidated entities:
|
||||||||||||
|
Investments in unconsolidated entities
|
$
|
(1,404
|
)
|
$
|
(6,318
|
)
|
$
|
(13,656
|
)
|
|||
|
Other liabilities
|
$
|
(21,615
|
)
|
$
|
(9,450
|
)
|
$
|
(52,815
|
)
|
|||
See accompanying notes
F-11
EQUITY RESIDENTIAL
CONSOLIDATED STATEMENTS OF CASH FLOWS (Continued)
(Amounts in thousands)
|
Year Ended December 31,
|
||||||||||||
|
2015
|
2014
|
2013
|
||||||||||
|
SUPPLEMENTAL INFORMATION (continued):
|
||||||||||||
|
Consolidation of previously unconsolidated properties:
|
||||||||||||
|
Investment in real estate, net
|
$
|
—
|
|
$
|
(64,319
|
)
|
$
|
—
|
|
|||
|
Investments in unconsolidated entities
|
$
|
—
|
|
$
|
(847
|
)
|
$
|
—
|
|
|||
|
Accounts payable and accrued expenses
|
$
|
—
|
|
$
|
1,987
|
|
$
|
—
|
|
|||
|
Other liabilities
|
$
|
—
|
|
$
|
18,383
|
|
$
|
—
|
|
|||
|
(Payments on) settlement of derivative instruments:
|
|
|
|
|
|
|
||||||
|
Other assets
|
$
|
1,848
|
|
$
|
6,623
|
|
$
|
(50
|
)
|
|||
|
Other liabilities
|
$
|
(15,786
|
)
|
$
|
(7,381
|
)
|
$
|
(44,013
|
)
|
|||
|
Other:
|
|
|
|
|
|
|
||||||
|
Foreign currency translation adjustments
|
$
|
327
|
|
$
|
552
|
|
$
|
(613
|
)
|
|||
See accompanying notes
F-12
EQUITY RESIDENTIAL
CONSOLIDATED STATEMENTS OF CHANGES IN EQUITY
(Amounts in thousands)
|
|
Year Ended December 31,
|
|||||||||||
|
SHAREHOLDERS’ EQUITY
|
2015
|
2014
|
2013
|
|||||||||
|
PREFERRED SHARES
|
|
|
|
|
|
|
||||||
|
Balance, beginning of year
|
$
|
50,000
|
|
$
|
50,000
|
|
$
|
50,000
|
|
|||
|
Partial redemption of 8.29% Series K Cumulative Redeemable
|
(12,720
|
)
|
—
|
|
—
|
|
||||||
|
Balance, end of year
|
$
|
37,280
|
|
$
|
50,000
|
|
$
|
50,000
|
|
|||
|
COMMON SHARES, $0.01 PAR VALUE
|
|
|
|
|
|
|
||||||
|
Balance, beginning of year
|
$
|
3,629
|
|
$
|
3,605
|
|
$
|
3,251
|
|
|||
|
Conversion of OP Units into Common Shares
|
2
|
|
1
|
|
1
|
|
||||||
|
Issuance of Common Shares
|
—
|
|
—
|
|
345
|
|
||||||
|
Exercise of share options
|
14
|
|
21
|
|
5
|
|
||||||
|
Employee Share Purchase Plan (ESPP)
|
1
|
|
—
|
|
1
|
|
||||||
|
Share-based employee compensation expense:
|
|
|
|
|
|
|
||||||
|
Restricted shares
|
2
|
|
2
|
|
2
|
|
||||||
|
Balance, end of year
|
$
|
3,648
|
|
$
|
3,629
|
|
$
|
3,605
|
|
|||
|
PAID IN CAPITAL
|
|
|
|
|
|
|
||||||
|
Balance, beginning of year
|
$
|
8,536,340
|
|
$
|
8,561,500
|
|
$
|
6,542,355
|
|
|||
|
Common Share Issuance:
|
|
|
|
|
|
|
||||||
|
Conversion of OP Units into Common Shares
|
4,964
|
|
2,364
|
|
1,698
|
|
||||||
|
Issuance of Common Shares
|
—
|
|
—
|
|
1,929,523
|
|
||||||
|
Exercise of share options
|
59,494
|
|
82,552
|
|
17,247
|
|
||||||
|
Employee Share Purchase Plan (ESPP)
|
4,403
|
|
3,392
|
|
3,400
|
|
||||||
|
Conversion of restricted shares to restricted units
|
(70
|
)
|
—
|
|
—
|
|
||||||
|
Share-based employee compensation expense:
|
|
|
|
|
|
|
||||||
|
Restricted shares
|
15,064
|
|
9,902
|
|
13,262
|
|
||||||
|
Share options
|
3,756
|
|
7,349
|
|
10,514
|
|
||||||
|
ESPP discount
|
884
|
|
859
|
|
632
|
|
||||||
|
Common Shares repurchased and retired
|
—
|
|
(1,777
|
)
|
—
|
|
||||||
|
Offering costs
|
(79
|
)
|
(41
|
)
|
(1,047
|
)
|
||||||
|
Supplemental Executive Retirement Plan (SERP)
|
1,380
|
|
7,374
|
|
(422
|
)
|
||||||
|
Acquisition of Noncontrolling Interests – Partially Owned Properties
|
—
|
|
(2,308
|
)
|
—
|
|
||||||
|
Change in market value of Redeemable Noncontrolling Interests – Operating
Partnership |
(64,378
|
)
|
(139,818
|
)
|
79,667
|
|
||||||
|
Adjustment for Noncontrolling Interests ownership in Operating Partnership
|
10,607
|
|
4,992
|
|
(35,329
|
)
|
||||||
|
Balance, end of year
|
$
|
8,572,365
|
|
$
|
8,536,340
|
|
$
|
8,561,500
|
|
|||
|
RETAINED EARNINGS
|
|
|
|
|
|
|
||||||
|
Balance, beginning of year
|
$
|
1,950,639
|
|
$
|
2,047,258
|
|
$
|
887,355
|
|
|||
|
Net income attributable to controlling interests
|
870,120
|
|
631,308
|
|
1,830,613
|
|
||||||
|
Common Share distributions
|
(804,825
|
)
|
(723,782
|
)
|
(666,565
|
)
|
||||||
|
Preferred Share distributions
|
(3,357
|
)
|
(4,145
|
)
|
(4,145
|
)
|
||||||
|
Premium on redemption of Preferred Shares – cash charge
|
(3,486
|
)
|
—
|
|
—
|
|
||||||
|
Balance, end of year
|
$
|
2,009,091
|
|
$
|
1,950,639
|
|
$
|
2,047,258
|
|
|||
See accompanying notes
F-13
EQUITY RESIDENTIAL
CONSOLIDATED STATEMENTS OF CHANGES IN EQUITY (Continued)
(Amounts in thousands)
|
|
Year Ended December 31,
|
|||||||||||
|
SHAREHOLDERS’ EQUITY (continued)
|
2015
|
2014
|
2013
|
|||||||||
|
ACCUMULATED OTHER COMPREHENSIVE (LOSS)
|
|
|
|
|
|
|
||||||
|
Balance, beginning of year
|
$
|
(172,152
|
)
|
$
|
(155,162
|
)
|
$
|
(193,148
|
)
|
|||
|
Accumulated other comprehensive income (loss) – derivative instruments:
|
|
|
|
|
|
|
||||||
|
Unrealized holding gains (losses) arising during the year
|
2,219
|
|
(33,306
|
)
|
18,771
|
|
||||||
|
Losses reclassified into earnings from other comprehensive income
|
18,244
|
|
16,868
|
|
20,141
|
|
||||||
|
Accumulated other comprehensive income (loss) – other instruments:
|
|
|
|
|
|
|
||||||
|
Unrealized holding gains arising during the year
|
—
|
|
—
|
|
583
|
|
||||||
|
(Gains) realized during the year
|
—
|
|
—
|
|
(2,122
|
)
|
||||||
|
Accumulated other comprehensive (loss) income – foreign currency:
|
||||||||||||
|
Currency translation adjustments arising during the year
|
(327
|
)
|
(552
|
)
|
613
|
|
||||||
|
Balance, end of year
|
$
|
(152,016
|
)
|
$
|
(172,152
|
)
|
$
|
(155,162
|
)
|
|||
|
NONCONTROLLING INTERESTS
|
|
|
|
|
|
|
||||||
|
OPERATING PARTNERSHIP
|
|
|
|
|
|
|
||||||
|
Balance, beginning of year
|
$
|
214,411
|
|
$
|
211,412
|
|
$
|
159,606
|
|
|||
|
Issuance of restricted units to Noncontrolling Interests
|
3
|
|
3
|
|
5
|
|
||||||
|
Conversion of OP Units held by Noncontrolling Interests into OP Units held
by General Partner |
(4,966
|
)
|
(2,365
|
)
|
(1,699
|
)
|
||||||
|
Conversion of restricted shares to restricted units
|
70
|
|
—
|
|
—
|
|
||||||
|
Equity compensation associated with Noncontrolling Interests
|
21,503
|
|
11,969
|
|
13,609
|
|
||||||
|
Net income attributable to Noncontrolling Interests
|
34,241
|
|
24,831
|
|
75,278
|
|
||||||
|
Distributions to Noncontrolling Interests
|
(31,604
|
)
|
(28,676
|
)
|
(26,277
|
)
|
||||||
|
Change in carrying value of Redeemable Noncontrolling Interests – Operating
Partnership |
(1,672
|
)
|
2,229
|
|
(44,439
|
)
|
||||||
|
Adjustment for Noncontrolling Interests ownership in Operating Partnership
|
(10,607
|
)
|
(4,992
|
)
|
35,329
|
|
||||||
|
Balance, end of year
|
$
|
221,379
|
|
$
|
214,411
|
|
$
|
211,412
|
|
|||
|
PARTIALLY OWNED PROPERTIES
|
|
|
|
|
|
|
||||||
|
Balance, beginning of year
|
$
|
124,909
|
|
$
|
126,583
|
|
$
|
77,688
|
|
|||
|
Net income (loss) attributable to Noncontrolling Interests
|
3,657
|
|
2,544
|
|
(538
|
)
|
||||||
|
Contributions by Noncontrolling Interests
|
—
|
|
5,684
|
|
27,660
|
|
||||||
|
Distributions to Noncontrolling Interests
|
(6,608
|
)
|
(7,827
|
)
|
(6,490
|
)
|
||||||
|
Acquisition of Archstone
|
—
|
|
—
|
|
28,263
|
|
||||||
|
Acquisition of Noncontrolling Interests – Partially Owned Properties
|
—
|
|
(2,244
|
)
|
—
|
|
||||||
|
Deconsolidation of previously consolidated Noncontrolling Interests
|
(117,350
|
)
|
—
|
|
—
|
|
||||||
|
Other
|
—
|
|
169
|
|
—
|
|
||||||
|
Balance, end of year
|
$
|
4,608
|
|
$
|
124,909
|
|
$
|
126,583
|
|
|||
See accompanying notes
F-14
ERP OPERATING LIMITED PARTNERSHIP
CONSOLIDATED BALANCE SHEETS
(Amounts in thousands)
|
December 31, 2015
|
December 31, 2014
|
|||||||
|
ASSETS
|
||||||||
|
Investment in real estate
|
|
|
|
|
||||
|
Land
|
$
|
5,864,046
|
|
$
|
6,295,404
|
|
||
|
Depreciable property
|
18,027,087
|
|
19,851,504
|
|
||||
|
Projects under development
|
1,122,376
|
|
1,343,919
|
|
||||
|
Land held for development
|
168,843
|
|
184,556
|
|
||||
|
Investment in real estate
|
25,182,352
|
|
27,675,383
|
|
||||
|
Accumulated depreciation
|
(4,905,406
|
)
|
(5,432,805
|
)
|
||||
|
Investment in real estate, net
|
20,276,946
|
|
22,242,578
|
|
||||
|
Real estate held for sale
|
2,181,135
|
|
—
|
|
||||
|
Cash and cash equivalents
|
42,276
|
|
40,080
|
|
||||
|
Investments in unconsolidated entities
|
68,101
|
|
105,434
|
|
||||
|
Deposits – restricted
|
55,893
|
|
72,303
|
|
||||
|
Escrow deposits – mortgage
|
56,946
|
|
48,085
|
|
||||
|
Deferred financing costs, net
|
54,004
|
|
58,380
|
|
||||
|
Other assets
|
422,027
|
|
383,754
|
|
||||
|
Total assets
|
$
|
23,157,328
|
|
$
|
22,950,614
|
|
||
|
LIABILITIES AND CAPITAL
|
||||||||
|
Liabilities:
|
|
|
|
|
||||
|
Mortgage notes payable
|
$
|
4,704,870
|
|
$
|
5,086,515
|
|
||
|
Notes, net
|
5,876,352
|
|
5,425,346
|
|
||||
|
Line of credit and commercial paper
|
387,276
|
|
333,000
|
|
||||
|
Accounts payable and accrued expenses
|
187,124
|
|
153,590
|
|
||||
|
Accrued interest payable
|
85,221
|
|
89,540
|
|
||||
|
Other liabilities
|
366,387
|
|
389,915
|
|
||||
|
Security deposits
|
77,582
|
|
75,633
|
|
||||
|
Distributions payable
|
209,378
|
|
188,566
|
|
||||
|
Total liabilities
|
11,894,190
|
|
11,742,105
|
|
||||
|
Commitments and contingencies
|
|
|
|
|
||||
|
Redeemable Limited Partners
|
566,783
|
|
500,733
|
|
||||
|
Capital:
|
|
|
|
|
||||
|
Partners' Capital:
|
|
|
|
|
||||
|
Preference Units
|
37,280
|
|
50,000
|
|
||||
|
General Partner
|
10,585,104
|
|
10,490,608
|
|
||||
|
Limited Partners
|
221,379
|
|
214,411
|
|
||||
|
Accumulated other comprehensive (loss)
|
(152,016
|
)
|
(172,152
|
)
|
||||
|
Total partners' capital
|
10,691,747
|
|
10,582,867
|
|
||||
|
Noncontrolling Interests – Partially Owned Properties
|
4,608
|
|
124,909
|
|
||||
|
Total capital
|
10,696,355
|
|
10,707,776
|
|
||||
|
Total liabilities and capital
|
$
|
23,157,328
|
|
$
|
22,950,614
|
|
||
See accompanying notes
F-15
ERP OPERATING LIMITED PARTNERSHIP
CONSOLIDATED STATEMENTS OF OPERATIONS AND COMPREHENSIVE INCOME
(Amounts in thousands except per Unit data)
|
|
Year Ended December 31,
|
|||||||||||
|
|
2015
|
2014
|
2013
|
|||||||||
|
REVENUES
|
|
|
||||||||||
|
Rental income
|
$
|
2,736,578
|
|
$
|
2,605,311
|
|
$
|
2,378,004
|
|
|||
|
Fee and asset management
|
8,387
|
|
9,437
|
|
9,698
|
|
||||||
|
Total revenues
|
2,744,965
|
|
2,614,748
|
|
2,387,702
|
|
||||||
|
EXPENSES
|
|
|
|
|
|
|
||||||
|
Property and maintenance
|
479,160
|
|
473,098
|
|
449,427
|
|
||||||
|
Real estate taxes and insurance
|
339,802
|
|
325,401
|
|
293,999
|
|
||||||
|
Property management
|
81,185
|
|
79,636
|
|
84,342
|
|
||||||
|
Fee and asset management
|
5,021
|
|
5,429
|
|
6,460
|
|
||||||
|
Depreciation
|
765,895
|
|
758,861
|
|
978,973
|
|
||||||
|
General and administrative
|
65,082
|
|
50,948
|
|
62,179
|
|
||||||
|
Total expenses
|
1,736,145
|
|
1,693,373
|
|
1,875,380
|
|
||||||
|
Operating income
|
1,008,820
|
|
921,375
|
|
512,322
|
|
||||||
|
Interest and other income
|
7,372
|
|
4,462
|
|
5,283
|
|
||||||
|
Other expenses
|
(2,942
|
)
|
(9,073
|
)
|
(29,630
|
)
|
||||||
|
Interest:
|
|
|
|
|
|
|
||||||
|
Expense incurred, net
|
(444,069
|
)
|
(457,191
|
)
|
(586,854
|
)
|
||||||
|
Amortization of deferred financing costs
|
(10,801
|
)
|
(11,088
|
)
|
(22,197
|
)
|
||||||
|
Income (loss) before income and other taxes, income (loss) from investments
in unconsolidated entities, net gain (loss) on sales of real estate properties and land parcels and discontinued operations |
558,380
|
|
448,485
|
|
(121,076
|
)
|
||||||
|
Income and other tax (expense) benefit
|
(917
|
)
|
(1,394
|
)
|
(1,169
|
)
|
||||||
|
Income (loss) from investments in unconsolidated entities
|
15,025
|
|
(7,952
|
)
|
(58,156
|
)
|
||||||
|
Net gain on sales of real estate properties
|
335,134
|
|
212,685
|
|
—
|
|
||||||
|
Net (loss) gain on sales of land parcels
|
(1
|
)
|
5,277
|
|
12,227
|
|
||||||
|
Income (loss) from continuing operations
|
907,621
|
|
657,101
|
|
(168,174
|
)
|
||||||
|
Discontinued operations, net
|
397
|
|
1,582
|
|
2,073,527
|
|
||||||
|
Net income
|
908,018
|
|
658,683
|
|
1,905,353
|
|
||||||
|
Net (income) loss attributable to Noncontrolling Interests – Partially
Owned Properties |
(3,657
|
)
|
(2,544
|
)
|
538
|
|
||||||
|
Net income attributable to controlling interests
|
$
|
904,361
|
|
$
|
656,139
|
|
$
|
1,905,891
|
|
|||
|
ALLOCATION OF NET INCOME:
|
||||||||||||
|
Preference Units
|
$
|
3,357
|
|
$
|
4,145
|
|
$
|
4,145
|
|
|||
|
Premium on redemption of Preference Units
|
$
|
3,486
|
|
$
|
—
|
|
$
|
—
|
|
|||
|
General Partner
|
$
|
863,277
|
|
$
|
627,163
|
|
$
|
1,826,468
|
|
|||
|
Limited Partners
|
34,241
|
|
24,831
|
|
75,278
|
|
||||||
|
Net income available to Units
|
$
|
897,518
|
|
$
|
651,994
|
|
$
|
1,901,746
|
|
|||
|
Earnings per Unit – basic:
|
|
|
|
|
|
|
||||||
|
Income (loss) from continuing operations available to Units
|
$
|
2.37
|
|
$
|
1.73
|
|
$
|
(0.47
|
)
|
|||
|
Net income available to Units
|
$
|
2.37
|
|
$
|
1.74
|
|
$
|
5.16
|
|
|||
|
Weighted average Units outstanding
|
377,074
|
|
374,899
|
|
368,038
|
|
||||||
|
Earnings per Unit – diluted:
|
|
|
|
|
|
|
||||||
|
Income (loss) from continuing operations available to Units
|
$
|
2.36
|
|
$
|
1.72
|
|
$
|
(0.47
|
)
|
|||
|
Net income available to Units
|
$
|
2.36
|
|
$
|
1.73
|
|
$
|
5.16
|
|
|||
|
Weighted average Units outstanding
|
380,620
|
|
377,735
|
|
368,038
|
|
||||||
|
Distributions declared per Unit outstanding
|
$
|
2.21
|
|
$
|
2.00
|
|
$
|
1.85
|
|
|||
See accompanying notes
F-16
ERP OPERATING LIMITED PARTNERSHIP
CONSOLIDATED STATEMENTS OF OPERATIONS AND COMPREHENSIVE INCOME (Continued)
(Amounts in thousands except per Unit data)
|
|
Year Ended December 31,
|
|||||||||||
|
|
2015
|
2014
|
2013
|
|||||||||
|
Comprehensive income:
|
|
|
|
|
|
|
||||||
|
Net income
|
$
|
908,018
|
|
$
|
658,683
|
|
$
|
1,905,353
|
|
|||
|
Other comprehensive income (loss):
|
||||||||||||
|
Other comprehensive income (loss) – derivative instruments:
|
|
|
|
|
|
|
||||||
|
Unrealized holding gains (losses) arising during the year
|
2,219
|
|
(33,306
|
)
|
18,771
|
|
||||||
|
Losses reclassified into earnings from other comprehensive income
|
18,244
|
|
16,868
|
|
20,141
|
|
||||||
|
Other comprehensive income (loss) – other instruments:
|
|
|
|
|
|
|
||||||
|
Unrealized holding gains arising during the year
|
—
|
|
—
|
|
583
|
|
||||||
|
(Gains) realized during the year
|
—
|
|
—
|
|
(2,122
|
)
|
||||||
|
Other comprehensive (loss) income – foreign currency:
|
||||||||||||
|
Currency translation adjustments arising during the year
|
(327
|
)
|
(552
|
)
|
613
|
|
||||||
|
Other comprehensive income (loss)
|
20,136
|
|
(16,990
|
)
|
37,986
|
|
||||||
|
Comprehensive income
|
928,154
|
|
641,693
|
|
1,943,339
|
|
||||||
|
Comprehensive (income) loss attributable to Noncontrolling Interests –
Partially Owned Properties |
(3,657
|
)
|
(2,544
|
)
|
538
|
|
||||||
|
Comprehensive income attributable to controlling interests
|
$
|
924,497
|
|
$
|
639,149
|
|
$
|
1,943,877
|
|
|||
See accompanying notes
F-17
ERP OPERATING LIMITED PARTNERSHIP
CONSOLIDATED STATEMENTS OF CASH FLOWS
(Amounts in thousands)
|
|
Year Ended December 31,
|
|||||||||||
|
|
2015
|
2014
|
2013
|
|||||||||
|
CASH FLOWS FROM OPERATING ACTIVITIES:
|
|
|
|
|
|
|
||||||
|
Net income
|
$
|
908,018
|
|
$
|
658,683
|
|
$
|
1,905,353
|
|
|||
|
Adjustments to reconcile net income to net cash provided by operating activities:
|
|
|
|
|
|
|
||||||
|
Depreciation
|
765,895
|
|
758,861
|
|
1,013,353
|
|
||||||
|
Amortization of deferred financing costs
|
10,801
|
|
11,088
|
|
22,425
|
|
||||||
|
Amortization of above/below market leases
|
3,382
|
|
3,222
|
|
898
|
|
||||||
|
Amortization of discounts and premiums on debt
|
(9,492
|
)
|
(13,520
|
)
|
(156,439
|
)
|
||||||
|
Amortization of deferred settlements on derivative instruments
|
18,075
|
|
16,334
|
|
19,607
|
|
||||||
|
Write-off of pursuit costs
|
3,208
|
|
3,607
|
|
5,184
|
|
||||||
|
(Income) loss from investments in unconsolidated entities
|
(15,025
|
)
|
7,952
|
|
58,156
|
|
||||||
|
Distributions from unconsolidated entities – return on capital
|
4,741
|
|
5,570
|
|
2,481
|
|
||||||
|
Net (gain) on sales of investment securities and other investments
|
(526
|
)
|
(57
|
)
|
(4,203
|
)
|
||||||
|
Net (gain) on sales of real estate properties
|
(335,134
|
)
|
(212,685
|
)
|
—
|
|
||||||
|
Net loss (gain) on sales of land parcels
|
1
|
|
(5,277
|
)
|
(12,227
|
)
|
||||||
|
Net (gain) on sales of discontinued operations
|
—
|
|
(179
|
)
|
(2,036,505
|
)
|
||||||
|
Realized/unrealized loss (gain) on derivative instruments
|
3,055
|
|
(60
|
)
|
70
|
|
||||||
|
Compensation paid with Company Common Shares
|
34,607
|
|
27,543
|
|
35,474
|
|
||||||
|
Changes in assets and liabilities:
|
|
|
|
|
|
|
||||||
|
(Increase) decrease in deposits – restricted
|
(1,794
|
)
|
(1,740
|
)
|
3,684
|
|
||||||
|
Decrease in mortgage deposits
|
258
|
|
1,452
|
|
1,813
|
|
||||||
|
(Increase) decrease in other assets
|
(41,803
|
)
|
21,773
|
|
3,742
|
|
||||||
|
(Decrease) increase in accounts payable and accrued expenses
|
(1,667
|
)
|
17,797
|
|
6,229
|
|
||||||
|
(Decrease) increase in accrued interest payable
|
(4,319
|
)
|
11,231
|
|
(9,219
|
)
|
||||||
|
Increase in other liabilities
|
12,269
|
|
8,437
|
|
15,401
|
|
||||||
|
Increase (decrease) in security deposits
|
1,949
|
|
4,041
|
|
(6,361
|
)
|
||||||
|
Net cash provided by operating activities
|
1,356,499
|
|
1,324,073
|
|
868,916
|
|
||||||
|
CASH FLOWS FROM INVESTING ACTIVITIES:
|
|
|
|
|
|
|
||||||
|
Acquisition of Archstone, net of cash acquired
|
—
|
|
—
|
|
(4,000,875
|
)
|
||||||
|
Investment in real estate – acquisitions
|
(331,336
|
)
|
(469,989
|
)
|
(108,308
|
)
|
||||||
|
Investment in real estate – development/other
|
(653,897
|
)
|
(530,387
|
)
|
(377,442
|
)
|
||||||
|
Capital expenditures to real estate
|
(182,113
|
)
|
(185,957
|
)
|
(135,816
|
)
|
||||||
|
Non-real estate capital additions
|
(3,991
|
)
|
(5,286
|
)
|
(4,134
|
)
|
||||||
|
Interest capitalized for real estate and unconsolidated entities under development
|
(59,885
|
)
|
(52,782
|
)
|
(47,321
|
)
|
||||||
|
Proceeds from disposition of real estate, net
|
504,748
|
|
522,647
|
|
4,551,454
|
|
||||||
|
Investments in unconsolidated entities
|
(23,019
|
)
|
(15,768
|
)
|
(66,471
|
)
|
||||||
|
Distributions from unconsolidated entities – return of capital
|
51,144
|
|
103,793
|
|
25,471
|
|
||||||
|
Proceeds from sale of investment securities and other investments
|
2,535
|
|
57
|
|
4,878
|
|
||||||
|
Decrease in deposits on real estate acquisitions and investments, net
|
17,874
|
|
33,004
|
|
143,694
|
|
||||||
|
(Increase) decrease in mortgage deposits
|
(531
|
)
|
798
|
|
7,893
|
|
||||||
|
Consolidation of previously unconsolidated properties
|
—
|
|
(44,796
|
)
|
—
|
|
||||||
|
Net cash (used for) investing activities
|
(678,471
|
)
|
(644,666
|
)
|
(6,977
|
)
|
||||||
See accompanying notes
F-18
ERP OPERATING LIMITED PARTNERSHIP
CONSOLIDATED STATEMENTS OF CASH FLOWS (Continued)
(Amounts in thousands)
|
|
Year Ended December 31,
|
|||||||||||
|
|
2015
|
2014
|
2013
|
|||||||||
|
CASH FLOWS FROM FINANCING ACTIVITIES:
|
|
|
|
|
|
|
||||||
|
Debt financing costs
|
$
|
(6,425
|
)
|
$
|
(10,982
|
)
|
$
|
(16,526
|
)
|
|||
|
Mortgage deposits
|
(8,588
|
)
|
(7,699
|
)
|
(5,631
|
)
|
||||||
|
Mortgage notes payable:
|
|
|
|
|
|
|
||||||
|
Proceeds
|
—
|
|
—
|
|
902,886
|
|
||||||
|
Lump sum payoffs
|
(359,244
|
)
|
(88,788
|
)
|
(2,532,682
|
)
|
||||||
|
Scheduled principal repayments
|
(9,275
|
)
|
(11,869
|
)
|
(12,658
|
)
|
||||||
|
Notes, net:
|
|
|
|
|
|
|
||||||
|
Proceeds
|
746,391
|
|
1,194,277
|
|
1,245,550
|
|
||||||
|
Lump sum payoffs
|
(300,000
|
)
|
(1,250,000
|
)
|
(400,000
|
)
|
||||||
|
Line of credit and commercial paper:
|
|
|
|
|
|
|
||||||
|
Line of credit proceeds
|
3,770,000
|
|
7,167,000
|
|
9,832,000
|
|
||||||
|
Line of credit repayments
|
(4,103,000
|
)
|
(6,949,000
|
)
|
(9,717,000
|
)
|
||||||
|
Commercial paper proceeds
|
3,931,227
|
|
—
|
|
—
|
|
||||||
|
Commercial paper repayments
|
(3,545,028
|
)
|
—
|
|
—
|
|
||||||
|
(Payments on) settlement of derivative instruments
|
(13,938
|
)
|
(758
|
)
|
(44,063
|
)
|
||||||
|
Proceeds from EQR's Employee Share Purchase Plan (ESPP)
|
4,404
|
|
3,392
|
|
3,401
|
|
||||||
|
Proceeds from exercise of EQR options
|
59,508
|
|
82,573
|
|
17,252
|
|
||||||
|
OP units repurchased and retired
|
—
|
|
(1,777
|
)
|
—
|
|
||||||
|
Redemption of Preference Units
|
(12,720
|
)
|
—
|
|
—
|
|
||||||
|
Premium on redemption of Preference Units
|
(3,486
|
)
|
—
|
|
—
|
|
||||||
|
Payment of offering costs
|
(79
|
)
|
(41
|
)
|
(1,047
|
)
|
||||||
|
Other financing activities, net
|
(49
|
)
|
(49
|
)
|
(48
|
)
|
||||||
|
Acquisition of Noncontrolling Interests – Partially Owned Properties
|
—
|
|
(5,501
|
)
|
—
|
|
||||||
|
Contributions – Noncontrolling Interests – Partially Owned Properties
|
—
|
|
5,684
|
|
27,660
|
|
||||||
|
Contributions – Limited Partners
|
3
|
|
3
|
|
5
|
|
||||||
|
Distributions:
|
|
|
|
|
|
|
||||||
|
OP Units – General Partner
|
(784,748
|
)
|
(776,659
|
)
|
(681,610
|
)
|
||||||
|
Preference Units
|
(3,357
|
)
|
(4,145
|
)
|
(4,145
|
)
|
||||||
|
OP Units – Limited Partners
|
(30,869
|
)
|
(30,744
|
)
|
(27,897
|
)
|
||||||
|
Noncontrolling Interests – Partially Owned Properties
|
(6,559
|
)
|
(7,778
|
)
|
(6,442
|
)
|
||||||
|
Net cash (used for) financing activities
|
(675,832
|
)
|
(692,861
|
)
|
(1,420,995
|
)
|
||||||
|
Net increase (decrease) in cash and cash equivalents
|
2,196
|
|
(13,454
|
)
|
(559,056
|
)
|
||||||
|
Cash and cash equivalents, beginning of year
|
40,080
|
|
53,534
|
|
612,590
|
|
||||||
|
Cash and cash equivalents, end of year
|
$
|
42,276
|
|
$
|
40,080
|
|
$
|
53,534
|
|
|||
See accompanying notes
F-19
ERP OPERATING LIMITED PARTNERSHIP
CONSOLIDATED STATEMENTS OF CASH FLOWS (Continued)
(Amounts in thousands)
|
|
Year Ended December 31,
|
|||||||||||
|
|
2015
|
2014
|
2013
|
|||||||||
|
SUPPLEMENTAL INFORMATION:
|
|
|
|
|
|
|
||||||
|
Cash paid for interest, net of amounts capitalized
|
$
|
436,748
|
|
$
|
443,125
|
|
$
|
722,963
|
|
|||
|
Net cash paid for income and other taxes
|
$
|
1,264
|
|
$
|
1,517
|
|
$
|
1,152
|
|
|||
|
Real estate acquisitions/dispositions/other:
|
|
|
|
|
|
|
||||||
|
Mortgage loans assumed
|
$
|
—
|
|
$
|
28,910
|
|
$
|
—
|
|
|||
|
Amortization of deferred financing costs:
|
|
|
|
|
|
|
||||||
|
Investment in real estate, net
|
$
|
—
|
|
$
|
—
|
|
$
|
(152
|
)
|
|||
|
Deferred financing costs, net
|
$
|
10,801
|
|
$
|
11,088
|
|
$
|
22,577
|
|
|||
|
Amortization of discounts and premiums on debt:
|
|
|
|
|
|
|
||||||
|
Mortgage notes payable
|
$
|
(13,126
|
)
|
$
|
(15,904
|
)
|
$
|
(158,625
|
)
|
|||
|
Notes, net
|
$
|
2,557
|
|
$
|
2,384
|
|
$
|
2,186
|
|
|||
|
Line of credit and commercial paper
|
$
|
1,077
|
|
$
|
—
|
|
$
|
—
|
|
|||
|
Amortization of deferred settlements on derivative instruments:
|
|
|
|
|
|
|
||||||
|
Other liabilities
|
$
|
(169
|
)
|
$
|
(534
|
)
|
$
|
(534
|
)
|
|||
|
Accumulated other comprehensive income
|
$
|
18,244
|
|
$
|
16,868
|
|
$
|
20,141
|
|
|||
|
Write-off of pursuit costs:
|
||||||||||||
|
Investment in real estate, net
|
$
|
2,804
|
|
$
|
2,541
|
|
$
|
4,956
|
|
|||
|
Deposits – restricted
|
$
|
330
|
|
$
|
—
|
|
$
|
25
|
|
|||
|
Other assets
|
$
|
74
|
|
$
|
1,066
|
|
$
|
203
|
|
|||
|
(Income) loss from investments in unconsolidated entities:
|
||||||||||||
|
Investments in unconsolidated entities
|
$
|
(17,340
|
)
|
$
|
4,610
|
|
$
|
53,066
|
|
|||
|
Other liabilities
|
$
|
2,315
|
|
$
|
3,342
|
|
$
|
5,090
|
|
|||
|
Distributions from unconsolidated entities – return on capital:
|
||||||||||||
|
Investments in unconsolidated entities
|
$
|
4,606
|
|
$
|
5,360
|
|
$
|
2,448
|
|
|||
|
Other liabilities
|
$
|
135
|
|
$
|
210
|
|
$
|
33
|
|
|||
|
Realized/unrealized loss (gain) on derivative instruments:
|
|
|
|
|
|
|
||||||
|
Other assets
|
$
|
(3,573
|
)
|
$
|
10,160
|
|
$
|
(17,139
|
)
|
|||
|
Notes, net
|
$
|
2,058
|
|
$
|
1,597
|
|
$
|
(1,523
|
)
|
|||
|
Other liabilities
|
$
|
2,351
|
|
$
|
21,489
|
|
$
|
(39
|
)
|
|||
|
Accumulated other comprehensive income
|
$
|
2,219
|
|
$
|
(33,306
|
)
|
$
|
18,771
|
|
|||
|
Acquisition of Archstone, net of cash acquired:
|
||||||||||||
|
Investment in real estate, net
|
$
|
—
|
|
$
|
39,929
|
|
$
|
(8,687,355
|
)
|
|||
|
Investments in unconsolidated entities
|
$
|
—
|
|
$
|
(33,993
|
)
|
$
|
(225,568
|
)
|
|||
|
Deposits – restricted
|
$
|
—
|
|
$
|
—
|
|
$
|
(528
|
)
|
|||
|
Escrow deposits – mortgage
|
$
|
—
|
|
$
|
—
|
|
$
|
(37,582
|
)
|
|||
|
Deferred financing costs, net
|
$
|
—
|
|
$
|
—
|
|
$
|
(25,780
|
)
|
|||
|
Other assets
|
$
|
—
|
|
$
|
(2,586
|
)
|
$
|
(215,622
|
)
|
|||
|
Mortgage notes payable
|
$
|
—
|
|
$
|
—
|
|
$
|
3,076,876
|
|
|||
|
Accounts payable and accrued expenses
|
$
|
—
|
|
$
|
(146
|
)
|
$
|
16,984
|
|
|||
|
Accrued interest payable
|
$
|
—
|
|
$
|
—
|
|
$
|
11,305
|
|
|||
|
Other liabilities
|
$
|
—
|
|
$
|
(3,204
|
)
|
$
|
117,299
|
|
|||
|
Security deposits
|
$
|
—
|
|
$
|
—
|
|
$
|
10,965
|
|
|||
|
Issuance of OP Units
|
$
|
—
|
|
$
|
—
|
|
$
|
1,929,868
|
|
|||
|
Noncontrolling Interests – Partially Owned Properties
|
$
|
—
|
|
$
|
—
|
|
$
|
28,263
|
|
|||
|
Interest capitalized for real estate and unconsolidated entities under development:
|
||||||||||||
|
Investment in real estate, net
|
$
|
(59,885
|
)
|
$
|
(52,717
|
)
|
$
|
(45,533
|
)
|
|||
|
Investments in unconsolidated entities
|
$
|
—
|
|
$
|
(65
|
)
|
$
|
(1,788
|
)
|
|||
|
Investments in unconsolidated entities:
|
||||||||||||
|
Investments in unconsolidated entities
|
$
|
(1,404
|
)
|
$
|
(6,318
|
)
|
$
|
(13,656
|
)
|
|||
|
Other liabilities
|
$
|
(21,615
|
)
|
$
|
(9,450
|
)
|
$
|
(52,815
|
)
|
|||
See accompanying notes
F-20
ERP OPERATING LIMITED PARTNERSHIP
CONSOLIDATED STATEMENTS OF CASH FLOWS (Continued)
(Amounts in thousands)
|
|
Year Ended December 31,
|
|||||||||||
|
|
2015
|
2014
|
2013
|
|||||||||
|
SUPPLEMENTAL INFORMATION (continued):
|
||||||||||||
|
Consolidation of previously unconsolidated properties:
|
||||||||||||
|
Investment in real estate, net
|
$
|
—
|
|
$
|
(64,319
|
)
|
$
|
—
|
|
|||
|
Investments in unconsolidated entities
|
$
|
—
|
|
$
|
(847
|
)
|
$
|
—
|
|
|||
|
Accounts payable and accrued expenses
|
$
|
—
|
|
$
|
1,987
|
|
$
|
—
|
|
|||
|
Other liabilities
|
$
|
—
|
|
$
|
18,383
|
|
$
|
—
|
|
|||
|
(Payments on) settlement of derivative instruments:
|
||||||||||||
|
Other assets
|
$
|
1,848
|
|
$
|
6,623
|
|
$
|
(50
|
)
|
|||
|
Other liabilities
|
$
|
(15,786
|
)
|
$
|
(7,381
|
)
|
$
|
(44,013
|
)
|
|||
|
Other:
|
||||||||||||
|
Foreign currency translation adjustments
|
$
|
327
|
|
$
|
552
|
|
$
|
(613
|
)
|
|||
See accompanying notes
F-21
ERP OPERATING LIMITED PARTNERSHIP
CONSOLIDATED STATEMENTS OF CHANGES IN CAPITAL
(Amounts in thousands)
|
|
Year Ended December 31,
|
|||||||||||
|
PARTNERS' CAPITAL
|
2015
|
2014
|
2013
|
|||||||||
|
PREFERENCE UNITS
|
|
|
|
|
|
|
||||||
|
Balance, beginning of year
|
$
|
50,000
|
|
$
|
50,000
|
|
$
|
50,000
|
|
|||
|
Partial redemption of 8.29% Series K Cumulative Redeemable
|
(12,720
|
)
|
—
|
|
—
|
|
||||||
|
Balance, end of year
|
$
|
37,280
|
|
$
|
50,000
|
|
$
|
50,000
|
|
|||
|
GENERAL PARTNER
|
|
|
|
|
|
|
||||||
|
Balance, beginning of year
|
$
|
10,490,608
|
|
$
|
10,612,363
|
|
$
|
7,432,961
|
|
|||
|
OP Unit Issuance:
|
|
|
|
|
|
|
||||||
|
Conversion of OP Units held by Limited Partners into OP Units held by
General Partner |
4,966
|
|
2,365
|
|
1,699
|
|
||||||
|
Issuance of OP Units
|
—
|
|
—
|
|
1,929,868
|
|
||||||
|
Exercise of EQR share options
|
59,508
|
|
82,573
|
|
17,252
|
|
||||||
|
EQR's Employee Share Purchase Plan (ESPP)
|
4,404
|
|
3,392
|
|
3,401
|
|
||||||
|
Conversion of EQR restricted shares to restricted units
|
(70
|
)
|
—
|
|
—
|
|
||||||
|
Share-based employee compensation expense:
|
|
|
|
|
|
|
||||||
|
EQR restricted shares
|
15,066
|
|
9,904
|
|
13,264
|
|
||||||
|
EQR share options
|
3,756
|
|
7,349
|
|
10,514
|
|
||||||
|
EQR ESPP discount
|
884
|
|
859
|
|
632
|
|
||||||
|
OP Units repurchased and retired
|
—
|
|
(1,777
|
)
|
—
|
|
||||||
|
Net income available to Units – General Partner
|
863,277
|
|
627,163
|
|
1,826,468
|
|
||||||
|
OP Units – General Partner distributions
|
(804,825
|
)
|
(723,782
|
)
|
(666,565
|
)
|
||||||
|
Offering costs
|
(79
|
)
|
(41
|
)
|
(1,047
|
)
|
||||||
|
Supplemental Executive Retirement Plan (SERP)
|
1,380
|
|
7,374
|
|
(422
|
)
|
||||||
|
Acquisition of Noncontrolling Interests – Partially Owned Properties
|
—
|
|
(2,308
|
)
|
—
|
|
||||||
|
Change in market value of Redeemable Limited Partners
|
(64,378
|
)
|
(139,818
|
)
|
79,667
|
|
||||||
|
Adjustment for Limited Partners ownership in Operating Partnership
|
10,607
|
|
4,992
|
|
(35,329
|
)
|
||||||
|
Balance, end of year
|
$
|
10,585,104
|
|
$
|
10,490,608
|
|
$
|
10,612,363
|
|
|||
|
LIMITED PARTNERS
|
||||||||||||
|
Balance, beginning of year
|
$
|
214,411
|
|
$
|
211,412
|
|
$
|
159,606
|
|
|||
|
Issuance of restricted units to Limited Partners
|
3
|
|
3
|
|
5
|
|
||||||
|
Conversion of OP Units held by Limited Partners into OP Units held by
General Partner |
(4,966
|
)
|
(2,365
|
)
|
(1,699
|
)
|
||||||
|
Conversion of EQR restricted shares to restricted units
|
70
|
|
—
|
|
—
|
|
||||||
|
Equity compensation associated with Units – Limited Partners
|
21,503
|
|
11,969
|
|
13,609
|
|
||||||
|
Net income available to Units – Limited Partners
|
34,241
|
|
24,831
|
|
75,278
|
|
||||||
|
Units – Limited Partners distributions
|
(31,604
|
)
|
(28,676
|
)
|
(26,277
|
)
|
||||||
|
Change in carrying value of Redeemable Limited Partners
|
(1,672
|
)
|
2,229
|
|
(44,439
|
)
|
||||||
|
Adjustment for Limited Partners ownership in Operating Partnership
|
(10,607
|
)
|
(4,992
|
)
|
35,329
|
|
||||||
|
Balance, end of year
|
$
|
221,379
|
|
$
|
214,411
|
|
$
|
211,412
|
|
|||
|
ACCUMULATED OTHER COMPREHENSIVE (LOSS)
|
|
|
|
|
|
|
||||||
|
Balance, beginning of year
|
$
|
(172,152
|
)
|
$
|
(155,162
|
)
|
$
|
(193,148
|
)
|
|||
|
Accumulated other comprehensive income (loss) – derivative instruments:
|
|
|
|
|
|
|
||||||
|
Unrealized holding gains (losses) arising during the year
|
2,219
|
|
(33,306
|
)
|
18,771
|
|
||||||
|
Losses reclassified into earnings from other comprehensive income
|
18,244
|
|
16,868
|
|
20,141
|
|
||||||
|
Accumulated other comprehensive income (loss) – other instruments:
|
|
|
|
|
|
|
||||||
|
Unrealized holding gains arising during the year
|
—
|
|
—
|
|
583
|
|
||||||
|
(Gains) realized during the year
|
—
|
|
—
|
|
(2,122
|
)
|
||||||
|
Accumulated other comprehensive (loss) income – foreign currency:
|
||||||||||||
|
Currency translation adjustments arising during the year
|
(327
|
)
|
(552
|
)
|
613
|
|
||||||
|
Balance, end of year
|
$
|
(152,016
|
)
|
$
|
(172,152
|
)
|
$
|
(155,162
|
)
|
|||
See accompanying notes
F-22
ERP OPERATING LIMITED PARTNERSHIP
CONSOLIDATED STATEMENTS OF CHANGES IN CAPITAL (Continued)
(Amounts in thousands)
|
|
Year Ended December 31,
|
|||||||||||
|
2015
|
2014
|
2013
|
||||||||||
|
NONCONTROLLING INTERESTS
|
|
|
|
|
|
|
||||||
|
NONCONTROLLING INTERESTS – PARTIALLY OWNED PROPERTIES
|
|
|
|
|
|
|
||||||
|
Balance, beginning of year
|
$
|
124,909
|
|
$
|
126,583
|
|
$
|
77,688
|
|
|||
|
Net income (loss) attributable to Noncontrolling Interests
|
3,657
|
|
2,544
|
|
(538
|
)
|
||||||
|
Contributions by Noncontrolling Interests
|
—
|
|
5,684
|
|
27,660
|
|
||||||
|
Distributions to Noncontrolling Interests
|
(6,608
|
)
|
(7,827
|
)
|
(6,490
|
)
|
||||||
|
Acquisition of Archstone
|
—
|
|
—
|
|
28,263
|
|
||||||
|
Acquisition of Noncontrolling Interests – Partially Owned Properties
|
—
|
|
(2,244
|
)
|
—
|
|
||||||
|
Deconsolidation of previously consolidated Noncontrolling Interests
|
(117,350
|
)
|
—
|
|
—
|
|
||||||
|
Other
|
—
|
|
169
|
|
—
|
|
||||||
|
Balance, end of year
|
$
|
4,608
|
|
$
|
124,909
|
|
$
|
126,583
|
|
|||
See accompanying notes
F-23
EQUITY RESIDENTIAL
ERP OPERATING LIMITED PARTNERSHIP
NOTES TO CONSOLIDATED FINANCIAL STATEMENTS
|
1.
|
Business
|
Equity Residential (“EQR”), a Maryland real estate investment trust (“REIT”) formed in March 1993, is an S&P 500 company focused on the acquisition, development and management of high quality apartment properties in top United States growth markets. ERP Operating Limited Partnership ("ERPOP"), an Illinois limited partnership, was formed in May 1993 to conduct the multifamily residential property business of Equity Residential. EQR has elected to be taxed as a REIT. References to the "Company," "we," "us" or "our" mean collectively EQR, ERPOP and those entities/subsidiaries owned or controlled by EQR and/or ERPOP. References to the "Operating Partnership" mean collectively ERPOP and those entities/subsidiaries owned or controlled by ERPOP. Unless otherwise indicated, the notes to consolidated financial statements apply to both the Company and the Operating Partnership.
EQR is the general partner of, and as of
December 31, 2015
owned an approximate
96.2%
ownership interest in, ERPOP. All of the Company's property ownership, development and related business operations are conducted through the Operating Partnership and EQR has no material assets or liabilities other than its investment in ERPOP. EQR issues public equity from time to time but does not have any indebtedness as all debt is incurred by the Operating Partnership. The Operating Partnership holds substantially all of the assets of the Company, including the Company's ownership interests in its joint ventures. The Operating Partnership conducts the operations of the business and is structured as a partnership with no publicly traded equity.
As of
December 31, 2015
, the Company, directly or indirectly through investments in title holding entities, owned all or a portion of
394
properties located in
12
states and the District of Columbia consisting of
109,652
apartment units. The ownership breakdown includes (table does not include various uncompleted development properties):
|
Properties
|
Apartment Units
|
|||||
|
Wholly Owned Properties
|
367
|
|
98,608
|
|
||
|
Master-Leased Properties – Consolidated
|
3
|
|
853
|
|
||
|
Partially Owned Properties – Consolidated
|
19
|
|
3,771
|
|
||
|
Partially Owned Properties – Unconsolidated
|
3
|
|
1,281
|
|
||
|
Military Housing
|
2
|
|
5,139
|
|
||
|
|
394
|
|
109,652
|
|
||
The “Wholly Owned Properties” are accounted for under the consolidation method of accounting. The "Master-Leased Properties – Consolidated" are wholly owned by the Company but the entire project is leased to a third party corporate housing provider. These properties are consolidated and reflected as real estate assets while the master leases are accounted for as operating leases. The “Partially Owned Properties – Consolidated” are controlled by the Company but have partners with noncontrolling interests and are accounted for under the consolidation method of accounting. The “Partially Owned Properties – Unconsolidated” are controlled by the Company's partners but the Company has noncontrolling interests and are accounted for under the equity method of accounting. The “Military Housing” properties consist of investments in limited liability companies that, as a result of the terms of the operating agreements, are accounted for as management contract rights with all fees recognized as fee and asset management revenue.
The Company maintains long-term ground leases for
14
operating properties. The Company owns the building and improvements and leases the land underlying the improvements under long-term ground leases. The expiration dates for these leases range from
2026
through
2110
. These properties are consolidated and reflected as real estate assets while the ground leases are accounted for as operating leases.
|
2.
|
Summary of Significant Accounting Policies
|
Basis of Presentation
Due to the Company’s ability as general partner to control either through ownership or by contract the Operating Partnership and its subsidiaries, the Operating Partnership and each such subsidiary has been consolidated with the Company for financial reporting purposes, except for
three
unconsolidated operating properties and our military housing properties.
F-24
Real Estate Assets and Depreciation of Investment in Real Estate
An acquiring entity is required to recognize all assets acquired and liabilities assumed in a transaction at the acquisition-date fair value with limited exceptions. In addition, an acquiring entity is required to expense acquisition-related costs as incurred, value noncontrolling interests at fair value at the acquisition date and expense restructuring costs associated with an acquired business.
The Company allocates the purchase price of properties to net tangible and identified intangible assets acquired based on their fair values. In making estimates of fair values for purposes of allocating purchase price, the Company utilizes a number of sources, including independent appraisals that may be obtained in connection with the acquisition or financing of the respective property, our own analysis of recently acquired and existing comparable properties in our portfolio and other market data. The Company also considers information obtained about each property as a result of its pre-acquisition due diligence, marketing and leasing activities in estimating the fair value of the tangible and intangible assets/liabilities acquired. The Company allocates the purchase price of acquired real estate to various components as follows:
|
•
|
Land – Based on actual purchase price adjusted to fair value (as necessary) if acquired separately or market research/comparables if acquired with an operating property.
|
|
•
|
Furniture, Fixtures and Equipment – Ranges between
$10,000
and
$25,000
per apartment unit acquired as an estimate of the fair value of the appliances and fixtures inside an apartment unit. The per-apartment unit amount applied depends on the economic age of the apartment building acquired. Depreciation is calculated on the straight-line method over an estimated useful life of
five
to
ten
years.
|
|
•
|
Lease Intangibles – The Company considers the value of acquired in-place leases and above/below market leases and the amortization period is the average remaining term of each respective acquired lease. In-place residential leases' average term at acquisition approximates
six
months. In-place retail leases' term at acquisition approximates the average remaining term of all acquired retail leases. See Note 4 for more information on above and below market leases.
|
|
•
|
Other Intangible Assets – The Company considers whether it has acquired other intangible assets, including any customer relationship intangibles and the amortization period is the estimated useful life of the acquired intangible asset.
|
|
•
|
Building – Based on the fair value determined on an “as-if vacant” basis. Depreciation is calculated on the straight-line method over an estimated useful life of
thirty
years.
|
|
•
|
Site Improvements – Based on replacement cost, which approximates fair value. Depreciation is calculated on the straight-line method over an estimated useful life of
eight
years.
|
|
•
|
Long-Term Debt – The Company calculates the fair value by discounting the remaining contractual cash flows on each instrument at the current market rate for those borrowings.
|
Replacements inside an apartment unit such as appliances and carpeting are depreciated over an estimated useful life of
five
to
ten
years. Expenditures for ordinary maintenance and repairs are expensed to operations as incurred and significant renovations and improvements that improve and/or extend the useful life of the asset are capitalized over their estimated useful life, generally
five
to
fifteen
years. Initial direct leasing costs are expensed as incurred as such expense approximates the deferral and amortization of initial direct leasing costs over the lease terms. Property sales or dispositions are recorded when title transfers to unrelated third parties, contingencies have been removed and sufficient cash consideration has been received by the Company. Upon disposition, the related costs and accumulated depreciation are removed from the respective accounts. Any gain or loss on sale is recognized in accordance with accounting principles generally accepted in the United States.
The Company classifies real estate assets as real estate held for sale when it is probable a property will be disposed of (see below and Note 4 for further discussion).
The Company classifies properties under development and/or expansion and properties in the lease-up phase (including land) as construction-in-progress until construction has been completed and certificates of occupancy permits have been obtained.
Impairment of Long-Lived Assets
The Company periodically evaluates its long-lived assets, including its investments in real estate, for indicators of impairment. The judgments regarding the existence of impairment indicators are based on factors such as operational performance, market conditions and legal and environmental concerns, as well as the Company’s ability to hold and its intent with regard to
F-25
each asset. Future events could occur which would cause the Company to conclude that impairment indicators exist and an impairment loss is warranted. If impairment indicators exist, the Company performs the following:
|
▪
|
For long-lived assets to be held and used, the Company compares the expected future undiscounted cash flows for the long-lived asset against the carrying amount of that asset. If the sum of the estimated undiscounted cash flows is less than the carrying amount of the asset, the Company would record an impairment loss for the difference between the estimated fair value and the carrying amount of the asset.
|
|
▪
|
For long-lived assets to be disposed of, an impairment loss is recognized when the estimated fair value of the asset, less the estimated cost to sell, is less than the carrying amount of the asset measured at the time that the Company has determined it will sell the asset. Long-lived assets held for sale and the related liabilities are separately reported, with the long-lived assets reported at the lower of their carrying amounts or their estimated fair values, less their costs to sell, and are not depreciated after reclassification to real estate held for sale.
|
Cost Capitalization
See the
Real Estate Assets and Depreciation of Investment in Real Estate
section for a discussion of the Company’s policy with respect to capitalization vs. expensing of fixed asset/repair and maintenance costs. In addition, the Company capitalizes an allocation of the payroll and associated costs of employees directly responsible for and who spend their time on the execution and supervision of major capital and/or renovation projects. These costs are reflected on the balance sheets as increases to depreciable property.
For all development projects, the Company uses its professional judgment in determining whether such costs meet the criteria for capitalization or must be expensed as incurred. The Company capitalizes interest, real estate taxes and insurance and payroll and associated costs for those individuals directly responsible for and who spend their time on development activities, with capitalization ceasing no later than 90 days following issuance of the certificate of occupancy. These costs are reflected on the balance sheets as construction-in-progress for each specific property. The Company expenses as incurred all payroll costs of on-site employees working directly at our properties, except as noted above on our development properties prior to certificate of occupancy issuance and on specific major renovations at selected properties when additional incremental employees are hired.
During the years ended December 31,
2015
,
2014
and
2013
, the Company capitalized
$22.3 million
,
$22.4 million
and
$16.5 million
, respectively, of payroll and associated costs of employees directly responsible for and who spend their time on the execution and supervision of development activities as well as major capital and/or renovation projects.
Cash and Cash Equivalents
The Company considers all demand deposits, money market accounts and investments in certificates of deposit and repurchase agreements purchased with a maturity of three months or less at the date of purchase to be cash equivalents. The Company maintains its cash and cash equivalents at financial institutions. The combined account balances at one or more institutions typically exceed the Federal Depository Insurance Corporation (“FDIC”) insurance coverage, and, as a result, there is a concentration of credit risk related to amounts on deposit in excess of FDIC insurance coverage. The Company believes that the risk is not significant, as the Company does not anticipate the financial institutions’ non-performance.
Investment Securities
Investment securities are included in other assets in the consolidated balance sheets. These securities are classified as held-to-maturity and carried at amortized cost if management has the positive intent and ability to hold the securities to maturity. Otherwise, the securities are classified as available-for-sale and carried at estimated fair value with unrealized gains and losses included in accumulated other comprehensive (loss), a separate component of shareholders’ equity/partners' capital. As of December 31,
2015
and
2014
, the Company did not hold any investment securities.
Deferred Financing Costs
Deferred financing costs include fees and costs incurred to obtain the Company’s line of credit and long-term financings. These costs are amortized over the terms of the related debt. Unamortized financing costs are written off when debt is retired before the maturity date. The accumulated amortization of such deferred financing costs was
$45.4 million
and
$37.7 million
at
December 31, 2015
and
2014
, respectively.
F-26
Fair Value of Financial Instruments, Including Derivative Instruments
The valuation of financial instruments requires the Company to make estimates and judgments that affect the fair value of the instruments. The Company, where possible, bases the fair values of its financial instruments, including its derivative instruments, on listed market prices and third party quotes. Where these are not available, the Company bases its estimates on current instruments with similar terms and maturities or on other factors relevant to the financial instruments.
In the normal course of business, the Company is exposed to the effect of interest rate changes. The Company seeks to manage these risks by following established risk management policies and procedures including the use of derivatives to hedge interest rate risk on debt instruments. The Company may also use derivatives to manage its exposure to foreign exchange rates or manage commodity prices in the daily operations of the business.
The Company has a policy of only entering into contracts with major financial institutions based upon their credit ratings and other factors. When viewed in conjunction with the underlying and offsetting exposure that the derivatives are designed to hedge, the Company has not sustained a material loss from these instruments nor does it anticipate any material adverse effect on its net income or financial position in the future from the use of derivatives it currently has in place.
The Company recognizes all derivatives as either assets or liabilities in the consolidated balance sheets and measures those instruments at fair value. In addition, fair value adjustments will affect either shareholders’ equity/partners' capital or net income depending on whether the derivative instruments qualify as a hedge for accounting purposes and, if so, the nature of the hedging activity. When the terms of an underlying transaction are modified, or when the underlying transaction is terminated or completed, all changes in the fair value of the instrument are marked-to-market with changes in value included in net income each period until the instrument matures. Any derivative instrument used for risk management that does not meet the hedging criteria is marked-to-market each period. The Company does not use derivatives for trading or speculative purposes.
Revenue Recognition
Rental income attributable to residential leases is recorded on a straight-line basis, which is not materially different than if it were recorded when due from residents and recognized monthly as it was earned. Leases entered into between a resident and a property for the rental of an apartment unit are generally year-to-year, renewable upon consent of both parties on an annual or monthly basis. Rental income attributable to retail/commercial leases is also recorded on a straight-line basis. Retail/commercial leases generally have
five
to
ten
year lease terms with market based renewal options. Fee and asset management revenue and interest income are recorded on an accrual basis.
Share-Based Compensation
The Company expenses share-based compensation such as restricted shares, restricted units and share options. Any common share of beneficial interest,
$0.01
par value per share (the "Common Shares") issued pursuant to EQR's incentive equity compensation and employee share purchase plans will result in ERPOP issuing units of partnership interest ("OP Units") to EQR on a one-for-one basis, with ERPOP receiving the net cash proceeds of such issuances. See Note 12 for further discussion.
The fair value of the option grants are recognized over the requisite service/vesting period of the options. The fair value for the Company's share options was estimated at the time the share options were granted using the Black-Scholes option pricing model with the primary grant in each year having the following weighted average assumptions:
|
2015
|
2014
|
2013
|
||||
|
Expected volatility (1)
|
26.6%
|
27.0%
|
26.9%
|
|||
|
Expected life (2)
|
5 years
|
5 years
|
5 years
|
|||
|
Expected dividend yield (3)
|
3.13%
|
3.78%
|
4.12%
|
|||
|
Risk-free interest rate (4)
|
1.29%
|
1.50%
|
0.84%
|
|||
|
Option valuation per share
|
$13.68
|
$9.12
|
$7.90
|
|||
|
(1)
|
Expected volatility – Estimated based on the historical ten-year volatility of EQR’s share price measured on a monthly basis.
|
|
(2)
|
Expected life – Approximates the actual weighted average life of all share options granted since the Company went public in 1993.
|
|
(3)
|
Expected dividend yield – Calculated by averaging the historical annual yield on EQR shares for a period matching the expected life of each grant, with the annual yield calculated by dividing actual dividends by the average price of EQR’s shares in a given year.
|
|
(4)
|
Risk-free interest rate – The most current U.S. Treasury rate available prior to the grant date for a period matching the expected life of each grant.
|
F-27
The valuation method and assumptions are the same as those the Company used in accounting for option expense in its consolidated financial statements. The Black-Scholes option valuation model was developed for use in estimating the fair value of traded options that have no vesting restrictions and are fully transferable. This model is only one method of valuing options. Because the Company’s share options have characteristics significantly different from those of traded options, and because changes in the subjective input assumptions can materially affect the fair value estimate, the actual value of the options to the recipient may be significantly different.
Income and Other Taxes
Due to the structure of EQR as a REIT and the nature of the operations of its operating properties, no provision for federal income taxes has been made at the EQR level. In addition, ERPOP generally is not liable for federal income taxes as the partners recognize their proportionate share of income or loss in their tax returns; therefore no provision for federal income taxes has been made at the ERPOP level. Historically, the Company has generally only incurred certain state and local income, excise and franchise taxes. The Company has elected Taxable REIT Subsidiary (“TRS”) status for certain of its corporate subsidiaries and as a result, these entities will incur both federal and state income taxes on any taxable income of such entities after consideration of any net operating losses.
Deferred tax assets and liabilities applicable to the TRS are recognized for future tax consequences attributable to differences between the financial statement carrying amounts of existing assets and liabilities and their respective tax bases. These assets and liabilities are measured using enacted tax rates for which the temporary differences are expected to be recovered or settled. The effects of changes in tax rates on deferred tax assets and liabilities are recognized in earnings in the period enacted. The Company’s deferred tax assets are generally the result of tax affected suspended interest deductions, net operating losses, differing depreciable lives on capitalized assets and the timing of expense recognition for certain accrued liabilities. As of
December 31, 2015
, the Company has recorded a deferred tax asset of approximately
$40.8 million
, which is fully offset by a valuation allowance due to the uncertainty of realization.
The Company provided for income, franchise and excise taxes allocated as follows in the consolidated statements of operations and comprehensive income for the years ended
December 31, 2015
,
2014
and
2013
(amounts in thousands):
|
|
Year Ended December 31,
|
|||||||||||
|
|
2015
|
2014
|
2013
|
|||||||||
|
Income and other tax expense (benefit) (1)
|
$
|
917
|
|
$
|
1,394
|
|
$
|
1,169
|
|
|||
|
Discontinued operations, net (2)
|
15
|
|
8
|
|
449
|
|
||||||
|
Provision for income, franchise and excise taxes (3)
|
$
|
932
|
|
$
|
1,402
|
|
$
|
1,618
|
|
|||
|
(1)
|
Primarily includes state and local income, excise and franchise taxes.
|
|
(2)
|
Primarily represents state and local income, excise and franchise taxes on operating properties sold prior to January 1, 2014 and included in discontinued operations. The amounts included in discontinued operations for the years ending December 31, 2015 and 2014 represent trailing activity for properties sold in 2013 and prior years. None of the properties sold during the years ended December 31, 2015 and 2014 met the new criteria for reporting discontinued operations.
|
|
(3)
|
All provisions for income tax amounts are current and none are deferred.
|
The Company’s TRSs have approximately
$19.4 million
of net operating loss ("NOL") carryforwards available as of January 1,
2016
that will expire between
2030
and
2032
.
During the years ended
December 31, 2015
,
2014
and
2013
, the Company’s tax treatment of dividends and distributions were as follows:
|
|
Year Ended December 31,
|
|||||||||||
|
|
2015
|
2014
|
2013
|
|||||||||
|
Tax treatment of dividends and distributions:
|
|
|
|
|
|
|
||||||
|
Ordinary dividends
|
$
|
1.591
|
|
$
|
1.475
|
|
$
|
0.662
|
|
|||
|
Qualified dividends
|
0.037
|
|
0.088
|
|
0.050
|
|
||||||
|
Long-term capital gain
|
0.443
|
|
0.280
|
|
0.870
|
|
||||||
|
Unrecaptured section 1250 gain
|
0.139
|
|
0.157
|
|
0.268
|
|
||||||
|
Dividends and distributions declared per
|
|
|
|
|
|
|
||||||
|
Common Share/Unit outstanding
|
$
|
2.210
|
|
$
|
2.000
|
|
$
|
1.850
|
|
|||
F-28
The unaudited cost of land and depreciable property, net of accumulated depreciation, for federal income tax purposes as of
December 31, 2015
and
2014
was approximately
$17.0 billion
and
$16.7 billion
, respectively.
Noncontrolling Interests
A noncontrolling interest in a subsidiary (minority interest) is in most cases an ownership interest in the consolidated entity that should be reported as equity in the consolidated financial statements and separate from the parent company's equity. In addition, consolidated net income is required to be reported at amounts that include the amounts attributable to both the parent and the noncontrolling interest and the amount of consolidated net income attributable to the parent and the noncontrolling interest are required to be disclosed on the face of the consolidated statements of operations and comprehensive income. See Note 3 for further discussion.
Operating Partnership: Net income is allocated to noncontrolling interests based on their respective ownership percentage of the Operating Partnership. The ownership percentage is calculated by dividing the number of OP Units held by the noncontrolling interests by the total OP Units held by the noncontrolling interests and EQR. Issuance of additional Common Shares and OP Units changes the ownership interests of both the noncontrolling interests and EQR. Such transactions and the related proceeds are treated as capital transactions.
Partially Owned Properties: The Company reflects noncontrolling interests in partially owned properties on the balance sheet for the portion of properties consolidated by the Company that are not wholly owned by the Company. The earnings or losses from those properties attributable to the noncontrolling interests are generally based on ownership percentage and are reflected as noncontrolling interests in partially owned properties in the consolidated statements of operations and comprehensive income.
Partners' Capital
The "Limited Partners" of ERPOP include various individuals and entities that contributed their properties to ERPOP in exchange for OP Units. The "General Partner" of ERPOP is EQR. Net income is allocated to the Limited Partners based on their respective ownership percentage of ERPOP. The ownership percentage is calculated by dividing the number of OP Units held by the Limited Partners by the total OP Units held by the Limited Partners and the General Partner. Issuance of additional Common Shares and OP Units changes the ownership interests of both the Limited Partners and EQR. Such transactions and the related proceeds are treated as capital transactions.
Redeemable Noncontrolling Interests – Operating Partnership / Redeemable Limited Partners
The Company classifies Redeemable Noncontrolling Interests – Operating Partnership / Redeemable Limited Partners in the mezzanine section of the consolidated balance sheets for the portion of OP Units that EQR is required, either by contract or securities law, to deliver registered Common Shares to the exchanging OP Unit holder. The redeemable noncontrolling interest units / redeemable limited partner units are adjusted to the greater of carrying value or fair market value based on the Common Share price of EQR at the end of each respective reporting period. See Note 3 for further discussion.
Use of Estimates
In preparation of the Company’s financial statements in conformity with accounting principles generally accepted in the United States, management makes estimates and assumptions that affect the reported amounts of assets and liabilities and disclosure of contingent assets and liabilities at the date of the financial statements as well as the reported amounts of revenues and expenses during the reporting period. Actual results could differ from these estimates.
Reclassifications
Certain reclassifications considered necessary for a fair presentation have been made to the prior period financial statements in order to conform to the current year presentation. These reclassifications have not changed the results of operations or equity/capital.
Recent Accounting Pronouncements
In May 2014, the Financial Accounting Standards Board (the "FASB") issued a comprehensive new revenue recognition standard entitled
Revenue from Contracts with Customers
that will supersede nearly all existing revenue recognition guidance.
F-29
The new standard specifically excludes lease revenue. The new standard’s core principle is that a company will recognize revenue when it transfers promised goods or services to customers in an amount that reflects the consideration to which the company expects to be entitled in exchange for those goods or services. Companies will likely need to use more judgment and make more estimates than under current revenue recognition guidance. These may include identifying performance obligations in the contract, estimating the amount of variable consideration, if any, to include in the transaction price and allocating the transaction price to each separate performance obligation. The new standard will be effective for the Company beginning on January 1, 2018 and early adoption will be permitted beginning on January 1, 2017. The new standard may be applied retrospectively to each prior period presented or prospectively with the cumulative effect recognized as of the date of adoption. The Company has not yet selected a transition method and is currently evaluating the impact of adopting the new standard on its consolidated results of operations and financial position.
In August 2014, the FASB issued a new standard that will explicitly require management to assess an entity's ability to continue as a going concern and to provide related footnote disclosures in certain circumstances. In connection with each annual and interim period, management will assess whether there is substantial doubt about an entity's ability to continue as a going concern within one year after the issuance date. Disclosures will be required if conditions give rise to substantial doubt. However, to determine the specific disclosures, management will need to assess whether its plans will alleviate substantial doubt. The new standard is effective for the annual period ending after December 15, 2016 and for interim periods thereafter. The Company does not expect that this will have a material effect on its consolidated results of operations or financial position.
In February 2015, the FASB issued new consolidation guidance which makes changes to both the variable interest model and the voting model. Among other changes, the new standard specifically eliminates the presumption in the current voting model that a general partner controls a limited partnership or similar entity unless that presumption can be overcome. Generally, only a single limited partner that is able to exercise substantive kick-out rights will consolidate. The Company adopted the new standard as required effective January 1, 2016. While adoption of the new standard did not result in any changes to conclusions about whether a joint venture was consolidated or unconsolidated, the Company has determined that certain of its joint ventures will now qualify as variable interest entities and therefore will require additional disclosures.
In April 2015, the FASB issued a new standard which requires companies to present debt financing costs as a direct deduction from the carrying amount of the associated debt liability rather than as an asset, consistent with the presentation of debt discounts on the consolidated balance sheets. Companies will be permitted to present debt issuance costs related to line of credit arrangements as an asset and amortize these costs over the term of the arrangement, regardless of whether there are any outstanding borrowings on the arrangement. The new standard must be applied retrospectively to all prior periods presented in the consolidated financial statements. The Company adopted this standard as required effective January 1, 2016 and other than presentation on the consolidated balance sheets, it did not have a material effect on its consolidated results of operations or financial position.
In January 2016, the FASB issued a new standard which requires companies to measure all equity securities with readily determinable fair values at fair value on the balance sheet, with changes in fair value recognized in net income. The new standard will be effective for the Company beginning on January 1, 2018. The Company does not expect that this will have a material effect on its consolidated results of operations or financial position.
Other
The Company is the controlling partner in various consolidated partnerships owning
19
properties and
3,771
apartment units having a noncontrolling interest book value of
$4.6 million
at
December 31, 2015
. The Company is required to make certain disclosures regarding noncontrolling interests in consolidated limited-life subsidiaries. Of the consolidated entities described above, the Company is the controlling partner in limited-life partnerships owning
six
properties having a noncontrolling interest deficit balance of
$11.5 million
. These
six
partnership agreements contain provisions that require the partnerships to be liquidated through the sale of their assets upon reaching a date specified in each respective partnership agreement. The Company, as controlling partner, has an obligation to cause the property owning partnerships to distribute the proceeds of liquidation to the Noncontrolling Interests in these Partially Owned Properties only to the extent that the net proceeds received by the partnerships from the sale of their assets warrant a distribution based on the partnership agreements. As of
December 31, 2015
, the Company estimates the value of Noncontrolling Interest distributions for these
six
properties would have been approximately
$75.1 million
(“Settlement Value”) had the partnerships been liquidated. This Settlement Value is based on estimated third party consideration realized by the partnerships upon disposition of the
six
Partially Owned Properties and is net of all other assets and liabilities, including yield maintenance on the mortgages encumbering the properties, that would have been due on
December 31, 2015
had those mortgages been prepaid. Due to, among other things, the inherent uncertainty in the sale of real estate assets, the amount of any potential distribution to the Noncontrolling Interests in the Company's Partially Owned Properties is subject to change. To the extent that the partnerships' underlying assets are worth less than the underlying liabilities, the Company has no obligation to remit any consideration to the Noncontrolling Interests in these Partially Owned Properties.
F-30
|
3.
|
Equity, Capital and Other Interests
|
Equity and Redeemable Noncontrolling Interests of Equity Residential
The following tables present the changes in the Company’s issued and outstanding Common Shares and “Units” (which includes OP Units and restricted units (formerly known as Long-Term Incentive Plan ("LTIP") Units)) for the years ended
December 31, 2015
,
2014
and
2013
:
|
2015
|
2014
|
2013
|
|||||||
|
Common Shares
|
|
|
|
|
|
|
|||
|
Common Shares outstanding at January 1,
|
362,855,454
|
|
360,479,260
|
|
325,054,654
|
|
|||
|
Common Shares Issued:
|
|
|
|
|
|
|
|||
|
Conversion of OP Units
|
208,307
|
|
94,671
|
|
67,939
|
|
|||
|
Issuance of Common Shares
|
—
|
|
—
|
|
34,468,085
|
|
|||
|
Exercise of share options
|
1,456,363
|
|
2,086,380
|
|
586,017
|
|
|||
|
Employee Share Purchase Plan (ESPP)
|
68,462
|
|
68,807
|
|
73,468
|
|
|||
|
Restricted share grants, net
|
168,142
|
|
169,722
|
|
229,097
|
|
|||
|
Common Shares Other:
|
|
|
|
|
|
|
|||
|
Conversion of restricted shares to restricted units
|
(1,284
|
)
|
(12,146
|
)
|
—
|
|
|||
|
Repurchased and retired
|
—
|
|
(31,240
|
)
|
—
|
|
|||
|
Common Shares outstanding at December 31,
|
364,755,444
|
|
362,855,454
|
|
360,479,260
|
|
|||
|
Units
|
|
|
|
|
|
|
|||
|
Units outstanding at January 1,
|
14,298,691
|
|
14,180,376
|
|
13,968,758
|
|
|||
|
Restricted unit grants, net
|
335,496
|
|
200,840
|
|
279,557
|
|
|||
|
Conversion of restricted shares to restricted units
|
1,284
|
|
12,146
|
|
—
|
|
|||
|
Conversion of OP Units to Common Shares
|
(208,307
|
)
|
(94,671
|
)
|
(67,939
|
)
|
|||
|
Units outstanding at December 31,
|
14,427,164
|
|
14,298,691
|
|
14,180,376
|
|
|||
|
Total Common Shares and Units outstanding at December 31,
|
379,182,608
|
|
377,154,145
|
|
374,659,636
|
|
|||
|
Units Ownership Interest in Operating Partnership
|
3.8
|
%
|
3.8
|
%
|
3.8
|
%
|
|||
The equity positions of various individuals and entities that contributed their properties to the Operating Partnership in exchange for OP Units, as well as the equity positions of the holders of restricted units, are collectively referred to as the “Noncontrolling Interests – Operating Partnership”. Subject to certain exceptions (including the “book-up” requirements of restricted units), the Noncontrolling Interests – Operating Partnership may exchange their Units with EQR for Common Shares on a one-for-one basis. The carrying value of the Noncontrolling Interests – Operating Partnership (including redeemable interests) is allocated based on the number of Noncontrolling Interests – Operating Partnership Units in total in proportion to the number of Noncontrolling Interests – Operating Partnership Units in total plus the number of Common Shares. Net income is allocated to the Noncontrolling Interests – Operating Partnership based on the weighted average ownership percentage during the period.
The Operating Partnership has the right but not the obligation to make a cash payment instead of issuing Common Shares to any and all holders of Noncontrolling Interests – Operating Partnership Units requesting an exchange of their OP Units with EQR. Once the Operating Partnership elects not to redeem the Noncontrolling Interests – Operating Partnership Units for cash, EQR is obligated to deliver Common Shares to the exchanging holder of the Noncontrolling Interests – Operating Partnership Units.
The Noncontrolling Interests – Operating Partnership Units are classified as either mezzanine equity or permanent equity. If EQR is required, either by contract or securities law, to deliver registered Common Shares, such Noncontrolling Interests – Operating Partnership are differentiated and referred to as “Redeemable Noncontrolling Interests – Operating Partnership”. Instruments that require settlement in registered shares cannot be classified in permanent equity as it is not always completely within an issuer’s control to deliver registered shares. Therefore, settlement in cash is assumed and that responsibility for settlement in cash is deemed to fall to the Operating Partnership as the primary source of cash for EQR, resulting in presentation in the mezzanine section of the balance sheet. The Redeemable Noncontrolling Interests – Operating Partnership are adjusted to the greater of carrying value or fair market value based on the Common Share price of EQR at the end of each respective reporting period. EQR has the ability to deliver unregistered Common Shares for the remaining portion of the Noncontrolling Interests – Operating Partnership Units that are classified in permanent equity at
December 31, 2015
and
2014
.
F-31
The carrying value of the Redeemable Noncontrolling Interests – Operating Partnership is allocated based on the number of Redeemable Noncontrolling Interests – Operating Partnership Units in proportion to the number of Noncontrolling Interests – Operating Partnership Units in total. Such percentage of the total carrying value of Units which is ascribed to the Redeemable Noncontrolling Interests – Operating Partnership is then adjusted to the greater of carrying value or fair market value as described above. As of
December 31, 2015
, the Redeemable Noncontrolling Interests – Operating Partnership have a redemption value of approximately
$566.8 million
, which represents the value of Common Shares that would be issued in exchange with the Redeemable Noncontrolling Interests – Operating Partnership Units.
The following table presents the changes in the redemption value of the Redeemable Noncontrolling Interests – Operating Partnership for the years ended
December 31, 2015
,
2014
and
2013
, respectively (amounts in thousands):
|
2015
|
2014
|
2013
|
||||||||||
|
Balance at January 1,
|
$
|
500,733
|
|
$
|
363,144
|
|
$
|
398,372
|
|
|||
|
Change in market value
|
64,378
|
|
139,818
|
|
(79,667
|
)
|
||||||
|
Change in carrying value
|
1,672
|
|
(2,229
|
)
|
44,439
|
|
||||||
|
Balance at December 31,
|
$
|
566,783
|
|
$
|
500,733
|
|
$
|
363,144
|
|
|||
Net proceeds from EQR Common Share and Preferred Share (see definition below) offerings are contributed by EQR to ERPOP. In return for those contributions, EQR receives a number of OP Units in ERPOP equal to the number of Common Shares it has issued in the equity offering (or in the case of a preferred equity offering, a number of preference units in ERPOP equal in number and having the same terms as the Preferred Shares issued in the equity offering). As a result, the net offering proceeds from Common Shares and Preferred Shares are allocated between shareholders’ equity and Noncontrolling Interests – Operating Partnership to account for the change in their respective percentage ownership of the underlying equity of ERPOP.
The Company’s declaration of trust authorizes it to issue up to
100,000,000
preferred shares of beneficial interest,
$0.01
par value per share (the “Preferred Shares”), with specific rights, preferences and other attributes as the Board of Trustees may determine, which may include preferences, powers and rights that are senior to the rights of holders of the Company’s Common Shares.
The following table presents the Company’s issued and outstanding Preferred Shares as of
December 31, 2015
and
2014
:
|
|
Amounts in thousands
|
|||||||||||||
|
Redemption
Date (1) |
Annual
Dividend per Share (2) |
December 31, 2015
|
December 31, 2014
|
|||||||||||
|
Preferred Shares of beneficial interest, $0.01 par value;
100,000,000 shares authorized: |
||||||||||||||
|
8.29% Series K Cumulative Redeemable Preferred; liquidation
value $50 per share; 745,600 shares issued and outstanding at December 31, 2015 and 1,000,000 shares issued and outstanding at December 31, 2014 (3) (4) |
12/10/26
|
|
$4.145
|
|
$
|
37,280
|
|
$
|
50,000
|
|
||||
|
$
|
37,280
|
|
$
|
50,000
|
|
|||||||||
|
(1)
|
On or after the redemption date, redeemable preferred shares may be redeemed for cash at the option of the Company, in whole or in part, at a redemption price equal to the liquidation price per share, plus accrued and unpaid distributions, if any.
|
|
(2)
|
Dividends on Preferred Shares are payable quarterly.
|
|
(3)
|
Effective January 26, 2015, the Company repurchased and retired
196,400
Series K Preferred Shares with a par value of
$9.82 million
for total cash consideration of approximately
$12.7 million
. As a result of this partial redemption, the Company incurred a cash charge of approximately
$2.8 million
which was recorded as a premium on the redemption of Preferred Shares.
|
|
(4)
|
Effective November 12, 2015, the Company repurchased and retired
58,000
Series K Preferred Shares with a par value of
$2.9 million
for total cash consideration of approximately
$3.6 million
. As a result of this partial redemption, the Company incurred a cash charge of approximately
$0.7 million
which was recorded as a premium on the redemption of Preferred Shares.
|
Capital and Redeemable Limited Partners of ERP Operating Limited Partnership
The following tables present the changes in the Operating Partnership's issued and outstanding Units and in the limited partners' Units for the years ended
December 31, 2015
,
2014
and
2013
:
F-32
|
2015
|
2014
|
2013
|
|||||||
|
General and Limited Partner Units
|
|
|
|
|
|
|
|||
|
General and Limited Partner Units outstanding at January 1,
|
377,154,145
|
|
374,659,636
|
|
339,023,412
|
|
|||
|
Issued to General Partner:
|
|||||||||
|
Issuance of OP Units
|
—
|
|
—
|
|
34,468,085
|
|
|||
|
Exercise of EQR share options
|
1,456,363
|
|
2,086,380
|
|
586,017
|
|
|||
|
EQR's Employee Share Purchase Plan (ESPP)
|
68,462
|
|
68,807
|
|
73,468
|
|
|||
|
EQR's restricted share grants, net
|
168,142
|
|
169,722
|
|
229,097
|
|
|||
|
Issued to Limited Partners:
|
|||||||||
|
Restricted unit grants, net
|
335,496
|
|
200,840
|
|
279,557
|
|
|||
|
OP Units Other:
|
|||||||||
|
Repurchased and retired
|
—
|
|
(31,240
|
)
|
—
|
|
|||
|
General and Limited Partner Units outstanding at December 31,
|
379,182,608
|
|
377,154,145
|
|
374,659,636
|
|
|||
|
Limited Partner Units
|
|
|
|
|
|
|
|||
|
Limited Partner Units outstanding at January 1,
|
14,298,691
|
|
14,180,376
|
|
13,968,758
|
|
|||
|
Limited Partner restricted unit grants, net
|
335,496
|
|
200,840
|
|
279,557
|
|
|||
|
Conversion of EQR restricted shares to restricted units
|
1,284
|
|
12,146
|
|
—
|
|
|||
|
Conversion of Limited Partner OP Units to EQR Common Shares
|
(208,307
|
)
|
(94,671
|
)
|
(67,939
|
)
|
|||
|
Limited Partner Units outstanding at December 31,
|
14,427,164
|
|
14,298,691
|
|
14,180,376
|
|
|||
|
Limited Partner Units Ownership Interest in Operating Partnership
|
3.8
|
%
|
3.8
|
%
|
3.8
|
%
|
|||
The Limited Partners of the Operating Partnership as of
December 31, 2015
include various individuals and entities that contributed their properties to the Operating Partnership in exchange for OP Units, as well as the equity positions of the holders of restricted units. Subject to certain exceptions (including the “book-up” requirements of restricted units), Limited Partners may exchange their Units with EQR for Common Shares on a one-for-one basis. The carrying value of the Limited Partner Units (including redeemable interests) is allocated based on the number of Limited Partner Units in total in proportion to the number of Limited Partner Units in total plus the number of General Partner Units. Net income is allocated to the Limited Partner Units based on the weighted average ownership percentage during the period.
The Operating Partnership has the right but not the obligation to make a cash payment instead of issuing Common Shares to any and all holders of Limited Partner Units requesting an exchange of their OP Units with EQR. Once the Operating Partnership elects not to redeem the Limited Partner Units for cash, EQR is obligated to deliver Common Shares to the exchanging limited partner.
The Limited Partner Units are classified as either mezzanine equity or permanent equity. If EQR is required, either by contract or securities law, to deliver registered Common Shares, such Limited Partner Units are differentiated and referred to as “Redeemable Limited Partner Units”. Instruments that require settlement in registered shares cannot be classified in permanent equity as it is not always completely within an issuer's control to deliver registered shares. Therefore, settlement in cash is assumed and that responsibility for settlement in cash is deemed to fall to the Operating Partnership as the primary source of cash for EQR, resulting in presentation in the mezzanine section of the balance sheet. The Redeemable Limited Partner Units are adjusted to the greater of carrying value or fair market value based on the Common Share price of EQR at the end of each respective reporting period. EQR has the ability to deliver unregistered Common Shares for the remaining portion of the Limited Partner Units that are classified in permanent equity at
December 31, 2015
and 2014.
The carrying value of the Redeemable Limited Partner Units is allocated based on the number of Redeemable Limited Partner Units in proportion to the number of Limited Partner Units in total. Such percentage of the total carrying value of Limited Partner Units which is ascribed to the Redeemable Limited Partner Units is then adjusted to the greater of carrying value or fair market value as described above. As of
December 31, 2015
, the Redeemable Limited Partner Units have a redemption value of approximately
$566.8 million
, which represents the value of Common Shares that would be issued in exchange with the Redeemable Limited Partner Units.
The following table presents the changes in the redemption value of the Redeemable Limited Partners for the years ended
December 31, 2015
,
2014
and
2013
, respectively (amounts in thousands):
F-33
|
2015
|
2014
|
2013
|
||||||||||
|
Balance at January 1,
|
$
|
500,733
|
|
$
|
363,144
|
|
$
|
398,372
|
|
|||
|
Change in market value
|
64,378
|
|
139,818
|
|
(79,667
|
)
|
||||||
|
Change in carrying value
|
1,672
|
|
(2,229
|
)
|
44,439
|
|
||||||
|
Balance at December 31,
|
$
|
566,783
|
|
$
|
500,733
|
|
$
|
363,144
|
|
|||
EQR contributes all net proceeds from its various equity offerings (including proceeds from exercise of options for Common Shares) to ERPOP. In return for those contributions, EQR receives a number of OP Units in ERPOP equal to the number of Common Shares it has issued in the equity offering (or in the case of a preferred equity offering, a number of preference units in ERPOP equal in number and having the same terms as the preferred shares issued in the equity offering).
The following table presents the Operating Partnership's issued and outstanding “Preference Units” as of
December 31, 2015
and
2014
:
|
|
|
Amounts in thousands
|
||||||||||||
|
Redemption
Date (1) |
Annual
Dividend per Unit (2) |
December 31, 2015
|
December 31, 2014
|
|||||||||||
|
Preference Units:
|
|
|
|
|
|
|
|
|||||||
|
8.29% Series K Cumulative Redeemable Preference Units;
liquidation value $50 per unit; 745,600 units issued and outstanding at December 31, 2015 and 1,000,000 units issued and outstanding at December 31, 2014 (3) (4) |
12/10/26
|
|
$4.145
|
|
$
|
37,280
|
|
$
|
50,000
|
|
||||
|
|
|
|
|
$
|
37,280
|
|
$
|
50,000
|
|
|||||
|
(1)
|
On or after the redemption date, redeemable preference units may be redeemed for cash at the option of the Operating Partnership, in whole or in part, at a redemption price equal to the liquidation price per unit, plus accrued and unpaid distributions, if any, in conjunction with the concurrent redemption of the corresponding Company Preferred Shares.
|
|
(2)
|
Dividends on Preference Units are payable quarterly.
|
|
(3)
|
Effective January 26, 2015, the Operating Partnership repurchased and retired
196,400
Series K Preference Units with a par value of
$9.82 million
for total cash consideration of approximately
$12.7 million
, in conjunction with the concurrent redemption of the corresponding Company Preferred Shares. As a result of this partial redemption, the Operating Partnership incurred a cash charge of approximately
$2.8 million
which was recorded as a premium on the redemption of Preference Units.
|
|
(4)
|
Effective November 12, 2015, the Operating Partnership repurchased and retired
58,000
Series K Preference Units with a par value of
$2.9 million
for total cash consideration of approximately
$3.6 million
, in conjunction with the concurrent redemption of the corresponding Company Preferred Shares. As a result of this partial redemption, the Operating Partnership incurred a cash charge of approximately
$0.7 million
which was recorded as a premium on the redemption of Preference Units.
|
Other
EQR and ERPOP currently have an active universal shelf registration statement for the issuance of equity and debt securities that automatically became effective upon filing with the SEC on July 30, 2013 and expires on July 30, 2016. Per the terms of ERPOP's partnership agreement, EQR contributes the net proceeds of all equity offerings to the capital of ERPOP in exchange for additional OP Units (on a one-for-one Common Share per OP Unit basis) or preference units (on a one-for-one preferred share per preference unit basis).
On February 27, 2013, the Company issued
34,468,085
Common Shares to an affiliate of Lehman Brothers Holdings Inc. as partial consideration for the portion of the Archstone Portfolio acquired by the Company (as discussed in Note 4 below). The shares had a total value of
$1.9 billion
based on the February 27, 2013 closing price of EQR Common Shares of
$55.99
per share. Concurrent with this transaction, ERPOP issued
34,468,085
OP Units to EQR. On March 7, 2013, EQR filed a shelf registration statement relating to the resale of these shares by the selling shareholders.
In September 2009, the Company announced the establishment of an At-The-Market (“ATM”) share offering program which would allow EQR to sell Common Shares from time to time into the existing trading market at current market prices as well as through negotiated transactions. Per the terms of ERPOP's partnership agreement, EQR contributes the net proceeds from all equity offerings to the capital of ERPOP in exchange for additional OP Units (on a one-for-one Common Share per OP Unit basis). On July 30, 2013, the Board of Trustees approved an increase to the amount of shares which may be offered under the ATM program to
13.0 million
Common Shares and extended the program maturity to July 2016. EQR has not issued any shares under this program since September 14, 2012.
F-34
Effective July 30, 2013, the Board of Trustees approved an increase and modification to the Company's share repurchase program to allow for the potential repurchase of up to
13.0 million
Common Shares. Considering the repurchase activity for the year ended December 31, 2014 (see discussion below), EQR has remaining authorization to repurchase an additional
12,968,760
of its shares as of December 31, 2015.
During the year ended December 31, 2014, EQR repurchased
31,240
of its Common Shares at an average price of $
56.87
per share for total consideration of $
1.8 million
. These shares were retired subsequent to the repurchases. Concurrent with these transactions, ERPOP repurchased and retired
31,240
OP Units previously issued to EQR. All of the shares repurchased during the year ended December 31, 2014 were repurchased from employees at the then current market prices to cover the minimum statutory tax withholding obligations related to the vesting of employees' restricted shares. No shares were repurchased during the years ended December 31, 2015 and 2013.
During the year ended December 31, 2014, the Company acquired all of its partners' interests in
one
consolidated partially owned property consisting of
268
apartment units and
one
consolidated partially owned land parcel for
$5.5 million
. In conjunction with these transactions, the Company reduced paid in capital (included in general partner's capital in the Operating Partnership's financial statements) by
$2.3 million
, Noncontrolling Interests – Partially Owned Properties by
$2.2 million
and other liabilities by
$1.0 million
.
During the year ended December 31, 2014, the Operating Partnership issued the
3.00%
Series P Cumulative Redeemable Preference Units with a liquidation value of approximately
$18.4 million
in conjunction with the buyout of its partner's
95%
interest in a previously unconsolidated development property. The Series P Preference Units are classified as a liability due in part to the fact that the holder can put the units back to the Operating Partnership for cash. Dividends are paid quarterly on the Series P Preference Units. See Note 4 for further discussion of the buyout.
|
4.
|
Real Estate, Real Estate Held for Sale and Lease Intangibles
|
The following table summarizes the carrying amounts for the Company’s investment in real estate (at cost) as of
December 31, 2015
and
2014
(amounts in thousands):
|
2015
|
2014
|
|||||||
|
Land
|
$
|
5,864,046
|
|
$
|
6,295,404
|
|
||
|
Depreciable property:
|
|
|
|
|
||||
|
Buildings and improvements
|
16,336,829
|
|
17,974,337
|
|
||||
|
Furniture, fixtures and equipment
|
1,207,098
|
|
1,365,276
|
|
||||
|
In-Place lease intangibles
|
483,160
|
|
511,891
|
|
||||
|
Projects under development:
|
|
|
|
|
||||
|
Land
|
284,995
|
|
466,764
|
|
||||
|
Construction-in-progress
|
837,381
|
|
877,155
|
|
||||
|
Land held for development:
|
|
|
|
|
||||
|
Land
|
120,007
|
|
145,366
|
|
||||
|
Construction-in-progress
|
48,836
|
|
39,190
|
|
||||
|
Investment in real estate
|
25,182,352
|
|
27,675,383
|
|
||||
|
Accumulated depreciation
|
(4,905,406
|
)
|
(5,432,805
|
)
|
||||
|
Investment in real estate, net
|
$
|
20,276,946
|
|
$
|
22,242,578
|
|
||
The following table summarizes the carrying amounts for the Company's above and below market ground and retail lease intangibles as of
December 31, 2015
and
2014
(amounts in thousands):
F-35
|
Description
|
Balance Sheet Location
|
2015
|
2014
|
|||||||
|
Assets
|
||||||||||
|
Ground lease intangibles – below market
|
Other Assets
|
$
|
178,251
|
|
$
|
178,251
|
|
|||
|
Retail lease intangibles – above market
|
Other Assets
|
1,260
|
|
1,260
|
|
|||||
|
Lease intangible assets
|
179,511
|
|
179,511
|
|
||||||
|
Accumulated amortization
|
(13,451
|
)
|
(8,913
|
)
|
||||||
|
Lease intangible assets, net
|
$
|
166,060
|
|
$
|
170,598
|
|
||||
|
Liabilities
|
||||||||||
|
Ground lease intangibles – above market
|
Other Liabilities
|
$
|
2,400
|
|
$
|
2,400
|
|
|||
|
Retail lease intangibles – below market
|
Other Liabilities
|
5,270
|
|
5,270
|
|
|||||
|
Lease intangible liabilities
|
7,670
|
|
7,670
|
|
||||||
|
Accumulated amortization
|
(3,414
|
)
|
(2,258
|
)
|
||||||
|
Lease intangible liabilities, net
|
$
|
4,256
|
|
$
|
5,412
|
|
||||
During the years ended
December 31, 2015
,
2014
and
2013
, the Company amortized approximately
$4.3 million
,
$4.3 million
and
$3.6 million
, respectively, of above and below market ground lease intangibles which is included (net increase) in property and maintenance expense in the accompanying consolidated statements of operations and comprehensive income and approximately
$0.9 million
,
$1.1 million
and
$2.7 million
, respectively, of above and below market retail lease intangibles which is included (net increase) in rental income in the accompanying consolidated statements of operations and comprehensive income.
The following table provides a summary of the aggregate amortization expense for above and below market ground lease intangibles and retail lease intangibles for each of the next five years (amounts in thousands):
|
2016
|
2017
|
2018
|
2019
|
2020
|
||||||||||||||||
|
Ground lease intangibles
|
$
|
4,321
|
|
$
|
4,321
|
|
$
|
4,321
|
|
$
|
4,321
|
|
$
|
4,321
|
|
|||||
|
Retail lease intangibles
|
(896
|
)
|
(540
|
)
|
(71
|
)
|
(71
|
)
|
(71
|
)
|
||||||||||
|
Total
|
$
|
3,425
|
|
$
|
3,781
|
|
$
|
4,250
|
|
$
|
4,250
|
|
$
|
4,250
|
|
|||||
Acquisitions and Dispositions
During the year ended
December 31, 2015
, the Company acquired the entire equity interest in the following from unaffiliated parties (purchase price in thousands):
|
Properties
|
Apartment Units
|
Purchase Price
|
||||||||
|
Rental Properties – Consolidated (1)
|
4
|
|
625
|
|
$
|
296,037
|
|
|||
|
Land Parcels (2)
|
—
|
|
—
|
|
27,800
|
|
||||
|
Total
|
4
|
|
625
|
|
$
|
323,837
|
|
|||
|
(1)
|
Purchase price includes an allocation of approximately
$44.7 million
to land and
$251.3 million
to depreciable property.
|
|
(2)
|
The Company acquired
three
contiguous land parcels in San Francisco during 2015 which will be combined for future development.
|
During the year ended
December 31, 2014
, the Company acquired the entire equity interest in the following from unaffiliated parties (purchase price in thousands):
|
Properties
|
Apartment Units
|
Purchase Price
|
||||||||
|
Rental Properties – Consolidated (1)
|
6
|
|
1,353
|
|
$
|
469,850
|
|
|||
|
Land Parcels
|
—
|
|
—
|
|
28,790
|
|
||||
|
Total
|
6
|
|
1,353
|
|
$
|
498,640
|
|
|||
|
(1)
|
Purchase price includes an allocation of approximately
$95.3 million
to land and
$374.6 million
to depreciable property.
|
F-36
The Company also acquired the
95%
equity interest it did not previously own in one unconsolidated development project with a stabilized real estate value of
$87.5 million
and an adjusted purchase price of
$64.2 million
. The Company paid cash of approximately
$44.8 million
and issued the Series P Preference Units with a liquidation value of approximately
$18.4 million
to complete the buyout (see Note 3). The Company recognized a revaluation loss of approximately
$3.5 million
, which is included in income (loss) from investments in unconsolidated entities in the accompanying consolidated statements of operations and comprehensive income, in conjunction with this buyout.
During the year ended
December 31, 2015
, the Company disposed of the following to unaffiliated parties (sales price in thousands):
|
Properties
|
Apartment Units
|
Sales Price
|
||||||||
|
Consolidated:
|
||||||||||
|
Rental Properties (1)
|
8
|
|
1,857
|
|
$
|
513,312
|
|
|||
|
Total
|
8
|
|
1,857
|
|
$
|
513,312
|
|
|||
|
(1)
|
Includes a
193,230
square foot medical office building adjacent to our Longfellow Place property in Boston with a sales price of approximately
$123.3 million
which is not included in the Company's property and apartment unit counts.
|
The Company recognized a net gain on sales of real estate properties of approximately
$335.1 million
on the above sales.
During the year ended
December 31, 2014
, the Company disposed of the following to unaffiliated parties (sales price in thousands):
|
Properties
|
Apartment Units
|
Sales Price
|
||||||||
|
Consolidated:
|
||||||||||
|
Rental Properties
|
10
|
|
3,092
|
|
$
|
466,968
|
|
|||
|
Land Parcels (three)
|
—
|
|
—
|
|
62,602
|
|
||||
|
Unconsolidated:
|
||||||||||
|
Rental Properties (1)
|
1
|
|
388
|
|
62,500
|
|
||||
|
Total
|
11
|
|
3,480
|
|
$
|
592,070
|
|
|||
|
(1)
|
The Company owned an
85%
interest in this unconsolidated rental property. Sale price listed is the gross sale price.
|
The Company recognized a net gain on sales of real estate properties of approximately
$212.7 million
, a net gain on sales of unconsolidated entities of approximately
$4.9 million
(included in income (loss) from investments in unconsolidated entities in the accompanying consolidated statements of operations and comprehensive income) and a net gain on sales of land parcels of approximately
$5.3 million
on the above sales.
Starwood Disposition
Following the approval by the Company's Board of Trustees, the Company executed an agreement with controlled affiliates of Starwood Capital Group ("Starwood") on October 23, 2015 to sell a portfolio of
72
operating properties consisting of
23,262
apartment units located in
five
markets across the United States for
$5.365 billion
(the "Starwood Transaction"). As of December 31, 2015, Starwood had deposited
$250.0 million
in cash into escrow as earnest money, which was non-refundable unless the Company defaulted on the sales agreement. On January 26 and 27, 2016, the Company closed on the sale of all of the portfolio described above. As a result, the Starwood Transaction meets the held for sale criteria at
December 31, 2015
. In accordance with this classification, the Company ceased depreciation on all assets in the Starwood portfolio as of November 1, 2015 and the following assets are classified as held for sale in the accompanying consolidated balance sheets at
December 31, 2015
(amounts in thousands):
F-37
|
2015
|
||||
|
Land
|
$
|
602,737
|
|
|
|
Depreciable property:
|
||||
|
Buildings and improvements
|
2,386,489
|
|
||
|
Furniture, fixtures and equipment
|
335,565
|
|
||
|
In-Place lease intangibles
|
35,554
|
|
||
|
Real estate held for sale before accumulated depreciation
|
3,360,345
|
|
||
|
Accumulated depreciation
|
(1,179,210
|
)
|
||
|
Real estate held for sale
|
$
|
2,181,135
|
|
|
The following table provides the operating segments/locations of the properties and apartment units sold in the Starwood Transaction, which represents substantially all of the assets in the Company's non-core South Florida and Denver markets and certain non-core assets in the Washington D.C., Seattle and other (Inland Empire, CA) markets. The sale of these properties represents the continuation of the Company's long-term strategy of investing in high barrier to entry/core urban markets. See Notes 11 and 18 for further discussion.
|
Markets/Metro Areas
|
Properties
|
Apartment Units
|
||||
|
Non-core – South Florida
|
33
|
|
10,742
|
|
||
|
Non-core – Denver
|
18
|
|
6,635
|
|
||
|
Washington D.C.
|
10
|
|
3,020
|
|
||
|
Seattle
|
8
|
|
1,721
|
|
||
|
Non-core – other (Inland Empire, CA)
|
3
|
|
1,144
|
|
||
|
Total
|
72
|
|
23,262
|
|
||
Archstone Acquisition
On February 27, 2013, the Company, AvalonBay Communities, Inc. (“AVB”) and certain of their respective subsidiaries completed their previously announced acquisition (the "Archstone Acquisition" or the "Archstone Transaction") from Archstone Enterprise LP ("Archstone" or “Enterprise”) (which subsequently changed its name to Jupiter Enterprise LP), an affiliate of Lehman Brothers Holdings Inc. (“Lehman”) and its affiliates, of all of the assets of Enterprise (including interests in various entities affiliated with Enterprise), constituting a portfolio of apartment properties and other assets (the “Archstone Portfolio”).
The Company acquired assets representing approximately
60%
of the Archstone Portfolio which consisted principally of high-quality apartment properties in major markets in the United States. The acquisition allowed the Company to accelerate the completion of its strategic shift into coastal apartment markets. Pursuant to the Archstone Transaction, the Company acquired directly or indirectly,
71
wholly owned, stabilized properties consisting of
20,160
apartment units,
one
partially owned and consolidated stabilized property consisting of
432
apartment units,
one
partially owned and unconsolidated stabilized property consisting of
336
apartment units,
three
consolidated master-leased properties consisting of
853
apartment units,
four
projects in various stages of construction (
two
consolidated and
two
unconsolidated) consisting of
964
apartment units and
fourteen
land sites for approximately
$9.0 billion
. During the year ended December 31, 2013, the Company recorded revenues and net operating income ("NOI") of
$514.7 million
and
$352.8 million
, respectively, from the acquired assets.
The consideration paid by the Company in connection with the Archstone Acquisition consisted of cash of approximately
$4.0 billion
(inclusive of
$2.0 billion
of Archstone secured mortgage principal paid off in conjunction with the closing),
34,468,085
Common Shares (which shares had a total value of
$1.9 billion
based on the February 27, 2013 closing price of EQR common shares of
$55.99
per share) issued to the seller and the assumption of approximately
$3.1 billion
of mortgage debt (inclusive of a net mark-to-market premium of
$127.9 million
) and approximately
60%
of all of the other assets and liabilities related to the Archstone Portfolio. The cash consideration was funded with proceeds from the issuance of
21,850,000
Common Shares (which
shares had a total value of approximately
$1.2 billion
based on a price of
$54.75
per share) in the November/December 2012 public equity offering, asset sales of approximately
$4.5 billion
that were completed during the year ended
December 31, 2013
, the Company's
$750.0 million
unsecured term loan facility (which was subsequently paid off in the second quarter of 2014) and the Company's revolving credit facility.
The Company owns the building and improvements and leases the land underlying the improvements under long-term ground leases that expire beginning in 2042 and running through 2103 for
nine
of the operating properties acquired and discussed
F-38
above. These properties are consolidated and reflected as real estate assets while the ground leases are accounted for as operating leases. The Company also leases the
three
master-leased properties discussed above to third party operators and earns monthly net rental income.
The Company accounted for the acquisition under the acquisition method in accordance with Accounting Standards Codification ("ASC") 805,
Business Combinations
(“ASC 805”), and the accounting for this business combination was complete and final as of February 28, 2014. The following table summarizes the acquisition date fair values of the assets acquired and liabilities assumed, which the Company determined using Level 1, Level 2 and Level 3 inputs (amounts in thousands):
|
Land
|
$
|
2,239,000
|
|
|
|
Depreciable property:
|
||||
|
Buildings and improvements
|
5,765,538
|
|
||
|
Furniture, fixtures and equipment
|
61,470
|
|
||
|
In-Place lease intangibles
|
304,830
|
|
||
|
Projects under development
|
36,583
|
|
||
|
Land held for development
|
244,097
|
|
||
|
Investments in unconsolidated entities
|
230,608
|
|
||
|
Other assets
|
195,260
|
|
||
|
Other liabilities
|
(108,997
|
)
|
||
|
Net assets acquired
|
$
|
8,968,389
|
|
|
The fair values of investment in real estate were determined using internally developed models that were based on market assumptions and comparable sales data as well as external valuations performed by unrelated third parties. The market assumptions used as inputs to the Company’s fair value model include construction costs, leasing assumptions, growth rates, discount rates, terminal capitalization rates and development yields. The Company used data on its existing portfolio of properties and its recent acquisition and development properties, as well as similar market data from third party sources, when available, in determining these inputs (Level 2 and 3). The fair value of Noncontrolling Interests was calculated similar to the investment in real estate described above. The fair value of mortgage debt was calculated using indicative rates, leverage and coverage provided by lenders of similar loans (Level 2). The Common Shares issued to an affiliate of Lehman Brothers Holdings Inc. were valued using the quoted market price of Common Shares (Level 1).
The following table summarizes the acquisition date fair values of the above and below market ground and retail lease intangibles, which we determined using Level 2 and Level 3 inputs (amounts in thousands):
|
Description
|
Balance Sheet Location
|
Fair Value
|
||||
|
Ground lease intangibles – below market
|
Other Assets
|
$
|
178,251
|
|
||
|
Retail lease intangibles – above market
|
Other Assets
|
1,260
|
|
|||
|
Ground lease intangibles – above market
|
Other Liabilities
|
2,400
|
|
|||
|
Retail lease intangibles – below market
|
Other Liabilities
|
8,040
|
|
|||
As of
December 31, 2015
, the Company has incurred cumulative Archstone-related expenses of approximately
$83.1 million
, of which approximately
$13.5 million
of this total was financing-related and approximately
$69.6 million
was merger costs. During the years ended
December 31, 2015
and
2014
, the Company expensed nominal amounts of direct merger costs. During the year ended December 31, 2013, the Company expensed
$19.9 million
of direct merger costs primarily related to investment banking and legal/accounting fees, which were included in other expenses in the accompanying consolidated statements of operations and comprehensive income. During the years ended December 31, 2015, 2014 and 2013, the Company also expensed
$2.7 million
,
$4.3 million
and
$54.0 million
, respectively, of indirect merger costs primarily related to severance and retention obligations, office leases and German operations/sales that were incurred through our
60%
interest in unconsolidated joint ventures with AVB, which were included in income (loss) from investments in unconsolidated entities in the accompanying consolidated statements of operations and comprehensive income. The indirect merger costs expensed during the year ended
December 31, 2015
were offset by
$18.6 million
received related to the favorable settlement of a lawsuit, which reduced income (loss) from investments in unconsolidated entities in the accompanying consolidated statements of operations and comprehensive income. Finally, during the year ended December 31, 2013, the Company expensed
$2.5 million
of financing-related costs, which were
F-39
included in interest expense in the accompanying consolidated statements of operations and comprehensive income.
Unaudited Pro Forma Financial Information
Equity Residential
The following table illustrates the effect on net income, earnings per share – basic and earnings per share – diluted as if the Company had consummated the Archstone Acquisition as of January 1, 2012 (amounts in thousands, except per share amounts):
|
Year Ended December 31, 2013
|
||||
|
Total revenues
|
$
|
2,485,438
|
|
|
|
Income from continuing operations
|
203,286
|
|
||
|
Discontinued operations, net
|
2,074,072
|
|
||
|
Net income
|
2,277,358
|
|
||
|
Net income available to Common Shares
|
2,183,756
|
|
||
|
Earnings per share - basic:
|
||||
|
Net income available to Common Shares
|
$
|
6.07
|
|
|
|
Weighted average Common Shares outstanding (1)
|
359,688
|
|
||
|
Earnings per share - diluted:
|
||||
|
Net income available to Common Shares
|
$
|
6.05
|
|
|
|
Weighted average Common Shares outstanding (1)
|
375,861
|
|
||
|
(1)
|
Includes an adjustment for Common Shares issued to the public in November/December 2012 and to an affiliate of Lehman Brothers Holdings Inc. in February 2013 as partial consideration for the Archstone Acquisition.
|
ERP Operating Limited Partnership
The following table illustrates the effect on net income, earnings per Unit – basic and earnings per Unit – diluted as if the Operating Partnership had consummated the Archstone Acquisition as of January 1, 2012 (amounts in thousands, except per Unit amounts):
|
Year Ended December 31, 2013
|
||||
|
Total revenues
|
$
|
2,485,438
|
|
|
|
Income from continuing operations
|
203,286
|
|
||
|
Discontinued operations, net
|
2,074,072
|
|
||
|
Net income
|
2,277,358
|
|
||
|
Net income available to Units
|
2,273,798
|
|
||
|
Earnings per Unit - basic:
|
||||
|
Net income available to Units
|
$
|
6.07
|
|
|
|
Weighted average Units outstanding (1)
|
373,421
|
|
||
|
Earnings per Unit - diluted:
|
||||
|
Net income available to Units
|
$
|
6.05
|
|
|
|
Weighted average Units outstanding (1)
|
375,861
|
|
||
|
(1)
|
Includes an adjustment for Common Shares issued to the public in November/December 2012 and to an affiliate of Lehman Brothers Holdings Inc. in February 2013 as partial consideration for the Archstone Acquisition. Concurrent with these transactions, ERPOP issued the same number of OP Units to EQR.
|
For the year ended December 31, 2013, acquisition costs of
$19.9 million
and severance/retention and other costs of
$54.1 million
related to the Archstone Acquisition are not expected to have a continuing impact on the Company's financial results and therefore have been excluded from these pro forma results. The pro forma results also do not include the impact of any synergies or lower borrowing costs that the Company has or may achieve as a result of the acquisition or any strategies that management has or may consider in order to more efficiently manage the Company's operations, nor do they give pro forma effect to any other acquisitions, dispositions or capital markets transactions (excluding the equity offering in November/December 2012 which proceeds were used for the Archstone Acquisition) that the Company completed during the period presented. These pro forma results are not necessarily indicative of the operating results that would have been obtained had the Archstone Acquisition occurred
F-40
at the beginning of the period presented, nor are they necessarily indicative of future operating results.
Other
In December 2011, the Company and Toll Brothers (NYSE: TOL) jointly acquired a vacant land parcel at 400 Park Avenue South in New York City. The Company's and Toll Brothers' allocated portions of the purchase price were approximately
$76.1 million
and
$57.9 million
, respectively. The acquisition was financed through contributions by the Company and Toll Brothers of approximately
$102.5 million
and
$75.7 million
, respectively, which included the land purchase noted above, restricted deposits and taxes and fees. Until the core and shell of the building were complete, the building and land were owned jointly and were required to be consolidated on the Company's balance sheet as the Company was the managing member and Toll Brothers did not have substantive kick-out or participating rights. In July 2015, the Company recorded the master condominium declaration for this development project and as a result, the Toll Brothers’ portion of the property was deconsolidated from the Company's balance sheet. The Company now solely owns the rental portion of the building (floors 2-22) and the ground floor retail and Toll Brothers solely owns the for sale portion of the building (floors 23-40). The joint venture no longer owns any real property. In conjunction with this transaction, the Company reduced investment in real estate by
$116.7 million
, noncontrolling interest by
$117.3 million
and accrued retainage by
$1.1 million
and increased other liabilities by
$1.7 million
(to account for Toll Brothers' restricted cash still held by the Company). The deconsolidation of the Toll Brothers' portion of the project had no impact on the consolidated results of operations and comprehensive income.
|
5.
|
Commitments to Acquire/Dispose of Real Estate
|
The Company has entered into separate agreements to acquire the following (purchase price in thousands):
|
Properties
|
Apartment Units
|
Purchase Price
|
||||||||
|
Rental Properties
|
3
|
|
549
|
|
$
|
242,880
|
|
|||
|
Total
|
3
|
|
549
|
|
$
|
242,880
|
|
|||
In addition to the properties that were subsequently disposed of as discussed in Note 18, the Company has entered into separate agreements to dispose of the following (sales price in thousands):
|
Properties
|
Apartment Units
|
Sales Price
|
||||||||
|
Land Parcels (two)
|
—
|
|
—
|
|
$
|
14,886
|
|
|||
|
Total
|
—
|
|
—
|
|
$
|
14,886
|
|
|||
The closings of these pending transactions are subject to certain conditions and restrictions, therefore, there can be no assurance that these transactions will be consummated or that the final terms will not differ in material respects from those summarized in the preceding paragraphs.
|
6.
|
Investments in Partially Owned Entities
|
The Company has co-invested in various properties with unrelated third parties which are either consolidated or accounted for under the equity method of accounting (unconsolidated). The following tables and information summarize the Company’s investments in partially owned entities as of
December 31, 2015
(amounts in thousands except for project and apartment unit amounts):
F-41
|
Consolidated
|
Unconsolidated
|
|||||||
|
Operating
|
Operating
|
|||||||
|
Total projects
|
19
|
|
3
|
|
||||
|
Total apartment units
|
3,771
|
|
1,281
|
|
||||
|
Balance sheet information at 12/31/15 (at 100%):
|
||||||||
|
ASSETS
|
||||||||
|
Investment in real estate
|
$
|
689,574
|
|
$
|
290,891
|
|
||
|
Accumulated depreciation
|
(216,697
|
)
|
(30,662
|
)
|
||||
|
Investment in real estate, net
|
472,877
|
|
260,229
|
|
||||
|
Cash and cash equivalents
|
23,445
|
|
7,044
|
|
||||
|
Investments in unconsolidated entities
|
49,408
|
|
—
|
|
||||
|
Deposits – restricted
|
346
|
|
289
|
|
||||
|
Deferred financing costs, net
|
1,792
|
|
6
|
|
||||
|
Other assets
|
26,567
|
|
448
|
|
||||
|
Total assets
|
$
|
574,435
|
|
$
|
268,016
|
|
||
|
LIABILITIES AND EQUITY/CAPITAL
|
||||||||
|
Mortgage notes payable (1)
|
$
|
343,429
|
|
$
|
174,846
|
|
||
|
Accounts payable & accrued expenses
|
1,698
|
|
733
|
|
||||
|
Accrued interest payable
|
1,223
|
|
691
|
|
||||
|
Other liabilities
|
786
|
|
347
|
|
||||
|
Security deposits
|
2,036
|
|
645
|
|
||||
|
Total liabilities
|
349,172
|
|
177,262
|
|
||||
|
Noncontrolling Interests – Partially Owned Properties/Partners' equity
|
4,608
|
|
90,878
|
|
||||
|
Company equity/General and Limited Partners' Capital
|
220,655
|
|
(124
|
)
|
||||
|
Total equity/capital
|
225,263
|
|
90,754
|
|
||||
|
Total liabilities and equity/capital
|
$
|
574,435
|
|
$
|
268,016
|
|
||
|
Consolidated
|
Unconsolidated
|
|||||||
|
Operating
|
Operating
|
|||||||
|
Operating information for the year ended 12/31/15 (at 100%):
|
||||||||
|
Operating revenue
|
$
|
94,349
|
|
$
|
32,285
|
|
||
|
Operating expenses
|
26,081
|
|
12,061
|
|
||||
|
Net operating income
|
68,268
|
|
20,224
|
|
||||
|
Depreciation
|
22,216
|
|
12,350
|
|
||||
|
General and administrative/other
|
330
|
|
255
|
|
||||
|
Operating income
|
45,722
|
|
7,619
|
|
||||
|
Interest and other income
|
12
|
|
(1
|
)
|
||||
|
Other expenses
|
(50
|
)
|
—
|
|
||||
|
Interest:
|
||||||||
|
Expense incurred, net
|
(15,459
|
)
|
(9,390
|
)
|
||||
|
Amortization of deferred financing costs
|
(349
|
)
|
(2
|
)
|
||||
|
Income (loss) before income and other taxes and (loss)
from investments in unconsolidated entities |
29,876
|
|
(1,774
|
)
|
||||
|
Income and other tax (expense) benefit
|
(35
|
)
|
(18
|
)
|
||||
|
(Loss) from investments in unconsolidated entities
|
(1,501
|
)
|
—
|
|
||||
|
Net income (loss)
|
$
|
28,340
|
|
$
|
(1,792
|
)
|
||
|
(1)
|
All debt is non-recourse to the Company.
|
Note: The above tables exclude the Company's interests in unconsolidated joint ventures entered into with AVB in connection with the Archstone Transaction. These ventures owned certain non-core Archstone assets and succeeded to certain residual Archstone liabilities/litigation, as well as responsibility for tax protection arrangements and third-party preferred interests in former Archstone
F-42
subsidiaries. The preferred interests had an aggregate liquidation value of
$42.2 million
at
December 31, 2015
. The ventures are owned
60%
by the Company and
40%
by AVB.
During the year ended
December 31, 2014
, the Company and its joint venture partners sold
one
consolidated partially owned land parcel and recognized a net gain on the sale of approximately
$1.1 million
as well as
one
unconsolidated partially owned property consisting of
388
apartment units and recognized a net gain on the sale of approximately
$4.9 million
.
The Company is the controlling partner in various consolidated partnership properties having an aggregate noncontrolling interest book value of
$4.6 million
at
December 31, 2015
. The Company does not have any variable interest entities as of
December 31, 2015
.
Operating Properties
The Company has a
75%
equity interest in the Wisconsin Place joint venture. The project contains a mixed-use site located in Chevy Chase, Maryland consisting of residential, retail, office and accessory uses, including underground parking facilities. The joint venture owns the
432
unit residential component, but has no ownership interest in the retail and office components. At
December 31, 2015
, the residential component had a net book value of
$175.8 million
. The Company is the managing member and its partner does not have substantive kick-out or participating rights. As a result, the entity that owns the residential component is required to be consolidated on the Company's balance sheet. The joint venture also retains an unconsolidated interest in an entity that owns the land underlying the entire project and owns and operates the parking facility. At
December 31, 2015
, the basis of this investment was
$49.4 million
. The Company does not have substantive kick-out or participating rights in the entity. As a result, the entity that owns the land and owns and operates the parking facility is unconsolidated and recorded using the equity method of accounting.
The Company has a
20%
equity interest in the Waterton Tenside joint venture which owns a
336
unit apartment property located in Atlanta, Georgia and had a basis of
$3.9 million
at
December 31, 2015
. The partner is the managing member and developed the project. The project is encumbered by a non-recourse mortgage loan that has a current outstanding balance of
$29.4 million
, bears interest at
3.66%
and matures
December 1, 2018
. The Company does not have substantive kick-out or participating rights. As a result, the entity is unconsolidated and recorded using the equity method of accounting.
The Company has a
20%
equity interest in each of the Nexus Sawgrass and Domain joint ventures. The Nexus Sawgrass joint venture owns a
501
unit apartment property located in Sunrise, Florida and had a basis of
$5.1 million
at
December 31, 2015
. The Domain joint venture owns a
444
unit apartment property located in San Jose, California and had a basis of
$10.0 million
at
December 31, 2015
. Nexus Sawgrass and Domain were completed and stabilized during the quarters ended September 30, 2014 and March 31, 2015, respectively. Construction on both projects was predominantly funded with long-term, non-recourse secured loans from the partner. The mortgage loan on Nexus Sawgrass has a current unconsolidated outstanding balance of
$48.6 million
, bears interest at
5.60%
and matures
January 1, 2021
. The mortgage loan on Domain has a current unconsolidated outstanding balance of
$96.8 million
, bears interest at
5.75%
and matures
January 1, 2022
. While the Company is the managing member of both of the joint ventures, was responsible for constructing both of the projects and gave certain construction cost overrun guarantees, the joint venture partner has significant participating rights and has active involvement in and oversight of the ongoing projects. As a result, the entities are unconsolidated and recorded using the equity method of accounting. The Company currently has no further funding obligations related to these projects.
Other
On February 27, 2013, in connection with the Archstone Acquisition, subsidiaries of the Company and AVB entered into three limited liability company agreements (collectively, the “Residual JV”). The Residual JV owned certain non-core Archstone assets and succeeded to certain residual Archstone liabilities/litigation. The Residual JV is owned
60%
by the Company and
40%
by AVB. The Company's initial investment was
$147.6 million
and the Company's basis at
December 31, 2015
was a net obligation of
$0.3 million
. The Residual JV is managed by a Management Committee consisting of two members from each of the Company and AVB. Both partners have equal participation in the Management Committee and all significant participating rights are shared by both partners. As a result, the Residual JV is unconsolidated and recorded using the equity method of accounting.
During the years ended December 31, 2015, 2014 and 2013, the Company received approximately
$51.0 million
,
$83.5 million
and
$18.9 million
, respectively, in distributions from the Residual JV as a result of the winddown/sale of assets owned by the Residual JV and litigation settlements received by the Residual JV. The Company's pro rata share of the proceeds/distributions that have been repatriated to the Residual JV and received by the Company as a result of the German dispositions and winddown activity was approximately
$3.5 million
,
$79.6 million
and
$18.9 million
during the years ended December 31, 2015, 2014 and 2013, respectively. The Company's pro rata share of the proceeds related to the sale of other real estate assets owned by the
F-43
Residual JV was approximately
$30.7 million
and
$3.9 million
, respectively, during the years ended December 31, 2015 and 2014. The Company’s pro rata share of the litigation settlements received by the Residual JV was approximately
$16.8 million
during the year ended December 31, 2015. As of
December 31, 2015
, the Residual JV has sold all of the real estate assets that were acquired as part of the Archstone Acquisition, including all of the German assets.
On February 27, 2013, in connection with the Archstone Acquisition, a subsidiary of the Company and AVB entered into a limited liability company agreement (the “Legacy JV”), through which they assumed obligations of Archstone in the form of preferred interests, some of which are governed by tax protection arrangements. During the year ended
December 31, 2015
, the Legacy JV distributed
$27.9 million
to its preferred interests holders for accrued and unpaid dividends, of which the Company's pro rata share was approximately
$16.7 million
. At
December 31, 2015
, the remaining preferred interests had an aggregate liquidation value of
$42.2 million
, our share of which is included in other liabilities in the accompanying consolidated balance sheets. Obligations of the Legacy JV are borne
60%
by the Company and
40%
by AVB. The Legacy JV is managed by a Management Committee consisting of two members from each of the Company and AVB. Both partners have equal participation in the Management Committee and all significant participating rights are shared by both partners. As a result, the Legacy JV is unconsolidated and recorded using the equity method of accounting.
|
7.
|
Deposits –
Restricted and Escrow Deposits – Mortgage
|
The following table presents the Company’s restricted deposits as of
December 31, 2015
and
2014
(amounts in thousands):
|
December 31,
2015 |
December 31,
2014 |
|||||||
|
Earnest money on pending acquisitions
|
$
|
1,000
|
|
$
|
580
|
|
||
|
Restricted deposits on real estate investments
|
6,077
|
|
24,701
|
|
||||
|
Resident security and utility deposits
|
48,458
|
|
46,516
|
|
||||
|
Other
|
358
|
|
506
|
|
||||
|
Totals
|
$
|
55,893
|
|
$
|
72,303
|
|
||
The following table presents the Company’s escrow deposits as of
December 31, 2015
and
2014
(amounts in thousands):
|
December 31,
2015 |
December 31,
2014 |
|||||||
|
Real estate taxes and insurance
|
$
|
1,977
|
|
$
|
2,235
|
|
||
|
Replacement reserves
|
3,962
|
|
3,431
|
|
||||
|
Mortgage principal reserves/sinking funds
|
50,155
|
|
41,567
|
|
||||
|
Other
|
852
|
|
852
|
|
||||
|
Totals
|
$
|
56,946
|
|
$
|
48,085
|
|
||
|
8.
|
Debt
|
EQR does not have any indebtedness as all debt is incurred by the Operating Partnership. EQR guarantees the Operating Partnership’s revolving credit facility up to the maximum amount and for the full term of the facility.
Mortgage Notes Payable
As of
December 31, 2015
, the Company had outstanding mortgage debt of approximately
$4.7 billion
.
During the year ended
December 31, 2015
, the Company repaid
$368.5 million
of mortgage loans.
The Company recorded
$0.6 million
of write-offs of unamortized deferred financing costs during the year ended
December 31, 2015
as additional interest expense related to debt extinguishment of mortgages. The Company also recorded
$1.4 million
of write-offs of net unamortized premiums during the year ended
December 31, 2015
as a reduction of interest expense related to debt extinguishment of mortgages.
As of
December 31, 2015
, the Company had
$668.8 million
of secured debt subject to third party credit enhancement.
As of
December 31, 2015
, scheduled maturities for the Company’s outstanding mortgage indebtedness were at various dates through
May 1, 2061
. At
December 31, 2015
, the interest rate range on the Company’s mortgage debt was
0.01%
to
7.25%
.
F-44
During the year ended
December 31, 2015
, the weighted average interest rate on the Company’s mortgage debt was
4.23%
.
The historical cost, net of accumulated depreciation, of encumbered properties was
$6.0 billion
and
$6.9 billion
at
December 31, 2015
and
2014
, respectively.
As of
December 31, 2014
, the Company had outstanding mortgage debt of approximately
$5.1 billion
.
During the year ended
December 31, 2014
, the Company:
|
▪
|
Repaid
$100.7 million
of mortgage loans; and
|
|
▪
|
Assumed
$28.9 million
of mortgage debt on
one
acquired property.
|
The Company recorded approximately
$0.3 million
of prepayment penalties during the year ended
December 31, 2014
as additional interest expense related to debt extinguishment of mortgages. The Company also recorded
$1.9 million
of write-offs of net unamortized premiums during the year ended
December 31, 2014
as a reduction of interest expense related to debt extinguishment of mortgages.
As of
December 31, 2014
, the Company had
$700.5 million
of secured debt subject to third party credit enhancement.
As of
December 31, 2014
, scheduled maturities for the Company’s outstanding mortgage indebtedness were at various dates through
May 1, 2061
. At
December 31, 2014
, the interest rate range on the Company’s mortgage debt was
0.03%
to
7.25%
. During the year ended
December 31, 2014
, the weighted average interest rate on the Company’s mortgage debt was
4.21%
.
Notes
The following tables summarize the Company’s unsecured note balances and certain interest rate and maturity date information as of and for the years ended
December 31, 2015
and
2014
, respectively:
|
December 31, 2015
(Amounts in thousands) |
Net Principal Balance
|
Interest Rate Ranges
|
Weighted Average Interest Rate
|
Maturity Date Ranges
|
||||||
|
Fixed Rate Public Notes (1)
|
$
|
5,423,012
|
|
3.00% - 7.57%
|
5.30%
|
2016 - 2045
|
||||
|
Floating Rate Public Notes (1)
|
453,340
|
|
(1)
|
0.93%
|
2019
|
|||||
|
Totals
|
$
|
5,876,352
|
|
|
|
|
||||
|
December 31, 2014
(Amounts in thousands) |
Net Principal Balance
|
Interest Rate Ranges
|
Weighted Average Interest Rate
|
Maturity Date Ranges
|
||||||
|
Fixed Rate Public Notes (1)
|
$
|
4,974,154
|
|
3.00% - 7.57%
|
5.45%
|
2015 - 2044
|
||||
|
Floating Rate Public Notes (1)
|
451,192
|
|
(1)
|
1.15%
|
2019
|
|||||
|
Totals
|
$
|
5,425,346
|
|
|
|
|
||||
|
(1)
|
Fair value interest rate swaps convert the
$450.0 million
2.375%
notes due July 1, 2019 to a floating interest rate of 90-Day LIBOR plus
0.61%
.
|
The Company’s unsecured public debt contains certain financial and operating covenants including, among other things, maintenance of certain financial ratios. The Company was in compliance with its unsecured public debt covenants for both the years ended
December 31, 2015
and
2014
.
EQR and ERPOP currently have an active universal shelf registration statement for the issuance of equity and debt securities that automatically became effective upon filing with the SEC on July 30, 2013 and expires on July 30, 2016. Per the terms of ERPOP's partnership agreement, EQR contributes the net proceeds of all equity offerings to the capital of ERPOP in exchange for additional OP Units (on a one-for-one Common Share per OP Unit basis) or preference units (on a one-for-one preferred share per preference unit basis).
During the year ended
December 31, 2015
, the Company:
|
▪
|
Repaid
$300.0 million
of
6.584%
unsecured notes at maturity;
|
|
▪
|
Issued
$450.0 million
of ten-year
3.375%
fixed rate public notes, receiving net proceeds of
$447.5 million
before underwriting fees, hedge termination costs and other expenses, at an all-in effective interest rate of
3.81%
after
|
F-45
termination of various forward starting swaps in conjunction with the issuance (see Note 9 for further discussion); and
|
▪
|
Issued
$300.0 million
of thirty-year
4.50%
fixed rate public notes, receiving net proceeds of
$298.9 million
before underwriting fees and other expenses, at an all-in effective interest rate of
4.55%
.
|
During the year ended
December 31, 2014
, the Company:
|
▪
|
Repaid
$500.0 million
of
5.250%
unsecured notes at maturity;
|
|
▪
|
Repaid its
$750.0 million
unsecured term loan facility in conjunction with the note issuances discussed below and wrote-off approximately
$0.6 million
of unamortized deferred financing costs as additional interest expense;
|
|
▪
|
Issued
$450.0 million
of five-year
2.375%
fixed rate public notes, receiving net proceeds of
$449.6 million
before underwriting fees and other expenses, at an all-in effective interest rate of
2.52%
and swapped the notes to a floating interest rate in conjunction with the issuance (see Note 9 for further discussion); and
|
|
•
|
Issued
$750.0 million
of thirty-year
4.50%
fixed rate public notes, receiving net proceeds of
$744.7 million
before underwriting fees, hedge termination costs and other expenses, at an all-in effective interest rate of
4.57%
after termination of various forward starting swaps in conjunction with the issuance (see Note 9 for further discussion).
|
Line of Credit and Commercial Paper
On January 11, 2013, the Company replaced its existing
$1.75 billion
facility with a
$2.5 billion
unsecured revolving credit facility maturing
April 1, 2018
. The Company has the ability to increase available borrowings by an additional
$500.0 million
by adding additional banks to the facility or obtaining the agreement of existing banks to increase their commitments. The interest rate on advances under the facility will generally be LIBOR plus a spread (currently
0.95%
) and the Company pays an annual facility fee (currently
15 basis points
). Both the spread and the facility fee are dependent on the credit rating of the Company's long-term debt.
On
February 2, 2015
the Company entered into an unsecured commercial paper note program in the United States. The Company may borrow up to a maximum of
$500.0 million
under this program subject to market conditions. The notes will be sold under customary terms in the United States commercial paper note market and will rank pari passu with all of the Company's other unsecured senior indebtedness. As of
December 31, 2015
, there was a balance of
$387.3 million
on the commercial paper program (
$387.5 million
in principal outstanding net of an unamortized discount of
$0.2 million
). The notes bear interest at various floating rates with a weighted average of
0.56%
for the year ended
December 31, 2015
and a weighted average maturity of
19
days as of
December 31, 2015
.
As of
December 31, 2015
, the amount available on the revolving credit facility was
$2.07 billion
(net of
$45.1 million
which was restricted/dedicated to support letters of credit and net of
$387.5 million
outstanding on the commercial paper program). During the year ended
December 31, 2015
, the weighted average interest rate on the revolving credit facility was
1.07%
. As of
December 31, 2014
, the amount available on the revolving credit facility was
$2.12 billion
(net of
$43.8 million
which was restricted/dedicated to support letters of credit and net of the
$333.0 million
outstanding on the revolving credit facility). During the year ended
December 31, 2014
, the weighted average interest rate on the revolving credit facility was
0.95%
.
Other
The following table provides a summary of the aggregate payments of principal on all debt for each of the next five years and thereafter as of
December 31, 2015
(amounts in thousands):
|
Year
|
Total (1)
|
|||
|
2016
|
$
|
1,352,813
|
|
|
|
2017
|
1,347,846
|
|
||
|
2018
|
180,461
|
|
||
|
2019
|
1,281,127
|
|
||
|
2020
|
1,679,432
|
|
||
|
Thereafter
|
5,173,079
|
|
||
|
Net Unamortized (Discount)
|
(46,260
|
)
|
||
|
Total
|
$
|
10,968,498
|
|
|
|
(1)
|
Premiums and discounts are amortized over the life of the debt. See Note 18 for discussion of the debt amounts repaid subsequent to
December 31, 2015
.
|
F-46
|
9.
|
Derivative and Other Fair Value Instruments
|
The valuation of financial instruments requires the Company to make estimates and judgments that affect the fair value of the instruments. The Company, where possible, bases the fair values of its financial instruments, including its derivative instruments, on listed market prices and third party quotes. Where these are not available, the Company bases its estimates on current instruments with similar terms and maturities or on other factors relevant to the financial instruments.
In the normal course of business, the Company is exposed to the effect of interest rate changes. The Company seeks to manage these risks by following established risk management policies and procedures including the use of derivatives to hedge interest rate risk on debt instruments. The Company may also use derivatives to manage its exposure to foreign exchange rates or manage commodity prices in the daily operations of the business.
A three-level valuation hierarchy exists for disclosure of fair value measurements. The valuation hierarchy is based upon the transparency of inputs to the valuation of an asset or liability as of the measurement date. A financial instrument’s categorization within the valuation hierarchy is based upon the lowest level of input that is significant to the fair value measurement. The three levels are defined as follows:
|
•
|
Level 1 – Inputs to the valuation methodology are quoted prices (unadjusted) for identical assets or liabilities in active markets.
|
|
•
|
Level 2 – Inputs to the valuation methodology include quoted prices for similar assets and liabilities in active markets, and inputs that are observable for the asset or liability, either directly or indirectly, for substantially the full term of the financial instrument.
|
|
•
|
Level 3 – Inputs to the valuation methodology are unobservable and significant to the fair value measurement.
|
The Company’s derivative positions are valued using models developed by the respective counterparty as well as models developed internally by the Company that use as their basis readily observable market parameters (such as forward yield curves and credit default swap data). Employee holdings other than Common Shares within the supplemental executive retirement plan (the “SERP”) are valued using quoted market prices for identical assets and are included in other assets and other liabilities on the consolidated balance sheets. Redeemable Noncontrolling Interests – Operating Partnership/Redeemable Limited Partners are valued using the quoted market price of Common Shares. The fair values disclosed for mortgage notes payable and unsecured debt (including its line of credit and commercial paper) were calculated using indicative rates provided by lenders of similar loans in the case of mortgage notes payable and the private unsecured debt (including its line of credit and commercial paper) and quoted market prices for each underlying issuance in the case of the public unsecured notes.
The carrying values of the Company’s mortgage notes payable and unsecured debt (including its commercial paper) were approximately
$4.7 billion
and
$6.3 billion
, respectively, at
December 31, 2015
. The fair values of the Company’s mortgage notes payable and unsecured debt (including its commercial paper) were approximately
$4.6 billion
(Level 2) and
$6.5 billion
(Level 2), respectively, at
December 31, 2015
. The carrying values of the Company’s mortgage notes payable and unsecured debt (including its line of credit) were approximately
$5.1 billion
and
$5.8 billion
, respectively, at
December 31, 2014
. The fair values of the Company’s mortgage notes payable and unsecured debt (including its line of credit) were approximately
$5.1 billion
(Level 2) and
$6.1 billion
(Level 2), respectively, at
December 31, 2014
. The fair values of the Company’s financial instruments (other than mortgage notes payable, unsecured notes, line of credit, commercial paper and derivative instruments), including cash and cash equivalents and other financial instruments, approximate their carrying or contract values.
The following table summarizes the Company’s consolidated derivative instruments at
December 31, 2015
(dollar amounts are in thousands):
|
Fair Value
Hedges (1) |
Forward
Starting Swaps (2) |
|||||||
|
Current Notional Balance
|
$
|
450,000
|
|
$
|
50,000
|
|
||
|
Lowest Possible Notional
|
$
|
450,000
|
|
$
|
50,000
|
|
||
|
Highest Possible Notional
|
$
|
450,000
|
|
$
|
50,000
|
|
||
|
Lowest Interest Rate
|
2.375
|
%
|
2.500
|
%
|
||||
|
Highest Interest Rate
|
2.375
|
%
|
2.500
|
%
|
||||
|
Earliest Maturity Date
|
2019
|
|
2026
|
|
||||
|
Latest Maturity Date
|
2019
|
|
2026
|
|
||||
F-47
|
(1)
|
Fair Value Hedges – Converts outstanding fixed rate unsecured notes (
$450.0 million
2.375%
notes due
July 1, 2019
) to a floating interest rate of 90-Day LIBOR plus
0.61%
.
|
|
(2)
|
Forward Starting Swaps – Designed to partially fix interest rates in advance of a planned future debt issuance. This swap has a mandatory counterparty termination in 2017, and is targeted to a 2016 issuance.
|
The following tables provide a summary of the fair value measurements for each major category of assets and liabilities measured at fair value on a recurring basis and the location within the accompanying consolidated balance sheets at
December 31, 2015
and
2014
, respectively (amounts in thousands):
|
Fair Value Measurements at Reporting Date Using
|
||||||||||||||||||
|
Description
|
Balance Sheet Location
|
12/31/2015
|
Quoted Prices in
Active Markets for Identical Assets/Liabilities (Level 1) |
Significant Other Observable Inputs (Level 2)
|
Significant Unobservable Inputs (Level 3)
|
|||||||||||||
|
Assets
|
||||||||||||||||||
|
Derivatives designated as hedging instruments:
|
||||||||||||||||||
|
Interest Rate Contracts:
|
||||||||||||||||||
|
Fair Value Hedges
|
Other Assets
|
$
|
3,655
|
|
$
|
—
|
|
$
|
3,655
|
|
$
|
—
|
|
|||||
|
Supplemental Executive Retirement Plan
|
Other Assets
|
105,942
|
|
105,942
|
|
—
|
|
—
|
|
|||||||||
|
Total
|
$
|
109,597
|
|
$
|
105,942
|
|
$
|
3,655
|
|
$
|
—
|
|
||||||
|
Liabilities
|
||||||||||||||||||
|
Derivatives designated as hedging instruments:
|
||||||||||||||||||
|
Interest Rate Contracts:
|
||||||||||||||||||
|
Forward Starting Swaps
|
Other Liabilities
|
$
|
673
|
|
$
|
—
|
|
$
|
673
|
|
$
|
—
|
|
|||||
|
Supplemental Executive Retirement Plan
|
Other Liabilities
|
105,942
|
|
105,942
|
|
—
|
|
—
|
|
|||||||||
|
Total
|
$
|
106,615
|
|
$
|
105,942
|
|
$
|
673
|
|
$
|
—
|
|
||||||
|
Redeemable Noncontrolling Interests –
|
||||||||||||||||||
|
Operating Partnership/Redeemable
|
||||||||||||||||||
|
Limited Partners
|
Mezzanine
|
$
|
566,783
|
|
$
|
—
|
|
$
|
566,783
|
|
$
|
—
|
|
|||||
|
Fair Value Measurements at Reporting Date Using
|
||||||||||||||||||
|
Description
|
Balance Sheet Location
|
12/31/2014
|
Quoted Prices in
Active Markets for Identical Assets/Liabilities (Level 1) |
Significant Other Observable Inputs (Level 2)
|
Significant Unobservable Inputs (Level 3)
|
|||||||||||||
|
Assets
|
||||||||||||||||||
|
Derivatives designated as hedging instruments:
|
||||||||||||||||||
|
Interest Rate Contracts:
|
||||||||||||||||||
|
Fair Value Hedges
|
Other Assets
|
$
|
1,597
|
|
$
|
—
|
|
$
|
1,597
|
|
$
|
—
|
|
|||||
|
Forward Starting Swaps
|
Other Assets
|
332
|
|
—
|
|
332
|
|
—
|
|
|||||||||
|
Supplemental Executive Retirement Plan
|
Other Assets
|
104,463
|
|
104,463
|
|
—
|
|
—
|
|
|||||||||
|
Total
|
$
|
106,392
|
|
$
|
104,463
|
|
$
|
1,929
|
|
$
|
—
|
|
||||||
|
Liabilities
|
||||||||||||||||||
|
Derivatives designated as hedging instruments:
|
||||||||||||||||||
|
Interest Rate Contracts:
|
||||||||||||||||||
|
Forward Starting Swaps
|
Other Liabilities
|
$
|
14,104
|
|
$
|
—
|
|
$
|
14,104
|
|
$
|
—
|
|
|||||
|
Supplemental Executive Retirement Plan
|
Other Liabilities
|
104,463
|
|
104,463
|
|
—
|
|
—
|
|
|||||||||
|
Total
|
$
|
118,567
|
|
$
|
104,463
|
|
$
|
14,104
|
|
$
|
—
|
|
||||||
|
Redeemable Noncontrolling Interests –
|
||||||||||||||||||
|
Operating Partnership/Redeemable
|
||||||||||||||||||
|
Limited Partners
|
Mezzanine
|
$
|
500,733
|
|
$
|
—
|
|
$
|
500,733
|
|
$
|
—
|
|
|||||
F-48
The following tables provide a summary of the effect of fair value hedges on the Company’s accompanying consolidated statements of operations and comprehensive income for the years ended
December 31, 2015
,
2014
and
2013
, respectively (amounts in thousands):
|
December 31, 2015
Type of Fair Value Hedge |
Location of
Gain/(Loss) Recognized in Income on Derivative |
Amount of
Gain/(Loss) Recognized in Income on Derivative |
Hedged Item
|
Income Statement
Location of Hedged Item Gain/(Loss) |
Amount of
Gain/(Loss) Recognized in Income on Hedged Item |
|||||||||
|
Derivatives designated as hedging instruments:
|
|
|
|
|
|
|
|
|||||||
|
Interest Rate Contracts:
|
|
|
|
|
|
|
|
|||||||
|
Interest Rate Swaps
|
Interest expense
|
$
|
2,058
|
|
Fixed rate debt
|
Interest expense
|
$
|
(2,058
|
)
|
|||||
|
Total
|
|
$
|
2,058
|
|
|
|
$
|
(2,058
|
)
|
|||||
|
December 31, 2014
Type of Fair Value Hedge |
Location of Gain/(Loss) Recognized in Income on Derivative
|
Amount of Gain/(Loss) Recognized in Income on Derivative
|
Hedged Item
|
Income Statement Location of Hedged Item Gain/(Loss)
|
Amount of Gain/(Loss)Recognized in Income
on Hedged Item |
|||||||||
|
Derivatives designated as hedging instruments:
|
|
|
|
|
|
|
|
|||||||
|
Interest Rate Contracts:
|
|
|
|
|
|
|
|
|||||||
|
Interest Rate Swaps
|
Interest expense
|
$
|
1,597
|
|
Fixed rate debt
|
Interest expense
|
$
|
(1,597
|
)
|
|||||
|
Total
|
|
$
|
1,597
|
|
|
|
$
|
(1,597
|
)
|
|||||
|
December 31, 2013
Type of Fair Value Hedge |
Location of Gain/(Loss) Recognized in Income on Derivative
|
Amount of Gain/(Loss) Recognized in Income on Derivative
|
Hedged Item
|
Income Statement Location of Hedged Item Gain/(Loss)
|
Amount of Gain/(Loss)Recognized in Income
on Hedged Item |
|||||||||
|
Derivatives designated as hedging instruments:
|
|
|
|
|
|
|
|
|||||||
|
Interest Rate Contracts:
|
|
|
|
|
|
|
|
|||||||
|
Interest Rate Swaps
|
Interest expense
|
$
|
(1,523
|
)
|
Fixed rate debt
|
Interest expense
|
$
|
1,523
|
|
|||||
|
Total
|
|
$
|
(1,523
|
)
|
|
|
$
|
1,523
|
|
|||||
The following tables provide a summary of the effect of cash flow hedges on the Company’s accompanying consolidated statements of operations and comprehensive income for the years ended
December 31, 2015
,
2014
and
2013
, respectively (amounts in thousands):
|
|
Effective Portion
|
Ineffective Portion
|
||||||||||||||
|
December 31, 2015
Type of Cash Flow Hedge |
Amount of
Gain/(Loss) Recognized in OCI on Derivative |
Location of Gain/(Loss)
Reclassified from Accumulated OCI into Income |
Amount of Gain/(Loss)
Reclassified from Accumulated OCI into Income |
Location of
Gain/(Loss) Recognized in Income on Derivative |
Amount of Gain/(Loss)
Reclassified from Accumulated OCI into Income |
|||||||||||
|
Derivatives designated as hedging instruments:
|
|
|
|
|
|
|
|
|
||||||||
|
Interest Rate Contracts:
|
|
|
|
|
|
|
|
|
||||||||
|
Forward Starting Swaps
|
$
|
(814
|
)
|
Interest expense
|
$
|
(18,244
|
)
|
Interest expense
|
$
|
(3,033
|
)
|
|||||
|
Total
|
$
|
(814
|
)
|
|
$
|
(18,244
|
)
|
|
$
|
(3,033
|
)
|
|||||
|
|
Effective Portion
|
Ineffective Portion
|
||||||||||||||
|
December 31, 2014
Type of Cash Flow Hedge |
Amount of
Gain/(Loss) Recognized in OCI on Derivative |
Location of Gain/(Loss)
Reclassified from Accumulated OCI into Income |
Amount of Gain/(Loss)
Reclassified from Accumulated OCI into Income |
Location of
Gain/(Loss) Recognized in Income on Derivative |
Amount of Gain/(Loss)
Reclassified from Accumulated OCI into Income |
|||||||||||
|
Derivatives designated as hedging instruments:
|
|
|
|
|
|
|||||||||||
|
Interest Rate Contracts:
|
|
|
|
|
|
|||||||||||
|
Forward Starting Swaps
|
$
|
(33,215
|
)
|
Interest expense
|
$
|
(16,868
|
)
|
Interest expense
|
$
|
91
|
|
|||||
|
Total
|
$
|
(33,215
|
)
|
|
$
|
(16,868
|
)
|
|
$
|
91
|
|
|||||
F-49
|
|
Effective Portion
|
Ineffective Portion
|
||||||||||||||
|
December 31, 2013
Type of Cash Flow Hedge |
Amount of
Gain/(Loss) Recognized in OCI on Derivative |
Location of Gain/(Loss)
Reclassified from Accumulated OCI into Income |
Amount of Gain/(Loss)
Reclassified from Accumulated OCI into Income |
Location of
Gain/(Loss) Recognized in Income on Derivative |
Amount of Gain/(Loss)
Reclassified from Accumulated OCI into Income |
|||||||||||
|
Derivatives designated as hedging instruments:
|
|
|
|
|
|
|||||||||||
|
Interest Rate Contracts:
|
|
|
|
|
|
|||||||||||
|
Forward Starting Swaps/Treasury Locks
|
$
|
18,771
|
|
Interest expense
|
$
|
(20,141
|
)
|
N/A
|
$
|
—
|
|
|||||
|
Total
|
$
|
18,771
|
|
|
$
|
(20,141
|
)
|
|
$
|
—
|
|
|||||
As of
December 31, 2015
and
2014
, there were approximately
$151.8 million
and
$172.2 million
in deferred losses, net, included in accumulated other comprehensive (loss), respectively, related to derivative instruments. Based on the estimated fair values of the net derivative instruments at
December 31, 2015
, the Company may recognize an estimated
$24.7 million
of accumulated other comprehensive (loss) as additional interest expense during the year ending
December 31, 2016
.
In May 2015, the Company paid a net
$15.1 million
to settle nine forward starting ten-year swaps in conjunction with the issuance of
$450.0 million
of ten-year fixed rate public notes. The ineffective portion of approximately
$30,000
and accrued interest of approximately
$1.2 million
were recorded as increases to interest expense. The remaining amount of approximately
$13.9 million
will be deferred as a component of accumulated other comprehensive (loss) and recognized as an increase to interest expense over the first 9 years and 10.5 months of the notes.
During the year ended December 31, 2015, the Company recorded approximately
$3.0 million
of deferred accumulated other comprehensive (loss) as additional interest expense due to the ineffectiveness of certain forward starting swaps.
In June 2014, the Company paid a net
$2.0 million
to settle seven forward starting ten-year swaps in conjunction with the issuance of
$750.0 million
of thirty-year fixed rate public notes. The ineffective portion of approximately
$0.1 million
was recorded as a decrease to interest expense and accrued interest of approximately
$1.3 million
was recorded as an increase to interest expense. The remaining amount of approximately
$0.8 million
will be deferred as a component of accumulated other comprehensive (loss) and recognized as an increase to interest expense over the first nine years and ten months of the notes.
In April 2013, the Company paid approximately
$44.7 million
to settle three forward starting swaps in conjunction with the issuance of
$500.0 million
of ten-year fixed rate public notes. The accrued interest of
$0.7 million
was recorded as interest expense. The remaining amount of
$44.0 million
will be deferred as a component of accumulated other comprehensive (loss) and recognized as an increase to interest expense over the approximate term of the notes.
During the year ended December 31, 2013, the Company sold all of its investment securities, receiving proceeds of approximately
$2.8 million
, and recorded a
$2.1 million
realized gain on sale (specific identification) which is included in interest and other income.
F-50
|
10.
|
Earnings Per Share and Earnings Per Unit
|
Equity Residential
The following tables set forth the computation of net income per share – basic and net income per share – diluted for the Company (amounts in thousands except per share amounts):
|
|
Year Ended December 31,
|
||||||||||
|
|
2015
|
2014
|
2013
|
||||||||
|
Numerator for net income per share – basic:
|
|
|
|
|
|
|
|||||
|
Income (loss) from continuing operations
|
$
|
907,621
|
|
$
|
657,101
|
|
$
|
(168,174
|
)
|
||
|
Allocation to Noncontrolling Interests – Operating Partnership, net
|
(34,226
|
)
|
(24,771
|
)
|
6,834
|
|
|||||
|
Net (income) loss attributable to Noncontrolling Interests – Partially Owned Properties
|
(3,657
|
)
|
(2,544
|
)
|
538
|
|
|||||
|
Preferred distributions
|
(3,357
|
)
|
(4,145
|
)
|
(4,145
|
)
|
|||||
|
Premium on redemption of Preferred Shares
|
(3,486
|
)
|
—
|
|
—
|
|
|||||
|
Income (loss) from continuing operations available to Common Shares, net of
Noncontrolling Interests
|
862,895
|
|
625,641
|
|
(164,947
|
)
|
|||||
|
Discontinued operations, net of Noncontrolling Interests
|
382
|
|
1,522
|
|
1,991,415
|
|
|||||
|
Numerator for net income per share – basic
|
$
|
863,277
|
|
$
|
627,163
|
|
$
|
1,826,468
|
|
||
|
Numerator for net income per share – diluted (1):
|
|||||||||||
|
Income from continuing operations
|
$
|
907,621
|
|
$
|
657,101
|
|
|||||
|
Net (income) attributable to Noncontrolling Interests – Partially Owned Properties
|
(3,657
|
)
|
(2,544
|
)
|
|||||||
|
Preferred distributions
|
(3,357
|
)
|
(4,145
|
)
|
|||||||
|
Premium on redemption of Preferred Shares
|
(3,486
|
)
|
—
|
|
|||||||
|
Income from continuing operations available to Common Shares
|
897,121
|
|
650,412
|
|
|||||||
|
Discontinued operations, net
|
397
|
|
1,582
|
|
|||||||
|
Numerator for net income per share – diluted (1)
|
$
|
897,518
|
|
$
|
651,994
|
|
$
|
1,826,468
|
|
||
|
Denominator for net income per share – basic and diluted (1):
|
|||||||||||
|
Denominator for net income per share – basic
|
363,498
|
|
361,181
|
|
354,305
|
|
|||||
|
Effect of dilutive securities:
|
|||||||||||
|
OP Units
|
13,576
|
|
13,718
|
|
|||||||
|
Long-term compensation shares/units
|
3,546
|
|
2,836
|
|
|||||||
|
Denominator for net income per share – diluted (1)
|
380,620
|
|
377,735
|
|
354,305
|
|
|||||
|
Net income per share – basic
|
$
|
2.37
|
|
$
|
1.74
|
|
$
|
5.16
|
|
||
|
Net income per share – diluted
|
$
|
2.36
|
|
$
|
1.73
|
|
$
|
5.16
|
|
||
|
Net income per share – basic:
|
|
|
|
|
|
|
|||||
|
Income (loss) from continuing operations available to Common Shares, net of
Noncontrolling Interests
|
$
|
2.37
|
|
$
|
1.73
|
|
$
|
(0.47
|
)
|
||
|
Discontinued operations, net of Noncontrolling Interests
|
—
|
|
0.01
|
|
5.63
|
|
|||||
|
Net income per share – basic
|
$
|
2.37
|
|
$
|
1.74
|
|
$
|
5.16
|
|
||
|
Net income per share – diluted (1):
|
|
|
|
|
|
|
|||||
|
Income (loss) from continuing operations available to Common Shares
|
$
|
2.36
|
|
$
|
1.72
|
|
$
|
(0.47
|
)
|
||
|
Discontinued operations, net
|
—
|
|
0.01
|
|
5.63
|
|
|||||
|
Net income per share – diluted
|
$
|
2.36
|
|
$
|
1.73
|
|
$
|
5.16
|
|
||
|
(1)
|
Potential common shares issuable from the assumed conversion of OP Units and the exercise/vesting of long-term compensation shares/units are automatically anti-dilutive and therefore excluded from the diluted earnings per share calculation as the Company had a loss from continuing operations for the year ended December 31, 2013.
|
Note: For additional disclosures regarding the employee share options and restricted shares, see Notes 2 and 12.
ERP Operating Limited Partnership
The following tables set forth the computation of net income per Unit – basic and net income per Unit – diluted for the Operating Partnership (amounts in thousands except per Unit amounts):
F-51
|
|
Year Ended December 31,
|
||||||||||
|
|
2015
|
2014
|
2013
|
||||||||
|
Numerator for net income per Unit – basic and diluted (1):
|
|
|
|
|
|
|
|||||
|
Income (loss) from continuing operations
|
$
|
907,621
|
|
$
|
657,101
|
|
$
|
(168,174
|
)
|
||
|
Net (income) loss attributable to Noncontrolling Interests – Partially Owned Properties
|
(3,657
|
)
|
(2,544
|
)
|
538
|
|
|||||
|
Allocation to Preference Units
|
(3,357
|
)
|
(4,145
|
)
|
(4,145
|
)
|
|||||
|
Allocation to premium on redemption of Preference Units
|
(3,486
|
)
|
—
|
|
—
|
|
|||||
|
Income (loss) from continuing operations available to Units
|
897,121
|
|
650,412
|
|
(171,781
|
)
|
|||||
|
Discontinued operations, net
|
397
|
|
1,582
|
|
2,073,527
|
|
|||||
|
Numerator for net income per Unit – basic and diluted (1)
|
$
|
897,518
|
|
$
|
651,994
|
|
$
|
1,901,746
|
|
||
|
Denominator for net income per Unit – basic and diluted (1):
|
|||||||||||
|
Denominator for net income per Unit – basic
|
377,074
|
|
374,899
|
|
368,038
|
|
|||||
|
Effect of dilutive securities:
|
|||||||||||
|
Dilution for Units issuable upon assumed exercise/vesting of the Company's
long-term compensation shares/units
|
3,546
|
|
2,836
|
|
|||||||
|
Denominator for net income per Unit – diluted (1)
|
380,620
|
|
377,735
|
|
368,038
|
|
|||||
|
Net income per Unit – basic
|
$
|
2.37
|
|
$
|
1.74
|
|
$
|
5.16
|
|
||
|
Net income per Unit – diluted
|
$
|
2.36
|
|
$
|
1.73
|
|
$
|
5.16
|
|
||
|
Net income per Unit – basic:
|
|
|
|
|
|
|
|||||
|
Income (loss) from continuing operations available to Units
|
$
|
2.37
|
|
$
|
1.73
|
|
$
|
(0.47
|
)
|
||
|
Discontinued operations, net
|
—
|
|
0.01
|
|
5.63
|
|
|||||
|
Net income per Unit – basic
|
$
|
2.37
|
|
$
|
1.74
|
|
$
|
5.16
|
|
||
|
Net income per Unit – diluted (1):
|
|
|
|
|
|
|
|||||
|
Income (loss) from continuing operations available to Units
|
$
|
2.36
|
|
$
|
1.72
|
|
$
|
(0.47
|
)
|
||
|
Discontinued operations, net
|
—
|
|
0.01
|
|
5.63
|
|
|||||
|
Net income per Unit – diluted
|
$
|
2.36
|
|
$
|
1.73
|
|
$
|
5.16
|
|
||
|
(1)
|
Potential Units issuable from the assumed exercise/vesting of the Company's long-term compensation shares/units are automatically anti-dilutive and therefore excluded from the diluted earnings per Unit calculation as the Operating Partnership had a loss from continuing operations for the year ended December 31, 2013.
|
Note: For additional disclosures regarding the employee share options and restricted shares, see Notes 2 and 12.
|
11.
|
Individually Significant Dispositions and Discontinued Operations
|
In April 2014, the FASB issued new guidance for reporting discontinued operations. Only disposals representing a strategic shift in operations that has a major effect on a company’s operations and financial results will be presented as discontinued operations. Companies are required to expand their disclosures about discontinued operations to provide more information on the assets, liabilities, income and expenses of the discontinued operations. Companies are also required to disclose the pre-tax income attributable to a disposal of a significant part of a company that does not qualify for discontinued operations reporting. Application of this guidance is prospective from the date of adoption and early adoption was permitted, but only for disposals (or classifications as held for sale) that had not been reported in financial statements previously issued. The new standard was effective January 1, 2015, but the Company early adopted it as allowed effective January 1, 2014. Adoption of this standard resulted in and will likely continue to result in substantially fewer of the Company's dispositions meeting the discontinued operations qualifications.
Individually Significant Dispositions
The Company concluded that the Starwood Transaction does not qualify for discontinued operations reporting as it does not represent a strategic shift that will have a major effect on the Company’s operations and financial results. The Company has been investing only in its six core coastal markets (Boston, New York, Washington D.C., Southern California, San Francisco and Seattle) and has not been acquiring or developing any new assets in its other markets. Over the past several years, the Company has been repositioning its portfolio by selling non-core assets and reducing its exposure to non-core markets. However, the Company concluded that the Starwood Transaction does qualify as an individually significant component of the Company as the amount received upon disposal will exceed
10%
of total assets and NOI (see definition in Note 17) of the Starwood portfolio represents approximately
16.4%
,
16.1%
and
16.4%
, respectively, of consolidated NOI for the Company for the years ended
F-52
December 31, 2015
,
2014
and
2013
. In addition, the Starwood Transaction meets the held for sale criteria at
December 31, 2015
and is classified as held for sale in the accompanying consolidated balance sheets at
December 31, 2015
(see Note 4 for further discussion). In accordance with this classification, the Company ceased depreciation on all assets in the Starwood portfolio as of November 1, 2015. As a result, the following table summarizes the results of operations attributable to the Starwood Transaction for the years ended
December 31, 2015
,
2014
and
2013
(amounts in thousands):
|
|
Year Ended December 31,
|
||||||||||
|
|
2015
|
2014
|
2013
|
||||||||
|
REVENUES
|
|
|
|
|
|
|
|||||
|
Rental income
|
$
|
427,433
|
|
$
|
401,134
|
|
$
|
373,899
|
|
||
|
Total revenues
|
427,433
|
|
401,134
|
|
373,899
|
|
|||||
|
EXPENSES (1)
|
|
|
|
|
|
|
|||||
|
Property and maintenance
|
78,189
|
|
76,579
|
|
75,848
|
|
|||||
|
Real estate taxes and insurance
|
48,403
|
|
46,416
|
|
44,035
|
|
|||||
|
Property management
|
11
|
|
11
|
|
11
|
|
|||||
|
Depreciation
|
87,616
|
|
104,104
|
|
105,015
|
|
|||||
|
General and administrative
|
38
|
|
24
|
|
22
|
|
|||||
|
Total expenses
|
214,257
|
|
227,134
|
|
224,931
|
|
|||||
|
Operating income
|
213,176
|
|
174,000
|
|
148,968
|
|
|||||
|
Interest and other income
|
1
|
|
1
|
|
2
|
|
|||||
|
Other expenses
|
(35
|
)
|
(1
|
)
|
—
|
|
|||||
|
Interest (2):
|
|||||||||||
|
Expense incurred, net
|
(680
|
)
|
(701
|
)
|
(754
|
)
|
|||||
|
Amortization of deferred financing costs
|
(559
|
)
|
(98
|
)
|
(98
|
)
|
|||||
|
Income and other tax (expense) benefit
|
(1
|
)
|
(3
|
)
|
(2
|
)
|
|||||
|
Income from operations
|
211,902
|
|
173,198
|
|
148,116
|
|
|||||
|
Income from operations attributable to Noncontrolling Interests – Partially Owned
Properties |
—
|
|
(14
|
)
|
(52
|
)
|
|||||
|
Income from operations attributable to controlling interests – Operating Partnership
|
211,902
|
|
173,184
|
|
148,064
|
|
|||||
|
Income from operations attributable to Noncontrolling Interests – Operating Partnership
|
(8,083
|
)
|
(6,598
|
)
|
(5,692
|
)
|
|||||
|
Income from operations attributable to controlling interests – Company
|
$
|
203,819
|
|
$
|
166,586
|
|
$
|
142,372
|
|
||
|
(1)
|
Includes expenses paid in the current period for properties held for sale.
|
|
(2)
|
Includes only interest expense specific to secured mortgage notes payable for properties held for sale which was repaid or will be repaid at or before closing.
|
Discontinued Operations
The Company has presented separately as discontinued operations in all periods the results of operations for all consolidated assets disposed of and all properties held for sale, if any, for properties sold in 2013 and prior years. The amounts included in discontinued operations for the years ended
December 31, 2015
and
2014
represent trailing activity for properties sold in 2013 and prior years. None of the properties sold during the years ended
December 31, 2015
and
2014
met the new criteria for reporting discontinued operations.
The components of discontinued operations are outlined below and include the results of operations for the respective periods that the Company owned such assets for properties sold in 2013 and prior years during each of the years ended
December 31, 2015
,
2014
and
2013
(amounts in thousands).
F-53
|
|
Year Ended December 31,
|
||||||||||
|
|
2015
|
2014
|
2013
|
||||||||
|
REVENUES
|
|
|
|
|
|
|
|||||
|
Rental income
|
$
|
499
|
|
$
|
1,309
|
|
$
|
121,942
|
|
||
|
Total revenues
|
499
|
|
1,309
|
|
121,942
|
|
|||||
|
EXPENSES (1)
|
|
|
|
|
|
|
|||||
|
Property and maintenance
|
(60
|
)
|
(141
|
)
|
36,792
|
|
|||||
|
Real estate taxes and insurance
|
65
|
|
267
|
|
11,903
|
|
|||||
|
Property management
|
—
|
|
—
|
|
1
|
|
|||||
|
Depreciation
|
—
|
|
—
|
|
34,380
|
|
|||||
|
General and administrative
|
85
|
|
89
|
|
85
|
|
|||||
|
Total expenses
|
90
|
|
215
|
|
83,161
|
|
|||||
|
Discontinued operating income
|
409
|
|
1,094
|
|
38,781
|
|
|||||
|
Interest and other income
|
3
|
|
317
|
|
217
|
|
|||||
|
Other expenses
|
—
|
|
—
|
|
(3
|
)
|
|||||
|
Interest (2):
|
|
|
|
|
|
|
|||||
|
Expense incurred, net
|
—
|
|
—
|
|
(1,296
|
)
|
|||||
|
Amortization of deferred financing costs
|
—
|
|
—
|
|
(228
|
)
|
|||||
|
Income and other tax (expense) benefit
|
(15
|
)
|
(8
|
)
|
(449
|
)
|
|||||
|
Discontinued operations
|
397
|
|
1,403
|
|
37,022
|
|
|||||
|
Net gain on sales of discontinued operations
|
—
|
|
179
|
|
2,036,505
|
|
|||||
|
Discontinued operations, net
|
$
|
397
|
|
$
|
1,582
|
|
$
|
2,073,527
|
|
||
|
(1)
|
Includes expenses paid in the current period for properties sold in prior periods related to the Company’s period of ownership.
|
|
(2)
|
Includes only interest expense specific to secured mortgage notes payable for properties sold.
|
11.
|
12.
|
Share Incentive Plans
|
Any Common Shares issued pursuant to EQR's incentive equity compensation and employee share purchase plans will result in ERPOP issuing OP Units to EQR on a one-for-one basis with ERPOP receiving the net cash proceeds of such issuances.
On June 16, 2011, the shareholders of EQR approved the Company's 2011 Share Incentive Plan, as amended (the "2011 Plan"). The 2011 Plan reserved
12,980,741
Common Shares for issuance. In conjunction with the approval of the 2011 Plan, no further awards may be granted under the 2002 Share Incentive Plan. The 2011 Plan expires on June 16, 2021. As of December 31, 2015,
7,952,498
shares were available for future issuance.
Pursuant to the 2011 Plan and the 2002 Share Incentive Plan, as restated and amended (collectively the “Share Incentive Plans”), officers, trustees and key employees of the Company may be granted share options to acquire Common Shares (“Options”) including non-qualified share options (“NQSOs”), incentive share options (“ISOs”) and share appreciation rights (“SARs”), or may be granted restricted or non-restricted shares/units (including performance-based awards), subject to conditions and restrictions as described in the Share Incentive Plans. Options, SARs, restricted shares (including performance awards) and restricted units (including performance awards) are sometimes collectively referred to herein as “Awards”.
The Options are generally granted at the fair market value of the Company’s Common Shares at the date of grant, vest in
three equal installments
over a
three
-year period, are exercisable upon vesting and expire
ten
years from the date of grant (see additional valuation discussion in Note 2). The exercise price for all Options under the Share Incentive Plans is equal to the fair market value of the underlying Common Shares at the time the Option is granted. Options exercised result in new Common Shares being issued on the open market. The 2002 Share Incentive Plan, as restated and amended, will terminate at such time as all outstanding Awards have expired or have been exercised/vested. The Board of Trustees may at any time amend or terminate the Share Incentive Plans, but termination will not affect Awards previously granted. Any Options which had vested prior to such a termination would remain exercisable by the holder.
F-54
Restricted shares are generally granted at the fair market value of the Company's Common Shares at the date of grant. Restricted shares that have been awarded through December 31, 2015 generally vest
three
years from the award date. In addition, the Company’s unvested restricted shareholders have the same voting rights as any other Common Share holder. During the
three
-year period of restriction, the Company’s unvested restricted shareholders receive quarterly dividend payments on their shares at the same rate and on the same date as any other Common Share holder. As a result, dividends paid on unvested restricted shares are included as a component of retained earnings (included in general partner's capital in the Operating Partnership's financial statements) and have not been considered in reducing net income available to Common Shares/Units in a manner similar to the Company’s preferred share/preference unit dividends for the earnings per share/Unit calculation. If employment is terminated prior to the lapsing of the restriction, the shares are generally canceled.
In December 2008, the Company’s then existing 2002 Share Incentive Plan was amended to allow for the issuance of restricted units (formerly known as long-term incentive plan units) to officers of the Company as an alternative to the Company’s restricted shares. The 2011 Plan also allows for the issuance of restricted units. Restricted units are a class of partnership interests that under certain conditions, including vesting, are convertible by the holder into an equal number of OP Units, which are redeemable by the holder for Common Shares on a one-for-one basis or the cash value of such shares at the option of the Company. In connection with the grant of long-term incentive compensation for services provided during a year, officers of the Company are allowed to choose, on a one-for-one basis, between restricted shares and restricted units. In January 2011, March 2014 and June 2015, certain holders of restricted shares converted these shares into restricted units. Similar to restricted shares, restricted units are generally granted at the fair market value of the Company's Common Shares at the date of grant and generally vest
three
years from the award date. In addition, restricted unit holders receive quarterly dividend payments on their restricted units at the same rate and on the same date as any other OP Unit holder. As a result, dividends paid on restricted units are included as a component of Noncontrolling Interests – Operating Partnership/Limited Partners' capital and have not been considered in reducing net income available to Common Shares/Units in a manner similar to the Company’s preferred share/preference unit dividends for the earnings per share/Unit calculation. If employment is terminated prior to vesting, the restricted units are generally canceled. A restricted unit will automatically convert to an OP Unit when the capital account of each restricted unit increases (“books-up”) to a specified target. If the capital target is not attained within
ten
years following the date of issuance, the restricted unit will automatically be canceled and no compensation will be payable to the holder of such canceled restricted unit.
In January 2015, the Company revised its executive compensation program for the Chairman, Chief Executive Officer and certain other Executive Officers.
The long-term portion of the revised program will allow these individuals to earn from 0% to 200% of the target number of performance awards, payable in the form of restricted shares and/or restricted units, as determined by the Company’s relative and absolute Total Shareholder Return (“TSR”) over a forward-looking three-year performance period. The Company’s TSR will be compared to pre-established quantitative performance metrics. In connection with the grant of long-term incentive compensation, the individuals are allowed to choose, on a one-for-one basis, between restricted shares and restricted units. The grant date fair value of the awards is estimated using a Monte Carlo model, and the resulting expense is recorded regardless of whether the TSR performance measures are achieved, if the required service is delivered. These awards generally vest three years from the award date. The grant date fair value is amortized into expense over the service period. If the executive is retirement-eligible, the grant date fair value is amortized into expense over the first year. All other awards are amortized into expense over the three year performance/vesting period. In addition, the awards granted as restricted units will receive quarterly partial dividend payments equal to 10% of any common share dividend on the same date as any other OP Unit holder during the three-year performance period. As a result, dividends paid on restricted units are included as a component of Noncontrolling Interests – Operating Partnership/Limited Partners' capital and have not been considered in reducing net income available to Common Shares/Units in a manner similar to the Company’s preferred share/preference unit dividends for the earnings per share/Unit calculation. The awards granted as restricted shares will not receive dividends during the three-year performance period. At the end of the three-year performance period, cumulative dividends will be paid for the three-year performance period for any restricted shares or restricted units actually earned, less any dividends already paid on the restricted units. If employment is terminated prior to vesting, the restricted shares and restricted units are generally canceled.
Once the Company's absolute and relative TSR is calculated at the end of the three-year performance period, the executive will earn a certain number of restricted shares and/or restricted units. No payout would be made for any return below 50% of the target performance metric.
All Trustees, with the exception of the Company's non-executive Chairman and employee Trustees, are granted options and restricted shares that vest
one
-year from the grant date that corresponds to the term for which he or she has been elected to serve. The non-executive Chairman's grants vest over the same term or period as all other employees.
The Company's Share Incentive Plans provide for certain benefits upon retirement. For employees hired prior to January 1, 2009, retirement generally means the termination of employment (other than for cause): (i) on or after age 62; or (ii) prior to age 62 after meeting the requirements of the Rule of 70 (described below). For employees hired after January 1, 2009, retirement generally means the termination of employment (other than for cause) after meeting the requirements of the Rule of 70. For Trustees, retirement generally means termination of service on the Board (other than for cause) on or after age 72.
F-55
The Rule of 70 is met when an employee’s years of service with the Company (which must be at least 15 years) plus his or her age (which must be at least 55 years) on the date of termination equals or exceeds 70 years. In addition, the employee must give the Company at least 6 months’ advance written notice of his or her intention to retire and sign a release upon termination of employment, releasing the Company from customary claims and agreeing to ongoing non-competition and employee non-solicitation provisions.
Under the Company's definitions of retirement, several of its executive officers, including its Chief Executive Officer, and its non-executive Chairman, are retirement eligible.
For employees hired prior to January 1, 2009 who retire at or after age 62 (or for Trustees who retire at or after age 72), such employee’s or Trustee's unvested restricted shares, restricted units and share options would immediately vest, and share options would continue to be exercisable for the balance of the applicable ten-year option period, as is provided under the Share Incentive Plans. For all other employees (those hired after January 1, 2009 and those hired before such date who choose to retire prior to age 62), upon such retirement under the Rule of 70 definition of retirement of employees, such employee’s unvested restricted shares, restricted units and share options would continue to vest per the original vesting schedule (subject to immediate vesting upon the occurrence of a subsequent change in control of the Company or the employee’s death), and options would continue to be exercisable for the balance of the applicable ten-year option period, subject to the employee’s compliance with the non-competition and employee non-solicitation provisions. The Rule of 70 does not apply to Trustees. For the individuals mentioned above who receive awards under the executive compensation program and retire at or after age 62 (age 72 for the Chairman of the Board) or under the Rule of 70, the award would be prorated in proportion to the number of days worked in the first year of the three-year performance period and the award would continue to vest per the original vesting schedule, subject to the individual’s compliance with the non-competition and employee non-solicitation provisions. The individual would not receive any payout of shares or units until the final payout is determined at the end of the three-year performance period. If an employee violates the non-competition and employee non-solicitation provisions after such retirement, all unvested restricted shares, unvested restricted units and unvested and vested share options at the time of the violation would be void, unless otherwise determined by the Compensation Committee of the Board of Trustees.
The following tables summarize compensation information regarding the restricted shares, restricted units, share options and Employee Share Purchase Plan (“ESPP”) for the three years ended
December 31, 2015
,
2014
and
2013
(amounts in thousands):
|
|
Year Ended December 31, 2015
|
||||||||||||||||||
|
Compensation
Expense
|
Compensation
Capitalized
|
Restricted Units
In-Lieu of Bonus (1) |
Compensation
Equity
|
Dividends
Incurred
|
|||||||||||||||
|
Restricted shares (2)
|
$
|
13,755
|
|
$
|
1,311
|
|
$
|
—
|
|
$
|
15,066
|
|
$
|
1,160
|
|
||||
|
Restricted units (2)
|
17,311
|
|
538
|
|
3,654
|
|
21,503
|
|
1,619
|
|
|||||||||
|
Share options
|
2,746
|
|
1,010
|
|
—
|
|
3,756
|
|
—
|
|
|||||||||
|
ESPP discount
|
795
|
|
89
|
|
—
|
|
884
|
|
—
|
|
|||||||||
|
Total
|
$
|
34,607
|
|
$
|
2,948
|
|
$
|
3,654
|
|
$
|
41,209
|
|
$
|
2,779
|
|
||||
|
|
Year Ended December 31, 2014
|
||||||||||||||
|
Compensation
Expense
|
Compensation
Capitalized
|
Compensation
Equity
|
Dividends
Incurred
|
||||||||||||
|
Restricted shares
|
$
|
9,244
|
|
$
|
660
|
|
$
|
9,904
|
|
$
|
1,012
|
|
|||
|
Restricted units
|
11,049
|
|
920
|
|
11,969
|
|
1,248
|
|
|||||||
|
Share options
|
6,453
|
|
896
|
|
7,349
|
|
—
|
|
|||||||
|
ESPP discount
|
797
|
|
62
|
|
859
|
|
—
|
|
|||||||
|
Total
|
$
|
27,543
|
|
$
|
2,538
|
|
$
|
30,081
|
|
$
|
2,260
|
|
|||
F-56
|
|
Year Ended December 31, 2013
|
||||||||||||||
|
Compensation
Expense
|
Compensation
Capitalized
|
Compensation
Equity
|
Dividends
Incurred
|
||||||||||||
|
Restricted shares
|
$
|
12,185
|
|
$
|
1,079
|
|
$
|
13,264
|
|
$
|
967
|
|
|||
|
Restricted units
|
13,108
|
|
501
|
|
13,609
|
|
520
|
|
|||||||
|
Share options
|
9,569
|
|
945
|
|
10,514
|
|
—
|
|
|||||||
|
ESPP discount
|
612
|
|
20
|
|
632
|
|
—
|
|
|||||||
|
Total
|
$
|
35,474
|
|
$
|
2,545
|
|
$
|
38,019
|
|
$
|
1,487
|
|
|||
|
(1)
|
Beginning in 2015, the Company allows officers the ability to receive immediately vested restricted units (subject to the book-up provisions and two-year hold restriction) in-lieu of any percentage of their annual cash bonus.
|
|
(2)
|
Includes performance awards granted under the executive compensation program.
|
Compensation expense is generally recognized for Awards as follows:
|
•
|
Restricted shares, restricted units and share options – Straight-line method over the vesting period of the options, shares or units regardless of cliff or ratable vesting distinctions.
|
|
•
|
Performance awards – Target amount is recognized under the straight-line method over the vesting period of the shares or units regardless of cliff or ratable vesting distinctions.
|
|
•
|
ESPP discount – Immediately upon the purchase of common shares each quarter.
|
The Company accelerates the recognition of compensation expense for all Awards for those individuals approaching or meeting the retirement age criteria discussed above. The total compensation expense related to Awards not yet vested at
December 31, 2015
is
$10.6 million
(excluding the accelerated expenses for individuals approaching or meeting the retirement age criteria discussed above), which is expected to be recognized over a weighted average term of
1.31
years.
See Note 2 for additional information regarding the Company’s share-based compensation.
The table below summarizes the Award activity of the Share Incentive Plans for the three years ended
December 31, 2015
,
2014
and
2013
:
|
Common
Shares Subject
to Options
|
Weighted
Average
Exercise Price
per Option
|
Restricted
Shares
|
Weighted
Average Fair
Value per
Restricted Share
|
Restricted
Units |
Weighted
Average Fair Value per Restricted Unit |
|||||||||||||||
|
Balance at December 31, 2012
|
8,115,255
|
|
|
$41.31
|
|
524,953
|
|
|
$46.81
|
|
285,034
|
|
|
$48.41
|
|
|||||
|
Awards granted (1)
|
1,006,444
|
|
|
$55.07
|
|
246,731
|
|
|
$55.37
|
|
281,931
|
|
|
$52.73
|
|
|||||
|
Awards exercised/vested (2) (3) (4)
|
(586,017
|
)
|
|
$29.34
|
|
(253,816
|
)
|
|
$36.81
|
|
(93,335
|
)
|
|
$32.97
|
|
|||||
|
Awards forfeited
|
(47,819
|
)
|
|
$56.16
|
|
(17,634
|
)
|
|
$55.74
|
|
(2,374
|
)
|
|
$56.72
|
|
|||||
|
Awards expired
|
(17,331
|
)
|
|
$47.51
|
|
—
|
|
—
|
|
—
|
|
—
|
|
|||||||
|
Balance at December 31, 2013
|
8,470,532
|
|
|
$43.67
|
|
500,234
|
|
|
$55.79
|
|
471,256
|
|
|
$55.67
|
|
|||||
|
Awards granted (1)
|
667,877
|
|
|
$56.72
|
|
176,457
|
|
|
$56.56
|
|
201,507
|
|
|
$53.82
|
|
|||||
|
Awards exercised/vested (2) (3) (4)
|
(2,086,380
|
)
|
|
$39.34
|
|
(175,344
|
)
|
|
$53.44
|
|
(60,294
|
)
|
|
$53.71
|
|
|||||
|
Awards forfeited
|
(19,022
|
)
|
|
$56.32
|
|
(6,735
|
)
|
|
$56.57
|
|
(667
|
)
|
|
$52.08
|
|
|||||
|
Awards expired
|
(2,387
|
)
|
|
$55.24
|
|
—
|
|
—
|
|
—
|
|
—
|
|
|||||||
|
Conversion of restricted shares
to restricted units |
—
|
|
—
|
|
(12,146
|
)
|
—
|
|
12,146
|
|
—
|
|
||||||||
|
Balance at December 31, 2014
|
7,030,620
|
|
|
$46.16
|
|
482,466
|
|
|
$56.89
|
|
623,948
|
|
|
$53.38
|
|
|||||
|
Awards granted (1) (5)
|
171,150
|
|
|
$80.15
|
|
174,112
|
|
|
$79.65
|
|
337,505
|
|
|
$81.87
|
|
|||||
|
Awards exercised/vested (2) (3) (4)
|
(1,456,363
|
)
|
|
$42.64
|
|
(127,174
|
)
|
|
$60.21
|
|
(72,003
|
)
|
|
$57.12
|
|
|||||
|
Awards forfeited
|
(9,550
|
)
|
|
$64.53
|
|
(5,970
|
)
|
|
$62.11
|
|
(2,009
|
)
|
|
$64.39
|
|
|||||
|
Awards expired
|
(1,492
|
)
|
|
$39.86
|
|
—
|
|
—
|
|
—
|
|
—
|
|
|||||||
|
Conversion of restricted shares
to restricted units |
—
|
|
—
|
|
(1,284
|
)
|
—
|
|
1,284
|
|
—
|
|
||||||||
|
Balance at December 31, 2015
|
5,734,365
|
|
|
$48.04
|
|
522,150
|
|
|
$63.67
|
|
888,725
|
|
|
$63.91
|
|
|||||
F-57
|
(1)
|
The weighted average grant date fair value for Options granted during the years ended
December 31, 2015
,
2014
and
2013
was
$13.67
per share,
$9.21
per share and
$7.97
per share, respectively.
|
|
(2)
|
The aggregate intrinsic value of options exercised during the years ended
December 31, 2015
,
2014
and
2013
was
$52.9 million
,
$50.8 million
and
$16.7 million
, respectively. These values were calculated as the difference between the strike price of the underlying awards and the per share price at which each respective award was exercised.
|
|
(3)
|
The fair value of restricted shares vested during the years ended
December 31, 2015
,
2014
and
2013
was
$10.2 million
,
$10.2 million
and
$13.9 million
, respectively.
|
|
(4)
|
The fair value of restricted units vested during the years ended
December 31, 2015
,
2014
and
2013
was
$5.8 million
,
$3.4 million
and
$5.1 million
, respectively.
|
|
(5)
|
Includes performance awards granted under the executive compensation program.
|
The following table summarizes information regarding options outstanding and exercisable at
December 31, 2015
:
|
|
Options Outstanding (1)
|
Options Exercisable (2)
|
||||||||||||||
|
Range of Exercise Prices
|
Options
|
Weighted
Average
Remaining
Contractual Life in Years
|
Weighted
Average
Exercise Price
|
Options
|
Weighted
Average
Exercise Price
|
|||||||||||
|
$18.70 to $24.93
|
865,289
|
|
3.10
|
|
$23.07
|
|
865,289
|
|
|
$23.07
|
|
|||||
|
$24.94 to $37.39
|
634,733
|
|
4.10
|
|
$32.97
|
|
634,733
|
|
|
$32.97
|
|
|||||
|
$37.40 to $43.62
|
446,345
|
|
1.17
|
|
$40.53
|
|
446,345
|
|
|
$40.53
|
|
|||||
|
$43.63 to $49.86
|
2,056
|
|
4.83
|
|
$48.63
|
|
2,056
|
|
|
$48.63
|
|
|||||
|
$49.87 to $56.09
|
1,969,539
|
|
5.58
|
|
$53.96
|
|
1,278,111
|
|
|
$54.06
|
|
|||||
|
$56.10 to $62.32
|
1,648,650
|
|
6.92
|
|
$58.65
|
|
1,209,674
|
|
|
$59.44
|
|
|||||
|
$68.56 to $74.78
|
2,353
|
|
9.49
|
|
$71.35
|
|
—
|
|
—
|
|
||||||
|
$74.79 to $81.01
|
165,400
|
|
9.11
|
|
$80.27
|
|
782
|
|
|
$80.27
|
|
|||||
|
$18.70 to $81.01
|
5,734,365
|
|
5.19
|
|
$48.04
|
|
4,436,990
|
|
|
$45.11
|
|
|||||
|
Vested and expected to vest
as of December 31, 2015 |
5,696,241
|
|
5.07
|
|
$47.96
|
|
|
|
|
|
||||||
|
(1)
|
The aggregate intrinsic value of options outstanding that are vested and expected to vest as of
December 31, 2015
is
$191.6 million
.
|
|
(2)
|
The aggregate intrinsic value and weighted average remaining contractual life in years of options exercisable as of
December 31, 2015
is
$161.9 million
and
4.6
years, respectively.
|
Note: The aggregate intrinsic values in Notes (1) and (2) above were both calculated as the excess, if any, between the Company’s closing share price of
$81.59
per share on
December 31, 2015
and the strike price of the underlying awards.
As of
December 31, 2014
and
2013
,
5,011,784
Options (with a weighted average exercise price of
$42.18
) and
6,046,489
Options (with a weighted average exercise price of
$38.76
) were exercisable, respectively.
|
13.
|
Employee Plans
|
The Company established an Employee Share Purchase Plan to provide each employee and trustee the ability to annually acquire up to $
100,000
of Common Shares of EQR. In 2003, EQR's shareholders approved an increase in the aggregate number of Common Shares available under the ESPP to
7,000,000
(from
2,000,000
). The Company has
2,970,072
Common Shares available for purchase under the ESPP at
December 31, 2015
. The Common Shares may be purchased quarterly at a price equal to
85%
of the lesser of: (a) the closing price for a share on the last day of such quarter; and (b) the greater of: (i) the closing price for a share on the first day of such quarter, and (ii) the average closing price for a share for all the business days in the quarter. The following table summarizes information regarding the Common Shares issued under the ESPP (the net proceeds noted below were contributed to ERPOP in exchange for OP Units):
|
|
Year Ended December 31,
|
||||
|
|
2015
|
2014
|
2013
|
||
|
|
(Amounts in thousands except share and per share amounts)
|
||||
|
Shares issued
|
68,462
|
68,807
|
73,468
|
||
|
Issuance price ranges
|
$63.70 – $65.90
|
$45.90 – $55.95
|
$44.26 – $48.17
|
||
|
Issuance proceeds
|
$4,404
|
$3,392
|
$3,401
|
||
F-58
The Company established a defined contribution plan (the “401(k) Plan”) to provide retirement benefits for employees that meet minimum employment criteria. Prior to 2014, the Company matched dollar for dollar up to the first
3%
of eligible compensation that a participant contributed to the 401(k) Plan. Beginning January 1, 2014, the Company increased its match to
4%
of eligible compensation that a participant contributes to the 401(k) Plan for all employees except those defined as highly compensated employees, whose match remains at
3%
. Participants are vested in the Company’s contributions over
five
years. The Company recognized an expense in the amount of
$5.5 million
,
$5.2 million
and
$4.2 million
for the years ended
December 31, 2015
,
2014
and
2013
, respectively.
The Company established the SERP to provide certain officers and trustees an opportunity to defer a portion of their eligible compensation in order to save for retirement. The SERP is restricted to investments in Common Shares, certain marketable securities that have been specifically approved and cash equivalents. The deferred compensation liability represented in the SERP and the securities issued to fund such deferred compensation liability are consolidated by the Company and carried on the Company’s balance sheet, and the Company’s Common Shares held in the SERP are accounted for as a reduction to paid in capital (included in general partner's capital in the Operating Partnership's financial statements).
|
14.
|
Distribution Reinvestment Plan
|
On
November 18, 2011
, the Company filed with the SEC a Form S-3 Registration Statement to register
4,850,000
Common Shares pursuant to a Distribution Reinvestment and Share Purchase Plan (the "2011 DRIP"), which included the remaining shares available for issuance under a 2008 registration, which terminated as of such date. The registration statement was automatically declared effective the same day and was to expire at the earlier of the date on which all
4,850,000
shares had been issued or November 18, 2014. On September 30, 2014, the Company filed with the SEC a Form S-3 Registration Statement to register
4,790,000
Common Shares under an amended Distribution Reinvestment Plan (the "2014 DRIP"), which included the remaining shares available for issuance under the 2011 DRIP, which terminated as of such date. The registration was automatically declared effective the same day and will expire when all
4,790,000
shares have been issued. The Company has
4,775,789
Common Shares available for issuance under the 2014 DRIP at
December 31, 2015
.
The 2014 DRIP provides holders of record and beneficial owners of Common Shares and Preferred Shares with a simple and convenient method of reinvesting cash dividends/distributions in additional Common Shares. Common Shares purchased under the 2014 DRIP may, at the option of EQR, be directly issued by EQR or purchased by EQR's transfer agent in the open market using participants' funds. The net proceeds from any Common Share issuances are contributed to ERPOP in exchange for OP Units.
|
15.
|
Transactions with Related Parties
|
Pursuant to the terms of its partnership agreement, ERPOP is required to reimburse EQR for all expenses incurred by EQR in excess of income earned by EQR through its indirect
1%
ownership of various entities. Amounts paid on behalf of EQR are reflected in the consolidated statements of operations and comprehensive income as general and administrative expenses.
The Company leases its corporate headquarters from an entity controlled by EQR’s Chairman of the Board of Trustees. The lease terminates on
January 31, 2022
. Amounts incurred for such office space for the years ended
December 31, 2015
,
2014
and
2013
, respectively, were approximately
$2.6 million
,
$2.5 million
and
$1.7 million
. The Company believes these amounts equal market rates for such rental space.
|
16.
|
Commitments and Contingencies
|
The Company, as an owner of real estate, is subject to various Federal, state and local environmental laws. Compliance by the Company with existing laws has not had a material adverse effect on the Company. However, the Company cannot predict the impact of new or changed laws or regulations on its current properties or on properties that it may acquire in the future.
The Company is party to a housing discrimination lawsuit brought by a non-profit civil rights organization in April 2006 in the U.S. District Court for the District of Maryland. The suit alleges that the Company designed and built certain of its properties in violation of the accessibility requirements of the Fair Housing Act and Americans With Disabilities Act. The suit seeks actual and punitive damages, injunctive relief (including modification of non-compliant properties), costs and attorneys' fees. The Company believes it has a number of viable defenses, including that a majority of the named properties were completed before the operative dates of the statutes in question and/or were not designed or built by the Company. Accordingly, the Company is defending the suit vigorously. Due to the pendency of the Company's defenses and the uncertainty of many other critical factual and legal issues, it is not possible to determine or predict the outcome of the suit or a possible loss or a range of loss, and no
F-59
amounts have been accrued at
December 31, 2015
. While no assurances can be given, the Company does not believe that the suit, if adversely determined, would have a material adverse effect on the Company.
The Company has established a reserve related to various litigation matters associated with its Massachusetts properties and periodically assesses the adequacy of the reserve and makes adjustments as necessary. During the year ended December 31, 2015, the Company recorded a reduction to the reserve of approximately
$3.0 million
, resulting in a total reserve of approximately
$3.0 million
at
December 31, 2015
. While no assurances can be given, the Company does not believe that the ultimate resolution of these litigation matters, if adversely determined, would have a material adverse effect on the Company.
The Company does not believe there is any other litigation pending or threatened against it that, individually or in the aggregate, may reasonably be expected to have a material adverse effect on the Company.
As of
December 31, 2015
, the Company has
10
wholly owned projects totaling
3,989
apartment units in various stages of development with commitments to fund of approximately
$762.3 million
and estimated completion dates ranging through
September 30, 2017
, as well as other completed development projects that are in various stages of lease up or are stabilized.
As of
December 31, 2015
, the Company has
two
completed unconsolidated development projects that are stabilized. Both projects were co-developed with the same third party development partner in different ventures. The development venture agreements with this partner are primarily deal-specific regarding profit-sharing, equity contributions, returns on investment, buy-sell agreements and other customary provisions. The Company currently has no further funding obligations related to these projects. While the Company is the managing member of both of the joint ventures, was responsible for constructing both of the projects and gave certain construction cost overrun guarantees, the joint venture partner has significant participating rights and has active involvement in and oversight of the ongoing operations. The buy-sell arrangements contain provisions that provide the right, but not the obligation, for the Company to acquire the partner’s interests or sell its interests at any time following the occurrence of certain pre-defined events (including at stabilization) described in the development venture agreements. See Note 6 for further discussion.
During the years ended
December 31, 2015
,
2014
and
2013
, total operating lease payments expensed for office space, including a portion of real estate taxes, insurance, repairs and utilities, and including rent due under
12
ground leases, aggregated
$17.8 million
,
$14.7 million
and
$13.2 million
, respectively.
The Company has entered into a retirement benefits agreement with its Chairman of the Board of Trustees and deferred compensation agreements with its Vice Chairman and two former chief executive officers (one of which was fully paid out in January 2013). During the years ended
December 31, 2015
,
2014
and
2013
, the Company recognized compensation expense of
$0.4 million
,
$0.5 million
and
$0.5 million
, respectively, related to these agreements.
The following table summarizes the Company’s contractual obligations for minimum rent payments under operating leases and deferred compensation for the next five years and thereafter as of
December 31, 2015
:
|
(Payments)/Receipts Due by Year (in thousands)
|
||||||||||||||||||||||||||||
|
|
2016
|
2017
|
2018
|
2019
|
2020
|
Thereafter
|
Total
|
|||||||||||||||||||||
|
Operating Leases:
|
|
|
|
|
|
|
|
|
|
|
|
|
||||||||||||||||
|
Minimum Rent Payments (a)
|
$
|
(15,723
|
)
|
$
|
(15,721
|
)
|
$
|
(15,712
|
)
|
$
|
(15,567
|
)
|
$
|
(15,158
|
)
|
$
|
(839,521
|
)
|
$
|
(917,402
|
)
|
|||||||
|
Minimum Rent Receipts (b)
|
70,360
|
|
56,759
|
|
50,134
|
|
45,956
|
|
42,050
|
|
210,149
|
|
475,408
|
|
||||||||||||||
|
Other Long-Term Liabilities:
|
|
|
|
|
|
|
|
|
|
|
|
|
|
|||||||||||||||
|
Deferred Compensation (c)
|
(1,387
|
)
|
(1,724
|
)
|
(1,724
|
)
|
(1,130
|
)
|
(1,080
|
)
|
(4,797
|
)
|
(11,842
|
)
|
||||||||||||||
|
(a)
|
Minimum basic rent due for various office space the Company leases and fixed base rent due on ground leases for
12
properties.
|
|
(b)
|
Minimum basic rent receipts due for various retail/commercial space where the Company is the lessor.
|
|
(c)
|
Estimated payments to the Company's Chairman, Vice Chairman and one former CEO based on actual and planned retirement dates.
|
|
17.
|
Reportable Segments
|
Operating segments are defined as components of an enterprise that engage in business activities from which they may earn revenues and incur expenses and about which discrete financial information is available that is evaluated regularly by the chief operating decision maker. The chief operating decision maker decides how resources are allocated and assesses performance on a recurring basis at least quarterly.
F-60
The Company’s primary business is the acquisition, development and management of multifamily residential properties, which includes the generation of rental and other related income through the leasing of apartment units to residents. The chief operating decision maker evaluates the Company's operating performance geographically by market and both on a same store and non-same store basis. The Company’s operating segments located in its core markets and two of its non-core markets represent its reportable segments (with the aggregation of Los Angeles, Orange County and San Diego into the Southern California reportable segment). The Company's operating segments located in its non-core – other markets that are not material have also been aggregated in the tables presented below. See also Note 4 for further discussion of the Starwood Transaction and the operating segments/locations in which properties are being sold.
The Company’s fee and asset management and development activities are other business activities that do not constitute an operating segment and as such, have been aggregated in the "Other" category in the tables presented below.
All revenues are from external customers and there is no customer who contributed 10% or more of the Company’s total revenues during the three years ended
December 31, 2015
,
2014
or
2013
.
The primary financial measure for the Company’s rental real estate segment is net operating income (“NOI”), which represents rental income less: 1) property and maintenance expense; 2) real estate taxes and insurance expense; and 3) property management expense (all as reflected in the accompanying consolidated statements of operations and comprehensive income). The Company believes that NOI is helpful to investors as a supplemental measure of its operating performance because it is a direct measure of the actual operating results of the Company’s apartment communities. Current year NOI is compared to prior year NOI and current year budgeted NOI as a measure of financial performance.
The following table presents a reconciliation of NOI from our rental real estate specific to continuing operations for the years ended
December 31, 2015
,
2014
and
2013
, respectively (amounts in thousands):
|
|
Year Ended December 31,
|
|||||||||||
|
|
2015
|
2014
|
2013
|
|||||||||
|
Rental income
|
$
|
2,736,578
|
|
$
|
2,605,311
|
|
$
|
2,378,004
|
|
|||
|
Property and maintenance expense
|
(479,160
|
)
|
(473,098
|
)
|
(449,427
|
)
|
||||||
|
Real estate taxes and insurance expense
|
(339,802
|
)
|
(325,401
|
)
|
(293,999
|
)
|
||||||
|
Property management expense
|
(81,185
|
)
|
(79,636
|
)
|
(84,342
|
)
|
||||||
|
Total operating expenses
|
(900,147
|
)
|
(878,135
|
)
|
(827,768
|
)
|
||||||
|
Net operating income
|
$
|
1,836,431
|
|
$
|
1,727,176
|
|
$
|
1,550,236
|
|
|||
The following tables present NOI for each segment from our rental real estate specific to continuing operations for the years ended
December 31, 2015
,
2014
and
2013
, respectively, as well as total assets and capital expenditures at
December 31, 2015
and
2014
, respectively (amounts in thousands):
F-61
|
|
Year Ended December 31, 2015
|
Year Ended December 31, 2014
|
Year Ended December 31, 2013
|
|||||||||||||||||||||||||||||||||
|
|
Rental Income
|
Operating Expenses
|
NOI
|
Rental Income
|
Operating Expenses
|
NOI
|
Rental Income
|
Operating Expenses
|
NOI
|
|||||||||||||||||||||||||||
|
Same store (1)
|
|
|
|
|
|
|
|
|
|
|
|
|
|
|
|
|
|
|
||||||||||||||||||
|
Boston
|
$
|
252,620
|
|
$
|
81,176
|
|
$
|
171,444
|
|
$
|
244,612
|
|
$
|
77,408
|
|
$
|
167,204
|
|
$
|
244,370
|
|
$
|
78,249
|
|
$
|
166,121
|
|
|||||||||
|
New York
|
474,850
|
|
176,654
|
|
298,196
|
|
455,598
|
|
170,549
|
|
285,049
|
|
438,366
|
|
165,329
|
|
273,037
|
|
||||||||||||||||||
|
San Francisco
|
376,073
|
|
108,003
|
|
268,070
|
|
340,252
|
|
106,425
|
|
233,827
|
|
312,345
|
|
108,218
|
|
204,127
|
|
||||||||||||||||||
|
Seattle
|
164,319
|
|
50,079
|
|
114,240
|
|
153,197
|
|
50,377
|
|
102,820
|
|
146,109
|
|
49,169
|
|
96,940
|
|
||||||||||||||||||
|
Southern California
|
433,431
|
|
136,559
|
|
296,872
|
|
410,094
|
|
135,091
|
|
275,003
|
|
401,516
|
|
137,667
|
|
263,849
|
|
||||||||||||||||||
|
Washington D.C.
|
455,341
|
|
149,190
|
|
306,151
|
|
451,973
|
|
145,523
|
|
306,450
|
|
448,520
|
|
140,708
|
|
307,812
|
|
||||||||||||||||||
|
Non-core – South Florida
|
202,714
|
|
72,792
|
|
129,922
|
|
191,729
|
|
70,295
|
|
121,434
|
|
182,620
|
|
69,475
|
|
113,145
|
|
||||||||||||||||||
|
Non-core – Denver
|
120,938
|
|
31,708
|
|
89,230
|
|
111,190
|
|
30,811
|
|
80,379
|
|
103,124
|
|
30,567
|
|
72,557
|
|
||||||||||||||||||
|
Non-core – other
|
86,419
|
|
31,719
|
|
54,700
|
|
82,745
|
|
30,858
|
|
51,887
|
|
97,380
|
|
36,483
|
|
60,897
|
|
||||||||||||||||||
|
Total same store
|
2,566,705
|
|
837,880
|
|
1,728,825
|
|
2,441,390
|
|
817,337
|
|
1,624,053
|
|
2,374,350
|
|
815,865
|
|
1,558,485
|
|
||||||||||||||||||
|
Non-same store/other (2) (3)
|
||||||||||||||||||||||||||||||||||||
|
Boston
|
9,028
|
|
2,570
|
|
6,458
|
|
3,637
|
|
841
|
|
2,796
|
|
2,728
|
|
651
|
|
2,077
|
|
||||||||||||||||||
|
New York
|
9,835
|
|
7,460
|
|
2,375
|
|
42
|
|
92
|
|
(50
|
)
|
—
|
|
—
|
|
—
|
|
||||||||||||||||||
|
San Francisco
|
6,408
|
|
2,974
|
|
3,434
|
|
15
|
|
147
|
|
(132
|
)
|
—
|
|
—
|
|
—
|
|
||||||||||||||||||
|
Seattle
|
22,199
|
|
6,478
|
|
15,721
|
|
6,951
|
|
2,172
|
|
4,779
|
|
4,387
|
|
1,336
|
|
3,051
|
|
||||||||||||||||||
|
Southern California
|
71,719
|
|
26,264
|
|
45,455
|
|
49,663
|
|
19,518
|
|
30,145
|
|
15,016
|
|
6,846
|
|
8,170
|
|
||||||||||||||||||
|
Washington D.C.
|
21,822
|
|
6,313
|
|
15,509
|
|
17,927
|
|
6,115
|
|
11,812
|
|
13,562
|
|
4,086
|
|
9,476
|
|
||||||||||||||||||
|
Non-core – South Florida
|
7,912
|
|
2,830
|
|
5,082
|
|
5,480
|
|
2,619
|
|
2,861
|
|
390
|
|
810
|
|
(420
|
)
|
||||||||||||||||||
|
Other (3)
|
20,950
|
|
7,378
|
|
13,572
|
|
80,206
|
|
29,294
|
|
50,912
|
|
59,994
|
|
34,903
|
|
25,091
|
|
||||||||||||||||||
|
Total non-same store/other
|
169,873
|
|
62,267
|
|
107,606
|
|
163,921
|
|
60,798
|
|
103,123
|
|
96,077
|
|
48,632
|
|
47,445
|
|
||||||||||||||||||
|
Archstone pre-ownership (4)
|
—
|
|
—
|
|
—
|
|
—
|
|
—
|
|
—
|
|
(92,423
|
)
|
(36,729
|
)
|
(55,694
|
)
|
||||||||||||||||||
|
Total
|
$
|
2,736,578
|
|
$
|
900,147
|
|
$
|
1,836,431
|
|
$
|
2,605,311
|
|
$
|
878,135
|
|
$
|
1,727,176
|
|
$
|
2,378,004
|
|
$
|
827,768
|
|
$
|
1,550,236
|
|
|||||||||
|
(1)
|
For the years ended
December 31, 2015
and
2014
, same store primarily includes all properties acquired or completed and stabilized prior to January 1,
2014
, less properties subsequently sold, which represented
96,286
apartment units. For the year ended December 31, 2013, same store primarily includes all properties acquired or completed and stabilized prior to January 1, 2013, less properties subsequently sold, which represented
97,911
apartment units and also includes
18,465
stabilized apartment units acquired in the Archstone Acquisition that are owned and managed by the Company.
|
|
(2)
|
For the years ended December 31, 2015 and 2014, non-same store primarily includes properties acquired after January 1,
2014
, plus any properties in lease-up and not stabilized as of January 1,
2014
. For the year ended December 31, 2013, non-same store primarily includes properties acquired after January 1, 2013, plus any properties in lease-up and not stabilized as of January 1, 2013, but excludes
18,465
stabilized apartment units acquired in the Archstone Acquisition that are owned and managed by the Company.
|
|
(3)
|
Other includes development, other corporate operations and operations prior to sale for properties sold in 2014 and 2015 that do not meet the new discontinued operations criteria.
|
|
(4)
|
Represents pro forma Archstone pre-ownership results for the period January 1, 2013 to February 27, 2013 that is included in 2013 same store results.
|
F-62
|
|
Year Ended December 31, 2015
|
Year Ended December 31, 2014
|
||||||||||||||
|
|
Total Assets
|
Capital Expenditures
|
Total Assets
|
Capital Expenditures
|
||||||||||||
|
Same store (1)
|
|
|
|
|
|
|
|
|
||||||||
|
Boston
|
$
|
1,840,812
|
|
$
|
18,759
|
|
$
|
1,897,740
|
|
$
|
19,254
|
|
||||
|
New York
|
4,585,328
|
|
19,273
|
|
4,647,269
|
|
22,118
|
|
||||||||
|
San Francisco
|
2,653,629
|
|
25,813
|
|
2,718,174
|
|
26,994
|
|
||||||||
|
Seattle
|
1,058,090
|
|
13,565
|
|
1,087,575
|
|
14,333
|
|
||||||||
|
Southern California
|
2,725,230
|
|
29,729
|
|
2,809,390
|
|
26,713
|
|
||||||||
|
Washington D.C.
|
4,169,317
|
|
35,522
|
|
4,282,317
|
|
44,607
|
|
||||||||
|
Non-core – South Florida
|
1,109,699
|
|
16,297
|
|
1,135,553
|
|
14,335
|
|
||||||||
|
Non-core – Denver
|
506,317
|
|
8,341
|
|
520,537
|
|
5,863
|
|
||||||||
|
Non-core – other
|
322,281
|
|
6,115
|
|
333,398
|
|
4,743
|
|
||||||||
|
Total same store
|
18,970,703
|
|
173,414
|
|
19,431,953
|
|
178,960
|
|
||||||||
|
|
||||||||||||||||
|
Non-same store/other (2) (3)
|
||||||||||||||||
|
Boston
|
171,832
|
|
629
|
|
48,323
|
|
699
|
|
||||||||
|
New York
|
364,475
|
|
(8
|
)
|
356,064
|
|
12
|
|
||||||||
|
San Francisco
|
262,851
|
|
6
|
|
218,415
|
|
—
|
|
||||||||
|
Seattle
|
453,111
|
|
457
|
|
335,086
|
|
918
|
|
||||||||
|
Southern California
|
911,728
|
|
6,360
|
|
851,812
|
|
1,968
|
|
||||||||
|
Washington D.C.
|
235,841
|
|
677
|
|
243,174
|
|
467
|
|
||||||||
|
Non-core – South Florida
|
64,854
|
|
42
|
|
67,834
|
|
8
|
|
||||||||
|
Other (3)
|
1,721,933
|
|
536
|
|
1,397,953
|
|
2,925
|
|
||||||||
|
Total non-same store/other
|
4,186,625
|
|
8,699
|
|
3,518,661
|
|
6,997
|
|
||||||||
|
Total
|
$
|
23,157,328
|
|
$
|
182,113
|
|
$
|
22,950,614
|
|
$
|
185,957
|
|
||||
|
(1)
|
Same store primarily includes all properties acquired or completed and stabilized prior to January 1,
2014
, less properties subsequently sold, which represented
96,286
apartment units.
|
|
(2)
|
Non-same store primarily includes properties acquired after January 1,
2014
, plus any properties in lease-up and not stabilized as of January 1,
2014
.
|
|
(3)
|
Other includes development, other corporate operations and capital expenditures for properties sold.
|
Note: Markets/Metro Areas included in the above Southern California and Non-core – other segments are as follows:
(a) Southern California – Los Angeles, Orange County and San Diego.
(b) Non-core – other – Inland Empire, CA, New England (excluding Boston) and Phoenix.
|
18.
|
Subsequent Events/Other
|
Subsequent Events
Subsequent to
December 31, 2015
, the Company:
|
•
|
Completed the sale of
72
properties consisting of
23,262
apartment units to controlled affiliates of Starwood Capital Group for
$5.365 billion
on January 26 and 27, 2016 (see Note 4 for further discussion);
|
|
•
|
Sold River Tower in New York, NY consisting of
323
apartment units for
$390.0 million
;
|
|
•
|
Sold Woodland Park in East Palo Alto, CA consisting of
1,811
apartment units for
$412.5 million
;
|
|
•
|
In addition to the Starwood Transaction and the sales discussed above, sold
six
other properties consisting of
766
apartment units and
one
land parcel for
$162.7 million
;
|
|
•
|
Retired approximately
$1.7 billion
in debt principal prior to scheduled maturity using proceeds from the Starwood Transaction and other sales discussed above and incurred approximately
$112.4 million
in prepayment penalties associated with these debt extinguishments. The payoffs included the following secured and unsecured debt:
|
|
◦
|
Repaid
$440.8 million
of
6.256%
mortgage debt held in a Fannie Mae loan pool maturing in
2017
and
|
F-63
incurred a prepayment penalty of approximately
$29.3 million
;
|
◦
|
Repaid
$41.8 million
of various tax-exempt mortgage bonds maturing in
2026
through
2034
and incurred a prepayment penalty of approximately
$0.2 million
;
|
|
◦
|
Repaid
$228.9 million
of
5.125%
unsecured notes maturing in
2016
and incurred a prepayment penalty of approximately
$1.4 million
;
|
|
◦
|
Repaid
$400.0 million
of
5.375%
unsecured notes maturing in
2016
and incurred a prepayment penalty of approximately
$9.5 million
;
|
|
◦
|
Repaid
$255.9 million
of
5.750%
unsecured notes maturing in
2017
and incurred a prepayment penalty of approximately
$16.5 million
;
|
|
◦
|
Repaid
$46.1 million
of
7.125%
unsecured notes maturing in
2017
and incurred a prepayment penalty of approximately
$4.6 million
;
|
|
◦
|
Repaid
$250.0 million
of
4.625%
unsecured notes maturing in
2021
and incurred a prepayment penalty of approximately
$31.6 million
;
|
|
◦
|
Repaid
$48.0 million
of
7.570%
unsecured notes maturing in
2026
and incurred a prepayment penalty of approximately
$19.3 million
; and
|
|
•
|
Declared a special dividend of
$8.00
per share/unit on February 22, 2016 that will be paid on March 10, 2016 to shareholders/unitholders of record as of March 3, 2016 using proceeds from the Starwood Transaction and other sales discussed above.
|
Other
During the years ended
December 31, 2015
,
2014
and
2013
, the Company incurred charges of
$1.0 million
,
$0.4 million
and
$0.3 million
, respectively, related to property acquisition costs, such as survey, title and legal fees, on the acquisition of operating properties (excluding the Archstone Transaction) and
$3.2 million
,
$3.6 million
and
$5.2 million
, respectively, related to the write-off of various pursuit and out-of-pocket costs for terminated acquisition, disposition and development transactions. These costs, totaling
$4.2 million
,
$4.0 million
and
$5.5 million
, respectively, are included in other expenses in the accompanying consolidated statements of operations and comprehensive income. See Note 4 for details on the property acquisition costs related to the Archstone Transaction.
During the years ended December 31, 2015 and 2014, the Company received
$6.0 million
and
$2.8 million
, respectively, for the settlement of various litigation/insurance claims, which are included in interest and other income in the accompanying consolidated statements of operations and comprehensive income.
During the year ended December 31, 2013, the Company sold a technology investment it had previously written off, receiving proceeds of
$2.1 million
that were recorded as a realized gain on sale and are included in interest and other income in the accompanying consolidated statements of operations and comprehensive income.
During the year ended December 31, 2011, the Company disposed of its corporate housing business for a sales price of approximately
$4.0 million
, of which the Company provided
$2.0 million
of seller financing to the buyer. At the time of sale, the full amount of the seller financing was reserved against and the related gain was deferred. During the year ended December 31, 2013, the Company collected
$1.5 million
, which represented its final reimbursement of the
$2.0 million
of seller financing. The Company has recognized a cumulative net gain on the sale of approximately
$2.9 million
.
F-64
|
19.
|
Quarterly Financial Data (Unaudited)
|
Equity Residential
The following unaudited quarterly data has been prepared on the basis of a December 31 year-end. Amounts are in thousands, except for per share amounts.
|
First Quarter
|
Second Quarter
|
Third Quarter
|
Fourth Quarter
|
|||||||||||||
|
2015
|
3/31
|
6/30
|
9/30
|
12/31
|
||||||||||||
|
Total revenues
|
$
|
666,371
|
|
$
|
679,112
|
|
$
|
696,289
|
|
$
|
703,193
|
|
||||
|
Operating income
|
218,171
|
|
246,184
|
|
257,501
|
|
286,964
|
|
||||||||
|
Income from continuing operations
|
190,069
|
|
298,504
|
|
205,375
|
|
213,673
|
|
||||||||
|
Discontinued operations, net
|
155
|
|
114
|
|
81
|
|
47
|
|
||||||||
|
Net income *
|
190,224
|
|
298,618
|
|
205,456
|
|
213,720
|
|
||||||||
|
Net income available to Common Shares
|
178,842
|
|
285,587
|
|
195,859
|
|
202,989
|
|
||||||||
|
Earnings per share – basic:
|
||||||||||||||||
|
Net income available to Common Shares
|
$
|
0.49
|
|
$
|
0.79
|
|
$
|
0.54
|
|
$
|
0.56
|
|
||||
|
Weighted average Common Shares outstanding
|
363,098
|
|
363,476
|
|
363,579
|
|
363,828
|
|
||||||||
|
Earnings per share – diluted:
|
||||||||||||||||
|
Net income available to Common Shares
|
$
|
0.49
|
|
$
|
0.78
|
|
$
|
0.53
|
|
$
|
0.55
|
|
||||
|
Weighted average Common Shares outstanding
|
380,327
|
|
380,491
|
|
380,663
|
|
381,220
|
|
||||||||
|
First Quarter
|
Second Quarter
|
Third Quarter
|
Fourth Quarter
|
|||||||||||||
|
2014
|
3/31
|
6/30
|
9/30
|
12/31
|
||||||||||||
|
Total revenues
|
$
|
633,442
|
|
$
|
652,568
|
|
$
|
664,078
|
|
$
|
664,660
|
|
||||
|
Operating income
|
199,259
|
|
228,310
|
|
243,274
|
|
250,532
|
|
||||||||
|
Income from continuing operations
|
81,680
|
|
117,210
|
|
231,252
|
|
226,959
|
|
||||||||
|
Discontinued operations, net
|
1,052
|
|
510
|
|
(62
|
)
|
82
|
|
||||||||
|
Net income *
|
82,732
|
|
117,720
|
|
231,190
|
|
227,041
|
|
||||||||
|
Net income available to Common Shares
|
78,099
|
|
111,654
|
|
220,707
|
|
216,703
|
|
||||||||
|
Earnings per share – basic:
|
||||||||||||||||
|
Net income available to Common Shares
|
$
|
0.22
|
|
$
|
0.31
|
|
$
|
0.61
|
|
$
|
0.60
|
|
||||
|
Weighted average Common Shares outstanding
|
360,470
|
|
360,809
|
|
361,409
|
|
362,018
|
|
||||||||
|
Earnings per share – diluted:
|
||||||||||||||||
|
Net income available to Common Shares
|
$
|
0.22
|
|
$
|
0.31
|
|
$
|
0.61
|
|
$
|
0.59
|
|
||||
|
Weighted average Common Shares outstanding
|
376,384
|
|
377,118
|
|
377,954
|
|
378,886
|
|
||||||||
* The Company did not have any extraordinary items or cumulative effect of change in accounting principle during the years ended
December 31, 2015
and
2014
. Therefore, income before extraordinary items and cumulative effect of change in accounting principle is not shown as it was equal to the net income amounts disclosed above.
F-65
ERP Operating Limited Partnership
The following unaudited quarterly data has been prepared on the basis of a December 31 year-end. Amounts are in thousands, except for per Unit amounts.
|
First Quarter
|
Second Quarter
|
Third Quarter
|
Fourth Quarter
|
|||||||||||||
|
2015
|
3/31
|
6/30
|
9/30
|
12/31
|
||||||||||||
|
Total revenues
|
$
|
666,371
|
|
$
|
679,112
|
|
$
|
696,289
|
|
$
|
703,193
|
|
||||
|
Operating income
|
218,171
|
|
246,184
|
|
257,501
|
|
286,964
|
|
||||||||
|
Income from continuing operations
|
190,069
|
|
298,504
|
|
205,375
|
|
213,673
|
|
||||||||
|
Discontinued operations, net
|
155
|
|
114
|
|
81
|
|
47
|
|
||||||||
|
Net income *
|
190,224
|
|
298,618
|
|
205,456
|
|
213,720
|
|
||||||||
|
Net income available to Units
|
185,901
|
|
296,941
|
|
203,637
|
|
211,039
|
|
||||||||
|
Earnings per Unit – basic:
|
|
|
|
|
|
|
|
|
||||||||
|
Net income available to Units
|
$
|
0.49
|
|
$
|
0.79
|
|
$
|
0.54
|
|
$
|
0.56
|
|
||||
|
Weighted average Units outstanding
|
376,696
|
|
377,063
|
|
377,147
|
|
377,380
|
|
||||||||
|
Earnings per Unit – diluted:
|
|
|
|
|
|
|
||||||||||
|
Net income available to Units
|
$
|
0.49
|
|
$
|
0.78
|
|
$
|
0.53
|
|
$
|
0.55
|
|
||||
|
Weighted average Units outstanding
|
380,327
|
|
380,491
|
|
380,663
|
|
381,220
|
|
||||||||
|
First Quarter
|
Second Quarter
|
Third Quarter
|
Fourth Quarter
|
|||||||||||||
|
2014
|
3/31
|
6/30
|
9/30
|
12/31
|
||||||||||||
|
Total revenues
|
$
|
633,442
|
|
$
|
652,568
|
|
$
|
664,078
|
|
$
|
664,660
|
|
||||
|
Operating income
|
199,259
|
|
228,310
|
|
243,274
|
|
250,532
|
|
||||||||
|
Income from continuing operations
|
81,680
|
|
117,210
|
|
231,252
|
|
226,959
|
|
||||||||
|
Discontinued operations, net
|
1,052
|
|
510
|
|
(62
|
)
|
82
|
|
||||||||
|
Net income *
|
82,732
|
|
117,720
|
|
231,190
|
|
227,041
|
|
||||||||
|
Net income available to Units
|
81,192
|
|
116,096
|
|
229,445
|
|
225,261
|
|
||||||||
|
Earnings per Unit – basic:
|
|
|
|
|
|
|
|
|
||||||||
|
Net income available to Units
|
$
|
0.22
|
|
$
|
0.31
|
|
$
|
0.61
|
|
$
|
0.60
|
|
||||
|
Weighted average Units outstanding
|
374,201
|
|
374,551
|
|
375,116
|
|
375,711
|
|
||||||||
|
Earnings per Unit – diluted:
|
|
|
|
|
|
|
|
|
||||||||
|
Net income available to Units
|
$
|
0.22
|
|
$
|
0.31
|
|
$
|
0.61
|
|
$
|
0.59
|
|
||||
|
Weighted average Units outstanding
|
376,384
|
|
377,118
|
|
377,954
|
|
378,886
|
|
||||||||
* The Operating Partnership did not have any extraordinary items or cumulative effect of change in accounting principle during the years ended
December 31, 2015
and
2014
. Therefore, income before extraordinary items and cumulative effect of change in accounting principle is not shown as it was equal to the net income amounts disclosed above.
F-66
EQUITY RESIDENTIAL
ERP OPERATING LIMITED PARTNERSHIP
Schedule III - Real Estate and Accumulated Depreciation
Overall Summary
December 31, 2015
|
Properties (H)
|
Apartment Units (H)
|
Investment in Real Estate, Gross
|
Accumulated
Depreciation
|
Investment in Real Estate, Net
|
Encumbrances (1)
|
||||||||||||||||
|
Investment in Real Estate – Wholly Owned Unencumbered
|
211
|
|
52,513
|
|
$
|
17,437,812,582
|
|
$
|
(3,224,397,212
|
)
|
$
|
14,213,415,370
|
|
$
|
—
|
|
|||||
|
Investment in Real Estate – Wholly Owned Encumbered
|
87
|
|
23,686
|
|
7,054,964,658
|
|
(1,464,311,726
|
)
|
5,590,652,932
|
|
4,220,456,586
|
|
|||||||||
|
Investment in Real Estate – Wholly Owned Properties
|
298
|
|
76,199
|
|
24,492,777,240
|
|
(4,688,708,938
|
)
|
19,804,068,302
|
|
4,220,456,586
|
|
|||||||||
|
Investment in Real Estate – Partially Owned Unencumbered
|
9
|
|
1,661
|
|
262,146,372
|
|
(96,031,075
|
)
|
166,115,297
|
|
—
|
|
|||||||||
|
Investment in Real Estate – Partially Owned Encumbered
|
10
|
|
2,110
|
|
427,427,967
|
|
(120,665,999
|
)
|
306,761,968
|
|
343,428,578
|
|
|||||||||
|
Investment in Real Estate – Partially Owned Properties
|
19
|
|
3,771
|
|
689,574,339
|
|
(216,697,074
|
)
|
472,877,265
|
|
343,428,578
|
|
|||||||||
|
Total Investment in Real Estate
|
317
|
|
79,970
|
|
$
|
25,182,351,579
|
|
$
|
(4,905,406,012
|
)
|
$
|
20,276,945,567
|
|
$
|
4,563,885,164
|
|
|||||
|
Real Estate Held For Sale – Wholly Owned Unencumbered
|
68
|
|
21,494
|
|
$
|
3,118,799,507
|
|
$
|
(1,075,431,644
|
)
|
$
|
2,043,367,863
|
|
$
|
—
|
|
|||||
|
Real Estate Held For Sale – Wholly Owned Encumbered (2)
|
4
|
|
1,768
|
|
241,545,360
|
|
(103,778,656
|
)
|
137,766,704
|
|
140,985,116
|
|
|||||||||
|
Total Real Estate Held For Sale
|
72
|
|
23,262
|
|
$
|
3,360,344,867
|
|
$
|
(1,179,210,300
|
)
|
$
|
2,181,134,567
|
|
$
|
140,985,116
|
|
|||||
|
Total Unencumbered Properties
|
288
|
|
75,668
|
|
$
|
20,818,758,461
|
|
$
|
(4,395,859,931
|
)
|
$
|
16,422,898,530
|
|
$
|
—
|
|
|||||
|
Total Encumbered Properties
|
101
|
|
27,564
|
|
7,723,937,985
|
|
(1,688,756,381
|
)
|
6,035,181,604
|
|
4,704,870,280
|
|
|||||||||
|
Total Investment in Real Estate and Real Estate Held For Sale
|
389
|
|
103,232
|
|
$
|
28,542,696,446
|
|
$
|
(6,084,616,312
|
)
|
$
|
22,458,080,134
|
|
$
|
4,704,870,280
|
|
|||||
|
(1)
|
See attached Encumbrances Reconciliation.
|
|
(2)
|
Includes certain mortgage debt that was required to be paid off prior to closing the Starwood Transaction.
|
S-1
EQUITY RESIDENTIAL
ERP OPERATING LIMITED PARTNERSHIP
Schedule III - Real Estate and Accumulated Depreciation
Encumbrances Reconciliation
December 31, 2015
|
Portfolio/Entity Encumbrances
|
Number of
Properties Encumbered by
|
See Properties With Note:
|
Partially Owned Encumbrances
|
Wholly Owned Encumbrances
|
Total Amount
|
|||||||||||
|
EQR-Fanwell 2007 LP
|
4
|
I
|
$
|
—
|
|
$
|
300,000,000
|
|
$
|
300,000,000
|
|
|||||
|
EQR-Wellfan 2008 LP (R)
|
10
|
J
|
—
|
|
550,000,000
|
|
550,000,000
|
|
||||||||
|
ASN-Fannie Mae 3
|
5
|
K
|
24,223,525
|
|
438,177,000
|
|
462,400,525
|
|
||||||||
|
Archstone Master Property Holdings LLC
|
13
|
L
|
—
|
|
800,000,000
|
|
800,000,000
|
|
||||||||
|
Portfolio/Entity Encumbrances
|
32
|
|
24,223,525
|
|
2,088,177,000
|
|
2,112,400,525
|
|
||||||||
|
Property Encumbrances – Investment in Real Estate
|
|
|
319,205,053
|
|
2,132,279,586
|
|
2,451,484,639
|
|
||||||||
|
Total Encumbrances – Investment in Real Estate
|
343,428,578
|
|
4,220,456,586
|
|
4,563,885,164
|
|
||||||||||
|
Property Encumbrances – Real Estate Held For Sale
|
—
|
|
140,985,116
|
|
140,985,116
|
|
||||||||||
|
Total Encumbrances per Financial Statements
|
|
|
$
|
343,428,578
|
|
$
|
4,361,441,702
|
|
$
|
4,704,870,280
|
|
|||||
S-2
EQUITY RESIDENTIAL
ERP OPERATING LIMITED PARTNERSHIP
Schedule III – Real Estate and Accumulated Depreciation
(Amounts in thousands)
The changes in total real estate for the years ended
December 31, 2015
,
2014
and
2013
are as follows:
|
2015
|
2014
|
2013
|
|||||||||
|
Balance, beginning of year
|
$
|
27,675,383
|
|
$
|
26,800,948
|
|
$
|
21,008,429
|
|
||
|
Acquisitions and development
|
964,645
|
|
1,121,423
|
|
9,273,492
|
|
|||||
|
Improvements
|
186,104
|
|
191,243
|
|
139,950
|
|
|||||
|
Dispositions and other
|
(283,435
|
)
|
(438,231
|
)
|
(3,620,923
|
)
|
|||||
|
Balance, end of year (1)
|
$
|
28,542,697
|
|
$
|
27,675,383
|
|
$
|
26,800,948
|
|
||
The changes in accumulated depreciation for the years ended
December 31, 2015
,
2014
and
2013
are as follows:
|
2015
|
2014
|
2013
|
|||||||||
|
Balance, beginning of year
|
$
|
5,432,805
|
|
$
|
4,807,709
|
|
$
|
4,912,221
|
|
||
|
Depreciation
|
765,895
|
|
758,861
|
|
1,013,353
|
|
|||||
|
Dispositions and other
|
(114,084
|
)
|
(133,765
|
)
|
(1,117,865
|
)
|
|||||
|
Balance, end of year (1)
|
$
|
6,084,616
|
|
$
|
5,432,805
|
|
$
|
4,807,709
|
|
||
(1) Balances at
December 31, 2015
include assets classified as real estate held for sale
S-3
EQUITY RESIDENTIAL
ERP OPERATING LIMITED PARTNERSHIP
Schedule III - Real Estate and Accumulated Depreciation
December 31, 2015
|
Description
|
|
Initial Cost to Company
|
Cost Capitalized Subsequent to Acquisition(Improvements, net) (E)
|
Gross Amount Carried at Close of Period 12/31/15
|
|
|
|
|
||||||||||||||||||||||||||||||||||||
|
Apartment Name
|
Location
|
Retail/Commercial Space
|
Date of Construction
|
Apartment Units (H)
|
Land
|
Building & Fixtures
|
Building & Fixtures
|
Land
|
Building & Fixtures (A)
|
Total (B)
|
Accumulated Depreciation (C)
|
Investment in Real Estate, Net at 12/31/15 (B)
|
Encumbrances
|
|||||||||||||||||||||||||||||||
|
Investment in Real Estate
–
Wholly Owned Unencumbered:
|
||||||||||||||||||||||||||||||||||||||||||||
|
100 K Street
|
Washington, D.C.
|
—
|
(F)
|
—
|
|
$
|
15,600,000
|
|
$
|
3,409,415
|
|
$
|
—
|
|
$
|
15,600,000
|
|
$
|
3,409,415
|
|
$
|
19,009,415
|
|
$
|
—
|
|
$
|
19,009,415
|
|
$
|
—
|
|
||||||||||||
|
170 Amsterdam
|
New York, NY
|
G
|
2015
|
236
|
|
—
|
|
111,609,104
|
|
3,648
|
|
—
|
|
111,612,752
|
|
111,612,752
|
|
(2,550,383
|
)
|
109,062,369
|
|
—
|
|
|||||||||||||||||||||
|
175 Kent
|
Brooklyn, NY
|
G
|
2011
|
113
|
|
22,037,831
|
|
53,962,169
|
|
1,187,580
|
|
22,037,831
|
|
55,149,749
|
|
77,187,580
|
|
(10,449,629
|
)
|
66,737,951
|
|
—
|
|
|||||||||||||||||||||
|
180 Montague (fka Brooklyn Heights)
|
Brooklyn, NY
|
G
|
2000
|
193
|
|
32,400,000
|
|
92,675,228
|
|
1,964,453
|
|
32,400,000
|
|
94,639,681
|
|
127,039,681
|
|
(13,281,633
|
)
|
113,758,048
|
|
—
|
|
|||||||||||||||||||||
|
1111 Belle Pre (fka The Madison)
|
Alexandria, VA
|
G
|
2014
|
360
|
|
18,937,702
|
|
92,822,313
|
|
109,202
|
|
18,937,702
|
|
92,931,515
|
|
111,869,217
|
|
(8,083,006
|
)
|
103,786,211
|
|
—
|
|
|||||||||||||||||||||
|
1210 Mass
|
Washington, D.C.
|
G
|
2004
|
144
|
|
9,213,512
|
|
36,559,189
|
|
1,158,827
|
|
9,213,512
|
|
37,718,016
|
|
46,931,528
|
|
(14,010,670
|
)
|
32,920,858
|
|
—
|
|
|||||||||||||||||||||
|
1401 E. Madison
|
Seattle, WA
|
—
|
(F)
|
—
|
|
10,394,673
|
|
2,735,646
|
|
—
|
|
10,394,673
|
|
2,735,646
|
|
13,130,319
|
|
—
|
|
13,130,319
|
|
—
|
|
|||||||||||||||||||||
|
1500 Mass Ave
|
Washington, D.C.
|
G
|
1951
|
556
|
|
54,638,298
|
|
40,361,702
|
|
13,920,874
|
|
54,638,298
|
|
54,282,576
|
|
108,920,874
|
|
(18,412,591
|
)
|
90,508,283
|
|
—
|
|
|||||||||||||||||||||
|
1800 Oak (fka Rosslyn)
|
Arlington, VA
|
G
|
2003
|
314
|
|
31,400,000
|
|
109,005,734
|
|
2,461,258
|
|
31,400,000
|
|
111,466,992
|
|
142,866,992
|
|
(15,629,471
|
)
|
127,237,521
|
|
—
|
|
|||||||||||||||||||||
|
200 N Lemon Street
|
Anaheim, CA
|
—
|
(F)
|
—
|
|
5,865,235
|
|
3,722,655
|
|
—
|
|
5,865,235
|
|
3,722,655
|
|
9,587,890
|
|
—
|
|
9,587,890
|
|
—
|
|
|||||||||||||||||||||
|
2nd & Pine (fka 204-206 Pine Street/1610 2nd Avenue)
|
Seattle, WA
|
G
|
(F)
|
—
|
|
22,323,720
|
|
73,357,643
|
|
—
|
|
22,323,720
|
|
73,357,643
|
|
95,681,363
|
|
—
|
|
95,681,363
|
|
—
|
|
|||||||||||||||||||||
|
2201 Pershing Drive
|
Arlington, VA
|
G
|
2012
|
188
|
|
11,321,198
|
|
49,674,175
|
|
2,036,904
|
|
11,321,198
|
|
51,711,079
|
|
63,032,277
|
|
(7,033,954
|
)
|
55,998,323
|
|
—
|
|
|||||||||||||||||||||
|
2201 Wilson
|
Arlington, VA
|
G
|
2000
|
219
|
|
21,900,000
|
|
78,724,663
|
|
1,495,753
|
|
21,900,000
|
|
80,220,416
|
|
102,120,416
|
|
(11,064,780
|
)
|
91,055,636
|
|
—
|
|
|||||||||||||||||||||
|
2400 M St
|
Washington, D.C.
|
G
|
2006
|
359
|
|
30,006,593
|
|
114,013,785
|
|
3,650,345
|
|
30,006,593
|
|
117,664,130
|
|
147,670,723
|
|
(41,374,875
|
)
|
106,295,848
|
|
—
|
|
|||||||||||||||||||||
|
315 on A
|
Boston, MA
|
G
|
2013
|
202
|
|
14,450,070
|
|
115,824,930
|
|
169,215
|
|
14,450,070
|
|
115,994,145
|
|
130,444,215
|
|
(6,171,735
|
)
|
124,272,480
|
|
—
|
|
|||||||||||||||||||||
|
340 Fremont (fka Rincon Hill)
|
San Francisco, CA
|
—
|
(F)
|
—
|
|
42,000,000
|
|
176,850,680
|
|
—
|
|
42,000,000
|
|
176,850,680
|
|
218,850,680
|
|
—
|
|
218,850,680
|
|
—
|
|
|||||||||||||||||||||
|
45 Worthington
|
Boston, MA
|
—
|
(F)
|
—
|
|
—
|
|
1,648,869
|
|
—
|
|
—
|
|
1,648,869
|
|
1,648,869
|
|
—
|
|
1,648,869
|
|
—
|
|
|||||||||||||||||||||
|
420 East 80th Street
|
New York, NY
|
—
|
1961
|
155
|
|
39,277,000
|
|
23,026,984
|
|
4,002,776
|
|
39,277,000
|
|
27,029,760
|
|
66,306,760
|
|
(11,554,868
|
)
|
54,751,892
|
|
—
|
|
|||||||||||||||||||||
|
425 Mass
|
Washington, D.C.
|
G
|
2009
|
559
|
|
28,150,000
|
|
138,600,000
|
|
3,574,977
|
|
28,150,000
|
|
142,174,977
|
|
170,324,977
|
|
(34,957,838
|
)
|
135,367,139
|
|
—
|
|
|||||||||||||||||||||
|
455 I Street (fka 443-459 Eye Street)
|
Washington, D.C.
|
G
|
(F)
|
—
|
|
12,762,857
|
|
16,214,611
|
|
—
|
|
12,762,857
|
|
16,214,611
|
|
28,977,468
|
|
—
|
|
28,977,468
|
|
—
|
|
|||||||||||||||||||||
|
4885 Edgemoor Lane
|
Bethesda, MD
|
—
|
(F)
|
—
|
|
—
|
|
875,185
|
|
—
|
|
—
|
|
875,185
|
|
875,185
|
|
—
|
|
875,185
|
|
—
|
|
|||||||||||||||||||||
|
4th and Hill
|
Los Angeles, CA
|
—
|
(F)
|
—
|
|
13,131,456
|
|
5,642,930
|
|
—
|
|
13,131,456
|
|
5,642,930
|
|
18,774,386
|
|
—
|
|
18,774,386
|
|
—
|
|
|||||||||||||||||||||
|
600 Washington
|
New York, NY
|
G
|
2004
|
135
|
|
32,852,000
|
|
43,140,551
|
|
580,906
|
|
32,852,000
|
|
43,721,457
|
|
76,573,457
|
|
(16,469,799
|
)
|
60,103,658
|
|
—
|
|
|||||||||||||||||||||
|
660 Washington (fka Boston Common)
|
Boston, MA
|
G
|
2006
|
420
|
|
106,100,000
|
|
166,311,679
|
|
1,378,724
|
|
106,100,000
|
|
167,690,403
|
|
273,790,403
|
|
(23,978,444
|
)
|
249,811,959
|
|
—
|
|
|||||||||||||||||||||
|
70 Greene
|
Jersey City, NJ
|
G
|
2010
|
480
|
|
28,108,899
|
|
236,763,553
|
|
838,875
|
|
28,108,899
|
|
237,602,428
|
|
265,711,327
|
|
(50,058,634
|
)
|
215,652,693
|
|
—
|
|
|||||||||||||||||||||
|
71 Broadway
|
New York, NY
|
G
|
1997
|
238
|
|
22,611,600
|
|
77,492,171
|
|
12,183,139
|
|
22,611,600
|
|
89,675,310
|
|
112,286,910
|
|
(35,917,280
|
)
|
76,369,630
|
|
—
|
|
|||||||||||||||||||||
|
77 Bluxome
|
San Francisco, CA
|
—
|
2007
|
102
|
|
5,249,124
|
|
18,609,876
|
|
175,686
|
|
5,249,124
|
|
18,785,562
|
|
24,034,686
|
|
(3,551,433
|
)
|
20,483,253
|
|
—
|
|
|||||||||||||||||||||
|
777 Sixth
|
New York, NY
|
G
|
2002
|
294
|
|
65,352,706
|
|
65,747,294
|
|
1,708,867
|
|
65,352,706
|
|
67,456,161
|
|
132,808,867
|
|
(22,000,130
|
)
|
110,808,737
|
|
—
|
|
|||||||||||||||||||||
|
88 Hillside
|
Daly City, CA
|
G
|
2011
|
95
|
|
7,786,800
|
|
31,587,325
|
|
1,740,889
|
|
7,786,800
|
|
33,328,214
|
|
41,115,014
|
|
(5,965,778
|
)
|
35,149,236
|
|
—
|
|
|||||||||||||||||||||
|
855 Brannan (fka 801 Brannan)
|
San Francisco, CA
|
G
|
(F)
|
—
|
|
41,363,921
|
|
59,118,300
|
|
—
|
|
41,363,921
|
|
59,118,300
|
|
100,482,221
|
|
—
|
|
100,482,221
|
|
—
|
|
|||||||||||||||||||||
|
Abington Glen
|
Abington, MA
|
—
|
1968
|
90
|
|
553,105
|
|
3,697,396
|
|
2,707,619
|
|
553,105
|
|
6,405,015
|
|
6,958,120
|
|
(4,378,376
|
)
|
2,579,744
|
|
—
|
|
|||||||||||||||||||||
|
Alban Towers
|
Washington, D.C.
|
—
|
1934
|
229
|
|
18,900,000
|
|
89,794,201
|
|
646,083
|
|
18,900,000
|
|
90,440,284
|
|
109,340,284
|
|
(12,554,736
|
)
|
96,785,548
|
|
—
|
|
|||||||||||||||||||||
|
Altitude (fka Village at Howard Hughes, The (Lots 1 & 2))
|
Los Angeles, CA
|
—
|
(F)
|
—
|
|
43,783,485
|
|
110,209,151
|
|
—
|
|
43,783,485
|
|
110,209,151
|
|
153,992,636
|
|
—
|
|
153,992,636
|
|
—
|
|
|||||||||||||||||||||
|
Alton, The (fka Millikan)
|
Irvine, CA
|
—
|
(F)
|
—
|
|
11,049,027
|
|
64,366,946
|
|
—
|
|
11,049,027
|
|
64,366,946
|
|
75,415,973
|
|
—
|
|
75,415,973
|
|
—
|
|
|||||||||||||||||||||
|
Arbor Terrace
|
Sunnyvale, CA
|
—
|
1979
|
175
|
|
9,057,300
|
|
18,483,642
|
|
2,639,125
|
|
9,057,300
|
|
21,122,767
|
|
30,180,067
|
|
(13,158,508
|
)
|
17,021,559
|
|
—
|
|
|||||||||||||||||||||
|
Arboretum (MA)
|
Canton, MA
|
—
|
1989
|
156
|
|
4,685,900
|
|
10,992,751
|
|
4,207,099
|
|
4,685,900
|
|
15,199,850
|
|
19,885,750
|
|
(8,869,308
|
)
|
11,016,442
|
|
—
|
|
|||||||||||||||||||||
|
Artisan on Second
|
Los Angeles, CA
|
—
|
2008
|
118
|
|
8,000,400
|
|
36,074,600
|
|
469,032
|
|
8,000,400
|
|
36,543,632
|
|
44,544,032
|
|
(7,896,054
|
)
|
36,647,978
|
|
—
|
|
|||||||||||||||||||||
|
Artistry Emeryville (fka Emeryville)
|
Emeryville, CA
|
—
|
1994
|
261
|
|
12,300,000
|
|
61,466,267
|
|
1,771,039
|
|
12,300,000
|
|
63,237,306
|
|
75,537,306
|
|
(9,620,717
|
)
|
65,916,589
|
|
—
|
|
|||||||||||||||||||||
|
Avenue Two
|
Redwood City, CA
|
—
|
1972
|
123
|
|
7,995,000
|
|
18,005,000
|
|
1,647,581
|
|
7,995,000
|
|
19,652,581
|
|
27,647,581
|
|
(4,179,196
|
)
|
23,468,385
|
|
—
|
|
|||||||||||||||||||||
|
Azure (at Mission Bay)
|
San Francisco, CA
|
—
|
2015
|
273
|
|
32,855,115
|
|
150,600,329
|
|
629
|
|
32,855,115
|
|
150,600,958
|
|
183,456,073
|
|
(2,077,524
|
)
|
181,378,549
|
|
—
|
|
|||||||||||||||||||||
|
Bay Hill
|
Long Beach, CA
|
—
|
2002
|
160
|
|
7,600,000
|
|
27,437,239
|
|
1,934,347
|
|
7,600,000
|
|
29,371,586
|
|
36,971,586
|
|
(11,990,933
|
)
|
24,980,653
|
|
—
|
|
|||||||||||||||||||||
|
Beatrice, The
|
New York, NY
|
G
|
2010
|
302
|
|
114,351,405
|
|
165,648,595
|
|
676,595
|
|
114,351,405
|
|
166,325,190
|
|
280,676,595
|
|
(29,116,223
|
)
|
251,560,372
|
|
—
|
|
|||||||||||||||||||||
|
Belle Arts Condominium Homes, LLC
|
Bellevue, WA
|
—
|
2000
|
1
|
|
63,158
|
|
248,929
|
|
(5,320
|
)
|
63,158
|
|
243,609
|
|
306,767
|
|
—
|
|
306,767
|
|
—
|
|
|||||||||||||||||||||
|
Belle Fontaine
|
Marina Del Rey, CA
|
—
|
2003
|
102
|
|
9,098,808
|
|
28,701,192
|
|
473,126
|
|
9,098,808
|
|
29,174,318
|
|
38,273,126
|
|
(5,588,486
|
)
|
32,684,640
|
|
—
|
|
|||||||||||||||||||||
|
Berkeley Land
|
Berkeley, CA
|
—
|
(F)
|
—
|
|
14,108,910
|
|
11,357,375
|
|
—
|
|
14,108,910
|
|
11,357,375
|
|
25,466,285
|
|
—
|
|
25,466,285
|
|
—
|
|
|||||||||||||||||||||
|
Bradford Apartments
|
Newington, CT
|
—
|
1964
|
64
|
|
401,091
|
|
2,681,210
|
|
961,845
|
|
401,091
|
|
3,643,055
|
|
4,044,146
|
|
(2,066,615
|
)
|
1,977,531
|
|
—
|
|
|||||||||||||||||||||
|
Breakwater at Marina Del Rey
|
Marina Del Rey, CA
|
—
|
1964-1969
|
224
|
|
—
|
|
73,189,262
|
|
649,866
|
|
—
|
|
73,839,128
|
|
73,839,128
|
|
(11,205,489
|
)
|
62,633,639
|
|
—
|
|
|||||||||||||||||||||
S-4
EQUITY RESIDENTIAL
ERP OPERATING LIMITED PARTNERSHIP
Schedule III - Real Estate and Accumulated Depreciation
December 31, 2015
|
Description
|
|
Initial Cost to Company
|
Cost Capitalized Subsequent to Acquisition(Improvements, net) (E)
|
Gross Amount Carried at Close of Period 12/31/15
|
|
|
|
|
|||||||||||||||||||||||||||
|
Apartment Name
|
Location
|
Retail/Commercial Space
|
Date of Construction
|
Apartment Units (H)
|
Land
|
Building & Fixtures
|
Building & Fixtures
|
Land
|
Building & Fixtures (A)
|
Total (B)
|
Accumulated Depreciation (C)
|
Investment in Real Estate, Net at 12/31/15 (B)
|
Encumbrances
|
||||||||||||||||||||||
|
Briar Knoll Apts
|
Vernon, CT
|
—
|
1986
|
150
|
|
928,972
|
|
6,209,988
|
|
2,633,266
|
|
928,972
|
|
8,843,254
|
|
9,772,226
|
|
(4,794,357
|
)
|
4,977,869
|
|
—
|
|
||||||||||||
|
Briarwood (CA)
|
Sunnyvale, CA
|
—
|
1985
|
192
|
|
9,991,500
|
|
22,247,278
|
|
3,514,394
|
|
9,991,500
|
|
25,761,672
|
|
35,753,172
|
|
(14,944,409
|
)
|
20,808,763
|
|
—
|
|
||||||||||||
|
Bridford Lakes II
|
Greensboro, NC
|
—
|
(F)
|
—
|
|
1,100,564
|
|
792,508
|
|
—
|
|
1,100,564
|
|
792,508
|
|
1,893,072
|
|
—
|
|
1,893,072
|
|
—
|
|
||||||||||||
|
Brooklyner, The (fka 111 Lawrence)
|
Brooklyn, NY
|
G
|
2010
|
490
|
|
40,099,922
|
|
221,438,631
|
|
1,387,079
|
|
40,099,922
|
|
222,825,710
|
|
262,925,632
|
|
(38,804,697
|
)
|
224,120,935
|
|
—
|
|
||||||||||||
|
Cambridge Park
|
Cambridge, MA
|
G
|
2002
|
312
|
|
31,200,000
|
|
106,048,587
|
|
2,123,216
|
|
31,200,000
|
|
108,171,803
|
|
139,371,803
|
|
(15,523,923
|
)
|
123,847,880
|
|
—
|
|
||||||||||||
|
Carlyle Mill
|
Alexandria, VA
|
—
|
2002
|
317
|
|
10,000,000
|
|
51,367,913
|
|
7,134,848
|
|
10,000,000
|
|
58,502,761
|
|
68,502,761
|
|
(26,086,693
|
)
|
42,416,068
|
|
—
|
|
||||||||||||
|
Cascade
|
Seattle, WA
|
G
|
(F)
|
—
|
|
23,751,564
|
|
43,951,916
|
|
—
|
|
23,751,564
|
|
43,951,916
|
|
67,703,480
|
|
—
|
|
67,703,480
|
|
—
|
|
||||||||||||
|
Centennial (fka Centennial Court & Centennial Tower)
|
Seattle, WA
|
G
|
1991/2001
|
408
|
|
9,700,000
|
|
70,080,378
|
|
8,150,667
|
|
9,700,000
|
|
78,231,045
|
|
87,931,045
|
|
(30,555,738
|
)
|
57,375,307
|
|
—
|
|
||||||||||||
|
Centre Club Combined
|
Ontario, CA
|
—
|
1994 & 2002
|
412
|
|
7,436,000
|
|
33,014,789
|
|
6,071,471
|
|
7,436,000
|
|
39,086,260
|
|
46,522,260
|
|
(20,011,745
|
)
|
26,510,515
|
|
—
|
|
||||||||||||
|
Church Corner
|
Cambridge, MA
|
G
|
1987
|
85
|
|
5,220,000
|
|
16,744,643
|
|
2,021,207
|
|
5,220,000
|
|
18,765,850
|
|
23,985,850
|
|
(7,784,093
|
)
|
16,201,757
|
|
—
|
|
||||||||||||
|
City Gate at Cupertino (fka Cupertino)
|
Cupertino, CA
|
—
|
1998
|
311
|
|
40,400,000
|
|
95,937,046
|
|
3,164,548
|
|
40,400,000
|
|
99,101,594
|
|
139,501,594
|
|
(13,831,042
|
)
|
125,670,552
|
|
—
|
|
||||||||||||
|
City Pointe
|
Fullerton, CA
|
G
|
2004
|
183
|
|
6,863,792
|
|
36,476,208
|
|
799,333
|
|
6,863,792
|
|
37,275,541
|
|
44,139,333
|
|
(10,525,198
|
)
|
33,614,135
|
|
—
|
|
||||||||||||
|
City Square Bellevue (fka Bellevue)
|
Bellevue, WA
|
G
|
1998
|
191
|
|
15,100,000
|
|
41,876,257
|
|
2,633,430
|
|
15,100,000
|
|
44,509,687
|
|
59,609,687
|
|
(6,132,286
|
)
|
53,477,401
|
|
—
|
|
||||||||||||
|
Clarendon, The
|
Arlington, VA
|
G
|
2005
|
292
|
|
30,400,340
|
|
103,824,660
|
|
2,066,458
|
|
30,400,340
|
|
105,891,118
|
|
136,291,458
|
|
(22,819,650
|
)
|
113,471,808
|
|
—
|
|
||||||||||||
|
Cleo, The
|
Los Angeles, CA
|
—
|
1989
|
92
|
|
6,615,467
|
|
14,829,335
|
|
3,799,207
|
|
6,615,467
|
|
18,628,542
|
|
25,244,009
|
|
(7,638,498
|
)
|
17,605,511
|
|
—
|
|
||||||||||||
|
Corcoran House at DuPont Circle (fka DuPont Circle)
|
Washington, D.C.
|
G
|
1961
|
137
|
|
13,500,000
|
|
26,913,113
|
|
1,352,210
|
|
13,500,000
|
|
28,265,323
|
|
41,765,323
|
|
(4,701,324
|
)
|
37,063,999
|
|
—
|
|
||||||||||||
|
Courthouse Plaza
|
Arlington, VA
|
G
|
1990
|
396
|
|
—
|
|
87,386,024
|
|
3,941,196
|
|
—
|
|
91,327,220
|
|
91,327,220
|
|
(14,489,207
|
)
|
76,838,013
|
|
—
|
|
||||||||||||
|
Creekside (San Mateo)
|
San Mateo, CA
|
—
|
1985
|
192
|
|
9,606,600
|
|
21,193,232
|
|
3,681,274
|
|
9,606,600
|
|
24,874,506
|
|
34,481,106
|
|
(14,783,421
|
)
|
19,697,685
|
|
—
|
|
||||||||||||
|
Cronins Landing
|
Waltham, MA
|
G
|
1998
|
281
|
|
32,300,000
|
|
85,119,324
|
|
3,008,274
|
|
32,300,000
|
|
88,127,598
|
|
120,427,598
|
|
(12,711,972
|
)
|
107,715,626
|
|
—
|
|
||||||||||||
|
Crystal Place
|
Arlington, VA
|
—
|
1986
|
181
|
|
17,200,000
|
|
47,918,975
|
|
2,609,270
|
|
17,200,000
|
|
50,528,245
|
|
67,728,245
|
|
(7,196,001
|
)
|
60,532,244
|
|
—
|
|
||||||||||||
|
Dean Estates
|
Taunton, MA
|
—
|
1984
|
58
|
|
498,080
|
|
3,329,560
|
|
840,538
|
|
498,080
|
|
4,170,098
|
|
4,668,178
|
|
(2,431,087
|
)
|
2,237,091
|
|
—
|
|
||||||||||||
|
Eagle Canyon
|
Chino Hills, CA
|
—
|
1985
|
252
|
|
1,808,900
|
|
16,274,361
|
|
8,358,167
|
|
1,808,900
|
|
24,632,528
|
|
26,441,428
|
|
(16,229,794
|
)
|
10,211,634
|
|
—
|
|
||||||||||||
|
Edgemont at Bethesda Metro
|
Bethesda, MD
|
—
|
1989
|
122
|
|
13,092,552
|
|
43,907,448
|
|
947,391
|
|
13,092,552
|
|
44,854,839
|
|
57,947,391
|
|
(8,612,518
|
)
|
49,334,873
|
|
—
|
|
||||||||||||
|
Elevé
|
Glendale, CA
|
G
|
2013
|
208
|
|
14,080,560
|
|
56,419,440
|
|
186,855
|
|
14,080,560
|
|
56,606,295
|
|
70,686,855
|
|
(5,258,108
|
)
|
65,428,747
|
|
—
|
|
||||||||||||
|
Emerson Place
|
Boston, MA
|
G
|
1962
|
444
|
|
14,855,000
|
|
57,566,636
|
|
18,997,536
|
|
14,855,000
|
|
76,564,172
|
|
91,419,172
|
|
(49,539,039
|
)
|
41,880,133
|
|
—
|
|
||||||||||||
|
Encinitas Heights (fka Encinitas)
|
Encinitas, CA
|
G
|
2002
|
120
|
|
12,000,000
|
|
29,207,497
|
|
294,376
|
|
12,000,000
|
|
29,501,873
|
|
41,501,873
|
|
(4,700,031
|
)
|
36,801,842
|
|
—
|
|
||||||||||||
|
Encore at Sherman Oaks, The
|
Sherman Oaks, CA
|
—
|
1988
|
174
|
|
8,700,000
|
|
25,446,003
|
|
1,110,902
|
|
8,700,000
|
|
26,556,905
|
|
35,256,905
|
|
(6,547,074
|
)
|
28,709,831
|
|
—
|
|
||||||||||||
|
Fountains at Emerald Park (fka Emerald Park)
|
Dublin, CA
|
—
|
2000
|
324
|
|
25,900,000
|
|
83,986,217
|
|
742,760
|
|
25,900,000
|
|
84,728,977
|
|
110,628,977
|
|
(12,566,319
|
)
|
98,062,658
|
|
—
|
|
||||||||||||
|
Fox Hill Apartments
|
Enfield, CT
|
—
|
1974
|
168
|
|
1,129,018
|
|
7,547,256
|
|
2,297,171
|
|
1,129,018
|
|
9,844,427
|
|
10,973,445
|
|
(5,478,777
|
)
|
5,494,668
|
|
—
|
|
||||||||||||
|
Fremont Center
|
Fremont, CA
|
G
|
2002
|
322
|
|
25,800,000
|
|
78,753,114
|
|
1,392,624
|
|
25,800,000
|
|
80,145,738
|
|
105,945,738
|
|
(11,547,488
|
)
|
94,398,250
|
|
—
|
|
||||||||||||
|
Gallery, The
|
Hermosa Beach, CA
|
—
|
1971
|
169
|
|
18,144,000
|
|
46,567,941
|
|
2,495,809
|
|
18,144,000
|
|
49,063,750
|
|
67,207,750
|
|
(18,185,915
|
)
|
49,021,835
|
|
—
|
|
||||||||||||
|
Gateway at Malden Center
|
Malden, MA
|
G
|
1988
|
203
|
|
9,209,780
|
|
25,722,666
|
|
13,139,391
|
|
9,209,780
|
|
38,862,057
|
|
48,071,837
|
|
(19,457,428
|
)
|
28,614,409
|
|
—
|
|
||||||||||||
|
Geary Court Yard
|
San Francisco, CA
|
—
|
1990
|
164
|
|
1,722,400
|
|
15,471,429
|
|
4,137,461
|
|
1,722,400
|
|
19,608,890
|
|
21,331,290
|
|
(11,745,089
|
)
|
9,586,201
|
|
—
|
|
||||||||||||
|
Glen Meadow
|
Franklin, MA
|
—
|
1971
|
288
|
|
2,339,330
|
|
16,133,588
|
|
4,187,941
|
|
2,339,330
|
|
20,321,529
|
|
22,660,859
|
|
(12,098,366
|
)
|
10,562,493
|
|
—
|
|
||||||||||||
|
Greenfield Village
|
Rocky Hill , CT
|
—
|
1965
|
151
|
|
911,534
|
|
6,093,418
|
|
827,545
|
|
911,534
|
|
6,920,963
|
|
7,832,497
|
|
(3,865,157
|
)
|
3,967,340
|
|
—
|
|
||||||||||||
|
Hampshire Place
|
Los Angeles, CA
|
—
|
1989
|
259
|
|
10,806,000
|
|
30,335,330
|
|
3,646,785
|
|
10,806,000
|
|
33,982,115
|
|
44,788,115
|
|
(14,251,207
|
)
|
30,536,908
|
|
—
|
|
||||||||||||
|
Harbor Steps
|
Seattle, WA
|
G
|
2000
|
758
|
|
59,387,158
|
|
158,829,432
|
|
15,887,513
|
|
59,387,158
|
|
174,716,945
|
|
234,104,103
|
|
(66,524,689
|
)
|
167,579,414
|
|
—
|
|
||||||||||||
|
Heritage at Stone Ridge
|
Burlington, MA
|
—
|
2005
|
180
|
|
10,800,000
|
|
31,808,335
|
|
1,471,640
|
|
10,800,000
|
|
33,279,975
|
|
44,079,975
|
|
(12,980,415
|
)
|
31,099,560
|
|
—
|
|
||||||||||||
|
Heritage Ridge
|
Lynwood, WA
|
—
|
1999
|
197
|
|
6,895,000
|
|
18,983,597
|
|
1,006,685
|
|
6,895,000
|
|
19,990,282
|
|
26,885,282
|
|
(8,656,120
|
)
|
18,229,162
|
|
—
|
|
||||||||||||
|
Heron Pointe
|
Boynton Beach, FL
|
—
|
1989
|
192
|
|
1,546,700
|
|
7,774,676
|
|
2,626,877
|
|
1,546,700
|
|
10,401,553
|
|
11,948,253
|
|
(7,058,305
|
)
|
4,889,948
|
|
—
|
|
||||||||||||
|
Hesby
|
North Hollywood, CA
|
—
|
2013
|
308
|
|
23,299,892
|
|
102,700,108
|
|
203,388
|
|
23,299,892
|
|
102,903,496
|
|
126,203,388
|
|
(9,214,042
|
)
|
116,989,346
|
|
—
|
|
||||||||||||
|
High Meadow
|
Ellington, CT
|
—
|
1975
|
100
|
|
583,679
|
|
3,901,774
|
|
1,342,073
|
|
583,679
|
|
5,243,847
|
|
5,827,526
|
|
(2,886,630
|
)
|
2,940,896
|
|
—
|
|
||||||||||||
|
Highland Glen
|
Westwood, MA
|
—
|
1979
|
180
|
|
2,229,095
|
|
16,828,153
|
|
2,895,346
|
|
2,229,095
|
|
19,723,499
|
|
21,952,594
|
|
(10,982,160
|
)
|
10,970,434
|
|
—
|
|
||||||||||||
|
Highland Glen II
|
Westwood, MA
|
—
|
2007
|
102
|
|
—
|
|
19,875,857
|
|
203,172
|
|
—
|
|
20,079,029
|
|
20,079,029
|
|
(6,387,155
|
)
|
13,691,874
|
|
—
|
|
||||||||||||
|
Highlands at Cherry Hill
|
Cherry Hills, NJ
|
—
|
2002
|
170
|
|
6,800,000
|
|
21,459,108
|
|
1,058,592
|
|
6,800,000
|
|
22,517,700
|
|
29,317,700
|
|
(8,801,180
|
)
|
20,516,520
|
|
—
|
|
||||||||||||
|
Highlands at South Plainfield
|
South Plainfield, NJ
|
—
|
2000
|
252
|
|
10,080,000
|
|
37,526,912
|
|
1,313,527
|
|
10,080,000
|
|
38,840,439
|
|
48,920,439
|
|
(14,496,059
|
)
|
34,424,380
|
|
—
|
|
||||||||||||
|
Hikari
|
Los Angeles, CA
|
G
|
2007
|
128
|
|
9,435,760
|
|
32,564,240
|
|
494,697
|
|
9,435,760
|
|
33,058,937
|
|
42,494,697
|
|
(6,882,542
|
)
|
35,612,155
|
|
—
|
|
||||||||||||
S-5
EQUITY RESIDENTIAL
ERP OPERATING LIMITED PARTNERSHIP
Schedule III - Real Estate and Accumulated Depreciation
December 31, 2015
|
Description
|
|
Initial Cost to Company
|
Cost Capitalized Subsequent to Acquisition(Improvements, net) (E)
|
Gross Amount Carried at Close of Period 12/31/15
|
|
|
|
|
|||||||||||||||||||||||||||
|
Apartment Name
|
Location
|
Retail/Commercial Space
|
Date of Construction
|
Apartment Units (H)
|
Land
|
Building & Fixtures
|
Building & Fixtures
|
Land
|
Building & Fixtures (A)
|
Total (B)
|
Accumulated Depreciation (C)
|
Investment in Real Estate, Net at 12/31/15 (B)
|
Encumbrances
|
||||||||||||||||||||||
|
Hudson Crossing
|
New York, NY
|
G
|
2003
|
259
|
|
23,420,000
|
|
69,977,699
|
|
2,026,803
|
|
23,420,000
|
|
72,004,502
|
|
95,424,502
|
|
(28,426,002
|
)
|
66,998,500
|
|
—
|
|
||||||||||||
|
Hudson Crossing II
|
New York, NY
|
—
|
(F)
|
—
|
|
10,599,286
|
|
2,025,249
|
|
—
|
|
10,599,286
|
|
2,025,249
|
|
12,624,535
|
|
—
|
|
12,624,535
|
|
—
|
|
||||||||||||
|
Hudson Pointe
|
Jersey City, NJ
|
—
|
2003
|
182
|
|
5,350,000
|
|
41,114,074
|
|
3,378,496
|
|
5,350,000
|
|
44,492,570
|
|
49,842,570
|
|
(18,501,842
|
)
|
31,340,728
|
|
—
|
|
||||||||||||
|
Hunt Club II
|
Charlotte, NC
|
—
|
(F)
|
—
|
|
100,000
|
|
—
|
|
—
|
|
100,000
|
|
—
|
|
100,000
|
|
—
|
|
100,000
|
|
—
|
|
||||||||||||
|
Ivory Wood
|
Bothell, WA
|
—
|
2000
|
144
|
|
2,732,800
|
|
13,888,282
|
|
874,464
|
|
2,732,800
|
|
14,762,746
|
|
17,495,546
|
|
(6,352,195
|
)
|
11,143,351
|
|
—
|
|
||||||||||||
|
Jia (fka Chinatown Gateway)
|
Los Angeles, CA
|
G
|
2014
|
280
|
|
14,791,831
|
|
76,010,218
|
|
115,966
|
|
14,791,831
|
|
76,126,184
|
|
90,918,015
|
|
(7,438,023
|
)
|
83,479,992
|
|
—
|
|
||||||||||||
|
Junction 47 (fka West Seattle)
|
Seattle, WA
|
G
|
2015
|
206
|
|
11,726,305
|
|
54,388,245
|
|
45
|
|
11,726,305
|
|
54,388,290
|
|
66,114,595
|
|
(684,861
|
)
|
65,429,734
|
|
—
|
|
||||||||||||
|
Kelvin, The
|
Irvine, CA
|
—
|
2015
|
194
|
|
15,521,552
|
|
64,853,448
|
|
10,657
|
|
15,521,552
|
|
64,864,105
|
|
80,385,657
|
|
(1,340,371
|
)
|
79,045,286
|
|
—
|
|
||||||||||||
|
Kendall Square II
|
Cambridge, MA
|
—
|
(F)
|
—
|
|
—
|
|
1,105,465
|
|
—
|
|
—
|
|
1,105,465
|
|
1,105,465
|
|
—
|
|
1,105,465
|
|
—
|
|
||||||||||||
|
Landings at Port Imperial
|
W. New York, NJ
|
—
|
1999
|
276
|
|
27,246,045
|
|
37,741,050
|
|
7,917,500
|
|
27,246,045
|
|
45,658,550
|
|
72,904,595
|
|
(25,157,567
|
)
|
47,747,028
|
|
—
|
|
||||||||||||
|
Lincoln Heights
|
Quincy, MA
|
—
|
1991
|
336
|
|
5,928,400
|
|
33,595,262
|
|
12,316,194
|
|
5,928,400
|
|
45,911,456
|
|
51,839,856
|
|
(29,948,038
|
)
|
21,891,818
|
|
—
|
|
||||||||||||
|
Lindley Apartments
|
Encino, CA
|
—
|
2004
|
129
|
|
5,805,000
|
|
25,705,000
|
|
797,056
|
|
5,805,000
|
|
26,502,056
|
|
32,307,056
|
|
(6,457,391
|
)
|
25,849,665
|
|
—
|
|
||||||||||||
|
Lofts 590
|
Arlington, VA
|
—
|
2005
|
212
|
|
20,100,000
|
|
67,909,023
|
|
291,850
|
|
20,100,000
|
|
68,200,873
|
|
88,300,873
|
|
(9,179,835
|
)
|
79,121,038
|
|
—
|
|
||||||||||||
|
Lofts at Kendall Square (fka Kendall Square)
|
Cambridge, MA
|
—
|
1998
|
186
|
|
23,300,000
|
|
78,445,657
|
|
4,174,184
|
|
23,300,000
|
|
82,619,841
|
|
105,919,841
|
|
(11,149,971
|
)
|
94,769,870
|
|
—
|
|
||||||||||||
|
Longacre House
|
New York, NY
|
G
|
2000
|
293
|
|
73,170,045
|
|
53,962,510
|
|
1,449,025
|
|
73,170,045
|
|
55,411,535
|
|
128,581,580
|
|
(19,189,340
|
)
|
109,392,240
|
|
—
|
|
||||||||||||
|
Longfellow Place
|
Boston, MA
|
G
|
1975
|
710
|
|
47,096,917
|
|
153,899,994
|
|
73,147,489
|
|
47,096,917
|
|
227,047,483
|
|
274,144,400
|
|
(129,782,488
|
)
|
144,361,912
|
|
—
|
|
||||||||||||
|
Mantena
|
New York, NY
|
G
|
2012
|
98
|
|
22,346,513
|
|
61,501,158
|
|
492,732
|
|
22,346,513
|
|
61,993,890
|
|
84,340,403
|
|
(9,234,987
|
)
|
75,105,416
|
|
—
|
|
||||||||||||
|
Marina 41 (fka Marina Del Rey)
|
Marina Del Rey, CA
|
—
|
1973
|
623
|
|
—
|
|
168,842,442
|
|
4,909,098
|
|
—
|
|
173,751,540
|
|
173,751,540
|
|
(27,415,993
|
)
|
146,335,547
|
|
—
|
|
||||||||||||
|
Mariposa at Playa Del Rey (fka Playa Del Rey)
|
Playa Del Rey, CA
|
—
|
2004
|
354
|
|
60,900,000
|
|
89,311,482
|
|
4,016,502
|
|
60,900,000
|
|
93,327,984
|
|
154,227,984
|
|
(13,774,366
|
)
|
140,453,618
|
|
—
|
|
||||||||||||
|
Milano Lofts
|
Los Angeles, CA
|
G
|
1925/2006
|
99
|
|
8,125,216
|
|
27,378,784
|
|
381,581
|
|
8,125,216
|
|
27,760,365
|
|
35,885,581
|
|
(4,712,661
|
)
|
31,172,920
|
|
—
|
|
||||||||||||
|
Monte Viejo
|
Phoenix, AZ
|
—
|
2004
|
480
|
|
12,700,000
|
|
45,926,784
|
|
1,757,827
|
|
12,700,000
|
|
47,684,611
|
|
60,384,611
|
|
(19,906,193
|
)
|
40,478,418
|
|
—
|
|
||||||||||||
|
Mountain View Redevelopment
|
Mountain View, CA
|
—
|
(F)
|
—
|
|
—
|
|
6,539
|
|
—
|
|
—
|
|
6,539
|
|
6,539
|
|
—
|
|
6,539
|
|
—
|
|
||||||||||||
|
Mozaic at Union Station
|
Los Angeles, CA
|
—
|
2007
|
272
|
|
8,500,000
|
|
52,529,446
|
|
1,554,378
|
|
8,500,000
|
|
54,083,824
|
|
62,583,824
|
|
(18,494,933
|
)
|
44,088,891
|
|
—
|
|
||||||||||||
|
Murray Hill Tower (fka Murray Hill)
|
New York, NY
|
G
|
1974
|
270
|
|
75,800,000
|
|
102,705,401
|
|
3,764,623
|
|
75,800,000
|
|
106,470,024
|
|
182,270,024
|
|
(17,676,937
|
)
|
164,593,087
|
|
—
|
|
||||||||||||
|
Northglen
|
Valencia, CA
|
—
|
1988
|
234
|
|
9,360,000
|
|
20,778,553
|
|
2,259,421
|
|
9,360,000
|
|
23,037,974
|
|
32,397,974
|
|
(12,381,522
|
)
|
20,016,452
|
|
—
|
|
||||||||||||
|
Northpark
|
Burlingame, CA
|
—
|
1972
|
510
|
|
38,607,000
|
|
77,472,217
|
|
11,916,802
|
|
38,607,000
|
|
89,389,019
|
|
127,996,019
|
|
(25,399,200
|
)
|
102,596,819
|
|
—
|
|
||||||||||||
|
Northridge
|
Pleasant Hill, CA
|
—
|
1974
|
221
|
|
5,527,800
|
|
14,691,705
|
|
10,416,100
|
|
5,527,800
|
|
25,107,805
|
|
30,635,605
|
|
(16,166,627
|
)
|
14,468,978
|
|
—
|
|
||||||||||||
|
Oak Park Combined
|
Agoura Hills, CA
|
—
|
1989 & 1990
|
444
|
|
3,390,700
|
|
30,517,274
|
|
9,019,341
|
|
3,390,700
|
|
39,536,615
|
|
42,927,315
|
|
(27,064,200
|
)
|
15,863,115
|
|
—
|
|
||||||||||||
|
Oakwood Boston
|
Boston, MA
|
G
|
1901
|
94
|
|
22,200,000
|
|
28,672,979
|
|
1,262,957
|
|
22,200,000
|
|
29,935,936
|
|
52,135,936
|
|
(4,761,170
|
)
|
47,374,766
|
|
—
|
|
||||||||||||
|
Oakwood Crystal City
|
Arlington, VA
|
—
|
1987
|
162
|
|
15,400,000
|
|
35,474,336
|
|
747,540
|
|
15,400,000
|
|
36,221,876
|
|
51,621,876
|
|
(5,451,482
|
)
|
46,170,394
|
|
—
|
|
||||||||||||
|
Oakwood Marina Del Rey
|
Marina Del Rey, CA
|
—
|
1969
|
597
|
|
—
|
|
120,795,359
|
|
2,191,084
|
|
—
|
|
122,986,443
|
|
122,986,443
|
|
(19,217,166
|
)
|
103,769,277
|
|
—
|
|
||||||||||||
|
Ocean Crest
|
Solana Beach, CA
|
—
|
1986
|
146
|
|
5,111,200
|
|
11,910,438
|
|
3,243,097
|
|
5,111,200
|
|
15,153,535
|
|
20,264,735
|
|
(9,238,961
|
)
|
11,025,774
|
|
—
|
|
||||||||||||
|
Odin (fka Tallman)
|
Seattle, WA
|
—
|
2015
|
301
|
|
16,807,519
|
|
63,101,811
|
|
241
|
|
16,807,519
|
|
63,102,052
|
|
79,909,571
|
|
(623,866
|
)
|
79,285,705
|
|
—
|
|
||||||||||||
|
Old Town Lofts
|
Redmond, WA
|
G
|
2014
|
149
|
|
7,740,467
|
|
44,146,181
|
|
159,751
|
|
7,740,467
|
|
44,305,932
|
|
52,046,399
|
|
(734,373
|
)
|
51,312,026
|
|
—
|
|
||||||||||||
|
One Henry Adams
|
San Francisco, CA
|
G
|
(F)
|
—
|
|
30,224,393
|
|
59,682,378
|
|
—
|
|
30,224,393
|
|
59,682,378
|
|
89,906,771
|
|
—
|
|
89,906,771
|
|
—
|
|
||||||||||||
|
Pacific Place
|
Los Angeles, CA
|
—
|
2008
|
430
|
|
32,250,000
|
|
110,750,000
|
|
989,768
|
|
32,250,000
|
|
111,739,768
|
|
143,989,768
|
|
(13,998,683
|
)
|
129,991,085
|
|
—
|
|
||||||||||||
|
Parc 77
|
New York, NY
|
G
|
1903
|
137
|
|
40,504,000
|
|
18,025,679
|
|
5,558,590
|
|
40,504,000
|
|
23,584,269
|
|
64,088,269
|
|
(10,342,724
|
)
|
53,745,545
|
|
—
|
|
||||||||||||
|
Parc Cameron
|
New York, NY
|
G
|
1927
|
166
|
|
37,600,000
|
|
9,855,597
|
|
6,604,055
|
|
37,600,000
|
|
16,459,652
|
|
54,059,652
|
|
(8,709,483
|
)
|
45,350,169
|
|
—
|
|
||||||||||||
|
Parc Coliseum
|
New York, NY
|
G
|
1910
|
177
|
|
52,654,000
|
|
23,045,751
|
|
8,549,855
|
|
52,654,000
|
|
31,595,606
|
|
84,249,606
|
|
(14,193,545
|
)
|
70,056,061
|
|
—
|
|
||||||||||||
|
Parc East Towers
|
New York, NY
|
G
|
1977
|
324
|
|
102,163,000
|
|
108,989,402
|
|
8,398,427
|
|
102,163,000
|
|
117,387,829
|
|
219,550,829
|
|
(40,021,695
|
)
|
179,529,134
|
|
—
|
|
||||||||||||
|
Parc on Powell (fka 1333 Powell)
|
Emeryville, CA
|
G
|
2015
|
173
|
|
16,667,059
|
|
66,308,322
|
|
4,993
|
|
16,667,059
|
|
66,313,315
|
|
82,980,374
|
|
(1,386,523
|
)
|
81,593,851
|
|
—
|
|
||||||||||||
|
Park at Pentagon Row (fka Pentagon City)
|
Arlington, VA
|
G
|
1990
|
298
|
|
28,300,000
|
|
78,838,184
|
|
700,661
|
|
28,300,000
|
|
79,538,845
|
|
107,838,845
|
|
(11,504,796
|
)
|
96,334,049
|
|
—
|
|
||||||||||||
|
Park Connecticut
|
Washington, D.C.
|
—
|
2000
|
142
|
|
13,700,000
|
|
59,087,519
|
|
757,785
|
|
13,700,000
|
|
59,845,304
|
|
73,545,304
|
|
(8,000,115
|
)
|
65,545,189
|
|
—
|
|
||||||||||||
|
Park Hacienda (fka Hacienda)
|
Pleasanton, CA
|
—
|
2000
|
540
|
|
43,200,000
|
|
128,753,359
|
|
774,074
|
|
43,200,000
|
|
129,527,433
|
|
172,727,433
|
|
(19,900,917
|
)
|
152,826,516
|
|
—
|
|
||||||||||||
|
Park West (CA)
|
Los Angeles, CA
|
—
|
1987/1990
|
444
|
|
3,033,500
|
|
27,302,383
|
|
9,419,065
|
|
3,033,500
|
|
36,721,448
|
|
39,754,948
|
|
(24,776,986
|
)
|
14,977,962
|
|
—
|
|
||||||||||||
|
Parkside
|
Union City, CA
|
—
|
1979
|
208
|
|
6,246,700
|
|
11,827,453
|
|
3,981,119
|
|
6,246,700
|
|
15,808,572
|
|
22,055,272
|
|
(10,527,862
|
)
|
11,527,410
|
|
—
|
|
||||||||||||
|
Pearl, The
|
Seattle, WA
|
G
|
2008
|
80
|
|
6,972,585
|
|
26,527,415
|
|
—
|
|
6,972,585
|
|
26,527,415
|
|
33,500,000
|
|
—
|
|
33,500,000
|
|
—
|
|
||||||||||||
S-6
EQUITY RESIDENTIAL
ERP OPERATING LIMITED PARTNERSHIP
Schedule III - Real Estate and Accumulated Depreciation
December 31, 2015
|
Description
|
|
Initial Cost to Company
|
Cost Capitalized Subsequent to Acquisition(Improvements, net) (E)
|
Gross Amount Carried at Close of Period 12/31/15
|
|
|
|
|
|||||||||||||||||||||||||||
|
Apartment Name
|
Location
|
Retail/Commercial Space
|
Date of Construction
|
Apartment Units (H)
|
Land
|
Building & Fixtures
|
Building & Fixtures
|
Land
|
Building & Fixtures (A)
|
Total (B)
|
Accumulated Depreciation (C)
|
Investment in Real Estate, Net at 12/31/15 (B)
|
Encumbrances
|
||||||||||||||||||||||
|
Pegasus
|
Los Angeles, CA
|
G
|
1949/2003
|
322
|
|
18,094,052
|
|
81,905,948
|
|
2,764,585
|
|
18,094,052
|
|
84,670,533
|
|
102,764,585
|
|
(19,826,265
|
)
|
82,938,320
|
|
—
|
|
||||||||||||
|
Phillips Park
|
Wellesley, MA
|
—
|
1988
|
49
|
|
816,922
|
|
5,460,955
|
|
1,157,352
|
|
816,922
|
|
6,618,307
|
|
7,435,229
|
|
(3,766,443
|
)
|
3,668,786
|
|
—
|
|
||||||||||||
|
Playa Pacifica
|
Hermosa Beach, CA
|
—
|
1972
|
285
|
|
35,100,000
|
|
33,473,822
|
|
12,699,944
|
|
35,100,000
|
|
46,173,766
|
|
81,273,766
|
|
(19,897,231
|
)
|
61,376,535
|
|
—
|
|
||||||||||||
|
Portofino
|
Chino Hills, CA
|
—
|
1989
|
176
|
|
3,572,400
|
|
14,660,994
|
|
3,510,897
|
|
3,572,400
|
|
18,171,891
|
|
21,744,291
|
|
(11,352,508
|
)
|
10,391,783
|
|
—
|
|
||||||||||||
|
Portofino (Val)
|
Valencia, CA
|
—
|
1989
|
216
|
|
8,640,000
|
|
21,487,126
|
|
3,296,844
|
|
8,640,000
|
|
24,783,970
|
|
33,423,970
|
|
(13,318,844
|
)
|
20,105,126
|
|
—
|
|
||||||||||||
|
Portside Towers
|
Jersey City, NJ
|
G
|
1992-1997
|
527
|
|
22,487,006
|
|
96,842,913
|
|
19,873,490
|
|
22,487,006
|
|
116,716,403
|
|
139,203,409
|
|
(71,088,414
|
)
|
68,114,995
|
|
—
|
|
||||||||||||
|
Potrero 1010
|
San Francisco, CA
|
G
|
(F)
|
—
|
|
40,830,011
|
|
133,910,937
|
|
—
|
|
40,830,011
|
|
133,910,937
|
|
174,740,948
|
|
—
|
|
174,740,948
|
|
—
|
|
||||||||||||
|
Prado (fka Glendale)
|
Glendale, CA
|
—
|
1988
|
264
|
|
—
|
|
67,977,313
|
|
2,061,951
|
|
—
|
|
70,039,264
|
|
70,039,264
|
|
(9,953,439
|
)
|
60,085,825
|
|
—
|
|
||||||||||||
|
Prime, The
|
Arlington, VA
|
—
|
2002
|
256
|
|
32,000,000
|
|
64,436,539
|
|
1,301,267
|
|
32,000,000
|
|
65,737,806
|
|
97,737,806
|
|
(23,364,019
|
)
|
74,373,787
|
|
—
|
|
||||||||||||
|
Prism at Park Avenue South (fka 400 Park Avenue South)
|
New York, NY
|
G
|
2015
|
269
|
|
76,292,169
|
|
163,700,126
|
|
—
|
|
76,292,169
|
|
163,700,126
|
|
239,992,295
|
|
(5,492,140
|
)
|
234,500,155
|
|
—
|
|
||||||||||||
|
Promenade at Town Center I & II
|
Valencia, CA
|
—
|
2001
|
564
|
|
28,200,000
|
|
69,795,915
|
|
5,471,517
|
|
28,200,000
|
|
75,267,432
|
|
103,467,432
|
|
(33,050,350
|
)
|
70,417,082
|
|
—
|
|
||||||||||||
|
Quarry Hills
|
Quincy, MA
|
—
|
2006
|
316
|
|
26,900,000
|
|
84,411,162
|
|
813,007
|
|
26,900,000
|
|
85,224,169
|
|
112,124,169
|
|
(12,835,782
|
)
|
99,288,387
|
|
—
|
|
||||||||||||
|
Red 160 (fka Redmond Way)
|
Redmond, WA
|
G
|
2011
|
250
|
|
15,546,376
|
|
65,320,010
|
|
872,804
|
|
15,546,376
|
|
66,192,814
|
|
81,739,190
|
|
(11,437,349
|
)
|
70,301,841
|
|
—
|
|
||||||||||||
|
Redmond Court
|
Bellevue, WA
|
—
|
1977
|
206
|
|
10,300,000
|
|
33,488,745
|
|
722,527
|
|
10,300,000
|
|
34,211,272
|
|
44,511,272
|
|
(5,429,653
|
)
|
39,081,619
|
|
—
|
|
||||||||||||
|
Regency Palms
|
Huntington Beach, CA
|
—
|
1969
|
310
|
|
1,857,400
|
|
16,713,254
|
|
5,591,340
|
|
1,857,400
|
|
22,304,594
|
|
24,161,994
|
|
(15,853,559
|
)
|
8,308,435
|
|
—
|
|
||||||||||||
|
Renaissance Villas
|
Berkeley, CA
|
G
|
1998
|
34
|
|
2,458,000
|
|
4,542,000
|
|
148,126
|
|
2,458,000
|
|
4,690,126
|
|
7,148,126
|
|
(1,571,899
|
)
|
5,576,227
|
|
—
|
|
||||||||||||
|
Reserve at Mountain View (fka Mountian View)
|
Mountain View, CA
|
—
|
1965
|
180
|
|
27,000,000
|
|
33,029,605
|
|
2,601,273
|
|
27,000,000
|
|
35,630,878
|
|
62,630,878
|
|
(5,569,705
|
)
|
57,061,173
|
|
—
|
|
||||||||||||
|
Reserve at Potomac Yard
|
Alexandria, VA
|
—
|
2002
|
588
|
|
11,918,917
|
|
68,862,641
|
|
7,339,599
|
|
11,918,917
|
|
76,202,240
|
|
88,121,157
|
|
(31,804,125
|
)
|
56,317,032
|
|
—
|
|
||||||||||||
|
Reserve at Town Center I-III (WA)
|
Mill Creek, WA
|
G
|
2001, 2009, 2014
|
584
|
|
16,769,205
|
|
77,511,523
|
|
2,678,501
|
|
16,769,205
|
|
80,190,024
|
|
96,959,229
|
|
(24,170,095
|
)
|
72,789,134
|
|
—
|
|
||||||||||||
|
Residences at Westgate I (fka Westgate II)
|
Pasadena, CA
|
G
|
2014
|
252
|
|
17,859,785
|
|
107,725,435
|
|
37,183
|
|
17,859,785
|
|
107,762,618
|
|
125,622,403
|
|
(6,461,296
|
)
|
119,161,107
|
|
—
|
|
||||||||||||
|
Residences at Westgate II (fka Westgate III)
|
Pasadena, CA
|
G
|
2015
|
88
|
|
12,118,061
|
|
39,965,098
|
|
3,415
|
|
12,118,061
|
|
39,968,513
|
|
52,086,574
|
|
(1,103,584
|
)
|
50,982,990
|
|
—
|
|
||||||||||||
|
Rianna I
|
Seattle, WA
|
G
|
2000
|
78
|
|
2,268,160
|
|
14,864,482
|
|
500,196
|
|
2,268,160
|
|
15,364,678
|
|
17,632,838
|
|
(4,413,092
|
)
|
13,219,746
|
|
—
|
|
||||||||||||
|
Ridgewood Village I&II
|
San Diego, CA
|
—
|
1997
|
408
|
|
11,809,500
|
|
34,004,048
|
|
5,222,765
|
|
11,809,500
|
|
39,226,813
|
|
51,036,313
|
|
(21,544,992
|
)
|
29,491,321
|
|
—
|
|
||||||||||||
|
Riva Terra I (fka Redwood Shores)
|
Redwood City, CA
|
—
|
1986
|
304
|
|
34,963,355
|
|
84,587,658
|
|
1,065,313
|
|
34,963,355
|
|
85,652,971
|
|
120,616,326
|
|
(13,337,511
|
)
|
107,278,815
|
|
—
|
|
||||||||||||
|
Riva Terra II (fka Harborside)
|
Redwood City, CA
|
—
|
1986
|
149
|
|
17,136,645
|
|
40,536,531
|
|
1,657,715
|
|
17,136,645
|
|
42,194,246
|
|
59,330,891
|
|
(6,014,126
|
)
|
53,316,765
|
|
—
|
|
||||||||||||
|
River Tower
|
New York, NY
|
G
|
1982
|
323
|
|
118,669,441
|
|
98,880,559
|
|
6,922,776
|
|
118,669,441
|
|
105,803,335
|
|
224,472,776
|
|
(31,766,311
|
)
|
192,706,465
|
|
—
|
|
||||||||||||
|
Riverpark
|
Redmond, WA
|
G
|
2009
|
319
|
|
14,355,000
|
|
80,894,049
|
|
852,454
|
|
14,355,000
|
|
81,746,503
|
|
96,101,503
|
|
(15,145,119
|
)
|
80,956,384
|
|
—
|
|
||||||||||||
|
Rivers Bend (CT)
|
Windsor, CT
|
—
|
1973
|
373
|
|
3,325,517
|
|
22,573,826
|
|
3,383,538
|
|
3,325,517
|
|
25,957,364
|
|
29,282,881
|
|
(14,452,521
|
)
|
14,830,360
|
|
—
|
|
||||||||||||
|
Riverview Condominiums
|
Norwalk, CT
|
—
|
1991
|
92
|
|
2,300,000
|
|
7,406,730
|
|
2,560,055
|
|
2,300,000
|
|
9,966,785
|
|
12,266,785
|
|
(5,911,876
|
)
|
6,354,909
|
|
—
|
|
||||||||||||
|
Rolling Green (Milford)
|
Milford, MA
|
—
|
1970
|
304
|
|
2,012,350
|
|
13,452,150
|
|
6,536,428
|
|
2,012,350
|
|
19,988,578
|
|
22,000,928
|
|
(11,602,104
|
)
|
10,398,824
|
|
—
|
|
||||||||||||
|
Rosecliff II
|
Quincy, MA
|
—
|
2005
|
130
|
|
4,922,840
|
|
30,202,160
|
|
668,021
|
|
4,922,840
|
|
30,870,181
|
|
35,793,021
|
|
(6,606,758
|
)
|
29,186,263
|
|
—
|
|
||||||||||||
|
Sakura Crossing
|
Los Angeles, CA
|
G
|
2009
|
230
|
|
14,641,990
|
|
42,858,010
|
|
516,747
|
|
14,641,990
|
|
43,374,757
|
|
58,016,747
|
|
(10,000,868
|
)
|
48,015,879
|
|
—
|
|
||||||||||||
|
Seventh & James
|
Seattle, WA
|
—
|
1992
|
96
|
|
663,800
|
|
5,974,803
|
|
3,738,122
|
|
663,800
|
|
9,712,925
|
|
10,376,725
|
|
(6,665,425
|
)
|
3,711,300
|
|
—
|
|
||||||||||||
|
Sheffield Court
|
Arlington, VA
|
—
|
1986
|
597
|
|
3,342,381
|
|
31,337,332
|
|
13,786,422
|
|
3,342,381
|
|
45,123,754
|
|
48,466,135
|
|
(31,901,556
|
)
|
16,564,579
|
|
—
|
|
||||||||||||
|
Skycrest
|
Valencia, CA
|
—
|
1999
|
264
|
|
10,560,000
|
|
25,574,457
|
|
2,534,401
|
|
10,560,000
|
|
28,108,858
|
|
38,668,858
|
|
(15,040,496
|
)
|
23,628,362
|
|
—
|
|
||||||||||||
|
Skylark
|
Union City, CA
|
—
|
1986
|
174
|
|
1,781,600
|
|
16,731,916
|
|
3,437,547
|
|
1,781,600
|
|
20,169,463
|
|
21,951,063
|
|
(11,666,506
|
)
|
10,284,557
|
|
—
|
|
||||||||||||
|
Skyline Terrace
|
Burlingame, CA
|
—
|
1967 & 1987
|
138
|
|
16,836,000
|
|
35,414,000
|
|
4,411,395
|
|
16,836,000
|
|
39,825,395
|
|
56,661,395
|
|
(10,031,613
|
)
|
46,629,782
|
|
—
|
|
||||||||||||
|
Skyline Towers
|
Falls Church, VA
|
G
|
1971
|
939
|
|
78,278,200
|
|
91,485,591
|
|
35,113,125
|
|
78,278,200
|
|
126,598,716
|
|
204,876,916
|
|
(60,654,648
|
)
|
144,222,268
|
|
—
|
|
||||||||||||
|
SoMa II
|
San Francisco, CA
|
—
|
(F)
|
—
|
|
29,406,496
|
|
1,512,966
|
|
—
|
|
29,406,496
|
|
1,512,966
|
|
30,919,462
|
|
—
|
|
30,919,462
|
|
—
|
|
||||||||||||
|
Sonterra at Foothill Ranch
|
Foothill Ranch, CA
|
—
|
1997
|
300
|
|
7,503,400
|
|
24,048,507
|
|
4,091,719
|
|
7,503,400
|
|
28,140,226
|
|
35,643,626
|
|
(16,219,354
|
)
|
19,424,272
|
|
—
|
|
||||||||||||
|
South City Station (fka South San Francisco)
|
San Francisco, CA
|
G
|
2007
|
360
|
|
68,900,000
|
|
79,476,861
|
|
2,029,236
|
|
68,900,000
|
|
81,506,097
|
|
150,406,097
|
|
(12,682,198
|
)
|
137,723,899
|
|
—
|
|
||||||||||||
|
South Winds
|
Fall River, MA
|
—
|
1971
|
404
|
|
2,481,821
|
|
16,780,359
|
|
5,786,341
|
|
2,481,821
|
|
22,566,700
|
|
25,048,521
|
|
(12,988,103
|
)
|
12,060,418
|
|
—
|
|
||||||||||||
|
Southwood
|
Palo Alto, CA
|
—
|
1985
|
100
|
|
6,936,600
|
|
14,324,069
|
|
3,133,285
|
|
6,936,600
|
|
17,457,354
|
|
24,393,954
|
|
(10,724,438
|
)
|
13,669,516
|
|
—
|
|
||||||||||||
|
Springbrook Estates
|
Riverside, CA
|
—
|
(F)
|
—
|
|
18,200,000
|
|
—
|
|
—
|
|
18,200,000
|
|
—
|
|
18,200,000
|
|
—
|
|
18,200,000
|
|
—
|
|
||||||||||||
|
Square One
|
Seattle, WA
|
—
|
2014
|
112
|
|
7,222,544
|
|
26,277,456
|
|
11,820
|
|
7,222,544
|
|
26,289,276
|
|
33,511,820
|
|
(2,132,808
|
)
|
31,379,012
|
|
—
|
|
||||||||||||
S-7
EQUITY RESIDENTIAL
ERP OPERATING LIMITED PARTNERSHIP
Schedule III - Real Estate and Accumulated Depreciation
December 31, 2015
|
Description
|
|
Initial Cost to Company
|
Cost Capitalized Subsequent to Acquisition(Improvements, net) (E)
|
Gross Amount Carried at Close of Period 12/31/15
|
|
|
|
|
|||||||||||||||||||||||||||
|
Apartment Name
|
Location
|
Retail/Commercial Space
|
Date of Construction
|
Apartment Units (H)
|
Land
|
Building & Fixtures
|
Building & Fixtures
|
Land
|
Building & Fixtures (A)
|
Total (B)
|
Accumulated Depreciation (C)
|
Investment in Real Estate, Net at 12/31/15 (B)
|
Encumbrances
|
||||||||||||||||||||||
|
Summerset Village II
|
Chatsworth, CA
|
—
|
(F)
|
—
|
|
260,646
|
|
—
|
|
—
|
|
260,646
|
|
—
|
|
260,646
|
|
—
|
|
260,646
|
|
—
|
|
||||||||||||
|
Summit & Birch Hill
|
Farmington, CT
|
—
|
1967
|
186
|
|
1,757,438
|
|
11,748,112
|
|
3,699,790
|
|
1,757,438
|
|
15,447,902
|
|
17,205,340
|
|
(9,010,282
|
)
|
8,195,058
|
|
—
|
|
||||||||||||
|
Summit at Sausalito (fka Sausalito)
|
Sausalito, CA
|
—
|
1978
|
198
|
|
26,000,000
|
|
28,435,024
|
|
3,038,378
|
|
26,000,000
|
|
31,473,402
|
|
57,473,402
|
|
(5,983,695
|
)
|
51,489,707
|
|
—
|
|
||||||||||||
|
Ten23 (fka 500 West 23rd Street)
|
New York, NY
|
G
|
2011
|
111
|
|
—
|
|
58,881,773
|
|
145,689
|
|
—
|
|
59,027,462
|
|
59,027,462
|
|
(8,159,767
|
)
|
50,867,695
|
|
—
|
|
||||||||||||
|
Terraces, The
|
San Francisco, CA
|
G
|
1975
|
117
|
|
14,087,610
|
|
16,314,151
|
|
792,092
|
|
14,087,610
|
|
17,106,243
|
|
31,193,853
|
|
(4,289,162
|
)
|
26,904,691
|
|
—
|
|
||||||||||||
|
Third Square
|
Cambridge, MA
|
G
|
2008/2009
|
471
|
|
26,767,171
|
|
218,822,728
|
|
3,752,897
|
|
26,767,171
|
|
222,575,625
|
|
249,342,796
|
|
(54,468,452
|
)
|
194,874,344
|
|
—
|
|
||||||||||||
|
Three20
|
Seattle, WA
|
G
|
2013
|
134
|
|
7,030,766
|
|
29,005,762
|
|
620,352
|
|
7,030,766
|
|
29,626,114
|
|
36,656,880
|
|
(2,968,086
|
)
|
33,688,794
|
|
—
|
|
||||||||||||
|
Town Center South Commercial Tract
|
St. Charles, MD
|
—
|
(F)
|
—
|
|
1,500,000
|
|
9,394
|
|
—
|
|
1,500,000
|
|
9,394
|
|
1,509,394
|
|
—
|
|
1,509,394
|
|
—
|
|
||||||||||||
|
Town Square at Mark Center II
|
Alexandria, VA
|
—
|
2001
|
272
|
|
15,568,464
|
|
55,029,607
|
|
891,715
|
|
15,568,464
|
|
55,921,322
|
|
71,489,786
|
|
(15,215,629
|
)
|
56,274,157
|
|
—
|
|
||||||||||||
|
Trump Place, 140 Riverside
|
New York, NY
|
G
|
2003
|
354
|
|
103,539,100
|
|
94,082,725
|
|
5,016,383
|
|
103,539,100
|
|
99,099,108
|
|
202,638,208
|
|
(37,252,860
|
)
|
165,385,348
|
|
—
|
|
||||||||||||
|
Trump Place, 160 Riverside
|
New York, NY
|
G
|
2001
|
455
|
|
139,933,500
|
|
190,964,745
|
|
11,256,618
|
|
139,933,500
|
|
202,221,363
|
|
342,154,863
|
|
(74,504,178
|
)
|
267,650,685
|
|
—
|
|
||||||||||||
|
Trump Place, 180 Riverside
|
New York, NY
|
G
|
1998
|
516
|
|
144,968,250
|
|
138,346,681
|
|
9,992,673
|
|
144,968,250
|
|
148,339,354
|
|
293,307,604
|
|
(56,241,522
|
)
|
237,066,082
|
|
—
|
|
||||||||||||
|
Urbana (fka Market Street Landing)
|
Seattle, WA
|
G
|
2014
|
287
|
|
12,542,418
|
|
74,480,619
|
|
269,601
|
|
12,542,418
|
|
74,750,220
|
|
87,292,638
|
|
(6,439,418
|
)
|
80,853,220
|
|
—
|
|
||||||||||||
|
Uwajimaya Village
|
Seattle, WA
|
—
|
2002
|
176
|
|
8,800,000
|
|
22,188,288
|
|
528,472
|
|
8,800,000
|
|
22,716,760
|
|
31,516,760
|
|
(9,395,695
|
)
|
22,121,065
|
|
—
|
|
||||||||||||
|
Vantage Pointe
|
San Diego, CA
|
G
|
2009
|
679
|
|
9,403,960
|
|
190,596,040
|
|
7,589,101
|
|
9,403,960
|
|
198,185,141
|
|
207,589,101
|
|
(45,420,591
|
)
|
162,168,510
|
|
—
|
|
||||||||||||
|
Veloce
|
Redmond, WA
|
G
|
2009
|
322
|
|
15,322,724
|
|
76,176,594
|
|
451,368
|
|
15,322,724
|
|
76,627,962
|
|
91,950,686
|
|
(11,158,120
|
)
|
80,792,566
|
|
—
|
|
||||||||||||
|
Verde Condominium Homes (fka Mission Verde, LLC)
|
San Jose, CA
|
—
|
1986
|
108
|
|
5,190,700
|
|
9,679,109
|
|
4,136,146
|
|
5,190,700
|
|
13,815,255
|
|
19,005,955
|
|
(8,802,858
|
)
|
10,203,097
|
|
—
|
|
||||||||||||
|
Veridian (fka Silver Spring)
|
Silver Spring, MD
|
G
|
2009
|
457
|
|
18,539,817
|
|
130,407,365
|
|
1,610,778
|
|
18,539,817
|
|
132,018,143
|
|
150,557,960
|
|
(29,933,549
|
)
|
120,624,411
|
|
—
|
|
||||||||||||
|
Villa Solana
|
Laguna Hills, CA
|
—
|
1984
|
272
|
|
1,665,100
|
|
14,985,678
|
|
9,240,278
|
|
1,665,100
|
|
24,225,956
|
|
25,891,056
|
|
(17,544,510
|
)
|
8,346,546
|
|
—
|
|
||||||||||||
|
Village at Del Mar Heights, The (fka Del Mar Heights)
|
San Diego, CA
|
—
|
1986
|
168
|
|
15,100,000
|
|
40,859,396
|
|
452,196
|
|
15,100,000
|
|
41,311,592
|
|
56,411,592
|
|
(6,269,124
|
)
|
50,142,468
|
|
—
|
|
||||||||||||
|
Virginia Square
|
Arlington, VA
|
G
|
2002
|
231
|
|
—
|
|
85,940,003
|
|
2,314,664
|
|
—
|
|
88,254,667
|
|
88,254,667
|
|
(12,224,720
|
)
|
76,029,947
|
|
—
|
|
||||||||||||
|
Vista 99 (fka Tasman)
|
San Jose, CA
|
—
|
(F)
|
—
|
|
27,709,329
|
|
163,443,672
|
|
—
|
|
27,709,329
|
|
163,443,672
|
|
191,153,001
|
|
—
|
|
191,153,001
|
|
—
|
|
||||||||||||
|
Vista Del Lago
|
Mission Viejo, CA
|
—
|
1986-1988
|
608
|
|
4,525,800
|
|
40,736,293
|
|
15,916,279
|
|
4,525,800
|
|
56,652,572
|
|
61,178,372
|
|
(41,596,423
|
)
|
19,581,949
|
|
—
|
|
||||||||||||
|
Vista on Courthouse
|
Arlington, VA
|
—
|
2008
|
220
|
|
15,550,260
|
|
69,449,740
|
|
1,252,472
|
|
15,550,260
|
|
70,702,212
|
|
86,252,472
|
|
(18,744,668
|
)
|
67,507,804
|
|
—
|
|
||||||||||||
|
Walden Park
|
Cambridge, MA
|
—
|
1966
|
232
|
|
12,448,888
|
|
52,044,448
|
|
3,777,135
|
|
12,448,888
|
|
55,821,583
|
|
68,270,471
|
|
(12,955,477
|
)
|
55,314,994
|
|
—
|
|
||||||||||||
|
Watertown Square
|
Watertown, MA
|
G
|
2005
|
134
|
|
16,800,000
|
|
34,074,056
|
|
492,605
|
|
16,800,000
|
|
34,566,661
|
|
51,366,661
|
|
(5,057,515
|
)
|
46,309,146
|
|
—
|
|
||||||||||||
|
Webster Green
|
Needham, MA
|
—
|
1985
|
77
|
|
1,418,893
|
|
9,485,006
|
|
1,325,106
|
|
1,418,893
|
|
10,810,112
|
|
12,229,005
|
|
(5,911,293
|
)
|
6,317,712
|
|
—
|
|
||||||||||||
|
West 96th
|
New York, NY
|
G
|
1987
|
207
|
|
84,800,000
|
|
67,055,502
|
|
2,339,801
|
|
84,800,000
|
|
69,395,303
|
|
154,195,303
|
|
(12,819,335
|
)
|
141,375,968
|
|
—
|
|
||||||||||||
|
West End Apartments (fka Emerson Place/ CRP II)
|
Boston, MA
|
G
|
2008
|
310
|
|
469,546
|
|
163,123,022
|
|
2,000,511
|
|
469,546
|
|
165,123,533
|
|
165,593,079
|
|
(44,450,837
|
)
|
121,142,242
|
|
—
|
|
||||||||||||
|
Westchester at Rockville
|
Rockville, MD
|
—
|
2009
|
192
|
|
10,600,000
|
|
44,135,207
|
|
361,408
|
|
10,600,000
|
|
44,496,615
|
|
55,096,615
|
|
(6,548,905
|
)
|
48,547,710
|
|
—
|
|
||||||||||||
|
Westmont
|
New York, NY
|
G
|
1986
|
163
|
|
64,900,000
|
|
61,143,259
|
|
1,305,267
|
|
64,900,000
|
|
62,448,526
|
|
127,348,526
|
|
(10,006,114
|
)
|
117,342,412
|
|
—
|
|
||||||||||||
|
Westside
|
Los Angeles, CA
|
—
|
2004
|
204
|
|
34,200,000
|
|
56,962,630
|
|
2,192,331
|
|
34,200,000
|
|
59,154,961
|
|
93,354,961
|
|
(8,309,849
|
)
|
85,045,112
|
|
—
|
|
||||||||||||
|
Westside Barrington (fka Westside Villas III)
|
Los Angeles, CA
|
—
|
1999
|
36
|
|
3,060,000
|
|
5,538,871
|
|
597,629
|
|
3,060,000
|
|
6,136,500
|
|
9,196,500
|
|
(3,105,675
|
)
|
6,090,825
|
|
—
|
|
||||||||||||
|
Westside Barry (Westside Villas VI)
|
Los Angeles, CA
|
—
|
1989
|
18
|
|
1,530,000
|
|
3,023,523
|
|
402,842
|
|
1,530,000
|
|
3,426,365
|
|
4,956,365
|
|
(1,787,554
|
)
|
3,168,811
|
|
—
|
|
||||||||||||
|
Westside Beloit (fka Westside Villas I)
|
Los Angeles, CA
|
—
|
1999
|
21
|
|
1,785,000
|
|
3,233,254
|
|
513,625
|
|
1,785,000
|
|
3,746,879
|
|
5,531,879
|
|
(1,945,537
|
)
|
3,586,342
|
|
—
|
|
||||||||||||
|
Westside Bundy (fka Westside Villas II)
|
Los Angeles, CA
|
—
|
1999
|
23
|
|
1,955,000
|
|
3,541,435
|
|
424,651
|
|
1,955,000
|
|
3,966,086
|
|
5,921,086
|
|
(1,996,405
|
)
|
3,924,681
|
|
—
|
|
||||||||||||
|
Westside Butler (fka Westside Villas IV)
|
Los Angeles, CA
|
—
|
1999
|
36
|
|
3,060,000
|
|
5,539,390
|
|
596,890
|
|
3,060,000
|
|
6,136,280
|
|
9,196,280
|
|
(3,111,743
|
)
|
6,084,537
|
|
—
|
|
||||||||||||
|
Westside Villas (fka Westside Villas V &VII)
|
Los Angeles, CA
|
—
|
1999 & 2001
|
113
|
|
9,605,000
|
|
19,983,385
|
|
1,877,050
|
|
9,605,000
|
|
21,860,435
|
|
31,465,435
|
|
(10,577,308
|
)
|
20,888,127
|
|
—
|
|
||||||||||||
|
Westwood Glen
|
Westwood, MA
|
—
|
1972
|
156
|
|
1,616,505
|
|
10,806,004
|
|
2,400,201
|
|
1,616,505
|
|
13,206,205
|
|
14,822,710
|
|
(7,265,245
|
)
|
7,557,465
|
|
—
|
|
||||||||||||
|
Windridge (CA)
|
Laguna Niguel, CA
|
—
|
1989
|
344
|
|
2,662,900
|
|
23,985,497
|
|
9,301,611
|
|
2,662,900
|
|
33,287,108
|
|
35,950,008
|
|
(23,042,811
|
)
|
12,907,197
|
|
—
|
|
||||||||||||
|
Wood Creek I
|
Pleasant Hill, CA
|
—
|
1987
|
256
|
|
9,729,900
|
|
23,009,768
|
|
6,723,042
|
|
9,729,900
|
|
29,732,810
|
|
39,462,710
|
|
(19,191,248
|
)
|
20,271,462
|
|
—
|
|
||||||||||||
|
Woodbridge (CT)
|
Newington, CT
|
—
|
1968
|
73
|
|
498,377
|
|
3,331,548
|
|
1,316,602
|
|
498,377
|
|
4,648,150
|
|
5,146,527
|
|
(2,687,633
|
)
|
2,458,894
|
|
—
|
|
||||||||||||
|
Woodland Park
|
East Palo Alto, CA
|
G
|
1953
|
1,811
|
|
74,900,178
|
|
61,407,965
|
|
10,172,148
|
|
74,900,178
|
|
71,580,113
|
|
146,480,291
|
|
(29,503,957
|
)
|
116,976,334
|
|
—
|
|
||||||||||||
|
Management Business
|
Chicago, IL
|
—
|
(D)
|
—
|
|
—
|
|
—
|
|
107,367,022
|
|
—
|
|
107,367,022
|
|
107,367,022
|
|
(84,488,405
|
)
|
22,878,617
|
|
—
|
|
||||||||||||
|
Operating Partnership
|
Chicago, IL
|
—
|
(F)
|
—
|
|
—
|
|
10,060,473
|
|
—
|
|
—
|
|
10,060,473
|
|
10,060,473
|
|
—
|
|
10,060,473
|
|
—
|
|
||||||||||||
|
Investment in Real Estate – Wholly Owned Unencumbered
|
|
|
|
52,513
|
|
4,495,508,075
|
|
12,087,293,175
|
|
855,011,332
|
|
4,495,508,075
|
|
12,942,304,507
|
|
17,437,812,582
|
|
(3,224,397,212
|
)
|
14,213,415,370
|
|
—
|
|
||||||||||||
S-8
EQUITY RESIDENTIAL
ERP OPERATING LIMITED PARTNERSHIP
Schedule III - Real Estate and Accumulated Depreciation
December 31, 2015
|
Description
|
|
Initial Cost to Company
|
Cost Capitalized Subsequent to Acquisition(Improvements, net) (E)
|
Gross Amount Carried at Close of Period 12/31/15
|
|
|
|
|
|||||||||||||||||||||||||||
|
Apartment Name
|
Location
|
Retail/Commercial Space
|
Date of Construction
|
Apartment Units (H)
|
Land
|
Building & Fixtures
|
Building & Fixtures
|
Land
|
Building & Fixtures (A)
|
Total (B)
|
Accumulated Depreciation (C)
|
Investment in Real Estate, Net at 12/31/15 (B)
|
Encumbrances
|
||||||||||||||||||||||
|
Investment in Real Estate – Wholly Owned Encumbered:
|
|||||||||||||||||||||||||||||||||||
|
101 West End
|
New York, NY
|
G
|
2000
|
506
|
|
190,600,000
|
|
131,374,708
|
|
2,576,456
|
|
190,600,000
|
|
133,951,164
|
|
324,551,164
|
|
(24,450,561
|
)
|
300,100,603
|
|
106,080,734
|
|
||||||||||||
|
1401 Joyce on Pentagon Row
|
Arlington, VA
|
—
|
2004
|
326
|
|
9,780,000
|
|
89,668,165
|
|
2,229,551
|
|
9,780,000
|
|
91,897,716
|
|
101,677,716
|
|
(25,254,785
|
)
|
76,422,931
|
|
57,428,472
|
|
||||||||||||
|
2501 Porter
|
Washington, D.C.
|
—
|
1988
|
202
|
|
13,000,000
|
|
75,271,179
|
|
2,533,202
|
|
13,000,000
|
|
77,804,381
|
|
90,804,381
|
|
(10,706,382
|
)
|
80,097,999
|
|
(L)
|
|
||||||||||||
|
300 East 39th (fka East 39th)
|
New York, NY
|
G
|
2001
|
254
|
|
48,900,000
|
|
96,174,639
|
|
1,477,085
|
|
48,900,000
|
|
97,651,724
|
|
146,551,724
|
|
(14,652,321
|
)
|
131,899,403
|
|
60,075,893
|
|
||||||||||||
|
303 East 83rd (fka Camargue)
|
New York, NY
|
G
|
1976
|
261
|
|
79,400,000
|
|
79,122,624
|
|
1,412,483
|
|
79,400,000
|
|
80,535,107
|
|
159,935,107
|
|
(13,348,028
|
)
|
146,587,079
|
|
(L)
|
|
||||||||||||
|
3003 Van Ness (fka Van Ness)
|
Washington, D.C.
|
—
|
1970
|
625
|
|
56,300,000
|
|
141,191,580
|
|
2,859,298
|
|
56,300,000
|
|
144,050,878
|
|
200,350,878
|
|
(22,215,124
|
)
|
178,135,754
|
|
(K)
|
|
||||||||||||
|
425 Broadway
|
Santa Monica, CA
|
G
|
2001
|
101
|
|
12,600,000
|
|
34,394,772
|
|
1,594,856
|
|
12,600,000
|
|
35,989,628
|
|
48,589,628
|
|
(4,950,823
|
)
|
43,638,805
|
|
(L)
|
|
||||||||||||
|
4701 Willard
|
Chevy Chase, MD
|
G
|
1966
|
517
|
|
76,921,130
|
|
153,947,682
|
|
27,665,480
|
|
76,921,130
|
|
181,613,162
|
|
258,534,292
|
|
(32,880,043
|
)
|
225,654,249
|
|
95,363,077
|
|
||||||||||||
|
55 West Fifth I & II (fka Townhouse Plaza and Gardens)
|
San Mateo, CA
|
—
|
1964/1972
|
241
|
|
21,041,710
|
|
71,931,323
|
|
10,143,724
|
|
21,041,710
|
|
82,075,047
|
|
103,116,757
|
|
(13,529,391
|
)
|
89,587,366
|
|
28,269,109
|
|
||||||||||||
|
77 Park Avenue (fka Hoboken)
|
Hoboken, NJ
|
G
|
2000
|
301
|
|
27,900,000
|
|
168,992,440
|
|
3,529,188
|
|
27,900,000
|
|
172,521,628
|
|
200,421,628
|
|
(22,319,468
|
)
|
178,102,160
|
|
(K)
|
|
||||||||||||
|
800 Sixth Ave (fka Chelsea)
|
New York, NY
|
G
|
2003
|
266
|
|
59,900,000
|
|
155,861,605
|
|
503,998
|
|
59,900,000
|
|
156,365,603
|
|
216,265,603
|
|
(21,941,504
|
)
|
194,324,099
|
|
77,542,253
|
|
||||||||||||
|
929 Mass (fka 929 House)
|
Cambridge, MA
|
G
|
1975
|
127
|
|
3,252,993
|
|
21,745,595
|
|
6,057,741
|
|
3,252,993
|
|
27,803,336
|
|
31,056,329
|
|
(14,907,606
|
)
|
16,148,723
|
|
1,408,857
|
|
||||||||||||
|
Academy Village
|
North Hollywood, CA
|
—
|
1989
|
248
|
|
25,000,000
|
|
23,593,194
|
|
7,547,018
|
|
25,000,000
|
|
31,140,212
|
|
56,140,212
|
|
(15,489,771
|
)
|
40,650,441
|
|
20,000,000
|
|
||||||||||||
|
Acappella
|
Pasadena, CA
|
—
|
2002
|
143
|
|
5,839,548
|
|
29,360,452
|
|
1,386,963
|
|
5,839,548
|
|
30,747,415
|
|
36,586,963
|
|
(7,867,305
|
)
|
28,719,658
|
|
19,548,601
|
|
||||||||||||
|
Acton Courtyard
|
Berkeley, CA
|
G
|
2003
|
71
|
|
5,550,000
|
|
15,785,509
|
|
179,627
|
|
5,550,000
|
|
15,965,136
|
|
21,515,136
|
|
(5,574,135
|
)
|
15,941,001
|
|
9,920,000
|
|
||||||||||||
|
Alborada
|
Fremont, CA
|
—
|
1999
|
442
|
|
24,310,000
|
|
59,214,129
|
|
4,613,227
|
|
24,310,000
|
|
63,827,356
|
|
88,137,356
|
|
(34,004,610
|
)
|
54,132,746
|
|
(I)
|
|
||||||||||||
|
Alcyone
|
Seattle, WA
|
G
|
2004
|
161
|
|
11,379,497
|
|
49,360,503
|
|
312,223
|
|
11,379,497
|
|
49,672,726
|
|
61,052,223
|
|
(3,589,789
|
)
|
57,462,434
|
|
28,936,250
|
|
||||||||||||
|
Arches, The
|
Sunnyvale, CA
|
—
|
1974
|
410
|
|
26,650,000
|
|
62,850,000
|
|
1,070,248
|
|
26,650,000
|
|
63,920,248
|
|
90,570,248
|
|
(15,872,496
|
)
|
74,697,752
|
|
(J)
|
|
||||||||||||
|
Artech Building
|
Berkeley, CA
|
G
|
2002
|
21
|
|
1,642,000
|
|
9,152,518
|
|
307,744
|
|
1,642,000
|
|
9,460,262
|
|
11,102,262
|
|
(3,049,419
|
)
|
8,052,843
|
|
3,200,000
|
|
||||||||||||
|
Artisan Square
|
Northridge, CA
|
—
|
2002
|
140
|
|
7,000,000
|
|
20,537,359
|
|
1,156,962
|
|
7,000,000
|
|
21,694,321
|
|
28,694,321
|
|
(9,975,656
|
)
|
18,718,665
|
|
22,779,715
|
|
||||||||||||
|
Avanti
|
Anaheim, CA
|
—
|
1987
|
162
|
|
12,960,000
|
|
18,497,682
|
|
1,948,417
|
|
12,960,000
|
|
20,446,099
|
|
33,406,099
|
|
(7,861,843
|
)
|
25,544,256
|
|
18,169,458
|
|
||||||||||||
|
Avenir Apartments
|
Boston, MA
|
G
|
2009
|
241
|
|
—
|
|
114,321,619
|
|
853,000
|
|
—
|
|
115,174,619
|
|
115,174,619
|
|
(16,129,562
|
)
|
99,045,057
|
|
92,869,154
|
|
||||||||||||
|
Bachenheimer Building
|
Berkeley, CA
|
G
|
2004
|
44
|
|
3,439,000
|
|
13,866,379
|
|
136,057
|
|
3,439,000
|
|
14,002,436
|
|
17,441,436
|
|
(4,681,558
|
)
|
12,759,878
|
|
8,585,000
|
|
||||||||||||
|
Bella Vista I, II, III Combined
|
Woodland Hills, CA
|
—
|
2003-2007
|
579
|
|
31,682,754
|
|
121,095,786
|
|
3,202,259
|
|
31,682,754
|
|
124,298,045
|
|
155,980,799
|
|
(45,159,303
|
)
|
110,821,496
|
|
58,055,099
|
|
||||||||||||
|
Berkeleyan
|
Berkeley, CA
|
G
|
1998
|
56
|
|
4,377,000
|
|
16,022,110
|
|
351,018
|
|
4,377,000
|
|
16,373,128
|
|
20,750,128
|
|
(5,615,136
|
)
|
15,134,992
|
|
8,290,000
|
|
||||||||||||
|
Calvert Woodley
|
Washington, D.C.
|
—
|
1962
|
136
|
|
12,600,000
|
|
43,527,379
|
|
1,351,455
|
|
12,600,000
|
|
44,878,834
|
|
57,478,834
|
|
(6,634,781
|
)
|
50,844,053
|
|
(L)
|
|
||||||||||||
|
Carmel Terrace
|
San Diego, CA
|
—
|
1988-1989
|
384
|
|
2,288,300
|
|
20,596,281
|
|
10,947,605
|
|
2,288,300
|
|
31,543,886
|
|
33,832,186
|
|
(24,139,928
|
)
|
9,692,258
|
|
(J)
|
|
||||||||||||
|
Chelsea Square
|
Redmond, WA
|
—
|
1991
|
113
|
|
3,397,100
|
|
9,289,074
|
|
1,938,442
|
|
3,397,100
|
|
11,227,516
|
|
14,624,616
|
|
(6,785,484
|
)
|
7,839,132
|
|
9,270,000
|
|
||||||||||||
|
Citrus Suites
|
Santa Monica, CA
|
—
|
1978
|
70
|
|
9,000,000
|
|
16,950,326
|
|
498,789
|
|
9,000,000
|
|
17,449,115
|
|
26,449,115
|
|
(2,511,650
|
)
|
23,937,465
|
|
(L)
|
|
||||||||||||
|
CityView at Longwood
|
Boston, MA
|
G
|
1970
|
295
|
|
14,704,898
|
|
79,195,102
|
|
9,909,279
|
|
14,704,898
|
|
89,104,381
|
|
103,809,279
|
|
(22,102,861
|
)
|
81,706,418
|
|
22,813,347
|
|
||||||||||||
|
Cleveland House
|
Washington, D.C.
|
—
|
1953
|
214
|
|
18,300,000
|
|
66,392,414
|
|
2,268,181
|
|
18,300,000
|
|
68,660,595
|
|
86,960,595
|
|
(9,841,260
|
)
|
77,119,335
|
|
(L)
|
|
||||||||||||
|
Columbia Crossing
|
Arlington, VA
|
—
|
1991
|
247
|
|
23,500,000
|
|
53,045,073
|
|
2,133,914
|
|
23,500,000
|
|
55,178,987
|
|
78,678,987
|
|
(8,468,042
|
)
|
70,210,945
|
|
(L)
|
|
||||||||||||
|
Connecticut Heights
|
Washington, D.C.
|
—
|
1974
|
518
|
|
27,600,000
|
|
114,002,295
|
|
2,233,880
|
|
27,600,000
|
|
116,236,175
|
|
143,836,175
|
|
(15,994,030
|
)
|
127,842,145
|
|
(K)
|
|
||||||||||||
|
Deerwood (SD)
|
San Diego, CA
|
—
|
1990
|
316
|
|
2,082,095
|
|
18,739,815
|
|
14,281,345
|
|
2,082,095
|
|
33,021,160
|
|
35,103,255
|
|
(25,264,071
|
)
|
9,839,184
|
|
(J)
|
|
||||||||||||
|
Del Mar Ridge
|
San Diego, CA
|
—
|
1998
|
181
|
|
7,801,824
|
|
36,948,176
|
|
3,200,550
|
|
7,801,824
|
|
40,148,726
|
|
47,950,550
|
|
(11,807,817
|
)
|
36,142,733
|
|
23,789,381
|
|
||||||||||||
|
Estancia at Santa Clara (fka Santa Clara)
|
Santa Clara, CA
|
—
|
2000
|
450
|
|
—
|
|
123,759,804
|
|
712,699
|
|
—
|
|
124,472,503
|
|
124,472,503
|
|
(18,177,935
|
)
|
106,294,568
|
|
(L)
|
|
||||||||||||
|
Fairchase
|
Fairfax, VA
|
—
|
2007
|
392
|
|
23,500,000
|
|
87,722,321
|
|
486,155
|
|
23,500,000
|
|
88,208,476
|
|
111,708,476
|
|
(12,420,764
|
)
|
99,287,712
|
|
(L)
|
|
||||||||||||
|
Fairfield
|
Stamford, CT
|
G
|
1996
|
263
|
|
6,510,200
|
|
39,690,120
|
|
6,807,773
|
|
6,510,200
|
|
46,497,893
|
|
53,008,093
|
|
(29,297,448
|
)
|
23,710,645
|
|
34,595,000
|
|
||||||||||||
|
Fine Arts Building
|
Berkeley, CA
|
G
|
2004
|
100
|
|
7,817,000
|
|
26,462,772
|
|
322,852
|
|
7,817,000
|
|
26,785,624
|
|
34,602,624
|
|
(9,099,586
|
)
|
25,503,038
|
|
16,215,000
|
|
||||||||||||
|
Flats at DuPont Circle
|
Washington, D.C.
|
—
|
1967
|
306
|
|
35,200,000
|
|
108,768,198
|
|
604,622
|
|
35,200,000
|
|
109,372,820
|
|
144,572,820
|
|
(14,855,770
|
)
|
129,717,050
|
|
(L)
|
|
||||||||||||
|
Gaia Building
|
Berkeley, CA
|
G
|
2000
|
91
|
|
7,113,000
|
|
25,623,826
|
|
234,336
|
|
7,113,000
|
|
25,858,162
|
|
32,971,162
|
|
(8,785,368
|
)
|
24,185,794
|
|
14,630,000
|
|
||||||||||||
|
Gaithersburg Station
|
Gaithersburg, MD
|
G
|
2013
|
389
|
|
17,500,000
|
|
74,678,917
|
|
395,060
|
|
17,500,000
|
|
75,073,977
|
|
92,573,977
|
|
(9,661,514
|
)
|
82,912,463
|
|
97,790,236
|
|
||||||||||||
|
Glo
|
Los Angeles, CA
|
G
|
2008
|
201
|
|
16,047,023
|
|
48,650,963
|
|
808,007
|
|
16,047,023
|
|
49,458,970
|
|
65,505,993
|
|
(10,096,648
|
)
|
55,409,345
|
|
32,088,033
|
|
||||||||||||
|
Hathaway
|
Long Beach, CA
|
—
|
1987
|
385
|
|
2,512,500
|
|
22,611,912
|
|
8,120,060
|
|
2,512,500
|
|
30,731,972
|
|
33,244,472
|
|
(21,884,752
|
)
|
11,359,720
|
|
46,517,800
|
|
||||||||||||
|
Heights on Capitol Hill
|
Seattle, WA
|
G
|
2006
|
104
|
|
5,425,000
|
|
21,138,028
|
|
295,592
|
|
5,425,000
|
|
21,433,620
|
|
26,858,620
|
|
(7,621,120
|
)
|
19,237,500
|
|
28,180,585
|
|
||||||||||||
|
Kelvin Court (fka Alta Pacific)
|
Irvine, CA
|
—
|
2008
|
132
|
|
10,752,145
|
|
34,628,115
|
|
387,734
|
|
10,752,145
|
|
35,015,849
|
|
45,767,994
|
|
(9,542,049
|
)
|
36,225,945
|
|
26,495,000
|
|
||||||||||||
|
Kenwood Mews
|
Burbank, CA
|
—
|
1991
|
141
|
|
14,100,000
|
|
24,662,883
|
|
3,351,321
|
|
14,100,000
|
|
28,014,204
|
|
42,114,204
|
|
(10,515,075
|
)
|
31,599,129
|
|
(J)
|
|
||||||||||||
|
La Terrazza at Colma Station
|
Colma, CA
|
G
|
2005
|
153
|
|
—
|
|
41,251,044
|
|
701,808
|
|
—
|
|
41,952,852
|
|
41,952,852
|
|
(14,153,248
|
)
|
27,799,604
|
|
25,175,000
|
|
||||||||||||
S-9
EQUITY RESIDENTIAL
ERP OPERATING LIMITED PARTNERSHIP
Schedule III - Real Estate and Accumulated Depreciation
December 31, 2015
|
Description
|
|
Initial Cost to Company
|
Cost Capitalized Subsequent to Acquisition(Improvements, net) (E)
|
Gross Amount Carried at Close of Period 12/31/15
|
|
|
|
|
|||||||||||||||||||||||||||
|
Apartment Name
|
Location
|
Retail/Commercial Space
|
Date of Construction
|
Apartment Units (H)
|
Land
|
Building & Fixtures
|
Building & Fixtures
|
Land
|
Building & Fixtures (A)
|
Total (B)
|
Accumulated Depreciation (C)
|
Investment in Real Estate, Net at 12/31/15 (B)
|
Encumbrances
|
||||||||||||||||||||||
|
Laguna Clara
|
Santa Clara, CA
|
—
|
1972
|
264
|
|
13,642,420
|
|
29,707,475
|
|
4,533,141
|
|
13,642,420
|
|
34,240,616
|
|
47,883,036
|
|
(15,885,790
|
)
|
31,997,246
|
|
(J)
|
|
||||||||||||
|
Liberty Park
|
Brain Tree, MA
|
—
|
2000
|
202
|
|
5,977,504
|
|
26,749,111
|
|
5,245,483
|
|
5,977,504
|
|
31,994,594
|
|
37,972,098
|
|
(14,287,477
|
)
|
23,684,621
|
|
24,980,280
|
|
||||||||||||
|
Liberty Tower
|
Arlington, VA
|
G
|
2008
|
235
|
|
16,382,822
|
|
83,817,078
|
|
1,351,073
|
|
16,382,822
|
|
85,168,151
|
|
101,550,973
|
|
(20,623,905
|
)
|
80,927,068
|
|
45,909,078
|
|
||||||||||||
|
Longview Place
|
Waltham, MA
|
—
|
2004
|
348
|
|
20,880,000
|
|
90,255,509
|
|
3,935,492
|
|
20,880,000
|
|
94,191,001
|
|
115,071,001
|
|
(35,006,528
|
)
|
80,064,473
|
|
60,073,423
|
|
||||||||||||
|
Market Street Village
|
San Diego, CA
|
—
|
2006
|
229
|
|
13,740,000
|
|
40,757,301
|
|
1,855,488
|
|
13,740,000
|
|
42,612,789
|
|
56,352,789
|
|
(15,053,939
|
)
|
41,298,850
|
|
(J)
|
|
||||||||||||
|
Metro on First
|
Seattle, WA
|
G
|
2002
|
102
|
|
8,540,000
|
|
12,209,981
|
|
764,124
|
|
8,540,000
|
|
12,974,105
|
|
21,514,105
|
|
(4,929,664
|
)
|
16,584,441
|
|
22,843,410
|
|
||||||||||||
|
Mill Creek
|
Milpitas, CA
|
—
|
1991
|
516
|
|
12,858,693
|
|
57,168,503
|
|
7,621,842
|
|
12,858,693
|
|
64,790,345
|
|
77,649,038
|
|
(28,371,508
|
)
|
49,277,530
|
|
69,312,259
|
|
||||||||||||
|
Moda
|
Seattle, WA
|
G
|
2009
|
251
|
|
12,649,228
|
|
36,842,012
|
|
801,043
|
|
12,649,228
|
|
37,643,055
|
|
50,292,283
|
|
(9,806,747
|
)
|
40,485,536
|
|
(M)
|
|
||||||||||||
|
Montierra (CA)
|
San Diego, CA
|
—
|
1990
|
272
|
|
8,160,000
|
|
29,360,938
|
|
7,505,606
|
|
8,160,000
|
|
36,866,544
|
|
45,026,544
|
|
(21,688,065
|
)
|
23,338,479
|
|
(J)
|
|
||||||||||||
|
Mosaic at Metro
|
Hyattsville, MD
|
—
|
2008
|
260
|
|
—
|
|
59,580,898
|
|
587,443
|
|
—
|
|
60,168,341
|
|
60,168,341
|
|
(15,416,225
|
)
|
44,752,116
|
|
42,865,814
|
|
||||||||||||
|
North Pier at Harborside
|
Jersey City, NJ
|
—
|
2003
|
297
|
|
4,000,159
|
|
94,290,590
|
|
2,769,431
|
|
4,000,159
|
|
97,060,021
|
|
101,060,180
|
|
(39,300,172
|
)
|
61,760,008
|
|
(I)
|
|
||||||||||||
|
Oaks
|
Santa Clarita, CA
|
—
|
2000
|
520
|
|
23,400,000
|
|
61,020,438
|
|
4,561,180
|
|
23,400,000
|
|
65,581,618
|
|
88,981,618
|
|
(29,469,941
|
)
|
59,511,677
|
|
35,967,006
|
|
||||||||||||
|
Olympus Towers
|
Seattle, WA
|
G
|
2000
|
328
|
|
14,752,034
|
|
73,335,425
|
|
7,047,844
|
|
14,752,034
|
|
80,383,269
|
|
95,135,303
|
|
(33,557,234
|
)
|
61,578,069
|
|
49,875,780
|
|
||||||||||||
|
Park Place at San Mateo (fka San Mateo)
|
San Mateo, CA
|
G
|
2001
|
575
|
|
71,900,000
|
|
211,907,141
|
|
6,896,968
|
|
71,900,000
|
|
218,804,109
|
|
290,704,109
|
|
(30,601,516
|
)
|
260,102,593
|
|
(L)
|
|
||||||||||||
|
Providence
|
Bothell, WA
|
—
|
2000
|
200
|
|
3,573,621
|
|
19,055,505
|
|
1,082,155
|
|
3,573,621
|
|
20,137,660
|
|
23,711,281
|
|
(8,760,511
|
)
|
14,950,770
|
|
(I)
|
|
||||||||||||
|
Reserve at Clarendon Centre, The
|
Arlington, VA
|
G
|
2003
|
252
|
|
10,500,000
|
|
52,812,935
|
|
4,001,480
|
|
10,500,000
|
|
56,814,415
|
|
67,314,415
|
|
(24,499,908
|
)
|
42,814,507
|
|
(J)
|
|
||||||||||||
|
Reserve at Eisenhower, The
|
Alexandria, VA
|
—
|
2002
|
226
|
|
6,500,000
|
|
34,585,060
|
|
1,518,215
|
|
6,500,000
|
|
36,103,275
|
|
42,603,275
|
|
(16,514,637
|
)
|
26,088,638
|
|
(J)
|
|
||||||||||||
|
Reserve at Empire Lakes
|
Rancho Cucamonga, CA
|
—
|
2005
|
467
|
|
16,345,000
|
|
73,080,670
|
|
2,428,206
|
|
16,345,000
|
|
75,508,876
|
|
91,853,876
|
|
(28,451,308
|
)
|
63,402,568
|
|
(I)
|
|
||||||||||||
|
Reserve at Fairfax Corner
|
Fairfax, VA
|
—
|
2001
|
652
|
|
15,804,057
|
|
63,129,050
|
|
9,196,688
|
|
15,804,057
|
|
72,325,738
|
|
88,129,795
|
|
(32,718,387
|
)
|
55,411,408
|
|
84,778,876
|
|
||||||||||||
|
Rianna II
|
Seattle, WA
|
G
|
2002
|
78
|
|
2,161,840
|
|
14,433,614
|
|
317,548
|
|
2,161,840
|
|
14,751,162
|
|
16,913,002
|
|
(4,197,329
|
)
|
12,715,673
|
|
9,428,447
|
|
||||||||||||
|
Rockingham Glen
|
West Roxbury, MA
|
—
|
1974
|
143
|
|
1,124,217
|
|
7,515,160
|
|
2,290,553
|
|
1,124,217
|
|
9,805,713
|
|
10,929,930
|
|
(5,551,551
|
)
|
5,378,379
|
|
523,346
|
|
||||||||||||
|
Siena Terrace
|
Lake Forest, CA
|
—
|
1988
|
356
|
|
8,900,000
|
|
24,083,024
|
|
6,763,521
|
|
8,900,000
|
|
30,846,545
|
|
39,746,545
|
|
(17,527,179
|
)
|
22,219,366
|
|
38,440,808
|
|
||||||||||||
|
Skyview
|
Rancho Santa Margarita, CA
|
—
|
1999
|
260
|
|
3,380,000
|
|
21,952,863
|
|
4,360,171
|
|
3,380,000
|
|
26,313,034
|
|
29,693,034
|
|
(14,316,970
|
)
|
15,376,064
|
|
30,889,928
|
|
||||||||||||
|
SoMa Square Apartments (fka South Market)
|
San Francisco, CA
|
G
|
1986
|
410
|
|
79,900,000
|
|
177,316,977
|
|
4,252,808
|
|
79,900,000
|
|
181,569,785
|
|
261,469,785
|
|
(25,190,244
|
)
|
236,279,541
|
|
(L)
|
|
||||||||||||
|
Summerset Village
|
Chatsworth, CA
|
—
|
1985
|
280
|
|
2,629,804
|
|
23,670,889
|
|
7,129,137
|
|
2,629,804
|
|
30,800,026
|
|
33,429,830
|
|
(19,917,548
|
)
|
13,512,282
|
|
38,039,912
|
|
||||||||||||
|
Talleyrand
|
Tarrytown, NY
|
—
|
1997-1998
|
300
|
|
12,000,000
|
|
49,838,160
|
|
4,916,190
|
|
12,000,000
|
|
54,754,350
|
|
66,754,350
|
|
(27,823,399
|
)
|
38,930,951
|
|
35,000,000
|
|
||||||||||||
|
Teresina
|
Chula Vista, CA
|
—
|
2000
|
440
|
|
28,600,000
|
|
61,916,670
|
|
2,749,599
|
|
28,600,000
|
|
64,666,269
|
|
93,266,269
|
|
(25,093,215
|
)
|
68,173,054
|
|
40,302,570
|
|
||||||||||||
|
Toscana
|
Irvine, CA
|
—
|
1991/1993
|
563
|
|
39,410,000
|
|
50,806,072
|
|
9,924,622
|
|
39,410,000
|
|
60,730,694
|
|
100,140,694
|
|
(32,579,537
|
)
|
67,561,157
|
|
71,243,194
|
|
||||||||||||
|
Touriel Building
|
Berkeley, CA
|
G
|
2004
|
35
|
|
2,736,000
|
|
7,810,027
|
|
175,855
|
|
2,736,000
|
|
7,985,882
|
|
10,721,882
|
|
(2,797,420
|
)
|
7,924,462
|
|
5,050,000
|
|
||||||||||||
|
Town Square at Mark Center I (fka Millbrook I)
|
Alexandria, VA
|
—
|
1996
|
406
|
|
24,360,000
|
|
86,178,714
|
|
3,521,624
|
|
24,360,000
|
|
89,700,338
|
|
114,060,338
|
|
(34,753,726
|
)
|
79,306,612
|
|
77,353,222
|
|
||||||||||||
|
Versailles
|
Woodland Hills, CA
|
—
|
1991
|
253
|
|
12,650,000
|
|
33,656,292
|
|
5,804,577
|
|
12,650,000
|
|
39,460,869
|
|
52,110,869
|
|
(18,318,859
|
)
|
33,792,010
|
|
30,372,953
|
|
||||||||||||
|
Versailles (K-Town)
|
Los Angeles, CA
|
—
|
2008
|
225
|
|
10,590,975
|
|
44,409,025
|
|
1,300,111
|
|
10,590,975
|
|
45,709,136
|
|
56,300,111
|
|
(12,641,215
|
)
|
43,658,896
|
|
29,826,475
|
|
||||||||||||
|
Victor on Venice
|
Los Angeles, CA
|
G
|
2006
|
115
|
|
10,350,000
|
|
35,433,437
|
|
535,196
|
|
10,350,000
|
|
35,968,633
|
|
46,318,633
|
|
(12,337,193
|
)
|
33,981,440
|
|
(J)
|
|
||||||||||||
|
Vintage
|
Ontario, CA
|
—
|
2005-2007
|
300
|
|
7,059,230
|
|
47,677,762
|
|
808,672
|
|
7,059,230
|
|
48,486,434
|
|
55,545,664
|
|
(17,191,840
|
)
|
38,353,824
|
|
33,000,000
|
|
||||||||||||
|
Vintage at 425 Broadway (fka Promenade)
|
Santa Monica, CA
|
G
|
1934/2001
|
58
|
|
9,000,000
|
|
13,961,523
|
|
539,897
|
|
9,000,000
|
|
14,501,420
|
|
23,501,420
|
|
(2,424,132
|
)
|
21,077,288
|
|
(L)
|
|
||||||||||||
|
Water Park Towers
|
Arlington, VA
|
—
|
1989
|
362
|
|
34,400,000
|
|
108,485,859
|
|
4,832,524
|
|
34,400,000
|
|
113,318,383
|
|
147,718,383
|
|
(16,327,687
|
)
|
131,390,696
|
|
(K)
|
|
||||||||||||
|
West 54th
|
New York, NY
|
G
|
2001
|
222
|
|
60,900,000
|
|
48,193,837
|
|
605,010
|
|
60,900,000
|
|
48,798,847
|
|
109,698,847
|
|
(9,079,353
|
)
|
100,619,494
|
|
47,327,897
|
|
||||||||||||
|
Westgate (fka Westgate I)
|
Pasadena, CA
|
—
|
2010
|
480
|
|
22,898,848
|
|
133,559,573
|
|
808,874
|
|
22,898,848
|
|
134,368,447
|
|
157,267,295
|
|
(23,243,923
|
)
|
134,023,372
|
|
96,935,000
|
|
||||||||||||
|
Woodleaf
|
Campbell, CA
|
—
|
1984
|
178
|
|
8,550,600
|
|
16,988,183
|
|
4,380,543
|
|
8,550,600
|
|
21,368,726
|
|
29,919,326
|
|
(12,368,124
|
)
|
17,551,202
|
|
17,858,854
|
|
||||||||||||
|
Portfolio/Entity Encumbrances (1)
|
|
|
|
|
|
|
|
|
|
|
|
|
|
|
|
|
|
|
|
|
|
2,088,177,000
|
|
||||||||||||
|
Investment in Real Estate –Wholly Owned Encumbered
|
|
|
|
23,686
|
|
1,688,383,769
|
|
5,069,221,671
|
|
297,359,218
|
|
1,688,383,769
|
|
5,366,580,889
|
|
7,054,964,658
|
|
(1,464,311,726
|
)
|
5,590,652,932
|
|
4,220,456,586
|
|
||||||||||||
|
|
|||||||||||||||||||||||||||||||||||
|
Investment in Real Estate – Partially Owned Unencumbered:
|
|||||||||||||||||||||||||||||||||||
|
2300 Elliott
|
Seattle, WA
|
—
|
1992
|
92
|
|
796,800
|
|
7,173,725
|
|
6,320,524
|
|
796,800
|
|
13,494,249
|
|
14,291,049
|
|
(10,068,231
|
)
|
4,222,818
|
|
—
|
|
||||||||||||
|
Canyon Ridge
|
San Diego, CA
|
—
|
1989
|
162
|
|
4,869,448
|
|
11,955,064
|
|
3,497,193
|
|
4,869,448
|
|
15,452,257
|
|
20,321,705
|
|
(9,266,022
|
)
|
11,055,683
|
|
—
|
|
||||||||||||
|
Country Oaks
|
Agoura Hills, CA
|
—
|
1985
|
256
|
|
6,105,000
|
|
29,561,865
|
|
5,290,585
|
|
6,105,000
|
|
34,852,450
|
|
40,957,450
|
|
(16,944,551
|
)
|
24,012,899
|
|
—
|
|
||||||||||||
|
Fox Ridge
|
Englewood, CO
|
—
|
1984
|
300
|
|
2,490,000
|
|
17,522,114
|
|
4,823,697
|
|
2,490,000
|
|
22,345,811
|
|
24,835,811
|
|
(12,642,142
|
)
|
12,193,669
|
|
—
|
|
||||||||||||
S-10
EQUITY RESIDENTIAL
ERP OPERATING LIMITED PARTNERSHIP
Schedule III - Real Estate and Accumulated Depreciation
December 31, 2015
|
Description
|
|
Initial Cost to Company
|
Cost Capitalized Subsequent to Acquisition(Improvements, net) (E)
|
Gross Amount Carried at Close of Period 12/31/15
|
|
|
|
|
||||||||||||||||||||||||||||||||||||
|
Apartment Name
|
Location
|
Retail/Commercial Space
|
Date of Construction
|
Apartment Units (H)
|
Land
|
Building & Fixtures
|
Building & Fixtures
|
Land
|
Building & Fixtures (A)
|
Total (B)
|
Accumulated Depreciation (C)
|
Investment in Real Estate, Net at 12/31/15 (B)
|
Encumbrances
|
|||||||||||||||||||||||||||||||
|
Monterra in Mill Creek
|
Mill Creek, WA
|
—
|
2003
|
139
|
|
2,800,000
|
|
13,255,123
|
|
787,359
|
|
2,800,000
|
|
14,042,482
|
|
16,842,482
|
|
(5,598,815
|
)
|
11,243,667
|
|
—
|
|
|||||||||||||||||||||
|
Rosecliff
|
Quincy, MA
|
—
|
1990
|
156
|
|
5,460,000
|
|
15,721,570
|
|
2,934,091
|
|
5,460,000
|
|
18,655,661
|
|
24,115,661
|
|
(10,612,838
|
)
|
13,502,823
|
|
—
|
|
|||||||||||||||||||||
|
Strayhorse at Arrowhead Ranch
|
Glendale, AZ
|
—
|
1998
|
136
|
|
4,400,000
|
|
12,968,002
|
|
627,934
|
|
4,400,000
|
|
13,595,936
|
|
17,995,936
|
|
(5,287,150
|
)
|
12,708,786
|
|
—
|
|
|||||||||||||||||||||
|
Via Ventura (CA) (fka Ventura)
|
Ventura, CA
|
—
|
2002
|
192
|
|
8,600,000
|
|
44,308,202
|
|
542,226
|
|
8,600,000
|
|
44,850,428
|
|
53,450,428
|
|
(7,114,728
|
)
|
46,335,700
|
|
—
|
|
|||||||||||||||||||||
|
Wood Creek II (fka Willow Brook (CA))
|
Pleasant Hill, CA
|
—
|
1985
|
228
|
|
5,055,000
|
|
38,388,672
|
|
5,892,178
|
|
5,055,000
|
|
44,280,850
|
|
49,335,850
|
|
(18,496,598
|
)
|
30,839,252
|
|
—
|
|
|||||||||||||||||||||
|
Investment in Real Estate – Partially Owned Unencumbered
|
|
|
|
1,661
|
|
40,576,248
|
|
190,854,337
|
|
30,715,787
|
|
40,576,248
|
|
221,570,124
|
|
262,146,372
|
|
(96,031,075
|
)
|
166,115,297
|
|
—
|
|
|||||||||||||||||||||
|
|
|
|
|
|
|
|
|
|
|
|
|
|
|
|
|
|
|
|
|
|
|
|
|
|||||||||||||||||||||
|
Investment in Real Estate – Partially Owned Encumbered:
|
|
|
|
|
|
|
|
|
|
|
|
|
|
|
|
|
|
|
|
|
|
|
|
|||||||||||||||||||||
|
Bellevue Meadows
|
Bellevue, WA
|
—
|
1983
|
180
|
|
4,507,100
|
|
12,574,814
|
|
4,683,238
|
|
4,507,100
|
|
17,258,052
|
|
21,765,152
|
|
(11,286,126
|
)
|
10,479,026
|
|
16,538,000
|
|
|||||||||||||||||||||
|
Canyon Creek (CA)
|
San Ramon, CA
|
—
|
1984
|
268
|
|
5,425,000
|
|
18,812,121
|
|
6,531,309
|
|
5,425,000
|
|
25,343,430
|
|
30,768,430
|
|
(13,863,495
|
)
|
16,904,935
|
|
28,200,000
|
|
|||||||||||||||||||||
|
Harrison Square (fka Elliot Bay)
|
Seattle, WA
|
G
|
1992
|
166
|
|
7,600,000
|
|
35,844,345
|
|
4,610,519
|
|
7,600,000
|
|
40,454,864
|
|
48,054,864
|
|
(5,597,458
|
)
|
42,457,406
|
|
(K)
|
|
|||||||||||||||||||||
|
Isle at Arrowhead Ranch
|
Glendale, AZ
|
—
|
1996
|
256
|
|
1,650,237
|
|
19,593,123
|
|
2,399,270
|
|
1,650,237
|
|
21,992,393
|
|
23,642,630
|
|
(13,781,305
|
)
|
9,861,325
|
|
17,700,000
|
|
|||||||||||||||||||||
|
Lantern Cove
|
Foster City, CA
|
—
|
1985
|
232
|
|
6,945,000
|
|
23,064,976
|
|
5,882,314
|
|
6,945,000
|
|
28,947,290
|
|
35,892,290
|
|
(14,983,809
|
)
|
20,908,481
|
|
36,455,000
|
|
|||||||||||||||||||||
|
Schooner Bay I
|
Foster City, CA
|
—
|
1985
|
168
|
|
5,345,000
|
|
20,390,618
|
|
4,890,277
|
|
5,345,000
|
|
25,280,895
|
|
30,625,895
|
|
(13,022,386
|
)
|
17,603,509
|
|
28,870,000
|
|
|||||||||||||||||||||
|
Schooner Bay II
|
Foster City, CA
|
—
|
1985
|
144
|
|
4,550,000
|
|
18,064,764
|
|
4,365,840
|
|
4,550,000
|
|
22,430,604
|
|
26,980,604
|
|
(11,706,487
|
)
|
15,274,117
|
|
26,175,000
|
|
|||||||||||||||||||||
|
Surrey Downs
|
Bellevue, WA
|
—
|
1986
|
122
|
|
3,057,100
|
|
7,848,618
|
|
2,498,023
|
|
3,057,100
|
|
10,346,641
|
|
13,403,741
|
|
(6,441,879
|
)
|
6,961,862
|
|
9,829,000
|
|
|||||||||||||||||||||
|
Virgil Square
|
Los Angeles, CA
|
—
|
1979
|
142
|
|
5,500,000
|
|
15,216,613
|
|
2,643,870
|
|
5,500,000
|
|
17,860,483
|
|
23,360,483
|
|
(7,233,630
|
)
|
16,126,853
|
|
9,900,000
|
|
|||||||||||||||||||||
|
Wisconsin Place
|
Chevy Chase, MD
|
—
|
2009
|
432
|
|
—
|
|
172,089,355
|
|
844,523
|
|
—
|
|
172,933,878
|
|
172,933,878
|
|
(22,749,424
|
)
|
150,184,454
|
|
145,538,053
|
|
|||||||||||||||||||||
|
Portfolio/Entity Encumbrances (1)
|
|
|
|
|
|
|
|
|
|
|
|
|
|
|
|
|
|
|
|
|
|
24,223,525
|
|
|||||||||||||||||||||
|
Investment in Real Estate – Partially Owned Encumbered
|
|
|
|
2,110
|
|
44,579,437
|
|
343,499,347
|
|
39,349,183
|
|
44,579,437
|
|
382,848,530
|
|
427,427,967
|
|
(120,665,999
|
)
|
306,761,968
|
|
343,428,578
|
|
|||||||||||||||||||||
|
|
|
|
|
|
|
|
|
|
|
|
|
|
|
|
|
|
|
|
|
|
|
|
|
|||||||||||||||||||||
|
Total Investment in Real Estate
|
|
|
|
79,970
|
|
$
|
6,269,047,529
|
|
$
|
17,690,868,530
|
|
$
|
1,222,435,520
|
|
$
|
6,269,047,529
|
|
$
|
18,913,304,050
|
|
$
|
25,182,351,579
|
|
$
|
(4,905,406,012
|
)
|
$
|
20,276,945,567
|
|
$
|
4,563,885,164
|
|
||||||||||||
|
Real Estate Held For Sale – Wholly Owned Unencumbered:
|
||||||||||||||||||||||||||||||||||||||||||||
|
Ashton, The
|
Corona Hills, CA
|
—
|
1986
|
492
|
|
$
|
2,594,264
|
|
$
|
33,042,397
|
|
$
|
7,170,917
|
|
$
|
2,594,264
|
|
$
|
40,213,314
|
|
$
|
42,807,578
|
|
$
|
(26,113,974
|
)
|
$
|
16,693,604
|
|
$
|
—
|
|
||||||||||||
|
Ball Park Lofts
|
Denver, CO
|
G
|
2003
|
354
|
|
5,481,556
|
|
51,658,741
|
|
4,998,907
|
|
5,481,556
|
|
56,657,648
|
|
62,139,204
|
|
(23,327,439
|
)
|
38,811,765
|
|
—
|
|
|||||||||||||||||||||
|
Bella Terra
|
Mukilteo, WA
|
G
|
2002
|
235
|
|
5,686,861
|
|
26,070,540
|
|
1,295,675
|
|
5,686,861
|
|
27,366,215
|
|
33,053,076
|
|
(11,731,682
|
)
|
21,321,394
|
|
—
|
|
|||||||||||||||||||||
|
Brookside (CO)
|
Boulder, CO
|
—
|
1993
|
144
|
|
3,600,400
|
|
10,211,159
|
|
2,816,110
|
|
3,600,400
|
|
13,027,269
|
|
16,627,669
|
|
(7,756,394
|
)
|
8,871,275
|
|
—
|
|
|||||||||||||||||||||
|
Canterbury
|
Germantown, MD
|
—
|
1986
|
544
|
|
2,781,300
|
|
32,942,531
|
|
15,962,268
|
|
2,781,300
|
|
48,904,799
|
|
51,686,099
|
|
(35,090,051
|
)
|
16,596,048
|
|
—
|
|
|||||||||||||||||||||
|
Cierra Crest
|
Denver, CO
|
—
|
1996
|
480
|
|
4,803,100
|
|
34,894,898
|
|
6,013,381
|
|
4,803,100
|
|
40,908,279
|
|
45,711,379
|
|
(25,673,488
|
)
|
20,037,891
|
|
—
|
|
|||||||||||||||||||||
|
Coconut Palm Club
|
Coconut Creek, FL
|
—
|
1992
|
301
|
|
3,001,700
|
|
17,678,928
|
|
4,535,698
|
|
3,001,700
|
|
22,214,626
|
|
25,216,326
|
|
(13,648,954
|
)
|
11,567,372
|
|
—
|
|
|||||||||||||||||||||
|
Colorado Pointe
|
Denver, CO
|
—
|
2006
|
193
|
|
5,790,000
|
|
28,815,607
|
|
841,854
|
|
5,790,000
|
|
29,657,461
|
|
35,447,461
|
|
(11,304,894
|
)
|
24,142,567
|
|
—
|
|
|||||||||||||||||||||
|
Copper Canyon
|
Highlands Ranch, CO
|
—
|
1999
|
222
|
|
1,442,212
|
|
16,251,114
|
|
1,889,129
|
|
1,442,212
|
|
18,140,243
|
|
19,582,455
|
|
(10,551,851
|
)
|
9,030,604
|
|
—
|
|
|||||||||||||||||||||
|
Cove at Boynton Beach I
|
Boynton Beach, FL
|
—
|
1996
|
252
|
|
12,600,000
|
|
31,469,651
|
|
5,894,856
|
|
12,600,000
|
|
37,364,507
|
|
49,964,507
|
|
(16,614,767
|
)
|
33,349,740
|
|
—
|
|
|||||||||||||||||||||
|
Cove at Boynton Beach II
|
Boynton Beach, FL
|
—
|
1998
|
296
|
|
14,800,000
|
|
37,874,719
|
|
—
|
|
14,800,000
|
|
37,874,719
|
|
52,674,719
|
|
(15,535,094
|
)
|
37,139,625
|
|
—
|
|
|||||||||||||||||||||
|
Dartmouth Woods
|
Lakewood, CO
|
—
|
1990
|
201
|
|
1,609,800
|
|
10,832,754
|
|
2,604,325
|
|
1,609,800
|
|
13,437,079
|
|
15,046,879
|
|
(8,898,931
|
)
|
6,147,948
|
|
—
|
|
|||||||||||||||||||||
|
Deerwood (Corona)
|
Corona, CA
|
—
|
1992
|
316
|
|
4,742,200
|
|
20,272,892
|
|
4,574,232
|
|
4,742,200
|
|
24,847,124
|
|
29,589,324
|
|
(16,204,547
|
)
|
13,384,777
|
|
—
|
|
|||||||||||||||||||||
|
Enclave at Waterways
|
Deerfield Beach, FL
|
—
|
1998
|
300
|
|
15,000,000
|
|
33,194,576
|
|
2,148,558
|
|
15,000,000
|
|
35,343,134
|
|
50,343,134
|
|
(14,572,103
|
)
|
35,771,031
|
|
—
|
|
|||||||||||||||||||||
|
Enclave at Winston Park
|
Coconut Creek, FL
|
—
|
1995
|
278
|
|
5,560,000
|
|
19,939,324
|
|
5,738,870
|
|
5,560,000
|
|
25,678,194
|
|
31,238,194
|
|
(12,419,692
|
)
|
18,818,502
|
|
—
|
|
|||||||||||||||||||||
|
Estates at Tanglewood
|
Westminster, CO
|
—
|
2003
|
504
|
|
7,560,000
|
|
51,256,538
|
|
3,230,043
|
|
7,560,000
|
|
54,486,581
|
|
62,046,581
|
|
(21,626,401
|
)
|
40,420,180
|
|
—
|
|
|||||||||||||||||||||
|
Estates at Wellington Green
|
Wellington, FL
|
—
|
2003
|
400
|
|
20,000,000
|
|
64,790,850
|
|
2,718,719
|
|
20,000,000
|
|
67,509,569
|
|
87,509,569
|
|
(26,657,478
|
)
|
60,852,091
|
|
—
|
|
|||||||||||||||||||||
|
Gables Grand Plaza
|
Coral Gables, FL
|
G
|
1998
|
195
|
|
—
|
|
44,601,000
|
|
7,472,911
|
|
—
|
|
52,073,911
|
|
52,073,911
|
|
(22,657,292
|
)
|
29,416,619
|
|
—
|
|
|||||||||||||||||||||
|
Gatehouse at Pine Lake
|
Pembroke Pines, FL
|
—
|
1990
|
296
|
|
1,896,600
|
|
17,070,795
|
|
7,166,800
|
|
1,896,600
|
|
24,237,595
|
|
26,134,195
|
|
(15,313,088
|
)
|
10,821,107
|
|
—
|
|
|||||||||||||||||||||
|
Gatehouse on the Green
|
Plantation, FL
|
—
|
1990
|
312
|
|
2,228,200
|
|
20,056,270
|
|
8,683,372
|
|
2,228,200
|
|
28,739,642
|
|
30,967,842
|
|
(18,755,567
|
)
|
12,212,275
|
|
—
|
|
|||||||||||||||||||||
|
Governors Green
|
Bowie, MD
|
—
|
1999
|
478
|
|
19,845,000
|
|
73,335,916
|
|
1,718,594
|
|
19,845,000
|
|
75,054,510
|
|
94,899,510
|
|
(25,022,239
|
)
|
69,877,271
|
|
—
|
|
|||||||||||||||||||||
|
Greenwood Park
|
Centennial, CO
|
—
|
1994
|
291
|
|
4,365,000
|
|
38,372,440
|
|
4,824,526
|
|
4,365,000
|
|
43,196,966
|
|
47,561,966
|
|
(14,493,439
|
)
|
33,068,527
|
|
—
|
|
|||||||||||||||||||||
|
Greenwood Plaza
|
Centennial, CO
|
—
|
1996
|
266
|
|
3,990,000
|
|
35,846,708
|
|
3,827,653
|
|
3,990,000
|
|
39,674,361
|
|
43,664,361
|
|
(13,920,511
|
)
|
29,743,850
|
|
—
|
|
|||||||||||||||||||||
|
Hammocks Place
|
Miami, FL
|
—
|
1986
|
296
|
|
319,180
|
|
12,513,467
|
|
6,386,783
|
|
319,180
|
|
18,900,250
|
|
19,219,430
|
|
(13,303,869
|
)
|
5,915,561
|
|
—
|
|
|||||||||||||||||||||
S-11
EQUITY RESIDENTIAL
ERP OPERATING LIMITED PARTNERSHIP
Schedule III - Real Estate and Accumulated Depreciation
December 31, 2015
|
Description
|
|
Initial Cost to Company
|
Cost Capitalized Subsequent to Acquisition(Improvements, net) (E)
|
Gross Amount Carried at Close of Period 12/31/15
|
|
|
|
|
|||||||||||||||||||||||||||
|
Apartment Name
|
Location
|
Retail/Commercial Space
|
Date of Construction
|
Apartment Units (H)
|
Land
|
Building & Fixtures
|
Building & Fixtures
|
Land
|
Building & Fixtures (A)
|
Total (B)
|
Accumulated Depreciation (C)
|
Investment in Real Estate, Net at 12/31/15 (B)
|
Encumbrances
|
||||||||||||||||||||||
|
Heronfield
|
Kirkland, WA
|
—
|
1990
|
202
|
|
9,245,000
|
|
27,017,749
|
|
3,960,441
|
|
9,245,000
|
|
30,978,190
|
|
40,223,190
|
|
(10,665,598
|
)
|
29,557,592
|
|
—
|
|
||||||||||||
|
Huntington Park
|
Everett, WA
|
—
|
1991
|
381
|
|
1,597,500
|
|
14,367,864
|
|
5,651,504
|
|
1,597,500
|
|
20,019,368
|
|
21,616,868
|
|
(14,833,511
|
)
|
6,783,357
|
|
—
|
|
||||||||||||
|
Kings Colony (FL)
|
Miami, FL
|
—
|
1986
|
480
|
|
19,200,000
|
|
48,379,586
|
|
7,396,307
|
|
19,200,000
|
|
55,775,893
|
|
74,975,893
|
|
(21,996,506
|
)
|
52,979,387
|
|
—
|
|
||||||||||||
|
Landings at Pembroke Lakes
|
Pembroke Pines, FL
|
—
|
1989
|
358
|
|
17,900,000
|
|
24,460,989
|
|
5,536,019
|
|
17,900,000
|
|
29,997,008
|
|
47,897,008
|
|
(14,056,557
|
)
|
33,840,451
|
|
—
|
|
||||||||||||
|
Legacy at Highlands Ranch
|
Highlands Ranch, CO
|
—
|
1999
|
422
|
|
6,330,000
|
|
37,557,013
|
|
2,837,915
|
|
6,330,000
|
|
40,394,928
|
|
46,724,928
|
|
(16,768,231
|
)
|
29,956,697
|
|
—
|
|
||||||||||||
|
Marquessa
|
Corona Hills, CA
|
—
|
1992
|
336
|
|
6,888,500
|
|
21,604,584
|
|
3,578,245
|
|
6,888,500
|
|
25,182,829
|
|
32,071,329
|
|
(16,010,773
|
)
|
16,060,556
|
|
—
|
|
||||||||||||
|
Martine, The
|
Bellevue, WA
|
—
|
1984
|
67
|
|
3,200,000
|
|
9,616,264
|
|
3,314,595
|
|
3,200,000
|
|
12,930,859
|
|
16,130,859
|
|
(5,125,452
|
)
|
11,005,407
|
|
—
|
|
||||||||||||
|
Midtown 24
|
Plantation, FL
|
G
|
2010
|
248
|
|
10,129,900
|
|
58,770,100
|
|
1,836,209
|
|
10,129,900
|
|
60,606,309
|
|
70,736,209
|
|
(13,083,451
|
)
|
57,652,758
|
|
—
|
|
||||||||||||
|
Miramar Lakes
|
Miramar, FL
|
—
|
2003
|
344
|
|
17,200,000
|
|
51,487,235
|
|
2,701,577
|
|
17,200,000
|
|
54,188,812
|
|
71,388,812
|
|
(20,915,774
|
)
|
50,473,038
|
|
—
|
|
||||||||||||
|
Mosaic at Largo Station
|
Hyattsville, MD
|
—
|
2008
|
242
|
|
4,120,800
|
|
42,477,297
|
|
733,047
|
|
4,120,800
|
|
43,210,344
|
|
47,331,144
|
|
(12,991,703
|
)
|
34,339,441
|
|
—
|
|
||||||||||||
|
New River Cove
|
Davie, FL
|
—
|
1999
|
316
|
|
15,800,000
|
|
46,142,895
|
|
4,122,060
|
|
15,800,000
|
|
50,264,955
|
|
66,064,955
|
|
(18,729,270
|
)
|
47,335,685
|
|
—
|
|
||||||||||||
|
Northlake (MD)
|
Germantown, MD
|
—
|
1985
|
304
|
|
15,000,000
|
|
23,142,302
|
|
10,395,369
|
|
15,000,000
|
|
33,537,671
|
|
48,537,671
|
|
(17,973,600
|
)
|
30,564,071
|
|
—
|
|
||||||||||||
|
Oak Mill I
|
Germantown, MD
|
—
|
1984
|
208
|
|
10,000,000
|
|
13,155,522
|
|
7,759,098
|
|
10,000,000
|
|
20,914,620
|
|
30,914,620
|
|
(11,568,469
|
)
|
19,346,151
|
|
—
|
|
||||||||||||
|
Oaks at Falls Church
|
Falls Church, VA
|
—
|
1966
|
176
|
|
20,240,000
|
|
20,152,616
|
|
4,074,265
|
|
20,240,000
|
|
24,226,881
|
|
44,466,881
|
|
(10,342,378
|
)
|
34,124,503
|
|
—
|
|
||||||||||||
|
Oasis at Delray Beach I
|
Delray Beach, FL
|
—
|
1999
|
196
|
|
5,900,000
|
|
25,150,766
|
|
1,433,675
|
|
5,900,000
|
|
26,584,441
|
|
32,484,441
|
|
(4,654,230
|
)
|
27,830,211
|
|
—
|
|
||||||||||||
|
Oasis at Delray Beach II
|
Delray Beach, FL
|
—
|
2013
|
128
|
|
3,840,000
|
|
18,144,955
|
|
20,701
|
|
3,840,000
|
|
18,165,656
|
|
22,005,656
|
|
(1,983,415
|
)
|
20,022,241
|
|
—
|
|
||||||||||||
|
Orchard Ridge
|
Lynnwood, WA
|
—
|
1988
|
104
|
|
480,600
|
|
4,372,033
|
|
1,713,611
|
|
480,600
|
|
6,085,644
|
|
6,566,244
|
|
(4,401,110
|
)
|
2,165,134
|
|
—
|
|
||||||||||||
|
Palm Trace Landings
|
Davie, FL
|
—
|
1995
|
768
|
|
38,400,000
|
|
105,693,432
|
|
5,925,125
|
|
38,400,000
|
|
111,618,557
|
|
150,018,557
|
|
(42,732,227
|
)
|
107,286,330
|
|
—
|
|
||||||||||||
|
Park Aire
|
Wellington, FL
|
—
|
2014
|
268
|
|
8,000,000
|
|
40,908,756
|
|
30,706
|
|
8,000,000
|
|
40,939,462
|
|
48,939,462
|
|
(3,974,911
|
)
|
44,964,551
|
|
—
|
|
||||||||||||
|
Park at Turtle Run, The
|
Coral Springs, FL
|
—
|
2001
|
257
|
|
15,420,000
|
|
36,064,629
|
|
1,581,233
|
|
15,420,000
|
|
37,645,862
|
|
53,065,862
|
|
(15,394,768
|
)
|
37,671,094
|
|
—
|
|
||||||||||||
|
Parkfield
|
Denver, CO
|
—
|
2000
|
476
|
|
8,330,000
|
|
28,667,618
|
|
3,516,386
|
|
8,330,000
|
|
32,184,004
|
|
40,514,004
|
|
(17,050,355
|
)
|
23,463,649
|
|
—
|
|
||||||||||||
|
Preserve at Deer Creek
|
Deerfield Beach, FL
|
—
|
1997
|
540
|
|
13,500,000
|
|
60,011,208
|
|
11,825,179
|
|
13,500,000
|
|
71,836,387
|
|
85,336,387
|
|
(30,159,581
|
)
|
55,176,806
|
|
—
|
|
||||||||||||
|
Promenade at Aventura
|
Aventura, FL
|
—
|
1995
|
296
|
|
13,320,000
|
|
30,353,748
|
|
7,204,516
|
|
13,320,000
|
|
37,558,264
|
|
50,878,264
|
|
(19,909,831
|
)
|
30,968,433
|
|
—
|
|
||||||||||||
|
Promenade at Wyndham Lakes
|
Coral Springs, FL
|
—
|
1998
|
332
|
|
6,640,000
|
|
26,743,760
|
|
5,473,840
|
|
6,640,000
|
|
32,217,600
|
|
38,857,600
|
|
(17,398,951
|
)
|
21,458,649
|
|
—
|
|
||||||||||||
|
Red Road Commons
|
Miami, FL
|
G
|
2009
|
404
|
|
27,383,547
|
|
99,656,440
|
|
2,428,548
|
|
27,383,547
|
|
102,084,988
|
|
129,468,535
|
|
(21,124,597
|
)
|
108,343,938
|
|
—
|
|
||||||||||||
|
Reserve at Ashley Lake
|
Boynton Beach, FL
|
—
|
1990
|
440
|
|
3,520,400
|
|
23,332,494
|
|
7,187,407
|
|
3,520,400
|
|
30,519,901
|
|
34,040,301
|
|
(19,863,102
|
)
|
14,177,199
|
|
—
|
|
||||||||||||
|
Residences at Bayview
|
Pompano Beach, FL
|
G
|
2004
|
225
|
|
5,783,545
|
|
39,334,455
|
|
2,505,813
|
|
5,783,545
|
|
41,840,268
|
|
47,623,813
|
|
(10,722,402
|
)
|
36,901,411
|
|
—
|
|
||||||||||||
|
Reunion at Redmond Ridge (fka Redmond Ridge)
|
Redmond, WA
|
—
|
2008
|
321
|
|
6,975,705
|
|
46,175,001
|
|
433,219
|
|
6,975,705
|
|
46,608,220
|
|
53,583,925
|
|
(12,707,487
|
)
|
40,876,438
|
|
—
|
|
||||||||||||
|
Sabal Pointe
|
Coral Springs, FL
|
—
|
1995
|
276
|
|
1,951,600
|
|
17,570,508
|
|
7,530,196
|
|
1,951,600
|
|
25,100,704
|
|
27,052,304
|
|
(16,637,960
|
)
|
10,414,344
|
|
—
|
|
||||||||||||
|
Sage
|
Everett, WA
|
—
|
2002
|
123
|
|
2,500,000
|
|
12,021,256
|
|
765,735
|
|
2,500,000
|
|
12,786,991
|
|
15,286,991
|
|
(5,027,121
|
)
|
10,259,870
|
|
—
|
|
||||||||||||
|
Savoy at Dayton Station Combined
|
Aurora, CO
|
—
|
2001 & 2012
|
612
|
|
6,109,460
|
|
60,039,972
|
|
3,773,037
|
|
6,109,460
|
|
63,813,009
|
|
69,922,469
|
|
(22,049,623
|
)
|
47,872,846
|
|
—
|
|
||||||||||||
|
Scarborough Square
|
Rockville, MD
|
—
|
1967
|
121
|
|
1,815,000
|
|
7,608,126
|
|
3,166,139
|
|
1,815,000
|
|
10,774,265
|
|
12,589,265
|
|
(6,919,778
|
)
|
5,669,487
|
|
—
|
|
||||||||||||
|
Sheridan Lake Club
|
Dania Beach, FL
|
—
|
2001
|
240
|
|
12,000,000
|
|
23,170,580
|
|
2,068,143
|
|
12,000,000
|
|
25,238,723
|
|
37,238,723
|
|
(10,173,850
|
)
|
27,064,873
|
|
—
|
|
||||||||||||
|
Sheridan Ocean Club Combined
|
Dania Beach, FL
|
—
|
1991
|
648
|
|
18,313,414
|
|
47,091,594
|
|
17,913,370
|
|
18,313,414
|
|
65,004,964
|
|
83,318,378
|
|
(35,303,699
|
)
|
48,014,679
|
|
—
|
|
||||||||||||
|
St. Andrews at Winston Park
|
Coconut Creek, FL
|
—
|
1997
|
284
|
|
5,680,000
|
|
19,812,090
|
|
5,781,847
|
|
5,680,000
|
|
25,593,937
|
|
31,273,937
|
|
(12,410,235
|
)
|
18,863,702
|
|
—
|
|
||||||||||||
|
Stonegate (CO)
|
Broomfield, CO
|
—
|
2003
|
350
|
|
8,750,000
|
|
32,950,375
|
|
3,317,249
|
|
8,750,000
|
|
36,267,624
|
|
45,017,624
|
|
(14,957,918
|
)
|
30,059,706
|
|
—
|
|
||||||||||||
|
Village at Bear Creek
|
Lakewood, CO
|
—
|
1987
|
472
|
|
4,519,700
|
|
40,676,390
|
|
5,983,533
|
|
4,519,700
|
|
46,659,923
|
|
51,179,623
|
|
(29,814,286
|
)
|
21,365,337
|
|
—
|
|
||||||||||||
|
Waterford Place (CO)
|
Thornton, CO
|
—
|
1998
|
336
|
|
5,040,000
|
|
29,946,419
|
|
2,288,680
|
|
5,040,000
|
|
32,235,099
|
|
37,275,099
|
|
(14,679,394
|
)
|
22,595,705
|
|
—
|
|
||||||||||||
|
Welleby Lake Club
|
Sunrise, FL
|
—
|
1991
|
304
|
|
3,648,000
|
|
17,620,879
|
|
6,103,581
|
|
3,648,000
|
|
23,724,460
|
|
27,372,460
|
|
(14,461,774
|
)
|
12,910,686
|
|
—
|
|
||||||||||||
|
Westchester at Pavilions
|
Waldorf, MD
|
G
|
2009
|
491
|
|
11,900,000
|
|
89,612,465
|
|
674,086
|
|
11,900,000
|
|
90,286,551
|
|
102,186,551
|
|
(11,937,856
|
)
|
90,248,695
|
|
—
|
|
||||||||||||
|
Winston, The (FL)
|
Pembroke Pines, FL
|
—
|
2001/2003
|
464
|
|
18,561,000
|
|
49,527,569
|
|
3,675,757
|
|
18,561,000
|
|
53,203,326
|
|
71,764,326
|
|
(19,941,539
|
)
|
51,822,787
|
|
—
|
|
||||||||||||
|
Woodlake (WA)
|
Kirkland, WA
|
—
|
1984
|
288
|
|
6,631,400
|
|
16,735,484
|
|
6,286,086
|
|
6,631,400
|
|
23,021,570
|
|
29,652,970
|
|
(12,784,626
|
)
|
16,868,344
|
|
—
|
|
||||||||||||
|
Real Estate Held For Sale – Wholly Owned Unencumbered
|
|
|
|
21,494
|
|
571,462,444
|
|
2,250,318,833
|
|
297,018,230
|
|
571,462,444
|
|
2,547,337,063
|
|
3,118,799,507
|
|
(1,075,431,644
|
)
|
2,043,367,863
|
|
—
|
|
||||||||||||
S-12
EQUITY RESIDENTIAL
ERP OPERATING LIMITED PARTNERSHIP
Schedule III - Real Estate and Accumulated Depreciation
December 31, 2015
|
Description
|
|
Initial Cost to Company
|
Cost Capitalized Subsequent to Acquisition(Improvements, net) (E)
|
Gross Amount Carried at Close of Period 12/31/15
|
|
|
|
|
||||||||||||||||||||||||||||||||||||
|
Apartment Name
|
Location
|
Retail/Commercial Space
|
Date of Construction
|
Apartment Units (H)
|
Land
|
Building & Fixtures
|
Building & Fixtures
|
Land
|
Building & Fixtures (A)
|
Total (B)
|
Accumulated Depreciation (C)
|
Investment in Real Estate, Net at 12/31/15 (B)
|
Encumbrances
|
|||||||||||||||||||||||||||||||
|
Real Estate Held For Sale – Wholly Owned Encumbered:
|
||||||||||||||||||||||||||||||||||||||||||||
|
Marks
|
Englewood, CO
|
G
|
1987
|
616
|
|
4,928,500
|
|
44,622,314
|
|
11,819,156
|
|
4,928,500
|
|
56,441,470
|
|
61,369,970
|
|
(36,125,982
|
)
|
25,243,988
|
|
19,195,000
|
|
|||||||||||||||||||||
|
Oak Mill II
|
Germantown, MD
|
—
|
1985
|
192
|
|
854,133
|
|
10,233,947
|
|
6,696,831
|
|
854,133
|
|
16,930,778
|
|
17,784,911
|
|
(12,269,574
|
)
|
5,515,337
|
|
9,600,000
|
|
|||||||||||||||||||||
|
Stoney Ridge
|
Dale City, VA
|
—
|
1985
|
264
|
|
8,000,000
|
|
24,147,091
|
|
5,964,620
|
|
8,000,000
|
|
30,111,711
|
|
38,111,711
|
|
(14,096,604
|
)
|
24,015,107
|
|
13,000,000
|
|
|||||||||||||||||||||
|
Uptown Square
|
Denver, CO
|
G
|
1999/2001
|
696
|
|
17,492,000
|
|
100,696,541
|
|
6,090,227
|
|
17,492,000
|
|
106,786,768
|
|
124,278,768
|
|
(41,286,496
|
)
|
82,992,272
|
|
99,190,116
|
|
|||||||||||||||||||||
|
Real Estate Held For Sale – Wholly Owned Encumbered
|
1,768
|
|
31,274,633
|
|
179,699,893
|
|
30,570,834
|
|
31,274,633
|
|
210,270,727
|
|
241,545,360
|
|
(103,778,656
|
)
|
137,766,704
|
|
140,985,116
|
|
||||||||||||||||||||||||
|
Total Real Estate Held For Sale
|
23,262
|
|
$
|
602,737,077
|
|
$
|
2,430,018,726
|
|
$
|
327,589,064
|
|
$
|
602,737,077
|
|
$
|
2,757,607,790
|
|
$
|
3,360,344,867
|
|
$
|
(1,179,210,300
|
)
|
$
|
2,181,134,567
|
|
$
|
140,985,116
|
|
|||||||||||||||
|
Total Investment in Real Estate and Real Estate Held For Sale
|
103,232
|
|
$
|
6,871,784,606
|
|
$
|
20,120,887,256
|
|
$
|
1,550,024,584
|
|
$
|
6,871,784,606
|
|
$
|
21,670,911,840
|
|
$
|
28,542,696,446
|
|
$
|
(6,084,616,312
|
)
|
$
|
22,458,080,134
|
|
$
|
4,704,870,280
|
|
|||||||||||||||
|
(1)
|
See attached Encumbrances Reconciliation
|
S-13
EQUITY RESIDENTIAL
ERP OPERATING LIMITED PARTNERSHIP
Schedule III - Real Estate and Accumulated Depreciation
December 31, 2015
NOTES:
|
(A)
|
The balance of furniture & fixtures included in the total investment in real estate and real estate held for sale amount was
$1,542,662,923
as of
December 31, 2015
.
|
|
(B)
|
The cost, net of accumulated depreciation, for Federal Income Tax purposes as of
December 31, 2015
was approximately
$17.0 billion
(unaudited).
|
|
(C)
|
The life to compute depreciation for building is
30
years, for building improvements ranges from
5
to
15
years, for furniture & fixtures and replacements is
5
to
10
years, and for lease intangibles is the average remaining term of each respective lease.
|
|
(D)
|
This asset consists of various acquisition dates and largely represents furniture, fixtures and equipment, leasehold improvements and capitalized software costs owned by the Management Business, which are generally depreciated over periods ranging from
3
to
7
years.
|
|
(E)
|
Primarily represents capital expenditures for major maintenance and replacements incurred subsequent to each property’s acquisition date.
|
|
(F)
|
Represents land and/or construction-in-progress on projects either held for future development or projects currently under development.
|
|
(G)
|
A portion of these properties includes and/or will include retail/commercial space.
|
|
(H)
|
Total properties and units exclude
three
unconsolidated properties containing
1,281
apartment units and
two
Military Housing properties containing
5,139
units.
|
|
(I)
|
through (L) See Encumbrances Reconciliation schedule.
|
|
(M)
|
Boot Property for Bond Partnership mortgage pool.
|
S-14
EXHIBIT INDEX
The exhibits listed below are filed as part of this report. References to exhibits or other filings under the caption “Location” indicate that the exhibit or other filing has been filed, that the indexed exhibit and the exhibit referred to are the same and that the exhibit referred to is incorporated by reference. The Commission file numbers for our Exchange Act filings referenced below are 1-12252 (Equity Residential) and 0-24920 (ERP Operating Limited Partnership).
|
Exhibit
|
|
Description
|
Location
|
|
|
3.1
|
|
Articles of Restatement of Declaration of Trust of Equity Residential dated December 9, 2004.
|
Included as Exhibit 3.1 to Equity Residential’s Form 10-K for the year ended December 31, 2004.
|
|
|
3.2
|
Eighth Amended and Restated Bylaws of Equity Residential, effective as of October 1, 2015.
|
Included as Exhibit 3.1 to Equity Residential's Form 8-K dated and filed on October 1, 2015.
|
||
|
3.3
|
|
Sixth Amended and Restated Agreement of Limited Partnership for ERP Operating Limited Partnership dated as of March 12, 2009.
|
Included as Exhibit 10.1 to Equity Residential's and ERP Operating Limited Partnership's Form 8-K dated March 12, 2009, filed on March 18, 2009.
|
|
|
3.4
|
Form of Preference Units Term Sheet for 3.00% Series P Cumulative Redeemable Preference Units.
|
Included as Exhibit 3.1 to ERP Operating Limited Partnership's Form 8-K dated November 26, 2014, filed on December 2, 2014.
|
||
|
4.1
|
|
Indenture, dated October 1, 1994, between the Operating Partnership and The Bank of New York Mellon Trust Company, N.A., as successor trustee (“Indenture”).
|
Included as Exhibit 4(a) to ERP Operating Limited Partnership’s Form S-3 filed on October 7, 1994.
|
|
|
4.2
|
|
First Supplemental Indenture to Indenture, dated as of September 9, 2004.
|
Included as Exhibit 4.2 to ERP Operating Limited Partnership’s Form 8-K, filed on September 10, 2004.
|
|
|
4.3
|
|
Second Supplemental Indenture to Indenture, dated as of August 23, 2006.
|
Included as Exhibit 4.1 to ERP Operating Limited Partnership’s Form 8-K dated August 16, 2006, filed on August 23, 2006.
|
|
|
4.4
|
|
Third Supplemental Indenture to Indenture, dated as of June 4, 2007.
|
Included as Exhibit 4.1 to ERP Operating Limited Partnership’s Form 8-K dated May 30, 2007, filed on June 1, 2007.
|
|
|
4.5
|
Fourth Supplemental Indenture to Indenture, dated as of December 12, 2011.
|
Included as Exhibit 4.2 to ERP Operating Limited Partnership's Form 8-K dated December 7, 2011, filed on December 9, 2011.
|
||
|
4.6
|
Fifth Supplemental Indenture to Indenture, dated as of February 1, 2016.
|
Attached herein.
|
||
|
4.7
|
|
Terms Agreement regarding 5.125% Notes due March 15, 2016.
|
Included as Exhibit 1.1 to ERP Operating Limited Partnership’s Form 8-K, filed on September 13, 2005.
|
|
|
4.8
|
|
Form of 5.375% Note due August 1, 2016.
|
Included as Exhibit 4.1 to ERP Operating Limited Partnership’s Form 8-K dated January 11, 2006, filed on January 18, 2006.
|
|
|
4.9
|
|
Form of 5.75% Note due June 15, 2017.
|
Included as Exhibit 4.3 to ERP Operating Limited Partnership’s Form 8-K dated May 30, 2007, filed on June 1, 2007.
|
|
|
4.10
|
|
Terms Agreement regarding 7
1
/8% Notes due October 15, 2017.
|
Included as Exhibit 1 to ERP Operating Limited Partnership’s Form 8-K, filed on October 9, 1997.
|
|
|
4.11
|
Form of 2.375% Note due July 1, 2019.
|
Included as Exhibit 4.1 to ERP Operating Limited Partnership's Form 8-K dated June 16, 2014, filed on June 18, 2014.
|
||
|
4.12
|
|
Form of 4.75% Note due July 15, 2020.
|
Included as Exhibit 4.1 to ERP Operating Limited Partnership’s Form 8-K dated July 12, 2010, filed on July 15, 2010.
|
|
|
4.13
|
Form of 4.625% Note due December 15, 2021.
|
Included as Exhibit 4.1 to ERP Operating Limited Partnership's Form 8-K dated December 7, 2011, filed on December 9, 2011.
|
||
|
4.14
|
Form of 3.00% Note due April 15, 2023.
|
Included as Exhibit 4.1 to ERP Operating Limited Partnership's Form 8-K dated April 3, 2013, filed on April 8, 2013.
|
||
|
4.15
|
Form of 3.375% Note due June 1, 2025.
|
Included as Exhibit 4.1 to ERP Operating Limited Partnership's Form 8-K dated May 11, 2015, filed on May 13, 2015.
|
||
|
4.16
|
|
Terms Agreement regarding 7.57% Notes due August 15, 2026.
|
Included as Exhibit 1 to ERP Operating Limited Partnership’s Form 8-K, filed on August 13, 1996.
|
|
|
4.17
|
Form of 4.500% Note due July 1, 2044.
|
Included as Exhibit 4.2 to ERP Operating Limited Partnership's Form 8-K dated June 16, 2014, filed on June 18, 2014.
|
||
|
4.18
|
Form of 4.500% Note due June 1, 2045.
|
Included as Exhibit 4.2 to ERP Operating Limited Partnership's Form 8-K dated May 11, 2015, filed on May 13, 2015.
|
||
|
10.1
|
*
|
Noncompetition Agreement (Zell).
|
Included as an exhibit to Equity Residential's Form S-11 Registration Statement, File No. 33-63158.
|
|
|
10.2
|
*
|
Noncompetition Agreement (Spector).
|
Included as an exhibit to Equity Residential's Form S-11 Registration Statement, File No. 33-63158.
|
|
|
10.3
|
*
|
Form of Noncompetition Agreement (other officers).
|
Included as an exhibit to Equity Residential's Form S-11 Registration Statement, File No. 33-63158.
|
|
|
Exhibit
|
|
Description
|
Location
|
|
|
10.4
|
Revolving Credit Agreement dated as of January 11, 2013 among ERP Operating Limited Partnership, Bank of America, N.A., as Administrative Agent, JPMorgan Chase Bank, N.A. and Wells Fargo Bank, National Association, as Co-Syndication Agents, J.P. Morgan Securities LLC, Wells Fargo Securities, LLC and Merrill Lynch, Pierce, Fenner & Smith Incorporated, as Joint Lead Arrangers and Joint Book Runners, and a syndicate of other banks (the “Revolving Credit Agreement”).
|
Included as Exhibit 10.1 to Equity Residential's and ERP Operating Limited Partnership's Form 8-K dated January 11, 2013, filed January 15, 2013.
|
||
|
10.5
|
|
Guaranty of Payment made as of January 11, 2013 between Equity Residential and Bank of America, N.A., as administrative agent for the banks party to the Revolving Credit Agreement.
|
Included as Exhibit 10.2 to Equity Residential's and ERP Operating Limited Partnership's Form 8-K dated January 11, 2013, filed January 15, 2013.
|
|
|
10.6
|
Amendment No. 1 to Revolving Credit Agreement dated as of January 16, 2015 among ERP Operating Limited Partnership, the Banks party thereto, Bank of America, N.A., as Administrative Agent, JPMorgan Chase Bank, N.A. and Wells Fargo Bank, National Association, as Co-Syndication Agents, and the other Agents named therein.
|
Included as Exhibit 10.6 to Equity Residential's and ERP Operating Limited Partnership's Form 10-K for the year ended December 31, 2014.
|
||
|
10.7
|
Master Credit Facility Agreement, dated February 27, 2013, by and among Federal National Mortgage Association and ASN Santa Monica LLC, et al.
|
Included as Exhibit 10.7 to Equity Residential's and ERP Operating Limited Partnership's Form 8-K dated February 27, 2013, filed on February 28, 2013.
|
||
|
10.8
|
Amended and Restated Fixed Loan Note (Collateral Pool 3), dated February 27, 2013, executed by ASN Santa Monica LLC, et al. in favor of Federal National Mortgage Association.
|
Included as Exhibit 10.8 to Equity Residential's and ERP Operating Limited Partnership's Form 8-K dated February 27, 2013, filed on February 28, 2013.
|
||
|
10.9
|
|
Amended and Restated Limited Partnership Agreement of Lexford Properties, L.P.
|
Included as Exhibit 10.16 to Equity Residential's Form 10-K for the year ended December 31, 1999.
|
|
|
10.10
|
*
|
Equity Residential 2011 Share Incentive Plan.
|
Included as Exhibit 99.1 to Equity Residential's and ERP Operating Limited Partnership's Form 8-K dated June 16, 2011, filed on June 22, 2011.
|
|
|
10.11
|
*
|
First Amendment to 2011 Share Incentive Plan.
|
Included as Exhibit 10.1 to Equity Residential's and ERP Operating Limited Partnership's Form 10-Q for the quarterly period ended June 30, 2012.
|
|
|
10.12
|
*
|
Second Amendment to 2011 Share Incentive Plan.
|
Included as Exhibit 10.1 to Equity Residential's and ERP Operating Limited Partnership's Form 10-Q for the quarterly period ended September 30, 2013.
|
|
|
10.13
|
*
|
Third Amendment to 2011 Share Incentive Plan.
|
Included as Exhibit 10.1 to Equity Residential's and ERP Operating Limited Partnership's Form 10-Q for the quarterly period ended March 31, 2014.
|
|
|
10.14
|
*
|
Fourth Amendment to 2011 Share Incentive Plan.
|
Included as Exhibit 10.1 to Equity Residential's and ERP Operating Limited Partnership's Form 10-Q for the quarterly period ended September 30, 2014.
|
|
|
10.15
|
*
|
Equity Residential Second Restated 2002 Share Incentive Plan dated December 10, 2008.
|
Included as Exhibit 10.15 to Equity Residential's Form 10-K for the year ended December 31, 2008.
|
|
|
10.16
|
*
|
First Amendment to Second Restated 2002 Share Incentive Plan.
|
Included as Exhibit 10.1 to Equity Residential's Form 10-Q for the quarterly period ended September 30, 2010.
|
|
|
10.17
|
*
|
Second Amendment to Second Restated 2002 Share Incentive Plan.
|
Included as Exhibit 10.3 to Equity Residential's Form 10-Q for the quarterly period ended June 30, 2011.
|
|
|
10.18
|
*
|
Third Amendment to Second Restated 2002 Share Incentive Plan.
|
Included as Exhibit 10.2 to Equity Residential's and ERP Operating Limited Partnership's Form 10-Q for the quarterly period ended June 30, 2012.
|
|
|
10.19
|
*
|
Fourth Amendment to Second Restated 2002 Share Incentive Plan.
|
Included as Exhibit 10.2 to Equity Residential's and ERP Operating Limited Partnership's Form 10-Q for the quarterly period ended September 30, 2013.
|
|
|
10.20
|
*
|
Form of 2015 Performance Award Agreement.
|
Included as Exhibit 10.1 to Equity Residential's and ERP Operating Limited Partnership's Form 10-Q for the quarterly period ended March 31, 2015.
|
|
|
10.21
|
*
|
Form of Change in Control/Severance Agreement between the Company and other executive officers.
|
Included as Exhibit 10.13 to Equity Residential's Form 10-K for the year ended December 31, 2001.
|
|
|
10.22
|
*
|
Form of First Amendment to Amended and Restated Change in Control/Severance Agreement with each executive officer.
|
Included as Exhibit 10.1 to Equity Residential's Form 10-Q for the quarterly period ended March 31, 2009.
|
|
|
10.23
|
*
|
Form of Indemnification Agreement between the Company and each trustee and executive officer.
|
Included as Exhibit 10.18 to Equity Residential's Form 10-K for the year ended December 31, 2003.
|
|
|
10.24
|
*
|
Form of Letter Agreement between Equity Residential and each of David J. Neithercut, Alan W. George and Bruce C. Strohm.
|
Included as Exhibit 10.3 to Equity Residential's Form 10-Q for the quarterly period ended September 30, 2008.
|
|
|
Exhibit
|
|
Description
|
Location
|
|
|
10.25
|
*
|
Form of Executive Retirement Benefits Agreement.
|
Included as Exhibit 10.24 to Equity Residential's Form 10-K for the year ended December 31, 2006.
|
|
|
10.26
|
*
|
Retirement Benefits Agreement between Samuel Zell and the Company dated October 18, 2001.
|
Included as Exhibit 10.18 to Equity Residential's Form 10-K for the year ended December 31, 2001.
|
|
|
10.27
|
*
|
Amended and Restated Deferred Compensation Agreement between the Company and Gerald A. Spector dated January 1, 2002.
|
Included as Exhibit 10.17 to Equity Residential's Form 10-K for the year ended December 31, 2001.
|
|
|
10.28
|
*
|
The Equity Residential Supplemental Executive Retirement Plan as Amended and Restated effective July 1, 2014.
|
Included as Exhibit 10.2 to Equity Residential's and ERP Operating Limited Partnership's Form 10-Q for the quarterly period ended September 30, 2014.
|
|
|
10.29
|
*
|
The Equity Residential Grandfathered Supplemental Executive Retirement Plan as Amended and Restated effective January 1, 2005.
|
Included as Exhibit 10.2 to Equity Residential's Form 10-Q for the quarterly period ended March 31, 2008.
|
|
|
10.30
|
Second Amended and Restated Sales Agency Financing Agreement, dated July 31, 2013, among the Company, the Operating Partnership and Merrill Lynch, Pierce, Fenner & Smith Incorporated.
|
Included as Exhibit 1.1 to Equity Residential's and ERP Operating Limited Partnership's Form 8-K dated and filed on July 31, 2013.
|
||
|
10.31
|
Amended and Restated Sales Agency Financing Agreement, dated July 31, 2013, among the Company, the Operating Partnership and BNY Mellon Capital Markets, LLC.
|
Included as Exhibit 1.2 to Equity Residential's and ERP Operating Limited Partnership's Form 8-K dated and filed on July 31, 2013.
|
||
|
10.32
|
Second Amended and Restated Sales Agency Financing Agreement, dated July 31, 2013, among the Company, the Operating Partnership and J.P. Morgan Securities LLC.
|
Included as Exhibit 1.3 to Equity Residential's and ERP Operating Limited Partnership's Form 8-K dated and filed on July 31, 2013.
|
||
|
10.33
|
Second Amended and Restated Sales Agency Financing Agreement, dated July 31, 2013, among the Company, the Operating Partnership and Morgan Stanley & Co. LLC.
|
Included as Exhibit 1.4 to Equity Residential's and ERP Operating Limited Partnership's Form 8-K dated and filed on July 31, 2013.
|
||
|
10.34
|
Sales Agency Financing Agreement, dated July 31, 2013, among the Company, the Operating Partnership and Scotia Capital (USA) Inc.
|
Included as Exhibit 1.5 to Equity Residential's and ERP Operating Limited Partnership's Form 8-K dated and filed on July 31, 2013.
|
||
|
10.35
|
Archstone Residual JV, LLC Limited Liability Company Agreement.
|
Included as Exhibit 10.3 to Equity Residential's and ERP Operating Limited Partnership's Form 8-K dated February 27, 2013, filed on February 28, 2013.
|
||
|
10.36
|
Archstone Parallel Residual JV, LLC Limited Liability Company Agreement.
|
Included as Exhibit 10.4 to Equity Residential's and ERP Operating Limited Partnership's Form 8-K dated February 27, 2013, filed on February 28, 2013.
|
||
|
10.37
|
Archstone Parallel Residual JV 2, LLC Limited Liability Company Agreement.
|
Included as Exhibit 10.5 to Equity Residential's and ERP Operating Limited Partnership's Form 8-K dated February 27, 2013, filed on February 28, 2013.
|
||
|
10.38
|
Legacy Holdings JV, LLC Limited Liability Company Agreement.
|
Included as Exhibit 10.6 to Equity Residential's and ERP Operating Limited Partnership's Form 8-K dated February 27, 2013, filed on February 28, 2013.
|
||
|
10.39
|
Real Estate Sale Agreement, dated October 23, 2015, by and among ERP Operating Limited Partnership, certain of its affiliates, and SCG Atlas Acquisition, L.P. (the "Real Estate Sale Agreement").
|
Included as Exhibit 2.1 to Equity Residential's and ERP Operating Limited Partnership's Form 8-K dated October 23, 2015, filed on October 26, 2015.
|
||
|
10.40
|
Schedule of Agreements Substantially Identical in all Material Respects to the Real Estate Sale Agreement.
|
Included as Exhibit 2.2 to Equity Residential's and ERP Operating Limited Partnership's Form 8-K dated October 23, 2015, filed on October 26, 2015.
|
||
|
12
|
Computation of Ratio of Earnings to Combined Fixed Charges.
|
Attached herein.
|
||
|
21
|
List of Subsidiaries of Equity Residential and ERP Operating Limited Partnership.
|
Attached herein.
|
||
|
23.1
|
Consent of Ernst & Young LLP - Equity Residential.
|
Attached herein.
|
||
|
23.2
|
Consent of Ernst & Young LLP - ERP Operating Limited Partnership.
|
Attached herein.
|
||
|
24
|
|
Power of Attorney.
|
See the signature page to this report.
|
|
|
31.1
|
|
Equity Residential - Certification of David J. Neithercut, Chief Executive Officer.
|
Attached herein.
|
|
|
31.2
|
|
Equity Residential - Certification of Mark J. Parrell, Chief Financial Officer.
|
Attached herein.
|
|
|
31.3
|
ERP Operating Limited Partnership - Certification of David J. Neithercut, Chief Executive Officer of Registrant's General Partner.
|
Attached herein.
|
||
|
31.4
|
ERP Operating Limited Partnership - Certification of Mark J. Parrell, Chief Financial Officer of Registrant's General Partner.
|
Attached herein.
|
||
|
Exhibit
|
Description
|
Location
|
||
|
32.1
|
Equity Residential - Certification Pursuant to 18 U.S.C. Section 1350, as adopted pursuant to Section 906 of the Sarbanes-Oxley Act of 2002, of David J. Neithercut, Chief Executive Officer of the Company.
|
Attached herein.
|
||
|
32.2
|
Equity Residential - Certification Pursuant to 18 U.S.C. Section 1350, as adopted pursuant to Section 906 of the Sarbanes-Oxley Act of 2002, of Mark J. Parrell, Chief Financial Officer of the Company.
|
Attached herein.
|
||
|
32.3
|
ERP Operating Limited Partnership - Certification Pursuant to 18 U.S.C. Section 1350, as adopted pursuant to Section 906 of the Sarbanes-Oxley Act of 2002, of David J. Neithercut, Chief Executive Officer of Registrant's General Partner.
|
Attached herein.
|
||
|
32.4
|
ERP Operating Limited Partnership - Certification Pursuant to 18 U.S.C. Section 1350, as adopted pursuant to Section 906 of the Sarbanes-Oxley Act of 2002, of Mark J. Parrell, Chief Financial Officer of Registrant's General Partner.
|
Attached herein.
|
||
|
101
|
XBRL (Extensible Business Reporting Language). The following materials from Equity Residential’s and ERP Operating Limited Partnership's Annual Report on Form 10-K for the year ended December 31, 2015, formatted in XBRL: (i) consolidated balance sheets, (ii) consolidated statements of operations and comprehensive income, (iii) consolidated statements of cash flows, (iv) consolidated statements of changes in equity (Equity Residential), (v) consolidated statements of changes in capital (ERP Operating Limited Partnership) and (vi) notes to consolidated financial statements.
|
Attached herein.
|
||
*Management contracts and compensatory plans or arrangements filed as exhibits to this report are identified by an asterisk.
TABLE OF CONTENTS
Part IItem 1. BusinessItem 1A. Risk FactorsItem 1B. Unresolved Staff CommentsItem 2. PropertiesItem 3. Legal ProceedingsItem 4. Mine Safety DisclosuresPart IIItem 5. Market For Registrant S Common Equity, Related Stockholder Matters and Issuer Purchases Of Equity SecuritiesItem 6. Selected Financial DataItem 7. Management S Discussion and Analysis Of Financial Condition and Results Of OperationsItem 7A. Quantitative and Qualitative Disclosures About Market RiskItem 8. Financial Statements and Supplementary DataItem 9. Changes in and Disagreements with Accountants on Accounting and Financial DisclosureItem 9A. Controls and ProceduresItem 9B. Other InformationPart IIIPart IVItem 15. Exhibits and Financial Statement Schedules