|
|
|
|
|
|
|
|
|
|
|
|
|
|
|
|
|
|
|
|
|
|
|
|
|
|
|
|
|
|
|
|
|
|
|
|
|
|
|
|
|
|
|
|
|
|
|
|
|
|
|
|
|
UNITED STATES
SECURITIES AND EXCHANGE COMMISSION
Washington, D.C. 20549
FORM 10-Q
|
☒ |
QUARTERLY REPORT PURSUANT TO SECTION 13 OR 15(d) OF THE SECURITIES EXCHANGE ACT OF 1934 |
For the quarterly period ended June 30, 2017
OR
|
☐ |
TRANSITION REPORT PURSUANT TO SECTION 13 OR 15(d) OF THE SECURITIES EXCHANGE ACT OF 1934 |
For the transition period from to
Commission File Number: 1-12252 (Equity Residential)
Commission File Number: 0-24920 (ERP Operating Limited Partnership)
EQUITY RESIDENTIAL
ERP OPERATING LIMITED PARTNERSHIP
( Exact name of registrant as specified in its charter)
|
Maryland (Equity Residential) |
|
13-3675988 (Equity Residential) |
|
Illinois (ERP Operating Limited Partnership) |
|
36-3894853 (ERP Operating Limited Partnership) |
|
(State or other jurisdiction of incorporation or organization) |
|
(I.R.S. Employer Identification No.) |
|
|
|
|
|
Two North Riverside Plaza, Chicago, Illinois 60606 |
|
(312) 474-1300 |
|
(Address of principal executive offices) (Zip Code) |
|
(Registrant's telephone number, including area code) |
Indicate by check mark whether the registrant (1) has filed all reports required to be filed by Section 13 or 15(d) of the Securities Exchange Act of 1934 during the preceding 12 months (or for such shorter period that the registrant was required to file such reports), and (2) has been subject to such filing requirements for the past 90 days.
|
Equity Residential Yes ☒ No ☐ |
ERP Operating Limited Partnership Yes ☒ No ☐ |
Indicate by check mark whether the registrant has submitted electronically and posted on its corporate Web site, if any, every Interactive Data File required to be submitted and posted pursuant to Rule 405 of Regulation S-T (§232.405 of this chapter) during the preceding 12 months (or for such shorter period that the registrant was required to submit and post such files).
|
Equity Residential Yes ☒ No ☐ |
ERP Operating Limited Partnership Yes ☒ No ☐ |
Indicate by check mark whether the registrant is a large accelerated filer, an accelerated filer, a non-accelerated filer, smaller reporting company, or an emerging growth company. See the definitions of “large accelerated filer,” “accelerated filer,” “smaller reporting company,” and “emerging growth company” in Rule 12b-2 of the Exchange Act.
Equity Residential:
|
Large accelerated filer |
|
☒ |
|
Accelerated filer |
|
☐ |
|
|
|
|
|
|||
|
Non-accelerated filer |
|
☐ (Do not check if a small reporting company) |
|
Small reporting company |
|
☐ |
|
|
|
|
|
|
|
|
|
Emerging growth company |
|
☐ |
|
|
|
|
ERP Operating Limited Partnership:
|
Large accelerated filer |
|
☐ |
|
Accelerated filer |
|
☐ |
|
|
|
|
|
|||
|
Non-accelerated filer |
|
☒ (Do not check if a small reporting company) |
|
Small reporting company |
|
☐ |
|
|
|
|
|
|
|
|
|
Emerging growth company |
|
☐ |
|
|
|
|
If an emerging growth company, indicate by check mark if the registrant has elected not to use the extended transition period for complying with any new or revised financial accounting standards provided pursuant to Section 13(a) of the Exchange Act.
|
Equity Residential ☐ |
ERP Operating Limited Partnership ☐ |
Indicate by check mark whether the registrant is a shell company (as defined in Rule 12b-2 of the Exchange Act).
|
Equity Residential Yes ☐ No ☒ |
ERP Operating Limited Partnership Yes ☐ No ☒ |
The number of EQR Common Shares of Beneficial Interest, $0.01 par value, outstanding on July 28, 2017 was 367,313,257.
This report combines the reports on Form 10-Q for the quarterly period ended June 30, 2017 of Equity Residential and ERP Operating Limited Partnership. Unless stated otherwise or the context otherwise requires, references to “EQR” mean Equity Residential, a Maryland real estate investment trust (“REIT”), and references to “ERPOP” mean ERP Operating Limited Partnership, an Illinois limited partnership. References to the “Company,” “we,” “us” or “our” mean collectively EQR, ERPOP and those entities/subsidiaries owned or controlled by EQR and/or ERPOP. References to the “Operating Partnership” mean collectively ERPOP and those entities/subsidiaries owned or controlled by ERPOP. The following chart illustrates the Company's and the Operating Partnership's corporate structure:
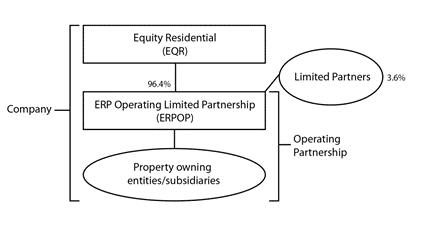
EQR is the general partner of, and as of June 30, 2017 owned an approximate 96.4% ownership interest in, ERPOP. The remaining 3.6% interest is owned by limited partners. As the sole general partner of ERPOP, EQR has exclusive control of ERPOP's day-to-day management. Management operates the Company and the Operating Partnership as one business. The management of EQR consists of the same members as the management of ERPOP.
The Company is structured as an umbrella partnership REIT (“UPREIT”) and EQR contributes all net proceeds from its various equity offerings to ERPOP. In return for those contributions, EQR receives a number of OP Units (see definition below) in ERPOP equal to the number of Common Shares it has issued in the equity offering. The Company may acquire properties in transactions that include the issuance of OP Units as consideration for the acquired properties. Such transactions may, in certain circumstances, enable the sellers to defer in whole or in part, the recognition of taxable income or gain that might otherwise result from the sales. This is one of the reasons why the Company is structured in the manner shown above. Based on the terms of ERPOP's partnership agreement, OP Units can be exchanged with Common Shares on a one-for-one basis because the Company maintains a one-for-one relationship between the OP Units of ERPOP issued to EQR and the outstanding Common Shares.
The Company believes that combining the reports on Form 10-Q of EQR and ERPOP into this single report provides the following benefits:
|
|
• |
enhances investors' understanding of the Company and the Operating Partnership by enabling investors to view the business as a whole in the same manner as management views and operates the business; |
|
|
• |
eliminates duplicative disclosure and provides a more streamlined and readable presentation since a substantial portion of the disclosure applies to both the Company and the Operating Partnership; and |
|
|
• |
creates time and cost efficiencies through the preparation of one combined report instead of two separate reports. |
The Company believes it is important to understand the few differences between EQR and ERPOP in the context of how EQR and ERPOP operate as a consolidated company. All of the Company's property ownership, development and related business operations are conducted through the Operating Partnership and EQR has no material assets or liabilities other than its investment in ERPOP. EQR's primary function is acting as the general partner of ERPOP. EQR also issues equity from time to time, the net proceeds of which it is obligated to contribute to ERPOP, and guarantees certain debt of ERPOP, as disclosed in this report. EQR does not have any indebtedness as all debt is incurred by the Operating Partnership. The Operating Partnership holds substantially all of the assets of the Company, including the Company's ownership interests in its joint ventures. The Operating Partnership conducts the operations of the business and is structured as a partnership with no publicly traded equity. Except for the net proceeds from
equity offerings by EQR, which are co ntributed to the capital of ERPOP in exchange for additional partnership interests in ERPOP (“OP Units”) (on a one-for-one Common Share per OP Unit basis) or additional preference units in ERPOP (on a one-for-one preferred share per preference unit basis), the Operating Partnership generates all remaining capital required by the Company's business. These sources include the Operating Partnership's working capital, net cash provided by operating activities, borrowings under its revolving credit facility and /or commercial paper program, the issuance of secured and unsecured debt and equity securities and proceeds received from disposition of certain properties and joint venture interests.
Shareholders' equity, partners' capital and noncontrolling interests are the main areas of difference between the consolidated financial statements of the Company and those of the Operating Partnership. The limited partners of the Operating Partnership are accounted for as partners' capital in the Operating Partnership's financial statements and as noncontrolling interests in the Company's financial statements. The noncontrolling interests in the Operating Partnership's financial statements include the interests of unaffiliated partners in various consolidated partnerships. The noncontrolling interests in the Company's financial statements include the same noncontrolling interests at the Operating Partnership level and limited partner OP Unit holders of the Operating Partnership. The differences between shareholders' equity and partners' capital result from differences in the equity issued at the Company and Operating Partnership levels.
To help investors understand the differences between the Company and the Operating Partnership, this report provides separate consolidated financial statements for the Company and the Operating Partnership; a single set of consolidated notes to such financial statements that includes separate discussions of each entity's debt, noncontrolling interests and shareholders' equity or partners' capital, as applicable; and a combined Management's Discussion and Analysis of Financial Condition and Results of Operations section that includes discrete information related to each entity.
This report also includes separate Part I, Item 4. Controls and Procedures sections and separate Exhibits 31 and 32 certifications for each of the Company and the Operating Partnership in order to establish that the requisite certifications have been made and that the Company and the Operating Partnership are compliant with Rule 13a-15 or Rule 15d-15 of the Securities Exchange Act of 1934 and 18 U.S.C. §1350.
In order to highlight the differences between the Company and the Operating Partnership, the separate sections in this report for the Company and the Operating Partnership specifically refer to the Company and the Operating Partnership. In the sections that combine disclosure of the Company and the Operating Partnership, this report refers to actions or holdings as being actions or holdings of the Company. Although the Operating Partnership is generally the entity that directly or indirectly enters into contracts and joint ventures and holds assets and debt, reference to the Company is appropriate because the Company is one business and the Company operates that business through the Operating Partnership.
As general partner with control of ERPOP, EQR consolidates ERPOP for financial reporting purposes, and EQR essentially has no assets or liabilities other than its investment in ERPOP. Therefore, the assets and liabilities of the Company and the Operating Partnership are the same on their respective financial statements. The separate discussions of the Company and the Operating Partnership in this report should be read in conjunction with each other to understand the results of the Company on a consolidated basis and how management operates the Company.
(Amounts in thousands except for share amounts)
(Unaudited)
|
|
|
June 30, |
|
|
December 31, |
|
||
|
|
|
2017 |
|
|
2016 |
|
||
|
ASSETS |
|
|
|
|
|
|
|
|
|
Investment in real estate |
|
|
|
|
|
|
|
|
|
Land |
|
$ |
5,927,949 |
|
|
$ |
5,899,862 |
|
|
Depreciable property |
|
|
19,123,571 |
|
|
|
18,730,579 |
|
|
Projects under development |
|
|
325,823 |
|
|
|
637,168 |
|
|
Land held for development |
|
|
112,474 |
|
|
|
118,816 |
|
|
Investment in real estate |
|
|
25,489,817 |
|
|
|
25,386,425 |
|
|
Accumulated depreciation |
|
|
(5,671,510 |
) |
|
|
(5,360,389 |
) |
|
Investment in real estate, net |
|
|
19,818,307 |
|
|
|
20,026,036 |
|
|
Cash and cash equivalents |
|
|
37,719 |
|
|
|
77,207 |
|
|
Investments in unconsolidated entities |
|
|
59,246 |
|
|
|
60,141 |
|
|
Deposits – restricted |
|
|
254,378 |
|
|
|
76,946 |
|
|
Escrow deposits – mortgage |
|
|
21,016 |
|
|
|
64,935 |
|
|
Other assets |
|
|
445,909 |
|
|
|
398,883 |
|
|
Total assets |
|
$ |
20,636,575 |
|
|
$ |
20,704,148 |
|
|
|
|
|
|
|
|
|
|
|
|
LIABILITIES AND EQUITY |
|
|
|
|
|
|
|
|
|
Liabilities: |
|
|
|
|
|
|
|
|
|
Mortgage notes payable, net |
|
$ |
3,743,363 |
|
|
$ |
4,119,181 |
|
|
Notes, net |
|
|
4,456,365 |
|
|
|
4,848,079 |
|
|
Line of credit and commercial paper |
|
|
764,361 |
|
|
|
19,998 |
|
|
Accounts payable and accrued expenses |
|
|
137,920 |
|
|
|
147,482 |
|
|
Accrued interest payable |
|
|
48,823 |
|
|
|
60,946 |
|
|
Other liabilities |
|
|
324,002 |
|
|
|
350,466 |
|
|
Security deposits |
|
|
63,648 |
|
|
|
62,624 |
|
|
Distributions payable |
|
|
191,717 |
|
|
|
192,296 |
|
|
Total liabilities |
|
|
9,730,199 |
|
|
|
9,801,072 |
|
|
|
|
|
|
|
|
|
|
|
|
Commitments and contingencies |
|
|
|
|
|
|
|
|
|
|
|
|
|
|
|
|
|
|
|
Redeemable Noncontrolling Interests – Operating Partnership |
|
|
380,519 |
|
|
|
442,092 |
|
|
Equity: |
|
|
|
|
|
|
|
|
|
Shareholders' equity: |
|
|
|
|
|
|
|
|
|
Preferred Shares of beneficial interest, $0.01 par value; 100,000,000 shares authorized; 745,600 shares issued and outstanding as of June 30, 2017 and December 31, 2016 |
|
|
37,280 |
|
|
|
37,280 |
|
|
Common Shares of beneficial interest, $0.01 par value; 1,000,000,000 shares authorized; 367,298,765 shares issued and outstanding as of June 30, 2017 and 365,870,924 shares issued and outstanding as of December 31, 2016 |
|
|
3,673 |
|
|
|
3,659 |
|
|
Paid in capital |
|
|
8,838,804 |
|
|
|
8,758,422 |
|
|
Retained earnings |
|
|
1,511,899 |
|
|
|
1,543,626 |
|
|
Accumulated other comprehensive (loss) |
|
|
(101,151 |
) |
|
|
(113,909 |
) |
|
Total shareholders’ equity |
|
|
10,290,505 |
|
|
|
10,229,078 |
|
|
Noncontrolling Interests: |
|
|
|
|
|
|
|
|
|
Operating Partnership |
|
|
229,049 |
|
|
|
221,297 |
|
|
Partially Owned Properties |
|
|
6,303 |
|
|
|
10,609 |
|
|
Total Noncontrolling Interests |
|
|
235,352 |
|
|
|
231,906 |
|
|
Total equity |
|
|
10,525,857 |
|
|
|
10,460,984 |
|
|
Total liabilities and equity |
|
$ |
20,636,575 |
|
|
$ |
20,704,148 |
|
See accompanying notes
2
CONSOLIDATED STATEMENTS OF OPERATIONS AND COMPREHENSIVE INCOME
(Amounts in thousands except per share data)
(Unaudited)
|
|
|
Six Months Ended June 30, |
|
|
Quarter Ended June 30, |
|
||||||||||
|
|
|
2017 |
|
|
2016 |
|
|
2017 |
|
|
2016 |
|
||||
|
REVENUES |
|
|
|
|
|
|
|
|
|
|
|
|
|
|
|
|
|
Rental income |
|
$ |
1,216,219 |
|
|
$ |
1,211,104 |
|
|
$ |
612,299 |
|
|
$ |
594,939 |
|
|
Fee and asset management |
|
|
361 |
|
|
|
3,133 |
|
|
|
181 |
|
|
|
215 |
|
|
Total revenues |
|
|
1,216,580 |
|
|
|
1,214,237 |
|
|
|
612,480 |
|
|
|
595,154 |
|
|
EXPENSES |
|
|
|
|
|
|
|
|
|
|
|
|
|
|
|
|
|
Property and maintenance |
|
|
201,924 |
|
|
|
205,472 |
|
|
|
99,316 |
|
|
|
96,307 |
|
|
Real estate taxes and insurance |
|
|
169,231 |
|
|
|
157,611 |
|
|
|
87,503 |
|
|
|
77,415 |
|
|
Property management |
|
|
43,841 |
|
|
|
44,486 |
|
|
|
21,589 |
|
|
|
20,991 |
|
|
General and administrative |
|
|
27,799 |
|
|
|
35,013 |
|
|
|
13,626 |
|
|
|
18,296 |
|
|
Depreciation |
|
|
358,864 |
|
|
|
349,012 |
|
|
|
179,896 |
|
|
|
176,127 |
|
|
Total expenses |
|
|
801,659 |
|
|
|
791,594 |
|
|
|
401,930 |
|
|
|
389,136 |
|
|
|
|
|
|
|
|
|
|
|
|
|
|
|
|
|
|
|
|
Operating income |
|
|
414,921 |
|
|
|
422,643 |
|
|
|
210,550 |
|
|
|
206,018 |
|
|
|
|
|
|
|
|
|
|
|
|
|
|
|
|
|
|
|
|
Interest and other income |
|
|
1,763 |
|
|
|
59,583 |
|
|
|
1,162 |
|
|
|
56,525 |
|
|
Other expenses |
|
|
(2,132 |
) |
|
|
(4,060 |
) |
|
|
(1,042 |
) |
|
|
(1,504 |
) |
|
Interest: |
|
|
|
|
|
|
|
|
|
|
|
|
|
|
|
|
|
Expense incurred, net |
|
|
(197,434 |
) |
|
|
(299,964 |
) |
|
|
(91,224 |
) |
|
|
(86,472 |
) |
|
Amortization of deferred financing costs |
|
|
(4,383 |
) |
|
|
(7,739 |
) |
|
|
(2,087 |
) |
|
|
(2,345 |
) |
|
Income before income and other taxes, (loss) from investments in unconsolidated entities, net gain (loss) on sales of real estate properties and land parcels and discontinued operations |
|
|
212,735 |
|
|
|
170,463 |
|
|
|
117,359 |
|
|
|
172,222 |
|
|
Income and other tax (expense) benefit |
|
|
(482 |
) |
|
|
(763 |
) |
|
|
(220 |
) |
|
|
(413 |
) |
|
(Loss) from investments in unconsolidated entities |
|
|
(1,755 |
) |
|
|
(1,904 |
) |
|
|
(682 |
) |
|
|
(800 |
) |
|
Net gain on sales of real estate properties |
|
|
124,433 |
|
|
|
3,780,835 |
|
|
|
87,726 |
|
|
|
57,356 |
|
|
Net gain (loss) on sales of land parcels |
|
|
19,170 |
|
|
|
11,722 |
|
|
|
(23 |
) |
|
|
— |
|
|
Income from continuing operations |
|
|
354,101 |
|
|
|
3,960,353 |
|
|
|
204,160 |
|
|
|
228,365 |
|
|
Discontinued operations, net |
|
|
— |
|
|
|
(122 |
) |
|
|
— |
|
|
|
35 |
|
|
Net income |
|
|
354,101 |
|
|
|
3,960,231 |
|
|
|
204,160 |
|
|
|
228,400 |
|
|
Net (income) attributable to Noncontrolling Interests: |
|
|
|
|
|
|
|
|
|
|
|
|
|
|
|
|
|
Operating Partnership |
|
|
(12,765 |
) |
|
|
(152,089 |
) |
|
|
(7,354 |
) |
|
|
(8,780 |
) |
|
Partially Owned Properties |
|
|
(1,553 |
) |
|
|
(1,545 |
) |
|
|
(765 |
) |
|
|
(781 |
) |
|
Net income attributable to controlling interests |
|
|
339,783 |
|
|
|
3,806,597 |
|
|
|
196,041 |
|
|
|
218,839 |
|
|
Preferred distributions |
|
|
(1,546 |
) |
|
|
(1,545 |
) |
|
|
(773 |
) |
|
|
(772 |
) |
|
Net income available to Common Shares |
|
$ |
338,237 |
|
|
$ |
3,805,052 |
|
|
$ |
195,268 |
|
|
$ |
218,067 |
|
|
Earnings per share – basic: |
|
|
|
|
|
|
|
|
|
|||||||
|
Income from continuing operations available to Common Shares |
|
$ |
0.92 |
|
|
$ |
10.43 |
|
|
$ |
0.53 |
|
|
$ |
0.60 |
|
|
Net income available to Common Shares |
|
$ |
0.92 |
|
|
$ |
10.43 |
|
|
$ |
0.53 |
|
|
$ |
0.60 |
|
|
Weighted average Common Shares outstanding |
|
|
366,713 |
|
|
|
364,820 |
|
|
|
366,820 |
|
|
|
365,047 |
|
|
Earnings per share – diluted: |
|
|
|
|
|
|
|
|
|
|
|
|
|
|
|
|
|
Income from continuing operations available to Common Shares |
|
$ |
0.92 |
|
|
$ |
10.36 |
|
|
$ |
0.53 |
|
|
$ |
0.59 |
|
|
Net income available to Common Shares |
|
$ |
0.92 |
|
|
$ |
10.36 |
|
|
$ |
0.53 |
|
|
$ |
0.59 |
|
|
Weighted average Common Shares outstanding |
|
|
382,505 |
|
|
|
382,012 |
|
|
|
382,692 |
|
|
|
382,065 |
|
|
|
|
|
|
|
|
|
|
|
|
|
|
|
|
|
|
|
|
Distributions declared per Common Share outstanding |
|
$ |
1.0075 |
|
|
$ |
9.0075 |
|
|
$ |
0.50375 |
|
|
$ |
0.50375 |
|
See accompanying notes
3
CONSOLIDATED STATEMENTS OF OPERATIONS AND COMPREHENSIVE INCOME (Continued)
(Amounts in thousands except per share data)
(Unaudited)
|
|
|
Six Months Ended June 30, |
|
|
Quarter Ended June 30, |
|
||||||||||
|
|
|
2017 |
|
|
2016 |
|
|
2017 |
|
|
2016 |
|
||||
|
Comprehensive income |
|
|
|
|
|
|
|
|
|
|
|
|
|
|
|
|
|
Net income |
|
$ |
354,101 |
|
|
$ |
3,960,231 |
|
|
$ |
204,160 |
|
|
$ |
228,400 |
|
|
Other comprehensive income (loss): |
|
|
|
|
|
|
|
|
|
|
|
|
|
|
|
|
|
Other comprehensive income (loss) – derivative instruments: |
|
|
|
|
|
|
|
|
|
|
|
|
|
|
|
|
|
Unrealized holding gains (losses) arising during the period |
|
|
3,507 |
|
|
|
(4,467 |
) |
|
|
3,507 |
|
|
|
(1,561 |
) |
|
Losses reclassified into earnings from other comprehensive income |
|
|
9,251 |
|
|
|
32,922 |
|
|
|
4,668 |
|
|
|
4,268 |
|
|
Other comprehensive income (loss) – foreign currency: |
|
|
|
|
|
|
|
|
|
|
|
|
|
|
|
|
|
Currency translation adjustments arising during the period |
|
|
— |
|
|
|
50 |
|
|
|
— |
|
|
|
(25 |
) |
|
Other comprehensive income |
|
|
12,758 |
|
|
|
28,505 |
|
|
|
8,175 |
|
|
|
2,682 |
|
|
Comprehensive income |
|
|
366,859 |
|
|
|
3,988,736 |
|
|
|
212,335 |
|
|
|
231,082 |
|
|
Comprehensive (income) attributable to Noncontrolling Interests |
|
|
(14,782 |
) |
|
|
(154,734 |
) |
|
|
(8,416 |
) |
|
|
(9,664 |
) |
|
Comprehensive income attributable to controlling interests |
|
$ |
352,077 |
|
|
$ |
3,834,002 |
|
|
$ |
203,919 |
|
|
$ |
221,418 |
|
See accompanying notes
4
CONSOLIDATED STATEMENTS OF CASH FLOWS
(Amounts in thousands)
(Unaudited)
|
|
|
Six Months Ended June 30, |
|
|||||
|
|
|
2017 |
|
|
2016 |
|
||
|
CASH FLOWS FROM OPERATING ACTIVITIES: |
|
|
|
|
|
|
|
|
|
Net income |
|
$ |
354,101 |
|
|
$ |
3,960,231 |
|
|
Adjustments to reconcile net income to net cash provided by operating activities: |
|
|
|
|
|
|
|
|
|
Depreciation |
|
|
358,864 |
|
|
|
349,012 |
|
|
Amortization of deferred financing costs |
|
|
4,383 |
|
|
|
7,739 |
|
|
Amortization of above/below market leases |
|
|
1,717 |
|
|
|
1,708 |
|
|
Amortization of discounts and premiums on debt |
|
|
3,359 |
|
|
|
(19,010 |
) |
|
Amortization of deferred settlements on derivative instruments |
|
|
9,246 |
|
|
|
32,850 |
|
|
Write-off of pursuit costs |
|
|
1,546 |
|
|
|
2,563 |
|
|
Loss from investments in unconsolidated entities |
|
|
1,755 |
|
|
|
1,904 |
|
|
Distributions from unconsolidated entities – return on capital |
|
|
1,345 |
|
|
|
1,482 |
|
|
Net (gain) on sales of investment securities and other investments |
|
|
— |
|
|
|
(55,156 |
) |
|
Net (gain) on sales of real estate properties |
|
|
(124,433 |
) |
|
|
(3,780,835 |
) |
|
Net (gain) on sales of land parcels |
|
|
(19,170 |
) |
|
|
(11,722 |
) |
|
Net (gain) on sales of discontinued operations |
|
|
— |
|
|
|
(15 |
) |
|
Compensation paid with Company Common Shares |
|
|
15,027 |
|
|
|
20,729 |
|
|
Changes in assets and liabilities: |
|
|
|
|
|
|
|
|
|
Decrease in deposits – restricted |
|
|
310 |
|
|
|
9,121 |
|
|
Decrease (increase) in mortgage deposits |
|
|
900 |
|
|
|
(840 |
) |
|
(Increase) decrease in other assets |
|
|
(39,845 |
) |
|
|
29,944 |
|
|
Increase in accounts payable and accrued expenses |
|
|
24,503 |
|
|
|
7,837 |
|
|
(Decrease) in accrued interest payable |
|
|
(12,123 |
) |
|
|
(27,046 |
) |
|
(Decrease) in other liabilities |
|
|
(32,476 |
) |
|
|
(42,080 |
) |
|
Increase (decrease) in security deposits |
|
|
1,024 |
|
|
|
(13,340 |
) |
|
Net cash provided by operating activities |
|
|
550,033 |
|
|
|
475,076 |
|
|
CASH FLOWS FROM INVESTING ACTIVITIES: |
|
|
|
|
|
|
|
|
|
Investment in real estate – acquisitions |
|
|
(57,066 |
) |
|
|
(160,680 |
) |
|
Investment in real estate – development/other |
|
|
(175,887 |
) |
|
|
(312,853 |
) |
|
Capital expenditures to real estate |
|
|
(89,297 |
) |
|
|
(74,450 |
) |
|
Non-real estate capital additions |
|
|
(654 |
) |
|
|
(3,259 |
) |
|
Interest capitalized for real estate under development |
|
|
(16,626 |
) |
|
|
(28,386 |
) |
|
Proceeds from disposition of real estate, net |
|
|
297,298 |
|
|
|
6,415,181 |
|
|
Investments in unconsolidated entities |
|
|
(2,488 |
) |
|
|
(1,829 |
) |
|
Distributions from unconsolidated entities – return of capital |
|
|
113 |
|
|
|
524 |
|
|
Proceeds from sale of investment securities and other investments |
|
|
— |
|
|
|
68,528 |
|
|
(Increase) in deposits on real estate acquisitions and investments, net |
|
|
(177,742 |
) |
|
|
(30,815 |
) |
|
(Increase) decrease in mortgage deposits |
|
|
(4,108 |
) |
|
|
46 |
|
|
Net cash (used for) provided by investing activities |
|
|
(226,457 |
) |
|
|
5,872,007 |
|
See accompanying notes
5
CONSOLIDATED STATEMENTS OF CASH FLOWS (Continued)
(Amounts in thousands)
(Unaudited)
|
|
|
Six Months Ended June 30, |
|
|||||
|
|
|
2017 |
|
|
2016 |
|
||
|
CASH FLOWS FROM FINANCING ACTIVITIES: |
|
|
|
|
|
|
|
|
|
Debt financing costs |
|
$ |
(2 |
) |
|
$ |
(437 |
) |
|
Mortgage deposits |
|
|
47,127 |
|
|
|
(3,971 |
) |
|
Mortgage notes payable, net: |
|
|
|
|
|
|
|
|
|
Lump sum payoffs |
|
|
(370,420 |
) |
|
|
(556,499 |
) |
|
Scheduled principal repayments |
|
|
(6,971 |
) |
|
|
(4,740 |
) |
|
Notes, net: |
|
|
|
|
|
|
|
|
|
Lump sum payoffs |
|
|
(394,077 |
) |
|
|
(1,500,000 |
) |
|
Line of credit and commercial paper: |
|
|
|
|
|
|
|
|
|
Line of credit proceeds |
|
|
890,000 |
|
|
|
246,000 |
|
|
Line of credit repayments |
|
|
(625,000 |
) |
|
|
(246,000 |
) |
|
Commercial paper proceeds |
|
|
2,608,895 |
|
|
|
1,324,784 |
|
|
Commercial paper repayments |
|
|
(2,131,500 |
) |
|
|
(1,712,472 |
) |
|
Proceeds from Employee Share Purchase Plan (ESPP) |
|
|
2,111 |
|
|
|
2,023 |
|
|
Proceeds from exercise of options |
|
|
8,143 |
|
|
|
26,141 |
|
|
Payment of offering costs |
|
|
(36 |
) |
|
— |
|
|
|
Other financing activities, net |
|
|
(40 |
) |
|
|
(33 |
) |
|
Contributions – Noncontrolling Interests – Partially Owned Properties |
|
|
125 |
|
|
— |
|
|
|
Contributions – Noncontrolling Interests – Operating Partnership |
|
|
— |
|
|
|
1 |
|
|
Distributions: |
|
|
|
|
|
|
|
|
|
Common Shares |
|
|
(369,244 |
) |
|
|
(3,306,704 |
) |
|
Preferred Shares |
|
|
(2,318 |
) |
|
|
(1,545 |
) |
|
Noncontrolling Interests – Operating Partnership |
|
|
(13,913 |
) |
|
|
(130,383 |
) |
|
Noncontrolling Interests – Partially Owned Properties |
|
|
(5,944 |
) |
|
|
(27,681 |
) |
|
Net cash (used for) financing activities |
|
|
(363,064 |
) |
|
|
(5,891,516 |
) |
|
Net (decrease) increase in cash and cash equivalents |
|
|
(39,488 |
) |
|
|
455,567 |
|
|
Cash and cash equivalents, beginning of period |
|
|
77,207 |
|
|
|
42,276 |
|
|
Cash and cash equivalents, end of period |
|
$ |
37,719 |
|
|
$ |
497,843 |
|
See accompanying notes
6
CONSOLIDATED STATEMENTS OF CASH FLOWS (Continued)
(Amounts in thousands)
(Unaudited)
|
|
|
Six Months Ended June 30, |
|
|||||
|
|
|
2017 |
|
|
2016 |
|
||
|
SUPPLEMENTAL INFORMATION: |
|
|
|
|
|
|
|
|
|
Cash paid for interest, net of amounts capitalized |
|
$ |
197,336 |
|
|
$ |
313,480 |
|
|
Net cash paid for income and other taxes |
|
$ |
624 |
|
|
$ |
1,166 |
|
|
Real estate acquisitions/dispositions/other: |
|
|
|
|
|
|
|
|
|
Mortgage loans assumed |
|
$ |
— |
|
|
$ |
43,400 |
|
|
Amortization of deferred financing costs: |
|
|
|
|
|
|
|
|
|
Other assets |
|
$ |
1,206 |
|
|
$ |
1,527 |
|
|
Mortgage notes payable, net |
|
$ |
1,378 |
|
|
$ |
2,617 |
|
|
Notes, net |
|
$ |
1,799 |
|
|
$ |
3,595 |
|
|
Amortization of discounts and premiums on debt: |
|
|
|
|
|
|
|
|
|
Mortgage notes payable, net |
|
$ |
195 |
|
|
$ |
(21,476 |
) |
|
Notes, net |
|
$ |
1,196 |
|
|
$ |
2,054 |
|
|
Line of credit and commercial paper |
|
$ |
1,968 |
|
|
$ |
412 |
|
|
Amortization of deferred settlements on derivative instruments: |
|
|
|
|
|
|
|
|
|
Other liabilities |
|
$ |
(5 |
) |
|
$ |
(72 |
) |
|
Accumulated other comprehensive income |
|
$ |
9,251 |
|
|
$ |
32,922 |
|
|
Write-off of pursuit costs: |
|
|
|
|
|
|
|
|
|
Investment in real estate, net |
|
$ |
1,505 |
|
|
$ |
2,072 |
|
|
Other assets |
|
$ |
21 |
|
|
$ |
390 |
|
|
Accounts payable and accrued expenses |
|
$ |
20 |
|
|
$ |
101 |
|
|
Loss from investments in unconsolidated entities: |
|
|
|
|
|
|
|
|
|
Investments in unconsolidated entities |
|
$ |
1,025 |
|
|
$ |
1,122 |
|
|
Other liabilities |
|
$ |
730 |
|
|
$ |
782 |
|
|
Realized/unrealized (gain) loss on derivative instruments: |
|
|
|
|
|
|
|
|
|
Other assets |
|
$ |
(2,877 |
) |
|
$ |
(8,390 |
) |
|
Notes, net |
|
$ |
(630 |
) |
|
$ |
8,390 |
|
|
Other liabilities |
|
$ |
— |
|
|
$ |
4,467 |
|
|
Accumulated other comprehensive income |
|
$ |
3,507 |
|
|
$ |
(4,467 |
) |
|
Investments in unconsolidated entities: |
|
|
|
|
|
|
|
|
|
Investments in unconsolidated entities |
|
$ |
(1,588 |
) |
|
$ |
(929 |
) |
|
Other liabilities |
|
$ |
(900 |
) |
|
$ |
(900 |
) |
|
Debt financing costs: |
|
|
|
|
|
|
|
|
|
Mortgage notes payable, net |
|
$ |
— |
|
|
$ |
(437 |
) |
|
Notes, net |
|
$ |
(2 |
) |
|
$ |
— |
|
|
Other: |
|
|
|
|
|
|
|
|
|
Foreign currency translation adjustments |
|
$ |
— |
|
|
$ |
(50 |
) |
See accompanying notes
7
CONSOLIDATED STATEMENT OF CHANGES IN EQUITY
(Amounts in thousands)
(Unaudited)
|
|
|
Six Months Ended |
|
|
|
|
|
June 30, 2017 |
|
|
|
SHAREHOLDERS’ EQUITY |
|
|
|
|
|
PREFERRED SHARES |
|
|
|
|
|
Balance, beginning of year |
|
$ |
37,280 |
|
|
Balance, end of period |
|
$ |
37,280 |
|
|
COMMON SHARES, $0.01 PAR VALUE |
|
|
|
|
|
Balance, beginning of year |
|
$ |
3,659 |
|
|
Conversion of OP Units into Common Shares |
|
|
11 |
|
|
Exercise of share options |
|
|
2 |
|
|
Share-based employee compensation expense: |
|
|
|
|
|
Restricted shares |
|
|
1 |
|
|
Balance, end of period |
|
$ |
3,673 |
|
|
PAID IN CAPITAL |
|
|
|
|
|
Balance, beginning of year |
|
$ |
8,758,422 |
|
|
Common Share Issuance: |
|
|
|
|
|
Conversion of OP Units into Common Shares |
|
|
14,611 |
|
|
Exercise of share options |
|
|
8,141 |
|
|
Employee Share Purchase Plan (ESPP) |
|
|
2,111 |
|
|
Share-based employee compensation expense: |
|
|
|
|
|
Restricted shares |
|
|
5,381 |
|
|
Share options |
|
|
5,979 |
|
|
ESPP discount |
|
|
414 |
|
|
Offering costs |
|
|
(36 |
) |
|
Supplemental Executive Retirement Plan (SERP) |
|
|
(666 |
) |
|
Change in market value of Redeemable Noncontrolling Interests – Operating Partnership |
|
|
30,351 |
|
|
Adjustment for Noncontrolling Interests ownership in Operating Partnership |
|
|
14,096 |
|
|
Balance, end of period |
|
$ |
8,838,804 |
|
|
RETAINED EARNINGS |
|
|
|
|
|
Balance, beginning of year |
|
$ |
1,543,626 |
|
|
Net income attributable to controlling interests |
|
|
339,783 |
|
|
Common Share distributions |
|
|
(369,964 |
) |
|
Preferred Share distributions |
|
|
(1,546 |
) |
|
Balance, end of period |
|
$ |
1,511,899 |
|
|
ACCUMULATED OTHER COMPREHENSIVE (LOSS) |
|
|
|
|
|
Balance, beginning of year |
|
$ |
(113,909 |
) |
|
Accumulated other comprehensive income – derivative instruments: |
|
|
|
|
|
Unrealized holding gains arising during the period |
|
|
3,507 |
|
|
Losses reclassified into earnings from other comprehensive income |
|
|
9,251 |
|
|
Balance, end of period |
|
$ |
(101,151 |
) |
See accompanying notes
8
CONSOLIDATED STATEMENT OF CHANGES IN EQUITY (Continued)
(Amounts in thousands)
(Unaudited)
|
|
|
Six Months Ended |
|
|
|
|
|
June 30, 2017 |
|
|
|
NONCONTROLLING INTERESTS |
|
|
|
|
|
OPERATING PARTNERSHIP |
|
|
|
|
|
Balance, beginning of year |
|
$ |
221,297 |
|
|
Conversion of OP Units held by Noncontrolling Interests into OP Units held by General Partner |
|
|
(14,622 |
) |
|
Equity compensation associated with Noncontrolling Interests |
|
|
5,869 |
|
|
Net income attributable to Noncontrolling Interests |
|
|
12,765 |
|
|
Distributions to Noncontrolling Interests |
|
|
(13,386 |
) |
|
Change in carrying value of Redeemable Noncontrolling Interests – Operating Partnership |
|
|
31,222 |
|
|
Adjustment for Noncontrolling Interests ownership in Operating Partnership |
|
|
(14,096 |
) |
|
Balance, end of period |
|
$ |
229,049 |
|
|
PARTIALLY OWNED PROPERTIES |
|
|
|
|
|
Balance, beginning of year |
|
$ |
10,609 |
|
|
Net income attributable to Noncontrolling Interests |
|
|
1,553 |
|
|
Contributions by Noncontrolling Interests |
|
|
125 |
|
|
Distributions to Noncontrolling Interests |
|
|
(5,984 |
) |
|
Balance, end of period |
|
$ |
6,303 |
|
See accompanying notes
9
ERP OPERATING LI MITED PARTNERSHIP
(Amounts in thousands)
(Unaudited)
|
|
|
June 30, |
|
|
December 31, |
|
||
|
|
|
2017 |
|
|
2016 |
|
||
|
ASSETS |
|
|
|
|
|
|
|
|
|
Investment in real estate |
|
|
|
|
|
|
|
|
|
Land |
|
$ |
5,927,949 |
|
|
$ |
5,899,862 |
|
|
Depreciable property |
|
|
19,123,571 |
|
|
|
18,730,579 |
|
|
Projects under development |
|
|
325,823 |
|
|
|
637,168 |
|
|
Land held for development |
|
|
112,474 |
|
|
|
118,816 |
|
|
Investment in real estate |
|
|
25,489,817 |
|
|
|
25,386,425 |
|
|
Accumulated depreciation |
|
|
(5,671,510 |
) |
|
|
(5,360,389 |
) |
|
Investment in real estate, net |
|
|
19,818,307 |
|
|
|
20,026,036 |
|
|
Cash and cash equivalents |
|
|
37,719 |
|
|
|
77,207 |
|
|
Investments in unconsolidated entities |
|
|
59,246 |
|
|
|
60,141 |
|
|
Deposits – restricted |
|
|
254,378 |
|
|
|
76,946 |
|
|
Escrow deposits – mortgage |
|
|
21,016 |
|
|
|
64,935 |
|
|
Other assets |
|
|
445,909 |
|
|
|
398,883 |
|
|
Total assets |
|
$ |
20,636,575 |
|
|
$ |
20,704,148 |
|
|
|
|
|
|
|
|
|
|
|
|
LIABILITIES AND CAPITAL |
|
|
|
|
|
|
|
|
|
Liabilities: |
|
|||||||
|
Mortgage notes payable, net |
|
$ |
3,743,363 |
|
|
$ |
4,119,181 |
|
|
Notes, net |
|
|
4,456,365 |
|
|
|
4,848,079 |
|
|
Line of credit and commercial paper |
|
|
764,361 |
|
|
|
19,998 |
|
|
Accounts payable and accrued expenses |
|
|
137,920 |
|
|
|
147,482 |
|
|
Accrued interest payable |
|
|
48,823 |
|
|
|
60,946 |
|
|
Other liabilities |
|
|
324,002 |
|
|
|
350,466 |
|
|
Security deposits |
|
|
63,648 |
|
|
|
62,624 |
|
|
Distributions payable |
|
|
191,717 |
|
|
|
192,296 |
|
|
Total liabilities |
|
|
9,730,199 |
|
|
|
9,801,072 |
|
|
|
|
|
|
|
|
|
|
|
|
Commitments and contingencies |
|
|
|
|
|
|
|
|
|
|
|
|
|
|
|
|
|
|
|
Redeemable Limited Partners |
|
|
380,519 |
|
|
|
442,092 |
|
|
Capital: |
|
|
|
|
|
|
|
|
|
Partners' Capital: |
|
|
|
|
|
|
|
|
|
Preference Units |
|
|
37,280 |
|
|
|
37,280 |
|
|
General Partner |
|
|
10,354,376 |
|
|
|
10,305,707 |
|
|
Limited Partners |
|
|
229,049 |
|
|
|
221,297 |
|
|
Accumulated other comprehensive (loss) |
|
|
(101,151 |
) |
|
|
(113,909 |
) |
|
Total partners' capital |
|
|
10,519,554 |
|
|
|
10,450,375 |
|
|
Noncontrolling Interests – Partially Owned Properties |
|
|
6,303 |
|
|
|
10,609 |
|
|
Total capital |
|
|
10,525,857 |
|
|
|
10,460,984 |
|
|
Total liabilities and capital |
|
$ |
20,636,575 |
|
|
$ |
20,704,148 |
|
See accompanying notes
10
ERP OPERATING LIMITED PARTNERSHIP
CONSOLIDATED STATEMENTS OF OPERATIONS AND COMPREHENSIVE INCOME
(Amounts in thousands except per Unit data)
(Unaudited)
|
|
|
Six Months Ended June 30, |
|
|
Quarter Ended June 30, |
|
||||||||||
|
|
|
2017 |
|
|
2016 |
|
|
2017 |
|
|
2016 |
|
||||
|
REVENUES |
|
|
|
|
|
|
|
|
|
|
|
|
|
|
|
|
|
Rental income |
|
$ |
1,216,219 |
|
|
$ |
1,211,104 |
|
|
$ |
612,299 |
|
|
$ |
594,939 |
|
|
Fee and asset management |
|
|
361 |
|
|
|
3,133 |
|
|
|
181 |
|
|
|
215 |
|
|
Total revenues |
|
|
1,216,580 |
|
|
|
1,214,237 |
|
|
|
612,480 |
|
|
|
595,154 |
|
|
EXPENSES |
|
|
|
|
|
|
|
|
|
|
|
|
|
|
|
|
|
Property and maintenance |
|
|
201,924 |
|
|
|
205,472 |
|
|
|
99,316 |
|
|
|
96,307 |
|
|
Real estate taxes and insurance |
|
|
169,231 |
|
|
|
157,611 |
|
|
|
87,503 |
|
|
|
77,415 |
|
|
Property management |
|
|
43,841 |
|
|
|
44,486 |
|
|
|
21,589 |
|
|
|
20,991 |
|
|
General and administrative |
|
|
27,799 |
|
|
|
35,013 |
|
|
|
13,626 |
|
|
|
18,296 |
|
|
Depreciation |
|
|
358,864 |
|
|
|
349,012 |
|
|
|
179,896 |
|
|
|
176,127 |
|
|
Total expenses |
|
|
801,659 |
|
|
|
791,594 |
|
|
|
401,930 |
|
|
|
389,136 |
|
|
|
|
|
|
|
|
|
|
|
|
|
|
|
|
|
|
|
|
Operating income |
|
|
414,921 |
|
|
|
422,643 |
|
|
|
210,550 |
|
|
|
206,018 |
|
|
|
|
|
|
|
|
|
|
|
|
|
|
|
|
|
|
|
|
Interest and other income |
|
|
1,763 |
|
|
|
59,583 |
|
|
|
1,162 |
|
|
|
56,525 |
|
|
Other expenses |
|
|
(2,132 |
) |
|
|
(4,060 |
) |
|
|
(1,042 |
) |
|
|
(1,504 |
) |
|
Interest: |
|
|
|
|
|
|
|
|
|
|
|
|
|
|
|
|
|
Expense incurred, net |
|
|
(197,434 |
) |
|
|
(299,964 |
) |
|
|
(91,224 |
) |
|
|
(86,472 |
) |
|
Amortization of deferred financing costs |
|
|
(4,383 |
) |
|
|
(7,739 |
) |
|
|
(2,087 |
) |
|
|
(2,345 |
) |
|
Income before income and other taxes, (loss) from investments in unconsolidated entities, net gain (loss) on sales of real estate properties and land parcels and discontinued operations |
|
|
212,735 |
|
|
|
170,463 |
|
|
|
117,359 |
|
|
|
172,222 |
|
|
Income and other tax (expense) benefit |
|
|
(482 |
) |
|
|
(763 |
) |
|
|
(220 |
) |
|
|
(413 |
) |
|
(Loss) from investments in unconsolidated entities |
|
|
(1,755 |
) |
|
|
(1,904 |
) |
|
|
(682 |
) |
|
|
(800 |
) |
|
Net gain on sales of real estate properties |
|
|
124,433 |
|
|
|
3,780,835 |
|
|
|
87,726 |
|
|
|
57,356 |
|
|
Net gain (loss) on sales of land parcels |
|
|
19,170 |
|
|
|
11,722 |
|
|
|
(23 |
) |
|
|
— |
|
|
Income from continuing operations |
|
|
354,101 |
|
|
|
3,960,353 |
|
|
|
204,160 |
|
|
|
228,365 |
|
|
Discontinued operations, net |
|
|
— |
|
|
|
(122 |
) |
|
|
— |
|
|
|
35 |
|
|
Net income |
|
|
354,101 |
|
|
|
3,960,231 |
|
|
|
204,160 |
|
|
|
228,400 |
|
|
Net (income) attributable to Noncontrolling Interests – Partially Owned Properties |
|
|
(1,553 |
) |
|
|
(1,545 |
) |
|
|
(765 |
) |
|
|
(781 |
) |
|
Net income attributable to controlling interests |
|
$ |
352,548 |
|
|
$ |
3,958,686 |
|
|
$ |
203,395 |
|
|
$ |
227,619 |
|
|
ALLOCATION OF NET INCOME: |
|
|
|
|
|
|
|
|
|
|
|
|
|
|
|
|
|
Preference Units |
|
$ |
1,546 |
|
|
$ |
1,545 |
|
|
$ |
773 |
|
|
$ |
772 |
|
|
|
|
|
|
|
|
|
|
|
|
|
|
|
|
|
|
|
|
General Partner |
|
$ |
338,237 |
|
|
$ |
3,805,052 |
|
|
$ |
195,268 |
|
|
$ |
218,067 |
|
|
Limited Partners |
|
|
12,765 |
|
|
|
152,089 |
|
|
|
7,354 |
|
|
|
8,780 |
|
|
Net income available to Units |
|
$ |
351,002 |
|
|
$ |
3,957,141 |
|
|
$ |
202,622 |
|
|
$ |
226,847 |
|
|
Earnings per Unit – basic: |
|
|
|
|
|
|
|
|
|
|
|
|
|
|
|
|
|
Income from continuing operations available to Units |
|
$ |
0.92 |
|
|
$ |
10.43 |
|
|
$ |
0.53 |
|
|
$ |
0.60 |
|
|
Net income available to Units |
|
$ |
0.92 |
|
|
$ |
10.43 |
|
|
$ |
0.53 |
|
|
$ |
0.60 |
|
|
Weighted average Units outstanding |
|
|
379,619 |
|
|
|
378,612 |
|
|
|
379,733 |
|
|
|
378,934 |
|
|
Earnings per Unit – diluted: |
|
|
|
|
|
|
|
|
|
|
|
|
|
|
|
|
|
Income from continuing operations available to Units |
|
$ |
0.92 |
|
|
$ |
10.36 |
|
|
$ |
0.53 |
|
|
$ |
0.59 |
|
|
Net income available to Units |
|
$ |
0.92 |
|
|
$ |
10.36 |
|
|
$ |
0.53 |
|
|
$ |
0.59 |
|
|
Weighted average Units outstanding |
|
|
382,505 |
|
|
|
382,012 |
|
|
|
382,692 |
|
|
|
382,065 |
|
|
|
|
|
|
|
|
|
|
|
|
|
|
|
|
|
|
|
|
Distributions declared per Unit outstanding |
|
$ |
1.0075 |
|
|
$ |
9.0075 |
|
|
$ |
0.50375 |
|
|
$ |
0.50375 |
|
See accompanying notes
11
ERP OPERATING LIMITED PARTNERSHIP
CONSOLIDATED STATEMENTS OF OPERATIONS AND COMPREHENSIVE INCOME (Continued)
(Amounts in thousands except per Unit data)
(Unaudited)
|
|
|
Six Months Ended June 30, |
|
|
Quarter Ended June 30, |
|
||||||||||
|
|
|
2017 |
|
|
2016 |
|
|
2017 |
|
|
2016 |
|
||||
|
Comprehensive income |
|
|
|
|
|
|
|
|
|
|
|
|
|
|
|
|
|
Net income |
|
$ |
354,101 |
|
|
$ |
3,960,231 |
|
|
$ |
204,160 |
|
|
$ |
228,400 |
|
|
Other comprehensive income (loss): |
|
|
|
|
|
|
|
|
|
|
|
|
|
|
|
|
|
Other comprehensive income (loss) – derivative instruments: |
|
|
|
|
|
|
|
|
|
|
|
|
|
|
|
|
|
Unrealized holding gains (losses) arising during the period |
|
|
3,507 |
|
|
|
(4,467 |
) |
|
|
3,507 |
|
|
|
(1,561 |
) |
|
Losses reclassified into earnings from other comprehensive income |
|
|
9,251 |
|
|
|
32,922 |
|
|
|
4,668 |
|
|
|
4,268 |
|
|
Other comprehensive income (loss) – foreign currency: |
|
|
|
|
|
|
|
|
|
|
|
|
|
|
|
|
|
Currency translation adjustments arising during the period |
|
|
— |
|
|
|
50 |
|
|
|
— |
|
|
|
(25 |
) |
|
Other comprehensive income |
|
|
12,758 |
|
|
|
28,505 |
|
|
|
8,175 |
|
|
|
2,682 |
|
|
Comprehensive income |
|
|
366,859 |
|
|
|
3,988,736 |
|
|
|
212,335 |
|
|
|
231,082 |
|
|
Comprehensive (income) attributable to Noncontrolling Interests – Partially Owned Properties |
|
|
(1,553 |
) |
|
|
(1,545 |
) |
|
|
(765 |
) |
|
|
(781 |
) |
|
Comprehensive income attributable to controlling interests |
|
$ |
365,306 |
|
|
$ |
3,987,191 |
|
|
$ |
211,570 |
|
|
$ |
230,301 |
|
See accompanying notes
12
ERP OPERATING LIMITED PARTNERSHIP
CONSOLIDATED STATEMENTS OF CASH FLOWS
(Amounts in thousands)
(Unaudited)
|
|
|
Six Months Ended June 30, |
|
|||||
|
|
|
2017 |
|
|
2016 |
|
||
|
CASH FLOWS FROM OPERATING ACTIVITIES: |
|
|
|
|
|
|
|
|
|
Net income |
|
$ |
354,101 |
|
|
$ |
3,960,231 |
|
|
Adjustments to reconcile net income to net cash provided by operating activities: |
|
|
|
|
|
|
|
|
|
Depreciation |
|
|
358,864 |
|
|
|
349,012 |
|
|
Amortization of deferred financing costs |
|
|
4,383 |
|
|
|
7,739 |
|
|
Amortization of above/below market leases |
|
|
1,717 |
|
|
|
1,708 |
|
|
Amortization of discounts and premiums on debt |
|
|
3,359 |
|
|
|
(19,010 |
) |
|
Amortization of deferred settlements on derivative instruments |
|
|
9,246 |
|
|
|
32,850 |
|
|
Write-off of pursuit costs |
|
|
1,546 |
|
|
|
2,563 |
|
|
Loss from investments in unconsolidated entities |
|
|
1,755 |
|
|
|
1,904 |
|
|
Distributions from unconsolidated entities – return on capital |
|
|
1,345 |
|
|
|
1,482 |
|
|
Net (gain) on sales of investment securities and other investments |
|
|
— |
|
|
|
(55,156 |
) |
|
Net (gain) on sales of real estate properties |
|
|
(124,433 |
) |
|
|
(3,780,835 |
) |
|
Net (gain) on sales of land parcels |
|
|
(19,170 |
) |
|
|
(11,722 |
) |
|
Net (gain) on sales of discontinued operations |
|
|
— |
|
|
|
(15 |
) |
|
Compensation paid with Company Common Shares |
|
|
15,027 |
|
|
|
20,729 |
|
|
Changes in assets and liabilities: |
|
|
|
|
|
|
|
|
|
Decrease in deposits – restricted |
|
|
310 |
|
|
|
9,121 |
|
|
Decrease (increase) in mortgage deposits |
|
|
900 |
|
|
|
(840 |
) |
|
(Increase) decrease in other assets |
|
|
(39,845 |
) |
|
|
29,944 |
|
|
Increase in accounts payable and accrued expenses |
|
|
24,503 |
|
|
|
7,837 |
|
|
(Decrease) in accrued interest payable |
|
|
(12,123 |
) |
|
|
(27,046 |
) |
|
(Decrease) in other liabilities |
|
|
(32,476 |
) |
|
|
(42,080 |
) |
|
Increase (decrease) in security deposits |
|
|
1,024 |
|
|
|
(13,340 |
) |
|
Net cash provided by operating activities |
|
|
550,033 |
|
|
|
475,076 |
|
|
CASH FLOWS FROM INVESTING ACTIVITIES: |
|
|
|
|
|
|
|
|
|
Investment in real estate – acquisitions |
|
|
(57,066 |
) |
|
|
(160,680 |
) |
|
Investment in real estate – development/other |
|
|
(175,887 |
) |
|
|
(312,853 |
) |
|
Capital expenditures to real estate |
|
|
(89,297 |
) |
|
|
(74,450 |
) |
|
Non-real estate capital additions |
|
|
(654 |
) |
|
|
(3,259 |
) |
|
Interest capitalized for real estate under development |
|
|
(16,626 |
) |
|
|
(28,386 |
) |
|
Proceeds from disposition of real estate, net |
|
|
297,298 |
|
|
|
6,415,181 |
|
|
Investments in unconsolidated entities |
|
|
(2,488 |
) |
|
|
(1,829 |
) |
|
Distributions from unconsolidated entities – return of capital |
|
|
113 |
|
|
|
524 |
|
|
Proceeds from sale of investment securities and other investments |
|
|
— |
|
|
|
68,528 |
|
|
(Increase) in deposits on real estate acquisitions and investments, net |
|
|
(177,742 |
) |
|
|
(30,815 |
) |
|
(Increase) decrease in mortgage deposits |
|
|
(4,108 |
) |
|
|
46 |
|
|
Net cash (used for) provided by investing activities |
|
|
(226,457 |
) |
|
|
5,872,007 |
|
See accompanying notes
13
ERP OPERATING LIMITED PARTNERSHIP
CONSOLIDATED STATEMENTS OF CASH FLOWS (Continued)
(Amounts in thousands)
(Unaudited)
|
|
|
Six Months Ended June 30, |
|
|||||
|
|
|
2017 |
|
|
2016 |
|
||
|
CASH FLOWS FROM FINANCING ACTIVITIES: |
|
|
|
|
|
|
|
|
|
Debt financing costs |
|
$ |
(2 |
) |
|
$ |
(437 |
) |
|
Mortgage deposits |
|
|
47,127 |
|
|
|
(3,971 |
) |
|
Mortgage notes payable, net: |
|
|
|
|
|
|
|
|
|
Lump sum payoffs |
|
|
(370,420 |
) |
|
|
(556,499 |
) |
|
Scheduled principal repayments |
|
|
(6,971 |
) |
|
|
(4,740 |
) |
|
Notes, net: |
|
|
|
|
|
|
|
|
|
Lump sum payoffs |
|
|
(394,077 |
) |
|
|
(1,500,000 |
) |
|
Line of credit and commercial paper: |
|
|
|
|
|
|
|
|
|
Line of credit proceeds |
|
|
890,000 |
|
|
|
246,000 |
|
|
Line of credit repayments |
|
|
(625,000 |
) |
|
|
(246,000 |
) |
|
Commercial paper proceeds |
|
|
2,608,895 |
|
|
|
1,324,784 |
|
|
Commercial paper repayments |
|
|
(2,131,500 |
) |
|
|
(1,712,472 |
) |
|
Proceeds from EQR's Employee Share Purchase Plan (ESPP) |
|
|
2,111 |
|
|
|
2,023 |
|
|
Proceeds from exercise of EQR options |
|
|
8,143 |
|
|
|
26,141 |
|
|
Payment of offering costs |
|
|
(36 |
) |
|
— |
|
|
|
Other financing activities, net |
|
|
(40 |
) |
|
|
(33 |
) |
|
Contributions – Noncontrolling Interests – Partially Owned Properties |
|
|
125 |
|
|
— |
|
|
|
Contributions – Limited Partners |
|
|
— |
|
|
|
1 |
|
|
Distributions: |
|
|
|
|
|
|
|
|
|
OP Units – General Partner |
|
|
(369,244 |
) |
|
|
(3,306,704 |
) |
|
Preference Units |
|
|
(2,318 |
) |
|
|
(1,545 |
) |
|
OP Units – Limited Partners |
|
|
(13,913 |
) |
|
|
(130,383 |
) |
|
Noncontrolling Interests – Partially Owned Properties |
|
|
(5,944 |
) |
|
|
(27,681 |
) |
|
Net cash (used for) financing activities |
|
|
(363,064 |
) |
|
|
(5,891,516 |
) |
|
Net (decrease) increase in cash and cash equivalents |
|
|
(39,488 |
) |
|
|
455,567 |
|
|
Cash and cash equivalents, beginning of period |
|
|
77,207 |
|
|
|
42,276 |
|
|
Cash and cash equivalents, end of period |
|
$ |
37,719 |
|
|
$ |
497,843 |
|
See accompanying notes
14
ERP OPERATING LIMITED PARTNERSHIP
CONSOLIDATED STATEMENTS OF CASH FLOWS (Continued)
(Amounts in thousands)
(Unaudited)
|
|
|
Six Months Ended June 30, |
|
|||||
|
|
|
2017 |
|
|
2016 |
|
||
|
SUPPLEMENTAL INFORMATION: |
|
|
|
|
|
|
|
|
|
Cash paid for interest, net of amounts capitalized |
|
$ |
197,336 |
|
|
$ |
313,480 |
|
|
Net cash paid for income and other taxes |
|
$ |
624 |
|
|
$ |
1,166 |
|
|
Real estate acquisitions/dispositions/other: |
|
|
|
|
|
|
|
|
|
Mortgage loans assumed |
|
$ |
— |
|
|
$ |
43,400 |
|
|
Amortization of deferred financing costs: |
|
|
|
|
|
|
|
|
|
Other assets |
|
$ |
1,206 |
|
|
$ |
1,527 |
|
|
Mortgage notes payable, net |
|
$ |
1,378 |
|
|
$ |
2,617 |
|
|
Notes, net |
|
$ |
1,799 |
|
|
$ |
3,595 |
|
|
Amortization of discounts and premiums on debt: |
|
|
|
|
|
|
|
|
|
Mortgage notes payable, net |
|
$ |
195 |
|
|
$ |
(21,476 |
) |
|
Notes, net |
|
$ |
1,196 |
|
|
$ |
2,054 |
|
|
Line of credit and commercial paper |
|
$ |
1,968 |
|
|
$ |
412 |
|
|
Amortization of deferred settlements on derivative instruments: |
|
|
|
|
|
|
|
|
|
Other liabilities |
|
$ |
(5 |
) |
|
$ |
(72 |
) |
|
Accumulated other comprehensive income |
|
$ |
9,251 |
|
|
$ |
32,922 |
|
|
Write-off of pursuit costs: |
|
|
|
|
|
|
|
|
|
Investment in real estate, net |
|
$ |
1,505 |
|
|
$ |
2,072 |
|
|
Other assets |
|
$ |
21 |
|
|
$ |
390 |
|
|
Accounts payable and accrued expenses |
|
$ |
20 |
|
|
$ |
101 |
|
|
Loss from investments in unconsolidated entities: |
|
|
|
|
|
|
|
|
|
Investments in unconsolidated entities |
|
$ |
1,025 |
|
|
$ |
1,122 |
|
|
Other liabilities |
|
$ |
730 |
|
|
$ |
782 |
|
|
Realized/unrealized (gain) loss on derivative instruments: |
|
|
|
|
|
|
|
|
|
Other assets |
|
$ |
(2,877 |
) |
|
$ |
(8,390 |
) |
|
Notes, net |
|
$ |
(630 |
) |
|
$ |
8,390 |
|
|
Other liabilities |
|
$ |
— |
|
|
$ |
4,467 |
|
|
Accumulated other comprehensive income |
|
$ |
3,507 |
|
|
$ |
(4,467 |
) |
|
Investments in unconsolidated entities: |
|
|
|
|
|
|
|
|
|
Investments in unconsolidated entities |
|
$ |
(1,588 |
) |
|
$ |
(929 |
) |
|
Other liabilities |
|
$ |
(900 |
) |
|
$ |
(900 |
) |
|
Debt financing costs: |
|
|
|
|
|
|
|
|
|
Mortgage notes payable, net |
|
$ |
— |
|
|
$ |
(437 |
) |
|
Notes, net |
|
$ |
(2 |
) |
|
$ |
— |
|
|
Other: |
|
|
|
|
|
|
|
|
|
Foreign currency translation adjustments |
|
$ |
— |
|
|
$ |
(50 |
) |
See accompanying notes
15
ERP OPERATING LIMITED PARTNERSHIP
CONSOLIDATED STATEMENT OF CHANGES IN CAPITAL
(Amounts in thousands)
(Unaudited)
|
|
|
Six Months Ended |
|
|
|
|
|
June 30, 2017 |
|
|
|
PARTNERS' CAPITAL |
|
|
|
|
|
PREFERENCE UNITS |
|
|
|
|
|
Balance, beginning of year |
|
$ |
37,280 |
|
|
Balance, end of period |
|
$ |
37,280 |
|
|
GENERAL PARTNER |
|
|
|
|
|
Balance, beginning of year |
|
$ |
10,305,707 |
|
|
OP Unit Issuance: |
|
|
|
|
|
Conversion of OP Units held by Limited Partners into OP Units held by General Partner |
|
|
14,622 |
|
|
Exercise of EQR share options |
|
|
8,143 |
|
|
EQR's Employee Share Purchase Plan (ESPP) |
|
|
2,111 |
|
|
Share-based employee compensation expense: |
|
|
|
|
|
EQR restricted shares |
|
|
5,382 |
|
|
EQR share options |
|
|
5,979 |
|
|
EQR ESPP discount |
|
|
414 |
|
|
Net income available to Units – General Partner |
|
|
338,237 |
|
|
OP Units – General Partner distributions |
|
|
(369,964 |
) |
|
Offering costs |
|
|
(36 |
) |
|
Supplemental Executive Retirement Plan (SERP) |
|
|
(666 |
) |
|
Change in market value of Redeemable Limited Partners |
|
|
30,351 |
|
|
Adjustment for Limited Partners ownership in Operating Partnership |
|
|
14,096 |
|
|
Balance, end of period |
|
$ |
10,354,376 |
|
|
LIMITED PARTNERS |
|
|
|
|
|
Balance, beginning of year |
|
$ |
221,297 |
|
|
Conversion of OP Units held by Limited Partners into OP Units held by General Partner |
|
|
(14,622 |
) |
|
Equity compensation associated with Units – Limited Partners |
|
|
5,869 |
|
|
Net income available to Units – Limited Partners |
|
|
12,765 |
|
|
Units – Limited Partners distributions |
|
|
(13,386 |
) |
|
Change in carrying value of Redeemable Limited Partners |
|
|
31,222 |
|
|
Adjustment for Limited Partners ownership in Operating Partnership |
|
|
(14,096 |
) |
|
Balance, end of period |
|
$ |
229,049 |
|
|
ACCUMULATED OTHER COMPREHENSIVE (LOSS) |
|
|
|
|
|
Balance, beginning of year |
|
$ |
(113,909 |
) |
|
Accumulated other comprehensive income – derivative instruments: |
|
|
|
|
|
Unrealized holding gains arising during the period |
|
|
3,507 |
|
|
Losses reclassified into earnings from other comprehensive income |
|
|
9,251 |
|
|
Balance, end of period |
|
$ |
(101,151 |
) |
See accompanying notes
16
ERP OPERATING LIMITED PARTNERSHIP
CONSOLIDATED STATEMENT OF CHANGES IN CAPITAL (Continued)
(Amounts in thousands)
(Unaudited)
|
|
|
Six Months Ended |
|
|
|
|
|
June 30, 2017 |
|
|
|
NONCONTROLLING INTERESTS |
|
|
|
|
|
NONCONTROLLING INTERESTS – PARTIALLY OWNED PROPERTIES |
|
|
|
|
|
Balance, beginning of year |
|
$ |
10,609 |
|
|
Net income attributable to Noncontrolling Interests |
|
|
1,553 |
|
|
Contributions by Noncontrolling Interests |
|
|
125 |
|
|
Distributions to Noncontrolling Interests |
|
|
(5,984 |
) |
|
Balance, end of period |
|
$ |
6,303 |
|
See accompanying notes
17
ERP OPERATING LIMITED PARTNERSHIP
NOTES TO CONSOLIDATED FINANCIAL STATEMENTS
(Unaudited)
Equity Residential (“EQR”), a Maryland real estate investment trust (“REIT”) formed in March 1993, is an S&P 500 company focused on the acquisition, development and management of rental apartment properties in urban and high-density suburban coastal gateway markets. ERP Operating Limited Partnership ("ERPOP"), an Illinois limited partnership, was formed in May 1993 to conduct the multifamily residential property business of Equity Residential. EQR has elected to be taxed as a REIT. References to the "Company," "we," "us" or "our" mean collectively EQR, ERPOP and those entities/subsidiaries owned or controlled by EQR and/or ERPOP. References to the "Operating Partnership" mean collectively ERPOP and those entities/subsidiaries owned or controlled by ERPOP. Unless otherwise indicated, the notes to consolidated financial statements apply to both the Company and the Operating Partnership.
EQR is the general partner of, and as of June 30, 2017 owned an approximate 96.4% ownership interest in, ERPOP. All of the Company's property ownership, development and related business operations are conducted through the Operating Partnership and EQR has no material assets or liabilities other than its investment in ERPOP. EQR issues public equity from time to time, the net proceeds of which it is obligated to contribute to ERPOP, but does not have any indebtedness as all debt is incurred by the Operating Partnership. The Operating Partnership holds substantially all of the assets of the Company, including the Company's ownership interests in its joint ventures. The Operating Partnership conducts the operations of the business and is structured as a partnership with no publicly traded equity.
As of June 30, 2017, the Company, directly or indirectly through investments in title holding entities, owned all or a portion of 301 properties located in 10 states and the District of Columbia consisting of 77,034 apartment units. The ownership breakdown includes (table does not include various uncompleted development properties):
|
|
|
Properties |
|
|
Apartment Units |
|
||
|
Wholly Owned Properties |
|
|
279 |
|
|
|
72,021 |
|
|
Master-Leased Properties – Consolidated |
|
|
3 |
|
|
|
853 |
|
|
Partially Owned Properties – Consolidated |
|
|
17 |
|
|
|
3,215 |
|
|
Partially Owned Properties – Unconsolidated |
|
|
2 |
|
|
|
945 |
|
|
|
|
|
301 |
|
|
|
77,034 |
|
Basis of Presentation
The accompanying unaudited condensed consolidated financial statements have been prepared in accordance with accounting principles generally accepted in the United States for interim financial information and with the instructions to Form 10-Q and Article 10 of Regulation S-X. Accordingly, they do not include all of the information and footnotes required by accounting principles generally accepted in the United States for complete financial statements. In the opinion of management, all adjustments (consisting of normal recurring accruals) and certain reclassifications considered necessary for a fair presentation have been included. Certain reclassifications have been made to the prior period financial statements in order to conform to the current year presentation. These reclassifications did not have an impact on net income previously reported. Operating results for the six months ended June 30, 2017 are not necessarily indicative of the results that may be expected for the year ending December 31, 2017.
In preparation of the Company’s financial statements in conformity with accounting principles generally accepted in the United States, management makes estimates and assumptions that affect the reported amounts of assets and liabilities and disclosure of contingent assets and liabilities at the date of the financial statements as well as the reported amounts of revenues and expenses during the reporting period. Actual results could differ from these estimates.
The balance sheets at December 31, 2016 have been derived from the audited financial statements at that date but do not include all of the information and footnotes required by accounting principles generally accepted in the United States for complete financial statements.
18
For further information, i ncluding definitions of capitalized terms not defined herein, refer to the consolidated financial statements and footnotes thereto included in the Company’s and the Operating Partnership's Annual Report on Form 10-K for the year ended December 31, 2016.
Income and Other Taxes
Due to the structure of EQR as a REIT and the nature of the operations of its operating properties, no provision for federal income taxes has been made at the EQR level. In addition, ERPOP generally is not liable for federal income taxes as the partners recognize their proportionate share of income or loss in their tax returns; therefore no provision for federal income taxes has been made at the ERPOP level. Historically, the Company has generally only incurred certain state and local income, excise and franchise taxes. The Company has elected Taxable REIT Subsidiary (“TRS”) status for certain of its corporate subsidiaries and as a result, these entities will incur both federal and state income taxes on any taxable income of such entities after consideration of any net operating losses.
Deferred tax assets and liabilities applicable to the TRS are recognized for future tax consequences attributable to differences between the financial statement carrying amounts of existing assets and liabilities and their respective tax bases. These assets and liabilities are measured using enacted tax rates for which the temporary differences are expected to be recovered or settled. The effects of changes in tax rates on deferred tax assets and liabilities are recognized in earnings in the period enacted. The Company’s deferred tax assets are generally the result of tax affected suspended interest deductions, net operating losses, differing depreciable lives on capitalized assets and the timing of expense recognition for certain accrued liabilities. As of June 30, 2017, the Company has recorded a deferred tax asset, which is fully offset by a valuation allowance due to the uncertainty of realization. The Company currently anticipates electing REIT status for its primary TRS upon filing the 2016 tax return in the third quarter of 2017. This election will be retroactive to January 1, 2016.
Recently Issued Accounting Pronouncements
In May 2014, the Financial Accounting Standards Board (the "FASB") issued a comprehensive new revenue recognition standard entitled Revenue from Contracts with Customers that will supersede nearly all existing revenue recognition guidance. The new standard specifically excludes lease revenue. The new standard’s core principle is that a company will recognize revenue when it transfers promised goods or services to customers in an amount that reflects the consideration to which the company expects to be entitled in exchange for those goods or services. Companies will likely need to use more judgment and make more estimates than under current revenue recognition guidance. These may include identifying performance obligations in the contract, estimating the amount of variable consideration, if any, to include in the transaction price and allocating the transaction price to each separate performance obligation. The new standard may be applied retrospectively to each prior period presented or prospectively with the cumulative effect, if any, recognized as of the date of adoption. The Company anticipates selecting the modified retrospective transition method with a cumulative effect recognized as of the date of adoption and will adopt the new standard effective January 1, 2018, when effective. The Company is continuing to evaluate the standard; however, we do not expect its adoption to have a significant impact on the consolidated financial statements, as in excess of 90% of total revenues consist of rental income from leasing arrangements, which is specifically excluded from the standard. In addition, the Company's fee and asset management activities are immaterial now that it sold its interest in Joint Base Lewis McChord in 2016 and given the nature of its disposition transactions, there should be no changes in accounting under the new standard.
In January 2016, the FASB issued a new standard which requires companies to measure all equity securities with readily determinable fair values at fair value on the balance sheet, with changes in fair value recognized in net income. The new standard will be effective for the Company beginning on January 1, 2018. The Company does not expect that this will have a material effect on its consolidated results of operations or financial position.
In February 2016, the FASB issued a new leases standard which sets out principles for the recognition, measurement, presentation and disclosure of leases for both parties to a contract (i.e. lessors and lessees). The new standard requires the following:
|
|
• |
Lessors – Leases will be accounted for using an approach that is substantially equivalent to existing guidance for operating, sales-type and financing leases, but aligned with the new revenue recognition standard. Lessors will be required to allocate lease payments to separate lease and non-lease components of each lease agreement, with the non-lease components evaluated under the new revenue recognition standard. |
19
The new standard will be effective for the Company beginning on January 1, 2019, with early adoption permitted, though the Company currently anticipates adopting the new standard on the effective date. The new standard must be adopted using a modified retrospective method, which requires application of the new guidance at the beginning of the earliest comparative period presented and provides for certain practical expedients, which the Company currently anticipates electing. The Company anticipates that its residential and retail/commercial leases where it is the lessor will continue to be accounted for as operating leases under the new standard. Therefore, the Company does not currently anticipate significant changes in the accounting for its lease revenues. The Company is also the lessee under various corporate office and ground leases, which it will be required to recognize right of use assets and related lease liabilities on its consolidated balance sheets upon adoption. The Company currently anticipates that its corporate office leases where it is the lessee will continue to be accounted for as operating leases under the new standard. Based on its anticipated election of the practical expedients, the Company would not be required to reassess the classification of existing ground leases and therefore these leases would continue to be accounted for as operating leases. However, in the event we modify existing ground leases and/or enter into new ground leases after adoption of the new standard, such leases will likely be classified as finance leases. The Company will continue to evaluate the impact of adopting the new leases standard on its consolidated results of operations and financial position.
In June 2016, the FASB issued a new standard which requires companies to adopt a new approach for estimating credit losses on certain types of financial instruments, such as trade and other receivables and loans. The standard will require entities to estimate a lifetime expected credit loss for most financial instruments, including trade receivables. The new standard will be effective for the Company beginning on January 1, 2020, with early adoption permitted beginning January 1, 2019. The Company is currently evaluating the impact of adopting the new standard on its consolidated results of operations and financial position.
In August 2016 and October 2016, the FASB issued new standards to clarify how specific transactions are classified and presented on the statement of cash flows. Among other clarifications, the new standards specifically provide guidance for the following items within the statement of cash flows which have required significant judgment in the past:
|
|
• |
Cash payments related to debt prepayments or extinguishment costs are to be classified within financing activities; |
|
|
• |
The portion of the cash payment made to settle a zero-coupon bond or a bond with an insignificant cash coupon attributable to accreted interest related to a debt discount is to be classified as a cash outflow within operating activities, and the portion attributable to the principal is to be classified within financing activities; |
|
|
• |
Insurance settlement proceeds are to be classified based on the nature of the loss; |
|
|
• |
Companies must elect to classify distributions received from equity method investees using either a cumulative earnings approach or a look-through approach and the election must be disclosed; and |
|
|
• |
Restricted cash will be included with cash and cash equivalents on the statement of cash flows. Total cash and cash equivalents and restricted cash are to be reconciled to the related line items on the balance sheet. |
The new standards must be applied retrospectively to all periods presented in the consolidated financial statements and they will be effective for the Company beginning on January 1, 2018, with early adoption permitted. The Company is currently evaluating the impact of adopting the new standards on its consolidated results of operations and financial position.
In February 2017, the FASB issued a new standard which clarifies the accounting treatment for partial sales of nonfinancial assets (i.e. real estate). The standard clarifies that partial sales transactions include contributions of nonfinancial assets to a joint venture or other noncontrolled investee. Companies must recognize a full gain or loss on transfers of nonfinancial assets to equity method investees. The standard requires companies to derecognize distinct nonfinancial assets or distinct in substance nonfinancial assets in partial sale transactions when it does not have a controlling financial interest in the legal entity that holds the asset and transfers control of the asset. Once the distinct nonfinancial asset is transferred, the company is required to measure any non-controlling interest it receives or retains at fair value and recognize a full gain or loss on the transaction. If a company transfers ownership interests in a consolidated subsidiary and continues to maintain a controlling financial interest, the company does not derecognize the assets or liabilities, and accounts for the transaction as an equity transaction and no gain or loss is recognized. The new standard will be effective for the Company beginning on January 1, 2018 and early
20
adoption was permitted beginning on January 1, 2017. The Company anticipates adopting the new standard concu rrently with the new revenue recognition standard. The new standard may be applied retrospectively to each prior period presented or prospectively with the cumulative effect recognized as of the date of adoption. The Company is currently evaluating the i mpact of adopting the new standard on its consolidated results of operations and financial position.
Recently Adopted Accounting Pronouncements
In February 2015, the FASB issued new consolidation guidance which makes changes to both the variable interest model and the voting model. Among other changes, the new standard specifically eliminated the presumption in the current voting model that a general partner controls a limited partnership or similar entity unless that presumption can be overcome. Generally, only a single limited partner that is able to exercise substantive kick-out rights will consolidate. The Company adopted this new standard as required effective January 1, 2016. While adoption of the new standard did not result in any changes to conclusions about whether a joint venture was consolidated or unconsolidated, the Company has determined that certain of its joint ventures and the Operating Partnership will now qualify as variable interest entities ("VIEs") and therefore will require additional disclosures. See Note 6 for further discussion.
In March 2016, the FASB issued a new standard which simplifies several aspects of the accounting for employee share-based payment transactions, including income tax consequences, classification of awards as equity or liability, statement of cash flows classification and policy election options for forfeitures. The Company adopted this new standard as required effective January 1, 2017. The Company will continue to estimate the number of awards expected to be forfeited and adjust the estimate when it is no longer probable that the employee will fulfill the service condition, as was required under the old standard. The adoption of this standard did not have a material impact on our consolidated results of operations or financial position.
In January 2017, the FASB issued a new standard which clarifies the definition of a business. The standard's objective is to add additional guidance that assists companies in determining whether transactions should be accounted for as an asset acquisition or a business combination. The new standard first requires an entity to evaluate if substantially all of the fair value of the gross assets acquired is concentrated in a single identifiable asset or a group of similar identifiable assets. If this threshold is met, the set is not a business. If this threshold is not met, the entity next evaluates whether the set meets the requirement that a business include, at a minimum, an input and a substantive process that together significantly contribute to the ability to create outputs. Among other differences, transaction costs associated with asset acquisitions are capitalized while those associated with business combinations are expensed as incurred. In addition, purchase price in an asset acquisition is allocated on a relative fair value basis while in a business combination it is generally measured at fair value. The new standard will be applied prospectively to any transactions occurring within the period of adoption. The Company early adopted the new standard as allowed effective January 1, 2017. The Company anticipates that substantially all of its transactions will now be accounted for as asset acquisitions, which means transaction costs will largely be capitalized as noted above.
Other
The Company is the controlling partner in various consolidated partnerships owning 17 properties and 3,215 apartment units having a noncontrolling interest book value of $6.3 million at June 30, 2017. The Company is required to make certain disclosures regarding noncontrolling interests in consolidated limited-life subsidiaries. Of the consolidated entities described above, the Company is the controlling partner in limited-life partnerships owning four properties having a noncontrolling interest deficit balance of $7.4 million. These four partnership agreements contain provisions that require the partnerships to be liquidated through the sale of their assets upon reaching a date specified in each respective partnership agreement. The Company, as controlling partner, has an obligation to cause the property owning partnerships to distribute the proceeds of liquidation to the Noncontrolling Interests in these Partially Owned Properties only to the extent that the net proceeds received by the partnerships from the sale of their assets warrant a distribution based on the partnership agreements. As of June 30, 2017, the Company estimates the value of Noncontrolling Interest distributions for these four properties would have been approximately $64.4 million (“Settlement Value”) had the partnerships been liquidated. This Settlement Value is based on estimated third party consideration realized by the partnerships upon disposition of the four Partially Owned Properties and is net of all other assets and liabilities, including yield maintenance on the mortgages encumbering the properties, that would have been due on June 30, 2017 had those mortgages been prepaid. Due to, among other things, the inherent uncertainty in the sale of real estate assets, the amount of any potential distribution to the Noncontrolling Interests in the Company's Partially Owned Properties is subject to change. To the extent that the partnerships' underlying assets are worth less than the underlying liabilities, the Company has no obligation to remit any consideration to the Noncontrolling Interests in these Partially Owned Properties .
21
Equity and Redeemable Noncontrolling Interests of Equity Residential
The following tables present the changes in the Company’s issued and outstanding Common Shares and “Units” (which includes OP Units and restricted units) for the six months ended June 30, 2017:
|
|
|
2017 |
|
|
|
Common Shares |
|
|
|
|
|
Common Shares outstanding at January 1, |
|
|
365,870,924 |
|
|
Common Shares Issued: |
|
|
|
|
|
Conversion of OP Units |
|
|
1,101,589 |
|
|
Exercise of share options |
|
|
195,400 |
|
|
Employee Share Purchase Plan (ESPP) |
|
|
39,760 |
|
|
Restricted share grants, net |
|
|
91,092 |
|
|
Common Shares Outstanding at June 30, |
|
|
367,298,765 |
|
|
Units |
|
|
|
|
|
Units outstanding at January 1, |
|
|
14,626,075 |
|
|
Restricted unit grants, net |
|
|
291,647 |
|
|
Conversion of OP Units to Common Shares |
|
|
(1,101,589 |
) |
|
Units outstanding at June 30, |
|
|
13,816,133 |
|
|
Total Common Shares and Units outstanding at June 30, |
|
|
381,114,898 |
|
|
Units Ownership Interest in Operating Partnership |
|
|
3.6 |
% |
The equity positions of various individuals and entities that contributed their properties to the Operating Partnership in exchange for OP Units, as well as the equity positions of the holders of restricted units, are collectively referred to as the “Noncontrolling Interests – Operating Partnership”. Subject to certain exceptions (including the “book-up” requirements of restricted units), the Noncontrolling Interests – Operating Partnership may exchange their Units with EQR for Common Shares on a one-for-one basis. The carrying value of the Noncontrolling Interests – Operating Partnership (including redeemable interests) is allocated based on the number of Noncontrolling Interests – Operating Partnership Units in total in proportion to the number of Noncontrolling Interests – Operating Partnership Units in total plus the number of Common Shares. Net income is allocated to the Noncontrolling Interests – Operating Partnership based on the weighted average ownership percentage during the period.
The Operating Partnership has the right but not the obligation to make a cash payment instead of issuing Common Shares to any and all holders of Noncontrolling Interests – Operating Partnership Units requesting an exchange of their OP Units with EQR. Once the Operating Partnership elects not to redeem the Noncontrolling Interests – Operating Partnership Units for cash, EQR is obligated to deliver Common Shares to the exchanging holder of the Noncontrolling Interests – Operating Partnership Units.
The Noncontrolling Interests – Operating Partnership Units are classified as either mezzanine equity or permanent equity. If EQR is required, either by contract or securities law, to deliver registered Common Shares, such Noncontrolling Interests – Operating Partnership are differentiated and referred to as “Redeemable Noncontrolling Interests – Operating Partnership”. Instruments that require settlement in registered shares cannot be classified in permanent equity as it is not always completely within an issuer’s control to deliver registered shares. Therefore, settlement in cash is assumed and that responsibility for settlement in cash is deemed to fall to the Operating Partnership as the primary source of cash for EQR, resulting in presentation in the mezzanine section of the balance sheet. The Redeemable Noncontrolling Interests – Operating Partnership are adjusted to the greater of carrying value or fair market value based on the Common Share price of EQR at the end of each respective reporting period. EQR has the ability to deliver unregistered Common Shares for the remaining portion of the Noncontrolling Interests – Operating Partnership Units that are classified in permanent equity at June 30, 2017 and December 31, 2016.
The carrying value of the Redeemable Noncontrolling Interests – Operating Partnership is allocated based on the number of Redeemable Noncontrolling Interests – Operating Partnership Units in proportion to the number of Noncontrolling Interests – Operating Partnership Units in total. Such percentage of the total carrying value of Units which is ascribed to the Redeemable Noncontrolling Interests – Operating Partnership is then adjusted to the greater of carrying value or fair market value as described above. As of June 30, 2017, the Redeemable Noncontrolling Interests – Operating Partnership have a redemption value of approximately $380.5 million, which represents the value of Common Shares that would be issued in exchange for the Redeemable Noncontrolling Interests – Operating Partnership Units.
22
The following table presents the changes in the redemption value of the Redeemable Noncontrolling Interests – Operating Partnership for the six months ended June 30, 2017 (amounts in thousands):
|
|
|
2017 |
|
|
|
Balance at January 1, |
|
$ |
442,092 |
|
|
Change in market value |
|
|
(30,351 |
) |
|
Change in carrying value |
|
|
(31,222 |
) |
|
Balance at June 30, |
|
$ |
380,519 |
|
Net proceeds from EQR Common Share and Preferred Share (see definition below) offerings are contributed by EQR to ERPOP. In return for those contributions, EQR receives a number of OP Units in ERPOP equal to the number of Common Shares it has issued in the equity offering (or in the case of a preferred equity offering, a number of preference units in ERPOP equal in number and having the same terms as the Preferred Shares issued in the equity offering). As a result, the net offering proceeds from Common Shares and Preferred Shares are allocated between shareholders’ equity and Noncontrolling Interests – Operating Partnership to account for the change in their respective percentage ownership of the underlying equity of ERPOP.
The Company’s declaration of trust authorizes it to issue up to 100,000,000 preferred shares of beneficial interest, $0.01 par value per share (the “Preferred Shares”), with specific rights, preferences and other attributes as the Board of Trustees may determine, which may include preferences, powers and rights that are senior to the rights of holders of the Company’s Common Shares.
The following table presents the Company’s issued and outstanding Preferred Shares as of June 30, 2017 and December 31, 2016:
|
|
|
|
|
|
|
|
|
Amounts in thousands |
|
|||||
|
|
|
|
|
Annual |
|
|
|
|
|
|
|
|
|
|
|
|
|
Redemption |
|
Dividend per |
|
|
June 30, |
|
|
December 31, |
|
|||
|
|
|
Date (1) |
|
Share (2) |
|
|
2017 |
|
|
2016 |
|
|||
|
Preferred Shares of beneficial interest, $0.01 par value; 100,000,000 shares authorized: |
|
|
|
|
|
|
|
|
|
|
|
|
|
|
|
8.29% Series K Cumulative Redeemable Preferred; liquidation value $50 per share; 745,600 shares issued and outstanding at June 30, 2017 and December 31, 2016 |
|
12/10/26 |
|
$ |
4.145 |
|
|
$ |
37,280 |
|
|
$ |
37,280 |
|
|
|
|
|
|
|
|
|
|
$ |
37,280 |
|
|
$ |
37,280 |
|
|
(1) |
On or after the redemption date, redeemable preferred shares may be redeemed for cash at the option of the Company, in whole or in part, at a redemption price equal to the liquidation price per share, plus accrued and unpaid distributions, if any. |
|
(2) |
Dividends on Preferred Shares are payable quarterly. |
23
Capital and Redeemable Limited Partners of ERP Operating Limited Partnership
The following tables present the changes in the Operating Partnership’s issued and outstanding Units and in the limited partners’ Units for the six months ended June 30, 2017:
|
|
|
2017 |
|
|
|
General and Limited Partner Units |
|
|
|
|
|
General and Limited Partner Units outstanding at January 1, |
|
|
380,496,999 |
|
|
Issued to General Partner: |
|
|
|
|
|
Exercise of EQR share options |
|
|
195,400 |
|
|
EQR’s Employee Share Purchase Plan (ESPP) |
|
|
39,760 |
|
|
EQR's restricted share grants, net |
|
|
91,092 |
|
|
Issued to Limited Partners: |
|
|
|
|
|
Restricted unit grants, net |
|
|
291,647 |
|
|
General and Limited Partner Units outstanding at June 30, |
|
|
381,114,898 |
|
|
Limited Partner Units |
|
|
|
|
|
Limited Partner Units outstanding at January 1, |
|
|
14,626,075 |
|
|
Limited Partner restricted unit grants, net |
|
|
291,647 |
|
|
Conversion of Limited Partner OP Units to EQR Common Shares |
|
|
(1,101,589 |
) |
|
Limited Partner Units outstanding at June 30, |
|
|
13,816,133 |
|
|
Limited Partner Units Ownership Interest in Operating Partnership |
|
|
3.6 |
% |
The Limited Partners of the Operating Partnership as of June 30, 2017 include various individuals and entities that contributed their properties to the Operating Partnership in exchange for OP Units, as well as the equity positions of the holders of restricted units. Subject to certain exceptions (including the “book-up” requirements of restricted units), Limited Partners may exchange their Units with EQR for Common Shares on a one-for-one basis. The carrying value of the Limited Partner Units (including redeemable interests) is allocated based on the number of Limited Partner Units in total in proportion to the number of Limited Partner Units in total plus the number of General Partner Units. Net income is allocated to the Limited Partner Units based on the weighted average ownership percentage during the period.
The Operating Partnership has the right but not the obligation to make a cash payment instead of issuing Common Shares to any and all holders of Limited Partner Units requesting an exchange of their OP Units with EQR. Once the Operating Partnership elects not to redeem the Limited Partner Units for cash, EQR is obligated to deliver Common Shares to the exchanging limited partner.
The Limited Partner Units are classified as either mezzanine equity or permanent equity. If EQR is required, either by contract or securities law, to deliver registered Common Shares, such Limited Partner Units are differentiated and referred to as “Redeemable Limited Partner Units”. Instruments that require settlement in registered shares cannot be classified in permanent equity as it is not always completely within an issuer's control to deliver registered shares. Therefore, settlement in cash is assumed and that responsibility for settlement in cash is deemed to fall to the Operating Partnership as the primary source of cash for EQR, resulting in presentation in the mezzanine section of the balance sheet. The Redeemable Limited Partner Units are adjusted to the greater of carrying value or fair market value based on the Common Share price of EQR at the end of each respective reporting period. EQR has the ability to deliver unregistered Common Shares for the remaining portion of the Limited Partner Units that are classified in permanent equity at June 30, 2017 and December 31, 2016 .
The carrying value of the Redeemable Limited Partner Units is allocated based on the number of Redeemable Limited Partner Units in proportion to the number of Limited Partner Units in total. Such percentage of the total carrying value of Limited Partner Units which is ascribed to the Redeemable Limited Partner Units is then adjusted to the greater of carrying value or fair market value as described above. As of June 30, 2017, the Redeemable Limited Partner Units have a redemption value of approximately $380.5 million, which represents the value of Common Shares that would be issued in exchange for the Redeemable Limited Partner Units.
24
The following table presents the changes in the redemption value of the Redeemable Limited Partners for the six months ended June 30, 2017 (amounts in thousands):
|
|
|
2017 |
|
|
|
Balance at January 1, |
|
$ |
442,092 |
|
|
Change in market value |
|
|
(30,351 |
) |
|
Change in carrying value |
|
|
(31,222 |
) |
|
Balance at June 30, |
|
$ |
380,519 |
|
EQR contributes all net proceeds from its various equity offerings (including proceeds from exercise of options for Common Shares) to ERPOP. In return for those contributions, EQR receives a number of OP Units in ERPOP equal to the number of Common Shares it has issued in the equity offering (or in the case of a preferred equity offering, a number of preference units in ERPOP equal in number and having the same terms as the preferred shares issued in the equity offering).
The following table presents the Operating Partnership's issued and outstanding “Preference Units” as of June 30, 2017 and December 31, 2016 :
|
|
|
|
|
|
|
|
|
Amounts in thousands |
|
|||||
|
|
|
|
|
Annual |
|
|
|
|
|
|
|
|
|
|
|
|
|
Redemption |
|
Dividend Per |
|
|
June 30, |
|
|
December 31, |
|
|||
|
|
|
Date (1) |
|
Unit (2) |
|
|
2017 |
|
|
2016 |
|
|||
|
Preference Units: |
|
|
|
|
|
|
|
|
|
|
|
|
|
|
|
8.29% Series K Cumulative Redeemable Preference Units; liquidation value $50 per unit; 745,600 units issued and outstanding at June 30, 2017 and December 31, 2016 |
|
12/10/26 |
|
$ |
4.145 |
|
|
$ |
37,280 |
|
|
$ |
37,280 |
|
|
|
|
|
|
|
|
|
|
$ |
37,280 |
|
|
$ |
37,280 |
|
|
(1) |
On or after the redemption date, redeemable preference units may be redeemed for cash at the option of the Operating Partnership, in whole or in part, at a redemption price equal to the liquidation price per unit, plus accrued and unpaid distributions, if any, in conjunction with the concurrent redemption of the corresponding Company Preferred Shares. |
|
(2) |
Dividends on Preference Units are payable quarterly. |
Other
In September 2009, the Company announced the establishment of an At-The-Market (“ATM”) share offering program which would allow EQR to sell Common Shares from time to time into the existing trading market at current market prices as well as through negotiated transactions. Per the terms of ERPOP's partnership agreement, EQR contributes the net proceeds from all equity offerings to the capital of ERPOP in exchange for additional OP Units (on a one-for-one Common Share per OP Unit basis). The program currently has a maturity of June 2019. EQR has the authority to issue 13.0 million shares but has not issued any shares under this program since September 2012.
The Company may repurchase up to 13.0 million Common Shares under its share repurchase program. No shares were repurchased during the six months ended June 30, 2017 and as a result, EQR has remaining authorization to repurchase up to 13.0 million of its shares under the repurchase program as of June 30, 2017.
25
The following table summarizes the carrying amounts for the Company’s investment in real estate (at cost) as of June 30, 2017 and December 31, 2016 (amounts in thousands):
|
|
|
June 30, 2017 |
|
|
December 31, 2016 |
|
||
|
Land |
|
$ |
5,927,949 |
|
|
$ |
5,899,862 |
|
|
Depreciable property: |
|
|
|
|
|
|
|
|
|
Buildings and improvements |
|
|
17,214,313 |
|
|
|
16,913,430 |
|
|
Furniture, fixtures and equipment |
|
|
1,441,413 |
|
|
|
1,346,300 |
|
|
In-Place lease intangibles |
|
|
467,845 |
|
|
|
470,849 |
|
|
Projects under development: |
|
|
|
|
|
|
|
|
|
Land |
|
|
61,400 |
|
|
|
115,876 |
|
|
Construction-in-progress |
|
|
264,423 |
|
|
|
521,292 |
|
|
Land held for development: |
|
|
|
|
|
|
|
|
|
Land |
|
|
73,841 |
|
|
|
84,440 |
|
|
Construction-in-progress |
|
|
38,633 |
|
|
|
34,376 |
|
|
Investment in real estate |
|
|
25,489,817 |
|
|
|
25,386,425 |
|
|
Accumulated depreciation |
|
|
(5,671,510 |
) |
|
|
(5,360,389 |
) |
|
Investment in real estate, net |
|
$ |
19,818,307 |
|
|
$ |
20,026,036 |
|
The following table summarizes the carrying amounts for the Company's above and below market ground and retail lease intangibles as of June 30, 2017 and December 31, 2016 (amounts in thousands):
|
Description |
|
Balance Sheet Location |
|
June 30, 2017 |
|
|
December 31, 2016 |
|
||
|
Assets |
|
|
|
|
|
|
|
|
|
|
|
Ground lease intangibles – below market |
|
Other Assets |
|
$ |
178,251 |
|
|
$ |
178,251 |
|
|
Retail lease intangibles – above market |
|
Other Assets |
|
|
1,260 |
|
|
|
1,260 |
|
|
Lease intangible assets |
|
|
|
|
179,511 |
|
|
|
179,511 |
|
|
Accumulated amortization |
|
|
|
|
(20,193 |
) |
|
|
(17,972 |
) |
|
Lease intangible assets, net |
|
|
|
$ |
159,318 |
|
|
$ |
161,539 |
|
|
|
|
|
|
|
|
|
|
|
|
|
|
Liabilities |
|
|
|
|
|
|
|
|
|
|
|
Ground lease intangibles – above market |
|
Other Liabilities |
|
$ |
2,400 |
|
|
$ |
2,400 |
|
|
Retail lease intangibles – below market |
|
Other Liabilities |
|
|
5,270 |
|
|
|
5,270 |
|
|
Lease intangible liabilities |
|
|
|
|
7,670 |
|
|
|
7,670 |
|
|
Accumulated amortization |
|
|
|
|
(5,013 |
) |
|
|
(4,509 |
) |
|
Lease intangible liabilities, net |
|
|
|
$ |
2,657 |
|
|
$ |
3,161 |
|
During the six months ended June 30, 2017 and 2016, the Company amortized approximately $2.2 million in both periods of above and below market ground lease intangibles which is included (net increase) in property and maintenance expense in the accompanying consolidated statements of operations and comprehensive income, and amortized approximately $0.5 million in both periods of above and below market retail lease intangibles which is included (net increase) in rental income in the accompanying consolidated statements of operations and comprehensive income. During the quarters ended June 30, 2017 and 2016, the Company amortized approximately $1.1 million in both periods of above and below market ground lease intangibles which is included (net increase) in property and maintenance expense in the accompanying consolidated statements of operations and comprehensive income, and amortized approximately $0.3 million in both periods of above and below market retail lease intangibles which is included (net increase) in rental income in the accompanying consolidated statements of operations and comprehensive income.
26
The following table provides a summary of the aggregate amortization expense for above and below market ground lease intangibles and retail lease intangibles for each of the next five years (amounts in thousands):
|
|
|
Remaining |
|
|
|
|
|
|
|
|
|
|
|
|
|
|
|
|
|
|
|
|
|
|
|
|
|
2017 |
|
|
2018 |
|
|
2019 |
|
|
2020 |
|
|
2021 |
|
|
2022 |
|
||||||
|
Ground lease intangibles |
|
$ |
2,161 |
|
|
$ |
4,321 |
|
|
$ |
4,321 |
|
|
$ |
4,321 |
|
|
$ |
4,321 |
|
|
$ |
4,321 |
|
|
Retail lease intangibles |
|
|
(97 |
) |
|
|
(71 |
) |
|
|
(71 |
) |
|
|
(71 |
) |
|
|
(71 |
) |
|
|
(27 |
) |
|
Total |
|
$ |
2,064 |
|
|
$ |
4,250 |
|
|
$ |
4,250 |
|
|
$ |
4,250 |
|
|
$ |
4,250 |
|
|
$ |
4,294 |
|
During the six months ended June 30, 2017, the Company acquired the entire equity interest in the following from an unaffiliated party (purchase price in thousands):
|
|
|
Properties |
|
|
Apartment Units |
|
|
Purchase Price |
|
|||
|
Rental Properties – Consolidated (1) |
|
|
1 |
|
|
|
136 |
|
|
$ |
57,028 |
|
|
Total |
|
|
1 |
|
|
|
136 |
|
|
$ |
57,028 |
|
|
(1) |
Purchase price includes an allocation of approximately $9.2 million to land and $47.9 million to depreciable property (inclusive of capitalized closing costs). |
During the six months ended June 30, 2017 , the Company disposed of the following to unaffiliated parties (sales price in thousands):
|
|
|
Properties |
|
|
Apartment Units |
|
|
Sales Price |
|
|||
|
Rental Properties – Consolidated |
|
|
3 |
|
|
|
904 |
|
|
$ |
266,700 |
|
|
Land Parcels (one) |
|
|
— |
|
|
|
— |
|
|
|
33,450 |
|
|
Total |
|
|
3 |
|
|
|
904 |
|
|
$ |
300,150 |
|
The Company recognized a net gain on sales of real estate properties of approximately $124.4 million and a net gain on sales of land parcels of approximately $19.2 million on the above sales.
The Company has entered into a separate agreement to acquire the following (purchase price in thousands):
|
|
|
Properties |
|
|
Apartment Units |
|
|
Purchase Price |
|
|||
|
Rental Properties |
|
|
1 |
|
|
|
160 |
|
|
$ |
115,999 |
|
|
Total |
|
|
1 |
|
|
|
160 |
|
|
$ |
115,999 |
|
In addition to the property that was subsequently disposed of as discussed in Note 14, the Company has entered into separate agreements to dispose of the following (sales price in thousands):
|
|
|
Properties |
|
|
Apartment Units |
|
|
Sales Price |
|
|||
|
Land Parcels (two) |
|
|
— |
|
|
|
— |
|
|
$ |
57,725 |
|
|
Total |
|
|
— |
|
|
|
— |
|
|
$ |
57,725 |
|
The closings of these pending transactions are subject to certain conditions and restrictions, therefore, there can be no assurance that these transactions will be consummated or that the final terms will not differ in material respects from those summarized in the preceding paragraphs.
27
The Company has co-invested in various properties with unrelated third parties which are either consolidated or accounted for under the equity method of accounting (unconsolidated). The following tables and information summarize the Company’s investments in partially owned entities as of June 30, 2017 (amounts in thousands except for property and apartment unit amounts):
|
|
|
Consolidated |
|
|
Unconsolidated |
|
||||||||||
|
|
|
(VIE) |
|
|
(Non-VIE) |
|
|
(VIE) (1) |
|
|
Total |
|
||||
|
Total properties |
|
|
17 |
|
|
|
2 |
|
|
|
— |
|
|
|
2 |
|
|
Total apartment units |
|
|
3,215 |
|
|
|
945 |
|
|
|
— |
|
|
|
945 |
|
|
Balance sheet information at 6/30/2017 (at 100%): |
|
|
|
|
|
|
|
|
|
|
|
|
|
|
|
|
|
ASSETS |
|
|
|
|
|
|
|
|
|
|
|
|
|
|
|
|
|
Investment in real estate |
|
$ |
648,047 |
|
|
$ |
236,332 |
|
|
$ |
172,995 |
|
|
$ |
409,327 |
|
|
Accumulated depreciation |
|
|
(221,433 |
) |
|
|
(38,177 |
) |
|
|
(47,295 |
) |
|
|
(85,472 |
) |
|
Investment in real estate, net |
|
|
426,614 |
|
|
|
198,155 |
|
|
|
125,700 |
|
|
|
323,855 |
|
|
Cash and cash equivalents |
|
|
17,431 |
|
|
|
5,886 |
|
|
|
176 |
|
|
|
6,062 |
|
|
Investments in unconsolidated entities |
|
|
45,688 |
|
|
|
— |
|
|
|
— |
|
|
|
— |
|
|
Deposits – restricted |
|
|
361 |
|
|
|
258 |
|
|
|
— |
|
|
|
258 |
|
|
Other assets |
|
|
25,300 |
|
|
|
576 |
|
|
|
176 |
|
|
|
752 |
|
|
Total assets |
|
$ |
515,394 |
|
|
$ |
204,875 |
|
|
$ |
126,052 |
|
|
$ |
330,927 |
|
|
|
|
|
|
|
|
|
|
|
|
|
|
|
|
|
|
|
|
LIABILITIES AND EQUITY/CAPITAL |
|
|
|
|
|
|
|
|
|
|
|
|
|
|
|
|
|
Mortgage notes payable, net (2) |
|
$ |
301,728 |
|
|
$ |
145,424 |
|
|
$ |
— |
|
|
$ |
145,424 |
|
|
Accounts payable & accrued expenses |
|
|
1,550 |
|
|
|
1,382 |
|
|
|
107 |
|
|
|
1,489 |
|
|
Accrued interest payable |
|
|
1,024 |
|
|
|
691 |
|
|
|
— |
|
|
|
691 |
|
|
Other liabilities |
|
|
922 |
|
|
|
333 |
|
|
|
55 |
|
|
|
388 |
|
|
Security deposits |
|
|
2,010 |
|
|
|
480 |
|
|
|
— |
|
|
|
480 |
|
|
Total liabilities |
|
|
307,234 |
|
|
|
148,310 |
|
|
|
162 |
|
|
|
148,472 |
|
|
Noncontrolling Interests – Partially Owned Properties/Partners' equity |
|
|
6,303 |
|
|
|
55,881 |
|
|
|
85,202 |
|
|
|
141,083 |
|
|
Company equity/General and Limited Partners' Capital |
|
|
201,857 |
|
|
|
684 |
|
|
|
40,688 |
|
|
|
41,372 |
|
|
Total equity/capital |
|
|
208,160 |
|
|
|
56,565 |
|
|
|
125,890 |
|
|
|
182,455 |
|
|
Total liabilities and equity/capital |
|
$ |
515,394 |
|
|
$ |
204,875 |
|
|
$ |
126,052 |
|
|
$ |
330,927 |
|
|
|
|
Consolidated |
|
|
Unconsolidated |
|
||||||||||
|
|
|
(VIE) |
|
|
(Non-VIE) |
|
|
(VIE) (1) |
|
|
Total |
|
||||
|
Operating information for the six months ended 6/30/2017 (at 100%): |
|
|
|
|
|
|
|
|
|
|
|
|
|
|
|
|
|
Operating revenue |
|
$ |
46,278 |
|
|
$ |
13,293 |
|
|
$ |
2,595 |
|
|
$ |
15,888 |
|
|
Operating expenses |
|
|
11,365 |
|
|
|
4,425 |
|
|
|
1,076 |
|
|
|
5,501 |
|
|
Net operating income |
|
|
34,913 |
|
|
|
8,868 |
|
|
|
1,519 |
|
|
|
10,387 |
|
|
Property management |
|
|
1,630 |
|
|
|
387 |
|
|
|
38 |
|
|
|
425 |
|
|
General and administrative/other |
|
|
29 |
|
|
|
1 |
|
|
|
89 |
|
|
|
90 |
|
|
Depreciation |
|
|
10,395 |
|
|
|
5,298 |
|
|
|
2,750 |
|
|
|
8,048 |
|
|
Operating income (loss) |
|
|
22,859 |
|
|
|
3,182 |
|
|
|
(1,358 |
) |
|
|
1,824 |
|
|
Interest and other income |
|
|
24 |
|
|
|
— |
|
|
|
— |
|
|
|
— |
|
|
Interest: |
|
|
|
|
|
|
|
|
|
|
|
|
|
|
|
|
|
Expense incurred, net |
|
|
(6,638 |
) |
|
|
(4,145 |
) |
|
|
— |
|
|
|
(4,145 |
) |
|
Amortization of deferred financing costs |
|
|
(135 |
) |
|
|
— |
|
|
|
— |
|
|
|
— |
|
|
Income (loss) before income and other taxes and (loss) from investments in unconsolidated entities |
|
|
16,110 |
|
|
|
(963 |
) |
|
|
(1,358 |
) |
|
|
(2,321 |
) |
|
Income and other tax (expense) benefit |
|
|
(34 |
) |
|
|
(13 |
) |
|
|
— |
|
|
|
(13 |
) |
|
(Loss) from investments in unconsolidated entities |
|
|
(761 |
) |
|
|
— |
|
|
|
— |
|
|
|
— |
|
|
Net income (loss) |
|
$ |
15,315 |
|
|
$ |
(976 |
) |
|
$ |
(1,358 |
) |
|
$ |
(2,334 |
) |
|
(1) |
Includes the Company’s unconsolidated interest in an entity that owns the land underlying our Wisconsin Place apartment property and owns and operates the parking facility. This entity is excluded from the property and apartment unit count. |
|
(2) |
All debt is non-recourse to the Company. |
28
Note: The above tables exclude EQR's ownership interest in ERPOP, private equity fund investments, and the Company's interes ts in unconsolidated joint ventures established in connection with the acquisition of certain real estate related assets from Archstone Enterprise LP ("Archstone"). These ventures owned certain Archstone assets and succeeded to certain residual Archstone liabilities/litigation, as well as responsibility for tax protection arrangements and third-party preferred interests in former Archstone subsidiaries. The preferred interests had an aggregate liquidation value of $ 39.5 million at June 30, 2017. The vent ures are owned 60% by the Company. See below for further discussion.
Operating Properties
The Company has various equity interests in certain limited partnerships owning 16 properties containing 2,783 apartment units. Each partnership owns a multifamily property. The Company is the general partner of these limited partnerships and is responsible for managing the operations and affairs of the partnerships as well as making all decisions regarding the businesses of the partnerships. The limited partners are not able to exercise substantive kick-out or participating rights. As a result, the partnerships qualify as VIEs. The Company has a controlling financial interest in the VIEs and, thus, is the VIEs' primary beneficiary. The Company has both the power to direct the activities of the VIEs that most significantly impact the VIEs' economic performance as well as the obligation to absorb losses or the right to receive benefits from the VIEs that could potentially be significant to the VIEs. As a result, the partnerships are required to be consolidated on the Company's balance sheet.
The Company has a 75% equity interest in the Wisconsin Place joint venture. The project contains a mixed-use site located in Chevy Chase, Maryland consisting of residential, retail, office and accessory uses, including underground parking facilities. The joint venture owns the 432 unit residential component, but has no ownership interest in the retail and office components. At June 30, 2017, the residential component had a net book value of $168.2 million. The Company is the managing member and is responsible for conducting all administrative day-to-day matters and affairs of the joint venture as well as implementing all decisions with respect to the joint venture. The limited partner is not able to exercise substantive kick-out or participating rights. As a result, the joint venture qualifies as a VIE. The Company has a controlling financial interest in the VIE and, thus, is the VIE's primary beneficiary. The Company has both the power to direct the activities of the VIE that most significantly impact the VIE's economic performance as well as the obligation to absorb losses or the right to receive benefits from the VIE that could potentially be significant to the VIE. As a result, the entity that owns the residential component is required to be consolidated on the Company's balance sheet.
The Wisconsin Place joint venture also retains an unconsolidated interest in an entity that owns the land underlying the entire project and owns and operates the parking facility. At June 30, 2017, the basis of this investment was $45.7 million. The joint venture, as a limited partner, does not have substantive kick-out or participating rights in the entity. As a result, the entity qualifies as a VIE. The joint venture does not have a controlling financial interest in the VIE and is not the VIE's primary beneficiary. The joint venture does not have the power to direct the activities of the VIE that most significantly impact the VIE's economic performance or the obligation to absorb losses or the right to receive benefits from the VIE that could potentially be significant to the VIE. As a result, the entity that owns the land and owns and operates the parking facility is unconsolidated and recorded using the equity method of accounting.
The Company has a 20% equity interest in each of the Nexus Sawgrass and Domain joint ventures. The Nexus Sawgrass joint venture owns a 501 unit apartment property located in Sunrise, Florida and the Company's interest had a basis of $4.6 million at June 30, 2017. The Domain joint venture owns a 444 unit apartment property located in San Jose, California and the Company's interest had a basis of $8.7 million at June 30, 2017. Both properties were funded with long-term, non-recourse secured loans from the partner. The mortgage loan on Nexus Sawgrass has a current unconsolidated outstanding balance of $48.6 million, bears interest at 5.60% and matures January 1, 2021. The mortgage loan on Domain has a current unconsolidated outstanding balance of $96.8 million, bears interest at 5.75% and matures January 1, 2022. While the Company is the managing member of both of the joint ventures, the joint venture partner has significant participating rights and has active involvement in and oversight of the operations. As a result, the entities do not qualify as VIEs. The Company alone does not have the power to direct the activities of the entities that most significantly impact the entities' economic performance and as a result, the entities are unconsolidated and recorded using the equity method of accounting.
Other
As the sole general partner of ERPOP, EQR has exclusive control of ERPOP's day-to-day management. The limited partners are not able to exercise substantive kick-out or participating rights. As a result, ERPOP qualifies as a VIE. EQR has a controlling financial interest in ERPOP and, thus, is ERPOP's primary beneficiary. EQR has the power to direct the activities of ERPOP that most significantly impact ERPOP's economic performance as well as the obligation to absorb losses or the right to receive benefits from ERPOP that could potentially be significant to ERPOP. As a result, ERPOP is required to be consolidated on EQR's balance sheet.
In the first quarter of 2017, the Company agreed to a maximum investment of $5.0 million in a private equity fund which
29
primarily focuses on real estate technology investments. The Company will account for the investment under the equity method of account ing. As of June 30, 2017, the Company’s interest had a basis of approximately $0.9 million.
On February 27, 2013, in connection with the acquisition of Archstone, subsidiaries of the Company entered into three limited liability company agreements (collectively, the “Residual JV”). The Residual JV owned certain Archstone assets and succeeded to certain residual Archstone liabilities/litigation. The Residual JV is owned 60% by the Company and 40% by its joint venture partner. The Company's basis at June 30, 2017 was a net obligation of $0.7 million. The Residual JV is managed by a Management Committee consisting of two members from each of the Company and its joint venture partner. Both partners have equal participation in the Management Committee and all significant participating rights are shared by both partners. As a result, the Residual JV does not qualify as a VIE. The Company alone does not have the power to direct the activities of the Residual JV that most significantly impact the Residual JV's economic performance and as a result, the Residual JV is unconsolidated and recorded using the equity method of accounting. The Residual JV has sold all of the real estate assets that were acquired as part of the acquisition of Archstone, including all of the German assets, and is in the process of winding down all remaining activities.
On February 27, 2013, in connection with the acquisition of Archstone, a subsidiary of the Company entered into a limited liability company agreement (the “Legacy JV”), through which they assumed obligations of Archstone in the form of preferred interests, some of which are governed by tax protection arrangements. At June 30, 2017, the remaining preferred interests had an aggregate liquidation value of $ 39.5 million, our share of which is included in other liabilities in the accompanying consolidated balance sheets. Obligations of the Legacy JV are borne 60% by the Company and 40% by its joint venture partner. The Legacy JV is managed by a Management Committee consisting of two members from each of the Company and its joint venture partner. Both partners have equal participation in the Management Committee and all significant participating rights are shared by both partners. As a result, the Legacy JV does not qualify as a VIE. The Company alone does not have the power to direct the activities of the Legacy JV that most significantly impact the Legacy JV's economic performance and as a result, the Legacy JV is unconsolidated and recorded using the equity method of accounting.
The following table presents the Company’s restricted deposits as of June 30, 2017 and December 31, 2016 (amounts in thousands):
|
|
|
June 30, 2017 |
|
|
December 31, 2016 |
|
||
|
Tax-deferred (1031) exchange proceeds |
|
$ |
217,235 |
|
|
$ |
38,847 |
|
|
Restricted deposits on real estate investments |
|
|
87 |
|
|
|
733 |
|
|
Resident security and utility deposits |
|
|
36,146 |
|
|
|
37,007 |
|
|
Other |
|
|
910 |
|
|
|
359 |
|
|
Totals |
|
$ |
254,378 |
|
|
$ |
76,946 |
|
The following table presents the Company’s escrow deposits for mortgages as of June 30, 2017 and December 31, 2016 (amounts in thousands):
|
|
|
June 30, 2017 |
|
|
December 31, 2016 |
|
||
|
Real estate taxes and insurance |
|
$ |
1,103 |
|
|
$ |
2,003 |
|
|
Replacement reserves |
|
|
7,536 |
|
|
|
3,428 |
|
|
Mortgage principal reserves/sinking funds |
|
|
11,525 |
|
|
|
58,652 |
|
|
Other |
|
|
852 |
|
|
|
852 |
|
|
Totals |
|
$ |
21,016 |
|
|
$ |
64,935 |
|
During the six months ended June 30, 2017, the Company received approximately $48.9 million from the return of various mortgage principal reserves/sinking funds on certain tax-exempt mortgage bond deals.
30
EQR does not have any indebtedness as all debt is incurred by the Operating Partnership. EQR guarantees the Operating Partnership’s revolving credit facility up to the maximum amount and for the full term of the facility.
Mortgage Notes Payable
As of June 30, 2017, the Company had outstanding mortgage debt of approximately $3.7 billion.
During the six months ended June 30, 2017, the Company:
|
|
• |
Repaid $300.0 million of 5.987% mortgage debt held in a Fannie Mae loan pool maturing in 2019 and incurred a prepayment penalty of approximately $10.8 million; |
|
|
• |
Repaid $70.4 million of conventional fixed-rate mortgage loans maturing in 2017 through 2048 and incurred a prepayment penalty of approximately $1.5 million; and |
|
|
• |
Repaid $7.0 million of scheduled principal repayments on various mortgage debt. |
The Company recorded $0.2 million of write-offs of unamortized deferred financing costs during the six months ended June 30, 2017 as additional interest expense related to debt extinguishment of mortgages. The Company also recorded $0.1 million of write-offs of net unamortized premiums during the six months ended June 30, 2017 as a reduction of interest expense related to debt extinguishment of mortgages.
As of June 30, 2017, the Company had $598.7 million of secured debt subject to third party credit enhancement.
As of June 30, 2017, scheduled maturities for the Company’s outstanding mortgage indebtedness were at various dates through May 28, 2061 . At June 30, 2017, the interest rate range on the Company’s mortgage debt was 0.10% to 7.20%. During the six months ended June 30, 2017, the weighted average interest rate on the Company’s mortgage debt was 4.38%.
Notes
As of June 30, 2017, the Company had outstanding unsecured notes of approximately $4.5 billion.
During the six months ended June 30, 2017, the Company repaid $394.1 million of 5.75% unsecured notes at maturity.
As of June 30, 2017, scheduled maturities for the Company’s outstanding notes were at various dates through June 1, 2045. At June 30, 2017, the interest rate range on the Company’s notes was 2.375% to 7.57%. During the six months ended June 30, 2017, the weighted average interest rate on the Company’s notes was 4.48%.
Line of Credit and Commercial Paper
On November 3, 2016, the Company replaced its existing $2.5 billion facility with a $2.0 billion unsecured revolving credit facility maturing January 10, 2022. The Company has the ability to increase available borrowings by an additional $750.0 million by adding additional banks to the facility or obtaining the agreement of existing banks to increase their commitments. The interest rate on advances under the facility will generally be LIBOR plus a spread (currently 0.825%), or based on bids received from the lending group, and the Company pays an annual facility fee (currently 12.5 basis points). Both the spread and the facility fee are dependent on the credit rating of the Company’s long term debt.
On February 2, 2015, the Company entered into an unsecured commercial paper note program in the United States. The Company may borrow up to a maximum of $500.0 million under this program subject to market conditions. The notes will be sold under customary terms in the United States commercial paper note market and will rank pari passu with all of the Company's other unsecured senior indebtedness. As of June 30, 2017, there was a balance of $499.4 million outstanding on the commercial paper program ($500.0 million in principal outstanding net of an unamortized discount of $0.6 million). The notes bear interest at various floating rates with a weighted average of 1.31% for the six months ended June 30, 2017 and a weighted average maturity of 30 days as of June 30, 2017.
As of June 30, 2017, the amount available on the revolving credit facility was $1.22 billion (net of $12.1 million which was restricted/dedicated to support letters of credit, net of $265.0 million outstanding on the revolving credit facility and net of $500.0
31
million in principal outstanding on the commercial paper program).
Other
On April 24, 2017, the Company executed a new letter of credit facility with a third party financial institution which is not backed by or collateralized by borrowings on the Company’s unsecured revolving credit facility. As of June 30, 2017, there was $8.3 million in letters of credit outstanding on this facility.
The valuation of financial instruments requires the Company to make estimates and judgments that affect the fair value of the instruments. The Company, where possible, bases the fair values of its financial instruments, including its derivative instruments, on listed market prices and third party quotes. Where these are not available, the Company bases its estimates on current instruments with similar terms and maturities or on other factors relevant to the financial instruments.
In the normal course of business, the Company is exposed to the effect of interest rate changes. The Company seeks to manage these risks by following established risk management policies and procedures including the use of derivatives to hedge interest rate risk on debt instruments. The Company may also use derivatives to manage commodity prices in the daily operations of the business.
A three-level valuation hierarchy exists for disclosure of fair value measurements. The valuation hierarchy is based upon the transparency of inputs to the valuation of an asset or liability as of the measurement date. A financial instrument’s categorization within the valuation hierarchy is based upon the lowest level of input that is significant to the fair value measurement. The three levels are defined as follows:
|
|
• |
Level 1 – Inputs to the valuation methodology are quoted prices (unadjusted) for identical assets or liabilities in active markets. |
|
|
• |
Level 2 – Inputs to the valuation methodology include quoted prices for similar assets and liabilities in active markets, and inputs that are observable for the asset or liability, either directly or indirectly, for substantially the full term of the financial instrument. |
|
|
• |
Level 3 – Inputs to the valuation methodology are unobservable and significant to the fair value measurement. |
The Company’s derivative positions are valued using models developed by the respective counterparty as well as models developed internally by the Company that use as their basis readily observable market parameters (such as forward yield curves and credit default swap data). Employee holdings other than Common Shares within the supplemental executive retirement plan (the “SERP”) are valued using quoted market prices for identical assets and are included in other assets and other liabilities on the consolidated balance sheets. Redeemable Noncontrolling Interests – Operating Partnership/Redeemable Limited Partners are valued using the quoted market price of Common Shares. The fair values disclosed for mortgage notes payable and unsecured debt (including its commercial paper) were calculated using indicative rates provided by lenders of similar loans in the case of mortgage notes payable and the private unsecured debt (including its commercial paper) and quoted market prices for each underlying issuance in the case of the public unsecured notes.
The carrying values of the Company’s mortgage notes payable and unsecured debt (including its commercial paper and line of credit) were approximately $3.7 billion and $5.2 billion, respectively, at June 30, 2017. The fair values of the Company’s mortgage notes payable and unsecured debt (including its commercial paper and line of credit) were approximately $3.8 billion (Level 2) and $5.4 billion (Level 2), respectively, at June 30, 2017. The carrying values of the Company's mortgage notes payable and unsecured debt (including its commercial paper) were approximately $4.1 billion and $4.9 billion, respectively, at December 31, 2016. The fair values of the Company’s mortgage notes payable and unsecured debt (including its commercial paper) were approximately $4.2 billion (Level 2) and $5.0 billion (Level 2), respectively, at December 31, 2016. The fair values of the Company’s financial instruments (other than mortgage notes payable, unsecured notes, commercial paper, line of credit and derivative instruments), including cash and cash equivalents and other financial instruments, approximate their carrying or contract values.
32
The following table summarizes the Company’s consolidated derivative instruments at June 30, 2017 (dollar amounts are in thousands):
|
|
Fair Value Hedges (1) |
|
|
Forward Starting Swaps (2) |
|
||
|
Current Notional Balance |
$ |
450,000 |
|
|
$ |
300,000 |
|
|
Lowest Interest Rate |
|
2.375 |
% |
|
|
2.1630 |
% |
|
Highest Interest Rate |
|
2.375 |
% |
|
|
2.2895 |
% |
|
Earliest Maturity Date |
|
2019 |
|
|
|
2027 |
|
|
Latest Maturity Date |
|
2019 |
|
|
|
2028 |
|
|
(1) |
Fair Value Hedges – Converts outstanding fixed rate unsecured notes ($450.0 million 2.375% notes due July 1, 2019) to a floating interest rate of 90-Day LIBOR plus 0.61%. |
|
(2) |
Forward Starting Swaps – Designed to partially fix interest rates in advance of planned future debt issuances. Of the $300.0 million notional balance, $200.0 million of these swaps have mandatory counterparty terminations in 2018 and are targeted for 2017 debt issuances (see Note 14 for further discussion) while $100.0 million of these swaps have mandatory counterparty terminations in 2019 and are targeted for 2018 debt issuances. |
The following tables provide a summary of the fair value measurements for each major category of assets and liabilities measured at fair value on a recurring basis and the location within the accompanying consolidated balance sheets at June 30, 2017 and December 31, 2016, respectively (amounts in thousands):
|
|
|
|
|
|
|
|
|
Fair Value Measurements at Reporting Date Using |
|
|||||||||
|
Description |
|
Balance Sheet Location |
|
6/30/2017 |
|
|
Quoted Prices in Active Markets for Identical Assets/Liabilities (Level 1) |
|
|
Significant Other Observable Inputs (Level 2) |
|
|
Significant Unobservable Inputs (Level 3) |
|
||||
|
Assets |
|
|
|
|
|
|
|
|
|
|
|
|
|
|
|
|
|
|
|
Derivatives designated as hedging instruments: |
|
|
|
|
|
|
|
|
|
|
|
|
|
|
|
|
|
|
|
Interest Rate Contracts: |
|
|
|
|
|
|
|
|
|
|
|
|
|
|
|
|
|
|
|
Fair Value Hedges |
|
Other Assets |
|
$ |
1,227 |
|
|
$ |
— |
|
|
$ |
1,227 |
|
|
$ |
— |
|
|
Forward Starting Swaps |
|
Other Assets |
|
|
3,507 |
|
|
|
— |
|
|
|
3,507 |
|
|
|
— |
|
|
Supplemental Executive Retirement Plan |
|
Other Assets |
|
|
132,255 |
|
|
|
132,255 |
|
|
|
— |
|
|
|
— |
|
|
Total |
|
|
|
$ |
136,989 |
|
|
$ |
132,255 |
|
|
$ |
4,734 |
|
|
$ |
— |
|
|
|
|
|
|
|
|
|
|
|
|
|
|
|
|
|
|
|
|
|
|
Liabilities |
|
|
|
|
|
|
|
|
|
|
|
|
|
|
|
|
|
|
|
Supplemental Executive Retirement Plan |
|
Other Liabilities |
|
$ |
132,255 |
|
|
$ |
132,255 |
|
|
$ |
— |
|
|
$ |
— |
|
|
Total |
|
|
|
$ |
132,255 |
|
|
$ |
132,255 |
|
|
$ |
— |
|
|
$ |
— |
|
|
|
|
|
|
|
|
|
|
|
|
|
|
|
|
|
|
|
|
|
|
Redeemable Noncontrolling Interests – |
|
|
|
|
|
|
|
|
|
|
|
|
|
|
|
|
|
|
|
Operating Partnership/Redeemable |
|
|
|
|
|
|
|
|
|
|
|
|
|
|
|
|
|
|
|
Limited Partners |
|
Mezzanine |
|
$ |
380,519 |
|
|
$ |
— |
|
|
$ |
380,519 |
|
|
$ |
— |
|
33
|
|
|
|
|
|
|
|
|
Fair Value Measurements at Reporting Date Using |
|
|||||||||
|
Description |
|
Balance Sheet Location |
|
12/31/2016 |
|
|
Quoted Prices in Active Markets for Identical Assets/Liabilities (Level 1) |
|
|
Significant Other Observable Inputs (Level 2) |
|
|
Significant Unobservable Inputs (Level 3) |
|
||||
|
Assets |
|
|
|
|
|
|
|
|
|
|
|
|
|
|
|
|
|
|
|
Derivatives designated as hedging instruments: |
|
|
|
|
|
|
|
|
|
|
|
|
|
|
|
|
|
|
|
Interest Rate Contracts: |
|
|
|
|
|
|
|
|
|
|
|
|
|
|
|
|
|
|
|
Fair Value Hedges |
|
Other Assets |
|
$ |
1,857 |
|
|
$ |
— |
|
|
$ |
1,857 |
|
|
$ |
— |
|
|
Supplemental Executive Retirement Plan |
|
Other Assets |
|
|
124,420 |
|
|
|
124,420 |
|
|
|
— |
|
|
|
— |
|
|
Total |
|
|
|
$ |
126,277 |
|
|
$ |
124,420 |
|
|
$ |
1,857 |
|
|
$ |
— |
|
|
|
|
|
|
|
|
|
|
|
|
|
|
|
|
|
|
|
|
|
|
Liabilities |
|
|
|
|
|
|
|
|
|
|
|
|
|
|
|
|
|
|
|
Supplemental Executive Retirement Plan |
|
Other Liabilities |
|
$ |
124,420 |
|
|
$ |
124,420 |
|
|
$ |
— |
|
|
$ |
— |
|
|
Total |
|
|
|
$ |
124,420 |
|
|
$ |
124,420 |
|
|
$ |
— |
|
|
$ |
— |
|
|
|
|
|
|
|
|
|
|
|
|
|
|
|
|
|
|
|
|
|
|
Redeemable Noncontrolling Interests – |
|
|
|
|
|
|
|
|
|
|
|
|
|
|
|
|
|
|
|
Operating Partnership/Redeemable |
|
|
|
|
|
|
|
|
|
|
|
|
|
|
|
|
|
|
|
Limited Partners |
|
Mezzanine |
|
$ |
442,092 |
|
|
$ |
— |
|
|
$ |
442,092 |
|
|
$ |
— |
|
The following tables provide a summary of the effect of fair value hedges on the Company’s accompanying consolidated statements of operations and comprehensive income for the six months ended June 30, 2017 and 2016 respectively (amounts in thousands):
|
June 30, 2017 Type of Fair Value Hedge |
|
Location of Gain/(Loss) Recognized in Income on Derivative |
|
Amount of Gain/(Loss) Recognized in Income on Derivative |
|
|
Hedged Item |
|
Income Statement Location of Hedged Item Gain/(Loss) |
|
Amount of Gain/(Loss) Recognized in Income on Hedged Item |
|
||
|
Derivatives designated as hedging instruments: |
|
|
|
|
|
|
|
|
|
|
|
|
|
|
|
Interest Rate Contracts: |
|
|
|
|
|
|
|
|
|
|
|
|
|
|
|
Interest Rate Swaps |
|
Interest expense |
|
$ |
(630 |
) |
|
Fixed rate debt |
|
Interest expense |
|
$ |
630 |
|
|
Total |
|
|
|
$ |
(630 |
) |
|
|
|
|
|
$ |
630 |
|
|
June 30, 2016 Type of Fair Value Hedge |
|
Location of Gain/(Loss) Recognized in Income on Derivative |
|
Amount of Gain/(Loss) Recognized in Income on Derivative |
|
|
Hedged Item |
|
Income Statement Location of Hedged Item Gain/(Loss) |
|
Amount of Gain/(Loss) Recognized in Income on Hedged Item |
|
||
|
Derivatives designated as hedging instruments: |
|
|
|
|
|
|
|
|
|
|
|
|
|
|
|
Interest Rate Contracts: |
|
|
|
|
|
|
|
|
|
|
|
|
|
|
|
Interest Rate Swaps |
|
Interest expense |
|
$ |
8,390 |
|
|
Fixed rate debt |
|
Interest expense |
|
$ |
(8,390 |
) |
|
Total |
|
|
|
$ |
8,390 |
|
|
|
|
|
|
$ |
(8,390 |
) |
34
The following tables provide a summary of the effect of cash flow hedges on the Company’s accompanying consolidated statements of operations and comprehensive income for the six months ended June 30, 2017 and 2016, respe ctively (amounts in thousands):
|
|
|
Effective Portion |
|
|
Ineffective Portion |
|
||||||||||
|
June 30, 2017 Type of Cash Flow Hedge |
|
Amount of Gain/(Loss) Recognized in OCI on Derivative |
|
|
Location of Gain/(Loss) Reclassified from Accumulated OCI into Income |
|
Amount of Gain/(Loss) Reclassified from Accumulated OCI into Income |
|
|
Location of Gain/(Loss) Recognized in Income on Derivative |
|
Amount of Gain/(Loss) Reclassified from Accumulated OCI into Income |
|
|||
|
Derivatives designated as hedging instruments: |
|
|
|
|
|
|
|
|
|
|
|
|
|
|
|
|
|
Interest Rate Contracts: |
|
|
|
|
|
|
|
|
|
|
|
|
|
|
|
|
|
Forward Starting Swaps |
|
$ |
3,507 |
|
|
Interest expense |
|
$ |
(9,251 |
) |
|
N/A |
|
$ |
— |
|
|
Total |
|
$ |
3,507 |
|
|
|
|
$ |
(9,251 |
) |
|
|
|
$ |
— |
|
|
|
|
Effective Portion |
|
|
Ineffective Portion |
|
||||||||||
|
June 30, 2016 Type of Cash Flow Hedge |
|
Amount of Gain/(Loss) Recognized in OCI on Derivative |
|
|
Location of Gain/(Loss) Reclassified from Accumulated OCI into Income |
|
Amount of Gain/(Loss) Reclassified from Accumulated OCI into Income |
|
|
Location of Gain/(Loss) Recognized in Income on Derivative |
|
Amount of Gain/(Loss) Reclassified from Accumulated OCI into Income |
|
|||
|
Derivatives designated as hedging instruments: |
|
|
|
|
|
|
|
|
|
|
|
|
|
|
|
|
|
Interest Rate Contracts: |
|
|
|
|
|
|
|
|
|
|
|
|
|
|
|
|
|
Forward Starting Swaps |
|
$ |
(4,467 |
) |
|
Interest expense |
|
$ |
(32,922 |
) |
|
N/A |
|
$ |
— |
|
|
Total |
|
$ |
(4,467 |
) |
|
|
|
$ |
(32,922 |
) |
|
|
|
$ |
— |
|
As of June 30, 2017 and December 31, 2016, there were approximately $101.2 million and $113.9 million in deferred losses, net, included in accumulated other comprehensive (loss), respectively, related to derivative instruments. Based on the estimated fair values of the net derivative instruments at June 30, 2017, the Company may recognize an estimated $21.8 million of accumulated other comprehensive (loss) as additional interest expense during the twelve months ending June 30, 2018.
35
Equity Residential
The following tables set forth the computation of net income per share – basic and net income per share – diluted for the Company (amounts in thousands except per share amounts):
|
|
|
Six Months Ended June 30, |
|
|
Quarter Ended June 30, |
|
||||||||||
|
|
|
2017 |
|
|
2016 |
|
|
2017 |
|
|
2016 |
|
||||
|
Numerator for net income per share – basic: |
|
|
|
|
|
|
|
|
|
|
|
|
|
|
|
|
|
Income from continuing operations |
|
$ |
354,101 |
|
|
$ |
3,960,353 |
|
|
$ |
204,160 |
|
|
$ |
228,365 |
|
|
Allocation to Noncontrolling Interests – Operating Partnership, net |
|
|
(12,765 |
) |
|
|
(152,093 |
) |
|
|
(7,354 |
) |
|
|
(8,779 |
) |
|
Net (income) attributable to Noncontrolling Interests – Partially Owned Properties |
|
|
(1,553 |
) |
|
|
(1,545 |
) |
|
|
(765 |
) |
|
|
(781 |
) |
|
Preferred distributions |
|
|
(1,546 |
) |
|
|
(1,545 |
) |
|
|
(773 |
) |
|
|
(772 |
) |
|
Income from continuing operations available to Common Shares, net of Noncontrolling Interests |
|
|
338,237 |
|
|
|
3,805,170 |
|
|
|
195,268 |
|
|
|
218,033 |
|
|
Discontinued operations, net of Noncontrolling Interests |
|
|
— |
|
|
|
(118 |
) |
|
|
— |
|
|
|
34 |
|
|
Numerator for net income per share – basic |
|
$ |
338,237 |
|
|
$ |
3,805,052 |
|
|
$ |
195,268 |
|
|
$ |
218,067 |
|
|
Numerator for net income per share – diluted: |
|
|
|
|
|
|
|
|
|
|
|
|
|
|
|
|
|
Income from continuing operations |
|
$ |
354,101 |
|
|
$ |
3,960,353 |
|
|
$ |
204,160 |
|
|
$ |
228,365 |
|
|
Net (income) attributable to Noncontrolling Interests – Partially Owned Properties |
|
|
(1,553 |
) |
|
|
(1,545 |
) |
|
|
(765 |
) |
|
|
(781 |
) |
|
Preferred distributions |
|
|
(1,546 |
) |
|
|
(1,545 |
) |
|
|
(773 |
) |
|
|
(772 |
) |
|
Income from continuing operations available to Common Shares |
|
|
351,002 |
|
|
|
3,957,263 |
|
|
|
202,622 |
|
|
|
226,812 |
|
|
Discontinued operations, net |
|
|
— |
|
|
|
(122 |
) |
|
|
— |
|
|
|
35 |
|
|
Numerator for net income per share – diluted |
|
$ |
351,002 |
|
|
$ |
3,957,141 |
|
|
$ |
202,622 |
|
|
$ |
226,847 |
|
|
Denominator for net income per share – basic and diluted: |
|
|
|
|
|
|
|
|
|
|
|
|
|
|
|
|
|
Denominator for net income per share – basic |
|
|
366,713 |
|
|
|
364,820 |
|
|
|
366,820 |
|
|
|
365,047 |
|
|
Effect of dilutive securities: |
|
|
|
|
|
|
|
|
|
|
|
|
|
|
|
|
|
OP Units |
|
|
12,906 |
|
|
|
13,792 |
|
|
|
12,913 |
|
|
|
13,887 |
|
|
Long-term compensation shares/units |
|
|
2,886 |
|
|
|
3,400 |
|
|
|
2,959 |
|
|
|
3,131 |
|
|
Denominator for net income per share – diluted |
|
|
382,505 |
|
|
|
382,012 |
|
|
|
382,692 |
|
|
|
382,065 |
|
|
Net income per share – basic |
|
$ |
0.92 |
|
|
$ |
10.43 |
|
|
$ |
0.53 |
|
|
$ |
0.60 |
|
|
Net income per share – diluted |
|
$ |
0.92 |
|
|
$ |
10.36 |
|
|
$ |
0.53 |
|
|
$ |
0.59 |
|
|
Net income per share – basic: |
|
|
|
|
|
|
|
|
|
|
|
|
|
|
|
|
|
Income from continuing operations available to Common Shares, net of Noncontrolling Interests |
|
$ |
0.92 |
|
|
$ |
10.43 |
|
|
$ |
0.53 |
|
|
$ |
0.60 |
|
|
Discontinued operations, net of Noncontrolling Interests |
|
|
— |
|
|
|
— |
|
|
|
— |
|
|
|
— |
|
|
Net income per share – basic |
|
$ |
0.92 |
|
|
$ |
10.43 |
|
|
$ |
0.53 |
|
|
$ |
0.60 |
|
|
Net income per share – diluted: |
|
|
|
|
|
|
|
|
|
|
|
|
|
|
|
|
|
Income from continuing operations available to Common Shares |
|
$ |
0.92 |
|
|
$ |
10.36 |
|
|
$ |
0.53 |
|
|
$ |
0.59 |
|
|
Discontinued operations, net |
|
|
— |
|
|
|
— |
|
|
|
— |
|
|
|
— |
|
|
Net income per share – diluted |
|
$ |
0.92 |
|
|
$ |
10.36 |
|
|
$ |
0.53 |
|
|
$ |
0.59 |
|
36
ERP Operating Limited Partnership
The following tables set forth the computation of net income per Unit – basic and net income per Unit – diluted for the Operating Partnership (amounts in thousands except per Unit amounts):
|
|
|
Six Months Ended June 30, |
|
|
Quarter Ended June 30, |
|
||||||||||
|
|
|
2017 |
|
|
2016 |
|
|
2017 |
|
|
2016 |
|
||||
|
Numerator for net income per Unit – basic and diluted: |
|
|
|
|
|
|
|
|
|
|
|
|
|
|
|
|
|
Income from continuing operations |
|
$ |
354,101 |
|
|
$ |
3,960,353 |
|
|
$ |
204,160 |
|
|
$ |
228,365 |
|
|
Net (income) attributable to Noncontrolling Interests – Partially Owned Properties |
|
|
(1,553 |
) |
|
|
(1,545 |
) |
|
|
(765 |
) |
|
|
(781 |
) |
|
Allocation to Preference Units |
|
|
(1,546 |
) |
|
|
(1,545 |
) |
|
|
(773 |
) |
|
|
(772 |
) |
|
Income from continuing operations available to Units |
|
|
351,002 |
|
|
|
3,957,263 |
|
|
|
202,622 |
|
|
|
226,812 |
|
|
Discontinued operations, net |
|
|
— |
|
|
|
(122 |
) |
|
|
— |
|
|
|
35 |
|
|
Numerator for net income per Unit – basic and diluted |
|
$ |
351,002 |
|
|
$ |
3,957,141 |
|
|
$ |
202,622 |
|
|
$ |
226,847 |
|
|
Denominator for net income per Unit – basic and diluted: |
|
|
|
|
|
|
|
|
|
|
|
|
|
|
|
|
|
Denominator for net income per Unit – basic |
|
|
379,619 |
|
|
|
378,612 |
|
|
|
379,733 |
|
|
|
378,934 |
|
|
Effect of dilutive securities: |
|
|
|
|
|
|
|
|
|
|
|
|
|
|
|
|
|
Dilution for Units issuable upon assumed exercise/vesting of the Company’s long-term compensation shares/units |
|
|
2,886 |
|
|
|
3,400 |
|
|
|
2,959 |
|
|
|
3,131 |
|
|
Denominator for net income per Unit – diluted |
|
|
382,505 |
|
|
|
382,012 |
|
|
|
382,692 |
|
|
|
382,065 |
|
|
Net income per Unit – basic |
|
$ |
0.92 |
|
|
$ |
10.43 |
|
|
$ |
0.53 |
|
|
$ |
0.60 |
|
|
Net income per Unit – diluted |
|
$ |
0.92 |
|
|
$ |
10.36 |
|
|
$ |
0.53 |
|
|
$ |
0.59 |
|
|
Net income per Unit – basic: |
|
|
|
|
|
|
|
|
|
|
|
|
|
|
|
|
|
Income from continuing operations available to Units |
|
$ |
0.92 |
|
|
$ |
10.43 |
|
|
$ |
0.53 |
|
|
$ |
0.60 |
|
|
Discontinued operations, net |
|
|
— |
|
|
|
— |
|
|
|
— |
|
|
|
— |
|
|
Net income per Unit – basic |
|
$ |
0.92 |
|
|
$ |
10.43 |
|
|
$ |
0.53 |
|
|
$ |
0.60 |
|
|
Net income per Unit – diluted: |
|
|
|
|
|
|
|
|
|
|
|
|
|
|
|
|
|
Income from continuing operations available to Units |
|
$ |
0.92 |
|
|
$ |
10.36 |
|
|
$ |
0.53 |
|
|
$ |
0.59 |
|
|
Discontinued operations, net |
|
|
— |
|
|
|
— |
|
|
|
— |
|
|
|
— |
|
|
Net income per Unit – diluted |
|
$ |
0.92 |
|
|
$ |
10.36 |
|
|
$ |
0.53 |
|
|
$ |
0.59 |
|
The Company executed an agreement with controlled affiliates of Starwood Capital Group ("Starwood") on October 23, 2015 to sell a portfolio of 72 operating properties consisting of 23,262 apartment units located in five markets across the United States for $5.365 billion (the "Starwood Transaction" or “Starwood Portfolio”). The Starwood Portfolio represented substantially all of the assets in the Company’s South Florida and Denver markets and certain suburban assets in the Washington D.C., Seattle and Los Angeles markets. On January 26 and 27, 2016, the Company closed on the sale of the entire portfolio described above.
37
T he Company concluded that the Starwood Transaction did not qualify for discontinued operations reporting as it did not represent a strategic shift that had a major effect on the Company’s operations and financial results. The Company has been investing on ly in its six coastal markets (Boston, New York, Washington D.C., Southern California, San Francisco and Seattle) and has not been acquiring or developing any new assets in its other markets. Over the past several years, the Company has been repositioning its portfolio by selling its suburban assets located in markets outside its six core coastal markets. The sale of the Starwood Portfolio represented the continuation of the above strategy. However, the Company concluded that the Starwood Transaction did qualify as an individually significant component of the Company as the amount received upon disposal exceeded 10% of total assets, and NOI (see definition in Note 13) of the Starwood Portfolio represented approximately 2.3% of consolidated NOI (for the ap proximate one-month period owned in 2016) for the six months ended June 30, 2016 and approximately 15.7% of consolidated NOI for the year ended December 31, 2015. As a result, the following table summarizes the results of operations attributable to the St arwood Transaction for the six months and quarter ended June 30, 2016 (amounts in thousands):
|
|
|
Six Months Ended |
|
|
Quarter Ended |
|
||
|
|
|
June 30, 2016 |
|
|
June 30, 2016 |
|
||
|
REVENUES |
|
|
|
|
|
|
|
|
|
Rental income |
|
$ |
30,421 |
|
|
$ |
304 |
|
|
Total revenues |
|
|
30,421 |
|
|
|
304 |
|
|
EXPENSES |
|
|
|
|
|
|
|
|
|
Property and maintenance |
|
|
7,923 |
|
|
|
33 |
|
|
Real estate taxes and insurance |
|
|
2,932 |
|
|
|
60 |
|
|
Property management |
|
|
2 |
|
|
|
— |
|
|
General and administrative |
|
|
15 |
|
|
|
14 |
|
|
Total expenses |
|
|
10,872 |
|
|
|
107 |
|
|
Operating income |
|
|
19,549 |
|
|
|
197 |
|
|
Interest and other income |
|
|
11 |
|
|
|
9 |
|
|
Interest: |
|
|
|
|
|
|
|
|
|
Expense incurred, net |
|
|
(374 |
) |
|
|
(46 |
) |
|
Amortization of deferred financing costs |
|
|
(707 |
) |
|
|
— |
|
|
Income and other tax (expense) benefit |
|
|
(1 |
) |
|
|
(1 |
) |
|
Net gain (loss) on sales of real estate properties |
|
|
3,161,200 |
|
|
|
(21 |
) |
|
Income from operations attributable to controlling interests – Operating Partnership |
|
|
3,179,678 |
|
|
|
138 |
|
|
Income from operations attributable to Noncontrolling Interests – Operating Partnership |
|
|
(122,138 |
) |
|
|
(6 |
) |
|
Income from operations attributable to controlling interests – Company |
|
$ |
3,057,540 |
|
|
$ |
132 |
|
The Company, as an owner of real estate, is subject to various Federal, state and local environmental laws. Compliance by the Company with existing laws has not had a material adverse effect on the Company. However, the Company cannot predict the impact of new or changed laws or regulations on its current properties or on properties that it may acquire in the future. As of June 30, 2017, the Company does have an environmental reserve of approximately $3.9 million related to vacant land that it owns adjacent to one of its operating properties.
The Company has established a reserve related to various litigation matters associated with its Massachusetts properties and periodically assesses the adequacy of the reserve and makes adjustments as necessary. As of June 30, 2017, the reserve totaled approximately $0.9 million. While no assurances can be given, the Company does not believe that the ultimate resolution of any of these remaining litigation matters, if adversely determined, would have a material adverse effect on the Company.
The Company does not believe there is any other litigation pending or threatened against it that, individually or in the aggregate, may reasonably be expected to have a material adverse effect on the Company.
As of June 30, 2017, the Company has five wholly owned projects totaling 1,720 apartment units in various stages of development with commitments to fund of approximately $123.2 million and estimated completion dates ranging through December 31, 2018, as well as other completed development projects that are in various stages of lease up or are stabilized.
As of June 30, 2017, the Company has two unconsolidated operating properties (Nexus Sawgrass and Domain) that are owned
38
with the same third party joint venture partner. The joint venture agreements with this partner are primarily deal-specific regarding profit-sharing, equity contributions, returns on investment, buy-sell agreements and other customary provisions. The buy-sell arrangements contain provisions that provide the right, but not the obligation, for the Company to acquire the partner’s interests or sell its interests at any time following the occurrence of certain pre-defined events described in the joint venture agreements. See Note 6 for further discussion.
Operating segments are defined as components of an enterprise that engage in business activities from which they may earn revenues and incur expenses and about which discrete financial information is available that is evaluated regularly by the chief operating decision maker. The chief operating decision maker decides how resources are allocated and assesses performance on a recurring basis at least quarterly.
The Company’s primary business is the acquisition, development and management of multifamily residential properties, which includes the generation of rental and other related income through the leasing of apartment units to residents. The chief operating decision maker evaluates the Company's operating performance geographically by market and both on a same store and non-same store basis. The Company’s same store operating segments located in its coastal markets represent its reportable segments. The Company's operating segments located in its other markets (Phoenix) that are not material have also been included in the tables presented below.
The Company’s fee and asset management and development activities are other business activities that do not constitute an operating segment and as such, have been aggregated in the "Other" category in the tables presented below.
All revenues are from external customers and there is no customer who contributed 10% or more of the Company’s total revenues during the six months and quarters ended June 30, 2017 and 2016, respectively.
The primary financial measure for the Company’s rental real estate segment is net operating income (“NOI”), which represents rental income less: 1) property and maintenance expense and 2) real estate taxes and insurance expense (all as reflected in the accompanying consolidated statements of operations and comprehensive income). The Company believes that NOI is helpful to investors as a supplemental measure of its operating performance because it is a direct measure of the actual operating results of the Company’s apartment properties. Revenues for all leases are reflected on a straight-line basis in accordance with GAAP for the current and comparable periods.
The following table presents a reconciliation of NOI from our rental real estate specific to continuing operations for the six months and quarters ended June 30, 2017 and 2016, respectively (amounts in thousands):
|
|
|
Six Months Ended June 30, |
|
|
Quarter Ended June 30, |
|
||||||||||
|
|
|
2017 |
|
|
2016 |
|
|
2017 |
|
|
2016 |
|
||||
|
Rental income |
|
$ |
1,216,219 |
|
|
$ |
1,211,104 |
|
|
$ |
612,299 |
|
|
$ |
594,939 |
|
|
Property and maintenance expense |
|
|
(201,924 |
) |
|
|
(205,472 |
) |
|
|
(99,316 |
) |
|
|
(96,307 |
) |
|
Real estate taxes and insurance expense |
|
|
(169,231 |
) |
|
|
(157,611 |
) |
|
|
(87,503 |
) |
|
|
(77,415 |
) |
|
Total operating expenses |
|
|
(371,155 |
) |
|
|
(363,083 |
) |
|
|
(186,819 |
) |
|
|
(173,722 |
) |
|
Net operating income |
|
$ |
845,064 |
|
|
$ |
848,021 |
|
|
$ |
425,480 |
|
|
$ |
421,217 |
|
39
The following tables present NOI for each segment from our rental real estate specific to continuing operations for the six months and quarters ended June 30, 201 7 and 2016, respectively, as well as total assets and capital expenditures at June 30, 2017 (amounts in thousands):
|
|
|
Six Months Ended June 30, 2017 |
|
|
Six Months Ended June 30, 2016 |
|
||||||||||||||||||
|
|
|
Rental Income |
|
|
Operating Expenses |
|
|
NOI |
|
|
Rental Income |
|
|
Operating Expenses |
|
|
NOI |
|
||||||
|
Same store (1) |
|
|
|
|
|
|
|
|
|
|
|
|
|
|
|
|
|
|
|
|
|
|
|
|
|
Los Angeles |
|
$ |
195,685 |
|
|
$ |
56,725 |
|
|
$ |
138,960 |
|
|
$ |
188,764 |
|
|
$ |
54,533 |
|
|
$ |
134,231 |
|
|
San Diego |
|
|
45,319 |
|
|
|
12,073 |
|
|
|
33,246 |
|
|
|
43,346 |
|
|
|
11,698 |
|
|
|
31,648 |
|
|
Orange County |
|
|
43,654 |
|
|
|
10,856 |
|
|
|
32,798 |
|
|
|
41,551 |
|
|
|
10,167 |
|
|
|
31,384 |
|
|
Subtotal - Southern California |
|
|
284,658 |
|
|
|
79,654 |
|
|
|
205,004 |
|
|
|
273,661 |
|
|
|
76,398 |
|
|
|
197,263 |
|
|
|
|
|
|
|
|
|
|
|
|
|
|
|
|
|
|
|
|
|
|
|
|
|
|
|
|
Washington DC |
|
|
213,544 |
|
|
|
64,585 |
|
|
|
148,959 |
|
|
|
210,540 |
|
|
|
62,371 |
|
|
|
148,169 |
|
|
New York |
|
|
229,462 |
|
|
|
84,309 |
|
|
|
145,153 |
|
|
|
229,454 |
|
|
|
79,746 |
|
|
|
149,708 |
|
|
San Francisco |
|
|
188,483 |
|
|
|
45,532 |
|
|
|
142,951 |
|
|
|
183,915 |
|
|
|
44,929 |
|
|
|
138,986 |
|
|
Boston |
|
|
113,474 |
|
|
|
31,186 |
|
|
|
82,288 |
|
|
|
111,749 |
|
|
|
30,908 |
|
|
|
80,841 |
|
|
Seattle |
|
|
87,825 |
|
|
|
24,646 |
|
|
|
63,179 |
|
|
|
82,618 |
|
|
|
23,218 |
|
|
|
59,400 |
|
|
Other Markets |
|
|
924 |
|
|
|
340 |
|
|
|
584 |
|
|
|
885 |
|
|
|
292 |
|
|
|
593 |
|
|
Total same store |
|
|
1,118,370 |
|
|
|
330,252 |
|
|
|
788,118 |
|
|
|
1,092,822 |
|
|
|
317,862 |
|
|
|
774,960 |
|
|
|
|
|
|
|
|
|
|
|
|
|
|
|
|
|
|
|
|
|
|
|
|
|
|
|
|
Non-same store/other (2) (3) |
|
|
|
|
|
|
|
|
|
|
|
|
|
|
|
|
|
|
|
|
|
|
|
|
|
Non-same store |
|
|
92,408 |
|
|
|
34,678 |
|
|
|
57,730 |
|
|
|
46,064 |
|
|
|
17,225 |
|
|
|
28,839 |
|
|
Other (3) |
|
|
5,441 |
|
|
|
6,225 |
|
|
|
(784 |
) |
|
|
72,218 |
|
|
|
27,996 |
|
|
|
44,222 |
|
|
Total non-same store/other |
|
|
97,849 |
|
|
|
40,903 |
|
|
|
56,946 |
|
|
|
118,282 |
|
|
|
45,221 |
|
|
|
73,061 |
|
|
|
|
|
|
|
|
|
|
|
|
|
|
|
|
|
|
|
|
|
|
|
|
|
|
|
|
Totals |
|
$ |
1,216,219 |
|
|
$ |
371,155 |
|
|
$ |
845,064 |
|
|
$ |
1,211,104 |
|
|
$ |
363,083 |
|
|
$ |
848,021 |
|
|
(1) |
For the six months ended June 30, 2017 and 2016, same store primarily includes all properties acquired or completed that were stabilized prior to January 1, 2016, less properties subsequently sold, which represented 70,400 apartment units. |
|
(2) |
For the six months ended June 30, 2017 and 2016, non-same store primarily includes properties acquired after January 1, 2016, plus any properties in lease-up and not stabilized as of January 1, 2016. |
|
(3) |
Other includes development, other corporate operations and operations prior to sale for properties sold from 2014 through 2017 that do not meet the discontinued operations criteria. |
|
|
|
Quarter Ended June 30, 2017 |
|
|
Quarter Ended June 30, 2016 |
|
||||||||||||||||||
|
|
|
Rental Income |
|
|
Operating Expenses |
|
|
NOI |
|
|
Rental Income |
|
|
Operating Expenses |
|
|
NOI |
|
||||||
|
Same store (1) |
|
|
|
|
|
|
|
|
|
|
|
|
|
|
|
|
|
|
|
|
|
|
|
|
|
Los Angeles |
|
$ |
100,360 |
|
|
$ |
28,731 |
|
|
$ |
71,629 |
|
|
$ |
96,930 |
|
|
$ |
27,877 |
|
|
$ |
69,053 |
|
|
San Diego |
|
|
22,760 |
|
|
|
6,010 |
|
|
|
16,750 |
|
|
|
21,876 |
|
|
|
5,862 |
|
|
|
16,014 |
|
|
Orange County |
|
|
21,999 |
|
|
|
5,385 |
|
|
|
16,614 |
|
|
|
21,028 |
|
|
|
5,025 |
|
|
|
16,003 |
|
|
Subtotal - Southern California |
|
|
145,119 |
|
|
|
40,126 |
|
|
|
104,993 |
|
|
|
139,834 |
|
|
|
38,764 |
|
|
|
101,070 |
|
|
|
|
|
|
|
|
|
|
|
|
|
|
|
|
|
|
|
|
|
|
|
|
|
|
|
|
New York |
|
|
120,775 |
|
|
|
43,320 |
|
|
|
77,455 |
|
|
|
120,846 |
|
|
|
40,723 |
|
|
|
80,123 |
|
|
Washington DC |
|
|
107,102 |
|
|
|
32,252 |
|
|
|
74,850 |
|
|
|
106,246 |
|
|
|
30,909 |
|
|
|
75,337 |
|
|
San Francisco |
|
|
94,475 |
|
|
|
22,780 |
|
|
|
71,695 |
|
|
|
92,553 |
|
|
|
22,502 |
|
|
|
70,051 |
|
|
Boston |
|
|
57,097 |
|
|
|
15,432 |
|
|
|
41,665 |
|
|
|
56,089 |
|
|
|
15,273 |
|
|
|
40,816 |
|
|
Seattle |
|
|
46,333 |
|
|
|
12,993 |
|
|
|
33,340 |
|
|
|
43,547 |
|
|
|
12,167 |
|
|
|
31,380 |
|
|
Other Markets |
|
|
461 |
|
|
|
144 |
|
|
|
317 |
|
|
|
449 |
|
|
|
140 |
|
|
|
309 |
|
|
Total same store |
|
|
571,362 |
|
|
|
167,047 |
|
|
|
404,315 |
|
|
|
559,564 |
|
|
|
160,478 |
|
|
|
399,086 |
|
|
|
|
|
|
|
|
|
|
|
|
|
|
|
|
|
|
|
|
|
|
|
|
|
|
|
|
Non-same store/other (2) (3) |
|
|
|
|
|
|
|
|
|
|
|
|
|
|
|
|
|
|
|
|
|
|
|
|
|
Non-same store |
|
|
36,824 |
|
|
|
15,923 |
|
|
|
20,901 |
|
|
|
17,533 |
|
|
|
6,392 |
|
|
|
11,141 |
|
|
Other (3) |
|
|
4,113 |
|
|
|
3,849 |
|
|
|
264 |
|
|
|
17,842 |
|
|
|
6,852 |
|
|
|
10,990 |
|
|
Total non-same store/other |
|
|
40,937 |
|
|
|
19,772 |
|
|
|
21,165 |
|
|
|
35,375 |
|
|
|
13,244 |
|
|
|
22,131 |
|
|
|
|
|
|
|
|
|
|
|
|
|
|
|
|
|
|
|
|
|
|
|
|
|
|
|
|
Totals |
|
$ |
612,299 |
|
|
$ |
186,819 |
|
|
$ |
425,480 |
|
|
$ |
594,939 |
|
|
$ |
173,722 |
|
|
$ |
421,217 |
|
40
|
(1) |
For the quarters ended June 30, 2017 and 2016, same store primarily includes all properties acquired or completed that were stabilized prior to April 1, 2016, less properties subsequently sold, which represented 71,354 apartment units. |
|
(2) |
For the quarters ended June 30, 2017 and 2016, non-same store primarily includes properties acquired after April 1, 2016, plus any properties in lease-up and not stabilized as of April 1, 2016. |
|
(3) |
Other includes development, other corporate operations and operations prior to sale for properties sold from 2014 through 2017 that do not meet the discontinued operations criteria. |
|
|
|
Six Months Ended June 30, |
|
|||||
|
|
|
Total Assets |
|
|
Capital Expenditures |
|
||
|
Same store (1) |
|
|
|
|
|
|
|
|
|
Los Angeles |
|
$ |
2,641,868 |
|
|
$ |
11,677 |
|
|
San Diego |
|
|
464,432 |
|
|
|
2,725 |
|
|
Orange County |
|
|
331,904 |
|
|
|
3,801 |
|
|
Subtotal - Southern California |
|
|
3,438,204 |
|
|
|
18,203 |
|
|
|
|
|
|
|
|
|
|
|
|
Washington DC |
|
|
3,861,391 |
|
|
|
17,474 |
|
|
New York |
|
|
4,226,200 |
|
|
|
14,585 |
|
|
San Francisco |
|
|
2,493,666 |
|
|
|
17,039 |
|
|
Boston |
|
|
1,679,537 |
|
|
|
10,559 |
|
|
Seattle |
|
|
1,177,985 |
|
|
|
8,804 |
|
|
Other Markets |
|
|
12,783 |
|
|
|
46 |
|
|
Total same store |
|
|
16,889,766 |
|
|
|
86,710 |
|
|
|
|
|
|
|
|
|
|
|
|
Non-same store/other (2) (3) |
|
|
|
|
|
|
|
|
|
Non-same store |
|
|
2,403,684 |
|
|
|
2,208 |
|
|
Other (3) |
|
|
1,343,125 |
|
|
|
379 |
|
|
Total non-same store/other |
|
|
3,746,809 |
|
|
|
2,587 |
|
|
|
|
|
|
|
|
|
|
|
|
Totals |
|
$ |
20,636,575 |
|
|
$ |
89,297 |
|
|
(1) |
Same store primarily includes all properties acquired or completed that were stabilized prior to January 1, 2016, less properties subsequently sold, which represented 70,400 apartment units. |
|
(2) |
Non-same store primarily includes properties acquired after January 1, 2016, plus any properties in lease-up and not stabilized as of January 1, 2016. |
|
(3) |
Other includes development, other corporate operations and capital expenditures for properties sold. |
Subsequent to June 30, 2017, the Company:
|
|
• |
Sold one wholly-owned property consisting of 120 units for $53.0 million; |
|
|
• |
Issued $400.0 million of ten-year 3.25% fixed rate public notes, receiving net proceeds of approximately $399.3 million before underwriting fees, at an all-in effective interest rate of approximately 3.30% ; |
|
|
• |
Issued $300.0 million of thirty-year 4.00% fixed rate public notes, receiving net proceeds of approximately $293.2 million before underwriting fees, at an all-in effective interest rate of approximately 4.10% ; |
|
|
• |
Received approximately $1.3 million to settle four forward starting swaps in conjunction with the issuance of the $400.0 million fixed rate public notes discussed above ; and |
|
|
• |
Repaid $90.0 million of mortgage debt. |
41
For further information including definitions for capitalized terms not defined herein, refer to the consolidated financial statements and footnotes thereto included in the Company’s and the Operating Partnership's Annual Report on Form 10-K for the year ended December 31, 2016.
Forward-looking statements are intended to be made pursuant to the safe harbor provisions of the Private Securities Litigation Reform Act of 1995. These statements are based on current expectations, estimates, projections and assumptions made by management. While the Company's management believes the assumptions underlying its forward-looking statements are reasonable, such information is inherently subject to uncertainties and may involve certain risks, which could cause actual results, performance or achievements of the Company to differ materially from anticipated future results, performance or achievements expressed or implied by such forward-looking statements. Many of these uncertainties and risks are difficult to predict and beyond management's control. Forward-looking statements are not guarantees of future performance, results or events. The forward-looking statements contained herein are made as of the date hereof and the Company undertakes no obligation to update or supplement these forward-looking statements. Factors that might cause such differences include, but are not limited to the following:
|
|
• |
We intend to actively acquire, develop and rehab multifamily properties for rental operations as market conditions dictate. We may also acquire multifamily properties that are unoccupied or in the early stages of lease up. We may be unable to lease up these apartment properties on schedule, resulting in decreases in expected rental revenues and/or lower yields due to lower occupancy and rental rates as well as higher than expected concessions or higher than expected operating expenses. We may not be able to achieve rents that are consistent with expectations for acquired, developed or rehabbed properties. We may underestimate the costs necessary to bring an acquired property up to standards established for its intended market position, to complete a development property or to complete a rehab. Additionally, we expect that other real estate investors with capital will compete with us for attractive investment opportunities or may also develop properties in markets where we focus our development and acquisition efforts. This competition (or lack thereof) may increase (or depress) prices for multifamily properties. We may not be in a position or have the opportunity in the future to make suitable property acquisitions on favorable terms. We have acquired in the past and intend to continue to pursue the acquisition of properties, including large portfolios of properties, that could increase our size and result in alterations to our capital structure. The total number of apartment units under development, costs of development and estimated completion dates are subject to uncertainties arising from changing economic conditions (such as the cost of labor and construction materials), competition and local government regulation; |
|
|
• |
Debt financing and other capital required by the Company may not be available or may only be available on adverse terms; |
|
|
• |
Labor and materials required for maintenance, repair, capital expenditure or development may be more expensive than anticipated; |
|
|
• |
Occupancy levels and market rents may be adversely affected by national and local political, economic and market conditions including, without limitation, new construction and excess inventory of multifamily and owned housing/ condominiums, increasing portions of owned housing/condominium stock being converted to rental use, rental housing subsidized by the government, other government programs that favor single family rental housing or owner occupied housing over multifamily rental housing, slow or negative employment growth and household formation, the availability of low-interest mortgages or the availability of mortgages requiring little or no down payment for single family home buyers, changes in social preferences, governmental regulations (including rent control legislation and restrictions) and the potential for geopolitical instability, all of which are beyond the Company's control; and |
|
|
• |
Additional factors as discussed in Part I of the Company’s and the Operating Partnership’s Annual Report on Form 10-K, particularly those under “Item 1A Risk Factors ”. |
Forward-looking statements and related uncertainties are also included in the Notes to Consolidated Financial Statements in this report.
42
Equity Residential (“EQR”), a Maryland real estate investment trust (“REIT”) formed in March 1993, is an S&P 500 company focused on the acquisition, development and management of rental apartment properties in urban and high-density suburban coastal gateway markets where today's renters want to live, work and play. ERP Operating Limited Partnership (“ERPOP”), an Illinois limited partnership, was formed in May 1993 to conduct the multifamily residential property business of Equity Residential. EQR has elected to be taxed as a REIT. References to the “Company,” “we,” “us” or “our” mean collectively EQR, ERPOP and those entities/subsidiaries owned or controlled by EQR and/or ERPOP. References to the “Operating Partnership” mean collectively ERPOP and those entities/subsidiaries owned or controlled by ERPOP.
EQR is the general partner of, and as of June 30, 2017 owned an approximate 96.4% ownership interest in, ERPOP. All of the Company’s property ownership, development and related business operations are conducted through the Operating Partnership and EQR has no material assets or liabilities other than its investment in ERPOP. EQR issues equity from time to time, the net proceeds of which it is obligated to contribute to ERPOP, but does not have any indebtedness as all debt is incurred by the Operating Partnership. The Operating Partnership holds substantially all of the assets of the Company, including the Company’s ownership interests in its joint ventures. The Operating Partnership conducts the operations of the business and is structured as a partnership with no publicly traded equity.
The Company’s corporate headquarters is located in Chicago, Illinois and the Company also operates property management offices in each of its six core coastal markets. As of June 30, 2017, the Company had approximately 2,700 employees who provided real estate operations, leasing, legal, financial, accounting, acquisition, disposition, development and other support functions.
Available Information
You may access our Annual Report on Form 10-K, our Quarterly Reports on Form 10-Q, our Current Reports on Form 8- K and any amendments to any of those reports we file with the SEC free of charge at our website, www.equityapartments.com. These reports are made available at our website as soon as reasonably practicable after we file them with the SEC. The information contained on our website, including any information referred to in this report as being available on our website, is not a part of or incorporated into this report.
Business Objectives and Operating and Investing Strategies
The Company’s and the Operating Partnership’s business objectives and operating and investing strategies have not changed from the information included in the Company’s and the Operating Partnership's Annual Report on Form 10-K for the year ended December 31, 2016.
Current Environment
During the six months ended June 30, 2017, the Company acquired one property consisting of 136 apartment units for approximately $57.0 million and sold three consolidated rental properties consisting of 904 apartment units for approximately $266.7 million. The Company also sold one land parcel for approximately $33.5 million during the six months ended June 30, 2017. The Company currently budgets consolidated rental property acquisitions of approximately $500.0 million ($57.0 million of which already occurred during the six months ended June 30, 2017) during the year ending December 31, 2017 to be funded with proceeds from rental property dispositions. The Company currently budgets consolidated rental property dispositions of approximately $500.0 million ($266.7 million of which already occurred during the six months ended June 30, 2017) during the year ending December 31, 2017.
The Company has been reducing its development spending and starts in response to high land prices and low projected returns on investment. During the six months ended June 30, 2017, the Company did not start any development projects and substantially completed construction on one project representing 344 apartment units totaling approximately $108.7 million of development costs. The Company has budgeted starting approximately $100.0 million of new development projects during the year ending December 31, 2017. We currently budget spending approximately $300.0 million on development costs during the year ending December 31, 2017, primarily for projects currently under construction. We expect that this capital will be primarily sourced with excess operating cash flow, future debt offerings and borrowings on our revolving credit facility and/or commercial paper program.
43
We currently have access to multiple sources of capital including the equity markets as well as both the secur ed and unsecured debt markets. ERPOP now maintains long-term senior debt ratings of A- with Standard & Poor’s and Fitch and A3 with Moody’s, as Moody’s recently upgraded us effective July 17, 2017. In August 2017 , the Company complet ed a $ 400 . 0 million u nsecured ten- year note offering with a coupon of 3.25 % and an all-in effective interest rate of approximately 3.30 % and completed a $ 300 . 0 million unsecured thirty - year note offering with a cou pon of 4.00 % and an all- in effective interest rate of approximately 4.10 % .
We believe that cash and cash equivalents, securities readily convertible to cash, excess operating cash flow, current availability on our revolving credit facility and commercial paper program, future debt offerings and disposition proceeds for 2017 will provide sufficient liquidity to meet our funding obligations relating to asset acquisitions, debt maturities and/or prepayments, and existing and new development projects through 2017. We expect that our remaining longer-term funding requirements will be met through some combination of new borrowings, equity issuances, property dispositions, joint ventures and cash generated from operations.
Same store revenues increased 2.3% during the six months ended June 30, 2017 as compared to the six months ended June 30, 2016, which was ahead of our expectations. As a result, the Company now anticipates same store revenue increases ranging from 1.75% to 2.25%, as compared to the original guidance range of 1.0% to 2.25% that was provided in February 2017. The Company’s primary goal in 2017 is to focus on retaining existing residents to drive renewal rate growth, which came in at 4.8% and 4.3% for the second quarter of 2017 and the first quarter of 2017, respectively. Same store turnover declined by 0.7% for the first half of 2017 as compared to the same period in 2016. With same store occupancy of 95.9% for the six months ended June 30, 2017, we also increased our occupancy expectations for full year 2017 from 95.7% to 95.8%.
Washington D.C. was originally expected to post improved same store revenue results for 2017 as compared to 2016 as continuing job growth allowed the elevated levels of new supply in this market to be absorbed. During the second quarter of 2017, this job growth weakened throughout the market. Same store revenues increased 1.4% in the six months ended June 30, 2017 as compared to the same period in 2016, which was lower than our original expectations. We expect to produce same store revenue growth of approximately 1.4% in 2017, which is relatively consistent with the prior year and slightly lower than our original expectations of 1.8% for this market.
In the New York market, elevated deliveries of new luxury supply are having an impact on our ability to raise rents as renters trend towards affordability over neighborhood loyalty. There has also been a reduction in the rate of job growth in the financial services sector and technology sector, which are important demand drivers in the market. Due in part to our strong same store occupancy levels (96.0% for the six months ended June 30, 2017), we have used fewer concessions in the first half of 2017 than we originally expected and anticipate that trend to continue in the second half of 2017. As a result, same store revenues were flat in the six months ended June 30, 2017 as compared to the same period in 2016, which was slightly above our expectations. We still expect there to be a decline in same store revenues of approximately 0.3% for full year 2017, which is better than our original expectations of a decline of 1.5% for this market.
We have a cautious outlook for Boston as the market continues to feel the impact from an elevated level of deliveries of new supply in the downtown and Cambridge submarkets with approximately 75% of this new supply competing with our properties. Job growth has continued to improve in the market which is a positive sign that the additional supply may be absorbed without significant disruption. Same store revenues increased 1.5% in the six months ended June 30, 2017 as compared to the same period in 2016, which was consistent with our expectations. We expect to produce same store revenue growth of approximately 1.5% in 2017, which is consistent with our original expectations for this market.
Seattle is producing solid rental rate growth driven by the continued growth in technology jobs in the market. While new supply remains elevated in this market, the strong job growth has enabled that supply to be quickly absorbed with little market disruption. Same store revenues increased 6.3% in the six months ended June 30, 2017 as compared to the same period in 2016, which exceeded our expectations. We expect Seattle to produce same store revenue growth of approximately 5.75% in 2017, which is better than our original expectations of 4.25% for this market.
44
San Francisco experienced significant volatility during 2016 peak leasing season as certain submarkets experienced elevated levels of new luxury supply combined with slower job growth in the technology sector. Thus far in 2017, the market seems to have st abilized with the lease-up environment generally more accommodating. While job growth in San Francisco appears to have slowed compared to previous years, it still remains above the national average. As a result, we continue to see strong demand throughou t the market, although the rate at which we can increase rents remains somewhat modest. Same store revenues increased 2.5% in the six months ended June 30, 2017 as compared to the same period in 2016, which was slightly ahead of our expectations . We expe ct to produce same store revenue growth of approximately 1.8 % in 2017 , which is better than our original expectations of 1.0% for this market.
Southern California, which includes Los Angeles, Orange County and San Diego, is performing well and is positioned to be one of our better performing markets in 2017. Widely dispersed new supply, very good economic growth and adequate levels of job growth in the market are driving strong revenue growth. Same store revenues increased 4.0% in the six months ended June 30, 2017 as compared to the same period in 2016, which was consistent with our expectations. We expect to produce same store revenue growth of approximately 3.8% in 2017, which is consistent with our original expectations for this market. We expect Orange County and San Diego to perform slightly better than Los Angeles for full year 2017 as compared to 2016.
Same store expenses increased 3.9% during the six months ended June 30, 2017 as compared to the six months ended June 30, 2016. The Company anticipates that 2017 same store expenses will increase 3.25% to 4.0% as compared to the original guidance range of 3.0% to 4.0% that was provided in February 2017, significantly impacted by the following items:
|
|
• |
Real estate taxes increased 4.2% during the six months ended June 30, 2017 as compared to the same period in 2016 and are estimated to increase between 4.0% and 4.5% for the full year 2017 as compared to 2016 due primarily to increased values, mainly in Boston and Seattle. We also expect 1.8 percentage points of the increase to come from 421-a tax abatement benefits expiring in New York; |
|
|
• |
Payroll costs increased 6.3% during the six months ended June 30, 2017 as compared to the same period in 2016 and are estimated to increase 6.0% for the full year 2017 as compared to 2016 (compared to the original guidance range of 4.0% to 5.0%) primarily due to an increase in on-site staffing to assure the service levels necessary to remain competitive with new supply, higher on-site wages due to competition from new supply and higher medical and workers compensation costs than originally anticipated; |
|
|
• |
Utilities increased 2.0% during the six months ended June 30, 2017 as compared to the same period in 2016 and are estimated to increase approximately 2.0% for the full year 2017 as compared to 2016 primarily due to moderate increases in natural gas costs, partially offset by lower gas usage and lower prices for electricity; |
|
|
• |
Repairs and maintenance expenses increased 3.5% during the six months ended June 30, 2017 as compared to the same period in 2016. Included in this category are approximately $0.7 million of costs incurred as a result of significant wind and rain storm damage in California in January 2017. Without the California wind and rain storm damage costs, same store repair and maintenance expenses would have only increased 1.6% during the six months ended June 30, 2017 as compared to the same period in 2016. This category is estimated to increase between 3.0% and 4.0% for the full year 2017 as compared to 2016 primarily due to approximately $1.0 million in costs related to minimum wage increases that impact our outside cleaning and landscaping vendors and the approximate $0.7 million in storm damage costs noted above; and |
|
|
• |
Leasing and advertising increased 7.5% during the six months ended June 30, 2017 as compared to the same period in 2016. The increase was driven by increased resident referral and broker fees (especially in New York and San Francisco) and higher spending on resident activities as part of our focus on retaining those residents. Despite the increase in the first six months of 2017, we expect this category to be flat for the full year 2017 as compared to 2016. |
Same store NOI increased 1.7% during the six months ended June 30, 2017 as compared to the six months ended June 30, 2016, which was ahead of our expectations. As a result, the Company now anticipates same store NOI increases ranging from 0.75% to 1.75%, as compared to the original guidance range of 0.0% to 2.0% that was provided in February 2017, for the full year 2017 as a result of the above same store revenue and expense expectations.
The Company expects total overhead costs (property management expense and general and administrative expense) to decline approximately $3.0 million in 2017 over 2016 as we have largely completed right sizing our overhead platform to our smaller asset size. As certain of the Company's overhead costs are fixed and/or not quickly scalable, the Company anticipates overhead costs as a percentage of total revenues will remain elevated as compared to 2015 levels, though slightly lower as compared to 2016 levels.
45
We believe that the Company is well-positioned in the long-term as a result of favorable demographics and increasing consumer preferences for the flexibility of rental housing. As of June 30, 2017, the Company's same store occupancy was 95.8% and its total portfolio-wide occupancy, which includes development properties in various stages of lease-up, was 93.9%. We believe our markets/metro areas will continue to see increased luxury multifamily supply, especially in our urban core locatio ns, and there will continue to be periods of disruption as new development projects lease up. We believe over the longer term that our markets will absorb future supply because of the strong long-term demand in these markets as exhibited by our current hi gh occupancy levels and increasing household formations. We have seen evidence of this in Seattle as elevated levels of new supply have been absorbed and rental rates continue to grow. We also anticipate supply declining in our markets beginning in 2018, with the possible exception of New York, because of high construction costs, lower revenue growth and development lenders materially reducing their lending activities due to regulatory pressures and concerns over markets being overbuilt.
The current environment information presented above is based on current expectations and is forward-looking.
Results of Operations
In conjunction with our business objectives and operating strategy, the Company continued to invest in apartment properties located in our six coastal markets and sell apartment properties located primarily in the less dense portion of suburban markets and/or properties that are functionally or locationally challenged during the six months ended June 30, 2017 as follows:
|
|
• |
Acquired one consolidated apartment property consisting of 136 apartment units for approximately $57.0 million, at an Acquisition Cap Rate (see definition below) of 5.0%; |
|
|
• |
Sold three consolidated apartment properties consisting of 904 apartment units for approximately $266.7 million, at a weighted average Disposition Yield (see definition below) of 5.3% and generating an Unlevered IRR (see definition below) of 14.1%; and |
|
|
• |
Substantially completed construction on one project consisting of 344 apartment units totaling approximately $108.7 million of development costs and stabilized two development projects consisting of 801 apartment units totaling $514.0 million of development costs. |
The Company's primary financial measure for evaluating each of its apartment communities is net operating income (“NOI”). NOI represents rental income less direct property operating expenses (including real estate taxes and insurance). The Company believes that NOI is helpful to investors as a supplemental measure of its operating performance because it is a direct measure of the actual operating results of the Company’s apartment properties.
The definition of certain terms described above or below are as follows:
|
|
• |
Acquisition Cap Rate – NOI that the Company anticipates receiving in the next 12 months (or the year two or three stabilized NOI for properties that are in lease-up at acquisition) less an estimate of property management costs/management fees allocated to the project (generally ranging from 2.0% to 4.0% of revenues depending on the size and income streams of the asset) and less an estimate for in-the-unit replacement capital expenditures (generally ranging from $100-$450 per apartment unit depending on the age and condition of the asset) divided by the gross purchase price of the asset. The weighted average Acquisition Cap Rate for acquired properties is weighted based on the projected NOI streams and the relative purchase price for each respective property. |
|
|
• |
Disposition Yield – NOI that the Company anticipates giving up in the next 12 months less an estimate of property management costs/management fees allocated to the project (generally ranging from 2.0% to 4.0% of revenues depending on the size and income streams of the asset) and less an estimate for in-the-unit replacement capital expenditures (generally ranging from $100-$450 per apartment unit depending on the age and condition of the asset) divided by the gross sale price of the asset. The weighted average Disposition Yield for sold properties is weighted based on the projected NOI streams and the relative sales price for each respective property. |
|
|
• |
Unlevered Internal Rate of Return (“IRR”) – The Unlevered IRR on sold properties is the compound annual rate of return calculated by the Company based on the timing and amount of: (i) the gross purchase price of the property plus any direct acquisition costs incurred by the Company; (ii) total revenues earned during the Company’s ownership period; (iii) total direct property operating expenses (including real estate taxes and insurance) incurred during the Company’s ownership period; (iv) capital expenditures incurred during the Company’s ownership period; and (v) the gross sales price of the property net of selling costs. Each of the items (i) through (v) is calculated in accordance with generally accepted accounting principles (“GAAP”). |
Properties that the Company owned and were stabilized (see definition below) for all of both of the six months ended June 30,
46
2017 and 2016 (the “Six-Month 2017 Same Store Properties”), which repres ented 70,400 apartment units, and properties that the Company owned and were stabilized for all of both of the quarters ended June 30, 2017 and 2016 (the “Second Quarter 2017 Same Store Properties”), which represented 71,354 apartment units, impacted the C ompany’s results of operations. Both the Six-Month 2017 Same Store Properties and the Second Quarter 2017 Same Store Properties are discussed in the following paragraphs.
The following tables provide a rollforward of the apartment units included in Same Store Properties and a reconciliation of apartment units included in Same Store Properties to those included in Total Properties for the six months and quarter ended June 30, 2017:
|
|
Six Months Ended |
|
|
Quarter Ended |
|
||||||||||
|
|
June 30, 2017 |
|
|
June 30, 2017 |
|
||||||||||
|
|
Properties |
|
|
Apartment Units |
|
|
Properties |
|
|
Apartment Units |
|
||||
|
Same Store Properties at Beginning of Period |
|
272 |
|
|
|
69,879 |
|
|
|
279 |
|
|
|
71,000 |
|
|
2015 acquisitions |
|
4 |
|
|
|
625 |
|
|
|
— |
|
|
|
— |
|
|
2016 acquisitions |
|
— |
|
|
|
— |
|
|
|
3 |
|
|
|
479 |
|
|
2017 dispositions |
|
(3 |
) |
|
|
(904 |
) |
|
|
(2 |
) |
|
|
(600 |
) |
|
Lease-up properties stabilized |
|
4 |
|
|
|
800 |
|
|
|
2 |
|
|
|
475 |
|
|
Same Store Properties at June 30, 2017 |
|
277 |
|
|
|
70,400 |
|
|
|
282 |
|
|
|
71,354 |
|
|
|
|
Six Months Ended |
|
|
Quarter Ended |
|
||||||||||
|
|
|
June 30, 2017 |
|
|
June 30, 2017 |
|
||||||||||
|
|
|
Properties |
|
|
Apartment Units |
|
|
Properties |
|
|
Apartment Units |
|
||||
|
Same Store |
|
|
277 |
|
|
|
70,400 |
|
|
|
282 |
|
|
|
71,354 |
|
|
Non-Same Store: |
|
|
|
|
|
|
|
|
|
|
|
|
|
|
|
|
|
2017 acquisitions |
|
|
1 |
|
|
|
136 |
|
|
|
1 |
|
|
|
136 |
|
|
2016 acquisitions |
|
|
4 |
|
|
|
573 |
|
|
|
1 |
|
|
|
94 |
|
|
Properties removed from same store (1) |
|
|
2 |
|
|
|
356 |
|
|
|
2 |
|
|
|
356 |
|
|
Master-Leased properties (2) |
|
|
3 |
|
|
|
853 |
|
|
|
3 |
|
|
|
853 |
|
|
Lease-up properties not yet stabilized (3) |
|
|
11 |
|
|
|
3,770 |
|
|
|
9 |
|
|
|
3,295 |
|
|
Other |
|
|
1 |
|
|
|
1 |
|
|
|
1 |
|
|
|
1 |
|
|
Total Non-Same Store |
|
|
22 |
|
|
|
5,689 |
|
|
|
17 |
|
|
|
4,735 |
|
|
Unconsolidated properties |
|
|
2 |
|
|
|
945 |
|
|
|
2 |
|
|
|
945 |
|
|
Total Properties and Apartment Units |
|
|
301 |
|
|
|
77,034 |
|
|
|
301 |
|
|
|
77,034 |
|
Note: Properties are considered "stabilized" when they have achieved 90% occupancy for three consecutive months. Properties are included in Same Store when they are stabilized for all of the current and comparable periods presented.
|
(1) |
Consists of one property containing 285 apartment units (Playa Pacifica in Hermosa Beach, California) which was removed from the same store portfolio in the first quarter of 2015 due to a major renovation in which significant portions of the property were taken offline for extended time periods and one property containing 71 apartment units (Acton Courtyard in Berkeley, California) which was removed from the same store portfolio in the third quarter of 2016 due to an affordable housing dispute which required significant portions of the property to be vacant for an extended releasing period. As of June 30, 2017 and 2016, Playa Pacifica had an occupancy of 92.3% and 56.0%, respectively. As of June 30, 2017 and September 30, 2016, Acton Courtyard had an occupancy of 97.2% and 67.6%, respectively. These properties will not return to the same store portfolio until they are stabilized for all of the current and comparable periods presented. |
|
(2) |
Consists of three properties containing 853 apartment units that are wholly owned by the Company but the entire projects are master leased to a third party corporate housing provider and the Company earns monthly net rental income. |
|
(3) |
Consists of properties in various stages of lease-up and properties where lease-up has been completed but the properties were not stabilized for the comparable periods presented. |
The Company’s acquisition, disposition and completed development activities also impacted overall results of operations for the six months and quarters ended June 30, 2017 and 2016. The impacts of these activities are discussed in greater detail in the following paragraphs.
Comparison of the six months ended June 30, 2017 to the six months ended June 30, 2016
For the six months ended June 30, 2017, the Company reported diluted earnings per share/unit of $0.92 compared to $10.36 per share/unit in the same period of 2016. The difference is primarily due to approximately $9.58 per share/unit in higher gains on
47
property sales and $0.12 p er share/unit in higher gains on sales of non-operating assets in 2016 compared to 2017 as a direct result of the significant sales activity in 2016 compared to 2017, partially offset by $ 0.28 per share/unit in higher debt extinguishment costs incurred in 2016 as compared to 2017 .
For the six months ended June 30, 2017, income from continuing operations decreased approximately $3.6 billion when compared to the six months ended June 30, 2016. The decrease in continuing operations is discussed below.
For the six months ended June 30, 2017, consolidated rental income increased 0.4%, consolidated operating expenses (comprised of property and maintenance and real estate taxes and insurance) increased 2.2% and consolidated NOI decreased 0.3% when compared to the six months ended June 30, 2016. The decline in NOI is primarily a result of the Company’s significant disposition activity in 2016, partially offset by improved NOI from same store and lease-up properties.
Revenues from the Six-Month 2017 Same Store Properties increased $25.5 million primarily as a result of an increase in average rental rates charged to residents. Expenses from the Six-Month 2017 Same Store Properties increased $12.4 million primarily as a result of an increase in real estate taxes, on-site payroll costs, leasing and advertising and repairs and maintenance expenses. The following tables provide comparative same store results and statistics for the Six-Month 2017 Same Store Properties:
June YTD 2017 vs. June YTD 2016
Same Store Results/Statistics for 70,400 Same Store Apartment Units
$ in thousands (except for Average Rental Rate)
|
|
|
Results |
|
|
Statistics |
|
||||||||||||||||||
|
Description |
|
Revenues |
|
|
Expenses |
|
|
NOI |
|
|
Average Rental Rate (1) |
|
|
Physical Occupancy (2) |
|
|
Turnover (3) |
|
||||||
|
YTD 2017 |
|
$ |
1,118,370 |
|
|
$ |
330,252 |
|
|
$ |
788,118 |
|
|
$ |
2,649 |
|
|
|
95.9 |
% |
|
|
25.2 |
% |
|
YTD 2016 |
|
$ |
1,092,822 |
|
|
$ |
317,862 |
|
|
$ |
774,960 |
|
|
$ |
2,584 |
|
|
|
96.0 |
% |
|
|
25.9 |
% |
|
Change |
|
$ |
25,548 |
|
|
$ |
12,390 |
|
|
$ |
13,158 |
|
|
$ |
65 |
|
|
|
(0.1 |
%) |
|
|
(0.7 |
)% |
|
Change |
|
|
2.3 |
% |
|
|
3.9 |
% |
|
|
1.7 |
% |
|
|
2.5 |
% |
|
|
|
|
|
|
|
|
Note: Same store revenues for all leases are reflected on a straight line basis in accordance with GAAP for the current and comparable periods.
|
(1) |
Average Rental Rate – Total residential rental revenues reflected on a straight-line basis in accordance with GAAP divided by the weighted average occupied apartment units for the reporting period presented. |
|
(2) |
Physical Occupancy – The weighted average occupied apartment units for the reporting period divided by the average of total apartment units available for rent for the reporting period. |
|
(3) |
Turnover – Total residential move-outs divided by total residential apartment units, including inter-property and intra-property transfers. |
The following table provides comparative same store operating expenses for the Six-Month 2017 Same Store Properties:
June YTD 2017 vs. June YTD 2016
Same Store Operating Expenses for 70,400 Same Store Apartment Units
$ in thousands
|
|
|
|
|
|
|
|
|
|
|
|
|
|
|
|
|
|
|
% of Actual |
|
|
|
|
|
|
|
|
|
|
|
|
|
|
|
|
|
|
|
|
|
YTD 2017 |
|
|
|
|
|
Actual |
|
|
Actual |
|
|
$ |
|
|
% |
|
|
Operating |
|
|||||
|
|
|
YTD 2017 |
|
|
YTD 2016 |
|
|
Change |
|
|
Change |
|
|
Expenses |
|
|||||
|
Real estate taxes |
|
$ |
140,236 |
|
|
$ |
134,556 |
|
|
$ |
5,680 |
|
|
|
4.2 |
% |
|
|
42.5 |
% |
|
On-site payroll (1) |
|
|
74,656 |
|
|
|
70,249 |
|
|
|
4,407 |
|
|
|
6.3 |
% |
|
|
22.6 |
% |
|
Utilities (2) |
|
|
44,530 |
|
|
|
43,657 |
|
|
|
873 |
|
|
|
2.0 |
% |
|
|
13.5 |
% |
|
Repairs and maintenance (3) |
|
|
41,735 |
|
|
|
40,338 |
|
|
|
1,397 |
|
|
|
3.5 |
% |
|
|
12.6 |
% |
|
Insurance |
|
|
8,361 |
|
|
|
8,695 |
|
|
|
(334 |
) |
|
|
(3.8 |
)% |
|
|
2.5 |
% |
|
Leasing and advertising |
|
|
4,550 |
|
|
|
4,233 |
|
|
|
317 |
|
|
|
7.5 |
% |
|
|
1.4 |
% |
|
Other on-site operating expenses (4) |
|
|
16,184 |
|
|
|
16,134 |
|
|
|
50 |
|
|
|
0.3 |
% |
|
|
4.9 |
% |
|
Same store operating expenses |
|
$ |
330,252 |
|
|
$ |
317,862 |
|
|
$ |
12,390 |
|
|
|
3.9 |
% |
|
|
100.0 |
% |
|
(1) |
On-site payroll – Includes payroll and related expenses for on-site personnel including property managers, leasing consultants and |
48
|
maintenance staff. |
|
(2) |
Utilities – Represents gross expenses prior to any recoveries under the Resident Utility Billing System (“RUBS”). Recoveries are reflected in rental income. |
|
(3) |
Repairs and maintenance – Includes general maintenance costs, apartment unit turnover costs including interior painting, routine landscaping, security, exterminating, fire protection, snow removal, elevator, roof and parking lot repairs and other miscellaneous building repair and maintenance costs. |
|
(4) |
Other on-site operating expenses – Includes ground lease costs and administrative costs such as office supplies, telephone and data charges and association and business licensing fees. |
The following tables present reconciliations of operating income per the consolidated statements of operations to NOI, along with rental income, operating expenses and NOI per the consolidated statements of operations allocated between same store and non-same store results for the six months ended June 30, 2017 and 2016:
|
|
|
Six Months Ended June 30, |
|
|||||
|
|
|
2017 |
|
|
2016 |
|
||
|
|
|
(Amounts in thousands) |
|
|||||
|
Operating income |
|
$ |
414,921 |
|
|
$ |
422,643 |
|
|
Adjustments: |
|
|
|
|
|
|
|
|
|
Fee and asset management revenue |
|
|
(361 |
) |
|
|
(3,133 |
) |
|
Property management |
|
|
43,841 |
|
|
|
44,486 |
|
|
General and administrative |
|
|
27,799 |
|
|
|
35,013 |
|
|
Depreciation |
|
|
358,864 |
|
|
|
349,012 |
|
|
Total NOI |
|
$ |
845,064 |
|
|
$ |
848,021 |
|
|
Rental income: |
|
|
|
|
|
|
|
|
|
Same store |
|
$ |
1,118,370 |
|
|
$ |
1,092,822 |
|
|
Non-same store |
|
|
97,849 |
|
|
|
118,282 |
|
|
Total rental income |
|
|
1,216,219 |
|
|
|
1,211,104 |
|
|
Operating expenses: |
|
|
|
|
|
|
|
|
|
Same store |
|
|
330,252 |
|
|
|
317,862 |
|
|
Non-same store |
|
|
40,903 |
|
|
|
45,221 |
|
|
Total operating expenses |
|
|
371,155 |
|
|
|
363,083 |
|
|
NOI: |
|
|
|
|
|
|
|
|
|
Same store |
|
|
788,118 |
|
|
|
774,960 |
|
|
Non-same store |
|
|
56,946 |
|
|
|
73,061 |
|
|
Total NOI |
|
$ |
845,064 |
|
|
$ |
848,021 |
|
For properties that the Company acquired or completed that were stabilized prior to January 1, 2016 and that the Company expects to continue to own through December 31, 2017, the Company anticipates the following same store results for the full year ending December 31, 2017:
|
2017 Same Store Assumptions |
|
|||
|
Physical occupancy |
|
|
95.8% |
|
|
Revenue change |
|
1.75% to 2.25% |
|
|
|
Expense change |
|
3.25% to 4.0% |
|
|
|
NOI change |
|
0.75% to 1.75% |
|
|
The Company anticipates consolidated rental acquisitions of $500.0 million and consolidated rental dispositions of $500.0 million and expects that the Acquisition Cap Rate will be 0.50% lower than the Disposition Yield for the full year ending December 31, 2017.
These 2017 assumptions are based on current expectations and are forward-looking.
49
Non-same store NOI results decreased approximately $16.1 million compared to the first half of 2016 and consist primarily of properties acquired in calendar years 2016 and 2017 , operations from the Company’s development properties and operations prior to disposition from 2016 and 2017 sold properties. This decrease primarily resulted from:
|
|
• |
The lost NOI from 2016 and 2017 dispositions of $37.9 million; and |
|
|
• |
A partial offset from development and newly stabilized development properties in lease-up of $19.2 million, operating properties acquired in 2016 and 2017 of $4.4 million, operating activities from other non-same store properties (including three master leased properties) of $0.9 million and operating activities from other miscellaneous operations. |
See also Note 13 in the Notes to Consolidated Financial Statements for additional discussion regarding the Company’s segment disclosures.
Fee and asset management revenues decreased approximately $2.8 million or 88.5% primarily as a result of lower revenue earned on management of the Company's military housing ventures at Joint Base Lewis McChord due to the sale of the Company's entire interest in the management contracts and related rights associated with these ventures in the second quarter of 2016.
Property management expenses include off-site expenses associated with the self-management of the Company’s properties as well as management fees paid to any third party management companies. These expenses decreased approximately $0.6 million or 1.4%. This decrease is primarily attributable to a decrease in payroll-related costs, partially offset by increases in temporary contractors. The Company anticipates that property management expenses will approximate $83.0 million to $85.0 million for the year ending December 31, 2017. The above assumption is based on current expectations and is forward-looking.
General and administrative expenses, which include corporate operating expenses, decreased approximately $7.2 million or 20.6% primarily due to a decrease in payroll-related costs. The Company anticipates that general and administrative expenses will approximate $50.0 million to $52.0 million for the year ending December 31, 2017, excluding charges of approximately $0.4 million related to the overlap of accounting costs for the Company's current and former executive compensation programs. The above assumption is based on current expectations and is forward-looking.
Depreciation expense, which includes depreciation on non-real estate assets, increased approximately $9.9 million or 2.8% primarily as a result of additional depreciation expense on properties acquired in 2016 and 2017 and development properties placed in service, partially offset by lower depreciation from properties sold in 2016 and 2017.
Interest and other income decreased approximately $57.8 million or 97.0%. This decrease is primarily attributable to the approximate $52.4 million gain from the sale of the Company's entire interest in the management contracts and related rights associated with the military housing ventures at Joint Base Lewis McChord during the six months ended June 30, 2016 , along with the sale of the Company’s 421-a real estate tax certificates in 2016, both of which did not reoccur in 2017. The Company anticipates that interest and other income will approximate $1.0 million for the year ending December 31, 2017, excluding certain non-comparable insurance/litigation settlement proceeds. The above assumption is based on current expectations and is forward-looking.
Other expenses decreased approximately $1.9 million or 47.5% primarily due to a decrease in transaction and pursuit costs of approximately $2.4 million as a result of a decline in acquisitions and development in 2017 as compared to 2016, partially offset by an increase in litigation settlements. In addition, the Company anticipates that substantially all of its transactions will now be accounted for as asset acquisitions, which means that transaction costs will largely be capitalized, as a result of its adoption of the new definition of a business standard effective January 1, 2017. See Note 2 in the Notes to Consolidated Financial Statements for further discussion.
Interest expense, including amortization of deferred financing costs, decreased approximately $105.9 million or 34.4% primarily as a result of $107.8 million in lower debt extinguishment costs in 2017 as compared to 2016. The effective interest cost on all indebtedness for the six months ended June 30, 2017 was 4.53% as compared to 4.70% for the six months ended June 30, 2016. The Company anticipates that interest expense from continuing operations, excluding debt extinguishment costs/prepayment penalties, will approximate $367.6 million to $375.8 million and capitalized interest will approximate $24.0 million to $28.0 million for the year ending December 31, 2017. The above assumptions are based on current expectations and are forward-looking.
Income and other tax expense decreased approximately $0.3 million or 36.8% primarily due to decreases in various state and local taxes related to the Company's elevated disposition activity in 2016 vs. 2017. The Company anticipates that income and other tax expense will approximate $1.0 million for the year ending December 31, 2017. The above assumption is based on current expectations and is forward-looking.
Net gain on sales of real estate properties decreased approximately $3.7 billion as a result of the sale of 83 consolidated
50
apartment properties (including the Starwood Portfolio) during the six months ended June 30, 2016 as compared to only three consolidated apartment property sale s during the six months ended June 30, 2017, all of which did not meet the criteria for reporting discontinued operations. See Note 11 in the Notes to Consolidated Financial Statements for further discussion.
Net gain on sales of land parcels increased approximately $7.4 million or 63.5% due to the gain on sale of one land parcel with a lower basis during the during the six months ended June 30, 2017 as compared to the gain on sales of three land parcels during the six months ended June 30, 2016.
Comparison of the quarter ended June 30, 2017 to the quarter ended June 30, 2016
For the quarter ended June 30, 2017, the Company reported diluted earnings per share/unit of $0.53 compared to $0.59 per share/unit in the same period of 2016. The difference is primarily due to approximately $0.14 per share/unit in lower gains on sales of non-operating assets in the second quarter of 2017 compared to the same period in 2016 partially offset by approximately $0.08 per share/unit in higher gains on property sales in the second quarter of 2017 compared to the same period in 2016.
For the quarter ended June 30, 2017, income from continuing operations decreased approximately $24.2 million when compared to the quarter ended June 30, 2016. The decrease in continuing operations is discussed below.
For the quarter ended June 30, 2017, consolidated rental income increased 2.9%, consolidated operating expenses (comprised of property and maintenance and real estate taxes and insurance) increased 7.5% and consolidated NOI increased 1.0% when compared to the quarter ended June 30, 2016. The increase in NOI is primarily a result of improved NOI from same store and lease-up properties.
Revenues from the Second Quarter 2017 Same Store Properties increased $11.8 million primarily as a result of an increase in average rental rates charged to residents and decrease in turnover. Expenses from the Second Quarter 2017 Same Store Properties increased $6.6 million primarily as a result of an increase in real estate taxes, on-site payroll costs and utilities expenses. The following tables provide comparative same store results and statistics for the Second Quarter 2017 Same Store Properties:
Second Quarter 2017 vs. Second Quarter 2016
Same Store Results/Statistics for 71,354 Same Store Apartment Units
$ in thousands (except for Average Rental Rate)
|
|
|
Results |
|
|
Statistics |
|
||||||||||||||||||
|
Description |
|
Revenues |
|
|
Expenses |
|
|
NOI |
|
|
Average Rental Rate (1) |
|
|
Physical Occupancy (2) |
|
|
Turnover (3) |
|
||||||
|
Q2 2017 |
|
$ |
571,362 |
|
|
$ |
167,047 |
|
|
$ |
404,315 |
|
|
$ |
2,669 |
|
|
|
95.8 |
% |
|
|
14.0 |
% |
|
Q2 2016 |
|
$ |
559,564 |
|
|
$ |
160,478 |
|
|
$ |
399,086 |
|
|
$ |
2,605 |
|
|
|
96.2 |
% |
|
|
15.0 |
% |
|
Change |
|
$ |
11,798 |
|
|
$ |
6,569 |
|
|
$ |
5,229 |
|
|
$ |
64 |
|
|
|
(0.4 |
%) |
|
|
(1.0 |
%) |
|
Change |
|
|
2.1 |
% |
|
|
4.1 |
% |
|
|
1.3 |
% |
|
|
2.5 |
% |
|
|
|
|
|
|
|
|
Note: Same store revenues for all leases are reflected on a straight line basis in accordance with GAAP for the current and comparable periods.
|
(1) |
Average Rental Rate – Total residential rental revenues reflected on a straight-line basis in accordance with GAAP divided by the weighted average occupied apartment units for the reporting period presented. |
|
(2) |
Physical Occupancy – The weighted average occupied apartment units for the reporting period divided by the average of total apartment units available for rent for the reporting period. |
|
(3) |
Turnover – Total residential move-outs divided by total residential apartment units, including inter-property and intra-property transfers. |
The following table provides comparative same store operating expenses for the Second Quarter 2017 Same Store Properties:
51
Second Quarter 2017 vs. Second Quar ter 2016
Same Store Operating Expenses for 71,354 Same Store Apartment Units
$ in thousands
|
|
|
|
|
|
|
|
|
|
|
|
|
|
|
|
|
|
|
% of Actual |
|
|
|
|
|
|
|
|
|
|
|
|
|
|
|
|
|
|
|
|
|
Q2 2017 |
|
|
|
|
|
Actual |
|
|
Actual |
|
|
$ |
|
|
% |
|
|
Operating |
|
|||||
|
|
|
Q2 2017 |
|
|
Q2 2016 |
|
|
Change |
|
|
Change |
|
|
Expenses |
|
|||||
|
Real estate taxes |
|
$ |
71,519 |
|
|
$ |
68,331 |
|
|
$ |
3,188 |
|
|
|
4.7 |
% |
|
|
42.8 |
% |
|
On-site payroll (1) |
|
|
38,211 |
|
|
|
35,270 |
|
|
|
2,941 |
|
|
|
8.3 |
% |
|
|
22.9 |
% |
|
Utilities (2) |
|
|
21,239 |
|
|
|
20,809 |
|
|
|
430 |
|
|
|
2.1 |
% |
|
|
12.7 |
% |
|
Repairs and maintenance (3) |
|
|
21,841 |
|
|
|
21,643 |
|
|
|
198 |
|
|
|
0.9 |
% |
|
|
13.1 |
% |
|
Insurance |
|
|
4,242 |
|
|
|
4,417 |
|
|
|
(175 |
) |
|
|
(4.0 |
)% |
|
|
2.5 |
% |
|
Leasing and advertising |
|
|
2,193 |
|
|
|
2,151 |
|
|
|
42 |
|
|
|
2.0 |
% |
|
|
1.3 |
% |
|
Other on-site operating expenses (4) |
|
|
7,802 |
|
|
|
7,857 |
|
|
|
(55 |
) |
|
|
(0.7 |
)% |
|
|
4.7 |
% |
|
Same store operating expenses |
|
$ |
167,047 |
|
|
$ |
160,478 |
|
|
$ |
6,569 |
|
|
|
4.1 |
% |
|
|
100.0 |
% |
|
(1) |
On-site payroll – Includes payroll and related expenses for on-site personnel including property managers, leasing consultants and maintenance staff. |
|
(2) |
Utilities – Represents gross expenses prior to any recoveries under the Resident Utility Billing System (“RUBS”). Recoveries are reflected in rental income. |
|
(3) |
Repairs and maintenance – Includes general maintenance costs, apartment unit turnover costs including interior painting, routine landscaping, security, exterminating, fire protection, snow removal, elevator, roof and parking lot repairs and other miscellaneous building repair and maintenance costs. |
|
(4) |
Other on-site operating expenses – Includes ground lease costs and administrative costs such as office supplies, telephone and data charges and association and business licensing fees. |
The following tables present reconciliations of operating income per the consolidated statements of operations to NOI, along with rental income, operating expenses and NOI per the consolidated statements of operations allocated between same store and non-same store results for the quarters ended June 30, 2017 and 2016:
|
|
|
Quarter Ended June 30, |
|
|||||
|
|
|
2017 |
|
|
2016 |
|
||
|
|
|
(Amounts in thousands) |
|
|||||
|
Operating income |
|
$ |
210,550 |
|
|
$ |
206,018 |
|
|
Adjustments: |
|
|
|
|
|
|
|
|
|
Fee and asset management revenue |
|
|
(181 |
) |
|
|
(215 |
) |
|
Property management |
|
|
21,589 |
|
|
|
20,991 |
|
|
General and administrative |
|
|
13,626 |
|
|
|
18,296 |
|
|
Depreciation |
|
|
179,896 |
|
|
|
176,127 |
|
|
Total NOI |
|
$ |
425,480 |
|
|
$ |
421,217 |
|
|
Rental income: |
|
|
|
|
|
|
|
|
|
Same store |
|
$ |
571,362 |
|
|
$ |
559,564 |
|
|
Non-same store |
|
|
40,937 |
|
|
|
35,375 |
|
|
Total rental income |
|
|
612,299 |
|
|
|
594,939 |
|
|
Operating expenses: |
|
|
|
|
|
|
|
|
|
Same store |
|
|
167,047 |
|
|
|
160,478 |
|
|
Non-same store |
|
|
19,772 |
|
|
|
13,244 |
|
|
Total operating expenses |
|
|
186,819 |
|
|
|
173,722 |
|
|
NOI: |
|
|
|
|
|
|
|
|
|
Same store |
|
|
404,315 |
|
|
|
399,086 |
|
|
Non-same store |
|
|
21,165 |
|
|
|
22,131 |
|
|
Total NOI |
|
$ |
425,480 |
|
|
$ |
421,217 |
|
Non-same store NOI results decreased approximately $1.0 million compared to the second quarter of 2016 and consist primarily of
52
properties acquired in calendar years 2016 and 2017 , operations from the Company’s development properties and operations prior to disposition from 2016 to 2017 sold properties. This decrease primarily resulted from :
|
|
• |
The lost NOI from 2016 and 2017 dispositions of $9.2 million; |
|
|
• |
A decrease in operating activities from other miscellaneous operations; and |
|
|
• |
A partial offset from development and newly stabilized development properties in lease-up of $7.7 million, operating properties acquired in 2016 and 2017 of $1.4 million and operating activities from other non-same store properties (including three master leased properties) of $0.4 million. |
See also Note 13 in the Notes to Consolidated Financial Statements for additional discussion regarding the Company’s segment disclosures.
Property management expenses include off-site expenses associated with the self-management of the Company’s properties as well as management fees paid to any third party management companies. These expenses increased approximately $0.6 million or 2.8%. This increase is primarily attributable to an increase in temporary contractors, computer operations and legal and professional fees, partially offset by decreases in payroll-related costs.
General and administrative expenses, which include corporate operating expenses, decreased approximately $4.7 million or 25.5% primarily due to a decrease in payroll-related costs.
Depreciation expense, which includes depreciation on non-real estate assets, increased approximately $3.8 million or 2.1% primarily as a result of additional depreciation expense on properties acquired in 2016 and 2017 and development properties placed in service, partially offset by lower depreciation from properties sold in 2016 and 2017.
Interest and other income decreased approximately $55.4 million or 97.9%. This decrease is primarily attributable to the approximate $52.4 million gain from the sale of the Company's entire interest in the management contracts and related rights associated with the military housing ventures at Joint Base Lewis McChord during the quarter ended June 30, 2016 , along with the sale of the Company’s 421-a real estate tax certificates in 2016, both of which did not reoccur in 2017.
Other expenses decreased approximately $0.5 million or 30.7% primarily due to a decrease in transaction and pursuit costs as a result of a decline in acquisitions and development in 2017 as compared to 2016. In addition, the Company anticipates that substantially all of its transactions will now be accounted for as asset acquisitions, which means that transaction costs will largely be capitalized, as a result of its adoption of the new definition of a business standard effective January 1, 2017. See Note 2 in the Notes to Consolidated Financial Statements for further discussion.
Interest expense, including amortization of deferred financing costs, increased approximately $4.5 million or 5.1% primarily as a result of lower capitalized interest in the first six months of 2017 as compared to same period in 2016 as a result of the Company’s decline in development activity. The effective interest cost on all indebtedness for the quarter ended June 30, 2017 was 4.45% as compared to 4.74% for quarter ended June 30, 2016.
Income and other tax expense decreased approximately $0.2 million or 46.7% primarily due to decreases in various state and local taxes related to the Company's elevated disposition activity in 2016 vs. 2017.
Net gain on sales of real estate properties increased approximately $30.4 million or 52.9% as a result of higher gains on the sale of two consolidated apartment properties during the quarter ended quarter ended June 30, 2017 as compared to the three consolidated property sales during the quarter ended June 30, 2016, all of which did not meet the criteria for reporting discontinued operations. See Note 11 to Consolidate Financial Statements for further discussion.
Liquidity and Capital Resources
EQR issues public equity from time to time and guarantees certain debt of the Operating Partnership. EQR does not have any indebtedness as all debt is incurred by the Operating Partnership.
As of January 1, 2017, the Company had approximately $77.2 million of cash and cash equivalents and the amount available on its revolving credit facility was $1.96 billion (net of $20.6 million which was restricted/dedicated to support letters of credit and net of $20.0 million in principal outstanding on the commercial paper program). After taking into effect the various transactions discussed in the following paragraphs and the net cash provided by operating activities, the Company's cash and cash equivalents balance at June
53
30, 2017 was approximately $37.7 million and the amount available on its revolving credit facility was $1.22 billion (net of $12.1 million wh ich was restricted/dedicated to support letters of credit, net of $265.0 million outstanding on the revolving credit facility and net of $500.0 million in principal outstanding on the commercial paper program).
During the six months ended June 30, 2017, the Company generated proceeds from various transactions, which included the following:
|
|
• |
Disposed of three consolidated rental properties and one land parcel, receiving net proceeds of approximately $297.3 million; and |
|
|
• |
Issued approximately 0.2 million Common Shares related to share option exercises and ESPP purchases and received net proceeds of $10.3 million, which were contributed to the capital of the Operating Partnership in exchange for additional OP Units (on a one-for-one Common Share per OP Unit basis). |
During the six months ended June 30, 2017, the above proceeds along with net cash flow from operations and borrowings from the Company's revolving line of credit and commercial paper program were primarily utilized to:
|
|
• |
Acquire one consolidated property for approximately $57.1 million in cash; |
|
|
• |
Invest $175.9 million primarily in development projects; |
|
|
• |
Repay $377.4 million of mortgage loans and incur prepayment penalties of approximately $12.3 million; and |
|
|
• |
Repay $394.1 million of 5.750% unsecured notes at maturity. |
In September 2009, EQR announced the establishment of an At-The-Market (“ATM”) share offering program which would allow EQR to sell Common Shares from time to time into the existing trading market at current market prices as well as through negotiated transactions. Per the terms of ERPOP’s partnership agreement, EQR contributes the net proceeds from all equity offerings to the capital of ERPOP in exchange for additional OP Units (on a one-for-one Common Share per OP Unit basis). EQR may, but shall have no obligation to, sell Common Shares through the ATM share offering program in amounts and at times to be determined by EQR. Actual sales will depend on a variety of factors to be determined by EQR from time to time, including (among others) market conditions, the trading price of EQR’s Common Shares and determinations of the appropriate sources of funding for EQR. The program currently has a maturity of June 2019. EQR has the authority to issue 13.0 million shares but has not issued any shares under this program since September 2012. Through July 28, 2017, EQR has cumulatively issued approximately 16.7 million Common Shares at an average price of $48.53 per share for total consideration of approximately $809.9 million.
Depending on its analysis of market prices, economic conditions and other opportunities for the investment of available capital, EQR may repurchase its Common Shares pursuant to its existing share repurchase program authorized by the Board of Trustees. The Company may repurchase up to 13.0 million Common Shares under this program. No open market repurchases have occurred since 2008. As of July 28, 2017, EQR has remaining authorization to repurchase up to 13.0 million of its shares.
Depending on its analysis of prevailing market conditions, liquidity requirements, contractual restrictions and other factors, the Company may from time to time seek to repurchase and retire its outstanding debt in open market or privately negotiated transactions.
54
The Company’s total debt summary and debt maturity schedules as of June 30, 2017 are as follows:
Debt Summary as of June 30, 2017
($ in thousands)
|
|
|
|
|
|
|
|
|
|
|
|
|
|
|
Weighted |
|
|
|
|
|
|
|
|
|
|
|
|
|
Weighted |
|
|
Average |
|
||
|
|
|
|
|
|
|
|
|
|
|
Average |
|
|
Maturities |
|
||
|
|
|
Amounts (1) |
|
|
% of Total |
|
|
Rates (1) |
|
|
(years) |
|
||||
|
Secured |
|
$ |
3,743,363 |
|
|
|
41.8 |
% |
|
|
4.38 |
% |
|
|
5.9 |
|
|
Unsecured |
|
|
5,220,726 |
|
|
|
58.2 |
% |
|
|
4.28 |
% |
|
|
8.9 |
|
|
Total |
|
$ |
8,964,089 |
|
|
|
100.0 |
% |
|
|
4.32 |
% |
|
|
7.6 |
|
|
Fixed Rate Debt: |
|
|
|
|
|
|
|
|
|
|
|
|
|
|
|
|
|
Secured – Conventional |
|
$ |
3,108,842 |
|
|
|
34.7 |
% |
|
|
4.96 |
% |
|
|
4.4 |
|
|
Unsecured – Public |
|
|
4,006,424 |
|
|
|
44.7 |
% |
|
|
4.76 |
% |
|
|
11.3 |
|
|
Fixed Rate Debt |
|
|
7,115,266 |
|
|
|
79.4 |
% |
|
|
4.85 |
% |
|
|
8.3 |
|
|
Floating Rate Debt: |
|
|
|
|
|
|
|
|
|
|
|
|
|
|
|
|
|
Secured – Conventional |
|
|
7,045 |
|
|
|
0.1 |
% |
|
|
0.87 |
% |
|
|
16.4 |
|
|
Secured – Tax Exempt |
|
|
627,476 |
|
|
|
7.0 |
% |
|
|
1.43 |
% |
|
|
12.5 |
|
|
Unsecured – Public (2) |
|
|
449,941 |
|
|
|
5.0 |
% |
|
|
1.69 |
% |
|
|
2.0 |
|
|
Unsecured – Revolving Credit Facility (3) |
|
|
265,000 |
|
|
|
2.9 |
% |
|
|
2.00 |
% |
|
|
4.5 |
|
|
Unsecured – Commercial Paper Program (4) |
|
|
499,361 |
|
|
|
5.6 |
% |
|
|
1.31 |
% |
|
|
— |
|
|
Floating Rate Debt |
|
|
1,848,823 |
|
|
|
20.6 |
% |
|
|
1.50 |
% |
|
|
5.1 |
|
|
Total |
|
$ |
8,964,089 |
|
|
|
100.0 |
% |
|
|
4.32 |
% |
|
|
7.6 |
|
|
(1) |
Net of the effect of any derivative instruments. Weighted average rates are for the six months ended June, 30, 2017. |
|
(2) |
Fair value interest rate swaps convert the $450.0 million 2.375% notes due July 1, 2019 to a floating interest rate of 90-Day LIBOR plus 0.61%. |
|
(3) |
The Company’s $2.0 billion unsecured revolving credit facility matures January 10, 2022. The interest rate on advances under the credit facility will generally be LIBOR plus a spread (currently 0.825%), or based on bids received from the lending group, and an annual facility fee (currently 12.5 basis points). Both the spread and the facility fee are dependent on the credit rating of the Company’s long-term debt. As of June 30, 2017, there was approximately $1.22 billion available on the Company’s unsecured revolving credit facility (net of $12.1 million which was restricted/dedicated to support letters of credit, net of $265.0 million outstanding on the revolving credit facility and net of $500.0 million in principal outstanding on the commercial paper program). |
|
(4) |
The Company may borrow up to a maximum of $500.0 million on the commercial paper program subject to market conditions. The notes bear interest at various floating rates with a weighted average of 1.31% for the six months ended June 30, 2017 and a weighted average maturity of 30 days as of June 30, 2017. |
Note: The Company capitalized interest of approximately $16.6 million and $28.4 million during the six months ended June 30, 2017 and 2016, respectively. The Company capitalized interest of approximately $8.4 million and $14.2 million during the quarters ended June 30, 2017 and 2016, respectively.
55
Debt Maturity Schedule as of June 30 , 2017
($ in thousands)
|
Year |
|
Fixed Rate (1) |
|
|
Floating Rate (1) |
|
|
Total |
|
|
% of Total |
|
|
Weighted Average Rates on Fixed Rate Debt (1) |
|
|
Weighted Average Rates on Total Debt (1) |
|
||||||
|
2017 |
|
$ |
197,531 |
|
|
$ |
500,100 |
|
(2) |
$ |
697,631 |
|
|
|
7.7 |
% |
|
|
7.11 |
% |
|
|
3.11 |
% |
|
2018 |
|
|
82,734 |
|
|
|
97,235 |
|
|
|
179,969 |
|
|
|
2.0 |
% |
|
|
5.58 |
% |
|
|
3.63 |
% |
|
2019 |
|
|
506,731 |
|
(3) |
|
471,427 |
|
|
|
978,158 |
|
|
|
10.8 |
% |
|
|
5.17 |
% |
|
|
3.51 |
% |
|
2020 |
|
|
1,678,592 |
|
(4) |
|
400 |
|
|
|
1,678,992 |
|
|
|
18.5 |
% |
|
|
5.49 |
% |
|
|
5.49 |
% |
|
2021 |
|
|
927,506 |
|
|
|
300 |
|
|
|
927,806 |
|
|
|
10.2 |
% |
|
|
4.64 |
% |
|
|
4.64 |
% |
|
2022 |
|
|
265,341 |
|
|
|
265,400 |
|
(5) |
|
530,741 |
|
|
|
5.9 |
% |
|
|
3.26 |
% |
|
|
2.62 |
% |
|
2023 |
|
|
1,326,800 |
|
|
|
4,700 |
|
|
|
1,331,500 |
|
|
|
14.7 |
% |
|
|
3.74 |
% |
|
|
3.73 |
% |
|
2024 |
|
|
1,272 |
|
|
|
11,300 |
|
|
|
12,572 |
|
|
|
0.1 |
% |
|
|
4.79 |
% |
|
|
1.34 |
% |
|
2025 |
|
|
451,334 |
|
|
|
13,800 |
|
|
|
465,134 |
|
|
|
5.1 |
% |
|
|
3.38 |
% |
|
|
3.31 |
% |
|
2026 |
|
|
593,424 |
|
|
|
15,000 |
|
|
|
608,424 |
|
|
|
6.7 |
% |
|
|
3.59 |
% |
|
|
3.52 |
% |
|
2027+ |
|
|
1,126,437 |
|
|
|
532,165 |
|
|
|
1,658,602 |
|
|
|
18.3 |
% |
|
|
4.52 |
% |
|
|
3.38 |
% |
|
Subtotal |
|
|
7,157,702 |
|
|
|
1,911,827 |
|
|
|
9,069,529 |
|
|
|
100.0 |
% |
|
|
4.52 |
% |
|
|
3.91 |
% |
|
Deferred Financing Costs and Unamortized (Discount) |
|
|
(42,436 |
) |
|
|
(63,004 |
) |
|
|
(105,440 |
) |
|
N/A |
|
|
N/A |
|
|
N/A |
|
|||
|
Total |
|
$ |
7,115,266 |
|
|
$ |
1,848,823 |
|
|
$ |
8,964,089 |
|
|
|
100.0 |
% |
|
|
4.52 |
% |
|
|
3.91 |
% |
|
(1) |
Net of the effect of any derivative instruments. Weighted average rates are as of June 30, 2017. |
|
(2) |
Includes $500.0 million in principal outstanding on the Company’s commercial paper program. |
|
(3) |
Includes a $500.0 million 5.19% mortgage loan with a maturity date of October 1, 2019 that can be prepaid at par beginning October 1, 2018. |
|
(4) |
Includes a $550.0 million 6.08% mortgage loan with a maturity date of March 1, 2020 that can be prepaid at par beginning March 1, 2019. Also includes a $500.0 million 5.78% mortgage loan with a maturity date of July 1, 2020 that can be prepaid at par beginning July 1, 2019. |
|
(5) |
Includes $265.0 million outstanding on the Company’s unsecured revolving credit facility. |
EQR and ERPOP currently have an active universal shelf registration statement for the issuance of equity and debt securities that automatically became effective upon filing with the SEC on June 28, 2016 and expires on June 28, 2019. Per the terms of ERPOP's partnership agreement, EQR contributes the net proceeds of all equity offerings to the capital of ERPOP in exchange for additional OP Units (on a one-for-one Common Share per OP Unit basis) or preference units (on a one-for-one preferred share per preference unit basis).
The Company generally expects to meet its short-term liquidity requirements, including capital expenditures related to maintaining its existing properties and scheduled unsecured note and mortgage note repayments, through its working capital, net cash provided by operating activities and borrowings under the Company’s revolving credit facility and commercial paper program. Under normal operating conditions, the Company considers its cash provided by operating activities to be adequate to meet operating requirements and payments of distributions.
The Company has a flexible dividend policy which it believes will generate payouts closely aligned with the actual annual operating results of the Company’s core business and provide transparency to investors. Beginning in 2014, the Company began paying its regular annual dividend based on 65% of the midpoint of the range of Normalized FFO guidance customarily provided as part of the Company's fourth quarter earnings release. The Company expects the 2017 regular annual dividend payout will be $2.015 per share/unit and the Company intends to pay four regular quarterly dividends of $0.50375 per share/unit in 2017. All future dividends remain subject to the discretion of the Board of Trustees. The above assumption is based on current expectations and is forward-looking.
While our current dividend policy makes it less likely that we will over distribute, it will also lead to a dividend reduction more quickly should operating results deteriorate or large portfolio sales occur. However, whether due to changes in the dividend policy or otherwise, there may be times when the Company experiences shortfalls in its coverage of distributions, which may cause the Company to consider reducing its distributions and/or using the proceeds from property dispositions or additional financing transactions to make up the difference. Should these shortfalls occur for lengthy periods of time or be material in nature, the Company's financial condition may be adversely affected and it may not be able to maintain its current distribution levels. The Company believes that its expected 2017 operating cash flow will be sufficient to cover capital expenditures and regular dividends/distributions.
56
The Company also expects to meet its long-term liquidity requirements, such as lump sum unsecured note and mortgage debt maturities, property acquisitions, financing of construction and development activities thro ugh the issuance of secured and unsecured debt and equity securities, including additional OP Units, proceeds received from the disposition of certain properties and joint ventures and cash generated from operations after all distributions. In addition, t he Company has significant unencumbered properties available to secure additional mortgage borrowings in the event that the public capital markets are unavailable or the cost of alternative sources of capital is too high. The fair value of and cash flow f rom these unencumbered properties are in excess of the requirements the Company must maintain in order to comply with covenants under its unsecured notes, line of credit and commercial paper program. Of the $25.5 billion in investment in real estate on th e Company’s balance sheet at June 30, 2017, $19.2 billion or 75.5% was unencumbered. However , there can be no assurances that these sources of capital will be available to the Company in the future on acceptable terms or otherwise.
ERPOP's long-term senior debt ratings and short-term commercial paper ratings as well as EQR's long-term preferred equity ratings as of July 28, 2017 are as follows:
|
|
|
Standard & Poor's |
|
Moody's |
|
Fitch |
|
ERPOP's long-term senior debt rating |
|
A- |
|
A3 (1) |
|
A- |
|
ERPOP's short-term commercial paper rating |
|
A-2 |
|
P-2 |
|
F-2 |
|
EQR's long-term preferred equity rating |
|
BBB |
|
Baa1 (1) |
|
BBB |
|
(1) |
The long-term credit ratings listed above reflect the one-level upgrade by Moody’s effective July 17, 2017. |
On November 3, 2016, the Company replaced its existing $2.5 billion facility with a $2.0 billion unsecured revolving credit facility maturing January 10, 2022. The Company has the ability to increase available borrowings by an additional $750.0 million by adding additional banks to the facility or obtaining the agreement of existing banks to increase their commitments. The interest rate on advances under the facility will generally be LIBOR plus a spread (currently 0.825%), or based on bids received from the lending group, and the Company pays an annual facility fee (currently 12.5 basis points). Both the spread and the facility fee are dependent on the credit rating of the Company's long-term debt.
On February 2, 2015, the Company entered into an unsecured commercial paper note program in the United States. The Company may borrow up to a maximum of $500.0 million under this program subject to market conditions. The notes will be sold under customary terms in the United States commercial paper note market and will rank pari passu with all of the Company's other unsecured senior indebtedness. As of July 28, 2017, there was a balance of $500.0 million outstanding on the commercial paper program.
As of July 28, 2017, $415.0 million was outstanding and the amount available on the revolving credit facility was $1.07 billion (net of $12.1 million which was restricted/dedicated to support letters of credit, net of $415.0 million outstanding on the revolving credit facility and net of $500.0 million in principal outstanding on the commercial paper program). This facility may, among other potential uses, be used to fund property acquisitions, costs for certain properties under development and short-term liquidity requirements.
See Note 14 in the Notes to Consolidated Financial Statements for discussion of the events which occurred subsequent to June 30, 2017.
Capitalization of Fixed Assets and Improvements to Real Estate
The Company’s and the Operating Partnership’s capital expenditures policy has not changed from the information included in the Company’s and the Operating Partnership's Annual Report on Form 10-K for the year ended December 31, 2016.
For the six months ended June 30, 2017, our actual capital expenditures to real estate included the following (amounts in thousands except for apartment unit and per apartment unit amounts):
57
Capital Expenditures to Real Estate
For the Six Months Ended June 30, 2017
|
|
|
Total Apartment Units (1) |
|
|
Replacements (2) |
|
|
Avg. Per Apartment Unit |
|
|
Building Improvements (3) |
|
|
Avg. Per Apartment Unit |
|
|
Total |
|
|
Avg. Per Apartment Unit |
|
|||||||
|
Same Store Properties (4) |
|
|
70,400 |
|
|
$ |
40,233 |
|
|
$ |
572 |
|
|
$ |
46,477 |
|
|
$ |
660 |
|
|
$ |
86,710 |
|
|
$ |
1,232 |
|
|
Non-Same Store Properties (5) |
|
|
5,689 |
|
|
|
922 |
|
|
|
170 |
|
|
|
1,286 |
|
|
|
237 |
|
|
|
2,208 |
|
|
|
407 |
|
|
Other (6) |
|
|
— |
|
|
|
129 |
|
|
|
|
|
|
|
250 |
|
|
|
|
|
|
|
379 |
|
|
|
|
|
|
Total |
|
|
76,089 |
|
|
$ |
41,284 |
|
|
|
|
|
|
$ |
48,013 |
|
|
|
|
|
|
$ |
89,297 |
|
|
|
|
|
|
(1) |
Total Apartment Units – Excludes 945 unconsolidated apartment units for which capital expenditures to real estate are self-funded and do not consolidate into the Company's results. |
|
(2) |
Replacements – Includes new expenditures inside the apartment units such as appliances, mechanical equipment, fixtures and flooring, including carpeting. Replacements for same store properties also include $22.0 million spent during the six months ended June 30, 2017 on apartment unit renovations/rehabs (primarily kitchens and baths) on approximately 1,650 same store apartment units (equating to approximately $13,300 per apartment unit rehabbed) designed to reposition these units for higher rental levels in their respective markets. |
|
(3) |
Building Improvements – Includes roof replacement, paving, amenities and common areas, building mechanical equipment systems, exterior painting and siding, major landscaping, vehicles and office and maintenance equipment. |
|
(4) |
Same Store Properties – Primarily includes all properties acquired or completed that are stabilized prior to January 1, 2016, less properties subsequently sold. |
|
(5) |
Non-Same Store Properties – Primarily includes all properties acquired during 2016 and 2017, plus any properties in lease-up and not stabilized as of January 1, 2016. Per apartment unit amounts are based on a weighted average of 5,421 apartment units. |
|
(6) |
Other – Primarily includes expenditures for properties sold and properties under development. |
The Company estimates that during 2017 it will spend approximately $2,600 per apartment unit of capital expenditures, inclusive of apartment unit renovation/rehab costs, or $1,900 per apartment unit excluding apartment unit renovation/rehab costs. During 2017, the Company expects to spend approximately $50.0 million for unit renovation/rehab costs on same store properties at an average cost of $11,000 per apartment unit rehabbed. These anticipated amounts represent an increase as a percentage of rental revenues, in the cost per unit and in the absolute dollar amounts over 2016. These increases include approximately $17.0 million or approximately $250 per apartment unit of additional estimated expenditures for resident focused renovation projects such as common areas and fitness centers in order to remain competitive with the new luxury supply being delivered in many of our markets. We will continue to create value from our properties by doing those rehabs that meet our investment criteria. The above assumptions are based on current expectations and are forward-looking.
During the six months ended June 30, 2017, the Company’s total non-real estate capital additions, such as computer software, computer equipment, and furniture and fixtures and leasehold improvements to the Company’s property management offices and its corporate offices, were approximately $0.7 million. The Company expects to fund approximately $2.5 million in total non-real estate capital additions for the remainder of 2017. These anticipated fundings represent a decrease over 2016, which is primarily driven by the substantial completion of the implementation of new systems during 2016. The above assumption is based on current expectations and is forward-looking.
Capital expenditures to real estate and non-real estate capital additions are generally funded from net cash provided by operating activities and from investment cash flow.
Derivative Instruments
In the normal course of business, the Company is exposed to the effect of interest rate changes. The Company seeks to manage these risks by following established risk management policies and procedures including the use of derivatives to hedge interest rate risk on debt instruments. The Company may also use derivatives to manage commodity prices in the daily operations of the business.
The Company has a policy of only entering into contracts with major financial institutions based upon their credit ratings and other factors. When viewed in conjunction with the underlying and offsetting exposure that the derivatives are designed to hedge, the Company has not sustained a material loss from these instruments nor does it anticipate any material adverse effect on its net income or financial position in the future from the use of derivatives it currently has in place.
58
See Note 9 in th e Notes to Consolidated Financial Statements for additional discussion of derivative instruments at June 30, 2017.
Other
Total distributions paid in July 2017 amounted to $191.7 million (excluding distributions on Partially Owned Properties), which included certain distributions declared during the second quarter ended June 30, 2017.
Off-Balance Sheet Arrangements and Contractual Obligations
The Company has various unconsolidated interests in certain joint ventures. The Company does not believe that these unconsolidated investments have a materially different impact on its liquidity, cash flows, capital resources, credit or market risk than its consolidated operating and/or other activities. See Notes 2 and 6 in the Notes to Consolidated Financial Statements for additional discussion regarding the Company’s investments in partially owned entities. See also Note 12 in the Notes to Consolidated Financial Statements for discussion regarding the Company’s development projects.
The Company’s contractual obligations for the next five years and thereafter have not changed materially from the amounts and disclosures included in the Company’s and the Operating Partnership’s Annual Report on Form 10-K for the year ended December 31, 2016. See the updated debt maturity schedule included in Liquidity and Capital Resources for further discussion.
Critical Accounting Policies and Estimates
The Company’s and the Operating Partnership’s critical accounting policies and estimates have not changed materially from the information included in the Company’s and the Operating Partnership's Annual Report on Form 10-K for the year ended December 31, 2016.
Funds From Operations and Normalized Funds From Operations
The following is the Company’s and the Operating Partnership’s reconciliation of net income to FFO available to Common Shares and Units / Units and Normalized FFO available to Common Shares and Units / Units for the six months and quarters ended June 30, 2017 and 2016:
59
Funds From Operations and Normalized Funds From Operations
(Amounts in thousands)
|
|
|
Six Months Ended June 30, |
|
|
Quarter Ended June 30, |
|
||||||||||
|
|
|
2017 |
|
|
2016 |
|
|
2017 |
|
|
2016 |
|
||||
|
Net income |
|
$ |
354,101 |
|
|
$ |
3,960,231 |
|
|
$ |
204,160 |
|
|
$ |
228,400 |
|
|
Net (income) attributable to Noncontrolling Interests – Partially Owned Properties |
|
|
(1,553 |
) |
|
|
(1,545 |
) |
|
|
(765 |
) |
|
|
(781 |
) |
|
Preferred distributions |
|
|
(1,546 |
) |
|
|
(1,545 |
) |
|
|
(773 |
) |
|
|
(772 |
) |
|
Net income available to Common Shares and Units / Units |
|
|
351,002 |
|
|
|
3,957,141 |
|
|
|
202,622 |
|
|
|
226,847 |
|
|
Adjustments: |
|
|
|
|
|
|
|
|
|
|
|
|
|
|
|
|
|
Depreciation |
|
|
358,864 |
|
|
|
349,012 |
|
|
|
179,896 |
|
|
|
176,127 |
|
|
Depreciation – Non-real estate additions |
|
|
(2,580 |
) |
|
|
(2,635 |
) |
|
|
(1,282 |
) |
|
|
(1,227 |
) |
|
Depreciation – Partially Owned Properties |
|
|
(1,666 |
) |
|
|
(1,943 |
) |
|
|
(834 |
) |
|
|
(949 |
) |
|
Depreciation – Unconsolidated Properties |
|
|
2,285 |
|
|
|
2,467 |
|
|
|
1,143 |
|
|
|
1,234 |
|
|
Net (gain) on sales of unconsolidated entities - operating assets |
|
|
(68 |
) |
|
|
— |
|
|
|
— |
|
|
|
— |
|
|
Net (gain) on sales of real estate properties |
|
|
(124,433 |
) |
|
|
(3,780,835 |
) |
|
|
(87,726 |
) |
|
|
(57,356 |
) |
|
Discontinued operations: |
|
|
|
|
|
|
|
|
|
|
|
|
|
|
|
|
|
Net (gain) on sales of discontinued operations |
|
|
— |
|
|
|
(15 |
) |
|
|
— |
|
|
|
— |
|
|
FFO available to Common Shares and Units / Units (1) (3) (4) |
|
|
583,404 |
|
|
|
523,192 |
|
|
|
293,819 |
|
|
|
344,676 |
|
|
Adjustments: |
|
|
|
|
|
|
|
|
|
|
|
|
|
|
|
|
|
Asset impairment and valuation allowances |
|
|
— |
|
|
|
— |
|
|
|
— |
|
|
|
— |
|
|
Write-off of pursuit costs |
|
|
1,546 |
|
|
|
2,563 |
|
|
|
831 |
|
|
|
1,115 |
|
|
Debt extinguishment (gains) losses, including prepayment penalties, preferred share/preference unit redemptions and non-cash convertible debt discounts |
|
|
12,402 |
|
|
|
120,164 |
|
|
|
98 |
|
|
|
67 |
|
|
(Gains) losses on sales of non-operating assets, net of income and other tax expense (benefit) |
|
|
(18,950 |
) |
|
|
(66,593 |
) |
|
|
(58 |
) |
|
|
(54,616 |
) |
|
Other miscellaneous items |
|
|
(790 |
) |
|
|
514 |
|
|
|
(799 |
) |
|
|
(883 |
) |
|
Normalized FFO available to Common Shares and Units / Units (2) (3) (4) |
|
$ |
577,612 |
|
|
$ |
579,840 |
|
|
$ |
293,891 |
|
|
$ |
290,359 |
|
|
|
|
|
|
|
|
|
|
|
|
|
|
|
|
|
|
|
|
FFO (1) (3) |
|
$ |
584,950 |
|
|
$ |
524,737 |
|
|
$ |
294,592 |
|
|
$ |
345,448 |
|
|
Preferred/preference distributions |
|
|
(1,546 |
) |
|
|
(1,545 |
) |
|
|
(773 |
) |
|
|
(772 |
) |
|
FFO available to Common Shares and Units / Units (1) (3) (4) |
|
$ |
583,404 |
|
|
$ |
523,192 |
|
|
$ |
293,819 |
|
|
$ |
344,676 |
|
|
|
|
|
|
|
|
|
|
|
|
|
|
|
|
|
|
|
|
Normalized FFO (2) (3) |
|
$ |
579,158 |
|
|
$ |
581,385 |
|
|
$ |
294,664 |
|
|
$ |
291,131 |
|
|
Preferred/preference distributions |
|
|
(1,546 |
) |
|
|
(1,545 |
) |
|
|
(773 |
) |
|
|
(772 |
) |
|
Normalized FFO available to Common Shares and Units / Units (2) (3) (4) |
|
$ |
577,612 |
|
|
$ |
579,840 |
|
|
$ |
293,891 |
|
|
$ |
290,359 |
|
|
(1) |
The National Association of Real Estate Investment Trusts (“NAREIT”) defines funds from operations (“FFO”) (April 2002 White Paper) as net income (computed in accordance with accounting principles generally accepted in the United States (“GAAP”)), excluding gains (or losses) from sales and impairment write-downs of depreciable operating properties, plus depreciation and amortization, and after adjustments for unconsolidated partnerships and joint ventures. Adjustments for unconsolidated partnerships and joint ventures will be calculated to reflect funds from operations on the same basis. The April 2002 White Paper states that gain or loss on sales of property is excluded from FFO for previously depreciated operating properties only. |
|
(2) |
Normalized funds from operations (“Normalized FFO”) begins with FFO and excludes: |
|
|
• |
the impact of any expenses relating to non-operating asset impairment and valuation allowances; |
|
|
• |
pursuit cost write-offs; |
|
|
• |
gains and losses from early debt extinguishment, including prepayment penalties, preferred share/preference unit redemptions and the cost related to the implied option value of non-cash convertible debt discounts; |
|
|
• |
gains and losses on the sales of non-operating assets, including gains and losses from land parcel sales, net of the effect of income tax benefits or expenses; and |
|
|
• |
other miscellaneous items. |
60
|
(4) |
FFO available to Common Shares and Units / Units and Normalized FFO available to Common Shares and Units / Units are calculated on a basis consistent with net income available to Common Shares / Units and reflects adjustments to net income for preferred distributions and premiums on redemption of preferred shares/preference units in accordance with GAAP. The equity positions of various individuals and entities that contributed their properties to the Operating Partnership in exchange for OP Units are collectively referred to as the "Noncontrolling Interests –Operating Partnership". Subject to certain restrictions, the Noncontrolling Interests –Operating Partnership may exchange their OP Units for Common Shares on a one-for-one basis. |
Item 3. Quantitative an d Qualitative Disclosures About Market Risk
The Company’s and the Operating Partnership’s market risk has not changed materially from the amounts and information reported in Part II, Item 7A. Quantitative and Qualitative Disclosures About Market Risk , to the Company’s a nd the Operating Partnership's Annual Report on Form 10-K for the year ended December 31, 2016. See the Current Environment section of Item 2. Management’s Discussion and Analysis of Financial Condition and Results of Operations relating to market risk and the current economic environment. See also Note 9 in the Notes to Consolidated Financial Statements for additional discussion of derivative and other fair value instruments.
Item 4. Controls and Procedures
Equity Residential
|
|
(a) |
Evaluation of Disclosure Controls and Procedures: |
Effective as of June 30, 2017, the Company carried out an evaluation, under the supervision and with the participation of the Company’s management, including the Chief Executive Officer and Chief Financial Officer, of the effectiveness of the Company’s disclosure controls and procedures pursuant to Exchange Act Rules 13a-15 and 15d-15. Based on that evaluation, the Chief Executive Officer and Chief Financial Officer concluded that the disclosure controls and procedures are effective to ensure that information required to be disclosed by the Company in its Exchange Act filings is recorded, processed, summarized and reported within the time periods specified in the SEC’s rules and forms.
|
|
(b) |
Changes in Internal Control over Financial Reporting: |
There were no changes to the internal control over financial reporting of the Company identified in connection with the Company’s evaluation referred to in Item 4(a) above that occurred during the second quarter of 2017 that have materially affected, or are reasonably likely to materially affect, the Company’s internal control over financial reporting.
61
ERP Operating Limited Partnership
|
|
(a) |
Evaluation of Disclosure Controls and Procedures: |
Effective as of June 30, 2017, the Operating Partnership carried out an evaluation, under the supervision and with the participation of the Operating Partnership’s management, including the Chief Executive Officer and Chief Financial Officer of EQR, of the effectiveness of the Operating Partnership’s disclosure controls and procedures pursuant to Exchange Act Rules 13a-15 and 15d-15. Based on that evaluation, the Chief Executive Officer and Chief Financial Officer concluded that the disclosure controls and procedures are effective to ensure that information required to be disclosed by the Operating Partnership in its Exchange Act filings is recorded, processed, summarized and reported within the time periods specified in the SEC’s rules and forms.
|
|
(b) |
Changes in Internal Control over Financial Reporting: |
There were no changes to the internal control over financial reporting of the Operating Partnership identified in connection with the Operating Partnership’s evaluation referred to in Item 4(a) above that occurred during the second quarter of 2017 that have materially affected, or are reasonably likely to materially affect, the Operating Partnership’s internal control over financial reporting.
62
As of June 30, 2017, the Company does not believe there is any litigation pending or threatened against it that, individually or in the aggregate, may reasonably be expected to have a material adverse effect on the Company.
There have been no material changes to the risk factors that were discussed in Part I, Item 1A of the Company’s and the Operating Partnership's Annual Report on Form 10-K for the year ended December 31, 2016.
Item 2. Unregistered Sales of Equity Securities and Use of Proceeds
(a) Unregistered Common Shares Issued in the Quarter Ended June 30, 2017 - Equity Residential
During the quarter ended June 30, 2017, EQR issued 13,905 Common Shares in exchange for 13,905 OP Units held by various limited partners of ERPOP. OP Units are generally exchangeable into Common Shares on a one-for-one basis or, at the option of ERPOP, the cash equivalent thereof, at any time one year after the date of issuance. These shares were either registered under the Securities Act of 1933, as amended (the “Securities Act”), or issued in reliance on an exemption from registration under Section 4(2) of the Securities Act and the rules and regulations promulgated thereunder, as these were transactions by an issuer not involving a public offering. In light of the manner of the sale and information obtained by EQR from the limited partners in connection with these transactions, EQR believes it may rely on these exemptions.
Item 3. Defaults Upon Senior Securities
None.
Item 4. Mine Safety Disclosures
Not applicable.
None.
Item 6. Exhibits – See the Exhibit Index.
63
Pursuant to the requirements of the Securities Exchange Act of 1934, each registrant has duly caused this report to be signed on its behalf by the undersigned thereunto duly authorized.
|
|
|
EQUITY RESIDENTIAL |
||
|
|
|
|
|
|
|
Date: |
August 4, 2017 |
By: |
|
/s/ Mark J. Parrell |
|
|
|
|
|
Mark J. Parrell |
|
|
|
|
|
Executive Vice President and Chief Financial Officer |
|
|
|
|
|
(Principal Financial Officer) |
|
|
|
|
|
|
|
Date: |
August 4, 2017 |
By: |
|
/s/ Ian S. Kaufman |
|
|
|
|
|
Ian S. Kaufman |
|
|
|
|
|
Senior Vice President and Chief Accounting Officer |
|
|
|
|
|
(Principal Accounting Officer) |
|
|
|
ERP OPERATING LIMITED PARTNERSHIP
ITS GENERAL PARTNER |
||
|
|
|
|
|
|
|
Date: |
August 4, 2017 |
By: |
|
/s/ Mark J. Parrell |
|
|
|
|
|
Mark J. Parrell |
|
|
|
|
|
Executive Vice President and Chief Financial Officer |
|
|
|
|
|
(Principal Financial Officer) |
|
|
|
|
|
|
|
Date: |
August 4, 2017 |
By: |
|
/s/ Ian S. Kaufman |
|
|
|
|
|
Ian S. Kaufman |
|
|
|
|
|
Senior Vice President and Chief Accounting Officer |
|
|
|
|
|
(Principal Accounting Officer) |
The exhibits listed below are filed as part of this report. References to exhibits or other filings under the caption “Location” indicate that the exhibit or other filing has been filed, that the indexed exhibit and the exhibit referred to are the same and that the exhibit referred to is incorporated by reference. The Commission file numbers for our Exchange Act filings referenced below are 1-12252 (Equity Residential) and 0-24920 (ERP Operating Limited Partnership).
|
Exhibit |
|
Description |
|
Location |
|
|
|
|
|
|
|
10.1 |
|
|
Attached herein. |
|
|
|
|
|
|
|
|
10.2 |
|
|
Attached herein. |
|
|
|
|
|
|
|
|
12 |
|
|
Attached herein. |
|
|
|
|
|
|
|
|
31.1 |
|
Equity Residential – Certification of David J. Neithercut, Chief Executive Officer. |
|
Attached herein. |
|
|
|
|
|
|
|
31.2 |
|
Equity Residential – Certification of Mark J. Parrell, Chief Financial Officer. |
|
Attached herein. |
|
|
|
|
|
|
|
31.3 |
|
|
Attached herein. |
|
|
|
|
|
|
|
|
31.4 |
|
|
Attached herein. |
|
|
|
|
|
|
|
|
32.1 |
|
|
Attached herein. |
|
|
|
|
|
|
|
|
32.2 |
|
|
Attached herein. |
|
|
|
|
|
|
|
|
32.3 |
|
|
Attached herein. |
|
|
|
|
|
|
|
|
32.4 |
|
|
Attached herein. |
|
|
|
|
|
|
|
|
101 |
|
XBRL (Extensible Business Reporting Language). The following materials from Equity Residential’s and ERP Operating Limited Partnership’s Quarterly Report on Form 10-Q for the period ended June 30, 2017, formatted in XBRL: (i) consolidated balance sheets, (ii) consolidated statements of operations and comprehensive income, (iii) consolidated statements of cash flows, (iv) consolidated statement of changes in equity (Equity Residential), (v) consolidated statement of changes in capital (ERP Operating Limited Partnership) and (vi) notes to consolidated financial statements. |
|
Attached herein. |