Table of Contents
UNITED STATES
SECURITIES AND EXCHANGE COMMISSION
Washington, D.C. 20549
FORM
|
|
QUARTERLY REPORT PURSUANT TO SECTION 13 OR 15(d) OF THE SECURITIES EXCHANGE ACT OF 1934
For the quarterly period ended
|
OR
|
|
TRANSITION REPORT PURSUANT TO SECTION 13 OR 15(d) OF THE SECURITIES EXCHANGE ACT OF 1934 For the transition period from to |
Commission File Number:
Commission File Number:
( Exact name of registrant as specified in its charter)
|
|
|
|
|
|
|
|
|
(State or other jurisdiction of incorporation or organization) |
|
(I.R.S. Employer Identification No.) |
|
|
|
|
|
|
|
(
|
|
(Address of principal executive offices) (Zip Code) |
|
(Registrant’s telephone number, including area code) |
Securities registered pursuant to Section 12(b) of the Act:
|
Title of each class |
|
Trading Symbol(s) |
|
Name of each exchange on which registered |
|
|
|
|
|
|
|
|
|
N/A |
|
|
Indicate by check mark whether the registrant (1) has filed all reports required to be filed by Section 13 or 15(d) of the Securities Exchange Act of 1934 during the preceding 12 months (or for such shorter period that the registrant was required to file such reports), and (2) has been subject to such filing requirements for the past 90 days.
|
Equity Residential
|
ERP Operating Limited Partnership
|
Indicate by check mark whether the registrant has submitted electronically every Interactive Data File required to be submitted pursuant to Rule 405 of Regulation S-T (§232.405 of this chapter) during the preceding 12 months (or for such shorter period that the registrant was required to submit such files).
|
Equity Residential
|
ERP Operating Limited Partnership
|
Indicate by check mark whether the registrant is a large accelerated filer, an accelerated filer, a non-accelerated filer, a smaller reporting company, or an emerging growth company. See the definitions of “large accelerated filer,” “accelerated filer,” “smaller reporting company,” and “emerging growth company” in Rule 12b-2 of the Exchange Act.
Equity Residential:
|
|
|
☒ |
|
Accelerated filer |
|
☐ |
|
|
|
|
|
|||
|
Non-accelerated filer |
|
☐ |
|
Smaller reporting company |
|
|
|
|
|
|
|
|
|
|
|
Emerging growth company |
|
|
|
|
|
|
l
ERP Operating Limited Partnership:
|
Large accelerated filer |
|
☐ |
|
Accelerated filer |
|
☐ |
|
|
|
|
|
|||
|
|
|
☒ |
|
Smaller reporting company |
|
|
|
|
|
|
|
|
|
|
|
Emerging growth company |
|
|
|
|
|
|
If an emerging growth company, indicate by check mark if the registrant has elected not to use the extended transition period for complying with any new or revised financial accounting standards provided pursuant to Section 13(a) of the Exchange Act.
|
Equity Residential ☐ |
ERP Operating Limited Partnership ☐ |
Indicate by check mark whether the registrant is a shell company (as defined in Rule 12b-2 of the Exchange Act).
|
Equity Residential Yes
|
ERP Operating Limited Partnership Yes
|
The number of EQR Common Shares of Beneficial Interest, $0.01 par value, outstanding on October 21, 2022 was
Table of Contents
EXPLANATORY NOTE
This report combines the reports on Form 10-Q for the quarterly period ended September 30, 2022 of Equity Residential and ERP Operating Limited Partnership. Unless stated otherwise or the context otherwise requires, references to “EQR” mean Equity Residential, a Maryland real estate investment trust (“REIT”), and references to “ERPOP” mean ERP Operating Limited Partnership, an Illinois limited partnership. References to the “Company,” “we,” “us” or “our” mean collectively EQR, ERPOP and those entities/subsidiaries owned or controlled by EQR and/or ERPOP. References to the “Operating Partnership” mean collectively ERPOP and those entities/subsidiaries owned or controlled by ERPOP. The following chart illustrates the Company’s and the Operating Partnership’s corporate structure:
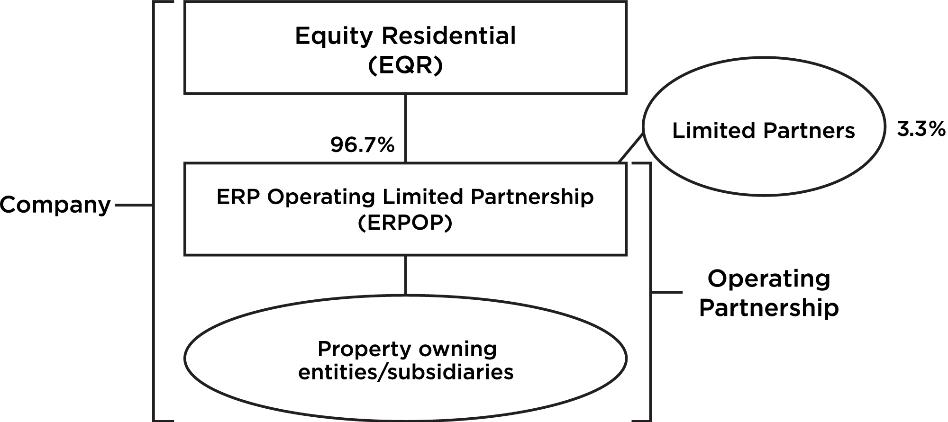
EQR is the general partner of, and as of September 30, 2022 owned an approximate 96.7% ownership interest in, ERPOP. The remaining 3.3% interest is owned by limited partners. As the sole general partner of ERPOP, EQR has exclusive control of ERPOP’s day-to-day management. Management operates the Company and the Operating Partnership as one business. The management of EQR consists of the same members as the management of ERPOP.
The Company is structured as an umbrella partnership REIT (“UPREIT”) and EQR contributes all net proceeds from its various equity offerings to ERPOP. In return for those contributions, EQR receives a number of OP Units (see definition below) in ERPOP equal to the number of Common Shares it has issued in the equity offering. The Company may acquire properties in transactions that include the issuance of OP Units as consideration for the acquired properties. Such transactions may, in certain circumstances, enable the sellers to defer in whole or in part, the recognition of taxable income or gain that might otherwise result from the sales. This is one of the reasons why the Company is structured in the manner shown above. Based on the terms of ERPOP’s partnership agreement, OP Units can be exchanged with Common Shares on a one-for-one basis because the Company maintains a one-for-one relationship between the OP Units of ERPOP issued to EQR and the outstanding Common Shares.
The Company believes that combining the reports on Form 10-Q of EQR and ERPOP into this single report provides the following benefits:
• enhances investors’ understanding of the Company and the Operating Partnership by enabling investors to view the business as a whole in the same manner as management views and operates the business;
• eliminates duplicative disclosure and provides a more streamlined and readable presentation since a substantial portion of the disclosure applies to both the Company and the Operating Partnership; and
• creates time and cost efficiencies through the preparation of one combined report instead of two separate reports.
Table of Contents
The Company believes it is important to understand the few differences between EQR and ERPOP in the context of how EQR and ERPOP operate as a consolidated company. All of the Company’s property ownership, development and related business operations are conducted through the Operating Partnership and EQR has no material assets or liabilities other than its investment in ERPOP. EQR’s primary function is acting as the general partner of ERPOP. EQR also issues equity from time to time, the net proceeds of which it is obligated to contribute to ERPOP. EQR does not have any indebtedness as all debt is incurred by the Operating Partnership. The Operating Partnership holds substantially all of the assets of the Company, including the Company’s ownership interests in its joint ventures. The Operating Partnership conducts the operations of the business and is structured as a partnership with no publicly traded equity. Except for the net proceeds from equity offerings by EQR (which are contributed to the capital of ERPOP in exchange for additional partnership interests in ERPOP (“OP Units”) (on a one-for-one Common Share per OP Unit basis) or additional preference units in ERPOP (on a one-for-one preferred share per preference unit basis)), the Operating Partnership generates all remaining capital required by the Company’s business. These sources include the Operating Partnership’s working capital, net cash provided by operating activities, borrowings under its revolving credit facility and/or commercial paper program, the issuance of secured and unsecured debt and partnership interests, and proceeds received from disposition of certain properties and joint venture interests.
Shareholders’ equity, partners’ capital and noncontrolling interests are the main areas of difference between the consolidated financial statements of the Company and those of the Operating Partnership. The limited partners of the Operating Partnership are accounted for as partners’ capital in the Operating Partnership’s financial statements and as noncontrolling interests in the Company’s financial statements. The noncontrolling interests in the Operating Partnership’s financial statements include the interests of unaffiliated partners in various consolidated partnerships. The noncontrolling interests in the Company’s financial statements include the same noncontrolling interests at the Operating Partnership level and limited partner OP Unit holders of the Operating Partnership. The differences between shareholders’ equity and partners’ capital result from differences in the equity issued at the Company and Operating Partnership levels.
To help investors understand the differences between the Company and the Operating Partnership, this report provides separate consolidated financial statements for the Company and the Operating Partnership; a single set of consolidated notes to such financial statements that includes separate discussions of each entity’s debt, noncontrolling interests and shareholders’ equity or partners’ capital, as applicable; and a combined Management’s Discussion and Analysis of Financial Condition and Results of Operations section that includes discrete information related to each entity.
This report also includes separate Part I, Item 4, Controls and Procedures , sections and separate Exhibits 31 and 32 certifications for each of the Company and the Operating Partnership in order to establish that the requisite certifications have been made and that the Company and the Operating Partnership are compliant with Rule 13a-15 or Rule 15d-15 of the Securities Exchange Act of 1934, as amended (the “Exchange Act”), and 18 U.S.C. §1350.
In order to highlight the differences between the Company and the Operating Partnership, the separate sections in this report for the Company and the Operating Partnership specifically refer to the Company and the Operating Partnership. In the sections that combine disclosure of the Company and the Operating Partnership, this report refers to actions or holdings as being actions or holdings of the Company. Although the Operating Partnership is generally the entity that directly or indirectly enters into contracts and joint ventures and holds assets and debt, reference to the Company is appropriate because the Company is one business and the Company operates that business through the Operating Partnership.
As general partner with control of ERPOP, EQR consolidates ERPOP for financial reporting purposes, and EQR essentially has no assets or liabilities other than its investment in ERPOP. Therefore, the assets and liabilities of the Company and the Operating Partnership are the same on their respective financial statements. The separate discussions of the Company and the Operating Partnership in this report should be read in conjunction with each other to understand the results of the Company on a consolidated basis and how management operates the Company.
Table of Contents
TABLE OF CONTENTS
1
Table of Contents
EQUITY RESIDENTIAL
CONSOLIDATED B ALANCE SHEETS
(Amounts in thousands except for share amounts)
(Unaudited)
|
|
|
September 30, |
|
|
December 31, |
|
||
|
|
|
2022 |
|
|
2021 |
|
||
|
ASSETS |
|
|
|
|
|
|
||
|
Land |
|
$ |
|
|
|
$ |
|
|
|
Depreciable property |
|
|
|
|
|
|
|
|
|
Projects under development |
|
|
|
|
|
|
|
|
|
Land held for development |
|
|
|
|
|
|
|
|
|
Investment in real estate |
|
|
|
|
|
|
|
|
|
Accumulated depreciation |
|
|
(
|
) |
|
|
(
|
) |
|
Investment in real estate, net |
|
|
|
|
|
|
|
|
|
Investments in unconsolidated entities |
|
|
|
|
|
|
|
|
|
Cash and cash equivalents |
|
|
|
|
|
|
|
|
|
Restricted deposits |
|
|
|
|
|
|
|
|
|
Right-of-use assets |
|
|
|
|
|
|
|
|
|
Other assets |
|
|
|
|
|
|
|
|
|
Total assets |
|
$ |
|
|
|
$ |
|
|
|
|
|
|
|
|
|
|
||
|
LIABILITIES AND EQUITY |
|
|
|
|
|
|
||
|
Liabilities: |
|
|
|
|
|
|
||
|
Mortgage notes payable, net |
|
$ |
|
|
|
$ |
|
|
|
Notes, net |
|
|
|
|
|
|
|
|
|
Line of credit and commercial paper |
|
|
|
|
|
|
|
|
|
Accounts payable and accrued expenses |
|
|
|
|
|
|
|
|
|
Accrued interest payable |
|
|
|
|
|
|
|
|
|
Lease liabilities |
|
|
|
|
|
|
|
|
|
Other liabilities |
|
|
|
|
|
|
|
|
|
Security deposits |
|
|
|
|
|
|
|
|
|
Distributions payable |
|
|
|
|
|
|
|
|
|
Total liabilities |
|
|
|
|
|
|
|
|
|
|
|
|
|
|
|
|
||
|
|
|
|
|
|
|
|
||
|
|
|
|
|
|
|
|
||
|
Redeemable Noncontrolling Interests – Operating Partnership |
|
|
|
|
|
|
|
|
|
Equity: |
|
|
|
|
|
|
||
|
Shareholders' equity: |
|
|
|
|
|
|
||
|
Preferred Shares of beneficial interest, $
|
|
|
|
|
|
|
|
|
|
Common Shares of beneficial interest, $
|
|
|
|
|
|
|
|
|
|
Paid in capital |
|
|
|
|
|
|
|
|
|
Retained earnings |
|
|
|
|
|
|
|
|
|
Accumulated other comprehensive income (loss) |
|
|
(
|
) |
|
|
(
|
) |
|
Total shareholders’ equity |
|
|
|
|
|
|
|
|
|
Noncontrolling Interests: |
|
|
|
|
|
|
||
|
Operating Partnership |
|
|
|
|
|
|
|
|
|
Partially Owned Properties |
|
|
(
|
) |
|
|
|
|
|
Total Noncontrolling Interests |
|
|
|
|
|
|
|
|
|
Total equity |
|
|
|
|
|
|
|
|
|
Total liabilities and equity |
|
$ |
|
|
|
$ |
|
|
See accompanying notes
2
Table of Contents
EQUITY RESIDENTIAL
CONSOLIDATED STATEMENTS OF O PERATIONS AND COMPREHENSIVE INCOME
(Amounts in thousands except per share data)
(Unaudited)
|
|
|
Nine Months Ended September 30, |
|
|
Quarter Ended September 30, |
|
||||||||||
|
|
|
2022 |
|
|
2021 |
|
|
2022 |
|
|
2021 |
|
||||
|
REVENUES |
|
|
|
|
|
|
|
|
|
|
|
|
||||
|
Rental income |
|
$ |
|
|
|
$ |
|
|
|
$ |
|
|
|
$ |
|
|
|
|
|
|
|
|
|
|
|
|
|
|
|
|
||||
|
EXPENSES |
|
|
|
|
|
|
|
|
|
|
|
|
||||
|
Property and maintenance |
|
|
|
|
|
|
|
|
|
|
|
|
|
|
|
|
|
Real estate taxes and insurance |
|
|
|
|
|
|
|
|
|
|
|
|
|
|
|
|
|
Property management |
|
|
|
|
|
|
|
|
|
|
|
|
|
|
|
|
|
General and administrative |
|
|
|
|
|
|
|
|
|
|
|
|
|
|
|
|
|
Depreciation |
|
|
|
|
|
|
|
|
|
|
|
|
|
|
|
|
|
Total expenses |
|
|
|
|
|
|
|
|
|
|
|
|
|
|
|
|
|
|
|
|
|
|
|
|
|
|
|
|
|
|
||||
|
Net gain (loss) on sales of real estate properties |
|
|
|
|
|
|
|
|
|
|
|
|
|
|
|
|
|
|
|
|
|
|
|
|
|
|
|
|
|
|
||||
|
Operating income |
|
|
|
|
|
|
|
|
|
|
|
|
|
|
|
|
|
|
|
|
|
|
|
|
|
|
|
|
|
|
||||
|
Interest and other income |
|
|
|
|
|
|
|
|
|
|
|
|
|
|
|
|
|
Other expenses |
|
|
(
|
) |
|
|
(
|
) |
|
|
(
|
) |
|
|
(
|
) |
|
Interest: |
|
|
|
|
|
|
|
|
|
|
|
|
||||
|
Expense incurred, net |
|
|
(
|
) |
|
|
(
|
) |
|
|
(
|
) |
|
|
(
|
) |
|
Amortization of deferred financing costs |
|
|
(
|
) |
|
|
(
|
) |
|
|
(
|
) |
|
|
(
|
) |
|
Income before income and other taxes, income (loss) from
|
|
|
|
|
|
|
|
|
|
|
|
|
|
|
|
|
|
Income and other tax (expense) benefit |
|
|
(
|
) |
|
|
(
|
) |
|
|
(
|
) |
|
|
(
|
) |
|
Income (loss) from investments in unconsolidated entities |
|
|
(
|
) |
|
|
(
|
) |
|
|
(
|
) |
|
|
(
|
) |
|
Net gain (loss) on sales of land parcels |
|
|
— |
|
|
|
|
|
|
|
— |
|
|
|
— |
|
|
Net income |
|
|
|
|
|
|
|
|
|
|
|
|
|
|
|
|
|
Net (income) loss attributable to Noncontrolling Interests: |
|
|
|
|
|
|
|
|
|
|
|
|
||||
|
Operating Partnership |
|
|
(
|
) |
|
|
(
|
) |
|
|
(
|
) |
|
|
(
|
) |
|
Partially Owned Properties |
|
|
(
|
) |
|
|
(
|
) |
|
|
(
|
) |
|
|
(
|
) |
|
Net income attributable to controlling interests |
|
|
|
|
|
|
|
|
|
|
|
|
|
|
|
|
|
Preferred distributions |
|
|
(
|
) |
|
|
(
|
) |
|
|
(
|
) |
|
|
(
|
) |
|
Net income available to Common Shares |
|
$ |
|
|
|
$ |
|
|
|
$ |
|
|
|
$ |
|
|
|
|
|
|
|
|
|
|
|
|
|
|
|
|
||||
|
Earnings per share – basic: |
|
|
|
|
|
|
|
|
|
|
|
|
||||
|
Net income available to Common Shares |
|
$ |
|
|
|
$ |
|
|
|
$ |
|
|
|
$ |
|
|
|
Weighted average Common Shares outstanding |
|
|
|
|
|
|
|
|
|
|
|
|
|
|
|
|
|
|
|
|
|
|
|
|
|
|
|
|
|
|
||||
|
Earnings per share – diluted: |
|
|
|
|
|
|
|
|
|
|
|
|
||||
|
Net income available to Common Shares |
|
$ |
|
|
|
$ |
|
|
|
$ |
|
|
|
$ |
|
|
|
Weighted average Common Shares outstanding |
|
|
|
|
|
|
|
|
|
|
|
|
|
|
|
|
See accompanying notes
3
Table of Contents
EQUITY RESIDENTIAL
CONSOLIDATED STATEMENTS OF OPERATIO NS AND COMPREHENSIVE INCOME (Continued)
(Amounts in thousands except per share data)
(Unaudited)
|
|
|
Nine Months Ended September 30, |
|
|
Quarter Ended September 30, |
|
||||||||||
|
|
|
2022 |
|
|
2021 |
|
|
2022 |
|
|
2021 |
|
||||
|
Comprehensive income: |
|
|
|
|
|
|
|
|
|
|
|
|
||||
|
Net income |
|
$ |
|
|
|
$ |
|
|
|
$ |
|
|
|
$ |
|
|
|
Other comprehensive income (loss): |
|
|
|
|
|
|
|
|
|
|
|
|
||||
|
Other comprehensive income (loss) – derivative instruments: |
|
|
|
|
|
|
|
|
|
|
|
|
||||
|
Unrealized holding gains (losses) arising during the period |
|
|
|
|
|
|
— |
|
|
|
|
|
|
|
— |
|
|
Losses reclassified into earnings from other comprehensive
|
|
|
|
|
|
|
|
|
|
|
|
|
|
|
|
|
|
Other comprehensive income (loss) |
|
|
|
|
|
|
|
|
|
|
|
|
|
|
|
|
|
Comprehensive income |
|
|
|
|
|
|
|
|
|
|
|
|
|
|
|
|
|
Comprehensive (income) attributable to Noncontrolling Interests |
|
|
(
|
) |
|
|
(
|
) |
|
|
(
|
) |
|
|
(
|
) |
|
Comprehensive income attributable to controlling interests |
|
$ |
|
|
|
$ |
|
|
|
$ |
|
|
|
$ |
|
|
See accompanying notes
4
Table of Contents
EQUITY RESIDENTIAL
CONSOLIDATED STATEM ENTS OF CASH FLOWS
(Amounts in thousands)
(Unaudited)
|
|
|
Nine Months Ended September 30, |
|
|||||
|
|
|
2022 |
|
|
2021 |
|
||
|
CASH FLOWS FROM OPERATING ACTIVITIES: |
|
|
|
|
|
|
||
|
Net income |
|
$ |
|
|
|
$ |
|
|
|
Adjustments to reconcile net income to net cash provided by operating activities: |
|
|
|
|
|
|
||
|
Depreciation |
|
|
|
|
|
|
|
|
|
Amortization of deferred financing costs |
|
|
|
|
|
|
|
|
|
Amortization of above/below market lease intangibles |
|
|
— |
|
|
|
(
|
) |
|
Amortization of discounts and premiums on debt |
|
|
|
|
|
|
|
|
|
Amortization of deferred settlements on derivative instruments |
|
|
|
|
|
|
|
|
|
Amortization of right-of-use assets |
|
|
|
|
|
|
|
|
|
Write-off of pursuit costs |
|
|
|
|
|
|
|
|
|
(Income) loss from investments in unconsolidated entities |
|
|
|
|
|
|
|
|
|
Distributions from unconsolidated entities – return on capital |
|
|
|
|
|
|
— |
|
|
Net (gain) loss on sales of real estate properties |
|
|
(
|
) |
|
|
(
|
) |
|
Net (gain) loss on sales of land parcels |
|
|
— |
|
|
|
(
|
) |
|
Realized (gain) loss on sale of investment securities |
|
|
(
|
) |
|
|
(
|
) |
|
Compensation paid with Company Common Shares |
|
|
|
|
|
|
|
|
|
Changes in assets and liabilities: |
|
|
|
|
|
|
||
|
(Increase) decrease in other assets |
|
|
|
|
|
|
|
|
|
Increase (decrease) in accounts payable and accrued expenses |
|
|
|
|
|
|
|
|
|
Increase (decrease) in accrued interest payable |
|
|
(
|
) |
|
|
(
|
) |
|
Increase (decrease) in lease liabilities |
|
|
(
|
) |
|
|
(
|
) |
|
Increase (decrease) in other liabilities |
|
|
(
|
) |
|
|
|
|
|
Increase (decrease) in security deposits |
|
|
|
|
|
|
|
|
|
Net cash provided by operating activities |
|
|
|
|
|
|
|
|
|
CASH FLOWS FROM INVESTING ACTIVITIES: |
|
|
|
|
|
|
||
|
Investment in real estate – acquisitions |
|
|
(
|
) |
|
|
(
|
) |
|
Investment in real estate – development/other |
|
|
(
|
) |
|
|
(
|
) |
|
Capital expenditures to real estate |
|
|
(
|
) |
|
|
(
|
) |
|
Non-real estate capital additions |
|
|
(
|
) |
|
|
(
|
) |
|
Interest capitalized for real estate and unconsolidated entities under development |
|
|
(
|
) |
|
|
(
|
) |
|
Proceeds from disposition of real estate, net |
|
|
|
|
|
|
|
|
|
Investments in unconsolidated entities – acquisitions |
|
|
(
|
) |
|
|
(
|
) |
|
Investments in unconsolidated entities – development/other |
|
|
(
|
) |
|
|
(
|
) |
|
Distributions from unconsolidated entities – return of capital |
|
|
|
|
|
|
|
|
|
Purchase of investment securities and other investments |
|
|
(
|
) |
|
|
(
|
) |
|
Proceeds from sale of investment securities |
|
|
|
|
|
|
|
|
|
Net cash provided by (used for) investing activities |
|
|
|
|
|
|
(
|
) |
See accompanying notes
5
Table of Contents
EQUITY RESIDENTIAL
CONSOLIDATED STATEMENTS OF CASH FLOWS (Continued)
(Amounts in thousands)
(Unaudited)
|
|
|
Nine Months Ended September 30, |
|
|||||
|
|
|
2022 |
|
|
2021 |
|
||
|
CASH FLOWS FROM FINANCING ACTIVITIES: |
|
|
|
|
|
|
||
|
Debt financing costs |
|
$ |
(
|
) |
|
$ |
(
|
) |
|
Mortgage notes payable, net: |
|
|
|
|
|
|
||
|
Proceeds |
|
|
|
|
|
|
|
|
|
Lump sum payoffs |
|
|
(
|
) |
|
|
(
|
) |
|
Scheduled principal repayments |
|
|
(
|
) |
|
|
(
|
) |
|
Notes, net: |
|
|
|
|
|
|
||
|
Proceeds |
|
|
— |
|
|
|
|
|
|
Lump sum payoffs |
|
|
(
|
) |
|
|
— |
|
|
Line of credit and commercial paper: |
|
|
|
|
|
|
||
|
Commercial paper proceeds |
|
|
|
|
|
|
|
|
|
Commercial paper repayments |
|
|
(
|
) |
|
|
(
|
) |
|
Finance ground lease principal payments |
|
|
(
|
) |
|
|
(
|
) |
|
Proceeds from Employee Share Purchase Plan (ESPP) |
|
|
|
|
|
|
|
|
|
Proceeds from exercise of options |
|
|
|
|
|
|
|
|
|
Payment of offering costs |
|
|
(
|
) |
|
|
(
|
) |
|
Other financing activities, net |
|
|
(
|
) |
|
|
(
|
) |
|
Acquisition of Noncontrolling Interests – Partially Owned Properties |
|
|
(
|
) |
|
|
— |
|
|
Contributions – Noncontrolling Interests – Partially Owned Properties |
|
|
|
|
|
|
— |
|
|
Contributions – Noncontrolling Interests – Operating Partnership |
|
|
|
|
|
|
— |
|
|
Distributions: |
|
|
|
|
|
|
||
|
Common Shares |
|
|
(
|
) |
|
|
(
|
) |
|
Preferred Shares |
|
|
(
|
) |
|
|
(
|
) |
|
Noncontrolling Interests – Operating Partnership |
|
|
(
|
) |
|
|
(
|
) |
|
Noncontrolling Interests – Partially Owned Properties |
|
|
(
|
) |
|
|
(
|
) |
|
Net cash provided by (used for) financing activities |
|
|
(
|
) |
|
|
(
|
) |
|
Net increase (decrease) in cash and cash equivalents and restricted deposits |
|
|
(
|
) |
|
|
|
|
|
Cash and cash equivalents and restricted deposits, beginning of period |
|
|
|
|
|
|
|
|
|
Cash and cash equivalents and restricted deposits, end of period |
|
$ |
|
|
|
$ |
|
|
|
|
|
|
|
|
|
|
||
|
Cash and cash equivalents and restricted deposits, end of period |
|
|
|
|
|
|
||
|
Cash and cash equivalents |
|
$ |
|
|
|
$ |
|
|
|
Restricted deposits |
|
|
|
|
|
|
|
|
|
Total cash and cash equivalents and restricted deposits, end of period |
|
$ |
|
|
|
$ |
|
|
See accompanying notes
6
Table of Contents
EQUITY RESIDENTIAL
CONSOLIDATED STATEMENTS OF CASH FLOWS (Continued)
(Amounts in thousands)
(Unaudited)
|
|
|
Nine Months Ended September 30, |
|
|||||
|
|
|
2022 |
|
|
2021 |
|
||
|
SUPPLEMENTAL INFORMATION: |
|
|
|
|
|
|
||
|
Cash paid for interest, net of amounts capitalized |
|
$ |
|
|
|
$ |
|
|
|
Net cash paid (received) for income and other taxes |
|
$ |
|
|
|
$ |
|
|
|
Amortization of deferred financing costs: |
|
|
|
|
|
|
||
|
Investment in real estate, net |
|
$ |
(
|
) |
|
$ |
(
|
) |
|
Other assets |
|
$ |
|
|
|
$ |
|
|
|
Mortgage notes payable, net |
|
$ |
|
|
|
$ |
|
|
|
Notes, net |
|
$ |
|
|
|
$ |
|
|
|
Amortization of discounts and premiums on debt: |
|
|
|
|
|
|
||
|
Mortgage notes payable, net |
|
$ |
|
|
|
$ |
|
|
|
Notes, net |
|
$ |
|
|
|
$ |
|
|
|
Amortization of deferred settlements on derivative instruments: |
|
|
|
|
|
|
||
|
Other liabilities |
|
$ |
(
|
) |
|
$ |
(
|
) |
|
Accumulated other comprehensive income |
|
$ |
|
|
|
$ |
|
|
|
Write-off of pursuit costs: |
|
|
|
|
|
|
||
|
Investment in real estate, net |
|
$ |
|
|
|
$ |
|
|
|
Investments in unconsolidated entities |
|
$ |
|
|
|
$ |
— |
|
|
Other assets |
|
$ |
|
|
|
$ |
|
|
|
Accounts payable and accrued expenses |
|
$ |
— |
|
|
$ |
|
|
|
(Income) loss from investments in unconsolidated entities: |
|
|
|
|
|
|
||
|
Investments in unconsolidated entities |
|
$ |
|
|
|
$ |
|
|
|
Other liabilities |
|
$ |
|
|
|
$ |
|
|
|
Realized/unrealized (gain) loss on derivative instruments: |
|
|
|
|
|
|
||
|
Other assets |
|
$ |
(
|
) |
|
$ |
— |
|
|
Accumulated other comprehensive income |
|
$ |
|
|
|
$ |
— |
|
|
Interest capitalized for real estate and unconsolidated entities under development: |
|
|
|
|
|
|
||
|
Investment in real estate, net |
|
$ |
(
|
) |
|
$ |
(
|
) |
|
Investments in unconsolidated entities |
|
$ |
(
|
) |
|
$ |
(
|
) |
|
Investments in unconsolidated entities – development/other: |
|
|
|
|
|
|
||
|
Investment in real estate, net |
|
$ |
— |
|
|
$ |
|
|
|
Investments in unconsolidated entities |
|
$ |
(
|
) |
|
$ |
(
|
) |
|
Other liabilities |
|
$ |
(
|
) |
|
$ |
(
|
) |
|
Debt financing costs: |
|
|
|
|
|
|
||
|
Other assets |
|
$ |
(
|
) |
|
$ |
|
|
|
Mortgage notes payable, net |
|
$ |
(
|
) |
|
$ |
(
|
) |
|
Notes, net |
|
$ |
(
|
) |
|
$ |
(
|
) |
|
Right-of-use assets and lease liabilities initial measurement and reclassifications: |
|
|
|
|
|
|
||
|
Right-of-use assets |
|
$ |
(
|
) |
|
$ |
|
|
|
Lease liabilities |
|
$ |
|
|
|
$ |
(
|
) |
|
Non-cash share distribution and other transfers from unconsolidated entities: |
|
|
|
|
|
|
||
|
Investments in unconsolidated entities |
|
$ |
|
|
|
$ |
|
|
|
Other assets |
|
$ |
(
|
) |
|
$ |
(
|
) |
See accompanying notes
7
Table of Contents
EQUITY RESIDENTIAL
CONSOLIDATED STATEMENT S OF CHANGES IN EQUITY
(Amounts in thousands except per share data)
(Unaudited)
|
|
|
Nine Months Ended September 30, |
|
|
Quarter Ended September 30, |
|
||||||||||
|
|
|
2022 |
|
|
2021 |
|
|
2022 |
|
|
2021 |
|
||||
|
SHAREHOLDERS’ EQUITY |
|
|
|
|
|
|
|
|
|
|
|
|
||||
|
PREFERRED SHARES |
|
|
|
|
|
|
|
|
|
|
|
|
||||
|
Balance, beginning of period |
|
$ |
|
|
|
$ |
|
|
|
$ |
|
|
|
$ |
|
|
|
Balance, end of period |
|
$ |
|
|
|
$ |
|
|
|
$ |
|
|
|
$ |
|
|
|
COMMON SHARES, $
|
|
|
|
|
|
|
|
|
|
|
|
|
||||
|
Balance, beginning of period |
|
$ |
|
|
|
$ |
|
|
|
$ |
|
|
|
$ |
|
|
|
Conversion of OP Units into Common Shares |
|
|
— |
|
|
|
|
|
|
|
— |
|
|
|
— |
|
|
Exercise of share options |
|
|
|
|
|
|
|
|
|
|
— |
|
|
|
|
|
|
Employee Share Purchase Plan (ESPP) |
|
|
|
|
|
|
|
|
|
|
|
|
|
|
— |
|
|
Share-based employee compensation expense: |
|
|
|
|
|
|
|
|
|
|
|
|
||||
|
Restricted shares |
|
|
|
|
|
|
|
|
|
|
— |
|
|
|
— |
|
|
Balance, end of period |
|
$ |
|
|
|
$ |
|
|
|
$ |
|
|
|
$ |
|
|
|
PAID IN CAPITAL |
|
|
|
|
|
|
|
|
|
|
|
|
||||
|
Balance, beginning of period |
|
$ |
|
|
|
$ |
|
|
|
$ |
|
|
|
$ |
|
|
|
Common Share Issuance: |
|
|
|
|
|
|
|
|
|
|
|
|
||||
|
Conversion of OP Units into Common Shares |
|
|
|
|
|
|
|
|
|
|
|
|
|
|
|
|
|
Exercise of share options |
|
|
|
|
|
|
|
|
|
|
|
|
|
|
|
|
|
Employee Share Purchase Plan (ESPP) |
|
|
|
|
|
|
|
|
|
|
|
|
|
|
|
|
|
Share-based employee compensation expense: |
|
|
|
|
|
|
|
|
|
|
|
|
||||
|
Restricted shares |
|
|
|
|
|
|
|
|
|
|
|
|
|
|
|
|
|
Share options |
|
|
|
|
|
|
|
|
|
|
|
|
|
|
|
|
|
ESPP discount |
|
|
|
|
|
|
|
|
|
|
|
|
|
|
|
|
|
Offering costs |
|
|
(
|
) |
|
|
(
|
) |
|
|
(
|
) |
|
|
(
|
) |
|
Supplemental Executive Retirement Plan (SERP) |
|
|
(
|
) |
|
|
(
|
) |
|
|
— |
|
|
|
|
|
|
Acquisition of Noncontrolling Interests – Partially Owned Properties |
|
|
(
|
) |
|
|
— |
|
|
|
(
|
) |
|
|
— |
|
|
Change in market value of Redeemable Noncontrolling Interests –
|
|
|
|
|
|
|
(
|
) |
|
|
|
|
|
|
(
|
) |
|
Adjustment for Noncontrolling Interests ownership in Operating
|
|
|
|
|
|
|
(
|
) |
|
|
|
|
|
|
|
|
|
Balance, end of period |
|
$ |
|
|
|
$ |
|
|
|
$ |
|
|
|
$ |
|
|
|
RETAINED EARNINGS |
|
|
|
|
|
|
|
|
|
|
|
|
||||
|
Balance, beginning of period |
|
$ |
|
|
|
$ |
|
|
|
$ |
|
|
|
$ |
|
|
|
Net income attributable to controlling interests |
|
|
|
|
|
|
|
|
|
|
|
|
|
|
|
|
|
Common Share distributions |
|
|
(
|
) |
|
|
(
|
) |
|
|
(
|
) |
|
|
(
|
) |
|
Preferred Share distributions |
|
|
(
|
) |
|
|
(
|
) |
|
|
(
|
) |
|
|
(
|
) |
|
Balance, end of period |
|
$ |
|
|
|
$ |
|
|
|
$ |
|
|
|
$ |
|
|
|
ACCUMULATED OTHER COMPREHENSIVE INCOME (LOSS) |
|
|
|
|
|
|
|
|
|
|
|
|
||||
|
Balance, beginning of period |
|
$ |
(
|
) |
|
$ |
(
|
) |
|
$ |
(
|
) |
|
$ |
(
|
) |
|
Accumulated other comprehensive income (loss) – derivative
|
|
|
|
|
|
|
|
|
|
|
|
|
||||
|
Unrealized holding gains (losses) arising during the period |
|
|
|
|
|
|
— |
|
|
|
|
|
|
|
— |
|
|
Losses reclassified into earnings from other comprehensive
|
|
|
|
|
|
|
|
|
|
|
|
|
|
|
|
|
|
Balance, end of period |
|
$ |
(
|
) |
|
$ |
(
|
) |
|
$ |
(
|
) |
|
$ |
(
|
) |
|
|
|
|
|
|
|
|
|
|
|
|
|
|
||||
|
DISTRIBUTIONS |
|
|
|
|
|
|
|
|
|
|
|
|
||||
|
Distributions declared per Common Share outstanding |
|
$ |
|
|
|
$ |
|
|
|
$ |
|
|
|
$ |
|
|
See accompanying notes
8
Table of Contents
EQUITY RESIDENTIAL
CONSOLIDATED STATEMENTS OF CHANGES IN EQUITY (Continued)
(Amounts in thousands except per share data)
(Unaudited)
|
|
|
Nine Months Ended September 30, |
|
|
Quarter Ended September 30, |
|
||||||||||
|
|
|
2022 |
|
|
2021 |
|
|
2022 |
|
|
2021 |
|
||||
|
NONCONTROLLING INTERESTS |
|
|
|
|
|
|
|
|
|
|
|
|
||||
|
OPERATING PARTNERSHIP |
|
|
|
|
|
|
|
|
|
|
|
|
||||
|
Balance, beginning of period |
|
$ |
|
|
|
$ |
|
|
|
$ |
|
|
|
$ |
|
|
|
Issuance of restricted units to Noncontrolling Interests |
|
|
|
|
|
|
— |
|
|
|
— |
|
|
|
— |
|
|
Conversion of OP Units held by Noncontrolling Interests into OP
|
|
|
(
|
) |
|
|
(
|
) |
|
|
(
|
) |
|
|
(
|
) |
|
Equity compensation associated with Noncontrolling Interests |
|
|
|
|
|
|
|
|
|
|
|
|
|
|
|
|
|
Net income attributable to Noncontrolling Interests |
|
|
|
|
|
|
|
|
|
|
|
|
|
|
|
|
|
Distributions to Noncontrolling Interests |
|
|
(
|
) |
|
|
(
|
) |
|
|
(
|
) |
|
|
(
|
) |
|
Change in carrying value of Redeemable Noncontrolling Interests –
|
|
|
|
|
|
|
(
|
) |
|
|
(
|
) |
|
|
(
|
) |
|
Adjustment for Noncontrolling Interests ownership in Operating
|
|
|
(
|
) |
|
|
|
|
|
|
(
|
) |
|
|
(
|
) |
|
Balance, end of period |
|
$ |
|
|
|
$ |
|
|
|
$ |
|
|
|
$ |
|
|
|
PARTIALLY OWNED PROPERTIES |
|
|
|
|
|
|
|
|
|
|
|
|
||||
|
Balance, beginning of period |
|
$ |
|
|
|
$ |
|
|
|
$ |
(
|
) |
|
$ |
|
|
|
Net income attributable to Noncontrolling Interests |
|
|
|
|
|
|
|
|
|
|
|
|
|
|
|
|
|
Contributions by Noncontrolling Interests |
|
|
|
|
|
|
— |
|
|
|
— |
|
|
|
— |
|
|
Distributions to Noncontrolling Interests |
|
|
(
|
) |
|
|
(
|
) |
|
|
(
|
) |
|
|
(
|
) |
|
Acquisition of Noncontrolling Interests – Partially Owned Properties |
|
|
(
|
) |
|
|
— |
|
|
|
|
|
|
|
— |
|
|
Balance, end of period |
|
$ |
(
|
) |
|
$ |
|
|
|
$ |
(
|
) |
|
$ |
|
|
See accompanying notes
9
Table of Contents
ERP OPERATING LI MITED PARTNERSHIP
CONSOLIDATED B ALANCE SHEETS
(Amounts in thousands)
(Unaudited)
|
|
|
September 30, |
|
|
December 31, |
|
||
|
|
|
2022 |
|
|
2021 |
|
||
|
ASSETS |
|
|
|
|
|
|
||
|
Land |
|
$ |
|
|
|
$ |
|
|
|
Depreciable property |
|
|
|
|
|
|
|
|
|
Projects under development |
|
|
|
|
|
|
|
|
|
Land held for development |
|
|
|
|
|
|
|
|
|
Investment in real estate |
|
|
|
|
|
|
|
|
|
Accumulated depreciation |
|
|
(
|
) |
|
|
(
|
) |
|
Investment in real estate, net |
|
|
|
|
|
|
|
|
|
Investments in unconsolidated entities |
|
|
|
|
|
|
|
|
|
Cash and cash equivalents |
|
|
|
|
|
|
|
|
|
Restricted deposits |
|
|
|
|
|
|
|
|
|
Right-of-use assets |
|
|
|
|
|
|
|
|
|
Other assets |
|
|
|
|
|
|
|
|
|
Total assets |
|
$ |
|
|
|
$ |
|
|
|
|
|
|
|
|
|
|
||
|
LIABILITIES AND CAPITAL |
|
|
|
|
|
|
||
|
Liabilities: |
|
|
|
|
|
|
||
|
Mortgage notes payable, net |
|
$ |
|
|
|
$ |
|
|
|
Notes, net |
|
|
|
|
|
|
|
|
|
Line of credit and commercial paper |
|
|
|
|
|
|
|
|
|
Accounts payable and accrued expenses |
|
|
|
|
|
|
|
|
|
Accrued interest payable |
|
|
|
|
|
|
|
|
|
Lease liabilities |
|
|
|
|
|
|
|
|
|
Other liabilities |
|
|
|
|
|
|
|
|
|
Security deposits |
|
|
|
|
|
|
|
|
|
Distributions payable |
|
|
|
|
|
|
|
|
|
Total liabilities |
|
|
|
|
|
|
|
|
|
|
|
|
|
|
|
|
||
|
|
|
|
|
|
|
|
||
|
|
|
|
|
|
|
|
||
|
Redeemable Limited Partners |
|
|
|
|
|
|
|
|
|
Capital: |
|
|
|
|
|
|
||
|
Partners’ Capital: |
|
|
|
|
|
|
||
|
Preference Units |
|
|
|
|
|
|
|
|
|
General Partner |
|
|
|
|
|
|
|
|
|
Limited Partners |
|
|
|
|
|
|
|
|
|
Accumulated other comprehensive income (loss) |
|
|
(
|
) |
|
|
(
|
) |
|
Total partners’ capital |
|
|
|
|
|
|
|
|
|
Noncontrolling Interests – Partially Owned Properties |
|
|
(
|
) |
|
|
|
|
|
Total capital |
|
|
|
|
|
|
|
|
|
Total liabilities and capital |
|
$ |
|
|
|
$ |
|
|
See accompanying notes
10
Table of Contents
ERP OPERATING LIMITED PARTNERSHIP
CONSOLIDATED STATEMENTS OF OPERA TIONS AND COMPREHENSIVE INCOME
(Amounts in thousands except per Unit data)
(Unaudited)
|
|
|
Nine Months Ended September 30, |
|
|
Quarter Ended September 30, |
|
||||||||||
|
|
|
2022 |
|
|
2021 |
|
|
2022 |
|
|
2021 |
|
||||
|
REVENUES |
|
|
|
|
|
|
|
|
|
|
|
|
||||
|
Rental income |
|
$ |
|
|
|
$ |
|
|
|
$ |
|
|
|
$ |
|
|
|
|
|
|
|
|
|
|
|
|
|
|
|
|
||||
|
EXPENSES |
|
|
|
|
|
|
|
|
|
|
|
|
||||
|
Property and maintenance |
|
|
|
|
|
|
|
|
|
|
|
|
|
|
|
|
|
Real estate taxes and insurance |
|
|
|
|
|
|
|
|
|
|
|
|
|
|
|
|
|
Property management |
|
|
|
|
|
|
|
|
|
|
|
|
|
|
|
|
|
General and administrative |
|
|
|
|
|
|
|
|
|
|
|
|
|
|
|
|
|
Depreciation |
|
|
|
|
|
|
|
|
|
|
|
|
|
|
|
|
|
Total expenses |
|
|
|
|
|
|
|
|
|
|
|
|
|
|
|
|
|
|
|
|
|
|
|
|
|
|
|
|
|
|
||||
|
Net gain (loss) on sales of real estate properties |
|
|
|
|
|
|
|
|
|
|
|
|
|
|
|
|
|
|
|
|
|
|
|
|
|
|
|
|
|
|
||||
|
Operating income |
|
|
|
|
|
|
|
|
|
|
|
|
|
|
|
|
|
|
|
|
|
|
|
|
|
|
|
|
|
|
||||
|
Interest and other income |
|
|
|
|
|
|
|
|
|
|
|
|
|
|
|
|
|
Other expenses |
|
|
(
|
) |
|
|
(
|
) |
|
|
(
|
) |
|
|
(
|
) |
|
Interest: |
|
|
|
|
|
|
|
|
|
|
|
|
||||
|
Expense incurred, net |
|
|
(
|
) |
|
|
(
|
) |
|
|
(
|
) |
|
|
(
|
) |
|
Amortization of deferred financing costs |
|
|
(
|
) |
|
|
(
|
) |
|
|
(
|
) |
|
|
(
|
) |
|
Income before income and other taxes, income (loss) from
|
|
|
|
|
|
|
|
|
|
|
|
|
|
|
|
|
|
Income and other tax (expense) benefit |
|
|
(
|
) |
|
|
(
|
) |
|
|
(
|
) |
|
|
(
|
) |
|
Income (loss) from investments in unconsolidated entities |
|
|
(
|
) |
|
|
(
|
) |
|
|
(
|
) |
|
|
(
|
) |
|
Net gain (loss) on sales of land parcels |
|
|
— |
|
|
|
|
|
|
|
— |
|
|
|
— |
|
|
Net income |
|
|
|
|
|
|
|
|
|
|
|
|
|
|
|
|
|
Net (income) loss attributable to Noncontrolling Interests – Partially Owned
|
|
|
(
|
) |
|
|
(
|
) |
|
|
(
|
) |
|
|
(
|
) |
|
Net income attributable to controlling interests |
|
$ |
|
|
|
$ |
|
|
|
$ |
|
|
|
$ |
|
|
|
ALLOCATION OF NET INCOME: |
|
|
|
|
|
|
|
|
|
|
|
|
||||
|
Preference Units |
|
$ |
|
|
|
$ |
|
|
|
$ |
|
|
|
$ |
|
|
|
|
|
|
|
|
|
|
|
|
|
|
|
|
||||
|
General Partner |
|
$ |
|
|
|
$ |
|
|
|
$ |
|
|
|
$ |
|
|
|
Limited Partners |
|
|
|
|
|
|
|
|
|
|
|
|
|
|
|
|
|
Net income available to Units |
|
$ |
|
|
|
$ |
|
|
|
$ |
|
|
|
$ |
|
|
|
|
|
|
|
|
|
|
|
|
|
|
|
|
||||
|
Earnings per Unit – basic: |
|
|
|
|
|
|
|
|
|
|
|
|
||||
|
Net income available to Units |
|
$ |
|
|
|
$ |
|
|
|
$ |
|
|
|
$ |
|
|
|
Weighted average Units outstanding |
|
|
|
|
|
|
|
|
|
|
|
|
|
|
|
|
|
|
|
|
|
|
|
|
|
|
|
|
|
|
||||
|
Earnings per Unit – diluted: |
|
|
|
|
|
|
|
|
|
|
|
|
||||
|
Net income available to Units |
|
$ |
|
|
|
$ |
|
|
|
$ |
|
|
|
$ |
|
|
|
Weighted average Units outstanding |
|
|
|
|
|
|
|
|
|
|
|
|
|
|
|
|
See accompanying notes
11
Table of Contents
ERP OPERATING LIMITED PARTNERSHIP
CONSOLIDATED STATEMENTS OF OPERATIO NS AND COMPREHENSIVE INCOME (Continued)
(Amounts in thousands except per Unit data)
(Unaudited)
|
|
|
Nine Months Ended September 30, |
|
|
Quarter Ended September 30, |
|
||||||||||
|
|
|
2022 |
|
|
2021 |
|
|
2022 |
|
|
2021 |
|
||||
|
Comprehensive income: |
|
|
|
|
|
|
|
|
|
|
|
|
||||
|
Net income |
|
$ |
|
|
|
$ |
|
|
|
$ |
|
|
|
$ |
|
|
|
Other comprehensive income (loss): |
|
|
|
|
|
|
|
|
|
|
|
|
||||
|
Other comprehensive income (loss) – derivative instruments: |
|
|
|
|
|
|
|
|
|
|
|
|
||||
|
Unrealized holding gains (losses) arising during the period |
|
|
|
|
|
|
— |
|
|
|
|
|
|
|
— |
|
|
Losses reclassified into earnings from other comprehensive
|
|
|
|
|
|
|
|
|
|
|
|
|
|
|
|
|
|
Other comprehensive income (loss) |
|
|
|
|
|
|
|
|
|
|
|
|
|
|
|
|
|
Comprehensive income |
|
|
|
|
|
|
|
|
|
|
|
|
|
|
|
|
|
Comprehensive (income) attributable to Noncontrolling Interests –
|
|
|
(
|
) |
|
|
(
|
) |
|
|
(
|
) |
|
|
(
|
) |
|
Comprehensive income attributable to controlling interests |
|
$ |
|
|
|
$ |
|
|
|
$ |
|
|
|
$ |
|
|
See accompanying notes
12
Table of Contents
ERP OPERATING LIMITED PARTNERSHIP
CONSOLIDATED STA TEMENTS OF CASH FLOWS
(Amounts in thousands)
(Unaudited)
|
|
|
Nine Months Ended September 30, |
|
|||||
|
|
|
2022 |
|
|
2021 |
|
||
|
CASH FLOWS FROM OPERATING ACTIVITIES: |
|
|
|
|
|
|
||
|
Net income |
|
$ |
|
|
|
$ |
|
|
|
Adjustments to reconcile net income to net cash provided by operating activities: |
|
|
|
|
|
|
||
|
Depreciation |
|
|
|
|
|
|
|
|
|
Amortization of deferred financing costs |
|
|
|
|
|
|
|
|
|
Amortization of above/below market lease intangibles |
|
|
— |
|
|
|
(
|
) |
|
Amortization of discounts and premiums on debt |
|
|
|
|
|
|
|
|
|
Amortization of deferred settlements on derivative instruments |
|
|
|
|
|
|
|
|
|
Amortization of right-of-use assets |
|
|
|
|
|
|
|
|
|
Write-off of pursuit costs |
|
|
|
|
|
|
|
|
|
(Income) loss from investments in unconsolidated entities |
|
|
|
|
|
|
|
|
|
Distributions from unconsolidated entities – return on capital |
|
|
|
|
|
|
— |
|
|
Net (gain) loss on sales of real estate properties |
|
|
(
|
) |
|
|
(
|
) |
|
Net (gain) loss on sales of land parcels |
|
|
— |
|
|
|
(
|
) |
|
Realized (gain) loss on sale of investment securities |
|
|
(
|
) |
|
|
(
|
) |
|
Compensation paid with Company Common Shares |
|
|
|
|
|
|
|
|
|
Changes in assets and liabilities: |
|
|
|
|
|
|
||
|
(Increase) decrease in other assets |
|
|
|
|
|
|
|
|
|
Increase (decrease) in accounts payable and accrued expenses |
|
|
|
|
|
|
|
|
|
Increase (decrease) in accrued interest payable |
|
|
(
|
) |
|
|
(
|
) |
|
Increase (decrease) in lease liabilities |
|
|
(
|
) |
|
|
(
|
) |
|
Increase (decrease) in other liabilities |
|
|
(
|
) |
|
|
|
|
|
Increase (decrease) in security deposits |
|
|
|
|
|
|
|
|
|
Net cash provided by operating activities |
|
|
|
|
|
|
|
|
|
CASH FLOWS FROM INVESTING ACTIVITIES: |
|
|
|
|
|
|
||
|
Investment in real estate – acquisitions |
|
|
(
|
) |
|
|
(
|
) |
|
Investment in real estate – development/other |
|
|
(
|
) |
|
|
(
|
) |
|
Capital expenditures to real estate |
|
|
(
|
) |
|
|
(
|
) |
|
Non-real estate capital additions |
|
|
(
|
) |
|
|
(
|
) |
|
Interest capitalized for real estate and unconsolidated entities under development |
|
|
(
|
) |
|
|
(
|
) |
|
Proceeds from disposition of real estate, net |
|
|
|
|
|
|
|
|
|
Investments in unconsolidated entities – acquisitions |
|
|
(
|
) |
|
|
(
|
) |
|
Investments in unconsolidated entities – development/other |
|
|
(
|
) |
|
|
(
|
) |
|
Distributions from unconsolidated entities – return of capital |
|
|
|
|
|
|
|
|
|
Purchase of investment securities and other investments |
|
|
(
|
) |
|
|
(
|
) |
|
Proceeds from sale of investment securities |
|
|
|
|
|
|
|
|
|
Net cash provided by (used for) investing activities |
|
|
|
|
|
|
(
|
) |
See accompanying notes
13
Table of Contents
ERP OPERATING LIMITED PARTNERSHIP
CONSOLIDATED STATEMENTS OF CASH FLOWS (Continued)
(Amounts in thousands)
(Unaudited)
|
|
|
Nine Months Ended September 30, |
|
|||||
|
|
|
2022 |
|
|
2021 |
|
||
|
CASH FLOWS FROM FINANCING ACTIVITIES: |
|
|
|
|
|
|
||
|
Debt financing costs |
|
$ |
(
|
) |
|
$ |
(
|
) |
|
Mortgage notes payable, net: |
|
|
|
|
|
|
||
|
Proceeds |
|
|
|
|
|
|
|
|
|
Lump sum payoffs |
|
|
(
|
) |
|
|
(
|
) |
|
Scheduled principal repayments |
|
|
(
|
) |
|
|
(
|
) |
|
Notes, net: |
|
|
|
|
|
|
||
|
Proceeds |
|
|
— |
|
|
|
|
|
|
Lump sum payoffs |
|
|
(
|
) |
|
|
— |
|
|
Line of credit and commercial paper: |
|
|
|
|
|
|
||
|
Commercial paper proceeds |
|
|
|
|
|
|
|
|
|
Commercial paper repayments |
|
|
(
|
) |
|
|
(
|
) |
|
Finance ground lease principal payments |
|
|
(
|
) |
|
|
(
|
) |
|
Proceeds from EQR’s Employee Share Purchase Plan (ESPP) |
|
|
|
|
|
|
|
|
|
Proceeds from exercise of EQR options |
|
|
|
|
|
|
|
|
|
Payment of offering costs |
|
|
(
|
) |
|
|
(
|
) |
|
Other financing activities, net |
|
|
(
|
) |
|
|
(
|
) |
|
Acquisition of Noncontrolling Interests – Partially Owned Properties |
|
|
(
|
) |
|
|
— |
|
|
Contributions – Noncontrolling Interests – Partially Owned Properties |
|
|
|
|
|
|
— |
|
|
Contributions – Limited Partners |
|
|
|
|
|
|
— |
|
|
Distributions: |
|
|
|
|
|
|
||
|
OP Units – General Partner |
|
|
(
|
) |
|
|
(
|
) |
|
Preference Units |
|
|
(
|
) |
|
|
(
|
) |
|
OP Units – Limited Partners |
|
|
(
|
) |
|
|
(
|
) |
|
Noncontrolling Interests – Partially Owned Properties |
|
|
(
|
) |
|
|
(
|
) |
|
Net cash provided by (used for) financing activities |
|
|
(
|
) |
|
|
(
|
) |
|
Net increase (decrease) in cash and cash equivalents and restricted deposits |
|
|
(
|
) |
|
|
|
|
|
Cash and cash equivalents and restricted deposits, beginning of period |
|
|
|
|
|
|
|
|
|
Cash and cash equivalents and restricted deposits, end of period |
|
$ |
|
|
|
$ |
|
|
|
|
|
|
|
|
|
|
||
|
Cash and cash equivalents and restricted deposits, end of period |
|
|
|
|
|
|
||
|
Cash and cash equivalents |
|
$ |
|
|
|
$ |
|
|
|
Restricted deposits |
|
|
|
|
|
|
|
|
|
Total cash and cash equivalents and restricted deposits, end of period |
|
$ |
|
|
|
$ |
|
|
See accompanying notes
14
Table of Contents
ERP OPERATING LIMITED PARTNERSHIP
CONSOLIDATED STATEMENTS OF CASH FLOWS (Continued)
(Amounts in thousands)
(Unaudited)
|
|
|
Nine Months Ended September 30, |
|
|||||
|
|
|
2022 |
|
|
2021 |
|
||
|
SUPPLEMENTAL INFORMATION: |
|
|
|
|
|
|
||
|
Cash paid for interest, net of amounts capitalized |
|
$ |
|
|
|
$ |
|
|
|
Net cash paid (received) for income and other taxes |
|
$ |
|
|
|
$ |
|
|
|
Amortization of deferred financing costs: |
|
|
|
|
|
|
||
|
Investment in real estate, net |
|
$ |
(
|
) |
|
$ |
(
|
) |
|
Other assets |
|
$ |
|
|
|
$ |
|
|
|
Mortgage notes payable, net |
|
$ |
|
|
|
$ |
|
|
|
Notes, net |
|
$ |
|
|
|
$ |
|
|
|
Amortization of discounts and premiums on debt: |
|
|
|
|
|
|
||
|
Mortgage notes payable, net |
|
$ |
|
|
|
$ |
|
|
|
Notes, net |
|
$ |
|
|
|
$ |
|
|
|
Amortization of deferred settlements on derivative instruments: |
|
|
|
|
|
|
||
|
Other liabilities |
|
$ |
(
|
) |
|
$ |
(
|
) |
|
Accumulated other comprehensive income |
|
$ |
|
|
|
$ |
|
|
|
Write-off of pursuit costs: |
|
|
|
|
|
|
||
|
Investment in real estate, net |
|
$ |
|
|
|
$ |
|
|
|
Investments in unconsolidated entities |
|
$ |
|
|
|
$ |
— |
|
|
Other assets |
|
$ |
|
|
|
$ |
|
|
|
Accounts payable and accrued expenses |
|
$ |
— |
|
|
$ |
|
|
|
(Income) loss from investments in unconsolidated entities: |
|
|
|
|
|
|
||
|
Investments in unconsolidated entities |
|
$ |
|
|
|
$ |
|
|
|
Other liabilities |
|
$ |
|
|
|
$ |
|
|
|
Realized/unrealized (gain) loss on derivative instruments: |
|
|
|
|
|
|
||
|
Other assets |
|
$ |
(
|
) |
|
$ |
— |
|
|
Accumulated other comprehensive income |
|
$ |
|
|
|
$ |
— |
|
|
Interest capitalized for real estate and unconsolidated entities under development: |
|
|
|
|
|
|
||
|
Investment in real estate, net |
|
$ |
(
|
) |
|
$ |
(
|
) |
|
Investments in unconsolidated entities |
|
$ |
(
|
) |
|
$ |
(
|
) |
|
Investments in unconsolidated entities – development/other: |
|
|
|
|
|
|
||
|
Investment in real estate, net |
|
$ |
— |
|
|
$ |
|
|
|
Investments in unconsolidated entities |
|
$ |
(
|
) |
|
$ |
(
|
) |
|
Other liabilities |
|
$ |
(
|
) |
|
$ |
(
|
) |
|
Debt financing costs: |
|
|
|
|
|
|
||
|
Other assets |
|
$ |
(
|
) |
|
$ |
|
|
|
Mortgage notes payable, net |
|
$ |
(
|
) |
|
$ |
(
|
) |
|
Notes, net |
|
$ |
(
|
) |
|
$ |
(
|
) |
|
Right-of-use assets and lease liabilities initial measurement and reclassifications: |
|
|
|
|
|
|
||
|
Right-of-use assets |
|
$ |
(
|
) |
|
$ |
|
|
|
Lease liabilities |
|
$ |
|
|
|
$ |
(
|
) |
|
Non-cash share distribution and other transfers from unconsolidated entities: |
|
|
|
|
|
|
||
|
Investments in unconsolidated entities |
|
$ |
|
|
|
$ |
|
|
|
Other assets |
|
$ |
(
|
) |
|
$ |
(
|
) |
See accompanying notes
15
Table of Contents
ERP OPERATING LIMITED PARTNERSHIP
CONSOLIDATED STATEMENT S OF CHANGES IN CAPITAL
(Amounts in thousands except per Unit data)
(Unaudited)
|
|
|
Nine Months Ended September 30, |
|
|
Quarter Ended September 30, |
|
||||||||||
|
|
|
2022 |
|
|
2021 |
|
|
2022 |
|
|
2021 |
|
||||
|
PARTNERS’ CAPITAL |
|
|
|
|
|
|
|
|
|
|
|
|
||||
|
PREFERENCE UNITS |
|
|
|
|
|
|
|
|
|
|
|
|
||||
|
Balance, beginning of period |
|
$ |
|
|
|
$ |
|
|
|
$ |
|
|
|
$ |
|
|
|
Balance, end of period |
|
$ |
|
|
|
$ |
|
|
|
$ |
|
|
|
$ |
|
|
|
GENERAL PARTNER |
|
|
|
|
|
|
|
|
|
|
|
|
||||
|
Balance, beginning of period |
|
$ |
|
|
|
$ |
|
|
|
$ |
|
|
|
$ |
|
|
|
OP Unit Issuance: |
|
|
|
|
|
|
|
|
|
|
|
|
||||
|
Conversion of OP Units held by Limited Partners into OP Units
|
|
|
|
|
|
|
|
|
|
|
|
|
|
|
|
|
|
Exercise of EQR share options |
|
|
|
|
|
|
|
|
|
|
|
|
|
|
|
|
|
EQR’s Employee Share Purchase Plan (ESPP) |
|
|
|
|
|
|
|
|
|
|
|
|
|
|
|
|
|
Share-based employee compensation expense: |
|
|
|
|
|
|
|
|
|
|
|
|
||||
|
EQR restricted shares |
|
|
|
|
|
|
|
|
|
|
|
|
|
|
|
|
|
EQR share options |
|
|
|
|
|
|
|
|
|
|
|
|
|
|
|
|
|
EQR ESPP discount |
|
|
|
|
|
|
|
|
|
|
|
|
|
|
|
|
|
Net income available to Units – General Partner |
|
|
|
|
|
|
|
|
|
|
|
|
|
|
|
|
|
OP Units – General Partner distributions |
|
|
(
|
) |
|
|
(
|
) |
|
|
(
|
) |
|
|
(
|
) |
|
Offering costs |
|
|
(
|
) |
|
|
(
|
) |
|
|
(
|
) |
|
|
(
|
) |
|
Supplemental Executive Retirement Plan (SERP) |
|
|
(
|
) |
|
|
(
|
) |
|
|
— |
|
|
|
|
|
|
Acquisition of Noncontrolling Interests – Partially Owned Properties |
|
|
(
|
) |
|
|
— |
|
|
|
(
|
) |
|
|
— |
|
|
Change in market value of Redeemable Limited Partners |
|
|
|
|
|
|
(
|
) |
|
|
|
|
|
|
(
|
) |
|
Adjustment for Limited Partners ownership in Operating Partnership |
|
|
|
|
|
|
(
|
) |
|
|
|
|
|
|
|
|
|
Balance, end of period |
|
$ |
|
|
|
$ |
|
|
|
$ |
|
|
|
$ |
|
|
|
LIMITED PARTNERS |
|
|
|
|
|
|
|
|
|
|
|
|
||||
|
Balance, beginning of period |
|
$ |
|
|
|
$ |
|
|
|
$ |
|
|
|
$ |
|
|
|
Issuance of restricted units to Limited Partners |
|
|
|
|
|
|
— |
|
|
|
— |
|
|
|
— |
|
|
Conversion of OP Units held by Limited Partners into OP Units held
|
|
|
(
|
) |
|
|
(
|
) |
|
|
(
|
) |
|
|
(
|
) |
|
Equity compensation associated with Units – Limited Partners |
|
|
|
|
|
|
|
|
|
|
|
|
|
|
|
|
|
Net income available to Units – Limited Partners |
|
|
|
|
|
|
|
|
|
|
|
|
|
|
|
|
|
Units – Limited Partners distributions |
|
|
(
|
) |
|
|
(
|
) |
|
|
(
|
) |
|
|
(
|
) |
|
Change in carrying value of Redeemable Limited Partners |
|
|
|
|
|
|
(
|
) |
|
|
(
|
) |
|
|
(
|
) |
|
Adjustment for Limited Partners ownership in Operating Partnership |
|
|
(
|
) |
|
|
|
|
|
|
(
|
) |
|
|
(
|
) |
|
Balance, end of period |
|
$ |
|
|
|
$ |
|
|
|
$ |
|
|
|
$ |
|
|
|
ACCUMULATED OTHER COMPREHENSIVE INCOME (LOSS) |
|
|
|
|
|
|
|
|
|
|
|
|
||||
|
Balance, beginning of period |
|
$ |
(
|
) |
|
$ |
(
|
) |
|
$ |
(
|
) |
|
$ |
(
|
) |
|
Accumulated other comprehensive income (loss) – derivative
|
|
|
|
|
|
|
|
|
|
|
|
|
||||
|
Unrealized holding gains (losses) arising during the period |
|
|
|
|
|
|
— |
|
|
|
|
|
|
|
— |
|
|
Losses reclassified into earnings from other comprehensive
|
|
|
|
|
|
|
|
|
|
|
|
|
|
|
|
|
|
Balance, end of period |
|
$ |
(
|
) |
|
$ |
(
|
) |
|
$ |
(
|
) |
|
$ |
(
|
) |
|
|
|
|
|
|
|
|
|
|
|
|
|
|
||||
|
DISTRIBUTIONS |
|
|
|
|
|
|
|
|
|
|
|
|
||||
|
Distributions declared per Unit outstanding |
|
$ |
|
|
|
$ |
|
|
|
$ |
|
|
|
$ |
|
|
See accompanying notes
16
Table of Contents
ERP OPERATING LIMITED PARTNERSHIP
CONSOLIDATED STATEMENTS OF CHANGES IN CAPITAL (Continued)
(Amounts in thousands except per Unit data)
(Unaudited)
|
|
|
Nine Months Ended September 30, |
|
|
Quarter Ended September 30, |
|
||||||||||
|
|
|
2022 |
|
|
2021 |
|
|
2022 |
|
|
2021 |
|
||||
|
NONCONTROLLING INTERESTS |
|
|
|
|
|
|
|
|
|
|
|
|
||||
|
NONCONTROLLING INTERESTS – PARTIALLY OWNED
|
|
|
|
|
|
|
|
|
|
|
|
|
||||
|
Balance, beginning of period |
|
$ |
|
|
|
$ |
|
|
|
$ |
(
|
) |
|
$ |
|
|
|
Net income attributable to Noncontrolling Interests |
|
|
|
|
|
|
|
|
|
|
|
|
|
|
|
|
|
Contributions by Noncontrolling Interests |
|
|
|
|
|
|
— |
|
|
|
— |
|
|
|
— |
|
|
Distributions to Noncontrolling Interests |
|
|
(
|
) |
|
|
(
|
) |
|
|
(
|
) |
|
|
(
|
) |
|
Acquisition of Noncontrolling Interests – Partially Owned Properties |
|
|
(
|
) |
|
|
— |
|
|
|
|
|
|
|
— |
|
|
Balance, end of period |
|
$ |
(
|
) |
|
$ |
|
|
|
$ |
(
|
) |
|
$ |
|
|
See accompanying notes
17
Table of Contents
EQUITY RESIDENTIAL
ERP OPERATING LIMITED PARTNERSHIP
NOTES TO CONSOLIDATED FINANCIAL STATEMENTS
(Unaudited)
Equity Residential (“EQR”) is an S&P 500 company focused on the acquisition, development and management of residential properties located in and around dynamic cities that attract affluent long-term renters, a business that is conducted on its behalf by ERP Operating Limited Partnership (“ERPOP”). EQR is a Maryland real estate investment trust (“REIT”) formed in March 1993 and ERPOP is an Illinois limited partnership formed in May 1993. References to the “Company,” “we,” “us” or “our” mean collectively EQR, ERPOP and those entities/subsidiaries owned or controlled by EQR and/or ERPOP. References to the “Operating Partnership” mean collectively ERPOP and those entities/subsidiaries owned or controlled by ERPOP. Unless otherwise indicated, the notes to consolidated financial statements apply to both the Company and the Operating Partnership.
EQR is the general partner of, and as of September 30, 2022 owned an approximate
As of September 30, 2022, the Company, directly or indirectly through investments in title holding entities, owned all or a portion of
|
|
|
Properties |
|
|
Apartment Units |
|
||
|
Wholly Owned Properties |
|
|
|
|
|
|
|
|
|
Partially Owned Properties – Consolidated |
|
|
|
|
|
|
|
|
|
|
|
|
|
|
|
|
|
|
Basis of Presentation
The accompanying unaudited condensed consolidated financial statements have been prepared in accordance with accounting principles generally accepted in the United States for interim financial information and with the instructions to Form 10-Q and Article 10 of Regulation S-X. Accordingly, they do not include all of the information and footnotes required by accounting principles generally accepted in the United States (“GAAP”) for complete financial statements. In the opinion of management, all adjustments (consisting of normal recurring accruals) and certain reclassifications considered necessary for a fair presentation have been included. Operating results for the nine months ended September 30, 2022 are not necessarily indicative of the results that may be expected for the year ending December 31, 2022.
In preparation of the Company’s financial statements in conformity with accounting principles generally accepted in the United States, management makes estimates and assumptions that affect the reported amounts of assets and liabilities and disclosure of contingent assets and liabilities at the date of the financial statements as well as the reported amounts of revenues and expenses during the reporting period. Actual results could differ from these estimates.
The balance sheets at December 31, 2021 have been derived from the audited financial statements at that date but do not include all of the information and footnotes required by accounting principles generally accepted in the United States for complete financial statements.
For further information, including definitions of capitalized terms not defined herein, refer to the consolidated financial statements and footnotes thereto included in the Company’s and the Operating Partnership’s Annual Report on Form 10-K for the year ended December 31, 2021 .
18
Table of Contents
Income and Other Taxes
EQR has elected to be taxed as a REIT. This, along with the nature of the operations of its operating properties, resulted in
Recent Accounting Pronouncements
In August 2020, the Financial Accounting Standards Board (“FASB”) issued an amendment to the debt and equity financial instruments standards which simplifies the accounting for convertible instruments and accounting for contracts in an entity’s own equity. The Company adopted the standard when effective on January 1, 2022 and it had no impact on its consolidated results of operations and financial position.
In March 2020, the FASB issued an amendment to the reference rate reform standard which provides the option for a limited period of time to ease the potential burden in accounting for, or recognizing the effects of, reference rate reform on contract modifications and hedge accounting. The new standard was effective for the Company upon issuance and elections can be made through December 31, 2022, subject to a proposed extension to December 31, 2024. The Company elected to apply the hedge accounting expedients and application of these expedients preserves the presentation of derivatives consistent with past presentation. The Company continues to evaluate the impact of the guidance and may apply other elections as applicable as additional changes in the market occur.
The Company refers to “Common Shares” and “Units” (which refer to both OP Units and restricted units) as equity securities for EQR and “General Partner Units” and “Limited Partner Units” as equity securities for ERPOP. To provide a streamlined and more readable presentation of the disclosures for the Company and the Operating Partnership, several sections below refer to the respective terminology for each with the same financial information and separate sections are provided, where needed, to further distinguish any differences in financial information and terminology.
The following table presents the changes in the Company’s issued and outstanding Common Shares and Units for the nine months ended September 30, 2022 and 2021:
|
|
|
2022 |
|
|
2021 |
|
||
|
Common Shares |
|
|
|
|
|
|
||
|
Common Shares outstanding at January 1, |
|
|
|
|
|
|
|
|
|
Common Shares Issued: |
|
|
|
|
|
|
||
|
Conversion of OP Units |
|
|
|
|
|
|
|
|
|
Exercise of share options |
|
|
|
|
|
|
|
|
|
Employee Share Purchase Plan (ESPP) |
|
|
|
|
|
|
|
|
|
Restricted share grants, net |
|
|
|
|
|
|
|
|
|
Common Shares outstanding at September 30, |
|
|
|
|
|
|
|
|
|
Units |
|
|
|
|
|
|
||
|
Units outstanding at January 1, |
|
|
|
|
|
|
|
|
|
Restricted unit grants, net |
|
|
|
|
|
|
|
|
|
Conversion of OP Units to Common Shares |
|
|
(
|
) |
|
|
(
|
) |
|
Units outstanding at September 30, |
|
|
|
|
|
|
|
|
|
Total Common Shares and Units outstanding at September 30, |
|
|
|
|
|
|
|
|
|
Units Ownership Interest in Operating Partnership |
|
|
|
% |
|
|
|
% |
19
Table of Contents
The following table presents the changes in the Operating Partnership’s issued and outstanding General Partner Units and Limited Partner Units for the nine months ended September 30, 2022 and 2021:
|
|
|
2022 |
|
|
2021 |
|
||
|
General and Limited Partner Units |
|
|
|
|
|
|
||
|
General and Limited Partner Units outstanding at January 1, |
|
|
|
|
|
|
|
|
|
Issued to General Partner: |
|
|
|
|
|
|
||
|
Exercise of EQR share options |
|
|
|
|
|
|
|
|
|
EQR’s Employee Share Purchase Plan (ESPP) |
|
|
|
|
|
|
|
|
|
EQR’s restricted share grants, net |
|
|
|
|
|
|
|
|
|
Issued to Limited Partners: |
|
|
|
|
|
|
||
|
Restricted unit grants, net |
|
|
|
|
|
|
|
|
|
General and Limited Partner Units outstanding at September 30, |
|
|
|
|
|
|
|
|
|
Limited Partner Units |
|
|
|
|
|
|
||
|
Limited Partner Units outstanding at January 1, |
|
|
|
|
|
|
|
|
|
Limited Partner restricted unit grants, net |
|
|
|
|
|
|
|
|
|
Conversion of Limited Partner OP Units to EQR Common Shares |
|
|
(
|
) |
|
|
(
|
) |
|
Limited Partner Units outstanding at September 30, |
|
|
|
|
|
|
|
|
|
Limited Partner Units Ownership Interest in Operating Partnership |
|
|
|
% |
|
|
|
% |
The equity positions of various individuals and entities that contributed their properties to the Operating Partnership in exchange for OP Units, as well as the equity positions of the holders of restricted units, are collectively referred to as the “Noncontrolling Interests – Operating Partnership” and “Limited Partners Capital,” respectively, for the Company and the Operating Partnership. Subject to certain exceptions (including the “book-up” requirements of restricted units), the Noncontrolling Interests – Operating Partnership/Limited Partners Capital may exchange their Units with EQR for Common Shares on a one-for-one basis. The carrying value of the Noncontrolling Interests – Operating Partnership/Limited Partners Capital (including redeemable interests) is allocated based on the number of Noncontrolling Interests – Operating Partnership/Limited Partners Capital in total in proportion to the number of Noncontrolling Interests – Operating Partnership/Limited Partners Capital in total plus the total number of Common Shares/General Partner Units. Net income is allocated to the Noncontrolling Interests – Operating Partnership/Limited Partners Capital based on the weighted average ownership percentage during the period.
The Operating Partnership has the right but not the obligation to make a cash payment instead of issuing Common Shares to any and all holders of Noncontrolling Interests – Operating Partnership/Limited Partners Capital requesting an exchange of their Noncontrolling Interests – Operating Partnership/Limited Partners Capital with EQR. Once the Operating Partnership elects not to redeem the Noncontrolling Interests – Operating Partnership/Limited Partners Capital for cash, EQR is obligated to deliver Common Shares to the exchanging holder of the Noncontrolling Interests – Operating Partnership/Limited Partners Capital.
The Noncontrolling Interests – Operating Partnership/Limited Partners Capital are classified as either mezzanine equity or permanent equity. If EQR is required, either by contract or securities law, to deliver registered Common Shares, such Noncontrolling Interests – Operating Partnership/Limited Partners Capital are differentiated and referred to as “Redeemable Noncontrolling Interests – Operating Partnership” and “Redeemable Limited Partners,” respectively. Instruments that require settlement in registered shares cannot be classified in permanent equity as it is not always completely within an issuer’s control to deliver registered shares. Therefore, settlement in cash is assumed and that responsibility for settlement in cash is deemed to fall to the Operating Partnership as the primary source of cash for EQR, resulting in presentation in the mezzanine section of the balance sheet. The Redeemable Noncontrolling Interests – Operating Partnership/Redeemable Limited Partners are adjusted to the greater of carrying value or fair market value based on the Common Share price of EQR at the end of each respective reporting period. EQR has the ability to deliver unregistered Common Shares for the remaining portion of the Noncontrolling Interests – Operating Partnership/Limited Partners Capital that are classified in permanent equity at September 30, 2022 and December 31, 2021.
The carrying value of the Redeemable Noncontrolling Interests – Operating Partnership/Redeemable Limited Partners is allocated based on the number of Redeemable Noncontrolling Interests – Operating Partnership/Redeemable Limited Partners in proportion to the number of Noncontrolling Interests – Operating Partnership/Limited Partners Capital in total. Such percentage of the total carrying value of Units/Limited Partner Units which is ascribed to the Redeemable Noncontrolling Interests – Operating Partnership/Redeemable Limited Partners is then adjusted to the greater of carrying value or fair market value as described above. As of September 30, 2022 and 2021, the Redeemable Noncontrolling Interests – Operating Partnership/Redeemable Limited Partners have a redemption value of approximately $
20
Table of Contents
The following table presents the changes in the redemption value of the Redeemable Noncontrolling Interests – Operating Partnership/Redeemable Limited Partners for the nine months ended September 30, 2022 and 2021, respectively (amounts in thousands):
|
|
|
2022 |
|
|
2021 |
|
||
|
Balance at January 1, |
|
$ |
|
|
|
$ |
|
|
|
Change in market value |
|
|
(
|
) |
|
|
|
|
|
Change in carrying value |
|
|
(
|
) |
|
|
|
|
|
Balance at September 30, |
|
$ |
|
|
|
$ |
|
|
Net proceeds from EQR Common Share and Preferred Share (see definition below) offerings and proceeds from exercise of options for Common Shares are contributed by EQR to ERPOP. In return for those contributions, EQR receives a number of OP Units in ERPOP equal to the number of Common Shares it has issued in the equity offering (or in the case of a preferred equity offering, a number of preference units in ERPOP equal in number and having the same terms as the Preferred Shares issued in the equity offering). As a result, the net proceeds from Common Shares and Preferred Shares are allocated for the Company between shareholders’ equity and Noncontrolling Interests – Operating Partnership and for the Operating Partnership between General Partner’s Capital and Limited Partners Capital to account for the change in their respective percentage ownership of the underlying equity.
The Company’s declaration of trust authorizes it to issue up to
The following table presents the Company’s issued and outstanding Preferred Shares/Preference Units as of September 30, 2022 and December 31, 2021:
|
|
|
|
|
|
|
|
Amounts in thousands |
|
||||||
|
|
|
|
|
Annual |
|
|
|
|
|
|
|
|||
|
|
|
Call |
|
Dividend Per |
|
|
September 30, |
|
|
December 31, |
|
|||
|
|
|
Date (1) |
|
Share/Unit (2) |
|
|
2022 |
|
|
2021 |
|
|||
|
Preferred Shares/Preference Units of beneficial interest, $
|
|
|
|
|
|
|
|
|
|
|
|
|||
|
|
|
|
|
$ |
|
|
|
$ |
|
|
|
$ |
|
|
|
|
|
|
|
|
|
|
$ |
|
|
|
$ |
|
|
|
Other
EQR and ERPOP currently have an active universal shelf registration statement for the issuance of equity and debt securities that automatically became effective upon filing with the SEC in May 2022 and expires in May 2025. Per the terms of ERPOP’s partnership agreement, EQR contributes the net proceeds of all equity offerings to the capital of ERPOP in exchange for additional OP Units (on a one-for-one Common Share per OP Unit basis) or preference units (on a one-for-one preferred share per preference unit basis).
The Company has an At-The-Market (“ATM”) share offering program which allows EQR to issue Common Shares from time to time into the existing trading market at current market prices or through negotiated transactions, including under forward sale arrangements. In May 2022, the Company replaced the prior program with a new program with the authority to issue up to
21
Table of Contents
As of September 30, 2022, the Company had entered into forward sale agreements under the prior program for a total of approxim
ately
The following table summarizes the carrying amounts for the Company’s investment in real estate (at cost) as of September 30, 2022 and December 31, 2021 (amounts in thousands):
|
|
|
September 30, 2022 |
|
|
December 31, 2021 |
|
||
|
Land |
|
$ |
|
|
|
$ |
|
|
|
Depreciable property: |
|
|
|
|
|
|
||
|
Buildings and improvements |
|
|
|
|
|
|
|
|
|
Furniture, fixtures and equipment |
|
|
|
|
|
|
|
|
|
In-Place lease intangibles |
|
|
|
|
|
|
|
|
|
Projects under development: |
|
|
|
|
|
|
||
|
Land |
|
|
|
|
|
|
— |
|
|
Construction-in-progress |
|
|
|
|
|
|
|
|
|
Land held for development: |
|
|
|
|
|
|
||
|
Land |
|
|
|
|
|
|
|
|
|
Construction-in-progress |
|
|
|
|
|
|
|
|
|
Investment in real estate |
|
|
|
|
|
|
|
|
|
Accumulated depreciation |
|
|
(
|
) |
|
|
(
|
) |
|
Investment in real estate, net |
|
$ |
|
|
|
$ |
|
|
During the nine months ended September 30, 2022, the Company acquired the following from unaffiliated parties (purchase price in thousands):
|
|
|
Properties |
|
|
Apartment Units |
|
|
Purchase Price |
|
|||
|
Rental Properties – Consolidated (1) |
|
|
|
|
|
|
|
|
|
$ |
|
|
|
Total |
|
|
|
|
|
|
|
|
|
$ |
|
|
During the nine months ended September 30, 2022, the Company disposed of the following to unaffiliated parties (sales price in thousands):
|
|
|
Properties |
|
|
Apartment Units |
|
|
Sales Price |
|
|||
|
Rental Properties – Consolidated |
|
|
|
|
|
|
|
|
|
$ |
|
|
|
Total |
|
|
|
|
|
|
|
|
|
$ |
|
|
The Company recognized a net gain on sales of real estate properties of approximately $
The Company has not entered into any agreements to acquire rental properties or land parcels as of the date of filing.
The Company has entered into an agreement to dispose of the following (sales price and net book value in thousands):
|
|
|
Properties |
|
|
Apartment Units |
|
|
Sales Price |
|
|
Net Book Value at
|
|
||||
|
Land Parcels (one) |
|
|
— |
|
|
|
— |
|
|
$ |
|
|
|
$ |
|
|
|
Total |
|
|
— |
|
|
|
— |
|
|
$ |
|
|
|
$ |
|
|
22
Table of Contents
The closing of pending transactions is subject to certain conditions and restrictions; therefore, there can be no assurance that the transactions will be consummated or that the final terms will not differ in material respects from any agreements summarized above. See Note 14 for discussion of the properties acquired or disposed of, if any, subsequent to September 30, 2022 .
The Company has invested in various entities with unrelated third parties which are either consolidated or accounted for under the equity method of accounting (unconsolidated).
Consolidated Variable Interest Entities (“VIEs”)
In accordance with accounting standards for consolidation of VIEs, the Company consolidates ERPOP on EQR’s financial statements. As the sole general partner of ERPOP, EQR has exclusive control of ERPOP’s day-to-day management. The limited partners are not able to exercise substantive kick-out or participating rights. As a result, ERPOP qualifies as a VIE. EQR has a controlling financial interest in ERPOP and, thus, is ERPOP’s primary beneficiary. EQR has the power to direct the activities of ERPOP that most significantly impact ERPOP’s economic performance as well as the obligation to absorb losses or the right to receive benefits from ERPOP that could potentially be significant to ERPOP.
The Company has various equity interests in certain joint ventures that have been deemed to be VIEs, and the Company is the VIEs’ primary beneficiary. As a result, the joint ventures are required to be consolidated on the Company’s financial statements.
|
|
|
Operating Properties (1) |
|
|
Project Under Development (2) |
|
||||||||||
|
|
|
Properties |
|
|
Apartment Units |
|
|
Project |
|
|
Apartment Units |
|
||||
|
Consolidated Joint Ventures (VIE) |
|
|
|
|
|
|
|
|
|
|
|
|
|
|
|
|
The following table provides consolidated assets and liabilities related to the VIEs discussed above as of September 30, 2022 and December 31, 2021 (amounts in thousands):
|
|
|
September 30, 2022 |
|
|
December 31, 2021 |
|
||
|
Consolidated Assets |
|
$ |
|
|
|
$ |
|
|
|
Consolidated Liabilities |
|
$ |
|
|
|
$ |
|
|
Certain consolidated joint ventures in which we have investments obtained mortgage debt to finance a portion of their activities.
|
|
|
Recently Completed Operating Property (1) |
|
|
Project Under Development |
|
||
|
Number of joint ventures with debt financing |
|
|
|
|
|
|
|
|
|
Aggregate loan commitments |
|
$ |
|
|
|
$ |
|
|
|
Amounts borrowed under loan commitments (2) |
|
$ |
|
|
|
$ |
|
|
|
Maturity dates |
|
|
|
|
|
|
||
Investments in Unconsolidated Entities
The Company has various equity interests in certain joint ventures that are unconsolidated and accounted for using the equity method of accounting. Most of these have been deemed to be VIEs and the Company is not the VIEs' primary beneficiary. The remaining have been deemed not to be VIEs and the Company does not have a controlling voting interest.
23
Table of Contents
The following table and information summarizes the Company’s investments in unconsolidated entities as of September 30, 2022 and December 31, 2021 (amounts in thousands except for ownership percentage):
|
|
|
September 30, 2022 |
|
|
December 31, 2021 |
|
|
Ownership Percentage |
||
|
Investments in Unconsolidated Entities: |
|
|
|
|
|
|
|
|
||
|
Various Real Estate Holdings (VIE) |
|
$ |
|
|
|
$ |
|
|
|
Varies |
|
Projects Under Development and Land Held for Development (VIE) |
|
|
|
|
|
|
|
|
|
|
|
Real Estate Technology Funds/Companies (VIE) |
|
|
|
|
|
|
|
|
|
Varies |
|
Other |
|
|
(
|
) |
|
|
(
|
) |
|
Varies |
|
Investments in Unconsolidated Entities |
|
$ |
|
|
|
$ |
|
|
|
|
The following table summarizes the Company’s unconsolidated joint ventures that were deemed to be VIEs as of September 30, 2022:
|
|
|
Real Estate Holdings (1) |
|
|
Projects Under Development (2), (5) |
|
|
Land Held for Development (2), (3) |
|
|||||||||||
|
|
|
Entities |
|
|
Projects |
|
|
Apartment Units (4) |
|
|
Projects |
|
|
Apartment Units (4) |
|
|||||
|
Unconsolidated Joint Ventures (VIE) |
|
|
|
|
|
|
|
|
|
|
|
|
|
|
|
|
|
|
|
|
New Development Joint Ventures
The following table provides information on total unconsolidated development joint ventures entered into during the nine months ended September 30, 2022 (amounts in thousands except for number of unconsolidated joint ventures):
|
Number of unconsolidated joint ventures (1) |
|
|
|
|
|
Apartment units (2) |
|
|
|
|
|
Investments in unconsolidated entities – acquisitions |
|
$ |
|
|
24
Table of Contents
The following table presents the Company’s restricted deposits as of September 30, 2022 and December 31, 2021 (amounts in thousands):
|
|
|
September 30, 2022 |
|
|
December 31, 2021 |
|
||
|
Mortgage escrow deposits: |
|
|
|
|
|
|
||
|
Replacement reserves |
|
$ |
|
|
|
$ |
|
|
|
Mortgage principal reserves/sinking funds |
|
|
|
|
|
|
|
|
|
Mortgage escrow deposits |
|
|
|
|
|
|
|
|
|
Restricted cash: |
|
|
|
|
|
|
||
|
Tax-deferred (1031) exchange proceeds |
|
|
— |
|
|
|
|
|
|
Earnest money on pending acquisitions |
|
|
— |
|
|
|
|
|
|
Restricted deposits on real estate investments |
|
|
|
|
|
|
|
|
|
Resident security and utility deposits |
|
|
|
|
|
|
|
|
|
Other |
|
|
|
|
|
|
|
|
|
Restricted cash |
|
|
|
|
|
|
|
|
|
Restricted deposits |
|
$ |
|
|
|
$ |
|
|
Lessor Accounting
The Company is the lessor for its residential and non-residential leases and these leases are accounted for as operating leases under the lease standard.
The Company generates the majority of its lease revenue from residential apartment leases that are generally
The Company also generates lease revenue from non-residential leases that are generally for terms ranging between
to
The following table presents the lease income types relating to lease payments for residential and non-residential leases along with the total other rental income for the nine months ended September 30, 2022 and 2021 (amounts in thousands):
|
|
|
Nine Months Ended September 30, 2022 |
|
|
Nine Months Ended September 30, 2021 |
|
||||||||||||||||||
|
Income Type |
|
Residential
|
|
|
Non-Residential
|
|
|
Total |
|
|
Residential
|
|
|
Non-Residential
|
|
|
Total |
|
||||||
|
Residential and non-residential rent |
|
$ |
|
|
|
$ |
|
|
|
$ |
|
|
|
$ |
|
|
|
$ |
|
|
|
$ |
|
|
|
Utility recoveries (RUBS income) (1) |
|
|
|
|
|
|
|
|
|
|
|
|
|
|
|
|
|
|
|
|
|
|
|
|
|
Parking rent |
|
|
|
|
|
|
|
|
|
|
|
|
|
|
|
|
|
|
|
|
|
|
|
|
|
Other lease revenue (2) |
|
|
(
|
) |
|
|
(
|
) |
|
|
(
|
) |
|
|
(
|
) |
|
|
|
|
|
|
(
|
) |
|
Total lease revenue |
|
$ |
|
|
|
$ |
|
|
|
|
|
|
|
$ |
|
|
|
$ |
|
|
|
|
|
|
|
Parking revenue |
|
|
|
|
|
|
|
|
|
|
|
|
|
|
|
|
|
|
|
|
||||
|
Other revenue |
|
|
|
|
|
|
|
|
|
|
|
|
|
|
|
|
|
|
|
|
||||
|
Total other rental income (3) |
|
|
|
|
|
|
|
|
|
|
|
|
|
|
|
|
|
|
|
|
||||
|
Rental income |
|
|
|
|
|
|
|
$ |
|
|
|
|
|
|
|
|
|
$ |
|
|
||||
25
Table of Contents
The following table presents the lease income types relating to lease payments for residential and non-residential leases along with the total other rental income for the quarters ended September 30, 2022 and 2021 (amounts in thousands):
|
|
|
Quarter Ended September 30, 2022 |
|
|
Quarter Ended September 30, 2021 |
|
||||||||||||||||||
|
Income Type |
|
Residential
|
|
|
Non-Residential
|
|
|
Total |
|
|
Residential
|
|
|
Non-Residential
|
|
|
Total |
|
||||||
|
Residential and non-residential rent |
|
$ |
|
|
|
$ |
|
|
|
$ |
|
|
|
$ |
|
|
|
$ |
|
|
|
$ |
|
|
|
Utility recoveries (RUBS income) (1) |
|
|
|
|
|
|
|
|
|
|
|
|
|
|
|
|
|
|
|
|
|
|
|
|
|
Parking rent |
|
|
|
|
|
|
|
|
|
|
|
|
|
|
|
|
|
|
|
|
|
|
|
|
|
Other lease revenue (2) |
|
|
(
|
) |
|
|
(
|
) |
|
|
(
|
) |
|
|
(
|
) |
|
|
|
|
|
|
|
|
|
Total lease revenue |
|
$ |
|
|
|
$ |
|
|
|
|
|
|
|
$ |
|
|
|
$ |
|
|
|
|
|
|
|
Parking revenue |
|
|
|
|
|
|
|
|
|
|
|
|
|
|
|
|
|
|
|
|
||||
|
Other revenue |
|
|
|
|
|
|
|
|
|
|
|
|
|
|
|
|
|
|
|
|
||||
|
Total other rental income (3) |
|
|
|
|
|
|
|
|
|
|
|
|
|
|
|
|
|
|
|
|
||||
|
Rental income |
|
|
|
|
|
|
|
$ |
|
|
|
|
|
|
|
|
|
$ |
|
|
||||
The following table presents residential and non-residential accounts receivable and straight-line receivable balances for the Company’s properties as of September 30, 2022 and December 31, 2021 (amounts in thousands):
|
|
|
Residential |
|
|
Non-Residential |
|
||||||||||
|
Balance Sheet (Other assets): |
|
September 30, 2022 |
|
|
December 31, 2021 |
|
|
September 30, 2022 |
|
|
December 31, 2021 |
|
||||
|
Resident/tenant accounts receivable balances |
|
$ |
|
|
|
$ |
|
|
|
$ |
|
|
|
$ |
|
|
|
Allowance for doubtful accounts |
|
|
(
|
) |
|
|
(
|
) |
|
|
(
|
) |
|
|
(
|
) |
|
Net receivable balances |
|
$ |
|
|
(1) |
$ |
|
|
|
$ |
|
|
|
$ |
|
|
|
|
|
|
|
|
|
|
|
|
|
|
|
|
||||
|
Straight-line receivable balances |
|
$ |
|
|
|
$ |
|
|
|
$ |
|
|
|
$ |
|
|
The following table presents residential bad debt for the Company’s properties for the nine months and quarters ended September 30, 2022 and 2021 (amounts in thousands):
|
|
|
Nine Months Ended September 30, |
|
|
Quarter Ended September 30, |
|
||||||||||
|
Income Statement (Rental income): |
|
2022 |
|
|
2021 |
|
|
2022 |
|
|
2021 |
|
||||
|
Bad debt, net (1) |
|
$ |
|
|
|
$ |
|
|
|
$ |
|
|
|
$ |
|
|
|
% of rental income |
|
|
|
% |
|
|
|
% |
|
|
|
% |
|
|
|
% |
EQR does not have any indebtedness as all debt is incurred by the Operating Partnership. Weighted average interest rates noted below for the nine months ended September 30, 2022 include the effect of any derivative instruments and amortization of premiums/discounts/OCI (other comprehensive income) on debt and derivatives.
26
Table of Contents
Mortgage Notes Payable
The following table summarizes the Company’s mortgage notes payable activity for the nine months ended September 30, 2022 (amounts in thousands):
|
|
|
Mortgage notes
|
|
|
Proceeds |
|
|
Lump sum
|
|
|
Scheduled
|
|
|
Amortization
|
|
|
Amortization
|
|
|
Mortgage notes
|
|
|||||||
|
Fixed Rate Debt: |
|
|
|
|
|
|
|
|
|
|
|
|
|
|
|
|
|
|
|
|
|
|||||||
|
Secured – Conventional |
|
$ |
|
|
|
$ |
— |
|
|
$ |
(
|
) |
|
$ |
(
|
) |
|
$ |
|
|
|
$ |
|
|
|
$ |
|
|
|
Floating Rate Debt: |
|
|
|
|
|
|
|
|
|
|
|
|
|
|
|
|
|
|
|
|
|
|||||||
|
Secured – Conventional |
|
|
|
|
|
|
|
|
(2) |
|
— |
|
|
|
(
|
) |
|
|
— |
|
|
|
|
|
|
|
|
|
|
Secured – Tax Exempt |
|
|
|
|
|
|
— |
|
|
|
— |
|
|
|
— |
|
|
|
|
|
|
|
|
|
|
|
|
|
|
Floating Rate Debt |
|
|
|
|
|
|
|
|
|
|
— |
|
|
|
(
|
) |
|
|
|
|
|
|
|
|
|
|
|
|
|
Total |
|
$ |
|
|
|
$ |
|
|
|
$ |
(
|
) |
|
$ |
(
|
) |
|
$ |
|
|
|
$ |
|
|
|
$ |
|
|
The following table summarizes certain interest rate and maturity date information as of and for the nine months ended September 30, 2022:
|
|
|
September 30, 2022 |
|
Interest Rate Ranges |
|
|
|
Weighted Average Interest Rate |
|
|
|
Maturity Date Ranges |
|
|
As of September 30, 2022, the Company had
$
Notes
The following table summarizes the Company’s notes activity for the nine months ended September 30, 2022 (amounts in thousands):
|
|
|
Notes, net as of
|
|
|
Proceeds |
|
|
Lump sum
|
|
|
Amortization
|
|
|
Amortization
|
|
|
Notes, net as of
|
|
||||||
|
Fixed Rate Debt: |
|
|
|
|
|
|
|
|
|
|
|
|
|
|
|
|
|
|
||||||
|
Unsecured – Public |
|
$ |
|
|
|
$ |
— |
|
|
$ |
(
|
) |
|
$ |
|
|
|
$ |
|
|
|
$ |
|
|
T
|
|
|
September 30, 2022 |
|
Interest Rate Ranges |
|
|
|
Weighted Average Interest Rate |
|
|
|
Maturity Date Ranges |
|
|
The Company’s unsecured public notes contain certain financial and operating covenants including, among other things, maintenance of certain financial ratios. The Company was in compliance with its unsecured public debt covenants for the nine months ended September 30, 2022.
27
Table of Contents
Line of Credit and Commercial Paper
The Company has a $
The Company has an unsecured commercial paper note program under which it may borrow up to a maximum of $
The Company limits its utilization of the revolving credit facility in order to maintain liquidity to support its $
|
|
|
September 30, 2022 |
|
|
|
Unsecured revolving credit facility commitment |
|
$ |
|
|
|
Commercial paper balance outstanding |
|
|
(
|
) |
|
Unsecured revolving credit facility balance outstanding |
|
|
— |
|
|
Other restricted amounts |
|
|
(
|
) |
|
Unsecured revolving credit facility availability |
|
$ |
|
|
Other
The following table summarizes the Company’s total debt extinguishment costs recorded as additional interest expense for the nine months and quarters ended September 30, 2022 and 2021 (amounts in thousands):
|
|
|
Nine Months Ended September 30, |
|
|
Quarter Ended September 30, |
|
||||||||||
|
|
|
2022 |
|
|
2021 |
|
|
2022 |
|
|
2021 |
|
||||
|
Write-offs of unamortized deferred financing costs |
|
$ |
|
|
|
$ |
|
|
|
$ |
|
|
|
$ |
— |
|
|
Write-offs of unamortized (premiums)/discounts/OCI |
|
|
|
|
|
|
— |
|
|
|
|
|
|
|
— |
|
|
Total |
|
$ |
|
|
|
$ |
|
|
|
$ |
|
|
|
$ |
— |
|
The valuation of financial instruments requires the Company to make estimates and judgments that affect the fair value of the instruments. The Company, where possible, bases the fair values of its financial instruments on listed market prices and third-party quotes. Where these are not available, the Company bases its estimates on current instruments with similar terms and maturities or on other factors relevant to the financial instruments.
In the normal course of business, the Company is exposed to the effect of interest rate changes. The Company may seek to manage these risks by following established risk management policies and procedures including the use of derivatives to hedge interest rate risk on debt instruments. The Company may also use derivatives to manage commodity prices in the daily operations of the business.
28
Table of Contents
A three-level valuation hierarchy exists for disclosure of fair value measurements. The valuation hierarchy is based upon the transparency of inputs to the valuation of an asset or liability as of the measurement date. A financial instrument’s categorization within the valuation hierarchy is based upon the lowest level of input that is significant to the fair value measurement. The three levels are defined as follows:
The Company’s derivative positions are valued using models developed by the respective counterparty as well as models applied internally by the Company that use as their inputs readily observable market parameters (such as forward yield curves and credit default swap data).
|
Fair Value Measurement Type |
|
Valuation Inputs |
|
|
|
|
|
|
|
|
|
|
|
|
|
|
|
|
The fair values of the Company’s financial instruments (other than mortgage notes payable, unsecured notes, commercial paper, line of credit and derivative instruments), including cash and cash equivalents and other financial instruments, approximate their carrying or contract value.
|
|
|
September 30, 2022 |
|
|
December 31, 2021 |
|
||||||||||
|
|
|
Carrying Value |
|
|
Estimated Fair
|
|
|
Carrying Value |
|
|
Estimated Fair
|
|
||||
|
Mortgage notes payable, net |
|
$ |
|
|
|
$ |
|
|
|
$ |
|
|
|
$ |
|
|
|
Unsecured debt, net |
|
|
|
|
|
|
|
|
|
|
|
|
|
|
|
|
|
Total debt, net |
|
$ |
|
|
|
$ |
|
|
|
$ |
|
|
|
$ |
|
|
The following table summarizes the Company’s consolidated derivative instruments at September 30, 2022 (dollar amounts are in thousands):
|
|
|
Forward Starting
|
|
|
|
Current Notional Balance |
|
$ |
|
|
|
Lowest Interest Rate |
|
|
|
% |
|
Highest Interest Rate |
|
|
|
% |
|
Maturity Date |
|
|
|
|
29
Table of Contents
The following tables provide a summary of the fair value measurements for each major category of assets and liabilities measured at fair value on a recurring basis and the location within the accompanying consolidated balance sheets at September 30, 2022 and December 31, 2021, respectively (amounts in thousands):
|
|
|
|
|
|
|
|
Fair Value Measurements at Reporting Date Using |
|
||||||||||
|
Description |
|
Balance Sheet
|
|
9/30/2022 |
|
|
Quoted Prices in
|
|
|
Significant Other
|
|
|
Significant
|
|
||||
|
Assets |
|
|
|
|
|
|
|
|
|
|
|
|
|
|
||||
|
Derivatives designated as hedging instruments: |
|
|
|
|
|
|
|
|
|
|
|
|
|
|
||||
|
Interest Rate Contracts: |
|
|
|
|
|
|
|
|
|
|
|
|
|
|
||||
|
Forward Starting Swaps |
|
Other Assets |
|
$ |
|
|
|
$ |
|
|
|
$ |
|
|
|
$ |
|
|
|
Supplemental Executive Retirement Plan |
|
Other Assets |
|
|
|
|
|
|
|
|
|
|
|
|
|
|
|
|
|
Total |
|
|
|
$ |
|
|
|
$ |
|
|
|
$ |
|
|
|
$ |
|
|
|
|
|
|
|
|
|
|
|
|
|
|
|
|
|
|
||||
|
Liabilities |
|
|
|
|
|
|
|
|
|
|
|
|
|
|
||||
|
Supplemental Executive Retirement Plan |
|
Other Liabilities |
|
$ |
|
|
|
$ |
|
|
|
$ |
|
|
|
$ |
|
|
|
|
|
|
|
|
|
|
|
|
|
|
|
|
|
|
||||
|
Redeemable Noncontrolling Interests – |
|
|
|
|
|
|
|
|
|
|
|
|
|
|
||||
|
Operating Partnership/Redeemable |
|
|
|
|
|
|
|
|
|
|
|
|
|
|
||||
|
Limited Partners |
|
Mezzanine |
|
$ |
|
|
|
$ |
|
|
|
$ |
|
|
|
$ |
|
|
|
|
|
|
|
|
|
|
Fair Value Measurements at Reporting Date Using |
|
||||||||||
|
Description |
|
Balance Sheet
|
|
12/31/2021 |
|
|
Quoted Prices in
|
|
|
Significant Other
|
|
|
Significant
|
|
||||
|
Assets |
|
|
|
|
|
|
|
|
|
|
|
|
|
|
||||
|
Supplemental Executive Retirement Plan |
|
Other Assets |
|
$ |
|
|
|
$ |
|
|
|
$ |
|
|
|
$ |
|
|
|
|
|
|
|
|
|
|
|
|
|
|
|
|
|
|
||||
|
Liabilities |
|
|
|
|
|
|
|
|
|
|
|
|
|
|
||||
|
Supplemental Executive Retirement Plan |
|
Other Liabilities |
|
$ |
|
|
|
$ |
|
|
|
$ |
|
|
|
$ |
|
|
|
|
|
|
|
|
|
|
|
|
|
|
|
|
|
|
||||
|
Redeemable Noncontrolling Interests – |
|
|
|
|
|
|
|
|
|
|
|
|
|
|
||||
|
Operating Partnership/Redeemable |
|
|
|
|
|
|
|
|
|
|
|
|
|
|
||||
|
Limited Partners |
|
Mezzanine |
|
$ |
|
|
|
$ |
|
|
|
$ |
|
|
|
$ |
|
|
The following tables provide a summary of the effect of cash flow hedges on the Company’s accompanying consolidated statements of operations and comprehensive income for the nine months ended September 30, 2022 and 2021, respectively (amounts in thousands):
|
September 30, 2022
|
|
Amount of
|
|
|
Location of
|
|
Amount of
|
|
||
|
Derivatives designated as hedging instruments: |
|
|
|
|
|
|
|
|
||
|
Interest Rate Contracts: |
|
|
|
|
|
|
|
|
||
|
Forward Starting Swaps |
|
$ |
|
|
|
Interest expense |
|
$ |
(
|
) |
|
Total |
|
$ |
|
|
|
|
|
$ |
(
|
) |
|
September 30, 2021
|
|
Amount of
|
|
|
Location of
|
|
Amount of
|
|
||
|
Derivatives designated as hedging instruments: |
|
|
|
|
|
|
|
|
||
|
Interest Rate Contracts: |
|
|
|
|
|
|
|
|
||
|
Forward Starting Swaps |
|
$ |
|
|
|
Interest expense |
|
$ |
(
|
) |
|
Total |
|
$ |
|
|
|
|
|
$ |
(
|
) |
30
Table of Contents
As of September 30, 2022 and December 31, 2021
, there were approximately $
Equity Residential
The following tables set forth the computation of net income per share – basic and net income per share – diluted for the Company (amounts in thousands except per share amounts):
|
|
|
Nine Months Ended September 30, |
|
|
Quarter Ended September 30, |
|
||||||||||
|
|
|
2022 |
|
|
2021 |
|
|
2022 |
|
|
2021 |
|
||||
|
Numerator for net income per share – basic: |
|
|
|
|
|
|
|
|
|
|
|
|
||||
|
Net income |
|
$ |
|
|
|
$ |
|
|
|
$ |
|
|
|
$ |
|
|
|
Allocation to Noncontrolling Interests – Operating Partnership |
|
|
(
|
) |
|
|
(
|
) |
|
|
(
|
) |
|
|
(
|
) |
|
Net (income) loss attributable to Noncontrolling
|
|
|
(
|
) |
|
|
(
|
) |
|
|
(
|
) |
|
|
(
|
) |
|
Preferred distributions |
|
|
(
|
) |
|
|
(
|
) |
|
|
(
|
) |
|
|
(
|
) |
|
Numerator for net income per share – basic |
|
$ |
|
|
|
$ |
|
|
|
$ |
|
|
|
$ |
|
|
|
Numerator for net income per share – diluted: |
|
|
|
|
|
|
|
|
|
|
|
|
||||
|
Net income |
|
$ |
|
|
|
$ |
|
|
|
$ |
|
|
|
$ |
|
|
|
Net (income) loss attributable to Noncontrolling
|
|
|
(
|
) |
|
|
(
|
) |
|
|
(
|
) |
|
|
(
|
) |
|
Preferred distributions |
|
|
(
|
) |
|
|
(
|
) |
|
|
(
|
) |
|
|
(
|
) |
|
Numerator for net income per share – diluted |
|
$ |
|
|
|
$ |
|
|
|
$ |
|
|
|
$ |
|
|
|
Denominator for net income per share – basic and diluted: |
|
|
|
|
|
|
|
|
|
|
|
|
||||
|
Denominator for net income per share – basic |
|
|
|
|
|
|
|
|
|
|
|
|
|
|
|
|
|
Effect of dilutive securities: |
|
|
|
|
|
|
|
|
|
|
|
|
||||
|
OP Units |
|
|
|
|
|
|
|
|
|
|
|
|
|
|
|
|
|
Long-term compensation shares/units |
|
|
|
|
|
|
|
|
|
|
|
|
|
|
|
|
|
ATM forward sales |
|
|
|
|
|
|
— |
|
|
|
— |
|
|
|
— |
|
|
Denominator for net income per share – diluted |
|
|
|
|
|
|
|
|
|
|
|
|
|
|
|
|
|
Net income per share – basic |
|
$ |
|
|
|
$ |
|
|
|
$ |
|
|
|
$ |
|
|
|
Net income per share – diluted |
|
$ |
|
|
|
$ |
|
|
|
$ |
|
|
|
$ |
|
|
ERP Operating Limited Partnership
The following tables set forth the computation of net income per Unit – basic and net income per Unit – diluted for the Operating Partnership (amounts in thousands except per Unit amounts):
|
|
|
Nine Months Ended September 30, |
|
|
Quarter Ended September 30, |
|
||||||||||
|
|
|
2022 |
|
|
2021 |
|
|
2022 |
|
|
2021 |
|
||||
|
Numerator for net income per Unit – basic and diluted: |
|
|
|
|
|
|
|
|
|
|
|
|
||||
|
Net income |
|
$ |
|
|
|
$ |
|
|
|
$ |
|
|
|
$ |
|
|
|
Net (income) loss attributable to Noncontrolling
|
|
|
(
|
) |
|
|
(
|
) |
|
|
(
|
) |
|
|
(
|
) |
|
Allocation to Preference Units |
|
|
(
|
) |
|
|
(
|
) |
|
|
(
|
) |
|
|
(
|
) |
|
Numerator for net income per Unit – basic and diluted |
|
$ |
|
|
|
$ |
|
|
|
$ |
|
|
|
$ |
|
|
|
Denominator for net income per Unit – basic and diluted: |
|
|
|
|
|
|
|
|
|
|
|
|
||||
|
Denominator for net income per Unit – basic |
|
|
|
|
|
|
|
|
|
|
|
|
|
|
|
|
|
Effect of dilutive securities: |
|
|
|
|
|
|
|
|
|
|
|
|
||||
|
Dilution for Units issuable upon assumed exercise/vesting
|
|
|
|
|
|
|
|
|
|
|
|
|
|
|
|
|
|
ATM forward sales |
|
|
|
|
|
|
|
|
|
|
— |
|
|
|
|
|
|
Denominator for net income per Unit – diluted |
|
|
|
|
|
|
|
|
|
|
|
|
|
|
|
|
|
Net income per Unit – basic |
|
$ |
|
|
|
$ |
|
|
|
$ |
|
|
|
$ |
|
|
|
Net income per Unit – diluted |
|
$ |
|
|
|
$ |
|
|
|
$ |
|
|
|
$ |
|
|
31
Table of Contents
Commitments
Real Estate Development Commitments
As of September 30, 2022
, the Company has both consolidated and unconsolidated real estate projects under development.
|
|
|
Projects |
|
|
Apartment Units |
|
|
Total Project Costs Remaining (1) |
|
|||
|
Projects Under Development |
|
|
|
|
|
|
|
|
|
|||
|
Consolidated |
|
|
|
|
|
|
|
|
|
$ |
|
|
|
Unconsolidated |
|
|
|
|
|
|
|
|
|
|
|
|
|
Total Projects Under Development |
|
|
|
|
|
|
|
|
|
$ |
|
|
We have entered into, and may continue in the future to enter into, joint venture agreements with third-party partners for the development of multifamily rental properties. The joint venture agreements with each development partner include buy-sell provisions that provide the right, but not the obligation, for the Company to acquire each respective partner’s interests or sell its interests at any time following the occurrence of certain pre-defined events described in the joint venture agreements. See Note 6 for additional discussion.
Other Commitments
We have entered into, and may continue in the future to enter into, real estate technology and other real estate fund investments. At September 30, 2022
, the Company has invested in
Contingencies
Litigation and Legal Matters
The Company, as an owner of real estate, is subject to various federal, state and local laws. Compliance by the Company with existing laws has not had a material adverse effect on the Company. However, the Company cannot predict the impact of new or changed laws or regulations on its current properties or on properties that it may acquire in the future.
The Company does not believe there is any litigation pending or threatened against it that, individually or in the aggregate, may reasonably be expected to have a material adverse effect on the Company.
Operating segments are defined as components of an enterprise that engage in business activities from which they may earn revenues and incur expenses and about which discrete financial information is available that is evaluated regularly by the chief operating decision maker. The chief operating decision maker decides how resources are allocated and assesses performance on a recurring basis at least quarterly.
The Company’s primary business is the acquisition, development and management of multifamily residential properties, which includes the generation of rental and other related income through the leasing of apartment units to residents. The chief operating decision maker evaluates the Company’s operating performance geographically by market and both on a same store and non-same store basis. While the Company does maintain a non-residential presence, it accounts for approximately
The Company’s development activities are other business activities that do not constitute an operating segment and as such, have been aggregated in the “Other” category in the tables presented below.
32
Table of Contents
All revenues are from external customers and there is
The primary financial measure for the Company’s rental real estate segment is net operating income (“NOI”), which represents rental income less: 1) property and maintenance expense and 2) real estate taxes and insurance expense (all as reflected in the accompanying consolidated statements of operations and comprehensive income). The Company believes that NOI is helpful to investors as a supplemental measure of its operating performance because it is a direct measure of the actual operating results of the Company’s apartment properties. Revenues for all leases are reflected on a straight-line basis in accordance with GAAP for the current and comparable periods.
The following table presents a reconciliation of NOI from our rental real estate for the nine months and quarters ended September 30, 2022 and 2021, respectively (amounts in thousands):
|
|
|
Nine Months Ended September 30, |
|
|
Quarter Ended September 30, |
|
||||||||||
|
|
|
2022 |
|
|
2021 |
|
|
2022 |
|
|
2021 |
|
||||
|
Rental income |
|
$ |
|
|
|
$ |
|
|
|
$ |
|
|
|
$ |
|
|
|
Property and maintenance expense |
|
|
(
|
) |
|
|
(
|
) |
|
|
(
|
) |
|
|
(
|
) |
|
Real estate taxes and insurance expense |
|
|
(
|
) |
|
|
(
|
) |
|
|
(
|
) |
|
|
(
|
) |
|
Total operating expenses |
|
|
(
|
) |
|
|
(
|
) |
|
|
(
|
) |
|
|
(
|
) |
|
Net operating income |
|
$ |
|
|
|
$ |
|
|
|
$ |
|
|
|
$ |
|
|
The following tables present NOI from our rental real estate for each segment for the nine months and quarters ended September 30, 2022 and 2021, respectively, as well as total assets and capital expenditures at September 30, 2022 (amounts in thousands):
|
|
|
Nine Months Ended September 30, 2022 |
|
|
Nine Months Ended September 30, 2021 |
|
||||||||||||||||||
|
|
|
Rental
|
|
|
Operating
|
|
|
NOI |
|
|
Rental
|
|
|
Operating
|
|
|
NOI |
|
||||||
|
Same store (1) |
|
|
|
|
|
|
|
|
|
|
|
|
|
|
|
|
|
|
||||||
|
Los Angeles |
|
$ |
|
|
|
$ |
|
|
|
$ |
|
|
|
$ |
|
|
|
$ |
|
|
|
$ |
|
|
|
Orange County |
|
|
|
|
|
|
|
|
|
|
|
|
|
|
|
|
|
|
|
|
|
|
|
|
|
San Diego |
|
|
|
|
|
|
|
|
|
|
|
|
|
|
|
|
|
|
|
|
|
|
|
|
|
Subtotal - Southern California |
|
|
|
|
|
|
|
|
|
|
|
|
|
|
|
|
|
|
|
|
|
|
|
|
|
|
|
|
|
|
|
|
|
|
|
|
|
|
|
|
|
|
|
|
||||||
|
San Francisco |
|
|
|
|
|
|
|
|
|
|
|
|
|
|
|
|
|
|
|
|
|
|
|
|
|
Washington, D.C. |
|
|
|
|
|
|
|
|
|
|
|
|
|
|
|
|
|
|
|
|
|
|
|
|
|
New York |
|
|
|
|
|
|
|
|
|
|
|
|
|
|
|
|
|
|
|
|
|
|
|
|
|
Seattle |
|
|
|
|
|
|
|
|
|
|
|
|
|
|
|
|
|
|
|
|
|
|
|
|
|
Boston |
|
|
|
|
|
|
|
|
|
|
|
|
|
|
|
|
|
|
|
|
|
|
|
|
|
Denver |
|
|
|
|
|
|
|
|
|
|
|
|
|
|
|
|
|
|
|
|
|
|
|
|
|
Total same store |
|
|
|
|
|
|
|
|
|
|
|
|
|
|
|
|
|
|
|
|
|
|
|
|
|
|
|
|
|
|
|
|
|
|
|
|
|
|
|
|
|
|
|
|
||||||
|
Non-same store/other |
|
|
|
|
|
|
|
|
|
|
|
|
|
|
|
|
|
|
||||||
|
Non-same store (2) |
|
|
|
|
|
|
|
|
|
|
|
|
|
|
|
|
|
|
|
|
|
|
|
|
|
Other (3) |
|
|
|
|
|
|
|
|
|
|
|
|
|
|
|
|
|
|
|
|
|
|
|
|
|
Total non-same store/other |
|
|
|
|
|
|
|
|
|
|
|
|
|
|
|
|
|
|
|
|
|
|
|
|
|
|
|
|
|
|
|
|
|
|
|
|
|
|
|
|
|
|
|
|
||||||
|
Totals |
|
$ |
|
|
|
$ |
|
|
|
$ |
|
|
|
$ |
|
|
|
$ |
|
|
|
$ |
|
|
33
Table of Contents
|
|
|
Quarter Ended September 30, 2022 |
|
|
Quarter Ended September 30, 2021 |
|
||||||||||||||||||
|
|
|
Rental
|
|
|
Operating
|
|
|
NOI |
|
|
Rental
|
|
|
Operating
|
|
|
NOI |
|
||||||
|
Same store (1) |
|
|
|
|
|
|
|
|
|
|
|
|
|
|
|
|
|
|
||||||
|
Los Angeles |
|
$ |
|
|
|
$ |
|
|
|
$ |
|
|
|
$ |
|
|
|
$ |
|
|
|
$ |
|
|
|
Orange County |
|
|
|
|
|
|
|
|
|
|
|
|
|
|
|
|
|
|
|
|
|
|
|
|
|
San Diego |
|
|
|
|
|
|
|
|
|
|
|
|
|
|
|
|
|
|
|
|
|
|
|
|
|
Subtotal - Southern California |
|
|
|
|
|
|
|
|
|
|
|
|
|
|
|
|
|
|
|
|
|
|
|
|
|
|
|
|
|
|
|
|
|
|
|
|
|
|
|
|
|
|
|
|
||||||
|
San Francisco |
|
|
|
|
|
|
|
|
|
|
|
|
|
|
|
|
|
|
|
|
|
|
|
|
|
Washington, D.C. |
|
|
|
|
|
|
|
|
|
|
|
|
|
|
|
|
|
|
|
|
|
|
|
|
|
New York |
|
|
|
|
|
|
|
|
|
|
|
|
|
|
|
|
|
|
|
|
|
|
|
|
|
Seattle |
|
|
|
|
|
|
|
|
|
|
|
|
|
|
|
|
|
|
|
|
|
|
|
|
|
Boston |
|
|
|
|
|
|
|
|
|
|
|
|
|
|
|
|
|
|
|
|
|
|
|
|
|
Denver |
|
|
|
|
|
|
|
|
|
|
|
|
|
|
|
|
|
|
|
|
|
|
|
|
|
All Other Markets |
|
|
|
|
|
|
|
|
|
|
|
|
|
|
|
|
|
|
|
|
|
|
|
|
|
Total same store |
|
|
|
|
|
|
|
|
|
|
|
|
|
|
|
|
|
|
|
|
|
|
|
|
|
|
|
|
|
|
|
|
|
|
|
|
|
|
|
|
|
|
|
|
||||||
|
Non-same store/other |
|
|
|
|
|
|
|
|
|
|
|
|
|
|
|
|
|
|
||||||
|
Non-same store (2) |
|
|
|
|
|
|
|
|
|
|
|
|
|
|
|
|
|
|
|
|
|
|
|
|
|
Other (3) |
|
|
|
|
|
|
|
|
|
|
(
|
) |
|
|
|
|
|
|
|
|
|
|
|
|
|
Total non-same store/other |
|
|
|
|
|
|
|
|
|
|
|
|
|
|
|
|
|
|
|
|
|
|
|
|
|
|
|
|
|
|
|
|
|
|
|
|
|
|
|
|
|
|
|
|
||||||
|
Totals |
|
$ |
|
|
|
$ |
|
|
|
$ |
|
|
|
$ |
|
|
|
$ |
|
|
|
$ |
|
|
|
|
|
Nine Months Ended September 30, 2022 |
|
|||||
|
|
|
Total Assets |
|
|
Capital Expenditures |
|
||
|
Same store (1) |
|
|
|
|
|
|
||
|
Los Angeles |
|
$ |
|
|
|
$ |
|
|
|
Orange County |
|
|
|
|
|
|
|
|
|
San Diego |
|
|
|
|
|
|
|
|
|
Subtotal - Southern California |
|
|
|
|
|
|
|
|
|
|
|
|
|
|
|
|
||
|
San Francisco |
|
|
|
|
|
|
|
|
|
Washington, D.C. |
|
|
|
|
|
|
|
|
|
New York |
|
|
|
|
|
|
|
|
|
Seattle |
|
|
|
|
|
|
|
|
|
Boston |
|
|
|
|
|
|
|
|
|
Denver |
|
|
|
|
|
|
|
|
|
Total same store |
|
|
|
|
|
|
|
|
|
|
|
|
|
|
|
|
||
|
Non-same store/other |
|
|
|
|
|
|
||
|
Non-same store (2) |
|
|
|
|
|
|
|
|
|
Other (3) |
|
|
|
|
|
|
|
|
|
Total non-same store/other |
|
|
|
|
|
|
|
|
|
|
|
|
|
|
|
|
||
|
Totals |
|
$ |
|
|
|
$ |
|
|
34
Table of Contents
Subsequent to September 30, 2022, the Company:
Item 2. Management’s Discussion and Analysis of Financial Condition and Results of Operations
For further information including definitions for capitalized terms not defined herein, refer to the consolidated financial statements and footnotes thereto included in the Company’s and the Operating Partnership’s Annual Report on Form 10-K for the year ended December 31, 2021. In addition, please refer to the Definitions section below for various capitalized terms not immediately defined in this Item 2, Management’s Discussion and Analysis of Financial Condition and Results of Operations .
Forward-Looking Statements
Forward-looking statements are intended to be made pursuant to the safe harbor provisions of the Private Securities Litigation Reform Act of 1995. These statements are based on current expectations, estimates, projections and assumptions made by management. While the Company’s management believes the assumptions underlying its forward-looking statements are reasonable, such information is inherently subject to uncertainties and may involve certain risks, which could cause actual results, performance or achievements of the Company to differ materially from anticipated future results, performance or achievements expressed or implied by such forward-looking statements. Many of these uncertainties and risks are difficult to predict and beyond management’s control, such as the current novel coronavirus (“COVID-19”) pandemic. Additional factors that might cause such differences are discussed in Part I of the Company’s and the Operating Partnership’s Annual Report on Form 10-K for the year ended December 31, 2021, particularly those under Item 1A, Risk Factors. Forward-looking statements and related uncertainties are also included in the Notes to Consolidated Financial Statements in this report . Forward-looking statements are not guarantees of future performance, results or events. The forward-looking statements contained herein are made as of the date hereof and the Company undertakes no obligation to update or supplement these forward-looking statements.
Overview
Equity Residential (“EQR”) is committed to creating communities where people thrive. The Company, a member of the S&P 500, is focused on the acquisition, development and management of residential properties located in and around dynamic cities that attract affluent long-term renters. ERP Operating Limited Partnership (“ERPOP”) is focused on conducting the multifamily property business of EQR. EQR is a Maryland real estate investment trust (“REIT”) formed in March 1993 and ERPOP is an Illinois limited partnership formed in May 1993. References to the “Company,” “we,” “us” or “our” mean collectively EQR, ERPOP and those entities/subsidiaries owned or controlled by EQR and/or ERPOP. References to the “Operating Partnership” mean collectively ERPOP and those entities/subsidiaries owned or controlled by ERPOP.
EQR is the general partner of, and as of September 30, 2022 owned an approximate 96.7% ownership interest in, ERPOP. All of the Company’s property ownership, development and related business operations are conducted through the Operating Partnership and EQR has no material assets or liabilities other than its investment in ERPOP. EQR issues equity from time to time, the net proceeds of which it is obligated to contribute to ERPOP, but does not have any indebtedness as all debt is incurred by the Operating Partnership. The Operating Partnership holds substantially all of the assets of the Company, including the Company’s ownership interests in its joint ventures. The Operating Partnership conducts the operations of the business and is structured as a partnership with no publicly traded equity.
The Company’s corporate headquarters is located in Chicago, Illinois and the Company also operates regional property management offices in most of its markets.
35
Table of Contents
Available Information
You may access our Annual Report on Form 10-K, our Quarterly Reports on Form 10-Q, our Current Reports on Form 8-K, our proxy statements and any amendments to any of those reports/statements we file with or furnish to the Securities and Exchange Commission (“SEC”) free of charge on our website, www.equityapartments.com. These reports/statements are made available on our website as soon as reasonably practicable after we file them with or furnish them to the SEC. The information contained on our website, including any information referred to in this report as being available on our website, is not a part of or incorporated into this report.
Business Objectives and Operating and Investing Strategies
The Company’s and the Operating Partnership’s overall business objectives and operating and investing strategies have not changed from the information included in the Company’s and the Operating Partnership’s Annual Report on Form 10-K for the year ended December 31, 2021.
Results of Operations
2022 Transactions
In conjunction with our business objectives and operating and investing strategies, the following table provides a rollforward of the transactions that occurred during the nine months ended September 30, 2022:
Portfolio Rollforward
($ in thousands)
|
|
|
Properties |
|
|
Apartment
|
|
|
Purchase
|
|
|
Acquisition
|
|
||||
|
12/31/2021 |
|
|
310 |
|
|
|
80,407 |
|
|
|
|
|
|
|
||
|
Acquisitions: |
|
|
|
|
|
|
|
|
|
|
|
|
||||
|
Consolidated Rental Properties |
|
|
1 |
|
|
|
172 |
|
|
$ |
113,000 |
|
|
|
3.5 |
% |
|
Unconsolidated Land Parcels (1) |
|
|
— |
|
|
|
— |
|
|
$ |
56,886 |
|
|
|
|
|
|
|
|
|
|
|
|
|
|
|
|
|
|
|
||||
|
|
|
|
|
|
|
|
|
Sales Price |
|
|
Disposition
|
|
||||
|
Dispositions: |
|
|
|
|
|
|
|
|
|
|
|
|
||||
|
Consolidated Rental Properties |
|
|
(3 |
) |
|
|
(945 |
) |
|
$ |
(746,150 |
) |
|
|
(3.4 |
%) |
|
|
|
|
|
|
|
|
|
|
|
|
|
|
||||
|
Configuration Changes |
|
|
— |
|
|
|
(40 |
) |
|
|
|
|
|
|
||
|
9/30/2022 |
|
|
308 |
|
|
|
79,594 |
|
|
|
|
|
|
|
||
Acquisitions
Dispositions
36
Table of Contents
Developments
Investments in Unconsolidated Entities
See Notes 4, 6 and 14 in the Notes to Consolidated Financial Statements for additional discussion regarding the Company’s real estate investments and investments in partially owned entities.
Future Outlook
The above 2022 assumptions are based on current expectations and are forward-looking.
Comparison of the nine months and quarter ended September 30, 2022 to the nine months and quarter ended September 30, 2021
The following table presents a reconciliation of diluted earnings per share/unit for the nine months and quarter ended September 30, 2022 as compared to the same period in 2021:
|
|
|
Nine Months Ended
|
|
|
Quarter Ended
|
|
||
|
Diluted earnings per share/unit for period ended 2021 |
|
$ |
2.14 |
|
|
$ |
1.15 |
|
|
Property NOI |
|
|
0.49 |
|
|
|
0.17 |
|
|
Interest expense |
|
|
(0.03 |
) |
|
|
— |
|
|
Corporate overhead (1) |
|
|
(0.03 |
) |
|
|
(0.01 |
) |
|
Net gain/loss on property sales |
|
|
(0.73 |
) |
|
|
(0.43 |
) |
|
Non-operating asset gains/losses |
|
|
(0.06 |
) |
|
|
— |
|
|
Depreciation expense |
|
|
(0.13 |
) |
|
|
— |
|
|
Other |
|
|
(0.02 |
) |
|
|
(0.02 |
) |
|
Diluted earnings per share/unit for period ended 2022 |
|
$ |
1.63 |
|
|
$ |
0.86 |
|
The Company’s primary financial measure for evaluating each of its apartment communities is net operating income (“NOI”). NOI represents rental income less direct property operating expenses (including real estate taxes and insurance). The Company believes that NOI is helpful to investors as a supplemental measure of its operating performance because it is a direct measure of the actual operating results of the Company’s apartment properties.
37
Table of Contents
The following tables present reconciliations of operating income per the consolidated statements of operations to NOI, along with rental income, operating expenses and NOI per the consolidated statements of operations allocated between same store and non-same store results (amounts in thousands):
|
|
|
Nine Months Ended September 30, |
|
|||||||||||||
|
|
|
2022 |
|
|
2021 |
|
|
$ Change |
|
|
% Change |
|
||||
|
Operating income |
|
$ |
873,683 |
|
|
$ |
1,033,958 |
|
|
$ |
(160,275 |
) |
|
|
(15.5 |
)% |
|
Adjustments: |
|
|
|
|
|
|
|
|
|
|
|
|
||||
|
Property management |
|
|
83,035 |
|
|
|
74,357 |
|
|
|
8,678 |
|
|
|
11.7 |
% |
|
General and administrative |
|
|
47,033 |
|
|
|
43,102 |
|
|
|
3,931 |
|
|
|
9.1 |
% |
|
Depreciation |
|
|
667,896 |
|
|
|
616,032 |
|
|
|
51,864 |
|
|
|
8.4 |
% |
|
Net (gain) loss on sales of real estate properties |
|
|
(304,346 |
) |
|
|
(587,623 |
) |
|
|
283,277 |
|
|
|
(48.2 |
)% |
|
Total NOI |
|
$ |
1,367,301 |
|
|
$ |
1,179,826 |
|
|
$ |
187,475 |
|
|
|
15.9 |
% |
|
Rental income: |
|
|
|
|
|
|
|
|
|
|
|
|
||||
|
Same store |
|
$ |
1,882,181 |
|
|
$ |
1,694,503 |
|
|
$ |
187,678 |
|
|
|
11.1 |
% |
|
Non-same store/other |
|
|
153,296 |
|
|
|
124,364 |
|
|
|
28,932 |
|
|
|
23.3 |
% |
|
Total rental income |
|
|
2,035,477 |
|
|
|
1,818,867 |
|
|
|
216,610 |
|
|
|
11.9 |
% |
|
Operating expenses: |
|
|
|
|
|
|
|
|
|
|
|
|
||||
|
Same store |
|
|
600,987 |
|
|
|
583,471 |
|
|
|
17,516 |
|
|
|
3.0 |
% |
|
Non-same store/other |
|
|
67,189 |
|
|
|
55,570 |
|
|
|
11,619 |
|
|
|
20.9 |
% |
|
Total operating expenses |
|
|
668,176 |
|
|
|
639,041 |
|
|
|
29,135 |
|
|
|
4.6 |
% |
|
NOI: |
|
|
|
|
|
|
|
|
|
|
|
|
||||
|
Same store |
|
|
1,281,194 |
|
|
|
1,111,032 |
|
|
|
170,162 |
|
|
|
15.3 |
% |
|
Non-same store/other |
|
|
86,107 |
|
|
|
68,794 |
|
|
|
17,313 |
|
|
|
25.2 |
% |
|
Total NOI |
|
$ |
1,367,301 |
|
|
$ |
1,179,826 |
|
|
$ |
187,475 |
|
|
|
15.9 |
% |
Note: See Note 13 in the Notes to Consolidated Financial Statements for detail by reportable segment/market. Non-same store/other NOI results consist primarily of properties acquired in calendar years 2021 and 2022, operations from the Company’s development properties and operations prior to disposition from 2021 and 2022 sold properties.
See the Same Store Results section below for additional discussion of those results.
Property management expenses include off-site expenses associated with the self-management of the Company’s properties as well as management fees paid to any third-party management companies. These expenses increased approximately $8.7 million or 11.7% and approximately $2.0 million or 8.2% for the nine months and quarter ended September 30, 2022, respectively, as compared to the prior year periods. These increases are primarily attributable to increases in payroll-related costs, training/conference costs, temporary help/contractors costs, travel costs and employment expenses, partially offset by decreases in legal and professional fees.
General and administrative expenses, which includes corporate operating expenses, increased approximately $3.9 million or 9.1% and approximately $0.3 million or 2.5% for the nine months and quarter ended September 30, 2022, respectively, as compared to the prior year periods, primarily due to increases in payroll-related costs, legal and professional fees and training/conference costs.
38
Table of Contents
Depreciation expense, which includes depreciation on non-real estate assets, increased approximately $51.9 million or 8.4% for the nine months ended September 30, 2022, as compared to the prior year period, primarily as a result of additional depreciation expense on properties acquired in 2021 and 2022 and development properties placed in service during 2021, partially offset by lower depreciation from properties sold in 2021 and 2022. Depreciation expense decreased approximately $1.3 million or 0.6% for the quarter ended September 30, 2022 as compared to the prior year period, primarily as a result of lower depreciation from properties sold in the fourth quarter of 2021 and 2022 and in-place leases for 2021 acquisitions being fully depreciated as of December 31, 2021, partially offset by additional depreciation expense on properties acquired in 2022 and development properties placed in service during 2021.
Net gain on sales of real estate properties decreased approximately $283.3 million or 48.2% and approximately $167.4 million or 46.0% for the nine months and quarter ended September 30, 2022, respectively, as compared to the prior year periods, primarily as a result of a lower sales volume with the sale of three consolidated apartment properties in 2022 as compared to the sale of ten consolidated apartment properties in the same period in 2021.
Interest and other income decreased approximately $20.4 million or 80.8% and approximately $0.3 million or 26.0% for the nine months and quarter ended September 30, 2022, respectively, as compared to the prior year periods. These decreases are primarily due to a gain of $23.6 million on the sale of various investment securities that occurred during 2021 but not during 2022, partially offset by increases in litigation settlement proceeds that occurred during 2022 but not during 2021.
Other expenses decreased approximately $1.7 million or 15.7% for the nine months ended September 30, 2022 as compared to the prior year period, primarily due to a decline in construction defect and litigation reserves recorded between 2022 and 2021, partially offset by increases in advocacy contributions and demolition/abatement costs. Other expenses increased approximately $0.3 million or 8.7% for the quarter ended September 30, 2022 as compared to the prior year period, primarily due to increases in advocacy contributions and demolition/abatement costs, partially offset by construction defect and litigation reserves that occurred during 2021 but not during 2022.
Interest expense, including amortization of deferred financing costs, increased approximately $14.6 million or 7.0% and approximately $4.3 million or 6.2% for the nine months and quarter ended September 30, 2022, respectively, as compared to the prior year periods. These increases are primarily due to higher overall interest rates and lower capitalized interest. The effective interest cost on all indebtedness, excluding debt extinguishment costs/prepayment penalties, for the nine months ended September 30, 2022 was 3.67% as compared to 3.51% for the prior year period, and for the quarter ended September 30, 2022 was 3.67% as compared to 3.46% for the prior year period. The Company capitalized interest of approximately $4.2 million and $12.4 million during the nine months ended September 30, 2022 and 2021, respectively, and $1.9 million and $4.2 million during the quarters ended September 30, 2022 and 2021, respectively.
Same Store Results
Properties that the Company owned and were stabilized for all of both of the nine months ended September 30, 2022 and 2021 (the “Nine-Month 2022 Same Store Properties”), which represented 72,869 apartment units, drove the Company’s results of operations. Properties are considered “stabilized” when they have achieved 90% occupancy for three consecutive months. Properties are included in same store when they are stabilized for all of the current and comparable periods presented.
The following table provides comparative total same store results and statistics for the Nine-Month 2022 Same Store Properties:
September YTD 2022 vs. September YTD 2021
Same Store Results/Statistics Including 72,869 Same Store Apartment Units
$ in thousands (except for Average Rental Rate)
|
September YTD 2022 |
|
|
September YTD 2021 |
|
|||||||||||||||||||||||||
|
|
Residential |
|
%
|
|
Non-
|
|
%
|
|
Total |
|
%
|
|
|
|
Residential |
|
Non-
|
|
Total |
|
|||||||||
|
Revenues |
$ |
1,813,450 |
|
|
11.2 |
% |
$ |
68,731 |
|
|
8.1 |
% |
$ |
1,882,181 |
|
|
11.1 |
% |
|
Revenues |
$ |
1,630,928 |
|
$ |
63,575 |
|
$ |
1,694,503 |
|
|
Expenses |
$ |
583,185 |
|
|
3.0 |
% |
$ |
17,802 |
|
|
3.1 |
% |
$ |
600,987 |
|
|
3.0 |
% |
|
Expenses |
$ |
566,210 |
|
$ |
17,261 |
|
$ |
583,471 |
|
|
NOI |
$ |
1,230,265 |
|
|
15.5 |
% |
$ |
50,929 |
|
|
10.0 |
% |
$ |
1,281,194 |
|
|
15.3 |
% |
|
NOI |
$ |
1,064,718 |
|
$ |
46,314 |
|
$ |
1,111,032 |
|
|
|
|
|
|
|
|
|
|
|
|
|
|
|
|
|
|
|
|
|
|
|
|||||||||
|
Average Rental Rate |
$ |
2,866 |
|
|
10.5 |
% |
|
|
|
|
|
|
|
|
|
Average Rental Rate |
$ |
2,594 |
|
|
|
|
|
||||||
|
Physical Occupancy |
|
96.5 |
% |
|
0.6 |
% |
|
|
|
|
|
|
|
|
|
Physical Occupancy |
|
95.9 |
% |
|
|
|
|
||||||
|
Turnover |
|
33.6 |
% |
|
(1.6 |
%) |
|
|
|
|
|
|
|
|
|
Turnover |
|
35.2 |
% |
|
|
|
|
||||||
Note: Same store revenues for all leases are reflected on a straight-line basis in accordance with GAAP for the current and comparable periods.
39
Table of Contents
The following table provides results and statistics related to our Residential same store operations for the nine months ended September 30, 2022 and 2021:
September YTD 2022 vs. September YTD 2021
Same Store Residential Results/Statistics by Market
|
|
|
|
|
|
|
|
|
|
|
|
|
|
|
|
|
Increase (Decrease) from Prior Year |
|
|||||||||||||||
|
Markets/Metro Areas |
|
Apartment
|
|
|
Sept. YTD 22
|
|
|
Sept. YTD 22
|
|
|
Sept. YTD 22
|
|
|
Sept. YTD 22
|
|
|
Average
|
|
|
Physical
|
|
|
Turnover |
|
||||||||
|
Los Angeles |
|
|
14,662 |
|
|
|
20.0 |
% |
|
$ |
2,725 |
|
|
|
96.9 |
% |
|
|
28.3 |
% |
|
|
11.4 |
% |
|
|
0.2 |
% |
|
|
(3.8 |
%) |
|
Orange County |
|
|
4,028 |
|
|
|
5.8 |
% |
|
|
2,591 |
|
|
|
97.1 |
% |
|
|
25.8 |
% |
|
|
13.6 |
% |
|
|
(0.6 |
%) |
|
|
(1.4 |
%) |
|
San Diego |
|
|
2,706 |
|
|
|
4.1 |
% |
|
|
2,737 |
|
|
|
97.0 |
% |
|
|
29.3 |
% |
|
|
11.9 |
% |
|
|
(0.7 |
%) |
|
|
(5.2 |
%) |
|
Subtotal – Southern California |
|
|
21,396 |
|
|
|
29.9 |
% |
|
|
2,701 |
|
|
|
97.0 |
% |
|
|
28.0 |
% |
|
|
11.8 |
% |
|
|
0.0 |
% |
|
|
(3.5 |
%) |
|
|
|
|
|
|
|
|
|
|
|
|
|
|
|
|
|
|
|
|
|
|
|
|
|
|
||||||||
|
San Francisco |
|
|
11,366 |
|
|
|
17.6 |
% |
|
|
3,127 |
|
|
|
96.3 |
% |
|
|
32.1 |
% |
|
|
8.0 |
% |
|
|
1.6 |
% |
|
|
(5.2 |
%) |
|
Washington, D.C. |
|
|
14,186 |
|
|
|
16.2 |
% |
|
|
2,432 |
|
|
|
96.9 |
% |
|
|
33.8 |
% |
|
|
4.7 |
% |
|
|
0.6 |
% |
|
|
(2.5 |
%) |
|
New York |
|
|
8,536 |
|
|
|
13.1 |
% |
|
|
3,964 |
|
|
|
97.0 |
% |
|
|
34.9 |
% |
|
|
15.8 |
% |
|
|
2.7 |
% |
|
|
3.9 |
% |
|
Seattle |
|
|
9,331 |
|
|
|
11.4 |
% |
|
|
2,472 |
|
|
|
95.1 |
% |
|
|
41.9 |
% |
|
|
10.7 |
% |
|
|
(0.7 |
%) |
|
|
2.5 |
% |
|
Boston |
|
|
6,430 |
|
|
|
9.9 |
% |
|
|
3,165 |
|
|
|
96.2 |
% |
|
|
37.3 |
% |
|
|
10.9 |
% |
|
|
0.5 |
% |
|
|
(0.4 |
%) |
|
Denver |
|
|
1,624 |
|
|
|
1.9 |
% |
|
|
2,275 |
|
|
|
96.9 |
% |
|
|
48.4 |
% |
|
|
12.0 |
% |
|
|
0.2 |
% |
|
|
2.5 |
% |
|
|
|
|
|
|
|
|
|
|
|
|
|
|
|
|
|
|
|
|
|
|
|
|
|
|
||||||||
|
Total |
|
|
72,869 |
|
|
|
100.0 |
% |
|
$ |
2,866 |
|
|
|
96.5 |
% |
|
|
33.6 |
% |
|
|
10.5 |
% |
|
|
0.6 |
% |
|
|
(1.6 |
%) |
Note: The above table reflects Residential same store results only. Residential operations account for approximately 96.3% of total revenues for the nine months ended September 30, 2022.
Despite geopolitical and economic uncertainties, demand to live in our apartment communities remained healthy, which our financial results reflected, as we continued to capture the gap between in-place rent levels and market rent levels. Demand for our apartments continues to support strong Physical Occupancy with pricing that is largely in-line with expectations, including modest use of Leasing Concessions. Key operating drivers for this performance during 2022 include:
In addition to these stronger fundamentals, bad debt, net has moderated during the nine months ended September 30, 2022 with improvement in resident collections primarily driven by receipt of governmental rental assistance payments on behalf of our residents.
Transaction activity has slowed as buyers and sellers adjust their expectations to a volatile economic climate and rising interest rates. While this type of environment can be challenging, the Company has traditionally found investment opportunities during periods of market dislocation as our ability to move quickly and our relatively low cost of capital creates flexibility that can provide us a competitive advantage.
Long-term, we expect elevated single family home ownership costs, positive household formation trends and the overall deficit in housing across the country to buffer the impact on our business from potential economic weakness. We also see our affluent resident base as being more resilient to rising inflation due to higher levels of disposable income and lower relative rent-to-income ratios.
40
Table of Contents
Liquidity and Capital Resources
With approximately $2.3 billion in readily available liquidity, a strong balance sheet, limited near-term maturities, very strong credit metrics and ample access to capital markets, the Company believes it is well positioned to meet its future obligations and opportunities. See further discussion below and Note 14 in the Notes to Consolidated Financial Statements for discussion of events, if any, subsequent to September 30, 2022.
Statements of Cash Flows
The following table sets forth our sources and uses of cash flows for the nine months ended September 30, 2022 and 2021 (amounts in thousands):
|
|
|
Nine Months Ended September 30, |
|
|||||
|
|
|
2022 |
|
|
2021 |
|
||
|
Cash flow provided by (used for): |
|
|
|
|
|
|
||
|
Operating activities |
|
$ |
1,120,228 |
|
|
$ |
978,213 |
|
|
Investing activities |
|
$ |
243,336 |
|
|
$ |
(309,589 |
) |
|
Financing activities |
|
$ |
(1,602,333 |
) |
|
$ |
(541,603 |
) |
The following provides information regarding the Company’s cash flows from operating, investing and financing activities for the nine months ended September 30, 2022.
Operating Activities
Our operating cash flows are primarily impacted by NOI and its components, such as Average Rental Rates, Physical Occupancy levels and operating expenses related to our properties. Cash provided by operating activities for the nine months ended September 30, 2022 as compared to the prior year period, increased by approximately $142.0 million as a direct result of the NOI and other changes discussed above in Results of Operations .
Investing Activities
Our investing cash flows are primarily impacted by our transaction activity (acquisitions/dispositions), development spend, capital expenditures and unconsolidated joint venture activity. For the nine months ended September 30, 2022, key drivers were:
Financing Activities
Our financing cash flows primarily relate to our borrowing activity (debt proceeds or repayment), distributions/dividends to shareholders and other Common Share activity. For the nine months ended September 30, 2022, key drivers were:
41
Table of Contents
Short-Term Liquidity and Cash Proceeds
The Company generally expects to meet its short-term liquidity requirements, including capital expenditures related to maintaining its existing properties and scheduled unsecured note and mortgage note repayments, through its working capital, net cash provided by operating activities and borrowings under the Company’s revolving credit facility and commercial paper program. Currently, the Company considers its cash provided by operating activities to be adequate to meet operating requirements and payments of distributions.
The following table presents the Company’s balances for cash and cash equivalents, restricted deposits and the available borrowing capacity on its revolving credit facility as of September 30, 2022 and December 31, 2021 (amounts in thousands):
|
|
|
September 30, 2022 |
|
|
December 31, 2021 |
|
||
|
Cash and cash equivalents |
|
$ |
44,788 |
|
|
$ |
123,832 |
|
|
Restricted deposits |
|
$ |
76,679 |
|
|
$ |
236,404 |
|
|
Unsecured revolving credit facility availability |
|
$ |
2,306,537 |
|
|
$ |
2,181,372 |
|
Credit Facility and Commercial Paper Program
The Company has a $2.5 billion unsecured revolving credit facility maturing November 1, 2024. The Company has the ability to increase available borrowings by an additional $750.0 million by adding lenders to the facility, obtaining the agreement of existing lenders to increase their commitments or incurring one or more term loans. The interest rate on advances under the facility will generally be the London Interbank Offered Rate (“LIBOR”) plus a spread (currently 0.775%), or based on bids received from the lending group, and the Company pays an annual facility fee (currently 0.125%). Both the spread and the facility fee are dependent on the Company’s senior unsecured credit rating.
The unsecured revolving credit agreement contains provisions that establish a process for entering into an amendment to replace LIBOR under certain circumstances, such as the anticipated phase-out of LIBOR.
The Company may borrow up to a maximum of $1.0 billion under its commercial paper program subject to market conditions. The notes will be sold under customary terms in the United States commercial paper note market and will rank pari passu with all of the Company’s other unsecured senior indebtedness.
The Company limits its utilization of the revolving credit facility in order to maintain liquidity to support its $1.0 billion commercial paper program along with certain other obligations. The following table presents the availability on the Company’s unsecured revolving credit facility as of October 21, 2022 (amounts in thousands):
|
|
|
October 21, 2022 |
|
|
|
Unsecured revolving credit facility commitment |
|
$ |
2,500,000 |
|
|
Commercial paper balance outstanding |
|
|
(145,000 |
) |
|
Unsecured revolving credit facility balance outstanding |
|
|
— |
|
|
Other restricted amounts |
|
|
(3,463 |
) |
|
Unsecured revolving credit facility availability |
|
$ |
2,351,537 |
|
Dividend Policy
The Company declared a dividend/distribution for the first, second and third quarters of 2022 of $0.625 per share/unit in each quarter, an annualized increase of 3.7% over the amount paid in 2021. All future dividends/distributions remain subject to the discretion of the Company’s Board of Trustees.
Total dividends/distributions paid in October 2022 amounted to $242.7 million (excluding distributions on Partially Owned Properties), which consisted of certain distributions declared during the quarter ended September 30, 2022.
42
Table of Contents
Long-Term Financing and Capital Needs
The Company expects to meet its long-term liquidity requirements, such as lump sum unsecured note and mortgage debt maturities, property acquisitions and financing of development activities, through the issuance of secured and unsecured debt and equity securities (including additional OP Units), proceeds received from the disposition of certain properties and joint ventures, along with cash generated from operations after all distributions. The Company has a significant number of unencumbered properties available to secure additional mortgage borrowings should unsecured capital be unavailable or the cost of alternative sources of capital be too high. The value of and cash flow from these unencumbered properties are in excess of the requirements the Company must maintain in order to comply with covenants under its unsecured notes and line of credit. Of the $28.0 billion in investment in real estate on the Company’s balance sheet at September 30, 2022, $24.3 billion or 87.0% was unencumbered. However, there can be no assurances that these sources of capital will be available to the Company in the future on acceptable terms or otherwise.
EQR issues equity and guarantees certain debt of the Operating Partnership from time to time. EQR does not have any indebtedness as all debt is incurred by the Operating Partnership. The Company settled all of its outstanding forward sales agreements under its At-The-Market (“ATM”) share offering program subsequent to September 30, 2022. See Note 14 in the Notes to Consolidated Financial Statements for additional discussion.
The Company’s total debt summary schedule as of September 30, 2022 is as follows:
Debt Summary as of September 30, 2022
($ in thousands)
|
|
|
Debt
|
|
|
% of Total |
|
||
|
Secured |
|
$ |
1,967,827 |
|
|
|
26.2 |
% |
|
Unsecured |
|
|
5,530,364 |
|
|
|
73.8 |
% |
|
Total |
|
$ |
7,498,191 |
|
|
|
100.0 |
% |
|
Fixed Rate Debt: |
|
|
|
|
|
|
||
|
Secured – Conventional |
|
$ |
1,634,342 |
|
|
|
21.8 |
% |
|
Unsecured – Public |
|
|
5,340,807 |
|
|
|
71.2 |
% |
|
Fixed Rate Debt |
|
|
6,975,149 |
|
|
|
93.0 |
% |
|
Floating Rate Debt: |
|
|
|
|
|
|
||
|
Secured – Conventional |
|
|
97,611 |
|
|
|
1.3 |
% |
|
Secured – Tax Exempt |
|
|
235,874 |
|
|
|
3.1 |
% |
|
Unsecured – Revolving Credit Facility |
|
|
— |
|
|
|
— |
|
|
Unsecured – Commercial Paper Program |
|
|
189,557 |
|
|
|
2.6 |
% |
|
Floating Rate Debt |
|
|
523,042 |
|
|
|
7.0 |
% |
|
Total |
|
$ |
7,498,191 |
|
|
|
100.0 |
% |
The Company’s long-term financing and capital needs and sources have not changed materially from the information included in the Company's and the Operating Partnership's Annual Report on Form 10-K for the year ended December 31, 2021.
Definitions
The definition of certain terms described above or below are as follows:
43
Table of Contents
Critical Accounting Policies and Estimates
The Company’s and the Operating Partnership’s critical accounting policies and estimates have not changed from the information included in the Company’s and the Operating Partnership’s Annual Report on Form 10-K for the year ended December 31, 2021.
44
Table of Contents
Funds From Operations and Normalized Funds From Operations
The following is the Company’s and the Operating Partnership’s reconciliation of net income to FFO available to Common Shares and Units / Units and Normalized FFO available to Common Shares and Units / Units for the nine months and quarters ended September 30, 2022 and 2021:
Funds From Operations and Normalized Funds From Operations
(Amounts in thousands)
|
|
|
Nine Months Ended September 30, |
|
|
Quarter Ended September 30, |
|
||||||||||
|
|
|
2022 |
|
|
2021 |
|
|
2022 |
|
|
2021 |
|
||||
|
Net income |
|
$ |
641,641 |
|
|
$ |
835,736 |
|
|
$ |
335,165 |
|
|
$ |
447,332 |
|
|
Net (income) loss attributable to Noncontrolling
|
|
|
(2,726 |
) |
|
|
(1,957 |
) |
|
|
(1,143 |
) |
|
|
(534 |
) |
|
Preferred/preference distributions |
|
|
(2,318 |
) |
|
|
(2,318 |
) |
|
|
(773 |
) |
|
|
(773 |
) |
|
Net income available to Common Shares and Units / Units |
|
|
636,597 |
|
|
|
831,461 |
|
|
|
333,249 |
|
|
|
446,025 |
|
|
Adjustments: |
|
|
|
|
|
|
|
|
|
|
|
|
||||
|
Depreciation |
|
|
667,896 |
|
|
|
616,032 |
|
|
|
214,129 |
|
|
|
215,397 |
|
|
Depreciation – Non-real estate additions |
|
|
(3,189 |
) |
|
|
(3,228 |
) |
|
|
(1,075 |
) |
|
|
(1,052 |
) |
|
Depreciation – Partially Owned Properties |
|
|
(2,097 |
) |
|
|
(2,676 |
) |
|
|
(543 |
) |
|
|
(994 |
) |
|
Depreciation – Unconsolidated Properties |
|
|
1,897 |
|
|
|
1,867 |
|
|
|
657 |
|
|
|
634 |
|
|
Net (gain) loss on sales of unconsolidated entities - operating assets |
|
|
(9 |
) |
|
|
(4 |
) |
|
|
— |
|
|
|
— |
|
|
Net (gain) loss on sales of real estate properties |
|
|
(304,346 |
) |
|
|
(587,623 |
) |
|
|
(196,551 |
) |
|
|
(363,928 |
) |
|
FFO available to Common Shares and Units / Units (1) (3) (4) |
|
|
996,749 |
|
|
|
855,829 |
|
|
|
349,866 |
|
|
|
296,082 |
|
|
Adjustments: |
|
|
|
|
|
|
|
|
|
|
|
|
||||
|
Impairment – non-operating assets |
|
|
— |
|
|
|
— |
|
|
|
— |
|
|
|
— |
|
|
Write-off of pursuit costs |
|
|
3,296 |
|
|
|
3,557 |
|
|
|
781 |
|
|
|
910 |
|
|
Debt extinguishment and preferred share redemption (gains) losses |
|
|
4,316 |
|
|
|
264 |
|
|
|
3,847 |
|
|
|
— |
|
|
Non-operating asset (gains) losses |
|
|
(1,174 |
) |
|
|
(23,014 |
) |
|
|
156 |
|
|
|
294 |
|
|
Other miscellaneous items |
|
|
1,832 |
|
|
|
4,520 |
|
|
|
2,017 |
|
|
|
1,179 |
|
|
Normalized FFO available to Common Shares and Units / Units (2) (3) (4) |
|
$ |
1,005,019 |
|
|
$ |
841,156 |
|
|
$ |
356,667 |
|
|
$ |
298,465 |
|
|
|
|
|
|
|
|
|
|
|
|
|
|
|
||||
|
FFO (1) (3) |
|
$ |
999,067 |
|
|
$ |
858,147 |
|
|
$ |
350,639 |
|
|
$ |
296,855 |
|
|
Preferred/preference distributions |
|
|
(2,318 |
) |
|
|
(2,318 |
) |
|
|
(773 |
) |
|
|
(773 |
) |
|
FFO available to Common Shares and Units / Units (1) (3) (4) |
|
$ |
996,749 |
|
|
$ |
855,829 |
|
|
$ |
349,866 |
|
|
$ |
296,082 |
|
|
|
|
|
|
|
|
|
|
|
|
|
|
|
||||
|
Normalized FFO (2) (3) |
|
$ |
1,007,337 |
|
|
$ |
843,474 |
|
|
$ |
357,440 |
|
|
$ |
299,238 |
|
|
Preferred/preference distributions |
|
|
(2,318 |
) |
|
|
(2,318 |
) |
|
|
(773 |
) |
|
|
(773 |
) |
|
Normalized FFO available to Common Shares and Units / Units (2) (3) (4) |
|
$ |
1,005,019 |
|
|
$ |
841,156 |
|
|
$ |
356,667 |
|
|
$ |
298,465 |
|
• the impact of any expenses relating to non-operating asset impairment;
• pursuit cost write-offs;
• gains and losses from early debt extinguishment and preferred share redemptions;
• gains and losses from non-operating assets; and
• other miscellaneous items.
45
Table of Contents
Item 3. Quantitative and Qualitat ive Disclosures About Market Risk
The Company’s and the Operating Partnership’s market risk has not changed materially from the amounts and information reported in Part II, Item 7A, Quantitative and Qualitative Disclosures About Market Risk , to the Company’s and the Operating Partnership’s Annual Report on Form 10-K for the year ended December 31, 2021.
Item 4. Controls and Procedures
Equity Residential
Effective as of September 30, 2022, the Company carried out an evaluation, under the supervision and with the participation of the Company’s management, including the Chief Executive Officer and Chief Financial Officer, of the effectiveness of the Company’s disclosure controls and procedures pursuant to Exchange Act Rules 13a-15 and 15d-15. Based on that evaluation, the Chief Executive Officer and Chief Financial Officer concluded that the disclosure controls and procedures are effective to ensure that information required to be disclosed by the Company in its Exchange Act filings is recorded, processed, summarized and reported within the time periods specified in the SEC’s rules and forms.
There were no changes to the internal control over financial reporting of the Company identified in connection with the Company’s evaluation referred to above that occurred during the third quarter of 2022 that have materially affected, or are reasonably likely to materially affect, the Company’s internal control over financial reporting.
ERP Operating Limited Partnership
Effective as of September 30, 2022, the Operating Partnership carried out an evaluation, under the supervision and with the participation of the Operating Partnership’s management, including the Chief Executive Officer and Chief Financial Officer of EQR, of the effectiveness of the Operating Partnership’s disclosure controls and procedures pursuant to Exchange Act Rules 13a-15 and 15d-15. Based on that evaluation, the Chief Executive Officer and Chief Financial Officer concluded that the disclosure controls and procedures are effective to ensure that information required to be disclosed by the Operating Partnership in its Exchange Act filings is recorded, processed, summarized and reported within the time periods specified in the SEC’s rules and forms.
46
Table of Contents
There were no changes to the internal control over financial reporting of the Operating Partnership identified in connection with the Operating Partnership’s evaluation referred to above that occurred during the third quarter of 2022 that have materially affected, or are reasonably likely to materially affect, the Operating Partnership’s internal control over financial reporting.
PART II. OTHER INFORMATION
Item 1. Lega l Proceedings
As of September 30, 2022, the Company does not believe there is any litigation pending or threatened against it that, individually or in the aggregate, may reasonably be expected to have a material adverse effect on the Company.
Item 1A. R isk Factors
There have been no material changes to the risk factors that were discussed in Part I, Item 1A of the Company’s and the Operating Partnership’s Annual Report on Form 10-K for the year ended December 31, 2021.
Item 2. Unregistered Sales of Equi ty Securities and Use of Proceeds
During the quarter ended September 30, 2022, EQR issued 6,572 Common Shares in exchange for 6,572 OP Units held by various limited partners of ERPOP. OP Units are generally exchangeable into Common Shares on a one-for-one basis or, at the option of ERPOP, the cash equivalent thereof, at any time one year after the date of issuance. These shares were either registered under the Securities Act of 1933, as amended (the “Securities Act”), or issued in reliance on an exemption from registration under Section 4(a)(2) of the Securities Act and the rules and regulations promulgated thereunder, as these were transactions by an issuer not involving a public offering. In light of the manner of the sale and information obtained by EQR from the limited partners in connection with these transactions, EQR believes it may rely on these exemptions.
Item 3. Defaults Up on Senior Securities
None.
Item 4. Mine Saf ety Disclosures
Not applicable.
Item 5. Other Information
None.
Item 6. Exhibits – S ee the Exhibit Index.
47
Table of Contents
EXHIBI T INDEX
The exhibits listed below are filed as part of this report. References to exhibits or other filings under the caption “Location” indicate that the exhibit or other filing has been filed, that the indexed exhibit and the exhibit referred to are the same and that the exhibit referred to is incorporated by reference. The Commission file numbers for our Exchange Act filings referenced below are 1-12252 (Equity Residential) and 0-24920 (ERP Operating Limited Partnership).
|
Exhibit |
|
Description |
|
Location |
|
10.1 |
|
|
Attached herein. |
|
|
|
|
|
|
|
|
31.1 |
|
Equity Residential – Certification of Mark J. Parrell, Chief Executive Officer. |
|
Attached herein. |
|
|
|
|
|
|
|
31.2 |
|
Equity Residential – Certification of Robert A. Garechana, Chief Financial Officer. |
|
Attached herein. |
|
|
|
|
|
|
|
31.3 |
|
|
Attached herein. |
|
|
|
|
|
|
|
|
31.4 |
|
|
Attached herein. |
|
|
|
|
|
|
|
|
32.1 |
|
|
Attached herein. |
|
|
|
|
|
|
|
|
32.2 |
|
|
Attached herein. |
|
|
|
|
|
|
|
|
32.3 |
|
|
Attached herein. |
|
|
|
|
|
|
|
|
32.4 |
|
|
Attached herein. |
|
|
|
|
|
|
|
|
101.INS |
|
Inline XBRL Instance Document – the instance document does not appear in the Interactive Data File because XBRL tags are embedded within the Inline XBRL document. |
|
|
|
|
|
|
|
|
|
101.SCH |
|
Inline XBRL Taxonomy Extension Schema Document. |
|
|
|
|
|
|
|
|
|
101.CAL |
|
Inline XBRL Taxonomy Extension Calculation Linkbase Document. |
|
|
|
|
|
|
|
|
|
101.DEF |
|
Inline XBRL Taxonomy Extension Definition Linkbase Document. |
|
|
|
|
|
|
|
|
|
101.LAB |
|
Inline XBRL Taxonomy Extension Label Linkbase Document. |
|
|
|
|
|
|
|
|
|
101.PRE |
|
Inline XBRL Taxonomy Extension Presentation Linkbase Document. |
|
|
|
|
|
|
|
|
|
104 |
|
Cover Page Interactive Data File (embedded within the Inline XBRL document). |
|
|
|
|
|
|
|
|
48
Table of Contents
SIGNATURES
Pursuant to the requirements of the Securities Exchange Act of 1934, each registrant has duly caused this report to be signed on its behalf by the undersigned thereunto duly authorized.
|
|
|
EQUITY RESIDENTIAL |
||
|
|
|
|
|
|
|
Date: |
October 28, 2022 |
By: |
|
/s/ Robert A. Garechana |
|
|
|
|
|
Robert A. Garechana |
|
|
|
|
|
Executive Vice President and Chief Financial Officer |
|
|
|
|
|
(Principal Financial Officer) |
|
|
|
|
|
|
|
Date: |
October 28, 2022 |
By: |
|
/s/ Ian S. Kaufman |
|
|
|
|
|
Ian S. Kaufman |
|
|
|
|
|
Senior Vice President and Chief Accounting Officer |
|
|
|
|
|
(Principal Accounting Officer) |
|
|
|
ERP OPERATING LIMITED PARTNERSHIP
ITS GENERAL PARTNER |
||
|
|
|
|
|
|
|
Date: |
October 28, 2022 |
By: |
|
/s/ Robert A. Garechana |
|
|
|
|
|
Robert A. Garechana |
|
|
|
|
|
Executive Vice President and Chief Financial Officer |
|
|
|
|
|
(Principal Financial Officer) |
|
|
|
|
|
|
|
Date: |
October 28, 2022 |
By: |
|
/s/ Ian S. Kaufman |
|
|
|
|
|
Ian S. Kaufman |
|
|
|
|
|
Senior Vice President and Chief Accounting Officer |
|
|
|
|
|
(Principal Accounting Officer) |