EQT CORP
10-Ks and 10-Qs
|
|
|
|
|
|
|
|
|
|
|
|
|
|
|
|
|
|
|
|
|
|
|
|
|
|
|
|
|
|
|
|
|
|
|
|
|
|
|
|
|
|
|
|
|
|
|
|
|
|
|
|
|
|
|
|
|
|
|
UNITED STATES
SECURITIES AND EXCHANGE COMMISSION
Washington, D.C. 20549
FORM 10-K
|
[X]
|
ANNUAL REPORT PURSUANT TO SECTION 13 OR 15(d) OF THE SECURITIES EXCHANGE ACT OF 1934
|
|||
FOR THE FISCAL YEAR ENDED
DECEMBER 31, 2014
|
[ ]
|
TRANSITION REPORT PURSUANT TO SECTION 13 OR 15(d) OF THE SECURITIES EXCHANGE ACT OF 1934
|
|||
or
FOR THE TRANSITION PERIOD FROM ___________ TO __________
COMMISSION FILE NUMBER 1-3551
EQT CORPORATION
(Exact name of registrant as specified in its charter)
|
PENNSYLVANIA
(State or other jurisdiction of incorporation or organization)
|
25-0464690
(IRS Employer Identification No.)
|
|
625 Liberty Avenue
Pittsburgh, Pennsylvania
(Address of principal executive offices)
|
15222
(Zip Code)
|
Registrant’s telephone number, including area code: (412) 553-5700
Securities registered pursuant to Section 12(b) of the Act:
|
Title of each class
|
Name of each exchange on which registered
|
|
Common Stock, no par value
|
New York Stock Exchange
|
Securities registered pursuant to Section 12(g) of the Act:
None
Indicate by check mark if the registrant is a well-known seasoned issuer, as defined in Rule 405 of the Securities Act. Yes
X
No ___
Indicate by check mark if the registrant is not required to file reports pursuant to Section 13 or Section 15(d) of the Act. Yes ___ No
X
Indicate by check mark whether the registrant: (1) has filed all reports required to be filed by Section 13 or 15(d) of the Securities Exchange Act of 1934 during the preceding 12 months (or for such shorter period that the registrant was required to file such reports), and (2) has been subject to such filing requirements for the past 90 days. Yes
X
No ___
Indicate by check mark whether the registrant has submitted electronically and posted on its corporate Website, if any, every Interactive Data File required to be submitted and posted pursuant to Rule 405 of Regulation S-T (§ 232.405 of this chapter) during the preceding 12 months (or for such shorter period that the registrant was required to submit and post such files). Yes
X
No ___
Indicate by check mark if disclosure of delinquent filers pursuant to Item 405 of Regulation S-K (§ 229.405 of this chapter) is not contained herein, and will not be contained, to the best of registrant’s knowledge, in definitive proxy or information statements incorporated by reference in Part III of this Form 10-K or any amendment to this Form 10-K. [X]
Indicate by check mark whether the registrant is a large accelerated filer, an accelerated filer, a non-accelerated filer, or a smaller reporting company. See the definitions of “large accelerated filer,” “accelerated filer” and “smaller reporting company” in Rule 12b-2 of the Exchange Act. (Check one):
|
Large accelerated filer
X
|
Accelerated filer ___
|
|
Non-accelerated filer ___
|
Smaller reporting company ___
|
Indicate by check mark whether the registrant is a shell company (as defined in Rule 12b-2 of the Act). Yes ___ No
X
The aggregate market value of voting stock held by non-affiliates of the registrant as of
June 30, 2014
:
$14.0 billion
The number of shares (in thousands) of common stock outstanding as of
January 31, 2015
:
151,602
DOCUMENTS INCORPORATED BY REFERENCE
The Company’s definitive proxy statement relating to the annual meeting of shareholders (to be held
April 15, 2015
) will be filed with the Commission within 120 days after the close of the Company’s fiscal year ended
December 31, 2014
and is incorporated by reference in Part III to the extent described therein.
TABLE OF CONTENTS
|
|
Glossary of Commonly Used Terms, Abbreviations and Measurements
|
|
|
|
Cautionary Statements
|
|
|
|
||
|
PART I
|
||
|
|
||
|
Item 1
|
Business
|
|
|
Item 1A
|
Risk Factors
|
|
|
Item 1B
|
Unresolved Staff Comments
|
|
|
Item 2
|
Properties
|
|
|
Item 3
|
Legal Proceedings
|
|
|
Item 4
|
Mine Safety and Health Administration Data
|
|
|
|
Executive Officers of the Registrant
|
|
|
|
|
|
|
|
|
|
|
PART II
|
||
|
|
|
|
|
Item 5
|
Market for Registrant’s Common Equity, Related Stockholder Matters and Issuer Purchases of Equity Securities
|
|
|
Item 6
|
Selected Financial Data
|
|
|
Item 7
|
Management’s Discussion and Analysis of Financial Condition and Results of Operations
|
|
|
Item 7A
|
Quantitative and Qualitative Disclosures About Market Risk
|
|
|
Item 8
|
Financial Statements and Supplementary Data
|
|
|
Item 9
|
Changes in and Disagreements with Accountants on Accounting and Financial Disclosure
|
|
|
Item 9A
|
Controls and Procedures
|
|
|
Item 9B
|
Other Information
|
|
|
|
||
|
PART III
|
||
|
|
||
|
Item 10
|
Directors, Executive Officers and Corporate Governance
|
|
|
Item 11
|
Executive Compensation
|
|
|
Item 12
|
Security Ownership of Certain Beneficial Owners and Management and Related Stockholder Matters
|
|
|
Item 13
|
Certain Relationships and Related Transactions and Director Independence
|
|
|
Item 14
|
Principal Accounting Fees and Services
|
|
|
|
|
|
|
PART IV
|
||
|
|
|
|
|
Item 15
|
Exhibits and Financial Statement Schedules
|
|
|
|
Index to Financial Statements Covered by Report of Independent Registered Public Accounting Firm
|
|
|
|
Index to Exhibits
|
|
|
|
Signatures
|
|
2
Glossary of Commonly Used Terms, Abbreviations and Measurements
Commonly Used Terms
AFUDC –
Allowance for Funds Used During Construction – carrying costs for the construction of certain long-term regulated assets are capitalized and amortized over the related assets’ estimated useful lives. The capitalized amount for construction of regulated assets includes interest cost and a designated cost of equity for financing the construction of these regulated assets.
Appalachian Basin –
the area of the United States composed of those portions of West Virginia, Pennsylvania, Ohio, Maryland, Kentucky and Virginia that lie in the Appalachian Mountains.
basis
– when referring to commodity pricing, the difference between the futures price for a commodity and the corresponding sales price at various regional sales points. The differential commonly is related to factors such as product quality, location, transportation capacity availability and contract pricing.
British thermal unit
– a measure of the amount of energy required to raise the temperature of one pound of water one degree Fahrenheit.
collar
– a financial arrangement that effectively establishes a price range for the underlying commodity. The producer bears the risk and benefit of fluctuation between the minimum (floor) price and the maximum (ceiling) price.
continuous accumulations
– natural gas and oil resources that are pervasive throughout large areas, have ill-defined boundaries and typically lack or are unaffected by hydrocarbon-water contacts near the base of the accumulation.
development well
– a well drilled within the proved area of an oil or gas reservoir to the depth of a stratigraphic horizon known to be productive.
exploratory well
– a well drilled to find a new field or to find a new reservoir in a field previously found to be productive of oil or gas in another reservoir. Generally, an exploratory well is any well that is not a development well, an extension well, a service well or a stratigraphic test well.
feet of pay
– footage penetrated by the drill bit into the target formation.
futures contract
– an exchange-traded contract to buy or sell a standard quantity and quality of a commodity at a specified future date and price.
gas –
all references to “gas” in this report refer to natural gas.
gross
– “gross” natural gas and oil wells or “gross” acres equal the total number of wells or acres in which the Company has a working interest.
hedging
– the use of derivative commodity and interest rate instruments to reduce financial exposure to commodity price and interest rate volatility.
horizontal drilling
– drilling that ultimately is horizontal or near horizontal to increase the length of the well bore penetrating the target formation.
margin call
– a demand for additional margin deposits when forward prices move adversely to a derivative holder’s position.
margin
deposits
– funds or good faith deposits posted during the trading life of a derivative contract to guarantee fulfillment of contract obligations.
multiple completion well
– a well equipped to produce oil and/or gas separately from more than one reservoir. Such wells contain multiple strings of tubing or other equipment that permit production from the various completions to be measured and accounted for separately.
3
Glossary of Commonly Used Terms, Abbreviations and Measurements
NGL
– natural gas liquids – those hydrocarbons in natural gas that are separated from the gas as liquids through the process of absorption, condensation, adsorption or other methods in gas processing plants. Natural gas liquids include primarily propane, butane and iso-butane.
net
– “net” natural gas and oil wells or “net” acres are determined by adding the fractional ownership working interests the Company has in gross wells or acres.
net revenue interest
– the interest retained by the Company in the revenues from a well or property after giving effect to all third-party interests (equal to 100% minus all royalties on a well or property).
play
– a proven geological formation that contains commercial amounts of hydrocarbons.
proved reserves
–quantities of oil, natural gas, and NGLs which, by analysis of geological and engineering data, can be estimated with reasonable certainty to be economically producible from a given date forward, from known reservoirs, and under existing economic conditions, operating methods and government regulations prior to the time at which contracts providing the right to operate expire, unless evidence indicates that renewal is reasonably certain, regardless of whether deterministic or probabilistic methods are used for the estimation.
proved developed reserves
– proved reserves which can be expected to be recovered through existing wells with existing equipment and operating methods.
proved undeveloped reserves (PUDs)
– proved reserves that can be estimated with reasonable certainty to be recovered from new wells on undrilled proved acreage or from existing wells where a relatively major expenditure is required for completion.
reservoir
– a porous and permeable underground formation containing a natural accumulation of producible natural gas and/or oil that is confined by impermeable rock or water barriers and is separate from other reservoirs.
royalty interest
– the land owner’s share of oil or gas production, typically 1/8.
throughput
– the volume of natural gas transported or passing through a pipeline, plant, terminal, or other facility during a particular period.
working gas
– the volume of natural gas in the storage reservoir that can be extracted during the normal operation of the storage facility.
working interest
– an interest that gives the owner the right to drill, produce and conduct operating activities on a property and receive a share of any production.
4
Glossary of Commonly Used Terms, Abbreviations and Measurements
Abbreviations
ASC –
Accounting Standards Codification
CBM –
Coalbed Methane
CFTC –
Commodity Futures Trading Commission
EPA
– U.S. Environmental Protection Agency
FASB
– Financial Accounting Standards Board
FERC
– Federal Energy Regulatory Commission
IPO
– initial public offering
IRS
– Internal Revenue Service
NYMEX
– New York Mercantile Exchange
OTC –
over the counter
SEC –
Securities and Exchange Commission
WTI –
West Texas Intermediate
Measurements
Bbl
= barrel
Btu
= one British thermal unit
BBtu
= billion British thermal units
Bcf
= billion cubic feet
Bcfe
= billion cubic feet of natural gas
equivalents, with one barrel of NGLs and crude oil
being equivalent to 6,000 cubic feet of natural gas
Dth
= million British thermal units
Mcf
= thousand cubic feet
Mcfe
= thousand cubic feet of natural gas
equivalents, with one barrel of NGLs and crude oil
being equivalent to 6,000 cubic feet of natural gas
Mbbl
= thousand barrels
MMBtu
= million British thermal units
MMcf
= million cubic feet
MMcfe
= million cubic feet of natural gas
equivalents, with one barrel of NGLs and crude oil
being equivalent to 6,000 cubic feet of natural gas
TBtu
= trillion British thermal units
Tcfe
= trillion cubic feet of natural gas
equivalents, with one barrel of NGLs and crude oil
being equivalent to 6,000 cubic feet of natural gas
5
Cautionary Statements
Disclosures in this Annual Report on Form 10-K contain certain forward-looking statements within the meaning of Section 21E of the Securities Exchange Act of 1934, as amended, and Section 27A of the Securities Act of 1933, as amended. Statements that do not relate strictly to historical or current facts are forward-looking and usually identified by the use of words such as “anticipate,” “estimate,” “could,” “would,” “will,” “may,” “forecast,” “approximate,” “expect,” “project,” “intend,” “plan,” “believe” and other words of similar meaning in connection with any discussion of future operating or financial matters. Without limiting the generality of the foregoing, forward-looking statements contained in this Annual Report on Form 10-K include the matters discussed in the sections captioned “Strategy” in Item 1, “Business,” and “Outlook” in Item 7, “Management’s Discussion and Analysis of Financial Condition and Results of Operations,” and the expectations of plans, strategies, objectives and growth and anticipated financial and operational performance of the Company and its subsidiaries, including guidance regarding the Company’s strategy to develop its Marcellus and other reserves; drilling plans and programs (including the number, type, feet of pay and location of wells to be drilled, the conversion of drilling rigs to utilize natural gas and the availability of capital to complete these plans and programs); the expiration of leasehold terms before production can be established; technology (including drilling and completion techniques); production sales volumes (including liquids volumes); gathering and transmission volumes (including the subscription of additional capacity related to the expiration of EQT Midstream Partners, LP firm transportation contracts); the weighted average contract life of transmission and storage contracts; infrastructure programs (including the timing, cost and capacity of the transmission and gathering expansion projects); the timing, cost, capacity and expected interconnects with facilities and pipelines of the Ohio Valley Connector and Mountain Valley Pipeline (MVP) projects; the ultimate terms, partners and structure of the MVP joint venture; the Partnership’s assumption of the Company’s interest in the MVP joint venture; monetization transactions, including midstream asset sales (dropdowns) to EQT Midstream Partners, LP and other asset sales, joint ventures or other transactions involving the Company’s assets; natural gas prices and changes in basis; reserves; projected capital expenditures; liquidity and financing requirements, including funding sources and availability; the amount and timing of any repurchases under the Company’s share repurchase authorization; the timing of the termination of the Company’s defined benefit plan; hedging strategy; the effects of government regulation and litigation; operation of the Company’s fleet vehicles on natural gas; and tax position. The forward-looking statements included in this Annual Report on Form 10-K involve risks and uncertainties that could cause actual results to differ materially from projected results. Accordingly, investors should not place undue reliance on forward-looking statements as a prediction of actual results. The Company has based these forward-looking statements on current expectations and assumptions about future events. While the Company considers these expectations and assumptions to be reasonable, they are inherently subject to significant business, economic, competitive, regulatory and other risks and uncertainties, many of which are difficult to predict and beyond the Company’s control. The risks and uncertainties that may affect the operations, performance and results of the Company’s business and forward-looking statements include, but are not limited to, those set forth under Item 1A, “Risk Factors,” and elsewhere in this Annual Report on Form 10-K.
Any forward-looking statement speaks only as of the date on which such statement is made and the Company does not intend to correct or update any forward-looking statement, whether as a result of new information, future events or otherwise.
In reviewing any agreements incorporated by reference in or filed with this Annual Report on Form 10-K, please remember such agreements are included to provide information regarding the terms of such agreements and are not intended to provide any other factual or disclosure information about the Company. The agreements may contain representations and warranties by the Company, which should not in all instances be treated as categorical statements of fact, but rather as a way of allocating the risk to one of the parties to such agreements should those statements prove to be inaccurate. The representations and warranties were made only as of the date of the relevant agreement or such other date or dates as may be specified in such agreement and are subject to more recent developments. Accordingly, these representations and warranties alone may not describe the actual state of affairs of the Company or its affiliates as of the date they were made or at any other time.
6
Item 1.
Business
General
EQT Corporation (EQT or the Company) conducts its business through
two
business segments: EQT Production and EQT Midstream. EQT Production is one of the largest natural gas producers in the Appalachian Basin with
10.7
Tcfe of proved natural gas, NGLs and crude oil reserves across approximately
3.4 million
gross acres, including approximately
630,000
gross acres in the Marcellus play, as of
December 31, 2014
. EQT Midstream provides gathering, transmission and storage services for the Company’s produced gas, as well as for independent third parties across the Appalachian Basin.
Key Events in
2014
During
2014
, EQT achieved record annual production sales volumes, including a
26%
increase in total sales volumes and a
38%
increase in Marcellus sales volumes. EQT’s midstream business delivered record gathered volumes that were
27%
higher than the previous year. During 2014, EQT Midstream Partners, LP (the Partnership) reported net income of $232.8 million, $61.7 million higher than 2013. The increase was primarily related to higher operating income driven by production development in the Marcellus Shale by EQT and third parties. EQT also completed the following transactions that were instrumental in contributing to a successful
2014
:
|
•
|
On May 7, 2014, a wholly owned subsidiary of the Company, EQT Gathering, LLC (EQT Gathering), contributed a
|
high-pressure gathering system to EQM Gathering Opco, LLC (EQM Gathering), a wholly owned subsidiary of the Partnership, in exchange for
$1.18 billion
(the Jupiter Transaction). EQM Gathering is consolidated by the Company as it is still controlled by the Company.
|
•
|
On
May 7, 2014
, the Partnership completed an underwritten public offering of
12,362,500
common units, which included the full exercise of the underwriters’ overallotment option, representing Partnership limited partner interests. The Partnership received net proceeds of approximately
$902.5 million
from the offering, after deducting the underwriters’ discount and offering expenses.
|
|
•
|
In
June 2014
, the Company exchanged certain assets with Range Resources Corporation (Range). The Company received approximately
73,000
net acres and approximately
900
producing wells, most of which are vertical wells, in the Permian Basin of Texas. In exchange, Range received approximately
138,000
net acres in the Company’s Nora field of Virginia (Nora), the Company’s working interest in approximately
2,000
producing vertical wells in Nora, the Company’s remaining
50%
ownership interest in Nora Gathering, LLC (Nora LLC), which owns the supporting gathering system in Nora, and
$167.3 million
in cash.
|
|
•
|
In July 2014, the Partnership announced that it will construct and own the Ohio Valley Connector (OVC) pipeline. The OVC includes a
36
-mile pipeline that will extend the Partnership’s transmission and storage system from northern West Virginia to Clarington, Ohio, at which point it will interconnect with the Rockies Express Pipeline and the Texas Eastern Pipeline. In December 2014, the Partnership submitted the OVC certificate application to the FERC and anticipates receiving the certificate in the second half of 2015. Subject to FERC approval, construction is scheduled to begin in the third quarter of 2015 and the pipeline is expected to be in-service by mid-year 2016. The OVC will provide approximately 850 BBtu per day of transmission capacity and the 36-mile pipeline portion is estimated to cost approximately $300 million, of which $120 million to $130 million is expected to be spent in 2015. The Partnership has entered into a
20
-year precedent agreement with the Company for a total of
650
BBtu per day of firm transmission capacity on the OVC.
|
|
•
|
In August 2014, the Partnership issued 4.00% Senior Notes (4.00% Senior Notes) due August 1, 2024 in the aggregate principal amount of $500.0 million. Net proceeds of the offering of $492.3 million were used to repay the outstanding borrowings under the Partnership’s credit facility and for general partnership purposes.
|
|
•
|
In September 2014, the Company and an affiliate of NextEra Energy, Inc. announced the formation of a joint venture, Mountain Valley Pipeline, LLC (MVP LLC), that will construct and own the Mountain Valley Pipeline (MVP). The Company expects to transfer its interest in MVP LLC to the Partnership. The approximately
300
-mile pipeline will extend from the Partnership’s existing transmission and storage system in Wetzel County, West Virginia to Pittsylvania County, Virginia. The Company expects that the Partnership will own the largest interest in the joint venture and will operate the MVP, which is estimated to cost a total of approximately $2.5 billion to $3.5 billion, with the Partnership funding its
|
7
proportionate share through capital contributions made to the joint venture. In 2015, the Partnership’s capital contributions are expected to be approximately $75 million to $85 million and will be primarily in support of environmental and land assessments, design work and materials. Expenditures are expected to increase substantially as construction commences, with the bulk of the expenditures expected to be made in 2017 and 2018. The joint venture has secured a total of
2.0
Bcf per day of firm capacity commitments at
20
-year terms and is currently in negotiation with additional shippers who have expressed interest in the MVP project. As a result, the final project scope, including pipe diameter and total capacity, has not yet been determined; however the voluntary pre-filing process with the FERC began in October 2014. The pipeline, which is subject to FERC approval, is expected to be in-service during the fourth quarter of 2018.
EQT Production Business Segment
EQT Production is one of the largest natural gas producers in the Appalachian Basin with
10.7
Tcfe of proved natural gas, NGLs and crude oil reserves across approximately
3.4 million
gross acres, including approximately
630,000
gross acres in the Marcellus play, as of
December 31, 2014
. EQT believes that it is a technology leader in extended lateral horizontal and completion drilling in the Appalachian Basin and continues to improve its operations through the use of new technology. EQT Production’s strategy is to maximize shareholder value by maintaining an industry leading cost structure to profitably develop its reserves. EQT’s proved reserves increased
29%
in
2014
, primarily across the Marcellus shale play. The Company’s Marcellus assets, including Upper Devonian assets, contribute approximately
8.7
Tcfe in total proved reserves.
8
The following illustration depicts EQT’s acreage position within the Marcellus play:
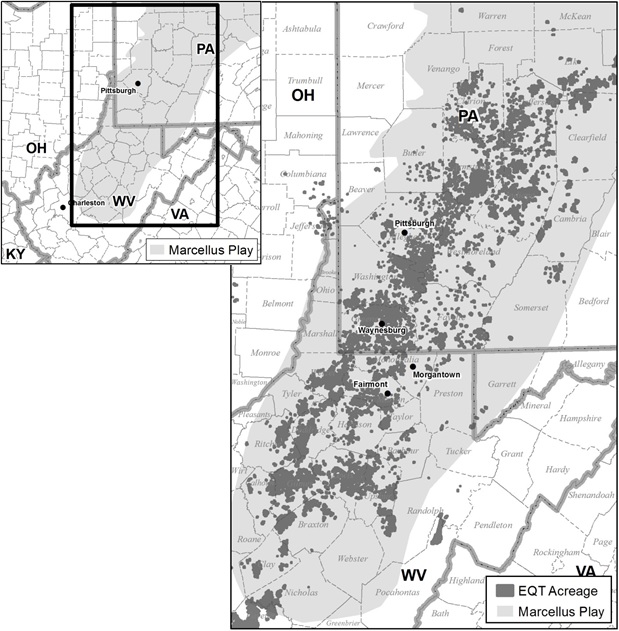
9
As of
December 31, 2014
, the Company’s proved reserves were as follows:
|
(Bcfe)
|
Marcellus
|
Huron (a)
|
Upper
Devonian
|
Other
|
Total
|
||||||||||
|
Proved Developed
|
2,708
|
|
1,203
|
|
155
|
|
760
|
|
4,826
|
|
|||||
|
Proved Undeveloped
|
5,576
|
|
37
|
|
300
|
|
—
|
|
5,913
|
|
|||||
|
Total Proved Reserves
|
8,284
|
|
1,240
|
|
455
|
|
760
|
|
10,739
|
|
|||||
(a) Includes Lower Huron, Cleveland, Berea sandstone and other Devonian age formations.
The Company’s natural gas wells are generally low-risk, having a long reserve life with relatively low development and production costs on a per unit basis. Assuming that future annual production from these reserves is consistent with
2014
, the remaining reserve life of the Company’s total proved reserves, as calculated by dividing total proved reserves by
2014
produced volumes, is
22
years.
The Company invested approximately
$1,717 million
on well development during
2014
, with total production sales volumes hitting a record high of
476.3
Bcfe, an increase of
26%
over the previous year. Capital spending for EQT Production is expected to be approximately
$1.85 billion
in
2015
(excluding land acquisitions), the majority of which will be used to support the drilling of approximately
191
gross wells, including
122
Marcellus wells,
59
Upper Devonian wells and
10
other wells. During the past three years, the Company’s number of wells drilled (spud) and related capital expenditures for well development were:
|
Years Ended December 31,
|
||||||||||||
|
Gross wells spud:
|
2014
|
2013
|
2012
|
|||||||||
|
Horizontal Marcellus*
|
237
|
|
168
|
|
127
|
|
||||||
|
Horizontal Huron
|
103
|
|
50
|
|
7
|
|
||||||
|
Other
|
5
|
|
7
|
|
1
|
|
||||||
|
Total
|
345
|
|
225
|
|
135
|
|
||||||
|
Capital expenditures for well development:
|
||||||||||||
|
(in millions):
|
|
|
|
|
|
|
||||||
|
Horizontal Marcellus*
|
$
|
1,456
|
|
$
|
1,103
|
|
$
|
810
|
|
|||
|
Horizontal Huron
|
188
|
|
79
|
|
22
|
|
||||||
|
Other
|
73
|
|
55
|
|
25
|
|
||||||
|
Total
|
$
|
1,717
|
|
$
|
1,237
|
|
$
|
857
|
|
|||
*
Includes Upper Devonian formations.
10
EQT Midstream Business Segment
The Appalachian Basin has been an area of significant natural gas production growth in recent years. The Company believes that the current footprint of its midstream assets, which spans a wide area of the Marcellus Shale in southwestern Pennsylvania and northern West Virginia, is a competitive advantage that uniquely positions it for growth. In conjunction with the continued growth of EQT Production and other producers in the Marcellus, EQT Midstream is strategically positioned to capitalize on the rapidly increasing need for gathering and transmission infrastructure in the region. In particular, there is a need for midstream header connectivity to interstate pipelines in Pennsylvania and West Virginia.
In
2012
, the Company formed the Partnership to own, operate, acquire and develop midstream assets in the Appalachian Basin. The Partnership provides midstream services to the Company and other third parties through its
two
primary assets: the Partnership’s transmission and storage system and the Partnership’s gathering system. As of December 31,
2014
, the Company held a
34.4%
limited partner interest and a
2%
general partner interest in the Partnership, whose results are consolidated in the Company’s financial statements. Unless otherwise noted, discussions of EQT Midstream’s business, operations and results in this Annual Report on Form 10-K include the Partnership’s business, operations and results. The Company records the noncontrolling interest of the public limited partners in its financial statements.
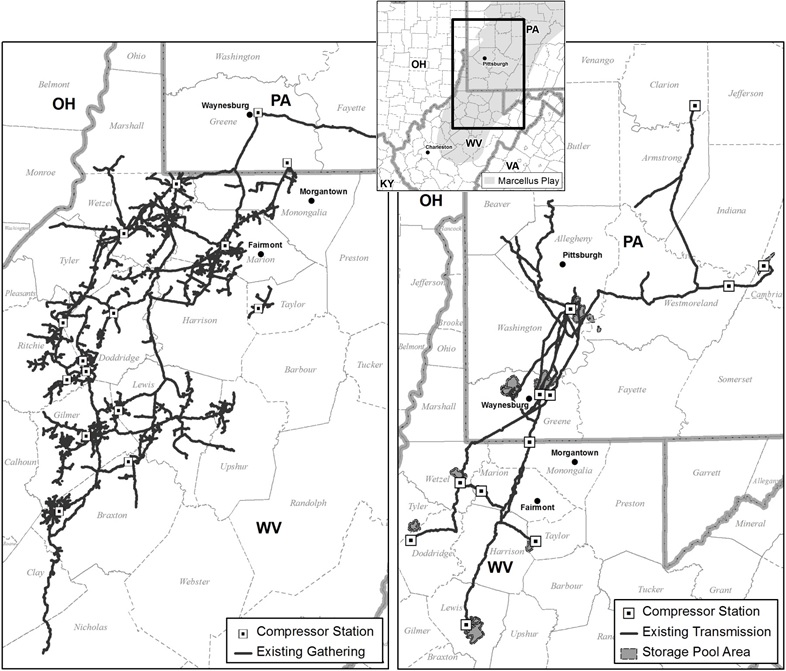
The Company’s gathering system includes approximately
8,200
miles of gathering lines,
1,500
miles of which are FERC-regulated, low-pressure gathering lines owned by the Partnership. The Partnership also owns 45 miles of high pressure gathering lines which are not subject to federal rate regulation. The left-hand map on page 12 depicts the Company’s gathering lines and compressor stations in relationship to the Marcellus Shale formation. During
2014
, the Company turned in-line approximately 60 miles of pipeline and 80,000 horse power of compression capacity primarily in the Marcellus play, which added approximately
475
MMcf per day of incremental gathering capacity, resulting in year-end Marcellus gathering capacity of
1,975
MMcf per day, consisting of
1,405
MMcf per day in Pennsylvania and
570
MMcf per day in West Virginia.
EQT Midstream’s transmission and storage system includes approximately
900
miles of FERC-regulated interstate pipeline that connects to
seven
interstate pipelines and multiple distribution companies. The interstate pipeline system includes approximately
700
miles of pipe owned by Equitrans, L.P. (Equitrans) and is referred to as the Equitrans transmission and storage system. Equitrans is owned by the Partnership. EQT Midstream’s transmission and storage system also includes an approximately
200
-mile pipeline referred to as the Allegheny Valley Connector (AVC), which was acquired by the Company in December 2013 in connection with the Equitable Gas Transaction (as described in Note 2 to the Consolidated Financial Statements).
The transmission and storage system is supported by
eighteen
natural gas storage reservoirs with approximately
660
MMcf per day of peak delivery capability and
47
Bcf of working gas capacity.
Fourteen
of these reservoirs, representing
400
MMcf per day of peak delivery capability and
32
Bcf of working gas capacity, are owned by the Partnership. The storage reservoirs are clustered in
two
geographic areas connected to the Partnership’s transmission and storage system, with
ten
in southwestern Pennsylvania and
eight
in northern West Virginia. The AVC facilities include
four
storage reservoirs owned by the Company and operated by the Partnership under a lease between the Partnership and an affiliate of the Company.
The right-hand map on page 12 depicts the Company’s transmission lines, storage pools and compressor stations in relationship to the Marcellus Shale formation. The Company completed a number of midstream expansion projects in
2014
to take advantage of rapid production development in the Marcellus play. During
2014
, the Company added approximately
750
MMcf per day of incremental transmission capacity, 550 MMcf per day of incremental transmission capacity through the completed Jefferson Compression Expansion project as well as 200 MMcf per day of transmission capacity through several third-party contracts. As a result of these expansion projects, EQT Midstream year-end total transmission capacity was approximately 3,450 MMcf per day.
11
EQT Midstream also has a gas marketing subsidiary, EQT Energy, LLC (EQT Energy), that provides optimization of capacity and storage assets through its NGL and natural gas sales to commercial and industrial customers within its operational footprint. EQT Energy also provides marketing services and manages approximately
1,400,000
Dth per day of third-party contractual pipeline capacity for the benefit of EQT Production; and has committed to an additional
850,000
Dth per day of third-party contractual capacity to come online in future periods. EQT Energy currently leases
3.7
Bcf of storage-related assets from third parties.
12
Strategy
EQT’s strategy is to maximize shareholder value by maintaining an industry leading cost structure, profitably developing its undeveloped reserves, and effectively and efficiently utilizing its extensive gathering and transmission assets that are uniquely positioned across the Marcellus Shale and in close proximity to the northeastern United States markets.
EQT believes that it is a technology leader in extended-lateral horizontal drilling and completion in the Appalachian Basin and continues to improve its operations through the use of new technology. Substantially all of the Company’s acreage is held by production or in fee; therefore, EQT Production is able to develop its acreage in the most economical manner through the use of longer laterals and multi-well pads, as opposed to being required to drill less-economical wells in order to retain acreage. The use of multi-well pads, in conjunction with a completion technique known as reduced cluster spacing, has the additional benefit of reducing the overall environmental surface footprint of the Company’s drilling operations.
EQT also believes that its midstream assets are strategically located in the Marcellus Shale region – spanning a large, prolific area of southwestern Pennsylvania and northern West Virginia – providing a competitive advantage that uniquely positions the Company for continued growth. EQT Midstream intends to capitalize on the rapidly growing need for gathering and transmission infrastructure in this region, and in particular the need for midstream header connectivity to interstate pipelines in Pennsylvania and West Virginia. Additionally, EQT entered into a joint venture agreement with an affiliate of NextEra Energy, Inc. to construct the MVP. The proposed pipeline is expected to be approximately 300 miles long, span from Wetzel County, West Virginia to Pittsylvania County, Virginia and be designed to transport natural gas production from the Marcellus and Utica to the growing demand markets in the southeast region of the United States.
The ongoing efforts of the Partnership are also an important support mechanism for EQT’s overall business strategy. Through pursuing accretive acquisitions from the Company, capitalizing on economically attractive organic growth opportunities, and attracting additional third-party volumes, the Partnership is expected to grow profitably and provide an ongoing source of capital to the Company.
See “Capital Resources and Liquidity” in Item 7, “Management’s Discussion and Analysis of Financial Condition and Results of Operations” of this Annual Report on Form 10-K for details regarding the Company’s capital expenditures.
Markets and Customers
Natural Gas Sales:
The Company’s produced natural gas is sold to marketers, utilities and industrial customers located mainly in the Appalachian Basin and the Northeastern United States as well as the Permian Basin of Texas. The Company’s current transportation portfolio also enables the Company to reach markets along the Gulf Coast of the United States. Natural gas is a commodity and therefore the Company receives market-based pricing. The market price for natural gas in the Appalachian Basin continues to be lower relative to the price at Henry Hub located in Louisiana, which is the location for pricing NYMEX and natural gas futures, as a result of the increased supply of natural gas in the Northeast region. In order to protect cash flow from undue exposure to the risk of changing commodity prices, the Company hedges a portion of its forecasted natural gas production, most of which is hedged at NYMEX natural gas prices. The Company’s hedging strategy and information regarding its derivative instruments is set forth in “Commodity Risk Management” in Item 7, “Management’s Discussion and Analysis of Financial Condition and Results of Operations”, Item 7A, “Quantitative and Qualitative Disclosures About Market Risk,” and in Notes 1 and 5 to the Consolidated Financial Statements.
The Company is also helping to build additional demand for natural gas. In mid-2011, EQT opened a public-access natural gas fueling station in Pittsburgh, Pennsylvania and, with the growing demand for compressed natural gas for numerous fleets throughout the region, the station underwent an expansion in 2013, adding two more dispensers. In conjunction with this project, the Company is promoting the use of natural gas with its own fleet vehicles and plans to operate 14% of its light-duty vehicle fleet, more than 180 vehicles, on natural gas by the end of 2015. In addition, the Company is operating four drilling rigs that utilize natural gas with three additional expected in 2015 and one hydraulic fracturing crew with one additional crew expected in 2015.
NGL Sales:
The Company sells NGLs from its own production through the EQT Production segment and from gas marketed for third parties by EQT Midstream. In its Appalachian operations, the Company contracts with MarkWest Energy Partners, L.P. (MarkWest) to process natural gas in order to extract heavier liquid hydrocarbons (propane, iso-butane, normal butane and natural gasoline) from the natural gas stream, primarily from EQT Production’s produced gas. NGLs are recovered at the processing plants and transported to a fractionation plant owned by MarkWest for separation into commercial components. MarkWest markets these components for a fee. The Company also has contractual processing arrangements in its Permian Basin operations whereby the Company sells gas to third-party processors at a weighted average liquids component price.
13
The following table presents the average sales price on an average per Mcfe basis to EQT Corporation for sales of produced natural gas, NGLs and oil, with and without cash settled derivatives, for the years ended December 31:
|
|
2014
|
2013
|
2012
|
|||||||||
|
Average sales price per Mcfe sold (excluding cash settled derivatives)
|
$
|
4.14
|
|
$
|
3.81
|
|
$
|
3.06
|
|
|||
|
Average sales price per Mcfe sold (including cash settled derivatives)
|
$
|
4.16
|
|
$
|
4.20
|
|
$
|
4.19
|
|
|||
In addition, price information for all products is included in Item 7, “Management’s Discussion and Analysis of Financial Condition and Results of Operations,” under the caption “Consolidated Operational Data,” and incorporated herein by reference.
Natural Gas Gathering:
EQT Midstream derives gathering revenues from charges to customers for use of its gathering system in the Appalachian Basin. The gathering system volumes are transported to four major interstate pipelines: Columbia Gas Transmission, East Tennessee Natural Gas Company, Dominion Transmission and Tennessee Gas Pipeline Company. The gathering system also maintains interconnections with the Partnership’s transmission and storage system.
Gathering system transportation volumes for
2014
totaled
590.5
TBtu, of which approximately
90%
related to gathering for EQT Production and other affiliates. Revenues from EQT Production and other affiliates accounted for approximately
91%
of
2014
gathering revenues.
Natural Gas Transmission, Storage and Marketing:
Natural gas transmission and storage operations are executed using transmission and underground storage facilities owned by the Company. EQT Energy provides marketing services and third-party contractual pipeline capacity management for the benefit of EQT Production and also leases storage capacity in order to take advantage of seasonal spreads where available through the EQT Midstream segment. EQT Energy also engages in risk management and hedging activities on behalf of EQT Production, the objective of which is to limit the Company’s exposure to shifts in market prices.
Customers of EQT Midstream’s gas transportation and storage services are affiliates and third parties primarily in the northeastern United States.
As of
December 31, 2014
, the weighted average remaining contract life based on total projected contracted revenues for the Partnership’s firm transmission and storage contracts was approximately
17
years. The Company anticipates that the capacity associated with expiring contracts will be remarketed or used by affiliates such that the capacity will remain fully subscribed. In
2014
, approximately
57%
of transportation volumes and 51% of transportation revenues were from affiliates.
One
customer within the EQT Production segment accounts for approximately
12%
and
11%
of EQT Production’s total operating revenues in
2014
and
2013
, respectively. The Company does not believe that the loss of this customer would have a material adverse effect on its business because alternative customers for the Company’s natural gas are available.
No
single customer accounted for more than
10%
of revenues in
2012
.
Competition
Natural gas producers compete in the acquisition of properties, the search for and development of reserves, the production, transportation and sale of natural gas and the securing of labor and equipment required to conduct operations. Competitors include independent oil and gas companies, major oil and gas companies and individual producers and operators. Competition for natural gas gathering, transmission and storage volumes is primarily based on rates and other commercial terms, customer commitment levels, timing, performance, reliability, service levels, location, reputation and fuel efficiencies. Key competitors in the natural gas transmission and storage market include companies that own major natural gas pipelines. Key competitors for gathering systems include independent gas gatherers and integrated energy companies. EQT competes with numerous companies when marketing natural gas and NGLs. Some of these competitors are affiliates of companies with extensive pipeline systems that are used for transportation from producers to end-users.
14
Regulation
Regulation of the Company’s Operations
EQT Production’s exploration and production operations are subject to various types of federal, state and local laws and regulations, including regulations related to the location of wells; the method of drilling, well construction, well stimulation, hydraulic fracturing and casing design; water withdrawal and procurement for well stimulation purposes; well production; spill prevention plans; the use, transportation, storage and disposal of fluids and materials incidental to oil and gas operations; surface usage and the reclamation of properties upon which wells or other facilities have been located; the plugging and abandoning of wells; the calculation, reporting and disbursement of royalties and taxes; and the gathering of production in certain circumstances. These regulations may affect the costs and timing of developing the Company’s natural gas resources.
EQT Production’s operations are also subject to conservation and correlative rights regulations, including the regulation of the size of drilling and spacing units or field rule units; the number of wells that may be drilled in a unit or in close proximity to other wells; drilling in the vicinity of coal mining operations and certain other structures; and the unitization or pooling of natural gas properties. Kentucky, Ohio, Virginia and, for Utica or other deep wells, West Virginia allow the statutory pooling or integration of tracts to facilitate development and exploration. In West Virginia, the Company must rely on voluntary pooling of lands and leases for Marcellus and Upper Devonian acreage. In 2013, the Pennsylvania legislature enacted lease integration legislation, which authorizes joint development of existing contiguous leases, and Texas permits similar joint development. In addition, state conservation and oil and gas laws generally limit the venting or flaring of natural gas, and Texas sets production allowances on the amount of annual production permitted from a well.
EQT Midstream’s transmission and gathering operations are subject to various types of federal and state environmental laws and local zoning ordinances, including air permitting requirements for compressor station and dehydration units; erosion and sediment control requirements for compressor station and pipeline construction projects; waste management requirements and spill prevention plans for compressor stations; various recordkeeping and reporting requirements for air permits and waste management practices; compliance with safety regulations; and siting and noise regulations for compressor stations. These regulations may increase the costs of operating existing pipelines and compressor stations and increase the costs of, and the time to develop, new or expanded pipelines and compressor stations.
The interstate natural gas transmission systems and storage operations of EQT Midstream are regulated by the FERC, and certain gathering lines are also subject to rate regulation by the FERC. For instance, the FERC approves tariffs that establish the Partnership’s rates, cost recovery mechanisms and other terms and conditions of service to the Partnership’s customers. The fees or rates established under the Partnership’s tariffs are a function of its costs of providing services to customers, including a reasonable return on invested capital. The FERC’s authority over transmission operations also extends to: storage and related services; certification and construction of new interstate transmission and storage facilities; extension or abandonment of interstate transmission and storage services and facilities; maintenance of accounts and records; relationships between pipelines and certain affiliates; terms and conditions of service; depreciation and amortization policies; acquisition and disposition of facilities; the safety of pipelines; and initiation and discontinuation of services.
In 2010, the U.S. Congress adopted comprehensive financial reform legislation that establishes federal oversight and regulation of the over-the-counter derivative market and entities, such as the Company, that participate in that market. The legislation, known as the Dodd-Frank Wall Street Reform and Consumer Protection Act (the Dodd-Frank Act), required the CFTC, the SEC and other regulatory agencies to promulgate rules and regulations implementing this legislation. As of the filing date of this Annual Report, the CFTC had adopted and implemented many final rules that impose regulatory obligations on all market participants, including the Company, such as recordkeeping and certain reporting obligations. Other CFTC rules that may be relevant to the Company have yet to be finalized. Because significant CFTC rules relevant to natural gas hedging activities are still at the proposal stage, it is not possible at this time to predict the extent of the impact of the regulations on the Company’s hedging program or regulatory compliance obligations. The Company has experienced increased, and expects additional, compliance costs and changes to current market practices as participants continue to adapt to a changing regulatory environment.
Regulators periodically review or audit the Company’s compliance with applicable regulatory requirements. The Company anticipates that compliance with existing laws and regulations governing current operations will not have a material adverse effect upon its capital expenditures, earnings or competitive position. Additional proposals that affect the oil and gas industry are regularly considered by the U.S. Congress, the states, regulatory agencies and the courts. The Company cannot predict when or whether any such proposals may become effective.
15
Environmental, Health and Safety Regulation
The business operations of the Company are also subject to various federal, state and local environmental, health and safety laws and regulations pertaining to, among other things, the release, emission or discharge of materials into the environment; the generation, storage, transportation, handling and disposal of materials (including solid and hazardous wastes); the safety of employees and the general public; pollution; site remediation; and preservation or protection of human health and safety, natural resources, wildlife and the environment. The Company must take into account environmental, health and safety regulations in, among other things, planning, designing, constructing (including drilling), operating and abandoning wells, pipelines and related facilities.
The Company has established procedures for ongoing evaluation of its operations to identify potential environmental exposures and to assure compliance with regulatory policies and procedures. Ongoing expenditures for compliance with environmental laws and regulations, including investments in plant and facilities to meet environmental requirements, have not been material to the Company’s financial position, results of operations or liquidity.
Vast quantities of natural gas deposits exist in shale and other formations. It is customary in the Company’s industry to recover natural gas from these shale formations through the use of hydraulic fracturing, combined with sophisticated horizontal drilling. Hydraulic fracturing is the process of creating or expanding cracks, or fractures, in formations underground where water, sand and other additives are pumped under high pressure into a shale gas formation. These deeper formations are geologically separated and isolated from fresh ground water supplies by overlying rock layers. The Company’s well construction practices include installation of multiple layers of protective steel casing surrounded by cement that are specifically designed and installed to protect freshwater aquifers. To assess water sources near our drilling locations, the Company conducts baseline and, as appropriate, post-drilling water testing at all water wells within at least
2,500
feet of our drilling pads. Legislative and regulatory efforts at the federal level and in some states have sought to render more stringent permitting and compliance requirements for hydraulic fracturing. If passed into law, the additional permitting requirements for hydraulic fracturing may increase the cost to or limit the Company’s ability to obtain permits to construct wells.
See Note 18 to the Consolidated Financial Statements for a description of expenditures related to environmental matters.
Climate Change
Legislative and regulatory measures to address climate change and greenhouse gas emissions are in various phases of discussion or implementation. The EPA and various states have issued a number of proposed and final laws and regulations that limit greenhouse gas emissions. Legislation or regulation that restricts carbon emissions could increase the Company’s cost of environmental compliance by requiring the Company to install new equipment to reduce emissions from larger facilities and/or purchase emission allowances. Climate change and greenhouse gas legislation or regulation could also delay or otherwise negatively affect efforts to obtain permits and other regulatory approvals with regard to existing and new facilities, or impose additional monitoring and reporting requirements. Conversely, legislation or regulation that sets a price on or otherwise restricts carbon emissions could also benefit the Company by increasing demand for natural gas, because the combustion of natural gas results in substantially fewer carbon emissions per Btu of heat generated than other fossil fuels, such as coal. The effect on the Company of any new legislative or regulatory measures will depend on the particular provisions that are ultimately adopted.
Employees
The Company and its subsidiaries had
1,750
employees at the end of
2014
, and
none
are subject to a collective bargaining agreement.
16
Availability of Reports
The Company makes certain filings with the SEC, including its annual report on Form 10-K, quarterly reports on Form 10-Q, current reports on Form 8-K and all amendments and exhibits to those reports, available free of charge through its website, http://www.eqt.com, as soon as reasonably practicable after the date they are filed with, or furnished to, the SEC. The filings are also available at the SEC’s Public Reference Room at 100 F Street, N.E., Washington, D.C. 20549 or by calling 1-800-SEC-0330. These filings are also available on the internet at http://www.sec.gov.
Composition of Segment Operating Revenues
Presented below are operating revenues as a percentage of total operating revenues for each class of products and services representing greater than
10%
of total operating revenues.
|
|
For the Years Ended
December 31,
|
|||||
|
|
2014
|
2013
|
2012
|
|||
|
EQT Production:
|
|
|
|
|||
|
Natural gas sales
|
66%
|
61%
|
55%
|
|||
|
EQT Midstream:
|
|
|
||||
|
Gathering revenue
|
15%
|
18%
|
20%
|
|||
|
Regulated storage and transmission
|
11%
|
9%
|
9%
|
|||
Financial Information about Segments
See Note 4 to the Consolidated Financial Statements for financial information by business segment including, but not limited to, revenues from external customers, operating income and total assets.
Jurisdiction and Year of Formation
The Company is a Pennsylvania corporation formed in 2008 in connection with a holding company reorganization of the former Equitable Resources, Inc.
Financial Information about Geographic Areas
Substantially all of the Company’s assets and operations are located in the continental United States.
17
Risks Relating to Our Business
In addition to the other information contained in this Form 10-K, the following risk factors should be considered in evaluating our business and future prospects. Please note that additional risks not presently known to us or that are currently considered immaterial may also have a negative impact on our business and operations. If any of the events or circumstances described below actually occur, our business, financial condition or results of operations could suffer and the trading price of our common stock could decline.
Natural gas, NGL and oil price volatility may have an adverse effect upon our revenue, profitability, future rate of growth and liquidity.
Our revenue, profitability, future rate of growth and liquidity depend upon the price for natural gas, NGLs and oil. The markets for natural gas, NGLs and oil are volatile and fluctuations in prices will affect our financial results. The price of natural gas, NGLs and oil are affected by a number of factors beyond our control, which include: weather conditions and seasonal trends; the supply of and demand for natural gas, NGLs and oil; regional basis differentials; national and worldwide economic and political conditions; the price and availability of alternative fuels; the availability, proximity and capacity of pipelines, other transportation facilities, and gathering, processing and storage facilities; and government regulations, such as regulation of natural gas transportation and price controls.
Lower natural gas, NGL and oil prices may result in decreases in the revenue, operating income and cash flow for each of our businesses, a reduction in drilling activity and the construction of new transportation capacity, as well as downward adjustments to the value of our oil and gas properties which may cause us to incur non-cash charges to earnings. Moreover, a failure to control our development costs during periods of lower natural gas, NGL and oil prices could have significant adverse effects on our earnings, cash flows and financial position. A reduction in operating income or cash flow will reduce our funds available for capital expenditures and, correspondingly, our opportunities for profitable growth. We are also exposed to the risk of non-performance by our hedge counterparties in the event that changes, positive or negative, in natural gas prices result in derivative contracts with a positive fair value. If commodity prices continue to trend lower as they did in the latter part of 2014, it could signal a need to reduce capital spending, be an indicator of impairment of the Company’s assets, and have a substantial impact on, among other things, the Company’s revenues, earnings, liquidity, reserves, DD&A rates and development plans.
Increases in natural gas, NGL and oil prices may be accompanied by or result in increased well drilling costs, increased production taxes, increased lease operating expenses, increased volatility in seasonal gas price spreads for our storage assets and increased end-user conservation or conversion to alternative fuels. Significant natural gas price increases may subject us to margin calls on our commodity price derivative contracts (hedging arrangements, including futures contracts, swap, collar and option agreements and exchange-traded instruments) which would potentially require us to post significant amounts of cash collateral with our hedge counterparties. The cash collateral, which is interest-bearing, provided to our hedge counterparties, is returned to us in whole or in part upon a reduction in forward market prices, depending on the amount of such reduction, or in whole upon settlement of the related derivative contract. In addition, to the extent we have hedged our current production at prices below the current market price, we are unable to benefit fully from an increase in the price of natural gas.
We are subject to risks associated with the operation of our wells, pipelines and facilities.
Our business operations are subject to all of the inherent hazards and risks normally incidental to the production, transportation and storage of natural gas and NGLs, such as well site blowouts, cratering and explosions, pipe and other equipment and system failures, uncontrolled flows of natural gas or well fluids, fires, formations with abnormal pressures, pollution and environmental risks and natural disasters. We also face various threats to the security of our or third parties’ facilities and infrastructure, such as processing plants and pipelines. These risks could result in substantial losses due to personal injury and/or loss of life, severe damage to and destruction of property and equipment, pollution or other environmental damage, disruptions to our operations and loss of sensitive confidential information. Moreover, in the event that one or more of these hazards occur, there can be no assurance that a response will be adequate to limit or reduce damage. As a result of these risks, we are also sometimes a defendant in legal proceedings and litigation arising in the ordinary course of business. There can be no assurance that the insurance policies we maintain to limit our liability for such losses will be adequate to protect us from all material expenses related to potential future claims for personal injury and property damage or that such levels of insurance will be available in the future at economical prices or to cover all risks.
18
Cyber incidents may adversely impact our operations.
Our business has become increasingly dependent upon digital technologies, including information systems, infrastructure and cloud applications, to operate our production and midstream businesses, and the maintenance of our financial and other records has long been dependent upon such technologies. The U.S. government has issued public warnings that indicate that energy assets might be specific targets of cyber security threats. Deliberate attacks on, or unintentional events affecting, our systems or infrastructure, the systems or infrastructure of third parties or the cloud could lead to corruption or loss of our proprietary data and potentially sensitive data, delays in production or delivery of natural gas and NGLs, difficulty in completing and settling transactions, challenges in maintaining our books and records, communication interruptions, environmental damage, personal injury, property damage, other operational disruptions and third-party liability. Further, as cyber incidents continue to evolve, we may be required to expend additional resources to continue to modify or enhance our protective measures or to investigate and remediate any vulnerability to cyber incidents.
Our failure to develop, obtain, access or maintain the necessary infrastructure to successfully deliver gas, NGLs and oil to market may adversely affect our earnings, cash flows and results of operations.
Our delivery of gas, NGLs and oil depends upon the availability, proximity and capacity of pipelines, other transportation facilities and gathering and processing facilities. The capacity of transportation, gathering and processing facilities may be insufficient to accommodate potential production from existing and new wells. Competition for pipeline infrastructure within the region is intense, and many of our competitors have substantially greater financial resources than we do, which could affect our competitive position. The Company’s investment in midstream infrastructure is intended to address a lack of capacity on, and access to, existing gathering and transportation pipelines as well as curtailments on such pipelines. Our infrastructure development and maintenance programs can involve significant risks, including those related to timing, cost overruns and operational efficiency, and these risks can be affected by the availability of capital, materials and qualified contractors and work force, as well as weather conditions, gas, NGL and oil price volatility, government approvals, title and property access problems, geology, compliance by third parties with their contractual obligations to us and other factors. Moreover, if our infrastructure development and maintenance programs are not successfully developed on time and within budget, we may not be able to profitably fulfill our contractual obligations to third parties, including joint venture partners.
We also deliver to and are served by third-party natural gas, NGL and oil transportation, gathering, processing and storage facilities which are limited in number, geographically concentrated and subject to the same risks identified above with respect to our infrastructure development and maintenance programs. Because we do not own these third-party pipelines or facilities, their continuing operation is not within our control. An extended interruption of access to or service from our or third-party pipelines and facilities for any reason, including cyber-attacks on such pipelines and facilities, could result in adverse consequences to us, such as delays in producing and selling our natural gas, NGLs and oil. In such an event, we might have to shut in our wells awaiting a pipeline connection or capacity and/or sell our production at prices lower than market prices or at prices lower than we currently project. In addition, some of our third-party contracts may involve significant long-term financial commitments on our part. Moreover, our usage of third parties for transportation, gathering and processing services subjects us to the credit and performance risk of such third parties and may make us dependent upon those third parties to get our produced natural gas, NGLs and oil to market.
Also, our producing properties and operations are primarily in the Appalachian Basin, making us vulnerable to risks associated with operating in limited geographic areas. As a result, we may be disproportionately exposed to the impact of delays or interruptions of production caused by transportation capacity constraints, curtailment of production, availability of equipment, facilities, personnel or services, significant governmental regulation, natural disasters, adverse weather conditions, plant closures for scheduled maintenance or interruption of transportation of gas and NGLs produced from this area.
Strategic determinations, including the allocation of capital and other resources to strategic opportunities, are challenging, and our failure to appropriately allocate capital and resources among our strategic opportunities may adversely affect our financial condition and reduce our future growth rate.
Our future growth prospects are dependent upon our ability to identify optimal strategies for our business. In developing our 2015 business plan, we considered allocating capital and other resources to various aspects of our businesses, including well development (primarily drilling), reserve acquisitions, exploratory activities, midstream infrastructure, corporate items and other alternatives. We also considered our likely sources of capital and evaluated opportunities outside of the Appalachian Basin. Notwithstanding the determinations made in the development of our 2015 plan, business opportunities not previously identified periodically come to our attention, including possible acquisitions and dispositions. If we fail to identify optimal business strategies, including the appropriate rate of reserve development, or fail to optimize our capital investment and capital raising opportunities and the use of our other resources in furtherance of our business strategies, our financial condition and growth rate may be adversely
19
affected. Moreover, economic or other circumstances may change from those contemplated by our 2015 plan, and our failure to recognize or respond to those changes may limit our ability to achieve our objectives.
We periodically engage in acquisitions, dispositions and other strategic transactions, including joint ventures. These transactions involve various inherent risks, such as our ability to obtain the necessary regulatory approvals; the timing of and conditions imposed upon us by regulators in connection with such approvals; and our ability to achieve benefits anticipated to result from the transactions. In addition, various factors including prevailing market conditions could negatively impact the benefits we receive from transactions. Joint venture arrangements may restrict our operational and corporate flexibility. Moreover, joint venture arrangements involve various risks and uncertainties, such as committing us to fund operating and/or capital expenditures, the timing and amount of which we may have little control over, and our joint venture partners may not satisfy their obligations to the joint venture. Our inability to complete a transaction or to achieve our strategic or financial goals in any transaction could have significant adverse effects on our earnings, cash flows and financial position.
Our need to comply with comprehensive, complex and sometimes unpredictable government regulations may increase our costs and limit our revenue growth, which may result in reduced earnings.
Our operations are regulated extensively at the federal, state and local levels. Laws, regulations and other legal requirements have increased the cost to plan, design, drill, install, operate and abandon wells, gathering and transmission systems and pipelines. Environmental, health and safety legal requirements govern discharges of substances into the air and water; the management and disposal of hazardous substances and wastes; the clean-up of contaminated sites; groundwater quality and availability; plant and wildlife protection; locations available for drilling and pipeline construction; environmental impact studies and assessments prior to permitting; restoration of drilling properties after drilling is completed; pipeline safety (including replacement requirements); and work practices related to employee health and safety. Compliance with the laws, regulations and other legal requirements applicable to our businesses may increase our cost of doing business or result in delays due to the need to obtain additional or more detailed governmental approvals and permits. These requirements could also subject us to claims for personal injuries, property damage and other damages. Our failure to comply with the laws, regulations and other legal requirements applicable to our businesses, even if as a result of factors beyond our control, could result in the suspension or termination of our operations and subject us to administrative, civil and criminal penalties and damages.
The rates charged to customers by our gathering, transportation and storage businesses are, in many cases, subject to federal regulation by the FERC, which may prohibit us from realizing a level of return which we believe is appropriate. These restrictions may take the form of imputed revenue credits, cost disallowances and/or expense deferrals.
Laws, regulations and other legal requirements are constantly changing, and implementation of compliant processes in response to such changes could be costly and time consuming. In addition to periodic changes to air, water and waste laws, as well as recent EPA initiatives to impose climate change-based air regulations on the industry, the U.S. Congress and various states have been evaluating climate-related legislation and other regulatory initiatives that would further restrict emissions of greenhouse gases, including methane (a primary component of natural gas) and carbon dioxide (a byproduct of burning natural gas). Such restrictions may result in additional compliance obligations with respect to, or taxes on the release, capture and use of, greenhouse gases that could have an adverse effect on our operations.
Another area of potential regulation is hydraulic fracturing, which we utilize to complete most of our natural gas wells. Certain environmental and other groups have suggested that additional laws and regulations may be needed to more closely regulate the hydraulic fracturing process, and legislation or regulation has been proposed or is under discussion at federal, state, and local levels. For instance, legislation or regulation banning hydraulic fracturing has been adopted in a number of jurisdictions in which we do not have drilling operations. We cannot predict whether any other such federal, state or local legislation or regulation will be enacted and, if enacted, how it may affect our operations, but enactment of additional laws or regulations could increase our operating costs.
Recent discussions regarding the federal budget have included proposals which could potentially increase and accelerate the payment of federal and collaterally state income taxes of independent producers with the potential repeal of the ability to expense intangible drilling costs having the most significant potential future impact to us. These changes, if enacted, will make it more costly for us to explore for and develop our natural gas resources.
The rates of federal, state and local taxes applicable to the industries in which we operate, including production taxes paid by EQT Production, which often fluctuate, could be increased by the various taxing authorities. In addition, the tax laws, rules and regulations that affect our business, such as the imposition of a new severance tax (a tax on the extraction of natural resources) in states in which we produce gas, could change. Any such increase or change could adversely impact our earnings, cash flows and financial position.
20
In 2010, the U.S. Congress adopted comprehensive financial reform legislation that establishes federal oversight and regulation of the over-the-counter derivative market and entities, such as the Company, that participate in that market. The legislation, known as the Dodd-Frank Act, required the CFTC, the SEC and other regulatory agencies to promulgate rules and regulations implementing the legislation. As of the filing date of this Annual Report, the CFTC had adopted and implemented many final rules that impose regulatory obligations on all market participants, including the Company, such as recordkeeping and certain reporting obligations. Other rules that may be relevant to the Company or its counterparties have yet to be finalized. Because significant rules relevant to natural gas hedging activities are still at the proposal stage, it is not possible at this time to predict the extent of the impact of the regulations on the Company’s hedging program, including available counterparties, or regulatory compliance obligations. The Company has experienced increased, and anticipates additional, compliance costs and changes to current market practices as participants continue to adapt to a changing regulatory environment.
We have substantial capital requirements, and we may not be able to obtain needed financing on satisfactory terms, if at all.
We rely upon access to both short-term bank and money markets and longer-term capital markets as sources of liquidity for any capital requirements not satisfied by the cash flows from operations or other sources. Future challenges in the global financial system, including access to capital markets and changes in the terms of and cost of capital, including increases in interest rates, may adversely affect our business and our financial condition. Our ability to access the capital markets may be restricted at a time when we desire, or need, to raise capital, which could have an impact on our flexibility to react to changing economic and business conditions. Adverse economic and market conditions could adversely affect the collectability of our trade receivables and cause our commodity hedging counterparties to be unable to perform their obligations or to seek bankruptcy protection. Future challenges in the economy could also lead to reduced demand for natural gas, NGLs and oil which could have a negative impact on our revenues and our credit ratings.
Any downgrade of our credit ratings may increase the cost of borrowing or adversely affect our ability to raise capital through the issuance of debt or equity securities or other borrowing arrangements, which could adversely affect our business, results of operations and liquidity. We cannot be sure that our current ratings will remain in effect for any given period of time or that our rating will not be lowered or withdrawn entirely by a rating agency. An increase in the level of our indebtedness in the future may result in a downgrade in the ratings that are assigned to our debt. Any downgrade in our ratings could result in an increase in our borrowing costs, which would diminish our financial results.
Our failure to assess production opportunities based on market conditions could negatively impact our long-term growth prospects for our production business.
Our goal of sustaining long-term growth for our production business is contingent upon our ability to identify production opportunities based on market conditions. Our decision to drill a well is subject to a number of factors which may alter our drilling schedule or our plans to drill at all. We may have difficulty drilling all of the wells before the lease term expires which could result in the loss of certain leasehold rights, or we could drill wells in locations where we do not have the necessary infrastructure to deliver the natural gas, NGLs and oil to market. Moreover, an incorrect determination of legal title to our wells could result in liability to the owner of the natural gas or oil rights and an impairment to our assets. Successfully identifying production opportunities involves a high degree of business experience, knowledge and careful evaluation of potential opportunities, along with subjective judgments and assumptions that may prove to be incorrect. In addition, any exploration projects increase the risks inherent in our production activities. Specifically, seismic data is subject to interpretation and may not accurately identify the presence of natural gas or other hydrocarbons, which could adversely affect the results of our operations. Because we have a limited operating history in certain areas, our future operating results may be difficult to forecast, and our failure to sustain high growth rates in the future could adversely affect the market price of our common stock.
The amount and timing of actual future gas, NGL and oil production is difficult to predict and may vary significantly from our estimates, which may reduce our earnings.
Our future success depends upon our ability to develop additional gas reserves that are economically recoverable and to optimize existing well production, and our failure to do so may reduce our earnings. Our drilling and subsequent maintenance of wells can involve significant risks, including those related to timing, cost overruns and operational efficiency, and these risks can be affected by the availability of capital, leases, rigs, equipment, a qualified work force, and adequate capacity for the treatment and recycling or disposal of waste water generated in our operations, as well as weather conditions, natural gas, NGL and oil price volatility, government approvals, title and property access problems, geology, equipment failure or accidents and other factors. Drilling for natural gas, NGLs and oil can be unprofitable, not only from dry wells, but from productive wells that do not produce sufficient revenues to return a profit. Additionally, a failure to effectively and efficiently operate existing wells may cause production volumes to fall short of our projections. Without continued successful development or acquisition activities, together
21
with effective operation of existing wells, our reserves and revenues will decline as a result of our current reserves being depleted by production.
We also rely on third parties for certain construction, drilling and completion services, materials and supplies. Delays or failures to perform by such third parties could adversely impact our earnings, cash flows and financial position.
The loss of key personnel could adversely affect our ability to execute our strategic, operational and financial plans.
Our operations are dependent upon key management and technical personnel, and one or more of these individuals could leave our employment. The unexpected loss of the services of one or more of these individuals could have a detrimental effect on us. In addition, the success of our operations will depend, in part, on our ability to attract, develop and retain experienced personnel. There is competition within our industry for experienced technical personnel and certain other professionals, which could increase the costs associated with attracting and retaining such personnel. If we cannot attract, develop and retain our technical and professional personnel or attract additional experienced technical and professional personnel, our ability to compete could be harmed.
Negative public perception regarding us and/or our industry could have an adverse effect on our operations.
Negative public perception regarding us and/or our industry resulting from, among other things, oil spills, the explosion of natural gas transmission lines and concerns raised by advocacy groups about hydraulic fracturing, may lead to increased regulatory scrutiny which may, in turn, lead to new local, state and federal safety and environmental laws, regulations, guidelines and enforcement interpretations. These actions may cause operational delays or restrictions, increased operating costs, additional regulatory burdens and increased risk of litigation. Moreover, governmental authorities exercise considerable discretion in the timing and scope of permit issuance and the public may engage in the permitting process, including through intervention in the courts. Negative public perception could cause the permits we need to conduct our operations to be withheld, delayed or burdened by requirements that restrict our ability to profitably conduct our business.
The standardized measure of discounted future net cash flows from our proved reserves will not be the same as the current market value of our estimated natural gas and oil reserves.
You should not assume that the standardized measure of discounted future net cash flows from our proved reserves is the current market value of our estimated natural gas and oil reserves. In accordance with SEC requirements, we based the discounted future net cash flows from our proved reserves on the twelve month unweighted arithmetic average of the first-day-of-the-month price for the preceding twelve months without giving effect to derivative transactions. Actual future net cash flows from our properties will be affected by factors such as the actual prices we receive for natural gas, NGLs and oil and the amount, timing and cost of actual production. In addition, the 10% discount factor we use when calculating standardized measure may not be the most appropriate discount factor based on interest rates in effect from time to time and risks associated with us or the natural gas, NGL and oil industry in general.
Our proved reserves are estimates that are based upon many assumptions that may prove to be inaccurate. Any significant change in these underlying assumptions will greatly affect the quantities and present value of our reserves.
Reserve engineering is a subjective process involving estimates of underground accumulations of natural gas, NGLs and oil and assumptions concerning future prices, production levels and operating and development costs. These estimates and assumptions are inherently imprecise. As a result, estimated quantities of proved reserves and projections of future production rates and the timing of development expenditures may prove to be inaccurate. Any significant variance from our assumptions could greatly affect our estimates of reserves, the economically recoverable quantities of natural gas, NGLs and oil, the classifications of reserves based on risk of recovery and estimates of the future net cash flows. Numerous changes over time to the assumptions on which our reserve estimates are based, as described above, often result in the actual quantities of natural gas, NGLs and oil we ultimately recover being different from our reserve estimates.
See Item 7A, “Quantitative and Qualitative Disclosures About Market Risk,” for further discussion regarding the Company’s exposure to market risks, including the risks associated with our use of derivative contracts to hedge commodity prices.
22
Item 1B.
Unresolved Staff Comments
None.
Item 2.
Properties
Principal facilities are owned or, in the case of certain office locations, warehouse buildings and equipment, leased, by the Company’s business segments. The majority of the Company’s properties are located on or under (i) private properties owned in fee, held by lease or occupied under perpetual easements or other rights acquired for the most part without warranty of underlying land titles or (ii) public highways under franchises or permits from various governmental authorities. The Company’s facilities are generally well maintained and, where appropriate, are replaced or expanded to meet operating requirements.
EQT Production:
EQT Production’s properties are located primarily in Pennsylvania, West Virginia, Ohio, Kentucky and Texas. This segment has approximately
3.4 million
gross acres (approximately
64%
of which are considered undeveloped), which encompass substantially all of the Company’s acreage of proved developed and undeveloped natural gas and oil producing properties. Approximately
630,000
of these gross acres are located in the Marcellus play. Although most of its wells are drilled to relatively shallow depths (
2,000
to
8,000
feet below the surface), the Company retains what are normally considered “deep rights” on the majority of its acreage. As of
December 31, 2014
, the Company estimated its total proved reserves to be
10.7
Tcfe, consisting of proved developed producing reserves of
4.7
Tcfe, proved developed non-producing reserves of
0.1
Tcfe and proved undeveloped reserves of
5.9
Tcfe. Substantially all of the Company’s reserves reside in continuous accumulations.
The Company’s estimate of proved natural gas, NGL and oil reserves is prepared by Company engineers. The engineer primarily responsible for preparing the reserve report and the technical aspects of the reserves audit received a bachelor’s degree in Chemical Engineering from the Pennsylvania State University and has
17
years of experience in the oil and gas industry. To ensure that the reserves are materially accurate, management reviews the price, heat content conversion rate and cost assumptions used in the economic model to determine the reserves. Additionally, division of interest and production volumes are reconciled between the system used to calculate the reserves and other accounting/measurement systems, and the reserve reconciliation between prior year reserves and current year reserves is reviewed by senior management.
The Company’s estimate of proved natural gas, NGL and oil reserves is audited by the independent consulting firm of Ryder Scott Company, L.P. (Ryder Scott), which is hired by the Company’s management. Since 1937, Ryder Scott has evaluated oil and gas properties and independently certified petroleum reserves quantities in the United States and internationally. Ryder Scott reviewed
100%
of the total net natural gas, NGL and oil proved reserves attributable to the Company’s interests as of
December 31, 2014
. Ryder Scott conducted a detailed, well by well, audit of the Company’s largest properties. This audit covered
80%
of the Company’s proved developed reserves. Ryder Scott’s audit of the remaining
20%
of the Company’s proved developed properties consisted of an audit of aggregated groups not exceeding
200
wells per case for operated wells and 230 wells per case for non-operated wells. For undeveloped locations, Ryder Scott determined which areas within the Company’s acreage were to be considered proven. Reserves were assigned and projected by the Company’s reserves engineers for locations within these proven areas and approved by Ryder Scott based on analogous type curves and offset production information. Ryder Scott’s audit report has been filed herewith as Exhibit 99.
No
report has been filed with any federal authority or agency reflecting a
5%
or more difference from the Company’s estimated total reserves. Additional information relating to the Company’s estimates of natural gas, NGL and crude oil reserves and future net cash flows is provided in Note 21 (unaudited) to the Consolidated Financial Statements.
In
2014
, the Company commenced drilling operations (spud or drilled) on
237
gross horizontal wells with an aggregate of approximately
1.4 million
feet of pay in the Marcellus, including Upper Devonian, play. Total proved reserves in the Marcellus, including Upper Devonian, play increased
42%
to
8.7
Tcfe in
2014
primarily as a result of the Company’s 2014 and 2013 drilling programs. In the Huron play, the Company spud
103
gross horizontal wells during
2014
with an aggregate of approximately
605,000
feet of pay. Total proved reserves in the Huron play decreased approximately
6%
to
1.2
Tcfe, as the Company ceased development of the Huron play and removed remaining proved undeveloped locations, as they are no longer in the five year development program. Production sales volumes in
2014
from the Marcellus, including Upper Devonian, and Huron plays were
378.2
Bcfe and
33.8
Bcfe, respectively. Over the past
three
years, the Company has experienced a
99%
developmental drilling success rate.
23
Natural gas, NGLs and crude oil pricing:
|
|
For the Years Ended December 31,
|
|||||||||||
|
|
2014
|
2013
|
2012
|
|||||||||
|
Natural Gas:
|
|
|
|
|
|
|
||||||
|
Average sales price (excluding cash settled derivatives) ($/Mcf)
|
$
|
4.51
|
|
$
|
4.18
|
|
$
|
3.58
|
|
|||
|
Average sales price (including cash settled derivatives) ($/Mcf)
|
$
|
4.53
|
|
$
|
4.60
|
|
$
|
4.80
|
|
|||
|
Average sales price (including cash settled derivatives and third-party gathering and transmission costs) ($/Mcf)
|
$
|
3.98
|
|
$
|
4.00
|
|
$
|
3.92
|
|
|||
|
NGLs:
|
|
|
|
|
|
|
||||||
|
Average sales price including third-party processing costs ($/Bbl)
|
$
|
32.44
|
|
$
|
36.80
|
|
$
|
40.84
|
|
|||
|
Crude Oil:
|
|
|
|
|
|
|
||||||
|
Average sales price ($/Bbl)
|
$
|
78.51
|
|
$
|
85.82
|
|
$
|
83.95
|
|
|||
NGLs and crude oil were converted to Mcfe at the rate of
six
Mcfe per barrel for all periods.
For additional information on pricing, see “Consolidated Operational Data” in Item 7, “Management’s Discussion and Analysis of Financial Condition and Results of Operations.”
The Company’s average per unit production cost, excluding production taxes, of natural gas, NGLs and oil during
2014
,
2013
and
2012
was
$0.14
,
$0.15
and
$0.17
per Mcfe, respectively. At
December 31, 2014
, the Company had approximately
50
multiple completion wells.
|
|
Natural Gas
|
Oil
|
||
|
Total productive wells at December 31, 2014:
|
|
|
||
|
Total gross productive wells
|
13,073
|
314
|
||
|
Total net productive wells
|
12,413
|
264
|
||
|
Total in-process wells at December 31, 2014:
|
|
|
||
|
Total gross in-process wells
|
270
|
1
|
||
|
Total net in-process wells
|
266
|
1
|
||
Summary of proved natural gas, oil and NGL reserves as of
December 31, 2014
based on average fiscal year prices:
|
|
Natural Gas
(Mcf)
|
Oil and NGLs
(Bbls)
|
||
|
Developed
|
4,257,377
|
94,835
|
||
|
Undeveloped
|
5,518,577
|
65,664
|
||
|
Total proved reserves
|
9,775,954
|
160,499
|
||
|
Total acreage at December 31, 2014:
|
|
|
Total gross productive acres
|
1,220,336
|
|
Total net productive acres
|
1,109,464
|
|
Total gross undeveloped acres
|
2,215,922
|
|
Total net undeveloped acres
|
2,033,302
|
24
As of
December 31, 2014
, the Company had a total of 15.3 Bcfe of reserves that have been classified as proved undeveloped for more than five years. These reserves are associated with two wells that were drilled in 2014 and that are scheduled to be completed and producing in 2015.
Certain lease and acquisition agreements require the Company to drill a specific number of wells in
2015
. Within the Marcellus formation, the Company is required to drill
three
wells in
2015
. The Company intends to satisfy such requirements either directly through its
2015
development program or indirectly by contracting with a third party to do so, including through an assignment of the lease, farmout or other arrangement.
As of
December 31, 2014
, leases associated with approximately
45,551
gross undeveloped acres expire in
2015
if they are not renewed. This acreage is in addition to the acreage that may be lost if drilling obligations are not met. The Company has an active lease renewal program in areas targeted for development.
Number of net productive and dry exploratory and development wells drilled:
|
|
For the Years Ended December 31,
|
||||||||
|
|
2014
|
2013
|
2012
|
||||||
|
Exploratory wells:
|
|
|
|
|
|
|
|||
|
Productive
|
2.0
|
|
—
|
|
—
|
|
|||
|
Dry
|
—
|
|
—
|
|
—
|
|
|||
|
Development wells:
|
|
|
|
|
|||||
|
Productive
|
340.4
|
|
223.2
|
|
128.5
|
|
|||
|
Dry
|
—
|
|
1.0
|
|
1.0
|
|
|||
25
Selected production, sales and acreage data by state (as of
December 31, 2014
unless otherwise noted), which is substantially all from the Appalachian Basin. Refer to pages 36 and 39 for sales volumes by final product.
|
|
Pennsylvania
|
West
Virginia
|
Kentucky
|
Other (b)
|
Total
|
||||||||||
|
Natural gas, oil and NGL production (MMcfe) – 2014 (a)
|
237,365
|
|
164,330
|
|
66,775
|
|
19,609
|
|
488,079
|
|
|||||
|
Natural gas, oil and NGL production (MMcfe) – 2013 (a)
|
196,250
|
|
103,861
|
|
65,467
|
|
22,811
|
|
388,389
|
|
|||||
|
Natural gas, oil and NGL production (MMcfe) – 2012 (a)
|
96,101
|
|
83,177
|
|
72,731
|
|
23,438
|
|
275,447
|
|
|||||
|
Natural gas, oil and NGL sales (MMcfe) – 2014
|
240,685
|
|
158,868
|
|
58,790
|
|
17,917
|
|
476,260
|
|
|||||
|
Natural gas, oil and NGL sales (MMcfe) – 2013
|
201,653
|
|
96,710
|
|
58,759
|
|
21,051
|
|
378,173
|
|
|||||
|
Natural gas, oil and NGL sales (MMcfe) – 2012
|
97,368
|
|
79,514
|
|
65,799
|
|
21,773
|
|
264,454
|
|
|||||
|
Average net revenue interest (%)
|
82.9
|
%
|
87.9
|
%
|
95.8
|
%
|
57.2
|
%
|
84.4
|
%
|
|||||
|
Total gross productive wells
|
1,008
|
|
4,990
|
|
5,657
|
|
1,732
|
|
13,387
|
|
|||||
|
Total net productive wells
|
996
|
|
4,755
|
|
5,405
|
|
1,521
|
|
12,677
|
|
|||||
|
Total gross productive acreage
|
96,676
|
|
430,014
|
|
545,463
|
|
148,183
|
|
1,220,336
|
|
|||||
|
Total gross undeveloped acreage
|
298,874
|
|
770,189
|
|
942,565
|
|
204,294
|
|
2,215,922
|
|
|||||
|
Total gross acreage
|
395,550
|
|
1,200,203
|
|
1,488,028
|
|
352,477
|
|
3,436,258
|
|
|||||
|
Total net productive acreage
|
88,709
|
|
394,576
|
|
500,510
|
|
125,669
|
|
1,109,464
|
|
|||||
|
Total net undeveloped acreage
|
288,532
|
|
663,227
|
|
903,309
|
|
178,234
|
|
2,033,302
|
|
|||||
|
Total net acreage
|
377,241
|
|
1,057,803
|
|
1,403,819
|
|
303,903
|
|
3,142,766
|
|
|||||
|
(Amounts in Bcfe)
|
|
|
|
|
|
|
|
|
|
|
|||||
|
Proved developed producing reserves
|
1,679
|
|
1,453
|
|
1,340
|
|
208
|
|
4,680
|
|
|||||
|
Proved developed non-producing reserves
|
97
|
|
37
|
|
12
|
|
—
|
|
146
|
|
|||||
|
Proved undeveloped reserves
|
3,471
|
|
2,405
|
|
37
|
|
—
|
|
5,913
|
|
|||||
|
Proved developed and undeveloped reserves
|
5,247
|
|
3,895
|
|
1,389
|
|
208
|
|
10,739
|
|
|||||
|
Gross proved undeveloped drilling locations
|
486
|
|
389
|
|
29
|
|
—
|
|
904
|
|
|||||
|
Net proved undeveloped drilling locations
|
483
|
|
389
|
|
29
|
|
—
|
|
901
|
|
|||||
(a) All production information related to natural gas is reported net of the effect of any reduction in natural gas volumes resulting from the processing of NGLs.
(b) Other includes Ohio, Virginia, Maryland and Texas.
26
The Company sells natural gas primarily within the Appalachian Basin under a variety of contractual agreements, some of which specify the delivery of fixed and determinable quantities. The Company expects to fulfill these delivery commitments with existing proved developed and proved undeveloped reserves. As of
December 31, 2014
, the Company’s delivery commitments through
2019
were as follows:
|
For the Year Ended December 31,
|
Natural Gas (Bcf)
|
|
|
2015
|
470
|
|
|
2016
|
299
|
|
|
2017
|
238
|
|
|
2018
|
184
|
|
|
2019
|
14
|
|
Capital expenditures at EQT Production totaled
$2,441 million
during
2014
, including
$724 million
for the acquisition of properties. The Company invested approximately
$1,196 million
during
2014
developing proved reserves and approximately
$521 million
on wells still in progress at year end. During the year, the Company converted
790
Bcfe of proved undeveloped reserves to proved developed reserves. The Company had additions to proved developed reserves of
737
Bcfe, the majority of which were from wells spud that had not previously been classified as proved. New proved undeveloped reserves of
2,829
Bcfe were added during
2014
. These reserve extensions and discoveries were mainly due to the addition of proved locations in the Company’s Pennsylvania and West Virginia Marcellus play. This increase was partially offset by negative revisions to proved undeveloped reserves of
489
Bcfe, which was due primarily to the removal of locations in both the Company’s Marcellus and Huron plays, the latter of which the Company announced will not be a target for drilling in its current development outlook. While the Company may develop these reserves, projected development has been delayed beyond
5
years. As of
December 31, 2014
, the Company’s proved undeveloped reserves totaled
5.9
Tcfe,
99%
of which is associated with the development of the Marcellus, including Upper Devonian, play. All proved undeveloped drilling locations are expected to be drilled within
five
years.
The Company’s
2014
extensions, discoveries and other additions resulting from extensions of the proved acreage of previously discovered reservoirs through additional drilling in periods subsequent to discovery of
3,276
Bcfe exceeded the
2014
production of
488
Bcfe.
Wells located in Pennsylvania are primarily in Marcellus formations with depths ranging from
5,000
feet to
8,000
feet. Wells located in West Virginia are primarily in Marcellus and Huron formations with depths ranging from
2,500
feet to
6,500
feet. Wells located in Kentucky are primarily in Huron formations with depths ranging from
2,500
feet to
6,000
feet. Wells located in other areas are in CBM, Utica and Permian formations with depths ranging from
2,000
feet to
7,000
feet.
EQT Production owns and leases office space in Pennsylvania, West Virginia, Kentucky and Texas.
EQT Midstream:
EQT Midstream including EQT Midstream Partners, owns or operates approximately
8,200
miles of gathering lines and
176
compressor units with approximately
225,000
horsepower of installed capacity, as well as other general property and equipment.
|
|
Kentucky
|
West
Virginia
|
Virginia
|
Pennsylvania
|
Total
|
|||||
|
Approximate miles of gathering lines
|
3,550
|
4,025
|
400
|
225
|
8,200
|
|||||
Substantially all of the gathering operation’s sales volumes are delivered to several large interstate pipelines on which the Company and other customers lease capacity. These pipelines are subject to periodic curtailments for maintenance and repairs.
EQT Midstream also operates a FERC-regulated transmission and storage system. These operations consist of an approximately
900
-mile FERC-regulated interstate pipeline system that connects to
seven
interstate pipelines and multiple distribution companies. The system is supported by eighteen associated natural gas storage reservoirs with approximately
660
MMcf per day of peak delivery capability and
47
Bcf of working gas capacity. The transmission and storage system stretches throughout north central West Virginia and southwestern Pennsylvania.
EQT Midstream owns and leases office space in Pennsylvania, West Virginia, Virginia and Kentucky.
27
Headquarters:
The Company’s corporate headquarters and other operations are located in leased office space in Pittsburgh, Pennsylvania.
See “Capital Resources and Liquidity” in Item 7, “Management’s Discussion and Analysis of Financial Condition and Results of Operations,” for a discussion of capital expenditures.
In the ordinary course of business, various legal and regulatory claims and proceedings are pending or threatened against the Company. While the amounts claimed may be substantial, the Company is unable to predict with certainty the ultimate outcome of such claims and proceedings. The Company accrues legal and other direct costs related to loss contingencies when actually incurred. The Company has established reserves it believes to be appropriate for pending matters and, after consultation with counsel and giving appropriate consideration to available insurance, the Company believes that the ultimate outcome of any matter currently pending against the Company will not materially affect the financial position, results of operations or liquidity of the Company.
Environmental Proceedings
In June and August 2012, the Company received three Notices of Violation (NOVs) from the Pennsylvania Department of Environmental Protection (the PADEP). The NOVs alleged violations of the Pennsylvania Oil and Gas Act and Clean Streams Law in connection with the unintentional release in May 2012, by a Company vendor, of water from an impaired water pit at a Company well location in Tioga County, Pennsylvania. Since confirming the release, the Company has cooperated with the PADEP in remediating the affected areas.
During the second quarter of 2014, the Company received a proposed consent assessment of civil penalty (CACP) from the PADEP and the Pennsylvania Fish and Boat Commission (the PFBC). Under the CACP, the PADEP proposed a civil penalty related to the NOVs and the PFBC proposed a civil penalty related to possible violations of the Pennsylvania Fish and Boat Code. The Company entered into settlement discussions regarding the assessed penalty with the PFBC and unsuccessfully attempted to do the same with the PADEP. The Company was unable to resolve the PADEP claims due to the agency’s interpretation of the penalty provisions of the Clean Streams Law. Accordingly, on September 19, 2014, the Company filed a declaratory judgment action in the Commonwealth Court of Pennsylvania against the PADEP seeking a court ruling on the legal interpretation. The Company did not include the PFBC in the action due to ongoing settlement discussions.
On September 30, 2014, the PFBC filed a misdemeanor complaint against the Company through the Pennsylvania Attorney General’s Office in the Tioga County court; the Company has initiated settlement discussions with the Attorney General’s Office.
On October 7, 2014, the PADEP filed a complaint against the Company before the Pennsylvania Environmental Hearing Board seeking $4.5 million in civil penalties. The Company believes the PADEP’s penalty assessment is legally flawed and unsupportable under the Clean Streams Law.
While the Company expects these claims to result in penalties that exceed $100,000, the Company expects the resolution of these matters, individually and in the aggregate, will not have a material impact on the financial position, results of operations or liquidity of the Company.
Not Applicable.
28
Executive Officers of the Registrant (as of
February 12, 2015
)
|
Name and Age
|
|
Current Title (Year Initially
Elected an Executive Officer)
|
|
Business Experience
|
|
|
|
|
|
|
|
Theresa Z. Bone (51)
|
|
Vice President, Finance and Chief Accounting Officer (2007)
|
|
Elected to present position October 2013; Vice President and Corporate Controller from July 2007 to October 2013. Ms. Bone is also Vice President, Finance and Chief Accounting Officer of EQT Midstream Services, LLC, the general partner of the Partnership, since October 2013. Ms. Bone was Vice President and Principal Accounting Officer of EQT Midstream Services, LLC from January 2012 to October 2013.
|
|
|
|
|
|
|
|
Philip P. Conti (55)
|
|
Senior Vice President and Chief Financial Officer (2000)
|
|
Elected to present position February 2007. Mr. Conti is also Senior Vice President, Chief Financial Officer and a Director of EQT Midstream Services, LLC, the general partner of the Partnership, since January 2012.
|
|
|
|
|
|
|
|
Randall L. Crawford (52)
|
|
Senior Vice President and President, Midstream and Commercial (2003)
|
|
Elected to present position December 2013; Senior Vice President and President, Midstream, Distribution and Commercial from April 2010 to December 2013; Senior Vice President and President, Midstream and Distribution from January 2008 to April 2010. Mr. Crawford is also Executive Vice President, Chief Operating Officer and a Director of EQT Midstream Services, LLC, the general partner of the Partnership, since December 2013. Mr. Crawford was Executive Vice President and a Director of EQT Midstream Services, LLC from January 2012 to December 2013.
|
|
|
|
|
|
|
|
Lewis B. Gardner (57)
|
|
General Counsel and Vice President, External Affairs (2008)
|
|
Elected to present position March 2008. Mr. Gardner is also a Director of EQT Midstream Services, LLC, the general partner of the Partnership, since January 2012.
|
|
|
|
|
|
|
|
Charlene Petrelli (54)
|
|
Vice President and Chief Human Resources Officer (2003)
|
|
Elected to present position February 2007.
|
|
|
|
|
|
|
|
David L. Porges (57)
|
|
Chairman, President and Chief Executive Officer (1998)
|
|
Elected to present position May 2011; President, Chief Executive Officer and Director from April 2010 to May 2011; President, Chief Operating Officer and Director from February 2007 to April 2010. Mr. Porges is also Chairman, President and Chief Executive Officer of EQT Midstream Services, LLC, the general partner of the Partnership, since January 2012.
|
|
|
|
|
|
|
|
Steven T. Schlotterbeck (49)
|
|
Executive Vice President and President, Exploration and Production (2008)
|
|
Elected to present position December 2013; Senior Vice President and President, Exploration and Production from April 2010 to December 2013; Vice President and President, Production from January 2008 to April 2010.
|
All executive officers have executed agreements with the Company and serve at the pleasure of the Company’s Board of Directors. Officers are elected annually to serve during the ensuing year or until their successors are elected and qualified, or until death, resignation or removal.
29
The Company’s common stock is listed on the New York Stock Exchange. The high and low sales prices reflected in the New York Stock Exchange Composite Transactions and the dividends declared and paid per share for
2014
and
2013
are summarized as follows (in U.S. dollars per share):
|
|
2014
|
2013
|
||||||||||||||||||||||
|
|
High
|
Low
|
Dividend
|
High
|
Low
|
Dividend
|
||||||||||||||||||
|
1st Quarter
|
$
|
104.72
|
|
$
|
84.25
|
|
$
|
0.03
|
|
$
|
68.44
|
|
$
|
56.84
|
|
$
|
0.03
|
|
||||||
|
2nd Quarter
|
111.47
|
|
95.78
|
|
0.03
|
|
84.00
|
|
64.71
|
|
0.03
|
|
||||||||||||
|
3rd Quarter
|
107.71
|
|
89.77
|
|
0.03
|
|
94.42
|
|
78.57
|
|
0.03
|
|
||||||||||||
|
4th Quarter
|
100.65
|
|
74.37
|
|
0.03
|
|
91.59
|
|
80.72
|
|
0.03
|
|
||||||||||||
As of
January 31, 2015
, there were
2,652
shareholders of record of the Company’s common stock.
The amount and timing of dividends is subject to the discretion of the Board of Directors and depends upon business conditions, such as the Company’s lines of business, results of operations and financial conditions, strategic direction and other factors. The Board of Directors has the discretion to change the annual dividend rate at any time for any reason.
The following table sets forth the Company’s repurchases of equity securities registered under Section 12 of the Securities Exchange Act of 1934, as amended, that have occurred during the three months ended
December 31, 2014
:
|
Period
|
Total
number of
shares
purchased (a)
|
Average
price
paid per
share (a)
|
Total number
of shares
purchased as
part of publicly
announced
plans or
programs
|
Maximum number
of shares that may
yet be purchased
under the plans or
programs (b)
|
|||||||||
|
October 2014 (October 1 – October 31)
|
—
|
|
$
|
—
|
|
—
|
|
700,000
|
|
||||
|
November 2014 (November 1 – November 30)
|
2,904
|
|
94.61
|
|
—
|
|
700,000
|
|
|||||
|
December 2014 (December 1 – December 31)
|
—
|
|
—
|
|
—
|
|
700,000
|
|
|||||
|
Total
|
2,904
|
|
$
|
94.61
|
|
—
|
|
|
|
||||
(a)
Reflects shares withheld by the Company to pay taxes upon vesting of restricted stock.
(b)
On April 30, 2014, the Company’s Board of Directors approved a share repurchase authorization of up to 1,000,000 shares of the Company’s outstanding common stock. The Company may repurchase shares from time to time in open market or in privately negotiated transactions. The share repurchase authorization does not obligate the Company to acquire any specific number of shares, has no pre-established end date and may be discontinued by the Company at any time. As of December 31, 2014, the Company has repurchased 300,000 shares under this authorization since its inception.
30
Stock Performance Graph
The following graph compares the most recent five-year cumulative total return attained by holders of the Company’s common stock with the cumulative total returns of the S&P 500 Index and a customized peer group of the
25
companies listed in footnote (a) below (the Self-Constructed Peer Group). An investment of
$100
(with reinvestment of all dividends) is assumed to have been made at the close of business on December 31,
2009
in the Company’s common stock, in the S&P 500 Index and in the Self-Constructed Peer Group. Relative performance is tracked through
December 31, 2014
.
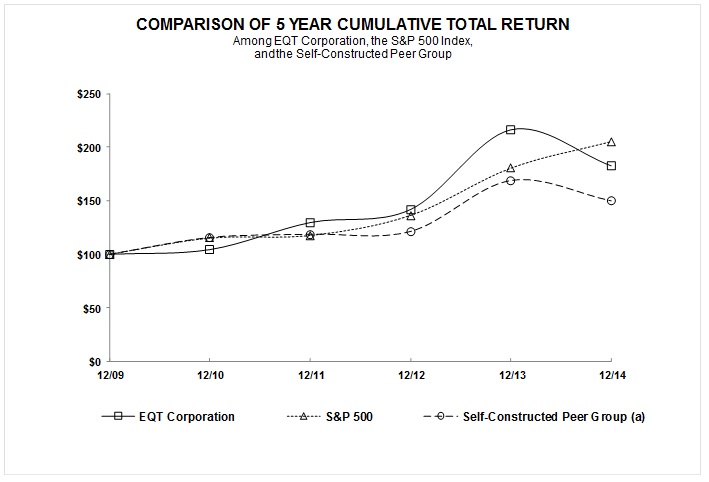
|
|
12/09
|
|
12/10
|
|
12/11
|
|
12/12
|
|
12/13
|
|
12/14
|
|
||||||
|
EQT Corporation
|
100.00
|
|
104.35
|
|
129.58
|
|
141.79
|
|
216.18
|
|
182.50
|
|
||||||
|
S&P 500
|
100.00
|
|
115.06
|
|
117.49
|
|
136.30
|
|
180.44
|
|
205.14
|
|
||||||
|
Self-Constructed Peer Group (a)
|
100.00
|
|
115.69
|
|
118.76
|
|
121.37
|
|
168.90
|
|
149.85
|
|
||||||
(a)
The Self-Constructed Peer Group includes the following 25 companies: Cabot Oil & Gas Corporation, Chesapeake Energy Corporation, Cimarex Energy Co., Concho Resources, Inc., CONSOL Energy Inc., Continental Resources, Inc., Energen Corporation, EOG Resources, Inc., EXCO Resources, Inc., MarkWest Energy Partners, L.P., National Fuel Gas Company, Newfield Exploration Company, Noble Energy, Inc., ONEOK, Inc., Pioneer Natural Resources Company, QEP Resources, Inc., Questar Corporation, Quicksilver Resources Inc., Range Resources Corporation, SM Energy Company, Southwestern Energy Company, Spectra Energy Corp, Ultra Petroleum Corp., Whiting Petroleum Corporation and The Williams Companies, Inc. QEP Resources, Inc. completed its IPO in 2010 and is included in the calculation from July 1, 2010, the date when its common stock began trading on the New York Stock Exchange, through
December 31, 2014
.
The Self-Constructed Peer Group is the same peer group used for the Company’s 2014 and 2015 Executive Performance Incentive Programs, each of which utilize three-year total shareholder return against the peer group as one performance metric.
See Item 12, “Security Ownership of Certain Beneficial Owners and Management and Related Stockholders Matters,” for information relating to compensation plans under which the Company’s securities are authorized for issuance.
31
|
|
As of and for the Years Ended December 31,
|
|||||||||||||||||||
|
|
2014
|
2013
|
2012
|
2011
|
2010
|
|||||||||||||||
|
|
(Thousands, except per share amounts)
|
|||||||||||||||||||
|
Operating revenues
|
$
|
2,469,710
|
|
$
|
1,862,011
|
|
$
|
1,377,222
|
|
$
|
1,323,829
|
|
$
|
1,038,240
|
|
|||||
|
Amounts attributable to EQT Corporation:
|
|
|
|
|
|
|
|
|
||||||||||||
|
Income from continuing operations
|
$
|
385,594
|
|
$
|
298,729
|
|
$
|
135,902
|
|
$
|
419,582
|
|
$
|
164,761
|
|
|||||
|
Net income
|
$
|
386,965
|
|
$
|
390,572
|
|
$
|
183,395
|
|
$
|
479,769
|
|
$
|
227,700
|
|
|||||
|
Earnings per share of common stock attributable to EQT Corporation:
|
|
|
|
|
||||||||||||||||
|
Basic:
|
|
|
|
|
|
|
|
|
||||||||||||
|
Income from continuing operations
|
$
|
2.54
|
|
$
|
1.98
|
|
$
|
0.91
|
|
$
|
2.81
|
|
$
|
1.14
|
|
|||||
|
Net income
|
$
|
2.55
|
|
$
|
2.59
|
|
$
|
1.23
|
|
$
|
3.21
|
|
$
|
1.58
|
|
|||||
|
Diluted:
|
|
|
|
|
|
|
|
|
||||||||||||
|
Income from continuing operations
|
$
|
2.53
|
|
$
|
1.97
|
|
$
|
0.90
|
|
$
|
2.79
|
|
$
|
1.14
|
|
|||||
|
Net income
|
$
|
2.54
|
|
$
|
2.57
|
|
$
|
1.22
|
|
$
|
3.19
|
|
$
|
1.57
|
|
|||||
|
Total assets
|
$
|
12,064,900
|
|
$
|
9,792,053
|
|
$
|
8,849,862
|
|
$
|
8,772,719
|
|
$
|
7,098,438
|
|
|||||
|
Long-term debt
|
$
|
2,988,900
|
|
$
|
2,501,516
|
|
$
|
2,526,173
|
|
$
|
2,746,942
|
|
$
|
1,949,200
|
|
|||||
|
Cash dividends declared per share of common stock
|
$
|
0.12
|
|
$
|
0.12
|
|
$
|
0.88
|
|
$
|
0.88
|
|
$
|
0.88
|
|
|||||
Refer to Note 2 to the Consolidated Financial Statements for a description of the Equitable Gas Transaction. Equitable Gas Company, LLC (Equitable Gas) and Equitable Homeworks, LLC (Homeworks) comprised substantially all of the Company’s previously reported Distribution segment. The financial information of Equitable Gas and Homeworks is reflected as discontinued operations in this Annual Report on Form 10-K. All prior periods presented in this Annual Report have been recast to reflect the presentation of discontinued operations. See Item 1A, “Risk Factors”, Item 7, “Management’s Discussion and Analysis of Financial Condition and Results of Operations” and Notes 2, 7 and 8 to the Consolidated Financial Statements for a discussion of matters that affect the comparability of the selected financial data as well as uncertainties that might affect the Company’s future financial condition.
32
Item 7.
Management’s Discussion and Analysis of Financial Condition and Results of Operations
Consolidated Results of Continuing Operations
2014
EQT Overview:
•
Annual production sales volumes of
476.3
Bcfe,
26%
higher than
2013
•
Marcellus sales volumes of
378.2
Bcfe,
38%
higher than
2013
•
Gathered volumes of
590.5
TBtu,
27%
higher than
2013
•
Increased proved reserves by
29%
to
10.7
Tcfe
•
The Partnership completed an underwritten public offering of common units representing limited partner interests
•
The Partnership issued 4.00% Senior Notes of $500.0 million due August 1, 2024
|
•
|
Recognized impairment of proved and unproved oil and gas properties of
$267.3 million
(pre-tax) in the Ohio Utica and Permian Basin
|
Income from continuing operations attributable to EQT Corporation for
2014
was
$385.6 million
,
$2.53
per diluted share, compared with
$298.7 million
,
$1.97
per diluted share, in
2013
. The
$86.9 million
increase in income from continuing operations attributable to EQT Corporation was primarily attributable to a 26% increase in production sales volumes, favorable gains on derivatives not designated as hedges, increases in contracted transmission capacity and throughput and gathered volumes, favorable changes in hedging ineffectiveness, and lower interest expense. These factors were partially offset by impairments of long-lived assets, higher net income attributable to noncontrolling interests of the Partnership, higher transportation and processing expenses, higher income tax expense, higher selling, general and administrative (SG&A) expense and higher depreciation, depletion and amortization (DD&A) expense.
Operating income was
$853.4 million
in
2014
compared to
$654.6 million
in
2013
, an increase of
$198.8 million
. EQT Production sales volumes increased 26% primarily as a result of increased production from the 2014 and 2013 drilling programs in the Marcellus acreage partially offset by the normal production decline in the Company’s producing wells. The average realized price to EQT Production for sales volumes was $3.23 per Mcfe in 2014 compared to $3.15 per Mcfe in 2013. EQT Production total net operating revenues for the year ended December 31, 2014 included $83.8 million of derivative gains for derivative instruments not designated as hedging instruments compared to $0.3 million of derivative losses for the year ended December 31, 2013. The $83.8 million of derivative gains for derivative instruments not designated as hedging instruments for the year ended December 31, 2014 included $36.5 million of cash settlements received, which is included in the average realized price to EQT Production of $3.23 per Mcfe in 2014. The year ended December 31, 2014 also included a $24.8 million gain for hedging ineffectiveness of financial hedges compared to a $21.3 million loss for ineffectiveness of financial hedges for the year ended December 31, 2013.
Transmission net operating revenues increased as a result of higher firm transmission contracted capacity and throughput for third parties and EQT Production, as well as higher interruptible transmission service. The increase in transmission net operating revenues is the result of increased production development in the Marcellus play. Gathering net operating revenues increased due to a 27% increase in gathered volumes, partially offset by an 11% decrease in the average gathering fee. The gathered volume increase was driven by higher volumes gathered for EQT Production in the Marcellus play. The decrease in the average gathering fee resulted from increased gathered volumes in the Marcellus play, as the Marcellus gathering rate is lower than the rate in other areas.
Operating expenses for
2014
were
$1,650.5 million
compared to
$1,227.0 million
in
2013
, an increase of
$423.5 million
. Excluding the $267.3 million impairment charge (described in more detail in Business Segment Results of Operations - EQT Production) and $26.2 million increase in depreciation and depletion, operating expenses increased $130.0 million. This increase was primarily attributable to higher transportation and processing expenses and higher SG&A costs consistent with the growth in the production and midstream businesses.
On May 7, 2014, a wholly owned subsidiary of the Company, EQT Gathering contributed a high-pressure gathering system to EQM Gathering, a wholly owned subsidiary of the Partnership, in exchange for
$1.18 billion
(the Jupiter Transaction). EQM Gathering is consolidated by the Company as it is still controlled by the Company.
On May 7, 2014, the Partnership completed an underwritten public offering of
12,362,500
common units, which included the full exercise of the underwriters’ overallotment option, representing Partnership limited partner interests. The Partnership received net proceeds of approximately
$902.5 million
from the offering, after deducting the underwriters’ discount and offering expenses of approximately
$34.0 million
. As of December 31, 2014, the Company held a
2%
general partner interest, all incentive
33
distribution rights and a
34.4%
limited partner interest in the Partnership. The Company’s limited partner interest in the Partnership consists of
3,959,952
common units and
17,339,718
subordinated units.
In
June 2014
, the Company exchanged certain assets with Range. The Company received approximately
73,000
net acres and approximately
900
producing wells, most of which are vertical wells, in the Permian Basin of Texas. In exchange, Range received approximately
138,000
net acres in the Company’s Nora field of Virginia, the Company’s working interest in approximately
2,000
producing vertical wells in the Nora field, the Company’s remaining
50%
ownership interest in Nora LLC, which owns the supporting gathering system in the Nora field, and
$167.3 million
in cash.
In August 2014, the Partnership issued 4.00% Senior Notes (4.00% Senior Notes) due August 1, 2024 in the aggregate principal amount of $500.0 million. Net proceeds of the offering of
$492.3 million
were used to repay the outstanding borrowings under the Partnership’s credit facility and for general partnership purposes.
Income from continuing operations attributable to EQT Corporation for 2013 was $298.7 million, $1.97 per diluted share, compared with $135.9 million, $0.90 per diluted share, in 2012. The $162.8 million increase in income from continuing operations attributable to EQT Corporation between periods was primarily attributable to a 43% increase in natural gas volumes sold, increases in contracted transmission capacity and throughput and gathered volumes, the gain on sale of certain energy marketing contracts by EQT Energy in December 2013 and lower interest expense. These factors were partially offset by higher DD&A expense, higher income tax expense, higher SG&A expense and higher net income attributable to noncontrolling interests of the Partnership.
Operating income was $654.6 million in 2013 compared to $389.6 million in 2012, an increase of $265.0 million. The increase in operating income was attributable to a 43% increase in natural gas volumes sold, increased transmission pipeline revenues and gathered volumes and a $19.6 million pre-tax gain from the disposal of customer contracts by EQT Energy, partially offset by higher DD&A expense and higher SG&A expense.
Production sales volumes increased in 2013 compared to 2012 primarily as a result of increased production from the 2013 and 2012 drilling programs in the Marcellus acreage. This increase was partially offset by the normal production decline in the Company’s producing wells. The average realized price to EQT Production for sales volumes was $3.15 per Mcfe in 2013 compared to $3.00 per Mcfe in 2012. Gathering net operating revenues increased due to a 39% increase in gathered volumes, partially offset by a 17% decrease in the average gathering fee. The gathered volume increase was driven by higher volumes gathered for EQT Production in the Marcellus play. The decrease in the average gathering fee resulted from increased gathered volumes in the Marcellus play, as the Marcellus gathering rate is lower than the rate in other areas.
Operating expenses for 2013 were $1,227.0 million compared to $987.6 million in 2012, an increase of $239.4 million. This increase was primarily attributable to higher DD&A charges attributable to higher production volumes at a production depletion rate of $1.50 per Mcfe in 2013 compared to $1.52 per Mcfe in 2012 and higher production-related and SG&A costs consistent with the growth in the production and midstream businesses.
On July 22, 2013, Sunrise Pipeline, LLC (Sunrise), a subsidiary of the Company, merged with and into Equitrans, a subsidiary of the Partnership, with Equitrans continuing as the surviving company (the Sunrise Merger). Equitrans continues to be consolidated by the Company as it is still under common control.
On July 22, 2013, the Partnership completed an underwritten public offering of
12,650,000
common units representing Partnership limited partner interests. Following the offering and the closing of the Sunrise Merger, the Company retained a
44.6%
equity interest in the Partnership, which includes
3,443,902
common units,
17,339,718
subordinated units and a
2%
general partner interest. The Partnership received net proceeds of
$529.4 million
from the offering, after deducting the underwriters’ discount and offering expenses of
$20.9 million
.
On December 17, 2013, the Company and its wholly owned subsidiary, Distribution Holdco, LLC, completed the disposition of their ownership interests in Equitable Gas and Homeworks to PNG Companies LLC (the Equitable Gas Transaction). As consideration for the transaction, the Company received total cash proceeds of $748.0 million, select midstream assets, including the AVC facilities, with a fair value of $140.9 million and other contractual assets with a fair value of $32.5 million.
On July 2, 2012, the Partnership completed its IPO of 14,375,000 common units representing limited partner interests in the Partnership, which represented 40.6% of the Partnership’s outstanding equity. The Company retained a 59.4% equity interest in the Partnership, including 2,964,718 common units, 17,339,718 subordinated units and a 2% general partner interest.
34
See “Other Income Statement Items” for a discussion of other income, interest expense, income taxes, income from discontinued operations and net income attributable to noncontrolling interests, and “Investing Activities” in “Capital Resources and Liquidity” for a discussion of capital expenditures.
Consolidated Operational Data
Revenues earned by the Company at the wellhead from the sale of natural gas, NGLs and oil are split between EQT Production and EQT Midstream. The split is reflected in the calculation of EQT Production’s average sales price. The following operational information presents detailed gross liquid and natural gas operational information as well as midstream deductions to assist in the understanding of the Company’s consolidated operations.
Non-GAAP Financial Measures
The operational information in the table below presents an average realized price ($/Mcfe) to EQT Production and EQT Corporation, which is based on EQT Production adjusted net operating revenues, a non-GAAP supplemental financial measure. EQT Production adjusted net operating revenues are presented because it is an important measure used by the Company’s management to evaluate period-to-period comparisons of earnings. EQT Production adjusted net operating revenues should not be considered as an alternative to EQT Corporation operating revenues as reported in the Statements of Consolidated Income, the most directly comparable GAAP financial measure. See “Reconciliation of Non-GAAP Measures” for a reconciliation of EQT Production adjusted net operating revenues to EQT Corporation operating revenues, as derived from the Statements of Consolidated Income.
35
EQT Corporation
Price Reconciliation
|
Years Ended December 31,
|
|||||||||||
|
in thousands (unless noted)
|
2014
|
2013
|
2012
|
||||||||
|
LIQUIDS
|
|
|
|||||||||
|
NGLs:
|
|
|
|||||||||
|
Sales volume (MMcfe) (a)
|
40,587
|
|
27,860
|
|
18,981
|
|
|||||
|
Sales volume (Mbbls)
|
6,764
|
|
4,643
|
|
3,163
|
|
|||||
|
Gross price ($/bbl)
|
$
|
41.94
|
|
$
|
45.58
|
|
$
|
49.29
|
|
||
|
Gross NGL sales
|
$
|
283,728
|
|
$
|
211,626
|
|
$
|
155,926
|
|
||
|
Third-party processing
|
(64,313
|
)
|
(40,754
|
)
|
(26,751
|
)
|
|||||
|
Net NGL sales
|
$
|
219,415
|
|
$
|
170,872
|
|
$
|
129,175
|
|
||
|
Oil:
|
|
|
|||||||||
|
Sales volume (MMcfe) (a)
|
2,693
|
|
1,620
|
|
1,587
|
|
|||||
|
Sales volume (Mbbls)
|
449
|
|
270
|
|
264
|
|
|||||
|
Net price ($/bbl)
|
$
|
78.51
|
|
$
|
85.82
|
|
$
|
83.95
|
|
||
|
Net oil sales
|
$
|
35,232
|
|
$
|
23,171
|
|
$
|
22,161
|
|
||
|
Net liquids sales
|
$
|
254,647
|
|
$
|
194,043
|
|
$
|
151,336
|
|
||
|
NATURAL GAS
|
|
|
|||||||||
|
Sales volume (MMcf)
|
432,980
|
|
348,693
|
|
243,886
|
|
|||||
|
NYMEX price ($/MMBtu) (b)
|
$
|
4.38
|
|
$
|
3.67
|
|
$
|
2.83
|
|
||
|
Btu uplift
|
$
|
0.38
|
|
$
|
0.30
|
|
$
|
0.26
|
|
||
|
Gross natural gas price ($/Mcf)
|
$
|
4.76
|
|
$
|
3.97
|
|
$
|
3.09
|
|
||
|
Basis ($/Mcf)
|
(1.07
|
)
|
(0.16
|
)
|
(0.03
|
)
|
|||||
|
Recoveries ($/Mcf) (c)
|
0.82
|
|
0.37
|
|
0.52
|
|
|||||
|
Cash settled basis swaps (not designated as hedges) ($/Mcf)
|
$
|
0.06
|
|
$
|
—
|
|
$
|
—
|
|
||
|
Average differential ($/Mcf)
|
$
|
(0.19
|
)
|
$
|
0.21
|
|
$
|
0.49
|
|
||
|
Average adjusted price - unhedged ($/Mcf)
|
$
|
4.57
|
|
$
|
4.18
|
|
$
|
3.58
|
|
||
|
Cash settled derivatives (cash flow hedges) ($/Mcf)
|
(0.06
|
)
|
0.42
|
|
1.22
|
|
|||||
|
Cash settled derivatives (not designated as hedges) ($/Mcf)
|
0.02
|
|
—
|
|
—
|
|
|||||
|
Average adjusted price, including cash settled derivatives ($/Mcf)
|
$
|
4.53
|
|
$
|
4.60
|
|
$
|
4.80
|
|
||
|
Net natural gas sales, including cash settled derivatives
|
$
|
1,962,667
|
|
$
|
1,603,891
|
|
$
|
1,171,435
|
|
||
|
TOTAL PRODUCTION
|
|||||||||||
|
Total net natural gas & liquids sales, including cash settled derivatives
|
$
|
2,217,314
|
|
$
|
1,797,934
|
|
$
|
1,322,771
|
|
||
|
Total sales volume (MMcfe)
|
476,260
|
|
378,173
|
|
264,454
|
|
|||||
|
Net natural gas & liquids price, including cash settled derivatives ($/Mcfe)
|
$
|
4.66
|
|
$
|
4.75
|
|
$
|
5.00
|
|
||
|
Midstream Revenue Deductions ($/Mcfe)
|
|
|
|||||||||
|
Gathering to EQT Midstream
|
$
|
(0.73
|
)
|
$
|
(0.82
|
)
|
$
|
(1.00
|
)
|
||
|
Transmission to EQT Midstream
|
(0.20
|
)
|
(0.23
|
)
|
(0.19
|
)
|
|||||
|
Third-party gathering and transmission costs
|
(0.50
|
)
|
(0.55
|
)
|
(0.81
|
)
|
|||||
|
Total midstream revenue deductions
|
$
|
(1.43
|
)
|
$
|
(1.60
|
)
|
$
|
(2.00
|
)
|
||
|
Average realized price to EQT Production ($/Mcfe)
|
$
|
3.23
|
|
$
|
3.15
|
|
$
|
3.00
|
|
||
|
Gathering and transmission to EQT Midstream ($/Mcfe)
|
$
|
0.93
|
|
$
|
1.05
|
|
$
|
1.19
|
|
||
|
Average realized price to EQT Corporation ($/Mcfe)
|
$
|
4.16
|
|
$
|
4.20
|
|
$
|
4.19
|
|
||
36
(a) NGLs and crude oil were converted to Mcfe at the rate of six Mcfe per barrel for all periods.
(b) The Company’s volume weighted NYMEX natural gas price (actual average NYMEX natural gas price ($/MMBtu) was
$4.41
,
$3.65
and
$2.79
for the years ended December 31,
2014
,
2013
and
2012
, respectively).
(c) Recoveries represent differences in natural gas prices between the Appalachian Basin and the sales points of other markets reached by utilizing transportation capacity, differences in natural gas prices between Appalachian Basin and fixed price sales contracts, term sales with fixed differentials to NYMEX and other marketing activity, including capacity releases. Recoveries includes approximately $0.19, $0.23 and $0.41 per Mcf for the years ended December 31, 2014, 2013 and 2012, respectively, for the sale of unused capacity.
Reconciliation of Non-GAAP Measures
The tables below reconcile EQT Production adjusted net operating revenues, a non-GAAP supplemental financial measure, to EQT Corporation operating revenues as reported in the Statements of Consolidated Income, its most directly comparable financial measure calculated in accordance with GAAP.
The Company reports gain (loss) for hedging ineffectiveness and gain (loss) on derivatives not designated as hedges within operating revenues in the Statements of Consolidated Income.
The Company’s management reviews and reports the EQT Production segment results with third-party transportation and processing costs reflected as a deduction from operating revenues. Third-party costs incurred to gather, process and transport gas produced by EQT Production to market sales points are recorded as a portion of transportation and processing costs in the Statements of Consolidated Income. Some transportation costs incurred by the Company are marketed for resale and are not incurred to transport gas produced by EQT Production. These transportation costs are reflected as a deduction from operating revenues in the Statements of Consolidated Income.
|
Calculation of EQT Production adjusted net operating revenues
|
Years Ended December 31,
|
||||||||||
|
$ in thousands (unless noted)
|
2014
|
2013
|
2012
|
||||||||
|
EQT Production total net operating revenues, as reported on segment page
|
$
|
1,612,730
|
|
$
|
1,168,657
|
|
$
|
793,773
|
|
||
|
(Deduct) add back:
|
|||||||||||
|
(Gain) loss for hedging ineffectiveness
|
(24,774
|
)
|
21,335
|
|
75
|
|
|||||
|
(Gain) loss on derivatives not designated as hedges
|
(83,760
|
)
|
301
|
|
317
|
|
|||||
|
Net cash settlements received (paid) on derivatives not designated as hedges
|
36,453
|
|
728
|
|
(317
|
)
|
|||||
|
EQT Production adjusted net operating revenues, a non-GAAP measure
|
$
|
1,540,649
|
|
$
|
1,191,021
|
|
$
|
793,848
|
|
||
|
Total sales volumes (MMcfe)
|
476,260
|
|
378,173
|
|
264,454
|
|
|||||
|
Average realized price to EQT Production ($/Mcfe)
|
$
|
3.23
|
|
$
|
3.15
|
|
$
|
3.00
|
|
||
|
Add:
|
|||||||||||
|
Gathering and Transmission to EQT Midstream ($/Mcfe)
|
$
|
0.93
|
|
$
|
1.05
|
|
$
|
1.19
|
|
||
|
Average realized price to EQT Corporation ($/Mcfe)
|
$
|
4.16
|
|
$
|
4.20
|
|
$
|
4.19
|
|
||
|
EQT Production total net operating revenues, as reported on segment page
|
$
|
1,612,730
|
|
$
|
1,168,657
|
|
$
|
793,773
|
|
||
|
EQT Midstream total operating revenues, as reported on segment page
|
699,083
|
|
614,042
|
|
505,498
|
|
|||||
|
Third-party transportation and processing costs
|
200,562
|
|
142,281
|
|
126,783
|
|
|||||
|
Less: intersegment revenues, net
|
(42,665
|
)
|
(62,969
|
)
|
(48,832
|
)
|
|||||
|
EQT Corporation operating revenues, as reported in accordance with GAAP
|
$
|
2,469,710
|
|
$
|
1,862,011
|
|
$
|
1,377,222
|
|
||
37
Business Segment Results of Operations
Business segment operating results from continuing operations are presented in the segment discussions and financial tables on the following pages. Operating segments are evaluated on their contribution to the Company’s consolidated results based on operating income. Other income, interest and income taxes are managed on a consolidated basis. Headquarters’ costs are billed to the operating segments based upon a fixed allocation of the headquarters’ annual operating budget. Differences between budget and actual headquarters expenses totaling
$36.9 million
,
$45.4 million
and
$35.6 million
were not allocated to the operating segments for the years ended December 31,
2014
,
2013
and
2012
, respectively. Unallocated expenses consist primarily of incentive compensation, administrative costs and for 2013 and 2012, corporate overhead charges previously allocated to the Company’s Distribution segment that were reclassified to headquarters as part of the recast of those periods to reflect the discontinued operations presentation.
The Company has reported the components of each segment’s operating income from continuing operations and various operational measures in the sections below, and where appropriate, has provided information describing how a measure was derived. EQT’s management believes that presentation of this information provides useful information to management and investors regarding the financial condition, operations and trends of each of EQT’s business segments without being obscured by the financial condition, operations and trends for the other segments or by the effects of corporate allocations of interest, income taxes and other income. In addition, management uses these measures for budget planning purposes. The Company’s management reviews and reports the EQT Production segment results with third-party transportation and processing costs reflected as a deduction from operating revenues as management believes this presentation provides a more useful view of average net sales price and is consistent with industry practices. Third-party costs incurred to gather, process and transport gas produced by EQT Production to market sales points are recorded as a portion of transportation and processing costs in the Statements of Consolidated Income. Purchased gas costs at EQT Midstream include natural gas purchases, including natural gas purchases from affiliates, purchased gas costs adjustments and other gas supply expenses. These purchased gas costs are primarily with affiliates and are eliminated in consolidation. Consistent with the consolidated results, energy trading contracts recorded within storage, marketing and other are reported net within operating revenues, regardless of whether the contracts are physically or financially settled. The Company has reconciled each segment’s operating income to the Company’s consolidated operating income and net income in Note 4 to the Consolidated Financial Statements.
38
EQT Production
Results of Operations
|
|
Years Ended December 31,
|
|||||||||||||||||
|
|
2014
|
2013
|
% change 2014 - 2013
|
2012
|
% change 2013 - 2012
|
|||||||||||||
|
OPERATIONAL DATA
|
|
|
|
|
|
|
||||||||||||
|
Sales volume detail (MMcfe):
|
|
|
|
|
|
|
||||||||||||
|
Horizontal Marcellus Play (a)
|
378,195
|
|
275,029
|
|
37.5
|
|
151,430
|
|
81.6
|
|
||||||||
|
Horizontal Huron Play
|
33,803
|
|
35,255
|
|
(4.1
|
)
|
41,985
|
|
(16.0
|
)
|
||||||||
|
Other
|
64,262
|
|
67,889
|
|
(5.3
|
)
|
71,039
|
|
(4.4
|
)
|
||||||||
|
Total production sales volumes (b)
|
476,260
|
|
378,173
|
|
25.9
|
|
264,454
|
|
43.0
|
|
||||||||
|
Average daily sales volumes (MMcfe/d)
|
1,305
|
|
1,036
|
|
26.0
|
|
723
|
|
43.3
|
|
||||||||
|
Average realized price to EQT Production ($/Mcfe)
|
$
|
3.23
|
|
$
|
3.15
|
|
2.5
|
|
$
|
3.00
|
|
5.0
|
|
|||||
|
Lease operating expenses (LOE), excluding production taxes ($/Mcfe)
|
$
|
0.14
|
|
$
|
0.15
|
|
(6.7
|
)
|
$
|
0.17
|
|
(11.8
|
)
|
|||||
|
Production taxes ($/Mcfe)
|
$
|
0.14
|
|
$
|
0.13
|
|
7.7
|
|
$
|
0.16
|
|
(18.8
|
)
|
|||||
|
Production depletion ($/Mcfe)
|
$
|
1.22
|
|
$
|
1.50
|
|
(18.7
|
)
|
$
|
1.52
|
|
(1.3
|
)
|
|||||
|
DD&A (thousands):
|
|
|
|
|
||||||||||||||
|
Production depletion
|
$
|
582,624
|
|
$
|
568,990
|
|
2.4
|
|
$
|
401,456
|
|
41.7
|
|
|||||
|
Other DD&A
|
10,231
|
|
9,651
|
|
6.0
|
|
8,172
|
|
18.1
|
|
||||||||
|
Total DD&A (thousands)
|
$
|
592,855
|
|
$
|
578,641
|
|
2.5
|
|
$
|
409,628
|
|
41.3
|
|
|||||
|
Capital expenditures (thousands) (c)
|
$
|
2,441,486
|
|
$
|
1,423,185
|
|
71.6
|
|
$
|
991,775
|
|
43.5
|
|
|||||
|
FINANCIAL DATA (thousands)
|
|
|
|
|
||||||||||||||
|
Revenues:
|
||||||||||||||||||
|
Production sales
|
$
|
1,504,196
|
|
$
|
1,190,293
|
|
26.4
|
|
$
|
794,165
|
|
49.9
|
|
|||||
|
Gain (loss) for hedging ineffectiveness
|
24,774
|
|
(21,335
|
)
|
(216.1
|
)
|
(75
|
)
|
28,346.7
|
|
||||||||
|
Gain (loss) on derivatives not designated as hedges
|
83,760
|
|
(301
|
)
|
(27,927.2
|
)
|
(317
|
)
|
(5.0
|
)
|
||||||||
|
Total net operating revenues
|
$
|
1,612,730
|
|
$
|
1,168,657
|
|
38.0
|
|
$
|
793,773
|
|
47.2
|
|
|||||
|
Operating expenses:
|
|
|
|
|
||||||||||||||
|
LOE, excluding production taxes
|
65,917
|
|
57,110
|
|
15.4
|
|
46,212
|
|
23.6
|
|
||||||||
|
Production taxes
|
67,571
|
|
50,981
|
|
32.5
|
|
49,943
|
|
2.1
|
|
||||||||
|
Exploration expense
|
21,665
|
|
18,483
|
|
17.2
|
|
10,370
|
|
78.2
|
|
||||||||
|
SG&A
|
118,816
|
|
92,197
|
|
28.9
|
|
89,707
|
|
2.8
|
|
||||||||
|
DD&A
|
592,855
|
|
578,641
|
|
2.5
|
|
409,628
|
|
41.3
|
|
||||||||
|
Impairment of long-lived assets
|
267,339
|
|
—
|
|
100.0
|
|
—
|
|
—
|
|
||||||||
|
Total operating expenses
|
1,134,163
|
|
797,412
|
|
42.2
|
|
605,860
|
|
31.6
|
|
||||||||
|
Gain on sale / exchange of assets
|
27,383
|
|
—
|
|
100.0
|
|
—
|
|
—
|
|
||||||||
|
Operating income
|
$
|
505,950
|
|
$
|
371,245
|
|
36.3
|
|
$
|
187,913
|
|
97.6
|
|
|||||
39
(a)
Includes Upper Devonian wells.
(b)
NGLs and crude oil were converted to Mcfe at the rate of six Mcfe per barrel for all periods.
(c)
Includes
$167.3 million
of cash capital expenditures and
$349.2 million
of non-cash capital expenditures for the exchange of assets with Range during the year ended December 31, 2014;
$114.2 million
of cash capital expenditures for the purchase of acreage and Marcellus wells from Chesapeake Energy Corporation and its partners (Chesapeake) during the year ended December 31,
2013
; and certain labor overhead costs including a portion of non-cash stock-based compensation expense and non-cash capital expense accruals that were not paid at the applicable year-end.
Year Ended December 31,
2014
vs. December 31,
2013
EQT Production’s operating income totaled
$506.0 million
for
2014
compared to
$371.2 million
for
2013
. The
$134.8 million
increase in operating income was primarily due to increased sales of produced natural gas and NGLs and a higher average realized price partially offset by an increase in operating expenses, which includes
$267.3 million
of noncash impairment charges. Impairment charges consist of $105.2 million associated with proved properties in the Permian Basin of Texas related to the 2014 decline in commodity prices. Impairment charges also include $86.6 million associated with undeveloped properties and $75.5 million associated with proved properties in the Utica Shale of Ohio as a result of insufficient recovery of hydrocarbons to support continued development along with the decline in commodity prices.
Total net operating revenues were
$1,612.7 million
for
2014
compared to
$1,168.7 million
for
2013
. The
$444.0 million
increase in total net operating revenues was primarily due to a
26%
increase in production sales volumes, a favorable gain on derivatives not designated as hedges, a favorable change in hedging ineffectiveness and a
3%
increase in the average realized price to EQT Production. The increase in production sales volumes was the result of increased production from the 2014 and 2013 drilling programs, primarily in the Marcellus play. This increase was partially offset by the normal production decline in the Company’s producing wells.
Total net operating revenues for the year ended December 31, 2014 included a $24.8 million gain for hedging ineffectiveness of financial hedges compared to a $21.3 million loss for ineffectiveness of financial hedges for the year ended December 31, 2013. The year ended December 31, 2014 also included $83.8 million of derivative gains for derivative instruments not designated as hedging instruments compared to $0.3 million of derivative losses for the year ended December 31, 2013. The gains for the year ended December 31, 2014 relate to favorable changes in the fair market value of basis swaps and NYMEX collars that were not designated as hedging instruments, due to decreased NYMEX and basis prices as of December 31, 2014. The $83.8 million of derivative gains for derivative instruments not designated as hedging instruments for the year ended December 31, 2014 included $36.5 million of cash settlements received, which is included in the average price discussion above.
The
$0.08
per Mcfe increase in the average realized price to EQT Production was the net result of an increase in the average NYMEX natural gas price net of cash settled derivatives combined with a per unit decrease in midstream revenue deductions, partly offset by a lower average natural gas differential of $0.40 per Mcf. The average differential includes lower Appalachian Basin basis of $0.91 per Mcf, favorable recoveries of $0.45 per Mcf and favorable settlements of basis swaps of $0.06 per Mcf. Recoveries represent differences in natural gas prices between the Appalachian Basin and the sales points of other markets reached by utilizing transportation capacity, differences in natural gas prices between Appalachian Basin and fixed price sales contracts, term sales with fixed differentials to NYMEX and other marketing activity, including capacity releases. For the year ended December 31, 2014, EQT Production recognized higher recoveries compared to 2013 primarily by using its contracted transportation capacity to sell gas in higher priced markets, particularly during the winter months when market prices in the United States Northeast region were significantly higher than the Appalachian Basin prices. Much of these higher revenues resulted from sales off of the Company’s Texas Eastern Transmission (TETCO) and Tennessee Gas Pipeline capacity, including additional TETCO capacity that came online in 2014. Effective February 2014, the Company acquired new TETCO capacity of 245,000 MMBtu per day that enables the Company to reach markets in eastern Pennsylvania. Effective November 2014, additional TETCO capacity of 300,000 MMBtu per day came online that enables the Company to reach markets in New Jersey as well as markets along the Gulf coast. Additionally, the Company executed natural gas sales with fixed differentials to NYMEX for the 2014 summer term during the fourth quarter of 2013 and first quarter of 2014 when market prices were favorable compared to actual Appalachian Basin basis during the summer of 2014.
Operating expenses totaled
$1,134.2 million
for
2014
compared to
$797.4 million
for
2013
. The increase in operating expenses was the result of impairments of long-lived assets of $267.3 million, as previously mentioned, and increases in SG&A, production taxes, DD&A, LOE and exploration expenses. SG&A expense increased in 2014 primarily as a result of higher personnel costs of $12.4 million, including incentive compensation expenses, higher litigation and environmental reserves of $6.2 million,
40
and an increase in professional services of $4.9 million. Production taxes increased due to an $11.6 million increase in severance taxes and property taxes as a result of higher market sales prices and higher production sales volumes in certain jurisdictions subject to these taxes. Production taxes also increased due to a $5.1 million increase in the Pennsylvania impact fee, primarily as a result of an increase in the number of wells drilled in Pennsylvania. Depletion expense increased as a result of higher production sales volumes in 2014 partially offset by a lower overall depletion rate. The increase in LOE was mainly a result of increased Marcellus activity in 2014, including a $2.8 million increase in salt water disposal expenses and a $2.7 million increase in labor expenses, along with expenses related to the exchange of properties with Range. Exploration expense increased in 2014 primarily as a result of increased geophysical activity compared to the prior year.
In connection with an asset exchange with Range during the second quarter of 2014, the Company received acreage and producing wells in the Permian Basin of Texas in exchange for acreage, producing wells, the Company’s 50% ownership interest in a supporting gathering system in the Nora fields of Virginia and cash of
$167.3 million
. In conjunction with the transaction, EQT Production recognized a pre-tax gain of $27.4 million in 2014, which is included in gain on sale / exchange of assets in the Statements of Consolidated Income. The $27.4 million pre-tax gain included a $28.0 million pre-tax gain related to the de-designation of certain derivative instruments that were previously designated as cash flow hedges because it was probable that the forecasted transactions would not occur. Any subsequent changes in fair value of these derivative instruments will be recognized within the results of operations for EQT Production.
Year Ended December 31,
2013
vs. December 31,
2012
EQT Production’s operating income totaled
$371.2 million
for
2013
compared to
$187.9 million
for
2012
. The
$183.3 million
increase in operating income was primarily due to increased sales of produced natural gas and NGLs and a higher average realized price partially offset by an increase in operating expenses.
Total net operating revenues were
$1,168.7 million
for
2013
compared to
$793.8 million
for
2012
. The
$374.9 million
increase in total net operating revenues was primarily due to a
43%
increase in production sales volumes and a 5% increase in the average realized price to EQT Production. The increase in production sales volumes was the result of increased production from the 2012 and 2011 drilling programs, primarily in the Marcellus play. This increase was partially offset by the normal production decline in the Company’s producing wells.
The $0.15 per Mcfe increase in the average realized price to EQT Production was the net result of a per unit decrease in midstream revenue deductions and an increase in the average NYMEX natural gas price net of cash settled derivatives, partly offset by a lower average natural gas differential of $0.28 per Mcf and lower NGL prices. The average differential includes lower Appalachian Basin basis of $0.13 per Mcf and lower recoveries of $0.15 per Mcf. The lower recoveries primarily related to decreases in the sales of unused capacity.
Total net operating revenues for the year ended December 31, 2013 included a $21.3 million loss for hedging ineffectiveness of financial hedges compared to a $0.1 million loss for ineffectiveness of financial hedges in the year ended December 31, 2012.
Operating expenses totaled $797.4 million for 2013 compared to $605.9 million for 2012. The increase in operating expenses was the result of increases in DD&A, LOE, exploration expenses, SG&A and production taxes. Depletion expense increased as a result of higher production sales volumes in 2013 partially offset by a slightly lower overall depletion rate. The increase in LOE was mainly a result of increased Marcellus activity in 2013, including a $6.5 million increase in salt water disposal expenses and a $3.1 million increase in labor expenses in that region. The increase in exploration expense was due to increased impairments of unproved lease acreage of $8.7 million resulting from lease expirations during 2013, slightly offset by a reduction in geophysical activity compared to the prior year. SG&A expense increased in 2013 primarily as a result of higher personnel costs of $4.6 million, including incentive compensation expenses, and higher environmental reserves of $1.9 million partially offset by a decrease in franchise taxes of $2.2 million.
Production taxes increased primarily due to an increase in severance and property taxes related to higher market sales prices and higher production sales volumes. Severance and property taxes were offset by a $3.1 million decrease in the Pennsylvania impact fee. During 2013, the Pennsylvania impact fee was $12.2 million compared to $15.3 million in 2012, of which $6.7 million represented a retroactive fee for pre-2012 Marcellus wells.
41
EQT Midstream
Results of Operations
|
|
Years Ended December 31,
|
|||||||||||||||||
|
|
2014
|
2013
|
% change 2014 - 2013
|
2012
|
% change 2013 - 2012
|
|||||||||||||
|
OPERATIONAL DATA
|
|
|
|
|
|
|
|
|
|
|
||||||||
|
Gathered volumes (BBtu)
|
590,492
|
|
466,405
|
|
26.6
|
|
335,407
|
|
39.1
|
|
||||||||
|
Average gathering fee ($/MMBtu)
|
$
|
0.67
|
|
$
|
0.75
|
|
(10.7
|
)
|
$
|
0.90
|
|
(16.7
|
)
|
|||||
|
Gathering and compression expense ($/MMBtu)
|
$
|
0.14
|
|
$
|
0.18
|
|
(22.2
|
)
|
$
|
0.24
|
|
(25.0
|
)
|
|||||
|
Transmission pipeline throughput (BBtu)
|
654,785
|
|
418,360
|
|
56.5
|
|
221,944
|
|
88.5
|
|
||||||||
|
Net operating revenues (thousands):
|
|
|
|
|
||||||||||||||
|
Gathering
|
$
|
397,878
|
|
$
|
351,410
|
|
13.2
|
|
$
|
302,255
|
|
16.3
|
|
|||||
|
Transmission
|
226,497
|
|
160,621
|
|
41.0
|
|
104,501
|
|
53.7
|
|
||||||||
|
Storage, marketing and other
|
30,729
|
|
33,555
|
|
(8.4
|
)
|
42,693
|
|
(21.4
|
)
|
||||||||
|
Total net operating revenues
|
$
|
655,104
|
|
$
|
545,586
|
|
20.1
|
|
$
|
449,449
|
|
21.4
|
|
|||||
|
Capital expenditures (thousands) (a)
|
$
|
455,359
|
|
$
|
369,399
|
|
23.3
|
|
$
|
375,731
|
|
(1.7
|
)
|
|||||
|
FINANCIAL DATA (thousands)
|
|
|
|
|
||||||||||||||
|
Total operating revenues
|
$
|
699,083
|
|
$
|
614,042
|
|
13.8
|
|
$
|
505,498
|
|
21.5
|
|
|||||
|
Purchased gas costs
|
43,979
|
|
68,456
|
|
(35.8
|
)
|
56,049
|
|
22.1
|
|
||||||||
|
Total net operating revenues
|
655,104
|
|
545,586
|
|
20.1
|
|
449,449
|
|
21.4
|
|
||||||||
|
Operating expenses:
|
|
|
|
|
||||||||||||||
|
Operating and maintenance (O&M)
|
108,359
|
|
97,540
|
|
11.1
|
|
97,400
|
|
0.1
|
|
||||||||
|
SG&A
|
82,165
|
|
63,850
|
|
28.7
|
|
49,943
|
|
27.8
|
|
||||||||
|
DD&A
|
87,034
|
|
75,032
|
|
16.0
|
|
64,782
|
|
15.8
|
|
||||||||
|
Total operating expenses
|
277,558
|
|
236,422
|
|
17.4
|
|
212,125
|
|
11.5
|
|
||||||||
|
Gain on sale / exchange of assets (b)
|
6,763
|
|
19,618
|
|
(65.5
|
)
|
—
|
|
100.0
|
|
||||||||
|
Operating income
|
$
|
384,309
|
|
$
|
328,782
|
|
16.9
|
|
$
|
237,324
|
|
38.5
|
|
|||||
(a)
Includes certain labor overhead costs including a portion of non-cash stock-based compensation expense and capital accruals not paid as of the respective year end.
(b)
As discussed in Note 7 to the Company’s Consolidated Financial Statements, in connection with an asset exchange with Range during the second quarter of 2014, the Company received acreage and producing wells in the Permian Basin of Texas in exchange for acreage, producing wells, the Company’s 50% ownership interest in a supporting gathering system in the Nora field of Virginia and cash of $167.3 million. In conjunction with this transaction, EQT Midstream recognized a pre-tax gain of $6.8 million, which is included in gain on sale / exchange of assets in the Statement of Consolidated Income for the year ended December 31, 2014.
42
Year Ended December 31,
2014
vs. December 31,
2013
EQT Midstream’s operating income totaled $384.3 million, an increase of
$55.5 million
in 2014 compared to 2013. The increase was the result of increased transmission and gathering net operating revenues partly offset by increased operating expenses, lower gains on asset sales and a decrease in storage, marketing and other net operating revenues.
Transmission net operating revenues increased by
$65.9 million
as a result of higher firm transmission contracted capacity and throughput of $61.9 million for third parties and EQT Production, including $14.7 million related to the AVC facilities, and higher interruptible transmission service. The increase in transmission net operating revenues is the result of increased development activity in the Marcellus Shale.
Gathering net operating revenues increased due to a
27%
increase in gathered volumes partly offset by an
11%
decrease in the average gathering fee. The gathered volume increase was primarily driven by higher affiliate volumes, which accounted for 84% of the increase, as a result of increased activity in the Marcellus play. The average gathering fee decreased due to a higher mix of gathered volumes in the Marcellus play as these volumes have a lower average fee compared to Huron and other volumes.
These increases in net operating revenues were partly offset by a decrease in storage, marketing and other net operating revenues as a result of $9.3 million of reduced marketing revenues primarily as a result of the sale of certain energy marketing contracts on December 31, 2013 and
$9.0 million
of lower revenues on NGLs marketed for non-affiliated producers as a result of lower prices and volumes, partly offset by increased storage revenues on the AVC facilities.
Total operating revenues increased
$85.0 million
primarily as a result of increased transmission and gathering revenue, partly offset by reduced gas marketing activity. Total purchased gas costs decreased
$24.5 million
primarily as a result of reduced gas marketing activity.
Operating expenses totaled $277.5 million, an increase of
$41.1 million
in 2014 compared to 2013. O&M expense increased as a result of $8.6 million in higher compression and pipeline operating expenses related to an increase in Marcellus activity and operating the AVC facilities as well as higher labor costs. The increase in SG&A was primarily the result of increased personnel costs including incentive compensation of $9.8 million, increased overhead allocated from affiliates of $4.2 million and increased professional services of $2.3 million. DD&A increased as a result of additional assets placed in-service, including the AVC facilities.
In
2013
, the Company sold certain energy marketing contracts to a third party for
$20.0 million
. In conjunction with this transaction, the Company recognized a pre-tax gain of
$19.6 million
in
2013
. In connection with an asset exchange with Range during 2014, the Company received acreage and producing wells in the Permian Basin of Texas in exchange for acreage, producing wells, the Company’s 50% ownership interest in a supporting gathering system in the Nora field of Virginia and cash of $167.3 million. In conjunction with this transaction, EQT Midstream recognized a pre-tax gain of $6.8 million. The difference in the gains on these two transactions resulted in the decrease in gain on sale / exchange of assets in 2014 compared to 2013.
Year Ended December 31,
2013
vs. December 31,
2012
EQT Midstream’s operating income totaled
$328.8 million
for
2013
compared to
$237.3 million
for
2012
. The increase in operating income was primarily the result of increased transmission and gathering net operating revenues and gains on asset sales, partly offset by increased operating expenses and a decrease in storage, marketing and other net operating revenues.
The
$96.1 million
increase in total net operating revenues was due to a
$56.1 million
increase in transmission net operating revenues and
$49.2 million
increase in gathering net operating revenues, partially offset by a decrease in storage, marketing and other net operating revenues.
Transmission net operating revenues increased from the prior year primarily as a result of
$44.0 million
of additional firm capacity reservation revenues and usage charges,
$10.1 million
of fees associated with transported volumes in excess of firm capacity and increased pipeline safety revenues.
Gathering net operating revenues increased due to a
39%
increase in gathered volumes, partly offset by a
17%
decrease in the average gathering fee. The gathered volume increase was driven by higher volumes gathered for EQT Production in the Marcellus play. The average gathering fee decreased due to the mix of gathered volumes as Marcellus volumes increased while Huron and other volumes, which have a higher gathering fee, decreased.
43
Storage, marketing and other net operating revenues decreased from the prior year primarily as a result of lower realized margins and reduced activity due to lower price spreads. In addition, revenues on NGLs marketed for non-affiliated producers decreased by
$2.8 million
primarily as a result of lower liquids pricing partially offset by slightly higher liquids volumes.
On December 31,
2013
, the Company sold certain energy marketing contracts to a third party for
$20.0 million
. These contracts were natural gas sales agreements with approximately
1,000
end use customers with total volumes of approximately
12
Bcf in
2013
. In conjunction with this transaction, the Company recognized a pre-tax gain of
$19.6 million
in
2013
, which is included in gain on sale / exchange of assets in the Statements of Consolidated Income.
Total operating revenues increased
$108.5 million
primarily as a result of the increase in gathered volumes and increased transmission revenue, partly offset by the lower gathering rate. Total purchased gas costs increased
$12.4 million
primarily as a result of an increase in commodity prices.
Operating expenses totaled
$236.4 million
for
2013
compared to
$212.1 million
for
2012
. The increase in SG&A was primarily the result of increased personnel costs of
$5.9 million
including incentive compensation expenses,
$2.2 million
of increased overhead allocated from affiliates, a
$2.1 million
unfavorable change in bad debt expense primarily as a result of lower recoveries from the Lehman Brothers settlement in
2013
and
$2.0 million
of lower reserve reductions in
2013
, primarily related to the expected recovery of a long-term, volume-based regulatory asset. DD&A increased as a result of additional assets placed in-service. O&M expenses were flat to the prior year as increases in personnel and other gathering and transmission business expenses in
2013
were offset by reduced compressor operating expenses.
Other Income
|
|
Years Ended December 31,
|
|||||||||||
|
|
2014
|
2013
|
2012
|
|||||||||
|
|
(Thousands)
|
|||||||||||
|
Other income
|
$
|
6,853
|
|
$
|
9,242
|
|
$
|
15,536
|
|
|||
Other income includes equity in earnings of nonconsolidated investments, primarily the Company’s prior investment in Nora LLC, of
$3.4 million
,
$7.6 million
and
$6.1 million
for the years ended December 31,
2014
,
2013
and
2012
, respectively. In connection with the asset exchange with Range in 2014, the Company transferred its 50% ownership interest in Nora LLC to Range.
Other income for the year ended December 31,
2014
also included
$3.2 million
of AFUDC compared to
$1.2 million
of AFUDC in
2013
, a
$2.0 million
increase primarily as a result of construction activity on the late 2013 acquisition of the AVC and the Jefferson Expansion project.
Other income for the year ended December 31,
2013
also included
$1.2 million
of AFUDC compared to
$6.8 million
of AFUDC in
2012
, a
$5.6 million
decrease as a result of the Sunrise Pipeline being placed into service during the third quarter of 2012. The Company also recognized a gain on the sale of leases of
$0.4 million
in
2013
compared to a gain on the sale of leases of
$2.0 million
in
2012
.
Interest Expense
|
|
Years Ended December 31,
|
|||||||||||
|
|
2014
|
2013
|
2012
|
|||||||||
|
|
|
|
(Thousands)
|
|
|
|||||||
|
Interest expense
|
$
|
136,537
|
|
$
|
142,688
|
|
$
|
184,786
|
|
|||
Interest expense decreased
$6.2 million
in
2014
compared to
2013
due to higher capitalized interest of
$35.0 million
on increased Marcellus well development in
2014
compared to
$22.9 million
in
2013
, partially offset by an increase in interest expense of $8.3 million related to the Partnership’s issuance of 4.00% Senior Notes due 2024 in the aggregate principal amount of $500.0 million during the third quarter of 2014.
44
Interest expense decreased
$42.1 million
in
2013
compared to
2012
primarily as a result of a
$23.3 million
payment to settle a forward-starting interest rate swap recorded as expense in
2012
and the Company’s repayment of
$200.0 million
of
5.15%
senior notes that matured in the fourth quarter of
2012
. This decrease was also attributable to higher capitalized interest of
$22.9 million
on increased Marcellus well development in
2013
compared to
$15.6 million
in
2012
.
During the third quarter of 2011, the Company entered into an interest rate hedge in anticipation of refinancing $200.0 million of long-term debt scheduled to mature in November 2012. The Company retired the debt using cash on hand and recognized a $23.3 million expense in the year ended December 31, 2012 to close the interest rate hedge.
The weighted average annual interest rates on the Company’s long-term debt, excluding the Partnership’s long-term debt, was
6.4%
for
2014
,
2013
and
2012
. The weighted average annual interest rate on the Partnership’s long-term debt was 4.0% for
2014
. The Partnership had no long-term debt outstanding in 2013 and 2012. The Company did not have any short-term loans outstanding at any time during the years ended December 31, 2014 and 2012. The maximum amount of outstanding short-term loans at any time under the Company’s credit facility during the year ended December 31,
2013
was
$178.5 million
. The average daily balance of short-term loans outstanding for the Company during the year ended December 31,
2013
was approximately
$12.1 million
at a weighted average annual interest rate of
1.7%
. The maximum amount of outstanding short-term loans at any time under the Partnership’s credit facility during the year ended December 31, 2014 was
$450 million
, and the average daily balance of short-term loans outstanding was approximately
$119 million
at a weighted average annual interest rate of
1.7%
. The Partnership had
no
short-term loans outstanding at any time during the years ended December 31, 2013 and 2012.
Income Taxes
|
|
Years Ended December 31,
|
|||||||||||
|
|
2014
|
2013
|
2012
|
|||||||||
|
|
(Thousands)
|
|||||||||||
|
Income taxes
|
$
|
214,092
|
|
$
|
175,186
|
|
$
|
71,461
|
|
|||
Income tax expense increased
$38.9 million
in 2014 compared to 2013 as a result of higher pre-tax income partly offset by a decrease in the Company’s effective income tax rate from
33.6%
to
29.6%
. The decrease in the rate in 2014 compared to 2013 was primarily related to an internal reorganization of subsidiaries resulting in a reduction of state taxes as well as an increase in noncontrolling interests related to the Partnership’s ownership structure. For both periods, the overall rate was lower than the federal statutory rate as the Company consolidates 100% of the pre-tax income related to the noncontrolling public limited partners’ share of partnership earnings, but is not required to record an income tax provision with respect to the portion of the Partnership’s earnings allocated to the noncontrolling public limited partners. The Partnership’s earnings increased primarily due to the Sunrise Merger in 2013 and the Jupiter Transaction in 2014, each of which also resulted in increases in the noncontrolling limited public partners’ share of partnership earnings (as described in Note 3 to the Consolidated Financial Statements).
Income tax expense increased
$103.7 million
in 2013 compared to 2012 as a result of higher pre-tax income and an increase in the Company’s effective income tax rate from
32.4%
to
33.6%
. The increase in the rate from
2012
to
2013
was primarily due to an increase in pre-tax book income on state tax paying entities as well as a shift in the Company’s business to states with higher income tax rates. This was partially offset by state tax benefits of
$9.8 million
realized in 2013 primarily related to the Sunrise Merger and the Equitable Gas Transaction which allowed the Company to utilize NOLs that had previously been fully reserved. As described in the preceding paragraph, the overall rate was reduced in both periods because the Company is not required to record an income tax provision with respect to the portion of the Partnership’s earnings allocated to its noncontrolling public limited partners.
The Company was in an overall federal taxable income position for
2014
and
2013
primarily as a result of the Jupiter Transaction in 2014 and taxable gains generated from the Sunrise Merger and the Equitable Gas Transaction in 2013. The Company was in an overall federal tax net operating loss (NOL) position for
2012
. Starting in 2013, the Company began to utilize the NOLs it generated in previous years. For federal income tax purposes, the Company deducts a portion of drilling costs as intangible drilling costs (IDCs) in the year incurred. IDCs, however, are sometimes limited for purposes of the alternative minimum tax (AMT) and can result in the Company paying AMT even when utilizing a regular tax NOL. See Note 9 to the Consolidated Financial Statements for further discussion of the Company’s income taxes.
45
Income from Discontinued Operations, Net of Tax
|
|
Years Ended December 31,
|
|||||||||||
|
|
2014
|
2013
|
2012
|
|||||||||
|
|
(Thousands)
|
|||||||||||
|
Income from discontinued operations, net of tax
|
$
|
1,371
|
|
$
|
91,843
|
|
$
|
47,493
|
|
|||
Income from discontinued operations, net of tax, was
$1.4 million
for the year ended December 31,
2014
compared to
$91.8 million
for the year ended December 31,
2013
. On December 17, 2013, the Company and Distribution Holdco, LLC completed the disposition of their ownership interests in Equitable Gas and Homeworks to PNG Companies LLC. Income from discontinued operations in 2014 resulted from working capital adjustments to the sales price completed in 2014.
Income from discontinued operations, net of tax, was
$91.8 million
for the year ended December 31,
2013
compared to
$47.5 million
for the year ended December 31,
2012
. The
$44.3 million
increase in
2013
compared to
2012
was primarily the result of a
$43.8 million
gain recognized on the Equitable Gas Transaction during
2013
. Excluding the gain recognized on the Equitable Gas Transaction, results for discontinued operations were relatively unchanged in 2013 compared to 2012 as favorable adjustments for the completion of a regulatory gas cost audit and colder weather in
2013
were offset by reduced revenues as a result of competitive contract renewals and an increase in bad debt expense.
Net Income Attributable to Noncontrolling Interests
|
|
Years Ended December 31,
|
|||||||||||
|
|
2014
|
2013
|
2012
|
|||||||||
|
|
(Thousands)
|
|||||||||||
|
Net income attributable to noncontrolling interests
|
$
|
124,025
|
|
$
|
47,243
|
|
$
|
13,016
|
|
|||
Net income attributable to noncontrolling interests of the Partnership was
$124.0 million
for the year ended December 31,
2014
compared to
$47.2 million
for the year ended December 31,
2013
. The increase resulted from higher capacity reservation revenues and higher gathering revenues in the Partnership, as well as increased noncontrolling interests in 2014. Noncontrolling interests in the Partnership increased from
55.4%
to
63.6%
during the year ended December 31,
2014
as a result of the underwritten public offering of additional common units representing limited partner interests in the Partnership in May 2014 in connection with the Jupiter Transaction.
Net income attributable to noncontrolling interests of the Partnership was
$47.2 million
for the year ended December 31,
2013
compared to
$13.0 million
for the year ended December 31,
2012
. The increase resulted from higher capacity reservation revenues in the Partnership, which completed its IPO in the third quarter of
2012
, as well as increased noncontrolling interests in
2013
. Noncontrolling interests in the Partnership increased from
40.6%
to
55.4%
during the year ended December 31,
2013
as a result of the underwritten public offering of additional common units representing limited partner interests in the Partnership in July
2013
in connection with the Sunrise Merger.
46
Outlook
The Company is committed to profitably developing its natural gas, NGL and oil reserves through environmentally responsible, cost-effective and technologically advanced horizontal drilling. The market price for commodities can be volatile and these fluctuations can impact, among other things, the Company’s revenues, earnings, liquidity, reserves, DD&A rates and development plans.
Average daily prices for NYMEX West Texas Intermediate crude oil ranged from a high of $107.26 per barrel to a low of $44.45 per barrel from January 1, 2014 through February 9, 2015. Average daily prices for NYMEX Henry Hub natural gas ranged from a high of $6.15 per MMBtu to a low of $2.58 per MMBtu from January 1, 2014 through February 9, 2015. In addition, the market price for natural gas in the Appalachian Basin continues to be lower relative to Henry Hub as a result of the increased supply of natural gas in the Northeast region. In January 2015, in response to decreases in commodity prices in late 2014, the Company reduced its 2015 capital expenditure spending plan, excluding acquisitions, by approximately $450 million. The Company is unable to predict future potential movements in the market price for natural gas, including Appalachian basis, oil and NGLs and thus, cannot predict the ultimate impact of prices on its operations. If commodity prices continue to trend lower as they did in the latter part of 2014, reduced operating cash flows could signal a need to further reduce capital spending.
The Company believes the outlook for its businesses is favorable despite the continued uncertainty of natural gas, NGL and oil prices. The Company’s resource base, financial strength, risk management, including commodity hedging strategy and disciplined investment of capital provide it with an opportunity to exploit and develop its positions and maximize efficiency through economies of scale in its key operating areas.
Total capital investment, excluding acquisitions, is expected to be approximately $2.55 billion in
2015
, revised from the Company’s previous estimate of approximately $3.0 billion, to reflect the current decrease in commodity prices. Capital spending for well development (primarily drilling) in
2015
is expected to be approximately
$1.85 billion
, to support the drilling of approximately
191
gross wells, including
122
Marcellus wells,
59
Upper Devonian wells and
10
other wells. Estimated sales volumes are expected to be 575 - 600 Bcfe for an anticipated production sales volume growth of approximately 23% in
2015
, while NGL volumes are expected to be 9,000 - 10,000 Mbbls. To support continued growth in production, the Company plans to invest approximately $0.7 billion on midstream infrastructure in
2015
. The
2015
capital spending plan is expected to be funded by cash on hand, cash flow generated from operations, proceeds from midstream asset sales (dropdowns) to the Partnership and Partnership capital raises.
In July 2014, the Partnership announced that it will construct and own the Ohio Valley Connector (OVC) pipeline. The OVC includes a
36
-mile pipeline that will extend the Partnership’s transmission and storage system from northern West Virginia to Clarington, Ohio, at which point it will interconnect with the Rockies Express Pipeline and the Texas Eastern Pipeline. In December 2014, the Partnership submitted the OVC certificate application to the FERC and anticipates receiving the certificate in the second half of 2015. Subject to FERC approval, construction is scheduled to begin in the third quarter of 2015 and the pipeline is expected to be in-service by mid-year 2016. The OVC will provide approximately 850 BBtu per day of transmission capacity and the 36-mile pipeline portion is estimated to cost approximately $300 million, of which $120 million to $130 million is expected to be spent in 2015. The Partnership has entered into a
20
-year precedent agreement with the Company for a total of
650
BBtu per day of firm transmission capacity on the OVC.
In September 2014, the Company and an affiliate of NextEra Energy, Inc. announced the formation of the MVP LLC joint venture that will construct and own the MVP. The Company expects to transfer its interest in MVP LLC to the Partnership. The approximately
300
-mile pipeline will extend from the Partnership’s existing transmission and storage system in Wetzel County, West Virginia to Pittsylvania County, Virginia. The Company expects that the Partnership will own the largest interest in the joint venture and will operate the MVP, which is estimated to cost a total of approximately $2.5 billion to $3.5 billion, excluding AFUDC, with the Partnership funding its proportionate share through capital contributions made to the joint venture. In 2015, the Partnership’s capital contributions are expected to be approximately $75 million to $85 million and will be primarily in support of environmental and land assessments, design work and materials. This investment is included in the midstream totals above. Expenditures are expected to increase substantially as construction commences, with the bulk of the expenditures expected to be made in 2017 and 2018. The joint venture has secured a total of
2.0
Bcf per day of firm capacity commitments at
20
-year terms and is currently in negotiation with additional shippers who have expressed interest in the MVP project. As a result, the final project scope, including pipe diameter and total capacity, has not yet been determined; however the voluntary pre-filing process with the FERC began in October 2014. The pipeline, which is subject to FERC approval, is expected to be in-service during the fourth quarter of 2018.
47
In December 2014, the Company announced that it intends to file a registration statement with the SEC for an IPO of common units of a master limited partnership (HoldCo) that will own the general partner and the incentive distribution rights of the Partnership, as well as the Company’s 21.3 million limited partner units. EQT will file a registration statement for the IPO with the SEC during the first quarter of 2015. Under the proposed structure, EQT expects to sell a small percentage of HoldCo to the public in the IPO, subject to market conditions. At the close of the IPO, EQT would own the general partner of HoldCo, and more than 80% percent of HoldCo’s common units. EQT intends to use the net proceeds from the IPO for the development of its existing assets, future capital expenditures, and general corporate purposes.
The Company continues to focus on creating and maximizing shareholder value through the implementation of a strategy that economically accelerates the monetization of its asset base and prudently pursues investment opportunities, all while maintaining a strong balance sheet with solid cash flow. While the tactics continue to evolve based on market conditions, the Company is considering arrangements, including asset sales and joint ventures, to monetize the value of certain mature assets for re-deployment into its highest value development opportunities.
Capital Resources and Liquidity
The Company’s primary sources of cash for the year ended December 31, 2014 were cash flows from operating activities, proceeds from the underwritten public offering of the Partnership’s common units and proceeds from the Partnership’s issuance of long-term debt. The Company’s primary use of cash in 2014 was for capital expenditures.
Operating Activities
The Company’s net cash provided by operating activities increased
$251.8 million
from
$1,162.9 million
in 2013 to
$1,414.7 million
in 2014. The increase in operating activities was primarily the result of a 26% increase in natural gas and NGL volumes sold, increases in contracted transmission capacity and gathered volumes and a $14.6 million decrease in interest payments, partially offset by a $41.1 million increase in income tax payments primarily due to taxes paid on transactions.
The Company’s net cash provided by operating activities increased $366.1 million from $796.8 million in 2012 to $1,162.9 million in 2013. The increase was primarily attributable to a 43% increase in natural gas and NGL volumes sold, increases in transmission pipeline throughput and gathered volumes and a $44.7 million decrease in interest payments, partially offset by a $136.1 million increase in income tax payments primarily due to taxes paid on the Sunrise Merger and Equitable Gas Transaction.
While the Company is unable to predict future movements in the market price for commodities, current prices are lower than average 2014 levels. If current low price trends continue, this trend would negatively impact the Company’s cash flows from operating activities during the year ended December 31, 2015.
Investing Activities
Cash flows used in investing activities totaled $2,444.2 million for 2014 as compared to $999.8 million for 2013. The $1,444.4 million increase was primarily attributable to higher capital expenditures in 2014 including the $167.3 million payment in 2014 in connection with the Range asset exchange, compared to proceeds received from the Equitable Gas Transaction of $740.6 million in 2013. As further described below, the Company increased cash capital expenditures from continuing operations by $724.9 million from 2013 to 2014.
Cash flows used in investing activities totaled $999.8 million for 2013 as compared to $1,370.5 million for 2012. The $370.7 million decrease was attributable to the proceeds received from the Equitable Gas Transaction of $740.6 million and from the sale of certain energy marketing contracts of $23.0 million, partially offset by higher capital expenditures in 2013. As further described below, the Company increased cash capital expenditures from continuing operations by $380.1 million from 2012 to 2013.
48
Capital Expenditures for Continuing Operations
($ in millions)
|
|
2014 Actual
|
2013 Actual
|
2012 Actual
|
||||||||
|
Well development (primarily drilling)
|
$
|
1,717
|
|
$
|
1,237
|
|
$
|
857
|
|
||
|
Property acquisitions
|
724
|
|
186
|
|
135
|
|
|||||
|
Midstream infrastructure
|
455
|
|
369
|
|
376
|
|
|||||
|
Other corporate items
|
4
|
|
5
|
|
3
|
|
|||||
|
Total
|
$
|
2,900
|
|
$
|
1,797
|
|
$
|
1,371
|
|
||
|
Less: non-cash *
|
448
|
|
70
|
|
24
|
|
|||||
|
Total cash capital expenditures
|
$
|
2,452
|
|
$
|
1,727
|
|
$
|
1,347
|
|
||
*
The Company capitalizes certain labor overhead costs including a portion of non-cash stock-based compensation expense and capital accruals that have not yet been paid. These accrued capital expenditures in the table above were $99 million, $70 million and $24 million for the years ended December 31, 2014, 2013 and 2012, respectively. The year ended December 31, 2014 also included $349 million of non-cash capital expenditures for the exchange of assets with Range.
The Company is estimating a 2015 capital expenditure spending plan of approximately $2.55 billion, including $1.85 billion for well development (primarily drilling) and $0.7 billion for midstream infrastructure. The Company does not forecast property acquisitions within its capital spending plan.
Capital expenditures for drilling and development totaled $1,717 million and $1,237 million during 2014 and 2013, respectively. The Company spud 345 gross wells (342 net wells) in 2014, including 196 horizontal Marcellus wells with approximately 1.1 million feet of pay, 41 horizontal Upper Devonian wells with approximately 260,000 feet of pay, 103 horizontal Huron wells with approximately 605,000 feet of pay and 5 other wells. The Company spud 225 gross wells (224 net wells) in 2013, including 146 horizontal Marcellus wells with approximately 720,000 feet of pay, 22 horizontal Upper Devonian wells with approximately 110,000 feet of pay, 50 horizontal Huron wells with approximately 300,000 feet of pay and 7 other wells. The $480 million increase in capital expenditures for well development was driven by an increase in completed frac stages, an increase in wells spud and higher spending in the Huron play. Capital expenditures for 2014 also included $724 million for property acquisitions, including $349 million of non-cash capital expenditures for the exchange of assets with Range.
Capital expenditures for the midstream operations totaled $455 million for 2014. During 2014, EQT Midstream turned in-line approximately 60 miles of pipeline and 80,000 horsepower of compression primarily in the Marcellus play. EQT Midstream also added approximately 475 MMcf per day of incremental gathering capacity and 750 MMcf per day of incremental transmission capacity in 2014. During 2013, midstream capital expenditures were $369 million. EQT Midstream turned in-line approximately 49 miles of pipeline and 2,100 horsepower of compression primarily within the Marcellus play. EQT Midstream also added 385 MMcf per day of incremental gathering capacity and 450 MMcf per day of incremental transmission capacity in 2013.
Capital expenditures for drilling and development totaled $1,237 million and $857 million during 2013 and 2012, respectively. The Company spud 225 gross wells (224 net wells) in 2013, including 146 horizontal Marcellus wells with approximately 720,000 feet of pay, 22 horizontal Upper Devonian wells with approximately 110,000 feet of pay, 50 horizontal Huron wells with approximately 300,000 feet of pay and 7 other wells, compared to 135 gross wells (129 net wells) in 2012, including 127 horizontal Marcellus wells with approximately 700,000 feet of pay, 7 horizontal Huron wells with approximately 37,000 feet of pay and one other well. The $380 million increase in capital expenditures for well development was driven by an increase in completed feet of pay, an increase in completed frac stages and an increase in wells spud offset slightly by lower cost per foot primarily in the Marcellus play. Capital expenditures for 2013 also included $129 million for undeveloped property acquisitions, including $13 million within the Utica play and $116 million within the Marcellus play, and $57 million for the purchase of Marcellus wells acquired in the Chesapeake acquisition.
During 2012, midstream capital expenditures were $376 million. EQT Midstream turned in-line approximately 89 miles of pipeline and 36,000 horsepower of compression primarily within the Marcellus play. EQT Midstream also added 455 MMcf per day of incremental gathering capacity and 700 MMcf per day of incremental transmission capacity in 2012.
49
Financing Activities
Cash flows provided by financing activities totaled $1,261.3 million for 2014 as compared to cash flows provided by financing activities of $500.5 million for 2013. The Company received net proceeds of $902.5 million from the Partnership’s May 2014 underwritten public offering of common units and the Partnership received net proceeds of $492.3 million from its August 2014 4.00% Senior Notes issuance. The Partnership paid distributions to noncontrolling interests of $67.8 million in 2014. The Company received proceeds from employee compensation plan exercises of
$52.4 million
. The Company used $32.4 million to repurchase and retire shares of the Company’s common stock during 2014. In 2013, the Company received net proceeds of $529.4 million from the Partnership’s July 2013 underwritten public offering of common units, received proceeds from employee compensation plan exercises of
$45.1 million
, paid distributions to noncontrolling interests of $32.8 million and repaid maturing long-term debt of $23.2 million.
On January 22, 2015, the Board of Directors of the Partnership’s general partner declared a cash distribution to the Partnership’s unitholders for the fourth quarter of 2014 of $0.58 per common and subordinated unit, $0.8 million to the general partner related to its 2% general partner interest and $5.2 million to the general partner related to its incentive distribution rights. The cash distribution will be paid on February 13, 2015 to unitholders of record at the close of business on February 3, 2015. As a result of this cash distribution, the subordination period with respect to the Partnership’s 17,339,718 subordinated units will expire on February 17, 2015 and all outstanding Partnership subordinated units will convert into Partnership common units on a one-for-one basis on that day.
On January 21, 2015, the Board of Directors of the Company declared a regular quarterly cash dividend of three cents per share, payable March 1, 2015, to the Company’s shareholders of record at the close of business on February 13, 2015.
On April 30, 2014, the Company’s Board of Directors approved a share repurchase authorization of up to 1,000,000 shares of the Company’s outstanding common stock. The Company may repurchase shares from time to time in open market or in privately negotiated transactions. The share repurchase authorization does not obligate the Company to acquire any specific number of shares, has no pre-established end date and may be discontinued by the Company at any time. During the year ended December 31, 2014, the Company repurchased and retired 300,000 shares of common stock for $32.4 million under the authorization.
Cash flows provided by financing activities totaled $500.5 million for 2013 as compared to cash flows used in financing activities of $75.5 million in 2012. In 2013, the Company received net proceeds of $529.4 million from the Partnership’s July 2013 underwritten public offering of common units, paid distributions to noncontrolling interests of $32.8 million, repaid maturing long-term debt of $23.2 million and received proceeds from employee compensation plan exercises of
$45.1 million
. In 2012, the Company received $276.8 million from the Partnership’s IPO, repaid maturing long-term debt of $219.3 million, paid distributions to noncontrolling interests of $5.0 million and received proceeds from employee compensation plan exercises of $7.9 million.
In December 2012, in connection with its announcement of a definitive agreement to transfer Equitable Gas and Homeworks to PNG Companies LLC, the Company reduced its annual dividend rate, effective January 2013, to $0.12 per share, which the Company believed better reflected the blend of the Company’s core businesses remaining after the closing of the Equitable Gas Transaction - a dividend supporting midstream business and a capital-intensive, rapidly growing production business. The $113.7 million favorable impact on cash provided by financing activities resulting from the decline in the dividend rate was partially offset by the $27.8 million increase in distributions to noncontrolling interests of the Partnership.
Short-term Borrowings
EQT primarily utilizes short-term borrowings to fund capital expenditures in excess of cash flow from operating activities until the expenditures can be permanently financed and to fund required margin deposits on derivative commodity instruments. Margin deposit requirements vary based on natural gas commodity prices, our credit ratings and the amount and type of derivative commodity instruments.
The Company has a $1.5 billion revolving credit facility, which was amended in February 2014, that expires in February 2019. The Company may request two one-year extensions of the expiration date, the approval of which is subject to satisfaction of certain conditions.
The revolving credit facility may be used for working capital, capital expenditures, share repurchases and any other lawful corporate purposes. The credit facility is underwritten by a syndicate of 18 financial institutions, each of which is obligated to fund its pro-rata portion of any borrowings by the Company.
50
Under the terms of the revolving credit facility, the Company may obtain base rate loans or fixed period Eurodollar rate loans. Base rate loans are denominated in dollars and bear interest at a base rate plus a margin based on the Company’s then current credit ratings. Fixed period Eurodollar rate loans bear interest at a Eurodollar rate plus a margin based on the Company’s then current credit ratings.
The Company had no loans or letters of credit outstanding under its revolving credit facility as of December 31, 2014 and 2013. For the years ended December 31, 2014 and 2013, the Company incurred commitment fees averaging approximately 23 basis points and 24 basis points, respectively, to maintain credit availability under its revolving credit facility.
The Company did not have any short-term loans outstanding at any time during the year ended December 31, 2014. The maximum amount of outstanding short-term loans at any time under the Company’s credit facility during the year ended December 31,
2013
was
$178.5 million
. The average daily balance of short-term loans outstanding for the Company during the year ended December 31,
2013
was approximately
$12.1 million
at a weighted average annual interest rate of
1.7%
.
The Company’s short-term borrowings generally have original maturities of three months or less.
In February 2014, the Partnership amended and restated its credit facility to increase the borrowing capacity to $750 million. The amended credit facility will expire in February 2019. The credit facility is available to fund working capital requirements and capital expenditures, to purchase assets, to pay distributions and repurchase units and for general partnership purposes. The credit facility is underwritten by a syndicate of 18 financial institutions, each of which is obligated to fund its pro-rata portion of any borrowings by the Partnership. The Company is not a guarantor of the Partnership’s obligations under the credit facility. The Partnership’s obligations under the credit facility were unconditionally guaranteed by each of the Partnership’s subsidiaries. In January 2015, the Partnership amended its credit facility to, among other things, release its subsidiaries from their guarantee of obligations under the credit facility. The Partnership’s obligations under the revolving portion of the credit facility are unsecured.
Under the terms of its revolving credit facility, the Partnership may obtain base rate loans or fixed period Eurodollar rate loans. Base rate loans are denominated in dollars and bear interest at a base rate plus a margin based on the Partnership’s then current credit rating. Fixed period Eurodollar rate loans bear interest at a Eurodollar rate plus a margin based on the Partnership’s then current credit rating.
The Partnership had no loans or letters of credit outstanding under its revolving credit facility as of December 31, 2014 and 2013. For the years ended December 31, 2014 and 2013, the Partnership incurred commitment fees averaging approximately 24 basis points and 25 basis points, respectively, to maintain credit availability under the revolving credit facility.
The maximum amount of outstanding short-term loans at any time under the Partnership’s credit facility during the year ended December 31, 2014 was $450 million, and the average daily balance of short-term loans outstanding was approximately $119 million at a weighted average annual interest rate of 1.7%. The Partnership had
no
short-term loans outstanding at any time during the year ended December 31, 2013.
Security Ratings
and
Financing Triggers
The table below reflects the credit ratings for debt instruments of the Company at December 31, 2014. Changes in credit ratings may affect the Company’s cost of short-term and long-term debt (including interest rates and fees under its lines of credit), collateral requirements under derivative instruments and access to the credit markets.
|
Rating Service
|
|
Senior
Notes
|
|
Outlook
|
|
Moody’s Investors Service
|
|
Baa3
|
|
Stable
|
|
Standard & Poor’s Ratings Services
|
|
BBB
|
|
Stable
|
|
Fitch Ratings Service
|
|
BBB-
|
|
Stable
|
51
The table below reflects the credit ratings for debt instruments of the Partnership at December 31, 2014. Changes in credit ratings may affect the Company’s cost of short-term and long-term debt (including interest rates and fees under its lines of credit) and access to the credit markets.
|
Rating Service
|
|
Senior
Notes
|
|
Outlook
|
|
Moody’s Investors Service
|
|
Ba1
|
|
Stable
|
|
Standard & Poor’s Ratings Services
|
|
BBB-
|
|
Stable
|
|
Fitch Ratings Service
|
|
BBB-
|
|
Stable
|
The Company’s and the Partnership’s credit ratings are subject to revision or withdrawal at any time by the assigning rating organization, and each rating should be evaluated independently of any other rating. The Company and the Partnership cannot ensure that a rating will remain in effect for any given period of time or that a rating will not be lowered or withdrawn entirely by a credit rating agency if, in its judgment, circumstances so warrant. If the credit rating agencies downgrade the ratings, particularly below investment grade, the access to the capital markets may be limited, borrowing costs and margin deposits on the Company’s derivative contracts would increase, counterparties may request additional assurances and the potential pool of investors and funding sources may decrease. The required margin on the Company’s derivative instruments is also subject to significant change as a result of factors other than credit rating, such as gas prices and credit thresholds set forth in agreements between the hedging counterparties and the Company.
The Company’s debt agreements and other financial obligations contain various provisions that, if not complied with, could result in termination of the agreements, require early payment of amounts outstanding or similar actions. The most significant covenants and events of default under the debt agreements relate to maintenance of a debt-to-total capitalization ratio, limitations on transactions with affiliates, insolvency events, nonpayment of scheduled principal or interest payments, acceleration of other financial obligations and change of control provisions. The Company’s credit facility contains financial covenants that require a total debt-to-total capitalization ratio of no greater than 65%. The calculation of this ratio excludes the effects of accumulated other comprehensive income (OCI). As of December 31, 2014, the Company was in compliance with all debt provisions and covenants.
The Partnership’s credit facility contains various provisions that, if not complied with, could result in termination of the credit facility, require early payment of amounts outstanding or similar actions. The covenants and events of default under the credit facility relate to maintenance of permitted leverage ratio, limitations on transactions with affiliates, limitations on restricted payments, insolvency events, nonpayment of scheduled principal or interest payments, acceleration of and certain other defaults under other financial obligations and change of control provisions. Under the credit facility, the Partnership is required to maintain a consolidated leverage ratio of not more than 5.00 to 1.00 (or, not more than 5.50 to 1.00 for certain measurement periods following the consummation of certain acquisitions). As of December 31, 2014, the Partnership was in compliance with all credit facility provisions and covenants.
Commodity Risk Management
The substantial majority of the Company’s commodity risk management program is related to hedging sales of the Company’s produced natural gas. The Company’s overall objective in this hedging program is to protect cash flow from undue exposure to the risk of changing commodity prices. The derivative commodity instruments currently utilized by the Company are primarily NYMEX swaps and collars. The Company may also use other contractual agreements in implementing its commodity hedging strategy. The Company also enters into fixed price natural gas sales agreements that are satisfied by physical delivery. The Company’s fixed price natural gas sales agreements include contracts that fix only the NYMEX portion of the price and contracts that fix NYMEX and basis. The Company does not currently hedge its oil or NGL exposure.
52
As of February 4, 2015, the approximate volumes and prices of the Company’s hedge position for 2015 through December 2017 production were:
|
|
2015
|
2016 (b)
|
2017 (b)
|
|||||||||
|
NYMEX swaps and fixed price sales
|
|
|
|
|
|
|
||||||
|
Total Volume (Bcf)
|
265
|
|
148
|
|
31
|
|
||||||
|
Average Price per Mcf (a)
|
$
|
4.17
|
|
$
|
4.27
|
|
$
|
4.27
|
|
|||
|
Collars
|
|
|
|
|
|
|
||||||
|
Total Volume (Bcf)
|
42
|
|
—
|
|
_
|
|
||||||
|
Average Floor Price per Mcf (NYMEX) (a)
|
$
|
4.57
|
|
$
|
—
|
|
$
|
—
|
|
|||
|
Average Cap Price per Mcf (NYMEX) (a)
|
$
|
7.14
|
|
$
|
—
|
|
$
|
—
|
|
|||
(a)
The average price is based on a conversion rate of 1.05 MMBtu/Mcf.
(b)
For 2016 and 2017, the Company also has a natural gas sales agreement for approximately 35 Bcf that includes a NYMEX ceiling price of $4.88 per Mcf. The Company also sold calendar year 2016 and 2017 calls/swaptions for approximately 25 Bcf at a strike price of $4.38 per Mcf and approximately 6 Bcf at a strike price of $3.93 per Mcf, respectively. The Company sold the calendar 2016 and 2017 calls in the first quarter of 2015.
See Item 7A, “Quantitative and Qualitative Disclosures About Market Risk,” and Note 5 to the Consolidated Financial Statements for further discussion of the Company’s hedging program.
Other Items
Off-Balance Sheet Arrangements
In connection with the sale of its NORESCO domestic operations in December 2005, the Company agreed to maintain in place guarantees of certain warranty obligations of NORESCO. The savings guarantees provided that once the energy-efficiency construction was completed by NORESCO, the customer would experience a certain dollar amount of energy savings over a period of years. The undiscounted maximum aggregate payments that may be due related to these guarantees were approximately $153 million as of December 31, 2014, extending at a decreasing amount for approximately 13 years.
In December 2014, the Company issued a
$130 million
performance guarantee (the Original MVP Guarantee) in connection with its subsidiary’s obligations to fund the Company’s proportionate share of the construction budget for the MVP. Upon the FERC’s initial release to begin construction of the MVP, the Original MVP Guarantee will terminate, and the Company will be obligated to issue a new guarantee in an amount equal to 33% of the subsidiary’s remaining obligations to make capital contributions to MVP LLC in connection with the then remaining construction budget. Upon the transfer of the Company’s interest in the joint venture to the Partnership, the Partnership will assume these obligations to provide performance assurances for the MVP. See Note 18 to the Consolidated Financial Statements for additional discussion regarding the MVP joint venture.
The NORESCO and the MVP guarantees are exempt from ASC Topic 460, Guarantees. The Company has determined that the likelihood it will be required to perform on these arrangements is remote and any potential payments are expected to be immaterial to the Company’s financial position, results of operations and liquidity. As such, the Company has not recorded any liabilities in its Consolidated Balance Sheets related to these guarantees.
Rate Regulation
As described under “Regulation” in Item 1, “Business,” the Company’s transmission and storage operations and a portion of its gathering operations are subject to various forms of rate regulation. As described in Note 1 to the Consolidated Financial Statements, regulatory accounting allows the Company to defer expenses and income as regulatory assets and liabilities which reflect future collections or payments through the regulatory process. The Company believes that it will continue to be subject to rate regulation that will provide for the recovery of the deferred costs.
53
Schedule of Contractual Obligations
The table below presents the Company’s long-term contractual obligations as of December 31, 2014 in total and by periods in accordance with SEC rules, which excludes the Company’s contractual obligations relating to its natural gas transportation agreements with the Partnership and MVP LLC. For a description of the transportation agreements, see “Commitments and Contingencies” below and Note 18 to the Consolidated Financial Statements.
|
|
Total
|
2015
|
2016-2017
|
2018-2019
|
2020+
|
|||||||||||||||
|
|
(Thousands)
|
|||||||||||||||||||
|
Purchase obligations
|
$
|
4,721,768
|
|
$
|
294,688
|
|
$
|
600,918
|
|
$
|
701,441
|
|
$
|
3,124,721
|
|
|||||
|
Long-term debt
|
2,987,204
|
|
166,011
|
|
2,993
|
|
1,408,000
|
|
1,410,200
|
|
||||||||||
|
Interest payments
|
970,200
|
|
176,416
|
|
339,407
|
|
229,119
|
|
225,258
|
|
||||||||||
|
Operating leases
|
225,609
|
|
83,448
|
|
69,095
|
|
26,394
|
|
46,672
|
|
||||||||||
|
Pension and other post-retirement benefits
|
83,007
|
|
3,902
|
|
7,121
|
|
7,239
|
|
64,745
|
|
||||||||||
|
Other liabilities
|
28,420
|
|
21,315
|
|
7,105
|
|
—
|
|
—
|
|
||||||||||
|
Total contractual obligations
|
$
|
9,016,208
|
|
$
|
745,780
|
|
$
|
1,026,639
|
|
$
|
2,372,193
|
|
$
|
4,871,596
|
|
|||||
Purchase obligations are primarily commitments for demand charges under existing long-term contracts and binding precedent agreements with various third-party pipelines, some of which extend up to approximately 20 years. The Company has entered into agreements to release some of its capacity to various third parties. Operating leases are primarily entered into for various office locations and warehouse buildings, as well as dedicated drilling rigs in support of the Company’s drilling program. The obligations for the Company’s various office locations and warehouse buildings totaled approximately $93.6 million as of December 31, 2014. The Company has agreements with Orion Drilling Company, Savanna Drilling, LLC and several other drillers to provide drilling equipment and services to the Company over the next four years. These obligations totaled approximately $132.0 million as of December 31, 2014.
The other liabilities line represents commitments for total estimated payouts for the 2014 Value Driver Award Program. See “Critical Accounting Policies Involving Significant Estimates” below and Note 16 to the Consolidated Financial Statements for further discussion regarding factors that affect the ultimate amount of the payout of these obligations.
As discussed in Note 9 to the Consolidated Financial Statements, the Company had a total reserve for unrecognized tax benefits at December 31, 2014 of $57.0 million, of which $10.1 million is offset against deferred tax assets since it would primarily reduce the related NOL carryover and research and experimentation tax credit carryforwards. The Company is currently unable to make reasonably reliable estimates of the period of cash settlement of these potential liabilities with taxing authorities; therefore, this amount has been excluded from the schedule of contractual obligations.
Commitments and Contingencies
In the ordinary course of business, various legal and regulatory claims and proceedings are pending or threatened against the Company. While the amounts claimed may be substantial, the Company is unable to predict with certainty the ultimate outcome of such claims and proceedings. The Company accrues legal and other direct costs related to loss contingencies when actually incurred. The Company has established reserves it believes to be appropriate for pending matters and, after consultation with counsel and giving appropriate consideration to available insurance, the Company believes that the ultimate outcome of any matter currently pending against the Company will not materially affect the Company’s financial position, results of operations or liquidity.
EQT Energy has capacity commitments relating to natural gas transportation agreements with the Partnership and Mountain Valley Pipeline, LLC. As of December 31, 2014, future payments related to these agreements totaled $10.3 billion. These capacity commitments have terms extending up to 20 years.
See Note 18 to the Consolidated Financial Statements for further discussion of the Company’s commitments and contingencies.
54
Recently Issued Accounting Standards
In May 2014, the Financial Accounting Standards Board issued Accounting Standards Update (ASU) No. 2014-09, Revenue from Contracts with Customers. The standard requires an entity to recognize revenue in a manner that depicts the transfer of goods or services to customers at an amount that reflects the consideration to which the entity expects to be entitled in exchange for those goods or services. ASU No. 2014-09 will replace most of the existing revenue recognition requirements in United States GAAP when it becomes effective. The guidance in ASU No. 2014-09 is effective for public entities for annual reporting periods beginning after December 15, 2016, including interim periods therein. Early adoption is not permitted. The Company is currently evaluating the method of adoption and impact this standard will have on its financial statements and related disclosures.
Critical Accounting Policies Involving Significant Estimates
The Company’s significant accounting policies are described in Note 1 to the Consolidated Financial Statements. The discussion and analysis of the Consolidated Financial Statements and results of operations are based upon the Company’s Consolidated Financial Statements, which have been prepared in accordance with U.S. generally accepted accounting principles. The preparation of the Consolidated Financial Statements requires management to make estimates and judgments that affect the reported amounts of assets, liabilities, revenues and expenses and the related disclosure of contingent assets and liabilities. The following critical accounting policies, which were reviewed by the Company’s Audit Committee, relate to the Company’s more significant judgments and estimates used in the preparation of its Consolidated Financial Statements. Actual results could differ from those estimates.
Accounting for Oil and Gas Producing Activities
: The Company uses the successful efforts method of accounting for its oil and gas production activities.
The carrying values of the Company’s proved oil and gas properties are reviewed for indications of impairment when events or circumstances indicate that the remaining carrying value may not be recoverable. The estimated future cash flows used to test those properties for recoverability are based on risk-adjusted proved and, in some cases, probable reserves, utilizing assumptions about the use of the asset, market prices for oil and gas and future operating costs. Proved oil and gas properties that have carrying amounts in excess of estimated future cash flows would be written down to fair value, which would be estimated by discounting the estimated future cash flows using discount rate assumptions that marketplace participants would use in their estimates of fair value.
Capitalized costs of unproved properties are evaluated at least annually for recoverability on a prospective basis. Indicators of potential impairment include changes brought about by economic factors, potential shifts in business strategy employed by management and historical experience. If it is determined that the properties will not yield proved reserves, the related costs are expensed in the period in which that determination is made.
The Company believes that the accounting estimate related to the accounting for oil and gas producing activities is a “critical accounting estimate” as the evaluations of impairment of proved properties involves significant judgment about future events such as future sales prices of natural gas and NGLs, future production costs, estimates of the amount of natural gas and NGLs recorded and the timing of those recoveries. See Note 1 to the Consolidated Financial Statements for additional information regarding the Company’s impairments of proved and unproved oil and gas properties.
Oil and Gas Reserves
: Proved oil and gas reserves, as defined by SEC Regulation S-X Rule 4-10, are those quantities of oil and gas, which, by analysis of geoscience and engineering data, can be estimated with reasonable certainty to be economically producible from a given date forward, from known reservoirs and under existing economic conditions, operating methods and government regulations prior to the time at which contracts providing the right to operate expire, unless evidence indicates that renewal is reasonably certain, regardless of whether deterministic or probabilistic methods are used for the estimation.
The Company’s estimates of proved reserves are made and reassessed annually using geological and reservoir data as well as production performance data. Reserve estimates are prepared and updated by the Company’s engineers and audited by the Company’s independent engineers. Revisions may result from changes in, among other things, reservoir performance, development plans, prices, economic conditions and governmental restrictions. Decreases in prices, for example, may cause a reduction in some proved reserves due to reaching economic limits sooner. A material change in the estimated volumes of reserves could have an impact on the depletion rate calculation and the financial statements, including cash flow to the Company and strength of the balance sheet.
The Company estimates future net cash flows from natural gas and oil reserves based on selling prices and costs using a 12-month average price, calculated as the unweighted arithmetic average of the first-day-of-the-month price for each month within
55
the 12-month period, which is subject to change in subsequent periods. Operating costs, production and ad valorem taxes and future development costs are based on current costs with no escalation. Income tax expense is computed using expected future tax rates and giving effect to tax deductions and credits available under current laws and which relate to oil and gas producing activities.
The Company believes that the accounting estimate related to oil and gas reserves is a “critical accounting estimate” because the Company must periodically reevaluate proved reserves along with estimates of future production and the estimated timing of development expenditures. Future results of operations, cash flow to the Company and strength of the balance sheet for any particular quarterly or annual period could be materially affected by changes in the Company’s assumptions.
Income Taxes:
The Company recognizes deferred tax assets and liabilities for the expected future tax consequences of events that have been included in the Company’s Consolidated Financial Statements or tax returns.
The Company has recorded deferred tax assets principally resulting from federal and state NOL carryforwards, an alternative minimum tax credit carryforward, incentive compensation and investment in the Partnership. The Company has established a valuation allowance against a portion of the deferred tax assets related to the state NOL carryforwards, as it is believed that it is more likely than not that these deferred tax assets will not all be realized. No other significant valuation allowances have been established, as it is believed that future sources of taxable income, reversing temporary differences and other tax planning strategies will be sufficient to realize these deferred tax assets. Any determination to change the valuation allowance would impact the Company’s income tax expense and net income in the period in which such a determination is made.
The Company also estimates the amount of financial statement benefit to record for uncertain tax positions as described in Note 9 to the Company’s Consolidated Financial Statements.
The Company believes that accounting estimates related to income taxes are “critical accounting estimates” because the Company must assess the likelihood that deferred tax assets will be recovered from future taxable income and exercise judgment regarding the amount of financial statement benefit to record for uncertain tax positions. When evaluating whether or not a valuation allowance must be established on deferred tax assets, the Company exercises judgment in determining whether it is more likely than not (a likelihood of more than 50%) that some portion or all of the deferred tax assets will not be realized. The Company considers all available evidence, both positive and negative, to determine whether, based on the weight of the evidence, a valuation allowance is needed, including carrybacks, tax planning strategies, reversal of deferred tax assets and liabilities and forecasted future taxable income. In making the determination related to uncertain tax positions, the Company considers the amounts and probabilities of the outcomes that could be realized upon ultimate settlement of an uncertain tax position using the facts, circumstances and information available at the reporting date to establish the appropriate amount of financial statement benefit. To the extent that an uncertain tax position or valuation allowance is established or increased or decreased during a period, the Company must include an expense or benefit within tax expense in the income statement. Future results of operations for any particular quarterly or annual period could be materially affected by changes in the Company’s assumptions.
Derivative Instruments:
The Company enters into derivative commodity instrument contracts primarily to mitigate exposure to commodity price risk associated with future sales of natural gas production. The Company also enters into derivative instruments to hedge other forecasted natural gas purchases and sales, to hedge basis and to hedge exposure to fluctuations in interest rates.
The Company estimates the fair value of all derivative instruments using quoted market prices, where available. If quoted market prices are not available, fair value is based upon models that use as inputs market-based parameters, including but not limited to forward curves, discount rates, broker quotes, volatilities and nonperformance risk. Nonperformance risk considers the effect of the Company’s credit standing on the fair value of liabilities and the effect of the counterparty’s credit standing on the fair value of assets. The Company estimates nonperformance risk by analyzing publicly available market information, including a comparison of the yield on debt instruments with credit ratings similar to the Company’s or counterparty’s credit rating, the yield of a risk-free instrument and credit default swap rates where available. The values reported in the financial statements change as these estimates are revised to reflect actual results, or market conditions or other factors change, many of which are beyond the Company’s control.
In addition, the derivative commodity instruments used to mitigate exposure to commodity price risk associated with future sales of natural gas production may limit the benefit the Company would receive from increases in the prices of natural gas and may expose the Company to margin requirements. Given the Company’s price risk management position and price volatility, the Company may be required from time to time to deposit cash with or provide letters of credit to its counterparties in order to satisfy these margin requirements.
56
The Company believes that the accounting estimates related to derivative instruments are “critical accounting estimates” because the Company’s financial condition, results of operations and liquidity can be significantly impacted by changes in the market value of the Company’s derivative instruments due to the volatility of natural gas prices, both NYMEX and basis, and by changes in margin requirements. Future results of operations for any particular quarterly or annual period could be materially affected by changes in the Company’s assumptions.
Contingencies and Asset Retirement Obligations
: The Company is involved in various regulatory and legal proceedings that arise in the ordinary course of business. The Company records a liability for contingencies based upon its assessment that a loss is probable and the amount of the loss can be reasonably estimated. The Company considers many factors in making these assessments, including history and specifics of each matter. Estimates are developed in consultation with legal counsel and are based upon an analysis of potential results.
The Company also accrues a liability for legal asset retirement obligations based on an estimate of the timing and amount of their settlement. For oil and gas wells, the fair value of the Company’s plugging and abandonment obligations is required to be recorded at the time the obligations are incurred, which is typically at the time the wells are spud. The Company is required to operate and maintain its natural gas pipeline and storage systems, and intends to do so as long as supply and demand for natural gas exists, which the Company expects for the foreseeable future. Therefore, the Company believes that the substantial majority of its natural gas pipeline and storage system assets have indeterminate lives.
The Company believes that the accounting estimates related to contingencies and asset retirement obligations are “critical accounting estimates” because the Company must assess the probability of loss related to contingencies and the expected amount and timing of asset retirement obligations. In addition, the Company must determine the estimated present value of future liabilities. Future results of operations for any particular quarterly or annual period could be materially affected by changes in the Company’s assumptions.
Share-Based Compensation:
The Company awards share-based compensation in connection with specific programs established under the 1999, 2009 and 2014 Long-Term Incentive Plans. Awards to employees are typically made in the form of performance-based awards, time-based restricted stock and stock options. Awards to directors are typically made in the form of phantom units.
Performance-based awards expected to be satisfied in cash are treated as liability awards. Awards under the 2014 EQT Value Driver Award program are treated as liability awards. Phantom units (which vest upon grant) expected to be satisfied in cash are also treated as liability awards. For liability awards, the Company is required to estimate, on grant date and on each reporting date thereafter until vesting and payment, the fair value of the ultimate payout based upon the expected performance through, and value of the Company’s common stock on, the vesting date. The Company then recognizes a proportionate amount of the expense for each period in the Company’s financial statements over the vesting period of the award, in the case of a performance-based award, and until payment, in the case of phantom units. The Company reviews its assumptions regarding performance and common stock value on a quarterly basis and adjusts its accrual when changes in these assumptions result in a material change in the fair value of the ultimate payouts.
Performance-based awards expected to be satisfied in Company common stock or Partnership common units are treated as equity awards. Awards under the 2012 Executive Performance Incentive Program, the 2013 Executive Performance Incentive Program, the 2013 Value Driver Award Program, the 2014 Executive Performance Incentive Program, the 2014 EQM Value Driver Award Program and the EQM Total Return Program, which remained outstanding at December 31, 2014, are treated as equity awards. For equity awards, the Company is required to determine the grant date fair value of the awards, which is then recognized as expense in the Company’s financial statements over the vesting period of the award. Determination of the grant date fair value of the awards requires judgments and estimates regarding, among other things, the appropriate methodologies to follow in valuing the awards and the related inputs required by those valuation methodologies. Most often, the Company is required to obtain a valuation based upon assumptions regarding risk-free rates of return, dividend or distribution yields, expected volatilities and the expected term of the award. The risk-free rate is based on the U.S. Treasury yield curve in effect at the time of grant. The dividend or distribution yield is based on the historical dividend or distribution yield of the Company’s common stock or the Partnership’s common units, as applicable, and any changes expected thereto, and, where applicable, of the common stock of the peer group members at the time of grant. Expected volatilities are based on historical volatility of the Company’s common stock or the Partnership’s common units and, where applicable, the common stock of the peer group members at the time of grant. The expected term represents the period of time elapsing during the applicable performance period.
For time-based restricted stock awards, the grant date fair value of the awards is recognized as expense in the Company’s financial statements over the vesting period, historically three years. For phantom units (which vest on date of grant) expected to be satisfied in equity, the grant date fair value of the awards is recognized as an expense in the Company’s financial statements in
57
the year of grant. The grant date fair value, in both cases, is determined based upon the closing price of the Company’s common stock on the date of the grant.
For non-qualified stock options, the grant date fair value is recognized as expense in the Company’s financial statements over the vesting period, typically two or three years. The Company utilizes the Black-Scholes option pricing model to measure the fair value of stock options, which includes assumptions for a risk-free interest rate, dividend yield, volatility factor and expected term. The risk-free rate for periods within the contractual life of the option is based on the U.S. Treasury yield curve in effect at the time of grant. The dividend yield is based on the dividend yield of the Company’s common stock at the time of grant. The expected volatility is based on historical volatility of the Company’s common stock at the time of grant. The expected term represents the period of time that options granted are expected to be outstanding based on historical option exercise experience at the time of grant.
The Company believes that the accounting estimates related to share-based compensation are “critical accounting estimates” because they may change from period to period based on changes in assumptions about factors affecting the ultimate payout of awards, including the number of awards to ultimately vest and the market price and volatility of the Company’s common stock. Future results of operations for any particular quarterly or annual period could be materially affected by changes in the Company’s assumptions. See Note 16 to the Consolidated Financial Statements for additional information regarding the Company’s share-based compensation.
58
Derivative Instruments
The Company’s primary market risk exposure is the volatility of future prices for natural gas and NGLs, which can affect the operating results of the Company primarily at EQT Production. The Company’s use of derivatives to reduce the effect of this volatility is described in Notes 1 and 5 to the Consolidated Financial Statements and under the caption “Commodity Risk Management” in Item 7, “Management’s Discussion and Analysis of Financial Condition and Results of Operations.” The Company uses derivative commodity instruments that are placed primarily with financial institutions and the creditworthiness of these institutions is regularly monitored. The Company also enters into derivative instruments to hedge other forecasted natural gas purchases and sales, to hedge basis and to hedge exposure to fluctuations in interest rates. The Company’s use of derivative instruments is implemented under a set of policies approved by the Company’s Hedge and Financial Risk Committee and reviewed by the Audit Committee of the Board of Directors.
Commodity Price Risk
For the derivative commodity instruments used to hedge the Company’s forecasted sales of production, most of which is hedged at NYMEX natural gas prices, the Company sets policy limits relative to the expected production and sales levels which are exposed to price risk. For the derivative commodity instruments used to hedge forecasted natural gas purchases and sales which are exposed to price risk, the Company sets limits related to acceptable exposure levels. The Company does not have any natural gas derivative commodity instruments for trading purposes.
The financial instruments currently utilized by the Company are primarily fixed price swap agreements and collar agreements which may require payments to or receipt of payments from counterparties based on the differential between two prices for the commodity. The Company may also use other contractual agreements in implementing its commodity hedging strategy.
The Company monitors price and production levels on a continuous basis and makes adjustments to quantities hedged as warranted. The Company’s overall objective in its hedging program is to protect cash flows from undue exposure to the risk of changing commodity prices.
With respect to the derivative commodity instruments held by the Company as of December 31,
2014
and
2013
, the Company hedged portions of expected sales of equity production, portions of forecasted purchases and sales and portions of its basis exposure covering approximately 563 Bcf and 388 Bcf of natural gas, respectively. See the “Commodity Risk Management” section in the “Capital Resources and Liquidity” section of Item 7, “Management’s Discussion and Analysis of Financial Condition and Results of Operations,” for further discussion.
A hypothetical decrease of 10% in the market price of natural gas from the December 31,
2014
and
2013
levels would increase the fair value of natural gas derivative instruments by approximately $126.6 million and $151.7 million, respectively. A hypothetical increase of 10% in the market price of natural gas from the December 31,
2014
and
2013
levels would decrease the fair value of natural gas derivative instruments by approximately $126.5 million and $151.6 million, respectively.
The Company determined the change in the fair value of the derivative commodity instruments using a method similar to its normal determination of fair value as described in Note 1 to the Consolidated Financial Statements. The Company assumed a 10% change in the price of natural gas from its levels at December 31,
2014
and December 31,
2013
. The price change was then applied to the natural gas derivative commodity instruments recorded on the Company’s Consolidated Balance Sheets, resulting in the change in fair value.
The above analysis of the derivative commodity instruments held by the Company does not include the offsetting impact that the same hypothetical price movement may have on the Company’s physical sales of natural gas. The portfolio of derivative commodity instruments held to hedge the Company’s forecasted equity production approximates a portion of the Company’s expected physical sales of natural gas. Therefore, an adverse impact to the fair value of the portfolio of derivative commodity instruments held to hedge the Company’s forecasted production associated with the hypothetical changes in commodity prices referenced above should be offset by a favorable impact on the Company’s physical sales of natural gas, assuming the derivative commodity instruments are not closed out in advance of their expected term, the derivative commodity instruments continue to function effectively as hedges of the underlying risk, the anticipated transactions occur as expected and basis does not significantly change.
59
If the underlying physical transactions or positions are liquidated prior to the maturity of the derivative commodity instruments, a loss on the financial instruments may occur or the derivative commodity instruments might be worthless as determined by the prevailing market value on their termination or maturity date, whichever comes first.
Interest Rate Risk
Changes in interest rates affect the amount of interest the Company and the Partnership earn on cash, cash equivalents and short-term investments and the interest rates the Company and the Partnership pay on borrowings under their respective revolving credit facilities. All of the the Company’s and the Partnership’s long-term borrowings are fixed rate and thus do not expose the Company to fluctuations in its results of operations or liquidity from changes in market interest rates. Changes in interest rates do affect the fair value of the Company’s and the Partnership’s fixed rate debt. See Notes 11 and 12 to the Consolidated Financial Statements for further discussion of the Company’s and the Partnership’s borrowings and Note 6 to the Consolidated Financial Statements for a discussion of fair value measurements, including the fair value of long-term debt.
Other Market Risks
The Company is exposed to credit loss in the event of nonperformance by counterparties to derivative contracts. This credit exposure is limited to derivative contracts with a positive fair value, which may change as market prices change. The Company believes that NYMEX-traded futures contracts have limited credit risk because CFTC regulations are in place to protect exchange participants, including the Company, from potential financial instability of the exchange members. The Company’s OTC derivative instruments are primarily with financial institutions and, thus, are subject to events that would impact those companies individually as well as that industry as a whole.
The Company utilizes various processes and analyses to monitor and evaluate its credit risk exposures. These include closely monitoring current market conditions, counterparty credit fundamentals and credit default swap rates. Credit exposure is controlled through credit approvals and limits based on counterparty credit fundamentals. To manage the level of credit risk, the Company enters into transactions with financial counterparties that are of investment grade or better, enters into netting agreements whenever possible and may obtain collateral or other security.
Approximately 95%, or $458.5 million, of the Company’s OTC derivative contracts outstanding at December 31,
2014
had a positive fair value. Approximately 79%, or $107.4 million, of the Company’s OTC derivative contracts at December 31,
2013
had a positive fair value.
As of December 31,
2014
, the Company was not in default under any derivative contracts and had no knowledge of default by any counterparty to derivative contracts. The Company made no adjustments to the fair value of derivative contracts due to credit related concerns outside of the normal non-performance risk adjustment included in the Company’s established fair value procedure. The Company monitors market conditions that may impact the fair value of derivative contracts reported in the Consolidated Balance Sheets.
The Company is also exposed to the risk of nonperformance by credit customers on physical sales or transportation of natural gas. A significant amount of revenues and related accounts receivable from EQT Production are generated from the sale of produced natural gas, NGLs and crude oil to certain marketers, utility and industrial customers located mainly in the Appalachian Basin and the Northeastern United States as well as the Permian Basin of Texas and a gas processor in Kentucky and West Virginia. Additionally, a significant amount of revenues and related accounts receivable from EQT Midstream are generated from the transportation or gathering of natural gas in Kentucky, Virginia, Pennsylvania and West Virginia.
The Company has a $1.5 billion revolving credit facility that expires in February 2019. The credit facility is underwritten by a syndicate of financial institutions, each of which is obligated to fund its pro-rata portion of any borrowings by the Company. As of December 31,
2014
, the Company had no loans or letters of credit outstanding under the facility. No one lender of the large group of financial institutions in the syndicate holds more than 10% of the facility. The Company’s large syndicate group and relatively low percentage of participation by each lender is expected to limit the Company’s exposure to problems or consolidation in the banking industry.
The Partnership has a $750 million revolving credit facility that expires in February 2019. The credit facility is underwritten by a syndicate of financial institutions, each of which is obligated to fund its pro-rata portion of any borrowings by the Partnership. As of December 31,
2014
, the Partnership had no loans and letters of credit outstanding under the credit facility. No one lender of the large group of financial institutions in the syndicate holds more than 10% of the facility. The Partnership’s large syndicate group and relatively low percentage of participation by each lender is expected to limit the Partnership’s exposure to problems or consolidation in the banking industry.
60
|
|
|
Page Reference
|
|
|
|
|
|
|
|
|
|
|
||
|
|
|
|
|
|
||
|
|
|
|
|
|
||
|
|
|
|
|
|
||
|
|
|
|
|
|
||
|
|
|
|
|
|
||
|
|
|
|
|
|
||
61
REPORT OF INDEPENDENT REGISTERED PUBLIC ACCOUNTING FIRM
The Board of Directors and Stockholders of
EQT Corporation and Subsidiaries
We have audited the accompanying consolidated balance sheets of EQT Corporation and Subsidiaries as of
December 31, 2014
and
2013
, and the related statements of consolidated income, comprehensive income, equity and cash flows for each of the three years in the period ended
December 31, 2014
. These financial statements are the responsibility of the Company’s management. Our responsibility is to express an opinion on these financial statements based on our audits.
We conducted our audits in accordance with the standards of the Public Company Accounting Oversight Board (United States). Those standards require that we plan and perform the audit to obtain reasonable assurance about whether the financial statements are free of material misstatement. An audit includes examining, on a test basis, evidence supporting the amounts and disclosures in the financial statements. An audit also includes assessing the accounting principles used and significant estimates made by management, as well as evaluating the overall financial statement presentation. We believe that our audits provide a reasonable basis for our opinion.
In our opinion, the financial statements referred to above present fairly, in all material respects, the consolidated financial position of EQT Corporation and Subsidiaries at
December 31, 2014
and
2013
, and the consolidated results of their operations and their cash flows for each of the three years in the period ended
December 31, 2014
in conformity with U.S. generally accepted accounting principles.
We also have audited, in accordance with the standards of the Public Company Accounting Oversight Board (United States), EQT Corporation and Subsidiaries’ internal control over financial reporting as of
December 31, 2014
, based on criteria established in Internal Control - Integrated Framework issued by the Committee of Sponsoring Organizations of the Treadway Commission (2013 framework) and our report dated
February 12, 2015
expressed an unqualified opinion thereon.
/s/ Ernst & Young LLP
Pittsburgh, Pennsylvania
February 12, 2015
62
REPORT OF INDEPENDENT REGISTERED PUBLIC ACCOUNTING FIRM
The Board of Directors and Stockholders of
EQT Corporation and Subsidiaries
We have audited EQT Corporation and Subsidiaries’ internal control over financial reporting as of
December 31, 2014
, based on criteria established in Internal Control – Integrated Framework issued by the Committee of Sponsoring Organizations of the Treadway Commission (2013 framework) (the COSO criteria). EQT Corporation and Subsidiaries’ management is responsible for maintaining effective internal control over financial reporting, and for its assessment of the effectiveness of internal control over financial reporting included in the accompanying Management’s Report on Internal Control over Financial Reporting. Our responsibility is to express an opinion on the company’s internal control over financial reporting based on our audit.
We conducted our audit in accordance with the standards of the Public Company Accounting Oversight Board (United States). Those standards require that we plan and perform the audit to obtain reasonable assurance about whether effective internal control over financial reporting was maintained in all material respects. Our audit included obtaining an understanding of internal control over financial reporting, assessing the risk that a material weakness exists, testing and evaluating the design and operating effectiveness of internal control based on the assessed risk, and performing such other procedures as we considered necessary in the circumstances. We believe that our audit provides a reasonable basis for our opinion.
A company’s internal control over financial reporting is a process designed to provide reasonable assurance regarding the reliability of financial reporting and the preparation of financial statements for external purposes in accordance with generally accepted accounting principles. A company’s internal control over financial reporting includes those policies and procedures that (1) pertain to the maintenance of records that, in reasonable detail, accurately and fairly reflect the transactions and dispositions of the assets of the company; (2) provide reasonable assurance that transactions are recorded as necessary to permit preparation of financial statements in accordance with generally accepted accounting principles, and that receipts and expenditures of the company are being made only in accordance with authorizations of management and directors of the company; and (3) provide reasonable assurance regarding prevention or timely detection of unauthorized acquisition, use, or disposition of the company’s assets that could have a material effect on the financial statements.
Because of its inherent limitations, internal control over financial reporting may not prevent or detect misstatements. Also, projections of any evaluation of effectiveness to future periods are subject to the risk that controls may become inadequate because of changes in conditions, or that the degree of compliance with the policies or procedures may deteriorate.
In our opinion, EQT Corporation and Subsidiaries maintained, in all material respects, effective internal control over financial reporting as of
December 31, 2014
, based on the COSO criteria.
We also have audited, in accordance with the standards of the Public Company Accounting Oversight Board (United States), the consolidated balance sheets of EQT Corporation and Subsidiaries as of
December 31, 2014
and
2013
, and the related statements of consolidated income, comprehensive income, equity and cash flows for each of the three years in the period ended
December 31, 2014
and our report dated
February 12, 2015
expressed an unqualified opinion thereon.
/s/ Ernst & Young LLP
Pittsburgh, Pennsylvania
February 12, 2015
63
EQT CORPORATION AND SUBSIDIARIES
STATEMENTS OF CONSOLIDATED INCOME
YEARS ENDED DECEMBER 31,
|
|
2014
|
2013
|
2012
|
||||||||
|
|
(Thousands except per share amounts)
|
||||||||||
|
Operating revenues
|
$
|
2,469,710
|
|
$
|
1,862,011
|
|
$
|
1,377,222
|
|
||
|
Operating expenses:
|
|
|
|
|
|
|
|||||
|
Transportation and processing
|
202,203
|
|
148,708
|
|
134,951
|
|
|||||
|
Operation and maintenance
|
108,283
|
|
97,762
|
|
99,257
|
|
|||||
|
Production
|
133,488
|
|
108,091
|
|
96,155
|
|
|||||
|
Exploration
|
21,716
|
|
18,483
|
|
10,370
|
|
|||||
|
Selling, general and administrative
|
238,134
|
|
200,849
|
|
172,243
|
|
|||||
|
Depreciation, depletion and amortization
|
679,298
|
|
653,132
|
|
474,617
|
|
|||||
|
Impairment of long-lived assets
|
267,339
|
|
—
|
|
—
|
|
|||||
|
Total operating expenses
|
1,650,461
|
|
1,227,025
|
|
987,593
|
|
|||||
|
Gain on sale / exchange of assets
|
34,146
|
|
19,618
|
|
—
|
|
|||||
|
Operating income
|
853,395
|
|
654,604
|
|
389,629
|
|
|||||
|
Other income
|
6,853
|
|
9,242
|
|
15,536
|
|
|||||
|
Interest expense
|
136,537
|
|
142,688
|
|
184,786
|
|
|||||
|
Income before income taxes
|
723,711
|
|
521,158
|
|
220,379
|
|
|||||
|
Income taxes
|
214,092
|
|
175,186
|
|
71,461
|
|
|||||
|
Income from continuing operations
|
509,619
|
|
345,972
|
|
148,918
|
|
|||||
|
Income from discontinued operations, net of tax
|
1,371
|
|
91,843
|
|
47,493
|
|
|||||
|
Net income
|
510,990
|
|
437,815
|
|
196,411
|
|
|||||
|
Less: Net income attributable to noncontrolling interests
|
124,025
|
|
47,243
|
|
13,016
|
|
|||||
|
Net income attributable to EQT Corporation
|
$
|
386,965
|
|
$
|
390,572
|
|
$
|
183,395
|
|
||
|
Amounts attributable to EQT Corporation:
|
|
|
|
|
|
|
|||||
|
Income from continuing operations
|
$
|
385,594
|
|
$
|
298,729
|
|
$
|
135,902
|
|
||
|
Income from discontinued operations
|
1,371
|
|
91,843
|
|
47,493
|
|
|||||
|
Net income
|
$
|
386,965
|
|
$
|
390,572
|
|
$
|
183,395
|
|
||
|
Earnings per share of common stock attributable to EQT Corporation:
|
|
|
|
|
|
|
|||||
|
Basic:
|
|
|
|
|
|
|
|||||
|
Income from continuing operations
|
$
|
2.54
|
|
$
|
1.98
|
|
$
|
0.91
|
|
||
|
Income from discontinued operations
|
0.01
|
|
0.61
|
|
0.32
|
|
|||||
|
Net income
|
$
|
2.55
|
|
$
|
2.59
|
|
$
|
1.23
|
|
||
|
Diluted:
|
|
|
|
|
|
|
|||||
|
Income from continuing operations
|
$
|
2.53
|
|
$
|
1.97
|
|
$
|
0.90
|
|
||
|
Income from discontinued operations
|
0.01
|
|
0.60
|
|
0.32
|
|
|||||
|
Net income
|
$
|
2.54
|
|
$
|
2.57
|
|
$
|
1.22
|
|
||
See notes to consolidated financial statements.
64
EQT CORPORATION AND SUBSIDIARIES
STATEMENTS OF CONSOLIDATED COMPREHENSIVE INCOME
YEARS ENDED DECEMBER 31,
|
|
2014
|
2013
|
2012
|
||||||||
|
|
(Thousands)
|
||||||||||
|
Net income
|
$
|
510,990
|
|
$
|
437,815
|
|
$
|
196,411
|
|
||
|
Other comprehensive income (loss), net of tax:
|
|
|
|
|
|
|
|||||
|
Net change in cash flow hedges:
|
|
|
|
|
|
|
|||||
|
Natural gas, net of tax expense (benefit) of $102,850, ($50,200) and ($61,757)
|
155,422
|
|
(76,489
|
)
|
(93,878
|
)
|
|||||
|
Interest rate, net of tax expense of $104, $63 and $4,833
|
145
|
|
144
|
|
6,369
|
|
|||||
|
Pension and other post-retirement benefits liability adjustment, net of tax (benefit) expense of ($515), $16,115 and ($1,992)
|
(776
|
)
|
21,501
|
|
(1,085
|
)
|
|||||
|
Other comprehensive income (loss)
|
154,791
|
|
(54,844
|
)
|
(88,594
|
)
|
|||||
|
Comprehensive income
|
665,781
|
|
382,971
|
|
107,817
|
|
|||||
|
Less: Comprehensive income attributable to noncontrolling interests
|
124,025
|
|
47,243
|
|
13,016
|
|
|||||
|
Comprehensive income attributable to EQT Corporation
|
$
|
541,756
|
|
$
|
335,728
|
|
$
|
94,801
|
|
||
See notes to consolidated financial statements.
65
EQT CORPORATION AND SUBSIDIARIES
YEARS ENDED DECEMBER 31,
|
|
2014
|
2013
|
2012
|
||||||||
|
|
(Thousands)
|
||||||||||
|
Cash flows from operating activities:
|
|
|
|
|
|
|
|||||
|
Net income
|
$
|
510,990
|
|
$
|
437,815
|
|
$
|
196,411
|
|
||
|
Adjustments to reconcile net income to net cash provided by operating activities:
|
|
|
|
|
|
|
|||||
|
Deferred income taxes
|
32,021
|
|
110,363
|
|
95,185
|
|
|||||
|
Depreciation, depletion and amortization
|
679,298
|
|
676,570
|
|
499,118
|
|
|||||
|
Impairment of long-lived assets and leases
|
281,979
|
|
14,198
|
|
5,543
|
|
|||||
|
Gain on sale / exchange of assets
|
(34,146
|
)
|
(19,618
|
)
|
—
|
|
|||||
|
Gain on dispositions included in discontinued operations
|
(2,898
|
)
|
(166,276
|
)
|
—
|
|
|||||
|
Provisions for (recoveries of) losses on accounts receivable
|
88
|
|
2,957
|
|
(1,235
|
)
|
|||||
|
Other income
|
(6,853
|
)
|
(9,508
|
)
|
(15,965
|
)
|
|||||
|
Stock-based compensation expense
|
42,123
|
|
52,618
|
|
40,230
|
|
|||||
|
(Gain) loss recognized in operating revenues for hedging ineffectiveness
|
(24,774
|
)
|
21,335
|
|
75
|
|
|||||
|
Gain on derivatives not designated as hedges
|
(80,942
|
)
|
(2,834
|
)
|
(2,176
|
)
|
|||||
|
Cash settlements on derivatives not designated as hedges
|
34,239
|
|
1,115
|
|
7,508
|
|
|||||
|
Noncash financial instrument put premium
|
—
|
|
—
|
|
8,227
|
|
|||||
|
Changes in other assets and liabilities:
|
|
|
|
|
|
|
|||||
|
Dividend from Nora Gathering, LLC
|
9,463
|
|
9,000
|
|
12,750
|
|
|||||
|
Excess tax benefits on stock-based compensation
|
(33,216
|
)
|
(12,251
|
)
|
—
|
|
|||||
|
Accounts receivable and unbilled revenues
|
(70,392
|
)
|
(44,818
|
)
|
(48,364
|
)
|
|||||
|
Inventory
|
15,511
|
|
30,090
|
|
43,277
|
|
|||||
|
Accounts payable
|
30,350
|
|
15,990
|
|
20,624
|
|
|||||
|
Other items, net
|
31,901
|
|
46,115
|
|
(64,386
|
)
|
|||||
|
Net cash provided by operating activities
|
1,414,742
|
|
1,162,861
|
|
796,822
|
|
|||||
|
Cash flows from investing activities:
|
|
|
|
|
|
|
|||||
|
Capital expenditures from continuing operations, excluding acquisitions
|
(2,277,472
|
)
|
(1,612,501
|
)
|
(1,346,595
|
)
|
|||||
|
Capital expenditures for acquisitions
|
(174,184
|
)
|
(114,224
|
)
|
—
|
|
|||||
|
Capital expenditures from discontinued operations
|
—
|
|
(36,637
|
)
|
(28,745
|
)
|
|||||
|
Proceeds from sale of assets
|
7,444
|
|
740,587
|
|
4,842
|
|
|||||
|
Proceeds from sale of energy marketing contracts
|
—
|
|
23,000
|
|
—
|
|
|||||
|
Net cash used in investing activities
|
(2,444,212
|
)
|
(999,775
|
)
|
(1,370,498
|
)
|
|||||
|
Cash flows from financing activities:
|
|
|
|
|
|
|
|||||
|
Proceeds from the issuance of common units of EQT Midstream Partners, LP, net of issuance costs
|
902,467
|
|
529,442
|
|
276,780
|
|
|||||
|
Proceeds from issuance of EQT Midstream Partners, LP debt
|
500,000
|
|
—
|
|
—
|
|
|||||
|
Increase in short-term loans
|
450,000
|
|
178,500
|
|
—
|
|
|||||
|
Decrease in short-term loans
|
(450,000
|
)
|
(178,500
|
)
|
—
|
|
|||||
|
Dividends paid
|
(18,207
|
)
|
(18,094
|
)
|
(131,803
|
)
|
|||||
|
Distributions to noncontrolling interests
|
(67,819
|
)
|
(32,781
|
)
|
(5,031
|
)
|
|||||
|
Repayments and retirements of long-term debt
|
(11,162
|
)
|
(23,204
|
)
|
(219,315
|
)
|
|||||
|
Proceeds and excess tax benefits from exercises under employee compensation plans
|
52,373
|
|
45,137
|
|
7,871
|
|
|||||
|
Cash paid for taxes related to net settlement of share-based incentive awards
|
(51,262
|
)
|
—
|
|
—
|
|
|||||
|
Debt issuance costs and revolving credit facility origination fees
|
(12,764
|
)
|
—
|
|
(4,022
|
)
|
|||||
|
Repurchase and retirement of common stock
|
(32,368
|
)
|
—
|
|
—
|
|
|||||
|
Net cash provided by (used in) financing activities
|
1,261,258
|
|
500,500
|
|
(75,520
|
)
|
|||||
|
Net change in cash and cash equivalents
|
231,788
|
|
663,586
|
|
(649,196
|
)
|
|||||
|
Cash and cash equivalents at beginning of year
|
845,641
|
|
182,055
|
|
831,251
|
|
|||||
|
Cash and cash equivalents at end of year
|
$
|
1,077,429
|
|
$
|
845,641
|
|
$
|
182,055
|
|
||
|
Cash paid during the year for:
|
|
|
|
|
|
|
|||||
|
Interest, net of amount capitalized
|
$
|
128,567
|
|
$
|
143,187
|
|
$
|
187,884
|
|
||
|
Income taxes, net
|
$
|
204,818
|
|
$
|
163,703
|
|
$
|
27,605
|
|
||
See notes to consolidated financial statements.
66
EQT CORPORATION AND SUBSIDIARIES
DECEMBER 31,
|
|
2014
|
2013
|
|||||
|
|
(Thousands)
|
||||||
|
Assets
|
|
|
|
|
|||
|
Current assets:
|
|
|
|
|
|||
|
Cash and cash equivalents
|
$
|
1,077,429
|
|
$
|
845,641
|
|
|
|
Accounts receivable (less accumulated provision for doubtful accounts: $5,311 in 2014; $5,171 in 2013)
|
306,085
|
|
235,781
|
|
|||
|
Inventory
|
4,145
|
|
19,656
|
|
|||
|
Derivative instruments, at fair value
|
458,460
|
|
107,647
|
|
|||
|
Prepaid expenses and other
|
58,204
|
|
46,700
|
|
|||
|
Total current assets
|
1,904,323
|
|
1,255,425
|
|
|||
|
Equity in nonconsolidated investments
|
—
|
|
128,983
|
|
|||
|
Property, plant and equipment
|
13,608,151
|
|
11,062,136
|
|
|||
|
Less: accumulated depreciation and depletion
|
3,531,337
|
|
2,728,374
|
|
|||
|
Net property, plant and equipment
|
10,076,814
|
|
8,333,762
|
|
|||
|
Other assets
|
83,763
|
|
73,883
|
|
|||
|
Total assets
|
$
|
12,064,900
|
|
$
|
9,792,053
|
|
|
67
EQT CORPORATION AND SUBSIDIARIES
CONSOLIDATED BALANCE SHEETS
DECEMBER 31,
|
|
2014
|
2013
|
|||||
|
|
(Thousands)
|
||||||
|
Liabilities and Stockholders’ Equity
|
|
|
|
|
|||
|
Current liabilities:
|
|
|
|
|
|||
|
Current portion of long-term debt
|
$
|
166,011
|
|
$
|
11,162
|
|
|
|
Accounts payable
|
444,077
|
|
330,329
|
|
|||
|
Derivative instruments, at fair value
|
22,942
|
|
29,651
|
|
|||
|
Other current liabilities
|
200,449
|
|
152,268
|
|
|||
|
Total current liabilities
|
833,479
|
|
523,410
|
|
|||
|
Long-term debt
|
2,822,889
|
|
2,490,354
|
|
|||
|
Deferred income taxes
|
1,750,870
|
|
1,655,765
|
|
|||
|
Other liabilities and credits
|
284,599
|
|
258,396
|
|
|||
|
Total liabilities
|
5,691,837
|
|
4,927,925
|
|
|||
|
Equity:
|
|
|
|
|
|||
|
Stockholders’ equity
|
|
|
|
|
|||
|
Common stock, no par value, authorized 320,000 shares, shares issued: 175,384 in 2014 and 175,684 in 2013
|
1,895,632
|
|
1,869,843
|
|
|||
|
Treasury stock, shares at cost: 23,788 in 2014 and 24,800 in 2013
|
(429,440
|
)
|
(447,738
|
)
|
|||
|
Retained earnings
|
2,917,129
|
|
2,567,980
|
|
|||
|
Accumulated other comprehensive income
|
199,494
|
|
44,703
|
|
|||
|
Total common stockholders’ equity
|
4,582,815
|
|
4,034,788
|
|
|||
|
Noncontrolling interests in consolidated subsidiaries
|
1,790,248
|
|
829,340
|
|
|||
|
Total equity
|
6,373,063
|
|
4,864,128
|
|
|||
|
Total liabilities and equity
|
$
|
12,064,900
|
|
$
|
9,792,053
|
|
|
See notes to consolidated financial statements.
68
EQT CORPORATION AND SUBSIDIARIES
STATEMENTS OF CONSOLIDATED EQUITY
YEARS ENDED DECEMBER 31,
2014
,
2013
and
2012
|
|
Common Stock
|
|
|
|
|
|||||||||||||||||
|
|
Shares
Outstanding |
No
Par Value |
Retained
Earnings |
Accumulated
Other Comprehensive Income (Loss) |
Noncontrolling
Interests in Consolidated Subsidiaries |
Total
Equity |
||||||||||||||||
|
|
|
|
(Thousands)
|
|
|
|||||||||||||||||
|
Balance, December 31, 2011
|
149,477
|
|
$
|
1,261,779
|
|
$
|
2,143,910
|
|
$
|
188,141
|
|
$
|
—
|
|
$
|
3,593,830
|
|
|||||
|
Comprehensive income (net of tax):
|
|
|
|
|
|
|
|
|
|
|
|
|
||||||||||
|
Net income
|
|
|
|
|
183,395
|
|
|
|
13,016
|
|
196,411
|
|
||||||||||
|
Net change in cash flow hedges:
|
|
|
|
|
|
|
|
|
|
|
|
|
||||||||||
|
Natural gas, net of tax of ($61,757)
|
|
|
|
|
|
|
(93,878
|
)
|
|
|
(93,878
|
)
|
||||||||||
|
Interest rate, net of tax of $4,833
|
|
|
|
|
|
|
6,369
|
|
|
|
6,369
|
|
||||||||||
|
Pension and other post-retirement benefits liability adjustment, net of tax of ($1,992)
|
|
|
|
|
|
|
(1,085
|
)
|
|
|
(1,085
|
)
|
||||||||||
|
Dividends ($0.88 per share)
|
|
|
|
|
(131,803
|
)
|
|
|
|
|
(131,803
|
)
|
||||||||||
|
Stock-based compensation plans, net
|
632
|
|
41,621
|
|
|
|
|
|
217
|
|
41,838
|
|
||||||||||
|
Distributions to noncontrolling interests ($0.35 per common unit)
|
(5,031
|
)
|
(5,031
|
)
|
||||||||||||||||||
|
Issuance of common units of EQT Midstream Partners, LP
|
276,780
|
|
276,780
|
|
||||||||||||||||||
|
Deferred taxes related to IPO of EQT Midstream Partners, LP
|
5,371
|
|
5,371
|
|
||||||||||||||||||
|
Balance, December 31, 2012
|
150,109
|
|
$
|
1,308,771
|
|
$
|
2,195,502
|
|
$
|
99,547
|
|
$
|
284,982
|
|
$
|
3,888,802
|
|
|||||
|
Comprehensive income (net of tax):
|
|
|
|
|
|
|
|
|
|
|
|
|
||||||||||
|
Net income
|
|
|
|
|
390,572
|
|
|
|
47,243
|
|
437,815
|
|
||||||||||
|
Net change in cash flow hedges:
|
|
|
|
|
|
|
|
|
|
|
|
|
||||||||||
|
Natural gas, net of tax of ($50,200)
|
|
|
|
|
|
|
(76,489
|
)
|
|
|
(76,489
|
)
|
||||||||||
|
Interest rate, net of tax of $63
|
|
|
|
|
|
|
144
|
|
|
|
144
|
|
||||||||||
|
Pension and other post-retirement benefits liability adjustment, net of tax of $16,115
|
|
|
|
|
|
|
21,501
|
|
|
|
21,501
|
|
||||||||||
|
Dividends ($0.12 per share)
|
|
|
|
|
(18,094
|
)
|
|
|
|
|
(18,094
|
)
|
||||||||||
|
Stock-based compensation plans, net
|
775
|
|
114,975
|
|
|
|
|
|
454
|
|
115,429
|
|
||||||||||
|
Distributions to noncontrolling interests ($1.55 per common unit)
|
|
|
|
|
|
|
|
|
(32,781
|
)
|
(32,781
|
)
|
||||||||||
|
Issuance of common units of EQT Midstream Partners, LP
|
|
|
|
|
|
|
|
|
529,442
|
|
529,442
|
|
||||||||||
|
Deferred taxes related to the public offering of common units of EQT Midstream Partners, LP
|
|
|
(1,641
|
)
|
|
|
|
|
|
|
(1,641
|
)
|
||||||||||
|
Balance, December 31, 2013
|
150,884
|
|
$
|
1,422,105
|
|
$
|
2,567,980
|
|
$
|
44,703
|
|
$
|
829,340
|
|
$
|
4,864,128
|
|
|||||
|
Comprehensive income (net of tax):
|
|
|
|
|
|
|
|
|
|
|
|
|
||||||||||
|
Net income
|
|
|
|
|
386,965
|
|
|
|
124,025
|
|
510,990
|
|
||||||||||
|
Net change in cash flow hedges:
|
|
|
|
|
|
|
|
|
|
|
|
|
||||||||||
|
Natural gas, net of tax of $102,850
|
|
|
|
|
|
|
155,422
|
|
|
|
155,422
|
|
||||||||||
|
Interest rate, net of tax of $104
|
|
|
|
|
|
|
145
|
|
|
|
145
|
|
||||||||||
|
Pension and other post-retirement benefits liability adjustment, net of tax of ($515)
|
|
|
|
|
|
|
(776
|
)
|
|
|
(776
|
)
|
||||||||||
|
Dividends ($0.12 per share)
|
|
|
|
|
(18,207
|
)
|
|
|
|
|
(18,207
|
)
|
||||||||||
|
Stock-based compensation plans, net
|
1,012
|
|
56,846
|
|
|
|
|
|
2,235
|
|
59,081
|
|
||||||||||
|
Distributions to noncontrolling interests ($2.02 per common unit)
|
|
|
|
|
|
|
|
|
(67,819
|
)
|
(67,819
|
)
|
||||||||||
|
Issuance of common units of EQT Midstream Partners, LP
|
|
|
|
|
|
|
|
|
902,467
|
|
902,467
|
|
||||||||||
|
Repurchase and retirement of common stock
|
(300
|
)
|
(12,759
|
)
|
(19,609
|
)
|
|
|
|
|
(32,368
|
)
|
||||||||||
|
Balance, December 31, 2014
|
151,596
|
|
$
|
1,466,192
|
|
$
|
2,917,129
|
|
$
|
199,494
|
|
$
|
1,790,248
|
|
$
|
6,373,063
|
|
|||||
Common shares authorized:
320,000
shares. Preferred shares authorized:
3,000
shares. There are no preferred shares issued or outstanding.
See notes to consolidated financial statements.
69
EQT CORPORATION AND SUBSIDIARIES
NOTES TO CONSOLIDATED FINANCIAL STATEMENTS
DECEMBER 31, 2014
1.
Summary of Significant Accounting Policies
Principles of Consolidation:
The Consolidated Financial Statements include the accounts of EQT Corporation and all subsidiaries, ventures and partnerships in which a controlling interest is held (EQT or the Company). All significant intercompany accounts and transactions have been eliminated in consolidation. As of December 31, 2014, EQT owned a
2.0%
general partner interest, all incentive distribution rights and a
34.4%
limited partner interest in EQT Midstream Partners, LP (the Partnership) (NYSE: EQM). The Partnership is consolidated in EQT’s consolidated financial statements. EQT records the noncontrolling interest of the public limited partners in EQT’s financial statements.
Segments:
Operating segments are revenue-producing components of the enterprise for which separate financial information is produced internally and which are subject to evaluation by the Company’s chief operating decision maker in deciding how to allocate resources.
The Company reports its operations in
two
segments, which reflect its lines of business. The EQT Production segment includes the Company’s exploration for, and development and production of, natural gas, natural gas liquids (NGLs) and a limited amount of crude oil, primarily in the Appalachian Basin. EQT Midstream’s operations include the natural gas gathering, transportation, storage and marketing activities of the Company, including ownership and operation of the Partnership.
Substantially all of the Company’s operating revenues, income from operations and assets are generated or located in the United States.
Reclassification:
Certain previously reported amounts have been reclassified to conform to the current year presentation. Additionally, financial statements and notes to the financial statements previously reported in prior periods have been recast to reflect the presentation of discontinued operations as a result of the Equitable Gas Transaction. Refer to Note 2 for additional information on discontinued operations.
Certain prior year amounts in the Statements of Consolidated Cash Flows have been revised to correctly present changes in accrued liabilities related to the timing of payments for capital expenditures. For the year ended December 31, 2013, net cash provided by operating activities decreased by approximately
$37.5 million
with a corresponding decrease in net cash used in investing activities as a result of this correction, and for the year ended December 31, 2012, net cash provided by operating activities decreased by
$11.7 million
with a corresponding decrease in net cash used in investing activities. The correction had no impact on the Statements of Consolidated Income or Consolidated Balance Sheets.
Use of Estimates:
The preparation of financial statements in conformity with United States generally accepted accounting principles (GAAP) requires management to make estimates and assumptions that affect the amounts reported in the Consolidated Financial Statements and accompanying notes. Actual results could differ from those estimates.
Cash Equivalents:
The Company considers all highly liquid investments with an original maturity of
three months
or less when purchased to be cash equivalents. These investments are accounted for at cost. Interest earned on cash equivalents is included as a reduction of interest expense.
Inventories:
Generally, the Company’s inventory balance consists of natural gas stored underground or in pipelines and materials and supplies recorded at the lower of average cost or market. For hedged inventory subject to fair value hedges, the Company adjusts the average cost for the change in natural gas spot prices from the date the inventory is hedged until settlement. These fair value adjustments become part of the average cost of the inventory. During the years ended December 31, 2014, 2013 and 2012, the Company recorded losses for lower of cost or market adjustments of
$3.2 million
,
$0.4 million
and
$7.0 million
, respectively, which became part of the average cost of the inventory.
70
Property, Plant and Equipment:
The Company’s property, plant and equipment consist of the following:
|
|
As of December 31,
|
||||||
|
|
2014
|
2013
|
|||||
|
|
(Thousands)
|
||||||
|
Oil and gas producing properties, successful efforts method
|
$
|
10,263,547
|
|
$
|
8,152,951
|
|
|
|
Accumulated depletion
|
(2,874,257
|
)
|
(2,134,953
|
)
|
|||
|
Net oil and gas producing properties
|
7,389,290
|
|
6,017,998
|
|
|||
|
Midstream plant
|
3,234,370
|
|
2,807,165
|
|
|||
|
Accumulated depreciation and amortization
|
(606,998
|
)
|
(547,991
|
)
|
|||
|
Net midstream plant
|
2,627,372
|
|
2,259,174
|
|
|||
|
Other properties, at cost less accumulated depreciation
|
60,152
|
|
56,590
|
|
|||
|
Net property, plant and equipment
|
$
|
10,076,814
|
|
$
|
8,333,762
|
|
|
Oil and gas producing properties use the successful efforts method of accounting for production activities. Under this method, the cost of productive wells, including mineral interests, wells and related equipment, development dry holes, as well as productive acreage, are capitalized and depleted using the unit-of-production method. These capitalized costs include salaries, benefits and other internal costs directly attributable to these activities. The Company capitalized internal costs of
$108.5 million
,
$93.5 million
and
$72.1 million
in
2014
,
2013
and
2012
, respectively. The Company capitalized
$35.0 million
,
$22.9 million
and
$15.6 million
of interest relative to Marcellus and Utica well development in
2014
,
2013
and
2012
, respectively. Depletion expense is calculated based on the actual production multiplied by the applicable depletion rate per unit. The depletion rates are derived by dividing the costs capitalized by the number of units expected to be produced over the life of the reserves for lease costs and well costs separately. Costs of exploratory dry holes, geological and geophysical activities, delay rentals and other property carrying costs are charged to expense. The majority of the Company’s producing oil and gas properties consist of producing gas properties which were depleted at an overall average rate of
$1.22
per Mcfe,
$1.50
per Mcfe and
$1.52
per Mcfe produced for the years ended December 31,
2014
,
2013
and
2012
, respectively.
The carrying values of the Company’s proved oil and gas properties are reviewed for indications of impairment when events or circumstances indicate that the remaining carrying value may not be recoverable. In order to determine whether impairment has occurred, the Company estimates the expected future cash flows (on an undiscounted basis) from its oil and gas properties and compares these estimates to the carrying values of the properties. The estimated future cash flows used to test those properties for recoverability are based on proved and, in limited cases, risk-adjusted probable reserves, utilizing assumptions about the use of the asset, market prices for oil and gas and future operating costs. Proved oil and gas properties that have carrying amounts in excess of estimated future cash flows would be deemed to be unrecoverable. Those properties would be written down to fair value, which would be estimated by discounting the estimated future cash flows using discount rate assumptions that marketplace participants would use in their estimates of fair value.
Due to the decline in commodity prices during 2014, there were indications that the carrying values of certain of the Company’s oil and gas producing properties may be impaired and undiscounted future cash flows attributed to these assets indicated their carrying amounts were not expected to be recovered. Their fair value was measured using an income approach based upon estimates of future production levels, commodity prices, drilling and operating costs and discount rates, as a result, valuation of the impaired assets was a Level 3 measurement. For the year ended December 31, 2014, the Company recognized pretax impairment charges on proved oil and gas properties of
$180.7 million
, which are included in the impairment of long-lived assets caption in the Statements of Consolidated Income. This impairment included charges of
$105.2 million
on proved properties in its Permian Basin of Texas primarily due to the decline in commodity prices and
$75.5 million
on proved properties in its Utica Shale of Ohio as a result of insufficient recovery of hydrocarbons to support continued development along with the decline in commodity prices. For the years ended December 31, 2013 and 2012, the Company did not recognize impairment charges on proved oil and gas properties.
Capitalized costs of unproved oil and gas properties are evaluated at least annually for recoverability on a prospective basis. Indicators of potential impairment include changes brought about by economic factors, potential shifts in business strategy employed by management and historical experience. If it is determined that the properties will not yield proved reserves, the related costs are expensed in the period in which that determination is made. For the year ended December 31, 2014, unproved property impairments relating to the determination that the properties will not yield proved reserves were
$86.6 million
and are included in the impairment of long-lived assets in the Statements of Consolidated Income. This impairment relates to the Company’s decision to stop development of properties in its Utica Shale of Ohio described above. In addition, unproved oil and gas property impairments primarily as a result of lease expirations prior to drilling of
$14.6 million
,
$14.2 million
and
$5.5 million
are included
71
in exploration expense for the years ended December 31, 2014, 2013 and 2012, respectively. Unproved properties had a net book value of
$824.5 million
and
$450.2 million
at December 31,
2014
and
2013
, respectively.
At December 31,
2014
, the Company had
$9.0 million
of capitalized exploratory well costs, there were
no
capitalized exploratory wells costs at December 31, 2013.
Midstream property, plant and equipment is carried at cost. Depreciation is calculated using the straight-line method based on estimated service lives. Midstream property consists largely of gathering and transmission systems (
25
-
60
year estimated service life), buildings (
35
year estimated service life), office equipment (
3
-
7
year estimated service life), vehicles (
5
year estimated service life), and computer and telecommunications equipment and systems (
3
-
7
year estimated service life). The Company capitalized internal costs of
$40.0 million
,
$32.5 million
and
$27.2 million
in
2014
,
2013
and
2012
, respectively.
Major maintenance projects that do not increase the overall life of the related assets are expensed. When major maintenance materially increases the life or value of the underlying asset, the cost is capitalized.
When events or changes in circumstances indicate that the carrying amount of any long-lived asset other than proved and unproved oil and gas properties may not be recoverable, the Company reviews its long-lived assets for impairment by first comparing the carrying value of the assets to the sum of the undiscounted cash flows expected to result from the use and eventual disposition of the assets. If the carrying value exceeds the sum of the assets’ undiscounted cash flows, the Company records an impairment loss equal to the difference between the carrying value and fair value of the assets. No impairment of any long-lived asset other than proved and unproved oil and gas properties was recorded in 2014, 2013 and 2012.
Sales and Retirements Policies:
No gain or loss is recognized on the partial sale of proved developed oil and gas reserves unless non-recognition would significantly alter the relationship between capitalized costs and remaining proved reserves for the affected amortization base. When gain or loss is not recognized, the amortization base is reduced by the amount of the proceeds.
Regulatory Accounting:
EQT Midstream’s regulated operations consist of interstate pipeline operations subject to regulation by the Federal Energy Regulatory Commission (FERC) and certain FERC-regulated gathering operations. The application of regulatory accounting allows the Company to defer expenses and income on its Consolidated Balance Sheets as regulatory assets and liabilities when it is probable that those expenses and income will be allowed in the rate setting process in a period different from the period in which they would have been reflected in the Statements of Consolidated Income for a non-regulated company. The deferred regulatory assets and liabilities are then recognized in the Statements of Consolidated Income in the period in which the same amounts are reflected in rates.
The following table presents the total regulated net revenues and operating expenses included in the operations of EQT Midstream:
|
|
Years Ended December 31,
|
||||||||||
|
|
2014
|
2013
|
2012
|
||||||||
|
|
(Thousands)
|
||||||||||
|
Net Revenues
|
$
|
267,997
|
|
$
|
184,767
|
|
$
|
131,184
|
|
||
|
Operating expenses
|
$
|
89,617
|
|
$
|
71,517
|
|
$
|
66,202
|
|
||
The following table presents the regulated net property, plant and equipment included in EQT Midstream:
|
|
As of December 31,
|
||||||
|
|
2014
|
2013
|
|||||
|
|
(Thousands)
|
||||||
|
Property, plant & equipment
|
$
|
1,160,696
|
|
$
|
1,015,118
|
|
|
|
Accumulated depreciation and amortization
|
(188,884
|
)
|
(158,533
|
)
|
|||
|
Net property, plant & equipment
|
$
|
971,812
|
|
$
|
856,585
|
|
|
The regulatory assets associated with deferred taxes of
$15.2 million
and
$13.3 million
as of December 31,
2014
and
2013
, respectively, are included in other assets in the Consolidated Balance Sheets and primarily represent deferred income taxes recoverable through future rates related to a historical deferred tax position and the equity component of allowance for funds used during construction (AFUDC). The Company expects to recover the amortization of the deferred tax position ratably over the
72
corresponding life of the underlying assets that created the difference. The deferred tax regulatory asset associated with AFUDC represents the offset to the deferred taxes associated with the equity component of the allowance for funds used during the construction of long-lived assets. Taxes on capitalized funds used during construction and the offsetting deferred income taxes will be collected through rates over the depreciable lives of the long-lived assets to which they relate.
Derivative Instruments:
Derivatives are held as part of a formally documented risk management program. The Company’s use of derivative instruments is implemented under a set of policies approved by the Company’s Hedge & Financial Risk Committee (HFRC) and reviewed by the Audit Committee of the Board of Directors. The HFRC is composed of the president and chief executive officer, the chief financial officer and other officers of the Company.
In regards to commodity price risk, the financial instruments currently utilized by the Company are primarily fixed price swap agreements and collar agreements which may require payments to or receipt of payments from counterparties based on the differential between two prices for the commodity. The Company may also use other contractual agreements in implementing its commodity hedging strategy. The Company may execute interest rate swap agreements to hedge exposures to fluctuations in interest rates. The Company does not enter into derivative instruments for trading purposes.
The accounting for the changes in fair value of the Company’s derivative instruments depends on the use of the derivative instruments. To the extent that a derivative instrument has been designated and qualifies as a cash flow hedge, the effective portion of the change in fair value of the derivative instrument is reported as a component of accumulated other comprehensive income
(OCI), net of tax, and is subsequently reclassified into the Statements of Consolidated Income in the same period or periods during which the hedged forecasted transaction affects earnings. The Company assesses the effectiveness of hedging relationships, as determined by the degree that the gain (loss) for the hedging instrument offsets the loss (gain) on the hedged item, both at the inception of the hedge and on an on-going basis. If the gain (loss) for the hedging instrument is greater than the loss (gain) on the hedged item, the ineffective portion of the cash flow hedge is immediately recognized in operating revenues in the Statements of Consolidated Income.
Effective December 31, 2014, the Company elected to de-designate all derivative commodity instruments that were designated and qualified as cash flow hedges. If a cash flow hedge was terminated or de-designated as a hedge before the settlement date of the hedged item, the amount of deferred gain or loss within accumulated OCI recorded up to that date remains deferred, provided that the forecasted transaction remained probable of occurring. Subsequent changes in fair value of a de-designated derivative instrument are recorded in earnings. The amount recorded in accumulated OCI is primarily related to instruments that were previously designated as cash flow hedges.
Effective October 1, 2013, the Company de-designated all derivative commodity instruments that were previously designated and qualified as fair value hedges. For a derivative instrument that had been designated and qualified as a fair value hedge, the change in the fair value for the instrument was recognized as a portion of operating revenues in the Statements of Consolidated Income each period. In addition, the change in the fair value of the hedged item (natural gas inventory) was recognized as a portion of operating revenues in the Statements of Consolidated Income. The Company elected to exclude the spot/forward differential from the assessment of effectiveness of the fair value hedges.
Any changes in fair value of derivative instruments that have not been designated as hedges are recognized within operating revenues in the Statements of Consolidated Income each period.
The Company reports all gains and losses on its natural gas derivative commodity instruments net as operating revenues on its Statements of Consolidated Income.
Allowance for Funds Used During Construction:
Carrying costs for the construction of certain long-term assets are capitalized by the Company and amortized over the related assets’ estimated useful lives. The capitalized amount for construction of regulated assets includes interest cost and a designated cost of equity for financing the construction of these assets which are subject to regulation by the FERC.
The debt portion of AFUDC is calculated based on the average cost of debt and is included as a reduction of interest expense in the Statements of Consolidated Income. AFUDC interest costs capitalized were
$5.8 million
,
$4.3 million
and
$3.9 million
for the years ended December 31,
2014
,
2013
and
2012
, respectively.
The equity portion of AFUDC is calculated using the most recent equity rate of return approved by the applicable regulator. Equity amounts capitalized are included in other income in the Statements of Consolidated Income. The AFUDC equity amounts capitalized were
$3.2 million
,
$1.2 million
and
$6.8 million
for the years ended December 31,
2014
,
2013
and
2012
, respectively.
73
Other Current Liabilities:
Other current liabilities as of December 31,
2014
and
2013
are detailed below.
|
|
December 31,
|
||||||
|
|
2014
|
2013
|
|||||
|
|
(Thousands)
|
||||||
|
Incentive compensation
|
$
|
70,826
|
|
$
|
65,053
|
|
|
|
Taxes other than income
|
52,035
|
|
39,073
|
|
|||
|
Accrued interest payable
|
37,349
|
|
29,379
|
|
|||
|
All other accrued liabilities
|
40,239
|
|
18,763
|
|
|||
|
Total other current liabilities
|
$
|
200,449
|
|
$
|
152,268
|
|
|
Revenue Recognition:
Revenue is recognized for production and gathering activities when deliveries of natural gas, NGLs and crude oil occur. Revenues from natural gas transportation and storage activities are recognized in the period the service is provided. Reservation revenues on firm contracted capacity are recognized over the contract period based on the contracted volume regardless of the amount of natural gas that is transported. The Company reports revenue from all energy trading contracts net in the income statement, regardless of whether the contracts are physically or financially settled. Contracts which result in physical delivery of a commodity expected to be used or sold by the Company in the normal course of business are considered normal purchases and sales and are not subject to derivative accounting. Revenues from these contracts are recognized at contract value when delivered and are reported in operating revenues. The Company reports all gains and losses on its derivative commodity instruments net as operating revenues on its Statements of Consolidated Income. The Company accounts for gas-balancing arrangements under the entitlement method. The Company uses the gross method to account for overhead cost reimbursements from joint operating partners. During periods in which rates are subject to refund as a result of a pending rate case, the Company records revenue at the rates which are pending approval but reserves these revenues to the level of previously approved rates until the final settlement of the rate case.
Investments
: EQT owns a
2.0%
general partner interest, all incentive distribution rights and a
34.4%
limited partner interest in the Partnership. The Partnership is consolidated in EQT’s consolidated financial statements because EQT controls the Partnership through its ownership of the general partner and the rights provided to the general partner under the Partnership’s partnership agreement. EQT records the noncontrolling interest of the public limited partners in EQT’s financial statements. Investments in companies in which the Company has the ability to exert significant influence over operating and financial policies (generally
20%
to
50%
ownership), but which the Company does not control, are accounted for using the equity method. Under the equity method, investments are initially recorded at cost and adjusted for dividends and undistributed earnings and losses. These investments are classified as equity in nonconsolidated investments on the Consolidated Balance Sheets.
Transportation and Processing:
Third-party costs incurred to gather, process, and transport gas produced by EQT Production to market sales points are recorded as a portion of transportation and processing costs in the Statements of Consolidated Income. Some transportation costs incurred by the Company are marketed for resale and are not incurred to transport gas produced by EQT Production. These transportation costs are reflected as a deduction from operating revenues.
Income Taxes:
The Company files a consolidated federal income tax return and utilizes the asset and liability method to account for income taxes. The provision for income taxes represents amounts paid or estimated to be payable, net of amounts refunded or estimated to be refunded, for the current year and the change in deferred taxes, exclusive of amounts recorded in OCI. Any refinements to prior years’ taxes made due to subsequent information are reflected as adjustments in the current period. Separate income taxes are calculated for income from continuing operations, income from discontinued operations and items charged or credited directly to stockholders’ equity.
Deferred income tax assets and liabilities are determined based on temporary differences between the financial reporting and tax bases of assets and liabilities and are recognized using enacted tax rates for the effect of such temporary differences. Deferred tax assets are reduced by a valuation allowance if it is more likely than not that some portion or all of the deferred tax asset will not be realized.
In accounting for uncertainty in income taxes of a tax position taken or expected to be taken in a tax return, the Company utilizes a recognition threshold and measurement attribute for the financial statement recognition and measurement. The recognition threshold requires the Company to determine whether it is more likely than not that a tax position will be sustained upon examination, including resolution of any related appeals or litigation processes, based on the technical merits of the position in order to record any financial statement benefit. If it is more likely than not that a tax position will be sustained, then the Company must measure the tax position to determine the amount of benefit to recognize in financial statements. The tax position is measured
74
at the largest amount of benefit that is greater than
50%
likely of being realized upon ultimate settlement. The Company recognizes interest and penalties accrued related to unrecognized tax benefits in income tax expense.
Provision for Doubtful Accounts:
Judgment is required to assess the ultimate realization of the Company’s accounts receivable, including assessing the probability of collection and the credit worthiness of certain customers. Reserves for uncollectible accounts are recorded as part of selling, general and administrative expense in the Statements of Consolidated Income. The reserves are based on historical experience, current and expected economic trends and specific information about customer accounts. Accordingly, actual results may differ from these estimates under different assumptions or conditions.
Earnings Per Share (EPS):
Basic EPS are computed by dividing net income attributable to EQT Corporation by the weighted average number of common shares outstanding during the period, without considering any dilutive items. Diluted EPS are computed by dividing net income attributable to EQT Corporation by the weighted average number of common shares and potentially dilutive securities, net of shares assumed to be repurchased using the treasury stock method. Purchases of treasury shares are calculated using the average share price for the Company’s common stock during the period. Potentially dilutive securities arise from the assumed conversion of outstanding stock options and other share-based awards. See Note 15.
Asset Retirement Obligations
: The Company accrues a liability for legal asset retirement obligations based on an estimate of the timing and amount of settlement. For oil and gas wells, the fair value of the Company’s plugging and abandonment obligations is required to be recorded at the time the obligations are incurred, which is typically at the time the wells are spud. Upon initial recognition of an asset retirement obligation, the Company increases the carrying amount of the long-lived asset by the same amount as the liability. Over time, the liabilities are accreted for the change in their present value, through charges to depreciation, depletion and amortization, and the initial capitalized costs are depleted over the useful lives of the related assets.
The Company is required to operate and maintain its natural gas pipeline and storage systems, and intends to do so as long as supply and demand for natural gas exists, which the Company expects for the foreseeable future. Therefore, the Company believes that the substantial majority of its natural gas pipeline and storage system assets have indeterminate lives.
The following table presents a reconciliation of the beginning and ending carrying amounts of the Company’s asset retirement obligations which are included in other liabilities and credits in the Consolidated Balance Sheets. The Company does not have any assets that are legally restricted for purposes of settling these obligations.
|
|
Years Ended December 31,
|
||||||
|
|
2014
|
2013
|
|||||
|
|
(Thousands)
|
||||||
|
Asset retirement obligation as of beginning of period
|
$
|
116,045
|
|
$
|
109,034
|
|
|
|
Accretion expense
|
9,420
|
|
8,342
|
|
|||
|
Liabilities incurred
|
16,953
|
|
2,510
|
|
|||
|
Liabilities settled
|
(14,025
|
)
|
(3,353
|
)
|
|||
|
Revisions in estimated cash flows
|
11,693
|
|
(488
|
)
|
|||
|
Asset retirement obligation as of end of period
|
$
|
140,086
|
|
$
|
116,045
|
|
|
In connection with the exchange of certain assets with Range Resources Corporation (Range) (see Notes 7 and 9 for additional information), the Company settled
$7.7 million
and incurred
$14.2 million
of asset retirement obligation liabilities during the year ended December 31, 2014. These amounts are included in the respective captions in the table above.
Self-Insurance:
The Company is self-insured for certain losses related to workers’ compensation and maintains a self-insured retention for general liability, automobile liability, environmental liability and other casualty coverage. The Company maintains stop loss coverage with third-party insurers to limit the total exposure for general liability, automobile liability, environmental liability and workers’ compensation. The recorded reserves represent estimates of the ultimate cost of claims incurred as of the balance sheet date. The estimated liabilities are based on analyses of historical data and actuarial estimates and are not discounted. The liabilities are reviewed by management quarterly and by independent actuaries annually to ensure that they are appropriate. While the Company believes these estimates are reasonable based on the information available, financial results could be impacted if actual trends, including the severity or frequency of claims, differ from estimates.
75
Accumulated other comprehensive income:
The components of accumulated OCI, net of tax, are as follows:
|
|
As of December 31,
|
||||||
|
|
2014
|
2013
|
|||||
|
|
(Thousands)
|
||||||
|
Net gain from natural gas hedging transactions
|
$
|
217,121
|
|
$
|
61,699
|
|
|
|
Net loss from interest rate swaps
|
(987
|
)
|
(1,132
|
)
|
|||
|
Pension and other post-retirement benefits liability adjustment
|
(16,640
|
)
|
(15,864
|
)
|
|||
|
Accumulated OCI
|
$
|
199,494
|
|
$
|
44,703
|
|
|
Noncontrolling interests:
Noncontrolling interests represent third-party equity ownership in the Partnership and are presented as a component of equity in the Consolidated Balance Sheets. In the Statements of Consolidated Income, noncontrolling interests reflect the allocation of earnings to third-party investors, which for the Partnership gives effect to the incentive distribution rights declared for each period. See Note 3 for further discussion of noncontrolling interests related to the Partnership.
Recently Issued Accounting Standards:
In May 2014, the Financial Accounting Standards Board issued Accounting Standards Update (ASU) No. 2014-09, Revenue from Contracts with Customers. The standard requires an entity to recognize revenue in a manner that depicts the transfer of goods or services to customers at an amount that reflects the consideration to which the entity expects to be entitled in exchange for those goods or services. ASU No. 2014-09 will replace most of the existing revenue recognition requirements in United States GAAP when it becomes effective. The guidance in ASU No. 2014-09 is effective for public entities for annual reporting periods beginning after December 15, 2016, including interim periods therein. Early adoption is not permitted. The Company is currently evaluating the method of adoption and impact this standard will have on its financial statements and related disclosures.
Subsequent Events:
The Company has evaluated subsequent events through the date of the financial statement issuance.
2.
Discontinued Operations
On December 17, 2013, the Company and its wholly owned subsidiary Distribution Holdco, LLC completed the disposition of their ownership interests in Equitable Gas Company, LLC (Equitable Gas) and Equitable Homeworks, LLC (Homeworks) to PNG Companies LLC (the Equitable Gas Transaction). Equitable Gas and Homeworks comprised substantially all of the Company’s previously reported Distribution segment. The financial information of Equitable Gas and Homeworks is reflected as discontinued operations for all periods presented in these financial statements. Prior periods have been recast to reflect this presentation.
During the year ended December 31, 2014, the Company received additional cash proceeds of
$7.4 million
as a result of post-closing purchase price adjustments for the Equitable Gas Transaction. The Company recognized an additional gain of
$2.9 million
for the year ended December 31, 2014, included in income from discontinued operations, net of tax, in the Statements of Consolidated Income. As consideration for the Equitable Gas Transaction, the Company received total cash proceeds of
$748.0 million
, select midstream assets (including the Allegheny Valley Connector) with a fair value of
$140.9 million
and other contractual assets with a fair value of
$32.5 million
.
During the year ended December 31, 2013, the Company recognized a gain on the sale of
$43.8 million
, subject to customary post-closing adjustments. The gain is net of tax expense of
$122.5 million
and is included in income from discontinued operations, net of tax, in the Statements of Consolidated Income.
76
The following table summarizes the components of discontinued operations activity:
|
|
Years Ended December 31,
|
||||||||||
|
|
2014
|
2013
|
2012
|
||||||||
|
|
(Thousands)
|
||||||||||
|
Operating revenues
|
$
|
—
|
|
$
|
332,947
|
|
$
|
314,821
|
|
||
|
Income from discontinued operations before income taxes
|
2,377
|
|
251,378
|
|
81,328
|
|
|||||
|
Income taxes
|
1,006
|
|
159,535
|
|
33,835
|
|
|||||
|
Income from discontinued operations, net of tax
|
$
|
1,371
|
|
$
|
91,843
|
|
$
|
47,493
|
|
||
The Company incurred
$8.1 million
and
$4.5 million
of transaction costs related to the Equitable Gas Transaction for the year ended December 31,
2013
and 2012, respectively, which are included in the results of discontinued operations. The Company also recognized a
$51.6 million
write off of income tax related regulatory assets (net of related deferred taxes) through income tax expense in discontinued operations in 2013.
3.
EQT Midstream Partners, LP
On July 2, 2012, the Partnership, a subsidiary of the Company, completed an underwritten initial public offering (IPO) of
14,375,000
common units representing limited partner interests in the Partnership, which represented
40.6%
of the Partnership’s outstanding equity. The Company retained a
59.4%
equity interest in the Partnership, including
2,964,718
common units,
17,339,718
subordinated units and a
2%
general partner interest. Prior to the IPO, the Company contributed to the Partnership
100%
of Equitrans, L.P. (Equitrans). A wholly owned subsidiary of the Company serves as the general partner of the Partnership, and the Company continues to operate the Equitrans business pursuant to certain contractual arrangements established in connection with the IPO. The Company continues to consolidate the results of the Partnership but records an income tax provision only as to its ownership percentage. The Company records the noncontrolling interest of the public limited partners in its financial statements.
On July 22, 2013, Sunrise, a subsidiary of the Company, merged with and into Equitrans, a subsidiary of the Partnership, with Equitrans continuing as the surviving company (the Sunrise Merger). Equitrans is consolidated by the Company as it is still controlled by the Company.
On July 22, 2013, the Partnership completed an underwritten public offering of
12,650,000
common units representing Partnership limited partner interests. Following the offering and the closing of the Sunrise Merger, the Company retained a
44.6%
equity interest in the Partnership, which included
3,443,902
common units,
17,339,718
subordinated units and a
2%
general partner interest. The Partnership received net proceeds of
$529.4 million
from the offering, after deducting the underwriters’ discount and offering expenses of
$20.9 million
.
On May 7, 2014, EQT Gathering, LLC, a wholly owned subsidiary of the Company, EQT Gathering contributed a high-pressure gathering system to EQM Gathering, a wholly owned subsidiary of the Partnership, in exchange for
$1.18 billion
(the Jupiter Transaction). EQM Gathering is consolidated by the Company as it is still controlled by the Company.
On May 7, 2014, the Partnership completed an underwritten public offering of
12,362,500
common units, which included the full exercise of the underwriters’ overallotment option, representing Partnership limited partner interests. The Partnership received net proceeds of approximately
$902.5 million
from the offering, after deducting the underwriters’ discount and offering expenses of approximately
$34.0 million
. As of December 31, 2014, the Company held a
2%
general partner interest, all incentive distribution rights and a
34.4%
limited partner interest in the Partnership. The Company’s limited partner interest in the Partnership consists of
3,959,952
common units and
17,339,718
subordinated units.
In August 2014, the Partnership issued
4.00%
Senior Notes due 2024 (
4.00%
Senior Notes) in the aggregate principal amount of
$500.0 million
. Net proceeds of the offering of
$492.3 million
, after deducting a discount of
$2.9 million
and debt issuance costs of
$4.8 million
, were used to repay all of the outstanding borrowings under the Partnership’s credit facility and for general partnership purposes. The indenture governing the
4.00%
Senior Notes contains covenants that limit the Partnership’s ability to, among other things, incur certain liens securing indebtedness, engage in certain sale and leaseback transactions, and enter into certain consolidations, mergers, conveyances, transfers or leases of all or substantially all of the Partnership’s assets. The payment obligations under the
4.00%
Senior Notes were unconditionally guaranteed by each of the Partnership’s subsidiaries that guaranteed the Partnership’s credit facility (other than EQT Midstream Finance Corporation). The subsidiary guarantors were
77
released from their guarantees of the
4.00%
Senior Notes in January 2015 in connection with an amendment to the Partnership’s credit facility.
On January 22, 2015, the Board of Directors of the Partnership’s general partner declared a cash distribution to the Partnership’s unitholders for the fourth quarter of 2014 of
$0.58
per common and subordinated unit,
$0.8 million
to the general partner related to its
2%
general partner interest and
$5.2 million
to the general partner related to its incentive distribution rights. The cash distribution will be paid on February 13, 2015 to unitholders of record at the close of business on February 3, 2015. As a result of this cash distribution, the subordination period with respect to the Partnership’s
17,339,718
subordinated units will expire on February 17, 2015 and all outstanding Partnership subordinated units will convert into Partnership common units on a one-for-one basis on that day.
Net income attributable to noncontrolling interests (i.e. the limited partner units not owned by the Company) was
$124.0 million
,
$47.2 million
and
$13.0 million
for the years ended December 31,
2014
,
2013
and 2012, respectively. The Partnership paid distributions of
$67.8 million
(
$2.02
per common unit),
$32.8 million
(
$1.55
per common unit) and
$5.0 million
(
$0.35
per common unit) to noncontrolling interests for the years ended December 31,
2014
,
2013
and 2012, respectively.
4.
Financial Information by Business Segment
Operating segments are revenue-producing components of the enterprise for which separate financial information is produced internally and which are subject to evaluation by the Company’s chief operating decision maker in deciding how to allocate resources.
The Company reports its operations in two segments, which reflect its lines of business. The EQT Production segment includes the Company’s exploration for, and development and production of, natural gas, natural gas liquids (NGLs) and a limited amount of crude oil in the Appalachian and Permian Basins. The EQT Midstream segment’s operations include the natural gas gathering, transportation, storage and marketing activities of the Company, including ownership and operation of the Partnership.
Operating segments are evaluated on their contribution to the Company’s consolidated results based on operating income. Other income, interest and income taxes are managed on a consolidated basis. Headquarters’ costs are billed to the operating segments based upon an allocation of the headquarters’ annual operating budget. Differences between budget and actual headquarters’ expenses are not allocated to the operating segments.
The Company’s management reviews and reports the EQT Production segment results with third-party transportation and processing costs reflected as a deduction from operating revenues. Third-party costs incurred to gather, process and transport gas produced by EQT Production to market sales points are recorded as a portion of transportation and processing costs in the Statements of Consolidated Income. Some transportation costs incurred by the Company are marketed for resale and are not incurred to transport gas produced by EQT Production. These transportation costs are reflected as a deduction from operating revenues.
Substantially all of the Company’s operating revenues, income from operations and assets are generated or located in United States.
78
|
|
Years Ended December 31,
|
|||||||||||
|
|
2014
|
2013
|
2012
|
|||||||||
|
|
|
|
(Thousands)
|
|
|
|||||||
|
Revenues from external customers:
|
|
|
|
|
|
|
||||||
|
EQT Production
|
$
|
1,612,730
|
|
$
|
1,168,657
|
|
$
|
793,773
|
|
|||
|
EQT Midstream
|
699,083
|
|
614,042
|
|
505,498
|
|
||||||
|
Third-party transportation and processing costs (a)
|
200,562
|
|
142,281
|
|
126,783
|
|
||||||
|
Less intersegment revenues, net (b)
|
(42,665
|
)
|
(62,969
|
)
|
(48,832
|
)
|
||||||
|
Total
|
$
|
2,469,710
|
|
$
|
1,862,011
|
|
$
|
1,377,222
|
|
|||
|
|
|
|
|
|
|
|||||||
|
EQT Production (c)
|
$
|
505,950
|
|
$
|
371,245
|
|
$
|
187,913
|
|
|||
|
EQT Midstream (c)
|
384,309
|
|
328,782
|
|
237,324
|
|
||||||
|
Unallocated expenses (d)
|
(36,864
|
)
|
(45,423
|
)
|
(35,608
|
)
|
||||||
|
Total operating income
|
$
|
853,395
|
|
$
|
654,604
|
|
$
|
389,629
|
|
|||
|
Reconciliation of operating income to income from continuing operations:
|
||||||||||||
|
Other income
|
$
|
6,853
|
|
$
|
9,242
|
|
$
|
15,536
|
|
|||
|
Interest expense
|
136,537
|
|
142,688
|
|
184,786
|
|
||||||
|
Income taxes
|
214,092
|
|
175,186
|
|
71,461
|
|
||||||
|
Income from continuing operations
|
$
|
509,619
|
|
$
|
345,972
|
|
$
|
148,918
|
|
|||
|
|
As of December 31,
|
|||||||
|
|
2014
|
2013
|
||||||
|
|
(Thousands)
|
|||||||
|
Segment assets:
|
|
|
|
|
||||
|
EQT Production
|
$
|
8,153,199
|
|
$
|
6,359,065
|
|
||
|
EQT Midstream
|
2,709,052
|
|
2,514,429
|
|
||||
|
Total operating segments
|
10,862,251
|
|
8,873,494
|
|
||||
|
Headquarters assets, including cash and short-term investments
|
1,202,649
|
|
918,559
|
|
||||
|
Total assets
|
$
|
12,064,900
|
|
$
|
9,792,053
|
|
||
EQT Production and EQT Midstream had segment assets of
$5,675.5 million
and
$2,046.6 million
, respectively, as of December 31,
2012
.
(a) This amount reflects the reclassification of third-party transportation and processing costs from operating revenues to transportation and processing costs at the consolidated level.
(b) Includes entries to eliminate intercompany natural gas sales from EQT Production to EQT Midstream. The Company also had
$37.6 million
and
$36.8 million
for the years ended December 31,
2013
and
2012
, respectively, of intercompany eliminations for transmission and storage services between EQT Midstream and Distribution that have been recast to discontinued operations as a result of the Equitable Gas Transaction. Additionally, the Company had
$2.6 million
and
$11.7 million
for the years ended December 31,
2013
and
2012
, respectively, of intercompany eliminations for retail business activity between Distribution and EQT Midstream that have been recast to discontinued operations. These recast adjustments had no impact on the Company’s net income for any period.
(c) Gain on sale / exchange of assets of
$6.8 million
and
$19.6 million
are included in EQT Midstream operating income for
2014
and
2013
, respectively. Gain on sale / exchange of assets of
$27.4 million
are included in EQT Production operating income for 2014. See Note 7. Impairment of long-lived assets of
$267.3 million
are included in EQT Production operating income for 2014. See Note 1.
79
(d) Unallocated expenses consist primarily of a
$20.0 million
contribution to the EQT Foundation in 2014, incentive compensation, administrative costs and in 2013 and 2012, corporate overhead charges previously allocated to the Distribution segment that were reclassified to Headquarters as part of the recast of those periods to reflect the discontinued operations presentation requirements.
|
|
Years Ended December 31,
|
|||||||||||
|
|
2014
|
2013
|
2012
|
|||||||||
|
|
|
(Thousands)
|
|
|||||||||
|
Depreciation, depletion and amortization:
|
|
|
|
|
|
|
||||||
|
EQT Production
|
$
|
592,855
|
|
$
|
578,641
|
|
$
|
409,628
|
|
|||
|
EQT Midstream
|
87,034
|
|
75,032
|
|
64,782
|
|
||||||
|
Other
|
(591
|
)
|
(541
|
)
|
207
|
|
||||||
|
Total
|
$
|
679,298
|
|
$
|
653,132
|
|
$
|
474,617
|
|
|||
|
Expenditures for segment assets: (e)
|
|
|
|
|
|
|
||||||
|
EQT Production (f)
|
$
|
2,441,486
|
|
$
|
1,423,185
|
|
$
|
991,775
|
|
|||
|
EQT Midstream
|
455,359
|
|
369,399
|
|
375,731
|
|
||||||
|
Other
|
3,341
|
|
4,292
|
|
3,134
|
|
||||||
|
Total
|
$
|
2,900,186
|
|
$
|
1,796,876
|
|
$
|
1,370,640
|
|
|||
(e) Includes non-cash capital expenditures of
$99.3 million
,
$70.2 million
and
$24.0 million
for the years ended December 31, 2014, 2013 and 2012, respectively, for certain labor overhead costs including a portion of non-cash stock-based compensation expense and non-cash capital expense accruals that had not yet been paid at the respective year-end.
(f) Expenditures for segment assets in the EQT Production segment include
$724.4 million
,
$186.2 million
and
$134.6 million
for property acquisitions in
2014
,
2013
and
2012
, respectively. Included within the
$724.4 million
of property acquisitions for the year ended December 31, 2014 is
$349.2 million
of non-cash capital expenditures for the exchange of assets with Range Resources Corporation (described in Note 7).
5.
Derivative Instruments
The Company’s primary market risk exposure is the volatility of future prices for natural gas and NGLs, which can affect the operating results of the Company primarily at EQT Production. The Company’s overall objective in its hedging program is to protect cash flows from undue exposure to the risk of changing commodity prices.
The Company uses over the counter (OTC) derivative commodity instruments, primarily swap and collar agreements, that are primarily placed with financial institutions and the creditworthiness of these institutions is regularly monitored. The Company also uses exchange traded futures contracts that obligate the Company to buy or sell a designated commodity at a future date for a specified price and quantity at a specified location. Swap agreements involve payments to or receipts from counterparties based on the differential between
two
prices for the commodity. Collar agreements require the counterparty to pay the Company if the index price falls below the floor price and the Company to pay the counterparty if the index price rises above the cap price. The Company also engages in basis swaps to protect earnings from undue exposure to the risk of geographic disparities in commodity prices and interest rate swaps to hedge exposure to interest rate fluctuations on potential debt issuances. During 2014, the Company granted
50,000
dth per day of calendar 2016 swaptions to counterparties in exchange for calendar 2015 collars with premium pricing. Swaption contracts grant the counterparty the option to enter into a fixed price swap agreement with the Company at a future date. Each 2016 swaption and associated 2015 collar was executed contemporaneously with a single counterparty and no cash was exchanged at the inception of the contracts.
The Company recognizes all derivative instruments as either assets or liabilities at fair value on a gross basis. These assets and liabilities are reported in the Consolidated Balance Sheets as derivative instruments at fair value. These derivative instruments are reported as either current assets or current liabilities due to their highly liquid nature. The Company can net settle its derivative instruments at any time.
The accounting for the changes in fair value of the Company’s derivative instruments depends on the use of the derivative instruments. To the extent that a derivative instrument has been designated and qualifies as a cash flow hedge, the effective portion of the change in fair value of the derivative instrument is reported as a component of accumulated OCI, net of tax, and is subsequently reclassified into the Statements of Consolidated Income in the same period or periods during which the forecasted transaction
80
affects earnings. On December 31, 2013, the Company sold certain energy marketing contracts and de-designated related derivative instruments that were previously designated as cash flow hedges because it was probable that the forecasted transactions would not occur, resulting in a
$1.0 million
pre-tax gain in operating revenues within the Statements of Consolidated Income for the year ended December 31, 2013. In conjunction with the exchange of assets with Range Resources Corporation (see Note 7), the Company de-designated certain derivative instruments that were previously designated as cash flow hedges because it was probable that the forecasted transactions would not occur, resulting in a pre-tax gain of
$28.0 million
recorded with gain on sale / exchange of assets in the Statements of Consolidated Income for the year ended December 31, 2014. Any subsequent changes in fair value of hedging instruments that have been de-designated are recognized within operating revenues in the Statements of Consolidated Income each period.
Historically, derivative commodity instruments used by the Company to hedge its exposure to variability in expected future cash flows associated with the fluctuations in the price of natural gas related to the Company’s forecasted sale of equity production and forecasted natural gas purchases and sales were designated and qualified as cash flow hedges. As of December 31, 2014 and 2013, the Company deferred net gains of
$217.1 million
and
$61.7 million
, respectively, in accumulated OCI, net of tax, related to the effective portion of the change in fair value of its derivative commodity instruments designated as cash flow hedges. Effective December 31, 2014, the Company elected to de-designate all cash flow hedges and discontinue the use of cash flow hedge accounting. As of December 31, 2014, the forecasted transactions remain probable of occurring and as such, the amounts in accumulated OCI will continue to be reported in accumulated OCI and will be reclassified into earnings in future periods when the underlying hedged transactions occur. The Company estimates that approximately
$153.2 million
of net gains on its derivative commodity instruments reflected in accumulated OCI, net of tax, as of December 31, 2014 will be recognized in earnings during the next twelve months due to the settlement of hedged transactions. As a result of the discontinuance of cash flow hedge accounting, all future changes in fair value of the Company’s derivative instruments will be recognized in the Statements of Consolidated Income each future period.
Historically, some of the derivative commodity instruments used by the Company to hedge its exposure to adverse changes in the market price of natural gas stored in the ground were designated and qualified as fair value hedges. These positions were de-designated effective October 1, 2013. Any hedging ineffectiveness and any change in fair value of derivative instruments that have not been designated as hedges are recognized in the Statements of Consolidated Income each period.
The Company also enters into fixed price natural gas sales agreements that are satisfied by physical delivery. These physical commodity contracts qualify for the normal purchases and sales exception and are not subject to derivative instrument accounting.
Exchange-traded instruments are generally settled with offsetting positions. OTC arrangements require settlement in cash. Settlements of derivative commodity instruments are reported as a component of cash flows from operations in the accompanying Statements of Consolidated Cash Flows.
81
|
|
Years Ended December 31,
|
|||||||||||
|
|
2014
|
2013
|
2012
|
|||||||||
|
|
|
(Thousands)
|
|
|||||||||
|
Commodity derivatives designated as cash flow hedges
|
|
|
|
|
|
|
||||||
|
Amount of gain recognized in OCI (effective portion), net of tax
|
$
|
156,207
|
|
$
|
10,669
|
|
$
|
86,259
|
|
|||
|
Amount of gain reclassified from accumulated OCI, net of tax, into gain on sale / exchange of assets and dispositions due to forecasted transactions probable to not occur
|
16,735
|
|
—
|
|
—
|
|
||||||
|
Amount of (loss) gain reclassified from accumulated OCI, net of tax, into operating revenues (effective portion)
|
(15,950
|
)
|
87,158
|
|
180,137
|
|
||||||
|
Amount of gain (loss) recognized in operating revenues (ineffective portion) (a)
|
24,774
|
|
(21,335
|
)
|
(75
|
)
|
||||||
|
Interest rate derivatives designated as cash flow hedges
|
|
|
|
|
|
|
||||||
|
Amount of loss recognized in OCI (effective portion), net of tax
|
$
|
—
|
|
$
|
—
|
|
$
|
(7,138
|
)
|
|||
|
Amount of loss reclassified from accumulated OCI, net of tax, into interest expense due to forecasted transactions no longer being probable
|
—
|
|
—
|
|
(13,266
|
)
|
||||||
|
Amount of loss reclassified from accumulated OCI, net of tax, into interest expense (effective portion)
|
(145
|
)
|
(144
|
)
|
(241
|
)
|
||||||
|
Commodity derivatives designated as fair value hedges (b)
|
|
|
|
|
|
|
||||||
|
Amount of (loss) gain recognized in operating revenues for fair value commodity contracts
|
$
|
—
|
|
$
|
(1,341
|
)
|
$
|
3,878
|
|
|||
|
Fair value gain recognized in operating revenues for inventory designated as hedged item
|
—
|
|
386
|
|
3,292
|
|
||||||
|
Derivatives not designated as hedging
instruments
|
|
|
|
|
||||||||
|
Amount of gain recognized in operating revenues
|
$
|
80,942
|
|
$
|
2,834
|
|
$
|
2,176
|
|
|||
(a)
No amounts have been excluded from effectiveness testing of cash flow hedges.
(b)
For the year ended December 31,
2013
, the net impact on operating revenues consisted of a
$0.5 million
gain due to the exclusion of the spot/forward differential from the assessment of effectiveness and a
$1.5 million
loss due to changes in basis. For the year ended December 31,
2012
, the net impact on operating revenues consisted of a
$7.6 million
gain due to the exclusion of the spot/forward differential from the assessment of effectiveness and a
$0.4 million
loss due to changes in basis.
|
|
As of December 31,
|
|||||||
|
|
2014
|
2013
|
||||||
|
|
(Thousands)
|
|||||||
|
Asset derivatives
|
|
|
|
|
||||
|
Commodity derivatives designated as hedging instruments
|
$
|
—
|
|
$
|
104,430
|
|
||
|
Commodity derivatives not designated as hedging instruments
|
458,460
|
|
3,217
|
|
||||
|
Total asset derivatives
|
$
|
458,460
|
|
$
|
107,647
|
|
||
|
Liability derivatives
|
|
|
|
|
||||
|
Commodity derivatives designated as hedging instruments
|
$
|
—
|
|
$
|
27,618
|
|
||
|
Commodity derivatives not designated as hedging instruments
|
22,942
|
|
2,033
|
|
||||
|
Total liability derivatives
|
$
|
22,942
|
|
$
|
29,651
|
|
||
During 2012, the Company deferred
$7.1 million
in accumulated OCI, net of tax, related to a forward-starting interest rate swap which settled in November 2012. As of December 31, 2012, the related forecasted debt issuance was no longer probable and the entire liability related to this swap of
$23.3 million
, pre-tax, was recognized in interest expense in the Statements of Consolidated Income. This resulted in the reversal of
$13.3 million
which had previously been deferred in accumulated OCI, net of tax. The forecasted debt issuance was no longer probable given the Company’s strong liquidity position at December 31, 2012.
82
The net fair value of derivative commodity instruments changed during
2014
primarily as a result of decreased New York Mercantile Exchange (NYMEX) forward prices and new derivative commodity instruments executed during the year. The absolute quantities of the Company’s derivative commodity instruments totaled
624
Bcf and
414
Bcf as of December 31,
2014
and
2013
, respectively, and are primarily related to natural gas swaps, basis swaps and collars. The open positions at December 31,
2014
had maturities extending through December 2018.
The Company is exposed to credit loss in the event of nonperformance by counterparties to derivative contracts. This credit exposure is limited to derivative contracts with a positive fair value, which may change as market prices change. The Company believes that NYMEX traded futures contracts have limited credit risk because Commodity Future Trading Commission (CFTC) regulations are in place to protect exchange participants, including the Company, from potential financial instability of the exchange members. The Company’s OTC derivative instruments are primarily placed with financial institutions and thus are subject to events that would impact those companies individually as well as that industry as a whole.
The Company utilizes various processes and analyses to monitor and evaluate its credit risk exposures. These include closely monitoring current market conditions, counterparty credit fundamentals and credit default swap rates. Credit exposure is controlled through credit approvals and limits based on counterparty credit fundamentals. To manage the level of credit risk, the Company enters into transactions with financial counterparties that are of investment grade or better, enters into netting agreements whenever possible and may obtain collateral or other security.
When the net fair value of any of the Company’s swap agreements represents a liability to the Company which is in excess of the agreed-upon threshold between the Company and the financial institution acting as counterparty, the counterparty requires the Company to remit funds to the counterparty as a margin deposit for the derivative liability which is in excess of the threshold amount. The Company records these deposits as a current asset. When the net fair value of any of the Company’s swap agreements represents an asset to the Company which is in excess of the agreed-upon threshold between the Company and the financial institution acting as counterparty, the Company requires the counterparty to remit funds as margin deposits in an amount equal to the portion of the derivative asset which is in excess of the threshold amount. The Company records a current liability for such amounts received. The Company had no such deposits in its Consolidated Balance Sheets as of December 31,
2014
or December 31,
2013
.
When the Company enters into exchange-traded natural gas contracts, exchanges may require the Company to remit funds to the corresponding broker as good-faith deposits to guard against the risks associated with changing market conditions. The Company must make such deposits based on an established initial margin requirement as well as the net liability position, if any, of the fair value of the associated contracts. The Company records these deposits as a current asset in the Consolidated Balance Sheets. In the case where the fair value of such contracts is in a net asset position, the broker may remit funds to the Company, in which case the Company records a current liability for such amounts received. The initial margin requirements are established by the exchanges based on the price, volatility and the time to expiration of the related contract. The margin requirements are subject to change at the exchanges’ discretion. The Company recorded current assets of
$0.1 million
and
$0.3 million
as of December 31,
2014
and December 31,
2013
, respectively, for such deposits in its Consolidated Balance Sheets.
The Company recognizes all derivative instruments as either assets or liabilities at fair value on a gross basis. Margin deposits remitted to financial counterparties or received from financial counterparties related to OTC natural gas swap agreements and options and any funds remitted to or deposits received from the Company’s brokers are recorded on a gross basis. The Company has netting agreements with financial institutions and its brokers that permit net settlement of gross commodity derivative assets against gross commodity derivative liabilities. The table below reflects the impact of netting agreements and margin deposits on gross derivative assets and liabilities as of December 31,
2014
and
2013
.
|
As of December 31, 2014
|
Derivative
instruments,
recorded in the
Consolidated
Balance
Sheet, gross
|
Derivative
instruments
subject to
master
netting
agreements
|
Margin
deposits
remitted to
counterparties
|
Derivative
instruments,
net
|
||||||||||||
|
|
(Thousands)
|
|||||||||||||||
|
Asset derivatives:
|
|
|
|
|
|
|
|
|
||||||||
|
Derivative instruments, at fair value
|
$
|
458,460
|
|
$
|
(22,810
|
)
|
$
|
—
|
|
$
|
435,650
|
|
||||
|
Liability derivatives:
|
|
|
|
|
|
|
|
|
||||||||
|
Derivative instruments, at fair value
|
$
|
22,942
|
|
$
|
(22,810
|
)
|
$
|
(132
|
)
|
$
|
—
|
|
||||
83
|
As of December 31, 2013
|
Derivative
instruments,
recorded in the
Consolidated
Balance
Sheet, gross
|
Derivative
instruments
subject to
master
netting
agreements
|
Margin
deposits
remitted to
counterparties
|
Derivative
instruments,
net
|
||||||||||||
|
|
(Thousands)
|
|||||||||||||||
|
Asset derivatives:
|
|
|
|
|
|
|
|
|
||||||||
|
Derivative instruments, at fair value
|
$
|
107,647
|
|
$
|
(20,843
|
)
|
$
|
—
|
|
$
|
86,804
|
|
||||
|
Liability derivatives:
|
|
|
|
|
|
|
|
|
||||||||
|
Derivative instruments, at fair value
|
$
|
29,651
|
|
$
|
(20,843
|
)
|
$
|
(266
|
)
|
$
|
8,542
|
|
||||
Certain of the Company’s derivative instrument contracts provide that if the Company’s credit ratings by Standard & Poor’s Rating Services (S&P) or Moody’s Investor Services (Moody’s) are lowered below investment grade, additional collateral must be deposited with the counterparty. The additional collateral can be up to
100%
of the derivative liability. As of December 31,
2014
, the aggregate fair value of all derivative instruments with credit risk-related contingent features that were in a net liability position was
$0.9 million
, for which the Company had
no
collateral posted on December 31,
2014
. If the Company’s credit rating by S&P or Moody’s had been downgraded below investment grade on December 31,
2014
, the Company would have been required to post
$0.9 million
of additional collateral under the agreements with the respective counterparties. Investment grade refers to the quality of the Company’s credit as assessed by one or more credit rating agencies. The Company’s senior unsecured debt was rated BBB by S&P and Baa3 by Moody’s at December 31,
2014
. In order to be considered investment grade, the Company must be rated BBB- or higher by S&P and Baa3 or higher by Moody’s. Anything below these ratings is considered non-investment grade.
6.
Fair Value Measurements
The Company records its financial instruments, principally derivative instruments, at fair value in its Consolidated Balance Sheets. The Company estimates the fair value using quoted market prices, where available. If quoted market prices are not available, fair value is based upon models that use as inputs market-based parameters, including but not limited to forward curves, discount rates, volatilities and nonperformance risk. Nonperformance risk considers the effect of the Company’s credit standing on the fair value of liabilities and the effect of the counterparty’s credit standing on the fair value of assets. The Company estimates nonperformance risk by analyzing publicly available market information, including a comparison of the yield on debt instruments with credit ratings similar to the Company’s or counterparty’s credit rating and the yield of a risk-free instrument and credit default swaps rates where available.
The Company has categorized its assets and liabilities recorded at fair value into a three-level fair value hierarchy, based on the priority of the inputs to the valuation technique. The fair value hierarchy gives the highest priority to quoted prices in active markets for identical assets and liabilities (Level 1) and the lowest priority to unobservable inputs (Level 3). Assets and liabilities included in Level 1 include the Company’s futures contracts. Assets and liabilities in Level 2 primarily include the Company’s swap and collar agreements. As of December 31, 2013, the Company transferred
$54.4 million
of derivative instruments from Level 3 into Level 2.
The fair value of the assets and liabilities included in Level 2 is based on standard industry income approach models that use significant observable inputs, including NYMEX forward curves, LIBOR-based discount rates and basis forward curves. The Company’s collars and swaptions are valued using standard industry income approach option models. The Company’s collars were historically classified in Level 3 because the volatility assumption in the option pricing model was not observable over the full duration of the collars. Effective December 31, 2013, the volatility assumption in the option pricing model was, and at December 31, 2014 continued to be, observable for the duration of the term of the collars outstanding. This change did not have a significant impact on the fair value of the derivative instruments previously included in Level 3. The significant observable inputs utilized by the option pricing models include NYMEX forward curves, natural gas volatilities and LIBOR-based discount rates.
The Company uses NYMEX forward curves to value futures, commodity swaps, collars and swaptions. The NYMEX forward curves, LIBOR-based discount rates, natural gas volatilities and basis forward curves are validated to external sources at least monthly.
84
The following assets and liabilities were measured at fair value on a recurring basis during the applicable period:
|
|
|
Fair value measurements at reporting date using
|
||||||||||||||
|
Description
|
December 31, 2014
|
Quoted
prices in
active
markets for
identical
assets
(Level 1)
|
Significant
other
observable
inputs
(Level 2)
|
Significant
unobservable
inputs
(Level 3)
|
||||||||||||
|
|
(Thousands)
|
|||||||||||||||
|
Assets
|
|
|
|
|
|
|
|
|
||||||||
|
Derivative instruments, at fair value
|
$
|
458,460
|
|
$
|
—
|
|
$
|
458,460
|
|
$
|
—
|
|
||||
|
Liabilities
|
|
|
|
|
|
|
|
|
||||||||
|
Derivative instruments, at fair value
|
$
|
22,942
|
|
$
|
132
|
|
$
|
22,810
|
|
$
|
—
|
|
||||
|
|
|
Fair value measurements at reporting date using
|
||||||||||||||
|
Description
|
December 31, 2013
|
Quoted
prices in
active
markets for
identical
assets
(Level 1)
|
Significant
other
observable
inputs
(Level 2)
|
Significant
unobservable
inputs
(Level 3)
|
||||||||||||
|
|
(Thousands)
|
|||||||||||||||
|
Assets
|
|
|
|
|
|
|
|
|
||||||||
|
Derivative instruments, at fair value
|
$
|
107,647
|
|
$
|
240
|
|
$
|
107,407
|
|
$
|
—
|
|
||||
|
Liabilities
|
|
|
|
|
|
|
|
|
||||||||
|
Derivative instruments, at fair value
|
$
|
29,651
|
|
$
|
315
|
|
$
|
29,336
|
|
$
|
—
|
|
||||
|
Fair value measurements using significant
unobservable inputs
(Level 3)
Derivative instruments, at fair value, net
Years Ended December 31,
|
||||||||
|
|
2014
|
2013
|
||||||
|
|
(Thousands)
|
|||||||
|
Balance at January 1
|
$
|
—
|
|
$
|
90,714
|
|
||
|
Total gains or losses:
|
|
|
|
|
||||
|
Included in earnings
|
—
|
|
640
|
|
||||
|
Included in OCI
|
—
|
|
(2,554
|
)
|
||||
|
Purchases
|
—
|
|
—
|
|
||||
|
Settlements
|
—
|
|
(34,381
|
)
|
||||
|
Transfers in and/or out of Level 3
|
—
|
|
(54,419
|
)
|
||||
|
Balance at December 31
|
$
|
—
|
|
$
|
—
|
|
||
There were
no
gains or losses included in earnings for the periods in the table above attributable to the changes in unrealized gains or losses relating to assets and liabilities held as of December 31,
2013
.
The carrying value of cash equivalents approximates fair value due to the short-term maturity of the instruments; these are considered Level 1 fair values.
The Company estimates the fair value of its debt using its established fair value methodology. Because not all of the Company’s debt is actively traded, the fair value of the debt is a Level 2 fair value measurement. Fair value for non-traded debt
85
obligations is estimated using a standard industry income approach model which utilizes a discount rate based on market rates for debt with similar remaining time to maturity and credit risk. The estimated fair value of long-term debt (including the Partnership’s long-term debt) on the Consolidated Balance Sheets at December 31,
2014
and
2013
was approximately
$3.3 billion
and
$2.8 billion
, respectively.
As consideration for the Equitable Gas Transaction, the Company received total cash proceeds of
$748.0 million
, select midstream assets (including the Allegheny Valley Connector) with a fair value of
$140.9
million and other contractual assets with a fair value of
$32.5
million. These assets are Level 2 fair value measurements as they were valued using standard industry income approach models.
For information on the fair values of assets related to the impairment of proved and unproved oil and gas properties, assets acquired in the Range Resources exchange, the assets acquired in the Chesapeake acquisition and the assets related to the defined benefit pension plan assets, see Notes 1, 7, 8 and Note 13, respectively.
7.
Sales of Properties and Contracts
On December 17, 2013, the Company executed the Equitable Gas Transaction. Refer to Note 2 for additional information.
On December 31, 2013, the Company sold certain energy marketing contracts to a third party for
$20.0 million
. These contracts were natural gas sales agreements with approximately
1,000
customers with total volumes of approximately
12
Bcf in 2013. The Company received
$18.0 million
of cash on December 31, 2013; the remaining
$2.0 million
was received in 2014. In conjunction with this transaction, the Company realized a pre-tax gain of
$19.6 million
in 2013.
Assets acquired as part of the Equitable Gas Transaction included energy marketing contracts with approximately
50
customers valued at
$5.0 million
. On December 31, 2013, the Company sold these contracts to a third party for
$5.0 million
, which was received on December 31, 2013.
In June 2014, the Company exchanged certain assets with Range. The Company received approximately
73,000
net acres and approximately
900
producing wells, most of which are vertical wells, in the Permian Basin of Texas. In exchange, Range received approximately
138,000
net acres in the Company’s Nora field of Virginia (Nora), the Company’s working interest in approximately
2,000
producing vertical wells in Nora, the Company’s remaining
50%
ownership interest in Nora Gathering, LLC (Nora LLC), which owns the supporting gathering system in Nora, and
$167.3 million
in cash. The Company accounted for its previous
50%
ownership interest in Nora LLC under the equity method, and this investment was reflected within equity in nonconsolidated investments in the Company’s Consolidated Balance Sheet.
The fair value of the assets exchanged by the Company was approximately
$516.5 million
. Fair value of
$318.3 million
was allocated to the acquired acreage and
$198.2 million
was allocated to the acquired wells. The Company recorded a pre-tax gain of
$34.1 million
, which is included in gain on sale / exchange of assets in the Statements of Consolidated Income. The gain on sale / exchange of assets includes a
$28.0 million
pre-tax gain related to the de-designation of certain derivative instruments that were previously designated as cash flow hedges because it was probable that the forecasted transactions would not occur.
As the asset exchange qualified as a business combination under United States GAAP, the fair value of the acquired assets was determined using a discounted cash flow model under the market approach. Significant unobservable inputs used in the analysis included the determination of estimated developed reserves, NYMEX forward pricing and comparable sales transactions, which classify the acquired assets as a Level 3 measurement.
8.
Acquisitions
In June 2013, the Company acquired approximately
99,000
net acres in southwestern Pennsylvania and
ten
horizontal Marcellus wells, located in Washington County, Pennsylvania, from Chesapeake Energy Corporation and its partners (Chesapeake) for approximately
$114.2 million
. The acreage included
67,000
Marcellus acres, of which
42,000
acres were unlikely to be developed due to near-term lease expirations or a scattered footprint. Of the total purchase price,
$57.2 million
was allocated to the undeveloped acreage and
$57.0 million
was allocated to the acquired Marcellus wells.
As the transaction qualified as a business combination under United States GAAP, the fair value of the acquired assets was determined using a market approach for the undeveloped acreage and a discounted cash flow model under the income approach for the wells. Significant unobservable inputs used in the analysis included the determination of estimated developed reserves and NYMEX forward pricing; as a result, valuation of the acquired assets was a Level 3 measurement.
86
9.
Income Taxes
Income tax expense (benefit) from continuing operations is summarized as follows:
|
|
Years Ended December 31,
|
|||||||||||
|
|
2014
|
2013
|
2012
|
|||||||||
|
|
(Thousands)
|
|||||||||||
|
Current:
|
|
|
|
|
|
|
||||||
|
Federal
|
$
|
164,935
|
|
$
|
100,796
|
|
$
|
3,771
|
|
|||
|
State
|
17,136
|
|
46,758
|
|
229
|
|
||||||
|
Subtotal
|
182,071
|
|
147,554
|
|
4,000
|
|
||||||
|
Deferred:
|
|
|
|
|
|
|
||||||
|
Federal
|
38,357
|
|
51,767
|
|
56,551
|
|
||||||
|
State
|
(6,336
|
)
|
(23,940
|
)
|
11,014
|
|
||||||
|
Subtotal
|
32,021
|
|
27,827
|
|
67,565
|
|
||||||
|
Amortization of deferred investment tax credit
|
—
|
|
(195
|
)
|
(104
|
)
|
||||||
|
Total income taxes
|
$
|
214,092
|
|
$
|
175,186
|
|
$
|
71,461
|
|
|||
The current federal income tax expense recorded in 2014 primarily related to federal alternative minimum tax (AMT) as a result of the tax gains generated from the Jupiter Transaction. The current state income tax expense recorded in 2014 primarily related to a Pennsylvania filing. The current income tax expense recorded in 2013 primarily related to AMT and state income taxes as a result of the tax gains generated from the Sunrise Merger as well as the Equitable Gas Transaction. The current income tax expense recorded in 2012 primarily related to AMT as a result of the tax gain generated from the Partnership’s IPO.
The Tax Increase Prevention Act of 2014 was enacted on December 19, 2014 and retroactively extended the research and experimentation (R&E) tax credit for 2014 and reinstated
50%
bonus depreciation for property placed in service in 2014. The impact of this law change has been reflected in the Company’s financial statements.
In 2013, the Commonwealth of Pennsylvania adopted multiple changes to the Commonwealth’s tax code, including an intangible expense addback provision effective in 2015, an increase of the cap on the net operating loss (NOL) deduction in 2014 and 2015 and an extension of the franchise tax through 2015. The impact of this law change has been reflected in the Company’s financial statements.
In September 2013, the United States Treasury Department issued final regulations regarding the deduction and capitalization of expenditures related to tangible property and proposed regulations addressing the disposition of tangible property. These regulations do not address the tax treatment for network assets such as natural gas pipelines; however, they do replace previously issued temporary regulations and are effective for tax years beginning January 1, 2014. The Company performed an analysis of the regulations and concluded that they have no significant impact on its financial statements.
The Company utilized NOLs for federal tax purposes in 2014 and 2013, given the increase in current taxable income. The Company generated NOLs for federal tax purposes from 2009 to 2012, primarily as a result of intangible drilling costs (IDCs), which are deducted for tax purposes but capitalized for financial statement purposes, and from accelerated and bonus tax depreciation associated with the expansion of the Company’s midstream business. For federal income tax purposes, the Company deducts a portion of drilling costs as IDCs in the year incurred which typically will cause the Company to generate a tax loss for the year. The Company expects to continue to generate tax losses over the next several years as it continues its drilling program in Appalachia, excluding taxable gains which may be recorded from potential future asset sales. IDCs, however, are sometimes limited for AMT purposes which can result in the Company paying AMT despite the fact that taxable income has been fully offset by current tax deductions or NOL carryforwards.
87
Income tax expense differs from amounts computed at the federal statutory rate of
35%
on pre-tax income as follows:
|
|
Years Ended December 31,
|
|||||||||||
|
|
2014
|
2013
|
2012
|
|||||||||
|
|
(Thousands)
|
|||||||||||
|
Tax at statutory rate
|
$
|
253,299
|
|
$
|
182,406
|
|
$
|
77,133
|
|
|||
|
State income taxes
|
7,020
|
|
16,180
|
|
2,869
|
|
||||||
|
Noncontrolling partners’ share of Partnership earnings
|
(43,409
|
)
|
(16,535
|
)
|
(4,571
|
)
|
||||||
|
Other
|
(2,818
|
)
|
(6,865
|
)
|
(3,970
|
)
|
||||||
|
Income tax expense
|
$
|
214,092
|
|
$
|
175,186
|
|
$
|
71,461
|
|
|||
|
Effective tax rate
|
29.6
|
%
|
33.6
|
%
|
32.4
|
%
|
||||||
The Company’s effective tax rate for the year ended December 31,
2014
was
29.6%
compared to
33.6%
for the year ended December 31,
2013
. The decrease in the rate from
2013
to
2014
was primarily due to an internal reorganization of subsidiaries resulting in a reduction to state taxes as well as an increase in Partnership earnings and the noncontrolling public limited partners’ share of Partnership earnings as a result of the Sunrise Merger and Jupiter Transaction. The Company consolidates
100%
of the pre-tax income related to the noncontrolling public limited partners’ share of Partnership earnings but is not required to record an income tax provision with respect to the portion of the Partnership’s earnings allocated to its noncontrolling public limited partners.
The Company’s effective tax rate for the year ended December 31,
2013
was
33.6%
compared to
32.4%
for the year ended December 31,
2012
. The increase in the rate from
2012
to
2013
was primarily due to an increase in pre-tax book income on state tax paying entities as well as a shift in the Company’s business to states with higher income tax rates. This was partially offset by state tax benefits of
$9.8 million
realized in 2013 primarily related to the Sunrise Merger and the Equitable Gas Transaction which allowed the Company to utilize NOLs that had previously been fully reserved. As described in the preceding paragraph, the overall rate was reduced in both periods because the Company is not required to record an income tax provision with respect to the portion of the Partnership’s earnings allocated to its noncontrolling public limited partners.
The following table reconciles the beginning and ending amount of reserve for uncertain tax positions (excluding interest and penalties):
|
|
2014
|
2013
|
2012
|
|||||||||
|
|
(Thousands)
|
|||||||||||
|
Balance at January 1
|
$
|
57,087
|
|
$
|
17,858
|
|
$
|
30,730
|
|
|||
|
Additions based on tax positions related to current year
|
1,195
|
|
49,289
|
|
2,165
|
|
||||||
|
Additions for tax positions of prior years
|
93
|
|
—
|
|
2,320
|
|
||||||
|
Settlements
|
—
|
|
—
|
|
—
|
|
||||||
|
Reductions for tax positions of prior years
|
(1,418
|
)
|
(790
|
)
|
(12,235
|
)
|
||||||
|
Lapse of statute of limitations
|
—
|
|
(9,270
|
)
|
(5,122
|
)
|
||||||
|
Balance at December 31
|
$
|
56,957
|
|
$
|
57,087
|
|
$
|
17,858
|
|
|||
Included in the tabular reconciliation above at December 31,
2014
,
2013
and
2012
are
$6.9 million
,
$7.6 million
and
$6.4 million
, respectively, for tax positions for which the ultimate deductibility is highly certain but for which there is uncertainty about the timing of tax deductions. Because of the impact of deferred tax accounting, the disallowance of the shorter deductibility period would not affect the annual effective tax rate but would accelerate the payment of cash taxes to an earlier period. Additionally, there are uncertain tax positions of
$10.1 million
and
$9.8 million
for the years ended December 31,
2014
and
2013
, respectively, that are included in the tabular reconciliation above, but recorded in the Consolidated Balance Sheets as a reduction of the related deferred tax asset for NOLs and R&E tax credit carryforwards.
The Company recognizes interest and penalties related to unrecognized tax benefits in income tax expense. The Company recorded approximately
$1.9 million
for 2014, and reversed
$0.4 million
and
$1.8 million
of previously recorded interest expense in
2013
and
2012
, respectively. Interest and penalties of
$2.0 million
,
$0.2 million
and
$0.5 million
were included in the balance sheet reserve at December 31,
2014
,
2013
and
2012
, respectively.
88
There were no material changes to the Company’s methodology for unrecognized tax benefits during
2014
. The total amount of unrecognized tax benefits (excluding interest and penalties) that, if recognized, would affect the effective tax rate was
$33.9 million
,
$33.3 million
and
$5.3 million
as of December 31,
2014
,
2013
and
2012
, respectively.
As of December 31,
2014
, the Company does not expect any of its unrecognized tax benefits to decrease within the next
12 months
due to potential settlements with taxing authorities, legal or administrative guidance by relevant taxing authorities or the lapse of applicable statutes of limitation.
The consolidated federal income tax liability of the Company has been settled with the Internal Revenue Service (IRS)through 2009. The IRS has completed its review of the 2010 and 2011 tax years and the Company is in the process of appealing its R&E tax credit claim for such years, which is the only item that remains open for those tax years. The Company also is the subject of various state income tax examinations. With few exceptions, as of December 31, 2014, the Company is no longer subject to state examinations by tax authorities for years before 2011.
The following table summarizes the source and tax effects of temporary differences between financial reporting and tax bases of assets and liabilities:
|
|
As of December 31,
|
|||||||
|
|
2014
|
2013
|
||||||
|
|
(Thousands)
|
|||||||
|
Deferred income taxes:
|
|
|
|
|
||||
|
Total deferred income tax assets .
|
$
|
(961,556
|
)
|
$
|
(612,705
|
)
|
||
|
Total deferred income tax liabilities
|
2,690,492
|
|
2,237,465
|
|
||||
|
Total net deferred income tax liabilities
|
1,728,936
|
|
1,624,760
|
|
||||
|
Total deferred income tax liabilities (assets)
|
|
|
|
|
||||
|
Drilling and development costs expensed for income tax reporting
|
1,391,156
|
|
1,190,357
|
|
||||
|
Tax depreciation in excess of book depreciation
|
1,154,082
|
|
1,018,255
|
|
||||
|
Accumulated OCI
|
130,770
|
|
28,597
|
|
||||
|
Post-retirement benefits
|
3,146
|
|
256
|
|
||||
|
Incentive compensation
|
(65,086
|
)
|
(60,863
|
)
|
||||
|
Net operating loss carryforwards
|
(212,718
|
)
|
(358,964
|
)
|
||||
|
Investment in Partnership
|
(336,394
|
)
|
(2,801
|
)
|
||||
|
Alternative minimum tax credit carryforward
|
(412,345
|
)
|
(246,157
|
)
|
||||
|
Other
|
11,338
|
|
(324
|
)
|
||||
|
Total excluding valuation allowances
|
1,663,949
|
|
1,568,356
|
|
||||
|
Valuation allowance
|
64,987
|
|
56,404
|
|
||||
|
Total (including amounts classified as current assets of $21,934 and $31,005, respectively)
|
$
|
1,728,936
|
|
$
|
1,624,760
|
|
||
The net deferred tax liability relating to the Company’s accumulated OCI balance as of December 31,
2014
consisted of a
$141.3 million
deferred tax liability related to the Company’s net unrealized gain from hedging transactions, a
$5.4 million
deferred tax asset related to other post-retirement benefits, and a
$5.1 million
deferred tax asset related to the Company’s pension plans. The net deferred tax liability relating to the Company’s accumulated OCI balance as of December 31,
2013
consisted of an
$38.7 million
deferred tax liability related to the Company’s net unrealized gain from hedging transactions, a
$5.3 million
deferred tax asset related to other post-retirement benefits, and a
$4.8 million
deferred tax asset related to the Company’s pension plans.
The Company also has a total deferred tax asset of
$30.8 million
at December 31,
2014
related to the federal NOL carryforward from
2013
of
$1.1 million
and
2012
of
$29.7 million
, respectively. The deferred tax asset has been increased for uncertain tax positions of approximately
$11.7 million
and
$10.6 million
as of December 31, 2014 and
2013
, respectively. The Company has federal income tax NOL carryforwards of
$88.0 million
. The federal NOL carryforward period is
20 years
and, if unused, the loss carryforward, in excess of the
2014
NOL utilization, for 2013 and 2012 will expire in 2033 and 2032, respectively.
The Company is subject to the AMT if the computed AMT liability exceeds the regular tax liability for the year. As a result of certain AMT preference items related to IDCs, the Company has generated AMT carryforwards. Because AMT taxes paid can
89
be credited against regular tax and have an indefinite carryforward period, this item is reflected as a deferred tax asset on the Company’s Consolidated Balance Sheets.
As of December 31,
2014
, the Company had a deferred tax asset of
$116.0 million
, net of valuation allowances of
$65.0 million
, related to tax benefits from state NOL carryforwards with various expiration dates ranging from 2018 to 2034. As of December 31,
2013
, the Company had a deferred tax asset of
$118.2 million
, net of valuation allowances of
$56.4 million
, related to tax benefits from state NOL carryforwards with various expiration dates ranging from 2014 to 2033. The deferred tax asset has been reduced for uncertain tax positions of approximately
$0.3 million
and
$0.3 million
during the years ended December 31,
2014
and
2013
, respectively.
During the year ended December 31, 2012, share-based payment arrangements paid in stock generated an
$8.1 million
excess tax benefit that was not recorded in the Company’s financial statements as an addition to common stockholders’ equity due to the Company’s NOL position. The tax benefits had not previously been recorded related to this item as the Company could not realize a reduction in income taxes payable given the NOL. Due to taxable income generated in the year ended December 31,
2014
, and the corresponding ability to realize a benefit from these amounts, the Company has recorded tax benefits of
$26.6 million
in the financial statements as an addition to common stockholders’ equity as these tax benefits reduced taxes payable in the current year. The Company also recorded tax benefits of
$6.6 million
for the 2011 excess tax benefits previously not recorded since the Company fully utilized the 2011 net operating loss during 2014. The Company uses tax law ordering when determining when excess tax benefits have been realized.
10.
Equity in Nonconsolidated Investments
Prior to the asset exchange with Range during 2014, the Company had ownership interests in a nonconsolidated investment that was accounted for under the equity method of accounting. The following table summarizes the Company’s equity in the nonconsolidated investment:
|
|
|
Interest
|
Ownership as of
|
As of December 31,
|
||||||||||
|
Investees
|
Location
|
Type
|
December 31, 2014
|
2014
|
2013
|
|||||||||
|
|
|
|
|
(Thousands)
|
||||||||||
|
Nora Gathering, LLC (Nora LLC)
|
USA
|
Joint
|
—
|
$
|
—
|
|
$
|
128,983
|
|
|||||
EQT Midstream’s equity investment in Nora LLC represented a
50%
ownership interest. EQT Midstream made no additional equity investments in Nora LLC during 2014 or 2013.
In connection with the asset exchange with Range, the Company received acreage and producing wells in the Permian Basin of Texas in exchange for acreage, producing wells, the Company’s
50%
ownership interest in Nora LLC and cash of
$167.3 million
. In conjunction with this transaction, the Company recognized a pre-tax gain of
$6.8 million
which is reflected in gain on sale / exchange of assets on the Statements of Consolidated Income.
The Company’s ownership share of the earnings for 2014,
2013
and
2012
related to the total investments accounted for under the equity method was
$3.4 million
,
$7.6 million
and
$6.1 million
, respectively, reported in other income on the Statements of Consolidated Income.
During September 2014, the Company and an affiliate of Nextera Energy, Inc. announced the formation of a joint venture, Mountain Valley Pipeline, LLC (MVP LLC), that will construct and own the Mountain Valley Pipeline (MVP). The Company expects to transfer its interest in MVP LLC to the Partnership. The approximately
300
-mile pipeline will extend from the Partnership’s existing transmission and storage system in Wetzel County, West Virginia to Pittsylvania County, Virginia. The Company expects that the Partnership will own the largest interest in the joint venture and will operate MVP. As of December 31, 2014, the Company’s interest in MVP LLC was recorded in other assets instead of equity in nonconsolidated investments as certain formation and funding activities for MVP LLC had not yet occurred.
90
The following tables summarize the unaudited condensed financial statements for nonconsolidated investments accounted for under the equity method of accounting for the periods noted:
Summarized Balance Sheets
|
|
As of December 31,
|
|||||||
|
|
2014
|
2013
|
||||||
|
|
(Thousands)
|
|||||||
|
Current assets
|
$
|
—
|
|
$
|
27,014
|
|
||
|
Noncurrent assets
|
—
|
|
239,583
|
|
||||
|
Total assets
|
$
|
—
|
|
$
|
266,597
|
|
||
|
Current liabilities
|
$
|
—
|
|
$
|
8,529
|
|
||
|
Stockholders’ equity
|
—
|
|
258,068
|
|
||||
|
Total liabilities and stockholders’ equity
|
$
|
—
|
|
$
|
266,597
|
|
||
Summarized Statements of Income
|
|
Years Ended December 31,
|
|||||||||||
|
|
2014
|
2013
|
2012
|
|||||||||
|
|
(Thousands)
|
|||||||||||
|
Revenues
|
$
|
19,924
|
|
$
|
45,040
|
|
$
|
47,888
|
|
|||
|
Operating expenses
|
13,155
|
|
29,810
|
|
35,596
|
|
||||||
|
Net income
|
$
|
6,769
|
|
$
|
15,230
|
|
$
|
12,292
|
|
|||
11.
Short-Term Loans
The Company has a
$1.5 billion
revolving credit facility, which was amended in February 2014, that expires in February 2019. The Company may request
two
one year
extensions of the expiration date, the approval of which is subject to satisfaction of certain conditions.
The revolving credit facility may be used for working capital, capital expenditures, share repurchases and any other lawful corporate purposes. Subject to certain terms and conditions, the Company may, on a one-time basis, request that the lenders’ commitments be increased to an aggregate amount up to
$2.0 billion
. Each lender in the facility may decide if it will increase its commitment. The credit facility is underwritten by a syndicate of
18
financial institutions, each of which is obligated to fund its pro-rata portion of any borrowings by the Company. The Company’s obligations under the credit facility are unsecured.
The Company is not required to maintain compensating bank balances. The Company’s debt issuer credit ratings, as determined by S&P, Moody’s or Fitch Ratings Service on its non-credit-enhanced, senior unsecured long-term debt, determine the level of fees associated with its lines of credit in addition to the interest rate charged by the counterparties on any amounts borrowed against the lines of credit; the lower the Company’s debt credit rating, the higher the level of fees and borrowing rate.
In February 2014, the Partnership amended its credit facility to increase the borrowing capacity to
$750 million
. The amended credit facility will expire in February 2019. The credit facility is available to fund working capital requirements and capital expenditures, to purchase assets, to pay distributions and repurchase units and for general partnership purposes. Provided there exists no default, and subject to certain terms and conditions, the Partnership may request that the lenders’ commitments be increased to an aggregate amount up to
$1.0 billion
. Each lender in the facility may decide if it will increase its commitment. The credit facility is underwritten by a syndicate of
18
financial institutions, each of which is obligated to fund its pro-rata portion of any borrowings by the Partnership. The Company is not a guarantor of the Partnership’s obligations under the credit facility. The Partnership’s obligations under the revolving portion of the credit facility are unsecured. The Partnership’s obligations under the credit facility were unconditionally guaranteed by each of the Partnership’s subsidiaries. In January 2015, the Partnership amended its credit facility to, among other things, release its subsidiaries from their guarantee obligations under the credit facility.
As of December 31,
2014
and
2013
, neither the Company nor the Partnership had loans or letters of credit outstanding under their respective credit facilities. The Company incurred commitment fees averaging approximately
23
basis points and
24
91
basis points for the years ended December 31, 2014 and
2013
, respectively, to maintain credit availability under its credit facility. The Partnership incurred commitment fees averaging approximately
24
basis points and
25
basis points for the years ended December 31, 2014 and
2013
, respectively, to maintain credit availability under its credit facility.
The Company did not have any short-term loans outstanding at any time during the year ended December 31, 2014. The maximum amount of outstanding short-term loans at any time under the Company’s credit facility during the year ended December 31,
2013
was
$178.5 million
. The average daily balance of short-term loans outstanding for the Company during the year ended December 31,
2013
was approximately
$12.1 million
at a weighted average annual interest rate of
1.7%
. The maximum amount of outstanding short-term loans at any time under the Partnership’s credit facility during the year ended December 31, 2014 was
$450 million
, and the average daily balance of short-term loans outstanding was approximately
$119 million
at a weighted average annual interest rate of
1.7%
. The Partnership had
no
short-term loans outstanding at any time during the year ended December 31, 2013.
The Company’s credit facility contains various provisions that, if not complied with, could result in termination of the credit facility, require early payment of amounts outstanding or similar actions. The most significant covenants and events of default under the Company’s credit facility relate to maintenance of a debt-to-total capitalization ratio and limitations on transactions with affiliates. The Company’s credit facility contains financial covenants that require a total debt-to-total capitalization ratio of no greater than
65%
. The calculation of this ratio excludes the effects of accumulated OCI. As of December 31,
2014
, the Company was in compliance with all debt provisions and covenants.
The Partnership’s credit facility contains various provisions that, if not complied with, could result in termination of the credit facility, require early payment of amounts outstanding or similar actions. The covenants and events of default under the credit facility relate to maintenance of permitted leverage ratio, limitations on transactions with affiliates, limitations on restricted payments, insolvency events, nonpayment of scheduled principal or interest payments, acceleration of and certain other defaults under other financial obligations and change of control provisions. Under the credit facility, the Partnership is required to maintain a consolidated leverage ratio of not more than
5.00
to
1.00
(or not more than
5.50
to
1.00
for certain measurement periods following the consummation of certain acquisitions). As of December 31,
2014
, the Partnership was in compliance with all credit facility provisions and covenants.
12.
Long-Term Debt
|
|
As of December 31,
|
|||||||
|
|
2014
|
2013
|
||||||
|
|
(Thousands)
|
|||||||
|
7.76% notes, due 2015 thru 2016
|
$
|
10,700
|
|
$
|
18,316
|
|
||
|
5.00% notes, due October 1, 2015
|
150,000
|
|
150,000
|
|
||||
|
5.15% notes, due March 1, 2018
|
200,000
|
|
200,000
|
|
||||
|
6.50% notes, due April 1, 2018
|
500,000
|
|
500,000
|
|
||||
|
8.13% notes, due June 1, 2019
|
700,000
|
|
700,000
|
|
||||
|
4.88% notes, due November 15, 2021
|
750,000
|
|
750,000
|
|
||||
|
4.00% EQT Midstream Partners notes, due August 1, 2024
|
500,000
|
|
—
|
|
||||
|
7.75% debentures, due July 15, 2026
|
115,000
|
|
115,000
|
|
||||
|
Medium-term notes:
|
|
|
|
|
||||
|
7.3% to 7.6% Series B, due 2015 thru 2023
|
20,000
|
|
20,000
|
|
||||
|
7.6% Series C, due 2018
|
8,000
|
|
8,000
|
|
||||
|
8.7% to 9.0% Series A, due 2020 thru 2021
|
35,200
|
|
40,200
|
|
||||
|
|
2,988,900
|
|
2,501,516
|
|
||||
|
Less debt payable within one year
|
166,011
|
|
11,162
|
|
||||
|
Total long-term debt
|
$
|
2,822,889
|
|
$
|
2,490,354
|
|
||
In August 2014, the Partnership issued
4.00%
Senior Notes due 2024 (
4.00%
Senior Notes) in the aggregate principal amount of
$500.0
million. Refer to Note 3 for additional information.
92
The indentures governing the Company’s and the Partnership’s long-term indebtedness contain certain restrictive financial and operating covenants, including covenants that restrict the Company’s ability to incur indebtedness, incur liens, enter into sale and leaseback transactions, complete acquisitions, merge, sell assets and perform certain other corporate actions. The covenants do not contain a rating trigger. Therefore, a change in the Company’s or the Partnership’s debt rating would not trigger a default under the indentures governing the indebtedness.
Aggregate maturities of long-term debt are
$166.0 million
in
2015
,
$3.0 million
in
2016
,
zero
in
2017
,
$708.0 million
in
2018
, and
$700.0 million
in
2019
.
13.
Pension and Other Post-Retirement Benefit Plans
The Company, as sponsor of the EQT Corporation Retirement Plan for Employees (Retirement Plan), a defined benefit pension plan, terminated the Retirement Plan effective December 31, 2014. Distribution of plan assets pursuant to the termination will not be made until the plan termination satisfies all regulatory requirements, including required filings with the IRS and the Pension Benefit Guaranty Corporation (PBGC). The termination process is expected to be complete by the end of 2016. Following the satisfaction of the IRS and PBGC regulatory requirements, the Company will fully fund the Retirement Plan and then satisfy all of the benefit obligations under the Retirement Plan by purchasing one or more annuities for participants from an insurance company or other financial institution. All assets of the Retirement Plan are expected to be liquidated and used to purchase annuities, and all non-cash unrecognized losses are expected to be recognized, by the end of 2016.
The following table sets forth the defined benefit pension and other post-retirement benefit plans’ funded status and amounts recognized for those plans in the Company’s Consolidated Balance Sheets. Refer to Note 2 for further information related to the Equitable Gas Transaction.
|
|
For the Years Ended December 31,
|
|||||||||||||||
|
|
2014
|
2013
|
2014
|
2013
|
||||||||||||
|
|
Pension Benefits
|
Other Benefits
|
||||||||||||||
|
|
(Thousands)
|
|||||||||||||||
|
Change in benefit obligation:
|
|
|
|
|
|
|
|
|
||||||||
|
Benefit obligation at beginning of year
|
$
|
21,828
|
|
$
|
63,270
|
|
$
|
18,253
|
|
$
|
36,255
|
|
||||
|
Service cost
|
350
|
|
500
|
|
669
|
|
905
|
|
||||||||
|
Interest cost
|
820
|
|
1,935
|
|
693
|
|
1,110
|
|
||||||||
|
Amendments
|
—
|
|
—
|
|
227
|
|
—
|
|
||||||||
|
Actuarial loss (gain)
|
2,412
|
|
(3,038
|
)
|
1,190
|
|
(2,355
|
)
|
||||||||
|
Benefits paid
|
(1,988
|
)
|
(5,269
|
)
|
(2,291
|
)
|
(3,961
|
)
|
||||||||
|
Expenses paid
|
(262
|
)
|
(493
|
)
|
—
|
|
—
|
|
||||||||
|
Divestitures
|
—
|
|
(34,410
|
)
|
—
|
|
(13,701
|
)
|
||||||||
|
Settlements
|
(1,456
|
)
|
(667
|
)
|
—
|
|
—
|
|
||||||||
|
Benefit obligation at end of year
|
$
|
21,704
|
|
$
|
21,828
|
|
$
|
18,741
|
|
$
|
18,253
|
|
||||
|
Change in plan assets:
|
|
|
|
|
|
|
|
|
||||||||
|
Fair value of plan assets at beginning of year
|
$
|
20,089
|
|
$
|
46,984
|
|
$
|
493
|
|
$
|
165
|
|
||||
|
Actual gain on plan assets
|
1,217
|
|
7,304
|
|
—
|
|
—
|
|
||||||||
|
Contributions
|
723
|
|
2,639
|
|
330
|
|
328
|
|
||||||||
|
Benefits paid
|
(1,988
|
)
|
(5,269
|
)
|
—
|
|
—
|
|
||||||||
|
Expenses paid
|
(262
|
)
|
(493
|
)
|
—
|
|
—
|
|
||||||||
|
Divestitures
|
—
|
|
(30,409
|
)
|
—
|
|
—
|
|
||||||||
|
Settlements
|
(1,456
|
)
|
(667
|
)
|
—
|
|
—
|
|
||||||||
|
Fair value of plan assets at end of year
|
18,323
|
|
20,089
|
|
823
|
|
493
|
|
||||||||
|
Funded status at end of year
|
$
|
(3,381
|
)
|
$
|
(1,739
|
)
|
$
|
(17,918
|
)
|
$
|
(17,760
|
)
|
||||
93
|
Amounts recognized in the statement of financial position consist of:
|
|
|
|
|
|
|
|
|
||||||||
|
Current liabilities
|
$
|
—
|
|
$
|
—
|
|
$
|
(924
|
)
|
$
|
(1,341
|
)
|
||||
|
Noncurrent liabilities
|
(3,381
|
)
|
(1,739
|
)
|
(16,994
|
)
|
(16,419
|
)
|
||||||||
|
Net amounts recognized
|
$
|
(3,381
|
)
|
$
|
(1,739
|
)
|
$
|
(17,918
|
)
|
$
|
(17,760
|
)
|
||||
|
Amounts recognized in accumulated OCI, net of tax, consist of:
|
|
|
|
|
|
|
|
|
||||||||
|
Net loss
|
$
|
8,082
|
|
$
|
7,524
|
|
$
|
8,273
|
|
$
|
8,234
|
|
||||
|
Net prior service (credit)
|
—
|
|
—
|
|
285
|
|
106
|
|
||||||||
|
Net amount recognized
|
$
|
8,082
|
|
$
|
7,524
|
|
$
|
8,558
|
|
$
|
8,340
|
|
||||
The accumulated benefit obligation for the Company’s defined benefit pension plans was
$21.7 million
and
$21.8 million
at December 31,
2014
and
2013
, respectively. The Company uses a December 31 measurement date for its defined benefit pension and other post-retirement benefit plans.
The Company’s costs related to its defined benefit pension and other post-retirement benefit plans were as follows:
|
|
For the Years Ended December 31,
|
|||||||||||||||||||||||
|
|
2014
|
2013
|
2012
|
2014
|
2013
|
2012
|
||||||||||||||||||
|
|
Pension Benefits
|
Other Benefits
|
||||||||||||||||||||||
|
|
(Thousands)
|
|||||||||||||||||||||||
|
Components of net periodic benefit cost:
|
|
|
|
|
|
|
|
|
|
|
|
|
||||||||||||
|
Service cost
|
$
|
350
|
|
$
|
500
|
|
$
|
500
|
|
$
|
669
|
|
$
|
905
|
|
$
|
737
|
|
||||||
|
Interest cost
|
820
|
|
1,935
|
|
2,448
|
|
693
|
|
1,110
|
|
1,427
|
|
||||||||||||
|
Expected return on plan assets
|
(1,377
|
)
|
(3,323
|
)
|
(3,712
|
)
|
—
|
|
—
|
|
—
|
|
||||||||||||
|
Amortization of prior service cost
|
—
|
|
—
|
|
—
|
|
(446
|
)
|
(845
|
)
|
(845
|
)
|
||||||||||||
|
Recognized net actuarial loss
|
709
|
|
2,306
|
|
1,880
|
|
879
|
|
1,760
|
|
1,671
|
|
||||||||||||
|
Settlement loss and special termination benefits
|
879
|
|
381
|
|
725
|
|
—
|
|
—
|
|
—
|
|
||||||||||||
|
Subtotal
|
1,381
|
|
1,799
|
|
1,841
|
|
1,795
|
|
2,930
|
|
2,990
|
|
||||||||||||
|
Net periodic benefit cost of discontinued operations
|
—
|
|
1,552
|
|
1,586
|
|
—
|
|
1,356
|
|
1,288
|
|
||||||||||||
|
Net periodic benefit cost
|
$
|
1,381
|
|
$
|
247
|
|
$
|
255
|
|
$
|
1,795
|
|
$
|
1,574
|
|
$
|
1,702
|
|
||||||
Currently, the Company recognizes expense for on-going post-retirement benefits other than pensions, a portion of which expense is subject to recovery in the approved rates of its rate-regulated EQT Midstream business.
|
|
For the Years Ended December 31,
|
|||||||||||||||||||||||
|
|
2014
|
2013
|
2012
|
2014
|
2013
|
2012
|
||||||||||||||||||
|
|
Pension Benefits
|
Other Benefits
|
||||||||||||||||||||||
|
|
(Thousands)
|
|||||||||||||||||||||||
|
Other changes in plan assets and benefit obligations recognized in OCI, net of tax:
|
|
|
|
|
|
|
|
|
|
|
|
|
||||||||||||
|
Net loss
|
$
|
558
|
|
$
|
712
|
|
$
|
261
|
|
$
|
39
|
|
$
|
2,147
|
|
$
|
494
|
|
||||||
|
Net prior service cost
|
—
|
|
—
|
|
—
|
|
179
|
|
416
|
|
330
|
|
||||||||||||
|
Total recognized in OCI, net of tax
|
$
|
558
|
|
$
|
712
|
|
$
|
261
|
|
$
|
218
|
|
$
|
2,563
|
|
$
|
824
|
|
||||||
|
Total recognized in net periodic benefit cost and OCI, net of tax
|
$
|
1,939
|
|
$
|
959
|
|
$
|
2,102
|
|
$
|
2,013
|
|
$
|
4,137
|
|
$
|
3,814
|
|
||||||
The net loss and prior service cost associated with the disposal group of the Equitable Gas Transaction totaled
$17.3 million
, net of tax, at the closing date of the Equitable Gas Transaction. The Company recognized the full amount in income from discontinued operations in the Statements of Consolidated Income for the year ended December 31, 2013.
94
The estimated net loss for the defined benefit pension plans that will be amortized from accumulated OCI, net of tax, into net periodic benefit cost during 2015 is
$0.4 million
. The estimated net loss and net prior service (credit) for the other post-retirement benefit plans that will be amortized from accumulated OCI, net of tax, into net periodic benefit cost during 2015 are
$0.4 million
and $
(0.2) million
, respectively.
The following weighted average assumptions were used to determine the benefit obligations for the Company’s defined benefit pension and other post-retirement benefit plans:
|
|
December 31,
|
|||||||
|
|
2014
|
2013
|
2014
|
2013
|
||||
|
|
Pension Benefits
|
Other Benefits
|
||||||
|
Discount rate
|
3.60%
|
4.00%
|
3.60%
|
4.00%
|
||||
|
Rate of compensation increase
|
N/A
|
N/A
|
N/A
|
N/A
|
||||
The following weighted average assumptions were used to determine the net periodic benefit cost for the Company’s defined benefit pension and other post-retirement benefit plans:
|
|
For the Years Ended December 31,
|
|||||||||||
|
|
2014
|
2013
|
2014
|
2013
|
||||||||
|
|
Pension Benefits
|
Other Benefits
|
||||||||||
|
Discount rate
|
4.00
|
%
|
3.25
|
%
|
4.00
|
%
|
3.25
|
%
|
||||
|
Expected return on plan assets
|
7.75
|
%
|
7.75
|
%
|
N/A
|
|
N/A
|
|
||||
|
Rate of compensation increase
|
N/A
|
|
N/A
|
|
N/A
|
|
N/A
|
|
||||
The expected rate of return is established at the beginning of the fiscal year to which it relates based upon information available to the Company at that time, including the plans’ investment mix and the historical and forecasted rates of return on the types of securities held. Any differences between actual experience and assumed experience are deferred as an unrecognized actuarial gain or loss. The unrecognized actuarial gains or losses are amortized into the Company’s net periodic benefit cost. The expected rate of return for
2015
is expected to be in the range of
5.50%
to
6.25%
. This assumption will be used to derive the Company’s
2015
net periodic benefit cost. The rate of compensation increase is not applicable in determining future benefit obligations as a result of plan design. Pension expense increases or decreases as the expected rate of return or discount rate changes.
For measurement purposes, the annual rate of increase in the per capita cost of covered health care benefits in
2014
was
7.25%
for both the Pre
-65
and Post-65 medical charges. The rates were assumed to decrease gradually to ultimate rates of
5.00%
in 2024.
Assumed health care cost trend rates have an effect on the amounts reported for the health care plans. A one-percentage-point change in assumed health care cost trend rates would have had the following effects:
|
|
One-Percentage-Point
Increase
|
One-Percentage-Point
Decrease
|
||||||||||||||||||||||
|
|
2014
|
2013
|
2012
|
2014
|
2013
|
2012
|
||||||||||||||||||
|
|
(Thousands)
|
|||||||||||||||||||||||
|
Increase (decrease) to total of service and interest cost components
|
$
|
13
|
|
$
|
25
|
|
$
|
32
|
|
$
|
(14
|
)
|
$
|
(26
|
)
|
$
|
(32
|
)
|
||||||
|
Increase (decrease) to post-retirement benefit obligation
|
$
|
228
|
|
$
|
220
|
|
$
|
711
|
|
$
|
(229
|
)
|
$
|
(223
|
)
|
$
|
(688
|
)
|
||||||
95
The asset allocation for the Retirement Plan at December 31,
2014
and
2013
and target allocation for January 2013 - October 2014 by asset category are as follows:
|
Target Allocation
|
Percentage of Plan Assets
at December 31,
|
|||||||
|
Asset Category
|
January 2013 - October 2014
|
2014
|
2013
|
|||||
|
Domestic broadly diversified equity securities
|
40% - 60%
|
26
|
%
|
42
|
%
|
|||
|
Fixed income securities
|
20% - 50%
|
63
|
%
|
29
|
%
|
|||
|
International broadly diversified equity securities
|
5% - 15%
|
8
|
%
|
7
|
%
|
|||
|
Alternative fixed income securities
|
0% - 10%
|
—
|
|
4
|
%
|
|||
|
Cash and equivalent investments
|
0% - 15%
|
3
|
%
|
18
|
%
|
|||
|
|
|
100
|
%
|
100
|
%
|
|||
The investment activities of the Retirement Plan are supervised and monitored by the Benefits Investment Committee (BIC). The BIC reports to the Management Development and Compensation Committee (the Compensation Committee) of the Board of Directors and consists of the Chief Financial Officer and other officers and employees of the Company. Prior to the Company’s determination to terminate the Retirement Plan, the BIC had developed an investment strategy that focused on asset allocation, diversification and quality guidelines. The investment goals of the BIC were to minimize high levels of risk at the total pension investment fund level.
In October 2014 in anticipation of the termination of the Retirement Plan, the BIC modified the investment allocations for the Retirement Plan by allocating a greater portion of the plan assets to fixed income securities to prepare for the expected liquidation of plan assets. As a result of the modification of the investment allocations at December 31, 2014, the fixed income securities and domestic broadly diversified equity securities categories were outside of the previously established target allocations but consistent with the BIC’s October 2014 determination. The investment allocation is likely to be adjusted further through the date of the liquidation of all assets of, and the settlement of the benefit obligations under, the Retirement Plan. The cash and equivalent investments category was outside of the target allocation at December 31, 2013 as a result of liquidating investments for transfer to the Peoples Natural Gas Company LLC DB Plan for Former Employees of Equitable Gas Company in connection with the Equitable Gas Transaction.
The BIC monitors the asset allocation on a quarterly basis and makes adjustments, as needed, to rebalance the assets to the desired allocation. Comparative market and peer group benchmarks are utilized to ensure that each of the investment managers is performing satisfactorily.
The Company made cash contributions to the Retirement Plan of approximately
$0.7 million
,
$2.6 million
and
$2.9 million
during
2014
,
2013
and
2012
, respectively, to meet certain funding targets. The Company expects to make cash payments of at least
$0.6 million
related to its pensions during
2015
, which will meet minimum required contributions and the
80%
funding obligation on the Retirement Plan. Typically, pension plan cash contributions are designed to at least meet requirements of the
80%
funding level. Assuming the termination process for the Retirement Plan is completed in 2016 as anticipated, the Company expects to make a cash contribution to the Retirement Plan so that it is fully funded and able to purchase the required annuities. The actual dollar amount of the cash contribution made in any particular year will vary as a result of gains or losses sustained by the pension plan during the year due to market conditions. The Company does not expect its cash contributions to have a significant effect on its financial position, results of operations or liquidity.
If the termination process for the Retirement Plan is not completed, the pension benefit payments over the next five years and five years thereafter, which reflect expected future service, are expected to be as follows:
$2.1 million
in
2015
;
$1.9 million
in
2016
;
$1.8 million
in
2017
;
$1.7 million
in
2018
;
$1.9 million
in
2019
; and
$7.7 million
in the five years thereafter.
The following benefit payments for post-retirement benefits other than pensions, which reflect expected future service, are expected to be paid by the Company during each of the next five years and the five years thereafter:
$1.8 million
in
2015
;
$1.7 million
in
2016
;
$1.7 million
in
2017
;
$1.7 million
in
2018
;
$1.6 million
in
2019
; and
$7.6 million
in the five years thereafter.
Expense recognized by the Company related to its defined contribution plans totaled
$13.7 million
in
2014
,
$14.6 million
in
2013
and
$12.0 million
in
2012
.
The Company reports defined benefit plan assets at fair value which is defined as the exchange price that would be received for an asset or paid to transfer a liability (an exit price) in an orderly transaction between market participants at the measurement
96
date. The disclosure below categorizes the assets by a fair value hierarchy. Assets and liabilities are classified in their entirety based on the lowest level of input significant to the fair value measurement. The three levels of the hierarchy are defined as follows:
Level 1 – Observable inputs based on quoted prices (unadjusted) in active markets for identical assets or liabilities.
Level 2 – Observable inputs, other than those included in Level 1, based on quoted prices for similar assets or liabilities in active markets or quoted prices for identical assets and liabilities in inactive markets.
Level 3 – Unobservable inputs that reflect an entity’s own assumptions about what inputs a market participant would use in pricing the asset or liability based on the best information available in the circumstances.
Defined benefit plan asset investments include mutual funds with a fair value of
$5.7 million
and
$6.9 million
as of December 31,
2014
and
2013
, respectively. These investments are based upon daily unadjusted quoted prices and therefore are considered Level 1.
Defined benefit plan asset investments also include common/collective trusts with a fair value of
$12.6 million
and
$13.2 million
as of December 31,
2014
and
2013
, respectively. These investments are valued at current market value of the underlying assets of the fund and therefore are considered Level 2.
As of December 31,
2014
and
2013
, the Retirement Plan did not hold any assets whose fair value was determined using unobservable inputs and therefore would be considered Level 3.
14.
Changes in Accumulated Other Comprehensive Income by Component
The following tables explain the changes in accumulated OCI by component for the years ended December 31,
2014
and
2013
:
|
|
Year Ended December 31, 2014
|
|||||||||||||||||||||
|
|
Natural gas cash
flow hedges, net
of tax
|
|
Interest rate
cash flow
hedges, net
of tax
|
|
Pension and
other post-
retirement
benefits
liability
adjustment,
net of tax
|
|
Accumulated
OCI (loss), net
of tax
|
|||||||||||||||
|
|
(Thousands)
|
|||||||||||||||||||||
|
Accumulated OCI (loss), net
of tax, as of January 1, 2014
|
$
|
61,699
|
|
|
$
|
(1,132
|
)
|
|
$
|
(15,864
|
)
|
|
$
|
44,703
|
|
|||||||
|
Gains recognized in accumulated OCI, net of tax
|
156,207
|
|
(a)
|
—
|
|
|
—
|
|
|
156,207
|
|
|||||||||||
|
Gain reclassified from accumulated OCI, net of tax, into gain on sale / exchange of assets
|
(16,735
|
)
|
(a)
|
—
|
|
—
|
|
(16,735
|
)
|
|||||||||||||
|
Losses (gains) reclassified from accumulated OCI, net of tax
|
15,950
|
|
(a)
|
145
|
|
(a)
|
(776
|
)
|
(b)
|
15,319
|
|
|||||||||||
|
Change in accumulated OCI, net of tax
|
155,422
|
|
|
145
|
|
|
(776
|
)
|
|
154,791
|
|
|||||||||||
|
Accumulated OCI (loss),
net of tax, as of December
31, 2014
|
$
|
217,121
|
|
|
$
|
(987
|
)
|
|
$
|
(16,640
|
)
|
|
$
|
199,494
|
|
|||||||
97
|
|
Year Ended December 31, 2013
|
|||||||||||||||||||||
|
|
Natural gas cash
flow hedges, net
of tax
|
|
Interest rate
cash flow
hedges, net
of tax
|
|
Pension and
other post-
retirement
benefits
liability
adjustment,
net of tax
|
|
Accumulated
OCI (loss), net
of tax
|
|||||||||||||||
|
|
(Thousands)
|
|||||||||||||||||||||
|
Accumulated OCI (loss), net
of tax, as of January 1, 2013
|
$
|
138,188
|
|
|
$
|
(1,276
|
)
|
|
$
|
(37,365
|
)
|
|
$
|
99,547
|
|
|||||||
|
Gains recognized in accumulated OCI, net of tax
|
10,669
|
|
(a)
|
—
|
|
|
2,081
|
|
|
12,750
|
|
|||||||||||
|
(Gains) losses reclassified from accumulated OCI, net of tax
|
(87,158
|
)
|
(a)
|
144
|
|
(a)
|
19,420
|
|
(b)
|
(67,594
|
)
|
|||||||||||
|
Change in accumulated OCI, net of tax
|
(76,489
|
)
|
|
144
|
|
|
21,501
|
|
|
(54,844
|
)
|
|||||||||||
|
Accumulated OCI (loss),
net of tax, as of December
31, 2013
|
$
|
61,699
|
|
|
$
|
(1,132
|
)
|
|
$
|
(15,864
|
)
|
|
$
|
44,703
|
|
|||||||
(a)
See Note 5 for additional information.
(b)
This accumulated OCI reclassification is attributable to the net actuarial loss and net prior service cost related to the Company’s defined benefit pension plans and other post-retirement benefit plans. See Note 13 for additional information.
15.
Common Stock and Earnings Per Share
Common Stock
At December 31,
2014
, shares of EQT’s authorized and unissued common stock were reserved as follows:
|
(Thousands)
|
||
|
Possible future acquisitions
|
20,457
|
|
|
Stock compensation plans
|
16,236
|
|
|
Total
|
36,693
|
|
98
Earnings Per Share
The computation of basic and diluted earnings per share of common stock attributable to EQT Corporation is shown in the table below:
|
|
Years Ended December 31,
|
|||||||||||
|
|
2014
|
2013
|
2012
|
|||||||||
|
|
(Thousands except per share amounts)
|
|||||||||||
|
Basic earnings per common share:
|
|
|
|
|
|
|
||||||
|
Net income attributable to EQT Corporation
|
$
|
386,965
|
|
$
|
390,572
|
|
$
|
183,395
|
|
|||
|
Average common shares outstanding
|
151,553
|
|
150,574
|
|
149,619
|
|
||||||
|
Basic earnings per common share
|
$
|
2.55
|
|
$
|
2.59
|
|
$
|
1.23
|
|
|||
|
Diluted earnings per common share:
|
|
|
|
|
|
|
||||||
|
Net income attributable to EQT Corporation
|
$
|
386,965
|
|
$
|
390,572
|
|
$
|
183,395
|
|
|||
|
Average common shares outstanding
|
151,553
|
|
150,574
|
|
149,619
|
|
||||||
|
Potentially dilutive securities:
|
|
|
|
|
|
|
||||||
|
Stock options and awards (a)
|
960
|
|
1,213
|
|
887
|
|
||||||
|
Total
|
152,513
|
|
151,787
|
|
150,506
|
|
||||||
|
Diluted earnings per common share
|
$
|
2.54
|
|
$
|
2.57
|
|
$
|
1.22
|
|
|||
(a)
There were
no
options to purchase common stock which were excluded from potentially dilutive securities because they were anti-dilutive for the years ended December 31,
2014
and
2013
. Options to purchase common stock which were excluded from potentially dilutive securities because they were anti-dilutive totaled
281,528
shares for the year ended December 31,
2012
.
The impact of the Partnership’s dilutive units did not have a material impact on the Company’s earnings per share calculations for any of the periods presented.
16.
Share-Based Compensation Plans
Share-based compensation expense recorded by the Company was as follows:
|
|
Years Ended December 31,
|
|||||||||||
|
|
2014
|
2013
|
2012
|
|||||||||
|
|
(Thousands)
|
|||||||||||
|
2010 Executive Performance Incentive Programs
|
$
|
—
|
|
$
|
—
|
|
$
|
1,940
|
|
|||
|
2012 Executive Performance Incentive Program
|
7,743
|
|
6,739
|
|
10,633
|
|
||||||
|
2013 Executive Performance Incentive Program
|
8,208
|
|
6,602
|
|
—
|
|
||||||
|
2014 Executive Performance Incentive Program
|
9,104
|
|
—
|
|
—
|
|
||||||
|
2010 Stock Incentive Award Program
|
—
|
|
—
|
|
4,022
|
|
||||||
|
2011 Volume and Efficiency Program
|
—
|
|
13,834
|
|
5,286
|
|
||||||
|
2011 EQT Value Driver Award Program
|
—
|
|
—
|
|
3,033
|
|
||||||
|
2012 EQT Value Driver Award Program
|
—
|
|
2,327
|
|
11,557
|
|
||||||
|
2013 EQT Value Driver Award Program
|
4,403
|
|
13,050
|
|
—
|
|
||||||
|
2014 EQT Value Driver Award Program
|
11,510
|
|
—
|
|
—
|
|
||||||
|
2014 EQM Value Driver Award Program
|
2,378
|
|
—
|
|
—
|
|
||||||
|
Restricted stock awards
|
4,688
|
|
3,033
|
|
2,007
|
|
||||||
|
Non-qualified stock options
|
3,002
|
|
3,805
|
|
3,580
|
|
||||||
|
Other programs, including non-employee director awards
|
(409
|
)
|
9,154
|
|
3,763
|
|
||||||
|
Total share-based compensation expense
|
$
|
50,627
|
|
$
|
58,544
|
|
$
|
45,821
|
|
|||
99
The Company typically uses treasury stock to fund awards that are paid in stock. When an award has graduated vesting, the Company records the expense equal to the vesting percentage on the vesting date. A portion of the expense related to share-based compensation plans is included as an unallocated expense in deriving total operating income for segment reporting purposes. See Note 4.
Cash received from exercises under all share-based payment arrangements for employees and directors for the years ended December 31,
2014
,
2013
and
2012
were
$19.2 million
,
$32.9 million
and
$7.9 million
, respectively. During the years ended December 31,
2014
,
2013
and
2012
, share-based payment arrangements paid in stock generated tax benefits of
$45.9 million
,
$14.4 million
and
$15.1 million
, respectively. As a result of the Company’s NOL position in 2012, excess tax benefits of
$8.1 million
were not recorded in the financial statements as an addition to common stockholders’ equity.
Executive Performance Incentive Programs
Effective in 2009, the Compensation Committee of the Board of Directors adopted the 2010 Executive Performance Incentive Program (2010 EPIP) and the 2010 July Executive Performance Incentive Program (the 2010 July EPIP, and together with the 2010 EPIP, the 2010 EPIPs) under the 2009 Long-Term Incentive Plan. The 2010 EPIPs were established to provide long-term incentive opportunities to key employees to further align their interest with those of the Company’s shareholders and with the strategic objectives of the Company. The vesting of the units under the 2010 EPIPs occurred on December 31, 2012, after the ordinary close of the respective performance periods. Awards granted were earned based on a combination of the level of total shareholder return relative to the respective peer groups over the period January 1, 2010 (July 1, 2010 for the 2010 July EPIP) through December 31, 2012 and the level of production sales revenues over the period January 1, 2010 (July 1, 2010 for the 2010 July EPIP) through September 20, 2012. The Company accounted for these awards as equity awards using the
$60.09
grant date fair value as determined using a Monte Carlo simulation. The Monte Carlo simulation projected the share price, for the Company and its peers, at the ending point of the performance periods. The prices were generated using each company’s annual volatility for the expected term and the commensurate
three
-year risk-free rate of
1.69%
. Based on the Company’s performance relative to the conditions discussed above,
192,744
shares of common stock, valued at
$6.9 million
based on the Monte Carlo value on the grant date, were distributed on December 31, 2012.
Effective in 2012, the Compensation Committee of the Board of Directors adopted the 2012 Executive Performance Incentive Plan (2012 EPIP) under the 2009 Long-Term Incentive Plan. The 2012 EPIP was established to provide long-term incentive opportunities to key employees to further align their interests with those of the Company’s shareholders and with the strategic objectives of the Company. The vesting of the units under the 2012 EPIP will occur upon payment in the first quarter of 2015, following the expiration of the performance period. Awards granted will be earned based on a combination of the level of total shareholder return relative to a predefined peer group and the level of cumulative operating cash flow per share over the period January 1, 2012 through December 31, 2014. The Company accounted for these awards as equity awards using the
$123.37
grant date fair value as determined using a Monte Carlo simulation. The Monte Carlo simulation projected the share price, for the Company and its peers, at the ending point of the performance period. The prices were generated using each company’s annual volatility for the expected term and the commensurate
three
-year risk-free rate of
0.36%
. Based on the Company’s performance relative to the conditions discussed above,
307,323
shares of common stock, valued at
$37.9 million
based on the Monte Carlo value on the grant date, are expected to be distributed during the first quarter of 2015. The total compensation cost capitalized in 2014, 2013 and 2012 was
$2.6 million
,
$8.1 million
, and
$2.1 million
, respectively.
The peer companies for the 2012 EPIP are as follows:
|
Cabot Oil & Gas Corp.
|
National Fuel Gas Company
|
Sempra Energy
|
|
Chesapeake Energy Corp.
|
NStar Electric Co.
|
SM Energy Company
|
|
Cimarex Energy Co.
|
ONEOK, Inc.
|
Southwestern Energy Company
|
|
CONSOL Energy Inc.
|
Penn Virginia Corp.
|
Spectra Energy Corp
|
|
Energen Corp.
|
Pioneer Natural Resources Company
|
Ultra Petroleum Corp.
|
|
EOG Resources, Inc.
|
Plains Exploration & Production Co.
|
Whiting Petroleum Corp.
|
|
EXCO Resources, Inc.
|
Questar Corp.
|
The Williams Companies, Inc.
|
|
MarkWest Energy Partners, L.P.
|
Quicksilver Resources Inc.
|
|
|
MDU Resources Group, Inc.
|
Range Resources Corp.
|
|
100
Effective in 2013, the Compensation Committee of the Board of Directors adopted the 2013 Executive Performance Incentive Plan (2013 EPIP) under the 2009 Long-Term Incentive Plan. The 2013 EPIP was established to provide long-term incentive opportunities to key employees to further align their interests with those of the Company’s shareholders and with the strategic objectives of the Company. A total of
297,597
units were outstanding at January 1, 2014. Adjusting for
26,534
forfeitures, there were
271,063
outstanding units as of December 31,
2014
. The vesting of the units under the 2013 EPIP will occur upon payment after December 31, 2015 (the end of the performance period). The payout factor will vary between
zero
and
300%
of the number of outstanding units contingent upon a combination of the level of total shareholder return relative to a predefined peer group and the level of cumulative operating cash flow per share over the period January 1, 2013 through December 31, 2015. The Company accounted for these awards as equity awards using the grant date fair value as determined using a Monte Carlo simulation. The Monte Carlo simulation projected the share price, for the Company and its peers, at the ending point of the performance period. The prices were generated using each company’s annual volatility for the expected term and the commensurate
three
-year risk-free rate of
0.36%
. As the program includes a performance condition that affects the number of shares that will ultimately vest (the cumulative operating cash flow per share performance condition), in accordance with ASC Topic 718, the Monte Carlo simulation computed a grant date fair value for each possible performance condition outcome on the grant date. The Company reevaluates the then-probable outcome at each reporting period, in order to record expense at the probable outcome grant date fair value. As of December 31, 2014, the compensation expense was recorded using a grant date fair value of
$140.00
per unit, which was the grant date fair value computed for the outcome which management estimated to be most probable. The total compensation cost capitalized in
2014
and 2013 was
$5.5 million
and
$5.0 million
, respectively. As of December 31,
2014
,
$12.6 million
of unrecognized compensation cost (assuming no changes to the performance condition achievement level) related to the 2013 EPIP was expected to be recognized by December 31, 2015.
The peer companies for the 2013 EPIP are as follows:
|
Cabot Oil & Gas Corp.
|
MDU Resources Group, Inc.
|
Sempra Energy
|
|
Chesapeake Energy Corp.
|
National Fuel Gas Company
|
SM Energy Company
|
|
Cimarex Energy Co.
|
Newfield Exploration Company
|
Southwestern Energy Company
|
|
Concho Resources, Inc
|
ONEOK, Inc.
|
Spectra Energy Corp
|
|
CONSOL Energy Inc.
|
Pioneer Natural Resources Company
|
Ultra Petroleum Corp.
|
|
Energen Corp.
|
Plains Exploration & Production Co.
|
Whiting Petroleum Corp.
|
|
EOG Resources, Inc.
|
Questar Corp.
|
The Williams Companies, Inc.
|
|
EXCO Resources, Inc.
|
Quicksilver Resources Inc.
|
|
|
MarkWest Energy Partners, L.P.
|
Range Resources Corp.
|
|
Effective in 2014, the Compensation Committee of the Board of Directors adopted the 2014 Executive Performance Incentive Plan (2014 EPIP) under the 2009 Long-Term Incentive Plan. The 2014 EPIP was established to provide long-term incentive opportunities to key employees to further align their interests with those of the Company’s shareholders and with the strategic objectives of the Company. A total of
278,440
units were granted in 2014 and no additional units may be granted. Adjusting for
19,210
forfeitures, there were
259,230
outstanding units as of December 31,
2014
. The vesting of the units under the 2014 EPIP will occur upon payment after December 31, 2016 (the end of the performance period). The payout factor will vary between
zero
and
300%
of the number of outstanding units contingent upon a combination of the level of total shareholder return relative to a predefined peer group and the level of production sales volume growth over the period January 1, 2014 through December 31, 2016. The Company accounted for these awards as equity awards using the grant date fair value as determined using a Monte Carlo simulation. The Monte Carlo simulation projected the share price, for the Company and its peers, at the ending point of the performance period. The prices were generated using each company’s annual volatility for the expected term and the commensurate
three
-year risk-free rate of
0.78%
. As the program includes a performance condition that affects the number of shares that will ultimately vest (the cumulative total sales volume growth performance condition), in accordance with ASC Topic 718, the Monte Carlo simulation computed a grant date fair value for each possible performance condition outcome on the grant date. The Company reevaluates the then-probable outcome at each reporting period, in order to record expense at the probable outcome grant date fair value. As of December 31, 2014, the compensation expense was recorded using a grant date fair value of
$167.12
per unit, which was the grant date fair value computed for the outcome which management estimated to be most probable. The total compensation cost capitalized in
2014
was
$4.6 million
. As of December 31,
2014
,
$27.3 million
of unrecognized compensation cost (assuming no changes to the performance condition achievement level) related to the 2014 EPIP was expected to be recognized over the next
two
years.
101
The peer companies for the 2014 EPIP are as follows:
|
Cabot Oil & Gas Corp.
|
MarkWest Energy Partners, L.P.
|
Range Resources Corp.
|
|
Chesapeake Energy Corp.
|
National Fuel Gas Company
|
SM Energy Company
|
|
Cimarex Energy Co.
|
Newfield Exploration Company
|
Southwestern Energy Company
|
|
Concho Resources, Inc.
|
Noble Energy, Inc.
|
Spectra Energy Corp
|
|
CONSOL Energy Inc.
|
ONEOK, Inc.
|
Ultra Petroleum Corp.
|
|
Continental Resources, Inc.
|
Pioneer Natural Resources Company
|
Whiting Petroleum Corp.
|
|
Energen Corp.
|
QEP Resources, Inc.
|
The Williams Companies, Inc.
|
|
EOG Resources, Inc.
|
Questar Corp.
|
|
|
EXCO Resources, Inc.
|
Quicksilver Resources, Inc.
|
|
2010 Stock Incentive Award Program
Effective in 2010, the Compensation Committee of the Board of Directors adopted the 2010 Stock Incentive Award Program (2010 SIA) under the 2009 Long-Term Incentive Plan. The 2010 SIA was established to provide long-term incentive opportunities to key employees to further align their interests with those of the Company’s shareholders and with the strategic objectives of the Company. The payout opportunity with respect to the performance awards was contingent upon adjusted 2010 earnings before interest, taxes, depreciation and amortization (EBITDA) performance as compared to the Company’s annual business plan and individual, business unit and Company value drive performance over the period January 1, 2010 through December 31, 2010. The vesting of the awards occurred on December 31, 2012. The vesting resulted in
294,925
awards including accrued dividends, valued at
$12.6 million
based on the grant date fair value, being distributed in Company common stock on December 31, 2012.
Value Driver Award Programs
Effective in 2011, the Compensation Committee of the Board of Directors adopted the 2011 Value Driver Award Program (2011 EQT VDA) under the 2009 Long-Term Incentive Plan. The 2011 EQT VDA was established to align the interests of key employees with the interests of shareholders and customers and the strategic objective of the Company. Under the 2011 EQT VDA,
50%
of the units confirmed vested upon payment following the first anniversary of the grant date; the remaining
50%
of the units confirmed vested on December 31, 2012. The payments were contingent upon adjusted 2011 EBITDA performance as compared to the Company’s annual business plan and individual, business unit and Company value drive performance over the period January 1, 2011 through December 31, 2011. The
two
tranches of awards vested and were distributed in cash payments of
$14.6 million
in February 2012 and
$15.3 million
on December 31, 2012. The Company accounted for these awards as liability awards and as such, recorded compensation expense for the remeasurement of the fair value of the awards at the end of each reporting period. Due to the graded vesting of the award, the Company recognized compensation cost over the requisite service period for each separately vesting tranche of the award as though the award was, in substance, multiple awards.
Effective in 2012, the Compensation Committee of the Board of Directors adopted the 2012 Value Driver Award Program (2012 EQT VDA) under the 2009 Long-Term Incentive Plan. The 2012 EQT VDA was established to align the interests of key employees with the interests of shareholders and customers and the strategic objectives of the Company. Under the 2012 EQT VDA,
50%
of the units confirmed vested upon payment following the first anniversary of the grant date; the remaining
50%
of the units confirmed vested upon the payment date following the second anniversary of the grant date. The payments were contingent upon adjusted 2012 EBITDA performance as compared to the Company’s annual business plan and individual, business unit and Company value driver performance over the period January 1, 2012 through December 31, 2012. The
two
tranches of awards vested and
204,679
awards including accrued dividends were distributed in Company common stock in January 2013 and
194,943
awards including accrued dividends were distributed in February 2014. The Company accounted for these awards as equity awards using the
$54.79
grant date fair value per unit which was equal to the Company’s common stock price on the date prior to the date of grant. Due to the graded vesting of the award, the Company recognized compensation cost over the requisite service period for each separately vesting tranche of the award as though the award was, in substance, multiple awards.
Effective in 2013, the Compensation Committee of the Board of Directors adopted the 2013 Value Driver Award Program (2013 EQT VDA) under the 2009 Long-Term Incentive Plan. The 2013 EQT VDA was established to align the interests of key employees with the interests of shareholders and customers and the strategic objectives of the Company. Under the 2013 EQT VDA,
50%
of the units confirmed vested upon payment following the first anniversary of the grant date; the remaining
50%
of the units confirmed will vest upon the payment date following the second anniversary of the grant date. The payments are contingent upon adjusted 2013 EBITDA performance as compared to the Company’s annual business plan and individual, business unit and
102
Company value driver performance over the period January 1, 2013 through December 31, 2013. As of January 1, 2014,
614,048
awards including accrued dividends were outstanding under the 2013 EQT VDA. The first tranche of the confirmed awards vested and
306,076
were distributed in Company common stock in February 2014. The remainder of the confirmed awards are expected to vest and be paid in Company common stock in the first quarter of 2015. As of December 31,
2014
,
279,761
awards including accrued dividends were outstanding under the 2013 EQT VDA. The Company accounts for these awards as equity awards using the
$58.98
grant date fair value per unit which was equal to the Company’s common stock price on the date prior to the date of grant. Due to the graded vesting of the award, the Company recognizes compensation cost over the requisite service period for each separately vesting tranche of the award as though the award was, in substance, multiple awards. The total compensation cost capitalized was
$2.9 million
and
$14.1 million
in
2014
and
2013
, respectively.
Effective in 2014, the Compensation Committee of the Board of Directors adopted the 2014 Value Driver Award Program (2014 EQT VDA) under the 2009 Long-Term Incentive Plan. The 2014 EQT VDA was established to align the interests of key employees with the interests of shareholders and customers and the strategic objectives of the Company. Under the 2014 EQT VDA,
50%
of the units confirmed will vest upon payment following the first anniversary of the grant date; the remaining
50%
of the units confirmed will vest upon the payment date following the second anniversary of the grant date. The payments are contingent upon adjusted 2014 EBITDA performance as compared to the Company’s annual business plan and individual, business unit and Company value driver performance over the period of January 1, 2014 through December 31, 2014. As of December 31, 2014,
375,426
awards including accrued dividends were outstanding under the 2014 EQT VDA. The first tranche of the confirmed awards are expected to vest and be paid in cash in the first quarter of 2015. The remainder of the confirmed awards are expected to vest and be paid in cash in the first quarter of 2016. The Company accounts for these awards as liability awards and as such, records compensation expense for the remeasurement of the fair value of the awards at the end of each reporting period. Due to the graded vesting of the awards, the Company recognizes compensation cost over the requisite service period for each separately vesting tranche of the award as though the award was, in substance, multiple awards. The total compensation cost capitalized was
$9.8 million
in 2014. The total liability recorded for the 2014 EQT VDA was
$21.3 million
as of December 31, 2014.
2011 Volume and Efficiency Program
Effective in 2011, the Compensation Committee of the Board of Directors adopted the 2011 Volume and Efficiency Program (2011 VEP) under the 2009 Long-Term Incentive Plan. The 2011 VEP was established to align the interests of key employees with the interests of shareholders and customers and the strategic objectives of the Company. The vesting of the stock units granted under the 2011 VEP occurred upon payment in February 2014 following the expiration of the performance period on December 31, 2013. The vesting resulted in approximately
663,350
awards including accrued dividends being distributed in Company common stock in February 2014. The Company accounted for these awards as equity awards using the
$48.06
grant date fair value per unit which was equal to the Company’s common stock price on the grant date. The total compensation cost capitalized was
$2.8 million
and
$2.5 million
in 2013 and 2012, respectively.
Restricted Stock Awards
The Company granted
89,500
,
101,510
and
103,730
restricted stock awards during the years ended December 31,
2014
,
2013
and
2012
, respectively, to key employees of the Company. The restricted shares granted will be fully vested at the end of the
three
-year period commencing with the date of grant, assuming continued employment. The weighted average fair value of these restricted stock grants, based on the grant date fair value of the Company’s common stock, was approximately
$95
,
$71
and
$54
for the years ended December 31,
2014
,
2013
and
2012
, respectively. The total fair value of restricted stock awards vested during the years ended December 31,
2014
,
2013
and
2012
was
$1.5 million
,
$4.3 million
and
$1.6 million
, respectively.
As of December 31,
2014
,
$9.4 million
of unrecognized compensation cost related to nonvested restricted stock awards was expected to be recognized over a remaining weighted average vesting term of approximately
1.5
years.
103
A summary of restricted stock activity as of December 31,
2014
, and changes during the year then ended, is presented below:
|
Restricted Stock
|
Non-
Vested
Shares
|
Weighted
Average
Fair Value
|
Aggregate
Fair Value
|
||||||||
|
Outstanding at January 1, 2014
|
182,378
|
|
$
|
61.98
|
|
$
|
11,302,992
|
|
|||
|
Granted
|
89,500
|
|
$
|
94.91
|
|
8,494,746
|
|
||||
|
Vested
|
(27,310
|
)
|
$
|
53.82
|
|
(1,469,604
|
)
|
||||
|
Forfeited
|
(14,578
|
)
|
$
|
75.64
|
|
(1,102,723
|
)
|
||||
|
Outstanding at December 31, 2014
|
229,990
|
|
$
|
74.90
|
|
$
|
17,225,411
|
|
|||
Non-Qualified Stock Options
The fair value of the Company’s option grants was estimated at the dates of grant using a Black-Scholes option-pricing model with the assumptions indicated in the table below for the years ended December 31,
2014
,
2013
and
2012
. The risk-free rate for periods within the contractual life of the option is based on the U.S. Treasury yield curve in effect at the date of grant. The dividend yield is based on the dividend yield of the Company’s common stock at the time of grant. Expected volatilities are based on historical volatility of the Company’s common stock. The expected term of options granted represents the period of time that options granted are expected to be outstanding based on historical option exercise experience.
|
|
Years Ended December 31,
|
|||||
|
|
2014
|
2013
|
2012
|
|||
|
Risk-free interest rate
|
1.72%
|
0.76%
|
0.89%
|
|||
|
Dividend yield
|
0.15%
|
0.22%
|
1.64%
|
|||
|
Volatility factor
|
24.80%
|
31.69%
|
31.44%
|
|||
|
Expected term
|
5 years
|
5 years
|
5 years
|
|||
The Company granted
133,500
,
259,600
and
278,300
stock options during the years ended December 31,
2014
,
2013
and
2012
, respectively. The weighted average grant date fair value of the options was
$22.25
,
$16.72
and
$13.19
for the years ended December 31,
2014
,
2013
and
2012
, respectively. The total intrinsic value of options exercised during the years ended December 31,
2014
,
2013
and
2012
was
$14.4 million
,
$22.8 million
, and
$11.8 million
, respectively.
As of December 31,
2014
,
$1.9 million
of unrecognized compensation cost related to outstanding nonvested stock options was expected to be recognized by December 31, 2016.
A summary of option activity as of December 31,
2014
, and changes during the year then ended, is presented below:
|
Non-qualified Stock Options
|
Shares
|
Weighted
Average
Exercise
Price
|
Weighted
Average
Remaining
Contractual
Term
|
Aggregate
Intrinsic
Value
|
|||||
|
Outstanding at January 1, 2014
|
1,482,001
|
|
$49.77
|
|
|
||||
|
Granted
|
133,500
|
|
$89.78
|
|
|
||||
|
Exercised
|
(277,033
|
)
|
$48.27
|
|
|
||||
|
Forfeited
|
—
|
|
$—
|
|
|
||||
|
Outstanding at December 31, 2014
|
1,338,468
|
|
$54.08
|
6.35 years
|
$30,823,027
|
||||
|
Exercisable at December 31, 2014
|
1,079,968
|
|
$49.09
|
5.83 years
|
$28,733,027
|
||||
104
Non-employee Directors’ Share-Based Awards
The Company has historically granted to non-employee directors share-based awards which vest upon grant of the awards. The value of the share-based awards will be paid in cash or Company common stock upon the directors’ termination of service on the Company’s Board of Directors. For awards which will be paid in cash, the Company accounts for these awards as liability awards and as such records compensation expense for the remeasurement of the fair value of the awards at the end of each reporting period. For awards which will be settled in Company common stock, the Company accounts for these awards as equity awards. A total of
197,778
non-employee director share-based awards including accrued dividends were outstanding as of December 31,
2014
. A total of
17,900
,
25,500
and
28,140
share-based awards were granted to non-employee directors during the years ended December 31,
2014
,
2013
and
2012
, respectively. The weighted average fair value of these grants, based on the Company’s common stock price on the grant date, was
$89.78
,
$58.98
and
$53.47
for the years ended December 31,
2014
,
2013
and
2012
, respectively.
EQM Awards
At the closing of the Partnership’s IPO in July 2012, the Compensation Committee of the Board of Directors and the general partner of the Partnership granted certain key Company employees performance awards under the EQM Total Return Program representing
146,490
common units of the Partnership. The performance condition related to the performance awards will be satisfied on December 31, 2015 if the total unitholder return realized on the Partnership’s common units from the date of grant is at least
10%
. If the unitholder return performance condition is not achieved as of December 31, 2015, the performance condition will nonetheless be satisfied if the
10%
unitholder return threshold is satisfied as of the end of any calendar quarter ending after December 31, 2015 and on or before December 31, 2017. If earned, the units are expected to be distributed in Partnership common units.
The Company accounted for the EQM Total Return Program awards as equity awards using a
$20.02
grant date fair value per unit as determined using a fair value model. The model projected the unit price for Partnership common units at the ending point of the performance period. The price was generated using annual historical volatilities of peer group companies for the expected term of the awards, which was based upon the performance period. The range of expected volatilities calculated by the valuation model was
27%
-
72%
, and the weighted-average expected volatility was approximately
38%
. Additional assumptions included the risk-free rate for periods within the contractual life of the awards based on the U.S. Treasury yield curve in effect at the time of grant and an expected Partnership distribution growth rate of
10%
. As of December 31, 2013,
142,500
of these performance awards were outstanding. Adjusting for
2,520
forfeitures, there were
139,980
awards outstanding as of December 31,
2014
. As of December 31,
2014
, there was
$0.8 million
of unrecognized compensation cost related to the EQM Total Return Program which is expected to be recognized by December 31, 2015.
Additionally, the general partner of the Partnership has granted Partnership common unit-based phantom awards to its independent directors, which vested upon grant. The value of the phantom awards will be paid in Partnership common units upon the director’s termination of service on the general partner’s Board of Directors. The Company accounts for these awards as equity awards and as such recorded compensation expense for the fair value of the awards at the grant date fair value. A total of
11,759
independent director unit-based awards including accrued distributions were outstanding as of December 31,
2014
. A total of
2,580
,
3,790
and
4,780
unit-based awards were granted to independent directors during the years ended December 31, 2014, 2013 and 2012, respectively. The weighted average fair value of these grants, based on the Partnership’s common unit price on the grant date, was
$58.79
,
$37.92
and
$24.30
for the years ended December 31, 2014, 2013 and 2012, respectively.
Effective in 2014, the Compensation Committee of the Board of Directors and the Board of Directors of the Partnership’s general partner adopted the 2014 EQM Value Driver Award Program (2014 EQM VDA) under the 2009 Long-Term Incentive Plan and the Partnership’s 2012 Long-Term Incentive Plan. The 2014 EQM VDA was established to align the interests of key employees with the interests of Partnership unitholders and customers and the strategic objectives of the Partnership. Under the 2014 EQM VDA,
50%
of the units confirmed will vest upon payment following the first anniversary of the grant date; the remaining
50%
of the units confirmed will vest upon the payment date following the second anniversary of the grant date. The performance metrics are the Partnership’s 2014 adjusted EBITDA performance as compared to the Partnership’s annual business plan and individual, business unit and value driver performance over the period of January 1, 2014 through December 31, 2014. As of December 31, 2014,
62,845
awards including accrued dividends were outstanding under the 2014 EQM VDA. The first tranche of the confirmed awards is expected to vest and be distributed in Partnership common units in the first quarter of 2015. The remainder of the confirmed awards is expected to vest and be paid in Partnership common units in the first quarter of 2016. The Partnership accounts for these awards as equity awards using the
$58.79
grant date fair value per unit which was equal to the Partnership’s common unit price on the date prior to the date of grant. Due to the graded vesting of the awards, the Partnership recognizes compensation cost over the requisite service period for each separately vesting tranche of the award as though the award was, in substance, multiple awards. The total compensation cost capitalized in 2014 was
$0.3 million
. As of December
105
31,
2014
, there was
$0.9 million
of unrecognized compensation cost related to the 2014 EQM VDA which is expected to be recognized by December 31, 2015.
2015 Value Driver Award Programs and 2015 Executive Performance Incentive Program
Effective in 2015, the Compensation Committee of the Board of Directors adopted the 2015 EQT Value Driver Award Program (2015 EQT VDA) and the 2015 Executive Performance Incentive Program (2015 EPIP) under the 2014 Long-Term Incentive Plan. The 2015 EQT VDA and 2015 EPIP were established to align the interests of key employees with the interests of shareholders and customers and the strategic objectives of the Company.
A total of
281,460
units were granted under the 2015 EQT VDA.
Fifty
percent of the units confirmed under the 2015 EQT VDA will vest upon the payment date following the first anniversary of the grant date; the remaining
50%
of the confirmed units under the 2015 EQT VDA will vest upon the payment date following the second anniversary of the grant date. The payout will vary between
zero
and
300%
of the number of outstanding units contingent upon adjusted 2015 EBITDA performance as compared to the Company’s annual business plan and individual, business unit and Company value driver performance over the period January 1, 2015 through December 31, 2015. If earned, the 2015 EQT VDA units are expected to be distributed in Company common stock. The Company did not record any obligation or expense related to the 2015 EQT VDA as of December 31, 2014.
A total of
369,290
units were granted under the 2015 EPIP. The vesting of the units under the 2015 EPIP will occur upon payment after December 31, 2017 (the end of the
three years
performance period). The payout will vary between
zero
and
300%
of the number of outstanding units contingent upon a combination of the level of total shareholder return relative to a predefined peer group and the level of production sales volume growth over the period January 1, 2015 through December 31, 2017. If earned, the 2015 EPIP units are expected to be distributed in Company common stock. The Company did not record any expense related to the 2015 EPIP as of December 31, 2014.
2015 Stock Options
Effective January 1, 2015, the Compensation Committee of the Board of Directors granted
158,200
non-qualified stock options to key employees of the Company. The 2015 options are
ten years
options, with an exercise price of
$75.70
, and are subject to
three years
cliff vesting. The Company did not record any expense related to 2015 stock options as of December 31, 2014.
17.
Concentrations of Credit Risk
Revenues and related accounts receivable from the EQT Production segment’s operations are generated primarily from the sale of produced natural gas, NGLs and crude oil to marketers, utility and industrial customers located mainly in the Appalachian Basin and Northeastern United States and a gas processor in Kentucky and West Virginia. Additionally, a significant amount of revenues and related accounts receivable from EQT Midstream are generated from the gathering of natural gas in Kentucky, Virginia, Pennsylvania and West Virginia. The Company had
one
customer within the EQT Production segment account for approximately
12%
and
11%
of its revenues in
2014
and
2013
, respectively.
No
single customer accounted for more than
10%
of revenues in 2012.
Approximately
87%
and
82%
of the Company’s accounts receivable balance as of December 31,
2014
and
2013
, respectively, represented amounts due from marketers. The Company manages the credit risk of sales to marketers by limiting its dealings to those marketers that meet the Company’s criteria for credit and liquidity strength and by regularly monitoring these accounts. The Company may require letters of credit, guarantees, performance bonds or other credit enhancements from a marketer in order for that marketer to meet the Company’s credit criteria. As a result, the Company did not experience any significant defaults on sales of natural gas to marketers during the years ended December 31,
2014
,
2013
or
2012
.
The Company is exposed to credit loss in the event of nonperformance by counterparties to derivative contracts. This credit exposure is limited to derivative contracts with a positive fair value, which may change as market prices change. The Company believes that NYMEX-traded future contracts have limited credit risk because CFTC regulations are in place to protect exchange participants, including the Company, from any potential financial instability of the exchange members. The Company’s OTC swap and collar derivative instruments are primarily with financial institutions and, thus, are subject to events that would impact those companies individually as well as that industry as a whole.
The Company utilizes various processes and analyses to monitor and evaluate its credit risk exposures. These include monitoring current market conditions, counterparty credit fundamentals and credit default swap rates. Credit exposure is controlled through credit approvals and limits based on counterparty credit fundamentals. To manage the level of credit risk, the Company
106
enters into transactions with financial counterparties that are of investment grade or better, enters into netting agreements whenever possible and may obtain collateral or other security.
As of December 31,
2014
, the Company was not in default under any derivative contracts and has no knowledge of default by any counterparty to derivative contracts. The Company made
no
adjustments to the fair value of derivative contracts due to credit related concerns outside of the normal non-performance risk adjustment included in the Company’s established fair value procedure. The Company monitors market conditions that may impact the fair value of derivative contracts reported in the Consolidated Balance Sheets.
18.
Commitments and Contingencies
The Company has commitments for demand charges under existing long-term contracts and binding precedent agreements with various third-party pipelines. Future payments for these items as of December 31,
2014
totaled
$4,632.2 million
(
2015
-
$205.1 million
,
2016
-
$267.8 million
,
2017
-
$333.1 million
,
2018
-
$353.4 million
,
2019
-
$348.0 million
and thereafter -
$3,124.8 million
). The Company has entered into agreements to release some of its capacity to various third parties.
The Company has agreements with drilling contractors to provide drilling equipment and services to the Company. These obligations totaled approximately
$132.0 million
as of December 31,
2014
. Operating lease rentals for drilling contractors, office locations and warehouse buildings, as well as a limited amount of equipment, amounted to approximately
$65.6 million
in
2014
,
$56.0 million
in
2013
and
$45.0 million
in
2012
. Future lease payments under non-cancelable operating leases as of December 31,
2014
totaled
$225.6 million
(
2015
-
$83.4 million
,
2016
-
$37.4 million
,
2017
-
$31.7 million
,
2018
–
$16.8 million
,
2019
-
$9.6 million
and thereafter -
$46.7 million
).
In July 2014, the Partnership announced that it will construct and own the Ohio Valley Connector (OVC) pipeline. The OVC includes a
36
-mile pipeline that will extend the Partnership’s transmission and storage system from northern West Virginia to Clarington, Ohio, at which point it will interconnect with the Rockies Express Pipeline and the Texas Eastern Pipeline. The Partnership has entered into a
20
-year precedent agreement with the Company for a total of
650
BBtu per day of firm transmission capacity on the OVC.
In September 2014, the Company and an affiliate of NextEra Energy, Inc. announced the formation of the MVP LLC joint venture that will construct and own the MVP. The Company expects to transfer its interest in MVP LLC to the Partnership. The approximately
300
-mile pipeline will extend from the Partnership’s existing transmission and storage system in Wetzel County, West Virginia to Pittsylvania County, Virginia. The Company expects that the Partnership will own the largest interest in the joint venture and will operate the MVP, with the Partnership funding its proportionate share through capital contributions made to the joint venture. The joint venture has secured a total of
2.0
Bcf per day of firm capacity commitments at
20
-year terms and is currently in negotiation with additional shippers who have expressed interest in the MVP project. As a result, the final project scope, including pipe diameter and total capacity, has not yet been determined; however the voluntary pre-filing process with the FERC began in October 2014.
The Company is subject to various federal, state and local environmental and environmentally-related laws and regulations. These laws and regulations, which are constantly changing, can require expenditures for remediation and may in certain instances result in assessment of fines. The Company has established procedures for ongoing evaluation of its operations to identify potential environmental exposures and to assure compliance with regulatory policies and procedures. The estimated costs associated with identified situations that require remedial action are accrued. However, certain costs are deferred as regulatory assets when recoverable through regulated rates. Ongoing expenditures for compliance with environmental laws and regulations, including investments in plant and facilities to meet environmental requirements, have not been material. Management believes that any such required expenditures will not be significantly different in either their nature or amount in the future and does not know of any environmental liabilities that will have a material effect on the Company’s financial position, results of operations or liquidity. The Company has identified situations that require remedial action for which approximately
$1.3 million
is included in other liabilities and credits in the Consolidated Balance Sheets as of December 31,
2014
.
In the ordinary course of business, various legal and regulatory claims and proceedings are pending or threatened against the Company. While the amounts claimed may be substantial, the Company is unable to predict with certainty the ultimate outcome of such claims and proceedings. The Company accrues legal or other direct costs related to loss contingencies when actually incurred. The Company has established reserves it believes to be appropriate for pending matters and, after consultation with counsel and giving appropriate consideration to available insurance, the Company believes that the ultimate outcome of any matter currently pending against the Company will not materially affect the financial position, results of operations or liquidity of the Company.
107
19.
Guarantees
In connection with the sale of its NORESCO domestic operations in December 2005, the Company agreed to maintain in place guarantees of certain warranty obligations of NORESCO. The savings guarantees provided that once the energy-efficiency construction was completed by NORESCO, the customer would experience a certain dollar amount of energy savings over a period of years. The undiscounted maximum aggregate payments that may be due related to these guarantees were approximately
$153 million
as of December 31,
2014
, extending at a decreasing amount for approximately
13 years
.
In December 2014, the Company issued a
$130 million
performance guarantee (the Original MVP Guarantee) in connection with its subsidiary’s obligations to fund the Company’s proportionate share of the construction budget for the MVP. Upon the FERC’s initial release to begin construction of the MVP, the Original MVP Guarantee will terminate, and the Company will be obligated to issue a new guarantee in an amount equal to
33%
of the subsidiary’s remaining obligations to make capital contributions to MVP LLC in connection with the then remaining construction budget. Upon the transfer of the Company’s interest in the joint venture to the Partnership, the Partnership will assume these obligations to provide performance assurances for the MVP. See Note 18 for additional discussion regarding the MVP joint venture.
The NORESCO and the MVP guarantees are exempt from ASC Topic 460, Guarantees. The Company has determined that the likelihood it will be required to perform on these arrangements is remote and any potential payments are expected to be immaterial to the Company’s financial position, results of operations and liquidity. As such, the Company has not recorded any liabilities in its Consolidated Balance Sheets related to these guarantees.
108
20. Interim Financial Information (Unaudited)
The following quarterly summary of operating results reflects variations due primarily to the volatility of natural gas commodity prices and the seasonal nature of the Company’s storage business.
|
|
Three Months Ended
|
|||||||||||||||
|
|
March 31
|
June 30
|
September 30
|
December 31
|
||||||||||||
|
|
(Thousands, except per share amounts)
|
|||||||||||||||
|
2014 (a)
|
|
|
|
|
|
|
|
|
||||||||
|
Operating revenues
|
$
|
661,625
|
|
$
|
526,168
|
|
$
|
578,723
|
|
$
|
703,194
|
|
||||
|
Operating income
|
356,791
|
|
224,771
|
|
231,503
|
|
40,330
|
|
||||||||
|
Amounts attributable to EQT Corporation:
|
|
|
|
|
|
|
|
|
||||||||
|
Income (loss) from continuing operations
|
192,297
|
|
109,045
|
|
98,555
|
|
(14,303
|
)
|
||||||||
|
(Loss) income from discontinued operations
|
(104
|
)
|
1,876
|
|
—
|
|
(401
|
)
|
||||||||
|
Net income (loss) attributable to EQT Corporation
|
$
|
192,193
|
|
$
|
110,921
|
|
$
|
98,555
|
|
$
|
(14,704
|
)
|
||||
|
Earnings per share of common stock attributable to EQT Corporation:
|
|
|
|
|
|
|
|
|
||||||||
|
Basic:
|
|
|
|
|
|
|
|
|
||||||||
|
Income (loss) from continuing operations
|
$
|
1.27
|
|
$
|
0.72
|
|
$
|
0.65
|
|
$
|
(0.10
|
)
|
||||
|
Income from discontinued operations
|
—
|
|
0.01
|
|
—
|
|
—
|
|
||||||||
|
Net income (loss)
|
$
|
1.27
|
|
$
|
0.73
|
|
$
|
0.65
|
|
$
|
(0.10
|
)
|
||||
|
Diluted:
|
|
|
|
|
|
|
|
|
||||||||
|
Income (loss) from continuing operations
|
$
|
1.26
|
|
$
|
0.72
|
|
$
|
0.65
|
|
$
|
(0.10
|
)
|
||||
|
Income from discontinued operations
|
—
|
|
0.01
|
|
—
|
|
—
|
|
||||||||
|
Net income (loss)
|
$
|
1.26
|
|
$
|
0.73
|
|
$
|
0.65
|
|
$
|
(0.10
|
)
|
||||
|
2013 (a)
|
|
|
|
|
|
|
|
|
||||||||
|
Operating revenues
|
$
|
415,883
|
|
$
|
473,093
|
|
$
|
479,606
|
|
$
|
493,429
|
|
||||
|
Operating income
|
144,479
|
|
161,980
|
|
167,064
|
|
181,081
|
|
||||||||
|
Amounts attributable to EQT Corporation:
|
|
|
|
|
|
|
|
|
||||||||
|
Income from continuing operations
|
69,131
|
|
81,466
|
|
86,199
|
|
61,933
|
|
||||||||
|
Income from discontinued operations
|
31,124
|
|
5,390
|
|
2,057
|
|
53,272
|
|
||||||||
|
Net income attributable to EQT Corporation
|
$
|
100,255
|
|
$
|
86,856
|
|
$
|
88,256
|
|
$
|
115,205
|
|
||||
|
Earnings per share of common stock attributable to EQT Corporation:
|
|
|
|
|
|
|
|
|
||||||||
|
Basic:
|
|
|
|
|
|
|
|
|
||||||||
|
Income from continuing operations
|
$
|
0.46
|
|
$
|
0.54
|
|
$
|
0.57
|
|
$
|
0.41
|
|
||||
|
Income from discontinued operations
|
0.21
|
|
0.04
|
|
0.02
|
|
0.35
|
|
||||||||
|
Net income
|
$
|
0.67
|
|
$
|
0.58
|
|
$
|
0.59
|
|
$
|
0.76
|
|
||||
|
Diluted:
|
|
|
|
|
|
|
|
|
||||||||
|
Income from continuing operations
|
$
|
0.46
|
|
$
|
0.54
|
|
$
|
0.57
|
|
$
|
0.40
|
|
||||
|
Income from discontinued operations
|
0.20
|
|
0.03
|
|
0.01
|
|
0.35
|
|
||||||||
|
Net income
|
$
|
0.66
|
|
$
|
0.57
|
|
$
|
0.58
|
|
$
|
0.75
|
|
||||
(a)
The sum of the quarterly data in some cases may not equal the yearly total due to rounding.
During the three months ended December 31, 2014, the Company recognized impairment charges on proved and unproved oil and gas properties of
$267.3 million
. Refer to Note 1 for additional information.
Differences between all amounts in the above table and those previously reported in the Company’s
2013
Form 10-Qs are attributable to the Equitable Gas Transaction, as described in Note 2. All prior periods presented have been recast to reflect the presentation of discontinued operations.
109
21. Natural Gas Producing Activities (Unaudited)
The supplementary information summarized below presents the results of natural gas and oil activities for the EQT Production segment in accordance with the successful efforts method of accounting for production activities.
Production Costs
The following table presents the costs incurred relating to natural gas, NGL and oil production activities (a):
|
|
For the Years Ended December 31,
|
|||||||||||
|
|
2014
|
2013
|
2012
|
|||||||||
|
|
(Thousands)
|
|||||||||||
|
At December 31:
|
|
|
|
|
|
|
||||||
|
Capitalized costs
|
$
|
10,263,547
|
|
$
|
8,152,951
|
|
$
|
6,750,343
|
|
|||
|
Accumulated depreciation and depletion
|
2,874,257
|
|
2,134,953
|
|
1,572,775
|
|
||||||
|
Net capitalized costs
|
$
|
7,389,290
|
|
$
|
6,017,998
|
|
$
|
5,177,568
|
|
|||
|
Costs incurred for the years ended December 31:
|
||||||||||||
|
Property acquisition:
|
|
|
|
|
|
|
||||||
|
Proved properties (b)
|
$
|
231,322
|
|
$
|
90,390
|
|
$
|
16,965
|
|
|||
|
Unproved properties (c)
|
493,067
|
|
95,861
|
|
117,654
|
|
||||||
|
Exploration (d)
|
16,023
|
|
4,285
|
|
4,827
|
|
||||||
|
Development
|
1,697,501
|
|
1,230,301
|
|
850,854
|
|
||||||
(a)
Amounts exclude capital expenditures for facilities and information technology.
(b)
Amounts include
$198.2 million
and
$1.1 million
for the purchase of Permian wells and leases, respectively, acquired in the Range acquisition in 2014 and
$57.0 million
and
$15.3 million
for the purchase of Marcellus wells and leases, respectively, acquired in the Chesapeake acquisition in 2013.
(c)
Amounts include
$317.2 million
for the purchase of Permian leases acquired in the Range acquisition in 2014. Amounts include
$41.9 million
for the purchase of Marcellus leases acquired in the Chesapeake acquisition in 2013.
(d)
Amounts include capitalizable exploratory costs and exploration expense, excluding impairments.
Results of Operations for Producing Activities
The following table presents the results of operations related to natural gas, NGL and oil production:
|
|
For the Years Ended December 31,
|
|||||||||||
|
|
2014
|
2013
|
2012
|
|||||||||
|
|
(Thousands)
|
|||||||||||
|
Revenues:
|
|
|
|
|
|
|
||||||
|
Affiliated
|
$
|
4,761
|
|
$
|
5,912
|
|
$
|
3,433
|
|
|||
|
Nonaffiliated
|
1,607,969
|
|
1,162,745
|
|
790,340
|
|
||||||
|
Production costs
|
133,488
|
|
108,091
|
|
96,155
|
|
||||||
|
Exploration costs
|
21,665
|
|
18,483
|
|
10,370
|
|
||||||
|
Depreciation, depletion and accretion
|
592,855
|
|
578,641
|
|
409,628
|
|
||||||
|
Impairment of long-lived assets
|
267,339
|
|
—
|
|
—
|
|
||||||
|
Income tax expense
|
238,057
|
|
183,060
|
|
109,660
|
|
||||||
|
Results of operations from producing activities (excluding corporate overhead)
|
$
|
359,326
|
|
$
|
280,382
|
|
$
|
167,960
|
|
|||
110
Reserve Information
The information presented below represents estimates of proved natural gas, NGL and oil reserves prepared by Company engineers. The engineer primarily responsible for preparing the reserve report and the technical aspects of the reserves audit received a bachelor’s degree in Chemical Engineering from the Pennsylvania State University and has
17 years
of experience in the oil and gas industry. To ensure that the reserves are materially accurate, management reviews the price, heat content conversion rate and cost assumptions used in the economic model to determine the reserves; division of interest and production volumes are reconciled between the system used to calculate the reserves and other accounting/measurement systems; the reserve reconciliation between prior year reserves and current year reserves is reviewed by senior management; and the estimates of proved natural gas, NGL and oil reserves are audited by the independent consulting firm of Ryder Scott Company, L.P. (Ryder Scott), which is hired by the Company’s management. Since 1937, Ryder Scott has evaluated oil and gas properties and independently certified petroleum reserves quantities in the United States and internationally.
Proved developed reserves represent only those reserves expected to be recovered from existing wells and support equipment. There were no differences between the internally prepared and externally audited estimates. Proved undeveloped reserves represent proved reserves expected to be recovered from new wells after substantial development costs are incurred. Ryder Scott reviewed
100%
of the total net gas, NGL and oil proved reserves attributable to the Company’s interests as of December 31,
2014
. Ryder Scott conducted a detailed, well by well, audit of the Company’s largest properties. This audit covered
80%
of the Company’s proved developed reserves. Ryder Scott’s audit of the remaining
20%
of the Company’s proved developed properties consisted of an audit of aggregated groups not exceeding
200
wells per case for operated wells and
230
wells per case for non-operated wells. For undeveloped locations, Ryder Scott determined which areas within the Company’s acreage were to be considered proven. Reserves were assigned and projected by the Company’s reserve engineers for locations within these proven areas and approved by Ryder Scott based on analogous type curves and offset production information. The audit utilized the performance method and the analogy method. Where historical reserve or production data was definitive, the performance method, which extrapolates historical data, was utilized. In other cases the analogy method, which calculates reserves based on correlations to comparable surrounding wells, was utilized. All of the Company’s proved reserves are located in the United States.
|
|
Years Ended December 31,
|
||||||||
|
|
2014
|
2013
|
2012
|
||||||
|
|
(Millions of Cubic Feet)
|
||||||||
|
Natural Gas
|
|
|
|
|
|
|
|||
|
Proved developed and undeveloped reserves:
|
|
|
|
|
|
|
|||
|
Beginning of year
|
7,561,561
|
|
5,985,758
|
|
5,347,386
|
|
|||
|
Revision of previous estimates
|
(228,085
|
)
|
(375,887
|
)
|
(755,788
|
)
|
|||
|
Purchase of natural gas in place
|
44,867
|
|
472,798
|
|
—
|
|
|||
|
Sale of natural gas in place
|
(198,531
|
)
|
(455
|
)
|
(694
|
)
|
|||
|
Extensions, discoveries and other additions
|
3,040,938
|
|
1,844,840
|
|
1,654,228
|
|
|||
|
Production
|
(444,796
|
)
|
(365,493
|
)
|
(259,374
|
)
|
|||
|
End of year
|
9,775,954
|
|
7,561,561
|
|
5,985,758
|
|
|||
|
Proved developed reserves:
|
|
|
|
|
|
|
|||
|
Beginning of year
|
3,567,313
|
|
2,779,187
|
|
2,948,546
|
|
|||
|
End of year
|
4,257,377
|
|
3,567,313
|
|
2,779,187
|
|
|||
111
|
|
Years Ended December 31,
|
||||||||
|
|
2014
|
2013
|
2012
|
||||||
|
|
(Thousands of Bbls)
|
||||||||
|
Oil (a)
|
|
|
|
|
|
|
|||
|
Proved developed and undeveloped reserves:
|
|
|
|
|
|
|
|||
|
Beginning of year
|
3,956
|
|
3,199
|
|
2,931
|
|
|||
|
Revision of previous estimates
|
(905
|
)
|
270
|
|
265
|
|
|||
|
Purchase of oil in place
|
2,165
|
|
—
|
|
—
|
|
|||
|
Sale of oil in place
|
(3
|
)
|
—
|
|
—
|
|
|||
|
Extensions, discoveries and other additions
|
241
|
|
757
|
|
268
|
|
|||
|
Production
|
(449
|
)
|
(270
|
)
|
(265
|
)
|
|||
|
End of year
|
5,005
|
|
3,956
|
|
3,199
|
|
|||
|
Proved developed reserves:
|
|
|
|
|
|
|
|||
|
Beginning of year
|
3,892
|
|
3,199
|
|
2,931
|
|
|||
|
End of year
|
5,005
|
|
3,892
|
|
3,199
|
|
|||
(a)
One thousand Bbl equals approximately
6 million
cubic feet (MMcf).
|
|
Years Ended December 31,
|
||||
|
2014
|
2013
|
||||
|
(Thousands of Bbls)
|
|||||
|
NGLs (a)
|
|||||
|
Proved developed and undeveloped reserves:
|
|
|
|||
|
Beginning of year
|
127,162
|
|
—
|
|
|
|
Revision of previous estimates
|
(11,306
|
)
|
94,296
|
|
|
|
Purchase of NGLs in place
|
7,476
|
|
—
|
|
|
|
Sale of NGLs in place
|
(18
|
)
|
—
|
|
|
|
Extensions, discoveries and other additions
|
38,945
|
|
32,866
|
|
|
|
Production
|
(6,765
|
)
|
—
|
|
|
|
End of year
|
155,494
|
|
127,162
|
|
|
|
Proved developed reserves:
|
|
|
|||
|
Beginning of year
|
65,837
|
|
—
|
|
|
|
End of year
|
89,830
|
|
65,837
|
|
|
(a)
One thousand Bbl equals approximately
6 million
cubic feet (MMcf).
During
2014
, the Company recorded net downward revisions of
301.4
Bcfe to the December 31,
2013
estimates of its reserves due primarily to the removal of
1,047.2
Bcfe associated with undeveloped locations that will not be drilled within
5
years of initial booking. This total includes locations that are no longer economic in accordance with SEC pricing requirements as well as the remainder of proved undeveloped Huron locations that are no longer planned for development following the Company’s decision to suspend development of this play. This decrease was partially offset by
845.1
Bcfe of increased reserves primarily due to improved performance of proved developed producing locations and increased lateral lengths for previously booked undeveloped Marcellus locations. The Company’s
2014
extensions, discoveries and other additions, resulting from extension of the proved acreage of previously discovered reservoirs through additional drilling in periods subsequent to discovery, of
3,276.1
Bcfe exceeded the
2014
production of
488.1
Bcfe. These reserve extensions and discoveries were mainly due to the addition of proved undeveloped locations in the Company’s Pennsylvania and West Virginia Marcellus fields and the development of locations not previously booked as proved.
112
During
2013
, the Company recorded upward revisions of
191.5
Bcfe to the December 31,
2012
estimates of its reserves primarily due to the increase in the average NYMEX natural gas price for the year causing the properties to remain economic for a longer period. This increase was partially offset by negative revisions of
349
Bcfe, which was primarily due to the removal of
58
undeveloped locations and their associated reserves. The Company included NGL reserves for the first time in
2013
. This caused a one-time decrease in gas reserves and an increase in equivalent NGL reserves. The Company’s
2013
extensions, discoveries and other additions, resulting from extension of the proved acreage of previously discovered reservoirs through additional drilling in periods subsequent to discovery, of
2,046.6
Bcfe exceeded the
2013
production of
367.1
Bcfe. These reserve extensions and discoveries were mainly due to decreased lateral spacing in
one
of the Company’s locations in Greene County, Pennsylvania, and additional proved locations in the Company’s Pennsylvania and West Virginia Marcellus fields and the addition of Huron proved undeveloped reserves due to the re-establishment of the Huron development program.
During
2012
, the Company recorded downward revisions of
754.2
Bcfe to the December 31,
2011
estimates of its reserves primarily due to the decrease in the average NYMEX natural gas price for the year causing the existing reserves to become uneconomic in accordance with SEC pricing requirements. The Company’s
2012
extensions, discoveries and other additions, resulting from extension of the proved acreage of previously discovered reservoirs through additional drilling in periods subsequent to discovery, of
1,655.8
Bcfe exceeded the
2012
production of
261.0
Bcfe. These reserve extensions and discoveries were mainly due to decreased lateral spacing in
one
of the Company’s Greene County, Pennsylvania locations and additional proved locations in the Company’s Wetzel and Doddridge County, West Virginia development areas.
As of
December 31, 2014
, the Company had a total of
15.3
Bcfe of reserves that have been classified as proved undeveloped for more than
five
years. These reserves are associated with
two
wells that were drilled in 2014 and that are scheduled to be completed and producing in 2015.
Standard Measure of Discounted Future Cash Flow
Management cautions that the standard measure of discounted future cash flows should not be viewed as an indication of the fair market value of natural gas and oil producing properties, nor of the future cash flows expected to be generated therefrom. The information presented does not give recognition to future changes in estimated reserves, selling prices or costs and has been discounted at a rate of
10%
.
Estimated future net cash flows from natural gas and oil reserves are as follows at December 31:
|
|
2014
|
2013
|
2012
|
|||||||||
|
|
(Thousands)
|
|||||||||||
|
Future cash inflows (a)
|
$
|
30,428,815
|
|
$
|
25,912,542
|
|
$
|
15,250,019
|
|
|||
|
Future production costs
|
(4,868,079
|
)
|
(4,180,136
|
)
|
(3,070,957
|
)
|
||||||
|
Future development costs
|
(5,052,195
|
)
|
(4,199,722
|
)
|
(3,082,053
|
)
|
||||||
|
Future income tax expenses
|
(7,718,407
|
)
|
(6,533,817
|
)
|
(3,324,472
|
)
|
||||||
|
Future net cash flow
|
12,790,134
|
|
10,998,867
|
|
5,772,537
|
|
||||||
|
10% annual discount for estimated timing of cash flows
|
(7,980,106
|
)
|
(7,047,588
|
)
|
(3,617,378
|
)
|
||||||
|
Standardized measure of discounted future net cash flows
|
$
|
4,810,028
|
|
$
|
3,951,279
|
|
$
|
2,155,159
|
|
|||
113
|
(a)
|
The majority of the Company’s production is sold through liquid trading points on interstate pipelines. For 2014, the reserves were computed using unweighted arithmetic averages of the closing prices on the first day of each month during 2014 of $94.99 per Bbl of oil (first day of each month closing price for West Texas Intermediate (WTI) less regional adjustments), $4.278 per Dth for Columbia Gas Transmission Corp., $3.191 per Dth for Dominion Transmission, Inc., $4.350 per Dth for the East Tennessee Natural Gas Pipeline, $3.258 per Dth for Texas Eastern Transmission Corp., $2.286 per Dth for the Tennessee, zone 4-300 Leg of Tennessee Gas Pipeline Company, $4.170 per Dth for the Tennessee LA 500 Leg of Tennessee Gas Pipeline Company, $4.152 per Dth for Waha, and $4.243 per Dth for Houston Ship Channel. For 2014, NGL pricing using arithmetic averages of the closing prices on the first day of each month during 2014 for NGL components and adjusted using the regional component makeup of produced NGLs resulted in prices of $49.22 per Bbl of NGLs from West Virginia Marcellus reserves in Doddridge, Ritchie, and Wetzel counties, $49.47 per Bbl of NGLs from certain Kentucky reserves, $47.11 per Bbl for Utica reserves, and $31.92 per Bbl for Permian reserves.
|
|
|
|
|
|
For 2013, the reserves were computed using unweighted arithmetic averages of the closing prices on the first day of each month during 2013 of $89.22 per Bbl of oil (first day of each month closing price for WTI less regional adjustments), $3.653 per Dth for Columbia Gas Transmission Corp., $3.447 per Dth for Dominion Transmission, Inc., $3.693 per Dth for the East Tennessee Natural Gas Pipeline, $3.495 per Dth for Texas Eastern Transmission Corp., $2.842 per Dth for the Tennessee, zone 4-300 Leg of Tennessee Gas Pipeline Company and $3.521 per Dth for the Tennessee LA 500 Leg of Tennessee Gas Pipeline Company. For 2013, NGL pricing using arithmetic averages of the closing prices on the first day of each month during 2013 for NGL components and adjusted using the regional component makeup of produced NGLs resulted in prices of $51.91 per Bbl of NGLs from West Virginia Marcellus reserves in Doddridge, Ritchie, and Wetzel counties, $49.38 per Bbl of NGLs from certain Kentucky reserves, and $48.14 per Bbl for Utica reserves.
|
|
|
|
|
|
For 2012, the reserves were computed using unweighted arithmetic averages of the closing prices on the first day of each month during 2012 of $82.90 per Bbl of oil (first day of each month closing price for WTI less Appalachian Basin adjustment), $2.793 per Dth for Columbia Gas Transmission Corp., $2.785 per Dth for Dominion Transmission, Inc., $2.769 per Dth for the East Tennessee Natural Gas Pipeline, $2.782 per Dth for Texas Eastern Transmission Corp., $2.403 per Dth for the Tennessee, zone 4-300 Leg of Tennessee Gas Pipeline Company and $2.878 per Dth for the Tennessee LA 500 Leg of Tennessee Gas Pipeline Company. For 2012, the West Virginia Marcellus reserves from Doddridge and Ritchie Counties were computed using an additional $0.591 and reserves from Wetzel County were computed using an additional $0.398 for revenues earned on NGLs that are produced from those reserves. Revenues earned on NGLs that are produced from certain Kentucky reserves were computed using an additional $0.764.
|
Holding production and development costs constant, a change in price of
$1
per Dth for natural gas,
$10
per barrel for oil and
$10
per barrel for NGLs would result in a change in the December 31,
2014
discounted future net cash flows before income taxes of the Company’s proved reserves of approximately
$4.3 billion
,
$21.8 million
and
$551.1 million
, respectively.
Summary of changes in the standardized measure of discounted future net cash flows for the years ended December 31:
|
|
2014
|
2013
|
2012
|
|||||||||
|
|
(Thousands)
|
|||||||||||
|
Sales and transfers of natural gas and oil produced – net
|
$
|
(1,479,242
|
)
|
$
|
(1,060,566
|
)
|
$
|
(697,618
|
)
|
|||
|
Net changes in prices, production and development costs
|
(1,525,944
|
)
|
(292,533
|
)
|
(3,530,086
|
)
|
||||||
|
Extensions, discoveries and improved recovery, less related costs
|
2,300,923
|
|
1,509,002
|
|
917,986
|
|
||||||
|
Development costs incurred
|
1,023,075
|
|
1,319,135
|
|
548,852
|
|
||||||
|
Purchase of minerals in place – net
|
72,139
|
|
348,608
|
|
—
|
|
||||||
|
Sale of minerals in place – net
|
(146,476
|
)
|
(252
|
)
|
(807
|
)
|
||||||
|
Revisions of previous quantity estimates
|
(222,195
|
)
|
106,170
|
|
(876,336
|
)
|
||||||
|
Accretion of discount
|
578,676
|
|
343,502
|
|
622,072
|
|
||||||
|
Net change in income taxes
|
(529,337
|
)
|
(1,031,105
|
)
|
1,127,272
|
|
||||||
|
Timing and other
|
787,130
|
|
554,159
|
|
111,000
|
|
||||||
|
Net increase (decrease)
|
858,749
|
|
1,796,120
|
|
(1,777,665
|
)
|
||||||
|
Beginning of year
|
3,951,279
|
|
2,155,159
|
|
3,932,824
|
|
||||||
|
End of year
|
$
|
4,810,028
|
|
$
|
3,951,279
|
|
$
|
2,155,159
|
|
|||
114
Not Applicable.
Evaluation of Disclosure Controls and Procedures
Under the supervision and with the participation of management, including the Company’s Principal Executive Officer and Principal Financial Officer, an evaluation of the Company’s disclosure controls and procedures (as defined in Rule 13a-15(e) under the Securities Exchange Act of 1934, as amended (Exchange Act)), was conducted as of the end of the period covered by this report. Based on that evaluation, the Principal Executive Officer and Principal Financial Officer concluded that the Company’s disclosure controls and procedures were effective as of the end of the period covered by this report.
Changes in Internal Control over Financial Reporting
There were no changes in internal control over financial reporting (as such term is defined in Rule 13a-15(f) under the Exchange Act) that occurred during the fourth quarter of
2014
that have materially affected, or are reasonably likely to materially affect, the Company’s internal control over financial reporting.
Management’s Report on Internal Control over Financial Reporting
The management of EQT is responsible for establishing and maintaining adequate internal control over financial reporting. EQT’s internal control system is designed to provide reasonable assurance to the Company’s management and Board of Directors regarding the reliability of financial reporting and the preparation of financial statements for external purposes in accordance with generally accepted accounting principles. All internal control systems, no matter how well designed, have inherent limitations. Accordingly, even effective controls can provide only reasonable assurance with respect to financial statement preparation and presentation.
EQT’s management assessed the effectiveness of the Company’s internal control over financial reporting as of December 31,
2014
. In making this assessment, management used the criteria set forth by the Committee of Sponsoring Organizations of the Treadway Commission in
Internal Control-Integrated Framework
(2013). Based on this assessment, management concluded that the Company maintained effective internal control over financial reporting as of December 31,
2014
.
Ernst & Young LLP (Ernst & Young), the independent registered public accounting firm that audited the Company’s Consolidated Financial Statements, has issued an attestation report on the Company’s internal control over financial reporting. Ernst & Young’s attestation report on the Company’s internal control over financial reporting appears in Part II, Item 8 of this Annual Report on Form 10-K and is incorporated by reference herein.
Not Applicable.
115
The following information is incorporated herein by reference from the Company’s definitive proxy statement relating to the annual meeting of the shareholders to be held on
April 15, 2015
, which proxy statement will be filed with the SEC within 120 days after the close of the Company’s fiscal year ended December 31,
2014
:
|
•
|
Information required by Item 401 of Regulation S-K with respect to directors is incorporated herein by reference from the sections captioned “Item No. 1 – Election of Directors,” “Nominees to Serve for a One-Year Term Expiring in 2016,” “Additional Directors Whose Terms Expire in 2016” and “Corporate Governance and Board Matters” in the Company’s definitive proxy statement;
|
|
•
|
Information required by Item 405 of Regulation S-K with respect to compliance with Section 16(a) of the Exchange Act is incorporated herein by reference from the section captioned “Equity Ownership – Section 16(a) Beneficial Ownership Reporting Compliance” in the Company’s definitive proxy statement;
|
|
•
|
Information required by Item 407(d)(4) of Regulation S-K with respect to disclosure of the existence of the Company’s separately-designated standing Audit Committee and the identification of the members of the Audit Committee is incorporated herein by reference from the section captioned “Corporate Governance and Board Matters – Board Meetings and Committees – Audit Committee” in the Company’s definitive proxy statement; and
|
|
•
|
Information required by Item 407(d)(5) of Regulation S-K with respect to disclosure of the Company’s audit committee financial expert is incorporated herein by reference from the section captioned “Corporate Governance and Board Matters – Board Meetings and Committees – Audit Committee” in the Company’s definitive proxy statement.
|
Information required by Item 401 of Regulation S-K with respect to executive officers is included after Item 4 at the end of Part I of this Annual Report on Form 10-K under the caption “Executive Officers of the Registrant (as of
February 12, 2015
),” and is incorporated herein by reference.
The Company has adopted a code of business conduct and ethics applicable to all directors and employees, including the principal executive officer, principal financial officer and principal accounting officer. The code of business conduct and ethics is posted on the Company’s website, http://www.eqt.com (accessible by clicking on the “Investors” link on the main page followed by the “Corporate Governance” link and the “Charters and Documents” link), and a printed copy will be delivered free of charge on request by writing to the corporate secretary at EQT Corporation, c/o Corporate Secretary, 625 Liberty Avenue, Suite 1700, Pittsburgh, Pennsylvania 15222. The Company intends to satisfy the disclosure requirement regarding certain amendments to, or waivers from, provisions of its code of business conduct and ethics by posting such information on the Company’s website.
The following information is incorporated herein by reference from the Company’s definitive proxy statement relating to the annual meeting of the shareholders to be held on
April 15, 2015
, which proxy statement will be filed with the SEC within 120 days after the close of the Company’s fiscal year ended
December 31, 2014
:
|
•
|
Information required by Item 402 of Regulation S-K with respect to executive and director compensation is incorporated herein by reference from the sections captioned “Executive Compensation - Compensation Discussion and Analysis,” “Executive Compensation - Compensation Tables,” “Executive Compensation - Compensation Policies and Practices and Risk Management,” and “Directors’ Compensation” in the Company’s definitive proxy statement; and
|
|
•
|
Information required by paragraphs (e)(4) and (e)(5) of Item 407 of Regulation S-K with respect to certain matters related to the Management Development and Compensation Committee is incorporated herein by reference from the sections captioned “Corporate Governance and Board Matters - Compensation Committee Interlocks and Insider Participation” and “Executive Compensation - Report of the Management Development and Compensation Committee” in the Company’s definitive proxy statement.
|
116
Information required by Item 403 of Regulation S-K with respect to stock ownership of significant shareholders, directors and executive officers is incorporated herein by reference to the sections captioned “Equity Ownership - Stock Ownership of Significant Shareholders” and “Equity Ownership - Equity Ownership of Directors and Executive Officers” in the Company’s definitive proxy statement relating to the annual meeting of shareholders to be held on April 15, 2015, which will be filed with the SEC within 120 days after the close of the Company’s fiscal year ended December 31, 2014.
Equity Compensation Plan Information
The following table and related footnotes provide information as of December 31, 2014 with respect to shares of the Company’s common stock that may be issued under the Company’s existing equity compensation plans, including the 2014 Long-Term Incentive Plan (2014 LTIP), the 2009 Long-Term Incentive Plan (2009 LTIP), the 1999 Long-Term Incentive Plan (1999 LTIP), the 1999 Non-Employee Directors’ Stock Incentive Plan (1999 NEDSIP), the 2005 Directors’ Deferred Compensation Plan (2005 DDCP), the 1999 Directors’ Deferred Compensation Plan (1999 DDCP) and the 2008 Employee Stock Purchase Plan (2008 ESPP):
|
Plan Category
|
|
Number Of
Securities To Be Issued Upon
Exercise Of
Outstanding
Options, Warrants
and Rights
(A)
|
|
Weighted Average
Exercise Price
of Outstanding
Options,
Warrants and
Rights
(B)
|
|
Number Of Securities
Remaining Available
For Future Issuance Under Equity
Compensation Plans (Excluding Securities Reflected In
Column A)
(C)
|
|
||||
|
Equity Compensation Plans Approved by Shareholders
(1)
|
|
4,205,522
|
|
(2)
|
$
|
54.08
|
|
(3)
|
9,261,964
|
|
(4)
|
|
Equity Compensation Plans Not Approved by Shareholders
(5)
|
|
25,400
|
|
(6)
|
N/A
|
|
|
172,027
|
|
||
|
Total
|
|
4,230,922
|
|
$
|
54.08
|
|
9,433,991
|
|
|||
|
(1)
|
Consists of the 2014 LTIP, the 2009 LTIP, the 1999 LTIP, the 1999 NEDSIP and the 2008 ESPP. Effective as of April 30, 2014, in connection with the adoption of the 2014 LTIP, the Company ceased making new grants under the 2009 LTIP. Effective as of April 22, 2009, in connection with the adoption of the 2009 LTIP, the Company ceased making new grants under the 1999 LTIP and the 1999 NEDSIP. The 2009 LTIP, the 1999 LTIP and the 1999 NEDSIP remain effectively solely for the purpose of issuing shares upon the exercise or payout of awards outstanding under such plans on April 30, 2014 (for the 2009 LTIP) and April 22, 2009 (for the 1999 LTIP and the 1999 NEDSIP).
|
|
(2)
|
Consists of (i) 1,144,342 shares subject to outstanding stock options under the 2009 LTIP; (ii) 2,534,042 shares subject to outstanding performance awards under the 2009 LTIP, inclusive of dividend reinvestments thereon (counted at a 3X multiple assuming maximum performance is achieved under the awards (representing 844,681
target
awards and dividend reinvestments thereon)); (iii) 279,761 shares subject to outstanding performance awards under the 2009 LTIP, inclusive of dividend reinvestments thereon (counted at award amounts previously
confirmed
by the Management Development and Compensation Committee but subject to continuing employment conditions, and therefore not subject to any additional multiplier); (iv) 43,492 shares subject to outstanding directors’ deferred stock units under the 2009 LTIP, inclusive of dividend reinvestments thereon; (v) 194,126 shares subject to outstanding stock options under the 1999 LTIP; and (vi) 9,759 shares subject to outstanding directors’ deferred stock units under the 1999 NEDSIP, inclusive of dividend reinvestments thereon. No stock options or performance awards were outstanding under the 2014 LTIP as of December 31, 2014.
|
|
(3)
|
The weighted-average exercise price is calculated based solely upon outstanding stock options under the 2009 LTIP and the 1999 LTIP and excludes deferred stock units under the 2009 LTIP and the 1999 NEDSIP and performance awards under the 2009 LTIP. The weighted average remaining term of the stock options was
6.35 years
as of December 31, 2014.
|
|
(4)
|
Consists of (i) 9,867,066 shares available for future issuance under the 2014 LTIP, (ii) a “notional” deficit of (1,325,976) shares under the 2009 LTIP and (iii) 720,874 shares available for future issuance under the 2008 ESPP. As of December 31, 2014, 5,124 shares were subject to purchase under the 2008 ESPP.
|
The “notional” deficit under the 2009 LTIP results from counting outstanding performance awards under the 2009 LTIP at a 3X multiple assuming maximum performance is achieved under the awards. The actual number of shares the Management Development and Compensation Committee will award at the end of the applicable performance periods will range between 0% and 300% of the target awards, based upon, among other things, the Company’s achievement of stated performance measures under the awards, as certified by the Committee. However, to the extent insufficient shares remain available for future issuance
117
under the 2009 LTIP upon the applicable payout dates of such performance awards, the awards will be settled (i) with shares reserved for issuance under the 2014 LTIP or (ii) in cash.
|
(5)
|
Consists of the 2005 DDCP and the 1999 DDCP, each of which is described below.
|
|
(6)
|
Reflects the number of notional shares invested in the EQT Common Stock Fund, payable in shares of common stock, allocated to non-employee directors’ accounts under the 2005 DDCP and the 1999 DDCP as of December 31, 2014.
|
2005 Directors’ Deferred Compensation Plan
The 2005 DDCP was adopted by the Management Development and Compensation Committee, effective January 1, 2005. The plan has been amended to, among other things, allow the plan to continue into 2006 and thereafter and to comply with the documentation requirements of Internal Revenue Code Section 409A. Neither the original adoption of the plan nor its amendments required approval by the Company’s shareholders. The plan allows non-employee directors to defer all or a portion of their directors’ fees and retainers. Amounts deferred are payable on or following retirement from the Board unless an early payment is authorized after the director suffers an unforeseeable financial emergency. In addition to deferred directors’ fees and retainers, the deferred stock units granted to directors on or after January 1, 2005 under the 1999 NEDSIP, the 2009 LTIP and the 2014 LTIP are administered under this plan.
1999 Directors’ Deferred Compensation Plan
The 1999 DDCP was suspended as of December 31, 2004. The plan continues to operate for the sole purpose of administering vested amounts deferred under the plan on or prior to December 31, 2004. Deferred amounts are generally payable upon retirement from the Board, but may be payable earlier if an early payment is authorized after a director suffers an unforeseeable financial emergency. In addition to deferred directors’ fees and retainers and a one-time grant of deferred shares in 1999 resulting from the curtailment of the directors’ retirement plan, the deferred stock units granted to directors and vested prior to January 1, 2005 under the 1999 NEDSIP are administered under this plan.
Information required by Items 404 and 407(a) of Regulation S-K with respect to director independence and related person transactions is incorporated herein by reference to the section captioned “Corporate Governance and Board Matters – Independence and Related Person Transactions” in the Company’s definitive proxy statement relating to the annual meeting of shareholders to be held on
April 15, 2015
, which proxy statement will be filed with the SEC within 120 days after the close of the Company’s fiscal year ended December 31,
2014
.
Information required by Item 9(e) of Schedule 14A is incorporated herein by reference to the section captioned “Item No. 3 – Ratification of Appointment of Independent Registered Public Accounting Firm” in the Company’s definitive proxy statement relating to the annual meeting of shareholders to be held on
April 15, 2015
, which proxy statement will be filed with the SEC within 120 days after the close of the Company’s fiscal year ended December 31,
2014
.
118
|
(a)
|
1
|
|
Financial Statements
|
||
|
|
|
The financial statements listed in the accompanying index to financial statements are filed as part of this Annual Report on Form 10-K.
|
|||
|
|
2
|
|
Financial Statement Schedule
|
||
|
|
|
All schedules are omitted since the subject matter thereof is either not present or is not present in amounts sufficient to require submission of the schedules.
|
|||
|
|
3
|
|
Exhibits
|
||
|
|
|
The exhibits listed on the accompanying index to exhibits (pages 120 through 127) are filed (or, as applicable, furnished) as part of this Annual Report on Form 10-K.
|
|||
EQT CORPORATION
INDEX TO FINANCIAL STATEMENTS COVERED
BY REPORT OF INDEPENDENT REGISTERED
PUBLIC ACCOUNTING FIRM
1.
The following Consolidated Financial Statements of EQT Corporation and Subsidiaries are included in Item 8:
|
|
Page Reference
|
|
|
|
|
Statements of Consolidated Income for each of the three years in the period ended December 31, 2014
|
|
|
Statements of Consolidated Comprehensive Income for each of the three years in the period ended December 31, 2014
|
|
|
Statements of Consolidated Cash Flows for each of the three years in the period ended December 31, 2014
|
|
|
Consolidated Balance Sheets as of December 31, 2014 and 2013
|
|
|
Statements of Consolidated Equity for each of the three years in the period ended December 31, 2014
|
|
|
Notes to Consolidated Financial Statements
|
|
2.
Schedule for the Three Years Ended December 31,
2014
included in Part IV:
All schedules are omitted since the subject matter thereof is either not present or is not present in amounts sufficient to require submission of the schedules.
119
INDEX TO EXHIBITS
|
Exhibits
|
|
Description
|
|
Method of Filing
|
|
|
|
|
|
|
|
2.01(a)
|
|
Master Purchase Agreement dated as of December 19, 2012 among the Company, Distribution Holdco, LLC and PNG Companies LLC
|
|
Filed as Exhibit 2.1 to Form 8-K filed on December 20, 2012
|
|
|
|
|
|
|
|
2.01(b)
|
|
Amendment No. 1 to Master Purchase Agreement dated as of February 22, 2013 among the Company, Distribution Holdco, LLC and PNG Companies LLC
|
|
Filed as Exhibit 2.01 to Form 10-Q for the quarter ended March 31, 2013
|
|
|
|
|
|
|
|
2.01(c)
|
|
Amendment No. 2 to Master Purchase Agreement dated as of December 17, 2013 among the Company, Distribution Holdco, LLC and PNG Companies LLC
|
|
Filed as Exhibit 2.1 to Form 8-K filed on December 19, 2013
|
|
|
|
|
|
|
|
2.02(a)
|
|
Asset Exchange Agreement dated as of December 19, 2012 between the Company and PNG Companies LLC
|
|
Filed as Exhibit 2.2 to Form 8-K filed on December 20, 2012
|
|
|
|
|
|
|
|
2.02(b)
|
|
Amendment to Asset Exchange Agreement dated as of December 17, 2013 between the Company and PNG Companies LLC
|
|
Filed as Exhibit 2.2 to Form 8-K filed on December 19, 2013
|
|
|
|
|
|
|
|
3.01
|
|
Restated Articles of Incorporation of EQT Corporation (amended through April 17, 2013)
|
|
Filed as Exhibit 3.01 to Form 10-Q for the quarter ended March 31, 2013
|
|
|
|
|
|
|
|
3.02
|
|
Amended and Restated By-Laws of EQT Corporation (amended through April 17, 2013)
|
|
Filed as Exhibit 3.2 to Form 8-K filed on April 18, 2013
|
|
|
|
|
|
|
|
4.01(a)
|
|
Indenture dated as of April 1, 1983 between the Company and Pittsburgh National Bank, as Trustee
|
|
Filed as Exhibit 4.01(a) to Form 10-K for the year ended December 31, 2007
|
|
|
|
|
|
|
|
4.01(b)
|
|
Instrument appointing Bankers Trust Company as successor trustee to Pittsburgh National Bank
|
|
Filed as Exhibit 4.01(b) to Form 10-K for the year ended December 31, 1998
|
|
|
|
|
|
|
|
4.01(c)
|
|
1991 Supplemental Indenture dated as of March 15, 1991 between the Company and Bankers Trust Company, as Trustee, eliminating limitations on liens and additional funded debt
|
|
Filed as Exhibit 4.01(f) to Form 10-K for the year ended December 31, 1996
|
|
|
|
|
|
|
|
4.01(d)
|
|
Resolution adopted August 19, 1991 by the Ad Hoc Finance Committee of the Board of Directors of the Company and Addenda Nos. 1 through 27, establishing the terms and provisions of the Series A Medium-Term Notes
|
|
Filed as Exhibit 4.01(g) to Form 10-K for the year ended December 31, 1996
|
Each management contract and compensatory arrangement in which any director or any named executive officer participates has been marked with an asterisk (*)
120
INDEX TO EXHIBITS
|
Exhibits
|
|
Description
|
|
Method of Filing
|
|
|
|
|
|
|
|
4.01(e)
|
|
Resolutions adopted July 6, 1992 and February 19, 1993 by the Ad Hoc Finance Committee of the Board of Directors of the Company and Addenda Nos. 1 through 8, establishing the terms and provisions of the Series B Medium-Term Notes
|
|
Filed as Exhibit 4.01(h) to Form 10-K for the year ended December 31, 1997
|
|
|
|
|
|
|
|
4.01(f)
|
|
Resolution adopted July 14, 1994 by the Ad Hoc Finance Committee of the Board of Directors of the Company and Addenda Nos. 1 and 2, establishing the terms and provisions of the Series C Medium-Term Notes
|
|
Filed as Exhibit 4.01 to Form 10-K for the year ended December 31, 1995
|
|
|
|
|
|
|
|
4.01(g)
|
|
Second Supplemental Indenture dated as of June 30, 2008 between the Company and Deutsche Bank Trust Company Americas, as Trustee, pursuant to which EQT Corporation assumed the obligations of Equitable Resources, Inc. under the related Indenture
|
|
Filed as Exhibit 4.01(g) to Form 8-K filed on July 1, 2008
|
|
|
|
|
|
|
|
4.02(a)
|
|
Indenture dated as of July 1, 1996 between the Company and The Bank of New York, as successor to Bank of Montreal Trust Company, as Trustee
|
|
Filed as Exhibit 4.01(a) to Form S-4 Registration Statement (#333-103178) filed on February 13, 2003
|
|
|
|
|
|
|
|
4.02(b)
|
|
Resolutions adopted January 18 and July 18, 1996 by the Board of Directors of the Company and Resolution adopted July 18, 1996 by the Executive Committee of the Board of Directors of the Company, establishing the terms and provisions of the 7.75% Debentures issued July 29, 1996
|
|
Filed as Exhibit 4.01(j) to Form 10-K for the year ended December 31, 1996
|
|
|
|
|
|
|
|
4.02(c)
|
|
Officer’s Declaration dated as of February 20, 2003 establishing the terms of the issuance and sale of the Notes of the Company in an aggregate amount of up to $200,000,000
|
|
Filed as Exhibit 4.01(c) to Form S-4 Registration Statement (#333-104392) filed on April 8, 2003
|
|
|
|
|
|
|
|
4.02(d)
|
|
Officer’s Declaration dated as of November 7, 2002 establishing the terms of the issuance and sale of the Notes of the Company in an aggregate amount of up to $200,000,000
|
|
Filed as Exhibit 4.01(c) to Form S-4/A Registration Statement (#333-103178) filed on March 12, 2003
|
|
|
|
|
|
|
|
4.02(e)
|
|
Officer’s Declaration dated as of September 27, 2005 establishing the terms of the issuance and sale of the Notes of the Company in an aggregate amount of $150,000,000
|
|
Filed as Exhibit 4.01(b) to Form S-4 Registration Statement (#333-104392) filed on October 28, 2005
|
|
|
|
|
|
|
|
4.02(f)
|
|
Supplemental Indenture dated as of June 30, 2008 between the Company and The Bank of New York, as Trustee, pursuant to which EQT Corporation assumed the obligations of Equitable Resources, Inc. under the related Indenture
|
|
Filed as Exhibit 4.02(f) to Form 8-K filed on July 1, 2008
|
Each management contract and compensatory arrangement in which any director or any named executive officer participates has been marked with an asterisk (*)
121
INDEX TO EXHIBITS
|
Exhibits
|
|
Description
|
|
Method of Filing
|
|
|
|
|
|
|
|
4.03(a)
|
|
Indenture dated as of March 18, 2008 between the Company and The Bank of New York, as Trustee
|
|
Filed as Exhibit 4.1 to Form 8-K filed on March 18, 2008
|
|
|
|
|
|
|
|
4.03(b)
|
|
First Supplemental Indenture (including the form of senior note) dated as of March 18, 2008 between the Company and The Bank of New York, as Trustee, pursuant to which the 6.5% Senior Notes due 2018 were issued
|
|
Filed as Exhibit 4.2 to Form 8-K filed on March 18, 2008
|
|
|
|
|
|
|
|
4.03(c)
|
|
Second Supplemental Indenture dated as of June 30, 2008 between the Company and The Bank of New York, as Trustee, pursuant to which EQT Corporation assumed the obligations of Equitable Resources, Inc. under the related Indenture
|
|
Filed as Exhibit 4.03(c) to Form 8-K filed on July 1, 2008
|
|
|
|
|
|
|
|
4.03(d)
|
|
Third Supplemental Indenture dated as of May 15, 2009 between the Company and The Bank of New York, as Trustee, pursuant to which the 8.13% Senior Notes due 2019 were issued
|
|
Filed as Exhibit 4.1 to Form 8-K filed on May 15, 2009
|
|
|
|
|
|
|
|
4.03(e)
|
|
Fourth Supplemental Indenture dated as of November 7, 2011 between the Company and The Bank of New York Mellon, as Trustee, pursuant to which the 4.88% Senior Notes due 2021 were issued
|
|
Filed as Exhibit 4.2 to Form 8-K filed on November 7, 2011
|
|
4.04(a)
|
Indenture dated as of August 1, 2014 among EQT Midstream Partners, LP, the subsidiary guarantors party thereto, and The Bank of New York Mellon Trust Company, N.A., as Trustee
|
Filed as Exhibit 4.01 to Form 10-Q for the quarter ended September 30, 2014
|
||
|
4.04(b)
|
First Supplemental Indenture dated as of August 1, 2014 among EQT Midstream Partners, LP, the subsidiary guarantors party thereto, and The Bank of New York Mellon Trust Company, N.A., as Trustee, pursuant to which the EQT Midstream Partners, LP 4.00% Senior Notes due 2024 were issued
|
Filed as Exhibit 4.02 to Form 10-Q for the quarter ended September 30, 2014
|
||
|
|
|
|
|
|
|
* 10.01(a)
|
|
1999 Long-Term Incentive Plan (as amended and restated July 11, 2012)
|
|
Filed as Exhibit 10.1 to Form 10-Q for the quarter ended June 30, 2012
|
|
|
|
|
|
|
|
* 10.01(b)
|
|
Form of Participant Award Agreement (Stock Option) under 1999 Long-Term Incentive Plan (2007 grants and later)
|
|
Filed as Exhibit 10.3 to Form 10-Q for the quarter ended September 30, 2008
|
|
|
|
|
|
|
|
* 10.02(a)
|
|
2009 Long-Term Incentive Plan (as amended and restated July 11, 2012)
|
|
Filed as Exhibit 10.2 to Form 10-Q for the quarter ended June 30, 2012
|
Each management contract and compensatory arrangement in which any director or any named executive officer participates has been marked with an asterisk (*)
122
INDEX TO EXHIBITS
|
Exhibits
|
|
Description
|
|
Method of Filing
|
|
|
|
|
|
|
|
* 10.02(b)
|
|
Form of Participant Award Agreement (Phantom Stock Unit Awards) under 2009 Long-Term Incentive Plan (pre-2013 grants)
|
|
Filed as Exhibit 10.02(b) to Form 10-K for the year ended December 31, 2012
|
|
|
|
|
|
|
|
* 10.02(c)
|
|
Form of Participant Award Agreement (Stock Option) under 2009 Long-Term Incentive Plan (pre-2012 grants)
|
|
Filed as Exhibit 10.01(q) to Form 10-K for the year ended December 31, 2010
|
|
|
|
|
|
|
|
* 10.02(d)
|
|
2010 Executive Performance Incentive Program
|
|
Filed as Exhibit 10.01(r) to Form 10-K for the year ended December 31, 2009
|
|
|
|
|
|
|
|
* 10.02(e)
|
|
Form of Participant Award Agreement under 2010 Executive Performance Incentive Program
|
|
Filed as Exhibit 10.01(s) to Form 10-K for the year ended December 31, 2009
|
|
|
|
|
|
|
|
* 10.02(f)
|
|
Form of 2010 Stock Incentive Award Agreement
|
|
Filed as Exhibit 10.01(t) to Form 10-K for the year ended December 31, 2009
|
|
|
|
|
|
|
|
* 10.02(g)
|
|
Form of Amendment to 2010 Stock Incentive Award Agreement
|
|
Filed as Exhibit 10.01(u) to Form 10-K for the year ended December 31, 2010
|
|
|
|
|
|
|
|
* 10.02(h)
|
|
2010 July Executive Performance Incentive Program
|
|
Filed as Exhibit 10.1 to Form 10-Q for the quarter ended September 30, 2010
|
|
|
|
|
|
|
|
* 10.02(i)
|
|
Form of 2011 Value Driver Performance Award Agreement
|
|
Filed as Exhibit 10.01(w) to Form 10-K for the year ended December 31, 2010
|
|
|
|
|
|
|
|
* 10.02(j)
|
|
Form of Amendment to 2011 Value Driver Performance Award Agreement
|
|
Filed as Exhibit 10.02(k) to Form 10-K for the year ended December 31, 2011
|
|
|
|
|
|
|
|
* 10.02(k)
|
|
2011 Volume and Efficiency Program
|
|
Filed as Exhibit 10.2 to Form 10-Q for the quarter ended March 31, 2011
|
|
|
|
|
|
|
|
* 10.02(l)
|
|
Form of Participant Award Agreement under 2011 Volume and Efficiency Program
|
|
Filed as Exhibit 10.1 to Form 10-Q for the quarter ended March 31, 2011
|
|
|
|
|
|
|
|
* 10.02(m)
|
|
Form of Amendment to Stock Option Award Agreements
|
|
Filed as Exhibit 10.3 to Form 10-Q for the quarter ended June 30, 2011
|
|
|
|
|
|
|
|
* 10.02(n)
|
|
Form of Participant Award Agreement (Stock Option) under 2009 Long-Term Incentive Plan (2012 grants)
|
|
Filed as Exhibit 10.02(n) to Form 10-K for the year ended December 31, 2011
|
|
|
|
|
|
|
|
* 10.02(o)
|
|
2012 Executive Performance Incentive Program
|
|
Filed as Exhibit 10.02(q) to Form 10-K for the year ended December 31, 2011
|
|
|
|
|
|
|
|
* 10.02(p)
|
|
Form of Participant Award Agreement under 2012 Executive Performance Incentive Program
|
|
Filed as Exhibit 10.02(r) to Form 10-K for the year ended December 31, 2011
|
Each management contract and compensatory arrangement in which any director or any named executive officer participates has been marked with an asterisk (*)
123
INDEX TO EXHIBITS
|
Exhibits
|
|
Description
|
|
Method of Filing
|
|
|
|
|
|
|
|
* 10.02(q)
|
|
Form of EQM TSR Performance Award Agreement under 2009 Long-Term Incentive Plan and EQT Midstream Services, LLC 2012 Long-Term Incentive Plan
|
|
Filed as Exhibit 10.02(r) to Form 10-K for the year ended December 31, 2012
|
|
|
|
|
|
|
|
* 10.02(r)
|
|
Form of Participant Award Agreement (Phantom Stock Unit Awards) under 2009 Long-Term Incentive Plan (2013 and 2014 grants)
|
|
Filed as Exhibit 10.02(s) to Form 10-K for the year ended December 31, 2012
|
|
|
|
|
|
|
|
* 10.02(s)
|
|
Form of Participant Award Agreement (Stock Option) under 2009 Long-Term Incentive Plan (2013 grants)
|
|
Filed as Exhibit 10.02(t) to Form 10-K for the year ended December 31, 2012
|
|
|
|
|
|
|
|
* 10.02(t)
|
|
2013 Executive Performance Incentive Program
|
|
Filed as Exhibit 10.02(u) to Form 10-K for the year ended December 31, 2012
|
|
|
|
|
|
|
|
* 10.02(u)
|
|
Form of Participant Award Agreement under 2013 Executive Performance Incentive Program
|
|
Filed as Exhibit 10.02(v) to Form 10-K for the year ended December 31, 2012
|
|
|
|
|
|
|
|
* 10.02(v)
|
|
Form of Participant Award Agreement (Stock Option) under 2009 Long-Term Incentive Plan (2014 grants)
|
|
Filed as Exhibit 10.02(v) to Form 10-K for the year ended December 31, 2013
|
|
|
|
|
|
|
|
* 10.02(w)
|
|
2014 Executive Performance Incentive Program
|
|
Filed as Exhibit 10.02(w) to Form 10-K for the year ended December 31, 2013
|
|
|
|
|
|
|
|
* 10.02(x)
|
|
Form of Participant Award Agreement under 2014 Executive Performance Incentive Program
|
|
Filed as Exhibit 10.02(x) to Form 10-K for the year ended December 31, 2013
|
|
|
|
|
|
|
|
* 10.03(a)
|
2014 Long-Term Incentive Plan
|
Filed as Exhibit 10.1 to Form 8-K filed on May 1, 2014
|
||
|
* 10.03(b)
|
Form of Participant Award Agreement (Phantom Stock Unit Awards) under 2014 Long-Term Incentive Plan
|
Filed herewith as Exhibit 10.03(b)
|
||
|
* 10.03(c)
|
Form of Participant Award Agreement (Stock Option) under 2014 Long-Term Incentive Plan
|
Filed herewith as Exhibit 10.03(c)
|
||
|
* 10.03(d)
|
2015 Executive Performance Incentive Program
|
Filed herewith as Exhibit 10.03(d)
|
||
|
* 10.03(e)
|
Form of Participant Award Agreement under 2015 Executive Performance Incentive Program
|
Filed herewith as Exhibit 10.03(e)
|
||
|
* 10.03(f)
|
Amendment to 2015 Executive Performance Incentive Program
|
Filed herewith as Exhibit 10.03(f)
|
||
|
* 10.04
|
|
EQT Midstream Services, LLC 2012 Long-Term Incentive Plan
|
|
Filed as Exhibit 10.03 to Form 10-K for the year ended December 31, 2012
|
|
|
|
|
|
|
|
* 10.05(a)
|
|
1999 Non-Employee Directors’ Stock Incentive Plan (as amended and restated December 3, 2008)
|
|
Filed as Exhibit 10.02(a) to Form 10-K for the year ended December 31, 2008
|
|
|
|
|
|
|
|
* 10.05(b)
|
|
Form of Participant Award Agreement (Phantom Stock Unit Awards) under 1999 Non-Employee Directors’ Stock Incentive Plan
|
|
Filed as Exhibit 10.04(c) to Form 10-K for the year ended December 31, 2006
|
|
|
|
|
|
|
|
* 10.06
|
|
2011 Executive Short-Term Incentive Plan
|
|
Filed as Exhibit 10.2 to Form 8-K filed on May 10, 2011
|
|
|
|
|
|
|
|
* 10.07
|
|
2006 Payroll Deduction and Contribution Program (as amended and restated November 20, 2013)
|
|
Filed as Exhibit 10.02 to Form 10-Q for the quarter ended June 30, 2014
|
|
|
|
|
|
|
|
* 10.08
|
|
1999 Directors’ Deferred Compensation Plan (as amended and restated December 3, 2014)
|
|
Filed herewith as Exhibit 10.08
|
Each management contract and compensatory arrangement in which any director or any named executive officer participates has been marked with an asterisk (*)
124
INDEX TO EXHIBITS
|
Exhibits
|
|
Description
|
|
Method of Filing
|
|
|
|
|
|
|
|
* 10.09
|
|
2005 Directors’ Deferred Compensation Plan (as amended and restated December 3, 2014)
|
|
Filed herewith as Exhibit 10.09
|
|
|
|
|
|
|
|
* 10.10(a)
|
|
Confidentiality, Non-Solicitation and Non-Competition Agreement dated as of September 8, 2008 between the Company and David L. Porges
|
|
Filed as Exhibit 10.8 to Form 10-Q for the quarter ended September 30, 2008
|
|
|
|
|
|
|
|
* 10.10(b)
|
|
Amendment to Confidentiality, Non-Solicitation and Non-Competition Agreement effective as of January 1, 2014 between the Company and David L. Porges
|
|
Filed as Exhibit 10.09(b) to Form 10-K for the year ended December 31, 2013
|
|
|
|
|
|
|
|
* 10.10(c)
|
|
Amended and Restated Change of Control Agreement dated as of February 19, 2013 between the Company and David L. Porges
|
|
Filed as Exhibit 10.10(b) to Form 10-K for the year ended December 31, 2012
|
|
|
|
|
|
|
|
* 10.11(a)
|
|
Confidentiality, Non-Solicitation and Non-Competition Agreement dated as of September 8, 2008 between the Company and Philip P. Conti
|
|
Filed as Exhibit 10.10 to Form 10-Q for the quarter ended September 30, 2008
|
|
|
|
|
|
|
|
* 10.11(b)
|
|
Amendment to Confidentiality, Non-Solicitation and Non-Competition Agreement effective as of January 1, 2014 between the Company and Philip P. Conti
|
|
Filed as Exhibit 10.10(b) to Form 10-K for the year ended December 31, 2013
|
|
* 10.11(c)
|
Second Amendment to Confidentiality, Non-Solicitation and Non-Competition Agreement effective as of January 1, 2015 between the Company and Philip P. Conti
|
Filed herewith as Exhibit 10.11(c)
|
||
|
|
|
|
|
|
|
* 10.11(d)
|
|
Amended and Restated Change of Control Agreement dated as of February 19, 2013 between the Company and Philip P. Conti
|
|
Filed as Exhibit 10.11(b) to Form 10-K for the year ended December 31, 2012
|
|
|
|
|
|
|
|
* 10.12(a)
|
|
Confidentiality, Non-Solicitation and Non-Competition Agreement dated as of September 8, 2008 between the Company and Randall L. Crawford
|
|
Filed as Exhibit 10.1 to Form 10-Q for the quarter ended June 30, 2013
|
|
|
|
|
|
|
|
* 10.12(b)
|
|
Amendment to Confidentiality, Non-Solicitation and Non-Competition Agreement effective as of January 1, 2014 between the Company and Randall L. Crawford
|
|
Filed as Exhibit 10.11(b) to Form 10-K for the year ended December 31, 2013
|
|
|
|
|
|
|
|
* 10.12(c)
|
Second Amendment to Confidentiality, Non-Solicitation and Non-Competition Agreement effective as of January 1, 2015 between the Company and Randall L. Crawford
|
Filed herewith as Exhibit 10.12(c)
|
||
|
* 10.12(d)
|
|
Amended and Restated Change of Control Agreement dated as of February 19, 2013 between the Company and Randall L. Crawford
|
|
Filed as Exhibit 10.12(b) to Form 10-K for the year ended December 31, 2012
|
|
|
|
|
|
|
|
* 10.13(a)
|
|
Confidentiality, Non-Solicitation and Non-Competition Agreement dated as of September 8, 2008 between the Company and Lewis B. Gardner
|
|
Filed as Exhibit 10.2 to Form 10-Q for the quarter ended June 30, 2013
|
Each management contract and compensatory arrangement in which any director or any named executive officer participates has been marked with an asterisk (*)
125
INDEX TO EXHIBITS
|
Exhibits
|
|
Description
|
|
Method of Filing
|
|
|
|
|
|
|
|
* 10.13(b)
|
|
Amendment to Confidentiality, Non-Solicitation and Non-Competition Agreement effective as of January 1, 2014 between the Company and Lewis B. Gardner
|
|
Filed as Exhibit 10.12(b) to Form 10-K for the year ended December 31, 2013
|
|
|
|
|
|
|
|
* 10.13(c)
|
Second Amendment to Confidentiality, Non-Solicitation and Non-Competition Agreement effective as of January 1, 2015 between the Company and Lewis B. Gardner
|
Filed herewith as Exhibit 10.13(c)
|
||
|
* 10.13(d)
|
|
Amended and Restated Change of Control Agreement dated as of February 19, 2013 between the Company and Lewis B. Gardner
|
|
Filed as Exhibit 10.13(b) to Form 10-K for the year ended December 31, 2012
|
|
|
|
|
|
|
|
* 10.14(a)
|
|
Confidentiality, Non-Solicitation and Non-Competition Agreement dated as of September 8, 2008 between the Company and Steven T. Schlotterbeck
|
|
Filed as Exhibit 10.3 to Form 10-Q for the quarter ended June 30, 2013
|
|
|
|
|
|
|
|
* 10.14(b)
|
|
Amendment to Confidentiality, Non-Solicitation and Non-Competition Agreement effective as of January 1, 2014 between the Company and Steven T. Schlotterbeck
|
|
Filed as Exhibit 10.13(b) to Form 10-K for the year ended December 31, 2013
|
|
|
|
|
|
|
|
* 10.14(c)
|
Second Amendment to Confidentiality, Non-Solicitation and Non-Competition Agreement effective as of January 1, 2015 between the Company and Steven T. Schlotterbeck
|
Filed herewith as Exhibit 10.14(c)
|
||
|
* 10.14(d)
|
|
Amended and Restated Change of Control Agreement dated as of February 19, 2013 between the Company and Steven T. Schlotterbeck
|
|
Filed as Exhibit 10.14(b) to Form 10-K for the year ended December 31, 2012
|
|
|
|
|
|
|
|
* 10.15
|
|
Form of Indemnification Agreement between the Company and each executive officer and each outside director
|
|
Filed as Exhibit 10.18 to Form 10-K for the year ended December 31, 2008
|
|
|
|
|
|
|
|
10.16
|
|
Amended and Restated Revolving Credit Agreement dated as of February 18, 2014 among the Company, PNC Bank, National Association, as Administrative Agent, Swing Line Lender and an L/C Issuer, Wells Fargo Bank, National Association, The Bank of Tokyo-Mitsubishi UFJ, Ltd., Bank of America, N.A., Barclays Bank PLC, Citibank, N.A., JPMorgan Chase Bank, N.A. and SunTrust Bank, as Syndication Agents, and the other lender parties thereto
|
|
Filed as Exhibit 10.1 to Form 8-K filed on February 18, 2014
|
|
10.17
|
First Amended and Restated Limited Liability Company Agreement of Mountain Valley Pipeline, LLC dated as of August 28, 2014 among MVP Holdco, LLC, US Marcellus Gas Infrastructure, LLC, and Mountain Valley Pipeline, LLC. Specific items in this exhibit have been redacted, as marked by three asterisks (***) because confidential treatment for those terms has been requested. The redacted material has been separately filed with the SEC.
|
Filed as Exhibit 10.01 to Form 10-Q/A filed on December 3, 2014
|
||
|
|
|
|
|
|
|
21
|
|
Schedule of Subsidiaries
|
|
Filed herewith as Exhibit 21
|
|
|
|
|
|
|
|
23.01
|
|
Consent of Independent Registered Public Accounting Firm
|
|
Filed herewith as Exhibit 23.01
|
|
|
|
|
|
|
|
23.02
|
|
Consent of Ryder Scott Company, L.P.
|
|
Filed herewith as Exhibit 23.02
|
|
|
|
|
|
|
|
31.01
|
|
Rule 13(a)-14(a) Certification of Principal Executive Officer
|
|
Filed herewith as Exhibit 31.01
|
|
|
|
|
|
|
|
31.02
|
|
Rule 13(a)-14(a) Certification of Principal Financial Officer
|
|
Filed herewith as Exhibit 31.02
|
Each management contract and compensatory arrangement in which any director or any named executive officer participates has been marked with an asterisk (*)
126
INDEX TO EXHIBITS
|
Exhibits
|
|
Description
|
|
Method of Filing
|
|
|
|
|
|
|
|
32
|
|
Section 1350 Certification of Principal Executive Officer and Principal Financial Officer
|
|
Furnished herewith as Exhibit 32
|
|
|
|
|
|
|
|
99
|
|
Independent Petroleum Engineers’ Audit Report
|
|
Filed herewith as Exhibit 99
|
|
|
|
|
|
|
|
101
|
|
Interactive Data File
|
|
Filed herewith as Exhibit 101
|
The Company agrees to furnish to the SEC, upon request, copies of instruments with respect to long-term debt, which have not previously been filed.
Each management contract and compensatory arrangement in which any director or any named executive officer participates has been marked with an asterisk (*)
127
SIGNATURES
Pursuant to the requirements of Section 13 or 15(d) of the Securities Exchange Act of 1934, the registrant has duly caused this report to be signed on its behalf by the undersigned, thereunto duly authorized.
|
|
|
EQT CORPORATION
|
|
|
|
|
|
|
|
|
|
By:
|
/s/ DAVID L. PORGES
|
|
|
|
|
David L. Porges
|
|
|
|
|
Chairman, President and Chief Executive Officer
|
|
|
|
|
February 12, 2015
|
Pursuant to the requirements of the Securities Exchange Act of 1934, this report has been signed below by the following persons on behalf of the registrant and in the capacities and on the dates indicated.
|
/s/ DAVID L. PORGES
|
|
Chairman, President
|
|
February 12, 2015
|
|
David L. Porges
|
|
and Chief Executive Officer
|
|
|
|
(Principal Executive Officer)
|
|
|
|
|
|
|
|
|
|
|
|
/s/ PHILIP P. CONTI
|
|
Senior Vice President
|
|
February 12, 2015
|
|
Philip P. Conti
|
|
and Chief Financial Officer
|
|
|
|
(Principal Financial Officer)
|
|
|
|
|
|
|
|
|
|
|
|
/s/ THERESA Z. BONE
|
|
Vice President, Finance
|
|
February 12, 2015
|
|
Theresa Z. Bone
|
|
and Chief Accounting Officer
|
|
|
|
(Principal Accounting Officer)
|
|
|
|
|
|
|
|
|
|
|
|
/s/ VICKY A. BAILEY
|
|
Director
|
|
February 12, 2015
|
|
Vicky A. Bailey
|
|
|
|
|
|
|
|
|
|
|
|
/s/ PHILIP G. BEHRMAN
|
|
Director
|
|
February 12, 2015
|
|
Philip G. Behrman
|
|
|
|
|
|
|
|
|
|
|
|
/s/ KENNETH M. BURKE
|
|
Director
|
|
February 12, 2015
|
|
Kenneth M. Burke
|
|
|
|
|
|
|
|
|
|
|
|
/s/ A. BRAY CARY JR.
|
|
Director
|
|
February 12, 2015
|
|
A. Bray Cary, Jr.
|
|
|
|
|
|
|
|
|
|
|
|
/s/ MARGARET K. DORMAN
|
|
Director
|
|
February 12, 2015
|
|
Margaret K. Dorman
|
|
|
|
|
|
|
|
|
|
|
|
/s/ GEORGE L. MILES, JR.
|
|
Director
|
|
February 12, 2015
|
|
George L. Miles, Jr.
|
|
|
|
|
|
|
|
|
|
|
|
/s/ JAMES E. ROHR
|
|
Director
|
|
February 12, 2015
|
|
James E. Rohr
|
|
|
|
|
|
|
|
|
|
|
|
/s/ DAVID S. SHAPIRA
|
|
Director
|
|
February 12, 2015
|
|
David S. Shapira
|
|
|
|
|
|
|
|
|
|
|
|
/s/ STEPHEN A. THORINGTON
|
|
Director
|
|
February 12, 2015
|
|
Stephen A. Thorington
|
|
|
|
|
|
|
|
|
|
|
|
/s/ LEE T. TODD, JR.
|
|
Director
|
|
February 12, 2015
|
|
Lee T. Todd, Jr.
|
|
|
|
|
128
TABLE OF CONTENTS
Part IItem 1. BusinessItem 1A. Risk FactorsItem 1B. Unresolved Staff CommentsItem 2. PropertiesItem 3. Legal ProceedingsItem 4. Mine Safety DisclosuresPart IIItem 5. Market For Registrant S Common Equity, Related Stockholder Matters and Issuer Purchases Of Equity SecuritiesItem 6. Selected Financial DataItem 7. Management S Discussion and Analysis Of Financial Condition and Results Of OperationsItem 7A. Quantitative and Qualitative Disclosures About Market RiskItem 8. Financial Statements and Supplementary DataItem 9. Changes in and Disagreements with Accountants on Accounting and Financial DisclosureItem 9A. Controls and ProceduresItem 9B. Other InformationPart IIIItem 10. Directors, Executive Officers and Corporate GovernanceItem 11. Executive CompensationItem 12. Security Ownership Of Certain Beneficial Owners and Management and Related Stockholder MattersItem 13. Certain Relationships and Related Transactions, and Director IndependenceItem 14. Principal Accounting Fees and ServicesPart IVItem 15. Exhibits and Financial Statement Schedules