ENERGY RECOVERY, INC.
10-Ks and 10-Qs
|
|
|
|
|
|
|
|
|
|
|
|
|
|
|
|
|
|
|
|
|
|
|
|
|
|
|
|
|
|
|
|
|
|
|
|
|
|
|
|
|
|
|
|
|
|
|
UNITED STATES SECURITIES AND EXCHANGE COMMISSION
Washington D.C. 20549
Form 10-K
|
(Mark One)
|
|
|
R
|
ANNUAL REPORT PURSUANT TO SECTION 13 OR 15(d) OF THE SECURITIES EXCHANGE ACT OF 1934
|
|
For the fiscal year ended December 31, 2012
|
|
|
or
|
|
|
£
|
TRANSITION REPORT PURSUANT TO SECTION 13 OR 15(d) OF THE SECURITIES EXCHANGE ACT OF 1934
|
|
For the transition period from to
|
Commission File Number: 001-34112
Energy
Recovery
, Inc.
(Exact Name of Registrant as Specified in Its Charter)
|
Delaware
|
01-0616867
|
|
(State or Other Jurisdiction of
|
(I.R.S. Employer
|
|
Incorporation or Organization)
|
Identification No.)
|
1717 Doolittle Drive, San Leandro, CA 94577
(Address of Principal Executive Offices)
Registrant’s telephone number, including area code: (510) 483-7370
Securities registered pursuant to Section 12(b) of the Securities Exchange Act of
1934:
|
Title of Each Class
|
Name of Exchange on Which Registered
|
|
Common stock, $0.001 par value
|
The NASDAQ Stock Market LLC
|
Securities registered pursuant to Section 12(g) of the Securities Exchange Act of
1934: None
Indicate by check mark whether the registrant is a well-known seasoned issuer, as defined in Rule 405 of the Securities Act.
Yes
£
No
R
Indicate by check mark if the registrant is not required to file reports pursuant to Section 13 or Section 15(d) of the Act.
Yes
£
No
R
Indicate by check mark whether the registrant: (1) has filed all reports required to be filed by Section 13 or 15(d) of the Securities Exchange Act of 1934 during the preceding 12 months (or for such shorter period that the registrant was required to file such reports), and (2) has been subject to such filing requirements for the past 90 days.
Yes
R
No
£
Indicate by check mark whether the registrant has submitted electronically and posted on its corporate Web site, if any, every Interactive Data File required to be submitted and posted pursuant to Rule 405 of Regulation S-T (§ 232.405 of this chapter) during the preceding 12 months (or for such shorter period that the registrant was required to submit and post such files).
Yes
R
No
£
Indicate by check mark if disclosure of delinquent filers pursuant to Item 405 of Regulation S-K is not contained herein and will not be contained, to the best of registrant’s knowledge, in definitive proxy or information statements incorporated by reference in Part III of this Form 10-K or any amendment to this Form 10-K.
R
Indicate by check mark whether the registrant is a large accelerated filer, an accelerated filer, a non-accelerated filer, or a smaller reporting company. See the definitions of “large accelerated filer”, “accelerated filer”, and “smaller reporting company” in Rule 12b-2 of the Exchange Act. (Check one):
|
Large accelerated filer
£
|
Accelerated filer
R
|
|
Non-accelerated filer
£
(Do not check if a smaller reporting company)
|
Smaller reporting company
£
|
Indicate by check mark whether the registrant is a shell company (as defined in Rule 12b-2 of the Exchange Act).
Yes
£
No
R
The aggregate market value of the voting stock held by non-affiliates amounted to $71.0 million on June 30, 2012.
The number of shares of the registrant’s common stock outstanding as of March 7, 2013 was 50,999,655.
DOCUMENTS INCORPORATED BY REFERENCE
Parts of the Proxy Statement for the Registrant’s Annual Meeting of Stockholders to be held on June 18, 2013 are incorporated by reference into Part III of this Annual Report on Form 10-K.
TABLE OF CONTENTS
|
|
|
Page
|
|
PART I
|
||
|
Item 1.
|
Business
|
4
|
|
Item 1A.
|
Risk Factors
|
9
|
|
Item 1B.
|
Unresolved Staff Comments
|
19
|
|
Item 2.
|
Properties
|
19
|
|
Item 3.
|
Legal Proceedings
|
19
|
|
Item 4.
|
Mine Safety Disclosures
|
19
|
|
PART II
|
||
|
Item 5.
|
Market for the Registrant’s Common Equity and Related Stockholder Matters and Issuer Purchases of Equity Securities
|
20
|
|
Item 6.
|
Selected Financial Data
|
22
|
|
Item 7.
|
Management’s Discussion and Analysis of Financial Condition and Results of Operations
|
23
|
|
Item 7A.
|
Quantitative and Qualitative Disclosure About Market Risk
|
39
|
|
Item 8.
|
Financial Statements and Supplementary Data
|
40
|
|
Item 9.
|
Changes in and Disagreements with Accountants on Accounting and Financial Disclosure
|
71
|
|
Item 9A.
|
Controls and Procedures
|
71
|
|
Item 9B.
|
Other Information
|
73
|
|
PART III
|
||
|
Item 10.
|
Directors, Executive Officers and Corporate Governance
|
73
|
|
Item 11.
|
Executive Compensation
|
73
|
|
Item 12.
|
Security Ownership of Certain Beneficial Owners and Management and Related Stockholder Matters
|
73
|
|
Item 13.
|
Certain Relationships and Related Transactions and Director Independence
|
73
|
|
Item 14.
|
Principal Accountant Fees and Services
|
73
|
|
PART IV
|
||
|
Item 15.
|
Exhibits and Financial Statement Schedules
|
74
|
|
SIGNATURES
|
75
|
|
FORWARD- LOOKING INFORMATION
This Annual Report on Form 10-K, including “Item 7. Management’s Discussion and Analysis” and certain information incorporated by
reference contain forward-looking statements within the “safe harbor” provisions of
the Private Securities Litigation Reform Act of 1995. Forward-looking statements in
this report include, but are not limited to, statements about our expectations,
objectives, anticipations, plans, hopes, beliefs, intentions, or strategies regarding
the future.
Forward-looking statements represent our current expectations about future events, are based on assumptions, and involve risks and uncertainties. If the risks or
uncertainties occur or the assumptions prove incorrect, then our results may differ
materially from those set forth or implied by the forward-looking statements. Our
forward-looking statements are not guarantees of future performance or events.
Words such as “expects,” “anticipates,” “aims,” “projects,” “intends,” “plans,” “believes,” “estimates,” “seeks,” variations of such words, and similar expressions are also intended to identify such forward-looking statements. These forward-looking statements are subject to risks, uncertainties, and assumptions that are difficult to predict; therefore, actual results may differ materially and adversely from those expressed in any forward-looking statements. Readers are directed to risks and uncertainties identified under “Risk Factors” and elsewhere in this report for factors that may cause actual results to be different from those expressed in these forward-looking statements. Except as required by law, we undertake no obligation to revise or update publicly any forward-looking statements for any reason.
Forward-looking statements in this report include, without limitation,
statements about the following:
|
|
•
|
our belief that the levels of gross profit margin achieved during the latter part of 2012 are sustainable and improvable to the extent that volume remains healthy and we continue to realize cost savings through production efficiencies and enhanced yields;
|
|
|
•
|
our plan to improve our existing energy recovery devices and to develop and manufacture new and enhanced versions of these devices;
|
|
|
•
|
our belief that sales of our PX-300 and PX-Q300
energy recovery devices will represent a higher percentage of our net revenue in 2013;
|
|
|
•
|
our belief that the ceramic components of our PX
®
energy recovery devices will result in low life-cycle maintenance costs;
|
|
|
•
|
our belief that our turbocharger devices have long operating lives;
|
|
|
•
|
our objective of finding new applications for our technology and developing new products for use outside of desalination, including oil and gas applications;
|
|
|
•
|
our belief that our products are the most cost-effective energy recovery devices over time;
|
|
|
•
|
our expectation that our expenses for research and development
will continue to increase;
|
|
|
•
|
our expectation that we will continue to rely on sales of our energy recovery devices in the desalination market for a substantial portion of our revenue;
|
|
|
•
|
our ability to meet projected new product development dates, anticipated cost reduction targets, or revenue growth objectives for new products;
|
|
|
•
|
continued weakness in the global economy affecting customer spending;
|
|
|
•
|
customer acceptance of new products;
|
|
|
•
|
our belief that our current facilities will be adequate for the foreseeable future;
|
|
|
•
|
our expectation that sales outside of the United States will remain a
significant portion of our revenue;
|
|
|
•
|
our expectation that future sales and marketing expense will increase;
|
|
|
•
|
the timing of our receipt of payment for products or services from our customers;
|
|
|
•
|
our belief that our existing cash balances and cash generated from our operations will be sufficient to meet our anticipated liquidity needs for the foreseeable future;
|
- 2 -
|
|
•
|
our expectation that, as we expand our international sales, a portion of our revenue could continue to be denominated in foreign currencies;
|
|
|
•
|
our expectation that we will be able to enforce our intellectual property rights; and
|
|
|
•
|
the ability to develop our brands.
|
You should not place undue reliance on these forward-looking statements, which reflect management’s opinions only as of the date of the filing of this Annual Report on Form 10-K. All forward-looking statements included in this document are subject to additional
risks and uncertainties further discussed under “Item 1A: Risk Factors” and are
based on information available to us as of March 12, 2013. We assume no
obligation to update any such forward-looking statements. It is important to note
that our actual results could differ materially from the results set forth or implied
by our forward-looking statements. The factors that could cause our actual results
to differ from those included in such forward-looking statements are set forth under
the heading “Item 1A: Risk Factors” and our results disclosed from time to time
in our reports on Forms 10-Q and 8-K and our Annual Reports to
Stockholders.
- 3 -
Overview
Energy Recovery, Inc. (the “Company”, “Energy Recovery”, “Our”, “Us”, and “We”) is a global leader in transforming untapped energy into reusable energy in fluid flow applications. Energy Recovery was incorporated in Virginia in April 1992 and reincorporated in Delaware in March 2001. We enable the harnessing of energy from industrial fluid flows using our patented energy recovery technologies, thus allowing our customers to reduce operating costs and increase profitability while minimizing their environmental impact and carbon footprint.
Our headquarters and manufacturing center is located at 1717 Doolittle Drive, San Leandro, California 94577, and we have two wholly-owned subsidiaries: Energy Recovery Iberia, S.L. and ERI Energy Recovery Ireland Ltd. We also have sales offices in Madrid, Spain; Dubai, United Arab Emirates; and Shanghai, Peoples Republic of China. Our main telephone number is (510) 483-7370. Additional information about the Company is available on our website at
http://www.energyrecovery.com
. Information contained on the website is not part of this report nor considered to be incorporated by reference herein.
Our Annual Report on Form 10-K, quarterly reports on Form 10-Q, current reports on Form 8-K and all amendments to those reports, and the Proxy Statement for our Annual Meeting of Stockholders are made available, free of charge, in the Investor Relations section of our website,
http://www.energyrecovery.com
, as soon as reasonably practicable after the reports have been filed with or furnished to the Securities and Exchange Commission.
Fluid Flow Markets
Fluid flow markets are characterized by applications in many different sectors, such as water desalination, oil and gas exploration and processing, and power generation. We have been and continue to be the global leader for energy recovery devices (“ERDs”) in the water desalination market with our patented Pressure Exchanger
®
technology and turbochargers. We also provide high-performance and high-efficiency pumps to facilitate a packaged solution to our customers. Building on our leading technology, brand, and reputation, we are now expanding into other fluid flow markets such as amine treatment application in the oil and gas industry while exploring other fluid flow markets such as chemical processing.
Water Desalination
Water desalination will continue to be our core market for revenue generation for the foreseeable future. The water desalination spectrum ranges from small water desalination plants such as those used in cruise ships and resorts to mega-project deployments. Because of the geographical location of many significant desalination projects, geopolitical and economic events can have an effect on the timing of expected projects. In addition, population and economic growth in countries such as India and China are also driving water demand for human, agricultural, and industrial use. We anticipate that markets traditionally not associated with water desalination, including the United States, will inevitably develop and provide further revenue growth opportunities.
Oil and Gas
Building on our market leadership for energy recovery technology in the water desalination industry, we are employing the same innovative approach in other markets where pressurized fluid flows are present such as oil and gas. In the upstream and midstream segments of the oil and gas industry, pressure is both a necessity and liability. Pressurized fluid flow is required to extract oil or gas, but at the same time this same pressure becomes a waste product at different stages of processing. It is at these stages that our technology enables the recovery of pressure energy in the fluid flow either through the exchange of pressure within the application or by converting it to electricity. We enable gas processing plant owners to achieve savings with little or no operational disruption. In addition, our high-efficiency energy recovery systems enable operators to increase profitability in an era of high environmental compliance and efforts to reduce carbon footprints.
- 4 -
Our Products
Our energy recovery products reduce plant operating costs by capturing and reusing the otherwise lost pressure energy from the reject stream of the desalination process. In the oil and gas sector, these devices capture pressure at critical points where pressure energy would otherwise be vented to the atmosphere. Energy is one of the biggest cost drivers in both water desalination and the oil and gas sector. By reducing energy costs, our devices increase the cost effectiveness and decrease the carbon footprint for both water desalination plants and oil and gas processes.
We design and manufacture ERDs primarily at our facility in San Leandro, California. Our water desalination ERDs are categorized into two technology groups: PX
®
energy recovery devices and turbochargers. The first technology group is comprised of our patented Pressure Exchanger
®
technology consisting of ceramic rotors and almost frictionless hydrodynamic bearings. Our PX energy recovery devices perform with up to 98% efficiency and unmatched uptime in the desalination industry
.
The second technology group is comprised of AT™ turbochargers designed for low-pressure brackish and high-pressure seawater reverse osmosis systems. Our turbochargers provide premium efficiency with state-of-the-art engineering and configuration. Designed for reliability and optimum efficiency, Energy Recovery's turbochargers offer substantial savings, especially where power costs are lower. Its custom-designed hydraulics and 3-D geometry allow for optimum performance, while patent-pending technology for volute inserts allows field flexibility as compared to competing centrifugal technologies.
Complementing both our Pressure Exchanger energy recovery devices and turbochargers are our high-efficiency and high-pressure pumps marketed under the trademarks of AquaBold™ and AquaSpire™. These pumps range from high-pressure multi- and single-stage centrifugal pumps to circulation and advanced high-speed pumps.
In the oil and gas market, we design and manufacture complete energy recovery and energy generating systems. The IsoBoost™ energy recovery systems are comprised of turbines and industrial pumps. Our IsoGen™ systems, through the integration of high-efficiency turbines and electric generators, enable oil and gas operators to capture hydraulic energy and generate electricity from high-pressure fluid flows. Additionally, our energy recovery and power generation systems result in lower capital costs for oil and gas operators by minimizing the need for high-pressure pumps that consume large amounts of energy. Another key attribute in our IsoBoost and IsoGen systems is the ease of installation, resulting in low downtime during and after the installation process.
Services
In addition to our industry-leading products, we provide a portfolio of services tailored to our customers’ needs. Specifically, we assist our customers in the early stages of planning and design by leveraging our broad experience in fluid flows. We also provide engineering, technical support, and training to customers during product installation and plant commissioning. Additionally, we offer preventive maintenance and support services as well as replacement parts and reinstallation services. To date the revenue from these services has not represented a significant portion of total revenue.
Customers
Our customers include major international engineering, procurement, and construction (EPC) firms that design and build large desalination plants and a number of original equipment manufacturers (OEMs), which are companies that supply equipment and packaged solutions for small- to medium-sized desalination plants. In the oil and gas market, our potential customers include major exploration and processing companies.
Large Engineering, Procurement and Construction Firms
.
A significant portion of our revenue historically has come from sales of products to large EPC firms worldwide that have the required desalination expertise to engineer, undertake procurement for, construct and sometimes own, and operate large desalination plants or mega-projects. We work with these firms to specify our products for their plants. The time between project tender and product shipment can range from six to 16 months. Each mega-project typically represents a revenue opportunity of between $1 million and $10 million.
- 5 -
A limited number of these EPC firms account for 10% or more of our net revenue. Revenue from customers representing 10% or more of total revenue varies from year to year. For the year ended December 31, 2012, one customer,
I.V.M. Minrav Sadyt (a consortium of Minrav Holdings, Ltd and Sadyt, a Valoriza Agua company),
accounted for approximately 16% of our net revenue. For the year ended December 31, 2011, one customer, IDE Technologies Ltd., accounted for approximately 14% of our net revenue. For the year ended December 31, 2010, two customers — Thiess Degremont J.V. (a joint venture of Thiess Pty Ltd. and Degremont S.A.) and Hydrochem (S) Pte Ltd (a Hyflux company) — accounted for approximately 23% and 12% of our net revenue, respectively.
Original Equipment Manufacturers
.
We also sell our products and services to suppliers of pumps and other water-related equipment for assembly and use in small- to medium-sized desalination plants located in hotels, power plants, cruise ships, farm operations, island bottlers, mobile and containerized water desalination solutions, and small municipalities. These OEMs also purchase our products for “quick water” or emergency water solutions. In this market, the time from project tender to shipment ranges from one to six months.
Oil and Gas Customers.
We currently have several pilot projects pending in the oil and gas market employing our IsoBoost and IsoGen products. These pilots are intended to provide a proof-of-concept to our oil and gas customers, leading to more substantial orders for our oil and gas products. For the year ended December 31, 2012, we did not recognize any revenue from shipments of our oil and gas products.
Competition
The market for energy recovery devices and pumps in the desalination market is competitive. As the demand for fresh water increases and the market expands, we expect competition to persist and intensify.
We have two main competitors for our energy recovery devices: Flowserve Corporation (Flowserve) based in Irving, Texas and Fluid Equipment Development Company (FEDCO) based in Monroe, Michigan. We compete with these companies on the basis of price, quality, efficiency, lead time, expected life, downtime, and maintenance costs. Although these companies may offer competing products at lower prices, we believe that our products offer a competitive advantage because our products are the most cost-effective energy recovery devices for reverse osmosis desalination over time.
In the market for large desalination projects, our PX devices and large turbochargers compete primarily with Flowserve’s DWEER product. We believe that our PX devices have a competitive advantage over DWEER devices because our devices are made with highly durable and corrosion-resistant ceramic parts that are designed for a life of 25 years, are warranted for high efficiencies, cause no unplanned downtime, and offer lower lifecycle costs. Additionally, the PX devices offer optimum scalability with a quick startup as well as minimal maintenance. We believe that our large turbocharger products have a competitive advantage over the DWEER product, particularly in countries where energy costs are low and upfront capital costs are a critical factor in purchase decisions, because our turbocharger products have lower upfront capital costs, a simple design with one moving part, a small physical footprint, and a long operating life that leads to low total lifecycle costs.
In the market for small- to medium-sized desalination plants, our products compete with Flowserve’s Pelton turbines and FEDCO turbochargers. We believe that our PX devices have a competitive advantage over these products because our devices provide up to 98% energy efficiency, have lower lifecycle maintenance costs, and are made of highly durable and corrosion-resistant ceramic parts. We also believe that our turbochargers compete favorably with Pelton turbines and FEDCO turbochargers on the basis of efficiency and price and because our turbochargers have design advantages that enhance efficiency, field flexibility, and serviceability.
In the market for high-pressure pumps, our products compete with pumps manufactured by Clyde Union Ltd. based in Glasgow, Scotland; FEDCO; Flowserve; Düchting Pumpen Maschinenfabrik GmbH & Co KG based in Witten, Germany; KSB Aktiengesellschaft based in Frankenthal, Germany; Torishima Pump Mfg. Co., Ltd. based in Osaka, Japan; Sulzer Pumps, Ltd. based in Winterthur, Switzerland; and other companies. We believe that our pump products are competitive with these products because our pumps are developed specifically for reverse osmosis desalination, are highly efficient, and feature product-lubricated bearings.
- 6 -
In the oil and gas market segment our products are being introduced into a nascent market yet to be penetrated by typical market incumbents such as Schlumberger Limited, Halliburton, and Baker Hughes Incorporated. Current desalination competitors could attempt to introduce their products into this market segment.
Go-To-Market Strategy
Our vision spans all market segments in which we operate and intend to operate. We aim to enable fluid flow operators – whether in water desalination or oil and gas – to maximize the efficiency of their processes, thus reducing operating costs and carbon footprint. Ultimately, our focus on and the execution of our strategy is central to our success.
Key elements of our strategy include:
|
|
·
|
Making clean usable water a reality, not a dream. Aging infrastructures and inadequate water capturing systems require an alternative source of clean usable water. Our goal is to make clean water a reality by reducing the cost of delivering clean usable water to people in an economical and environmentally friendly manner.
|
|
|
·
|
Designing world-class products complemented by premium customer service. We understand that our customers have alternatives to their energy recovery needs. That is why we have designed, and continue to engineer, energy recovery devices that lead the market in uptime, maintenance requirements, and operating costs.
|
|
|
·
|
Diversifying into new flow industries where our world-leading products promise to reduce the overall costs of fluid processing such as oil and gas. We plan to aggressively pursue customers in the oil and gas industry and believe in the value proposition of our oil and gas products, whether from a total cost of ownership or an environmental perspective.
|
|
|
·
|
Driving
customer satisfaction as the flag-bearer of our Company. Without satisfied customers, no element of our strategy will in and of itself translate into shareholder value. We will continue to focus on customer satisfaction through on-time deliveries, market-leading product performance, and continued leading-edge innovation
.
|
Sales and Marketing
We market and sell our products directly to customers through our sales organization and, in some countries, through authorized, independent sales agents. Our current sales organization consists of two groups, water desalination and oil and gas. The water desalination group consists of the mega-projects group, which is responsible for sales of our ERDs for desalination projects exceeding 50,000 cubic meters per day; and our OEM group, which is responsible for sales of PX devices, turbochargers, and pumps for plants designed to produce less than 50,000 cubic meters per day. Our oil and gas group is focused on the identification of new oil and gas applications for our products and the marketing of our products into various market segments of the oil and gas industry.
We manufacture and sell our products under one operating segment. A significant portion of our revenue is from outside of the United States. Sales in the United States represented 8%, 10%, and 7% of our net revenue for the fiscal years 2012, 2011, and 2010, respectively. Additional segment and geographical information regarding our net revenues is included in Note 13 to the consolidated financial statements in this Form 10-K.
Since many of the large EPC firms that specialize in large projects are located in the Mediterranean region, we have sales and technical staff based out of Madrid and Barcelona, Spain. A sales branch in Dubai, United Arab Emirates serves the Middle East, where many desalination plants and key EPC firms are located. We also have a sales office in Shanghai, China to address this emerging market for our energy recovery products. In the U.S., our sales office along with our corporate headquarters is located in San Leandro, California. As opportunities and diversification dictate, we will look to expand our geographical presence.
Manufacturing
We have a manufacturing facility in San Leandro, California, where our PX devices are produced, assembled, and tested. In late 2011, we integrated the manufacturing and testing of our turbochargers and pumps into our
- 7 -
manufacturing facility in San Leandro. Prior to the integration, we manufactured and tested our turbochargers and pumps at a manufacturing facility in New Boston, Michigan. We produce the majority of our ceramic components for our PX products in our in-house ceramics manufacturing facility. We complete machining and assemble in-house all ceramic components of our PX devices and many components of our turbochargers and pumps to protect the proprietary nature of our manufacturing methods and product designs and to maintain premium quality standards.
In connection with the integration of all production operations at our facility in San Leandro, California, we listed the facility in New Boston, Michigan for sale. We have not completed a sale as of December 2012, but we anticipate selling the property in 2013.
Research and Development
Design, quality, and innovation are key facets of our corporate culture. Our development efforts are focused on enhancing our existing energy recovery devices and pumps for the desalination market and advancing our know-how in fluid dynamics for use in other markets such as oil and gas. In the last several years our engineering work has led to the development of new product lines for applications both within the water desalination market as well as other fluid flow applications such as oil and gas. Research and development expense totaled $4.8 million in 2012, $3.5 million in 2011, and $3.9 million in 2010. We expect research and development costs to increase in the future as we continue to advance our existing technology and develop new energy recovery and efficiency-enhancing solutions for markets outside of seawater desalination.
Intellectual Property
We seek patent protection for new technologies, inventions, and improvements that are likely to be incorporated into our products. We rely on trade secret law and contractual safeguards to protect the proprietary tooling, processing techniques, and other know-how used in the production of our products.
We have nine U.S. patents and eighteen patents outside of the U.S. that are counterparts to U.S. patents. The U.S. patents expire between 2017 and 2028, and the corresponding international patents expire at various dates through 2028. Additionally, there are six pending U.S. patent applications and thirty-eight pending foreign applications corresponding to the U.S. patents and patent applications.
We have registered the following trademarks with the United States Patent and Trademark office: “ERI,” “PX,” “PX Pressure Exchanger,” “Pressure Exchanger,” the Energy Recovery logo, “ERI Energy Recovery, Inc.”, and “Making Desalination Affordable.” We have also applied for and received registrations in international trademark offices.
Employees
As of December 31, 2012, we had 116 employees: 43 in manufacturing; 29 in corporate services and management; 25 in sales, service, and marketing; and 19 in engineering and R&D. Thirteen of these employees were located outside of the United States. We also engage a relatively small number of independent contractors from time to time. We have not experienced any work stoppages, and our employees are not unionized.
- 8 -
|
·
|
Almost all of our revenue is derived from sales of energy recovery devices and pumps used in reverse osmosis desalination; a decline in demand for desalination or the reverse osmosis method of desalination will reduce demand for our products and will cause our sales and revenue to decline.
|
Products for the desalination market have historically accounted for a high percentage of our revenue. We expect that the revenue from these products will continue to account for most of our revenue in the foreseeable future. Any factors adversely affecting the demand for desalination, including changes in weather patterns, increased precipitation in areas of high human population density, new technology for producing fresh water, increased water conservation or reuse, political changes and unrest, changes in the global economy, or changes in industry or governmental regulations would reduce the demand for our energy recovery products and services and would cause a significant decline in our revenue. Similarly, any factors adversely affecting the demand for energy recovery products in reverse osmosis desalination, including new energy technology or reduced energy costs, new methods of desalination that reduce pressure and energy requirements, or improvements in membrane technology would reduce the demand for our energy recovery devices and would cause a significant decline in our revenue. Some of the factors that may affect sales of our energy recovery devices and pumps may be out of our control.
|
·
|
We depend on the construction of new desalination plants for revenue, and as a result, our operating results have experienced, and may continue to experience, significant variability due to volatility in capital spending, availability of project financing, and other factors affecting the water desalination industry.
|
We currently derive substantially all of our revenue from sales of products and services used in desalination plants for municipalities, hotels, mobile containerized desalination solutions, resorts, and agricultural operations in dry or drought-ridden regions of the world. The demand for our products may decrease if the construction of desalination plants declines for political, economic, or other factors, especially in these regions. Other factors that could affect the number and capacity of desalination plants built or the timing of their completion include the availability of required engineering and design resources; a weak global economy; shortage in the supply of credit and other forms of financing; changes in government regulation, permitting requirements, or priorities; and reduced capital spending for desalination. Each of these factors could result in reduced or uneven demand for our products. Pronounced variability or delays in the construction of desalination plants or reductions in spending for desalination could negatively impact our sales and revenue and make it difficult for us to accurately forecast our future sales and revenue, which could lead to increased inventory and use of working capital.
|
·
|
Our revenue and growth depend upon the continued viability and growth of the seawater reverse osmosis desalination industry using current technology.
|
If there is a downturn in the seawater reverse osmosis desalination industry, our sales would be directly and adversely impacted. Changes in seawater reverse osmosis desalination technology could also reduce the demand for our devices. For example, a reduction in the operating pressure used in seawater reverse osmosis desalination plants could reduce the need for, and viability of, our energy recovery devices. Membrane manufacturers are actively working on low-pressure membranes for seawater reverse osmosis desalination that could potentially be used on a large scale to desalinate seawater at much lower pressures than is currently necessary.
Engineers are also evaluating the possibility of diluting seawater prior to reverse osmosis desalination to reduce the required membrane pressure. Similarly, an increase in the membrane recovery rate would reduce the number of energy recovery devices required and would reduce the demand for our product. A significant reduction in the cost of power may reduce demand for our product or favor a less expensive product from a competitor.
Any of these changes would adversely impact our revenue and growth. Water shortages and demand for desalination can also be adversely affected by water conservation and water reuse initiatives.
|
·
|
New planned seawater reverse osmosis projects can be cancelled and/or delayed, and cancellations and/or delays may negatively impact our revenue.
|
Planned seawater reverse osmosis desalination projects can be cancelled or postponed due to delays in, or failure to obtain, approval, financing, or permitting for plant construction because of political factors, including political unrest in key desalination markets such as the Middle East; adverse and increasingly uncertain financial conditions; or other factors. Even though we may have a signed contract to provide a certain number of energy recovery devices by a certain date, shipments may be suspended or delayed at the request of customers. Such shipping delays
- 9 -
negatively impact our results of operations and revenue. As a result of these factors, we have experienced, and may in the future experience, significant variability in our revenue on both an annual and a quarterly basis.
|
·
|
We rely on a limited number of engineering, procurement, and construction firms for a large portion of our revenue. If these customers delay or cancel their commitments, do not purchase our products in connection with future projects, or are unable to attract and retain sufficient qualified engineers to support their growth, our revenue could significantly decrease, which would adversely affect our financial condition and future growth.
|
There are a limited number of large engineering, procurement, and construction firms in the desalination industry, and these customers account for a substantial portion of our net revenue. One or more of these customers represent 10% or more of our total revenue each year, and the customers in this category vary from year to year. Since, in most cases, we do not have long-term contracts with these large customers, but rather sell to them on a purchase order or project basis, these orders may be postponed or delayed on short or no notice. If any of these customers reduces or delays its purchases, cancels a project, decides not to specify our products for future projects, fails to attract and retain qualified engineers and other staff, fails to pay amounts due to us, experiences financial difficulties, or experiences reduced demand for its services, we may not be able to replace that lost business and our projected revenue may significantly decrease, which will adversely affect our financial condition and future growth.
|
·
|
We face competition from a number of companies that offer competing energy recovery and pump solutions. If any one of these companies produces superior technology or offers more cost-effective products, our competitive position in the market could be harmed and our profits may decline.
|
The market for energy recovery devices and pumps for desalination plants is competitive and evolving. We expect competition, especially competition on price and warranty terms, to persist and intensify as the
desalination market grows and new competitors enter the market. Some of our current and potential competitors may have significantly greater financial, technical, marketing, and other resources; longer operating histories; or greater name recognition. They may also be able to devote greater resources to the development, promotion, sale, and support of their products and respond more quickly to new technologies. These companies may also have more extensive customer bases, broader customer relationships across product lines, or long-standing or exclusive relationships with our current or potential customers. They may also have more extensive products and product lines that would enable them to offer multi-product or packaged solutions as well as competing products at lower prices or with other more favorable terms and conditions. As a result, our ability to sustain our market share may be adversely impacted, which would affect our business, operating results, and financial condition. In addition, if another one of our competitors were to merge or partner with another company, the change in the competitive landscape could adversely affect our continuing ability to compete effectively.
|
·
|
Global economic conditions could have an adverse effect on our business and results of operations.
|
Global economic conditions may negatively impact our business and make forecasting future operating results more difficult and uncertain. A weak global economy may cause our customers to delay product orders or shipments, or delay or cancel planned or new desalination projects, including retrofits, which would reduce our revenue. Turmoil in the financial and credit markets may also make it difficult for our customers to obtain needed project financing, resulting in lower sales. Negative economic conditions may also affect our suppliers, which could impede their ability to remain in business and supply us with parts, resulting in delays in the availability or shipment of our products. In addition, cash, cash equivalents, and short- and long-term investments that we may hold from time to time are typically invested in certificates of deposit, money market funds, government obligations, corporate obligations, and other securities summarized in the notes to the consolidated financial statements included in this report. Given the currently weak global economy, the potential instability of domestic and foreign financial institutions, and external risks such as European sovereign debt problems, we cannot be assured that we will not experience losses on our investments, which would adversely affect our financial condition. If current economic conditions persist or worsen and negatively impact the desalination industry, our business, financial condition, or results of operations could be materially and adversely affected.
|
·
|
Part of our inventory may be written off, which would increase our cost of revenues. In addition, we may be exposed to inventory-related losses on inventories purchased by our contract manufacturers.
|
Inventory of raw materials, parts, components, work in-process, or finished products may accumulate, and we may encounter losses due to a variety of factors, including:
- 10 -
|
•
|
technological change in the desalination and oil and gas industries that result in product changes;
|
|
•
|
long delays in shipment of our products or order cancellations;
|
|
•
|
our need to order raw materials that have long lead times and our inability to estimate exact amounts and types of items thus needed, especially with regard to the configuration of our high-efficiency pumps; and
|
|
•
|
cost reduction initiatives resulting in component changes within the products.
|
In addition, we may from time to time purchase more inventory than is immediately required in order to shorten our delivery time in case of an increase in demand for our products. If we are unable to forecast demand for our products with any degree of certainty and our actual orders from our customers are lower than these forecasts, we may accumulate excess inventory that we may be required to write off. If we are forced to write off this inventory, our business, financial condition, and results of operations could be adversely affected.
|
·
|
Our operating results may fluctuate significantly, making our future operating results difficult to predict and could cause our operating results to fall below expectations or guidance.
|
Our operating results may fluctuate due to a variety of factors, many of which are outside of our control. Since a single order for our energy recovery devices may represent substantial revenue, we have experienced significant fluctuations in revenue from quarter to quarter and year to year, and we expect such fluctuations to continue. As a result, comparing our operating results on a period-to-period basis may not be meaningful. You should not rely on our past results as an indication of our future performance. If our revenue or operating results fall below the expectations of investors or securities analysts or below any guidance we may provide to the market, the price of our common stock would likely decline.
In some past years, customer buying patterns led to a significant portion of our sales occurring in the fourth quarter, with the risk that delays, cancellations, or other adverse events in the fourth quarter had a substantial negative impact on annual results. More recently, our results have fluctuated or decreased due to adverse timing of larger orders during the year, the effects of a global decline in new desalination plant construction stemming from global economic and financial pressures, and competition. It is difficult for us to anticipate our future results, and our stock price may be adversely affected by the risks discussed in this paragraph.
|
·
|
If we are unable to collect unbilled receivables, our operating results will be adversely affected.
|
Our contracts with large engineering, procurement, and construction firms generally contain holdback provisions that delay final installment payments by up to 24 months after the product has been shipped and revenue has been recognized. Typically, between 10% and 20%, and in some instances up to 30%, of the revenue we recognize pursuant to our customer contracts is subject to such holdback provisions and is accounted for as unbilled receivables until we deliver invoices for payment. Such holdbacks can result in relatively high current and non-current unbilled receivables. If we are unable to invoice and collect these performance holdbacks or if our customers fail to make these payments when due under the sales contracts, our results of operations will be adversely affected.
|
·
|
If we lose key personnel upon whom we are dependent, we may not be able to execute our strategies. Our ability to increase our revenue will depend on hiring highly skilled professionals with industry-specific experience, particularly given the unique and complex nature of our devices.
|
Given the specialized nature of our business, we must hire highly skilled professionals for certain positions with industry-specific experience. Given the nature of the reverse osmosis desalination industry, the number of qualified candidates for certain positions is limited. Our ability to grow depends on recruiting and retaining skilled employees with relevant experience, competing with larger, often better known companies, and offering competitive total compensation packages. Our failure to retain existing or attract future talented and experienced key personnel could harm our business.
|
·
|
Our future success depends on our ability to diversify into new markets outside of desalination while continuing to market, enhance, and scale existing desalination products.
|
We believe that developing new products for applications outside of desalination is a necessary strategy to accelerate future growth in our business as we continue to market, enhance, and scale existing desalination products.
- 11 -
While new or enhanced products and services have the potential to meet specified needs of new or existing markets, pricing may not meet customer expectations, and our products may not compete favorably with products and services of current or potential competitors. New products may be delayed or cancelled if they do not meet specifications, performance requirements, or quality standards, or perform as expected in a production environment. Product designs also may not scale as expected. We may have difficulty finding new markets for our existing technologies or developing or acquiring new products for new markets. Customers may not accept or be slow to adopt new products and services, and potential new markets may be too costly to penetrate. In addition, we may not be
able to offer our products and services that meet customer expectations without decreasing our prices and eroding our margins. We may also have difficulty executing plans to break into new markets, expanding our operations to successfully manufacture new products, or scaling our operations to accommodate increased business. If we are unable to develop competitive new products, open new markets, and scale our business to support increased sales and new markets, our business and results of operations will be adversely affected.
We have hired and promoted individuals to new executive positions and undertaken other activities to pursue new markets beyond desalination. We may incur significant personnel and development expenses in these efforts without assurance as to when or if new products will contribute to revenue or be profitable.
|
·
|
Our diversification into different fluid flow markets such as oil & gas may not materialize according to our expectations.
|
We have made a substantial investment in research, development, and marketing to execute on our diversification strategy into fluid flow markets such as oil and gas. While we see diversification as core to our growth strategy, there is no guarantee that we will be successful in our efforts. Our model for growth is based on our ability to initiate and embrace disruptive technology trends, to enter new markets, both in terms of geographies and product areas, and to drive broad adoption of the products and services that we develop and market. While we believe that our products will, for example, enable gas processing plant operators to operate at a high level of energy efficiency with minimal downtime, we may be subject to claims if customers of these offerings experience significant downtimes or failures for which our warranty reserves may be inadequate given the lack of historical failure rates associated with new product introductions. We also could be subject to damage claims based on our products against which we may not be able to properly insure. In addition, profitability, if any, in oil and gas may be lower than in our desalination market, and we may not be sufficiently successful in our diversification efforts to recoup investments. If any of this were to occur, it could damage our reputation, limit our growth, and negatively affect our operating results.
|
·
|
Our manufacture of ceramic components may prove to be more costly or less reliable than outsourcing
.
|
We previously outsourced the production of our ceramic components to a limited number of ceramic vendors. In 2011, to diversify our supply of ceramics, ensure the availability of a reliable source of quality ceramic components, and retain more control over our intellectual property, we validated the internal production capability of our own ceramics plant at our headquarters in San Leandro, California to manufacture the ceramic components used in
PX
®
devices. We also completed in 2011 the closure of our manufacturing plant in Michigan and integration of all production operations in San Leandro. We believe that internal production capacity at one location reduces costs, improves efficiencies and quality, and enhances research and development efforts.
If we are not efficient at producing our ceramic components or do not achieve required yields that are equal to or greater than the vendors to which we previously outsourced, then our cost of manufacturing may be adversely affected. If we do not meet internal production requirements of our ceramics parts or manufacture these parts cost-effectively and/or if for any reason we do not purchase sufficient raw materials on a timely basis, we may be exposed to capacity shortages, and our business and financial results, including our cost of revenue and margins, may be adversely affected.
|
·
|
The durable nature of our
PX
energy recovery devices may reduce or delay potential aftermarket revenue opportunities.
|
Our
PX energy recovery
devices utilize ceramic components that have to date demonstrated high durability, high corrosion resistance, and long life in seawater reverse osmosis desalination applications. Because most of our
PX
devices have been installed for a limited number of years, it is difficult to accurately predict their performance or endurance over a longer period of time. In the event that our products are more durable than expected, our opportunity for aftermarket revenue may be deferred.
- 12 -
|
·
|
Our sales cycle can be long and unpredictable, and our sales efforts require considerable time and expense. As a result, our sales are difficult to predict and may vary substantially from quarter to quarter, which may cause our operating results to fluctuate.
|
Our sales efforts involve substantial education of our current and prospective customers about the use and benefits of our energy recovery products. This education process can be time-consuming and typically involves a significant product evaluation process. While the sales cycle for our OEM customers, which are involved with smaller desalination plants, averages one to three months, the average sales cycle for our international engineering, procurement, and construction firm customers, which are involved with larger desalination plants, ranges from nine to 16 months and has, in some cases, extended up to 24 months. This long sales cycle makes quarter-by-quarter revenue predictions difficult and results in our investing significant resources well in advance of orders for our products.
|
·
|
We depend on a limited number of suppliers for some of our components. If our suppliers are not able to meet our demand and/or requirements, our business could be harmed.
|
We rely on a limited number of suppliers for vessel housings, stainless steel castings, and alumina powder for our
PX energy recovery
devices and castings for our turbochargers and pumps. Our reliance on a limited number of manufacturers for these supplies involves a number of risks, including reduced control over delivery schedules, quality assurance, manufacturing yields, production costs, and lack of guaranteed production capacity or product supply. In most cases, we do not have long-term supply agreements with these suppliers and instead secure these supplies on a purchase order basis. Our suppliers have no obligation to supply products to us for any specific period, in any specific quantity, or at any specific price, except as set forth in a particular purchase order. Our requirements represent a small portion of the total production capacities of these suppliers, and our suppliers may reallocate capacity to other customers, even during periods of high demand for our products. We have in the past experienced, and may in the future experience, quality control issues and delivery delays with our suppliers due to factors such as high industry demand or the inability of our vendors to consistently meet our quality or delivery requirements. If our suppliers were to cancel or materially change their commitments to us or fail to meet quality or delivery requirements needed to satisfy customer orders for our products, we could lose time-sensitive customer orders, be unable to develop or sell our products cost-effectively or on a timely basis, if at all, and have significantly decreased revenue, which would harm our business, operating results, and financial condition. We may qualify additional suppliers in the future, which would require time and resources. If we do not qualify additional suppliers, we may be exposed to increased risk of capacity shortages due to our dependence on current suppliers.
|
·
|
We are subject to risks related to product defects, which could lead to warranty claims in excess of our warranty provision or result in a significant or a large number of warranty or other claims in any given year.
|
We have historically provided a warranty for certain products for a period of one to two years and provided up to a six-year warranty for the ceramic components of our
PX
-branded products. We test our products in our manufacturing facilities through a variety of means; however, there can be no assurance that our testing will reveal latent defects in our products, which may not become apparent until after the products have been sold into the market, or will replicate the harsh, corrosive, and varied conditions of the desalination and other plants in which they are installed. In addition, certain components of our turbochargers and pumps are custom-made and may not scale or perform as required in production environments. Accordingly, there is a risk that we may have significant warranty claims or breach supply agreements due to product defects. We may incur additional cost of revenue if our warranty provisions do not reflect the actual cost of resolving issues related to defects in our products. If these additional expenses are significant, they could adversely affect our business, financial condition, and results of operations.
|
·
|
If we are unable to protect our technology or enforce our intellectual property rights, our competitive position could be harmed, and we could be required to incur significant expenses to enforce our rights.
|
Our competitive position depends on our ability to establish and maintain proprietary rights in our technology and to protect our technology from copying by others. We rely on trade secret, patent, copyright, and trademark laws, as well as confidentiality agreements with employees and third parties, all of which may offer only limited protection. We hold a limited number of U.S. patents and patents outside the U.S. that are counterparts to several of the U.S. patents, and when their terms expire, we could become more vulnerable to increased competition. The protection of our intellectual property in some countries may be limited. We also do not know whether any of our pending patent applications will result in the issuance of patents or whether the examination process will require us to narrow our claims, and even if patents are issued, they may be contested, circumvented, or invalidated. Moreover, while we
- 13 -
believe our remaining issued patents are essential to the protection of our technology, the rights granted under any of our issued patents or patents that may be issued in the future may not provide us with proprietary protection or competitive advantages, and as with any technology, competitors may be able to develop similar or superior technologies now or in the future. In addition, our granted patents may not prevent misappropriation of our technology, particularly in foreign countries where intellectual property laws may not protect our proprietary rights as fully as those in the United States. This may render our patents impaired or useless and ultimately expose us to currently unanticipated competition. Protecting against the unauthorized use of our products, trademarks, and other proprietary rights is expensive, difficult, and in some cases, impossible. Litigation may be necessary in the future to enforce or defend our intellectual property rights or to determine the validity and scope of the proprietary rights of others. Intellectual property litigation could result in substantial costs and diversion of management resources, either of which could harm our business.
|
·
|
Claims by others that we infringe their proprietary rights could harm our business.
|
Third parties could claim that our technology infringes their intellectual property rights. In addition, we or our customers may be contacted by third parties suggesting that we obtain a license to certain of their intellectual property rights that they may believe we are infringing. We expect that infringement claims against us may increase as the number of products and competitors in our market increases and overlaps occur. In addition, to the extent that we gain greater visibility, we believe that we will face a higher risk of being the subject of intellectual property infringement claims. Any claim of infringement by a third party, even those without merit, could cause us to incur substantial costs defending against the claim and could distract management from our business. Furthermore, a party making such a claim, if successful, could secure a judgment that requires us to pay substantial damages. A judgment against us could also include an injunction or other court order that could prevent us from offering our products. In addition, we might be required to seek a license for the use of such intellectual property, which may not be available on commercially reasonable terms, or at all. Alternatively, we may be required to develop non-infringing technology, which could require significant effort and expense and may ultimately not be successful. Any of these events could seriously harm our business. Third parties may also assert infringement claims against our customers. Because we generally indemnify our customers if our products infringe the proprietary rights of third parties, any such claims would require us to initiate or defend protracted and costly litigation on their behalf in one or more jurisdictions, regardless of the merits of these claims. If any of these claims succeed, we may be forced to pay damages on behalf of our customers.
|
·
|
We are currently involved in legal proceedings, and may be subject to additional future legal proceedings, that may result in material adverse outcomes.
|
In addition to intellectual property litigation risks discussed above, we are presently involved, and may become involved in the future, in various commercial and other disputes as well as related claims and legal proceedings that arise from time to time in the course of our business. We believe that we have substantial defenses in the matters currently pending; however, the process of settling or litigating claims is subject to uncertainties, and our views of these matters may change in the future. We could in the future incur judgments or enter into settlements of claims that could have a material adverse effect on our results of operations and financial condition.
|
·
|
Our business entails significant costs that are fixed or difficult to reduce in the short term while demand for our products is variable and subject to downturns, which may adversely affect our operating results.
|
Our business requires investments in facilities, equipment, R&D, and training that are either fixed or difficult to reduce or scale in the short term. At the same time, the market for our products is variable and has experienced downturns due to factors such as economic recessions, increased precipitation, uncertain global financial markets, and political changes, many of which are outside of our control. During periods of reduced product demand, we may experience higher relative costs and excess manufacturing capacity, resulting in high overhead and lower gross profit margins while causing
cash flow and profitability to decline. Similarly, although we believe that our existing manufacturing facilities are capable of meeting current demand and demand for the foreseeable future, the continued success of our business depends on our ability to expand our manufacturing, research and development, and testing facilities to meet market needs. If we are unable to respond timely to an increase in demand, our revenue, gross profit margin, cash flow, and net income may be adversely affected.
|
·
|
If we need additional capital to fund future growth, it may not be available on favorable terms, or at all.
|
We have historically relied on outside financing to fund our operations, capital expenditures, and expansion. In our initial public offering in July 2008, we issued approximately 10,000,000 shares of common stock at $8.50 per share
- 14 -
before underwriting discounts and issuing expenses. We may require additional capital from equity or debt financing in the future to fund our operations or respond to competitive pressures or strategic opportunities. We may not be able to secure such additional financing on favorable terms or at all. The terms of additional financing may place limits on our financial and operating flexibility. If we raise additional funds through further issuances of equity, convertible debt securities, or other securities convertible into equity, our existing stockholders could suffer significant dilution in their percentage ownership of our company, and any new securities that we issue could have rights, preferences, or privileges senior to those of existing or future holders of our common stock. If we are unable to obtain necessary financing on terms satisfactory to us, if and when we require it, our ability to grow or support our business and to respond to business challenges or opportunities could be significantly limited.
|
·
|
If foreign and local government entities no longer guarantee and subsidize, or are willing to engage in, the construction and maintenance of desalination plants and projects, the demand for our products would decline and adversely affect our business.
|
Our products are used in seawater reverse osmosis desalination plants, which are often constructed and maintained with local, regional, or national government guarantees and subsidies, including tax-free bonds. The rate of construction of desalination plants depends on each governing entity's willingness and ability to obtain and allocate funds for such projects, which may be affected by the currently fragile global financial system and credit market. In addition, some desalination projects in the Middle East and North Africa have been funded by budget surpluses resulting from high crude oil and natural gas prices. Since prices for crude oil and natural gas vary, governments in those countries may not have the necessary funding for such projects and may cancel the projects or divert funds allocated for them to other projects. Political unrest, coups, or changes in government administrations, such as recent political changes and unrest in the Middle East, may result in policy or priority changes that may also cause governments to cancel, delay, or re-contract planned or ongoing projects. Government embargoes may also prohibit sales into certain countries. As a result, the demand for our products could decline and negatively affect our revenue base, our overall profitability, and the pace of our expected growth.
|
·
|
Our products are highly technical and may contain undetected flaws or defects that could harm our business and our reputation and adversely affect our financial condition.
|
The manufacture of our products is highly technical and some designs and components of our turbochargers and pumps are custom-made. Our products may contain latent defects or flaws. We test our products prior to commercial release, and during such testing have discovered, and may in the future discover, flaws and defects that need to be resolved prior to release. Resolving these flaws and defects can take a significant amount of time and prevent our technical personnel from working on other important tasks. In addition, our products have contained, and may in the future contain, one or more flaws that were not detected prior to commercial release to our customers. Some flaws in our products may only be discovered after a product has been installed and used by customers. Any flaws or defects discovered in our products after commercial release could result in loss of revenue or delay in revenue recognition, loss of customers, and increased service and warranty costs, any of which could adversely affect our business, operating results, and
financial condition. In addition, we could face claims for product liability, tort, or breach of warranty. Our contracts with our customers contain provisions relating to warranty disclaimers and liability limitations, which may not be upheld or, for reasons of good long-term customer relations, we may not be willing to enforce. Defending a lawsuit, regardless of its merit, is costly and may divert management's attention and adversely affect the market's perception of us and our products. In addition, if our business liability insurance coverage proves inadequate or future coverage is unavailable on acceptable terms or at all, our business, operating results, and financial condition could be harmed.
|
·
|
Our international sales and operations subject us to additional risks that may adversely affect our operating results.
|
Historically, we have derived a significant portion of our revenue from customers whose seawater reverse osmosis desalination facilities are outside of the United States. Many of these projects are located in emerging growth countries with relatively young or unstable market economies or changing political environments. These countries may be affected significantly by global economic conditions and the liquidity of credit markets. We also rely on sales and technical support personnel stationed in Europe, Asia, and the Middle East, and we expect to continue to add personnel in other countries. Governmental changes; political unrest or reforms; or changes in the business, regulatory, or political environments of the countries in which we sell our products or have staff could have a material adverse effect on our business, financial condition, and results of operations.
- 15 -
Sales of our products have to date been denominated principally in U.S. Dollars. If the U.S. Dollar strengthens against most other currencies, it will effectively increase the price of our products in the currency of the countries in which our customers are located. This may result in our customers seeking lower-priced suppliers, which could adversely impact our revenue, margins, and operating results. A larger portion of our international revenue may be denominated in foreign currencies in the future, which would subject us to increased risks associated with fluctuations in foreign exchange rates.
Our international contracts and operations subject us to a variety of additional risks, including:
|
•
|
political and economic uncertainties;
|
|
•
|
uncertainties related to the application of local contract and other laws, including reduced protection for intellectual property rights;
|
|
•
|
trade barriers and other regulatory or contractual limitations on our ability to sell and service our products in certain foreign markets;
|
|
•
|
difficulties in enforcing contracts, beginning operations as scheduled, and collecting accounts receivable, especially in emerging markets;
|
|
•
|
increased travel, infrastructure, and legal compliance costs associated with multiple international locations;
|
|
•
|
competing with non-U.S. companies that are not subject to the U.S. Foreign Corrupt Practices Act;
|
|
•
|
difficulty in attracting, hiring, and retaining qualified personnel; and
|
|
•
|
instability in the capital markets and banking systems worldwide, especially in developing countries, which may limit the availability of project financing for the construction of desalination plants.
|
As we continue to expand our business globally, our success will depend, in large part, on our ability to anticipate and effectively manage these and other risks associated with our international operations. Our failure to manage any of these risks successfully could harm our international operations and reduce our international sales, which in turn could adversely affect our business, operating results, and financial condition.
|
·
|
If we fail to manage future growth effectively, our business would be harmed.
|
Future growth in our business, if it occurs, will place significant demands on our management, infrastructure, and other resources. To manage any future growth, we will need to hire, integrate, and retain highly skilled and motivated employees. We will also need to continue to improve our financial and management controls, reporting and operating systems, and procedures. If we do not effectively manage our growth, our business, operating results, and financial condition would be adversely affected.
|
·
|
Our failure to achieve or maintain adequate internal control over financial reporting in accordance with SEC rules or prevent or detect material misstatements in our annual or interim consolidated financial statements in the future could materially harm our business and cause our stock price to decline.
|
As a public company, SEC rules require that we maintain internal control over financial reporting to provide reasonable assurance regarding the reliability of financial reporting and preparation of published financial statements in accordance with generally accepted accounting principles, or GAAP, in the United States. Accordingly, we are required to document and test our internal controls and procedures to assess the effectiveness of our internal control over financial reporting. In addition, our independent registered public accounting firm is required to report on the effectiveness of our internal control over financial reporting. In the future, we may identify material weaknesses and deficiencies that we may not be able to remediate in a timely manner. If there are material weaknesses or deficiencies in our internal control, we will not be able to conclude that we have maintained effective internal control over financial reporting, or our independent registered public accounting firm may not be able to issue an unqualified report on the effectiveness of our internal control over financial reporting. As a result, our ability to report our financial results on a timely and accurate basis may be adversely affected, and investors may lose confidence in our financial information, which in turn could cause the market price of our common stock to decrease. We may also be required to restate our financial statements from prior periods. In addition, testing and maintaining internal control will require increased management time and resources. Any failure to maintain effective internal control over financial reporting could impair the success of our business and harm our financial results, and an investor could lose all or a significant portion of his/her investment. If we have material weaknesses in our internal control over financial reporting, the accuracy and timing of our financial reporting may be adversely affected.
- 16 -
|
·
|
Changes to financial accounting standards may affect our results of operations and cause us to change our business practices.
|
We prepare our financial statements to conform to U.S. GAAP. These accounting principles are subject to interpretation by the SEC and various other bodies. A change in these policies can have a significant effect on our reported results and may affect our reporting of transactions completed before a change is announced. Changes to these rules or the interpretation of our current practices may adversely affect our reported financial results or the manner in which we conduct our business.
|
·
|
Our past acquisition and future acquisitions could disrupt our business, impact our margins, cause dilution to our stockholders, or harm our financial condition and operating results.
|
We acquired privately-held Pump Engineering, LLC in late 2009, and in the future, we may invest in other companies, technologies, or assets. We may not realize the expected benefits from our past or future acquisitions. We may not be able to find other suitable acquisition candidates, and we may not be able to complete acquisitions on favorable terms, if at all. If we do complete acquisitions, we cannot ensure that they will ultimately strengthen our competitive or financial position or that they will not be viewed negatively by customers, financial markets, investors, or the media. Acquisitions could also result in shareholder dilution or significant acquisition-related charges for restructuring, share-based compensation, and the amortization of purchased technology and intangible assets. Expenses resulting from impairment of acquired goodwill, intangible assets, and purchased technology could also increase over time if the fair value of those assets decreases. A future change in our market conditions, a downturn in our business, or a long-term
decline in the quoted market price of our stock may result in a reduction of the fair value of acquisition-related assets. Any such impairment of goodwill or intangible assets could harm our operating results and financial condition. In addition, when we make an acquisition, we may have to assume some or all of that entity's liabilities, which may include liabilities that are not fully known at the time of the acquisition. Future acquisitions may reduce our cash available for operations and other uses. If we continue to make acquisitions, we may require additional cash or use shares of our common stock as payment, which would cause dilution to our existing stockholders.
Acquisitions entail a number of risks that could harm our ability to achieve their anticipated benefits. We could have difficulties integrating and retaining key management and other personnel, aligning product plans and sales strategies, coordinating research and development efforts, supporting customer relationships, aligning operations, and integrating accounting, order processing, purchasing, and other support services. Since acquired companies have different accounting and other operational practices, we may have difficulty harmonizing order processing, accounting, billing, resource management, information technology, and other systems company-wide. We may also have to invest more than anticipated in product or process improvements. Especially with acquisitions of privately-held or non-U.S. companies, we may face challenges developing and maintaining internal controls consistent with the requirements of the Sarbanes-Oxley Act and U.S. public accounting standards. Acquisitions may also disrupt our ongoing operations, divert management from day-to-day responsibilities, and disrupt other strategic, research and development, marketing, or sales efforts. Geographic and time zone differences and disparate corporate cultures may increase the difficulties and risks of an acquisition. If integration of our acquired businesses or assets is not successful or disrupts our ongoing operations, acquisitions may increase our expenses, harm our competitive position, adversely impact our operating results and financial condition, and fail to achieve anticipated revenue, cost, competitive, or other objectives.
|
·
|
Insiders and principal stockholders will likely have significant influence over matters requiring stockholder approval.
|
Our directors, executive officers, and other principal stockholders beneficially own, in the aggregate, a substantial amount of our outstanding common stock. Although they do not have majority control of the outstanding stock, these stockholders will likely have significant influence over all matters requiring stockholder approval, including the election of directors and approval of significant corporate transactions such as a merger or other sale of our company or its assets.
|
·
|
Anti-takeover provisions in our charter documents and under Delaware law could discourage, delay, or prevent a change in control of our company and may affect the trading price of our common stock.
|
Provisions in our amended and restated certificate of incorporation and bylaws may have the effect of delaying or
- 17 -
preventing a change of control or changes in our management. Our amended and restated certificate of incorporation and amended and restated bylaws include provisions that:
|
•
|
authorize our Board of Directors to issue, without further action by the stockholders, up to 10,000,000 shares of undesignated preferred stock;
|
|
•
|
require that any action to be taken by our stockholders be effected at a duly called annual or special meeting and not by written consent;
|
|
•
|
specify that special meetings of our stockholders can be called only by our Board of Directors, the chairman of the board, the chief executive officer, or the president;
|
|
•
|
establish an advance notice procedure for stockholder approvals to be brought before an annual meeting of our stockholders, including proposed nominations of persons for election to our Board of Directors;
|
|
•
|
establish that our Board of Directors is divided into three classes, Class I, Class II, and Class III, with each class serving staggered terms;
|
|
•
|
provide that our directors may be removed only for cause;
|
|
•
|
provide that vacancies on our Board of Directors may be filled only by a majority vote of directors then in office, even though less than a quorum;
|
|
•
|
specify that no stockholder is permitted to cumulate votes at any election of directors; and
|
|
•
|
require a super-majority of votes to amend certain of the above mentioned provisions.
|
In addition, we are subject to the provisions of Section 203 of the Delaware General Corporation Law regulating corporate takeovers. Section 203 generally prohibits us from engaging in a business combination with an interested stockholder subject to certain exceptions.
|
·
|
We may experience difficulties implementing our enterprise resource planning system.
|
We have initiated a project to upgrade our enterprise resource planning (“ERP”) system to streamline our business processes and allow for cost-efficient scalability, flexibility, and improved management reporting and analysis. Further, we anticipate that our new ERP system, once implemented, will accommodate our future needs as we continue to evolve our business in a changing marketplace. Our new ERP system will be critical to our ability to accurately maintain books and records, record transactions, provide important information to our management, and prepare our financial statements. The design and implementation of the new ERP system has required, and will continue to require, the investment of significant financial and human resources. The total cost needed to implement the new ERP system may turn out to be more than we currently anticipate. In addition, we may not be able to successfully implement the new ERP system without experiencing difficulties, nor can we guarantee that the new ERP system will support our business operations after the system goes live. Any disruptions, delays, or deficiencies in the design and implementation of the new ERP system could adversely affect our ability to process orders, ship products, provide services and customer support, send invoices and track payments, fulfill contractual obligations, or otherwise operate our business, which could, in turn, adversely affect our results of operations, financial condition, and cash flows as well as our internal controls over financial reporting.
|
·
|
New regulations related to conflict minerals could adversely impact our business.
|
The Dodd-Frank Wall Street Reform and Consumer Protection Act contains provisions to improve transparency and accountability concerning the supply of certain minerals, known as conflict minerals, originating from the Democratic Republic of Congo (DRC) and adjoining countries. As a result, in August 2012, the SEC adopted annual disclosure and reporting requirements for those companies who use conflict minerals mined from the DRC and adjoining countries in their products. These new requirements will require due diligence efforts in 2013, with initial disclosure requirements beginning in May of 2014. There will be costs associated with complying with these disclosure requirements, including for diligence to determine the sources of conflict minerals used in our products and other potential changes to products, processes or sources of supply as a consequence of such verification activities. The implementation of these rules could adversely affect the sourcing, supply, and pricing of materials used in our products. As there may be only a limited number of suppliers offering ”conflict free” minerals, we cannot be sure that we will be able to obtain necessary materials from such suppliers in sufficient quantities or at competitive prices. Also, we may face reputational challenges if we determine that certain of our products contain minerals not determined to be conflict-free or if we are unable to sufficiently verify the origins for all conflict minerals used in our products through the procedures we may implement.
- 18 -
None
We lease approximately 170,000 square feet of space in San Leandro, California for product manufacturing, R&D, and executive headquarters under a lease that expires in November of 2019. We believe that this facility will be adequate for our purposes for the foreseeable future. Additionally, we lease sales offices in Madrid, Spain; Dubai, United Arab Emirates; and Shanghai, Peoples Republic of China. We own a manufacturing building in New Boston, Michigan, which is not in use, as it was listed for sale in connection with our restructuring plan to consolidate our production operations in California.
See Note 9 — C
ommitments and Contingencies
to the consolidated financial statements in Item 8 of this report, under the heading “
Litigation,
” for a description of two lawsuits pending against us.
Not applicable.
- 19 -
Market Information
Since July 2, 2008, our common stock has been quoted on the NASDAQ Global Select Market under the symbol “ERII”.
The following table sets forth the high and low sales prices of our common stock for the periods indicated.
|
High
|
Low
|
|||||||
|
2011
|
||||||||
|
First Quarter
|
$ | 4.36 | $ | 2.88 | ||||
|
Second Quarter
|
$ | 3.40 | $ | 2.35 | ||||
|
Third Quarter
|
$ | 3.30 | $ | 2.09 | ||||
|
Fourth Quarter
|
$ | 3.50 | $ | 2.25 | ||||
|
2012
|
||||||||
|
First Quarter
|
$ | 2.70 | $ | 2.02 | ||||
|
Second Quarter
|
$ | 2.63 | $ | 1.95 | ||||
|
Third Quarter
|
$ | 2.98 | $ | 2.10 | ||||
|
Fourth Quarter
|
$ | 3.69 | $ | 2.40 | ||||
Stockholders
As of March 7, 2013, there were approximately 52 stockholders of record of our common stock as reported by our transfer agent, one of which is Cede & Co., a nominee for Depository Trust Company (DTC). All of the shares of common stock held by brokerage firms, banks, and other financial institutions as nominees for beneficial owners are deposited into participant accounts at DTC and are therefore considered to be held of record by Cede & Co. as one stockholder.
Dividend Policy
We have never declared or paid any dividends on our common stock, and we do not currently intend to pay any dividends on our common stock for the foreseeable future. We expect to retain future earnings, if any, to fund the development and growth of our business. Any future determination to pay dividends on our common stock will be, subject to applicable law, at the discretion of our Board of Directors and will depend upon, among other factors, our results of operations, financial condition, capital requirements, and contractual restrictions in loan or other agreements.
Stock Performance Graph
The following graph shows the cumulative total shareholder return of an investment of $100 on July 2, 2008 in (i) our common stock, (ii) common stock of a selected group of peer issuers (“Peer Group”), and (iii) the NASDAQ Composite Index on June 30, 2008. Cumulative total return assumes the reinvestment of dividends, although dividends have never been declared on our stock, and is based on the returns of the component companies weighted according to their capitalizations as of the end of each quarterly period. The NASDAQ Composite Index tracks the aggregate price performance of equity securities traded on the NASDAQ. The Peer Group tracks the weighted average price performance of equity securities of seven companies in our industry: Consolidated Water Co. Ltd.; Flowserve Corp.; Hyflux Ltd., Kurita Water Industries Ltd.; Pentair Inc.; Tetra Tech, Inc.; and The Gorman-Rupp Company. The return of each component issuer of the Peer Group is weighted according to the respective issuer’s stock market capitalization at the end of each period for which a return is indicated. Our stock price performance shown in the graph below is not indicative of future stock price performance.
The following graph and its related information is not “soliciting material,” is not deemed “filed” with the SEC, and is not to be incorporated by reference into any filing of the Company under the 1933 Securities Act or 1934 Securities Exchange Act, whether made before or after the date hereof and irrespective of any general incorporation language contained in such filing.
- 20 -
COMPARISON OF 54 MONTH CUMULATIVE TOTAL RETURN *
Among Energy Recovery Inc., The NASDAQ Composite Index,
And A Peer Group
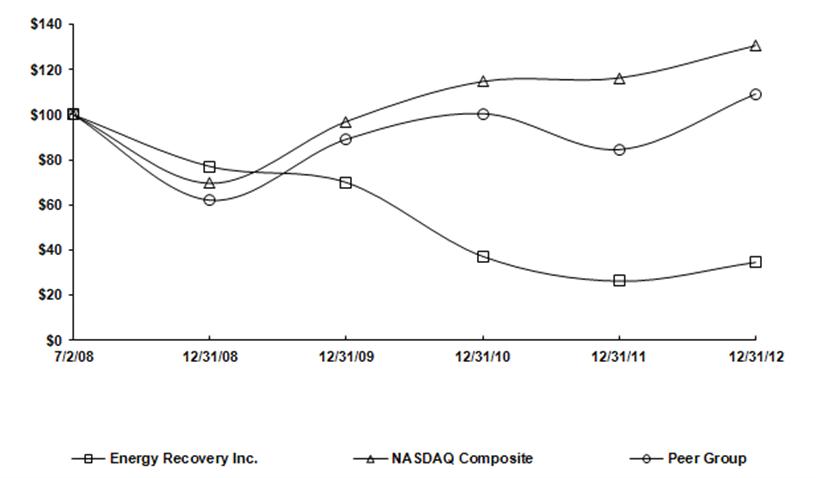
|
*
|
Graph represents the value of $100 invested on 7/2/08 in stock or 6/30/08 in index, including reinvestment of dividends as of the fiscal year ending December 31.
|
|
6/30/08 or
7/2/08(1)
|
12/31/08
|
12/31/09
|
12/31/10
|
12/31/11
|
12/31/12
|
|||||||||||||||||||
|
Energy Recovery, Inc.
|
100.00 | 77.11 | 69.99 | 37.23 | 26.25 | 34.59 | ||||||||||||||||||
|
NASDAQ Composite
|
100.00 | 69.63 | 97.01 | 114.78 | 116.33 | 130.66 | ||||||||||||||||||
|
Peer Group
|
100.00 | 62.14 | 89.14 | 100.52 | 84.60 | 109.24 | ||||||||||||||||||
|
(1)
|
The index measurement date is 6/30/08; stock measurement dates are 7/2/08
|
Sales of Unregistered Securities
During the fourth quarter of 2012, we did not issue or sell any unregistered securities.
Purchases of Equity Securities
During the fourth quarter of 2012, we did not repurchase any equity securities.
- 21 -
The following selected financial data should be read in conjunction with “Management’s Discussion and Analysis of Financial Condition and Results of Operations” and the financial statements and notes thereto included in this Report on Form 10-K.
|
|
Years Ended December 31,
|
|||||||||||||||||||
|
|
2012
|
2011
|
2010
|
2009
|
2008
|
|||||||||||||||
|
Consolidated Statement of Income Data:
|
||||||||||||||||||||
|
Net revenue
|
$ | 42,632 | $ | 28,047 | $ | 45,853 | $ | 47,014 | $ | 52,119 | ||||||||||
|
Cost of revenue
|
22,419 | 20,248 | 23,781 | 17,595 | 18,933 | |||||||||||||||
|
Gross profit
|
20,213 | 7,799 | 22,072 | 29,419 | 33,186 | |||||||||||||||
|
Operating expenses:
|
||||||||||||||||||||
|
General and administrative
|
15,146 | 16,745 | 14,471 | 13,515 | 11,291 | |||||||||||||||
|
Sales and marketing
|
7,290 | 7,997 | 8,205 | 6,472 | 6,549 | |||||||||||||||
|
Research and development
|
4,774 | 3,526 | 3,943 | 3,041 | 2,415 | |||||||||||||||
|
Amortization of intangible assets
|
1,042 | 1,360 | 2,624 | 241 | 30 | |||||||||||||||
|
Restructuring charges
|
369 | 3,294 | — | — | — | |||||||||||||||
|
Impairment of intangibles
|
1,020 | — | — | — | — | |||||||||||||||
|
Loss (gain) on fair value remeasurement
|
— | 171 | (2,147 | ) | — | — | ||||||||||||||
|
Proceeds from litigation settlement
|
(775 | ) | — | — | — | — | ||||||||||||||
|
Total operating expenses
|
28,866 | 33,093 | 27,096 | 23,269 | 20,285 | |||||||||||||||
|
(Loss) income from operations
|
(8,653 | ) | (25,294 | ) | (5,024 | ) | 6,150 | 12,901 | ||||||||||||
|
Other income (expense):
|
||||||||||||||||||||
|
Interest expense
|
(6 | ) | (34 | ) | (73 | ) | (46 | ) | (79 | ) | ||||||||||
|
Other non-operating income (expense), net
|
143 | 184 | (137 | ) | 54 | 873 | ||||||||||||||
|
(Loss) income before income taxes
|
(8,516 | ) | (25,144 | ) | (5,234 | ) | 6,158 | 13,695 | ||||||||||||
|
(Benefit from) provision for income taxes
|
(262 | ) | 1,299 | (1,626 | ) | 2,472 | 5,032 | |||||||||||||
|
Net (loss) income
|
$ | (8,254 | ) | $ | (26,443 | ) | $ | (3,608 | ) | $ | 3,686 | $ | 8,663 | |||||||
|
(Loss) earnings per share - basic
|
$ | (0.16 | ) | $ | (0.50 | ) | $ | (0.07 | ) | $ | 0.07 | $ | 0.19 | |||||||
|
(Loss) earnings per share - diluted
|
$ | (0.16 | ) | $ | (0.50 | ) | $ | (0.07 | ) | $ | 0.07 | $ | 0.18 | |||||||
|
Number of shares used in per share calculations:
|
||||||||||||||||||||
|
Basic
|
51,452 | 52,612 | 52,072 | 50,166 | 44,848 | |||||||||||||||
|
Diluted
|
51,452 | 52,612 | 52,072 | 52,644 | 47,392 | |||||||||||||||
|
|
As of December 31,
|
|||||||||||||||||||
|
|
2012
|
2011
|
2010
|
2009
|
2008
|
|||||||||||||||
|
Consolidated Balance Sheet Data:
|
||||||||||||||||||||
|
Cash and cash equivalents
|
$ | 16,642 | $ | 18,507 | $ | 55,338 | $ | 59,115 | $ | 79,287 | ||||||||||
|
Total assets
|
104,554 | 110,713 | 133,917 | 142,969 | 120,612 | |||||||||||||||
|
Long-term liabilities
|
4,317 | 3,880 | 2,770 | 4,505 | 420 | |||||||||||||||
|
Total liabilities
|
17,173 | 13,759 | 13,117 | 22,000 | 13,613 | |||||||||||||||
|
Total stockholders’ equity
|
87,381 | 96,954 | 120,800 | 120,969 | 106,999 | |||||||||||||||
- 22 -
The following Management Discussion and Analysis is intended to help the reader understand our results of operations and financial condition. It should be read in conjunction with our consolidated financial statements and related notes included in “Item 8. Financial Statements and Supplementary Data” in this Report.
We are in the business of designing, developing, and manufacturing energy recovery devices to harness the reusable energy from industrial fluid flows and pressure cycles. Our company was founded in 1992, and we introduced the initial version of our Pressure Exchanger
®
energy recovery device in early 1997. In December 2009, we acquired Pump Engineering, LLC, which manufactured centrifugal energy recovery devices, known as turbochargers, as well as high-pressure pumps.
Our energy recovery devices are primarily used in seawater reverse osmosis desalination. In 2011 and 2012, we invested significant research and development costs to expand into other pressurized fluid flow industries such as oil and gas.
A significant portion of our net revenue typically has been generated by sales to a limited number of large engineering, procurement, and construction, or EPC, firms, which are involved with the design and construction of larger desalination plants. Sales to these firms often involve a long sales cycle, which can range from nine to 16 months and, in some cases, up to 24 months. A single large desalination project can generate an order for numerous energy recovery devices and generally represents an opportunity for significant revenue. We also sell our devices to many small- to medium-sized original equipment manufacturers, or OEMs, which commission smaller desalination plants, order fewer energy recovery devices per plant, and have shorter sales cycles. In the oil and gas market, we currently have pilot devices installed and new devices pending installation for major oil and gas customers worldwide.
Due to the fact that a single order for our energy recovery devices by a large EPC firm for a particular plant may represent significant revenue, we often experience substantial fluctuations in net revenue from quarter to quarter and from year to year. In addition, historically our EPC customers tend to order a significant amount of equipment for delivery in the fourth quarter, and as a consequence, a significant portion of our annual sales typically occurs during that quarter. In 2010 and 2011, the fourth quarter revenues did not reflect as high of a percentage of the annual revenues as in past years due to the overall lower percentage of sales to engineering, procurement, and construction firms in 2011 and customer project delays in 2010. During the fourth quarter of 2012, five large mega-project shipments contributed to the significant increase in net revenue.
A limited number of our customers account for a substantial portion of our net revenue and accounts receivable. Revenue from customers representing 10% or more of total revenue varies from period to period. For the year ended December 31, 2012, one customer accounted for approximately 16% of our net revenue. For the year ended December 31, 2011, one customer accounted for approximately 14% of our net revenue. For the year ended December 31, 2010, two customers accounted for approximately 23% and 12% of our net revenue. No other customer accounted for more than 10% of our net revenue during any of these periods. See Note 14 —
“Concentrations”
in the notes to the consolidated financial statements for further customer concentration detail.
During the years ended December 31, 2012, 2011, and 2010, most of our net revenue was attributable to sales outside of the United States. We expect sales outside of the United States to remain a significant portion of our revenue for the foreseeable future.
Our revenue is principally derived from the sale of our energy recovery devices. We also derive revenue from the sale of our high-pressure and circulation pumps, which we manufacture and sell in connection with our energy recovery devices for use in desalination plants. We also receive incidental revenue from the sale of spare parts and services, including start-up and commissioning services that we provide for our customers. We have not recognized any revenue from shipments of energy recovery devices for oil and gas customers.
Critical Accounting Policies and Estimates
Our consolidated financial statements are prepared in accordance with generally accepted accounting principles in the United States, or GAAP. These accounting principles require us to make estimates and judgments that can affect the reported amounts of assets and liabilities as of the date of the consolidated financial statements as well as the reported amounts of revenue and expense during the periods presented. We believe that the estimates and
- 23 -
judgments upon which we rely are reasonable based upon information available to us at the time that we make these estimates and judgments. To the extent that there are material differences between these estimates and actual results, our consolidated financial results will be affected. The accounting policies that reflect our more significant estimates and judgments and which we believe are the most critical to aid in fully understanding and evaluating our reported financial results are revenue recognition, allowance for doubtful accounts, allowance for product warranty, valuation of stock options, valuation of goodwill and acquired intangible assets, useful lives for depreciation and amortization, valuation adjustments for excess and obsolete inventory, deferred taxes and valuation allowances on deferred tax assets, and evaluation and measurement of contingencies, including contingent consideration.
The following is not intended to be a comprehensive list of all of our accounting policies or estimates. Our significant accounting policies are more fully described in Note 2 —
Summary of Significant Accounting Policies,”
included in “Item 8. Financial Statements and Supplementary Data” in this Report.
Revenue Recognition
We recognize revenue when the earnings process is complete, as evidenced by an agreement with the customer, transfer of title, fixed pricing that is determinable, and collection that is reasonably assured. Transfer of title typically occurs upon shipment of the equipment pursuant to a written purchase order or contract. The portion of the sales agreement related to the field services and training for commissioning of our devices in a desalination plant is deferred until we have performed such services. We regularly evaluate our revenue arrangements to identify deliverables and to determine whether these deliverables are separable into multiple units of accounting. In January 2011, we adopted guidance issued by the Financial Accounting Standards Board (“FASB”) on revenue arrangements with multiple deliverables. In accordance with the guidance, when multiple elements exist in a sales agreement, we allocate revenue to all deliverables based on their relative selling prices. The new guidance provides a hierarchy to determine the selling price to be used for allocating revenue to deliverables: (i) vendor-specific objective evidence (“VSOE”), (ii) third-party evidence (“TPE”) if available and when VSOE is not available, and (iii) best estimate of the selling price (“BESP”) if neither VSOE nor TPE is available. We have established VSOE for most of our products and services considering that a substantial majority of selling prices fall within a narrow range when sold separately. For deliverables with no established VSOE, we use BESP to determine the standalone selling price for such deliverables, as TPE is generally not available given that our products contain significant proprietary technology and solutions that differ substantially from our competitors. We have an established process for developing BESP, which incorporates historical selling prices, market conditions, gross margin objectives, pricing practices, and entity-specific factors. We monitor and evaluate estimated selling price on a regular basis to ensure that changes in circumstances are accounted for in a timely manner. We may modify our pricing in the future, which could result in changes to our VSOE and BESP. The services element of our contracts represents an insignificant portion of the total contract price.
Under our revenue recognition policy, evidence of an arrangement has been met when we have an executed purchase order, sales order, or stand-alone contract. Typically, smaller projects utilize sales or purchase orders that conform to standard terms and conditions and require the customer to remit payment generally within 30 to 90 days from product delivery. In some cases, if credit worthiness cannot be determined, prepayment or other security is required from smaller customers.
For large projects, stand-alone contracts are utilized. For these contracts, consistent with industry practice, our customers typically require their suppliers, including Energy Recovery, to accept contractual holdback provisions whereby the final amounts due under the sales contract are remitted over extended periods of time or alternatively, stand-by letters of credit are issued to guarantee performance. These retention payments typically range between 10% and 20%, and in some instances up to 30%, of the total contract amount and are due and payable when the customer is satisfied that certain specified product performance criteria have been met upon commissioning of the desalination plant, which may be 12 months to 24 months from the date of product delivery as described further below.
The specified product performance criteria for our PX device generally pertain to the ability of our product to meet its published performance specifications and warranty provisions, which our products have demonstrated on a consistent basis. This factor, combined with historical performance metrics, provides our management with a reasonable basis to conclude that its PX device will perform satisfactorily upon commissioning of the plant. To ensure this successful product performance, we provide service consisting principally of supervision of customer personnel and training to the customers during the commissioning of the plant. The installation of the PX device is relatively simple, requires no customization, and is performed by the customer under the supervision of our
- 24 -
personnel. We defer the value of the service and training component of the contract and recognize such revenue as services are rendered. Based on these factors, our management has concluded that, for sale of PX devices, delivery and performance have been completed when the product has been delivered (title transfers) to the customer.
We perform an evaluation of credit worthiness on an individual contract basis to assess whether collectability is reasonably assured. As part of this evaluation, our management considers many factors about the individual customer, including the underlying financial strength of the customer and/or partnership consortium and management’s prior history or industry-specific knowledge about the customer and its supplier relationships.
Under stand-alone contracts, the usual payment arrangements are summarized as follows:
|
|
•
|
an advance payment due upon execution of the contract, typically 10% to 20% of the total contract amount;
|
|
|
•
|
a payment upon delivery of the product due on average between 90 and 150 days from product delivery, and in some cases up to 180 days, typically in the range of 50% to 70% of the total contract amount; and
|
|
|
•
|
a retention payment due subsequent to product delivery as described further below, typically in the range of 10% to 20%, and in some cases up to 30%, of the total contract amount.
|
Under the terms of the retention payment component, we are typically required to issue to the customer a product performance guarantee that takes the form of a stand-by letter of credit, which is issued to the customer approximately 12 to 24 months after the product delivery date. The stand-by letter of credit is either collateralized by restricted cash on deposit with a financial institution or funds available through a credit facility. The stand-by letter of credit remains in place for the performance period as specified in the contract, which is generally 12 to 36 months and, in some cases, up to 65 months from issuance. The performance period generally runs concurrent with our standard product warranty period. Once the stand-by letter of credit has been put in place, we invoice the customer for this final retention payment under the sales contract. During the time between product delivery and the issuance of the stand-by letter of credit, the amount of the final retention payment is classified on the balance sheet as an unbilled receivable, of which a portion may be classified as long-term to the extent that the billable period extends beyond one year. Once the stand-by letter of credit is issued, we invoice the customer and reclassify the retention amount from unbilled receivable to accounts receivable, where it remains until payment.
We do not provide our customers with a right of product return; however, we will accept returns of products that are deemed to be damaged or defective when delivered that are covered by the terms and conditions of the product warranty. Product returns have not been significant. Reserves are established for possible product returns related to the advance replacement of products pending the determination of a warranty claim.
Shipping and handling charges billed to customers are included in net revenue. The cost of shipping to customers is included in cost of revenue.
Allowances for Doubtful Accounts
We record a provision for doubtful accounts based on historical experience and a detailed assessment of the collectability of our accounts receivable. In estimating the allowance for doubtful accounts, we consider, among other factors, the aging of the accounts receivable, our historical write-offs, the credit worthiness of each customer, and general economic conditions. Account balances are charged off against the allowance when we believe that it is probable that the receivable will not be recovered. Actual write-offs may be in excess of our estimated allowance.
Warranty Costs
We sell products with a limited warranty for a period ranging from one to six years. We accrue for warranty costs based on estimated product failure rates, historical activity, and expectations of future costs. Periodically, we evaluate and adjust the warranty costs to the extent that actual warranty costs vary from the original estimates.
- 25 -
Share-Based Compensation
We measure and recognize share-based compensation expense based on the fair value measurement for all share-based awards made to our employees and directors — including restricted stock units, restricted shares, and employee stock options — over the requisite service period (typically the vesting period of the awards). The fair value of restricted stock units and restricted stock is based on our stock price on the date of grant. The fair value of stock options is calculated on the date of grant using the Black-Scholes option pricing model, which requires a number of complex assumptions, including expected life, expected volatility, risk-free interest rate, and dividend yield. The estimation of awards that will ultimately vest requires judgment and, to the extent actual results or updated estimates differ from our current estimates, such amounts are recorded as a cumulative adjustment in the period in which the estimates are revised. See Note 12 —
“Share-Based Compensation”
for further discussion of share-based compensation.
Goodwill and Other Intangible Assets
The purchase price of an acquired company is allocated between intangible assets and the net tangible assets of the acquired business with the residual purchase price recorded as goodwill. The determination of the value of the intangible assets acquired involves certain judgments and estimates. These judgments can include, but are not limited to, the cash flows that an asset is expected to generate in the future and the appropriate weighted average cost of capital.
Acquired intangible assets with determinable useful lives are amortized on a straight-line or accelerated basis over the estimated periods benefited, ranging from one to 20 years. Acquired intangible assets with contractual terms are amortized over their respective legal or contractual lives. Customer relationships and other non-contractual intangible assets with determinable lives are amortized over periods ranging from five to 20 years. Patents developed internally are recorded at cost and amortized on a straight-line basis over their expected useful lives of 16 to 20 years.
When certain events or changes in operating conditions occur, an impairment assessment is performed and lives of intangible assets with determinable lives may be adjusted. Accordingly, with the launch of the Company’s new branding strategy in the fourth quarter of 2012 and the discontinuation of the use of the trademarks “PEI” and “Pump Engineering”, we recorded an impairment charge of $1.0 million in our consolidated statement of operations for the year ended December 31, 2012. See Note 6 — “
Goodwill and Intangible Assets”
for further details related to the impairment of acquired intangible assets.
Goodwill is not amortized, but is evaluated annually for impairment at the reporting unit level or when indicators of a potential impairment are present. Such indicators would normally include a significant reduction in our market capitalization, a decrease in operating results, or a deterioration in our financial position. We operate under a single reporting unit and, accordingly, all of our goodwill is associated with the entire company. Consequently, the annual evaluation for the impairment of goodwill is based on our market capitalization. We determined that, based on our market capitalization, goodwill was not impaired.
As of December 31, 2012 and 2011, acquired intangibles, including goodwill, relate to the acquisition of Pump Engineering, LLC during the fourth quarter of 2009. See Note 6. —
“Goodwill and Intangible Assets”
for further discussion of intangible assets.
Property and Equipment
Property and equipment is recorded at cost and reduced by accumulated depreciation. Depreciation expense is recognized over the estimated useful lives of the assets using the straight-line method. Estimated useful lives are three to ten years. A small portion of our manufacturing equipment was acquired under capital lease obligations. These assets are depreciated over periods consistent with depreciation of owned assets of similar types. Certain equipment used in the development and manufacturing of ceramic components is depreciated over estimated useful lives of up to ten years. Leasehold improvements represent remodeling and retrofitting costs for leased office and manufacturing space and are depreciated over the shorter of either the estimated useful lives or the term of the lease. Software purchased for internal use consists primarily of amounts paid for perpetual licenses to third-party software providers and are depreciated over the estimated useful lives of three to five years. Estimated useful lives are periodically reviewed and, when appropriate, changes are made prospectively. When certain events or changes in operating conditions occur, asset lives may be adjusted and an impairment assessment may be performed on the recoverability of the carrying amounts. Maintenance and repairs are charged directly to expense as incurred.
- 26 -
We own our manufacturing facility in New Boston, Michigan. As a result of the consolidation of our North American manufacturing operations, amounts related to the building and land were classified as held for sale at December 31, 2011. Accordingly, we impaired the building and land held for sale by $728,000 and ceased depreciation charges in December 2011. We recorded an additional $314,000 of impairment during the year ended December 31, 2012 to reduce the carrying value to the estimated fair value. See Note 4 —
“Other Financial Information”
for further details related to the impairment of property held for sale.
Inventories
Inventories are stated at the lower of cost (using the weighted average cost method) or market. We calculate inventory valuation adjustments for excess and obsolete inventory based on current inventory levels, movement, expected useful lives, and estimated future demand of the products and spare parts.
Income Taxes
Current and non-current tax assets and liabilities are based upon an estimate of taxes refundable or payable for each of the jurisdictions in which we are subject to tax. In the ordinary course of business, there is inherent uncertainty in quantifying income tax positions. We assess income tax positions and record tax benefits for all years subject to examination based upon our evaluation of the facts, circumstances, and information available at the reporting dates. For those tax positions where it is more likely than not that a tax benefit will be sustained, we record the largest amount of tax benefit with a greater than 50% likelihood of being realized upon ultimate settlement with a taxing authority that has full knowledge of all relevant information. For those income tax positions where it is not more likely than not that a tax benefit will be sustained, no tax benefit is recognized in the financial statements. When applicable, associated interest and penalties are recognized as a component of income tax expense. Accrued interest and penalties are included within the related tax asset or liability on the Consolidated Balance Sheets.
Deferred income taxes are provided for temporary differences arising from differences in basis of assets and liabilities for tax and financial reporting purposes. Deferred income taxes are recorded on temporary differences using enacted tax rates in effect for the year in which the temporary differences are expected to reverse. The effect of a change in tax rates on deferred tax assets and liabilities is recognized in income in the period that includes the enactment date. Deferred tax assets are reduced by a valuation allowance when, in the opinion of management, it is more likely than not that some portion or all of the deferred tax assets will not be realized. Significant judgment is required in determining whether and to what extent any valuation allowance is needed on our deferred tax assets. In making such a determination, we consider all available positive and negative evidence including recent results of operations, scheduled reversals of deferred tax liabilities, projected future income, and available tax planning strategies. As of December 31, 2012, a valuation allowance of approximately $12.7 million was established to reduce our deferred income tax assets to the amount expected to be realized. See Note 10 —
“Income Taxes”
for further discussion of the tax valuation allowance.
Our operations are subject to income and transaction taxes in the U.S. and in foreign jurisdictions. Significant estimates and judgments are required in determining our worldwide provision for income taxes. Some of these estimates are based on interpretations of existing tax laws or regulations. The ultimate amount of tax liability may be uncertain as a result.
- 27 -
Results of Operations
2012 Compared to 2011
The following table sets forth certain data from our historical operating results as a percentage of revenue for the years indicated:
| For the Year Ended December 31, | ||||||||||||||||||||||||
|
2012
|
2011
|
Change
Increase (Decrease)
|
||||||||||||||||||||||
|
Results of Operations: **
|
||||||||||||||||||||||||
|
Net revenue
|
$ | 42,632 | 100 | % | $ | 28,047 | 100 | % | $ | 14,585 | 52 | % | ||||||||||||
|
Cost of revenue
|
22,419 | 53 | % | 20,248 | 72 | % | 2,171 | 11 | % | |||||||||||||||
|
Gross profit
|
20,213 | 47 | % | 7,799 | 28 | % | 12,414 | 159 | % | |||||||||||||||
|
Operating expenses:
|
||||||||||||||||||||||||
|
General and administrative
|
15,146 | 36 | % | 16,745 | 60 | % | (1,599 | ) | (10 | )% | ||||||||||||||
|
Sales and marketing
|
7,290 | 17 | % | 7,997 | 29 | % | (707 | ) | (9 | )% | ||||||||||||||
|
Research and development
|
4,774 | 11 | % | 3,526 | 13 | % | 1,248 | 35 | % | |||||||||||||||
|
Amortization of intangible assets
|
1,042 | 2 | % | 1,360 | 5 | % | (318 | ) | (23 | )% | ||||||||||||||
|
Restructuring charges
|
369 | 1 | % | 3,294 | 12 | % | (2,925 | ) | (89 | )% | ||||||||||||||
|
Impairment of intangibles
|
1,020 | 2 | % | — | * | 1,020 | * | |||||||||||||||||
|
Loss on fair value remeasurement
|
— | * | 171 | 1 | % | (171 | ) | (100 | )% | |||||||||||||||
|
Proceeds from litigation settlement
|
(775 | ) | (2 | )% | — | * | 775 | * | ||||||||||||||||
|
Total operating expenses
|
28,866 | 68 | % | 33,093 | 118 | % | (4,227 | ) | (13 | )% | ||||||||||||||
|
Loss from operations
|
(8,653 | ) | (20 | )% | (25,294 | ) | (90 | )% | 16,641 | 66 | % | |||||||||||||
|
Other income (expense):
|
||||||||||||||||||||||||
|
Interest expense & finance charges
|
(6 | ) | * | (34 | ) | * | 28 | 82 | % | |||||||||||||||
|
Other non-operating income (expense), net
|
143 | * | 184 | 1 | % | (41 | ) | (22 | )% | |||||||||||||||
|
Net loss before income tax
|
(8,516 | ) | (20 | )% | (25,144 | ) | (90 | )% | 16,628 | 66 | % | |||||||||||||
|
Provision for (benefit from) income tax expense
|
(262 | ) | (1 | )% | 1,299 | 5 | % | (1,561 | ) | (120 | )% | |||||||||||||
|
Net loss
|
$ | (8,254 | ) | (19 | )% | $ | (26,443 | ) | (94 | )% | $ | 18,189 | 69 | % | ||||||||||
|
*
|
Not meaningful
|
|
**
|
Percentages may not add up to 100% due to rounding
|
Net revenue
Our net revenue increased by $14.6 million, or 52%, to $42.6 million for the year ended December 31, 2012 from $28.0 million for the year ended December 31, 2011. The increase in revenue was reflective of the resurging desalination market, the Company’s increased market share related to mega-project awards around the world, and increased sales of PX devices associated with large mega-project shipments during 2012 compared to 2011, the latter of which only included mega-project shipments in the first quarter.
Revenue by product category as a percentage of net revenue was as follows:
|
|
Years Ended December 31,
|
|||||||
|
2012
|
2011
|
|||||||
|
PX devices and related products and services
|
81 | % | 66 | % | ||||
|
Turbochargers and pumps and related products and services
|
19 | % | 34 | % | ||||
|
Total net revenue
|
100 | % | 100 | % | ||||
The following geographic information includes net revenue to our domestic and international customers based on the customers’ requested delivery locations, except for certain cases in which the customer directed us to deliver our products to a location that differs from the known ultimate location of use. In such cases, the ultimate location of use is reflected in the table below instead of the delivery location. The amounts below are in thousands, except percentage data.
- 28 -
|
|
Years Ended
December 31,
|
|||||||
|
|
2012
|
2011
|
||||||
|
Domestic revenue
|
$ | 3,546 | $ | 2,798 | ||||
|
International revenue
|
39,086 | 25,249 | ||||||
|
Total revenue
|
$ | 42,632 | $ | 28,047 | ||||
|
Revenue by country:
|
||||||||
|
Israel
|
25 | % | 1 | % | ||||
|
Australia
|
11 | 2 | ||||||
|
India
|
* | 18 | ||||||
|
United States
|
8 | 10 | ||||||
|
Others
(1)
|
56 | 69 | ||||||
|
Total
|
100 | % | 100 | % | ||||
|
(1)
|
Includes remaining countries not separately disclosed.
No country in this line item accounted for more than 10% of our net revenue during any of the periods presented.
|
Gross profit
Gross profit represents our net revenue less our cost of revenue. Our cost of revenue consists primarily of raw materials, personnel costs (including share-based compensation), manufacturing overhead, warranty costs, depreciation expense, and manufactured components. The largest component of our cost of revenue is raw materials. For the year ended December 31, 2012, gross profit as a percentage of net revenue was 47%, as compared to 28% for the year ended December 31, 2011.
The increase in gross profit as a percentage of net revenue in 2012 compared to 2011 was primarily due to positive operating leverages achieved through increased volume, a favorable product mix of PX devices over turbochargers and pumps (the latter of which command lower gross margins), and diminished costs realized through our plant consolidation and vertical integration efforts.
Impacting gross profit in the fourth quarter of 2012, was an increase in the provision for excess and obsolete inventory by $0.9 million. Nearly all of this provision pertained to legacy parts and components that were moved from our facility in Michigan as part of the consolidation of production operations at our corporate headquarters and manufacturing center in California. Also affecting gross profit in the fourth quarter of 2012, was the recognition of $0.8 million in non-recurring charges associated with a new oil and gas prototype device, for which no matching revenue was recognized. We continue to make significant investments in oil and gas technologies and solutions to diversify our business and expand addressable markets. Most of these investments are expensed as incurred in research and development expense. Those that have reached technological feasibility are ultimately recorded in cost of revenue when leased, sold, or evaluated for net realizable value and therefore impact gross profit.
Future gross profit is highly dependent on the product and customer mix of our net revenue, overall market demand and competition, and the volume of production in our ceramics factory and assembly operations that determines our operating leverage. Accordingly, we are not able to predict our future gross profit levels with certainty. However, we believe that the elevated levels of gross profit margin achieved during the latter part of 2012 are sustainable and improvable to the extent that volume persists, our product mix favors PX devices, pricing remains stable, and we continue to realize cost saving through production efficiencies and enhanced yields.
Share-based compensation expense included in cost of revenue was $101,000 for the year ended December 31, 2012 and $149,000 for the year ended December 31, 2011.
General and administrative
General and administrative expense decreased by $1.6 million, or 10%, to $15.1 million for the year ended December 31, 2012 from $16.7 million for the year ended December 31, 2011. General and administrative expense as a percentage of net revenue decreased to 36% for the year ended December 31, 2012 from 60% for the year ended December 31, 2011 as general and administrative costs decreased period over period while net revenue increased period over period.
General and administrative average headcount decreased to 27 for the year ended December 31, 2012 from 31 for the year ended December 31, 2011, largely as a result of reductions in force at our corporate headquarters in early 2011 and the closure of our Michigan-based facility at the end of 2011.
- 29 -
Of the $1.6 million net decrease in general and administrative expense, $1.3 million related to compensation and employee-related benefits, $0.5 million related to occupancy costs, $0.3 million related to value-added taxes, $0.2 million related to bad debt reserves, and $0.2 million related to other administrative costs. These decreases in costs were partially offset by an increase of $0.9 million related to professional and other services
Share-based compensation expense included in general and administrative expense was $1.8 million for the year ended December 31, 2012 and $1.6 million for the year ended December 31, 2011.
Sales and marketing
Sales and marketing expense decreased by $0.7 million or 9%, to $7.3 million for the year ended December 31, 2012 from $8.0 million for the year ended December 31, 2011. Sales and marketing expense as a percentage of net revenue decreased to 17% for the year ended December 31, 2012 from 29% for the year ended December 31, 2011, as sales and marketing expense decreased period over period while net revenue increased period over period.
Sales and marketing average headcount decreased to 24 for the year ended December 31, 2012 from 27 for the year ended December 31, 2011
Of the $0.7 million net decrease in sales and marketing expense, $0.7 million related to marketing, occupancy, and other sales and marketing costs and $0.4 million related to compensation and employee-related benefits. The decreases were offset by an increase of $0.4 million related to sales commissions.
Share-based compensation expense included in sales and marketing expense was $522,000 for the year ended December 31, 2012 and $591,000 for the year ended December 31, 2011.
We anticipate that our sales and marketing expenditures will increase in the future as we continue to advance our existing technologies and develop new energy recovery and efficiency-enhancing solutions for markets outside of seawater desalination.
Research and development
Research and development expense increased by $1.3 million, or 35%, to $4.8 million for the year ended December 31, 2012 from $3.5 million for the year ended December 31, 2011. Research and development expense as a percentage of net revenue remained relatively stable at 11% for the year ended December 31, 2012 compared to 13% for the year ended December 31, 2011, as research and development costs increased period over period at a similar percentage as net revenue.
Average headcount in our research and development department increased to 15 for the year ended December 31, 2012 compared to 12 for the year ended December 31, 2011.
Of the $1.3 million increase in research and development expense, $0.7 million related to direct project costs, $0.3 million related to consulting and professional costs, and $0.3 million related to compensation, employee-related benefits, and occupancy costs.
Share-based compensation expense included in research and development expense was $139,000 for the year ended December 31, 2012 and $164,000 for the year ended December 31, 2011.
We anticipate that our research and development expenditures will increase in the future as we continue to advance our existing technologies and develop new energy recovery and efficiency-enhancing solutions for markets outside of seawater desalination.
Amortization of intangible assets
Amortization of intangible assets is primarily related to finite-lived intangible assets acquired as a result of our purchase of Pump Engineering, LLC in December 2009. These intangible assets include developed technology, non-compete agreements, backlog, trademarks, and customer relationships. Amortization expense decreased by $0.3 million during the year ended December 31, 2012 compared to the year ended December 31, 2011 due to one non-compete agreement being fully amortized during 2011.
- 30 -
Amortization of intangibles is expected to decrease in 2013 due to the impairment of the trademark intangible in 2012. See discussion below under “Impairment of intangibles”.
Restructuring charges
In July 2011, we initiated a restructuring plan to consolidate our North American production activity and transfer our Michigan-based operations to our manufacturing center and headquarters in San Leandro, California. The consolidation was meant to reduce costs, improve efficiencies, and enhance research and development activities. For the year ended December 31, 2011, we recorded total pre-tax charges of $3.1 million related to this plan. Additionally, we initiated a restructuring plan to reduce operating expenses related to our sales branch office in Spain. For the year ended December 31, 2011, we recorded total pre-tax charges of $0.2 million related to this plan. See Note 15 —
“Restructuring Activities”
for further discussion of restructuring activities. Both restructuring plans were essentially completed by December 31, 2011, with the exception of the continued evaluation for impairment of assets held for sale. In June 2012, we signed a purchase agreement to sell this land and building. The sale was expected to be completed in August 2012. The agreement was not finalized as planned, and the property was again listed for sale with a commercial agent.
During the year ended December 31, 2012, we recorded $369,000 related to our restructuring plan. Of these charges, $314,000 related to the additional impairment of the land and building held for sale based on market studies of similar sales in the area, $34,000 related to other exit costs, and $21,000 related to termination benefits and other personnel costs.
Impairment of intangibles
In December 2012, we determined that the capitalized cost associated with the acquired trademarks “PEI” and “Pump Engineering” was impaired as a result of the launch of the Company’s new branding strategy in the fourth quarter of 2012 and the discontinuation of the use of the trademarks. Accordingly, we recorded an impairment charge of $1.0 million, the remaining unamortized intangible balance, in our consolidated statement of operations for the year ended December 31, 2012.
Loss on fair value remeasurement
In connection with our acquisition of Pump Engineering, LLC in December 2009, we initially recognized a liability of $5.5 million as an estimate of the acquisition date fair value of contingent and other consideration, consisting of $3.5 million of contingent consideration subject to pay-out to the sellers upon the acquired company’s achievement of certain milestones and $2.0 of other consideration securing the sellers’ indemnification obligations. The fair value measurement of the $3.5 million of contingent consideration was based on the weighted probability of achievement, as of the acquisition date, that the milestones would be achieved. In the fourth quarter of 2010, some of the milestones were not met. Accordingly, we remeasured the estimated fair value contingent consideration at $1.4 million and recorded a gain on fair-value remeasurement of $2.1 million in 2010. In December 2011, we remeasured the contingent consideration at $1.5 million to reflect its estimated fair value at December 31, 2011, and recognized a loss of $171,000 in our consolidated statement of operations as a result of the change in estimated fair value in 2011. There was no change in estimated fair value in 2012.
Proceeds from litigation settlement
In October 2012, we entered into a confidential settlement agreement resulting from an alleged breach of contract claim against one of our suppliers. Without any admission of liability or wrongdoing by the supplier, we received a one-time payment of $775,000.
Non-operating income (expense), net
Non-operating income (expense), net, changed unfavorably by $13,000 to $137,000 for the year ended December 31, 2012, from $150,000 for the year ended December 31, 2011. The variance was primarily due to an unfavorable change in net foreign currency losses of $184,000. The unfavorable change in net foreign currency losses is primarily a result of unfavorable changes in exchange rates and a decrease in Euro-denominated trade receivables during 2012 compared to 2011. The unfavorable changes in net non-operating income (expense) during the year ended December 31, 2012 was offset by an increase in interest income of $113,000, a decrease in interest expense of $28,000, and an increase in other income of $30,000.
- 31 -
2011 Compared to 2010
The following table sets forth certain data from our historical operating results as a percentage of revenue for the years indicated:
|
|
For the Year Ended December 31,
|
|||||||||||||||||||||||
|
|
2011
|
2010
|
Change
Increase (Decrease)
|
|||||||||||||||||||||
|
Results of Operations: **
|
||||||||||||||||||||||||
|
Net revenue
|
$ | 28,047 | 100 | % | $ | 45,853 | 100 | % | $ | (17,806 | ) | (39 | )% | |||||||||||
|
Cost of revenue
|
20,248 | 72 | % | 23,781 | 52 | % | (3,533 | ) | (15 | )% | ||||||||||||||
|
Gross profit
|
7,799 | 28 | % | 22,072 | 48 | % | (14,273 | ) | (65 | )% | ||||||||||||||
|
Operating expenses:
|
||||||||||||||||||||||||
|
General and administrative
|
16,745 | 60 | % | 14,471 | 32 | % | 2,274 | 16 | % | |||||||||||||||
|
Sales and marketing
|
7,997 | 29 | % | 8,205 | 18 | % | (208 | ) | (3 | )% | ||||||||||||||
|
Research and development
|
3,526 | 13 | % | 3,943 | 9 | % | (417 | ) | (11 | )% | ||||||||||||||
|
Amortization of intangible assets
|
1,360 | 5 | % | 2,624 | 6 | % | (1,264 | ) | (48 | )% | ||||||||||||||
|
Loss (gain) on fair value remeasurement
|
171 | 1 | % | (2,147 | ) | (5 | )% | 2,318 | 108 | % | ||||||||||||||
|
Restructuring charges
|
3,294 | 12 | % | — | * | 3,294 | * | |||||||||||||||||
|
Total operating expenses
|
33,093 | 118 | % | 27,096 | 59 | % | 5,997 | 22 | % | |||||||||||||||
|
Loss from operations
|
(25,294 | ) | (90 | )% | (5,024 | ) | (11 | )% | (20,270 | ) | (403 | )% | ||||||||||||
|
Other income (expense):
|
||||||||||||||||||||||||
|
Interest expense & finance charges
|
(34 | ) | * | (73 | ) | * | 39 | 53 | % | |||||||||||||||
|
Other non-operating income (expense), net
|
184 | 1 | % | (137 | ) | * | 321 | 234 | % | |||||||||||||||
|
Net loss before income tax
|
(25,144 | ) | (90 | )% | (5,234 | ) | (11 | )% | (19,910 | ) | (380 | )% | ||||||||||||
|
Provision for (benefit from) income tax expense
|
1,299 | 5 | % | (1,626 | ) | (4 | )% | 2,925 | 180 | % | ||||||||||||||
|
Net loss
|
$ | (26,443 | ) | (94 | )% | $ | (3,608 | ) | (8 | )% | $ | (22,835 | ) | (633 | )% | |||||||||
|
*
|
Not meaningful
|
|
**
|
Percentages may not add up to 100% due to rounding
|
Net revenue
Our net revenue decreased by $17.8 million, or 39%, to $28.0 million for the year ended December 31, 2011 from $45.8 million for the year ended December 31, 2010. The decrease in revenue was primarily due to decreased shipments of PX devices, turbochargers, and pumps resulting from the continued global decline in new construction of large desalination plants, which was further exacerbated in 2011 as compared to 2010 by unanticipated global events such as civil uprisings in the Middle East and the Euro financial crisis. Additionally, we consolidated our North American production activities and transferred our Michigan-based operations to our manufacturing center and headquarters in San Leandro, California. The transfer of operations resulted in some delays in shipments during the fourth quarter of 2011. Lastly, the average sales prices of our PX devices and turbochargers decreased slightly during 2011 due to product mix and customized configurations.
Revenue by product category as a percentage of net revenue was as follows:
|
|
Years Ended December 31,
|
|||||||
|
2011
|
2010
|
|||||||
|
PX devices and related products and services
|
66 | % | 61 | % | ||||
|
Turbochargers and pumps and related products and services
|
34 | % | 39 | % | ||||
|
Total net revenue
|
100 | % | 100 | % | ||||
The following geographic information includes net revenue to our domestic and international customers based on the customers’ requested delivery locations, except for certain cases in which the customer directed us to deliver our products to a location that differs from the known ultimate location of use. In such cases, the ultimate location of use is reflected in the table below instead of the delivery location. The amounts below are in thousands, except percentage data.
- 32 -
|
|
Years Ended December 31,
|
|||||||
|
|
2011
|
2010
|
||||||
|
Domestic net revenue
|
$ | 2,798 | $ | 3,334 | ||||
|
International net revenue
|
25,249 | 42,519 | ||||||
|
Total net revenue
|
$ | 28,047 | $ | 45,853 | ||||
|
Revenue by country:
|
||||||||
|
India
|
18 | % | 3 | % | ||||
|
United States
|
10 | 7 | ||||||
|
Australia
|
2 | 31 | ||||||
|
Algeria
|
1 | 12 | ||||||
|
Others
(1)
|
69 | 47 | ||||||
|
Total
|
100 | % | 100 | % | ||||
|
(1)
|
Includes remaining countries not separately disclosed.
No country in this line item accounted for more than 10% of our net revenue during any of the periods presented
|
Gross profit
Gross profit represents our net revenue less our cost of revenue. Our cost of revenue consists primarily of raw materials, personnel costs (including share-based compensation), manufacturing overhead, warranty costs, depreciation expense, and manufactured components. The largest component of our cost of revenue is raw materials, primarily ceramic materials. For the year ended December 31, 2011, gross profit as a percentage of net revenue was 28%, as compared to 48% for the year ended December 31, 2010.
The decrease in gross profit as a percentage of net revenue was primarily due to underutilization of our manufacturing facilities in 2011 as a result of the decline in product demand during the current year as compared to prior year, the phase-out of our Michigan-based manufacturing facility as part of the consolidation of our North American operations, and the integration of our new ceramics facility, which went online in 2011. To a lesser extent, gross profit decreased in the current year compared to the prior year due to a slight drop in average sales prices due to changes in product mix.
Gross profit is highly dependent on the product and customer mix of our net revenues, overall market demand and competition, and the volume of production in our own ceramics factory and our assembly operations that determines our operating leverage.
Share-based compensation expense included in cost of revenue was $149,000 for the year ended December 31, 2011 and $190,000 for the year ended December 31, 2010.
General and administrative
General and administrative expense increased by $2.3 million, or 16%, to $16.7 million for the year ended December 31, 2011 from $14.5 million for the year ended December 31, 2010. General and administrative expense as a percentage of net revenue increased to 60% for the year ended December 31, 2011 from 32% for the year ended December 31, 2010 as general and administrative costs increased period over period while net revenue decreased.
General and administrative average headcount decreased to 31 for the year ended December 31, 2011 from 40 for the year ended December 31, 2010, largely as a result of reductions in force at our corporate headquarters during late 2010 and early 2011 and reductions in force at our Michigan-based facility during the second half of 2011. In February 2011, our chief executive officer (CEO) announced his retirement, and our Board of Directors appointed a new CEO. During the second quarter of 2011, our Board of Directors appointed a new chief financial officer (CFO). General and administrative costs increased primarily as a result of non-recurring expenses related to the departures of the former CEO and CFO and the appointments of a new CEO and new CFO.
Of the $2.3 million net increase in general and administrative expense, $1.4 million related to compensation and employee-related benefits, $0.4 million related to adjustments to bad debt reserves, $0.3 million related to value added taxes, $0.2 million related to professional and other services, and $0.4 million related to other administrative costs. These increases in costs were partially offset by a decrease of $0.4 million related to occupancy costs.
Share-based compensation expense included in general and administrative expense was $1.6 million for the year ended December 31, 2011 and $1.8 million for the year ended December 31, 2010.
- 33 -
Sales and marketing
Sales and marketing expense decreased by $208,000, or 3%, for the year ended December 31, 2011 compared to the year ended December 31, 2010. Sales and marketing average headcount increased to 27 for the year ended December 31, 2011 from 26 for the year ended December 31, 2010. As a percentage of net revenue, sales and marketing expense increased to 29% for the year ended December 31, 2011 from 18% for the year ended December 31, 2010, as the percentage decrease in net revenue exceeded the percentage decrease in sales and marketing expense year over year.
Of the $208,000 net decrease in sales and marketing expense for the year ended December 31, 2011, a decrease of $944,000 related to sales commissions was partially offset by increases of $693,000 in direct and other marketing costs and $43,000 in employee compensation and benefits.
Share-based compensation expense included in sales and marketing expense was $591,000 for the year ended December 31, 2011 and $599,000 for the year ended December 31, 2010.
Research and development
Research and development expense decreased by $0.4 million, or 11%, to $3.5 million for the year ended December 31, 2011 from $3.9 million for the year ended December 31, 2010. Research and development expense as a percentage of net revenue increased to 13% for the year ended December 31, 2011 compared to 9% for the year ended December 31, 2010, as the percentage decrease in net revenue exceeded the percentage decrease in research and development expense year over year.
Average headcount in our research and development department decreased to 12 for the year ended December 31, 2011 compared to 17 for the year ended December 31, 2010.
Share-based compensation expense included in research and development expense was $164,000 for the year ended December 31, 2011 and $214,000 for the year ended December 31, 2010.
The $417,000 decrease in research and development expense for the year ended December 31, 2011 compared to prior year was primarily due to decreases of $251,000 in occupancy costs, $149,000 related to direct project costs, and $53,000 related to other costs. These decreases in expense were slightly offset by an increase in compensation and employee benefits of $36,000.
Amortization of intangible assets
Amortization of intangible assets is primarily related to finite-lived intangible assets acquired as a result of our purchase of Pump Engineering, LLC in December 2009. These intangible assets include developed technology, non-compete agreements, backlog, trademarks, and customer relationships. Amortization expense decreased by $1.3 million during the year ended December 31, 2011 compared to the year ended December 31, 2010 due to the full amortization of backlog in 2010.
Loss (gain) on fair value remeasurement
We acquired Pump Engineering, LLC in December 2009. Under the business combinations guidance of U.S. GAAP, we initially recognized a liability of $5.5 million as an estimate of the acquisition date fair value of contingent and other consideration, consisting of $3.5 million of contingent consideration subject to pay-out to the sellers upon the acquired company’s achievement of certain milestones and $2.0 of other consideration securing the sellers’ indemnification obligations. The fair value measurement of the $3.5 million of contingent consideration was based on the weighted probability of achievement, as of the acquisition date, that the milestones would be achieved. In the fourth quarter of 2010, some of the milestones were not met. Accordingly, we remeasured the estimated fair value contingent consideration at $1.4 million and recorded a gain on fair-value remeasurement of $2.1 million in 2010.. In December 2011, we remeasured the contingent consideration at $1.5 million to reflect its estimated fair value at December 31, 2011. This was an increase in the estimated fair value compared to $1.4 million at December 31, 2010. We recognized a loss of $171,000 in our consolidated statement of operations as a result of the change in estimated fair value in 2011.
- 34 -
Restructuring charges
In July 2011, we initiated a restructuring plan to consolidate our North American production activity and transfer our Michigan-based operations to our manufacturing center and headquarters in San Leandro, California. The consolidation is expected to reduce costs, improve efficiencies, and enhance research and development activities. For the year ended December 31, 2011, we recorded total pre-tax charges of $3.1 million related to this plan. Additionally, we initiated a restructuring plan to reduce operating expenses related to our sales branch office in Spain. For the year ended December 31, 2011, we recorded total pre-tax charges of $0.2 million related to this plan. Both restructuring plans were essentially completed by December 31, 2011, and with the exception of a continued evaluation for impairment of assets held for sale, we do not expect significant restructuring charges related to these restructuring plans in the future.
Non-operating income (expense), net
Non-operating income (expense), net, changed favorably by $360,000 to $150,000 of other income for the year ended December 31, 2011 from $(210,000) of other expense for the year ended December 31, 2010. The favorable variance was primarily due to favorable changes in net foreign currency gains of $295,000, an increase in interest income of $31,000, and a decrease in interest expense of $39,000. The favorable change in net foreign currency gains was primarily a result of favorable changes in exchange rates and an increase in Euro-denominated trade receivables during 2011 compared to 2010. The favorable changes in non-operating income (expense) during the year ended December 31, 2011 were slightly offset by an increase in other non-operating expenses of $5,000.
Liquidity and Capital Resources
Our primary source of cash historically has been proceeds from the issuance of common stock, customer payments for our products and services, and borrowings under credit facilities. From January 1, 2005 through December 31, 2012, we issued common stock for aggregate net proceeds of $84.0 million, excluding common stock issued in exchange for promissory notes. The proceeds from the sales of common stock have been used to fund our operations and capital expenditures.
As of December 31, 2012, our principal sources of liquidity consisted of unrestricted cash and cash equivalents of $16.6 million, which are invested primarily in money market funds; short- and long-term investments in marketable debt securities of $14.3 million, and accounts receivable of $13.2 million. We invest cash not needed for current operations predominantly in high-quality investment grade marketable debt instruments with the intent to make such funds available for operating purposes as needed.
We have unbilled receivables pertaining to customer contractual holdback provisions, whereby we invoice the final installment due under a sales contract 12 to 24 months, and in some cases up to 36 months, after the product has been shipped to the customer and revenue has been recognized. The customer holdbacks represent amounts intended to provide a form of security for the customer rather than a form of long-term financing; accordingly, these receivables have not been discounted to present value. At December 31, 2012 and 2011, we had $5.9 million and $1.1 million of unbilled receivables, respectively.
In 2008, we entered into a credit agreement (the “2008 Agreement”) with a financial institution. The 2008 Agreement, as amended, was terminated in the first quarter of 2009. As a result of terminating the 2008 Agreement, we were required to transfer cash to a restricted cash account as collateral for outstanding stand-by letters of credit that were collateralized by the credit agreement as of the date of termination. We were also required to restrict cash as collateral for the outstanding balance on an equipment promissory note. As of December 31, 2012, no cash was restricted under the 2008 Agreement for outstanding stand-by letters of credit, as the stand-by letter of credit was reissued under our current loan and security agreement. As of December 31, 2012, no cash was restricted for the equipment promissory note, as the note was fully paid in August 2012.
In 2012, our company credit card vendor required us to restrict cash for outstanding credit card balances. Accordingly, we restricted $315,000 of cash for credit card balances.
In 2009, we entered into a loan and security agreement (the “2009 Agreement”) with another financial institution. The 2009 Agreement, as amended, provided a total available credit line of $16.0 million. Under the 2009 Agreement, we were allowed to draw advances of up to $10.0 million on a revolving line of credit or utilize up to $15.9 million as collateral for stand-by letters of credit, provided that the aggregate of the outstanding advances
- 35 -
and collateral did not exceed the total available credit line of $16.0 million. Advances under the revolving line of credit incurred interest based on a prime rate index or on LIBOR plus 1.375%.
During the periods presented, we provided certain customers with stand-by letters of credit to secure our obligations for the delivery and performance of products in accordance with sales arrangements. Some of these stand-by letters of credit were issued under our 2009 Agreement. The stand-by letters of credit generally terminate within 12 to 48 months from issuance. As of December 31, 2012, the amounts outstanding on stand-by letters of credit collateralized under our 2009 Agreement totaled approximately $4.3 million.
The 2009 Agreement, as amended, required us to maintain a cash collateral balance equal to at least 101% of the face amount of all outstanding stand-by letters of credit collateralized by the line of credit and 100% of the amount of all outstanding advances. As of December 31, 2012, restricted cash related to the stand-by letters of credit issued under the 2009 Agreement was approximately $4.3 million. Of this $4.3 million cash restricted, $1.0 million was classified as current and $3.3 million was non-current. The 2009 Agreement expired at the end of May 2012. There were no advances drawn on the line of credit under the 2009 Agreement at the time of its expiration. The restricted cash related to the outstanding stand-by letters of credit under the 2009 Agreement is expected to be released at various dates through 2015.
On June 5, 2012, we entered into a loan and security agreement (the “2012 Agreement”) with another financial institution. The 2012 Agreement provides for a total available credit line of $16.0 million. Under the 2012 Agreement, we are allowed to draw advances not to exceed, at any time, $10.0 million as revolving loans. The total stand-by letters of credit issued under the 2012 Agreement may not exceed the lesser of the $16.0 million credit line or the credit line minus all outstanding revolving loans. At no time may the aggregate of the revolving loans and stand-by letters of credit exceed the total available credit line of $16.0 million. Revolving loans may be in the form of a base rate loan that bears interest equal to the prime rate plus 0% or a Eurodollar loan that bears interest equal to the adjusted LIBO rate plus 1.25%. Stand-by letters of credit are subject to customary fees and expenses for issuance or renewal. The unused portion of the credit facility is subject to a facility fee in an amount equal to 0.25% per annum of the average unused portion of the revolving line.
The 2012 Agreement also requires us to maintain a cash collateral balance equal to 101% of all outstanding advances and all outstanding stand-by letters of credit collateralized by the line of credit. The 2012 Agreement matures on June 5, 2015 and is collateralized by substantially all of our assets. There were no advances drawn under the 2012 Agreement’s line of credit as of December 31, 2012. As of December 31, 2012, the amount outstanding on stand-by letters of credit collateralized under the 2012 Agreement totaled $1.4 million, and restricted cash related to the stand-by letters of credit issued under the 2012 Agreement was $1.4 million. Of this $1.4 million cash restricted, $1.4 million was classified as current and $32,000 was non-current.
Cash Flows from Operating Activities
2012 compared to 2011
Net cash used by operating activities was $4.4 million and $8.3 million for the years ended December 31, 2012 and 2011, respectively. For the years ended December 31, 2012 and 2011, net losses of $(8.3) million and $(26.4) million, respectively, were adjusted to $1.7 million and $(11.8) million, respectively, by non-cash items totaling $10.0 million and $14.6 million, respectively. Non-cash adjustments in 2012 primarily include $3.8 million of depreciation and amortization, $2.6 million of share-based compensation, $1.0 million of trademark impairment, $0.9 million of excess and obsolete inventory reserves, a $0.6 million provision for warranty claims, and $0.5 million of amortization of premiums paid on investments.
The net cash effect from changes in operating assets and liabilities was a $(6.2) million decrease and a $3.5 million increase for the years ended December 31, 2012 and 2011, respectively. Net changes in assets and liabilities are primarily attributable to a $11.6 million increase in accounts receivable and unbilled receivables as a result of the timing of invoices and collections for large projects; a $2.8 million change in prepaid expenses and accrued liabilities as a result of the timing of payments to employees, vendors, and other third parties; and a $1.8 million decrease in inventory as a result of the timing of order processing and product shipments.
2011 compared to 2010
Net cash (used in) provided by operating activities was $(8.3) million and $1.7 million for the years ended December 31, 2011 and 2010, respectively. For the years ended December 31, 2011 and 2010, net losses of $(26.4)
- 36 -
million and $(3.6) million, respectively, were adjusted to $(11.8) million and $4.2 million, respectively, by non-cash items totaling $14.6 million and $7.8 million, respectively. Non-cash adjustments primarily include depreciation and amortization, deferred income taxes, share-based compensation, gains or losses on fair value remeasurement, inventory write-downs, warranty reserves, and excess and obsolete inventory reserves. In 2011, non-cash items also included $2.2 million related to non-cash restructuring charges.
The net cash effect from changes in operating assets and liabilities was an approximately $3.5 million increase and $(2.5) million decrease for the years ended December 31, 2011 and 2010, respectively. Net changes in assets and liabilities were primarily attributable to changes in inventory as a result of the timing of order processing and product shipments, changes in accounts receivable and unbilled receivables as a result of the timing of invoices and collections for large projects, changes in prepaid expenses and accrued liabilities as a result of the timing of payments to employees, vendors, and other third parties, and changes in deferred revenue.
Cash Flows from Investing Activities
2012 compared to 2011
Cash flows used in investing activities primarily relate to maturities and purchases of marketable securities to preserve our cash, capital expenditures to support our growth, and changes in our restricted cash used to collateralize our stand-by letters of credit.
Net cash provided by (used in) investing activities was $6.7 million and $(28.2) million for the years ended December 31, 2012 and 2011, respectively. The increase of $34.9 million in cash provided by investing activities was primarily attributable to $18.1 million less cash invested in short-term and long-term financial instruments, $13.1 million of maturities in some of our financial instruments, and a $5.4 million change in restricted cash. The increases in cash provided from investing activities were offset by an increase in capital expenditures of $0.8 million primarily related to the implementation of a new enterprise resource planning system project and a decrease of $0.8 million from the sale of property and equipment.
2011 compared to 2010
Net cash used in investing activities was $28.2 million and $5.5 million for the years ended December 31, 2011 and 2010, respectively. The increase of $22.7 million in net cash used by investing activities was primarily attributable to our investment of $23.0 million in short-term and long-term financial instruments. We increased restricted cash by $4.0 million during 2011 compared to releasing restricted cash of $4.0 million during 2010. This $8.0 million change in cash used for restricted cash balances was primarily the result of new requirements to collateralize outstanding stand-by letters of credit under an amended credit agreement. The increases in cash used in investing activities year over year was partially offset by a decrease in capital expenditures of $7.6 million due to the significant completion of key capital projects in the prior year and an increase of $0.7 million in proceeds from the sale of property and equipment in the current year.
Cash Flows from Financing Activities
2012 compared to 2011
Net cash used in financing activities was $4.1 million and $267,000 for the years ending December 31, 2012 and 2011, respectively. The unfavorable change in net cash flows from financing activities was primarily due to $4.0 million used to repurchase our common stock. This unfavorable change was offset by decreases in debt and capital lease payments of $165,000 due to our debt and several capital leases reaching the end of their term in 2012.
2011 compared to 2010
Net cash (used in) provided by financing activities was $(267,000) and $121,000 for the years ending December 31, 2011 and 2010, respectively. The unfavorable change in net cash flows from financing activities in 2011 compared to 2010 was primarily due to a decrease in cash received from warrant and stock option exercises of $584,000, including excess tax benefits related to share-based compensation arrangements, and a decrease in repayments of notes receivable from stockholders of $38,000. Unfavorable changes were partially offset by a decrease in debt and capital lease payments of $234,000 due to our early payoff of a promissory note in 2010 and several capital leases reaching the end of their terms in late 2010 and early 2011.
- 37 -
Liquidity and Capital Resource Requirements
We believe that our existing resources and cash generated from our operations will be sufficient to meet our anticipated capital requirements for at least the next 12 months. However, we may need to raise additional capital or incur additional indebtedness to continue to fund our operations in the future. Our future capital requirements will depend on many factors, including our rate of revenue growth, if any, the expansion of our sales and marketing and research and development activities, the timing and extent of our expansion into new geographic territories, the timing of new product introductions, and the continuing market acceptance of our products. We may enter into potential material investments in, or acquisitions of, complementary businesses, services, or technologies in the future, which could also require us to seek additional equity or debt financing. Additional funds may not be available on terms favorable to us or at all.
Contractual Obligations
We lease facilities and equipment under fixed non-cancelable operating leases that expire on various dates through 2019. We have purchased property and equipment under capital leases and notes payable. Additionally, in the course of our normal operations, we have entered into cancelable purchase commitments with our suppliers for various key raw materials and component parts. The purchase commitments covered by these arrangements are subject to change based on our sales forecasts for future deliveries.
The following is a summary of our contractual obligations as of December 31, 2012 (in thousands):
|
|
Payments Due by Period
|
||||||||||||||||
|
Payments Due During Year Ending December 31,
|
Operating
Leases
|
Capital
Leases(1)
|
Purchase
Obligations(2)
|
Total
|
|
||||||||||||
|
2013
|
$ | 1,558 | $ | 18 | $ | 2,359 | $ | 3,935 | |||||||||
|
2014
|
1,627 | — | — | 1,627 | |||||||||||||
|
2015
|
1,544 | — | — | 1,544 | |||||||||||||
|
2016
|
1,581 | — | — | 1,581 | |||||||||||||
|
2017
|
1,569 | — | — | 1,569 | |||||||||||||
|
Thereafter
|
2,923 | — | — | 2,923 | |||||||||||||
| $ | 10,802 | $ | 18 | $ | 2,359 | $ | 13,179 | ||||||||||
(1) Present value of net minimum capital lease payments is $18,000, as reflected on the balance sheet.
(2) Purchase obligations are related to open purchase orders for materials and supplies.
This table excludes agreements with guarantees or indemnity provisions that we have entered into with customers and others in the ordinary course of business. Based on our historical experience and information known to us as of December 31, 2012, we believe that our exposure related to these guarantees and indemnities as of December 31, 2012 was not material.
Off-Balance Sheet Arrangements
During the periods presented, we did not have any relationships with unconsolidated entities or financial partnerships such as entities often referred to as structured finance or special purpose entities, which would have been established for the purpose of facilitating off-balance sheet arrangements or other contractually narrow or limited purposes.
Recent Accounting Pronouncements
See Note 2 —
“Summary of Significant Accounting Policies”
to the consolidated financial statements regarding the impact of certain recent accounting pronouncements on our consolidated financial statements.
- 38 -
Foreign Currency Risk
The majority of our revenue contracts have been denominated in United States dollars. In some circumstances, we have priced certain international sales in Euros. The amount of revenue recognized and denominated in Euros amounted to $0.6 million, $1.4 million, and $2.1 million in 2012, 2011, and 2010, respectively. We experienced a net foreign currency gain (loss) of approximately $(22,000), $172,000, and $(152,000) related to our revenue contracts for the years ended December 31, 2012, 2011, and 2010, respectively.
As we expand our international sales, we expect that a portion of our revenue could continue to be denominated in foreign currencies. As a result, our cash and cash equivalents and operating results could be increasingly affected by changes in exchange rates. Our international sales and marketing operations incur expense that is denominated in foreign currencies. This expense could be materially affected by currency fluctuations. Our exposures are to fluctuations in exchange rates for the United States dollar versus the Euro. Changes in currency exchange rates could adversely affect our consolidated operating results or financial position. Additionally, our international sales and marketing operations maintain cash balances denominated in foreign currencies. To decrease the inherent risk associated with translation of foreign cash balances into our reporting currency, we have not maintained excess cash balances in foreign currencies. We have not hedged our exposure to changes in foreign currency exchange rates because expenses in foreign currencies have been insignificant to date, and exchange rate fluctuations have had little impact on our operating results and cash flows.
Interest Rate Risk and Credit Risk
We have an investment portfolio of fixed income marketable debt securities, including amounts classified as cash equivalents, short-term investments, and long-term investments. At December 31, 2012, our short-term investments and long-term investments totaled approximately $14.3 million. The primary objective of our investment activities is to preserve principal and liquidity while at the same time maximizing yields without significantly increasing risk. We invest primarily in high quality short-term and long-term debt instruments of the U.S. government and its agencies and high-quality corporate issuers. These investments are subject to interest rate fluctuations and will decrease in market value if interest rates increase. To minimize the exposure due to adverse shifts in interest rates, we maintain investments with an average maturity of less than three years. A hypothetical 1% increase in interest rates would have resulted in an approximately $162,000 decrease in the fair value of our fixed-income debt securities as of December 31, 2012.
In addition to interest rate risk, our investments in marketable debt securities are subject to potential loss of value due to counterparty credit risk. To minimize this risk, we invest pursuant to a Board-approved investment policy. The policy mandates high credit rating requirements and restricts our exposure to any single corporate issuer by imposing concentration limits.
- 39 -
The Board of Directors and Stockholders of
Energy Recovery, Inc.
San Leandro, California
We have audited the accompanying consolidated balance sheets of Energy Recovery, Inc. as of December 31, 2012 and 2011 and the related consolidated statements of operations,
comprehensive loss, stockholders’ equity, and cash flows for each of the three years in the period ended December 31, 2012. In connection with our audits of the financial statements, we have also audited the financial statement schedule (“schedule”) listed in Item 15(a)(2). These financial statements and schedule are the responsibility of the Company’s management. Our responsibility is to express an opinion on these financial statements and schedule based on our audits.
We conducted our audits in accordance with the standards of the Public Company Accounting Oversight Board (United States). Those standards require that we plan and perform the audit to obtain reasonable assurance about whether the financial statements are free of material misstatement. An audit includes examining, on a test basis, evidence supporting the amounts and disclosures in the financial statements, assessing the accounting principles used and significant estimates made by management, as well as evaluating the overall presentation of the financial statements and schedule. We believe that our audits provide a reasonable basis for our opinion.
In our opinion, the consolidated financial statements referred to above present fairly, in all material respects, the financial position of Energy Recovery, Inc. at December 31, 2012 and 2011, and the results of its operations and its cash flows for each of the three years in the period ended December 31, 2012, in conformity with accounting principles generally accepted in the United States of America.
Also, in our opinion, the financial statement schedule, when considered in relation to the basic consolidated financial statements taken as a whole, presents fairly, in all material respects, the information set forth therein.
We also have audited, in accordance with the standards of the Public Company Accounting Oversight Board (United States), Energy Recovery, Inc.’s internal control over financial reporting as of December 31, 2012, based on criteria established in
Internal Control — Integrated Framework
issued by the Committee of Sponsoring Organizations of the Treadway Commission (COSO) and our report dated March 12, 2013 expressed an unqualified opinion thereon.
/s/ BDO USA, LLP
San Jose, California
March 12, 2013
- 40 -
ENERGY RECOVERY, INC.
|
|
December 31,
2012
|
December 31,
2011
|
||||||
|
(In thousands, except share data and par value)
|
||||||||
|
ASSETS
|
||||||||
|
Current assets:
|
||||||||
|
Cash and cash equivalents
|
$ | 16,642 | $ | 18,507 | ||||
|
Restricted cash
|
5,235 | 5,687 | ||||||
|
Short-term investments
|
9,497 | 11,706 | ||||||
|
Accounts receivable, net of allowance for doubtful accounts of $217 and $248 at December 31, 2012 and 2011
|
13,240 | 6,498 | ||||||
|
Unbilled receivables, current
|
5,020 | 1,059 | ||||||
|
Inventories
|
5,135 | 7,824 | ||||||
|
Deferred tax assets, net
|
500 | 460 | ||||||
|
Land and building held for sale
|
1,345 | 1,660 | ||||||
|
Prepaid expenses and other current assets
|
4,245 | 4,929 | ||||||
|
Total current assets
|
60,859 | 58,330 | ||||||
|
Restricted cash, non-current
|
4,366 | 5,232 | ||||||
|
Unbilled receivables, non-current
|
868 | — | ||||||
|
Long-term investments
|
4,773 | 11,198 | ||||||
|
Property and equipment, net
|
15,967 | 16,170 | ||||||
|
Goodwill
|
12,790 | 12,790 | ||||||
|
Other intangible assets, net
|
4,929 | 6,991 | ||||||
|
Other assets, non-current
|
2 | 2 | ||||||
|
Total assets
|
$ | 104,554 | $ | 110,713 | ||||
|
LIABILITIES AND STOCKHOLDERS’ EQUITY
|
||||||||
|
Current liabilities:
|
||||||||
|
Accounts payable
|
$ | 2,154 | $ | 1,506 | ||||
|
Accrued expenses and other current liabilities
|
8,555 | 6,474 | ||||||
|
Income taxes payable
|
39 | 21 | ||||||
|
Accrued warranty reserve
|
1,172 | 852 | ||||||
|
Deferred revenue
|
918 | 859 | ||||||
|
Current portion of long-term debt
|
— | 85 | ||||||
|
Current portion of capital lease obligations
|
18 | 82 | ||||||
|
Total current liabilities
|
12,856 | 9,879 | ||||||
|
Capital lease obligations, non-current
|
— | 18 | ||||||
|
Deferred tax liabilities, non-current, net
|
1,706 | 1,516 | ||||||
|
Deferred revenue, non-current
|
411 | 261 | ||||||
|
Other non-current liabilities
|
2,200 | 2,085 | ||||||
|
Total liabilities
|
17,173 | 13,759 | ||||||
|
Commitments and Contingencies (Note 9)
|
||||||||
|
Stockholders’ equity:
|
||||||||
|
Preferred stock, $0.001 par value; 10,000,000 shares authorized; no shares issued or outstanding
|
— | — | ||||||
|
Common stock, $0.001 par value; 200,000,000 shares authorized; 52,685,129 shares issued and 50,902,526 shares outstanding at December 31, 2012 and 52,645,129 shares issued and outstanding at December 31, 2011
|
53 | 53 | ||||||
|
Additional paid-in capital
|
117,264 | 114,619 | ||||||
|
Notes receivable from stockholders
|
— | (23 | ) | |||||
|
Accumulated other comprehensive loss
|
(79 | ) | (92 | ) | ||||
|
Treasury stock, at cost, 1,782,603 and 0 shares repurchased at December 31, 2012 and 2011
|
(4,000 | ) | — | |||||
|
Accumulated deficit
|
(25,857 | ) | (17,603 | ) | ||||
|
Total stockholders’ equity
|
87,381 | 96,954 | ||||||
|
Total liabilities and stockholders’ equity
|
$ | 104,554 | $ | 110,713 | ||||
See accompanying Notes to Consolidated Financial Statements
- 41 -
ENERGY RECOVERY, INC.
|
|
Years Ended
December 31,
|
|||||||||||
|
|
2012
|
2011
|
2010
|
|||||||||
|
(In thousands, except per share data)
|
||||||||||||
|
Net revenue
|
$ | 42,632 | $ | 28,047 | $ | 45,853 | ||||||
|
Cost of revenue
|
22,419 | 20,248 | 23,781 | |||||||||
|
Gross profit
|
20,213 | 7,799 | 22,072 | |||||||||
|
Operating expenses:
|
||||||||||||
|
General and administrative
|
15,146 | 16,745 | 14,471 | |||||||||
|
Sales and marketing
|
7,290 | 7,997 | 8,205 | |||||||||
|
Research and development
|
4,774 | 3,526 | 3,943 | |||||||||
|
Amortization of intangible assets
|
1,042 | 1,360 | 2,624 | |||||||||
|
Restructuring charges
|
369 | 3,294 | — | |||||||||
|
Impairment of intangibles
|
1,020 | — | — | |||||||||
|
Loss (gain) on fair value remeasurement
|
— | 171 | (2,147 | ) | ||||||||
|
Proceeds from litigation settlement
|
(775 | ) | — | — | ||||||||
|
Total operating expenses
|
28,866 | 33,093 | 27,096 | |||||||||
|
Loss from operations
|
(8,653 | ) | (25,294 | ) | (5,024 | ) | ||||||
|
Other income (expense):
|
||||||||||||
|
Interest expense
|
(6 | ) | (34 | ) | (73 | ) | ||||||
|
Other non-operating income (expense), net
|
143 | 184 | (137 | ) | ||||||||
|
Loss before income taxes
|
(8,516 | ) | (25,144 | ) | (5,234 | ) | ||||||
|
(Benefit from) provision for income taxes
|
(262 | ) | 1,299 | (1,626 | ) | |||||||
|
Net loss
|
$ | (8,254 | ) | $ | (26,443 | ) | $ | (3,608 | ) | |||
|
Loss per share:
|
||||||||||||
|
Basic and diluted
|
$ | (0.16 | ) | $ | (0.50 | ) | $ | (0.07 | ) | |||
|
Number of shares used in per share calculations:
|
||||||||||||
|
Basic and diluted
|
51,452 | 52,612 | 52,072 | |||||||||
See accompanying Notes to Consolidated Financial Statements
- 42 -
ENERGY RECOVERY, INC.
|
|
Years Ended December
31,
|
|||||||||||
|
|
2012
|
2011
|
2010
|
|||||||||
|
(In thousands)
|
||||||||||||
|
Net loss
|
$ | (8,254 | ) | $ | (26,443 | ) | $ | (3,608 | ) | |||
|
Other comprehensive income (loss), net of tax:
|
||||||||||||
|
Foreign currency translation adjustments
|
(2 | ) | 2 | (14 | ) | |||||||
|
Unrealized gain (loss) on investments
|
15 | (14 | ) | — | ||||||||
|
Other comprehensive income (loss)
|
13 | (12 | ) | (14 | ) | |||||||
|
Comprehensive loss
|
$ | (8,241 | ) | $ | (26,455 | ) | $ | (3,622 | ) | |||
See accompanying Notes to Consolidated Financial Statements
- 43 -
ENERGY RECOVERY, INC.
Years Ended December 31, 2012, 2011, and 2010
|
Common Stock
|
Treasury Stock
|
Additional
Paid-in
|
Notes
Receivable
|
Accumulated
Other
|
Retained
Earnings
|
Total
Stockholders’
|
||||||||||||||||||||||||||||||
|
Shares
|
Amount
|
Shares
|
Amount
|
Capital
|
Stockholders
|
Income (Loss)
|
Deficit)
|
Equity
|
||||||||||||||||||||||||||||
|
(In thousands)
|
||||||||||||||||||||||||||||||||||||
|
Balance at December 31, 2009
|
51,216 | $ | 51 | — | $ | — | $ | 108,626 | $ | (90 | ) | $ | (66 | ) | $ | 12,448 | $ | 120,969 | ||||||||||||||||||
|
Net loss
|
— | — | — | — | — | — | — | (3,608 | ) | (3,608 | ) | |||||||||||||||||||||||||
|
Foreign currency translation adjustments
|
— | — | — | — | — | — | (14 | ) | — | (14 | ) | |||||||||||||||||||||||||
|
Issuance of common stock
|
1,380 | 2 | — | — | 555 | — | — | — | 557 | |||||||||||||||||||||||||||
|
Interest on notes receivable from stockholders
|
— | — | — | — | — | (2 | ) | — | — | (2 | ) | |||||||||||||||||||||||||
|
Repayment of notes receivable from stockholders
|
— | — | — | — | — | 54 | — | — | 54 | |||||||||||||||||||||||||||
|
Stock option income tax benefit
|
— | — | — | — | 60 | — | — | — | 60 | |||||||||||||||||||||||||||
|
Employee share-based compensation
|
— | — | — | — | 2,785 | — | — | — | 2,785 | |||||||||||||||||||||||||||
|
Non-employee share-based compensation
|
— | — | — | — | (1 | ) | — | — | — | (1 | ) | |||||||||||||||||||||||||
|
Balance at December 31, 2010
|
52,596 | 53 | — | — | 112,025 | (38 | ) | (80 | ) | 8,840 | 120,800 | |||||||||||||||||||||||||
|
Net loss
|
— | — | — | — | — | — | — | (26,443 | ) | (26,443 | ) | |||||||||||||||||||||||||
|
Unrealized losses on investment
|
— | — | — | — | — | — | (14 | ) | — | (14 | ) | |||||||||||||||||||||||||
|
Foreign currency translation adjustments
|
— | — | — | — | — | — | 2 | — | 2 | |||||||||||||||||||||||||||
|
Issuance of common stock
|
49 | — | — | — | 49 | — | — | — | 49 | |||||||||||||||||||||||||||
|
Interest on notes receivable from stockholders
|
— | — | — | — | — | (1 | ) | — | — | (1 | ) | |||||||||||||||||||||||||
|
Repayment of notes receivable from stockholders
|
— | — | — | — | — | 16 | — | — | 16 | |||||||||||||||||||||||||||
|
Stock option income tax benefit
|
— | — | — | — | (1 | ) | — | — | — | (1 | ) | |||||||||||||||||||||||||
|
Employee share-based compensation
|
— | — | — | — | 2,499 | — | — | — | 2,499 | |||||||||||||||||||||||||||
|
Non-employee share-based compensation
|
— | — | — | — | 47 | — | — | — | 47 | |||||||||||||||||||||||||||
|
Balance at December 31, 2011
|
52,645 | 53 | — | — | 114,619 | (23 | ) | (92 | ) | (17,603 | ) | 96,954 | ||||||||||||||||||||||||
|
Net loss
|
— | — | — | — | — | — | — | (8,254 | ) | (8,254 | ) | |||||||||||||||||||||||||
|
Unrealized gains on investment
|
— | — | — | — | — | — | 15 | — | 15 | |||||||||||||||||||||||||||
|
Foreign currency translation adjustments
|
— | — | — | — | — | — | (2 | ) | — | (2 | ) | |||||||||||||||||||||||||
|
Issuance of common stock
|
40 | — | — | — | 30 | — | — | — | 30 | |||||||||||||||||||||||||||
|
Repurchase of common stock for treasury
|
— | — | (1,783 | ) | (4,000 | ) | — | — | — | — | (4,000 | ) | ||||||||||||||||||||||||
|
Interest on notes receivable from stockholders
|
— | — | — | — | — | (1 | ) | — | — | (1 | ) | |||||||||||||||||||||||||
|
Repayment of notes receivable from stockholders
|
— | — | — | — | — | 24 | — | — | 24 | |||||||||||||||||||||||||||
|
Employee share-based compensation
|
— | — | — | — | 2,611 | — | — | — | 2,611 | |||||||||||||||||||||||||||
|
Non-employee share-based compensation
|
— | — | — | — | 4 | — | — | — | 4 | |||||||||||||||||||||||||||
|
Balance at December 31, 2012
|
52,685 | $ | 53 | (1,783 | ) | $ | (4,000 | ) | $ | 117,264 | $ | — | $ | (79 | ) | $ | (25,857 | ) | $ | 87,381 | ||||||||||||||||
See accompanying Notes to Consolidated Financial Statements
- 44 -
ENERGY RECOVERY, INC.
|
|
Years Ended December 31,
|
|||||||||||
|
|
2012
|
2011
|
2010
|
|||||||||
|
(In thousands)
|
||||||||||||
|
Cash Flows From Operating Activities
|
||||||||||||
|
Net loss
|
$ | (8,254 | ) | $ | (26,443 | ) | $ | (3,608 | ) | |||
|
Adjustments to reconcile net loss to net cash (used in) provided by
operating activities:
|
||||||||||||
|
Depreciation and amortization
|
3,802 | 4,791 | 5,204 | |||||||||
|
Non-cash restructuring charges
|
314 | 2,202 | — | |||||||||
|
Impairment of intangible assets
|
1,020 | — | 11 | |||||||||
|
Loss on disposal of fixed assets
|
49 | 105 | 56 | |||||||||
|
Amortization of premiums on investments
|
507 | 119 | — | |||||||||
|
Interest accrued on notes receivables from stockholders
|
(1 | ) | (1 | ) | (2 | ) | ||||||
|
Share-based compensation
|
2,615 | 2,544 | 2,774 | |||||||||
|
Loss on foreign currency transactions
|
(5 | ) | 69 | 158 | ||||||||
|
Deferred income taxes
|
150 | 2,836 | 133 | |||||||||
|
Excess tax benefit from share-based compensation arrangements
|
— | (1 | ) | (16 | ) | |||||||
|
Provision for (recovery of) doubtful accounts
|
6 | 203 | (136 | ) | ||||||||
|
Provision for warranty claims
|
601 | 589 | 846 | |||||||||
|
Valuation adjustments for excess or obsolete inventory
|
857 | 366 | 224 | |||||||||
|
Amortization of inventory acquisition valuation step-up
|
— | — | 870 | |||||||||
|
Loss (gain) on fair value remeasurement
|
— | 171 | (2,147 | ) | ||||||||
|
Write-down of inventories
|
— | 632 | — | |||||||||
|
Other non-cash adjustments
|
113 | 18 | (137 | ) | ||||||||
|
Changes in operating assets and liabilities:
|
||||||||||||
|
Accounts receivable
|
(6,779 | ) | 2,942 | 3,106 | ||||||||
|
Unbilled receivables
|
(4,830 | ) | 1,181 | 3,239 | ||||||||
|
Inventories
|
1,832 | 950 | (506 | ) | ||||||||
|
Prepaid and other assets
|
692 | (483 | ) | (2,656 | ) | |||||||
|
Accounts payable
|
583 | 108 | (140 | ) | ||||||||
|
Accrued expenses and other liabilities
|
2,068 | 214 | (3,110 | ) | ||||||||
|
Income taxes payable
|
19 | 11 | (335 | ) | ||||||||
|
Deferred revenue
|
209 | (1,379 | ) | (2,130 | ) | |||||||
|
Net cash (used in) provided by operating activities
|
(4,432 | ) | (8,256 | ) | 1,698 | |||||||
|
Cash Flows From Investing Activities
|
||||||||||||
|
Capital expenditures
|
(2,810 | ) | (1,966 | ) | (9,527 | ) | ||||||
|
Proceeds from sale of capitalized assets
|
— | 770 | 36 | |||||||||
|
Restricted cash
|
1,318 | (4,039 | ) | 3,946 | ||||||||
|
Purchases of marketable securities
|
(4,961 | ) | (23,037 | ) | — | |||||||
|
Maturities of marketable securities
|
13,116 | — | — | |||||||||
|
Net cash provided by (used in) investing activities
|
6,663 | (28,272 | ) | (5,545 | ) | |||||||
|
Cash Flows From Financing Activities
|
||||||||||||
|
Repayment of long-term debt
|
(85 | ) | (128 | ) | (298 | ) | ||||||
|
Repayment of capital lease obligation
|
(82 | ) | (204 | ) | (268 | ) | ||||||
|
Net proceeds from issuance of common stock
|
30 | 49 | 557 | |||||||||
|
Excess tax benefit from share-based compensation arrangements
|
— | — | 76 | |||||||||
|
Repurchase of common stock
|
(4,000 | ) | — | — | ||||||||
|
Repayment of notes receivable from stockholders
|
24 | 16 | 54 | |||||||||
|
Net cash (used in) provided by financing activities
|
(4,113 | ) | (267 | ) | 121 | |||||||
|
Effect of exchange rate differences on cash and cash equivalents
|
17 | (36 | ) | (51 | ) | |||||||
|
Net change in cash and cash equivalents
|
(1,865 | ) | (36,831 | ) | (3,777 | ) | ||||||
|
Cash and cash equivalents, beginning of year
|
18,507 | 55,338 | 59,115 | |||||||||
|
Cash and cash equivalents, end of year
|
$ | 16,642 | $ | 18,507 | $ | 55,338 | ||||||
|
Supplemental disclosure of cash flow information
|
||||||||||||
|
Cash paid for interest
|
$ | 6 | $ | 34 | $ | 73 | ||||||
|
Cash received for income tax refunds
|
$ | 442 | $ | 669 | $ | 872 | ||||||
|
Cash paid for income taxes
|
$ | 23 | $ | 36 | $ | 1,707 | ||||||
|
Supplemental disclosure of non-cash transactions
|
||||||||||||
|
Purchases of property and equipment in trade accounts payable and accrued expenses and other liabilities
|
$ | 279 | $ | 383 | $ | 327 | ||||||
See accompanying Notes to Consolidated Financial Statements
- 45 -
ENERGY RECOVERY, INC.
Energy Recovery, Inc. (“the Company”, “Energy Recovery”, “we”, “our”, or “us”) designs, develops, and manufactures energy recovery devices that harness the reusable energy from industrial fluid flows and pressure cycles. Our products are marketed and sold in fluid flow markets, such as desalination and oil and gas, under the trademarks ERI
®
, PX
®
, Pressure Exchanger
®
, and PX Pressure Exchanger
®
. Our products are developed and manufactured in the United States of America (“U.S.”) at our headquarters in San Leandro, California. We also have offices in Madrid, Spain; Dubai, United Arab Emirates; and Shanghai, Peoples Republic of China.
The Company was incorporated in Virginia in April 1992 and reincorporated in Delaware in March 2001. Shares of our common stock began trading publicly in July 2008. As of December 31, 2012, we had two wholly-owned subsidiaries: Energy Recovery Iberia, S.L (incorporated in September 2006) and ERI Energy Recovery Ireland Ltd. (incorporated in April 2010). In December 2011, we merged three wholly-owned subsidiaries – Osmotic Power, Inc., Energy Recovery, Inc. International, and Pump Engineering, Inc. – into our parent company, Energy Recovery, Inc.
Basis of Presentation
Our consolidated financial statements include the accounts of Energy Recovery, Inc. and its wholly-owned subsidiaries. All significant intercompany accounts and transactions have been eliminated in consolidation.
Use of Estimates
The preparation of consolidated financial statements in conformity with U.S. generally accepted accounting principles (“U.S. GAAP”) requires our management to make judgments, assumptions, and estimates that affect the amounts reported in our consolidated financial statements and accompanying notes. The accounting policies that reflect our more significant estimates and judgments and that we believe are the most critical to aid in fully understanding and evaluating our reported financial results are revenue recognition, allowance for doubtful accounts, allowance for product warranty, valuation of stock options, valuation and impairment of goodwill and acquired intangible assets, valuation of fair value of assets held for sale, useful lives for depreciation and amortization, valuation adjustments for excess and obsolete inventory, deferred taxes and valuation allowances on deferred tax assets, and evaluation and measurement of contingencies, including contingent consideration. It is reasonably possible that those estimates could change, and as a result, actual results could differ materially from those estimates.
Reclassifications
Certain amounts in the prior years’ consolidated financial statements have been reclassified to conform to the current period presentation. In our consolidated balance sheets, assets held for sale in connection with our restructuring activities was previously included as a long-term asset and is now classified as a current asset.
Cash and Cash Equivalents
We consider all highly liquid investments with an original or remaining maturity of three months or less at the time of purchase to be cash equivalents. Cash equivalents are stated at cost, which approximates fair value. Our cash and cash equivalents are maintained primarily in demand deposit accounts with large financial institutions and in institutional money market funds. We frequently monitor the creditworthiness of the financial institutions and institutional money market funds in which we invest our surplus funds. We have not experienced any credit losses from our cash investments.
Allowances for Doubtful Accounts
We record a provision for doubtful accounts based on historical experience and a detailed assessment of the collectability of our accounts receivable. In estimating the allowance for doubtful accounts, we consider, among other factors, the aging of the accounts receivable, our historical write-offs, the credit worthiness of each customer,
- 46 -
and general economic conditions. Account balances are charged off against the allowance when we believe that it is probable that the receivable will not be recovered. Actual write-offs may be in excess of our estimated allowance.
Short-Term and Long-Term Investments
Our short-term and long-term investments consist primarily of investment-grade debt securities, all of which are classified as available-for-sale. Available-for-sale securities are carried at fair value. Amortization or accretion of premium or discount is included in other income (expense) on the consolidated statements of operations. Changes in the fair value of available-for-sale securities are reported as a component of accumulated other comprehensive income within stockholders’ equity on the consolidated balance sheet. Realized gains and losses on the sale of available-for-sale securities are determined by specific identification of the cost basis of each security. Long-term investments generally will mature within three years.
Inventories
Inventories are stated at the lower of cost (using the weighted average cost method) or market. We calculate inventory valuation adjustments for excess and obsolete inventory based on current inventory levels, movement, expected useful lives, and estimated future demand of the products and spare parts.
Property and Equipment
Property and equipment is recorded at cost and reduced by accumulated depreciation. Depreciation expense is recognized over the estimated useful lives of the assets using the straight-line method. Estimated useful lives are three to ten years. A small portion of our manufacturing equipment was acquired under capital lease obligations. These assets are depreciated over periods consistent with depreciation of owned assets of similar types. Certain equipment used in the development and manufacturing of ceramic components is depreciated over estimated useful lives of up to ten years. Leasehold improvements represent remodeling and retrofitting costs for leased office and manufacturing space and are depreciated over the shorter of either the estimated useful lives or the term of the lease. Software purchased for internal use consists primarily of amounts paid for perpetual licenses to third-party software providers and are depreciated over the estimated useful lives of three to five years. Estimated useful lives are periodically reviewed, and when appropriate, changes are made prospectively. When certain events or changes in operating conditions occur, asset lives may be adjusted and an impairment assessment may be performed on the recoverability of the carrying amounts. Maintenance and repairs are charged directly to expense as incurred.
We own our manufacturing facility in New Boston, Michigan. As a result of the consolidation of our North American manufacturing operations, amounts related to the building and land were classified as held for sale at December 31, 2011. Accordingly, we impaired the building and land held for sale by $728,000 and ceased depreciation charges in December 2011. We recorded an additional $314,000 of impairment during the year ended December 31, 2012 to reduce the carrying value to the estimated fair value. See Note 4 —
“Other Financial Information”
for further details related to the impairment of property held for sale.
Goodwill and Other Intangible Assets
The purchase price of an acquired company is allocated between intangible assets and the net tangible assets of the acquired business with the residual purchase price recorded as goodwill. The determination of the value of the intangible assets acquired involves certain judgments and estimates. These judgments can include, but are not limited to, the cash flows that an asset is expected to generate in the future and the appropriate weighted average cost of capital.
Acquired intangible assets with determinable useful lives are amortized on a straight-line or accelerated basis over the estimated periods benefited, ranging from one to 20 years. Acquired intangible assets with contractual terms are amortized over their respective legal or contractual lives. Customer relationships and other non-contractual intangible assets with determinable lives are amortized over periods ranging from five to 20 years. Patents developed internally are recorded at cost and amortized on a straight-line basis over their expected useful life of 16 to 20 years.
When certain events or changes in operating conditions occur, an impairment assessment is performed and lives of intangible assets with determinable lives may be adjusted. Accordingly, with the launch of the Company’s new branding strategy in the fourth quarter of 2012 and the discontinuation of the use of the trademarks “PEI” and “Pump Engineering”, we recorded an impairment charge of $1.0 million in our consolidated statements of
- 47 -
operations for the year ended December 31, 2012. See Note 6 —
“Goodwill and Intangible Assets”
for further details related to the impairment of acquired intangible assets.
Goodwill is not amortized, but is evaluated annually for impairment at the reporting unit level or when indicators of a potential impairment are present. Such indicators would normally include a significant reduction in our market capitalization, a decrease in operating results, or a deterioration in our financial position. We operate under a single reporting unit, and accordingly, all of our goodwill is associated with the entire company. Consequently, the annual evaluation for the impairment of goodwill is based on our market capitalization. We determined that, based on our market capitalization, goodwill was not impaired.
As of December 31, 2012 and 2011, acquired intangibles, including goodwill, relate to the acquisition of Pump Engineering, LLC during the fourth quarter of 2009. See Note 6. —
“Goodwill and Intangible Assets”
for further discussion of intangible assets.
Fair Value of Financial Instruments
Our financial instruments include cash and cash equivalents, restricted cash, investments in marketable securities, accounts receivable, accounts payable, and debt. The carrying amounts for these financial instruments reported in the Consolidated Balance Sheets approximate their fair values. See Note 7 — “
Fair Value Measurements”
for further discussion of fair value.
Revenue Recognition
We recognize revenue when the earnings process is complete, as evidenced by an agreement with the customer, transfer of title, fixed pricing that is determinable, and collection that is reasonably assured. Transfer of title typically occurs upon shipment of the equipment pursuant to a written purchase order or contract. The portion of the sales agreement related to the field services and training for commissioning of our devices in a desalination plant is deferred until we have performed such services. We regularly evaluate our revenue arrangements to identify deliverables and to determine whether these deliverables are separable into multiple units of accounting. In January 2011, we adopted guidance issued by the Financial Accounting Standards Board (“FASB”) on revenue arrangements with multiple deliverables. In accordance with the guidance, when multiple elements exist in a sales agreement, we allocate revenue to all deliverables based on their relative selling prices. The new guidance provides a hierarchy to determine the selling price to be used for allocating revenue to deliverables: (i) vendor-specific objective evidence (“VSOE”), (ii) third-party evidence (“TPE”) if available and when VSOE is not available, and (iii) best estimate of the selling price (“BESP”) if neither VSOE nor TPE is available. We have established VSOE for most of our products and services considering that a substantial majority of selling prices fall within a narrow range when sold separately. For deliverables with no established VSOE, we use BESP to determine the standalone selling price for such deliverables, as TPE is generally not available given that our products contain significant proprietary technology and solutions that differ substantially from our competitors. We have an established process for developing BESP, which incorporates historical selling prices, market conditions, gross margin objectives, pricing practices, and entity-specific factors. We monitor and evaluate estimated selling price on a regular basis to ensure that changes in circumstances are accounted for in a timely manner. We may modify our pricing in the future, which could result in changes to our VSOE and BESP. The services element of our contracts represents an insignificant portion of the total contract price.
Under our revenue recognition policy, evidence of an arrangement has been met when we have an executed purchase order, sales order, or stand-alone contract. Typically, smaller projects utilize sales or purchase orders that conform to standard terms and conditions and require the customer to remit payment generally within 30 to 90 days from product delivery. In some cases, if credit worthiness cannot be determined, prepayment or other security is required from smaller customers.
For large projects, stand-alone contracts are utilized. For these contracts, consistent with industry practice, our customers typically require their suppliers, including Energy Recovery, to accept contractual holdback provisions whereby the final amounts due under the sales contract are remitted over extended periods of time or alternatively, stand-by letters of credit are issued to guarantee performance. These retention payments typically range between 10% and 20%, and in some instances up to 30%, of the total contract amount and are due and payable when the customer is satisfied that certain specified product performance criteria have been met upon commissioning of the desalination plant, which may be 12 months to 24 months from the date of product delivery as described further below.
- 48 -
The specified product performance criteria for our PX device generally pertain to the ability of our product to meet its published performance specifications and warranty provisions, which our products have demonstrated on a consistent basis. This factor, combined with historical performance metrics, provides our management with a reasonable basis to conclude that its PX device will perform satisfactorily upon commissioning of the plant. To ensure this successful product performance, we provide service consisting principally of supervision of customer personnel and training to the customers during the commissioning of the plant. The installation of the PX device is relatively simple, requires no customization, and is performed by the customer under the supervision of our personnel. We defer the value of the service and training component of the contract and recognize such revenue as services are rendered. Based on these factors, our management has concluded that, for sale of PX devices, delivery and performance have been completed when the product has been delivered (title transfers) to the customer.
We perform an evaluation of credit worthiness on an individual contract basis to assess whether collectability is reasonably assured. As part of this evaluation, our management considers many factors about the individual customer, including the underlying financial strength of the customer and/or partnership consortium and management’s prior history or industry-specific knowledge about the customer and its supplier relationships.
|
|
Under stand-alone contracts, the usual payment arrangements are summarized as follows:
|
|
|
•
|
an advance payment due upon execution of the contract, typically 10% to 20% of the total contract amount;
|
|
|
•
|
a payment upon delivery of the product due on average between 90 and 150 days from product delivery, and in some cases up to 180 days, typically in the range of 50% to 70% of the total contract amount; and
|
|
|
•
|
a retention payment due subsequent to product delivery as described further below, typically in the range of 10% to 20%, and in some cases up to 30%, of the total contract amount.
|
Under the terms of the retention payment component, we are typically required to issue to the customer a product performance guarantee that takes the form of a stand-by letter of credit, which is issued to the customer approximately 12 to 24 months after the product delivery date. The stand-by letter of credit is either collateralized by restricted cash on deposit with a financial institution or funds available through a credit facility. The stand-by letter of credit remains in place for the performance period as specified in the contract, which is generally 12 to 36 months and, in some cases up to 65 months, from issuance. The performance period generally runs concurrent with our standard product warranty period. Once the stand-by letter of credit has been put in place, we invoice the customer for this final retention payment under the sales contract. During the time between the product delivery and the issuance of the stand-by letter of credit, the amount of the final retention payment is classified on the balance sheet as an unbilled receivable, of which a portion may be classified as long-term to the extent that the billable period extends beyond one year. Once the stand-by letter of credit is issued, we invoice the customer and reclassify the retention amount from unbilled receivable to accounts receivable, where it remains until payment.
We do not provide our customers with a right of product return; however, we will accept returns of products that are deemed to be damaged or defective when delivered that are covered by the terms and conditions of the product warranty. Product returns have not been significant. Reserves are established for possible product returns related to the advance replacement of products pending the determination of a warranty claim.
Shipping and handling charges billed to customers are included in net revenue. The cost of shipping to customers is included in cost of revenue.
Warranty Costs
We sell products with a limited warranty for a period ranging from one to six years. We accrue for warranty costs based on estimated product failure rates, historical activity, and expectations of future costs. Periodically, we evaluate and adjust the warranty costs to the extent that actual warranty costs vary from the original estimates.
Share-Based Compensation
We measure and recognize share-based compensation expense based on the fair value measurement for all share-based awards made to our employees and directors — including restricted stock units, restricted shares, and employee stock options — over the requisite service period (typically the vesting period of the awards). The fair value of restricted stock units and restricted stock is based on our stock price on the date of grant. The fair value of stock options is calculated on the date of grant using the Black-Scholes option pricing model, which requires a number of complex assumptions, including expected life, expected volatility, risk-free interest rate, and dividend yield. The estimation of awards that will ultimately vest requires judgment, and to the extent actual results or
- 49 -
updated estimates differ from our current estimates, such amounts are recorded as a cumulative adjustment in the period in which the estimates are revised. See Note 12 —
“Share-Based Compensation”
for further discussion of share-based compensation.
Foreign Currency
Our reporting currency is the U.S. dollar, while the functional currencies of our foreign subsidiaries are their respective local currencies. The asset and liability accounts of our foreign subsidiaries are translated from their local currencies at the rates in effect on the balance sheet date. Revenue and expenses are translated at average rates of exchange prevailing during the period. Gains and losses resulting from the translation of our subsidiary balance sheets are recorded as a component of accumulated other comprehensive income. Gains and losses from foreign currency transactions are recorded in other income and expense in the Consolidated Statements of Operations.
Income Taxes
Current and non-current tax assets and liabilities are based upon an estimate of taxes refundable or payable for each of the jurisdictions in which we are subject to tax. In the ordinary course of business, there is inherent uncertainty in quantifying income tax positions. We assess income tax positions and record tax benefits for all years subject to examination based upon our evaluation of the facts, circumstances, and information available at the reporting dates. For those tax positions where it is more likely than not that a tax benefit will be sustained, we record the largest amount of tax benefit with a greater than 50% likelihood of being realized upon ultimate settlement with a taxing authority that has full knowledge of all relevant information. For those income tax positions where it is not more likely than not that a tax benefit will be sustained, no tax benefit is recognized in the financial statements. When applicable, associated interest and penalties are recognized as a component of income tax expense. Accrued interest and penalties are included within the related tax asset or liability on the Consolidated Balance Sheets.
Deferred income taxes are provided for temporary differences arising from differences in basis of assets and liabilities for tax and financial reporting purposes. Deferred income taxes are recorded on temporary differences using enacted tax rates in effect for the year in which the temporary differences are expected to reverse. The effect of a change in tax rates on deferred tax assets and liabilities is recognized in income in the period that includes the enactment date. Deferred tax assets are reduced by a valuation allowance when, in the opinion of management, it is more likely than not that some portion or all of the deferred tax assets will not be realized. Significant judgment is required in determining whether and to what extent any valuation allowance is needed on our deferred tax assets. In making such a determination, we consider all available positive and negative evidence including recent results of operations, scheduled reversals of deferred tax liabilities, projected future income, and available tax planning strategies. As of December 31, 2012, a valuation allowance of approximately $12.7 million was established to reduce our deferred income tax assets to the amount expected to be realized. See Note 10 —
“Income Taxes”
for further discussion of the tax valuation allowance.
Our operations are subject to income and transaction taxes in the U.S. and in foreign jurisdictions. Significant estimates and judgments are required in determining our worldwide provision for income taxes. Some of these estimates are based on interpretations of existing tax laws or regulations. The ultimate amount of tax liability may be uncertain as a result.
Recent Accounting Pronouncements
Other than as described below, no new accounting pronouncement issued or effective during the fiscal year has had or is expected to have a material impact on the consolidated financial statements.
Testing Goodwill for Impairment
In September 2011, the Financial Accounting Standards Board (“FASB”) issued Accounting Standards Update (“ASU”) No. 2011-08,
Intangibles-Goodwill and Other, Testing Goodwill for Impairment
. The revised standard provides entities an option to perform a qualitative assessment to determine whether further impairment testing is necessary. If an entity believes, as a result of its qualitative assessment, that it is more likely than not that the fair value of a reporting entity is less than its carrying amount, then the quantitative impairment test is required. Otherwise, no further testing is required. This standard is effective for annual and interim goodwill impairment tests performed for fiscal years beginning after December 15, 2011, with early adoption permitted. We perform an annual impairment test of goodwill during our fourth quarter. Since we have one reporting unit and evaluate
- 50 -
goodwill for impairment based upon our market capitalization, the adoption of the new guidance did not have an impact on our financial statements.
Presentation of Comprehensive Income
On January 1, 2012, we adopted guidance issued by the FASB under ASU No. 2011-05,
Comprehensive Income (Topic 220): Presentation of Comprehensive Income
. This standard requires that all non-owner changes in stockholders’ equity be presented in either a single continuous statement of comprehensive income or in two separate but consecutive statements and eliminates the option to present other comprehensive income in the statement of changes in equity. We adopted this guidance by presenting comprehensive income (loss) in a separate consecutive financial statement.
Fair Value Disclosure Requirements
On January 1, 2012, we adopted guidance issued by the FASB under ASU No. 2011-04, Fair Value Measurement (Topic 820):
Amendments to Achieve Common Fair Value Measurement and Disclosure Requirements in U.S. GAAP and IFRSs
. This standard clarifies the application of certain existing fair value measurement guidance and expands the disclosures for fair value measurement that are estimated using significant unobservable (Level 3) inputs. Adoption of this guidance did not have a material impact on our financial statements.
Testing Indefinite-Lived Intangible Assets for Impairment
In July 2012, the FASB issued ASU No. 2012-02,
Intangibles-Goodwill and Other, Testing Indefinite-Lived Assets for Impairment
. The revised standard provides entities an option to perform a qualitative assessment to determine whether the existence of events and circumstances indicate that it is more likely than not that the indefinite-lived intangible asset is impaired. If an entity concludes, as a result of its qualitative assessment, that it is more likely than not that the fair value of indefinite-lived intangible asset is less than its carrying amount, then the quantitative impairment test is required. Otherwise, no further testing is required. This standard is effective for annual and interim impairment tests performed for fiscal years beginning after September 15, 2012, with early adoption permitted. Adoption of this guidance will not have a material impact on our financial statements as we currently do not own indefinite-lived intangible assets.
Reporting of Amounts Reclassified Out of Accumulated Other Comprehensive Income
In February 2013, the FASB issued ASU No. 2013-02, Reporting of Amounts Reclassified Out of Accumulated Other Comprehensive Income. The revised standard requires an entity to provide information about the amounts reclassified out of accumulated other comprehensive income by component and present significant amounts reclassified by the respective line items of the net income but only if the reclassified amount is required to be reclassified by U.S.GAAP. Amounts not required to be reclassified by U.S. GAAP must be cross-referenced to other disclosure required by U.S. GAAP that provide additional detail about those amounts. This standard is effective prospectively for reporting periods after December 15, 2012, with early adoption permitted. Adoption of this guidance is not expected to have a material impact on our financial statements.
Net losses are divided by the weighted average number of common shares outstanding during the year to calculate basic net loss per common share. Diluted net loss per common share is calculated to give effect to stock options and other share-based awards. The following table sets forth the computation of basic and diluted loss per share (in thousands, except per share data):
|
|
Years Ended December 31,
|
|||||||||||
|
|
2012
|
2011
|
2010
|
|||||||||
|
Numerator:
|
||||||||||||
|
Net loss
|
$ | (8,254 | ) | $ | (26,443 | ) | $ | (3,608 | ) | |||
|
Denominator:
|
||||||||||||
|
Basic and diluted weighted average common shares outstanding
|
51,452 | 52,612 | 52,072 | |||||||||
|
Basic and diluted net loss per share
|
$ | (0.16 | ) | $ | (0.50 | ) | $ | (0.07 | ) | |||
- 51 -
The following potential common shares were excluded from the computation of diluted net loss per share because their effect would have been anti-dilutive (in thousands):
|
|
Years Ended December 31,
|
|||||||||||
|
|
2012
|
2011
|
2010
|
|||||||||
|
Restricted awards (includes restricted stock and restricted stock units)
|
4 | 11 | 49 | |||||||||
|
Warrants
|
950 | 970 | 970 | |||||||||
|
Stock options
|
6,516 | 4,833 | 4,053 | |||||||||
Subsequent Issuance of Potential Common Shares
In January 2013, we granted 100,000 stock options to an employee. See Note 12 —
“Share-Based Compensation”
for further details regarding this grant.
In January 2013, warrants to purchase 50,000 shares of our common stock were exercised. See Note 11 —
“Stockholders’ Equity”
for further details regarding this exercise.
Restricted Cash
We have pledged cash in connection with stand-by letters of credit, credit cards, and contingent payments resulting from a business acquisition. We have deposited corresponding amounts into money market and non-interest bearing accounts at three financial institutions for these items as follows (in thousands):
|
December 31,
|
||||||||
|
2012
|
2011
|
|||||||
|
Contingent and other consideration for acquisition
|
$ | 2,504 | $ | 2,504 | ||||
|
Collateral for stand-by letters of credit
|
2,416 | 3,094 | ||||||
|
Collateral for credit cards
|
315 | — | ||||||
|
Collateral for equipment promissory note
|
— | 89 | ||||||
|
Current restricted cash
|
$ | 5,235 | $ | 5,687 | ||||
|
Contingent and other consideration for acquisition
|
$ | 1,000 | $ | 1,000 | ||||
|
Collateral for stand-by letters of credit
|
3,366 | 4,232 | ||||||
|
Non-current restricted cash
|
$ | 4,366 | $ | 5,232 | ||||
|
Total restricted cash
|
$ | 9,601 | $ | 10,919 | ||||
Accounts Receivable
Accounts receivable consisted of the following (in thousands):
|
|
December 31,
|
|||||||
|
|
2012
|
2011
|
||||||
|
Accounts receivable
|
$ | 13,457 | $ | 6,746 | ||||
|
Less: allowance for doubtful accounts
|
(217 | ) | (248 | ) | ||||
| $ | 13,240 | $ | 6,498 | |||||
Accounts receivable increased significantly at the end of 2012 primarily due to five large mega-project shipments during the fourth quarter of 2012.
Unbilled Receivables
We have unbilled receivables pertaining to customer contractual holdback provisions, whereby we invoice the final retention payment(s) due under certain sales contracts in periods generally ranging from 12 to 24 months, and in some instances up to 36 months, after the product has been shipped to the customer and revenue has been recognized.
- 52 -
Unbilled receivables consisted of the following (in thousands):
|
December 31,
|
||||||||
|
|
2012
|
2011
|
||||||
|
Unbilled receivables, current
|
5,020 | $ | 1,059 | |||||
|
Unbilled receivables, non-current
|
868 | — | ||||||
| $ | 5,888 | $ | 1,059 | |||||
Unbilled receivables increased significantly at the end of 2012 primarily due to five large mega-project shipments during the fourth quarter of 2012.
Inventories
Our inventories consisted of the following (in thousands):
|
|
December 31,
|
|||||||
|
|
2012
|
2011
|
||||||
|
Raw materials
|
$ | 3,406 | $ | 4,683 | ||||
|
Work in process
|
1,489 | 1,550 | ||||||
|
Finished goods
|
240 | 1,591 | ||||||
| $ | 5,135 | $ | 7,824 | |||||
Excess and obsolete valuation reserve adjustments reflected as a reduction of inventory at December 31, 2012 and 2011 were $1.6 million and $704,000, respectively. During the year ended December 31, 2011, we recorded a charge of $632,000 in cost of goods sold for the reduction of inventory resulting from the consolidation of our North American manufacturing operations.
Prepaid and Other Current Assets
Prepaid expenses and other current assets consisted of the following (in thousands):
|
|
December 31,
|
|||||||
|
|
2012
|
2011
|
||||||
|
Prepaid income taxes and carryback tax refund
|
$ | 3,221 | $ | 3,224 | ||||
|
Deferred cost of goods sold
|
— | 453 | ||||||
|
Interest receivable
|
140 | 257 | ||||||
|
Supplier advances
|
222 | 180 | ||||||
|
Other prepaid expenses and current assets
|
662 | 815 | ||||||
| $ | 4,245 | $ | 4,929 | |||||
Property and Equipment
Property and equipment held for use consisted of the following (in thousands):
|
|
December 31,
|
|||||||
|
|
2012
|
2011
|
||||||
|
Machinery and equipment
|
$ | 11,780 | $ | 11,072 | ||||
|
Office equipment, furniture, and fixtures
|
1,545 | 1,443 | ||||||
|
Automobiles
|
22 | 22 | ||||||
|
Software
|
507 | 503 | ||||||
|
Leasehold improvements
|
9,930 | 9,284 | ||||||
|
Construction in progress
|
1,489 | 465 | ||||||
| 25,273 | 22,789 | |||||||
|
Less: accumulated depreciation and amortization
|
(9,306 | ) | (6,619 | ) | ||||
| $ | 15,967 | $ | 16,170 | |||||
As a result of the consolidation of our North American manufacturing operations, amounts related to the building and land are classified as held for sale as of December 31, 2012 and 2011. Accordingly, we stopped depreciating these assets effective December 2011. We measure long-lived assets held for sale at the lower of carrying amount or estimated fair value. We impaired the building and land held for sale by $314,000 and $728,000 in 2012 and 2011, respectively, to reduce the carrying value to estimated fair value. This impairment was recorded as a loss in our consolidated statement of operations in the caption “Restructuring Charges.” See Note 15 —
“Restructuring Activities”
for additional details of our North American restructuring.
- 53 -
The building and land, located in Michigan, were listed for sale with a commercial agent during 2012 and 2011. We continue to assess the estimated fair value of the assets held for sale on an ongoing basis until the assets are sold. We anticipate the building and land will be sold during 2013.
Property held for sale as of December 31, 2012 was as follows:
|
|
Building
|
Land
|
Total
|
|||||||||
|
Gross value
|
$ | 2,297 | $ | 210 | $ | 2,507 | ||||||
|
Accumulated depreciation
|
(119 | ) | — | (119 | ) | |||||||
|
Impairment
|
(954 | ) | (89 | ) | (1,043 | ) | ||||||
| $ | 1,224 | $ | 121 | $ | 1,345 | |||||||
Depreciation and amortization expense related to all property and equipment, including equipment acquired under capital leases, was approximately $2.8 million, $3.4 million, and $2.6 million for the years ended December 31, 2012, 2011, and 2010, respectively.
Construction in progress costs at December 31, 2012 related primarily to
a project to upgrade our enterprise resource planning (“ERP”) system to streamline our business processes and allow for cost-efficient scalability, flexibility, and improved management reporting and analysis
. As of December 31, 2012, none of the assets related to construction in progress have been placed in service and therefore have not yet been subject to depreciation or amortization. We estimate the costs to complete the ERP project to be approximately $400,000 as of December 31, 2012 and expect to complete the project within the first half of 2013.
Accrued Expenses and Other Current Liabilities
Accrued expenses and other current liabilities consisted of the following (in thousands):
|
|
December 31,
|
|||||||
|
|
2012
|
2011
|
||||||
|
Payroll and commissions payable
|
$ | 4,687 | $ | 3,595 | ||||
|
Other accrued expenses and current liabilities
|
2,362 | 1,840 | ||||||
|
Contingent consideration and legal expenses, current portion
|
1,506 | 1,039 | ||||||
| $ | 8,555 | $ | 6,474 | |||||
Non-Current Liabilities
Non-current liabilities consisted of the following (in thousands):
|
|
December 31,
|
|||||||
|
|
2012
|
2011
|
||||||
|
Deferred rent expense, non-current
|
$ | 1,200 | $ | 1,085 | ||||
|
Contingent consideration, non-current
|
1,000 | 1,000 | ||||||
| $ | 2,200 | $ | 2,085 | |||||
Revenue by Product Category
We manufacture and sell high-efficiency energy recovery products, high-pressure pumps, and related parts and services under one operating segment (see Note 13 —
“Business Segment and Geographic Information”
). Although we operate under one reporting segment, we categorize revenue based on type of energy recovery device and its related products and services. The following table reflects revenue by product category for the periods indicated (in thousands):
|
|
Years Ended
December 31,
|
|||||||||||
|
|
2012
|
2011
|
2010
|
|||||||||
|
PX devices and related products and services
|
$ | 34,400 | $ | 18,540 | $ | 27,850 | ||||||
|
Turbochargers and pumps and related products and services
|
8,232 | 9,507 | 18,003 | |||||||||
| $ | 42,632 | $ | 28,047 | $ | 45,853 | |||||||
- 54 -
Advertising Expense
Advertising expense is charged to operations in the year in which it is incurred. Total advertising expense amounted to $16,000, $32,000, and $112,000 for the years ended December 31, 2012, 2011, and 2010, respectively.
Our short-term and long-term investments are all classified as available-for-sale. There were no sales of available-for-sale securities during the years ended December 31, 2012, 2011, and 2010.
Available-for-sale securities at December 31, 2012 consisted of the following (in thousands):
|
Amortized
Cost
|
Gross
Unrealized
Holding Gains
|
Gross
Unrealized
Holding Losses
|
Fair Value
|
|||||||||||||
|
Short-term investments
|
||||||||||||||||
|
Certificates of deposit
|
$ | 250 | $ | — | $ | — | $ | 250 | ||||||||
|
State and local government obligations
|
2,444 | 3 | (1 | ) | 2,446 | |||||||||||
|
Corporate notes and bonds
|
6,799 | 3 | (1 | ) | 6,801 | |||||||||||
|
Total short-term investments
|
$ | 9,493 | $ | 6 | $ | (2 | ) | $ | 9,497 | |||||||
|
Long-term investments
|
||||||||||||||||
|
State and local government obligations
|
1,381 | 6 | (2 | ) | 1,385 | |||||||||||
|
Corporate notes and bonds
|
3,381 | 13 | (6 | ) | 3,388 | |||||||||||
|
Total long-term investments
|
$ | 4,762 | $ | 19 | $ | (8 | ) | $ | 4,773 | |||||||
| $ | 14,255 | $ | 25 | $ | (10 | ) | $ | 14,270 | ||||||||
Available-for-sale securities at December 31, 2011 consisted of the following (in thousands):
|
Amortized
Cost
|
Gross
Unrealized
Holding Gains
|
Gross
Unrealized
Holding Losses
|
Fair Value
|
|||||||||||||
|
Short-term investments
|
||||||||||||||||
|
Certificates of deposit
|
$ | 750 | $ | — | $ | — | $ | 750 | ||||||||
|
Commercial paper
|
1,000 | — | — | 1,000 | ||||||||||||
|
State and local government obligations
|
1,611 | — | (3 | ) | 1,608 | |||||||||||
|
Corporate notes and bonds
|
8,353 | 1 | (6 | ) | 8,348 | |||||||||||
|
Total short-term investments
|
$ | 11,714 | $ | 1 | $ | (9 | ) | $ | 11,706 | |||||||
|
Long-term investments
|
||||||||||||||||
|
Agency obligations
|
$ | 750 | $ | — | $ | — | $ | 750 | ||||||||
|
State and local government obligations
|
2,032 | 1 | (1 | ) | 2,032 | |||||||||||
|
Corporate notes and bonds
|
8,422 | 7 | (13 | ) | 8,416 | |||||||||||
|
Total long-term investments
|
$ | 11,204 | $ | 8 | $ | (14 | ) | $ | 11,198 | |||||||
| $ | 22,918 | $ | 9 | $ | (23 | ) | $ | 22,904 | ||||||||
Expected maturities can differ from contractual maturities because borrowers may have the right to prepay obligations without prepayment penalties. The amortized cost and fair value of available-for-sale securities that had stated maturities as of December 31, 2012 are shown below by contractual maturity (in thousands):
|
December 31, 2012
|
||||||||
|
Amortized Cost
|
Fair Value
|
|||||||
|
Due in one year or less
|
$ | 1,736 | $ | 1,735 | ||||
|
Due after one year through three years
|
12,519 | 12,535 | ||||||
| $ | 14,255 | $ | 14,270 | |||||
Goodwill
Goodwill as of December 31, 2012 was the result of our acquisition of Pump Engineering, LLC in December 2009. We perform an annual impairment test of goodwill during our fourth quarter at the reporting unit level using a fair value approach. No impairment of goodwill has been recorded in the accompanying financial statements.
- 55 -
The net carrying amount of goodwill was $12.8 million for the years ended December 31, 2012, 2011, and 2010.
Other Intangible Assets
The components of identifiable intangible assets, all of which are finite-lived, were as follows (in thousands):
|
|
December 31, 2012
|
||||||||||||||||||||
|
|
Gross
Carrying
Amount
|
Accumulated
Amortization
|
Accumulated
Impairment
Losses
|
Net
Carrying
Amount
|
Weighted
Average
Useful Life
|
Amortization
Method (1)
|
|||||||||||||||
|
Developed Technology
|
$ | 6,100 | $ | (1,881 | ) | $ | — | $ | 4,219 | 10 |
SL
|
||||||||||
|
Non-compete agreements
|
1,310 | (1,015 | ) | — | 295 | 4 |
SL
|
||||||||||||||
|
Backlog
|
1,300 | (1,300 | ) | — | — | 1 |
SL
|
||||||||||||||
|
Trademarks
|
1,200 | (180 | ) | (1,020 | ) | — | 20 |
SL
|
|||||||||||||
|
Customer relationships
|
990 | (792 | ) | — | 198 | 5 |
SOYD
|
||||||||||||||
|
Patents
|
585 | (326 | ) | (42 | ) | 217 | 18 |
SL
|
|||||||||||||
| $ | 11,485 | $ | (5,494 | ) | $ | (1,062 | ) | $ | 4,929 | 9 | |||||||||||
|
|
December 31, 2011
|
||||||||||||||||||||
|
|
Gross
Carrying
Amount
|
Accumulated
Amortization
|
Accumulated
Impairment
Losses
|
Net
Carrying
Amount
|
Weighted
Average
Useful Life
|
Amortization
Method (1)
|
|||||||||||||||
|
Developed Technology
|
$ | 6,100 | $ | (1,271 | ) | $ | — | $ | 4,829 | 10 |
SL
|
||||||||||
|
Non-compete agreements
|
1,310 | (861 | ) | — | 449 | 4 |
SL
|
||||||||||||||
|
Backlog
|
1,300 | (1,300 | ) | — | — | 1 |
SL
|
||||||||||||||
|
Trademarks
|
1,200 | (125 | ) | — | 1,075 | 20 |
SL
|
||||||||||||||
|
Customer relationships
|
990 | (594 | ) | — | 396 | 5 |
SOYD
|
||||||||||||||
|
Patents
|
585 | (301 | ) | (42 | ) | 242 | 18 |
SL
|
|||||||||||||
| $ | 11,485 | $ | (4,452 | ) | $ | (42 | ) | $ | 6,991 | 9 | |||||||||||
(1) SL means Straight-Line and SOYD means Sum-of-Year’s-Digits
In 2012, we determined that capitalized cost associated with our acquired trademark intangibles was impaired with the launch of the Company’s new branding strategy in the fourth quarter of 2012 and the discontinuation of the use of the associated trademarks “PEI” and “Pump Engineering.” Accordingly, we recorded an impairment charge of $1.0 million in our consolidated statements of operations for the year ended December 31, 2012.
During 2010, we determined that capitalized costs associated with a patent application were impaired as a result of the rejection of the application by the U.S. Patent and Trademark office. Accordingly, we recorded an impairment charge of $11,000 in general and administrative expense for the year ended December 31, 2010. Accumulated impairment losses for patents at December 31, 2012 (including a $31,000 impairment loss from 2007) aggregate to $42,000.
No other impairments of intangible assets were identified during the periods presented.
Amortization of intangibles was approximately $1.0 million, $1.4 million, and $2.6 million for the years ended December 31, 2012, 2011, and 2010, respectively.
Future estimated amortization expense on intangible assets is as follows (in thousands):
|
|
December 31,
|
|||
|
2013
|
$ | 921 | ||
|
2014
|
842 | |||
|
2015
|
635 | |||
|
2016
|
631 | |||
|
2017
|
631 | |||
|
Thereafter
|
1,269 | |||
| $ | 4,929 | |||
- 56 -
We follow the authoritative guidance for fair value measurements and disclosures that, among other things, defines fair value, establishes a consistent framework for measuring fair value, and expands disclosure for each major asset and liability category measured at fair value on either a recurring or nonrecurring basis. Fair value is defined as an exit price that would be received to sell an asset or paid to transfer a liability in an orderly transaction between market participants. As such, fair value is a market-based measurement that should be determined based on assumptions that market participants would use in pricing an asset or liability.
The framework for measuring fair value provides a hierarchy that prioritizes the inputs to valuation techniques used in measuring fair value as follows:
Level 1 — Quoted prices (unadjusted) in active markets for identical assets or liabilities;
Level 2 — Inputs other than quoted prices included within Level 1 that are either directly or indirectly observable; and
Level
3 — Unobservable inputs in which little or no market activity exists, therefore requiring an entity to develop its own estimates of assumptions that market participants would use in pricing an asset or liability.
Fair Value of Financial Instruments
The carrying values of cash and cash equivalents, restricted cash, accounts receivable, accounts payable, and other accrued expenses approximate fair value due to the short-term maturity of those instruments. For our investments in available-for-sale securities, if quoted prices in active markets for identical investments are not available to determine fair value (Level 1), then we use quoted prices for similar assets or inputs other than the quoted prices that are observable either directly or indirectly (Level 2). The investments included in Level 2 consist primarily of certificates of deposit, commercial paper, and municipal, corporate, and agency obligations. The carrying amount of the contingent consideration arising from our acquisition of Pump Engineering, LLC is measured at fair value on a recurring basis using unobservable inputs in which little or no market activity exists (Level 3). The estimated fair value of the contingent consideration is determined based entirely on management’s assessment of the weighted probability of payment under various scenarios that range from 50% to 100% depending on the nature of the milestone. The valuation of the contingent consideration is subject to uncertainties that are difficult to predict. Factors that may affect our valuation include changes to our expectations with respect to the outcome of these milestones.
The fair value of financial assets and liabilities measured on a recurring basis is as follows (in thousands):
| Fair Value Measurement at Reporting Date Using | ||||||||||||||||
|
|
December 31,
2012
|
Level 1
Inputs
|
Level 2
Inputs
|
Level 3
Inputs
|
||||||||||||
|
Assets:
|
||||||||||||||||
|
Available-for-sale securities
|
$ | 14,270 | $ | — | $ | 14,270 | $ | — | ||||||||
|
Liabilities:
|
||||||||||||||||
|
Contingent consideration
|
$ | 1,524 | $ | — | $ | — | $ | 1,524 | ||||||||
| Fair Value Measurement at Reporting Date Using | ||||||||||||||||
|
December 31,
2011
|
Level 1
Inputs
|
Level 2
Inputs
|
Level 3
Inputs
|
|||||||||||||
|
Assets:
|
||||||||||||||||
|
Available-for-sale securities
|
$ | 22,904 | $ | — | $ | 22,904 | $ | — | ||||||||
|
Liabilities:
|
||||||||||||||||
|
Contingent consideration
|
$ | 1,524 | $ | — | $ | — | $ | 1,524 | ||||||||
A reconciliation of the beginning and ending balances for financial assets and liabilities measured on a recurring basis using significant unobservable inputs (Level 3) for the years ended December 31, 2012 and 2011 is as follows (in thousands):
- 57 -
|
|
Contingent
Consideration
|
|||
|
Balance, December 31, 2010
|
$ | 1,353 | ||
|
Loss due to change in fair value
(1)
|
171 | |||
|
Balance, December 31, 2011
|
$ | 1,524 | ||
|
Loss due to change in fair value
|
— | |||
|
Balance, December 31, 2012
|
$ | 1,524 | ||
(1)
Reported in the Consolidated Statement of Operations within the caption Loss (gain) on fair value remeasurement
Fair Value of Assets Held for Sale
As of December 31, 2012, we had assets held for sale of $1.3 million related to our Michigan manufacturing facility. The assets included a building and land. The fair value of these assets was determined based on Level 2 inputs, primarily sales data for similar properties. Losses recognized in fiscal year 2012 due to fair value remeasurements using Level 2 inputs were $0.3 million. The fair value of assets held for sale, measured on a nonrecurring basis, is as follows (in thousands):
|
|
December 31,
2012
|
Level 1
Inputs
|
Level 2
Inputs
|
Level 3
Inputs
|
Total Gains
(Losses)
|
|||||||||||||||
|
Assets held for sale
|
$ | 1,345 | $ | — | $ | 1,345 | $ | — | $ | (1,043 | ) | |||||||||
|
December 31,
2011
|
Level 1
Inputs
|
Level 2
Inputs
|
Level 3
Inputs
|
Total Gains
(Losses)
|
||||||||||||||||
|
Assets held for sale
|
$ | 1,660 | $ | — | $ | 1,660 | $ | — | $ | (728 | ) | |||||||||
Notes Payable
In March 2007, we entered into a $1.0 million equipment promissory note. This equipment promissory note had an interest rate of cost of funds plus 2.75% and matured in September 2012. The interest rate for the equipment promissory note at December 31, 2011 was 7.81%. As of December 31, 2012 and 2011, the amount outstanding on the equipment promissory note was as follows (in thousands):
|
|
December 31,
|
|||||||
|
|
2012
|
2011
|
||||||
|
Promissory notes payable
|
$ | — | $ | 85 | ||||
|
Less: current portion
|
— | (85 | ) | |||||
|
Long-term debt, non-current portion
|
$ | — | $ | — | ||||
Capital Leases
We lease certain equipment under agreements classified as capital leases. The terms of the lease agreements generally extend up to five years. As of December 31, 2012, costs and accumulated depreciation of equipment under capital leases were $179,000 and $79,000, respectively. As of December 31, 2011, costs and accumulated depreciation of equipment under capital leases were $449,000 and $134,000, respectively.
Future minimum payments under capital leases consist of the following (in thousands):
|
|
December 31,
|
|||
|
2013
|
$ | 18 | ||
|
Total future minimum lease payments
|
18 | |||
|
Less: amount representing interest
|
— | |||
|
Present value of net minimum capital lease payments
|
18 | |||
|
Less: current portion
|
(18 | ) | ||
|
Long-term portion
|
$ | — | ||
- 58 -
Lines of Credit
On June 5, 2012, we entered into a loan agreement (the “2012 Agreement”) with a financial institution. The 2012 Agreement provides for a total available credit line of $16.0 million. Under the 2012 Agreement, we are allowed to draw advances not to exceed, at any time, $10.0 million as revolving loans. The total stand-by letters of credit issued under the 2012 Agreement may not exceed the lesser of the $16.0 million credit line or the credit line minus all outstanding revolving loans. At no time may the aggregate of the revolving loans and stand-by letters of credit exceed the total available credit line of $16.0 million. Revolving loans may be in the form of a base rate loan that bears interest equal to the prime rate plus 0% or a Eurodollar loan that bears interest equal to the adjusted LIBO rate plus 1.25%. Stand-by letters of credit are subject to customary fees and expenses for issuance or renewal. The unused portion of the credit facility is subject to a facility fee in an amount equal to 0.25% per annum of the average unused portion of the revolving line. The 2012 Agreement also requires us to maintain a cash collateral balance equal to 101% of all outstanding advances and all outstanding stand-by letters of credit collateralized by the line of credit. The 2012 Agreement matures on June 5, 2015 and is collateralized by substantially all of our assets. As of December 31, 2012, there were no advances drawn and $1.4 million in stand-by letters of credit collateralized under the 2012 Agreement’s line of credit.
We are subject to certain financial and administrative covenants under the 2012 Agreement. As of December 31, 2012, we were in compliance with these covenants.
In 2009, we entered into a loan and security agreement (the “2009 Agreement”) with another financial institution. The 2009 Agreement, as amended, provided a total available credit line of $16.0 million. Under the 2009 Agreement, we were allowed to draw advances of up $10.0 million on a revolving line of credit or utilize up to $15.9 million as collateral for stand-by letters of credit, provided that the aggregate of the outstanding advances and collateral did not exceed the total available credit line of $16.0 million. Advances under the revolving line of credit incurred interest based on a prime rate index or LIBOR plus 1.375%. The 2009 Agreement, as amended, required us to maintain cash collateral balances equal to at least 101% of the face amount of all outstanding stand-by letters of credit collateralized by the line of credit and 100% of the amount of all outstanding advances. The 2009 Agreement, as amended, expired on May 30, 2012. There were no advances drawn under the 2009 Agreement’s credit line at the time of expiration. The amount of outstanding stand-by letters of credit collateralized under the 2009 Agreement at December 31, 2011 totaled $6.7 million. As of December 31, 2012, remaining stand-by letters of credit issued under the 2009 Agreement, for which we have restricted cash, totaled $4.3 million.
In 2008, we entered into a credit agreement (the “2008 Agreement”) with yet another financial institution. The 2008 Agreement, as amended, was terminated during the first quarter of 2009. As a result of terminating the 2008 Agreement, we were required to transfer cash to a restricted cash account as collateral for outstanding stand-by letters of credit that were collateralized by the agreement as of the date of its termination. We were also required to restrict cash as collateral for the outstanding balance on our equipment promissory note. As of December 31, 2012, there were no outstanding stand-by letters of credit or equipment promissory note as the stand-by letters of credit was transferred to our 2012 Agreement and the promissory note was fully paid in 2012. Accordingly, no cash was restricted in connection to the 2008 Agreement.
See Note 9 —
“Commitments and Contingencies,”
for further discussion of restricted cash associated with stand-by letters of credit.
Operating Lease Obligations
We lease facilities under fixed non-cancelable operating leases that expire on various dates through November 2019. Future minimum lease payments consist of the following (in thousands):
|
|
December 31,
|
|||
|
2013
|
1,558 | |||
|
2014
|
1,627 | |||
|
2015
|
1,544 | |||
|
2016
|
1,581 | |||
|
2017
|
1,569 | |||
|
Thereafter
|
2,923 | |||
| $ | 10,802 | |||
- 59 -
Total rent and lease expense was $1.4 million, $1.6 million, and $1.9 million for the years ended December 31, 2012, 2011, and 2010, respectively.
Warranty
Changes in our accrued warranty reserve and the expenses incurred under our warranties were as follows (in thousands):
|
|
Years Ended
December 31,
|
|||||||||||
|
|
2012
|
2011
|
2010
|
|||||||||
|
Balance, beginning of period
|
$ | 852 | $ | 1,028 | $ | 605 | ||||||
|
Warranty costs charged to cost of revenue
|
601 | 589 | 846 | |||||||||
|
Utilization of warranty
|
(281 | ) | (765 | ) | (423 | ) | ||||||
|
Balance, end of period
|
$ | 1,172 | $ | 852 | $ | 1,028 | ||||||
Purchase Obligations
We have purchase order arrangements with our vendors for which we have not received the related goods or services as of December 31, 2012. These arrangements are subject to change based on our sales demand forecasts, and we have the right to cancel the arrangements prior to the date of delivery. The majority of these purchase order arrangements were related to various raw materials and components parts. As of December 31, 2012, we had approximately $2.4 million of open cancelable purchase order arrangements related primarily to materials and parts.
Guarantees
We enter into indemnification provisions under our agreements with other companies in the ordinary course of business, typically with customers. Under these provisions, we generally indemnify and hold harmless the indemnified party for losses suffered or incurred by the indemnified party as a result of our activities, generally limited to personal injury and property damage caused by our employees at a customer’s desalination plant in proportion to the employee’s percentage of fault for the accident. Damages incurred for these indemnifications would be covered by our general liability insurance to the extent provided by the policy limitations. We have not incurred material costs to defend lawsuits or settle claims related to these indemnification agreements. As a result, the estimated fair value of these agreements is not material. Accordingly, we had no liabilities recorded for these agreements as of December 31, 2012 and 2011.
In certain cases, we issue warranty and product performance guarantees to our customers for amounts ranging from 10% to 30% of the total sales agreement to endorse the execution of product delivery and the warranty of design work, fabrication, and operating performance of the PX device. These guarantees are generally stand-by letters of credit and remain in place for periods ranging from 12 to 36 months, which relate to the underlying product warranty period. The stand-by letters of credit, collateralized by restricted cash, are as follows (in thousands):
|
|
December 31,
|
|||||||
|
|
2012
|
2011
|
||||||
|
2009 Agreement
|
$ | 4,297 | $ | 6,739 | ||||
|
2012 Agreement
|
1,428 | — | ||||||
|
2008 Agreement
|
— | 495 | ||||||
| $ | 5,725 | $ | 7,234 | |||||
Cash collateral balances generally require a premium equal to approximately 1.0% to 5.0% of the amount of the corresponding stand-by letters of credit. As a result, the balance of restricted cash related to stand-by letters of credit at December 31, 2012 and 2011 totals $5.8 million and $7.3 million, respectively.
Litigation
Supplier Agreement
We are a defendant in a claim made by a vendor related to a supply agreement. This lawsuit was filed on December 14, 2011, entitled “Morgan Technical Ceramics Auburn, Inc. v. Energy Recovery, Inc.” in the Alameda County Superior Court of California. In 2008, we entered into a supply agreement with a vendor to manage the cost and availability of key raw materials and components. The agreement was amended in 2010. Under the terms of the amended agreement, we committed to future minimum annual purchases of raw materials and components through 2013. If annual purchase commitments were not met, a penalty of approximately 35% of the remaining open annual minimum purchase requirement could be assessed by the vendor. In June 2011, due to ongoing quality
- 60 -
issues, we terminated the agreement on the basis of a material breach by the vendor. While we believe that we have meritorious defenses against the suit and are aggressively defending the litigation, the ultimate resolution of this matter, which is expected to occur in 2013, could result in a loss ranging from $0 to $1.0 million in excess of the amount accrued.
Contingent Consideration
We are a defendant in a claim made by the former shareholders of Pump Engineering, LLC. This lawsuit was filed August 8, 2011, entitled “Roy Radakovich, as representative on behalf of former shareholders of Pump Engineering, LLC v. Energy Recovery, Inc.,” in the U.S. District Court for the Eastern District of Michigan (Southern Division). We acquired Pump Engineering, LLC in December 2009. Under the terms of the purchase agreement, $3.5 million of consideration was contingent upon achievement of certain performance milestones. These performance milestones were tied to: (i) achieving certain minimum product energy efficiency metrics ($1.3 million); (ii) meeting certain product delivery time schedules ($1.2 million); and (iii) meeting certain product warranty metrics ($1.0 million). During the fourth quarter of 2010, the first two performance milestones were not met. Accordingly, we withheld payment of $2.5 million under the contractual terms of the purchase agreement. In their lawsuit, the former shareholders of Pump Engineering, LLC seek damages in the amount of $2.5 million and their litigation costs.
We filed a motion to dismiss all claims in the complaint in this case on November 7, 2011. The plaintiff filed an opposition brief in December 2011, and we filed a reply brief in January 2012. The matter was argued to the court on January 25, 2012, and on September 30, 2012, the Court dismissed one of the three claims. We continue to believe that our decision to withhold the two performance-based milestone payments was justified, and we intend to defend this case vigorously.
The components of the (benefit) provision for income taxes consist of the following (in thousands):
|
|
Years Ended December 31,
|
|||||||||||
|
|
2012
|
2011
|
2010
|
|||||||||
|
Current tax (benefit) provision:
|
||||||||||||
|
Federal
|
$ | (3 | ) | $ | (1,584 | ) | $ | (1,807 | ) | |||
|
State
|
(434 | ) | 17 | 46 | ||||||||
|
Foreign
|
35 | 30 | 3 | |||||||||
| $ | (402 | ) | $ | (1,537 | ) | $ | (1,758 | ) | ||||
|
Deferred tax provision (benefit):
|
||||||||||||
|
Federal
|
212 | 2,431 | 365 | |||||||||
|
State
|
(72 | ) | 405 | (233 | ) | |||||||
| $ | 140 | $ | 2,836 | $ | 132 | |||||||
|
Total (benefit) provision for income taxes
|
$ | (262 | ) | $ | 1,299 | $ | (1,626 | ) | ||||
A reconciliation of income taxes computed at the statutory federal income tax rate to the provision (benefit) for income taxes included in the accompanying statements of operations is as follows (in thousands, except percentages):
|
|
Years Ended December 31,
|
|||||||||||
|
|
2012
|
2011
|
2010
|
|||||||||
|
U.S. federal taxes at statutory rate
|
(34 | )% | (34 | )% | (34 | )% | ||||||
|
Non-benefited losses stemming from valuation allowance on current year
|
32 | % | 26 | % | — | |||||||
|
Prior year deferred tax benefit valuation allowance
|
— | 10 | % | — | ||||||||
|
State income tax, net of federal benefit
|
(6 | )% | 2 | % | (5 | )% | ||||||
|
Share-based compensation
|
5 | % | 2 | % | 10 | % | ||||||
|
Other
|
— | (1 | )% | (2 | )% | |||||||
|
Effective tax rate
|
(3 | )% | 5 | % | (31 | )% | ||||||
- 61 -
Total deferred tax assets and liabilities consist of the following (in thousands):
|
|
Years Ended December 31,
|
|||||||
|
|
2012
|
2011
|
||||||
|
Deferred tax assets:
|
||||||||
|
Net operating loss carry forwards
|
$ | 7,546 | $ | 7,378 | ||||
|
Acquired intangibles
|
1,401 | 997 | ||||||
|
Accruals and reserves
|
5,229 | 3,920 | ||||||
|
Research and development credit carryforwards
|
572 | 463 | ||||||
|
Charitable contributions
|
7 | 8 | ||||||
| 14,755 | 12,766 | |||||||
|
Valuation Allowance
|
(12,690 | ) | (10,343 | ) | ||||
|
Net deferred tax assets
|
$ | 2,065 | $ | 2,423 | ||||
|
Deferred tax liabilities:
|
||||||||
|
Depreciation on property and equipment
|
$ | (1,972 | ) | $ | (2,325 | ) | ||
|
Unrecognized gain on translation of foreign currency receivables
|
(93 | ) | (98 | ) | ||||
|
Goodwill
|
(1,206 | ) | (1,056 | ) | ||||
|
Total deferred tax liabilities
|
$ | (3,271 | ) | $ | (3,479 | ) | ||
|
Net deferred tax liabilities
|
$ | (1,206 | ) | $ | (1,056 | ) | ||
|
As reported on the balance sheet:
|
||||||||
|
Current assets, net
|
$ | 500 | $ | 460 | ||||
|
Non-current liabilities
|
(1,706 | ) | (1,516 | ) | ||||
|
Net deferred tax liabilities
|
$ | (1,206 | ) | $ | (1,056 | ) | ||
We had net deferred tax assets of approximately $11.5 million and $9.3 million at December 31, 2012 and 2011, respectively, relating principally to accrued expenses, acquired intangibles (including goodwill), stock-based compensation, fixed assets, and inventory. In assessing the recoverability of deferred tax assets, we consider whether it is more likely than not that the assets will be realized. The ultimate realization of deferred tax assets is dependent upon the generation of future taxable income during the periods in which those temporary differences become deductible.
We consider, among other things, projected future taxable income in making this assessment. Based upon the projections for future taxable income over the periods in which the deferred tax items are not recognizable for tax reporting purposes, we have determined that it is more likely than not that the we will not realize the benefits of these differences at December 31, 2012.
As of December 31, 2012, a valuation allowance of approximately $12.7 million was established to reduce our deferred income tax assets to the amount expected to be realized. The valuation allowance represents a provision for uncertainty as to the realization of tax benefits from these deferred income tax assets. We record net deferred income tax assets to the extent that we believe that it is more likely than not that these assets will be realized in accordance with generally accepted accounting principles. In making such a determination, we consider all available positive and negative evidence including recent results of operations, scheduled reversals of deferred tax liabilities, projected future income, and available tax planning strategies. We will continue to evaluate the tax benefit uncertainty and will adjust, if warranted, the valuation allowance in future periods to the extent that our deferred income tax assets become more likely than not to be realizable.
At December 31, 2012 and 2011, we had net operating loss carry-forwards of approximately $20.3 million and $19.8 million, respectively, for federal and $9.8 million and $7.7 million, respectively, for California. The net operating loss carry-forwards, if not utilized, will begin to expire in 2032 for both federal and California purposes. Utilization of the net operating loss carry-forwards is subject to a substantial annual limitation due to the ownership change limitations provided by the Internal Revenue Code and similar state provisions. The annual limitation will result in the expiration of the net operating loss carry-forwards before utilization. We have estimated the amount which may ultimately be realized and recorded deferred tax assets accordingly.
At December 31, 2012 and 2011, we had credit carry-forwards of approximately $300,000 and $300,000, respectively, for federal and approximately $413,000 and $247,000, respectively, for California. The credit carry-forwards, if not utilized, will begin to expire in 2022 for federal. The California credit carry-forwards do not expire. Utilization of the credit carry-forwards may be subject to a substantial annual limitation due to the ownership change limitations provided by the Internal Revenue Code and similar state provisions.
- 62 -
Measurement of uncertain tax positions is based on judgment regarding the largest amount that is greater than 50% likely of being realized upon the ultimate settlement with a taxing authority. The total amount of unrecognized tax benefits as of the date of adoption was immaterial. As a result of the implementation of this guidance, we recognized no increase in the liability for unrecognized tax benefits, and there were no unrecognized income tax benefits during the tax years ended December 31, 2012.
We recognize interest and/or penalties related to uncertain tax positions in income tax expense. There were no accrued interest or penalties associated with any unrecognized tax benefits as of December 31, 2012 and 2011.
We are subject to taxation in the U.S. and various states and foreign jurisdictions. There are no ongoing examinations by taxing authorities at this time. Our various tax years from 1996 to 2011 remain open in various taxing jurisdictions.
Preferred Stock
We have the authority to issue 10,000,000 shares of $0.001 par value preferred stock. Our Board of Directors has the authority, without action by our stockholders, to designate and issue shares of preferred stock in one or more series. The Board of Directors is also authorized to designate the rights, preferences, and voting powers of each series of preferred stock, any or all of which may be greater than the rights of the common stock including restrictions of dividends on the common stock, dilution of the voting power of the common stock, reduction of the liquidation rights of the common stock, and delaying or preventing a change in control of the Company without further action by our stockholders. To date, the Board of Directors has not designated any rights, preferences, or powers of any preferred stock, and as of December 31, 2012 and 2011, no shares of preferred stock were issued or outstanding.
Common Stock
We have the authority to issue 200,000,000 shares of $0.001 par value common stock. Subject to the preferred rights of the holders of shares of any class or series of preferred stock as provided by our Board of Directors with respect to any such class or series of preferred stock, the holders of the common stock shall be entitled to receive dividends, as and when declared by the Board of Directors. In the event of any liquidation, dissolution, or winding up of the Company, whether voluntary or involuntary, after the distribution or payment to the holders of shares of any class or series of preferred stock as provided by the Board of Directors with respect to any such class or series of preferred stock, the remaining assets of the Company available for distribution to stockholders shall be distributed among and paid to the holders of common stock ratably in proportion to the number of shares of common stock held by them. As of December 31, 2012, 52,685,129 shares were issued and 50,902,526 shares were outstanding. A total of 52,645,129 shares were issued and outstanding as of December 31, 2011.
Stock Repurchase Program
In June of 2011, our Board of Directors authorized a stock repurchase program under which up to five million shares of our outstanding common stock could be repurchased through June of 2012 at the discretion of management. A total of 1,782,603 shares at an aggregate cost of $4.0 million were repurchased under this authorization during the year ending December 31, 2012.
Warrants
Warrants to purchase an aggregate of 950,000 shares of our common stock at exercise prices ranging from $0.50 to $1.00 per share were outstanding as of December 31, 2012. The warrants, issued in 2003 through 2005, are fully exercisable over a 10-year term, expiring in 2013 through 2015.
During the year ended December 31, 2012, warrants to purchase 20,000 shares of common stock were exercised for cash at a price of $0.20 per share. The proceeds received from this exercise totaled $4,000. During the year ended December 31, 2011, no warrants were exercised. During the year ended December 31, 2010, warrants to purchase 1,104,122 shares of common stock were exercised for cash at a price of $0.20 per share. The proceeds received from these exercises totaled $221,000.
- 63 -
A summary of our warrant activity is as follows (in thousands, except exercise prices and contractual life data):
|
|
Years Ended
December 31,
|
|||||||||||
|
|
2012
|
2011
|
2010
|
|||||||||
|
Outstanding, beginning of period
|
970 | 970 | 2,074 | |||||||||
|
Exercised during the period
|
(20 | ) | — | (1,104 | ) | |||||||
|
Cancelled during the period
|
— | — | — | |||||||||
|
Issued during the period
|
— | — | — | |||||||||
|
Outstanding, end of period
|
950 | 970 | 970 | |||||||||
|
Weighted average exercise price of warrants outstanding at end of period
|
$ | 0.90 | $ | 0.88 | $ | 0.88 | ||||||
|
Weighted average remaining contractual life, in years, of warrants outstanding at end of period
|
1.9 | 2.8 | 3.8 | |||||||||
In January 2013, warrants to purchase 50,000 shares of common stock were exercised for cash at a price of $1.00 per share. The proceeds received from this exercise totaled $50,000.
Stock Option Plans
We maintain an equity incentive plan, the Amended and Restated 2008 Equity Incentive Plan (the “Plan”), that permits the grant of stock options, stock appreciation rights, restricted stock, restricted stock units, performance units, performance shares, and other share-based awards to employees, officers, directors, and consultants. We have granted stock options, restricted stock units, and restricted stock under this plan. Share-based awards granted under this plan generally vest over four years and expire no more than ten years after the date of grant. Under the Plan, our Board of Directors is authorized to reserve for issuance up to 10,000,000 shares of common stock, all of which had been reserved as of December 31, 2012. Shares available for grant under the Plan were 3,933,524 and 4,557,910 at December 31, 2012 and 2011, respectively.
Stock Option Activity
The following table summarizes the stock option activity under the Plan:
|
|
Options Outstanding
|
||||||||||||||||
|
|
Shares
|
Weighted
Average
Exercise
Price
|
Weighted
Average
Remaining
Contractual
Life (in Years)
|
Aggregate
Intrinsic
Value (2)
|
|||||||||||||
|
Balance December 31, 2009
|
3,834,355 | $ | 6.30 | 8.5 | $ | 4,674,000 | |||||||||||
|
Granted
|
834,600 | $ | 3.82 | — | — | ||||||||||||
|
Exercised
|
(232,056 | ) | $ | 1.44 | — | — | |||||||||||
|
Forfeited
|
(371,594 | ) | $ | 7.53 | — | — | |||||||||||
|
Balance December 31, 2010
|
4,065,305 | $ | 5.95 | 7.2 | $ | 947,000 | |||||||||||
|
Granted
|
1,610,794 | $ | 3.02 | — | — | ||||||||||||
|
Exercised
|
(40,000 | ) | $ | 1.21 | — | — | |||||||||||
|
Forfeited
|
(790,687 | ) | $ | 5.46 | — | — | |||||||||||
|
Balance December 31, 2011
|
4,845,412 | $ | 5.10 | 7.6 | $ | 177,000 | |||||||||||
|
Granted
|
2,147,662 | $ | 2.51 | — | — | ||||||||||||
|
Exercised
|
(14,000 | ) | $ | 1.83 | — | — | |||||||||||
|
Forfeited
|
(462,992 | ) | $ | 5.07 | — | — | |||||||||||
|
Balance December 31, 2012
|
6,516,082 | 4.25 | 7.5 | $ | 2,994,000 | ||||||||||||
|
Vested and exercisable as of December 31, 2012
|
3,538,285 | $ | 5.38 | 6.4 | $ | 1,008,592 | |||||||||||
|
Vested and exercisable as of December 31, 2012 and expected to vest thereafter(1)
|
6,184,165 | $ | 4.32 | 7.4 | $ | 2,773,840 | |||||||||||
(
1) Options that are expected to vest are net of estimated future option forfeitures in accordance with the provisions of ASC 718,
“Compensation — Stock
Compensation.”
(2) The aggregate intrinsic value is calculated as the difference between the exercise price of the underlying options and the fair value of our common stock as of December 31, 2012 of $3.40 per share
- 64 -
The weighted average fair value per share of options granted to employees for the years ended December 31, 2012, 2011, and 2010 was $1.19, $1.41, and $1.93, respectively. The aggregate intrinsic value of options exercised for the years ended December 31, 2012, 2011, and 2010 was $12,000, $59,000, and $726,000, respectively. As of December 31, 2012, total unrecognized compensation cost related to non-vested options was $3.5 million, which is expected to be recognized as expense over a weighted average period of approximately 2.4 years.
In January 2013, we granted 100,000 stock options to an employee. The options vest over a four-year period, have an exercise price of $3.42 per share, and expire 10 years from the grant date.
Restricted Stock Awards
In July 2009, we issued 60,000 restricted stock units to key management team members under the Plan. The restricted stock units vest 25% on the first anniversary of the grant date and 1/48th monthly thereafter dependent upon continued employment. As the restricted stock units vest, the units are settled in shares of common stock based on a one-to-one ratio. The units are valued based on the market price on the date of grant.
In August 2010, 29,500 shares of restricted stock were granted to a member of our Board of Directors in exchange for consulting services. The restricted shares vest ratably on a quarterly basis for one year from the date of grant.
The following table summarizes the restricted stock activity under the Plan:
|
|
Shares
|
Weighted
Average
Grant-Date Fair
Value
|
||||||
|
(Per share)
|
||||||||
|
Balance at December 31, 2009
|
52,000 | $ | 7.13 | |||||
|
Awarded
|
29,500 | $ | 3.63 | |||||
|
Vested
|
(22,247 | ) | $ | 5.97 | ||||
|
Forfeited
|
(10,000 | ) | $ | 7.13 | ||||
|
Outstanding at December 31, 2010
|
49,253 | $ | 5.56 | |||||
|
Awarded
|
— | $ | — | |||||
|
Vested
|
(31,084 | ) | $ | 4.64 | ||||
|
Forfeited
|
(7,084 | ) | $ | 7.13 | ||||
|
Outstanding at December 31, 2011
|
11,085 | $ | 7.13 | |||||
|
Awarded
|
— | $ | — | |||||
|
Vested
|
(6,000 | ) | $ | 7.13 | ||||
|
Forfeited
|
(1,584 | ) | $ | 7.13 | ||||
|
Outstanding at December 31, 2012
|
3,501 | $ | 7.13 | |||||
As of December 31, 2012, total unrecognized compensation cost related to non-vested restricted stock units was $22,000, which is expected to be recognized as expense over a weighted average period of approximately 0.5 years.
Stock Based Compensation — Fair Value
We applied ASC 718,
“Compensation — Stock Compensation,”
during the years ended December 31, 2012, 2011, and 2010 and recognized related compensation expense of $2.6 million, $2.5 million and $2.8 million, respectively, related to stock options and restricted stock units.
The fair value of restricted stock units granted to employees is based on our common stock price on the date of grant. The fair value of stock options granted to employees is based on the Black-Scholes option pricing model. To determine the inputs for the Black-Scholes option pricing model, we are required to develop several assumptions, which are highly subjective. In general, we determine these assumptions as follows:
Expected Term:
Under the Plan, the expected term of options granted is determined using the weighted average period during which the stock options are expected to remain outstanding. Expected term is based on the option vesting term and contractual terms, blending historical data with disclosure information from similar publicly-traded companies to develop reasonable expectations about future exercise patterns and post-vesting employment termination behavior.
- 65 -
Expected Volatility
:
The expected volatility is determined using a blend of the historical volatility of our stock since becoming a public entity in 2008 and the volatility of a representative industry peer group. In evaluating the industry peer group, we considered factors such as industry, stage of life cycle, and size.
Risk-Free Interest Rate
:
The risk-free rate is based on U.S. Treasury issues with remaining terms similar to the expected term on the options.
Dividend Yield
:
We have never declared or paid any cash dividends and do not plan to pay cash dividends in the foreseeable future; therefore, we use an expected dividend yield of zero in the valuation model.
Forfeitures
:
We estimate forfeitures at the time of grant and revise those estimates periodically in subsequent periods if actual forfeitures differ from those estimates. We use historical data to estimate pre-vesting option forfeitures and record share-based compensation expense only for those awards that are expected to vest. All share-based payment awards are amortized on a straight-line basis over the requisite service periods of the awards, which are generally the vesting periods. If our actual forfeiture rate is materially different from its estimate, the share-based compensation expense could be significantly different from what we have recorded in the current period.
Share-Based Compensation — Employee Stock Options and Restricted Stock Awards
The estimated grant date fair values of stock options granted to employees were calculated using the Black-Scholes option pricing model based on the following assumptions:
|
|
Years Ended December 31,
|
||||||||||||||
|
|
2012
|
2011
|
2010
|
||||||||||||
|
Weighted average expected life (years)
|
4.5
|
4
|
4
|
|
|||||||||||
|
Weighted average expected volatility
|
59 | % | 62 | % | 63 | % | |||||||||
|
Risk-free interest rate
|
0.42 | - | 1.01 | % | 0.33 | - | 1.54 | % | 1.00 | - | 2.31 | % | |||
|
Weighted average dividend yield
|
0 | % | 0 | % | 0 | % | |||||||||
Share-based compensation expense related to the fair value measurement of awards granted to employees was allocated as follows (in thousands):
|
|
Years Ended December 31,
|
|||||||||||
|
|
2012
|
2011
|
2010
|
|||||||||
|
Cost of revenue
|
$ | 101 | $ | 149 | $ | 190 | ||||||
|
General and administrative
|
1,850 | 1,593 | 1,772 | |||||||||
|
Sales and marketing
|
522 | 591 | 599 | |||||||||
|
Research and development
|
139 | 164 | 214 | |||||||||
|
Total employee share-based compensation expense
|
$ | 2,612 | $ | 2,497 | $ | 2,775 | ||||||
Share-Based Compensation — Non-Employee Stock Options
We account for awards granted to non-employees other than members of our Board of Directors in accordance with ASC 505-50
,
“Equity-Based Payments to Non-Employees,”
which requires such awards to be recorded at their fair value on the measurement date using the Black-Scholes option pricing model. The measurement of share-based compensation is subject to periodic adjustment as the underlying awards vest.
The fair value of stock options issued to consultants was calculated using the Black-Scholes option pricing model based on the following assumptions:
|
|
Years Ended December 31,
|
||||||||||||||
|
|
2012
|
2011
|
2010
|
||||||||||||
|
Expected life (years)
|
.4 | - |
6
|
1 | - |
7
|
7 | - |
8
|
||||||
|
Weighted average expected volatility
|
59% | 63% | 63% | ||||||||||||
|
Risk-free interest rate
|
0.11 | - | 1.33% | 0.12 | - | 2.96% | 1.85 | - | 3.57% | ||||||
|
Weighted average dividend yield
|
0% | 0% | 0% | ||||||||||||
- 66 -
Share-based compensation expense related to awards granted to non-employees was allocated as follows (in thousands):
|
|
Years Ended
December 31,
|
|||||||||||
|
|
2012
|
2011
|
2010
|
|||||||||
|
General and administrative
|
$ | 4 | $ | 47 | $ | (1 | ) | |||||
|
Total non-employee share-based compensation expense
|
$ | 4 | $ | 47 | $ | (1 | ) | |||||
We manufacture and sell high-efficiency energy recovery products, high-pressure pumps, and related services and operate under one reporting segment. Our chief operating decision-maker is the chief executive officer (“CEO”). The CEO reviews financial information presented on a consolidated basis, accompanied by disaggregated information about revenue by geographic region for purposes of making operating decisions and assessing financial performance. Accordingly, we have concluded that we have one reportable segment.
The following geographic information includes net revenue to our domestic and international customers based on the customers’ requested delivery locations, except for certain cases in which the customer directed us to deliver its products to a location that differs from the known ultimate location of use. In such cases, the ultimate location of use, rather than the delivery location, is reflected in the table below (in thousands, except percentages):
|
|
Years Ended
December 31,
|
|||||||||||
|
|
2012
|
2011
|
2010
|
|||||||||
|
Domestic revenue
|
$ | 3,546 | $ | 2,798 | $ | 3,334 | ||||||
|
International revenue
|
39,086 | 25,249 | 42,519 | |||||||||
|
Total revenue
|
$ | 42,632 | $ | 28,047 | $ | 45,853 | ||||||
|
Revenue by country:
|
||||||||||||
|
Israel
|
25 | % | 1 | % | 2 | % | ||||||
|
Australia
|
11 | 2 | 31 | |||||||||
|
India
|
* | 18 | 3 | |||||||||
|
United States
|
8 | 10 | 7 | |||||||||
|
Algeria
|
* | 1 | 12 | |||||||||
|
Others(1)
|
56 | 68 | 45 | |||||||||
|
Total
|
100 | % | 100 | % | 100 | % | ||||||
(1) Includes remaining countries not separately disclosed.
No country in this line item accounted for more than 10% of our net revenue during any of the periods presented.
All of our long-lived assets were located in the United States at December 31, 2012 and 2011.
Concentration of Credit Risk
We have an investment portfolio of fixed -income marketable debt securities, including amounts classified as cash equivalents, short-term investments, and long-term investments. The primary objective of our investment activities is to preserve principal and liquidity while at the same time maximizing yields without significantly increasing risk. We invest primarily in investment-grade short-term and long-term debt instruments of corporate issuers and the U.S. government and its agencies. These investments are subject to counterparty credit risk. To minimize this risk, we invest pursuant to a Board-approved investment policy. The policy mandates high credit rating requirements and restricts our exposure to any single corporate issuer by imposing concentration limits.
Our accounts receivable are derived from sales to customers in the water desalination industry located around the world. We generally do not require collateral to support customer receivables, but frequently require export letters of credit securing payment. We perform ongoing evaluations of our customers’ financial condition and periodically review credit risk associated with receivables. For sales with customers outside of the U.S. (see Note 13 —
“Business Segment and Geographic Information”
), we may also obtain credit risk insurance to minimize credit risk exposure. An allowance for doubtful accounts is determined with respect to receivable amounts that we
- 67 -
have determined to be doubtful of collection using specific identification of doubtful accounts and an aging of receivables analysis based on invoice due dates. Actual collection losses may differ from our estimates, and such differences could be material to the financial position, results of operations, and cash flows. Uncollectible receivables are written off against the allowance for doubtful accounts when all efforts to collect them have been exhausted, while recoveries are recognized when they are received.
Customers accounting for 10% or more of our combined accounts receivable and unbilled receivables were as follows:
|
December 31,
|
||||||||
|
2012
|
2011
|
|||||||
|
I.V.M. Minrav Sadyt (a consortium of Minrav Holdings, Ltd and Sadyt, a Valoriza Agua company)
|
26 | % | * | |||||
|
Via Maris Desalination (a Global Environmental Solutions (GES) company)
|
13 | % | * | |||||
|
Thiess Degremont J.V. (a joint venture of Thiess Pty Ltd. and Degremont S.A.)
|
* | 14 | % | |||||
|
Tecton Engineering and Construction LLC
|
* | 11 | % | |||||
* Less than 10%.
No other customer accounted for more than 10% of our combined accounts receivable and unbilled receivables during any of these periods.
Revenue from customers representing 10% or more of net revenue varies from period to period. Customers representing 10% or more of net revenue for the periods indicated were:
|
December 31,
|
||||||||||||
|
2012
|
2011
|
2010
|
||||||||||
|
I.V.M. Minrav Sadyt (a consortium of Minrav Holdings, Ltd and Sadyt, a Valoriza Agua company)
|
16 | % | * | * | ||||||||
|
IDE Technologies Ltd.,
|
* | 14 | % | * | ||||||||
|
Thiess Degremont J.V. (a joint venture of Thiess Pty Ltd. and Degremont S.A.)
|
* | * | 23 | % | ||||||||
|
Hydrochem (S) Pte Ltd (a Hyflux company)
|
* | * | 12 | % | ||||||||
* Less than 10%.
No other customer accounted for more than 10% of our net revenue during any of these periods.
Consolidation of North American Operations
In 2011, we completed a restructuring plan to consolidate our North American production activities and transfer our Michigan-based operations to our manufacturing center and headquarters in San Leandro, California. The consolidation was, and continues to be, expected to reduce costs, improve efficiencies, and enhance research and development activities. For the year ended December 31, 2011, we recorded total pre-tax charges of $3.1 million related to this plan. The consolidation of these operations was substantially completed as of December 31, 2011.
In 2012, we recorded additional restructuring charges related to this plan of $369,000. With the exception of potential further impairment adjustments for assets held for sale, we do not anticipate further costs related to this restructuring activity. See Note 4. —
“Other Financial Information”
for further details related to the impairment of property held for sale.
The major components of the restructuring charges relating to the consolidation of our North American operations were as follows (in thousands):
|
Year Ended December 31,
|
||||||||
|
|
2012
|
2011
|
||||||
|
One-time termination benefits and other personnel costs
|
$ | 21 | $ | 583 | ||||
|
Losses on disposals of assets and impairment of assets held for sale
|
314 | 2,188 | ||||||
|
Other exit costs
|
34 | 332 | ||||||
| $ | 369 | $ | 3,103 | |||||
- 68 -
The following table summarizes activity related to liabilities associated with our North American operations restructuring during the years ended December 31, 2012 and December 31, 2011 (in thousands):
|
Balance at
December 31,
2011
|
Additions
|
Amounts
Utilized
|
Balance at
December 31,
2012
|
|||||||||||||
|
One-time termination benefits and other personnel costs
|
$ | 70 | $ | 21 | $ | (91 | ) | $ | — | |||||||
|
Impairment of assets held for sale
|
— | 314 | (314 | ) | — | |||||||||||
|
Other exit costs
|
91 | 34 | (125 | ) | — | |||||||||||
| $ | 161 | $ | 369 | $ | (530 | ) | $ | — | ||||||||
|
Balance at
December 31,
2010
|
Additions
|
Amounts
Utilized
|
Balance at
December 31,
2011
|
|||||||||||||
|
One-time termination benefits and other personnel costs
|
$ | — | $ | 583 | $ | (513 | ) | $ | 70 | |||||||
|
Losses on disposals of assets and impairment of assets held for sale
|
— | 2,188 | (2,188 | ) | — | |||||||||||
|
Other exit costs
|
— | 332 | (241 | ) | 91 | |||||||||||
| $ | — | $ | 3,103 | $ | (2,942 | ) | $ | 161 | ||||||||
Restructuring of Spanish Subsidiary
During the fourth quarter of 2011, we initiated a restructuring plan to reduce operating costs related to our sales branch office in Spain. For the year ended December 31, 2011, we recorded total pre-tax charges of $191,000 related to this plan. The consolidation of these operations was completed during the first quarter of 2012. For the year ended December 31, 2012, there were no additional charges recorded related to this plan.
The major components of the charges relating to the restructuring of our branch office in Spain were as follows (in thousands):
|
Year Ended December 31,
|
||||||||
|
|
2012
|
2011
|
||||||
|
One-time termination benefits and other personnel costs
|
$ | — | $ | 72 | ||||
|
Losses on disposals of assets
|
— | 13 | ||||||
|
Other exit costs
|
— | 106 | ||||||
| $ | — | $ | 191 | |||||
The following table summarizes activity related to liabilities associated with our restructuring of our branch office in Spain during the years ended December 31, 2012 and December 31, 2011 (in thousands):
|
Balance at
December 31,
2011
|
Additions
|
Amounts
Utilized
|
Balance at
December 31,
2012
|
|||||||||||||
|
One-time termination benefits and other personnel costs
|
$ | 7 | $ | — | $ | (7 | ) | $ | — | |||||||
|
Other exit costs
|
53 | — | (53 | ) | — | |||||||||||
| $ | 60 | $ | — | $ | (60 | ) | $ | — | ||||||||
|
Balance at
December 31,
2010
|
Additions
|
Amounts
Utilized
|
Balance at
December 31,
2011
|
|||||||||||||
|
One-time termination benefits and other personnel costs
|
$ | — | $ | 72 | $ | (65 | ) | $ | 7 | |||||||
|
Losses on disposals of assets
|
— | 13 | (13 | ) | — | |||||||||||
|
Other exit costs
|
— | 106 | (53 | ) | 53 | |||||||||||
| $ | — | $ | 191 | $ | (131 | ) | $ | 60 | ||||||||
See Note 11 —
“Stockholders’ Equity”
for discussion of warrants exercised during the first quarter of 2013.
See Note 12 —
“Share-Based Compensation”
for discussion of stock options granted during the first quarter of 2013.
- 69 -
The following table presents certain unaudited consolidated quarterly financial information for each of the eight fiscal quarters in the period ended December 31, 2012. This quarterly information has been prepared on the same basis as the audited consolidated financial statements and includes all adjustments, consisting only of normal recurring adjustments, necessary for a fair presentation of the information for the periods presented. The results for these quarterly periods are not necessarily indicative of the operating results for a full year or any future period.
QUARTERLY FINANCIAL DATA (unaudited)
|
Three Months Ended,
|
||||||||||||||||
|
|
Dec. 31,
2012
|
Sept. 30,
2012
|
June 30,
2012
|
March 31,
2012
|
||||||||||||
|
(In thousands, except per share amounts)
|
||||||||||||||||
|
Quarterly Results of Operations
(1)
|
||||||||||||||||
|
Net revenue
|
$ | 15,082 | $ | 10,498 | $ | 12,296 | $ | 4,756 | ||||||||
|
Cost of revenue
|
8,583 | 4,696 | 5,636 | 3,504 | ||||||||||||
|
Gross profit
(2)
|
6,499 | 5,802 | 6,660 | 1,252 | ||||||||||||
|
Operating expenses:
|
||||||||||||||||
|
General administrative
|
4,247 | 3,825 | 3,606 | 3,468 | ||||||||||||
|
Sales and marketing
|
2,176 | 1,860 | 1,772 | 1,482 | ||||||||||||
|
Research and development
|
1,719 | 1,495 | 866 | 694 | ||||||||||||
|
Amortization of intangible assets
|
257 | 262 | 261 | 262 | ||||||||||||
|
Restructuring charges
|
92 | 167 | 79 | 31 | ||||||||||||
|
Impairment loss on intangible assets
|
1,020 | — | — | — | ||||||||||||
|
Proceeds from litigation settlement
|
(775 | ) | — | — | — | |||||||||||
|
(Loss) income from operations
|
$ | (2,237 | ) | $ | (1,807 | ) | $ | 76 | $ | (4,685 | ) | |||||
|
Net (loss) income
|
$ | (2,184 | ) | $ | (1,826 | ) | $ | 439 | $ | (4,683 | ) | |||||
|
(Loss) earnings per share:
|
||||||||||||||||
|
Basic
|
$ | (0.04 | ) | $ | (0.04 | ) | $ | 0.01 | $ | (0.09 | ) | |||||
|
Diluted
|
$ | (0.04 | ) | $ | (0.04 | ) | $ | 0.01 | $ | (0.09 | ) | |||||
|
Three Months Ended,
|
||||||||||||||||
|
|
Dec. 31,
2011
|
Sept. 30,
2011
|
June 30,
2011
|
March 31,
2011
|
||||||||||||
|
(In thousands, except per share amounts)
|
||||||||||||||||
|
Quarterly Results of Operations
(1)
|
||||||||||||||||
|
Net revenue
|
$ | 6,115 | $ | 4,933 | $ | 6,632 | $ | 10,367 | ||||||||
|
Cost of revenue
|
6,027 | 4,214 | 4,304 | 5,703 | ||||||||||||
|
Gross profit
|
88 | 719 | 2,328 | 4,664 | ||||||||||||
|
Operating expenses:
|
||||||||||||||||
|
General administrative
|
4,792 | 3,571 | 4,325 | 4,057 | ||||||||||||
|
Sales and marketing
|
1,627 | 2,291 | 2,009 | 2,070 | ||||||||||||
|
Research and development
|
900 | 726 | 871 | 1,029 | ||||||||||||
|
Amortization of intangible assets
|
323 | 346 | 345 | 346 | ||||||||||||
|
Loss (gain) on fair value remeasurement
|
171 | — | — | — | ||||||||||||
|
Restructuring charges
|
2,824 | 470 | — | — | ||||||||||||
|
Loss from operations
|
$ | (10,549 | ) | $ | (6,685 | ) | $ | (5,222 | ) | $ | (2,838 | ) | ||||
|
Net loss
|
$ | (10,021 | ) | $ | (11,326 | ) | $ | (3,338 | ) | $ | (1,758 | ) | ||||
|
Loss per share:
|
||||||||||||||||
|
Basic and Diluted
|
$ | (0.19 | ) | $ | (0.22 | ) | $ | (0.06 | ) | $ | (0.03 | ) | ||||
|
|
(1)
|
Quarterly results may not add up to annual results due to rounding.
|
|
(2)
|
Impacting gross profit in the fourth quarter of 2012, was the recognition of $0.8 million in non-recurring charges associated with a new oil and gas prototype device, for which no matching revenue was recognized.
|
- 70 -
None.
Evaluation of Disclosure Controls and Procedures
Our management has evaluated, with the participation of our chief executive officer and chief financial officer, the effectiveness of our disclosure controls and procedures (as defined in Rules 13a-15(e) and 15d-15(e) under the Securities Exchange Act of 1934, or “Exchange Act”) as of the end of the period covered by this Annual Report on Form 10-K. Based on that evaluation, our chief executive officer and chief financial officer have concluded that, as of such date, our disclosure controls and procedures were effective to ensure that information we are required to disclose in reports that we file or submit under the Exchange Act is recorded, processed, summarized, and reported within the time periods specified in Securities and Exchange Commission rules and forms and that such information is accumulated and communicated to management as appropriate to allow for timely decisions regarding required disclosure.
Our disclosure controls and procedures are designed to provide reasonable assurance of achieving their objectives, and our chief executive officer and chief financial officer have concluded that these controls and procedures are effective at the “reasonable assurance” level. Our management, including the chief executive officer and chief financial officer, believes that a control system, no matter how well designed and operated, cannot provide absolute assurance that the objectives of the control system are met, and that no evaluation of controls can provide absolute assurance that all control issues and instances of fraud, if any, within a company have been detected.
Management’s Annual Report on Internal Control Over Financial Reporting and Attestation Report of the Registered Accounting Firm
Management is responsible for establishing and maintaining adequate internal control over the Company’s financial reporting. Management assessed the effectiveness of the Company’s internal control over financial reporting as of December 31, 2012. In making this assessment, management used the criteria set forth by the Committee of Sponsoring Organizations of the Treadway Commission (COSO) in
Internal Control —
Integrated Framework
. Based on the assessment using those criteria, management concluded that, as of December 31, 2012, our internal control over financial reporting was effective.
The Company’s independent registered public accountants, BDO USA, LLP, audited the consolidated financial statements included in this Annual Report on Form 10-K and have issued an audit report on the Company’s internal control over financial reporting. The report on the audit of internal control over financial reporting appears below.
- 71 -
REPORT OF INDEPENDENT REGISTERED PUBLIC ACCOUNTING FIRM
The Board of Directors and Stockholders of
Energy Recovery, Inc.
San Leandro, California
We have audited Energy Recovery, Inc.’s internal control over financial reporting as of December 31, 2012, based on criteria established in
Internal Control —
Integrated Framework
issued by the Committee of Sponsoring Organizations of the Treadway Commission (the COSO criteria). Energy Recovery, Inc.’s management is responsible for maintaining effective internal control over financial reporting and for its assessment of the effectiveness of internal control over financial reporting, included in the accompanying “Item 9A, Management’s Annual Report on Internal Control Over Financial Reporting and Attestation Report of the Registered Public Accounting Firm”. Our responsibility is to express an opinion on the Company’s internal control over financial reporting based on our audit.
We conducted our audit in accordance with the standards of the Public Company Accounting Oversight Board (United States). Those standards require that we plan and perform the audit to obtain reasonable assurance about whether effective internal control over financial reporting was maintained in all material respects. Our audit included obtaining an understanding of internal control over financial reporting, assessing the risk that a material weakness exists, and testing and evaluating the design and operating effectiveness of internal control based on the assessed risk. Our audit also included performing such other procedures as we considered necessary in the circumstances. We believe that our audit provides a reasonable basis for our opinion.
A company’s internal control over financial reporting is a process designed to provide reasonable assurance regarding the reliability of financial reporting and the preparation of financial statements for external purposes in accordance with generally accepted accounting principles. A company’s internal control over financial reporting includes those policies and procedures that (1) pertain to the maintenance of records that, in reasonable detail, accurately and fairly reflect the transactions and dispositions of the assets of the Company; (2) provide reasonable assurance that transactions are recorded as necessary to permit preparation of financial statements in accordance with generally accepted accounting principles, and that receipts and expenditures of the Company are being made only in accordance with authorizations of management and directors of the Company; and (3) provide reasonable assurance regarding prevention or timely detection of unauthorized acquisition, use, or disposition of the Company’s assets that could have a material effect on the financial statements.
Because of its inherent limitations, internal control over financial reporting may not prevent or detect misstatements. Also, projections of any evaluation of effectiveness to future periods are subject to the risk that controls may become inadequate because of changes in conditions, or that the degree of compliance with the policies or procedures may deteriorate.
In our opinion, Energy Recovery, Inc. maintained, in all material respects, effective internal control over financial reporting as of December 31, 2012, based on the COSO criteria.
We also have audited, in accordance with the standards of the Public Company Accounting Oversight Board (United States), the Consolidated Balance Sheets of Energy Recovery, Inc. as of December 31, 2012 and 2011, and the related consolidated statements of operations, stockholders’ equity and comprehensive loss, and cash flows for each of the three years in the period ended December 31, 2012, and our report dated March 12, 2013 expressed an unqualified opinion thereon.
/s/ BDO USA, LLP
San Jose, California
March 12, 2013
- 72 -
Changes in Internal Control Over Financial Reporting
There were no changes in our internal control over financial reporting that occurred during our most recent fiscal quarter that have materially affected, or are reasonably likely to materially affect, our internal control over financial reporting.
None.
The information required by this Item is incorporated by reference from the Company’s Definitive Proxy Statement related to the Annual Meeting of Stockholders to be held on June 18, 2013, which will be filed by the Company with the SEC (the “Proxy Statement”).
The information required by this Item is incorporated by reference from the Proxy Statement.
The information required by this Item is incorporated by reference from the Proxy Statement.
The information required by this Item is incorporated by reference from the Proxy Statement.
The information required by this item is incorporated by reference from the Proxy Statement.
- 73 -
(a) The following documents are included as part of this Annual Report on Form 10-K:
(1)
Financial Statements
|
|
Page in
Form 10-K
|
|
Report of Independent Registered Public Accounting Firm
|
40
|
|
Consolidated Balance Sheets — December 31, 2012 and 2011
|
41
|
|
Consolidated Statements of Operations —
Years ended December 31, 2012, 2011, and 2010
|
42
|
|
Consolidated Statements of Comprehensive Loss—
Years ended December 31, 2012, 2011, and 2010
|
43
|
|
Consolidated Statements of Stockholders’ Equity —
Years ended December 31, 2012, 2011, and 2010
|
44
|
|
Consolidated Statements of Cash Flows —
Years ended December 31, 2012, 2011, and 2010
|
45
|
|
Notes to the Consolidated Financial Statements
|
46
|
(2) Financial Statement Schedule
SCHEDULE II
VALUATION AND QUALIFYING ACCOUNTS
|
Description
|
Balance at
Beginning of
Period
|
Additions
Charged to
Costs and
Expenses
|
Changes in
Estimates
Charged to
Costs and
Expenses(1)
|
Deductions(2)
|
Balance at
End of Period
|
|||||||||||||||
|
(In thousands)
|
||||||||||||||||||||
|
Year Ended December 31, 2010
|
||||||||||||||||||||
|
Allowance for doubtful accounts
|
$ | 196 | $ | 47 | $ | (183 | ) | $ | (16 | ) | $ | 44 | ||||||||
|
Year Ended December 31, 2011
|
||||||||||||||||||||
|
Allowance for doubtful accounts
|
$ | 44 | $ | 323 | $ | (119 | ) | $ | -- | $ | 248 | |||||||||
|
Year Ended December 31, 2012
|
||||||||||||||||||||
|
Allowance for doubtful accounts
|
$ | 248 | $ | 285 | $ | (279 | ) | $ | (37 | ) | $ | 217 | ||||||||
(
1) Collections of previously reserved accounts
(2) Uncollectible accounts written off, net of recoveries
All other schedules have been omitted because the information required to be presented in them is not applicable or is shown in the consolidated financial statements or related notes.
(3) Exhibit Index
See Exhibit Index immediately follow the signature page for a list of exhibits filed or incorporated by reference as a part of this Report.
(b) Exhibit.
See Exhibits listed under Item 15(a)(3).
(c) Financial Statement Schedules.
All financial statement schedules are omitted because they are not applicable or not required or because the required information is included in the financial statements, or notes thereto, or in the Exhibits listed under Item 15(a)(2).
- 74 -
Pursuant to the requirements of Section 13 or 15(d) of the Securities Exchange Act of 1934, the Registrant has duly caused this Report to be signed on its behalf by the undersigned, thereunto duly authorized, in the City of San Leandro, State of California, on the 12th day of March 2013.
|
ENERGY RECOVERY, INC.
|
|||
|
|
By:
|
/s/ THOMAS S. ROONEY, JR.
|
|
|
Thomas S. Rooney, Jr.
|
|||
|
President and Chief Executive Officer
|
|||
Pursuant to the requirements of the Securities and Exchange Act of 1934, this Report has been signed below by the following persons on behalf of the Registrant and in the capacities and on the dates indicated.
|
Signature
|
Title
|
Date
|
|
|
/s/ THOMAS S. ROONEY, JR.
|
President and Chief Executive Officer
|
March 12, 2013
|
|
|
Thomas S. Rooney, Jr.
|
(Principal Executive Officer) and Director
|
||
|
/s/ ALEXANDER J. BUEHLER
|
Chief Financial Officer
|
March 12, 2013
|
|
|
Alexander J. Buehler
|
(Principal Financial Officer)
|
||
|
/s/ HANS PETER MICHELET
|
Director and Chairman of the Board
|
March 12, 2013
|
|
|
Hans Peter Michelet
|
|||
|
/s/ PAUL M. COOK
|
Director
|
March 12, 2013
|
|
|
Paul M. Cook
|
|||
|
/s/ ARVE HANSTVEIT
|
Director
|
March 12, 2013
|
|
|
Arve Hanstveit
|
|||
|
/s/ FRED OLAV JOHANNESSEN
|
Director
|
March 12, 2013
|
|
|
Fred Olav Johannessen
|
|||
|
/s/ ROBERT MAO
|
Director
|
March 12, 2013
|
|
|
Robert Mao
|
|||
|
/s/ MARIE-ELISABETH PATÉ-CORNELL
|
Director
|
March 12, 2013
|
|
|
Marie-Elisabeth Paté-Cornell
|
|||
|
/s/ DOMINIQUE TREMPONT
|
Director
|
March 12, 2013
|
|
|
Dominique Trempont
|
- 75 -
INDEX TO EXHIBITS
|
Exhibit
|
Incorporated by Reference
|
Filed
|
||||
|
Number
|
Exhibit Description
|
Form
|
File No.
|
Exhibit
|
Filing Date
|
Herewith
|
|
2.1
|
Agreement and Plan of Merger dated as of December 2, 2009, by and among the Company, CFE Acquisition Corporation, Pump Engineering, LLC, Roy Radakovich and U.S. Bank, National Association.
|
8-K
|
001-34112
|
2.1
|
12/8/2009
|
|||
|
3.1
|
Amended and Restated Certificate of Incorporation, as filed with the Delaware Secretary of State on July 7, 2008.
|
10-K
|
001-34112
|
3.1
|
3/27/2009
|
|||
|
3.2
|
Amended and Restated Bylaws, effective as of July 8, 2008.
|
10-K
|
001-34112
|
3.2
|
3/27/2009
|
|||
|
10.1*
|
Form of Indemnification Agreement between the Company and its directors and officers.
|
S-1/A
|
333-150007
|
10.1
|
5/12/2008
|
|||
|
10.2*
|
2001 Stock Option Plan of the Company and form of Stock Option Agreement thereunder.
|
S-1
|
333-150007
|
10.2
|
4/1/2008
|
|||
|
10.3*
|
2002 Stock Option/Stock Issuance Plan of the Company and forms of Stock Option and Stock Purchase Agreements thereunder.
|
S-1
|
333-150007
|
10.3
|
4/1/2008
|
|||
|
10.4*
|
2004 Stock Option/Stock Issuance Plan of the Company and forms of Stock Option and Stock Purchase Agreements thereunder.
|
S-1
|
333-150007
|
10.4
|
4/1/2008
|
|||
|
10.5*
|
2006 Stock Option/Stock Issuance Plan of the Company and forms of Stock Option and Stock Purchase Agreements thereunder.
|
S-1
|
333-150007
|
10.5
|
4/1/2008
|
|||
|
10.6*
|
Amendment to 2006 Stock Option/Stock Issuance Plan of the Company.
|
S-1
|
333-150007
|
10.5.1
|
4/1/2008
|
|||
|
10.7*
|
Second Amendment to 2006 Stock Option/Stock Issuance Plan of the Company.
|
S-1
|
333-150007
|
10.5.2
|
4/1/2008
|
|||
|
10.8*
|
2008 Equity Incentive Plan of the Company and form of Stock Option Agreement thereunder.
|
S-1/A
|
333-150007
|
10.6
|
5/12/2008
|
|||
|
10.9*
|
Amendment to 2008 Equity Incentive Plan of the Company.
|
S-1/A
|
333-150007
|
10.6.1
|
6/27/2008
|
|||
|
10.10*
|
Energy Recovery Inc. Amended and Restated 2008 Equity Incentive Plan dated June 5, 2012
|
DEF14A
|
001-34112
|
Appendix A
|
4/27/2012
|
|||
|
10.11
|
Modified Industrial Gross Lease Agreement dated November 25, 2008, between the Company and Doolittle Williams, LLC.
|
10-K
|
001-34112
|
10.17
|
3/27/2009
|
|||
|
10.12
|
First Amendment to Modified Industrial Gross Lease dated May 28, 2009, between the Company and Doolittle Williams, LLC.
|
10-Q
|
001-34112
|
10.17.1
|
8/7/2009
|
|||
- 76 -
|
Exhibit
|
Incorporated by Reference
|
Filed
|
||||
|
Number
|
Exhibit Description
|
Form
|
File No.
|
Exhibit
|
Filing Date
|
Herewith
|
|
10.13
|
Second Amendment to Modified Industrial Gross Lease dated June 26, 2009, between the Company and Doolittle Williams, LLC.
|
10-Q
|
001-34112
|
10.17.2
|
8/7/2009
|
|||
|
10.14
|
Third Amendment to Modified Industrial Gross Lease dated June 26, 2009 between the Company and Doolittle Williams, LLC
|
X
|
||||||
|
10.15
|
Pledge and Security Agreement dated February 17, 2009, between the Company and Comerica Bank
|
10-Q
|
001-34112
|
10.20
|
5/8/2009
|
|||
|
10.16*
|
Employment Agreement dated August 1, 2007, between the Company and Borja Sanchez-Blanco.
|
10-Q
|
001-34112
|
10.22
|
5/7/2010
|
|||
|
10.17*
|
Wage Structure Change Agreement dated December 30, 2009, between the Company and Borja Sanchez-Blanco.
|
10-Q
|
001-34112
|
10.22.1
|
5/7/2010
|
|||
|
10.18*
|
Offer Letter dated February 14, 2011, to Thomas Rooney.
|
8-K
|
001-34112
|
99.2
|
2/15/2011
|
|||
|
10.19*
|
G.G. Pique Resignation Acceptance and Separation Package Letter dated February 14, 2011.
|
10-K
|
001-34112
|
10.40
|
3/15/2011
|
|||
|
10.20*
|
Offer Letter dated April 13, 2011, to Alexander Buehler.
|
10-Q
|
001-34112
|
10.41
|
5/6/2011
|
|||
|
10.21
|
Control Agreement dated July 7, 2011, between the Company, Citibank, N.A., Citigroup Global Markets Inc., and Morgan Stanley Smith Barney LLC.
|
10-Q
|
001-34112
|
10.43
|
8/8/2011
|
|||
|
10.22*
|
Energy Recovery, Inc. Change in Control Severance Plan. dated March 5, 2012
|
8-K
|
001-34112
|
10.1
|
3/9/2012
|
|||
|
10.23*
|
Energy Recovery, Inc. Annual Incentive Plan dated January 1, 2012
|
10-Q
|
001-34112
|
10.44
|
5/8/2012
|
|||
|
10.24
|
Loan Agreement dated June 5, 2012 between Company and HSBC Bank, USA, National Association
|
8-K
|
001-34112
|
10.1
|
6/11/2012
|
|||
|
14.1
|
Code of Ethics of Energy Recovery, Inc. Additional Conduct and Ethics Policies for the Chief Executive Officer and Senior Financial Officers.
|
10-K
|
001-34112
|
14.1
|
3/27/2009
|
|||
|
21.1
|
List of subsidiaries of the Company.
|
X
|
||||||
|
23.1
|
Consent of BDO USA, LLP, Independent Registered Public Accounting Firm.
|
X
|
||||||
|
31.1
|
Certification of Principal Executive Officer pursuant to Exchange Act Rule 13a-14(a) or 15d-14(a), as adopted pursuant to Section 302 of the Sarbanes-Oxley Act of 2002.
|
X
|
||||||
|
31.2
|
Certification of Principal Financial Officer pursuant to Exchange Act Rule 13a-14(a) or 15d-14(a), as adopted pursuant to Section 302 of the Sarbanes-Oxley Act of 2002.
|
X
|
||||||
- 77 -
|
Exhibit
|
Incorporated by Reference
|
Filed
|
||||
|
Number
|
Exhibit Description
|
Form
|
File No.
|
Exhibit
|
Filing Date
|
Herewith
|
|
32.1
|
Certification of Principal Executive Officer and Principal Financial Officer, pursuant to 18 U.S.C. Section 1350, as adopted pursuant to Section 906 of the Sarbanes-Oxley Act of 2002.
|
X
|
||||||
|
101.INS**
|
XBRL Instance Document
|
|||||||
|
101.SCH**
|
XBRL Taxonomy Extension Schema Document
|
|||||||
|
101.CAL**
|
XBRL Taxonomy Extension Calculation Linkbase Document
|
|||||||
|
101.DEF**
|
XBRL Taxonomy Extension Definition Linkbase Document
|
|||||||
|
101.LAB**
|
XBRL Taxonomy Extension Label Linkbase Document
|
|||||||
|
101.PRE**
|
XBRL Taxonomy Extension Presentation Linkbase Document
|
|||||||
|
*
|
Indicates management compensatory plan, contract or arrangement.
|
|
**
|
XBRL (Extensible Business Reporting Language) information is furnished and not filed herewith, is not a part of a registration statement or Prospectus for purposes of Sections 11 or 12 of the Securities Act of 1933, is deemed not filed for purposes of Section 18 of the Securities Exchange Act of 1934, and otherwise is not subject to liability under these sections.
|
- 78 -
TABLE OF CONTENTS
Part IItem 1. BusinessItem 1A. Risk FactorsItem 1B. Unresolved Staff CommentsItem 2. PropertiesItem 3. Legal ProceedingsItem 4. Mine Safety DisclosuresPart IIItem 5. Market For The Registrant S Common Stock Equity, Related Stockholder Matters and Issuer Purchases Of Equity SecuritiesItem 5. Market For The Registrant S Common Stock Equity, RelatedItem 6. Selected Financial DataItem 7. Management S Discussion and Analysis Of Financial Condition and Results Of OperationsItem 7. Management S Discussion and Analysis Of Financial Condition andItem 7A. Quantitative and Qualitative Disclosure About Market RiskItem 8. Financial Statements and Supplementary DataNote 1 Description Of BusinessNote 2 Summary Of Significant Accounting PoliciesNote 3 Loss Per ShareNote 4 Other Financial InformationNote 5 InvestmentsNote 6 Goodwill and Intangible AssetsNote 7 Fair Value MeasurementsNote 8 Long-term Debt and Capital LeasesNote 9 Commitments and ContingenciesNote 10 Income TaxesNote 11 Stockholders EquityNote 12 Share-based CompensationNote 13 Business Segment and Geographic InformationNote 14 ConcentrationsNote 15 Restructuring ActivitiesNote 16 Subsequent EventsNote 17 Supplementary Data Quarterly Financial Data (unaudited)Item 9. Changes in and Disagreements with Accountants on Accounting and Financial DisclosureItem 9. Changes in and Disagreements with Accountants on Accounting andItem 9A. Controls and ProceduresItem 9B. Other InformationPart IIIItem 10. Directors, Executive Officers and Corporate GovernanceItem 11. Executive CompensationItem 12. Security Ownership Of Certain Beneficial Owners and Management and Related Stockholder MattersItem 12. Security Ownership Of Certain Beneficial Owners and ManagementItem 13. Certain Relationships and Related Transactions and Director IndependenceItem 13. Certain Relationships and Related Transactions and DirectorItem 14. Principal Accountant Fees and ServicesPart IVItem 15. Exhibits and Financial Statement Schedules