UNITED STATES
SECURITIES AND EXCHANGE COMMISSION
Washington, D.C. 20549
FORM 20-F
ANNUAL REPORT PURSUANT TO SECTION 13 OR 15(d)
OF THE SECURITIES EXCHANGE ACT OF 1934
for the fiscal year ended December 31, 2012
Commission File No. 0-28998
ELBIT SYSTEMS LTD.
(Exact name of registrant as specified in its charter and translation of registrant’s name into English)
Israel
(Jurisdiction of incorporation or organization)
Advanced Technology Center, Haifa 31053, Israel
(Address of principal executive offices)
Joseph Gaspar
c/o Elbit Systems Ltd.
P.O. Box 539
Advanced Technology Center
Haifa 31053
Israel
Tel: 972-4-831-6404
Fax: 972-4-831-6944
E-mail: j.gaspar@elbitsystems.com
(Name, telephone, e-mail and/or facsimile number and address of Company contact person)
Securities registered or to be registered pursuant to Section 12(b) of the Act:
Ordinary Shares, nominal value 1.0 New Israeli Shekels per share
(Title of Class)
The NASDAQ Global Select Market
(Name of each Exchange on which registered)
Securities registered or to be registered pursuant to Section 12(g) of the Act:
Not Applicable
Securities for which there is a reporting obligation pursuant to Section 15(d) of the Act:
Not Applicable
Indicate the number of outstanding shares of each of the issuer’s classes of capital or common stock as of the close of the period covered by the annual report:
41,881,745
Ordinary Shares
Indicate by check mark whether the registrant is a well-known seasoned issuer, as defined in Rule 405 of the Securities Act.
Yes
x
No
o
If this report is an annual or transition report, indicate by check mark if the registrant is not required to file reports pursuant to Section 13 or 15(d) of the Securities Exchange Act of 1934.
Yes
o
No
x
Indicate by check mark whether the registrant (1) has filed all reports required to be filed by Section 13 or 15(d) of the Securities Exchange Act of 1934 during the preceding 12 months (or for such shorter period that the registrant was required to file such reports), and (2) has been subject to such filing requirements for the past 90 days.
Yes
x
No
o
Indicate by check mark whether the registrant has submitted electronically and posted on its corporate Web site, if any, every Interactive Date File required to be submitted and posted pursuant to Rule 405 of Regulation S-T (232.405 of this chapter) during the preceding 12 months (or for such shorter period that the registrant was required to submit and post such files).
Yes
x
No
o
Indicate by check mark whether the registrant is a large accelerated filer, an accelerated filer, or a non-accelerated filer. See definition of “accelerated filer and large accelerated filer” in Rule 12b-2 of the Exchange Act (Check One).
|
Large accelerated filer
x
|
Accelerated filer
o
|
Non-accelerated filer
o
|
Indicate by check mark which basis of accounting the registrant has used to prepare the financial statements included in this filing.
|
U.S. GAAP
x
|
International Financial Reporting
o
Standards as issued by the International
Accounting Standards Board
|
Other
o
|
If “Other” has been checked in response to the previous question, indicate by check mark which financial statement item the registrant has elected to follow.
Item 17
o
Item 18 No
o
If this is an annual report, indicate by check mark whether the registrant is a shell company (as defined in Rule 12b-2 of the Exchange Act).
Yes
o
No
x
Table of Contents
|
Page
|
||
|
2
|
||
|
2
|
||
|
3
|
||
|
3
|
||
|
3
|
||
|
14
|
||
|
40
|
||
|
41
|
||
|
60
|
||
|
74
|
||
|
76
|
||
|
77
|
||
|
78
|
||
|
93
|
||
|
97
|
||
|
97
|
||
|
97
|
||
|
97
|
||
|
98
|
||
|
98
|
||
|
98
|
||
|
99
|
||
|
99
|
||
|
99
|
||
|
100
|
||
|
100
|
||
|
100
|
||
|
100
|
||
|
101
|
||

The consolidated financial statements of Elbit Systems Ltd. (Elbit Systems) included in this annual report on Form 20-F are prepared in accordance with United States generally accepted accounting principles (U.S. GAAP). Unless otherwise indicated, all financial information contained in this annual report is presented in U.S. dollars. References in this annual report to the “Company”, “we”, “our”, “us” and terms of similar meaning refer to Elbit Systems and our subsidiaries unless the context requires otherwise.
This annual report on Form 20-F contains forward-looking statements within the meaning of Section 27A of the Securities Act of 1933, as amended, and Section 21E of the Securities Exchange Act of 1934, as amended. These statements relate to our current plans, estimates, strategies, goals and beliefs and as such do not relate to historical or current fact. Forward-looking statements are made pursuant to the safe harbor provisions of the Private Securities Litigation Reform Act of 1995, as amended.
Forward-looking statements contained herein generally are identified by the words “believe”, “project”, “expect”, “will likely result”, and “strategy”, “plan”, “may”, “should”, “will”, “would”, “will be”, “will continue”, “will likely result” and similar expressions. Forward-looking statements are based on management’s current expectations, estimates, projections and assumptions, are not guarantees of future performance and involve certain risks and uncertainties, the outcomes of which cannot be predicted. Therefore, actual future results, performance and trends may differ materially from these forward-looking statements due to a variety of factors, including, without limitation:
|
|
•
|
the scope and length of customer contracts;
|
|
|
•
|
governmental regulations and approvals;
|
|
|
•
|
changes in governmental budgeting priorities;
|
|
|
•
|
general market, political and economic conditions in the countries in which we operate or sell, including Israel and the United States among others;
|
|
|
•
|
differences in anticipated and actual program performance, including the ability to perform under long-term fixed-price contracts;
|
|
|
•
|
the impact on our backlog from export restrictions by the Government of Israel;
|
|
|
•
|
inventory write-downs and possible liabilities to customers from program cancellations due to political relations between Israel and countries where our customers may be located; and
|
|
|
•
|
the outcome of legal and/or regulatory proceedings.
|
The factors listed above are not all-inclusive, and further information about risks and other factors that will affect our future performance is contained in this annual report on Form 20-F. All forward-looking statements speak only as of the date of this annual report. We expressly disclaim any obligation to update or review any forward-looking statements, whether as a result of new information, future events or otherwise, except as may be required by applicable law.
2
Information not required in annual report on Form 20-F.
Information not required in annual report on Form 20-F.
Selected Financial Data
The following selected consolidated financial data of the Company as of and for the years ended December 31, 2008, 2009, 2010, 2011 and 2012 are derived from our audited consolidated financial statements, including our audited consolidated financial statements as of December 31, 2011 and 2012, and for each of the years ended December 31, 2010, 2011 and 2012, which appear in Item 18 in this annual report on Form 20-F. You should read the audited consolidated financial statements appearing in Item 18 together with the selected financial data set forth below. (For non-GAAP financial data see Item 5. Operating and Financial Review and Prospects – Non-GAAP Financial Data.)
|
Years Ended December 31,
|
||||||||||||||||||||
|
2008
|
2009
|
2010
|
__ 2011
|
2012
|
||||||||||||||||
|
(U.S. dollars in millions except for per share amounts)
|
||||||||||||||||||||
|
Income Statement Data:
|
||||||||||||||||||||
|
Revenues
|
$ | 2,638.3 | $ | 2,832.4 | $ | 2,670.1 | $ | 2,817.5 | $ | 2,888.6 | ||||||||||
|
Cost of revenues
|
1,870.9 | 1,982.9 | 1,872.2 | 2,085.5 | 2,072.7 | |||||||||||||||
|
Gross profit
|
767.4 | 849.5 | 797.9 | 732.0 | 815.9 | |||||||||||||||
|
Research and development expenses, net
|
185.0 | 216.8 | 234.1 | 241.1 | 233.4 | |||||||||||||||
|
Marketing and selling expenses
|
198.2 | 250.9 | 230.0 | 235.9 | 241.9 | |||||||||||||||
|
General and administrative expenses
|
134.2 | 119.3 | 131.2 | 139.3 | 137.5 | |||||||||||||||
|
Acquired in-process research and development (IPR&D) and other expenses (income)
|
1.0 | – | (4.7 | ) | – | – | ||||||||||||||
|
Total operating expenses
|
518.4 | 587.0 | 590.6 | 616.3 | 612.8 | |||||||||||||||
|
Operating income
|
249.0 | 262.5 | 207.3 | 115.7 | 203.1 | |||||||||||||||
|
Financial expenses, net
|
36.8 | 15.6 | 21.3 | 13.6 | 26.1 | |||||||||||||||
|
Other income, net
|
94.3 | 0.4 | 13.3 | 1.9 | 0.1 | |||||||||||||||
|
Income before taxes on income
|
306.5 | 247.3 | 199.3 | 104.0 | 177.0 | |||||||||||||||
|
Taxes on income
|
54.3 | 38.1 | 24.0 | 13.6 | 17.1 | |||||||||||||||
|
Equity in net earnings of affiliated companies
|
14.4 | 19.3 | 18.8 | 15.4 | 11.2 | |||||||||||||||
|
Net income from continuing operations, net
|
266.6 | 228.5 | 194.1 | 105.8 | 171.1 | |||||||||||||||
|
Income (loss) from discontinued operations, net
|
– | – | 0.9 | (16.0 | ) | (0.6 | ) | |||||||||||||
|
Net income
|
266.6 | 228.5 | 195.0 | 89.8 | 170.5 | |||||||||||||||
|
Less: net income (loss) attributed to non-controlling interests
|
62.4 | 13.6 | 11.1 | (0.5 | ) | 2.6 | ||||||||||||||
|
Income attributed to Elbit Systems’ shareholders
|
204.2 | * | 214.9 | 183.5 | 90.3 | 167.9 | ||||||||||||||
|
Earnings per share:
|
||||||||||||||||||||
|
Basic net earnings (loss) per share
|
||||||||||||||||||||
|
Continuing operations
|
$ | 4.85 | * | $ | 5.08 | $ | 4.29 | $ | 2.33 | $ | 3.99 | |||||||||
|
Discontinued operations
|
– | – | 0.01 | (0.22 | ) | (0.01 | ) | |||||||||||||
|
Total
|
$ | 4.85 | * | $ | 5.08 | $ | 4.30 | $ | 2.11 | $ | 3.98 | |||||||||
|
Diluted net earnings (loss) per share
|
||||||||||||||||||||
|
Continuing operations
|
4.78 | * | 5.00 | 4.24 | 2.31 | 3.98 | ||||||||||||||
|
Discontinued operations
|
– | – | 0.01 | (0.22 | ) | (0.01 | ) | |||||||||||||
|
Total
|
$ | 4.78 | * | $ | 5.00 | $ | 4.25 | $ | 2.09 | $ | 3.97 | |||||||||
*Including $74 million in net income ($1.73 diluted net earnings per share) from the sale of Mediguide Inc. (Mediguide) shares in 2008.
3
|
December 31,
|
||||||||||||||||||||
|
2008
|
2009
|
2010
|
2011
|
2012
|
||||||||||||||||
|
(U.S. dollars in millions except for per share amounts
)
|
||||||||||||||||||||
|
Balance Sheet Data:
|
||||||||||||||||||||
|
Cash, cash equivalents, short-term
bank deposits and marketable securities
|
$ | 278 | $ | 280 | $ | 215 | $ | 224 | $ | 265 | ||||||||||
|
Working capital
|
290 | 392 | 382 | 236 | 375 | |||||||||||||||
|
Long-term deposits, marketable securities and other receivables
|
41 | 44 | 52 | 12 | 19 | |||||||||||||||
|
Long-term trade and unbilled receivables
|
– | 17 | 90 | 163 | 230 | |||||||||||||||
|
Property, plant and equipment, net
|
384 | 405 | 504 | 518 | 501 | |||||||||||||||
|
Total assets
|
2,940 | 3,054 | 3,616 | 3,721 | 3,811 | |||||||||||||||
|
Long-term debt
|
270 | 389 | 292 | 302 | 174 | |||||||||||||||
|
Series A Notes, net of current maturities
|
– | – | 273 | 235 | 409 | |||||||||||||||
|
Capital stock
|
300 | 284 | 294 | 245 | 249 | |||||||||||||||
|
Elbit Systems shareholders’ equity
|
724 | 833 | 967 | 898 | 1,017 | |||||||||||||||
|
Non-controlling interests
|
76 | 24 | 39 | 29 | 34 | |||||||||||||||
|
Total equity
|
800 | 857 | 1,005 | 928 | 1,051 | |||||||||||||||
|
Number of outstanding ordinary shares of NIS 1 par value (in thousands)
|
42,079 | 42,531 | 42,693 | 42,608 | 41,882 | |||||||||||||||
|
Dividends paid per ordinary share with respect to the applicable year
|
$ | 1.42 | $ | 1.82 | $ | 1.44 | $ | 1.44 | $ | 1.20 | ||||||||||
4
Risk Factors
General Risks Related to Our Business and Market
Our revenues depend on a continued level of government business
.
We derive most of our revenues directly or indirectly from government agencies, mainly the Israeli Ministry of Defense (IMOD), the U.S. Department of Defense (DoD) and defense ministries of certain other countries, pursuant to contracts awarded to us under defense-related programs. The funding of these programs is subject to government budgeting decisions affected by numerous factors, including geo-political events and macro-economic conditions that are beyond our control. Government spending under such contracts may cease or may be reduced, which would cause a negative effect on our revenues, results of operations, cash flow and financial condition.
The current worldwide economic and financial situation as well as reductions in U.S. and European defense expenditures may have a material adverse effect on our results
.
Over the past few years many of the world’s economies and financial institutions have experienced a reduction in economic activity, a decline in asset prices, liquidity problems and limited availability of credit. Also, in recent years the U.S. and a number of European governments have reduced defense budgets, and the U.S. defense budget has been reduced by the sequestration provisions that became effective in March 2013 under the U.S. Budget Control Act of 2011. Such factors may result in a reduction in demand and downward pressure on pricing in some of our markets, which could adversely affect our business, results of operations and financial condition. The general economic and financial situation may: (i) cause the value of our investments in our pension plans to decrease, requiring us to increase our funding of those pension plans; (ii) result in a lower return and value on our assets; (iii) increase the cost or hinder our ability to finance future projects; and (iv) negatively impact our customers, which in turn could negatively impact our ability to collect accounts receivable.
Our contracts may be terminated for convenience of the customer.
Our contracts with governments often contain provisions permitting termination for convenience of the customer. Our subcontracts with non-governmental prime contractors sometimes contain similar provisions. In a minority of these contracts, an early termination for convenience would not entitle us to reimbursement for all of our incurred contract costs or for a proportionate share of our fee or profit for work performed.
We depend on governmental approval of our exports.
Our international sales as well as our international procurement of skilled human resources, technology and components depend largely on export license approvals from the governments of Israel, the U.S. and other countries. If we fail to obtain material approvals in the future, if material approvals previously obtained are revoked or expire and are not renewed or if government export policies change, our ability to sell our products and services to overseas customers and our ability to obtain goods and services essential to our business could be interrupted, resulting in a material adverse effect on our business, revenues, assets, liabilities and results of operations. (See Item 4. Information on the Company – Governmental Regulation.)
As a government contractor, we are subject to a number of procurement and anti-bribery rules and regulations.
We are required to comply with specific government contracting rules and regulations, including those relating to cost accounting, anti-bribery, procurement integrity and others, which increase our performance and compliance costs. (See Item 4. Information on the Company – Governmental Regulation.) If these rules and regulations change, our costs of complying with them could increase and reduce our margins. In addition, failure to comply with these rules and regulations could result in reductions of the value of contracts, contract modifications or termination, and the assessment of penalties and fines, which could negatively impact our results of operations and financial condition. Failure to comply with these rules and regulations, for example in the area of anti-bribery, could also lead to suspension or debarment from government contracting or subcontracting for a period of time as well as other possible sanctions, which could have a negative impact on our results of operations, financial condition and reputation.
5
We depend on international operations
.
We expect that international sales will continue to account for a significant portion of our revenues for the foreseeable future. As a result, changes in international, political, economic or geographic events could result in significant shortfalls in orders or revenues. These shortfalls could cause our business, financial condition and results of operations to be harmed. In addition to the other risks from international operations set forth in these Risk Factors, some of the risks of doing business internationally include:
|
|
•
|
unexpected changes in regulatory requirements;
|
|
|
•
|
termination or non-renewal of export licenses;
|
|
|
•
|
changes in governmental defense budgets and national priorities;
|
|
|
•
|
imposition of tariffs and other barriers and restrictions;
|
|
|
•
|
burdens of complying with a variety of foreign laws;
|
|
|
•
|
political and economic instability; and
|
|
|
•
|
changes in diplomatic and trade relationships.
|
Some of these factors, such as the ability to obtain foreign government approvals, termination of export licenses and changes in diplomatic relationships, may be affected by Israel’s overall political situation. (See “Risks Related to Our Israeli Operations” below.) In addition, the economic and political stability of the countries of our major customers and suppliers may impact our business.
We have risks related to our pension plans, which could impact our liquidity.
Funding obligations for certain of our pension plans are impacted by the performance of the financial markets and interest rates. When interest rates are low, or if the financial markets do not provide long-term returns as expected, there is an increased likelihood we may be required to make additional contributions to these pension plans. Because of the volatility in the equity markets, our estimate of future contribution requirements can change dramatically in relatively short periods of time. (See Item 18. Financial Statements – Notes 2(S) and 17.)
We face currency exchange risks.
As more of our revenues are generated in currencies other than the U.S. dollar (which is the functional currency we use for financial reporting purposes), mainly in New Israeli Shekels (NIS), Great Britain Pounds (GBP) and Euros, we are subject to increasingly significant foreign currency risks. For example, we could be negatively affected by exchange rate changes during the period from the date we submit a price proposal until the date of contract award or until the date(s) of payment. Moreover, since a significant portion of our expenses is denominated in NIS, if we do not adequately hedge against exchange rate risks, our financial results could be adversely affected. Accordingly, our level of revenues and profits may be adversely affected by exchange rate fluctuations. (See below “Risks Related to Our Israeli Operations – Changes in the U.S. Dollar – NIS Exchange Rate” and Item 5. Operating and Financial Review and Prospects – Impact of Inflation and Exchange Rates.)
We operate in a competitive industry
.
The markets in which we participate are highly competitive and characterized by technological change. If we are unable to improve existing systems and products and develop new systems and technologies in order to meet evolving customer demands, our business could be adversely affected. In addition, our competitors could introduce new products with innovative capabilities, which could adversely affect our business. We compete with many large and mid-tier defense contractors on the basis of system performance, cost, overall value, delivery and reputation. Many of these competitors are larger and have greater resources than us, and therefore may be better positioned to take advantage of economies of scale and develop new technologies. Some of these competitors are also our suppliers in some programs.
Due to significant consolidation in our industry, we are more likely to compete with certain potential customers.
As the number of companies in the defense industry has decreased in recent years, the market share of some prime contractors has increased. Some of these companies are vertically integrated with in-house capabilities similar to ours in certain areas. Thus, at times we could be seeking business from certain of these prime contractors, while at other times we could be in competition with some of them. Failure to maintain good business relations with these major contractors could negatively impact our future business.
6
We face risks of changes in costs under fixed-price contracts.
Most of our contracts are fixed-price contracts, as opposed to cost-plus or cost-share type contracts. Generally, a fixed-price contract price is not adjusted as long as the work performed falls within the original contract scope. Therefore, under these contracts, we generally assume the risk that increased or unexpected costs may reduce profits or generate a loss. The risk can be particularly significant under a fixed-price contract involving research and development for new technology, where estimated gross profit or loss from long-term projects may change and such changes in estimated gross profit/loss are recorded on a cumulative catch-up basis. (See Item 5. Operating and Financial Review and Prospects – General – Critical Accounting Policies and Estimates – Revenue Recognition.) To the extent we underestimate the costs to be incurred in any fixed-price contract, we could experience a loss on the contract, which would have a negative effect on our results of operations, financial position and cash flow.
We face fluctuations in revenues and profit margins.
The level of our revenues may fluctuate over different periods due to changes in pricing or sales volume or our mix of projects during any given period. Moreover, since certain of our project revenues are recognized in connection with achievement of specific performance milestones, we may experience significant fluctuations in year-to-year and quarter-to-quarter financial results. Similarly, our profit margins may vary significantly from project to project as a result of changes in estimated project gross profits that are recorded in results of operations on a cumulative catch-up basis pursuant to the percentage-of-completion accounting method. (See Item 5. Operating and Financial Review and Prospects – General – Critical Accounting Policies and Estimates – Revenue Recognition.) As a result, comparisons of our financial results for prior periods may not provide a reliable indicator of our future results. Moreover, our share price may be subject to significant fluctuation in response to period-to-period variations in our financial results.
Our backlog of projects under contract is subject to unexpected adjustments and cancellations.
Our backlog includes revenue we expect to record in the future from signed contracts and certain other commitments. Many projects may remain in our backlog for an extended period of time because of the size or long-term nature of the contract. In addition, from time to time, projects are delayed, scaled back, stopped or cancelled for reasons beyond our control, which may adversely affect the revenue and profit that we ultimately receive from contracts reflected in our backlog.
We may experience production delays or liability if suppliers fail to make compliant or timely deliveries
.
The manufacturing process for some of our products largely consists of the assembly, integration and testing of purchased components. Some components are available from a small number of suppliers, and in a few cases we work with suppliers that are effectively our sole source. If a supplier stops delivery of such components, finding another source could result in added cost and manufacturing delays. Moreover, if our subcontractors fail to meet their design, delivery schedule or other obligations we could be held liable by our customers, and we may be unable to obtain full or partial recovery from our subcontractors for those liabilities. The foregoing risks could have a material adverse effect on our operating results. In addition, the current global economic situation could impair the ability of our suppliers to meet their obligations to us.
We may be affected by failures of our prime contractors.
We often act as a subcontractor, and a failure of our prime contractor to meet its obligations may affect our ability to receive payments under our subcontract.
Undetected problems in our products could impair our financial results and give rise to potential product liability claims.
If there are defects in the design, production or testing of our or our subcontractors’ products and systems, including our products sold for public safety purposes in the homeland security area, we could face substantial repair, replacement or service costs and potential liability and damage to our reputation. Our efforts to implement appropriate design, testing and manufacturing processes for our products or systems may not be sufficient to prevent such occurrences, which could have a material adverse effect on our business, results of operations and financial condition.
7
Our future success depends on our ability to develop new offerings and technologies for our current and future markets.
To achieve our business strategies and continue to grow our revenues and operating profits, we must successfully develop new, or adapt or modify our existing, offerings and technologies for our current core defense markets and our future markets, including adjacent and emerging markets. Accordingly, our future performance depends on a number of factors, including our ability to:
|
|
•
|
identify emerging technological trends in our current and future markets;
|
|
|
•
|
identify additional uses for our existing technology to address customer needs in our current or future markets;
|
|
|
•
|
develop and maintain competitive products and services for our current and future markets;
|
|
|
•
|
enhance our offerings by adding innovative solutions that differentiate our offerings from those of our competitors;
|
|
|
•
|
develop, manufacture and bring solutions to the market quickly at cost-effective prices;
|
|
|
•
|
develop working prototypes as a condition to receiving contract awards; and
|
|
|
•
|
effectively structure our business, through the use of joint ventures, teaming agreements and other forms of alliances, to reflect the competitive environment.
|
To remain competitive in the future, we believe we will need to invest significant financial resources to develop new, and adapt or modify our existing, offerings and technologies, including through internal research and development, acquisitions and joint ventures or other teaming arrangements. In addition, our customers more frequently require demonstration of working prototypes prior to awarding contracts for new programs. Expenditures for new, adapted or modified offerings and technologies and for production of prototypes could divert our attention and resources from other projects and may not ultimately lead to the timely development of new offerings and technologies or new contracts. Due to the design complexity of our products, we may experience delays in completing the development and introduction of new products. Any delays could result in increased costs and development, deflect resources from other projects or increase the risk that our competitors may develop competing technologies, which gain market acceptance in advance of our products. If we fail in our new product development efforts, or our products or services fail to achieve market acceptance more rapidly than our competitors, our ability to procure new contracts could be negatively impacted, which would negatively impact our results of operations and financial condition.
Our business depends on proprietary technology that may be infringed
. Many of our systems and products depend on our proprietary technology for their success. Like other technology oriented companies, we rely on a combination of patents, trade secrets, copyrights and trademarks, together with non-disclosure agreements, contractual confidentiality clauses, including those in employment agreements, and technical measures to establish and protect proprietary rights in our products. Our ability to successfully protect our technology may be limited because:
|
|
•
|
some foreign countries may not protect proprietary rights as comprehensively as the laws of the United States and Israel;
|
|
|
•
|
detecting infringements and enforcing proprietary rights may be time consuming and costly, diverting management’s attention and company resources;
|
|
|
•
|
measures such as non-disclosure agreements afford only limited protection;
|
|
|
•
|
unauthorized parties may copy aspects of our products or technologies to develop similar products or technologies or obtain and use information that we regard as proprietary;
|
|
|
•
|
our patents may expire, thus providing competitors access to the applicable technology;
|
|
|
•
|
competitors may independently develop products that are substantially equivalent or superior to our products or circumvent our intellectual property rights; and
|
|
|
•
|
competitors may register patents in technologies relevant to our business areas.
|
8
In addition, others may allege infringement claims against us. The cost of defending against infringement claims could be significant, regardless of whether the claims are valid. To the extent we are not successful in defending such claims, we may be prevented from the use or sale of certain of our products, subject to liabilities for damages and required to obtain licenses, which may not be available on reasonable terms, any of which may have a material adverse impact on our business, results of operation or financial condition.
Systems and information technology interruptions or cyber attacks could adversely impact our ability to operate.
Our operations rely on computer, information and communications technology and related systems. From time to time, we may experience system interruptions and delays. If we are unable to continually add software and hardware, effectively upgrade our systems and network infrastructure and take other steps to improve the efficiency of and protect our systems, our operations could be interrupted or delayed. Our computer and communications systems and operations could be damaged or interrupted by natural disasters, telecommunications failures, acts of war, terrorism or similar events or disruptions. Any of these or other events could cause system interruption, delays and loss of critical data, or delay or stoppage of our operations, and adversely affect our operating results.
In addition, we face the ongoing threat to our computer systems of unauthorized access, computer hackers, computer viruses, malicious code, organized cyber attacks and other security problems and system disruptions. We have devoted and will continue to devote significant resources to the security of our computer systems, but they may still be vulnerable to these threats. A user who circumvents security measures could misappropriate proprietary information or cause interruptions or malfunctions in operations. As a result, we may be required to expend significant resources to protect against the threat of these system disruptions and security breaches or to alleviate problems caused by these disruptions and breaches. Any of these events could have a material adverse effect on our business, results of operations and financial condition.
We sometimes have risks relating to financing for our programs.
A number of our major projects require us to arrange, or to provide, guarantees in connection with the customer’s financing of the project. These include commitments by us as well as guarantees provided by financial institutions relating to advance payments received from customers. Customers typically have the right to drawdown against advance payment guarantees if we were to default under the applicable contract. In addition, some customers require that the payment period under the contract be extended for a number of years, sometimes beyond the period of contract performance. We may face difficulties in issuing guarantees or providing financing for our programs. Moreover, if we are required to provide significant financing for our programs, this could result in increased leverage on our balance sheet. (See Item 4. Information on the Company – Financing Terms.)
We are subject to buy-back obligations.
A number of our international programs require us to meet “buy-back” obligations. (See Item 5. Operating and Financial Review and Prospects – Off Balance Sheet Transactions.) Should we be unable to meet such obligations we may be subject to contractual penalties, and our chances of receiving further business from the applicable customers could be reduced or, in certain cases, eliminated.
We sometimes participate in risk-sharing contracts.
We sometimes participate in “risk-sharing” type contracts, in which our non-recurring costs are only recoverable if there is a sufficient level of sales for the applicable product, which level of sales typically is not guaranteed. If sales do not occur at the level anticipated, we may not be able to recover our non-recurring costs under the contract.
We would be adversely affected if we are unable to retain key employees
. Our success depends in part on key management, scientific and technical personnel and our continuing ability to attract and retain highly qualified personnel. There is competition for the services of such personnel. The loss of the services of key personnel, and the failure to attract highly qualified personnel in the future, may have a negative impact on our business. Moreover, our competitors may hire and gain access to the expertise of our former employees.
We may face labor relations disputes or not be able to amend collective bargaining agreements in a timely manner
.
A number of our subsidiaries in Israel and certain other countries are parties to collective bargaining agreements that cover a substantial number of our employees. These agreements contain a range of conditions that vary depending on the applicable company and are for various periods of time. Disputes with trade unions or other labor relations difficulties as well as failure to timely amend or extend collective bargaining agreements could lead to worker disputes, slow-downs, strikes and other measures, which could negatively impact our results of operations.
9
We face acquisition and integration risks
.
We have made in the past and plan to continue to make equity or asset acquisitions and investments in companies and technology ventures that we believe complement our business. (See Item 4. Information on the Company – Recent Acquisitions, Mergers and Divestitures.) Acquisitions typically involve a certain amount of risks and uncertainties such as:
|
|
•
|
the difficulty in integrating newly-acquired businesses and operations in an efficient and cost-effective manner and the risk that we encounter significant unanticipated costs or other problems associated with integration;
|
|
|
•
|
failure to meet the challenges of achieving strategic objectives, cost savings and other benefits expected from acquisitions could lead to impairment of intangible assets related to the acquired companies;
|
|
|
•
|
the risk that our markets do not evolve as anticipated and that the technologies acquired do not prove to be those needed to be successful in those markets;
|
|
|
•
|
the risk that we assume significant liabilities that exceed the enforceability or other limitations of applicable indemnification provisions, if any, or the financial resources of any indemnifying parties, including indemnity for regulatory compliance issues that may result in our incurring successor liability;
|
|
|
•
|
the potential loss of key employees of the acquired businesses;
|
|
|
•
|
the risk of diverting the attention of senior management from our existing operations; and
|
|
|
•
|
the risk that certain of our newly acquired operating subsidiaries in various countries could be subject to more restrictive regulations by the local authorities after our acquisition.
|
Our acquisitions are subject to governmental approvals.
Most countries require local governmental approval of acquisitions of domestic defense businesses, which approval may be denied, or unfavorable conditions imposed, if the local government determines the acquisition is not in its national interest. We may also be unable to obtain antitrust approvals for certain acquisitions as our operations expand. Failure to obtain such governmental approvals could negatively impact our future business and prospects.
Our due diligence in acquisitions may not adequately cover all risks.
There may be liabilities or risks that we fail to discover in performing due diligence investigations, or that may arise following an acquisition, relating to businesses we have acquired or may acquire in the future. Examples of these liabilities include employee benefit contribution obligations, estimated costs to complete contracts, environmental liabilities, regulatory compliance liabilities or liabilities for infringement of third party intellectual property rights for which we, as a successor owner, may be responsible. Such risks may include changes in estimated costs to complete programs and estimated future revenues. In addition, there may be additional costs relating to acquisitions including, but not limited to, possible purchase price adjustments provided in the applicable acquisition agreement or impairment write downs, if the value of the acquired company were to decrease after the acquisition, or after follow-on investments in that company. Such liabilities could have a material adverse effect on our business, financial condition, results of operations or prospects. In addition, there may be situations in which our management determines, based on market conditions or other applicable considerations, to pursue an acquisition with limited due diligence or without performing any due diligence at all.
Our share price may be volatile and may decline.
Numerous factors, some of which are beyond our control and unrelated to our operating performance or prospects, may cause the market price of our ordinary shares to fluctuate significantly. Factors affecting market price include, but are not limited to: (i) variations in our operating results and whether we have achieved our key business targets; (ii) sales or purchases of large blocks of stock; (iii) changes in securities analysts’ earnings estimates or recommendations; (iv) differences between reported results and those expected by investors and securities analysts; and (v) changes in our business including announcements of new contracts by us or by our competitors. In the past, securities class action litigation has been instituted against companies following periods of volatility in the market price of their securities.
10
Other general factors and market conditions that could affect our stock price include changes in: (i) the market’s perception of our business; (ii) the businesses, earnings estimates or market perceptions of our competitors or customers; (iii) the outlook for the defense industry; (iv) the general market or economic conditions unrelated to our performance; (v) the legislative or regulatory environment; (vi) government defense spending or appropriations; (vii) military or defense activities worldwide; (viii) the level of national or international hostilities; and (ix) the general geo-political environment.
We have risks related to our issuance of Series A Notes under an Israeli debt offering.
We face various risks relating to our issuance of Series A Notes (the Notes). (See Items 5. Operating and Financial Review and Prospects – Liquidity and Capital Resources – Israeli Debt Offering.) The risks we face include our ability to generate sufficient cash flow to make payments on the Notes.
We have risks related to the inherent limitations of internal control systems.
Despite our internal control measures, we may still be subject to financial reporting errors or even fraud. A control system, no matter how well conceived and operated, can provide only reasonable, not absolute assurance that the objectives of the control system are met. In addition, the design of a control system must reflect the fact that there are resource constraints and the benefit of controls must be relative to their costs. These inherent limitations include the realities that judgments in decision-making can be faulty and that breakdowns can occur because of simple error or mistake. Further, controls can be circumvented by individual acts of some persons, by collusion of two or more persons or by management override of the controls. The design of any system of controls also is based in part upon certain assumptions about the likelihood of future events, and any design may fail to achieve its stated goals, under some or all future conditions. Over time, a control may be inadequate because of changes in conditions or the degree of compliance with the policies or procedures may deteriorate. Because of inherent limitations in a cost effective control system, misstatements due to error or fraud may occur and not be detected. (See Item 15. Controls and Procedures.)
Risks Related to Our Israeli Operations
Conditions in Israel may affect our operations
.
Political, economic and military conditions in Israel directly affect our operations. Since the establishment of the State of Israel, a number of armed conflicts have taken place between Israel and its Arab neighbors. An ongoing state of hostility, varying in degree and intensity has led to security and economic problems for Israel. For a number of years there have been continuing hostilities between Israel and the Palestinians including with the Islamic movement Hamas in the Gaza Strip, which have adversely affected the peace process and at times have negatively influenced Israel’s economy as well as its relationship with several other countries. Israel also faces threats from Hezbollah militants in Lebanon, from the government of Iran and other potential threats from neighboring countries, some of whom have recently undergone or are undergoing significant political changes, such as Egypt and Syria. In recent years there has also been a change in the relations between Israel and Turkey. These political, economic and military conditions in Israel could have a material adverse effect on our business, financial condition, results of operations and future growth.
Political relations could limit our ability to sell or buy internationally.
We could be adversely affected by the interruption or reduction of trade between Israel and its trading partners. Some countries, companies and organizations continue to participate in a boycott of Israeli firms and others doing business with Israel or with Israeli companies. Foreign government defense export policies towards Israel could also make it more difficult for us to obtain the export authorizations necessary for our activities. Also, over the past several years there have been calls in Europe and elsewhere to reduce trade with Israel.
In addition, the Israeli defense budget may be adversely affected by reductions in U.S. foreign military assistance due to the sequestration process in the U.S. See above “General Risks Related to Our Business and Market.”
There can be no assurance that restrictive laws, policies or practices directed towards Israel or Israeli businesses will not have an adverse impact on our business.
Reduction in Israeli government spending or changes in priorities for defense products may adversely affect our earnings.
The Israeli government may reduce its expenditures for defense items or change its defense priorities in the coming years.
In addition, the Israeli defense budget may be adversely affected by reductions in U.S. foreign
military assistance due to the sequestration process in the U.S. See above "General Risks
Related to Our Business and Market."
There is no assurance that our programs will not be affected in the future if there is a reduction in Israeli government defense spending for our programs or a change in priorities to products other than ours.
Israel’s economy may become unstable.
Over the years, Israel’s economy has been subject to periods of inflation, low foreign exchange reserves, fluctuations in world commodity prices, military conflicts and civil unrest. For these and other reasons, the government of Israel has intervened in the economy employing fiscal and monetary policies, import duties, foreign currency restrictions, controls of wages, prices and foreign currency exchange rates and regulations regarding the lending limits of Israeli banks to companies considered to be in an affiliated group. The Israeli government has periodically changed its policies in these areas. Reoccurrence of previous destabilizing factors could make it more difficult for us to operate our business as we have in the past and could adversely affect our business.
11
Changes in the U.S. dollar – NIS exchange rate.
The exchange rate between the NIS and the U.S. dollar has fluctuated in recent years. For example, at the end of 2010, 2011 and 2012, the NIS/U.S. dollar exchange rate was 3.549, 3.821 and 3.733, respectively. This represented a devaluation of the NIS against the U.S. dollar of approximately 8% in 2011 and a strengthening of the NIS against the U.S. dollar of approximately 2% in 2012. During 2012, the NIS/U.S. dollar exchange rate fluctuated. For example, at the end of each of the fiscal quarters of 2012, the exchange rate of the NIS against the U.S. dollar was 3.715, 3.923, 3.912 and 3.733, respectively. During the first two months of 2013, the NIS strengthened against the U.S. dollar by approximately 0.7%, and the NIS/U.S. dollar exchange rate as of February 28, 2013 was 3.708. While most of our sales and expenses are denominated in U.S. dollars, a significant portion of our expenses is paid in NIS, and most of our sales to customers in Israel are in NIS. Our primary expenses paid in NIS that are not linked to the dollar are employee expenses in Israel and lease payments on some of our Israeli facilities. As a result, if we do not hedge our position in NIS, a change in the value of the NIS compared to the dollar, which over the past year has undergone numerous fluctuations, could affect our research and development expenses, manufacturing labor costs and general and administrative expenses. (See Item 5. Operating and Financial Review and Prospects – Impact of Inflation and Exchange Rates – Inflation and Currency Exchange Rates.)
Israeli government programs and tax benefits may be terminated or reduced in the future.
Elbit Systems and some of our Israeli subsidiaries participate in programs of the Israeli Office of the Chief Scientist (OCS) and the Israel Investment Center, for which we receive tax and other benefits as well as funding for the development of technologies and products. The benefits available under these programs depend on meeting specified conditions. (See Item 4. Information on the Company – Conditions in Israel – Chief Scientist (OCS) and Investment Center Funding.) If we fail to comply with these conditions, we may be required to pay additional taxes and penalties, make refunds and may be denied future benefits. From time to time, the government of Israel has discussed reducing or eliminating the benefits available under these programs, and therefore these benefits may not be available in the future at their current levels or at all.
Israeli law regulates acquisition of a controlling interest in Israeli defense industries.
Israeli legislation regarding the domestic defense industry requires Israeli government approval of an acquisition of a 25% or more equity interest (or a smaller percentage that constitutes a “controlling interest”) in companies such as Elbit Systems. Moreover, the Israeli government may issue specific orders to a domestic defense industry under this legislation that could impose additional conditions relating to transfers of ownership. This could limit the ability of a potential purchaser to acquire a significant interest in our shares. (See Item 4. Information on the Company – Governmental Regulation – Approval of Israeli Defense Acquisitions.)
Israel has stringent export control regulations.
In recent years the Israeli government adopted laws and regulations regarding enhanced defense export controls and the export of “dual use” items (items that are typically sold in the commercial market but that may also be used in the defense market). If government approvals required under these laws and regulations are not obtained, including revocation of or failure to renew authorizations previously granted, our ability to export our products from Israel could be negatively impacted, thus causing a reduction in our revenues and a potential material negative impact on our financial results. (See Item 4. Information on the Company – Governmental Regulation – Israeli Export Regulations.)
We may rely on certain Israel “home country” corporate governance practices which may not afford stockholders the same protection afforded to shareholders of U.S. companies.
As a foreign private issuer for purposes of U.S. securities laws, Nasdaq rules allow us to follow certain Israeli “home country” corporate governance practices in lieu of the corresponding Nasdaq corporate governance rules. Such home country practices may not afford shareholders the same level of rights or protections in certain matters as those of shareholders of U.S. domestic companies. In 2011, we notified Nasdaq of our intent to follow Israeli home country practice in connection with an amendment to our 2007 Stock Option Plan, which was approved by our board of directors as permitted by Israeli law without approval by our shareholders. To the extent we are entitled to elect to follow Israeli law and practice rather than corresponding U.S. law or practice, such as with regard to the requirement for shareholder approval of changes to stock option plans, our shareholders may not be afforded the same level of rights they would have under U.S. practice. (See Item 16.G. Corporate Governance.)
12
Many of our employees and some of our officers are obligated to perform military reserve duty in Israel
.
Generally, Israeli adult male citizens and permanent residents are obligated to perform annual military reserve duty up to a specified age. They also may be called to active duty at any time under emergency circumstances, which could have a disruptive impact on our workforce.
It may be difficult to enforce a non-Israeli judgment against us, our officers and directors
.
We are incorporated in Israel. Our executive officers and directors are not residents of the United States, and a substantial portion of our assets and the assets of these persons are located outside the United States. Therefore, it may be difficult for an investor, or any other person or entity, to enforce against us or any of those persons in an Israeli court a U.S. court judgment based on the civil liability provisions of the U.S. federal securities laws. It may also be difficult to effect service of process on these persons in the United States. Additionally, it may be difficult for an investor, or any other person or entity, to enforce civil liabilities under U.S. federal securities laws in original actions filed in Israel. (See below – Item 4. Information on the Company – Conditions in Israel – Enforcement of Judgments.)
13
Business Overview
Principal Activities
We are an international defense electronics company engaged in a wide range of programs throughout the world. The Company, operates in the areas of aerospace, land and naval systems, command, control, communications, computers, intelligence, surveillance and reconnaissance (C4ISR), unmanned aircraft systems, advanced electro-optics, electro-optic space systems, electronic warfare (EW) suites, airborne warning systems, electronic intelligence systems, data links, artillery systems, military communications systems and radios. We also focus on the upgrading of existing military platforms and developing new technologies for defense, homeland security and commercial aviation applications. In addition, we provide a range of support services.
Our major activities include:
|
|
•
|
military aircraft and helicopter systems;
|
|
|
•
|
helmet mounted systems;
|
|
|
•
|
commercial aviation systems and aerostructures;
|
|
|
•
|
unmanned aircraft systems;
|
|
|
•
|
land vehicle systems;
|
|
|
•
|
command, control, communications, computer and intelligence (C4I) and cyber systems;
|
|
|
•
|
electro-optic and countermeasures systems;
|
|
|
•
|
homeland security systems;
|
|
|
•
|
EW and signal intelligence systems; and
|
|
|
•
|
various commercial activities.
|
Many of these major activities have a number of common and related elements. Therefore, we often jointly conduct marketing, research and development, manufacturing, performance of programs, sales and after sales support among these areas of activities.
Principal Market Environment
We operate primarily in the defense and homeland security arenas. The nature of military actions in recent years, including low intensity conflicts and ongoing terrorist activities, as well as budgetary pressures to focus on leaner but more cutting-edge defense forces, has caused a shift in the defense priorities for many of our major customers. As a result we believe there is a greater demand in the areas of C4I, as well as intelligence, surveillance and reconnaissance (ISR), including network centric information systems, intelligence gathering systems, border and perimeter security systems, airborne systems, unmanned aircraft systems (UAS), unmanned surface vessels (USVs), remote controlled systems, cyber-based systems, space and satellite based defense capabilities and homeland security applications. There is also a growing demand for cost effective logistic support and training and simulation services. We believe our synergistic “one-company” approach of finding solutions that combine elements of our various activities positions us to meet evolving customer requirements in several of these areas.
We tailor and adapt our technologies, integration skills, market knowledge and battle-proven systems to each customer’s individual requirements in both existing and new platforms. By upgrading existing platforms with advanced electronic and electro-optic technologies, we provide customers with cost-effective solutions, and our customers are able to improve their technological and operational capabilities within limited defense budgets. We are experienced in providing “systems of systems”, which enables us to provide overall solutions in a range of areas to meet our customers’ comprehensive defense and security needs.
14
The worldwide defense market has been characterized in recent years by significant consolidation and merger and acquisition activities. Part of our growth strategy includes our continued activity in mergers and acquisitions both in Israel and internationally. We operate as a multi-domestic, “global – local (GloCal)” organization in order to meet the needs of our customers around the world. The Company’s structure enables us to benefit from the synergy of our overall capabilities while at the same time focus on local requirements.
Company History
We have many decades of operational experience. Our predecessor Elbit Ltd. was incorporated in Israel in 1966 as Elbit Computers Ltd. We were formed in 1996, as part of the Elbit Ltd. corporate demerger, under which Elbit Ltd.’s defense related assets and business were spun-off to us. From its founding in 1966 until the demerger, Elbit Ltd. was involved in a wide range of defense-related airborne, land, naval and C4I programs throughout the world. We continue these activities today, together with the activities of companies we have acquired and activities relating to newly developed areas, as the largest non-government-owned defense company in Israel. Several of our subsidiaries in Israel and around the world have decades of experience in their respective markets. Our companies have collectively been awarded the Israel Defense Prize ten times, recognizing extraordinary contributions to defense technological innovations.
Elbit Systems Ltd. is a corporation domiciled and incorporated in Israel where we operate in accordance with the provisions of the Israeli Companies Law – 1999 (the Companies Law).
Trading Symbols and Address
Our shares are traded on the Nasdaq National Market (Nasdaq), as part of the Nasdaq Global Select Market, under the symbol “ESLT” and on the Tel-Aviv Stock Exchange (TASE).
Our main offices are in the Advanced Technology Center, Haifa 31053, Israel, and our main telephone number at that address is (972-4) 8315315. Our website home page is
www.elbitsystems.com.
We make our website content available for informational purposes only. It should not be relied upon for investment purposes, nor is it incorporated by reference in this annual report on Form 20-F.
Our principal offices in the United States are the headquarters of Elbit Systems of America, LLC at 4700 Marine Creek Parkway, Fort Worth, Texas 76179-6969, and the main telephone number at that address is 817-234-6799.
Revenues
The table below shows our consolidated revenues by major areas of operations for the years ended December 31, 2010, 2011 and 2012:
|
2010
|
2011
|
2012
|
||||||||||||
|
Airborne systems:
|
$ | 791 | $ | 970 | $ | 1,054 | ||||||||
|
Land systems:
|
363 | 405 | 375 | |||||||||||
|
C4ISR systems:
|
1,019 | 996 | 1,018 | |||||||||||
|
Electro-optic systems:
|
369 | 300 | 324 | |||||||||||
|
Other (mainly non-defense engineering and production
services):
|
128 | 146 | 118 | |||||||||||
|
Total:
|
$ | 2,670 | $ | 2,817 | $ | 2,889 | ||||||||
The following table provides our consolidated revenues by geographic region, expressed as a percentage of total revenues for the years ended December 31, 2010, 2011 and 2012:
15
|
2010
|
2011
|
2012
|
||||||||||
|
Israel
|
18% | 25% | 24% | |||||||||
|
North America (U.S. and Canada)
|
31% | 31% | 32% | |||||||||
|
Europe
|
20% | 20% | 20% | |||||||||
|
Latin America
|
9% | 6% | 6% | |||||||||
|
Asia-Pacific
|
20% | 16% | 17% | |||||||||
|
Others
|
2% | 2% | 1% | |||||||||
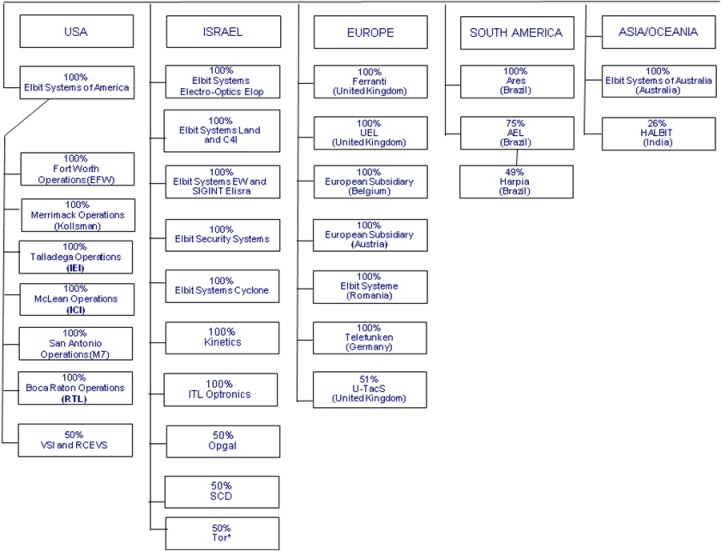
Subsidiary Organizational Structure
Our beneficial ownership interest in our primary subsidiaries and investees is set forth below. Our equity and voting interests in these entities are the same as our beneficial ownership interests.
The following is a general description of our principal subsidiaries.
|
(*)
|
As of February 28, 2013, Tor was owned 100% by the Company, but we are in process of transferring 50% of the ownership interest to Israel Aerospace Industries Ltd.
|
16
U.S. Subsidiaries
Elbit Systems of America
We conduct most of our U.S. business through Elbit Systems of America, LLC (Elbit Systems of America), a Delaware limited liability company, and its major wholly-owned subsidiaries including: EFW Inc. (EFW), Kollsman, Inc. (Kollsman), KMC Systems, Inc. (KMC), International Enterprises, Inc. (IEI), Innovative Concepts, Inc. (ICI), M7 Aerospace LLC (M7) and Real-Time Laboratories, LLC (RTL). We hold our 100% interest in Elbit Systems of America through intermediate Delaware holding companies. Elbit Systems of America provides products and system solutions focusing on U.S. military, commercial aviation, homeland security and medical instrumentation customers. Elbit Systems of America is organized along a number of main business lines operating out of several primary operational facilities. The major business lines include Airborne Solutions, Land and C4I Solutions, Sensor and Electro-Optics Solutions, Unmanned Aircraft Systems, Services and Support Solutions, Commercial Aviation – Kollsman and Medical Instruments – KMC Systems. Elbit Systems of America’s main operation centers include its facilities in Fort Worth, Texas; San Antonio, Texas; Merrimack, New Hampshire; Boca Raton, Florida; Talladega, Alabama; and McLean, Virginia.
Elbit Systems of America acts as a contractor for U.S. Foreign Military Financing (FMF) and Foreign Military Sales (FMS) programs. (See below “Governmental Regulations – Foreign Military Financing.”) Each of Elbit Systems of America’s major operational facilities has engineering and manufacturing capabilities. Elbit Systems of America’s facilities in Alabama and Texas have significant maintenance and repair capabilities. (See below “Manufacturing” and “Customer Satisfaction and Quality Assurance.”)
Elbit Systems of America, Elbit Systems and intermediate Delaware holding company subsidiaries are parties to a Special Security Agreement (SSA) with the DoD. The SSA provides the framework for controls and procedures to protect classified information and export controlled data. The SSA allows the Elbit Systems of America companies to participate in classified U.S. government programs even though, due to their ownership by Elbit Systems, the Elbit Systems of America companies are considered under the control of a non-U.S. interest. Under the SSA, a Government Security Committee of Elbit Systems of America’s board of directors was permanently established to supervise and monitor compliance with Elbit Systems of America’s export control and national security requirements. The SSA also requires Elbit Systems of America’s board of directors to include outside directors who have no other affiliation with the Company. Elbit Systems of America’s board of directors also contains officers of Elbit Systems of America and up to two inside directors, who have other affiliations with the Company. The SSA requires outside directors and officers of the Elbit Systems of America companies who are directors, and certain other senior officers, to be U.S. resident citizens and eligible for DoD personal security clearances.
VSI/RCEVS.
Elbit Systems of America and Rockwell Collins Inc. (Rockwell Collins) each own 50% of Vision Systems International LLC (VSI) and Rockwell Collins ESA Vision Systems LLC (RCVES), joint venture companies with operations in Fort Worth, Texas and Cedar Rapids, Iowa. VSI was established in 1996, and RCVES was established in November 2012. VSI and RCEVS act on a world-wide basis on behalf of Rockwell Collins and Elbit Systems/ Elbit Systems of America in the area of helmet mounted display systems for fixed-wing military and paramilitary aircraft. Elbit Systems, Elbit Systems of America and Rockwell Collins each have provided VSI and RCEVS with licenses to use their helmet mounted display technologies. In general, VSI and RCEVS subcontract product development and production to its owners on an approximately equal basis. Each owner has equal representation in VSI and RCEVES management.
Israeli Subsidiaries
Elop.
Based in Rehovot, Israel, our wholly-owned subsidiary Elbit Systems Electro-Optics Elop Ltd. (Elop) (formerly Elop Electro-Optics Industries Ltd.) designs, engineers, manufactures and supports a wide range of electro-optic systems and products mainly for defense, space and homeland security applications. With more than 75 years of operational experience, Elop has a broad customer base, both in Israel and internationally.
ESLC.
Elbit Systems Land and C4I Ltd. (ESLC) is a wholly-owned Israeli subsidiary, with headquarters in Netanya, Israel. ESLC is engaged in the worldwide market for land-based systems and products for military vehicles, artillery and mortar systems, C4I systems and communications systems and equipment.
17
Elisra
.
Elbit Systems EW and SIGINT –
Elisra Ltd. (Elisra) (formerly Elisra Electronic Systems Ltd.) is a wholly-owned Israeli subsidiary located in Bnei Brak and Holon, Israel. Elisra and its subsidiaries provide a wide range of EW systems, signal intelligence (SIGINT) systems and C4ISR technological solutions for the worldwide market.
Cyclone.
Elbit Systems – Cyclone Ltd. (Cyclone) is a wholly-owned Israeli subsidiary of Elbit Systems. Located near Karmiel, Israel, that designs and produces composite and metal aerostructure parts for civil and military aircraft and performs maintenance, integration and installation engineering for aircraft and helicopters. Cyclone also manufactures weapons pylons and external fuel tanks for fighter aircraft. Both directly and through our wholly-owned subsidiary Snunit Aviation Services Ltd., Cyclone supplies maintenance and operation services for fixed-wing aircraft and helicopter fleets.
ELSEC.
Elbit Security Systems Ltd. (ELSEC) is a wholly-owned Israeli subsidiary of Elbit Systems. Located in Sderot, Israel, ELSEC operates mainly in the fields of homeland security, electro-optic surveillance systems, E-fences, border and coastal integrated security systems, airport security systems, other transportation security systems and strategic perimeter sites security. ELSEC also manufactures a range of electro-optic products.
Kinetics.
Kinetics Ltd. (Kinetics), based in Airport City, Israel, is a wholly-owned Israeli subsidiary. Kinetics develops technologies, systems and products in the field of advanced life support and environmental controls, such as climate control systems and nuclear, biological and chemical protection systems for combat vehicles. Also, Kinetics develops and manufactures other products for land vehicles, such as hydraulic, fuel, braking and suspension systems, an auxiliary power unit for land vehicle power pack systems and hydraulic systems for aircraft.
ITL Optronics.
ITL Optronics Ltd. (ITL Optronics) is a wholly-owned Israeli subsidiary located in Rehovot, Israel, engaged in the area of soldier-oriented optronic systems.
SCD.
Semi-Conductor Devices (SCD) is an Israeli registered partnership equally owned by Elbit Systems and Rafael Advanced Defense Systems Ltd. (Rafael). Located in Leshem, Israel, SCD develops and manufactures cooled and uncooled IR detectors for thermal imaging equipment and laser diodes used in defense and commercial applications.
Opgal.
Opgal – Optronics Industries Ltd. (Opgal
)
is an Israeli company owned 50.1% by Elbit Systems and 49.9% by Rafael. Located in Karmiel, Israel, Opgal provides commercial applications of thermal imaging and electro-optic technologies, including an enhanced vision sensor designed to assist in landing aircraft under limited visibility and harsh weather conditions and thermal imaging cameras and systems for surveillance, industrial, medical and fire fighting applications. Opgal also produces IR subassemblies for forward-looking infrared (FLIR) sensors for defense applications.
Tor.
Tor - Advanced Flight Training Limited Partnership (Tor) is an Israeli limited partnership based in Tel-Aviv, Israel, established to perform the Israeli Air Force’s future trainer aircraft program. See below “Current Business Operations – Military Aircraft and Helicopter Systems – Programs.” TOR is currently wholly-owned by Elbit Systems, but is in the process of having 50% of its ownership interest transferred to Israel Aerospace Industries Ltd. (IAI) pursuant to a limited partnership agreement.
Subsidiaries in Other Countries
Ferranti.
Ferranti Technologies (Group) Limited (Ferranti), is a wholly-owned U.K. subsidiary. Located in Oldham, U.K, Ferranti’s principal activities include engineering, manufacturing and logistic support to aerospace and defense industries in the U.K. and internationally.
U-TacS.
UAV Tactical Systems Ltd. (U-TacS) is a U.K. subsidiary located in Leicester, U.K., held 51% by Elbit Systems (through a wholly-owned U.K. holding company – Elbit Systems UK Limited), with the remaining 49% owned by Thales UK Limited, a subsidiary of Thales S.A. U-TacS’ main business is to perform a major part of the Watchkeeper Program and other related programs
.
See below “Current Business Operations – UAS –Programs.”
European Subsidiary (Belgium).
The European Subsidiary (Belgium) is a wholly-owned Belgium subsidiary located near Ghent, Belgium. It develops, manufactures and supports electro-optical products, mainly for the defense and space markets.
18
European Subsidiary (Austria).
The European Subsidiary (Austria) is a wholly-owned Austrian subsidiary located near Vienna, Austria. It is engaged in programs relating to airborne, land and C4I systems.
Elbit Systeme.
Elbit Systems S.A. (Elbit Systeme) is a wholly-owned Romanian subsidiary located in Bucharest, Romania. Elbit Systeme serves as the base for our various defense and commercial operations and holdings in Romania.
Telefunken RACOMS.
Telefunken Radio Communications Systems GmbH (Telefunken RACOMS) is a wholly-owned German subsidiary located in Ulm, Germany. Telefunken RACOMS is active in both military and civilian communications projects in Germany and internationally.
AEL.
AEL Sistemas S.A. (AEL) is a 75%-owned Brazilian subsidiary, with the 25% balance of its shares owned by Embraer Defesa e Seguranca Participacoes S.A. (Embraer Defesa). Located in Porto Alegre, Brazil, AEL performs engineering, manufacturing and logistic support activities for defense and commercial applications.
Ares.
Ares Aeroespacial e Defesa S.A. (Ares) is a wholly-owned Brazilian subsidiary located near Rio de Janeiro and is engaged in the area of defense electronic systems for the Brazilian military and other customers.
Harpia.
Harpia Sistemas S.A. (Harpia) is a Brazilian subsidiary, 49% owned by AEL and 51% owned by Embraer Defesa. Based in Brasilia, Brazil, Harpia is engaged in the areas of UAS, avionics and simulation systems. In January 2013, an agreement was signed under which AEL will sell 9% of the ownership interest in Harpia to Avibras Divisao Aerea e Naval S.A. (See below “Recent Acquisitions, Mergers and Divestitures – Mergers.”)
Elbit Systems of Australia.
Elbit Systems of Australia Pty Ltd. (Elbit Systems of Australia) is a wholly-owned subsidiary. Located in Melbourne, Australia. it is engaged in defense electronic systems for the Australian armed forces and other customers.
HALBIT
. HALBIT Avionics Private Limited (HALBIT) is an Indian company owned 26% by Elbit Systems, with the largest shareholder being Hindustan Aerospace Limited. Located in Bangalore, India, HALBIT is engaged in avionics programs for the Indian defense market.
Others.
We have several other relatively small subsidiaries and investee companies in Israel and other countries that conduct marketing, manufacturing, logistic support and other activities principally in the subsidiary’s local market.
Recent Acquisitions, Mergers and Divestitures
During 2012 and the beginning of 2013, we continued to focus our capabilities through the enhancement of joint ventures in Israel, the U.S. and Brazil as well as the initiation of operations in technology-based investment companies in Israel. We also divested certain non-core assets, and are in the process of divesting other non-core assets, in Israel and abroad.
Enhancement of Joint Ventures and Technology-based Investment Companies
During 2012, we began operational activities in Tor (see above “Israeli Subsidiaries”). Tor was established to perform the new aircraft trainer program for the Israeli Air Force, and in September 2012, it received its initial contract under that program. (See below “Military Aircraft and Helicopter Systems – Programs”.)
In November 2012, we established Rockwell Collins - ESA Vision Systems LLC, an additional joint venture in the U.S. with Rockwell Collins Inc., to pursue helmet mounted systems for fixed-wind military aircraft. (See above “U.S. Subsidiaries – VSI/RCEVS”.)
In January 2013, we enhanced our Brazilian joint venture Harpia Sistemas S.A. (Harpia), by entering into agreements with Embraer Defesa and Avibras Divisão Aerea e Naval S.A. (Avibras), pursuant to which Avibras will acquire a 9% interest in Harpia from AEL. Avibras will provide Harpia the right to use Avibras’ UAS related assets. Following completion of this transaction, Harpia will be owned 51% by Embraer Defesa, 40% by AEL and 9% by Avibras.
During 2012, we launched activities in Incubit Technology Ventures Ltd., a wholly-owned Israeli subsidiary located in the High Technology Center in Beersheva, Israel, that will pursue investments in high technology startup companies.
19
Divestitures.
During 2012 and the beginning of 2013, we divested and signed agreements to divest certain non-core assets. These divestment transactions included an agreement to sell our approximately 59% ownership interest in Fraser-Volpe, LLC, a U.S. company engaged in certain optic-based products for military and commercial applications. We also sold our approximately 19% interest in Chip PC Ltd., an Israeli company involved in “thin client” solutions related to server-based computer technologies.
We sold our ownership in a brand name relating to Soltam for houseware product uses. We also sold the assets relating to AEL’s commercial fleet navigation business in Brazil. The consideration received from the sales of these ownership interests and assets was not material.
Current Business Operations
We generally operate and manage the major activities described below in an interrelated manner and on a project-oriented basis. This means that contracts are frequently performed by more than one operating subsidiary or division within the Company, on the basis of the multiple skills and available resources that may be needed or appropriate for the contract. Thus, the involvement of an operating subsidiary or division in the performance of a contract is not a function of management’s review for purposes of allocation of resources within the Company.
Military Aircraft and Helicopter Systems
Overview
We supply a comprehensive portfolio of advanced airborne electronic and electro-optic systems and products to leading military aircraft manufacturers and end users designed to enhance operational capabilities and extend aircraft life cycles. Our military airborne systems are compatible with emerging net-centric concepts supporting enhanced situational awareness, faster decision making and optimal response. Our airborne C4ISR solutions provide pilots with data, communications and real-time situation pictures, as well as the ability to share mission-critical data with ground and naval platforms, thus enhancing joint, effective operations between air to air, air to ground, manned and unmanned platforms via common avionics and C4I solutions. Our multidisciplinary approach extends to designing training and simulation systems that accommodate evolving missions and combine air and ground systems in a single architecture.
Our airborne systems provide a range of solutions from a single sensor to an entire cockpit avionics suite. We integrate our systems on fixed and rotary-wing, eastern and western, new and mature aircraft. Under our aircraft and helicopter upgrade programs, we integrate advanced weapon, communication, navigation, electro-optic and EW systems, providing advanced net-centric capabilities for fast, precise missions. We support life cycle extension of our customers’ fleets and supply logistic support services for airborne platforms, including repair and maintenance centers, training and spare parts.
Systems Portfolio
Our systems and products for military fixed-wing aircraft and helicopters include a range of advanced avionics systems, electro-optic and aerial reconnaissance systems, precision guidance systems, fighter aircraft structural components, data links, training systems and simulators. This is in addition to our helmet mounted systems and EW airborne systems described below.
Avionics Systems
. Our avionics systems include integrated flight deck systems (glass cockpits), mission and aircraft management computers, weapon delivery and navigation systems, large display systems, airborne C4I systems, digital map systems, enhanced vision systems, stores management systems and digital recording devices
.
Electro-Optic Systems
. Our airborne electro-optic systems include direct infrared countermeasures (DIRCM) systems, head-up displays, laser range-finders and laser designators, FLIR systems, payloads such as the CoMPASS
™
family, countermeasures systems and aerial reconnaissance systems such as the CONDOR
™
long-range oblique photography system.
Precision Guidance Systems.
We supply a range of precision guidance systems for airborne applications including the Whizzard family (LIZARD and GAL) of laser-based precision guidance kits, semi-active laser (SAL) seekers, the STAR (smart tactical advance rocket) and the GATR (guided advanced tactical rocket).
Fighter Aircraft and Helicopter Structural Components
. We supply external fuel tanks, pylons and structural parts for fighter aircraft such as the F-15, F-16 and F-18, and we supply structural parts for helicopters such as the UH-60 and CH-53.
20
Trainers and Simulators
. Our training and simulation products and solutions for all military branches and homeland security include a variety of simulators, complete training centers for tactical, virtual, appended and embedded training, full mission trainers, partial task trainers and computer-based trainers. We also supply air defense simulators, naval embedded and tactical trainers and ACMI (air combat maneuvering instrumentation) pods.
Programs
Our programs for military fixed-wing aircraft and helicopters encompass full scale aircraft upgrades, system upgrades, system and product supply, training, simulators and logistic support. The customers and end users for our military fixed-wing aircraft and helicopters programs include the Israeli Air Force (IAF), the U.S. Air Force (USAF), the U.S. Navy (USN), the U.S. Army, the U.S. Marine Corps (USMC), the U.S. Coast Guard, air forces and other branches of the armed forces of the North American Treaty Organization (NATO) member governments and/or European Union (EU) member governments, Brazil, Korea as well as of other governments around the world. Our customers also include major fixed-wing aircraft and helicopter manufacturers such as Lockheed Martin Inc. (Lockheed Martin), the Boeing Company (Boeing), Raytheon Company (Raytheon), BAE Systems Inc. (BAE Systems), Embraer S.A. (Embraer), European Aerospace Defence and Space Company N.V. (EADS), EADS – CASA, Alenia Aermacchi S.p.A. (Aermacchi), Dassault Aviation S.A.
(Dassault)
,
Eurocopter S.A. (Eurocopter), Hindustan Aeronautics Limited (HAL), Bell Helicopters Textron Inc. (Bell Helicopters), Sikorsky Aircraft Company (Sikorsky) and Agusta S.p.A. (Agusta), among others.
We perform upgrade programs for numerous fixed-wing fighter, trainer and transport aircraft, as well as a wide range of helicopter platforms. In 2012, our contract awards for aircraft upgrade programs included contracts for the upgrade of C-130H transport aircraft for the IAF and for the Republic of Korea’s Air Force. We also supply on a stand-alone basis advanced avionics systems such as mission computers, displays, moving maps, digital video recorders, tactical data links and operational flight protocol software for many fixed-wing and rotary-wing aircraft. This includes, among others, numerous systems for Lockheed Martin’s F-16 aircraft. Other contracts awarded in 2012 include a contract for the redesign and upgrade of the Apache Longbow mission processor, as well as contracts for battle management systems and avionics for IAF helicopters. We were selected by Boeing to develop the Advanced Cockpit system consisting of a Large Area Display and a Low Profile Heads-Up Display for future F-15 and F/A-18 fighter aircraft. During 2012, Cyclone was awarded orders by Boeing for the supply of several structural components for military aircraft.
We also supply a range of airborne electro-optic systems for fixed-wing fighter and trainer aircraft, including head-up display systems for aircraft such as the C-17, F-16 Block 50, F-15, F/A-18 and the KC-390, as well as airborne reconnaissance systems and combined airborne imagery intelligence (IMINT) systems for fighter aircraft. In addition, we supply various types of precision guidance systems to several air forces and missile manufacturers.
Our airborne, training and simulators programs include aircraft flight training solutions and operation of training aircraft for both fixed-wing trainers and helicopters under private financing initiative (PFI) and “power by the hour” (PBH) arrangements. In 2012, we were awarded a contract to integrate F-15 training capabilities into the IAF’s Mission Training Center. We also supply several customers with EHUD ACMI systems for real-time autonomous air-to-air and air-to-ground combat training and debriefing. We supply simulation systems including the IAF’s F-16I aircrew flight and system trainer and a mission training center as well as a B-200 simulator for the IAF. We will also supply the training system for the IAF’s future trainer aircraft program. We are supplying Boeing with the Virtual Mission Training system for the USN’s T-45 Goshhawk aircraft and numerous other fixed and rotary wing aircraft. We also supply Israel Defense Forces (IDF) ground forces with a tactical battle group trainer as well as tank appended trainers, and the IDF’s Home Front Command with a crises management simulator. Our naval training simulators are used by the Israeli Navy and several other navies world-wide.
Our logistic support services programs for fixed-wing aircraft and helicopters include repair and maintenance services and supply of spare parts for a range of air forces. Part of these services are performed as contractor logistic support (CLS) projects and performance based logistics (PBL). In 2012, Tor, our joint venture with IAI, was awarded a contract by the IMOD in the amount of approximately $603 million, to perform the IAF’s future trainer aircraft program. Our share of this contract is in the amount of approximately $420 million, of which approximately $110 million is to be performed in the establishment phase of the program over the next three years, and approximately $310 million during the operational phase of the program over a 20-year period. The program calls for establishment of an enhanced logistic support and maintenance structure for the new trainer aircraft as well as an advanced ground array. We operate and maintain the IAF’s Effroni trainer aircraft and the Israeli Police Force’s helicopter fleet. We also perform maintenance support activities for numerous products such as jammers, radar, 20 mm cannon and others. We provide on a turn-key basis aircraft procurement, operation and maintenance services to the IMOD for airborne fire fighting services.
21
Through AEL, we provide CLS services for several aircraft of the Brazilian Air Force. Through ESA’s subsidiary, M7, we provide aircraft level CLS to the U.S. Army, USAF and USN for a range of aircraft on a worldwide basis, including a recent award by BAE Systems to M7 to provide logistics support for USN T-34, T-44 and T-6 aircraft.
Helmet Mounted Systems
Overview
. We design and supply a range of advanced helmet mounted systems (HMS), including helmet mounted displays (HMDs) for fixed-wing aircraft and rotary aircraft pilots. These include tracking and display systems, both for day and night flying. Our systems measure the pilot’s line of sight, slave weapons and sensors to the target, identify target location and bring displays to the pilot’s eye level. We supply our HMS as part of our upgrade programs as well as on a stand-alone basis. Through our jointly-owned companies with Rockwell Collins, (see above “Principal Subsidiaries – VSI/RCEVS”), we are a leader in HMS for fighter aircraft.
Systems Portfolio
Fixed-Wing HMS.
Examples of our fixed-wing HMS currently in operational use include the Display and Sight Helmet (DASH) family, the Joint Helmet Mounted Cueing System (JHMCS), the Night Vision Cueing Display (NVCD) system and the HMS for the F-35 Joint Strike Fighter (JSF). These systems enable slaving of various aircraft systems to the pilot’s line of sight, target location and identification and display of information. We have also developed TARGO
®
, a HMA (helmet mounted avionics) solution for fixed-wing trainer aircraft, and we supply the FACT
®
(fast action cockpit mapping tool) for electro-magnetic mapping of cockpits.
Helicopter HMS.
For helicopters, our operational HMS include the Aviator Night Vision Imaging System Head-Up Display (ANVIS/HUD
®
) family, the Integrated Helmet and Display Sight System (IHADSS), Jedeye
®
and the Panoramic Night Vision Goggle (PNVG) based on our QuadEye
®
system. We also supply low visibility landing (LVL) solutions. These systems facilitate safety for night flights, weapon slaving, increased operational capabilities and performance of “head-out” missions.
Programs
We are engaged in a range of programs for HMS for fighter aircraft and helicopters. Customers and end users for our HMS include the IAF, USAF, U.S. Army, USN, USMC, U.S. Coast Guard, air forces of EU and NATO member governments and other governments’ air forces. Our customers also include aircraft and helicopter manufacturers such as Boeing, Lockheed Martin, Bell Helicopters, Sikorsky, Agusta and Aermacchi.
In the fighter aircraft area we supply various versions of our DASH systems for the IAF’s F-15I and F-16 (C, D and I) aircraft as well as for other air forces around the world. We supply the JHMCS through VSI for Boeing’s F-15 and F/A-18 aircraft and for Lockheed Martin's F-16 aircraft. Thousands of JHMCS production systems have been delivered and are in operational use by the USAF, the USN, the U.S. Air National Guard (ANG) and the air forces of more than 25 other countries including orders for additional lots received during 2012. Through VSI and RCEVS we are developing and supplying the HMS to Lockheed Martin for the U.S. F-35 Joint Strike Fighter (JSF) Program. VSI is also supplying the NVCD to the USN. The NVCD includes the PNVG, based on our QuadEye
®
system. In the trainer aircraft area we are supplying TARGO
®
for the M-346 Advanced Trainer. In the helicopter area we have supplied thousands of operational ANVIS/HUD
®
systems for numerous customers. We also supply IHADSS to various users of Apache and Agusta 129 helicopters, as well as the Helmet Display and Tracking System for the weapon system of the USMC AH-1W helicopters, and the color helmet mounted system for the CV-22.
Commercial Aviation Systems and Aerostructures
Overview
. Leveraging our core competencies in airborne defense systems, as well as our legacy strengths in commercial aviation, we provide a range of systems and products for the commercial and business aviation market. These activities mainly include vision-based cockpit concept systems, other avionics systems, electrical systems, pressurization systems and aerostructure products. Our commercial avionics systems are employed on numerous fixed-wing aircraft, as well as on commercial helicopters. Our aerostructure products are installed on a number of commercial aircraft.
22
Systems Portfolio
Vision-based Cockpit Systems
. Our commercial aviation product line includes the Vision Based Cockpit concept, incorporating our Clear Vision
™
multi-spectral enhanced vision system (EVS), our EVS II and EVS-XP systems and our General Aviation – Vision System (GAViS
®
) ,which improve an aircraft’s capability to safely land in bad weather and reduced visibility conditions. We also supply the Landing
®
system that enhances landing safely under a variety of conditions. Our commercial aviation products provide critical information to pilots including a family of commercial advanced head-up displays and unique synthetic vision and image-based applications.
Avionics, Electronic and Legacy Systems
. We supply cabin pressurization control systems, air data test equipment, air data processor/sensor systems and flight instruments for the general aviation market. Our legacy products for commercial aircraft include altimeters, pressure meters, cockpit indicators and avionics test equipment.
Commercial Helicopter Systems.
We produce full avionic suites, including displays, moving maps, electronic flight instrumentation systems and flight management systems for commercial helicopters.
Aerostructure Products
. Our aerostructure parts include pressurized and non-pressurized doors, composite beams and composite landing gear doors, thrust reverse blocker doors, fan cowl doors and winglets for commercial aircraft manufactured by Boeing, Airbus, King Air and others, as well as aerostructures for UAS.
Hydraulic Components.
We supply hydraulic and pneumatic components for aerial refueling, jet engines and missiles and rockets.
Programs
Customers for our commercial and business aviation systems and products include General Dynamics – Gulfstream Aerospace Corporation (Gulfstream), Boeing, Airbus S.A.S. (Airbus), Hawker Beechcraft Corporation, Eurocopter, Dassault, Air Macchi, FedEx Express Inc. (FedEx Express), Embraer, Honeywell, Sikorsky, Piaggio America Inc. and Jetcraft Aviation Ltd. (Jetcraft). Customers for our aerostructure products for commercial aircraft include Spirit Aerosystems Inc. (Spirit Aero Systems), Airbus, Boeing, IAI and others.
Our programs in the area of commercial avionics and enhanced vision systems include a number of U.S. Federal Aviation Administration (FAA) certifications for installation of our EVS on a range of Gulfstream business jets and FedEx Express MD11 aircraft. EVS II also has received European Aviation Safety Agency (EASA) approval, and our GAViS
®
system has been FAA certified.
Elbit Systems of America maintains an FAA certified repair facilities for commercial avionics repairs. As the original manufacturer of the Fairchild Metro/Merlin aircraft, ESA’s subsidiary M7 provides ongoing spares and engineering support for over 700 aircraft around the world. Cyclone performs maintenance for commercial helicopters.
UAS (Unmanned Aircraft Systems) and USVs (Unmanned Surface Vessels)
Overview
. We design and supply integrated UAS for a range of applications. We design and manufacture a variety of UAS platforms, including the Hermes
®
and Skylark
®
families of UAS. We supply UAS training systems with capabilities to simulate payload performance, malfunctions and ground control station operation. We design and supply command and control ground station elements, engines, data links, stabilized electro-optic payloads and electronic intelligence (ELINT) and communications intelligence (COMINT) payloads that can be adapted for various types of UAS. Our UAS technology has also been applied to our unmanned ground vehicle and USV activities. We also are developing USVs for a range of naval applications.
Systems Portfolio
Hermes
®
UAS Family.
As part of our intelligence, surveillance, target acquisition and reconnaissance (ISTAR) solutions, we developed our Hermes
®
family of tactical UAS including Hermes
®
450 (in various configurations) a tactical long-endurance UAS supporting ISTAR missions, Hermes
®
900, a tactical medium altitude long-endurance (MALE) UAS, and Hermes
®
90, a tactical short-range UAS designed for long-endurance point-launch ISR missions.
23
Skylark
®
UAS Family.
Our Skylark
®
family of mini-UAS includes electrically propelled and covert short-range UAS with ISR capabilities for company-brigade-level tactical echelons. The family is based on Skylark
®
I, a man-packed UAS for close-range surveillance and observation, Skylark
®
I LE, which provides longer endurance of the Skylark
®
I capabilities.
Ground Stations.
Our UAS ground stations include mission command and control, payload operation and exploitation capabilities.
Engines.
Our UAS engines include a family of Wankel rotary technology based engines providing UAS with the capability to carry multiple payloads with extended endurance.
Training Systems.
Our UAS training systems include full air vehicle and payload high end operators and mission commanders training.
Data Links and Payloads.
We develop and manufacture data links and payloads for our UAS as well as tactical data links and networking solutions for UAS.
USVs.
We are developing USVs, such as the Silver Marlin and Stingray, for various maritime applications that adopt the capabilities of our UAS to sea-based applications.
Programs
We perform a broad range of development, supply, lease, support services and training activities relating to UAS. The principal customers for our UAS include the IDF, the U.K. Armed Forces through Thales U.K., the Brazilian Air Force and other customers (mainly governmental organizations) around the world.
We are performing under the U.K. Ministry of Defence’s (UK MOD) Watchkeeper and Lydian programs. U-TacS was awarded a contract by Thales U.K., the prime contractor to the UK MOD for the program. U-TacS is supplying the Watchkeeper subsystem comprised of the dual payload WK 450 UAS (based on the Hermes
®
450). U-TacS is also under contract for the UK MOD Lydian Program to supply service-based support to an ISR capability in an overseas theatre, including Hermes
®
450 UAS, training and contractor logistics support and is performing an urgent operating capability (UOR) contract to provide the U.K. Armed Forces ISTAR support capability.
Our first large UAS program was providing Hermes
®
450 to the IDF, which has been fully operational for more than a decade, providing the backbone of the IDF’s tactical UAS. Under this program the Hermes
®
450 has accumulated over 200,000 flight hours. We also supply the IDF Hermes
®
900 systems and Skylark
®
systems.
During 2012, we were awarded a number of UAS-related contracts including for the following programs. We were awarded an approximately $160 million contract to supply UAS to a European customer over the next two years. In addition, we were awarded a contract to supply Hermes
®
900 and 450 UAS to a Latin American customer.
In January 2013, we were awarded contracts by the IMOD to supply the IDF with additional Hermes
®
900 UAS, UAS maintenance services and to develop advanced UAS features.
In February 2013, the U.S. Army selected five companies, including Elbit Systems of America, as potential suppliers for the Army’s Small Unmanned Aircraft Systems (SUAS) program. If awarded a contract under the SUAS program, Elbit Systems of America will supply Skylark
®
I-LE Block II UAS.
Land Vehicle Systems
Overview
. We upgrade and modernize tanks, other combat vehicles and artillery platforms both as a prime contractor and as a systems supplier to leading platform manufacturers. Our land vehicle and platform solutions cover the entire combat vehicle spectrum, from complete modernization, to system supply to maintenance depots and life cycle support services. Utilizing our experience from advanced avionics systems, electro-optic thermal imaging and C4I systems, we adapt and develop “tankionics” for land vehicles that shorten the “sensor to shooter” loop. Our systems are operational on a full range of tracked and wheeled combat vehicles including main battle tanks, medium and light tanks, light armored vehicles, armored personnel carriers, wheeled vehicles and artillery platforms. We offer a comprehensive range of fully integrated, modular artillery and mortar solutions, incorporating C4I and fire control systems and platform upgrades, as well as a complete range of artillery and mortar ammunition. We also develop and supply unmanned ground vehicles and robotic devices for a variety of land based missions. In addition, we supply training systems for tanks and fighting vehicles.
24
Systems Portfolio
Fire Control Systems.
We supply fire control systems using day and night vision systems and displays for target identification, acquisition and engagement, incorporating thermal imaging, laser range-finders, day TV, digital ballistic computers and sensors.
Electric Gun and Turret Drive Systems.
We supply electric gun and turret drive and stabilization systems for controlling electrically driven turrets and guns using advanced brushless technology and digital/software based servo systems.
Laser Warning and Threat Detection Systems.
We provide a wide range of combat proven computer and display hardware products and situation awareness peripheral vision systems, including laser warning systems for identifying and pinpointing the angular direction of laser sources generated by laser range-finders and laser guided and laser beamrider missiles.
Unmanned Turrets and Remote Controlled Weapon Stations.
We supply advanced unmanned turrets and overhead remote controlled weapon stations, including the UT30 configurable unmanned turret and the Overhead Remote Controlled Weapon Station (ORCWS) family of products, that enhance ground vehicle capabilities for urban warfare scenarios and convert armored personnel carriers to armored fighting vehicles with no penetration of the vehicle’s deck.
Unmanned Systems
. We supply various unmanned ground vehicle (UGVs) platforms, including our small-size UGV – the Elbit Viper
™
(Versatile Intelligent Portable Elbit Robot), a man-packed robot designated for urban combat support missions and mini-robotic devices used by land forces for tactical missions. Through G-NIUS, our jointly-owned company with IAI, we developed and supply a number of UGVs for combat mission support.
Smart All-Terrain Networked Detectors (SAND).
We develop and supply SAND, an advanced, stand-alone, long-life, wireless security system that remotely monitors wide areas and detects and tracks both the movements of people as well as the movements of all types of vehicles.
C4I Systems.
Our C4I systems for combat vehicles include battle management systems that process data and enhance situational awareness of land vehicle crews and commanders and include electro-optic-based laser range-finders, TOW night targeting sights, thermal imaging systems, flat paneled color displays, threat detection systems, gunner’ and commander’s sights, laser warning systems, reconnaissance systems and our “See-through Armor” system providing 360° panoramic observation for 360º location and identification and gun-turret direction, using day and night vision systems.
Surveillance, Reconnaissance and Targeting Systems and Sensors.
We supply fully-customizable ground and mobile solutions for intelligence collection and dissemination comprised of a broad array of lightweight network-ready sensors and C4I systems, providing day and night observation, target detection and recognition, radar and identification of friendly forces. The sensors are fully controlled from the commander terminal, with digital maps for navigation and orientation. We also develop unattended ground sensors that detect human and vehicle activity.
Artillery Guns and Mortar Systems.
We develop and supply a range of howitzers and artillery field guns. We also develop and supply a range of mortar systems for special forces, commando units and infantry forces. We develop and supply a range of mortar ammunition, white phosphorus (WP) and smoke mortars and illuminating bombs
Counter-IED Measures.
We develop and supply deployed vehicle mounted counter remote controlled improvised explosive devices (IEDs) electronic warfare systems, which protect vehicle crews from IEDs.
Driver Thermal Vision Systems.
We develop and supply uncooled thermal imaging kits, fully ruggedized and suitable for a wide range of vehicle-mounted applications.
25
Auxiliary Power Units (APUs).
We develop and supply APUs that improve the vehicle crew’s performance and safety by reducing fatigue and minimizing exposure to noise, heat and vibrations.
Life Support and Hydraulic Systems
. We supply life support systems for land vehicles for environmental, climate and chemical, biological, radiological and nuclear (CBRN) protection and control. The systems include heating, ventilation and air conditioning (HVAC), water generation and fire suppression systems. We also supply hydraulic systems for vehicle fueling, braking, suspension and power pack operation.
Programs
We are engaged in a wide range of land vehicle systems programs, from comprehensive vehicle modernization programs, to stand-alone system supply to vehicle manufacturers to life cycle support programs. Customers for our land vehicle systems include the IDF, the U.S. Army, the USMC, the armed forces of numerous NATO and EU members, the Brazilian Army and armed forces of other countries, as well as major military vehicle manufacturers such as General Dynamics Corporation (General Dynamics), BAE Systems Inc. (BAE Systems), Lockheed Martin, Patria Oyj (Patria), Mowag GmbH (Mowag), Steyr GmbH (Steyr) and Iveco S.p.A. (Iveco). We supply a range of systems for all models of the IDF’s main battle tank, the Merkava. We also are supplying systems to BAE Systems for the U.S. Army’s Bradley A-3 fighting vehicle and to Lockheed Martin for the U.S. Army Multiple Launch Rocket System (MLRS) as well as for the U.S. Army’s and USMC’s High Mobility Artillery Rocket System (HMARS) and Light Armored Vehicle (LAV). We are supplying unmanned turrets for the Brazilian Army Land Forces’ Guarani Project and are performing numerous land vehicle modernization programs for European and Asian customers. We supply a range of thermal imaging systems and generic commander sights for various tanks and armored personnel carriers.
During 2012, we were awarded several contracts in the land vehicle and artillery platform areas, including for the following programs. We received a contract from the IMOD to supply Cardom electronic and artillery systems to the IDF. We also received an order to supply artillery systems to a Far Eastern country. Our Brazilian subsidiary AEL was awarded a production order to supply unmanned turrets for the Brazilian Army’s Guarani program, and our Brazilian subsidiary Ares was awarded a contract to supply REMAX remote controlled weapon stations to the Brazilian Army.
We also supply tank gunnery training systems, and ground forces trainers to other customers worldwide. We supply the U.S. Army and other customers, advanced life support systems, such as environmental and climate control and NBC protection systems, hydraulic, fuel, braking and suspension systems as well as an auxiliary power unit for a number of combat vehicles. Through G-NIUS, we are developing and supplying UGVs, which perform a variety of missions in support of infantry forces’ combat operations.
C4I and Cyber Systems
Overview
. Building on in-house capabilities and core technologies, we provide net-centric compatible solutions for land-based C4I systems ranging from target acquisition, to battle management to communication systems. We supply our advanced land-based C4I systems as part of turn-key solutions as well as on a stand-alone basis. Our solutions cater to all types of land combatant forces and can be integrated into military vehicles. Providing comprehensive net-centric solutions for low intensity conflicts (LIC) and counter-terror activities, our systems connect intelligence data to combat forces via C4I networks and mobile command and control posts and support “terrain dominance”. Our integrated infantry systems provide infantry units with C4ISR, field intelligence, urban warfare and peacekeeping capabilities. We also design and supply military information technology (IT) systems and IT and integrated information gathering systems to various governmental agencies for border control and management systems, crime prevention and other governmental applications, including a range of cyber-based C4I solutions. We also have access to a full range of radio and military communications solutions.
Systems Portfolio
Digital Army’s “Systems of Systems.”
We supply “systems of systems” such as the Digital Army Program (see below “Programs”), that incorporate advanced combat concepts geared to increase net-centric operational effectiveness and connectivity throughout all land forces echelons, in all combat situations. This includes TORC2H
®
, an integrated operational command control headquarters system, that closes the sensor to shooter loop and facilitates data collection and border patrol operations. It also includes our Tactical Intranet Geographic dissemination in Real-Time (Elbit TIGER
®
) advanced communication system and enhanced tactical computers.
26
Battle Management Systems (BMS).
We supply a range of battle management systems that comprise advanced electro-optical sensors, multi-functional displays, command and control software, information and dissemination systems and advanced mission computers, for enabling coordination among fighting vehicles and combat forces.
Integrated Infantry Combat Systems.
We supply systems that provide real-time net-centric information to infantry forces, including our DOMINATOR
®
system that enables infantry units to send and receive real-time data, view-up-to the-minute common operational pictures on personal displays and live video from either our external electro-optic payload advanced stabilized system (CoMPASS
™
) and our multi-sensor stabilized integrated system (MSIS), or from body sensors, as well as transmit images and positions back to the command post.
Artillery C4I Systems.
We supply a range of systems for C4I applications among field artillery units, such as our Combat NG system, which are deployed from the platform to brigade levels, managing all aspects of artillery operations and fire control, including for theater missile defense applications.
MapCore
®
.
We supply MapCore
®
, a software design kit providing mapping capabilities for application programmers, capable of manipulating 2D maps, 2.5D maps (2D maps with elevation) and 3D maps (terrain visualization) in the application’s user window and serving as an infrastructure for developing moving maps, mission planning and debriefing, C4ISR and simulator systems.
Observation and Ground Reconnaissance Systems
. We supply electro-optic-based thermal imaging, day-night observation systems and tactical reconnaissance systems for border control and ground reconnaissance.
Enhanced Tactical Computers and RPDAs.
We supply ruggedized enhanced tactical computers and ruggedized personal data assistants (RPDAs) that bring the versatility of advanced personal computers and data assistants to the operational battlefield, including . the Tacter
®
-31D tactical computer in a tablet configuration supporting both vehicle mounted and dismounted applications and the Tacter
®
-31M computer on a Windows-based platform.
Ground Smart Display Unit (GSDU).
We supply GSDU, a multi-function high brushless C4I display unit with supporting multiple video formats.
Tactical Multi-media Router (TMR).
We supply TMR, a building block for execution of multi-media routing on a dynamic basis for command posts as well as combat vehicles.
Radio and Communications Systems and Products.
Based in part on the Tadiran product line, we supply a range of tactical radio systems, software data radio systems, multi-channel radio systems, integrated radio communications systems, power HF communications systems, broadnet communications systems based on WiMAX technology, mobile net communications systems and tactical data communications systems and military wireless LAN systems for wide band data transmission. These systems are used for voice, data and video (multi-media) applications in a broad range of frequencies, starting at the VLF band though HF, VHF, UHF to the C-band and further on in the mm wave band, facilitating secured and ECCM immuned voice and broadband data communications. Our military communications product line also includes short and medium-range VHF radio systems, long-range HF radio systems, multi-band VHF-UHF handheld/man-pack radios, hand-held radios, soldier radios, line-of-sight multi-channel radio systems, ruggedized computers/communication terminals, integrated communications systems combining wireless (radio) and wired (telephony), IP/LAN/WAN networks situation awareness systems and radio network management systems.
Integrated Radio Communication System (IRCS)
. Our field proven IRCS enables all echelons, from high-ranking commanders down to the individual soldier in the field, to directly communicate throughout the military network.
BRO@DNET.
We develop and supply the BRO@DNET battle-proven broadband wireless communication infrastructure solution that enables secure broadband communication, integrating all echelons of military hierarchy into a unified communication solutions.
Satellite on the Move (SOTM).
We supply SOTM solutions and antennas for combat platforms for continuous satellite communication.
27
Communications Support Products and Services.
We supply a range of tactical radio power amplifiers for the AN/PRC-117F, AN/PSC-5 and Single Channel Ground and Airborne Radio Systems (SINCGARS).
Military IT Systems.
We deliver and supply military IT systems such as the Integrated Component-based Exploitation (ICE) system that provides ISR centers with an end-to-end system for the entire operational cycle of multi-sensor imagery exploitation. We also supply a multi-satellite mission planning system for planning satellite operational missions.
Government IT Systems
. We supply operational IT solutions to governmental agencies for border-control, anti-money laundering and intelligence applications, including intelligence knowledge management systems. This includes Wise Intelligence Technology (WiT
™
), a technology solution supporting organizational doctrine and improving the intelligence process, that addresses all phases of the intelligence process including the reception, adaption and conversion of intelligence data from multiple sources as well as processing and disseminating intelligence reports.
Tactical Battle Company Training Systems.
We supply trainers for commanders and staff from the company-level to battalion battle company and brigade-level operations.
Cyber-based C4I systems.
We supply a range of C4-based cyber solutions.
Programs
We perform a broad range of C4I battle management systems, soldier mounted systems and radio and communications programs with land-based applications. Our customers include the IDF, the U.S. Army, the USMC, the Australian Army and ground forces and governmental agencies of a wide range of NATO and EU member nations as well as those of other countries. In 2012, we received several contract awards in these areas, including a contract by the Finnish Army to supply advanced dismounted soldier systems, a contract by the Royal Australian Navy to supply battle management systems for landing craft and a contract by a Far Eastern country to supply personal radio systems.
We are performing a contract for the Department of Defence of the Commonwealth of Australia for the supply, integration, installation and support of a Battle Group and Below Command, Control and Communications (BGC3) system for the Australian Army’s Land 75/125 program.
We are the prime contractor to the IMOD for the Israel Digital Army Program (DAP). Under the DAP, we are supplying the IDF with computerized systems down to the single soldier level. The systems facilitate transmission of integrated, real-time situation pictures to and from all battlefield and command echelons. The DAP includes a significant portion being performed under U.S. FMF funding. We also are performing a contract for IMOD for the supply, upgrade and maintenance of communication equipment over a 20-year period.
Electro-Optic and Countermeasures Systems
Overview
.
We design and manufacture a full range of electro-optic-based solutions for air, land, sea and space applications, covering the complete spectrum of electro-optic-based solutions with products ranging from laser and thermal imaging systems to head-up displays, countermeasure systems, through ISR systems – including payloads for space, airborne, naval and land-based missions – to ground integrated sights, electro-optic countermeasures and homeland security solutions. We are one of the few companies in the world that has engineering capability and facilities in-house in all major areas of electro-optics. In the space area, we also maintain in-house Israel’s national space electro-optics infrastructure.
Systems Portfolio
Thermal Imaging and NVG-based Systems and Products.
We produce a range of FLIR systems for night observation for air, land and sea platforms, including stabilized payloads as well as hand-held and man-portable solutions. This includes, among others, the CORAL family of thermal imagers, the LVCR family of long-range man-portable reconnaissance systems and the Mini-Coral S uncooled thermal imager and target acquisition system. These systems are integrated into north finding solutions, such as the Atlas family of goniometers.
28
Laser-Based Systems.
We develop and supply a range of laser designators, laser range-finders and laser radars for air, land and naval platforms based on solid state flash lamp or diode pumped technologies, both in the eye-safe and non-eye safe band.
Stabilized Payloads.
We design and supply a number of payloads for air, land and sea-based observation, target acquisition, target engagement, training and fire control, using stabilized line-of-sight systems and incorporating laser range-finders or designators and thermal and HD/TV cameras, including our very long-range Advanced Multi-Sensor Payload System (AMPS) and our Compact Multi-Purpose Advanced Stabilized System (CoMPASS
™
) family. Our payloads for naval applications provide a wide portfolio of solutions from the small Micro-CoMPASS 8”, through the 15th generation D-CoMPASS payload, up to the large high end AMPS system that is used for very long-range stand-off observation.
Countermeasures Systems.
Our electro-optic-based countermeasure systems (DIRCM – Directional IR Countermeasures) include our Multi-Spectral Infrared Countermeasures System (MUSIC
®
) for installation on commercial (C-MUSIC
™
) aircraft and military helicopters and transport aircraft for detection and jamming of anti-aircraft shoulder-launched missiles. We have also developed EO SHIELD, a soft kill countermeasures solution for armored vehicles.
ISR Systems.
Our electro-optic-based ISR systems include aerial reconnaissance systems, such as the CONDOR
™
2- EO/IR LOROP – visible and IR long-range oblique photography systems. Our long-range day and night surveillance systems include LORROS
®
(Long-Range Reconnaissance and Observation System) for border protection and surveillance posts.
Space Cameras and Telescopes.
We supply advanced panchromatic and multi-spectral cameras for high resolution, remote sensing satellites for commercial and military space IMINT, supplying high resolution ground images, and for scientific research.
Hyperspectral.
We develop cutting edge hyperspectral sensors and systems for various airborne platforms, including UAS.
Infrared Sensors.
SCD develops and manufactures infrared detectors and laser diodes for electro-optical applications. Opgal develops electro-optics “engines” (camera cores) that combine detectors with proprietary electronics, as well as IR solutions for commercial and defense applications.
Programs
We perform a range of programs in the electro-optic and countermeasures systems area. Our customers include the IDF, the Israel Space Agency, the USMC, the USN, armed forces of many other governments as well as major defense contractors such as Lockheed Martin and Boeing. We supply a range of hand-held thermal imaging and binocular systems for long-range observation and reconnaissance devices to the IDF and the armed forces of the U.S., Canada, Germany, Spain and other countries. We supply AN/AVS-7 head-up display components to the U.S. armed forces and also are under contract with the USN for the repair and maintenance of various Night Targeting systems components for USMC AH-IW helicopters, as well as the upgrade of the AH-1W Night Targeting System to the NTSU configuration. We supply the USMC with the JTAC compact hand-held designator, and we were selected by the USMC to supply a Common Laser Ranger-Finder - Integrated Capability. We also supply laser designators and range-finders for air and ground applications to numerous customers such as the German Armed Forces, the USMC and Lockheed Martin. In 2012, contract awards in this area included a contract to supply advanced observation and long-range target acquisition systems to the IDF. In addition, we supply long-range FLIR systems to the IDF for day and night observation.
Our electro-optic shipboard payloads are in use by several navy and maritime forces for both coastal surveillance and observation as well as fire control applications.
In the countermeasures area we are developing C-MUSIC
™
, a laser-based countermeasure system for use on commercial passenger aircraft as well as military helicopters, transport aircraft and other commercial aircraft to protect against missiles using IR seekers. We are developing for implementation our C-MUSIC
™
commercial DIRCM (direct infrared countermeasures) system for Israeli commercial aircraft, and in 2012 we began test flights on an IAF platform. We supply a variety of high resolution cameras and telescopes for space applications. This includes cameras for the various versions of the IDF’s Ofek satellites, satellites of the Israel Space Agency and other countries’ space agencies and EROS satellites operated by ImageSat International N.V. In 2012, we were awarded a contract to supply the space camera for the Italian OPTSAT 3000 Observation Satellite.
29
Homeland Security Systems
Overview
.
We design, manufacture and integrate a wide range of comprehensive homeland security and para-government systems and products covering diverse scenarios and applications. These include integrated land, maritime and coastal control and surveillance systems, airport and seaport security systems, border control systems, “safe city” systems, large venue security systems, access and border registration control systems, pilot identification systems, transportation security systems, C4I homeland security applications, facility perimeter security products, electronic fences, electro-optic surveillance systems, tactical mini-UAS and communications systems for defense, police, airport, border patrol and coast guard applications, training and simulation solutions, energy and critical infrastructure protection and other homeland security uses.
Systems Portfolio
Border Surveillance Systems.
We supply a range of systems and products for border, surveillance, including day/night observation systems, smart fences, mini-UAS, surveillance land vehicles and C4I-based systems combining some or all of the above-mentioned systems. We also supply border control and management IT systems.
Safe City Systems
. We offer “safe city” crime and terror detection and crisis management solutions combining fully integrated C4I systems with advanced electro-optic surveillance, UAS, communication solutions and other systems to provide city-wide event detection and operations coordination, management and control to municipal security forces.
Airport Security Systems.
We supply a variety of solutions to secure airports and related aviation security facilities from undesired intrusions, supporting secure airport operations and facilitating pilot identification, while complying with the range of regulations that govern airport security.
Seaport and Coastal Surveillance Systems
. We supply comprehensive surveillance systems for monitoring maritime traffic, prevention of smuggling, illegal shipments, customs violations and illegal immigration, controlling fishing activities and coordination of search and rescue.
Perimeter Security and Intrusion Detection Systems.
We supply electronic alarm fences and virtual fences, combined with electro-optic pointing, verification and tracking to detect and deter attempts by intruders to breach secured facilities and critical infrastructures.
Transportation Security and Safety Systems.
We provide security and safety solutions for railroad authorities, including railway security systems and anti-collision alert systems for crossing junctions.
Communications Systems
. We supply MICOM HF radio communications systems for land and maritime-based security forces.
Training and Simulation Solutions.
We supply training and simulation solutions for first responders, FEMA (Federal Emergency Management Administration) activities, crime prevention and counter-terrorism.
Programs
.
We perform a range of homeland security-related programs for national, regional and municipal security authorities, including airport, border guard and coastal control authorities. Customers for our homeland security systems include the Israeli Ministry of Transportation, the IMOD, various commercial airports in Europe and Africa, border and security forces in Europe and Asia and security organizations of several other governments. We are engaged in several “smart” electronic deterrence projects for the Israeli government. We have developed and supplied the Israel Police with Israel’s Border Control Management System. We are performing programs relating to border security projects, coastal surveillance systems and integrated airport security systems for European and other governments. We provide the emergency response training system for the IDF’s Homeland Security Command. We also provide a system level security solution to the Israeli Railroad Authority for protecting many of its nationally deployed sites. We are also supplying a perimeter security system, with advanced command and control, for protection of the Port of Haifa in Israel.
30
EW and SIGINT Systems
Overview
.
We supply a range of multi-spectral self-protection suites and systems for airborne, ground and naval platforms including advanced EW and electronic countermeasures (ECM) systems, communications jammer solutions, missile warning systems, laser warning systems and radar warning receivers. We also furnish SIGINT systems, including ELINT, COMINT and direction finding (DF) systems, designed for air, ground and naval platforms and applications.
Systems Portfolio
EW Suites including ECMs
. Our EW suites provide advanced self protection integrated capabilities for various types of combat aircraft, naval and ground platforms, combining defense aid suites (DAS) with ESM in a single unit, that cover multi-spectral bands and include radar warning receivers (RWR), passive IR missile warning systems, laser warning receivers, ECM systems and other measures. As part of our IR missile warning systems we supply additional operational capabilities such as our Situation Awareness Panoramic IR (SAPIR) system with collision avoidance for increased mission safety. We also supply a range of systems for self protection and electronic attack for airborne, naval and ground platforms including the SPJ (Self Protection Jammer) and the COMJAM (Communication Jammer) as well as electronic support measurements for threat identification and electro-magnetic analysis for surface ships and submarines.
SIGINT Systems
. We develop and supply full electromagnetic spectrum SIGINT (ELINT and COMINT) systems for tactical and strategic intelligence gathering for airborne, ground and naval applications. Our SIGINT systems incorporate advanced receiving, signal processing and DF technologies, including different times of arrival (DTOA) and interferometer technologies.
Counter Improvised Explosive Devices (CIED)
. We develop and supply a range of electronic jammer anti-bomb products, including cellular selective jammer and protection systems against IEDs, such as the Electronic Jamming Anti-Bomb (EJAB) family of products.
Data Links and Video Dissemination Systems
. We develop and supply smart data link solutions for unmanned platforms, guided weapons and satellites and video dissemination for airborne (including UAS), ground and naval applications.
Search and Rescue Systems
. We develop and supply advanced solutions for pilots and rescue teams for the combat arena as well as personal search and rescue systems for non-combat situations.
Anti-Tactical Ballistic Missile Defense Systems
. We are the developer of the command and control system for the Arrow missile program. We also are the developer of the core of the Israel Test Bed (ITB), a real-time simulator for tactical ballistic missile defense systems.
Radars.
We provide radar solutions for various applications.
Programs
. We supply a range of EW, SIGNIT, data links and search and rescue systems to defense forces around the world for airborne, ground and sea-based applications. Customers for these systems include the IDF, the armed forces of several other governments as well as major defense contractors. This includes supplying our airborne platform self-protection suites to the IAF and several other air forces around the world. It also includes the supply of data links for airborne platforms including UAS and the supply of airborne search and rescue systems to various customers. In 2012, our contract awards in this area included contracts to supply EW systems for IAF F-15 and F-16 aircraft and EW systems for Israeli Navy missile vessels.
Various Commercial Activities
We are engaged in applications of our defense technologies to commercial applications as well as other commercial activities. Our current commercial activities, in addition to the activities described under “Commercial Aviation Systems and Aerostructures” and elsewhere above, include medical equipment, commercial communications and mobile and wireless telephone network encryptions, SATCOM equipment, microwave technologies and components and spectrum monitoring and control systems, commercial automotive night vision enhancement equipment, super capacitor energy sources, smart grids for railroad transportation, manufacture of lasers for the cinematography industry and general manufacturing and machinery services.
31
We own an approximately 89% interest in Brightway Vision Ltd., an Israeli company involved in developing night vision enhancement equipment for commercial automotive applications. We also own a minority interest in certain companies that are engaged in activities primarily for the commercial market. This includes an approximately 22% interest in DIR Technologies (Detection IR) Ltd., an Israeli company, spun off from SCD, that is engaged in identification through thermal imaging technologies of counterfeit pharmaceuticals. We also own an approximately 14% equity interest in ImageSat International N.V., a company incorporated in Netherlands Antilles, involved in the operation of satellites for commercial and other applications and providing satellite imagery. (Also see Item 8. Financial Information – Legal Proceedings – ImageSat.) We own an approximately 15% interest in Capital Nature Ltd., an Israeli company involved in investments in renewable energy ventures. In addition, our wholly-owned subsidiary Incubit Technology Ventures Ltd. recently began operations in investing in start-up ventures engaged in a range of high-tech commercial activities in Israel.
During 2012 and the beginning of 2013, we sold certain ownership interests and assets relating to some non-core commercial activities. See above “Recent Acquisitions, Mergers and Divestitures – Divestitures.”
Property, Plant and Equipment
Facilities Owned or Leased by the Company
|
Israel
(1)
|
U.S.
(2)
|
Other Countries
(3)
|
||||
|
Owned
|
2,158,000 square feet
|
710,000 square feet
|
891,000 square feet
|
|||
|
Leased
|
1,896,000 square feet
|
631,000 square feet
|
303,000 square feet
|
|
(1)
|
Includes offices, development and engineering facilities, manufacturing facilities, maintenance facilities, hangar facilities and a landing strip in various locations in Israel used by Elbit Systems and our various majority-owned Israeli subsidiaries.
|
|
(2)
|
Includes offices, development and engineering facilities, manufacturing facilities and maintenance facilities of Elbit Systems of America primarily in Texas, New Hampshire, Florida, Alabama and Virginia. Elbit Systems of America’s facilities in Texas, New Hampshire and Alabama are located on a total of approximately 153 acres of land owned by Elbit Systems of America. This does not include properties not held by Elbit Systems of America, including approximately 6,000 square feet leased by our wholly-owned subsidiary Elmec Inc. in Massachusetts.
|
|
(3)
|
Includes offices, design and engineering facilities and manufacturing facilities in Europe, Latin America, Australia and Asia.
|
Recent Investment in Facilities
.
Over the last two years the average annual net investment in our facilities, including building projects, equipment, machinery and vehicles, amounted to approximately $102 million. Each of our manufacturing facilities generally operates at or near full capacity. Accordingly, we believe that our current facilities are adequate for our operations as now conducted.
Governmental Regulation
Government Contracting Regulations.
We operate under laws, regulations and administrative rules governing defense contracts, mainly in Israel and the United States. Some of these carry major penalty provisions for non-compliance, including disqualification from participating in future contracts. In addition, our participation in governmental procurement processes in Israel, the United States and other countries is subject to specific regulations governing the conduct of the process of procuring defense contracts.
Israeli Export Regulations.
Israel’s defense export policy regulates the sale of a number of our systems and products. Current Israeli policy encourages exports to approved customers of defense systems and products such as ours, as long as the export is consistent with Israeli government policy. A license is required to initiate marketing activities. We also must receive a specific export license for defense related hardware, software and technology eventually exported from Israel. Israeli law also regulates export of “dual use” items (items that are typically sold in the commercial market but that also may be used in the defense market). In 2012, more than 50% of our revenue was derived from exports subject to Israeli export regulations.
32
U.S. and Other Export Regulations.
Elbit Systems of America’s export of defense products, military technical data and technical services to Israel and other countries is subject to applicable approvals of the U.S. government. Such approvals are typically in the form of an export license or a technical assistance agreement (TAA). Other U.S. companies wishing to export defense products or military related services and technology to our Israeli and other non-U.S. entities are also required to obtain such export licenses and TAAs. This applies to data required by our non-U.S. entities to perform work for U.S. programs. Licenses are also required for Israeli nationals assigned to work in defense-related technical areas at our U.S. affiliated companies. An application for an export license or a TAA requires disclosure of the intended sales of the product and the use of the technology. The U.S. government may deny an export authorization if it determines that a transaction is counter to U.S. policy or national security. Other governments’ export regulations also affect our business from time to time, particularly with respect to end user restrictions of our suppliers’ governments.
Approval of Israeli Defense Acquisitions
The Israeli Defense Entities Law (Protection of Defense Interests) establishes conditions for the approval of an acquisition or transfer of control of an entity that is determined to be an Israeli “defense entity” under the terms of the law. Designation as a “defense entity” is to occur through an order to be issued jointly by the Israeli Prime Minister, Defense Minister and Trade, Industry and Labor Minister. Although no such orders have been issued as of the date of this annual report on Form 20-F, it is assumed that Elbit Systems and most of our Israeli subsidiaries will be designated as “defense entities” under the law and that the Israeli Government will issue such an order regarding our applicable Israeli companies. Under separate regulations, Elbit Systems and our major Israeli subsidiaries have been designated as “defense entities” by the Defense Minister with respect to Israeli law governing various aspects of defense security arrangements.
Orders to be issued under the Israeli Defense Entities Law will also establish other conditions and restrictions. It is anticipated that in the case of a publicly traded company such as Elbit Systems, Israeli government approval will be required for acquisition of 25% or more of the voting securities or a smaller percentage of shares that grant “means of control.” Means of control for purposes of the law include the right to control the vote at a shareholders’ meeting or to appoint a director. Orders relating to defense entities are also anticipated to, among other matters: (1) impose restrictions on the ability of non-Israeli resident citizens to hold “means of control” or to be able to “substantially influence” defense entities; (2) require that senior officers of defense entities have appropriate Israeli security clearances; (3) require that a defense entity’s headquarters be in Israel; and (4) subject a defense entity’s international joint ventures and various technology transfers to the approval of the IMOD.
Approval of U.S. and Other Defense Acquisitions
.
Many other countries also require governmental approval of acquisitions of local defense companies or assets by foreign entities. Mergers and acquisitions of defense related businesses in the U.S. are subject to the Foreign Investment and National Security Act (FINSA). Under FINSA, our acquisitions of defense related businesses in the U.S. require review, and in some cases approval, by the Committee on Foreign Investment in the United States (CFIUS).
“Buy American” Laws.
The U.S. “Buy American” laws impose price differentials or prohibitions on procurement of products purchased under U.S. government programs. The price differentials or prohibitions apply to products that are not made in the United States or that do not contain U.S. components making up at least 50% of the total cost of all components in the product. However, a Memorandum of Agreement between the United States and Israeli governments waives the Buy American laws for specified products, including almost all the products currently sold in the United States by Elbit Systems and our Israeli subsidiaries.
Foreign Military Financing (FMF).
Elbit Systems of America participates in United States FMF programs. These programs require countries, including Israel, receiving military aid from the United States to use the funds to purchase products containing mainly U.S. origin components. In most cases, subcontracting under FMF contracts to non-U.S. entities is not permitted. As a consequence, Elbit Systems of America generally either performs FMF contracts itself or subcontracts with U.S. suppliers. The U.S. government may authorize the IMOD to utilize a portion of the FMF budget under the United States Subcontracting Procurement (USSP) channel. In such cases, companies such as Elbit Systems or our Israeli subsidiaries, who are acting as the Israeli prime contractor to the IMOD under the NIS funded portion of an IMOD program, are authorized to negotiate and enter into a subcontract directly with a U.S. supplier. However, payment of the funds under a USSP channel subcontract is administered by the IMOD Purchasing Mission to the U.S. Elbit Systems of America also participates in U.S. Foreign Military Sales (FMS) programs.
33
Procurement Regulations.
Solicitations for procurements by governmental purchasing agencies in Israel, the United States and other countries are governed by laws, regulations and procedures relating to procurement integrity, including avoiding conflicts of interest and corruption in the procurement process.
Anti-Bribery Regulations.
Laws such as the Israel Penal Code, the Organization for Economic Cooperation and Development (OECD) Convention on Combating Bribery of Foreign Public Officials in International Business Transactions, the U.S. Foreign Corrupt Practices Act, the U.K. Bribery Act and corresponding legislation in other countries, prohibit providing personal benefits or bribes to government officials in connection with the governmental procurement process. Israeli defense exporters, such as Elbit Systems, are required to maintain an anti-bribery compliance program, including specific procedures, record keeping and training.
Audit Regulations.
The IMOD audits our books and records relating to its contracts with us. Our books and records and other aspects of projects related to U.S. defense contracts are subject to audit by the U.S. Defense Contract Audit Agency. Such audits review compliance with government contracting cost accounting and other applicable standards. If discrepancies are found this could result in a downward adjustment of the applicable contract’s price. Some other customers have similar rights under specific contract provisions.
Antitrust Laws.
Antitrust laws and regulations in Israel, the United States and other countries often require governmental approvals for transactions that are considered to limit competition. Such transactions may include cooperative agreements for specific programs or areas, as well as mergers and acquisitions.
Civil Aviation Regulations
.
Several of the products sold by Company entities for commercial aviation applications are subject to flight safety and airworthiness standards of the U.S. Federal Aviation Administration (FAA) and similar civil aviation authorities in Israel, Europe and other countries.
Federal Drug Administration Regulations.
Medical products designed and manufactured by Elbit Systems of America’s Medical Instruments – KMC Systems business unit are subject to U.S. Federal Drug Administration (FDA) regulations.
Buy-Back
As part of their standard contractual requirements for defense programs, several of our customers include “buy-back” or “offset” provisions. These provisions are typically obligations to make, or to facilitate third parties to make, various specified transactions in the customer’s country, such as procurement of defense and commercial related products, investment in the local economy and transfer of know-how. (For a description of these provisions, see Item 5. Operating and Financial Review and Prospects – Off-Balance Sheet Transactions.)
Financing Terms
Types of Financing
.
There are several types of financing terms applicable to our defense contracts. In some cases, we receive progress payments according to a percentage of the cost incurred in performing the contract. Sometimes we receive advances from the customer at the beginning, or during the course, of the project, and sometimes we also receive milestone payments for achievement of specific milestones. In some programs we extend credit to the customer, sometimes based on receipt of guarantees or other security. In other situations work is performed before receipt of the payment, which means that we finance all or part of the project’s costs for various periods of time. Financing arrangements may extend beyond the term of the contract’s performance. When we believe it is necessary, we seek to protect all or part of our financial exposure by letters of credit, insurance or other measures, although in some cases such measures may not be available.
Advance Payment Guarantees
.
In some cases where we receive advances prior to incurring contract costs or making deliveries, the customer may require guarantees against advances paid. These guarantees are issued either by financial institutions or by us. We have received substantial advances from customers under some of our contracts. In certain circumstances, such as if a contract is canceled for default and there has been an advance or progress payment, we may be required to return payments to the customer as provided in the specific guarantee. As part of the guarantees we provide to receive progress payments or advance payments, some of our customers require us to transfer to them title in inventory acquired with such payments. (See Item 5. Operating and Financial Review and Prospects – General – Long-Term Arrangements and Commitments – Bank Guarantees.)
34
Performance Guarantees.
A number of projects require us to provide performance guarantees in an amount equal to a percentage of the contract price. In certain cases we also provide guarantees related to the performance of buy-back obligations. Some of our contracts contain clauses that impose penalties or reduce the amount payable to us if there is a delay or failure in performing in accordance with the contract or the completion of a phase of work, including in some cases during the warranty period. These types of guarantees may remain in effect for a period of time after completion of deliveries under the contract. Such guarantees are customary in defense transactions, and we provide them in the normal course of our business. (See Item 5. Operating and Financial Review and Prospects – General – Long-Term Arrangements and Commitments – Bank Guarantees.)
Private Finance Initiatives (PFI).
Some of our projects operate under PFI financing arrangements where we provide long-term financing arrangements or facilities, with the repayment generally made based on the project’s cash flow. PFI projects can be structured in several ways. PFI projects may require us to pledge equity and enter into relatively complex financial and other agreements. Such financing may be raised either through banks or institutional lenders and carries various financial risks and exposures. In addition, PFI projects may require us to draw upon our equity base and borrowing capacities. In recent years we were involved in several PFI-type projects in Israel, and we expect to participate in future PFI contracts both in Israel and other countries.
Financial Risks Relating to Our Projects.
The nature of our projects and contracts creates some potential financial risks, including risks relating to dependence on governmental budgets, fixed-price contracts for development effort and production, schedule extensions beyond our control, termination for the customer’s convenience, potential for monetary penalties for late deliveries or failure to perform in accordance with the contract requirements and liability for subcontractors. In addition, we receive payments for some of our projects in currencies other than U.S. dollars. In such cases, we sometimes elect to adopt measures to reduce the risk of exchange rate fluctuations. (See Item 3. Key Information – Risk Factors – General Risks Related to Our Business and Market.)
Intellectual Property
Patents, Trademarks and Trade Secrets.
We own hundreds of living patent families including patents and applications registered or filed in Israel, the United States, the European Patent Office and other countries. We also hold dozens of living trademark families relating to specific products. A significant part of our intellectual property assets relates to unique applications of advanced software-based technologies, development processes and production technologies. These applications are often not easily patentable, but are considered as our trade secrets and proprietary information. We take a number of measures to safeguard our intellectual property against infringement as well as to avoid infringement of other parties’ intellectual property. (For risks related to our intellectual property see Item 3. Key Information – Risk Factors – General Risks Related to Our Business and Market.)
Governmental Customers’ Rights in Data.
The IMOD usually retains specific rights to technologies and inventions resulting from our performance under Israeli government contracts. This generally includes the right to disclose the information to third parties, including other defense contractors that may be our competitors. Consistent with common practice in the defense industry, approximately 35% of our revenues in 2012 was dependent on products incorporating technology that a government customer may disclose to third parties. When the Israeli government funds research and development, it usually acquires rights to data and inventions. We often may retain a non-exclusive license for such inventions. The Israeli government usually is entitled to receive royalties on export sales in relation to sales resulting from government financed development. However, if only the end product is purchased, we normally retain the principal rights to the technology. Sales of our products to the U.S. government and some other customers are subject to similar conditions. Subject to applicable law, regulations and contract requirements, we attempt to maintain our intellectual property rights and provide customers with the right to use the technology only for the specific project under contract.
Licensing.
There are relatively few cases where we manufacture under license. Such licenses typically apply to the use of technologies that are the result of collaboration with academic institutions or where we are manufacturing another company’s product in accordance with that company’s specifications. In such cases, the licensor typically is entitled to royalties or other types of compensation. In some cases where we have acquired business lines we obtain a royalty free license to use the applicable technology for specified applications. Occasionally, we license parts of our intellectual property to customers as part of the requirements of a particular contract. We also sometimes license technology to other companies for specific purposes or markets, such as the right to use certain of our intellectual property relating to our training and simulation systems.
35
Research and Development
We invest in research and development (R&D) according to a long-term plan based on estimated market needs. Our R&D efforts focus on anticipating operational needs of our customers, achieving reduced time to market and increasing affordability. We emphasize improving existing systems and products and developing new ones using emerging or existing technologies.
We perform R&D projects to produce new systems for the IMOD and other customers. These projects give us the opportunity to develop and test emerging technologies. We developed new tools for fast prototyping for both the design and development process. This permits the operational team members to effectively specify requirements and to automatically transfer them into software code. Examples of our ongoing defense-related R&D projects include those for night operation capabilities, laser systems, display systems, helmet mounted systems, other avionics systems, aerial, land and sea-based unmanned vehicles and robotics, space based cameras, ISR systems, C4I systems, electric tank and turret drive systems, unmanned turret systems, communication systems and homeland security systems. Examples of our R&D in commercial areas include projects relating to commercial aviation and commercial night vision products for automobiles. We employ thousands of software, hardware and systems engineers engaged in advance programs for airborne, ground and naval defense, homeland security and space applications. In addition, most of our program and business line managers have engineering backgrounds. More than 50% of our total workforce is engaged in research, development and engineering.
Our customers, the Office of the Israeli Chief Scientist (OCS) and other R&D granting authorities sometimes participate in our R&D funding. We also invest in our research and development activities. This investment is in accordance with our strategy and plan of operations. The table below shows amounts we invested in R&D activities for the years ended December 31, 2010, 2011 and 2012:
|
2010
|
2011
|
2012
|
||||||||||
|
(U.S. dollars in millions
)
|
||||||||||||
|
Total Investment
|
$ | 268.6 | $ | 288.7 | $ | 276.5 | ||||||
|
Less Participation*
|
34.5 | 47.6 | 43.1 | |||||||||
|
Net Investment
|
$ | 234.1 | $ | 241.1 | $ | 233.4 | ||||||
(Also see Item 5. Operating and Financial Review and Prospects – Summary of Operating Results – 2012 Compared to 2011 – Research and Development.)
|
*
|
See above – “Government Rights in Data” and see below – “Conditions in Israel – Chief Scientist (OCS) and Investment Center Funding.”
|
Manufacturing
We manufacture and assemble our systems and products at our operational facilities in Israel, the U.S., Europe, Brazil and at certain of our subsidiaries in other countries. These facilities contain warehouses, electronic manufacturing areas, mechanical workshops, final assembly and test stations with test equipment. We also have supporting infrastructure including fully automated surface mount technology lines and clean rooms for electro-optic components, solid state components integration, environmental testing and final testing, including space simulation and thermal chambers. We also have computerized logistics systems for managing manufacturing and material supply. A number of our manufacturing activities are provided on a shared services basis by various of our in-house centers of excellence.
We also manufacture and assemble composite materials, metal parts and machinery. One of our Israeli subsidiaries has a high technology semiconductor manufacturing facility where it performs electronic integration and assembly of thermal imaging detectors and laser diodes. We also manufacture and repair test equipment.
We manufacture commercial avionics and aircraft components, as well as perform maintenance, repair and overhaul at our U.S. FAA registered facilities in the U.S., Europe and Israel. We also manufacture medical equipment at U.S. FDA registered facilities in the U.S.
36
Environmental Compliance
As part of overall Company policy, we are committed to environmental, health and safety standards in all aspects of our operations. This includes all regulatory requirements as well as ISO 14001 compliance. We also conduct a number of measures on an ongoing basis to promote environmentally friendly operational practices, including measures to reduce electrical, fuel and water consumption. There are no material environmental issues that affect the Company’s use of our facilities.
Seasonality
Although revenues may sometimes increase towards the end of a fiscal year, no material portion of the Company’s business is considered to be seasonal. The timing of revenue recognition is based on several factors. (See Item 5. Operating and Financial Review and Prospects – General – Critical Accounting Policies and Estimates – Revenue Recognition.)
Purchasing and Raw Materials
We conduct purchasing activities at most of our operational facilities. A number of purchasing and related support and logistic services are performed on a shared services basis by central service providers in the Company for various Company units and entities. We generally are not dependent on single sources of supply. We manage our inventory according to project requirements. In some projects, specific major subcontractors are designated by the customer. Raw materials used by us are generally available from a range of suppliers internationally, and the prices of such materials are generally not subject to significant volatility. We monitor the on-time delivery and the quality of our contractors and encourage them to continuously improve their performance.
Customer Satisfaction and Quality Assurance
We invest in continuous improvement of processes, with emphasis on prevention of deficiencies, to ensure customer satisfaction throughout all stages of our operations. This includes development, design, integration, manufacturing and services for software and hardware, for the range of our systems and products. Our quality teams are involved in assuring compliance with processes and administrating quality plans. These activities begin at the pre-contract stage and continue through the customer’s acceptance of the product or services.
We use a project management method under the guidelines of Theory of Constraints (TOC) in many of our development projects. Using advanced software, work plans are continuously updated and are available to all integrated product team members. This method makes management more efficient and improves our ability to meet schedule demands of complex projects. Another TOC methodology is used to manage our manufacturing lines at various facilities in Israel. We also use methods such as Kaizen and Lean. Our processes are based on a cutting edge tool case and CAD-CAM tools. This infrastructure, together with well defined development methodology and management tools, assists us in providing high quality and on-time implementation of projects.
All Israeli operational sites are certified for one or more of the following: ISO-9001, ISO-90003 for software, AS9100 (for which we are certified for revision C), AS9006 for software ISO-14001, OSHAS 18001 and European Aviation Safety Agency (EASA) part 145 for maintaining civil products and part 21 G for production of civil products. We also comply with Capability Maturity Model Integration (CMMI) Level 3 of the U.S. Software Engineering Institute (SEI) and NATO AQAP. Representatives of our customers generally test our products before acceptance. Branches of the IDF and other customers have authorized us to conduct acceptance testing of our products on their behalf.
Quality certifications applicable to defense products of Elbit Systems of America’s operating units include certifications for CMMI Level 3 of the SEI, ISO-9001, AS9100 and compliance with NATO AQAP requirements. In the area of commercial aviation Elbit Systems of America’s operating units hold EASA certification as well as a variety of FAA certifications including FAA Part 21 approval and FAA Part 145 approved repair stations. In the medical equipment area, Elbit Systems of America is certified for ISO 13485:2003, is registered with the FDA as a GMP manufacturer and is FDA compliant with Quality Systems Regulations 21 CFR Parts 820, 803 and 806.
37
Service and Warranty
We instruct our customers on the proper maintenance of our systems and products. In addition, we often offer training and provide equipment to assist our customers in performing their own maintenance. When required, support may be provided by a local support team or by experts sent from our facilities. We also provide performance based logistics services.
We generally offer a one or two-year warranty for our systems and products following delivery to, or installation by, the customer. In some cases we offer longer warranty periods. We accrue for warranty obligations specifically determined for each project based on our experience and engineering estimates. These accruals are intended to cover post-delivery functionality and operating issues for which we are responsible under the applicable contract.
Marketing and Sales
We actively take the initiative in identifying the individual defense needs of our customers throughout the world. We then focus our research and development activities on systems designed to provide tailored solutions to those needs. We often provide demonstrations of prototypes and existing systems to potential customers.
We market our systems and products either as a prime contractor or as a subcontractor to various governments and defense contractors worldwide. In Israel, we sell our military systems and products mainly to the IMOD, which procures all equipment for the IDF. A number of marketing related support services are provided on a central shared services basis to various units in the Company. We are assisted in marketing our systems, products and services in other parts of the world through subsidiaries, joint ventures and representatives.
In the U.S., Elbit Systems of America leads our sales and marketing activities, from its facilities throughout the U.S. Elbit Systems of America operates under a Special Security Agreement that allows it and its subsidiaries to work on certain classified U.S. government programs. See above “Principal Subsidiaries – Elbit Systems of America.” Our subsidiaries in other countries typically lead the marketing activities in their home countries, often assisted by marketing and business development personnel based in Israel.
Over the past several years, a number of the major entities in the Company have entered into cooperation agreements with major defense contractors in Israel, the United States, Europe, Brazil and certain other key markets. These agreements provide for joint participation in marketing and performance of a range of projects. In other countries, we actively pursue business opportunities as either a prime contractor or a subcontractor, usually together with local companies. Often we enter into cooperation agreements with other companies for such opportunities.
Competition
We operate in a competitive environment for most of our projects, systems and products. Competition is based on product and program performance, price, reputation, reliability, life cycle costs and responsiveness to customer requirements. This includes the ability to respond to rapid changes in technology. In addition, our competitive position sometimes is affected by specific requirements in particular markets.
In recent years consolidation in the defense industry has affected competition. This has decreased the number but increased the relative size and resources of our competitors. We adapt to market conditions by adjusting our business strategy to changing defense market conditions. We also anticipate continued competition in defense markets due to declining defense budgets in many countries.
Competitors in the sale of some of our products to the government of Israel include IAI and Rafael among others. From time to time we also cooperate with some of our competitors on specific projects. Outside of Israel, we compete in a number of areas with major international defense contractors principally from the United States, Europe and Israel. Our main competitors include divisions and subsidiaries of Northrop Grumman Corporation, BAE Systems, Rockwell Collins, L-3 Communications Corporation, Thales S.A., EADS, Finmeccanica S.p.A., Harris Corporation, AAI Corporation, FLIR Systems, Inc., Rhode and Schwartz GmbH, Rheinmetall AG, Kongsberg Defense and Aerospace A.S. and Safran Group – Sagem Defense Securite S.A. Many of these competitors have greater financial, marketing and other resources than ours. We also compete in the worldwide defense market with numerous smaller companies. In addition, we compete with a range of companies in the commercial avionics market. In certain cases we also engage in strategic cooperative activities with some of our competitors.
38
Overall, we believe we are able to compete on the basis of our systems development and technological expertise, our systems’ combat-proven performance and our policy of offering customers overall solutions to technological, operational and financial needs.
Major Customers
Sometimes, our revenues from an individual customer account for more than 10% of our revenues in a specific year. Our only such customer during the last three years was the IMOD, which accounted for 23% in 2010, 23% in 2011 and 15% in 2012.
Ethics
We conduct our business activities and develop Company policies based on a firm commitment to ethical practices. In addition to our Code of Conduct (see Item 16.B) and compliance with applicable laws and regulations, we have an active Company-wide ethics compliance program, incorporating policies and procedures, including for anti-bribery compliance. Our compliance program also includes ongoing training and enforcement. We also expect our supply chain to follow ethical practices. We are active in a number of international organizations relating to ethics and compliance.
Social Responsibility and Sustainability
We place importance on social responsibility to the communities in which we live and work. This is consistent with our policy of emphasizing ethics in our business practices. Our policy encourages the voluntary efforts of our Company entities and employees who donate their time and efforts in the support of members of our communities who are in need. In this regard, we place priority on initiatives to promote educational advancement, particularly in the technology sectors. A major activity resulting from our social responsibility policy is facilitating the placement of our employees as tutors in peripheral communities and less developed neighborhoods, providing technology-related knowledge as well as other educational resources generally lacking in those areas. We also promote numerous other community support activities, including involvement on a national level basis in major charitable organizations in Israel and the U.S. We place emphasis on best practices in corporate governance, ethical conduct and fair employment practices. We also pursue continuous improvement of our operations from an environmental perspective. Our commitment to social responsibility and sustainability initiatives has been reflected in our ongoing ranking among the top Israeli companies in the “Maala” social responsibility index. We periodically publish a Sustainability Report detailing our activities in the areas of corporate responsibility, ethics, environmental initiatives and community-related activities.
Conditions in Israel
Political, Military and Economic Risks.
Our operations in Israel are subject to several potential political, military and economic risks. (See Item 3. Key Information – Risk Factors – Risks Related to Our Israeli Operations.)
Trade Agreements
Israel is a member of the United Nations, the International Monetary Fund, the International Bank for Reconstruction and Development and the International Finance Corporation. Israel also is a party to the General Agreement on Tariffs and Trade, which provides for reciprocal lowering of trade barriers among its members. In addition, Israel has been granted preferences under the Generalized System of Preferences from several countries. These preferences allow Israel to export products covered by such programs either duty-free or at reduced tariffs.
Israel and the European Community are parties to a Free Trade Agreement that provides some advantages for Israeli exports to most European countries and requires Israel to lower its tariffs on imports from these countries over a number of years. Israel and the United States entered into an agreement to establish a Free Trade Area that eliminates tariff and some non-tariff barriers on most trade between the two countries. An agreement between Israel and the European Free Trade Association (EFTA), established a free-trade zone between Israel and the EFTA member nations.
39
Chief Scientist (OCS) and Investment Center Funding
The government of Israel, through the OCS and the Israel Investment Center (the Investment Center), encourages research and development projects oriented towards export products and participates in the funding of such projects as well as company investments in manufacturing infrastructures.
Our Israeli companies receiving OCS funding for development of products usually pay the Israeli government a royalty at various rates and are subject to a number of conditions. (See Item 5. Operating and Financial Review and Prospects – Long-Term Arrangements and Commitments – Government Funding of Development.) Separate Israeli government consent is required to transfer to third parties technologies developed through projects in which the government participates in the funding of the development effort.
The Investment Center promotes Israeli export products and increased industrialization of peripheral areas through investment in industrial infrastructure. The Investment Center either provides grants for qualified projects or provides tax benefits for qualified industrial investments by Israeli companies.
Israeli Labor Laws.
Our employees in Israel are subject to Israeli labor laws. Some employees are also affected by some provisions of collective bargaining agreements between the Histadrut – General Federation of Labor in Israel and the Coordination Bureau of Economic Organizations, which includes the Industrialists’ Association. These labor laws and collective bargaining provisions mainly concern the length of the work day, minimum daily wages for professional workers, insurance for work-related accidents, procedures for dismissing certain employees, determination of severance pay, employment of “manpower” employees and other conditions of employment.
Severance Pay
.
Under Israeli law, our Israeli companies are required to make severance payments to terminated Israeli employees, other than in some cases of termination for cause. The severance reserve is calculated based on the employee’s last salary and period of employment. A portion of the severance pay and pension obligation is covered by payment of premiums to insurance companies under approved plans and to pension funds. The deposits presented in the balance sheet include profits accumulated to the balance sheet date. The amounts deposited may be withdrawn only after fulfillment of the obligations under the Israeli laws relating to severance pay. However, Elbit Systems and our Israeli subsidiaries have entered into agreements with some of our employees implementing Section 14 of the Severance Payment Law, which agreements relate to the treatment of severance pay. (See Item 18. Financial Statements – Note 2(R).)
National Insurance Institute.
Israeli employees and employers are required to pay predetermined sums to the National Insurance Institute, which is similar to the U.S. Social Security Administration. These amounts also include payments for national health insurance. As of December 31, 2012, the payments to the National Insurance Institute were equal to approximately 17.9% of wages, subject to a cap if an employee’s monthly wages exceed a specified amount. The employee contributes approximately 67%, and the employer contributes approximately 33%.
Enforcement of Judgments
Israeli courts may enforce U.S. and other foreign jurisdiction final executory judgments for liquidated amounts in civil matters, obtained after due process before a court of competent jurisdiction. This enforcement is made according to the private international law rules currently applicable in Israel, which recognize and enforce similar Israeli judgments, provided that:
|
|
•
|
adequate service of process has been made and the defendant has had a reasonable opportunity to be heard;
|
|
|
•
|
the judgment and its enforcement are not contrary to the law, public policy, security or sovereignty of the State of Israel;
|
|
|
•
|
the judgment was not obtained by fraud and does not conflict with any other valid judgment in the same matter between the same parties;
|
|
|
•
|
an action between the same parties in the same matter is not pending in any Israeli court at the time the lawsuit is instituted in the foreign court; and
|
|
|
•
|
the judgment is no longer subject to a right of appeal.
|
Foreign judgments enforced by Israeli courts generally will be payable in Israeli currency. The usual practice in Israel in an action to recover an amount in a non-Israeli currency is for the Israeli court to provide for payment of the equivalent amount in Israeli currency at the exchange rate in effect on the judgment date. Under existing Israeli law, a foreign judgment payable in foreign currency may be paid in Israeli currency at the foreign currency’s exchange rate on the payment date or in foreign currency. Until collection, an Israeli court judgment stated in Israeli currency will ordinarily be linked to the Israeli Consumer Price Index (CPI) plus interest at the annual rate (set by Israeli regulations) in effect at that time. Judgment creditors must bear the risk of unfavorable exchange rates.
None.
40
The following discussion and analysis should be read together with our audited consolidated financial statements and notes appearing in Item 18 below.
General
Critical Accounting Policies and Estimates
Our significant accounting policies are described in Item 18. Financial Statements – Note 2.
Our results of operations and financial condition are based on our consolidated financial statements, which are presented in conformity with United States generally accepted accounting principles (U.S. GAAP). The preparation of the consolidated financial statements requires management to select accounting policies as well as estimates and assumptions and to make judgments that involve the accounting policies described below that affect the amounts reported in the consolidated financial statements. Significant changes in assumptions and/or conditions and changes in our critical accounting policies could materially impact our operating results and financial condition.
We believe our most critical accounting policies relate to:
|
|
•
|
Revenue Recognition.
|
|
|
•
|
Business Combinations.
|
|
|
•
|
Impairment of Long-Lived Assets and Goodwill.
|
|
|
•
|
Other-Than-Temporary Decline in Value of Investments in Investee.
|
|
|
•
|
Useful Lives of Long-Lived Assets.
|
|
|
•
|
Taxes on Income.
|
|
|
•
|
Stock-Based Compensation Expense.
|
Revenue Recognition
We generate revenues principally from fixed-price long-term contracts involving the design, development, manufacture and integration of defense electronic systems and products. In addition, to a minor extent, we provide support and services for such systems and products.
Revenues from long-term contracts are recognized primarily using the Financial Accounting Standards Board (FASB), Accounting Standards Codification (ASC) ASC 605-35 “Construction-Type and Production-Type Contracts” (ASC 605-35) according to which we recognize revenues on the percentage-of-completion basis.
The percentage-of-completion method of accounting requires management to estimate the cost and gross profit margin for each individual contract. Estimated gross profit or loss from long-term contracts may change due to changes in estimates resulting from differences between actual performance and original estimated forecasts. Such changes in estimated gross profit are recorded in results of operations when they are reasonably determinable by management, on a cumulative catch-up basis. Anticipated losses on contracts are charged to earnings when determined to be probable.
We believe that the use of the percentage of completion method is appropriate as we have the ability to make reasonably dependable estimates of the extent of progress towards completion, contract revenues and contract costs. In addition, contracts executed include provisions that clearly specify the enforceable rights regarding products and services to be provided and received by the parties to the contracts, the consideration to be exchanged and the manner and terms of settlement. In all cases, revenue is recognized when we expect to perform our contractual obligations, and our customers are expected to satisfy their obligations under the contract.
41
Management periodically reviews the estimates of progress towards completion and project costs. These estimates are determined based on engineering estimates and past experience, by personnel having the appropriate authority and expertise to make reasonable estimates of the related costs. Such engineering estimates are reviewed periodically for each specific contract by professional personnel from various disciplines within the organization. These estimates take into consideration the probability of achievement of certain milestones, as well as other factors that might impact the contract’s completion.
A number of internal and external factors affect our cost estimates, including labor rates, estimated future prices of materials, revised estimates of uncompleted work, efficiency variances, linkage to indices and exchange rates, customer specifications and testing requirement changes. If any of the above factors were to change, or if different assumptions were used in estimating project cost and measuring progress towards completion, it is likely that materially different amounts would be reported in our consolidated financial statements.
In certain circumstances, sales under short-term fixed-price production type contracts or sale of products are accounted for in accordance with the Securities and Exchange Commission’s Staff Accounting Bulletin (SAB) No. 104, “Revenue Recognition in Financial Statements” (SAB 104), and recognized when all the following criteria are met: persuasive evidence of an arrangement exists, delivery has occurred, the seller’s price to the buyer is fixed or determinable, no further obligation exists and collectability is reasonably assured.
In cases where the contract involves the delivery of products and performance of services, or other obligations, we follow the guidelines specified in ASC 605-25. “Multiple-Element Arrangements”, in order to allocate the contract consideration between the identified different elements
using the relative selling price method to allocate the entire arrangement consideration. The selling price of each element would be allocated by using a hierarchy of: (i) Vendor Specific Objective Evidence (VSOE); (ii) third-party evidence of the selling price for that element; or (iii) estimated selling price for individual elements of an arrangement when VSOE or third-party evidence of the selling price is unavailable.
Service revenues include contracts primarily for the provision of supplies or services other than associated with design, development or manufacturing and production activities. It may be a stand-alone service contract or a service element, which was separated from the design, development or production contract according to the criteria established in ASC 605-25. Our service contracts primarily include operation and maintenance contracts, outsourcing-type arrangements, return and repair contracts, training, installation service, etc. Revenue from services were less than 10% of consolidated revenues in each of the fiscal years 2010, 2011and 2012.
Business Combinations
In accordance with ASC 805 “Business Combinations”, we allocate the purchase price of acquired companies to the tangible and intangible assets acquired and liabilities assumed, as well as to IPR&D and contingent consideration, and non-controlling interest, based on their estimated fair values. Such valuations require management to make significant estimates and assumptions, especially with respect to intangible assets.
We engage third-party appraisal firms to assist management in determining the fair values of certain assets acquired and liabilities assumed. Estimating the fair value of certain assets acquired and liabilities assumed requires judgment and often involves the use of significant estimates and assumptions, mainly with respect to intangible assets. Management makes estimates of fair value based upon market participants’ assumptions believed to be reasonable. These estimates are based on historical experience and information obtained from the management of the acquired companies, and although they are deemed to be consistent with market participants’ highest and best use of the assets in the principal or most advantageous market, they are inherently uncertain. While there are a number of different methods for estimating the value of intangible assets acquired, the primary method used is the discounted cash flow approach. Some of the more significant estimates and assumptions inherent in the discounted cash flow approach include projected future cash flows, including their timing, a discount rate reflecting the risk inherent in the future cash flows and a terminal growth rate. We also estimate the expected useful lives of the intangible assets, which requires judgment and can impact our results of operations. Unanticipated events and circumstances may occur that may affect the accuracy or validity of such assumptions, estimates or actual results.
To the extent intangible assets are assigned longer useful lives, there may be less amortization expense recorded in a given period. Because we operate in industries which are extremely competitive, the value of our intangible assets and their respective useful lives are exposed to future adverse changes, which can result in an impairment charge to our results of operations.
42
Impairment of Long-Lived Assets and Goodwill
Our long-lived assets, including identifiable intangible assets, are reviewed for impairment in accordance with ASC 360-10-35 “Property, Plant and Equipment Subsequent Measurement” whenever events or changes in circumstances indicate that the carrying amount of an asset may not be recoverable. Recoverability of assets to be held and used is measured by a comparison of the carrying amount of an asset to the future undiscounted cash flows expected to be generated by the asset. If an asset is determined to be impaired, the impairment to be recognized is measured by the amount by which the carrying amount of the asset exceeds its fair value. Fair value of non-financial assets is determined based on market participant assumptions. For each of the years ended December 31, 2010, 2011 and 2012, no material impairment was identified.
Goodwill represents the excess of the cost of acquired businesses over the fair values of the assets acquired and net of liabilities assumed. Goodwill is not amortized, but is instead tested for impairment at least annually (or more frequently if impairment indicators arise).
We review goodwill for impairment on an annual basis and whenever events or changes in circumstances indicate the carrying value of goodwill may not be recoverable. Such events or circumstances could include significant changes in the business climate of our industry, operating performance indicators, competition or sale or disposal of a portion of a reporting unit. The assessment is performed at the reporting unit level. Our annual testing date for all reporting units is December 31.
Performing the goodwill impairment test requires judgment, including how we define reporting units and determine their fair value. We consider a component of our business to be a reporting unit if it constitutes a business for which discrete financial information is available and management regularly reviews the operating results of that component. We estimate the fair value of each reporting unit using a discounted cash flow methodology that requires significant judgment. Forecasts of future cash flows are based on our best estimate of future sales and operating costs, based primarily on existing backlog, expected future contracts, contracts with suppliers, labor agreements and general market conditions. We base cash flow projections for each reporting unit using a five-year forecast of cash flows and a terminal value based on the Perpetuity Growth Model. The five-year forecast and related assumptions were derived from the most recent annual financial forecast for which the planning process commenced in our fourth quarter. The discount rate applied to our forecasts of future cash flows is based on our estimated weighted average cost of capital and includes factors such as the risk-free rate of return and the return an outside investor would expect to earn based on the overall level of inherent risk. The determination of expected returns includes consideration of the beta (a measure of risk) of traded securities of comparable companies. Changes in these estimates and assumptions could materially affect the determination of fair value and/or goodwill impairment for each reporting unit.
We evaluate goodwill for impairment by comparing the estimated fair value of a reporting unit to its carrying value, including goodwill. If the carrying value exceeds the estimated fair value, we measure impairment by comparing the derived fair value of goodwill to its carrying value, and any impairment determined is recorded in the current period.
For each of the three years in the period ended December 31, 2012, no material impairment was identified.
Other-Than-Temporary Decline in Value of Investments in Investee
Management evaluates investments in affiliates and other companies for evidence of other-than-temporary declines in value. When relevant factors indicate a decline in value that is other-than-temporary we recognize an impairment loss for the decline in value. We use our judgment in determining whether an other-than-temporary decline in the value of an investment has been sustained. Such evaluation is dependent on the specific facts and circumstances. Accordingly, management evaluates financial information (e.g. budgets, business plans, financial statements, etc.) in determining whether an other-than-temporary decline in value exists. Factors indicative of an other-than-temporary decline include recurring operating losses, credit defaults and subsequent rounds of financings at an amount below the cost basis of the investment. This list is not all-inclusive, and management weighs many quantitative and qualitative factors in determining if an other-than-temporary decline in value of an investment has occurred.
43
During 2012 no material impairment was recognized
.
During 2011, an impairment loss was recorded in the amount of $9.5 million relating to our investment in Fraser-Volpe LLC, a subsidiary that is classified as held-for-sale. During 2010, no material impairment was recognized.
Useful Lives of Long-Lived Assets
Identifiable intangible assets and property, plant and equipment are amortized over their estimated useful lives. Determining the useful lives of such assets involves the use of estimates and judgments. In determining the useful lives we take into account various factors such as the expected use of the assets, effects of obsolescence, including technological developments, competition, demand, and changes in business, acquisitions and other economic factors. If we estimate changes and the useful lives of such assets increase or decrease, it will affect our results of operations. (See above “Impairment of Long-Lived Assets and Goodwill” for further discussion of the effects of changes in useful lives.)
Taxes on Income
We record income taxes using the asset and liability approach, whereby deferred tax assets and liability account balances are determined based on differences between financial reporting and tax bases of assets and liabilities and of operating losses and credit carry-forwards, and are measured using the enacted tax rates and laws that will be in effect when the differences are expected to reverse. We record a valuation allowance, if necessary, to reduce deferred tax assets to amounts that are more likely than not to be realized. We have considered future taxable income on a jurisdiction by jurisdiction basis, prudent and feasible tax planning strategies and other available evidence in determining the need for a valuation allowance. In the event we were to determine that we would be able to realize these deferred income tax assets in the future, we would adjust the valuation allowance, which would reduce the provision for income taxes.
We establish reserves for tax-related uncertainties based on estimates of whether, and the extent to which, additional taxes will be due. These reserves are established when we believe that certain positions might be challenged despite our belief that our tax return positions are in accordance with applicable tax laws. As part of the determination of our tax liability, management exercises considerable judgment in evaluating tax positions taken by us in determining the income tax provision and establishes reserves for tax contingencies in accordance with ASC 740 "Income Taxes" guidelines. We adjust these reserves in light of changing facts and circumstances, such as the closing of a tax audit, new tax legislation or the change of an estimate based on new information. To the extent that the final tax outcome of these matters is different from the amounts recorded, such differences will affect the provision for income taxes in the period in which such determination is made. The provision for income taxes includes the effect of reserve provisions and changes to reserves that are considered appropriate, as well as the related interest and penalties.
Management’s judgment is required in determining our provision for income taxes in each of the jurisdictions in which we operate. The provision for income tax is calculated based on our assumptions as to our entitlement to various benefits under the applicable tax laws in the jurisdictions in which we operate. The entitlement to such benefits depends upon our compliance with the terms and conditions set out in these laws. Although we believe that our estimates are reasonable and that we have considered future taxable income and ongoing prudent and feasible tax strategies in estimating our tax outcome, there is no assurance that the final tax outcomes will not be different than those which are reflected in our historical income tax provisions and accruals. Such differences could have a material effect on our income tax provision, net income and cash balances in the period in which such determination is made.
Stock-Based Compensation Expense
We apply ASC 718 “Compensation – Stock Based Compensation” (ASC 718), which requires the measurement and recognition of compensation expense for all share-based payment awards made to our employees and directors including employee stock options based on estimated fair values and cash-based awards linked to the share price. Stock-based compensation expense in 2012 was $3.3 million, in 2011 was $2.0 million and in 2010 was $5.2 million. (See Item 18. Financial Statements – Notes 2(Z) and 21 for additional information.)
Under ASC 718, we estimate the value of employee stock options on the date of grant using a lattice-based option valuation model. The determination of fair value of stock option awards on the date of grant is affected by several factors including our stock price, our stock price volatility, risk-free interest rate, expected dividends and employee stock option exercise behaviors. If such factors change and we employ different assumptions for future grants, our compensation expense may differ significantly from what we have recorded in the current period.
44
In addition, our compensation expense is affected by our estimate of the number of awards that will ultimately vest. In the future, if the number of equity awards that are forfeited by employees are lower than expected, the expenses recognized in such future periods will be higher. (See Item 18. Financial Statements – Notes 2(Z) and 21 for further description of our assumptions used for calculation of stock-based compensation expense.)
Governmental Policies
Governmental policies and regulations applicable to defense contractors, such as cost accounting and audit, export control, procurement solicitation and anti-bribery rules and regulations, could have a material impact on our operations. (See Item 3. Risk Factors – General Risks Related to Our Business and Market and Item 4. Information on the Company – Governmental Regulation.) According to Section 404 of the U.S. Sarbanes-Oxley Act of 2002, we are required to include in our annual report on Form 20-F an assessment, as of the end of the fiscal year, of the effectiveness of our internal controls over financial reporting. (See Item 15. Controls and Procedures – Management’s Annual Report on Internal Control Over Financial Reporting.)
Recent Accounting Pronouncements
See Item 18. Financial Statements – Notes 2(AD).
Long-Term Arrangements and Commitments
Government Funding of Development.
Elbit Systems and certain Israeli subsidiaries partially finance our research and development expenditures under programs sponsored by the Government of Israel Office of the Chief Scientist (OCS) for the support of research and development activities conducted in Israel. At the time the funds are received, successful development of the funded projects is not assured. In exchange for the funds, Elbit Systems and the subsidiaries pay 2% – 5% of total sales of the products developed under these programs. The obligation to pay these royalties is contingent on actual future sales of the products. Elbit Systems and some of our subsidiaries may also be obligated to pay certain amounts to the IMOD and others on certain sales including sales resulting from the development of some of the technologies developed with such respective entity’s funds. (See Item 4. Information on the Company – Conditions in Israel – Chief Scientist (OCS) and Investment Center Funding.)
Lease Commitments.
The future minimum lease commitments of the Company under various non-cancelable operating lease agreements for property, motor vehicles and office equipment as of December 31, 2012 were as follows: $34.1million for 2013, $29.2 million for 2014, $21.0 million for 2015, $18.7 million for 2016, $13.8 million for 2017 and $93.1 million for 2018 and thereafter. (See below “Contractual Obligations”.)
Bank Covenants.
In connection with bank credits and loans, including performance guarantees issued by banks and bank guarantees in order to secure certain advances from customers, Elbit Systems and certain subsidiaries are obligated to meet certain financial covenants. (See below – “Liquidity and Capital Resources – Financial Resources”). Such covenants include requirements for shareholders’ equity, current ratio, operating profit margin, tangible net worth, EBITDA, interest coverage ratio and total leverage. (See Item 18. Financial Statements – Note 20(F).) As a result of recognition of the expense due to the cessation of a program with a foreign customer in December 2011 (see Item 18. Financial Statements - Notes 1(C) and 20(F)), as of December 31, 2011, we did not meet one of our covenants. During the first quarter of 2012, the banks waived such covenant through March 31, 2013, and accordingly, as of December 31, 2011, our bank credits and loans were not negatively affected. As of December 31, 2012, the Company met all financial covenants.
Bank Guarantees.
As of December 31, 2012 and 2011, guarantees in the aggregate amount of approximately $1,070 million and $1,040 million, respectively, were issued by banks on behalf of several Company entities primarily in order to secure certain advances from customers and performance bonds.
Purchase Commitments.
As of December 31, 2012 and 2011, we had purchase commitments of approximately $949 million and $1,026 million, respectively. These purchase orders and subcontracts are typically in standard formats proposed by us. These subcontracts and purchase orders also reflect provisions from the applicable prime contract that apply to subcontractors and vendors. The terms typically included in these purchase orders and subcontracts are consistent with Uniform Commercial Code provisions in the United States for sales of goods, as well as with specific terms requested by our customers in international contracts. These terms include our right to terminate the purchase order or subcontract in the event of the vendor’s or subcontractor’s default, as well as our right to terminate the order or subcontract for our convenience (or if our prime contractor has so terminated the prime contract). Such purchase orders and subcontracts typically are not subject to variable price provisions.
45
Acquisitions During 2012
See Item 4. Information on the Company – Recent Acquisitions, Mergers and Divestitures.
Backlog of Orders
Our backlog includes firm commitments received from customers for systems, products and projects that have yet to be completed. Our policy is to include orders in our backlog only when specific conditions are met. Examples of these conditions may include, among others, receipt of a letter of commitment, program funding, advances, letters of credit, guarantees and/or other commitments from customers. As a result, from time to time we could have unrecorded orders in excess of the level of backlog.
We reduce backlog when revenues for a specific contract are recognized. We reduce backlog as delivery or acceptance occurs or when contract milestones or engineering progress under the long-term contracts are recognized as achieved. In some cases we reduce backlog when costs are incurred. In the unusual event of a contract cancellation, we would also be required to reduce our backlog accordingly. The method of backlog recognition used may differ depending on the particular contract. Orders in currencies other than U.S. dollars are translated periodically into U.S. dollars and recorded accordingly.
Our backlog of orders as of December 31, 2012 was $5,683 million, of which 67%was for orders outside Israel. Our backlog as of December 31, 2011 was $5,528 million, of which 75% was for orders outside Israel. Approximately 68% of our backlog as of December 31, 2012 is scheduled to be performed during 2013 and 2014. The majority of the 32% balance is scheduled to be performed in 2015 and 2016. Backlog information and any comparison of backlog as of different dates may not necessarily represent an indication of future sales.
Trends
Trends in the defense electronics and homeland security markets in which we operate have been impacted by the nature of recent conflicts and terrorism activities throughout the world, increasing the focus of defense forces on low intensity conflicts, homeland security and cyber warfare. The defense market has also been impacted by the withdrawal of most of the allied forces from Iraq and a reduction of allied forces in Afghanistan.
In the defense electronics market, there is an increasing demand for products and systems in the areas of C4ISR and unmanned vehicles. Accordingly, while we continue to perform platform upgrades, in recent years more emphasis is being placed on C4ISR, including information systems, intelligence gathering, situational awareness, precision guidance, all weather and day/night operations, border and perimeter security, UAS, other unmanned vehicles, cyber-based systems, training and simulation, space and satellite based defense capabilities and homeland security systems. We believe that our core technologies and abilities will enable us to take advantage of many of these emerging trends, as well as to continue to participate in the “Current Force” legacy operations of our customers.
In recent years consolidation in the defense industry has affected competition. This consolidation has decreased the number but increased the relative size and resources of our competitors. We adapt to evolving market conditions by adjusting our business strategy. Our business strategy also anticipates increased competition in defense markets due to declining defense budgets in certain countries. As a result of recent worldwide financial developments, current indications are that overall defense spending is unlikely to increase in the coming years, and many governments recently have reduced their defense budgets. However, we believe in our ability to compete on the basis of our systems development, technological expertise, combat-proven performance and policy of offering customers overall solutions to technological, operational and financial needs and at the same time enhancing the industrial capabilities in certain of our customers’ countries.
Our future success is dependent on our ability to meet our customers’ expectations and anticipate emerging customer needs. We must continue to successfully perform on existing programs, as past performance is an important selection criteria for new competitive awards. We also must anticipate customer needs so as to be able to develop working prototypes in advance of program solicitations. Such working prototypes are becoming an increasingly standard part of our competitive environment. This requires us to anticipate future technological and operational trends in our marketplace and efficiently engage in relevant research and development efforts.
46
Summary of Operating Results
The following table sets forth our consolidated statements of operations for each of the three years ended December 31, 2012.
| Year ended December 31, | ||||||||||||||||||||||||
| 2012 | 2011 | 2010 | ||||||||||||||||||||||
| $ | % | $ | % | $ | % | |||||||||||||||||||
|
(in thousands of U.S. dollars except per share data
)
|
||||||||||||||||||||||||
|
Total revenues
|
$ | 2,888,607 | 100.0 | $ | 2,817,465 | 100.0 | 2,670,133 | 100.0 | ||||||||||||||||
|
Cost of revenues
|
2,072,742 | 71.8 | 2,085,451 | 74.0 | 1,872,263 | 70.1 | ||||||||||||||||||
|
Gross profit
|
815,865 | 28.2 | 732,014 | 26.0 | 797,870 | 29.9 | ||||||||||||||||||
|
Research and development (R&D) expenses
|
276,458 | 9.6 | 288,668 | 10.2 | 268,578 | 10.0 | ||||||||||||||||||
|
Less – participation
|
(43,071 | ) | (1.5 | ) | (47,576 | ) | (1.6 | ) | (34,447 | ) | (1.29 | ) | ||||||||||||
|
R&D expenses, net
|
233,387 | 8.1 | 241,092 | 8.6 | 234,131 | 8.8 | ||||||||||||||||||
|
Marketing and selling expenses
|
241,911 | 8.4 | 235,909 | 8.4 | 229,942 | 8.6 | ||||||||||||||||||
|
General and administrative expenses
|
137,517 | 4.8 | 139,349 | 4.9 | 131,200 | 4.9 | ||||||||||||||||||
|
Acquired IPR&D and other expenses
|
– | – | – | – | (4,756 | ) | (0.2 | ) | ||||||||||||||||
| 612,815 | 21.2 | 616,350 | 21.9 | 590,517 | 22.1 | |||||||||||||||||||
|
Operating income
|
203,050 | 7.0 | 115,664 | 4.1 | 207,353 | 7.8 | ||||||||||||||||||
|
Financial expenses, net
|
(26,086 | ) | (0.9 | ) | (13,569 | ) | (0.5 | ) | (21,251 | ) | (0.8 | ) | ||||||||||||
|
Other income, net
|
78 | 0.0 | 1,909 | 0.1 | 13,259 | 0.5 | ||||||||||||||||||
|
Income before taxes on income
|
177,042 | 6.1 | 104,004 | 3.7 | 199,361 | 7.5 | ||||||||||||||||||
|
Taxes on income
|
17,099 | 0.6 | 13,624 | 0.5 | 24,037 | 0.9 | ||||||||||||||||||
| 159,943 | 5.5 | 90,380 | 3.2 | 175,324 | 6.6 | |||||||||||||||||||
|
Equity in net earnings of affiliated companies and partnerships
|
11,160 | 0.4 | 15,377 | 0.6 | 18,796 | 0.7 | ||||||||||||||||||
|
Income from continuing operations
|
$ | 171,103 | 5.9 | $ | 105,757 | 3.8 | 194,120 | 7.3 | ||||||||||||||||
|
Income (loss) from discontinued operations, net
|
(616 | ) | (0.0 | ) | (15,977 | ) | (0.6 | ) | 921 | – | ||||||||||||||
|
Net income
|
170,487 | 5.9 | 89,780 | 3.2 | 195,041 | 7.3 | ||||||||||||||||||
|
Less – net loss (income) attributable to non-controlling interests
|
$ | (2,608 | ) | (0.1 | ) | $ | 508 | (11,543 | ) | (0.4 | ) | |||||||||||||
|
Net income attributable to the Company’s shareholders
|
$ | 167,879 | 5.8 | $ | 90,288 | 3.2 | 183,498 | 6.9 | ||||||||||||||||
|
Diluted net earnings (loss) per share:
|
||||||||||||||||||||||||
|
Continuing operations
|
$ | 3.98 | $ | 2.31 | 4.24 | |||||||||||||||||||
|
Discontinued operations
|
(0.01 | ) | (0.22 | ) | 0.01 | |||||||||||||||||||
|
Total
|
$ | 3.97 | $ | 2.09 | $ | 4.25 | ||||||||||||||||||
2012 Compared to 2011
Revenues
Our sales are primarily to governmental entities and prime contractors under government defense programs. Accordingly, the level of our revenues is subject to governmental budgetary constraints.
The following table sets forth our revenue distribution by areas of operation:
|
Year ended
|
||||||||||||||||
|
December 31, 2012
|
December 31, 2011
|
|||||||||||||||
|
$ millions
|
%
|
$ millions
|
%
|
|||||||||||||
|
Airborne systems
|
1,054.5 | 36.5 | 969.4 | 34.4 | ||||||||||||
|
Land systems
|
374.5 | 13.0 | 405.3 | 14.4 | ||||||||||||
|
C4ISR systems
|
1,017.6 | 35.2 | 996.4 | 35.4 | ||||||||||||
|
Electro-optic systems
|
324.1 | 11.2 | 300.2 | 10.6 | ||||||||||||
|
Other (mainly non-defense engineering and production services)
|
117.9 | 4.1 | 146.2 | 5.2 | ||||||||||||
|
Total
|
2,888.6 | 100.0 | 2,817.5 | 100.0 | ||||||||||||
47
Our consolidated revenues increased by 2.5% from $2,817.5 million in 2011 to $2,888.6 million in 2012.
The leading contributors to our revenues were the airborne systems and C4ISR systems areas of operations. The major increase was in the airborne systems area of operations, primarily due to increased revenues in North America for avionic systems, aerostructures and maintenance services. The decrease in the land systems area of operations was mainly due to a decline in revenues for fire control and life support systems in Israel and North America.
The following table sets forth our distribution of revenues by geographical regions:
|
Year ended
|
||||||||||||||||
|
December 31, 2012
|
December 31, 2011
|
|||||||||||||||
|
$ millions
|
%
|
$ millions
|
%
|
|||||||||||||
|
Israel
|
519.9 | 18.0 | 697.2 | 24.8 | ||||||||||||
|
North America
|
909.4 | 31.5 | 890.7 | 31.6 | ||||||||||||
|
Europe
|
561.1 | 19.4 | 552.4 | 19.6 | ||||||||||||
|
Latin America
|
258.8 | 9.0 | 165.5 | 5.9 | ||||||||||||
|
Asia-Pacific
|
568.4 | 19.7 | 460.0 | 16.3 | ||||||||||||
|
Other
|
71.0 | 2.4 | 51.7 | 1.8 | ||||||||||||
|
Total
|
2,888.6 | 100 | 2,817.5 | 100.0 | ||||||||||||
The decline in revenues in Israel was mainly a result of reduced revenues relating to fire control and command and control systems. The increased revenues in Asia-Pacific was mainly related to electro-optics and communication equipment. The increased revenues in Latin America was mainly due to UAS and command and control systems.
Cost of Revenues and Gross Profit
Cost of revenues in 2012 was $2,072.7 million (with a gross profit margin of 28.2%) as compared to $2,085.5 million (with a gross profit margin of 26.0%) in 2011. Cost of revenues in 2011 included an expense of $72.8 million related to the cessation of a program with a foreign customer (See Item 18. Financial Statements – Note 1(C).)
Gross profit
for the year ended December 31, 2012
was $815.9 million (28.2% of revenues), as compared with gross profit of $732.0 million (26.0% of revenues) in the year ended December 31, 2011.
The gross profit margin in 2012 increased mainly as a result of the mix of programs sold in the year.
The gross profit in 2011 was reduced by an expense of $72.8 million related to the cessation of a program with a foreign customer.
Research and Development (R&D)
We continually invest in R&D in order to maintain and further advance our technologies, in accordance with our long-term plans, based on our estimate of future market needs. Our R&D costs, net of participation grants, include costs incurred for independent research and development and bid and proposal (B&P) efforts and are expensed as incurred.
Gross R&D expenses in 2012 totaled $276.5 million (9.6% of revenues) as compared with $288.7 million (10.2% of revenues) in 2011.
Net R&D expenses (after deduction of third party participation) in 2012 totaled $233.4 million (8.1% of revenues), as compared to $241.1 million (8.6% of revenues) in 2011.
Marketing and Selling Expenses
We are active in developing new markets and pursue at any given time various business opportunities according to our plans.
Marketing and selling expenses in 2012 were $241.9 million (8.4% of revenues), as compared to $235.9 million (8.4% of revenues) in 2011.
48
General and Administration (G&A) Expenses
G&A expenses in 2012 were $137.5 million (4.8% of revenues), as compared to $139.3 million (4.9% of revenues) in 2011.
Operating Income
Our operating income in 2012 was $203.1 million (7.0% of revenues), as compared to $115.7 million (4.1% of revenues) in 2011. The lower amount and margin of operating income in 2011 was mainly a result of the cessation of the program mentioned above.
Financial Expense (Net)
Net financing expenses in 2012 were $26.1 million, as compared to $13.6 million in 2011. The increase in 2012 is related to interest on the additional issued Series A Notes.
The financial expenses in 2011 were lower as a result of income primarily from currency hedging activities and the settlement of the ImageSat transaction.
Other Income (Net)
Other income, net in 2012 was a $0.1 million gain, as compared to a gain of $1.9 in 2011.
Taxes on Income
Our tax rate represents a weighted average of the tax rates to which our various entities are subject.
Income taxes in 2012 were $17.1 million (effective tax rate of 9.7%) as compared to an income taxes of $13.6 million (effective tax rate of 13.1%) in 2011. The effective tax rate was affected by prior years adjustments of $5.5 million. The change in the effective tax rate was also affected by the mix of the tax rates in the various jurisdictions in which the Company’s entities generate taxable income. We continue to enjoy a lower effective Israeli tax rate and the benefits of an “Approved and Privileged Enterprise”, which resulted in savings of $26.1 million and $11.5 million, respectively, in 2012 and 2011, significantly influencing our effective tax rates.
Company’s Share in Earnings of Affiliated Entities
The entities, in which we hold 50% or less in shares or voting rights (affiliates), and are therefore not consolidated in our financial statements, operate in complementary areas to our core business activities, including electro-optics and airborne systems.
In 2012, we had income of $11.2 million from our share in earnings of affiliates, as compared to income of $15.4 million in 2011.
Loss from Discontinued Operations, Net
Loss from discontinued operations for the year ended December 31, 2012, amounted to $0.6 million. The net loss from discontinued operations (after deducting the minority interest) amounted to $0.4 million.
Net Income and Earnings Per Share (EPS)
Net income in 2012 was $167.9 million (5.8% of revenues), as compared to net income of $90.3 million (3.2% of revenues) in 2011. The net income in 2011 included the net effect of the cessation of a program which amounted to $62.2 million. (See Item 18. Financial Statements – Note 1(C).) Diluted EPS was $3.97 in 2012, as compared to $2.09 in 2011.
The number of shares used for computation of diluted EPS in the year ended December 31, 2012 was 42,277,000 shares, as compared to 43,131,000 shares in the year ended December 31, 2011.
49
2011 Compared to 2010
Revenues
The following table sets forth our revenue distribution by areas of operation:
|
Year ended
|
||||||||||||||||
|
December 31, 2011
|
December 31, 2010 | |||||||||||||||
|
$ millions
|
%
|
$ millions
|
%
|
|||||||||||||
|
Airborne systems
|
969.4 | 34.4 | 791.1 | 29.6 | ||||||||||||
|
Land systems
|
405.3 | 14.4 | 363.2 | 13.6 | ||||||||||||
|
C4ISR systems
|
996.4 | 35.4 | 1,019.1 | 38.2 | ||||||||||||
|
Electro-optic systems
|
300.2 | 10.6 | 368.8 | 13.8 | ||||||||||||
|
Other (mainly non-defense engineering and production services)
|
146.2 | 5.2 | 127.9 | 4.8 | ||||||||||||
|
Total
|
2,817.5 | 100.0 | 2,670.1 | 100.0 | ||||||||||||
Our consolidated revenues increased by 5.5% from $2,670.1 million in 2010 to $2,817.5 million in 2011.
The leading contributors to our revenues were the C4ISR and airborne areas of operations. The major increase was in the airborne area of operations, which included in 2011 revenues resulting from M7’s operations acquired in the fourth quarter of 2010 and which contributed to the revenue growth in 2011. The decrease in the electro-optic systems area of operations was mainly due to reduced revenues in reconnaissance systems and night vision products.
The following table sets forth our distribution of revenues by geographical regions:
|
Year ended
|
||||||||||||||||
|
December 31, 2011
|
December 31, 2010
|
|||||||||||||||
|
$ millions
|
%
|
$ millions
|
%
|
|||||||||||||
|
Israel
|
697.2 | 24.8 | 651.0 | 24.4 | ||||||||||||
|
North America
|
890.7 | 31.6 | 844.0 | 31.6 | ||||||||||||
|
Europe
|
552.4 | 19.6 | 541.7 | 20.3 | ||||||||||||
|
Latin America
|
165.5 | 5.9 | 152.1 | 5.7 | ||||||||||||
|
Asia-Pacific
|
460.0 | 16.3 | 459.6 | 17.2 | ||||||||||||
|
Other countries
|
51.7 | 1.8 | 21.7 | 0.8 | ||||||||||||
|
Total
|
2,817.5 | 100.0 | 2,670.1 | 100.0 | ||||||||||||
Cost of Revenues and Gross Profit
Cost of revenues in 2011 was $2,085.5 million (with a gross profit margin of 26%), as compared to $1,872.3 million (with a gross profit margin of 29.9%) in 2010. Cost of revenues in 2011 included an expense of $72.8 million related to the cessation of a program with a foreign customer. Gross profit
for the year ended December 31, 2011
was $732.0 million (26.0% of revenues), as compared with gross profit of $797.9 million (29.9% of revenues) in the year ended December 31, 2010. The decrease in the amount of gross profit in 2011 resulted primarily from the above-mentioned expense as well as reduced gross profit in the mix of programs underlying our revenues in 2011.
Research and Development (R&D)
Gross R&D expenses in 2011 totaled $288.7 million (10.2% of revenues) as compared with $268.6 million (10.0% of revenues) in 2010.
Net R&D expenses (after deduction of third party participation) in 2011 totaled $241.1 million (8.6% of revenues), as compared to $234.1 million (8.8% of revenues) in 2010.
50
Marketing and Selling Expenses
Marketing and selling expenses in 2011 were $235.9 million (8.4% of revenues), as compared to $229.9 million (8.6% of revenues) in 2010.
General and Administration (G&A) Expenses
G&A expenses in 2011 were $139.3 million (4.9% of revenues), as compared to $131.2 million (4.9% of revenues) in 2010.
The increase in G&A expenses in 2011 compared to 2010 was due to higher expenses related to our subsidiaries acquired in the last quarter of 2010.
Other operational income
for the year ended December 31, 2010 amounted to $4.8 million. The amount reflects a net gain of $4.8 million in the second quarter of 2010, related to the revaluation of the previously held Azimuth shares at the acquisition date, due to its accounting treatment as a business combination achieved in stages. There was no other operational income in 2011.
Operating Income
Our operating income in 2011 was $115.7 million (4.1% of revenues), as compared to $207.4 million (7.8% of revenues) in 2010. The change in the amount of operating income was a result of the expense of $72.8 million mentioned above as well as the increases in operating expenses discussed above.
Financial Expense (Net)
Net financing expenses in 2011 were $13.6 million, as compared to $21.3 million in 2010.
The financial expenses in 2011 decreased as a result of income primarily from currency hedging activities and interest on the settlement of the ImageSat debt transaction.
Other Income (Net)
Other income, net in 2011 was a $1.9 million gain, as compared to a gain of $13.3 in 2010. The amount in 2010 included a gain of $12.8 million related to the sale of Mediguide shares in the first quarter of 2010.
Taxes on Income
Income taxes in 2011 were $13.6 million (effective tax rate of 13.1%) as compared to an income taxes of $24.0 million (effective tax rate of 12.1%) in 2010. Taxes on income in 2010 included an amount of approximately $10 million related to the first recognition of deferred tax assets for prior years’ losses in one of our subsidiaries. The change in the effective tax rate was also affected by the mix of the tax rates in the various jurisdictions in which the Company’s entities generate taxable income. We continued to enjoy a lower effective Israeli tax rate and the benefits of an “Approved and Privileged Enterprise”, which resulted in savings of $11.5 million and $20.5 million, respectively, in 2011 and 2010, significantly influencing our effective tax rates.
Company’s Shares in Earnings of Affiliated Entities
In 2011, we had income of $15.4 million from our share in earnings of affiliates, as compared to income of $18.8 million in 2010.
Loss from Discontinued Operations, Net
Loss from discontinued operations for the year ended December 31, 2011, amounted to $16 million. The amount reflects a net loss related to an impairment of held-for-sale investments acquired during 2010, as part of the acquisition of the Mikal group of companies. The net loss from discontinued operations (after deducting the minority interest) amounted to $9.5 million.
51
Net Income and Earnings Per Share (EPS)
Net income in 2011 was $90.3 million (3.2% of revenues), as compared to net income of $183.5 million (6.9% of revenues) in 2010. The net income in 2011 included the net effect of the cessation of the above-mentioned program which amounted to $62.2 million. Diluted EPS was $2.09 in 2011, as compared to $4.25 in 2010.
The number of shares used for computation of diluted EPS in the year ended December 31, 2011 was 43,131,000 shares, as compared to 43,217,000 shares in the year ended December 31, 2010.
In June 2010, Elbit Systems completed a public offering in Israel on the TASE of NIS 1.1 billion (approximately $283 million) Series A Notes (the Series A Notes). The Series A Notes were offered and sold pursuant to a shelf prospectus filed in May 2010 with the Israeli Securities Authority and the TASE. The shelf prospectus allowed us, during a period of 24 months following its publication, to raise capital from the public in Israel, from time to time, by issuing notes or warrants that are exercisable into notes subject to the terms of the shelf prospectus and to the publication of a supplemental shelf offering report describing the terms of the securities offered and the details of the specific offering.
In March and May 2012, respectively, under the framework of the shelf prospectus, Elbit Systems completed both an additional public offering on the TASE and a private placement in Israel to Israeli institutional investors, of new Series A Notes, for an aggregate consideration of approximately NIS 926 million (approximately $249 million). All Series A Notes form a single series.
We account for the outstanding principal amount of our Series A Notes as long-term liability, in accordance with ASC 470, “Debt”, with current maturities classified as short-term liabilities. Debt issuance costs are capitalized and reported as deferred financing costs, which are amortized over the life of the Series A Notes using the effective interest rate method. As of December 31, 2012, the value of the Series A Notes was $450,727 million, less $58,275 million in current maturities and a fair value adjustment of $16,158 million from cross-currency interest rate swaps.
The Series A Notes are payable in ten equal annual installments on June 30 of each of the years 2011 through 2020. The Series A Notes bear a fixed interest rate of 4.84% per annum, payable on June 30 and December 30 of each of the years through 2020 (the first interest payment was made on December 30, 2010, and the last interest payment will be made on June 30, 2020). (See Item 8. Financial Statements – Note 16.)
The Series A Notes (principal and interest) are in NIS and are not linked to any currency or index. The Series A Notes are unsecured, non-convertible and do not restrict our ability to issue additional notes of any class or distribute dividends in the future. There are no covenants on the Series A Notes.
The Series A Notes are listed for trading on the TASE.
However, the Series A Notes are not registered under the U.S. Securities Act of 1933, as amended (the Securities Act), and may not be offered or sold in the United States or to U.S. Persons (as defined in Regulation “S” promulgated under the Securities Act) without registration under the Securities Act or an exemption from the registration requirements of the Securities Act.
We also entered into ten-year cross currency interest rate swap transactions in order to effectively hedge the effect of interest and exchange rate differences resulting from the NIS Series A Notes that were issued in 2010 and the additional Series A Notes that were issued in 2012. Under the cross currency interest rate swaps, we receive fixed NIS at a rate of 4.84% on NIS 2 billion and pay floating six-month USD LIBOR plus an average spread of 1.84% on $450 million, which reflects the U.S. dollar value of the Series A Notes on the specific dates the transactions were entered. Both the debt and the swap instruments pay semi-annual coupons on June 30 and December 31. The purpose of these transactions was to convert the NIS fixed rate Series A Notes into USD LIBOR (6 months) floating rate obligations. As a result of these agreements, we are currently paying an effective interest rate of six-month LIBOR (0.45% at December 31, 2012) plus an average of 1.84% on the principal amount, as compared to the original 4.84% fixed rate. The above transactions qualify for fair value hedge accounting. (See also Item 11. Quantitative and Qualitative Disclosures about Market Risk.)
52
Cash Flows
Our operating cash flow is affected by the cumulative cash flow generated from our various projects in the reported periods. Project cash flows are affected by the timing of the receipt of advances and the collection of accounts receivable from customers, as well as the timing of payments made by us in connection with the performance of the project. The receipt of payments usually relates to specific events during the project, while expenses are ongoing. As a result, our cash flow may vary from one period to another. Our policy is to invest our cash surplus mainly in interest bearing deposits, in accordance with our projected needs.
In general, subsidiaries are able to freely transfer cash dividends, loans or advances to Elbit Systems, subject to tax considerations in their applicable jurisdiction and subject to management commitment not to distribute tax exempt earnings. Such tax considerations have not had in the past, and are not anticipated to have, a material impact on our ability to meet our obligations.
2012
Our net cash flow generated from operating activities in 2012 was approximately $198.4 million, resulting mainly from our net income and the increase in advances received from customers.
Net cash flow used in investment activities in 2012 was approximately $117.6 million, which was used mainly to purchase property, plant and equipment and investment in available-for-sale marketable securities.
Net cash flow used for financing activities in 2012 was approximately $84.1 million, which was used mainly for purchase of treasury shares, repayment of Series A Notes and payment of dividends to shareholders.
2011
Our net cash flow generated from operating activities in 2011 was approximately $190.9 million, resulting mainly from our net income and the increase in advances received from customers.
Net cash flow used in investment activities in 2011 was approximately $55.1 million, which was used mainly to purchase property, plant and equipment and acquisitions of subsidiaries and business operations.
Net cash flow used for financing activities in 2011 was approximately $84.3 million, which was used mainly for purchase of the non-controlling interest in Elisra, repayment of Series A Notes and payment of dividends to shareholders.
2010
Our net cash flow generated from operating activities in 2010 was approximately $186.0 million, resulting mainly from net income and increases in trade and other payables, which were partially offset, mainly by an increase in short and long-term trade receivables and prepaid expenses, increase in inventories net and a decrease in advances received from customers, which was a result of lower advances received in new projects in 2010.
Net cash flow used in investment activities in 2010 was approximately $255.5 million, which was used mainly to purchase property, plant and equipment, investments in short-term deposits and acquisitions of subsidiaries and business operations.
Net cash flow provided by financing activities in 2010 was approximately $79.9 million, resulting mainly from the issuance of Series A Notes, part of which was used for repayment of long-term loans and payment of dividends to shareholders.
Financial Resources
The financial resources available to us include profits, collection of accounts receivable, advances from customers and government of Israel and other third parties’ programs such as the OCS and development grants. In addition, we have access to bank credit lines and financing in Israel and abroad based on our capital, assets and activities.
53
Elbit Systems and some subsidiaries are obligated to meet various financial covenants set forth in our respective loan and credit agreements. Such covenants include requirements for shareholders’ equity, current ratio, operating profit margin, tangible net worth, EBITDA, interest coverage ratio and total leverage. As a result of recognition of the expense due to the cessation of a program with a foreign customer in December 2011 (see Item 18. Financial Statements - Note 1(C)), as of December 31, 2011, we did not meet one of our covenants. Subsequent to our balance sheet date (December 31, 2011), in March 2012 the banks waived such covenant through March 31, 2013, and accordingly our bank credits and loans as of December 31, 2011, were not negatively affected. As of December 31, 2012, the Company met all financial covenants.
On December 31, 2012, we had total borrowings from banks and public institutes in the amount of $206 million, including $174 million in long-term loans, of which most of the loans mature in 2014 and $1,070 million in guarantees issued on our behalf by banks, mainly in respect of advance payment and performance guarantees provided in the regular course of business. In addition, at December 31, 2012, we had $467 million in outstanding debt under our Series A Notes, including $58 million maturing in 2013. On December 31, 2012, we had a cash balance amounting to $199 million. We also have the ability to raise funds on the capital market and through expansion of our credit lines. (See above “Israeli Debt Offering.”)
As of December 31, 2012, we had working capital of $375 million and a current ratio of 1.25. We believe that our working capital and cash flow from operations will be sufficient to support our current requirements and financial covenants.
We believe that our current cash balances, cash generated from operations, lines of credit and financing arrangements will provide sufficient resources to meet our operational needs for at least the next fiscal year. However, our ability to borrow funds from the banking system may be impacted by the ongoing global financial and liquidity situation. See Item 3. Risk Factors – General Risk Related to Our Business and Market.
For further information on the level, maturity and terms of our borrowings, see Item 18. Financial Statements – Notes 12 and 15.
We believe our ability to access external capital resources should be sufficient to satisfy existing short-term and long-term commitments and plans, and also to provide adequate financial flexibility to take advantage of potential strategic business opportunities should they arise within the next year.
Pensions and Other Post-Retirement Benefits
We account for pensions and other post-employment arrangements in accordance with ASC 715 “Compensation – Retirement Benefits”. Accounting for pensions and other post-retirement benefits involves judgment about uncertain events, including estimated retirement dates, salary levels at retirement, mortality rates, rates of return on plan assets, determination of discount rates for measuring plan obligations, healthcare cost trend rates and rates of utilization of healthcare services by retirees. These assumptions are based on the environment in each country. (For our pension and other post-retirement benefit assumptions at December 31, 2012 and 2011, see Item 18 – Financial Statements – Note 17.)
At December 31, 2012 our termination obligations were $407.7 million, of which we had severance funds of $302.7 million set aside to satisfy potential obligations.
Auction Rate Securities
. As of December 31, 2010, we had approximately $31.6 million (before cumulative impairment losses of $28.6 million) of principal invested in ARS. The estimated market value of our ARS holdings at December 31, 2010 was $7.2 million. In the fourth quarter of 2011 we sold our investment in the ARS for a consideration of $9.4 million.
Material Commitments for Capital Expenditures
. We believe that we have adequate sources of funds to meet our material commitments for capital expenditures for the fiscal year ending December 31, 2013 and the subsequent fiscal year. (See above “Financial Resources.”) We believe our anticipated capital expenditures (which include mainly the purchase of equipment, vehicles and buildings) as of December 31, 2012 were at a similar level to those as of December 31, 2011. We plan to pay for such anticipated expenditures using cash from operations. (See also Item 18. Financial Statements – Consolidated Statements of Cash Flows and Note 10.)
54
Impact of Inflation and Exchange Rates
Functional Currency
. Our reporting currency is the U.S. dollar, which is also the functional currency for most of our consolidated operations. A majority of our sales are made outside of Israel in non-Israeli currency, mainly U.S. dollars, as well as a majority of our purchases of materials and components. A significant portion of our expenses, mainly labor costs, are in NIS. Some of our subsidiaries have functional currencies in Euro, GBP and other currencies. Transactions and balances originally denominated in U.S. dollars are presented in their original amounts. Transactions and balances in currencies other than the U.S. dollar are remeasured in U.S. dollars according to the principles set forth in ASC 830 “Foreign Currency Matters”. Exchange gains and losses arising from remeasurement are reflected in financial expenses, net, in the consolidated statements of income.
Market Risks and Variable Interest Rates
Market risks relating to our operations result mainly from changes in interest rates and exchange rates. We use derivative instruments to limit exposure to changes in exchange rates in certain cases. We also typically enter into forward contracts in connection with transactions where long-term contracts have been signed and that are denominated in currencies other than U.S. dollars or NIS. We also enter from time to time into forward contracts and other hedging instruments related to NIS based on market conditions.
We use financial instruments and derivatives in order to limit our exposure to risks arising from changes in exchange rates. The use of such instruments does not expose us to additional exchange rate risks since the derivatives are held against an asset (for example, excess assets in Euros). Our policy in utilizing these financial instruments is to protect the dollar value of our cash and cash equivalent assets rather than to serve as a source of income.
In the context of our overall treasury policy specific objectives apply to the management of financial risks. These objectives are disclosed under the headings below “NIS/U.S. Dollar Exchange Rates”, “Inflation and Currency Exchange Rates” and “Foreign Currency Derivatives and Hedging”.
On December 31, 2012, our liquid assets were comprised of bank deposits, and short and long-term investments. Our deposits and investments are based on variable interest rates, and their value as of December 31, 2012 was therefore exposed to changes in interest rates. Should interest rates either increase or decrease, such change may affect our results of operations due to changes in the cost of the liabilities and the return on the assets that are based on variable rates.
NIS/U.S. Dollar Exchange Rates
. We attempt to manage our financial activities in order to reduce material financial losses in U.S. dollars resulting from the impact of inflation and exchange rate fluctuations on our non-U.S. dollar assets and liabilities. Our income and expenses in Israeli currency are translated into U.S. dollars at the prevailing exchange rates as of the date of the transaction. Consequently, we are affected by changes in the NIS/U.S. dollar exchange rates. We entered into other derivative instruments to limit our exposure to exchange rate fluctuations, related mainly to payroll expenses incurred in NIS. (See Item 11. Quantitative and Qualitative Disclosure of Market Risks.) The amount of our exposure to the changes in the NIS/U.S. dollar exchange rate may vary from time to time. (See Item 3. Key Information – Risk Factors – Risks Relating to Our Israeli Operations.)
Inflation and Currency Exchange Rates
The U.S. dollar cost of our operations in Israel is influenced by any increase in the rate of inflation in Israel that is not fully offset by the devaluation of the NIS in relation to the U.S. dollar. Unless inflation in Israel is offset by a devaluation of the NIS, such inflation may have a negative effect on the profitability of contracts where Elbit Systems or any of our Israeli subsidiaries receives payment in U.S. dollars, NIS linked to U.S. dollars or other foreign currencies, but incurs expenses in NIS linked to the CPI. Inflation in Israel and currency fluctuations may also have a negative effect on the profitability of fixed-price contracts where we receive payments in NIS.
In the past, our profitability was negatively affected when inflation in Israel (measured by the change in the CPI from the beginning to the end of the calendar year) exceeded the devaluation of the NIS against the U.S. dollar and at the same time we experienced corresponding increases in the U.S. dollar cost of our operations in Israel. For example, in 2010, the inflation rate was approximately 2.7%, and the NIS strengthened against the U.S. dollar by approximately 6%. In 2011, the inflation rate was approximately 2%, and the NIS devalued against the U.S. dollar by approximately 8%. In 2012, the inflation rate was approximately 1.6%, and the NIS strengthened against the U.S. dollar by approximately 2%. There can be no assurance that we will not be materially adversely affected in the future if inflation in Israel exceeds the devaluation of the NIS against the U.S. dollar or if the timing of such devaluation lags behind increases in inflation in Israel.
55
A devaluation of the NIS in relation to the U.S. dollar also has the effect of decreasing the dollar value of any of our assets that consist of NIS or accounts receivable denominated in NIS, unless such assets or accounts receivable are linked to the U.S. dollar. Such a devaluation also has the effect of reducing the U.S. dollar amount of any of our liabilities that are payable in NIS, unless such payables are linked to the U.S. dollar. On the other hand, any increase in the value of the NIS in relation to the U.S. dollar will have the effect of increasing the U.S. dollar value of any unlinked NIS assets as well as the U.S. dollar amount of any unlinked NIS liabilities and expenses.
Foreign Currency, Derivatives and Hedging
While our functional currency is the U.S. dollar, we also have some non-U.S. dollar or non-U.S. dollar linked exposure to currencies other than NIS. These are mainly non-U.S. dollar customer debts, payments to suppliers and subcontractors, obligations in other currencies, assets or undertakings. Some subcontractors are paid in local currency under prime contracts where we are paid in U.S. dollars. The exposure on these transactions has not been in amounts that are material to us. However, when we view it necessary, due to anticipated uncertainty in the applicable foreign exchange rates, we seek to minimize our foreign currency exposure by entering into hedging arrangements, obtaining periodic payments upon the completion of milestones, obtaining guarantees and security from customers and sharing currency risks with subcontractors.
Most of our future cash flows that will be denominated in currencies other than the NIS and the U.S. dollar were covered as of December 31, 2012 by forward contracts. On December 31, 2012, we had forward contracts for the sale and purchase of Euro, GBP and various other currencies. On December 31, 2012, we had forward contracts for the sale and purchase of such foreign currencies totaling approximately $285 million ($192 million in Euros, $74 million in GBP and the balance of $19 million in other currencies).
We also use forward exchange hedging contracts and options strategies in order to limit our exposure to exchange rate fluctuation associated with payroll expenses, mainly incurred in NIS. These include forward contracts with notional amount of $386 million in NIS maturing in 2013. (See also Item 11. Quantitative and Qualitative Disclosure of Market Risks.) As of December 31, 2012, an unrealized net gain of approximately $16.2 million was included in accumulated other comprehensive income. As of December 31, 2012, all of the forward contracts are expected to mature during the years 2013 – 2018.
Regarding the measures taken to reduce the foreign currency exchange rate impact on our Series A Notes see above “Liquidity and Capital Resources – Israeli Debt Offering.”
The table below presents the balance of the derivative instruments held in order to limit the exposure to exchange rate fluctuations as of December 31, 2012 and is presented in millions of U.S. dollar equivalent terms:
|
Notional
|
Unrealized
|
|||||||
|
Forward
|
Amount*
|
Gain (Loss)
|
||||||
|
Buy US$ and Sell:
|
||||||||
|
Euro
|
131.7 | 2.2 | ||||||
|
GBP
|
28.3 | (0.1 | ) | |||||
|
NIS
|
– | – | ||||||
|
Other various currencies
|
14.8 | (1.3 | ) | |||||
|
Notional
|
Unrealized
|
|||||||
|
Forward
|
Amount*
|
Gain (Loss)
|
||||||
|
Sell US$ and Buy:
|
||||||||
|
Euro
|
60.7 | (0.9 | ) | |||||
|
GBP
|
45.3 | 1.2 | ||||||
|
NIS
|
386.1 | 17.2 | ||||||
|
Other various currencies
|
4.3 | 1.4 | ||||||
____________________
* Notional amount information is based on the foreign exchange rate at year end.
56
Contractual Obligations
|
Less than
|
More than
|
|||||||||||||||
|
1 year
|
2-3 years
|
4-5 years
|
5 years
|
|||||||||||||
|
(U.S. dollars in millions
)
|
||||||||||||||||
|
1. Long-Term Debt Obligations
|
32 | 174 | 2 | – | ||||||||||||
|
2. Series A Notes
|
58 | 117 | 117 | 175 | ||||||||||||
|
3. Operating Lease Obligations*
|
34 | 50 | 33 | 93 | ||||||||||||
|
4. Purchase Obligations*
|
741 | 172 | 32 | 4 | ||||||||||||
|
5. Other Long-Term Liabilities Reflected on the Company’s Balance Sheet under U.S. GAAP**
|
– | – | – | – | ||||||||||||
|
6. Other Long-Term Liabilities***
|
– | – | – | – | ||||||||||||
|
Total
|
865 | 513 | 182 | 272 | ||||||||||||
____________________
|
*
|
For further descriptio
n of the Purchase Obligations see above “Long-Term Arrangements and Commitments – Purchase Commitments” and See Item 18. Financial Statements – Notes 20(D) and 20(H).
|
|
**
|
The obligation amount does not include an amount of $408 million of pension and employee termination liabilities. See Item 18. Financial Statements – Notes 2(R) and 17. The obligation amount also does not include an amount of $53 million of tax reserve related to uncertain tax positions. See Item 18. Financial Statements – Note 18.
|
|
***
|
See below “Off-Balance Sheet Transactions.”
|
Off-Balance Sheet Transactions
Buy-Back
In connection with projects in certain countries, Elbit Systems and some of our subsidiaries have entered and may enter in the future into “buy-back” or “offset” agreements, required by a number of our customers as a condition to our obtaining orders for our products and services. These agreements are customary in our industry and are designed to facilitate economic flow back (buy-back) and/or technology transfer to businesses or government agencies in the applicable country.
These commitments may be satisfied by our placement of direct work or vendor orders for supplies and/or services, transfer of technology, investments or other forms of assistance in the applicable country. The buy-back rules and regulations, as well as the underlying contracts, may differ from one country to another. The ability to fulfill the buy-back obligations may depend, among other things, on the availability of local suppliers with sufficient capability to meet our requirements and which are competitive in cost, quality and schedule. In certain cases, our commitments may also be satisfied through transactions conducted by other parties.
We do not commit to buy-back agreements until orders for our products or services are definitive, but in some cases the orders for our products or services may become effective only after our corresponding buy-back commitments enter into effect. Buy-back programs generally extend at least over the relevant commercial contract period and may provide for penalties in the event we fail to perform in accordance with buy-back requirements. In some cases we provide guarantees in connection with the performance of our buy-back obligations.
Should we be unable to meet such obligations we may be subject to contractual penalties, and our chances of receiving additional business from the applicable customers could be reduced or, in certain cases, eliminated. (See Item 3. Risk Factors – General Risks Related to Our Business and Market.)
At December 31, 2012, we had outstanding buy-back obligations totaling approximately $748 million that extend through 2020.
57
Non-GAAP Financial Data
The following non-GAAP financial data is presented to enable investors to have additional information on our business performance as well as a further basis for periodical comparisons and trends relating to our financial results. We believe such data provides useful information to investors by facilitating more meaningful comparisons of our financial results over time. Such non-GAAP information is used by our management to make strategic decisions, forecast future results and evaluate our current performance. However, investors are cautioned that, unlike financial measures prepared in accordance with GAAP, non-GAAP measures may not be comparable with the calculation of similar measures for other companies.
The non-GAAP financial data below includes reconciliation adjustments regarding non-GAAP gross profit, operating income, net income and diluted EPS. In arriving at non-GAAP presentations, companies generally factor out items such as those that have a non-recurring impact on the income statements, various non-cash items, significant effects of retroactive tax legislation and changes in accounting guidance and other items which, in management’s judgment, are items that are considered to be outside the review of core operating results. In our non-GAAP presentation below, we made the following adjustments to our GAAP net income: (1) added back amortization of purchased intangible assets; (2) added back significant reorganization, restructuring and other related expenses; (3) added back impairment of investments, including impairment of ARS; (4) subtracted gain from changes in holdings, including revaluation of the previously held shares at the acquisition date when a business combination is achieved in stages (step-up); (5) added back impairment loss from discontinued operations; (6) excluded the impact of the cessation of a program with a foreign customer; and (7) excluded the income tax effects of the foregoing.
These non-GAAP measures are not based on any comprehensive set of accounting rules or principles. We believe that non-GAAP measures have limitations in that they do not reflect all of the amounts associated with our results of operations, as determined in accordance with GAAP, and that these measures should only be used to evaluate our results of operations in conjunction with the corresponding GAAP measures. Investors should consider non-GAAP financial measures in addition to, and not as replacements for or superior to, measures of financial performance prepared in accordance with GAAP.
58
Reconciliation of GAAP (Audited) to
Non-GAAP (Unaudited) Supplemental Financial Data
(U.S. dollars in millions)
|
2012
|
2011
|
2010
|
||||||||||
|
GAAP gross profit
|
815.9 | 732.0 | 797.9 | |||||||||
|
Adjustments:
|
||||||||||||
|
Amortization of intangible assets
|
24.2 | 30.9 | 25.0 | |||||||||
|
Cessation of program
(1)
|
– | 72.8 | – | |||||||||
|
Reorganization, restructuring and other related expenses
(2)
|
– | – | 12.8 | |||||||||
|
Non-GAAP gross profit
|
840.1 | 835.7 | 835.7 | |||||||||
|
Percent of revenues
|
29.1 | % | 29.7 | % | 31.3 | % | ||||||
|
GAAP operating income
|
203.1 | 115.7 | 207.4 | |||||||||
|
Adjustments:
|
||||||||||||
|
Amortization of intangible assets
|
49.3 | 57.3 | 47.7 | |||||||||
|
Cessation of program
(1)
|
– | 72.8 | – | |||||||||
|
Reorganization, restructuring and other related expenses
(2)
|
– | – | 16.4 | |||||||||
|
Impairment of investments
(3)
|
– | – | 1.3 | |||||||||
|
Gain from changes in holdings
(4)
|
– | – | (4.8 | ) | ||||||||
|
Non-GAAP operating income
|
252.3 | 245.8 | 268.0 | |||||||||
|
Percent of revenues
|
8.7 | % | 8.7 | % | 10.0 | % | ||||||
|
GAAP net income attributable to Elbit Systems’ shareholders
|
167.9 | 90.3 | 183.5 | |||||||||
|
Adjustments:
|
||||||||||||
|
Amortization of intangible assets
|
49.3 | 57.3 | 47.7 | |||||||||
|
Cessation of program
(1)
|
– | 72.8 | – | |||||||||
|
Reorganization, restructuring and other related expenses
(2)
|
– | 16.4 | ||||||||||
|
Impairment of investments
(3)
|
– | 0.5 | 1.3 | |||||||||
|
Gain from changes in holdings
(4)
|
(2.3 | ) | – | (17.6 | ) | |||||||
|
Adjustment of loss (gain) from discontinued operations, net
(5)
|
0.4 | 9.4 | (0.5 | ) | ||||||||
|
Related tax benefits
|
(8.9 | ) | (23.7 | ) | (8.9 | ) | ||||||
|
Non-GAAP net income attributable to Elbit Systems’ shareholders
|
206.3 | 206.6 | 221.9 | |||||||||
|
Percent of revenues
|
7.1 | % | 7.3 | % | 8.3 | % | ||||||
|
Non-GAAP diluted net EPS
|
4.9 | 4.8 | 5.1 | |||||||||
|
|
(1)
|
Adjustment of expenses related to cessation of a program, which resulted in write-off of inventories and other related costs.
|
|
|
(2)
|
Adjustment of reorganization, restructuring and other related expenses in 2010 were mainly due to write-off of inventories in the amount of approximately $13 million related to the acquisitions of Soltam and ITL.
|
|
|
(3)
|
Impairment of investments in 2011 was due to adjustment of impairment in available-for-sale marketable securities, and in 2010 were due to the impairment of intangible assets.
|
|
|
(4)
|
Adjustment of gain from changes in holdings includes the income from the sale of investments in affiliated companies of $2.3 million in 2012, a sale of Mediguide shares of $12.8 million in 2010 and a gain of $4.8 million from a revaluation of a previously held investment due to accounting treatment as a business combination achieved in stages in 2010.
|
|
|
(5)
|
Adjustment of loss from discontinued operations, net of tax and minority interest, related to impairment of a held-for-sale investment acquired during 2010, as part of the acquisition of the Mikal group of companies.
|
59
Directors and Executive Officers
Board of Directors (Board)
Our directors as of February 28, 2013 are as follows:
|
Name
|
Age
|
Director
Since
|
|||
|
Michael Federmann (Chairman)
|
69
|
2000
|
|||
|
Moshe Arad
|
78
|
2005
|
|||
|
Avraham Asheri
|
75
|
2000
|
|||
|
Rina Baum
|
67
|
2001
|
|||
|
David Federmann
|
38
|
2007
|
|||
|
Yigal Ne’eman
|
71
|
2004
|
|||
|
Yehoshua Gleitman (External Director)
|
63
|
2010
|
|||
|
Dov Ninveh
|
65
|
2000
|
|||
|
Dalia Rabin (External Director)
|
62
|
2010
|
The term of office of each director, other than the External Directors, expires at the annual general shareholders meeting to be held during 2013. The term of office for Yehoshua Gleitman as an External Director expires in March 2016, and the term of office for Dalia Rabin as an External Director expires in November 2013.
Michael Federmann
.
Michael Federmann has served as chairman of the Board since 2000. He has held managerial positions in the Federmann Group since 1969, and since 2002 he has served as chairman and CEO of Federmann Enterprises Ltd. (FEL). Currently, he also serves as chairman of the board of directors of Dan Hotels Ltd. (Dan Hotels). Mr. Federmann is chairman of the board of governors of the Hebrew University of Jerusalem (the Hebrew University). He serves as the president of the Israel - Germany Chamber of Industry and Commerce. Mr. Federmann holds a bachelor’s degree in economics and political science from the Hebrew University.
Moshe Arad
.
Moshe Arad served as vice president for external relations of the Hebrew University from 1994 to 2004. He currently serves as the chairman of the board of trustees of The Harry S. Truman Research Institute for the Advancement of Peace of The Hebrew University and is a member of the board of the Israeli branch of the Mandel Foundation of Cleveland, Ohio. From 1994 to 1999, he was a member of the board of directors of Elbit Ltd. During 1992 and 1993, Mr. Arad served as director general of the Israel Ministry of Communications. From 1990 to 1992, he was a member of the Tel-Aviv law firm of Herzog, Fox, Ne’eman. Mr. Arad served as Israel’s ambassador to the United States from 1987 to 1990 and as Israel’s ambassador to Mexico from 1983 to 1987. Ambassador Arad holds a bachelor’s degree in political science and international relations and an L.L.B. degree from the Hebrew University. Mr. Arad serves on the Audit Committee and the Financial Statements Review Committee of the Board.
Avraham Asheri
.
Avraham Asheri has served as an economic advisor and a director of several companies since 1998. He currently serves on the boards of directors of Elron Electronic Industries Ltd., Koor Industries Ltd., Mikronet Ltd. and Radware Ltd. Mr. Asheri was president and chief executive officer of Israel Discount Bank from 1991 until 1998, and executive vice president and member of its management committee from 1983 until 1991. Prior to that, he served for 23 years at the Israel Ministry of Industry and Trade and at the Israel Ministry of Finance, including as director general of the Israel Ministry of Industry and Trade, managing director of the Israel Investment Center and Trade Commissioner of Israel to the United States. Mr. Asheri holds a bachelor’s degree in economics and political science from the Hebrew University. Mr. Asheri serves as chair of the Corporate Governance and Nominating Committee and as a member of the Audit Committee, the Compensation Committee and the Financial Statements Review Committee of the Board. He is considered by the Board to have financial and accounting expertise under the Companies Law.
Rina Baum
.
Rina Baum is vice president for investments of FEL and since 1986 has served as director and general manager of Unico Investment Company Ltd. She serves as a director of Dan Hotels, Etanit Building Products Ltd. and Incotec Ltd., as well as in other managerial positions within the Federmann Group. She also serves as a director in Harel-PIA Mutual Funds Management Company Ltd. Mrs. Baum holds an L.L.B. degree from the Hebrew University.
60
David Federmann
. David Federmann has served in various management capacities in FEL since 2000. He currently serves as chairman of the board of Freiberger Compound Materials GmbH (Freiberger) in Freiberg, Germany and as a member of the boards of directors of Dan Hotels and BGN Technologies (the technology transfer company of Ben-Gurion University). David Federmann is the son of Michael Federmann, chairman of the Board. Mr. Federmann holds a bachelor’s degree in mathematics and philosophy from New York University.
Dr. Yehoshua Gleitman (External Director).
Dr. Yehoshua (Shuki) Gleitman has served since 2001 as the managing partner of Platinum VC, a venture capital firm. He currently serves as chairman of the board of directors of Capital Point Ltd. and is a director of Teuza – A Fairchild Technology Venture Ltd. From 2000 until 2005, he was the chief executive officer and a director of SFKT Ltd. From 1997 until 1999, Dr. Gleitman was the chief executive officer of Ampal-American Israel Corporation. Prior to that he served in various senior management positions in the Israeli government and in Israeli industry, including as director general and chief scientist of the Israel Ministry of Industry and Trade, chairman of the U.S.-Israel Industrial R&D Foundation, joint chairman of the U.S.-Israel Science and Technology Commission, managing director of AIMS Ltd., vice president and general manager of Elop Electro-Optic Industries Ltd.’s (Elop) marine and aerial operations and head of the Laser Branch of the Israel Ministry of Defense. Dr. Gleitman serves as the honorary consul general of Singapore to Israel, is chairman of the executive board of Holon Institute of Technology and is a member of the executive board of Tel-Aviv University. Dr. Gleitman holds bachelors of science, master of science and PhD degrees in physical chemistry from the Hebrew University. Dr. Gleitman serves as chair of the Audit Committee and of the Financial Statements Review Committee and as a member of the Corporate Governance and Nominating Committee and the Compensation Committee of the Board. He is considered by the Board to have financial and accounting expertise under the Companies Law.
Yigal Ne’eman
.
Yigal Ne’eman has served as the general manager of the Academic College of Israel in Ramat Gan since 2010. From 1994 to 2010, he served as the chairman and president of the Israel College. From 1989 to 1993, he served as chairman and as a shareholder of several industrial, commercial and service companies. Mr. Ne’eman served as the president and CEO of Tadiran Ltd (Tadiran) from 1981 to 1989. During that period he also served as chairman of the board of directors of Elisra Electronic Systems Ltd. and of Elop. Prior to that he held a number of management positions in the control and finance departments of Tadiran. Mr. Ne’eman completed his accounting studies at the Hebrew University and is a Certified Public Accountant. Mr. Ne’eman serves as a member of the Audit Committee, the Financial Statements Review Committee and the Corporate Governance and Nominating Committee of the Board. He is considered by the Board to have financial and accounting expertise under the Companies Law.
Dov Ninveh
. Dov Ninveh has served as chief financial officer and a manager in FEL since 1994 and as general manager of Heris Aktiengesellschaft since August 2012. He serves as a director of Dan Hotels and Etanit Ltd. and as a member of the board of Freiberger. Mr. Ninveh served as a director of Elop from 1996 until 2000. From 1989 to 1994, he served as deputy general manager of Etanit Building Products Ltd. Mr. Ninveh holds a bachelor’s degree in economics and management from the Israel Institute of Technology (the Technion).
Dalia Rabin (External Director)
.
Dalia Rabin has served since 2002 as the chairperson of the Yitzhak Rabin Center, a national institute dedicated to ensuring that former Prime Minister and Minister of Defense Yitzhak Rabin’s legacy continues to impact Israeli society through experiential educational programming, a national archive and a museum. Mrs. Rabin was a member of the Israeli government from 1999 until 2002. She was elected to the Knesset as a member of the Center Party in 1999 and served as chairperson of the Ethics Committee. She also served on the Constitution, Law and Justice Committee, the Committee for the Advancement of the Status of Women, the State Control Committee and the Committee for the Advancement of the Status of the Child. In 2001, Mrs. Rabin was appointed Deputy Minister of Defense. She resigned in 2002 to head the Rabin Center. Prior to her election to the Knesset, Mrs. Rabin served as the legal advisor of the professional associations of the General Federation of Labor (the Histadrut). She also served for 14 years in the Tel-Aviv District Attorney’s Office in the Civil Division, specializing in labor law. Mrs. Rabin holds an L.L.B. degree from Tel-Aviv University. Mrs. Rabin serves as chair of the Compensation Committee and as a member of the Audit Committee, the Financial Statements Review Committee and the Corporate Governance and Nominating Committee of the Board.
61
Executive Officers
Our executive officers (the President and CEO and the management officials reporting to the President and CEO) as of February 28, 2013 are as follows:
|
Name
|
Age
|
Position
|
||
|
Joseph Ackerman
|
63
|
President and Chief Executive Officer
|
||
|
Bezhalel Machlis
|
49
|
Executive Vice President - President and CEO Designee
|
||
|
Elad Aharonson
|
39
|
Executive Vice President and General Manager – UAS Division
|
||
|
Jonathan Ariel
|
56
|
Executive Vice President and Chief Legal Officer
|
||
|
David Block Temin
|
57
|
Executive Vice President, Chief Compliance Officer and Senior Counsel
|
||
|
Adi Dar
|
41
|
Executive Vice President and General Manager – Electro-Optics Elop Division
|
||
|
Itzhak Dvir
|
65
|
Executive Vice President and Chief Operating Officer
|
||
|
Jacob Gadot
|
65
|
Executive Vice President – International Marketing and Business Development
|
||
|
Joseph Gaspar
|
64
|
Executive Vice President and Chief Financial Officer
|
||
|
Zeev Gofer
|
60
|
Executive Vice President – Strategic and Business Development - North America
|
||
|
Dalia Gonen
|
61
|
Executive Vice President – Human Resources
|
||
|
Ran Hellerstein
|
62
|
Executive Vice President and Co-General Manager – Aerospace Division
|
||
|
Edgar Maimon
|
57
|
Executive Vice President and General Manager – EW and SIGINT Elisra Division
|
||
|
Ilan Pacholder
|
58
|
Executive Vice President – Mergers and Acquisitions, Offset and Financing
|
||
|
Marco Rosenthal
|
66
|
Executive Vice President - Corporate Shared Services
|
||
|
Haim Rousso
|
66
|
Executive Vice President – Engineering and Technology Excellence
|
||
|
Gideon Sheffer
|
64
|
Executive Vice President – Strategic Planning and Business Development – Israel
|
||
|
Yoram Shmuely
|
52
|
Executive Vice President and Co-General Manager – Aerospace Division
|
||
|
Udi Vered
|
55
|
Executive Vice President and General Manager – Land and C4I Division
|
62
Joseph Ackerman
.
Joseph Ackerman was appointed as President and Chief Executive Officer in 1996. In August 2012, he announced his retirement effective March 31, 2013. From 1996 to 2004, he served as a member of our Board. From 1994 to 1996, he served as senior vice president and general manager of Elbit Ltd.’s defense systems division. Mr. Ackerman joined Elbit Ltd. in 1982 and held various management positions, including general manager – EFW, senior vice president – operations, vice president – operations and vice president – advanced battlefield systems. He serves as chairman or as a director on the boards of many of our affiliated companies. Mr. Ackerman holds a bachelor of science degree in aeronautical engineering from the Technion and was awarded an honorary doctorate by the Technion.
Bezhalel Machlis
.
Bezhalel Machlis was designated in August 2012 to succeed Joseph Ackerman as the Company’s President and CEO, effective April 1, 2013. From 2008 until December 2012, he served as executive vice president and general manager – land and C4I division, after serving as corporate vice president and general manager – land systems and C4I since 2004. In 2003, he served as corporate vice president and general manager – ground, C4I and battlefield systems. From 2000 until 2002, he served as vice president – battlefield and information systems. Mr. Machlis joined Elbit Ltd. in 1991 and held various management positions in the battlefield and information systems area. Prior to that, he served as an artillery officer in the IDF, where he holds the rank of colonel (reserves). Mr. Machlis holds a bachelor of science degree in mechanical engineering and a bachelor of arts degree in computer science from the Technion and an MBA from Tel-Aviv University. He is a graduate of Harvard University Business School's Advanced Management Program.
Elad Aharonson
. Elad Aharonson was appointed as Executive Vice President and General Manager – UAS Division in 2011, after serving as vice president – UAV systems since 2009. He joined Elbit Systems in 2004 and held various senior program management positions relating to UAS. Prior to that, Mr. Aharonson served as an officer in the IDF holding command positions in the Artillery Branch and in the Ground Forces’ UAV unit. Mr. Aharonson holds an L.L.B. degree in law and a bachelor’s degree in business administration from the Hebrew University.
Jonathan Ariel
. Jonathan Ariel was appointed as Executive Vice President and Chief Legal Officer in January 2012, after serving as senior vice president and general counsel since 2008. He joined Elbit Systems in 1996 and has held several positions within the legal department, including vice president and general counsel of Elop. Prior to joining Elbit Systems, Mr. Ariel served as a legal advisor both in-house and in private law firms in Israel and the U.S. Mr. Ariel holds an L.L.B degree in law from Tel-Aviv University and is admitted to the Israeli Bar.
David Block Temin.
David Block Temin has served as Executive Vice President, Chief Compliance Officer and Senior Counsel since January 2012, after serving as executive vice president, chief legal officer and chief compliance officer since 2008, as corporate vice president since 2000 and as general counsel since 1996. From 1987 to 1996, he was a legal advisor to Elbit Ltd. Prior to that, Mr. Block Temin was an attorney with law firms in New York City. Mr. Block Temin received a juris doctor degree as well as a master of arts degree in international relations from Stanford University and holds a bachelor of arts degree in political science from the University of Maryland. He is admitted to the Israeli and New York bars.
Adi Dar.
Adi Dar was appointed as Executive Vice President and General Manager – Electro-Optics Elop Division in 2009. From 2006 until his current appointment he served as Elop’s vice president for business development. Prior to that he served in a number of management positions in Elbit Systems, which he joined in 2002. From 1999 until 2002, he was vice president for business development and marketing at Elron Telesoft Ltd. Mr. Dar holds a bachelors degree in industrial engineering from the Technion and an MBA from Tel-Aviv University.
Itzhak Dvir.
Itzhak Dvir was appointed as an Executive Vice President in 2008 and has served as Chief Operating Officer since 2004. From June to December 2010, he also served as general manager (acting) of the UAS Division. He was appointed as a corporate vice president in 2000. Mr. Dvir served as general manager – UAV, tactical and security systems from 2003 until 2004. From 2000 through 2002, he was general manager – C4I and battlefield systems. From 1996 until 2000, he was vice president and division manager – UAV and C3 division. Mr. Dvir joined Elbit Ltd. in 1989 and held various management positions, including vice president – UAV division, vice president – advance battlefield systems division and marketing director – battlefield systems division. Prior to that he served as a career officer in the IAF, retiring with the rank of colonel. Mr. Dvir holds a bachelor of science degree in aeronautical engineering from the Technion and a master of science degree in aeronautical engineering from the U.S. Air Force Institute of Technology at Wright Patterson Air Force Base.
63
Jacob Gadot
.
Jacob Gadot was appointed as Executive Vice President – International Marketing and Business Development in 2009. From 2008 until his current appointment he was executive vice president – mergers and acquisitions, after serving as corporate vice president – mergers and acquisitions since 2000. He also served as chief technology officer from 2001 until 2005. Mr. Gadot held the position of vice president – mergers and acquisitions from 1998 to 2000 and vice president – business development from 1996 to 1998. Mr. Gadot joined Elbit Ltd. in 1983 and held various management positions, including vice president – international marketing and head of the airborne division. Prior to that, he worked for Motorola Israel, after serving for ten years as an officer in the IAF. Mr. Gadot holds a bachelor of science degree in electrical engineering from the Technion.
Joseph Gaspar
.
Joseph Gaspar was appointed as an Executive Vice President in 2008 and as Chief Financial Officer in 2001. He was appointed as a corporate vice president in 2000 and served as corporate vice president – strategy, technology and subsidiaries from 2000 until 2001. From 1996 until 2000, he held the position of corporate vice president, marketing and business development of Elop. Mr. Gaspar joined Elop in 1975 and held several management positions, including vice president and general manager of Elop’s optronics product division and co-manager of an Elop subsidiary in the United States. Mr. Gaspar holds a bachelor of science degree from the Technion in electronic engineering with advanced studies in digital signal processing and communication.
Zeev Gofer.
Zeev Gofer was appointed as Executive Vice President – Strategic and Business Development – North America in 2009. From 2008 until his current appointment he was executive vice president – business development and marketing, after serving as corporate vice president – business development and marketing since 2003. He previously served as corporate vice president and as co-general manager – aircraft and helicopter upgrades and systems from 2000 until 2003. From 1999 until 2000, he was vice president – aircraft upgrades and airborne systems division, having served as division manager since 1996. He joined Elbit Ltd. in 1982 and held various management positions, including director of the aircraft upgrade division, director of a major aircraft upgrade program, director of avionics system engineering and technical manager of the Lavi aircraft avionics program. Mr. Gofer holds bachelor and master of science degrees in electronic engineering from the Technion and a master of science of management degree from the Polytechnic University of New York.
Dalia Gonen
.
Dalia Gonen was appointed as Executive Vice President – Human Resources in 2008 after serving as vice president – human resources from 2000. She became director of human resources in 1996. Ms. Gonen joined Elbit Ltd. in 1971 and held various positions in the human resources department. Ms. Gonen holds a bachelor of arts degree in sociology from Haifa University and a master of science of management degree from the Polytechnic University of New York.
Ran Hellerstein
.
Ran Hellerstein was appointed as Executive Vice President and Co-General Manager – Aerospace Division in 2008. He has announced his retirement and effective March 31, 2013 will stepdown from his current position. Mr. Hellerstein served as corporate vice president and co-general manager – aircraft and helmet systems since 2003. Mr. Hellerstein served as corporate vice president and co-general manager – aircraft and helicopter upgrades and systems from 2000 until 2003. From 1996 until 2000, he served as vice president – development and engineering division, having served as division manager since 1993. Mr. Hellerstein joined Elbit Ltd. in 1978 and served in various management positions, including manager of the engineering division, department manager, technical manager and systems engineer. Mr. Hellerstein holds bachelor and master of science degrees in electrical engineering from the Technion.
Edgar Maimon.
Edgar Maimon was appointed as Executive Vice President and General Manager – EW and SIGINT Elisra Division in February 2013. From 2005 until his current appointment Mr. Maimon served as vice president of marketing and business development at Elbit Systems EW and SIGINT – Elisra Ltd. (Elisra). He joined Elisra in 2004. Prior to that Mr. Maimon served for 26 years in the IAF, where he holds the rank of colonel (reserves). He served as the head of the IAF’s C4I systems engineering department and held several additional senior positions in the IAF. Mr. Maimon holds a bachelor of science degree in electronic engineering from Ben Gurion University.
Ilan Pacholder.
Ilan Pacholder was appointed as Executive Vice President – Mergers and Acquisitions in 2009, in addition to his position as Executive Vice President – Offset and Financing to which he was appointed in 2008. During 2007, he served as vice president and chief financial officer of Tadiran Communications Ltd. Mr. Pacholder served as corporate secretary and vice president – finance and capital markets of Elbit Systems from 2003 until 2006. From 2001 until 2003, he served as vice president – finance. Mr. Pacholder joined Elbit Ltd. in 1994 and held various senior positions in the finance department. Prior to joining Elbit Ltd. he served as the chief financial officer for Sanyo Industries in New York. Before that Mr. Pacholder worked for Bank Leumi in New York and held the position of vice president in the international and domestic lending departments. Mr. Pacholder holds a bachelor of arts degree in accounting and economics from Queens College in New York and an MBA in finance and investments from Adelphi University.
64
Marco Rosenthal
.
Marco Rosenthal was appointed as Executive Vice President - Corporate Shared Services in 2011, having served prior to that as executive vice president and co-general manager – technologies and operations division from 2008, and as corporate vice president and co-general manager – technologies and operations division since 2005. He served as corporate vice president – manufacturing and purchasing from 2001 until 2005, having served from 1999 to 2001 as vice president – operations and general manager of the Karmiel facility. From 1996 to 1999, he served as vice president – material. Mr. Rosenthal joined Elbit Ltd. in 1975 and held various management positions, including director of the sales department. Mr. Rosenthal holds a degree in technical engineering from the Technion and a degree in business management from Haifa University.
Haim Rousso
.
Haim Rousso was appointed as Executive Vice President – Engineering and Technology Excellence in 2009. Prior to that he served from 2008 as executive vice president and general manager – electro-optics Elop division after serving as corporate vice president and general manager of Elop since 2000. He held various management positions in Elop since 1972. Mr. Rousso holds bachelor and master of science degrees in electrical engineering from the Technion.
Gideon Sheffer
.
Gideon Sheffer was appointed as Executive Vice President – Strategic Planning and Business Development – Israel in August 2009. From 2008 until his current position he served as executive vice president – strategic planning, after serving as corporate vice president – strategic planning since 2001. Prior to that he served as acting head of Israel’s National Security Council and as national security advisor to former Prime Minister Ehud Barak. In 1998, he completed 32 years of service in the IDF, retiring with the rank of major general. From 1995 to 1998, he served on the general staff as head of the IDF’s human resources branch. Before that, he served as deputy commander of the IAF. Mr. Sheffer held a number of command positions in the IAF after serving as a fighter aircraft and helicopter pilot. Mr. Sheffer holds a bachelor’s degree in Israel studies from Bar Ilan University and is a graduate of the Harvard University Business School’s Advanced Management Program.
Yoram Shmuely.
Yoram Shmuely was appointed as Executive Vice President and Co-General Manager – Aerospace Division in 2008 and effective March 31, 2013, will assume the position of sole General Manager of the Aerospace Division. Mr. Shmuely served as corporate vice president and co-general manager – airborne and helmet systems since 2003. He served as corporate vice president and general manager – helmet mounted systems from 2000 until 2003. From 1998 until 2000, he was vice president – helmet mounted systems division. From its founding in 1996 until 1998, he served as president of VSI. Mr. Shmuely joined Elbit Ltd. in 1990 and served as director of Elbit Ltd.’s helmet mounted display business. He served as a fighter aircraft pilot in the IAF. Mr. Shmuely holds a bachelor of science degree in electronic engineering from the Technion.
Udi Vered
.
Yehuda (Udi) Vered was appointed Executive Vice President and General Manager – Land and C4I Division in January 2013. From 2009 until his current appointment Mr. Vered served as executive vice president – service solutions as well as vice president – marketing for the land and C4I division. Prior to that, since 2004 he served as chief financial officer and vice president for contracts and sales of the land and C4I division. Mr. Vered joined Elbit Systems in 2003 as vice president for contracts and sales and chief financial officer – ground, C4I and battlefield systems. Before that, he served as an aircrew officer in the IAF, where he holds the rank of colonel (reserves). Mr. Vered holds a bachelor of arts degree in management and economics from Tel-Aviv University, an MBA from Ben Gurion University and is a graduate of the Harvard University Business School’s Advanced Management Program.
President and CEO of Elbit Systems of America
Elbit Systems of America’s President and CEO reports to the board of directors of Elbit Systems of America in accordance with the provisions of the Special Security Agreement with the U.S. Department of Defense. (See Item 4. Information on the Company – U.S. Subsidiaries.) Raanan Horowitz serves as President and CEO of Elbit Systems of America.
65
Raanan Horowitz.
Raanan Horowitz was appointed President and Chief Executive Officer of Elbit Systems of America in 2007. He served as executive vice president and general manager of EFW from 2001 until his current appointment. From 1991 until 2001, Mr. Horowitz held various management positions with EFW and other U.S. subsidiaries of the Company. From 1989 to 1991, he served as a senior program manager for Elbit Ltd. Mr. Horowitz serves on the executive committee of the board of governors of the Aerospace Industries Association and is a member of the executive committee of the national board of directors of the Leukemia and Lymphoma Society. Mr. Horowitz holds an MBA from the Seidman School of Business of Grand Valley State University in Allendale, Michigan. He also holds a master of science degree in electrical engineering and a bachelor of science degree in mechanical engineering from Tel-Aviv University.
Compensation of Directors and Executive Officers
The following table sets forth the aggregate compensation paid to all of our directors and executive officers as a group for the fiscal year ended December 31, 2012:
|
Salaries, Directors’ Fees Commissions and Bonuses
|
Pension, Retirement and Similar Benefits
|
|||||||
|
(U.S. dollars in thousands
)
|
||||||||
|
All directors (consisting of 9 persons)
|
$
|
296
|
*
|
$
|
–
|
|||
|
All executive officers (consisting of 19 persons)
|
$
|
11,580
|
**
|
$
|
1,003
|
|||
|
|
*
|
Elbit Systems’ shareholders at the annual general shareholders meeting held in 2004 approved payment to directors thereafter in accordance with maximum regulatory rates payable to External Directors under Israeli law for companies similarly classified based on their shareholding equity. These rates were linked to the Israeli consumer price index. At an extraordinary general shareholders meeting held in 2008, our shareholders approved increasing compensation, so long as such approval has not been replaced or revoked by the shareholders. to our External Directors and to other directors meeting the director independence criteria of Nasdaq, each of whom has additional duties under applicable non-Israeli law. The increased compensation was consistent with amendments to Israeli law regarding compensation to External Directors who serve on the boards of “dual listed” companies, such as Elbit Systems, and are subject to corresponding additional duties.
|
|
|
As a result, External Directors and other such “independent” directors are and will be entitled, so long as the above-mentioned resolution adopted in 2008 is in effect, to an annual fee of NIS 114,775 (equal to approximately $29,858) and a per meeting fee of 2,525 NIS (equal to approximately $656), which reflect the fees levels previously approved at the 2008 Shareholders’ Extraordinary General Meeting and linked to the Israeli consumer price index. The other directors are paid the following compensation: an annual fee of NIS 57,200 (equal to approximately $14,880) and a per meeting fee of NIS 2,158 (equal to approximately $561), which reflect the fees levels previously approved at the 2004 annual general shareholders meeting and linked to the Israeli consumer price index.
|
|
|
In compliance with the Companies Law, our Audit Committee and the Board approved, in meetings held in 2011 in accordance with the Israeli Companies Regulations (Relief from Related Parties’ Transactions), 5760-2000 (the “Regulations”), payment of director’s compensation to Michael Federmann and to David Federmann in amounts equal to the compensation paid by the Company to other directors of the Company who are not “independent” directors, as specified above. We currently intend to maintain such compensation rates to such directors. Compensation payments to directors are made either directly to the director or to his or her employing company.
|
|
|
**
|
We recorded an amount of approximately $1.2 million in 2012 as compensation costs related to stock options granted to our executive officers under our 2007 Employee Stock Option Plan. (See below “Share Ownership – Elbit Systems’ Stock Option Plans.”)
|
In August 2012 our Board approved a “Phantom” Option Retention Plan for Senior Officers (the Plan). The purpose of the Plan is to provide an incentive to retain applicable senior officers of Elbit Systems and certain of our subsidiaries by strengthening the alignment of the Plan recipients’ financial interests with those of the Company and our shareholders. See Item 18. Financial Statements – Note 21(I). We recorded an amount of approximately $0.3 million in 2012 as compensation costs related to the tranches of phantom options granted to our executive officers under the Plan.
|
|
Pursuant to recent amendments to the Companies Law, Elbit Systems is required to adopt a compensation policy and follow certain approval requirements with respect to the compensation of our directors and executive officers. See below “Board of Directors – Compensation Committee” and Item 10. Additional Information – General Provisions of Israeli Law and Related Provisions of Articles of Association – Office Holders.
|
66
|
Board Practices
|
Appointment of Directors
Our directors are elected by the shareholders at the annual general shareholders meeting. They hold office until the next annual general shareholders meeting, which is held at least once every calendar year but not more than 15 months after the previous general shareholders meeting. Between annual general shareholders meetings our Board may appoint new directors to fill vacancies; however, new External Directors must be elected at a general shareholders meeting as described under “External Directors” below. Our Articles of Association authorize a maximum of 17 and a minimum of five directors.
The Companies Law requires the board of directors of a public company, after considering the company’s type and size and the scope and complexity of its activities, to determine the minimum number of directors on the board having “financial and accounting expertise” as defined in the Companies Law. Our Board has adopted a policy pursuant to which it will include a minimum of two directors having financial and accounting expertise as defined under the Companies Law. Currently our Board has three directors who are considered by the Board to have financial and accounting expertise: Dr. Gleitman, Mr. Asheri and Mr. Ne’eman. In addition, the Companies Law provides that a person will not be elected and will not serve as a director in a public company if he or she does not have the required qualifications and the ability to dedicate an appropriate amount of time for the performance of his or her director position in the company, taking into consideration, among other factors, the special needs and size of the company. A general shareholders meeting of a company whose shares are publicly traded, at which the election of a director is to be considered, will not be held unless the nominee has declared to the company that he or she complies with the above-mentioned requirements, and the details of his or her applicable qualifications are provided, and in case such nominee is an "Independent Director" as defined in the Companies Law, that such nominee has also declared that he or she complies with the independence criteria under the Companies Law. Each of our elected directors has declared to our Board that he or she complies with the required qualifications under the Companies Law for appointment as a member of our Board, detailing his or her applicable qualifications, and that he or she is capable of dedicating the appropriate amount of time for the performance of his or her role as a member of our Board. In addition, each of our Independent Directors also has declared that he or she complies with the criteria of an Independent Director under the Companies Law.
The current External Directors on our Board were each appointed at a general meeting of shareholders, with their terms expiring as described under “External Directors” below. The other seven current directors were appointed at the annual general meeting of shareholders held in November 2012. There are no service contracts or similar arrangements with any director that provide for benefits upon termination of directorship.
Nasdaq’s director independence and related rules applicable to boards of directors apply to Elbit Systems. Under these rules, our Board is required to meet the Nasdaq director independence criteria. Also applicable are certain other rules regarding independent directors serving on a director nomination committee and the manner for approving the compensation to Elbit Systems’ Chief Executive Officer. Directors on our Board are recommended for appointment or election by the Board’s Corporate Governance and Nominating Committee. (See below “Corporate Governance and Nominating Committee.”)
Substitute Directors.
The Articles of Association provide that any director may appoint another person to serve as a substitute director. A substitute director must be qualified under the Companies Law to serve as a substitute of the relevant director, and, under the Companies Law, in case the substituted director is an "Independent Director" as defined in the Companies Law, the substitute director must also comply with the requirements of the Companies Law for Independent Directors. If his or her appointment is for more than one meeting it will be subject to the approval of the Board. Such person may not act as a substitute director for more than one director at the same time. In addition, a Board committee member may not substitute for another Board committee member in meetings of the applicable committee. The same rules, including compensation, will apply to a substitute director as to the director who appointed him or her, and the substitute director may participate in Board and Board committee meetings in the same manner as the appointing director (subject to any applicable independence criteria). Subject to the Companies Law, a director who has appointed a substitute director may revoke the appointment at any time. In addition, the office of a substitute director will be vacated at any time that the office of the director who appointed the substitute is vacated for any reason. Any appointment or revocation of the appointment of a substitute director will be made by notice in writing to the substitute director and Elbit Systems. The appointment or revocation, as the case may be, will become effective on the later of the date of receipt of the above notice or the date fixed in the notice.
67
External Directors
Under the Companies Law publicly held Israeli companies are required to appoint at least two “External Directors.” Among other requirements, for each publicly held company such as Elbit Systems, that is considered to have a controlling shareholder, a person may serve as an External Director:
|
|
(A)
|
if that person is not a relative of the controlling shareholder of that company, or if that person (and each of that person’s relatives, partners and employers), or any person to whom he or she is subordinated (directly or indirectly), or any entity controlled by that person, did not have, at any time during the two years preceding that person’s appointment as an External Director, any affiliation (as defined in the Companies Law) with any of:
|
|
|
(1) the applicable company;
|
|
|
(2) the controlling shareholder of the applicable company or any of his or her relatives;
|
|
|
(3) the entities controlling the company;
|
|
|
(4) the entities controlled by the company; or
|
|
|
(5) the entities controlled by the company’s controlling shareholders;
|
|
|
(B)
|
if and so long as:
|
|
(1)
|
no conflict of interest exists or may exist between his or her responsibilities as a member of the board of directors of the respective company and his or her other positions or business activities; or
|
|
(2)
|
such position or business activities does not impair his or her ability to serve as a director; and
|
|
|
(C)
|
if and so long as:
|
|
(1)
|
that person (and each of that person’s relatives, partners and employers, or any person to whom he or she is subordinated (directly or indirectly) or any entity controlled by that person) has no business or professional relationships with any of the persons or entities mentioned in (A) above, even if such relationship is not on a regular basis (other than a negligible relationship); and
|
|
(2)
|
no other consideration except as permitted under the Companies Law is paid to that person in connection with that person's position as a director in the relevant company.
|
In general, at least one External Director must have “financial and accounting expertise”, and the other External Director(s) must have “professional competence” as described below. However, in companies such as Elbit Systems that are “dual listed” (for example traded on a stock exchange in both Israel and the U.S.) if one or more other directors who meet the independence criteria applicable to members of the audit committee under the foreign applicable law (including stock exchange rules) have been determined by the board of directors to have “financial and accounting expertise” then it is permissible for any or all of the External Directors to have only “professional competence” as described below. Under the relevant regulations of the Companies Law, a director has “financial and accounting expertise” if he or she, based on his or her education, experience and qualifications, is highly skilled in respect of, and understands, business and accounting matters and financial statements, in a manner that enables him or her to have an in-depth understanding of the company’s financial statements and to stimulate discussion with respect to the manner in which the financial data is presented.
68
The evaluation of the “financial and accounting expertise” of a director is to be made by the board of directors taking into account the parameters specified in the relevant regulations of the Companies Law. A director has “professional competence” if he or she (1) has an academic degree in either economics, business administration, accounting, law or public administration or an academic degree in an area relevant to the company’s business, or (2) has at least five years experience in a senior position in the business management of any corporate entity with a substantial scope of business, in a senior position in public service or in the field of the applicable company’s business. The evaluation of the professional competence of a director is to be made by the board of directors.
According to the Companies Law, External Directors serve for a three-year term following which they may stand for re-election for one additional term, or up to two additional terms (if the articles of association of the company so allows) of three years each. Re-election of an External Director for each additional period beyond the first period requires that he or she: (i) is recommended for re-election by one or more shareholders holding at least 1% of all voting rights of the relevant company; or (ii) is recommended for re-election by the board of directors of the relevant company, and, in each case the nomination is approved by the general meeting of shareholders of the relevant company with the applicable majority requirements as provided by the Companies Law. At a general meeting of shareholders held in 2011, our shareholders approved relevant amendments to our Articles of Association, consistent with the above, allowing External Directors of the Company to be re-elected up to two additional terms of service as permitted by the Companies Law.
In addition, External Directors in companies such as Elbit Systems that are “dual listed” may stand for re-election to additional terms of up to three years each beyond the first three terms, subject to meeting the following conditions:
|
|
(1)
|
the audit committee and the board both determine that based upon the expertise and the unique contribution of the External Director to the work of the board and its committees, his or her re-election for an additional term is for the benefit of the company;
|
|
|
(2)
|
his or her re-election is recommended by one or more shareholders holding at least 1% of all voting rights of the relevant company;
|
|
|
(3)
|
his or her re-election is approved at a general shareholders meeting by the special majority required for nomination of External Directors under the Companies Law; and
|
|
|
(4)
|
his or her terms of service as an External Director and the considerations of the audit committee and the board regarding his or her re-election were presented to the general meeting of shareholders prior to the vote on such approval.
|
At a general meeting of shareholders held in 2008, our shareholders approved an amendment to our Articles of Association, consistent with the above, allowing External Directors of the Company to be elected to more than three terms of service. Any committee of the Board must include at least one External Director, and all External Directors must be members of the Audit Committee and the Compensation Committee.
Yehoshua Gleitman and Dalia Rabin currently serve as our Board’s External Directors. Dr. Gleitman’s term of office ends in March 2016, and the term of office of Dalia Rabin ends in November 2013. Yehoshua Gleitman was determined by the Board to have “financial and accounting expertise” under Israeli law, and Dalia Rabin was determined by the Board to have the applicable “professional competence” to serve as an External Director.
Audit Committee.
Yehoshua Gleitman (Chair), Moshe Arad, Avraham Asheri, Yigal Ne’eman and Dalia Rabin are members of the Audit Committee. The Audit Committee operates in accordance with an Audit Committee Charter that provides the framework for its oversight functions consistent with Israeli and U.S. legal and regulatory requirements. All of the members of the Audit Committee meet the applicable requirements of the Companies Law and have been determined to be independent as defined by the applicable Nasdaq rules and those of the U.S. Securities Exchange Commission (SEC). The Audit Committee meets from time to time in executive sessions and also conducts annual assessments of the sufficiency of its Charter and of the Committee’s compliance with its obligations. (See Item 10. Additional Information – General Provisions of Israeli Law and Related Provisions – Internal Auditor and Audit Committee; Item 16A. Audit Committee – Financial Expert and Item 16D. Exemptions from Listing Standards for Audit Committees.)
69
Financial Statements Review Committee.
Yehoshua Gleitman (Chair), Moshe Arad, Avraham Asheri, Yigal Ne’eman and Dalia Rabin are members of the Board’s Financial Statements Review Committee, which was established in 2011. Pursuant to the Israeli Companies Regulations the financial reports of a public company such as Elbit Systems may be brought for discussion and approval of the board only after such committee has discussed and formulated recommendations to the board in connection with: (1) the valuations and estimates used in connection with the financial statements; (2) the internal controls related to financial reporting; (3) the completeness and appropriateness of disclosure in the financial statements; (4) the accounting policy adopted and accounting treatment applied in the material matters of the company; and (5) valuations, including the assumptions and estimates underlying them, on which data in the financial statements is provided. The chairperson of the committee must be an External Director, and other members of the committee must be directors who meet certain independence requirements, and, among other criteria, must be able to read and understand financial statements, with at least one of the members having “financial and accounting expertise” (as defined above). Yehoshua Gleitman, Avraham Asheri and Yigal Ne’eman have been determined by the Board to have “financial and accounting expertise”.
Compensation Committee
Dalia Rabin
(Chair), Avraham Asheri and Yehoshua Gleitman are members of the Board’s Compensation Committee. All of our Compensation Committee members have been determined to be eligible to be members of a compensation committee in accordance with the recent amendments to the Companies Law and also have been determined to be independent as defined by the applicable Nasdaq rules and those of the SEC.
Under recent amendments to the Companies Law, which provide for new procedures relating to the approval of the terms of office and employment of Office Holders of and the formulation of a compensation policy applicable to Israeli public companies, the compensation committee of a public company, such as Elbit Systems, is required to consist of at least three members and all of the external directors must be members of the committee (one of which to be appointed as the chairperson) and constitute the majority thereof. The remaining members must be directors who qualify to serve as members of the audit committee as defined in the Companies Law. In addition to its other roles , under the amendments to the Companies Law the compensation committee of a public company such as Elbit Systems is required:
|
|
(i)
|
to recommend to the board of directors the compensation policy for the company's Office Holders to be adopted by the company and to recommend to the board of directors, once every three years, regarding any extension or modifications of the current compensation policy that had been approved for a period of more than three years;
|
|
|
(ii)
|
from time to time to recommend to the board of directors any updates required to the compensation policy and examine the implementation thereof;
|
|
|
(iii)
|
to determine, with respect to the company's Office Holders, whether to approve their terms of office and employment in situations that require the approval of the compensation committee in accordance with the Companies Law; and
|
|
|
(iv)
|
in certain situations described in the Companies Law, to determine whether to exempt the approval of terms of office of the CEO of the company from the requirement to obtain shareholder approval.
|
According to the Companies Law amended as described above, terms of service and employment (including cash and equity-based compensation, exemption from liability, indemnification, D&O insurance and other benefits and payments related to the service and employment) of a public company’s Office Holders must be approved also by the board as a whole and, with respect to terms of service and employment of the CEO or a director, also by the company's shareholders in accordance with the majority requirements of the Companies Law. (For further information see Item 10. Additional Information – General Provisions of Israeli Law and Related Provisions of Articles of Association– Office Holders.)
70
Corporate Governance and Nominating Committee.
Avraham Asheri (Chair), Yehoshua Gleitman, Yigal Ne’eman and Dalia Rabin are members of the Board’s Corporate Governance and Nominating Committee. This Committee operates in accordance with a Corporate Governance and Nominating Committee Charter that specifies its oversight functions consistent with Israeli and U.S. legal and regulatory requirements. The role of the Corporate Governance and Nominating Committee is to assist the Board in fulfilling its responsibilities with respect to the qualification of candidates to become Board members and to monitor compliance with corporate governance requirements applicable to Board members. All of the members of the Corporate Governance and Nominating Committee have been determined to be independent as defined by the applicable Nasdaq rules and those of the SEC. A nominee to our Board must have such experience in business or financial matters as would make such nominee an asset to the Board. In recommending director candidates, our Corporate Governance and Nominating Committee takes into consideration such factors as it deems appropriate based on our current needs. These factors may include: professional and person ethics and integrity; business, professional and industry knowledge, sophistication and contacts; the ability to make informed and independent judgments on a wide range of issues; relevant skills and experience demonstrated through business, professional, charitable or civic affairs; and the candidate’s ability to devote the required time and effort to serve on our Board. (See Item 16.G. Corporate Governance.)
Board Committee Membership
|
Audit Committee:
|
Financial Statements
Review Committee:
|
Corporate Governance and Nominating Committee:
|
Compensation Committee:
|
|||
|
Yehoshua Gleitman
|
Yehoshua Gleitman
|
Avraham Asheri
|
Dalia Rabin
|
|||
|
(Chair)
|
(Chair)
|
(Chair)
|
(Chair)
|
|||
|
Moshe Arad
|
Moshe Arad
|
Yehoshua Gleitman
|
Avraham Asheri
|
|||
|
Avraham Asheri
|
Avraham Asheri
|
Yigal Ne’eman
|
Yehoshua Gleitman
|
|||
|
Yigal Ne’eman
|
Yigal Ne’eman
|
Dalia Rabin
|
||||
|
Dalia Rabin
|
Dalia Rabin
|
Employees
Number of Employees
.
Most of our employees are based in Israel, and we have a significant number of employees in the United States. The total number of employees worldwide and the number of employees in the U.S. at the end of 2012, 2011 and 2010 were as follows:
|
Total
|
U.S.
|
|||||||
|
Employees
|
Employees
|
|||||||
|
2012
|
12,134 | 1,772 | ||||||
|
2011
|
12,545 | 1,980 | ||||||
|
2010
|
12,317 | 1,963 | ||||||
Employment Contracts
. The majority of our Israeli employees have individual employment contracts. However, by law some employees receive rights under a number of general collective bargaining agreements and under Israeli employment laws. See Item 4. Information on the Company – Conditions in Israel – Israeli Labor Laws. We believe our overall relationship with our employees is satisfactory.
Collective Bargaining Agreements
.
In Israel, several of our wholly-owned subsidiaries are each parties to collective bargaining agreements covering a portion of their employees. A total of approximately 2,410 employees in Israel are covered by such agreements that extend for various periods up to 2017. Approximately 225 of the employees at Elbit Systems of America’s operations are covered by collective bargaining agreements in effect through various periods up to 2014.
71
Share Ownership
Elbit Systems’ Stock Option Plans
2007 Employee Stock Option Plan
In 2007, our shareholders approved the 2007 Option Plan (the Plan). The purpose of the Plan is to provide an incentive to applicable employees of Elbit Systems and certain of our subsidiaries, who are expected to contribute to the Company’s future growth and success and to strengthen the alignment of the option recipients’ interests with those of the Company and our shareholders.
The options were allocated, subject to the required approvals, in two tracks as follows: (i) Regular Options – up to an aggregate of 1,250,000 options exercisable into 1,250,000 of our ordinary shares in consideration for the exercise price, all or any portion of which may be granted as Incentive Stock Options (Regular Options); and (ii) Cashless Options – up to an aggregate of 1,250,000 options, which entitle the participant to exercise options for an amount reflecting only the benefit factor (Cashless Options). Each of the participants is granted an equal amount of Regular Options and Cashless Options. The exercise price for Israeli participants is the average closing price of our shares during 30 trading days preceding the options’ grant date. The exercise price of options granted to a non-Israeli participant residing in the United States is the fair market value of the share on the day the options are granted. Generally, the options expire five years from the grant date.
According to the Plan, the options granted on a certain date (such grant date being the Commencement Date) will become vested and exercisable in accordance with the following vesting schedule:
|
|
(1)
|
50% of the options will be vested and exercisable from the second anniversary of the Commencement Date;
|
|
|
(2)
|
An additional 25% of the options will be vested and exercisable from the third anniversary of the Commencement Date; and
|
|
|
(3)
|
The remaining 25% of the options will be vested and exercisable from the fourth anniversary of the Commencement Date.
|
In 2011, in accordance with Nasdaq Rule 5615(a)(3) allowing a foreign private issuer to follow its home country practice in lieu of certain requirements of Nasdaq’s 5600 series of corporate governance rules, our Board approved an amendment to the Plan (the Amendment), which allows the Plan Administrator (the Compensation Committee), subject to additional approvals as may be required under the Companies Law, to determine for each option granted and subject to the above-mentioned vesting periods, an expiration period of not less than five years and not more than seven years from the Commencement Date.
In accordance with the Amendment, the Plan Administrator determined in November 2011 and 2012, respectively, to extend each time by one year the final exercise date of all the options granted to our employees during 2007 (except for the options granted to our employees in the U.S.), which were vested and not yet exercised on the date of such applicable determination by the Plan Administrator. In November 2012, the Plan Administrator determined to extend by one year, the final exercise date of all the options granted to our employees during 2008 (except for the options granted to our employees in the U.S.), which were vested and not yet exercised on the date of such determination by the Plan Administrator. The final date for exercising options granted after 2008 remains, so long as the Plan Administrator does not determine otherwise, five years after the Commencement Date of each relevant option.
Israeli participants are granted options under the Plan in accordance with the provisions of Section 102 of the Israeli Tax Ordinance related to the Capital Gains Tax Track.
During 2007, we granted to approximately 200 employees an aggregate total of 2,381,300 options under the Plan. The average exercise price of the options was $33.27. During 2008, we granted an additional 135,800 options to 34 employees, at an average exercise price of $56.15. During 2009, we granted an additional 58,500 options to 12 employees, at an average exercise price of $50.33. During 2010, we granted an additional 28,000 options to seven employees at an average exercise price of $52.31. During 2011, we granted an additional 63,300 options to 21 employees, at an average exercise price of $50.74. During 2012, we granted an additional 30,000 options to six employees at an average exercise price of $35.55.
72
In accordance with the Amendment and the determinations of the Plan Administrator mentioned above, the options granted during 2007 to employees (other than U.S. employees) and which are vested but not exercised by November 2012, are exercisable for seven years from the Commencement Date, and the options granted during 2008 to employees (other than U.S. employees) and which are vested but not exercised by November 2012, are exercisable for six years from the Commencement Date. All other options are exercisable for five years from the Commencement Date. The compensation expenses related to the options granted in 2010, 2011 and 2012 as well as the compensation expenses related to the extensions of the options granted in 2007 and 2008 as mentioned above, were not material.
As part of the overall grant in the first quarter of 2007, our President, Joseph Ackerman, was granted 95,000 options under the Plan at an exercise price of $33.20 per share. Also, as part of the overall grant in the first quarter of 2007, our President Designee, Bezhalel Machlis, was granted 70,000 options under the Plan at an exercise price of $33.20 per share, and 7,000 options in 2011 at an average price of $50.74. No directors were granted options under the Plan, but executive officers other than Mr. Ackerman and Mr. Machlis
were granted under the Plan an aggregate of 568,000 options in 2007, at an average exercise price of $33.34, an aggregate of 7,000 options in 2008, at an average exercise price of $53.60, an aggregate of 15,000 options in 2009, at an average exercise price of $48.10, an aggregate of 5,000 options in 2010, at an average exercise price of $53.88 and an aggregate of 7,000 options in 2011, at an aggregate exercise price of $50.74. There were no grants of options under the Plan to executive officers during 2012.
(For the full text of the Plan as amended by the Amendment see exhibit 4.3 – Amended 2007 Stock Option Plan to the post effective amendment to our registration statement on Form S-8, which amendment was filed with the SEC on December 1, 2011. See also Item 18. Financial Statements – Note 21(B).)
73
Major Shareholders
Percentages
We had, as of February 28, 2013, 41,911,989 ordinary shares outstanding
(1)
. The following table sets forth specific information as of February 28, 2013, to the best of our knowledge, concerning:
|
|
•
|
beneficial ownership of more than 5% of our outstanding ordinary shares; and
|
|
|
•
|
the number of ordinary shares beneficially owned by all of our executive officers and directors as a group.
|
|
Name of Beneficial Owner
|
Amount Owned
|
Percent of Ordinary Shares
|
||||||
|
Federmann Enterprises Ltd.
|
||||||||
|
99 Hayarkon Street
|
||||||||
|
Tel-Aviv, Israel
(2)
|
19,580,342 | 46.72 | % | |||||
|
Heris Aktiengesellschaft
|
||||||||
|
c/o 99 Hayarkon Street
|
||||||||
|
Tel-Aviv, Israel
|
3,836,458 | (3) | 9.15 | % | ||||
|
All executive officers and directors as
|
||||||||
|
a group (28 persons)
|
197,796 | (4) | 0.47 | % | ||||
|
|
(1)
|
The total number of ordinary shares excludes 1,408,921 ordinary shares held by us as treasury shares.
|
|
|
(2)
|
Federmann Enterprises Ltd. (FEL) owns our ordinary shares directly and indirectly through Heris Aktiengesellschaft (Heris) which is controlled by FEL. FEL is controlled by Beit Federmann Ltd. (BFL). BFL is controlled by Beit Bella Ltd. (BBL) and Beit Yekutiel Ltd. (BYL). Michael Federmann is the controlling shareholder of BBL and BYL. He is also the chairman of Elbit Systems’ Board and the chairman of the Board and the chief executive officer of FEL. Therefore, Mr. Federmann controls, directly and indirectly, the vote of ordinary shares owned by Heris and FEL.
|
As of February 28, 2013, 4,655,448 ordinary shares held by FEL were pledged to Bank Leumi Le-Israel BM to guarantee loans provided to FEL in connection with FEL’s purchase in 2004 of our ordinary shares from Elron Electronics Industries Ltd. as well as to guarantee an increase of the loan provided to FEL according to an 2007 amendment to the loan agreement. In addition, 2,175,000 ordinary shares held by FEL were pledged in favor of Bank Hapoalim BM, in connection with FEL’s purchase in 2006 from Koor Industries Ltd. of 2,350,000 of our ordinary shares.
|
|
(3)
|
The amount of ordinary shares owned by Heris is included in the amount of shares held by FEL as set forth in footnote (2) above.
|
|
|
(4)
|
This amount does not include: (i) any ordinary shares that may be deemed to be beneficially owned by Michael Federmann as described in footnote (2) above; and (ii) 301,373 ordinary shares underlying options that are currently exercisable or that will become exercisable within 60 days of February 28, 2013. A portion of the underlying options are “phantom options” or “cashless” options that have been calculated based on our February 28, 2013 closing share price on the TASE of $38.94.
|
74
Rights in Shares, Significant Changes in Shareholders and Controlling Shareholders
Our major shareholders have the same rights as other holders of our ordinary shares. (See also Item 10. Additional Information – Provisions Relating to Major Shareholders. With respect to the Company’s repurchase of our ordinary shares see Item 16.E. Purchases of Equity Securities by the Issuer and Affiliated Purchasers.)
The only changes in shareholdings by major shareholders in the last three years were those relating to FEL as follows:
|
February 28, 2013
|
February 29, 2012
|
February 28, 2011
|
May 31, 2010
|
|||||||||||||||||||||||||||||
|
Shares Owned
|
% of Shares Owned
|
Shares Owned
|
% of Shares Owned
|
Shares Owned
|
% of Shares Owned
|
Shares Owned
|
%
of Shares Owned
|
|||||||||||||||||||||||||
|
FEL
|
19,580,342 | (1) | 46.72 | % | 19,503,380 | (2) | 45.97 | % | 19,457,566 | (3) | 45.50 | % | 19,342,625 | 45.49 | % | |||||||||||||||||
____________________
|
|
(1)
|
Reflects incidental purchases by FEL of shares in open market transactions during March 2012 – February 2013.
|
|
|
(2)
|
Reflects incidental purchases by FEL of shares in open market transactions during May 2011 – February 2012.
|
|
|
(3)
|
Reflects incidental purchases by FEL of shares in open market transactions during May 2010 – February 2011.
|
As of February 28, 2013, approximately 8.08% of our outstanding ordinary shares were held in the United States by approximately 153 shareholders of record registered on the books of our transfer agent.
We are not aware of any arrangement which may result in a change in control of the Company.
Related Party Transactions
Transactions with Affiliated Companies.
In the ordinary course of business, some of our subsidiaries and affiliates engage in business activities with each other. The purchases among our related parties are made at prices and on terms equivalent to those used in transacting business with unrelated parties under similar conditions. The sales among our related parties in respect to government defense contracts are made on the basis of costs incurred. (See Item 10. Additional Information – General Provisions of Israeli Law and Related Provisions of Articles of Association – Approval of Certain Transactions.)
Transactions with Officers and Directors.
See below – Item 10. Additional Information – General Provisions of Israeli Law and Related Provisions of Articles of Association and - Approval of Certain Transactions. For information on the grant of options in Elbit Systems’ shares to officers and directors, see Item 6. Directors, Senior Management and Employees – Share Ownership – Elbit Systems’ Stock Option Plans.
75
Consolidated Statements and Other Financial Information
See Item 18. Financial Statements.
Export Sales
Export sales constitute a significant portion of our sales. In 2012, export sales were approximately $2.4 billion, constituting approximately 82% of our total sales. (For further information regarding the allocation of our revenues by geographic region see Item 5. Operating and Financial Review and Prospects – 2012 Compared to 2011 – Revenues.)
Legal Proceedings
Aminov.
In November 2012, a claim in the amount of approximately $40 million regarding a commercial dispute was filed in the District Court of Tel-Aviv – Jaffa by Dr. Baruch Aminov against the Company, a European subsidiary of the Company and two of its officers. Based upon a preliminary review the Company believes that there is no merit to the allegations made in the claim and will respond accordingly in court.
IMOD – Program Cancellation.
In November 2012, Elbit Systems and its subsidiary Elop filed a lawsuit against the Government of Israel, for damages and expenses caused in connection with the cancellation of export licenses for a project of a foreign customer. This followed the unsuccessful efforts to reach an appropriate compensatory settlement with the Government. The approximately $74 million lawsuit was filed with the District Court of the Central Region of Israel. See Item 18. Financial Statements - Note 1(C).
Pinpoint
. In 2009, a claim in the amount of approximately $10 million was filed in the District Court – Central District of Israel by Pinpoint Advance Corporation (Pinpoint) and four of its founders against our Israeli subsidiary, Elbit Systems Holdings (1997) Ltd., as well as against one of our officers. Pinpoint is a special purpose acquisition company that was in negotiations with us and other shareholders of our subsidiary Kinetics, regarding the sale of shares in Kinetics during 2008. The transaction was not completed and negotiations were terminated. Pinpoint claims that the agreement was completed and thus entered into effect. Alternatively, Pinpoint claims that our decision not to complete the agreement was made in bad faith, and that under the circumstances Pinpoint and its founders are entitled to pecuniary compensation equal to their rights and entitlements under the alleged breached contract. We believe there is no merit to the allegations made in the claim and have responded accordingly to the court. The claim is in the discovery stage.
Credit Suisse.
In 2009, Elbit Systems filed a claim in the U.S. District Court for the Southern District of Illinois against Credit Suisse Group (CSG). The complaint seeks to recover approximately $16 million that Elbit Systems believes was fraudulently obtained by CSG and by its subsidiary Credit Suisse Securities (USA) from Tadiran Communications Ltd. (Tadiran Communications) in 2007 in connection with auction rate securities purchased by Tadiran Communications through CSG. In 2008, Tadiran Communication was merged into Elbit Systems, and Tadiran Communications’ activities are currently performed as part of Elbit Systems’ wholly-owned Israeli subsidiary, Elbit Systems Land and C4I Ltd. CSG filed a motion to dismiss the claim based on a release signed by Tadiran Communications in 2007. In 2009, the case was moved to the U.S. District Court for the Southern District of New York. In January 2013, the court ruled in Elbit Systems’ favor on a motion to dismiss filed by CSG, and the case is proceeding to the discovery stage.
ImageSat
In 2010, a claim was filed in the Supreme Court of the State of New York, County of New York (New York State Court) by certain minority security holders of ImageSat against ImageSat, IAI, Elbit Systems and Elop claiming a breach of the Security Holders Agreement between various security holders of ImageSat, based on an alleged failure to appoint independent directors to the ImageSat board of directors. Elop holds approximately 14% (7% on a fully diluted basis) of ImageSat’s issued share capital and is entitled to nominate one director to ImageSat’s board. Elbit Systems and Elop believe such claim is baseless and have filed corresponding responses to the New York State Court.
In 2012, plaintiffs moved to enjoin defendants from taking any action to seat two specific individuals as independent directors on the ImageSat Board of Directors, however, this motion was denied by the court. Plaintiffs have filed a Notice of Appeal.
76
In 2010, Elbit Systems and Elop were served with an Application to Approve a Derivative Action (the Application) filed in the District Court of Petach Tikva, Israel, by certain minority shareholders of ImageSat. The Application names a number of respondents, including, among others, ImageSat, IAI, Elop, Elbit Systems and several former directors of ImageSat, including, among others, Michael Federmann, Joseph Ackerman and Joseph Gaspar (Elbit Systems, Elop and the above-named former directors are referred to as the Elbit Defendants). The Application requested the court to approve the filing of a derivative action on behalf of ImageSat for alleged breaches by some of the respondents of the applicants’ rights as minority shareholders in ImageSat. The claims contained various allegations that the defendants breached their fiduciary and/or contractual obligations to the detriment of the plaintiffs. In 2011, the court granted the Elbit Defendants motions to dismiss the Application, and in June 2011 the Applicants filed a Notice of Appeal of the court’s ruling with the Israeli Supreme Court. A hearing is scheduled for September 2013. The Elbit Defendants believe that there is no merit to the allegations made against them in this matter.
In January 2012, a group of minority shareholders of ImageSat (the Petitioners), provided ImageSat with a letter of notice, according to which the Petitioners intend to file a petition before the Joint Court of Justice of Aruba, Curacao, Saint Maarten and of Bonaire, St. Eustatia, and Saba to make inquiry as to the policy and course of affairs at ImageSat and for other remedies authorized under the Civil Code of Curacao (the Letter of Notice). Although the Letter of Notice is directed at ImageSat, it contains various allegations against, among others, the Elbit Defendants (as described above in connection with the Israeli proceedings). The nature of the allegations is substantially similar to those previously made in the Israeli action as described above. In March 2013 the court denied the Petitioners’ request in the Letter of Notice. The Petitioners have the right to appeal the court’s ruling.
IAI has agreed to indemnify Elbit Systems, Elop and the directors nominated by Elop to ImageSat’s board, for any losses arising out of any of the foregoing claims or legal proceedings, net of insurance proceeds received from ImageSat’s insurance policies and any indemnification proceeds received from ImageSat.
Other Legal Proceedings
.
The Company is involved in other legal proceedings from time to time. Based on the advice of our legal counsel, management believes such current proceedings will not have a material adverse effect on our financial position or results of operations.
Dividend Distributions
We do not have a declared dividend policy. (Regarding declarations of dividends out of certain tax-exempt income see below Item 10. Additional Information – Taxation – Investment Law.) Our Articles of Association provide that the Board may approve dividend payments to shareholders out of surplus earnings as permitted by applicable law. To date we have consistently paid a quarterly dividend to our shareholders.
Our aggregate quarterly dividend payments for the last three full fiscal years were as follows:
|
2010
|
$
|
1.44 per share
|
|
2011
|
$
|
1.44 per share
|
|
2012
|
$
|
1.20 per share
|
Significant Changes
Other than those significant events described in this annual report, if any, there have not been any significant changes since December 31, 2012.
Share Listings and Trading Prices
Our ordinary shares are listed on the TASE and are quoted on Nasdaq under the symbol “ESLT”.
77
The high and low sale prices for our ordinary shares for the five most recent fiscal years are:
|
Nasdaq
|
TASE
(1
)
|
|||||||||||||||
|
High
|
Low
|
High
|
Low
|
|||||||||||||
|
2008
|
$ | 63.40 | $ | 36.25 | $ | 62.64 | $ | 36.06 | ||||||||
|
2009
|
$ | 70.50 | $ | 40.50 | $ | 69.78 | $ | 40.27 | ||||||||
|
2010
|
$ | 66.65 | $ | 46.80 | $ | 65.69 | $ | 46.70 | ||||||||
|
2011
|
$ | 56.75 | $ | 35.35 | $ | 55.36 | $ | 34.29 | ||||||||
|
2012
|
$ | 42.09 | $ | 29.59 | $ | 39.87 | $ | 29.02 | ||||||||
The high and low quarterly sale prices for our ordinary shares for the two most recent full financial years and the next subsequent quarter are:
|
Nasdaq
|
TASE
(1
)
|
|||||||||||||||
|
High
|
Low
|
High
|
Low
|
|||||||||||||
|
2011
|
||||||||||||||||
|
First Quarter
|
$ | 55.95 | $ | 48.78 | $ | 52.58 | $ | 47.95 | ||||||||
|
Second Quarter
|
$ | 56.75 | $ | 46.62 | $ | 55.36 | $ | 44.11 | ||||||||
|
Third Quarter
|
$ | 49.94 | $ | 35.35 | $ | 49.20 | $ | 34.29 | ||||||||
|
Fourth Quarter
|
$ | 45.63 | $ | 39.50 | $ | 44.00 | $ | 40.74 | ||||||||
|
2012
|
||||||||||||||||
|
First Quarter
|
$ | 40.99 | $ | 34.37 | $ | 39.87 | $ | 34.14 | ||||||||
|
Second Quarter
|
$ | 37.83 | $ | 32.42 | $ | 35.07 | $ | 33.69 | ||||||||
|
Third Quarter
|
$ | 34.58 | $ | 29.59 | $ | 33.99 | $ | 29.02 | ||||||||
|
Fourth Quarter
|
$ | 40.20 | $ | 33.80 | $ | 37.26 | $ | 34.05 | ||||||||
|
2013
|
||||||||||||||||
|
First Quarter (through February 28, 2013)
|
$ | 41.62 | $ | 37.08 | $ | 40.49 | $ | 37.06 | ||||||||
The monthly high and low sale prices of our ordinary shares for the most recent six months are:
|
Nasdaq
|
TASE
(1
)
|
|||||||||||||||
|
High
|
Low
|
High
|
Low
|
|||||||||||||
|
September 2012
|
$ | 34.04 | $ | 30.54 | $ | 33.84 | $ | 30.47 | ||||||||
|
October 2012
|
$ | 37.81 | $ | 35.33 | $ | 37.77 | $ | 34.77 | ||||||||
|
November 2012
|
$ | 37.74 | $ | 33.80 | $ | 37.88 | $ | 34.05 | ||||||||
|
December 2012
|
$ | 40.33 | $ | 38.19 | $ | 40.50 | $ | 38.03 | ||||||||
|
January 2013
|
$ | 41.62 | $ | 37.76 | $ | 41.33 | $ | 37.20 | ||||||||
|
February 2013
|
$ | 39.02 | $ | 37.08 | $ | 39.39 | $ | 37.06 | ||||||||
|
|
(1)
|
The closing prices of our ordinary shares on the TASE have been translated into U.S. dollars using the daily representative rate of exchange of the NIS to the U.S. dollar as published by the Bank of Israel for the applicable day of the high/low amount in the specified period.
|
General Provisions of Israeli Law and Related Provisions of Articles of Association
Israeli Companies Registrar.
We are registered with the Israeli Companies Registrar. The registration number issued to us by the Companies Registrar is 52-004302-7.
78
The Companies Law and Restated Articles of Association.
The Companies Law is the basic corporation law governing Israeli publicly and privately held companies. The Companies Law mandates specific provisions be included in an Israeli company’s articles of association, which are included in Elbit Systems Restated Articles of Association (the Articles of Association).
Purpose.
Elbit Systems’ purpose, as described in Article 3 of the Articles of Association, includes any objectives permitted by law.
Appointment and Removal of Directors.
See Item 6. Directors, Senior Management and Employees – Board of Directors.
Internal Auditor and Audit Committee.
Publicly held Israeli companies are required to appoint an internal auditor. The main role of the internal auditor is to examine whether the company’s activities comply with the law, integrity and orderly business procedures. Publicly held companies are also required to establish an audit committee of the board of directors. The audit committee must consist of at least three directors qualified to serve as members of an audit committee under the Companies Law including all External Directors. The chair of the audit committee must be an External Director, and the majority of the members must qualify as being “Independent Directors” in accordance with the criteria of the Companies Law. Our Audit Committee and internal auditor operate in accordance with an audit committee charter that provides the framework for their functions, consistent with applicable Israeli and U.S. laws and regulations. (See Item 6. Directors, Senior Management and Employees – Board Practices – Audit Committee.)
Office Holders
The Companies Law specifies the duty of care and fiduciary duties that an “Office Holder” owes to a company. An Office Holder is defined as a director, general manager, chief business manager, deputy general manager, vice general manager, any other person who fulfills these functions without regard to that person’s title or other manager directly subordinate to the general manager. Each person listed above as a director or executive officer in Item 6. Directors - Senior Management and Employees - Directors and Executive Officers, is an Office Holder of Elbit Systems.
Under the Companies Law, an Office Holder’s fiduciary duty includes the general duty to act in good faith and for the benefit of the company, avoiding any conflict of interest between the Officer Holder’s position in the company and his or her personal affairs. The fiduciary duty also includes avoiding any competition with the company and avoiding exploiting any business opportunity of the company in order to receive personal advantage for the Office Holder or others. Also, the Office Holder is required to disclose to the company any information or documents relating to the company’s affairs that the Officer Holder has received due to his or her position as an Office Holder. Under the Companies Law voting agreements among directors or a director’s failure to exercise independent judgment while voting are each considered a breach of fiduciary duty. The duty of care requires an Office Holder to act in a way that a reasonable Office Holder would act in the same position and under similar circumstances. This includes the duty to utilize reasonable means to obtain information regarding the advisability of a given action submitted for his or her approval or performed by virtue of his or her position and all other relevant information.
Some members of our Board are also directors of FEL or companies controlled by FEL. Therefore, in the event of an issue or transaction between Elbit Systems and any of those companies, those individuals who are affiliated with both of the applicable companies will be excluded from any decisions concerning such issue or transaction. In addition, an issue or transaction with any of such companies also requires authorization in accordance with the requirements of the Companies Law. Transactions with Office Holders, key employees and affiliates may require authorization in accordance with the requirements of the Companies Law. (See below – Item 10. Additional Information – Approval of Certain Transactions. For information on the grant of options in Elbit Systems’ shares to executive officers and directors, see Item 6. Directors, Senior Management and Employees – Share Ownership – Elbit Systems’ Stock Option Plans).
79
In accordance with recent amendments to the Companies Law a public company, such as Elbit Systems, is required to adopt a compensation policy setting forth the principles to govern the terms of office and employment (including, cash and equity-based compensation, exemption from liability, indemnification, D&O insurance and other benefits and payments related to the service and employment) of the Office Holders of the company. The above mentioned amendments to the Companies Law also define the criteria to be considered or included in such compensation policy. The compensation policy needs to be approved no later than September 2013 by the board of directors as a whole, after consideration of the recommendations of the compensation committee, and by the majority of the company's shareholders provided that either:
|
|
(i)
|
such majority includes a majority of the total votes of shareholders who are not controlling shareholders and do not have a Personal Interest in the approval of the compensation policy and who participate in the voting, in person, by proxy or by written ballot, at the meeting (abstentions not taken into account); or
|
|
|
(ii)
|
the total number of votes of shareholders mentioned in (i) above that are voted against the approval of the compensation policy do not represent more than 2% of the total voting rights in the company.
|
Under certain circumstances and subject to certain exceptions, the board of directors may approve the compensation policy even if not approved by the shareholders as described above, provided that the compensation committee and the board of directors determine, following an additional discussion and based on detailed reasons, that it is for the benefit of the company to adopt such compensation policy
.
We intend to comply with these new requirements of the Companies Law within the required time frame.
Commencing as of December 2012, compensation terms of an Office Holder are to be approved in accordance with the principles set forth in such amendments to the Companies Law as if a compensation policy was already in force. In accordance with the Companies Law, as amended, the compensation policy must be re-approved every three years, in the manner described above. The board of directors is responsible for reviewing from time to time the compensation policy and determining whether or not there are any circumstances that require adjustments to the current compensation policy. (See also Item 6. Directors, Senior Management and Employees - Board Practices - Compensation Committee and "Approval of Certain Transactions - Approval of Transactions" below).
Approval of Certain Transactions
Approval Procedures
.
The Companies Law requires that certain transactions, actions and arrangements, mainly with related parties including Office Holders, be approved as provided for in the Companies Law and in a company’s articles of association and in many cases by the audit committee and by the board of directors. Sometimes shareholder approval is also required.
Personal Interest and Extraordinary Transactions
.
The Companies Law requires that an Office Holder or a controlling shareholder (see “Provisions Relating to Major Shareholders” below) of a publicly traded company immediately disclose (and no later than the first board meeting the transaction is discussed) any “Personal Interest” that he or she may have and all related material information known to him or her, in connection with any existing or proposed transaction of the company. A person with a Personal Interest in any such transaction that is brought for approval of the audit committee or board of directors may not be present at the meeting where the transaction is being deliberated or approved (unless the chair of the audit committee or the board, as the case may be, determines that such person’s presence at the meeting is required for presentation of the relevant transaction) and, in case such person is a director, he or she may not vote on the matter, unless a majority of the members of the audit committee or of the board of directors (as the case may be) have a Personal Interest in the approval of the relevant transaction, in which case the directors having such Personal Interest may be present and may participate in the vote. In the event that the majority of the members of the board of directors have a Personal Interest in the relevant transaction, the approval of the shareholders is also required. Personal Interest also includes any interest held by the Office Holder’s spouse, siblings, parents, grandparents, descendants, spouse’s descendants, spouse’s siblings and parents and the spouses of any of them. It also includes an interest by any entity in which the Office Holder or his or her relative is a 5% or greater shareholder, director or general manager or in which he or she has the right to appoint at least one director or the general manager. An “extraordinary transaction” is other than in the ordinary course of business, other than on market terms or is likely to have a material impact on the company’s profitability, assets or liabilities.
Approval of Transactions
The Companies Law requires approval by the board of directors for transactions that are not extraordinary with an Office Holder or in which an Office Holder has a Personal Interest, unless the company’s articles of association provide otherwise.
80
The Companies Law requires approval by both the audit committee and the board of directors for the following transactions:
|
|
(1)
|
extraordinary transactions with an Office Holder or in which an Office Holder has a Personal Interest;
|
|
|
(2)
|
material actions or arrangements that may otherwise be considered a breach of fiduciary duty of an Office Holder; or
|
|
|
(3)
|
except for certain specific exemptions under the Companies Law, extraordinary transactions of a public company with its controlling shareholder or with another person in which the controlling shareholder has a Personal Interest, including a private offering in which the controlling shareholder has a Personal Interest, as well as an agreement of a public company with its controlling shareholder or his or her relatives, directly or indirectly, including through a company controlled by him or her, regarding the grant of services to the applicable company or regarding the terms of service and/or employment of the controlling shareholder or his or her relatives, as the case may be, except that with respect to terms of service of the controlling shareholder or his or her relatives as Office Holders of the company the approval of the compensation committee (instead of the audit committee) is required.
|
Except for certain exemptions specified under the Companies Law, matters referred to herein also require shareholder approval, including, where applicable, by a specified percentage of non-interested shareholders, In addition, the Companies Law requires re-approval every three years with respect to some of the matters referred to above. Re-approval when applicable is required by the audit committee, the board of directors and, except for certain specific exemptions, also by the shareholders. (See also “Provisions Relating to Major Shareholders” below.)
Approval of Terms of Service and Employment of Office Holders
In accordance with the recent amendments to the Companies Law, approval by both the compensation committee and the board of directors is required for all arrangements regarding terms of service including cash and equity based, exemption from liability, indemnification, D&O insurance and other benefits and payments related to the service and employment. Except for certain specific exemptions under the Companies Law, matters referred to herein with respect to the CEO of a public company or a director of a company (including engagement with respect to employment terms of a director in a position other than as a director) also require shareholder approval. With respect to the CEO of a public company, or with respect to a director who is a controlling shareholder, shareholder approval must be by a special majority vote, provided that either:
|
|
(i)
|
such majority includes a majority of the total votes of shareholders who have no Personal Interest in the approval of the transaction and who participate in the voting, in person, by proxy or by written ballot, at the meeting (abstentions not taken into account); or
|
|
|
(ii)
|
the total number of votes of shareholders mentioned above that are voted against the transaction do not represent more than 2% of the total voting rights in the company.
|
With respect to transactions described above with the CEO the compensation committee may determine that such transaction does not have to be approved by the shareholders of the company, provided that: (i) the CEO is considered to be "independent" based on criteria set forth in the Companies Law; (ii) the compensation committee determined, based on detailed reasons, that bringing the transaction to the approval of the shareholders may compromise the entering into the transaction; and (iii) the terms of the transaction are consistent with the company's compensation policy.
In order to be approved, the terms of employment of Office Holders of a public company such as Elbit Systems must be consistent with the company's compensation policy. However the compensation committee and the board of directors may, under special circumstances, approve terms of employment which are not in accordance with the company's compensation policy, if:
|
|
(i)
|
the compensation committee and the board of directors have taken into consideration the mandatory considerations and criteria which are specified in the Companies Law for a compensation policy and the respective employment terms include such mandatory considerations and criteria; and
|
81
|
|
(ii)
|
the company's shareholders approved such terms of employment, subject to the above-mentioned special majority requirement.
|
Notwithstanding the above, the compensation committee and the board of directors may approve terms of employment of Office Holders (other than CEO or directors) that are not in accordance with the company's compensation policy, even if the shareholders' do not approve such terms, provided that:
|
|
(i)
|
both the compensation committee and the board of directors re-discussed the transaction and decided to approve it despite the shareholders' objection, based on detailed reasons; and
|
|
|
(ii)
|
the company is not a "Public Pyramid Held Company". For the purpose hereof, a "Public Pyramid Held Company" is a public company that is controlled by another public company (including by a company that only issued debentures to the public), which is also controlled by another public company (including a company that only issued debentures to the public) that has a controlling shareholder.
|
Under the Companies Law as amended, changes of the terms of a current arrangement regarding service and employment terms of an Office holder (other than a director), may require only the approval of the compensation committee, if the compensation committee has determined that such changes are not material.
Exemption, Insurance and Indemnification of Directors and Officers
Exemption, Insurance and Indemnification under the Companies Law
Under the Companies Law, an Israeli company may not exempt an Office Holder from liability with respect to a breach of his or her duty of loyalty, but may exempt in advance an Office Holder from his or her liability to the company, in whole or in part, with respect to a breach of his or her duty of care, provided that a relevant provision is included in the company’s articles of association. However, a company may not exempt in advance a director from his or her liability to the company with respect to a breach of duty of care in connection with a distribution made by the company.
The Companies Law permits a company to obtain an insurance policy covering liabilities of Office Holders resulting from a breach of the Office Holder’s duty of care to the company or to another person, provided that a relevant provision is included in the company’s articles of association. Insurance may also be obtained to cover liabilities from the breach of his or her fiduciary duty to the company, to the extent that the Office Holder acted in good faith and had reasonable cause to believe that the act would not prejudice the interests of the company. It may also cover monetary liabilities charged against an Office Holder while serving the company. In addition, the Israeli Securities Law – 1968 (Securities Law) permits that such insurance policy will cover a payment which an Office Holder is obligated to pay to an injured party as set forth in the relevant sections of the Securities Law as well as expenses incurred by an Office Holder in connection with certain proceedings that are specified in the Securities Law, including reasonable litigation expenses (to include also lawyers' fees), provided that a relevant provision is included in the company's articles of association.
Under the Companies Law, a company may indemnify an Office Holder against any monetary liability incurred in his or her capacity as an Office Holder whether imposed on him or her in favor of another person pursuant to a judgment, a settlement or an arbitrator’s award approved by a court. A company can also indemnify an Office Holder against reasonable litigation expenses, including attorneys’ fees, incurred by him or her in his or her capacity as an Office Holder, in a proceeding instituted against him or her by the company, on its behalf or by a third party, or in connection with criminal proceedings in which the Office Holder was acquitted, or as a result of a conviction for a crime that does not require proof of criminal intent or in which an indictment was not brought against the Office Holder. In addition, a company may indemnify an Office Holder in respect of payments that the Office Holder is obligated to pay to an injured party as set forth in the relevant sections of the Securities Law, including reasonable litigation expenses (to include also lawyer's fees). These indemnifications are subject to the inclusion of relevant provisions in the company’s articles of association.
Also under the Companies Law, provided that a relevant provision is included in the company’s articles of association, a company may indemnify an Office Holder against reasonable litigation expenses, including attorneys’ fees, incurred by him or her in his or her capacity as an Office Holder, in an investigation or proceeding by an authority authorized to conduct such investigation or proceeding in which no indictment was filed and no monetary payments in lieu of criminal proceedings were imposed against the Office Holder, or monetary payments in lieu of criminal proceedings were imposed on him or her provided that the alleged criminal offense does not require proof of criminal intent.
82
Under the Companies Law, a company may indemnify an Office Holder in respect of certain liabilities, either in advance of an event or following an event. If a company undertakes to indemnify an Office Holder in advance of an event, the indemnification, other than reasonable litigation expenses, must be limited to foreseeable events in light of the company’s actual activities at the time the company undertook such indemnification and also limited to reasonable amounts or criteria under the circumstances, as determined by the board of directors, and the undertaking to indemnity will specify any such events, amounts or criteria.
A company may not indemnify an Office Holder or enter into an insurance contract that would provide coverage for any monetary liability incurred or exempt an Office Holder from liability to the company with respect to each of the following:
|
|
(1)
|
a breach of fiduciary duty, except indemnification or insurance that provides coverage for a breach of a fiduciary duty to the company while acting in good faith and having reasonable cause to assume that such act would not prejudice the interests of the company;
|
|
|
(2)
|
a willful breach of the duty of care or reckless disregard for the circumstances or to the consequences of a breach of the duty of care other than mere negligence;
|
|
|
(3)
|
an act done with the intent to unlawfully realize a personal gain;
|
|
|
(4)
|
a fine or monetary penalty imposed upon such Office Holder; or
|
|
|
(5)
|
certain monetary liabilities that are set forth in the Securities Law.
|
|
|
Insurance and Indemnification of Directors and Officers under the Articles of Association
|
In accordance with and subject to the provisions of the Companies Law and the Securities Law, Elbit Systems’ Articles of Association allow for directors and officers liability insurance, in respect of a liability or payment imposed on a director or officer as a result of an act carried out by such person in his or her capacity as a director or officer. This insurance may cover:
|
|
(1)
|
a breach of his or her duty of care to Elbit Systems or to another person;
|
|
|
(2)
|
a breach of his or her fiduciary duty to Elbit Systems, provided that the director or officer acted in good faith and had reasonable cause to assume that his or her act would not harm the interests of Elbit Systems;
|
|
|
(3)
|
a financial obligation imposed on him or her in favor of another person;
|
|
|
(4)
|
a payment that he or she are obligated to pay to an injured party as set forth in the relevant sections of the Securities Law;
|
|
|
(5)
|
expenses incurred by him or her in connection with certain administrative proceedings specified in the Securities Law, including reasonable litigation expenses (including also lawyers' fees); or
|
|
|
(6)
|
any other event for which insurance of a director or officer is or may be permitted.
|
In addition, in accordance with and subject to the Companies Law and the Securities Law, Elbit Systems’ Articles of Association permit indemnification, retroactively or in advance, of a director or officer against liability
,
payment or expense imposed or incurred by him or her as a result of an act carried out in his or her capacity as a director or officer, that may include:
|
|
(1)
|
a monetary liability imposed on the director or officer or paid by him or her in favor of a third party under a judgment, including a judgment by way of compromise or a judgment of an arbitrator approved by a court; provided however, that in case such undertaking is granted in advance it will be limited to events which, in the Board’s opinion, are foreseeable in light of the Elbit Systems’ actual activities at the time of granting the obligation to indemnify, and to a sum or criteria as the Board deems reasonable under the circumstances, and the undertaking to indemnify will specify the aforementioned events and sum or criteria;
|
83
|
|
(2)
|
a payment imposed on him or her in favor of an injured party in the circumstances specified in the Securities Law;
|
|
|
(3)
|
reasonable litigation expenses (including lawyer’s fees), incurred by a director or officer as a result of an investigation or proceeding conducted against him by an authority authorized to conduct such investigation or procedure, conducted against him or her by an authority authorized to conduct such investigation or procedure, provided that such investigation or procedure: (i) concludes without the filing of an indictment against the director or officer and without imposition of monetary payment in lieu of criminal proceedings; or (ii) concludes with imposing on the director or officer monetary payment in lieu of criminal proceedings, provided that the alleged criminal offense in question does not require proof of criminal intent or was incurred by the director or officer in connection with a monetary sanction imposed by the Companies Law or the Securities Law;
|
|
|
(4)
|
expenses incurred by a director or a officer in connection with certain administrative proceedings set forth in the Securities Law, including reasonable litigation expenses (including lawyers' fees);
|
|
|
(5)
|
reasonable litigation expenses (including lawyers fees), expended by the director or officer or imposed on him or her by the court for:
|
|
|
(a)
|
proceedings issued against him or her by or on Elbit Systems’ behalf or by a third party;
|
|
|
(b)
|
criminal proceedings from which the director or officer was acquitted; or
|
|
|
(c)
|
criminal proceedings in which he or she was convicted of an offense that does not require proof of criminal intent; or
|
|
|
(6)
|
any other liability or expense for which it is or may be permissible to indemnify a director or an officer.
|
The Articles of Association permit the grant of similar indemnification to any person acting on behalf or at the request of Elbit Systems as a director or officer of another company in which Elbit Systems is directly or indirectly a shareholder or has any other interest.
However, any indemnification so granted by Elbit Systems may not exceed 25% of Elbit Systems’ consolidated shareholders equity as reflected in our most recent consolidated financial statements published prior to the date of the indemnification payment.
In 2011, Elbit Systems’ Audit Committee, Board and shareholders approved the grant to members of our Board of indemnification letters reflecting the above conditions and limitations. Similar letters were also approved by the Audit Committee and the Board for grant to Office Holders of Elbit Systems who are not directors.
In August 2009, a general meeting of Elbit Systems’ shareholders approved a framework resolution that allows Elbit Systems to purchase directors and officers (D&O) liability insurance that meets the framework resolution’s terms. The framework resolution covers a five-year period beginning in August 2009, or until the close of our shareholders’ annual general meeting to be held in 2014, whichever occurs later, and allows for an aggregate increase of insurance coverage of up to $70 million (from the then current level of $45 million) for any year covered by the policy. As of February 28, 2013, the D&O policy’s limit of liability was up to $70 million. The framework resolution also allows for an increase of up to a maximum aggregate of 125% of the then current annual premium ($391,400). As of February 28, 2013, the annual premium was $317,850. The Audit Committee and the Board must approve that any purchase of D&O insurance falls within the terms of the framework resolution. In meetings held on November 11, 2012 and November 12, 2012, respectively, our Audit Committee and Board approved, in accordance with the Israeli Companies Regulations (Relief from Related Parties’ Transactions), 5760-2000 (the “Regulations”), the inclusion of Michael Federmann and David Federmann (who may be considered direct or indirect controlling shareholders of the Company) in the D&O liability insurance policy to be purchased, subject to the above mentioned terms, by the Company for the Company’s other directors and Office Holders.
84
Rights, Preferences and Restrictions of Shares
Elbit Systems currently has one type of share, this being ordinary shares. The share capital of Elbit Systems is NIS 80,000,000 divided into 80,000,000 ordinary shares of NIS 1 nominal (par) value each of which 43,320,910 ordinary shares were issued and outstanding as of February 28, 2013. All issued and outstanding ordinary shares are fully paid and non-assessable.
Each ordinary share entitles its owner to receive notices of, to attend and to cast one vote at, a general meeting of shareholders.
Our Articles of Association do not grant shareholders any rights to share in our profits other than through dividends. Subject to Israeli law, dividends may be declared by our Board and paid to the shareholders according to their respective rights. In the event that we go into liquidation, any surplus remaining after the payment of liabilities is distributed to the shareholders in proportion to the amount paid by each on account of the nominal value of the shares paid. No account is taken of any premiums paid in excess of the nominal value.
Our Board may make calls upon shareholders in respect of sums unpaid on their shares. Our Articles of Association contain no provisions which discriminate against any existing or future shareholder as a result of said shareholder holding a substantial number of shares.
A change of Elbit Systems’ share capital, by way of increasing the share capital, creation of new shares, or cancellation of unissued registered shares (if there is no undertaking to allot such shares), requires a change to our Articles of Association and as such requires the vote of a special majority of the shareholders participating in a general meeting of shareholders (see “General Meetings of Shareholders” below.)
If at any time our share capital is divided into different classes of shares, we may change the rights of shareholders by way of a resolution at a general meeting of shareholders, subject to the consent of the shareholders of the class whose rights are being impaired by the proposed change or subject to the adoption of a resolution by a special majority of the general meeting of the shareholders of such class, all of which is subject to other terms if and as provided by the terms of issuance of a particular class of shares.
Our ordinary shares do not have pre-emptive rights.
General Meetings of Shareholders
An annual general meeting of our shareholders must be held once in each year and not later than 15 months after the preceding annual general meeting. The Board determines the location of the meeting. All shareholders are entitled to attend and vote in person or by proxy at annual general meetings. Notice of annual general meetings may be sent by us by personal delivery or by sending it by prepaid registered mail. Such notice may be sent by cablegram, telex, facsimile or other electronic means provided confirmation is made by registered mail as stated above. Such notice should be sent to shareholders at the address in our records. Any general meeting that is not an annual general meeting is called an extraordinary general meeting. All shareholders are entitled to attend and vote in person or by proxy at extraordinary general meetings.
In general, subject to the Companies Law, ordinary resolutions in a general meeting require approval of a majority of the votes cast at the general meeting, whether in person or by proxy. (For information as to the required majority for the approval of related party transactions, see “Provisions Relating to Major Shareholders” below.) For information as to the required majority for the approval of certain transactions with Office Holders of a public company, see "Approval of Certain Transactions – Approval of Transactions" above. However, under our Articles of Association, some resolutions require a special majority of at least 67% of all votes properly cast at a general meeting, without taking into account abstentions.
Our Board may convene an extraordinary general meeting when and as it sees fit. In addition the Board must, according to statute, convene an extraordinary general meeting if it receives a demand to do so from either: (i) at least two directors; (ii) at least one quarter of the members of the Board; or (iii) one or more shareholders who hold: (A) an aggregate of at least 5% of our issued share capital and at least 1% of all voting rights; or (B) at least 5% of all voting rights, and in such case the extraordinary meeting must be held not more than 56 days from the submission date of such request to the Board and not later than 35 days from the applicable notice to shareholders described below. Any demand by a person or persons, as described in (i), (ii) and/or (iii) of this paragraph, who demands that an extraordinary general meeting be convened, must be made in writing and sent to our registered office.
85
Subject to the provisions of our Articles of Association, as well as applicable law and regulations, including applicable laws and regulations of any stock market on which our shares are listed, notice of an annual general meeting and of an extraordinary general meeting must be sent at least 21 days (and in some cases at least 35 days) in advance to all shareholders recorded in our shareholders registry. Such notice must include the place, date and hour of the meeting, the agenda for the meeting, the proposed resolutions and instructions for proxy voting.
The quorum required for a meeting of shareholders, except in the case of certain extraordinary meetings convened in special circumstances, consists of at least two shareholders present in person or by proxy or other voting instrument and holding or representing between them at least one-third of the voting power. The chairman of our Board presides at each of our shareholders’ meetings. A meeting adjourned for lack of a quorum will be adjourned to the same day in the following week, at the same time and place, or to the day, time and place that the Board determines, with notice to the shareholders. At the reconvened meeting, if a quorum is not present within one-half hour from the time appointed for holding the adjourned meeting, the required quorum then is two shareholders, present in person or by proxy or other voting instrument, representing at least 10% of the voting power. Nasdaq Listing Rule 5620(c) provides that a company listed on the Nasdaq Global Select Market should have a quorum requirement for shareholder meetings of at least one-third of the company’s outstanding common voting stock. As described above, our general quorum requirement is consistent with the Nasdaq Listing Rule. However, in the case of an adjourned meeting, our Articles of Association, consistent with what is permissible under the Companies Law, provide for a 10% quorum requirement.
Limitations on Non-Israeli Shareholders
No limitations exist or are imposed by Israeli law or our constituent documents with regard to the rights of non-Israeli shareholders or shareholders not resident in Israel to hold or exercise voting rights except for shareholders who are subjects of countries that are enemies of the State of Israel. (For a description of Israeli regulations relating to acquisitions of a controlling interest in Israeli defense companies see Item 4. Information on the Company – Governmental Regulation – Approval of Israeli Defense Acquisitions.)
Change of Control
Subject to certain exceptions, the Companies Law provides that a merger requires approval both by the board of directors and by the shareholders of each of the merging companies. In approving a merger, the board of directors must determine that there is no reasonable expectation that, as a result of the merger, the merged company will not be able to meet its obligations to its creditors. Creditors may seek a court order to enjoin or delay the merger if there is an expectation that the merged company will not be able to meet its obligations to its creditors. A court may also issue other instructions for the protection of the creditors’ rights in connection with a merger.
Under the Companies Law, an acquisition of shares in a public company must be made by means of a tender offer to all shareholders if, as a result of the acquisition, the purchaser would hold 25% or more or 45% or more (as the case may be) of the company’s voting rights. This rule does not apply if there is already another shareholder who holds 25% or more or 45% or more (as the case may be) of the company’s voting rights, nor does it apply to a purchase of shares by way of a “private offering” in certain circumstances provided under the Companies Law. (For information regarding Israeli law applicable to acquisition of Israeli “Defense Entities” see Item 4. Information on the Company – Governmental Regulations – Approval of Israeli Defense Acquisitions.)
Provisions Relating to Major Shareholders
We are required by law to maintain a separate registry of shareholders that hold 5% or more of either our issued shares or voting rights.
86
Under the Companies Law, the disclosure requirements with respect to the disclosure of a Personal Interest that apply to an Office Holder also apply to a controlling shareholder of a public company. A controlling shareholder is a shareholder who has the ability to direct the activities of a company, including a shareholder that holds 25% or more of the voting rights if no other shareholder owns more than 50% of the voting rights in the company, but excluding a shareholder whose power derives solely from his or her position as a director of the company or any other position with the company. Except for certain specified exemptions under the Companies Law, extraordinary transactions with a controlling shareholder or in which a controlling shareholder has a Personal Interest, including a private offering in which the controlling shareholder has a Personal Interest, and an engagement of a public company with a controlling shareholder or his or her relative, directly or indirectly, including through a company controlled by such person, regarding the grant of services to the applicable company (and if the controlling shareholder is an employee of the company but he or she is not an Office Holder regarding his or her employment terms) require the approval of the audit committee (or, if the controlling shareholder is an Office Holder regarding his or her term of service, of the compensation committee, the board of directors and the shareholders of the company, in that order.) The shareholder approval must be by a majority vote, provided that either:
|
|
•
|
such majority includes a majority of the total votes of shareholders who have no Personal Interest in the approval of the transaction and who participate in the voting, in person, by proxy or by written ballot, at the meeting (abstentions not taken into account); or
|
|
|
•
|
the total number of votes of shareholders mentioned above that are voted against the transaction do not represent more than 2% of the total voting rights in the company.
|
In addition, the Companies Law requires that, except for certain exemptions, transactions as above for a period of more than three years be re-approved in same manner for every three-year period.
In addition, under the Companies Law, each shareholder has a duty to act in good faith in exercising his or her rights and fulfilling his or her obligations toward the company and other shareholders and to refrain from abusing his or her power in the company, such as in certain shareholder votes. In addition, specified shareholders have a duty of fairness toward the company. These shareholders include any controlling shareholder, any shareholder who knows that it possesses the power to determine the outcome of a shareholder vote and any shareholder who, pursuant to the provisions of the articles of association, has the power to appoint or to prevent the appointment of an Office Holder or any other power of the shareholder with respect to the company.
Borrowing Power
Our Articles of Association grant broad powers to the Board to have us borrow, repay borrowings, make guarantees and grant security interests in borrowings.
Exchange Controls and Other Limitations Affecting Security Holders
Non-residents of Israel may freely hold and trade our ordinary shares under general and specific permits issued under the Israeli Currency Control Law, 1978. Our Memorandum of Association and Articles of Association do not restrict the ownership of ordinary shares by non-residents of Israel. Neither the Memorandum of Association and Articles of Association nor Israeli law restrict the voting rights of non-residents.
Under the general permit given through the Israeli Currency Control Law, 1978, non-residents of Israel who buy our ordinary shares inside or outside of Israel with any foreign currency are able to receive a number of types of distributions in freely repatriable U.S. dollars or specified other currencies. These distributions include dividends, proceeds from the sale of shares and any amounts payable on the dissolution, liquidation or winding-up of Elbit Systems.
In the last several years, the government of Israel liberalized its policies regarding exchange controls and investments in Israel and abroad.
Taxation
General
The following is a summary of some aspects of the current tax law applicable to companies in Israel, with special reference to its effect on Elbit Systems and our Israeli subsidiaries, and government programs from which Elbit Systems and some of our Israeli subsidiaries benefit.
The following also contains a discussion of specified Israeli and U.S. tax consequences to our shareholders. It also contains a discussion of the Israeli tax consequences to holders of our Series A Notes. See Item 5. Operating and Financial Review and Prospects – Liquidity and Capital Resources – Israeli Debt Offering. The Series A Notes are not registered for trading in the U.S. and may not be sold in the U.S. without registration or compliance with Regulation “S” under the Securities Act. Therefore, we have not included a discussion of U.S. tax consequences to holders of the Series A Notes. To the extent that the discussion is based on tax legislation that has not been subject to judicial or administrative interpretation, there can be no assurance that the views expressed in the discussion will be accepted by the tax authorities in question. The discussion is not intended, and should not be construed, as legal or professional tax advice and is not exhaustive of all possible tax considerations.
87
Effective Israeli Corporate Tax Rate.
Elbit Systems’ income tax liability in Israel is based on our unconsolidated earnings and such earnings of our Israeli-based subsidiaries. It is determined in NIS and not in U.S. dollars. Tax liability of non-Israeli subsidiaries is determined according to the laws of their respective countries of residence. As a result, the tax provision in Elbit Systems’ consolidated financial statements does not directly relate to income reported on these statements.
General Corporate Tax in Israel
Generally, Israeli companies were subject to Corporate Tax on taxable income at the rate of 25% for the 2012 tax year. The corporate tax rate and corporate capital gains tax rate are scheduled to remain at 25% for future tax years following the Law for Tax Burden Reform (Legislative Amendments) – 2011 (the Tax Burden Reform) which came into effect on January 1, 2012 and which repealed the gradual reduction in corporate tax rates enacted in previous legislation. The corporate income tax rates for the 2011 and 2010 tax years were 24% and 25% respectively.
Under the Israeli Tax Ordinance, 1961( the Ordinance) transfer pricing rules require that cross-border transactions between related parties be carried out implementing an arm’s-length principle and reported and taxed accordingly.
A portion of our Israeli operations have been granted “Approved Enterprise”, “Privileged Enterprise” and “Preferred Enterprise” status, as described under “Investment Law” below. These operations are subject to taxation at reduced rates applicable to those types of enterprises. We cannot assure you that Elbit Systems or our Israeli subsidiaries will continue to qualify for such benefits, or benefits under the Law for Encouragement of Industry in the future.
Industry Encouragement
.
Under the Law for the Encouragement of Industry (Taxes), 1969, a company qualifies as an “Industrial Company” if it is resident in Israel and at least 90% of its income (determined in Israeli currency) in a given tax year, with some exceptions, comes from “Industrial Enterprises” owned by that company. An Industrial Enterprise is defined as an enterprise whose primary activity in a particular tax year is industrial manufacturing activity. We believe Elbit Systems qualifies as an Industrial Company. The principal benefits of this status are amortization of the cost of know-how and patents over an eight-year period, under certain interpretations, deduction of expenses incurred in connection with a public issuance of securities over a three-year period, accelerated depreciation for certain assets and an election under certain conditions to file a consolidated tax return with additional related Israeli Industrial Companies. Eligibility for the benefits under this law is not subject to receipt of prior approval from any governmental authority.
Investment Law
The Israeli Law for the Encouragement of Capital Investments, 1959 (the Investment Law) provides tax benefits to companies that make capital investments in eligible fixed assets. Under the Investment Law prior to an amendment in 2005, companies could apply to the Investment Center to be granted “Approved Enterprise” status for certain of their activities. Following the 2005 amendment, the Investment Law allows a company to claim a “Privileged Enterprise” status without the need to obtain approval from the Investment Center, or an “Approved Enterprise” status by applying to receive Investment Center grants. Each approval for an Approved Enterprise and each Privileged Enterprise program relates to a specific investment program.
The benefits granted to an Approved Enterprise under the Investment Law prior to the 2005 amendment and to a Privileged Enterprise after the amendment include:
|
|
(1)
|
Exemption from corporate tax for periods ranging between two – ten years depending on specific conditions; and
|
|
|
(2)
|
Reduced corporate tax rates for several years thereafter depending on certain conditions.
|
In order to maintain the benefits under the Investment Law, a company must meet the criteria set forth in the applicable certificate of approval (for an Approved Enterprise) and certain requirements to establish that it contributes to the country’s economic growth and is a competitive factor for the Gross Domestic Product (a competitive enterprise).
88
As of December 31, 2012, Elbit Systems and some of our subsidiaries in Israel had active Approved Enterprise programs and Privileged Enterprise programs eligible for tax benefits. These programs will expire during the years 2015 to 2021
.
In January 2011, the Knesset enacted a reform to the Investment Law, effective January 2011. According to the reform a flat rate tax applies to companies eligible for the “Preferred Enterprise” status. In order to be eligible for Preferred Enterprise status, a company must meet minimum requirements to establish that it contributes to the country’s economic growth and is a competitive factor for the Gross Domestic Product (a competitive enterprise). Benefits granted to a Preferred Enterprise include reduced and gradually decreasing tax rates. In peripheral regions (Development Area A) the reduced tax rate is 10% in 2011 - 2012, 7% in 2013 - 2014 and 6% starting from 2015. In other regions the tax rate is 15% in 2011 - 2012, 12.5% in 2013 - 2014 and 12% starting from 2015.
Israeli companies which currently benefit from an Approved or Privileged Enterprise status and meet the criteria for qualification as a Preferred Enterprise can elect to apply the Preferred Enterprise benefits by waiving their benefits under the Approved and Privileged Enterprise status. Several of our Israeli subsidiaries have elected the Preferred Enterprise status.
With the exception of distribution upon complete liquidation, a distribution from income exempt under the Approved Enterprise programs benefits will subject the exempt income to corporate tax at the reduced corporate income tax rates pertaining to the Approved Enterprise programs. A distribution (including repurchase of shares) (See Item 16.E. Purchase of Equity Securities by the Issuer and Affiliated Purchasers - for more information regarding our repurchase of shares) from income exempt under the Privileged Enterprise programs will subject the exempt income to tax at the reduced corporate income tax rates pertaining to the Privileged Enterprise programs upon distribution or complete liquidation. Distributed amounts will be subject to a 15% withholding tax.
A distribution from a Preferred Enterprise out of the “Preferred Income” would be subject to 15% withholding tax for Israeli-resident individuals and non-Israeli residents (subject to applicable treaty rates). A distribution from a Preferred Enterprise out of the “Preferred Income” would be exempt from withholding tax for an Israeli-resident company. A company electing to waive its Privileged Enterprise or Approved Enterprise status through June 30, 2015 may distribute “Approved Income” or “Privileged Income” subject to 15% withholding tax for Israeli resident individuals and non-Israeli residents (subject to applicable treaty rates) and exempt from withholding tax for an Israeli-resident company. Nonetheless, a distribution from income exempt under Privileged Enterprise and Approved Enterprise programs will subject the exempt income to tax at the reduced corporate income tax rates pertaining to the Privileged Enterprise and Approved Enterprise programs upon distribution, or complete liquidation in the case of a Privileged Enterprise’s exempt income.
Elbit Systems’ Board and our Israeli subsidiaries’ boards of directors have decided that their respective policy is not to declare dividends out of such tax-exempt income. Accordingly, no deferred income taxes have been provided on income attributable to these companies’ Approved Enterprises and Privileged Enterprises, as such retained earnings are essentially permanent in duration.
In November 2012, the Knesset passed amendment 69 to the Investment Law (the Trapped Earnings Law) which provides a temporary, partial, relief from taxation on a distribution from exempt income for companies which elect the relief through November 2013. The Trapped Earnings Law allows a company to qualify a portion of its exempt income (Elected Earnings) for a reduced tax rate ranging between 17.5% and 6%. While the reduced tax is payable within 30 days of election, an electing company is not required to actually distribute the Elected Earnings within a certain period of time. The applicable rate is based on a linear formula involving the portion of Elected Earnings to exempt income and the applicable tax rate prescribed in the Investment Law. A company electing to qualify its exempt income must undertake to make designated investments in productive fixed assets, research and development or wages of new employees (Designated Investment). The Designated Investment amount is defined by a formula which considers the portion of Elected Earnings to the exempt income and the applicable tax rate prescribed by the Investment Law.
In addition to the reduced tax rate a distribution of Elected Earnings would be subject to a 15% withholding tax. The Trapped Earnings Law provides an exemption from the 15% withholding tax for a distribution to an Israeli resident company from companies which have elected the Privileged Enterprise status and waived their Approved Enterprise and privileged Enterprise Status through June 2015.
89
We are currently assessing the implications of an election under the "Trapped Earnings law” on the Company and its Israeli subsidiaries.
Capital Gains to a Shareholder
Capital gains to Israeli residents
.
Following the amendment in the Tax Burden Reform, starting January 1, 2012, the tax rate on capital gains to a “non-principal” individual shareholder (those persons holding less than 10% of our ordinary shares) is 25%, and 30% to an individual “principal” shareholder. In addition, the Tax Burden Reform also eliminates the differentiation between real gain earned prior and post January 1, 2003 for shares listed on a stock exchange prior to January 1, 2012. The real gain is based on the difference between the adjusted average value of the shares during the last three trading days before January 1, 2003 (or the adjusted original cost if it is higher than the adjusted average value) and the value of the shares at the date of sale. In the later case, the capital loss that might be set off is the difference between the adjusted average value and the value of the shares at the date of sale. Dealers in securities in Israel are taxed at regular tax rates applicable to business income. Companies resident in Israel are taxed at rates applicable to capital gains.
Capital gains to non-residents of Israel
.
Gains on the sale of ordinary shares traded on the TASE and on Nasdaq held by non-Israeli resident investors for tax purposes will generally be exempt from Israeli capital gains tax, subject to the provisions of the Israeli tax legislation. However, non-Israeli corporations will not be entitled to such exemption if an Israeli resident (i) has a controlling interest of 25% or more in such non-Israeli corporation, or (ii) is the beneficiary or is entitled to 25% or more of the revenues or profits of such non-Israeli corporation, whether directly or indirectly.
Capital Gains to a Holder of Series A Notes
Capital gains to Israeli residents
.
A capital gain for an individual derived from the sale of a debenture that is not linked to an index, such as our Series A Notes, will be taxable at a rate not to exceed 15% in case of a “non-principal” individual shareholder, or 20% in the case of a “principal” individual shareholder. Tax payers claiming a deduction of real interest expenses and linkage differences on debentures such as the Series A Notes will be taxed at a rate of 30% on their real capital gains. Dealers in securities in Israel are taxed at regular tax rates applicable to business income. Companies resident in Israel are taxed at rates applicable to capital gains.
Capital gains to non-residents of Israel
.
Gains on the sale of securities traded on the TASE, such as our Series A Notes, held by non-Israeli resident investors for tax purposes will generally be exempt from Israeli capital gains tax, subject to the provisions of the Israeli tax legislation. However, non-Israeli corporations will not be entitled to such exemption if an Israeli resident: (i) has a controlling interest of 25% or more in such non-Israeli corporation; or (ii) is the beneficiary or is entitled to 25% or more of the revenues or profits of such non-Israeli corporation, whether directly or indirectly.
Taxation on Dividends Paid to a Shareholder
Income tax for individual Israeli residents.
Residents of Israel are subject to income tax on distributions of dividends other than bonus shares (stock dividends). Following the amendment in the Tax Burden Reform, effective January 1, 2012, the tax rate on dividend income to a “non-principal” individual shareholder is 25% and 30% to an individual “principal” shareholder. The paying company withholds at source income tax at the rate of 25% or 30% in the case of a “principal shareholder”. A company whose stock is traded on a stock exchange withholds tax at the rate of 25% from dividends paid to a “principal” shareholder for shares registered and held by a registration company
.
90
Generally, dividends distributed from taxable income accrued during the period of benefit of an Approved Enterprise, Privileged Enterprise or Preferred Enterprise (see above “Investment Law”) are taxable at the rate of 15% if the dividend is distributed during the tax benefit period under the Investment Law or within 12 years after that period (this limitation does not apply if the company qualifies as a foreign investors’ company according to the Investment Law). These rates are the final tax on dividends.
Income tax for non-residents of Israel.
Non-residents of Israel are subject to income tax on distributions of dividends other than bonus shares (stock dividends). Following the Tax Burden Reform, effective January 1, 2012, the tax rate on dividend income to a "non-principal" non-resident of Israel shareholder is 25% and 30% to a "principal" shareholder (including a foreign company as opposed to an Israeli company). The paying company withholds at source income tax at the rate of 25% for a “non-principal” shareholder, or 30% for a "principal" shareholder, A company whose stock is traded on a stock exchange will withhold tax at the rate of 25% from dividend paid to a "principal" shareholder for shares registered and held by a registration company, unless a lower rate is applicable under a double taxation treaty. Accordingly, Elbit Systems withholds income tax at the source. Generally, dividends distributed from taxable income accrued during the period of benefit of an Approved Enterprise, Privileged Enterprise or Preferred Enterprise are taxable at the rate of 15% if the dividend is distributed during the tax benefit period under the Investment Law or within 12 years after the period (this limitation does not apply if the company qualifies as a foreign investors’ company according to the Investment Law). These rates are the final taxes in Israel on dividends for individual and corporate non-residents of Israel. Foreign residents who have Israeli derived income for which tax was withheld at the source are generally exempt from the duty to file tax returns in Israel for such income. This includes income from Israeli derived interest, dividends and royalties.
Taxation of Interest Income of Holders of Series A Notes
Income tax for Israeli residents.
Israeli resident individuals are tax exempt on the linkage differences derived from the debenture principal, under certain conditions. An individual is taxable at a rate of 15% on interest or discount fees originating from debentures which are not linked to the index, whether in whole or in part, such as the Series A Notes. Following the amendment in the Tax Burden Reform, effective January 1, 2012, the tax rate on interest income or discount fees originating from fully index-linked debentures, including debentures linked to a foreign currency is 25% in case of a "non-principal" shareholder. These tax rates will not apply if any of the following conditions are met: (1) the interest represents income from a “business” or is recorded in the individual’s books of account or is required to be so recorded; (2) the individual has claimed deduction of linkage differences and interest expenses on the debentures; (3) the individual is a “principal” individual shareholder; or (4) the individual is employed by a corporation that paid the interest, is a supplier of goods or services to the corporation, or has other special relations with the corporation, unless the tax assessing officer is satisfied that the interest rate has been established in good faith and regardless of the existence of any such relations between the individual and the corporation. In these cases, the individual will be taxed at the marginal tax rate. The paying company will deduct tax at a rate of 15% on interest in respect of unlinked debentures, such as the Series A Notes, a rate of 25% in the case of linked debentures, and the maximum tax rate will apply in the case of an individual who is a "principal" individual shareholder. The tax rate applicable to interest income (including linkage differences) or discount fees of an Israeli resident corporation is the corporate tax rate. The paying company will deduct tax at the corporate tax rate.
Income tax for foreign residents.
Commencing January 1, 2009, interest, discount fees or linkage differences paid to a foreign resident on debentures listed on the TASE and issued by an Israeli resident corporation, such as our Series A Notes, are typically exempt from Israeli tax, provided that the income is not produced by the foreign resident’s permanent establishment in Israel. The tax exemption will not apply in the following circumstances: (1) the foreign resident is a “principal” shareholder in the issuing company; (2) the foreign resident is a relative, as defined in the Ordinance, of the issuing company; (3) the foreign resident is an employee, a supplier of goods or services or has special relations with respect to the issuing company (unless it is demonstrated that the interest rate or discount fees have been determined in good faith and regardless of the existence of any special relations); or (4) a foreign resident company held by Israeli residents. If the tax exemption does not apply as above, the tax rate applicable to interest income received by foreign residents (individuals and corporations) originating from securities will be established in accordance with the provisions of the Ordinance, or in accordance with the provisions of the relevant treaty for the avoidance of double taxation signed between the State of Israel and the foreign resident’s country of residence. In such case, the paying company will withhold tax according to the rates prescribed in the Ordinance as above, and this rate may be reduced subject to the relevant treaty for the avoidance of double taxation. As indicated above, the Series A Notes are not registered under the Securities Act and may not be offered or sold in the United States or to U.S. Persons (as defined in Regulation “S” under the Securities Act) without registration under the Securities Act or an exception from the registration requirements of the Securities Act.
Israeli Tax on United States Shareholders
Dividends paid by Elbit Systems to an individual shareholder resident in the United States are generally subject to withholding tax deducted at source in Israel. Israel and the United States are parties to a tax treaty. Under the treaty, the withholding tax rate on a dividend is normally 25% or 15% in connection with an Approved Enterprise, Privileged Enterprise or Preferred Enterprise. (See above “Investment Law.”)
91
A U.S. corporation would have a reduced withholding tax rate on dividends if it were to own 10% or more of Elbit Systems’ voting shares under specified conditions. The reduced withholding tax rate on the dividend would be 12.5%. The U.S. corporation must own at least 10% of the voting shares during the portion of Elbit Systems’ tax year before the payment of the dividend and during the entire prior tax year. The reduced rate is also subject to two other conditions. First, not more than 25% of Elbit Systems’ gross income for the prior tax year could consist of interest, other than interest received from banking, financing or similar businesses or from certain subsidiaries. Second, the dividend cannot be derived from income during any period for which Elbit Systems is entitled to the reduced tax rate applicable to an Approved Enterprise / Privileged Enterprise. In this case the withholding tax rate would be 15%.
Since Elbit Systems’ ordinary shares are traded on the TASE and on Nasdaq, gains on the sale of ordinary shares held by non-Israeli resident investors for tax purposes will generally be exempt from Israeli capital gains tax, subject to the provisions of the Israeli tax legislation. Under the terms of the tax treaty, Israel may tax capital gains realized by shareholders resident in the United States on a sale of ordinary shares of Elbit Systems if certain conditions exist, however, such right is subject to the above exemption.
Subject to certain conditions and limitations, any Israeli tax withheld or paid with respect to dividends on ordinary shares will generally be eligible for credit against a U.S. shareholder’s U.S. federal income tax liability at such U.S. shareholder’s election. The U.S. Internal Revenue Code of 1986, as amended, (the Code) provides limitations on the amount of foreign tax credits that a U.S. shareholder may claim, including extensive separate computation rules under which foreign tax credits allowable with respect to specific categories of income cannot exceed the U.S. federal income taxes otherwise payable with respect to each such category of income. U.S. shareholders that do not elect to claim a foreign tax credit may instead claim a deduction for Israeli income tax withheld or paid, but only for a year in which these U.S. shareholders elect to do so for all foreign income taxes. Dividends with respect to the ordinary shares will generally be classified as foreign source “passive income” for the purpose of computing a U.S. shareholder’s foreign tax credit limitations for U.S. foreign tax credit purposes. The rules relating to foreign tax credits are complex, and each U.S. holder of our ordinary shares should consult his or her tax advisor to determine whether and if he or she would be entitled to this credit.
This summary of Israeli taxation is based on existing treaties, laws, regulations and judicial and administrative interpretations. There can be no assurance that any of these may not be amended or repealed, possibly with retroactive effect, or that a tax authority may take a contrary position. Also, this summary does not address the tax consequences that may be applicable to specific persons based on their individual circumstances. It also does not address any local or other foreign tax consequences. A shareholder or holder of Series A Notes should consult his or her own tax advisor as to the specific tax consequences of purchasing, holding or transferring shares or Series A Notes of Elbit Systems.
United States Federal Income Tax Considerations
General
The following is a summary of material U.S. federal income tax considerations regarding the acquisition, ownership and disposition of Elbit Systems’ ordinary shares by a “U.S. Shareholder”, which, for these purposes, means a beneficial owner of an ordinary share who is, for U.S. federal income tax purposes:
|
|
•
|
a citizen or individual resident of the United States for U.S. federal income tax purposes;
|
|
|
•
|
a corporation (or an entity taxable as a corporation for U.S. federal income tax purposes) created or organized in or under the laws of the United States or any political subdivision thereof (including the District of Columbia);
|
|
|
•
|
an estate whose income is subject to U.S. federal income taxation regardless of its source; or
|
|
|
•
|
a trust if (A) a U.S. court is able to exercise primary supervision over the trust’s administration and (B) one or more U.S. persons have the authority to control all of the trust’s substantial decisions.
|
If a partnership or other entity treated as a partnership for U.S. federal income tax purposes holds ordinary shares of Elbit Systems, the tax treatment of a partner generally will depend upon the status of the partner and the activities of the partnership. A partner in a partnership that holds our ordinary shares is urged to consult its own tax advisor regarding the specific tax consequences of owning and disposing of our ordinary shares.
92
This summary is based on provisions of the Code, existing and proposed U.S. Treasury regulations, administrative pronouncements, rulings and judicial decisions in effect as of the date of this annual report. These authorities and their interpretation are subject to change, possibly with retroactive effect. In addition, this summary does not discuss all aspects of U.S. federal income taxation that may be applicable to investors in light of their particular circumstances or to investors who are subject to special treatment under U.S. federal income tax law, including U.S. expatriates, insurance companies, banks, regulated investment companies, securities broker-dealers, financial institutions, tax-exempt organizations, persons holding ordinary shares as part of a straddle, hedging or conversion transaction, persons subject to the alternative minimum tax, persons who acquired their Elbit Systems’ ordinary shares pursuant to the exercise of employee stock options or otherwise as compensation, persons having a functional currency other than the U.S. dollar, persons owning (directly, indirectly or by attribution) 10% or more of our outstanding voting shares and persons not holding ordinary shares as capital assets.
Dividends
A U.S. Shareholder generally will be required to include in gross income, as ordinary dividends, the amount of any distributions paid on ordinary shares of Elbit Systems to the extent of Elbit Systems’ earnings and profits out of current or accumulated earnings and profits, including the amount of any Israeli taxes withheld in respect of such dividend. Dividends paid by Elbit Systems do not qualify for the dividends-received deduction applicable in certain cases to U.S. corporations.
The amount of any distribution paid in NIS, including the amount of any Israeli withholding tax thereon, will be included in the gross income of a U.S. Shareholder of ordinary shares in an amount equal to the U.S. dollar value of the NIS calculated by reference to the spot rate of exchange in effect on the date the distribution is received by the U.S. Shareholder. If a U.S. Shareholder converts dividends paid in NIS into U.S. dollars on the day Elbit Systems distributes the dividends, the U.S. Shareholder generally should not be required to recognize foreign currency gain or loss with respect to such conversion. If the NIS received in the distribution are not converted into U.S. dollars on the date of receipt, any foreign currency gain or loss recognized upon a subsequent conversion or other disposition of the NIS will be treated as U.S. source ordinary income or loss. Special rules govern and special elections are available to accrual method taxpayers to determine the U.S. dollar amount that should be included in income in the case of taxes withheld in a foreign currency. Accrual basis taxpayers are urged to consult their own tax advisors regarding the requirements and the elections applicable in this regard.
Dividends paid by us to a U.S. Shareholder on our ordinary shares will be treated as foreign source income and will generally be categorized as “passive category income” for U.S. foreign tax credit purposes. Subject to the limitations in the Code, as modified by the applicable tax treaty, a U.S. Shareholder may elect to claim a foreign tax credit against its U.S. federal income tax liability for Israeli income tax withheld from dividends received in respect of ordinary shares. U.S. Shareholders who do not elect to claim the foreign tax credit may instead claim a deduction for Israeli income tax withheld, but only for a year in which the U.S. Shareholder elects to do so with respect to all foreign income taxes. A deduction does not reduce U.S. tax on a dollar-for-dollar basis as it does for a tax credit. The deduction, however, is not subject to the limitations applicable to foreign tax credits. The rules relating to the determination of the foreign tax credit are complex. Accordingly, if you are a U.S. Shareholder of ordinary shares, you should consult your own tax advisor to determine whether and to what extent you would be entitled to the credit.
Certain U.S. Shareholders (including individuals) are eligible for reduced U.S. federal income tax rates in respect of “qualified dividend income.” Subject to applicable limitations, qualified dividend income included in income after December 31, 2012 is generally subject to U.S. federal taxation at a maximum rate of 15%, or 20% in the case of taxpayers with annual taxable income that exceeds certain thresholds. For this purpose, qualified dividend income generally includes dividends paid by a non-U.S. corporation if, among other things, the U.S. Shareholder meets certain minimum holding periods and the non-U.S. corporation satisfies certain requirements, including that either: (i) the shares with respect to which the dividend has been paid are readily tradable on an established securities market in the United States; or (ii) the non-U.S. corporation is eligible for the benefits of a comprehensive U.S. income tax treaty (such as the U.S. Treaty), which provides for the exchange of information. We currently believe that dividends paid with respect to our ordinary shares should constitute qualified dividend income for U.S. federal income tax purposes. We anticipate that our dividends will be reported as qualified dividends on Forms 1099-DIV delivered to U.S. Shareholders. Each individual U.S. Shareholder of ordinary shares is urged to consult his or her own tax advisor regarding the availability to him of the reduced dividend tax rate in light of his or her own particular situation and regarding the computations of his or her foreign tax credit limitation with respect to any qualified dividend income paid by us, as applicable.
93
Sale, exchange or other disposition
Upon the sale, exchange or other disposition of ordinary shares, a U.S. Shareholder generally will recognize capital gain or loss equal to the difference between the U.S. dollar value of the amount realized on the sale, exchange or other disposition and the U.S. Shareholder’s adjusted tax basis, determined in U.S. dollars, of the ordinary shares. Any gain or loss recognized upon the sale, exchange or other disposition of the ordinary shares will be treated as long-term capital gain or loss if, at the time of the sale, exchange or other disposition, the holding period of the ordinary shares exceeds one year. In the case of individual U.S. Shareholders, capital gains generally are subject to U.S. federal income tax at preferential rates if specified minimum holding periods are met. The deductibility of capital losses by a U.S. Shareholder is subject to significant limitations. U.S. Shareholders should consult their own tax advisors in this regard.
In general, gain or loss recognized by a U.S. Shareholder on the sale, exchange or other disposition of ordinary shares will be U.S. source income or loss for U.S. foreign tax credit purposes. Pursuant to the applicable tax treaty, however, gain from the sale or other disposition of ordinary shares by a holder who is a U.S. resident, for purposes of the applicable tax treaty, and who sells the ordinary shares within Israel, may be treated as foreign source income for U.S. foreign tax credit purposes.
U.S. Shareholders who hold ordinary shares through an Israeli stockbroker or other Israeli intermediary may be subject to an Israeli withholding tax on any capital gains recognized if the U.S. Shareholder does not obtain approval of an exemption from the Israeli Tax Authorities. U.S. Shareholders are advised that any Israeli tax paid under circumstances in which an exemption from such tax was available will not give rise to a deduction or credit for foreign taxes paid for U.S. federal income tax purposes. U.S. Shareholders are advised to consult their Israeli stockbroker or intermediary regarding the procedures for obtaining an exemption.
If a U.S. Shareholder receives NIS upon the sale of ordinary shares, that U.S. Shareholder may recognize ordinary income or loss as a result of currency fluctuations between the date of the sale of the ordinary shares and the date the sales proceeds are converted into U.S. dollars.
Passive Foreign Investment Company rules
A non-U.S. corporation will be classified as a Passive Foreign Investment Company (a PFIC) for any taxable year if at least 75% of its gross income consists of passive income (such as dividends, interest, rents, royalties (other than rents or royalties derived in the active conduct of a trade or business and received from an unrelated person) or gains on the disposition of certain minority interests), or at least 50% of the average value of its assets consists of assets that produce, or are held for the production of, passive income. We currently believe that we were not a PFIC for the year ended December 31, 2012. However, this conclusion is a factual determination that must be made at the close of each year and is based on, among other things, a valuation of our ordinary shares and assets, which will likely change from time to time. If we were characterized as a PFIC for any taxable year, a U.S. Shareholder would suffer adverse tax consequences. These consequences may include having gains realized on the disposition of ordinary shares treated as ordinary income rather than capital gains and being subject to punitive interest charges on certain dividends and on the proceeds of the sale or other disposition of the ordinary shares. Furthermore, dividends paid by a PFIC are not eligible to be treated as “qualified dividend income” (as discussed above).
The PFIC rules are complex. U.S. Shareholders should consult their own tax advisors regarding the potential application of the PFIC rules to the ownership of our ordinary shares.
Informational reporting and backup withholding
Dividend payments with respect to ordinary shares and proceeds from the sale, exchange or other disposition of ordinary shares may be subject to informational reporting to the Internal Revenue Service (the IRS) and possible U.S. backup withholding at a current rate of 28%. Backup withholding will not apply, however, to a holder who furnishes a correct taxpayer identification number or certificate of foreign status and makes any other required certification or who is otherwise exempt from backup withholding. U.S. persons who are required to establish their exempt status generally must provide IRS Form W-9 (Request for Taxpayer Identification Number and Certification). Non-U.S. Shareholders generally will not be subject to U.S. informational reporting or backup withholding. However, such holders may be required to provide certification of non-U.S. status (generally on IRS Form W-8BEN) in connection with payments received in the United States or through certain U.S.-related financial intermediaries.
94
Backup withholding is not an additional tax. Amounts withheld as backup withholding may be credited against a holder’s U.S. federal income tax liability, and a holder may obtain a refund of any excess amounts withheld by filing the appropriate claim for refund with the IRS and furnishing any required information.
Holders of our ordinary shares should consult their own tax advisors concerning the specific U.S. federal, state and local tax consequences of the ownership and disposition of the ordinary shares in light of their particular situations as well as any consequences arising under the laws of any other taxing jurisdiction. In particular, U.S. Shareholders are urged to consult their own tax advisors concerning whether they will be eligible for benefits under the above-mentioned tax treaty.
Documents on Display
We are subject to the informational requirements of the Securities Exchange Act of 1934, as amended. In accordance with these requirements, we file reports and other information with the SEC. These materials, including this annual report and its exhibits, may be inspected and copied at the SEC’s Public Reference Room (the Public Reference Room) at 100 F Street, N.E., Washington, D.C. 20549, and copies of the materials may be obtained from the Public Reference Room at prescribed rates. The public may obtain information on the operation of the Public Reference Room by calling the SEC in the United States at 1-800-SEC-0330.
General
Market risks relating to our operations result primarily from changes in exchange rates and interest rates. We do not believe that we were exposed to any material market risk at December 31, 2012. We take various measures to compensate for the effects and fluctuation in both exchange rates and interest rates. We use financial instruments and derivatives in order to limit the exposure to risks deriving from changes in exchange rates and interest rates. The use of such instruments does not expose us to additional significant exchange rate or interest rate risks because the derivatives are covering expenses in the corresponding underlying assets, liabilities or forecasted transactions. No derivatives instruments are entered into for trading purposes.
Exchange Rate Risk Management
General
While our functional currency is the U.S. dollar, we also have some non-U.S. dollar or non-U.S. dollar linked currency exposures. These exposures are mainly derived from our revenues and expenses denominated in foreign currencies and non-U.S. dollar accounts receivable, payments to suppliers and subcontractors, obligations in other currencies and payroll related expenses incurred, mainly in NIS. Some subcontractors are paid in local currency under prime contracts where we are paid in U.S. dollars.
We take various measures to compensate for the effects of fluctuations in exchange rates. These measures include currency hedging transactions (in which we purchase foreign exchange contracts to reduce the volatility of cash flows primarily related to forecasted revenue denominated in certain foreign currencies) and attempts to maintain a balance between monetary assets and liabilities in our functional currencies. We also attempt to share currency risks with subcontractors on a “back-to-back” basis, by having the subcontractor assume a proportional amount of the exchange risk.
We use currency hedging contracts to limit exposure to changes in foreign currency exchange rates associated with revenue denominated in a foreign currency, primarily GBP and Euro. We also use currency hedging contracts to hedge against anticipated costs to be incurred in a foreign currency, primarily NIS, and to limit our exposure to exchange rate fluctuations related to payroll expenses incurred in NIS. The objective of the foreign exchange contracts is to better ensure that the U.S. dollar-equivalent cash flows are not adversely affected by changes in U.S. dollar/foreign currency exchange rates. In accordance with ASC 815 “Derivatives and Hedging” (ASC 815), these contracts are designated as cash flow hedges. The gain on the effective portion of a cash flow hedge is initially reported as a component of accumulated other comprehensive income and subsequently reclassified into revenues when the hedged exposure affects revenues, or as financial expenses, if the hedged transaction becomes probable of not occurring. Any gain or loss after a hedge is de-designated, because the hedged transaction is no longer probable of occurring or related to an ineffective portion of a hedge, is recognized in “financial expenses, net” in our consolidated statements of income.
95
As of December 31, 2012, the principal amount of our outstanding forward contracts was $671.1 million. Most of these contracts met the requirements of hedge accounting.
The table below provides information regarding our derivatives instruments held in order to limit the exposure to exchange rate fluctuation as of December 31, 2012.
The table below does not include information regarding the cross currency interest rate swap transactions in order to effectively hedge the effect of interest and exchange rate differences resulting from the NIS Series A Notes.
|
Maturity Date - Notional Amount
|
|||||||||||||||||||
|
2013
|
2014
|
2015
|
2016
|
2017 onwards
|
Total
|
Fair Value at December 31, 2012
|
|||||||||||||
|
( US dollars in millions)
|
|||||||||||||||||||
|
Sell US$ and buy:
|
|||||||||||||||||||
|
EUR
|
44.8
|
12.5
|
2.6
|
0.8
|
–
|
60.7
|
(0.9
|
)
|
|||||||||||
|
GBP
|
43.0
|
2.3
|
–
|
–
|
–
|
45.3
|
1.2
|
||||||||||||
|
NIS
|
386.0
|
–
|
–
|
–
|
–
|
386.0
|
17.2
|
||||||||||||
|
Other currencies
|
1.7
|
2.5
|
(0.7
|
) |
0.1
|
0.7
|
4.3
|
1.4
|
|||||||||||
|
Total
|
475.5
|
17.3
|
1.9
|
0.9
|
0.7
|
496.3
|
18.9
|
||||||||||||
|
Maturity Date - Notional Amount
|
|||||||||||||||||||
|
2013
|
2014
|
2015
|
2016
|
2017 onwards
|
Total
|
Fair Value at December 31, 2012
|
|||||||||||||
|
( US dollars in millions)
|
|||||||||||||||||||
|
Buy US$ and sell:
|
|||||||||||||||||||
|
EUR
|
81.8
|
40.1
|
7.3
|
2.5
|
–
|
131.7
|
2.2
|
||||||||||||
|
GBP
|
27.7
|
0.3
|
0.3
|
–
|
–
|
28.3
|
(0.1
|
)
|
|||||||||||
|
Other currencies
|
11.5
|
2.1
|
0.7
|
0.7
|
(0.2
|
) |
14.8
|
(1.3
|
)
|
||||||||||
|
Total
|
121.0
|
42.5
|
8.3
|
3.2
|
(0.2
|
) |
174.8
|
0.8
|
|||||||||||
At December 31, 2012, a 5% strengthening of the U.S. dollar relative to the currencies in which our derivative instruments were denominated would have resulted in an decrease in our unrealized gains by $20.4 million, and a 5% weakening in the value of the U.S. dollar relative to the currencies in which our derivative instruments were denominated would have resulted in an increase in our unrealized gains of $22.3 million. This calculation assumes that each exchange rate would have changed in the same direction relative to the U.S. dollar. Consistent with the use of these contracts to neutralize the effect of exchange rate fluctuations, such unrealized losses or gains would be offset by corresponding gains or losses, respectively, in the remeasurement of the underlying transactions being hedged. When taken together, these forward currency contracts and the offsetting underlying commitments did not create material market risk.
Interest Rate Risk Management
On December 31, 2012, our liquid assets and obligations were comprised of cash and cash equivalents, bank deposits, short and long-term loans and Series A Notes. Our deposits are mainly in U.S. dollars.
In June 2010, we completed a public offering on the TASE of NIS 1.1 billion (approximately $283 million), payable in ten equal annual installments on June 30 of each of the years 2011 through 2020. The Series A Notes bear a fixed interest rate of 4.84% per annum, payable on June 30 and December 30 of each of the years 2010 through 2020. In March 2012, we issued through a public offering on the TASE additional Series A Notes in the aggregate principal amount of NIS 807 million (approximately $217 million), and in May 2012, we issued additional Series A Notes in an aggregate principal amount of NIS 92 million (approximately $24 million) through a private placement to Israeli institutional investors. We also entered into ten-year cross currency interest rate swap transactions in order to effectively hedge the effect of interest and exchange rate differences resulting from the NIS Series A Notes (including the additional Series A Notes that were issued in March and May 2012). Under the cross currency interest rate swaps, the Company received fixed NIS at a rate of 4.84% on NIS 1.1 billion and pays floating six-month USD LIBOR + an average spread of 1.84% on $450 million, which reflects the U.S. dollar value of the Series A Notes on the specific dates the transactions were entered. (See above Item 5. Operating and Financial Review and Prospects – Israeli Debt Offering.)
The remaining debt is mainly in bank loans in U.S. dollars at floating interest rates . The majority of our borrowings are usually linked to the relevant LIBOR plus a spread of 1.6% - 2.5%, and therefore are exposed to changes in interest rates. Most of our loans will mature within the next two to three years.
96
Should interest rates either increase or decrease, such change may affect our results of operations due to changes in the cost of the liabilities and the return on the assets that are based on variable rates. At December 31, 2012, a 10% change in the then current interest rates would not have had a material impact on our financial results.
Not applicable.
Not applicable.
Not applicable.
Disclosure Controls and Procedures.
We maintain disclosure controls and procedures designed to ensure that information required to be disclosed in our periodic filings with the SEC is recorded, processed, summarized and reported within the time periods specified in the SEC’s rules and forms. These controls and procedures also provide that such information is accumulated and communicated to our management, including our Chief Executive Officer (CEO) and Chief Financial Officer (CFO), as appropriate, to allow timely decisions regarding required disclosure. In designing and evaluating the disclosure controls and procedures, management recognized that any controls and procedures, no matter how well designed and operated, can provide only reasonable assurance of achieving the desired control objectives. Also, management necessarily was required to use its judgment in evaluating the cost to benefit relationship of possible disclosure controls and procedures. As of December 31, 2012, we performed an evaluation of the effectiveness of the design and operation of our disclosure controls and procedures. The evaluation was performed with the participation of senior management of major business areas and key corporate functions, and under the supervision of the CEO and CFO. Based on the evaluation, our management, including the CEO and CFO, concluded that our disclosure controls and procedures were effective. There have been no significant changes in our internal controls or in other factors that could significantly affect internal controls after the date we completed the evaluation.
Management’s Annual Report on Internal Control Over Financial Reporting
Our management is responsible for establishing and maintaining adequate internal control over financial reporting. Internal control over financial reporting is defined in Rules 13a-15(f) under the Securities Exchange Act of 1934, as amended, as a process designed to provide reasonable assurance regarding the reliability of financial reporting and the preparation of financial statements for external purposes in accordance with generally accepted accounting principles and includes those policies and procedures that:
(1) pertain to the maintenance of records that in reasonable detail accurately and fairly reflect our transactions and dispositions of assets;
(2) provide reasonable assurance that transactions are recorded as necessary to permit preparation of financial statements in accordance with generally accepted accounting principles, and that our receipts and expenditures are being made in accordance with authorizations of our management and directors; and
97
(3) provide reasonable assurance regarding prevention or timely detection of unauthorized acquisition, use or disposition of our assets that could have a material effect on the financial statements.
Because of its inherent limitations, internal control over financial reporting may not prevent or detect misstatements including the possibility of human error and the circumvention or overriding of sound control procedures. Projections of any evaluation of effectiveness to future periods are subject to the risks that controls may become inadequate because of changes in conditions, or that the degree of compliance with the policies or procedures may deteriorate.
Our management, including our CEO and CFO, assessed the effectiveness of our internal control over financial reporting as of December 31, 2012. In making this assessment, management used the criteria set forth by the Committee of Sponsoring Organizations of the Treadway Commission (COSO) in “Internal Control – Integrated Framework.” Based on this assessment, management believes that, as of December 31, 2012, our internal control over financial reporting is effective.
The effectiveness of our internal control over financial reporting as of December 31, 2012 has been audited by Kost Forer Gabbay & Kasierer (Kost), an independent registered public accounting firm in Israel and a member of Ernst & Young Global (E&Y), as stated in their report included in Item 18. Financial Statements.
Changes in Internal Control over Financial Reporting.
During the period covered by this annual report, there have not been any changes in our internal control over financial reporting (as such term is defined in Rules 13a-15(f) and 15d-15(f) under the Securities Exchange Act of 1934, as amended) that have materially affected, or are reasonably likely to materially affect, our internal control over financial reporting.
Avraham Asheri, Yehoshua Gleitman and Yigal Ne’eman, members of our Audit Committee, each meets the criteria of an “Audit Committee Financial Expert” under the applicable rules and regulations of the SEC, and each of their designations as an Audit Committee Financial Expert has been ratified by the Board. They are all “independent”, as that term is defined in the Nasdaq listing standards.
We have adopted a code of business conduct and ethics that is applicable to all our directors, officers and employees including our principal executive, financial and accounting officers and persons performing similar functions. The code of ethics was approved by our Board and covers areas of professional and business conduct. It is intended to promote honest and ethical behavior, including fair dealing and the ethical handling of conflicts of interest. The code of ethics includes a “whistleblower” process to encourage reports of violations. We provide training on our code of ethics to all of our employees. Our code of ethics is posted on our website:
www.elbitsystems.com
.
At the annual general shareholders meeting held in November 2012, our shareholders reappointed Kost to serve as our independent auditors. Kost and other E&Y affiliates billed the Company the following fees for professional services in each of the last two fiscal years:
|
Year Ended December 31
|
||||||||
|
2012
|
2011
|
|||||||
|
(U.S. dollars in thousands
)
|
||||||||
|
Audit Fees
|
$ | 3,129 | $ | 2,961 | ||||
|
Tax Fees
|
$ | 415 | $ | 444 | ||||
|
Other Fees
|
$ | 355 | 413 | |||||
|
Total
|
$ | 3,899 | $ | 3,818 | ||||
“Audit Fees” are the aggregate fees for the audit of our consolidated annual financial statements. This category also includes services generally provided by the independent auditor, such as consents and assistance with and review of documents filed with the SEC, as well as with documentation related to Sarbanes-Oxley Act implementation. It also includes fees billed for accounting consultations regarding the accounting treatment of matters that occur in the regular course of business, implications of new accounting pronouncements and other accounting issues that occur from time to time.
98
“Tax Fees” are the aggregate fees billed for professional services rendered for tax compliance and tax advice, other than in connection with the audit. Tax compliance involves preparation of original and amended tax returns, tax planning and tax advice.
“Other Fees” are fees billed for services related to conceptual analysis of finance software.
Kost and other E&Y affiliates did not bill the Company for services other than the Audit Fees, Tax Fees and Other Fees described above for fiscal year 2012 or fiscal year 2011.
Our Audit Committee has adopted a pre-approval policy for the engagement of our independent accountant to perform permitted audit and non-audit services. Under this policy, which is designed to assure that such engagements do not impair the independence of our auditors, the Audit Committee pre-approves annually a range of specific audit and non-audit services in the categories of Audit Service, Audit-Related Services, Tax Services and other services that may be performed by our independent accountants, and the maximum pre-approved fees that may be paid as compensation for each pre-approved service in those categories. The Audit Committee is notified periodically and before commencement of any work in these categories. Any proposed services exceeding the pre-approved fees or which includes other scope of work requires specific pre-approval by the Audit Committee. Accordingly, all of the above-mentioned independent audit fees were pre-approved by our Audit Committee.
Not applicable.
Reference is made to the disclosure relating to changes in shareholdings of major shareholders in Item 7 of this annual report on Form 20-F.
In September 2011, we announced that our Board authorized us to repurchase up to one million of our ordinary shares over the following 12 months, in open market purchases on the TASE. Set forth below is a summary of the ordinary shares repurchased by us during 2012 and the approximate maximum number of ordinary shares that may yet be purchased under the repurchase plan approved by our Board (the Plan):
|
Period
|
Total Number of Shares Purchased by the Company
|
Average Price Paid Per Share
|
Total Number of Shares Purchased as Part of the Plan
|
Maximum Number of Shares that May Yet Be Purchased Under the Plan
|
||||||||||||
|
January 1 – January 31, 2012
|
64,901 | $ | 40.74 | 64,901 | 694,731 | |||||||||||
|
February 1 – February 29, 2012
|
131,631 | $ | 38.23 | 131,631 | 563,100 | |||||||||||
|
March 1 – March 31, 2012
|
63,100 | $ | 36.33 | 63.100 | 500,000 | |||||||||||
|
April 1 – April 30, 2012
|
-- | $ | -- | -- | 500,000 | |||||||||||
|
May 1 – May 31, 2012
|
-- | $ | -- | -- | 500,000 | |||||||||||
|
June 1 – June 30, 2012
|
94,722 | $ | 34.05 | 94,722 | 405,278 | |||||||||||
|
July 1 – July 31, 2012
|
130,135 | $ | 32.43 | 130,135 | 275,143 | |||||||||||
|
August 1 – August 31, 2012
|
227,057 | $ | 30.97 | 227,057 | 48,086 | |||||||||||
|
September 1 – September 30, 2012
|
48,086 | $ | 31.46 | 48,086 | -- | |||||||||||
Not Applicable.
99
As a foreign private issuer, Nasdaq Marketplace Rule 5615(a)(3) allows us to follow Israeli corporate governance practices instead of certain Nasdaq Stock Market requirements. That rule requires that we provide Nasdaq with a letter from outside Israeli counsel stating that our corporate governance practices are not prohibited by Israeli law and disclose in our annual reports the Nasdaq requirements we do not follow and the equivalent Israeli requirement. In 2011, we notified Nasdaq of our intent to follow Israeli home country practice in connection with an amendment to our 2007 Stock Option Plan, which was approved by our board of directors as permitted by Israeli law without approval by our shareholders. See also “Item 10 – Additional Information – Memorandum and Articles of Association – Approval of Certain Transactions.”
In addition, as described above in “Item 10 – Additional Information – Memorandum and Articles of Association – Meetings of Shareholders”, under our corporate governance documents and applicable provisions of the Israeli Companies Law, the quorum requirement for an adjourned meeting of our shareholders differs from the relevant Nasdaq requirement.
Not applicable.
Not applicable.
See Consolidated Financial Statements attached to this annual report on Form 20-F.
100
(a) Index to Financial Statements
|
Page
|
||
|
Report of Independent Registered Public Accounting Firm
|
F-2
|
|
|
Report of Independent Registered Public Accounting Firm on Internal Control over Financial Reporting
|
F-3
|
|
|
Consolidated Balance Sheets at December 31, 2012 and 2011
|
F-4
|
|
|
Consolidated Statements of Income
|
F-6
|
|
|
Consolidated Statements of Changes in Equity
|
F-8
|
|
|
Consolidated Statements of Cash Flows
|
F-11
|
|
|
Notes to Consolidated Financial Statements
|
F-13
|
|
|
Schedule II – Valuation and Qualifying Accounts
|
S-1
|
(b) Exhibits
|
1.1
|
Elbit Systems’ Memorandum of Association
(1)
|
|
1.2
|
Elbit Systems’ Restated Articles of Association
(2)
|
|
4.1
|
Elbit Systems 2007 Stock Option Plan, as amended
(3)
|
|
4.2
|
Elbit Systems’ Post Merger Stock Option Plan (Summary in English)
(1)
|
|
8
|
Primary Operating Subsidiaries of Elbit Systems
|
|
12.1
|
Certification of Chief Executive Officer of the Registrant pursuant to Section 302 of the Sarbanes-Oxley Act of 2002
|
|
12.2
|
Certification of Chief Financial Officer of the Registrant pursuant to Section 302 of the Sarbanes-Oxley Act of 2002
|
|
13.1
|
Certification of Chief Executive Officer of the Registrant pursuant to Section 906 of the Sarbanes-Oxley Act of 2002
|
|
13.2
|
Certification of Chief Financial Officer of the Registrant pursuant to Section 906 of the Sarbanes-Oxley Act of 2002
|
|
15.1
|
Consent of Kost Forer Gabbay & Kasierer
|
|
|
(1)
|
Filed as an exhibit to Elbit Systems’ Annual Report on Form 20-F (File No. 0-28998) for the year ended December 31, 2000, which was filed with the Securities and Exchange Commission on April 5, 2001, and incorporated herein by reference.
|
|
|
(2)
|
Filed as an exhibit to Elbit Systems’ Report on Form 6-K for March 2008, which was filed by Elbit Systems with the Securities and Exchange Commission on March 26, 2008, and incorporated herein by reference.
|
|
|
(3)
|
Filed as exhibit 4.3 to Elbit Systems’ post-effective amendment No. 1 to registration statement on Form S-8 (File No. 333-139512), which was filed by Elbit Systems with the Securities and Exchange Commission on December 1, 2011, and incorporated herein by reference.
|
101
SIGNATURES
Pursuant to the requirements of Section 12 of the Securities Exchange Act of 1934, the Registrant certifies that it meets all of the requirements for filing on Form 20-F and has duly caused this annual report to be signed on its behalf by the undersigned, thereunto duly authorized.
Date: March 13, 2013
|
ELBIT SYSTEMS LTD.
|
|||
|
By:
|
/s/ JOSEPH ACKERMAN
|
||
|
Name:
|
Joseph Ackerman
|
||
|
Title:
|
President and Chief Executive Officer
|
||
|
(Principal Executive Officer)
|
|||
102
|
ELBIT SYSTEMS LTD. AND SUBSIDIARIES
|
CONSOLIDATED FINANCIAL STATEMENTS
as of December 31, 2012
|
ELBIT SYSTEMS LTD. AND SUBSIDIARIES
|
CONSOLIDATED FINANCIAL STATEMENTS
as of December 31, 2012
in thousands of U.S. dollars
C O N T E N T S
|
|
Page
|
|
|
|
|
F - 2 - F - 3
|
|
|
|
|
|
CONSOLIDATED FINANCIAL STATEMENTS:
|
|
|
|
|
|
F - 4 - F - 5
|
|
|
|
|
|
F - 6
|
|
|
|
|
|
F - 7
|
|
|
F - 8 - F - 10
|
|
|
|
|
|
F - 11 - F - 13
|
|
|
|
|
|
F - 13 - F - 64
|

|
Kost Forer Gabbay & Kasierer
3 Aminadav St.
Tel-Aviv 67067, Israel
Tel: 972 (3)6232525
Fax: 972 (3)5622555
www.ey.com
|
To the Shareholders and Board of Directors of
Elbit Systems Ltd.
We have audited the accompanying consolidated balance sheets of Elbit Systems Ltd. (“Elbit Systems”) and subsidiaries as of December 31, 2012 and 2011, and the related consolidated statements of income, comprehensive income, changes in equity and cash flows for each of the three years in the period ended December 31, 2012. Our audits also included the financial statement schedule listed in the index at Item 19. These consolidated financial statements and schedule are the responsibility of Elbit Systems’ management. Our responsibility is to express an opinion on these consolidated financial statements and schedule based on our audits.
We conducted our audits in accordance with the standards of the Public Company Accounting Oversight Board (United States). Those standards require that we plan and perform the audits to obtain reasonable assurance about whether the financial statements are free of material misstatement. An audit includes examining, on a test basis, evidence supporting the amounts and disclosures in the financial statements. An audit also includes assessing the accounting principles used and significant estimates made by management, as well as evaluating the overall financial statement presentation. We believe that our audits provide a reasonable basis for our opinion.
In our opinion, the consolidated financial statements referred to above present fairly, in all material respects, the consolidated financial position of Elbit Systems and subsidiaries as of December 31, 2012 and 2011, and the consolidated results of their operations and their cash flows for each of the three years in the period ended December 31, 2012, in conformity with U.S generally accepted accounting principles. Also, in our opinion, the related financial statement schedule, when considered in relation to the basic financial statements taken as a whole, presents fairly in all material respects the information set forth therein.
We also have audited, in accordance with the standards of the Public Company Accounting Oversight Board (United States), Elbit Systems’ internal control over financial reporting as of December 31, 2012, based on criteria established in Internal Control-Integrated Framework issued by the Committee of Sponsoring Organizations of the Treadway Commission, and our report dated March 12, 2013, expressed an unqualified opinion thereon.
|
Kost Forer Gabbay & Kasierer
A member of Ernst & Young Global
|
Tel Aviv, Israel
March 12, 2013
F - 2
|
|
Kost Forer Gabbay & Kasierer
3 Aminadav St.
Tel-Aviv 67067, Israel
Tel: 972 (3)6232525
Fax: 972 (3)5622555
www.ey.com
|
REPORT OF INDEPENDENT REGISTERED PUBLIC ACCOUNTING FIRM
ON INTERNAL CONTROL OVER FINANCIAL REPORTING
To the Shareholders and Board of Directors of
Elbit Systems Ltd.
We have audited Elbit Systems Ltd.’s (“Elbit Systems”) internal control over financial reporting as of December 31, 2012, based on criteria established in Internal Control-Integrated Framework issued by the Committee of Sponsoring Organizations of the Treadway Commission (the “COSO criteria”). Elbit Systems’ management is responsible for maintaining effective internal control over financial reporting and for its assessment of the effectiveness of internal control over financial reporting included in the Management’s Annual Report on Internal Control over Financial Reporting. Our responsibility is to express an opinion on Elbit Systems’ internal control over financial reporting based on our audit.
We conducted our audit in accordance with the standards of the Public Company Accounting Oversight Board (United States). Those standards require that we plan and perform the audit to obtain reasonable assurance about whether effective internal control over financial reporting was maintained in all material respects. Our audit included obtaining an understanding of internal control over financial reporting, assessing the risk that a material weakness exists, testing and evaluating the design and operating effectiveness of internal control based on the assessed risk, and performing such other procedures as we considered necessary in the circumstances. We believe that our audit provides a reasonable basis for our opinion.
A company’s internal control over financial reporting is a process designed to provide reasonable assurance regarding the reliability of financial reporting and the preparation of financial statements for external purposes in accordance with generally accepted accounting principles. A company’s internal control over financial reporting includes those policies and procedures that (1) pertain to the maintenance of records that, in reasonable detail, accurately and fairly reflect the transactions and dispositions of the assets of the company; (2) provide reasonable assurance that transactions are recorded as necessary to permit preparation of financial statements in accordance with generally accepted accounting principles, and that receipts and expenditures of the company are being made only in accordance with authorizations of management and directors of the company; and (3) provide reasonable assurance regarding prevention or timely detection of unauthorized acquisition, use or disposition of the company’s assets that could have a material effect on the financial statements.
Because of its inherent limitations, internal control over financial reporting may not prevent or detect misstatements. Also, projections of any evaluation of effectiveness to future periods are subject to the risk that controls may become inadequate because of changes in conditions, or that the degree of compliance with the policies or procedures may deteriorate.
In our opinion, Elbit Systems maintained, in all material respects, effective internal control over financial reporting, as of December 31, 2012, based on the COSO criteria.
We also have audited, in accordance with the standards of the Public Company Accounting Oversight Board (United States), the consolidated balance sheets of Elbit Systems and subsidiaries as of December 31, 2012 and 2011, and the related consolidated statements of income, comprehensive income, changes in equity and cash flows for each of the three years in the period ended December 31, 2012, and our report dated March 12, 2013, expressed an unqualified opinion thereon.
|
Kost Forer Gabbay & Kasierer
A member of Ernst & Young Global
|
Tel Aviv, Israel
March 12, 2013
F - 3
ELBIT SYSTEMS LTD. AND SUBSIDIARIES
|
|
|
|
|
|
December 31,
|
|
||||||
|
|
|
Note
|
|
|
2012
|
|
|
2011
|
|
|||
|
|
|
|
|
|
|
|
|
|
|
|||
|
CURRENT ASSETS:
|
|
|
|
|
|
|
|
|
|
|||
|
Cash and cash equivalents
|
|
|
|
|
$
|
199,241
|
|
|
$
|
202,577
|
|
|
|
Short-term bank deposits
|
|
|
|
|
|
15,444
|
|
|
|
21,693
|
|
|
|
Available-for-sale marketable securities
|
(9)
|
50,111
|
-
|
|||||||||
|
Trade and unbilled receivables, net
|
|
|
(3)
|
|
|
|
688,129
|
|
|
669,524
|
|
|
|
Other receivables and prepaid expenses
|
|
|
(4)
|
|
|
|
180,103
|
|
|
180,024
|
|
|
|
Inventories, net of customer advances
|
|
|
(5)
|
|
|
|
751,247
|
|
|
|
761,269
|
|
|
Total current assets
|
|
|
|
|
|
|
1,884,275
|
|
|
|
1,835,087
|
|
|
|
|
|
|
|
|
|
|
|
|
|
|
|
|
LONG-TERM INVESTMENTS AND RECEIVABLES:
|
|
|
|
|
|
|
|
|
|
|
|
|
|
Investments in affiliated companies, partnerships and other companies
|
|
|
(6)
|
|
|
|
126,482
|
|
|
110,159
|
|
|
|
Long-term trade and unbilled receivables
|
|
|
(7)
|
|
|
|
229,687
|
|
|
|
162,762
|
|
|
Long-term bank deposits and other receivables
|
|
|
(8)
|
|
|
|
19,269
|
|
|
12,215
|
|
|
|
Deferred income taxes, net
|
|
|
(18F)
|
|
|
|
31,465
|
|
|
|
36,130
|
|
|
Severance pay fund
|
|
|
(2R)
|
|
|
|
302,680
|
|
|
|
283,477
|
|
|
|
|
|
|
|
|
|
709,583
|
|
|
|
604,743
|
|
|
|
|
|
|
|
|
|
|
|
|
|
|
|
|
PROPERTY, PLANT AND EQUIPMENT, NET
|
|
|
(10)
|
|
|
|
501,286
|
|
|
|
517,608
|
|
|
|
|
|
|
|
|
|
|
|
|
|
|
|
|
GOODWILL
|
|
|
(11)
|
|
|
|
500,598
|
|
|
|
499,326
|
|
|
|
|
|
|
|
|
|
|
|
|
|
|
|
|
OTHER INTANGIBLE ASSETS, NET
|
|
|
(11)
|
|
|
|
214,963
|
|
|
|
263,746
|
|
|
|
|
|
|
|
|
|
|
|
|
|
|
|
|
|
|
|
|
|
|
$
|
3,810,705
|
|
|
$
|
3,720,510
|
|
The accompanying notes are an integral part of the consolidated financial statements.
F - 4
ELBIT SYSTEMS LTD. AND SUBSIDIARIES
CONSOLIDATED BALANCE SHEETS
|
|
|
|
|
|
December 31,
|
|||||||
|
|
|
Note
|
|
|
2012
|
|
|
2011
|
|
|||
|
|
|
|
|
|
|
|
|
|
|
|||
|
CURRENT LIABILITIES:
|
|
|
|
|
|
|
|
|
|
|||
|
Short-term bank credit and loans
|
|
|
(12)
|
|
|
$
|
181
|
|
$
|
2,998
|
|
|
|
Current maturities of long-term loans and Series A Notes
|
|
|
|
|
|
90,056
|
|
|
|
127,627
|
|
|
|
Trade payables
|
|
|
|
|
|
|
260,975
|
|
|
|
303,601
|
|
|
Other payables and accrued expenses
|
|
|
(13)
|
|
|
|
704,450
|
|
|
|
756,529
|
|
|
Customer advances in excess of costs incurred on contracts in progress
|
|
|
(14)
|
|
|
|
453,382
|
|
|
|
407,222
|
|
|
Total current liabilities
|
|
|
|
|
|
|
1,509,044
|
|
|
|
1,597,977
|
|
|
|
|
|
|
|
|
|
|
|
|
|
|
|
|
LONG-TERM LIABILITIES:
|
|
|
|
|
|
|
|
|
|
|
|
|
|
Long-term loans, net of current maturities
|
|
|
(15)
|
|
|
|
173,745
|
|
|
|
302,255
|
|
|
Series A Notes, net of current maturities
|
|
|
(16)
|
|
|
|
408,610
|
|
|
|
235,319
|
|
|
Employee benefit liabilities
|
|
|
|
|
|
|
407,661
|
|
|
|
394,115
|
|
|
Deferred income taxes and tax liabilities, net
|
|
|
(18F)
|
|
|
|
48,787
|
|
|
|
48,467
|
|
|
Customer advances in excess of costs incurred on contracts in progress
|
|
|
(14)
|
|
|
|
156,497
|
|
|
|
154,696
|
|
|
Other long-term liabilities
|
|
|
|
|
|
|
55,735
|
|
|
|
59,961
|
|
|
|
|
|
|
|
|
|
1,251,035
|
|
|
|
1,194,813
|
|
|
|
|
|
|
|
|
|
|
|
|
|
|
|
|
COMMITMENTS AND CONTINGENT LIABILITIES
|
|
|
(20)
|
|
|
|
|
|
|
|
|
|
|
|
|
|
|
|
|
|
|
|
|
|
|
|
|
EQUITY:
|
|
|
(21)
|
|
|
|
|
|
|
|
|
|
|
Elbit Systems Ltd. equity:
|
|
|
|
|
|
|
|
|
|
|
|
|
|
Share capital:
|
|
|
|
|
|
|
|
|
|
|
|
|
|
Ordinary shares of 1 New Israeli Shekels (“NIS”) par value each;
Authorized – 80,000,000 shares as of
December 31, 2012 and 2011;
Issued 43,290,666 and 43,257,077 shares as
of December 31, 2012 and 2011, respectively;
Outstanding 41,881,745 and 42,607,788 shares
as of December 31, 2012 and 2011, respectively
|
|
|
|
|
|
|
12,105
|
|
|
12,093
|
|
|
|
Additional paid-in capital
|
|
|
|
|
|
237,234
|
|
|
232,407
|
|
||
|
Treasury shares – 1,408,921 and 649,289 shares as of December 31, 2012 and 2011, respectively
|
|
|
|
|
|
|
(40,428
|
) |
|
|
(14,422
|
) |
|
Accumulated other comprehensive loss
|
|
|
|
|
|
|
(33,544
|
) |
|
|
(56,226
|
) |
|
Retained earnings
|
|
|
|
|
|
|
841,748
|
|
|
724,485
|
|
|
|
Total Elbit Systems Ltd. equity
|
|
|
|
|
|
|
1,017,115
|
|
|
898,337
|
|
|
|
Non-controlling interests
|
|
|
|
|
|
|
33,511
|
|
|
29,383
|
|
|
|
|
|
|
|
|
|
|
1,050,626
|
|
|
927,720
|
|
|
|
|
|
|
|
|
|
|
|
|
|
|||
|
Total liabilities and equity
|
|
|
|
|
|
$
|
3,810,705
|
|
$
|
3,720,510
|
|
|
The accompanying notes are an integral part of the consolidated financial statements.
F - 5
ELBIT SYSTEMS LTD. AND SUBSIDIARIES
|
|
|
|
|
|
Year ended December 31,
|
|
||||||||||
|
|
|
Note
|
|
|
2012
|
|
|
2011
|
|
|
2010
|
|
||||
|
Revenues
|
|
|
(22)
|
|
|
$
|
2,888,607
|
|
$
|
2,817,465
|
|
|
$
|
2,670,133
|
|
|
|
Cost of revenues
|
|
|
|
|
|
|
2,072,742
|
|
|
2,085,451
|
|
|
|
1,872,263
|
|
|
|
Gross profit
|
|
|
|
|
|
|
815,865
|
|
|
732,014
|
|
|
|
797,870
|
|
|
|
Operating expenses:
|
|
|
|
|
|
|
|
|
|
|
|
|
|
|
||
|
Research and development, net
|
|
|
(23)
|
|
|
|
233,387
|
|
|
241,092
|
|
|
|
234,131
|
|
|
|
Marketing and selling
|
|
|
|
|
|
|
241,911
|
|
|
235,909
|
|
|
|
229,942
|
|
|
|
General and administrative
|
|
|
|
|
|
|
137,517
|
|
|
139,349
|
|
|
|
131,200
|
|
|
|
Other operating income, net
|
|
|
|
|
|
-
|
|
|
-
|
|
|
|
(4,756
|
) | ||
|
Total operating expenses
|
|
|
|
|
|
|
612,815
|
|
|
616,350
|
|
|
|
590,517
|
|
|
|
|
|
|
|
|
|
|
|
|
|
|
|
|
|
|
||
|
Operating income
|
|
|
|
|
|
|
203,050
|
|
|
115,664
|
|
|
|
207,353
|
|
|
|
Financial expenses, net
|
|
|
(24)
|
|
|
|
(26,086
|
) |
|
|
(13,569
|
) |
|
|
(21,251
|
) |
|
Other income, net
|
|
|
(25)
|
|
|
|
78
|
|
|
1,909
|
|
|
|
13,259
|
|
|
|
Income before income taxes
|
|
|
|
|
|
|
177,042
|
|
|
104,004
|
|
|
|
199,361
|
|
|
|
Income taxes
|
|
|
(18D)
|
|
|
|
17,099
|
|
|
13,624
|
|
|
|
24,037
|
|
|
|
|
|
|
|
|
|
|
159,943
|
|
|
90,380
|
|
|
|
175,324
|
|
|
|
|
|
|
|
|
|
|
|
|
|
|
|
|
|
|
||
|
Equity in net earnings of affiliated companies and partnerships
|
|
|
(6B)
|
|
|
|
11,160
|
|
|
15,377
|
|
|
|
18,796
|
|
|
|
Income from continuing operations
|
|
|
|
|
|
|
171,103
|
|
|
105,757
|
|
|
|
194,120
|
|
|
|
Income (loss) from discontinued operations and impairment, net
|
|
|
(1D)
|
|
|
|
(616
|
) |
|
|
(15,977
|
) |
|
|
921
|
|
|
Net income
|
|
|
|
|
|
$
|
170,487
|
|
$
|
89,780
|
|
|
$
|
195,041
|
|
|
|
Less: net loss (income) attributable to non-controlling interests
|
|
|
|
|
|
|
(2,608
|
) |
|
|
508
|
|
|
|
(11,543
|
) |
|
Net income attributable to Elbit Systems Ltd.’s shareholders
|
|
|
|
|
|
$
|
167,879
|
|
$
|
90,288
|
|
|
$
|
183,498
|
|
|
|
|
|
|
|
|
|
|
|
|
|
|
|
|
|
|
|
|
|
Earnings per share attributable to Elbit Systems Ltd.’s shareholders:
|
|
|
(21)
|
|
|
|
|
|
|
|
|
|
|
|
|
|
|
Basic net earnings (losses) per share:
|
|
|
|
|
|
|
|
|
|
|
|
|
|
|
|
|
|
Continuing operations
|
|
|
|
|
|
|
3.99
|
|
|
2.33
|
|
|
|
4.29
|
|
|
|
Discontinued operations
|
|
|
|
|
|
|
(0.01
|
) |
|
|
(0.22
|
)
|
|
|
0.01
|
|
|
Total
|
|
|
|
|
|
$
|
3.98
|
|
$
|
2.11
|
|
|
$
|
4.30
|
|
|
|
Diluted net earnings (losses) per share:
|
|
|
|
|
|
|
|
|
|
|
|
|
|
|
||
|
Continuing operations
|
|
|
|
|
|
|
3.98
|
|
|
2.31
|
|
|
|
4.24
|
|
|
|
Discontinued operations
|
|
|
|
|
|
|
(0.01
|
) |
|
|
(0.22
|
)
|
|
|
0.01
|
|
|
Total
|
|
|
|
|
|
$
|
3.97
|
|
$
|
2.09
|
|
|
$
|
4.25
|
|
|
|
Weighted average number of shares used in computation of basic earnings per share
|
|
|
|
|
|
|
42,190
|
|
|
42,764
|
|
|
|
42,645
|
|
|
|
Weighted average number of shares used in computation of diluted earnings per share
|
|
|
|
|
|
|
42,277
|
|
|
43,131
|
|
|
|
43,217
|
|
|
|
Amounts attributable to Elbit Systems Ltd.’s shareholders
|
|
|
|
|
|
|
|
|
|
|
|
|
|
|
||
|
Income from continuing operations, net of income taxes
|
|
|
|
|
|
$
|
168,245
|
|
$
|
99,778
|
|
|
$
|
182,951
|
|
|
|
Discontinued operations, net of income taxes
|
|
|
|
|
|
|
(366
|
) |
|
|
(9,490
|
)
|
|
|
547
|
|
|
Net income attributable to Elbit Systems Ltd.’s shareholders
|
|
|
|
|
|
$
|
167,879
|
|
$
|
90,288
|
|
|
$
|
183,498
|
|
|
The accompanying notes are an integral part of the consolidated financial statements.
F - 6
ELBIT SYSTEMS LTD. AND SUBSIDIARIES
|
U.S. dollars (In thousands, except share data)
|
|
|
|
Year ended December 31,
|
|
|||||||||
|
|
|
2012
|
|
|
2011
|
|
|
2010
|
|
|||
|
Net income
|
|
$
|
170,487
|
|
$
|
89,780
|
|
|
$
|
195,041
|
|
|
|
Other comprehensive income (loss), net of tax
:
|
|
|
|
|
|
|
|
|
||||
|
Foreign currency translation differences
|
|
|
1,972
|
|
|
(5,597
|
)
|
|
|
2,991
|
|
|
|
Unrealized gains (losses) on derivative instruments
|
|
24,885
|
|
|
(20,025
|
)
|
|
|
6,668
|
|
||
|
Pension and post-retirement benefit plans
|
|
|
(4,956
|
) |
|
|
(15,807
|
)
|
|
|
(2,781
|
)
|
|
Unrealized gains (losses) on available-for-sale marketable securities
|
|
|
781
|
|
|
3,663
|
|
|
|
(2,925
|
)
|
|
|
|
|
22,682
|
|
|
(37,766
|
)
|
|
|
3,953
|
|
||
|
Total comprehensive income (loss)
|
|
|
193,169
|
|
|
52,014
|
|
|
|
189,994
|
|
|
|
Less: comprehensive income (loss) attributable to non-controlling interest
|
(4,128
|
) |
4
|
(10,508
|
)
|
|||||||
|
Comprehensive income attributable to Elbit Systems Ltd.'s shareholders
|
$
|
189,041
|
$
|
52,018
|
$
|
179,486
|
||||||
The accompanying notes are an integral part of the consolidated financial statements.
F - 7
ELBIT SYSTEMS LTD. AND SUBSIDIARIES
|
STATEMENTS OF CHANGES IN EQUITY
|
|
U.S. dollars (In thousands, except share data)
|
|
|
|
Number of
outstanding
shares
|
Share
capital
|
Additional
paid–in
capital
|
Accumulated
other
comprehensive
income (loss)
|
Retained
earnings
|
Treasury
shares
|
Non–
controlling
interest
|
Total
equity
|
|
||||||||||||||||||||||
|
Balance as of January 1, 2010
|
|
$
|
42,530,895
|
$
|
12,006
|
|
$ |
272,127
|
|
$ |
(22,413
|
)
|
$
|
575,469
|
|
$ |
(4,321
|
)
|
$ |
24,326
|
$ |
857,194
|
|
|||||||||
|
Exercise of options
|
|
|
162,445
|
|
44
|
|
|
3,546
|
|
-
|
|
-
|
|
-
|
|
-
|
|
|
3,590
|
|
||||||||||||
|
Stock-based compensation
|
|
|
-
|
|
-
|
|
|
5,211
|
|
-
|
|
-
|
|
-
|
|
-
|
|
|
5,211
|
|
||||||||||||
|
Tax benefit in respect of options exercised
|
|
|
-
|
|
-
|
|
|
710
|
|
-
|
|
-
|
|
-
|
|
-
|
|
|
710
|
|
||||||||||||
|
Dividends paid
|
|
|
-
|
|
-
|
|
|
-
|
|
-
|
|
(63,137
|
) |
-
|
|
-
|
|
|
(63,137
|
) | ||||||||||||
|
Fair value of non-controlling interests related to the
acquisition of ITL
|
|
|
-
|
|
-
|
|
|
-
|
|
-
|
|
-
|
|
-
|
|
4,298
|
|
|
4,298
|
|
||||||||||||
|
Other comprehensive income, net of tax benefit of $1,801
|
|
|
-
|
|
-
|
|
|
-
|
3,953
|
-
|
|
|
|
(1,035
|
) |
|
|
2,918
|
|
|||||||||||||
|
Net income attributable to non- controlling interests
|
|
|
-
|
|
-
|
|
|
-
|
|
-
|
|
-
|
|
-
|
|
11,543
|
|
|
11,543
|
|
||||||||||||
|
Net income attributable to non-controlling interest from discontinued operation
|
|
|
-
|
|
-
|
|
|
-
|
|
-
|
|
-
|
|
-
|
|
(374
|
) |
(374
|
) | |||||||||||||
|
Net income attributable to Elbit Systems Ltd.'s shareholders
|
|
|
-
|
-
|
|
-
|
-
|
183,498
|
|
-
|
-
|
|
183,498
|
|||||||||||||||||||
|
Balance as of December 31, 2010
|
|
$
|
42,693,340
|
$
|
12,050
|
|
$ |
281,594
|
|
$ |
(18,460
|
)
|
|
$
|
695,830
|
|
$ |
(4,321
|
) | $ |
38,758
|
$ |
1,005,451
|
|
||||||||
The accompanying notes are an integral part of the consolidated financial statements.
F - 8
ELBIT SYSTEMS LTD. AND SUBSIDIARIES
|
STATEMENTS OF CHANGES IN EQUITY (CONT.)
|
|
U.S. dollars (In thousands, except share data)
|
|
|
Number of
outstanding
shares
|
Share
capital
|
Additional
paid–in
capital
|
Accumulated
other
comprehensive
income (loss)
|
Retained
earnings
|
Treasury
shares
|
Non–
controlling
interest
|
Total
equity
|
||||||||||||||||||||||||
|
Balance as of January 1, 2011
|
$ | 42,693,340 | $ | 12,050 | $ | 281,594 | $ | (18,460 | ) | $ | 695,830 | $ | (4,321 | ) | $ | 38,758 | $ | 1,005,451 | ||||||||||||||
|
Exercise of options
|
154,816 | 43 | 3,790 | - | - | - | - | 3,833 | ||||||||||||||||||||||||
|
Stock-based compensation
|
- | - | 1,996 | - | - | - | - | 1,996 | ||||||||||||||||||||||||
|
Tax benefit in respect of options exercised
|
- | - | 169 | - | - | - | - | 169 | ||||||||||||||||||||||||
|
Dividends paid
|
- | - | - | - | (61,633 | ) | - | - | (61,633 | ) | ||||||||||||||||||||||
|
Purchase of treasury shares
|
(240,368 | ) | - | - | - | - | (10,101 | ) | - | (10,101 | ) | |||||||||||||||||||||
|
Purchase of subsidiaries
shares from
non-
controlling interest, net
|
- | - | (55,142 | ) | - | - | - | (15,858 | ) | (71,000 | ) | |||||||||||||||||||||
|
Other comprehensive income,
net of t
ax benefit of $10,400
|
- | - | - | (37,766 | ) | - | - | 504 | (37,262 | ) | ||||||||||||||||||||||
|
Net income attributable to
non-controlling
interests
|
- | - | - | - | - | - | (508 | ) | (508 | ) | ||||||||||||||||||||||
|
Net loss attributable to
non-controlling interest
from discontinued operation
|
- | - | - | - | - | - | 6,487 | 6,487 | ||||||||||||||||||||||||
|
Net income attributable to
Elbit
Systems Ltd.'s shareholders
|
- | - | - | - | 90,288 | - | - | 90,288 | ||||||||||||||||||||||||
|
Balance as of December 31, 2011
|
$
|
42,607,788 | $ | 12,093 | $ | 232,407 | $ | (56,226 | ) | $ | 724,485 | $ | (14,422 | ) | $ | 29,383 | $ | 927,720 | ||||||||||||||
The accompanying notes are an integral part of the consolidated financial statements.
F - 9
ELBIT SYSTEMS LTD. AND SUBSIDIARIES
|
STATEMENTS OF CHANGES IN EQUITY (CONT.)
|
|
U.S. dollars (In thousands, except share data)
|
|
|
Number of
outstanding
shares
|
Share
capital
|
Additional
paid–in
capital
|
Accumulated
other
comprehensive
income (loss)
|
Retained
earnings
|
Treasury
shares
|
Non–
controlling
interest
|
Total
equity
|
||||||||||||||||||||||||
|
Balance as of January 1, 2012
|
$
|
42,607,788 | $ | 12,093 | $ | 232,407 | $ | (56,226 | ) | $ | 724,485 | $ | (14,422 | ) | $ | 29,383 | $ | 927,720 | ||||||||||||||
|
Exercise of options
|
33,589 | 12 | 1,340 | - | - | - | - | 1,352 | ||||||||||||||||||||||||
|
Stock-based compensation
|
- | - | 3,326 | - | - | - | - | 3,326 | ||||||||||||||||||||||||
|
Tax benefit in respect of options exercised
|
- | - | 161 | - | - | - | - | 161 | ||||||||||||||||||||||||
|
Dividends paid
|
- | - | - | - | (50,616 | ) | - | - | (50,616 | ) | ||||||||||||||||||||||
|
Purchase of treasury shares
|
(759,632 | ) | - | - | - | - | (26,006 | ) | - | (26,006 | ) | |||||||||||||||||||||
|
Other comprehensive income, net of tax expense of $1,574
|
- | - | 22,682 | - | 1,520 | 24,202 | ||||||||||||||||||||||||||
|
Net income attributable to non- controlling interests
|
- | - | - | - | - | - | 2,608 | 2,608 | ||||||||||||||||||||||||
|
Net income attributable to Elbit
Systems Ltd.'s shareholders
|
- | - | - | - | 167,879 | - | - | 167,879 | ||||||||||||||||||||||||
|
Balance as of December 31, 2012
|
$
|
41,881,745 | $ | 12,105 | $ | 237,234 | $ | (33,544 | ) | $ | 841,748 | $ | (40,428 | ) | $ | 33,511 | $ | 1,050,626 | ||||||||||||||
The accompanying notes are an integral part of the consolidated financial statements.
F - 10
ELBIT SYSTEMS LTD. AND SUBSIDIARIES
|
U.S. dollars (In thousands)
|
|
|
Year ended December 31,
|
|||||||||||
|
|
2012
|
2011
|
2010
|
|||||||||
|
CASH FLOWS FROM OPERATING ACTIVITIES
|
|
|
|
|||||||||
|
Net income
|
$ | 170,487 | $ | 89,780 | $ | 195,041 | ||||||
|
Adjustments to reconcile net income to net cash provided by operating activities:
|
||||||||||||
|
Depreciation and amortization
|
138,796 | 150,618 | 132,141 | |||||||||
|
Write-off impairment and discontinued operations, net
|
616 | 15,977 | 1,284 | |||||||||
|
Stock-based compensation
|
3,326 | 1,996 | 5,211 | |||||||||
|
Amortization of Series A Notes discount (premium) and related issuance costs, net
|
153 | 422 | (258 | ) | ||||||||
|
Deferred income taxes and reserve, net
|
6,579 | (8,777 | ) | (28,162 | ) | |||||||
|
Loss (gain) on sale of property, plant and equipment
|
1,197 | (1,645 | ) | (1,426 | ) | |||||||
|
Loss (gain) on sale of investment
|
(829 | ) | 2,189 | (19,151 | ) | |||||||
|
Equity in net earnings of affiliated companies and partnerships, net of dividend received(*)
|
(1,602 | ) | (270 | ) | (8,791 | ) | ||||||
|
Changes in operating assets and liabilities, net of amounts acquired:
|
||||||||||||
|
Increase in short and long-term trade receivables, and prepaid expenses
|
(91,988 | ) | (65,062 | ) | (84,708 | ) | ||||||
|
Decrease (increase) in inventories, net
|
10,022 | (95,363 | ) | (49,724 | ) | |||||||
|
Increase (decrease) in trade payables, other payables and accrued expenses
|
(75,724 | ) | 17,225 | 76,807 | ||||||||
|
Severance, pension and termination indemnities, net
|
(10,612 | ) | 1,879 | 4,160 | ||||||||
|
Increase (decrease) in advances received from customers
|
47,961 | 81,946 | (36,396 | ) | ||||||||
|
Net cash provided by operating activities
|
198,382 | 190,915 | 186,028 | |||||||||
|
CASH FLOWS FROM INVESTING ACTIVITIES
|
||||||||||||
|
Purchase of property, plant and equipment
|
(81,637 | ) | (121,977 | ) | (138,644 | ) | ||||||
|
Acquisitions of subsidiaries and business operations (Schedule A)
|
- | (12,173 | ) | (229,556 | ) | |||||||
|
Investments in affiliated companies and other companies
|
(4,241 | ) | (13,555 | ) | (4,956 | ) | ||||||
|
Proceeds from sale of property, plant and equipment
|
7,335 | 15,059 | 10,667 | |||||||||
|
Proceeds from sale of investments
|
705 | 329 | 27,941 | |||||||||
|
Investment in long-term deposits
|
(779 | ) | (609 | ) | (14,484 | ) | ||||||
|
Proceeds from sale of long-term deposits
|
2,849 | 40,396 | 30,240 | |||||||||
|
Investment in short-term deposits and available-for-sale marketable securities
|
(340,899 | ) | (88,842 | ) | (189,345 | ) | ||||||
|
Proceeds from sale of short-term deposits and available-for-sale marketable securities
|
299,029 | 126,306 | 252,550 | |||||||||
|
Net cash used in investing activities
|
(117,638 | ) | (55,066 | ) | (255,587 | ) | ||||||
|
CASH FLOWS FROM FINANCING ACTIVITIES
|
||||||||||||
|
Proceeds from exercise of options
|
1,352 | 3,833 | 3,590 | |||||||||
|
Purchase of non-controlling interests
|
- | (71,000 | ) | - | ||||||||
|
Repayment of long-term loans
|
(319,601 | ) | (73,666 | ) | (488,657 | ) | ||||||
|
Proceeds from long-term loans
|
122,038 | 172,303 | 387,692 | |||||||||
|
Proceeds from issuance of Series A Notes
|
246,973 | - | 283,213 | |||||||||
|
Series A Notes issuance costs
|
(2,035 | ) | - | (2,530 | ) | |||||||
|
Purchase of treasury shares
|
(26,006 | ) | (10,101 | ) | - | |||||||
|
Repayment of Series A Notes and convertible debentures
|
(53,530 | ) | (29,998 | ) | - | |||||||
|
Purchase of convertible debentures of a subsidiary
|
- | (2,121 | ) | - | ||||||||
|
Dividends paid
|
(50,616 | ) | (61,633 | ) | (63,137 | ) | ||||||
|
Tax benefit in respect of options exercised
|
161 | 169 | 710 | |||||||||
|
Change in short-term bank credit and loans, net
|
(2,817 | ) | (12,117 | ) | (40,972 | ) | ||||||
|
Net cash provided by (used in) financing activities
|
(84,081 | ) | (84,331 | ) | 79,909 | |||||||
|
NET INCREASE (DECREASE) IN CASH AND CASH EQUIVALENTS
|
(3,336 | ) | 51,518 | 10,350 | ||||||||
|
CASH AND CASH EQUIVALENTS AT THE BEGINNING OF THE YEAR
|
202,577 | 151,059 | 140,709 | |||||||||
|
CASH AND CASH EQUIVALENTS AT THE END OF THE YEAR
|
$ | 199,241 | $ | 202,577 | $ | 151,059 | ||||||
|
(*) dividend received from affiliated companies and partnership
|
$ | 9,558 | $ | 15,107 | $ | 10,925 | ||||||
The accompanying notes are an integral part of the consolidated financial statements.
F - 11
ELBIT SYSTEMS LTD. AND SUBSIDIARIES
|
CONSOLIDATED STATEMENTS OF CASH FLOWS (CONT.)
|
|
U.S. dollars (In thousands)
|
|
|
|
Year ended December 31,
|
|
|||||||||
|
|
|
2012
|
|
|
2011
|
|
|
2010
|
|
|||
|
SUPPLEMENTAL CASH FLOW ACTIVITIES:
|
|
|
|
|
|
|
|
|
|
|||
|
Cash paid during the year for:
|
|
|
|
|
|
|
|
|
|
|||
|
Income taxes, net
|
|
$
|
5,734
|
|
$
|
18,955
|
|
|
$
|
60,759
|
|
|
|
Interest
|
|
$
|
19,168
|
|
$
|
10,258
|
|
|
$
|
13,524
|
|
|
|
|
|
|
|
|
|
|
|
|
|
|
||
|
SCHEDULE A:
|
|
|
|
|
|
|
|
|
|
|
||
|
Acquisitions of subsidiaries and business operations
|
|
|
|
|
|
|
|
|
|
|
||
|
Estimated net fair value of assets acquired and liabilities assumed at the date of acquisition was as follows:
|
|
|
|
|
|
|
|
|
|
|
||
|
Working capital (deficit), net (excluding cash and cash equivalents)
|
|
$
|
-
|
|
$
|
306
|
|
|
$
|
(57,937
|
)
|
|
|
Property, plant and equipment
|
|
|
-
|
|
|
1,938
|
|
|
|
56,233
|
|
|
|
Other long-term assets
|
|
|
-
|
|
|
-
|
|
|
|
16,008
|
|
|
|
Goodwill and other intangible assets
|
|
|
-
|
|
|
17,993
|
|
|
|
261,910
|
|
|
|
Deferred income taxes
|
|
|
-
|
|
|
(1,171
|
)
|
|
|
(15,515
|
)
|
|
|
Long-term liabilities
|
|
|
-
|
|
|
(6,893
|
)
|
|
|
(26,845
|
)
|
|
|
Non-controlling interest
|
|
|
-
|
|
|
-
|
|
|
|
(4,298
|
)
|
|
|
|
|
$
|
-
|
|
$
|
12,173
|
|
|
$
|
229,556
|
|
|
The accompanying notes are an integral part of the consolidated financial statements.
F - 12
ELBIT SYSTEMS LTD. AND SUBSIDIARIES
|
|
A.
|
Elbit Systems Ltd. (“Elbit Systems”) is an Israeli corporation, 46.75% owned by the Federmann Group. Elbit Systems’ shares are traded on the Nasdaq National Market in the United States (“Nasdaq”) and on the Tel Aviv Stock Exchange (“TASE”). Elbit Systems and its subsidiaries (collectively the “Company”) are engaged mainly in the field of defense electronics, homeland security and commercial aviation. Elbit Systems’ principal wholly-owned subsidiaries are the Elbit Systems of America, LLC (“ESA”) companies, Elbit Systems Electro-Optics Industries Elop Ltd. (“Elop”), Elbit Systems Land and C4I Ltd. (“ESLC”) and Elbit Systems EW and SIGINT – Elisra Ltd. (“Elisra”) (formerly known as Elisra Electronic Systems Ltd.).
|
|
|
B.
|
A majority of the Company’s revenues are derived from direct or indirect sales to governments or to governmental agencies. As a result, a substantial portion of the Company’s sales is subject to the special risks associated with sales to governments or to governmental agencies. These risks include, among others, the dependency on the resources allocated by governments to defense programs, changes in governmental priorities, changes in governmental registration, changes in governmental regulations and changes in governmental approvals regarding export licenses required for the Company’s products and for its suppliers. As for major customers, refer to Note 22(C).
|
|
|
C.
|
In December 2011, the Israeli Government, due to political considerations, did not renew the Company’s export authorization to complete performance under an approximately $90,000 contract to supply systems to a foreign customer. As a result of the cessation of the program, and in accordance with our legal advisors opinion, the Company recorded in its 2011 results of operations an expense of approximately $72,800 ($62,000 net of taxes), which was included in cost of goods sold. In May 2012, the foreign customer drew down an amount of approximately $33,600 in advance and performance guarantees. The remaining balance will be utilized after 2013. In November 2012, following discussions with the Israeli Government regarding a possible compensatory settlement (which discussions did not result in an agreement regarding such settlement), the Company filed a lawsuit against the Government of Israel to recover damages and resulting expenses in the amount of approximately $74,000 in connection with the cancellation of the export authorization. The lawsuit was filed with the District Court of the Central Region of Israel.
|
|
|
D.
|
DISCONTINUED OPERATIONS
|
Fraser-Volpe LLC (“FV”) is a U.S. Company held approximately 59.4% by the Company through the Company’s wholly-owned subsidiary ITL Optronics Inc. ("ITL"). ITL and FV were acquired by the Company in the fourth quarter of 2010, as part of the acquisition of the Mikal group of companies, with the balance of ITL’s shares being acquired in February 2011.
Since the acquisition date, Company’s management is committed to and still is in process of selling its holdings in FV. Accordingly, FV was classified in the consolidated financial statements as held-for-sale, discontinued operations, in accordance with the criteria set in ASC 360-10-45-9, and the operating results and the cash flows for the years ended at December 31, 2012 and 2011 were classified as discontinued operations, in accordance with ASC 205-20, “Discontinued Operations”.
F - 13
ELBIT SYSTEMS LTD. AND SUBSIDIARIES
NOTES TO THE CONSOLIDATED FINANCIAL STATEMENTS
|
|
D.
|
DISCONTINUED OPERATIONS (Cont.)
|
During the third quarter of 2011, the Company recognized an impairment loss of approximately $16,000 on its holdings in FV, of which the non-controlling interest was approximately $6,500. Net loss recognized in the financial statements related to the above mentioned impairment was approximately $9,500.
As of December 31, 2012 and 2011, net assets related to FV amounted to $1,172 and $1,748, respectively, and are included in “Other Receivables and Prepaid Expenses” (See Note 4).
In October 2012 the Company signed an agreement for the sale of its interest in FV for an amount of $2,000 for which a down payment of $100 was paid by the purchaser in December 2012. The results of operations and cash flows of the discontinued operations, for each of the three years ended December 31, 2012, were immaterial. The Company expects to finalize the sale during 2013.
The consolidated financial statements have been prepared in accordance with U.S. generally accepted accounting principles (“U.S. GAAP”).
|
|
A.
|
USE OF ESTIMATES
|
The preparation of financial statements in conformity with generally accepted accounting principles requires management to make estimates and assumptions that affect the amounts reported in the financial statements and accompanying notes. The most significant assumptions are employed in estimates used in determining values of intangible assets, warranty and contract loss accruals, legal contingencies, tax assets and tax liabilities, stock-based compensation costs, retirement and post-retirement benefits (including the actuarial assumptions), financial instruments with no observable market quotes, as well as in estimates used in applying the revenue recognition policy. Actual results may differ from estimated results.
|
|
B.
|
FUNCTIONAL CURRENCY
|
The Company’s revenues are generated mainly in U.S. dollars. In addition, most of the Company’s costs are incurred in U.S. dollars. The Company’s management believes that the U.S. dollar is the primary currency of the economic environment in which the Company operates. Thus, the functional and reporting currency of the Company is the U.S. dollar.
Transactions and balances of the Company and certain subsidiaries, which are denominated in other currencies, have been remeasured into U.S. dollars in accordance with principles set forth in ASC 830, “Foreign Currency Matters”. All exchange gains and losses from the remeasurement mentioned above are reflected in the statement of income as financial expenses or income, as appropriate.
For those foreign subsidiaries and investees whose functional currency has been determined to be other than the U.S. dollar, assets and liabilities are translated at year-end exchange rates, and statement of income items are translated at average exchange rates prevailing during the year. Resulting translation differences are recorded as a separate component of accumulated other comprehensive income in equity.
F - 14
ELBIT SYSTEMS LTD. AND SUBSIDIARIES
NOTES TO THE CONSOLIDATED FINANCIAL STATEMENTS (CONT.)
Note 2 -
SIGNIFICANT ACCOUNTING POLICIES (Cont.)
|
|
C.
|
PRINCIPLES OF CONSOLIDATION
|
The consolidated financial statements include the accounts of Elbit Systems and it's wholly and majority-owned subsidiaries.
Intercompany transactions and balances, including profit from intercompany yet realized outside the Company, have been eliminated upon consolidation.
|
|
D.
|
COMPREHENSIVE INCOME
|
The Company accounts for comprehensive income in accordance with ASC 220, "Comprehensive Income". This statement establishes standards for the reporting and display of comprehensive income and its components. Comprehensive income generally represents all changes in shareholders' equity during the period except those resulting from investments by, or distributions to, shareholders.
In June 2011, the FASB issued ASU 2011-05, “Comprehensive Income (Topic 220): Presentation of Comprehensive Income”, which is effective for annual reporting periods beginning after December 15, 2011. Accordingly, the Company adopted ASU 2011-05 on January 1, 2012. This guidance eliminates the option to present the components of other comprehensive income as part of the statement of changes in shareholders’ equity. Upon adoption of the new guidance, the Company elected to present a separate statement of consolidated comprehensive income.
The components of accumulated other comprehensive income (loss), net of taxes, in the amount of $23,845 and $25,419 at December 31, 2012 and 2011, respectively, were as follows:
|
|
Year ended December 31,
|
|||||||
|
|
2012
|
2011
|
||||||
|
Foreign currency translation differences
|
$ | (5,189 | ) | $ | (7,161 | ) | ||
|
Unrealized gains (losses) on derivative instruments
|
14,771 | (10,114 | ) | |||||
|
Pension and post–retirement benefit plans
|
(42,354 | ) | (37,398 | ) | ||||
|
Unrealized gains (losses) on available-for-sale marketable securities
|
$ | (772 | ) | $ | (1,553 | ) | ||
|
|
||||||||
|
Accumulated other comprehensive income (loss), net of taxes
|
$ | (33,544 | ) | $ | (56,226 | ) | ||
|
|
E.
|
BUSINESS COMBINATIONS
|
The Company applies ASC 805, “Business Combinations”. ASC 805 requires recognition of assets acquired, liabilities assumed, and non-controlling interest in the acquire at the acquisition date, measured at their fair values as of that date. This ASC also requires the fair value of acquired in-process research and development (“IPR&D”) to be recorded as intangibles with indefinite lives, contingent consideration to be recorded on the acquisition date, and restructuring and acquisition-related deal costs to be expensed as incurred. Any excess of the fair value of net assets acquired over purchase price and any subsequent changes in estimated contingencies are to be recorded in earnings. In addition, changes in valuation allowance related to acquired deferred tax assets and in acquired income tax position are to be recognized in earnings.
F - 15
ELBIT SYSTEMS LTD. AND SUBSIDIARIES
NOTES TO THE CONSOLIDATED FINANCIAL STATEMENTS (CONT.)
|
Note 2 -
|
SIGNIFICANT ACCOUNTING POLICIES (Cont.)
|
|
|
F.
|
CASH AND CASH EQUIVALENTS
|
Cash equivalents are short-term highly liquid investments that are readily convertible to cash with original maturities of three months or less, when purchased.
|
|
G.
|
SHORT-TERM BANK DEPOSITS
|
Short-term bank deposits are deposits with original maturities of more than three months but less than one year. The short–term bank deposits are presented at their cost, which approximates fair value.
|
|
H.
|
AVAILABLE-FOR-SALE MARKETABLE SECURITIES
|
The Company accounts for all its investments in debt securities and for investments in marketable equity securities of entities in which it does not have significant influence, in accordance with ASC 320, “Investments - Debt and Equity Securities”. The Company classifies all debt securities and marketable equity securities as “available-for-sale”. All of the Company’s investments in available-for-sale securities are reported at fair value. Unrealized gains and losses are comprised of the difference between fair value and the cost of such securities and are recognized, net of tax, as accumulated other comprehensive income (“OCI”).
The amortized cost of debt securities is adjusted for amortization of premiums and accretion of discounts to maturity. Such amortization together with interest and dividends on securities are included in "financial expenses, net".
The Company recognizes an impairment charge when a decline in the fair value of its investments in debt securities below the cost basis of such securities is judged to be other-than-temporary impairment (“OTTI“). Factors considered in making such a determination include the duration and severity of the impairment, the reason for the decline in value, the potential recovery period and if the entity has the intent to sell the debt security, or if it is more likely than not that it will be required to sell the debt security before recovery of its amortized cost basis. However, if an entity does not expect to sell a debt security, it will still need to evaluate expected cash flows to be received and determine if a credit loss exists. In the event of a credit loss, only the amount of impairment associated with the credit loss is recognized in earnings. Amounts relating to factors other than credit losses are recorded in OCI.
|
|
I.
|
INVENTORIES
|
Inventories are stated at the lower of cost or market value. Inventory write-offs are provided to cover risks arising from slow-moving items or technological obsolescence for which recoverability is not probable.
Cost is determined as follows;
|
|
·
|
Raw materials using the average or FIFO cost method.
|
|
|
·
|
Work in progress:
|
|
|
·
|
Costs incurred on long-term contracts in progress include direct labor, material, subcontractors, other direct costs and an allocation of overheads, which represent recoverable costs incurred for production, allocable operating overhead cost and, where appropriate, research and development costs (See Note 2(V)).
|
F - 16
ELBIT SYSTEMS LTD. AND SUBSIDIARIES
NOTES TO THE CONSOLIDATED FINANCIAL STATEMENTS (CONT.)
U.S. dollars (In thousands)
|
Note 2 -
|
SIGNIFICANT ACCOUNTING POLICIES (Cont.)
|
|
|
I.
|
INVENTORIES (Cont.)
|
|
|
·
|
Labor overhead is generally included on a basis of updated hourly rates and is allocated to each project according to the amount of hours expended. Material overhead is generally allocated to each project based on the value of direct material that is charged to the project.
|
Advances from customers are allocated to the applicable contract inventories and are deducted from the inventory balance. Advances in excess of related inventories are classified as liabilities.
Pre-contract costs are generally expenses, but can be deferred and included in inventory, only when such costs can be directly associated with a specific anticipated contract and if their recoverability from the specific anticipated contract is probable according to the guidelines of ASC 605-35.
|
|
J.
|
INVESTMENT IN AFFILIATED COMPANIES, PARTNERSHIPS AND OTHER COMPANIES
|
Investments in affiliated companies and partnerships that are not controlled but over which the Company can exercise significant influence (generally, entities in which the Company holds approximately between 20% and 50% of the voting rights of the investee) are presented using the equity method of accounting. Profits on intercompany sales, not realized outside the Company, are eliminated. The Company discontinues applying the equity method when its investment (including advances and loans) is reduced to zero and the Company has not guaranteed obligations of the affiliate or otherwise committed to provide further financial support to the affiliate.
Investments in preferred shares, which are not in substance common stock, are recorded on a cost basis according to ASC 323-10-15-13, “Investments-Equity Method and Joint Ventures-In-substance Common Stock” and ASC 323-10-40-1, "Investment-Equity Method and Joint Ventures-Investee Capital Transactions".
A change in the Company’s proportionate share of an investee’s equity, resulting from issuance of common or in-substance common shares by the investee to third parties, is recorded as a gain or loss in the consolidated income statements in accordance with ASC 323-10-40-1.
Investments in non-marketable equity securities of entities in which the Company does not have control or the ability to exercise significant influence over their operation and financial policies, are recorded at cost (generally when the Company holds less than 20% of the voting rights).
Management evaluates investments in affiliated companies, partnerships and other non-marketable equity securities for evidence of other-than-temporary declines in value. Such evaluation is dependent on the specific facts and circumstances. Accordingly, in determining whether other-than-temporary declines exist, management evaluates various indicators for other-than-temporary declines and evaluates financial information (e.g. budgets, business plans, financial statements, etc.). During 2012 and 2011, no material impairment was recognized.
F - 17
ELBIT SYSTEMS LTD. AND SUBSIDIARIES
NOTES TO THE CONSOLIDATED FINANCIAL STATEMENTS (CONT.)
U.S. dollars (In thousands)
|
Note 2 -
|
SIGNIFICANT ACCOUNTING POLICIES (Cont.)
|
|
|
K.
|
VARIABLE INTEREST ENTITIES
|
ASC 810-10, “Consolidation”, provides a framework for identifying variable interest entities (“VIEs”) and determining when a company should include the assets, liabilities, non-controlling interests and results of activities of a VIE in its consolidated financial statements. According to ASC 810-10, the Company consolidates a VIE when it has both (1) the power to direct the economically significant activities of the entity and (2) the obligation to absorb losses of, or the right to receive benefits from, the entity that could potentially be significant to the variable interest entity. The determination about whether the Company should consolidate a VIE is evaluated continuously as existing relationships change or future transactions occur.
The Company’s assessment of whether an entity is a VIE and the determination of the primary beneficiary is judgmental in nature and involves the use of significant estimates and assumptions. Those include, among others, forecasted cash flows, their respective probabilities and the economic value of certain preference rights. In addition, such assessment also involves estimates of whether a group entity can finance its current activities, until it reaches profitability, without additional subordinated financial support.
Also according to ASC 810, a non-controlling interest in a subsidiary is an ownership interest in the consolidated entity that should be reported as a separate component of equity in the consolidated financial statements. As such, changes in the parent’s ownership interest with no change of control are treated as equity transactions, rather than step acquisitions or dilution gains or losses. The amendment clarifies that losses of partially owned consolidated subsidiaries shall continue to be allocated to the non-controlling interests even when their investment was already reduced to zero.
UAV Tactical Systems Ltd. (“U-TacS”) in the U.K. is considered to be a VIE. As Elbit Systems is the primary beneficiary and has both the power to direct its activities and absorb the majority of its loss or right to majority of its earnings based upon holding the majority voting rights in U-TacS (51%), U-TacS is consolidated in the Company’s financial statements.
|
|
L.
|
LONG-TERM RECEIVABLES
|
Long-term trade, unbilled and other receivables, with long-term payment terms, which are considered collectible, are recorded at their estimated present values (determined based on the market interest rates at the date of initial recognition).
F - 18
ELBIT SYSTEMS LTD. AND SUBSIDIARIES
NOTES TO THE CONSOLIDATED FINANCIAL STATEMENTS (CONT.)
U.S. dollars (In thousands)
|
Note 2 -
|
SIGNIFICANT ACCOUNTING POLICIES (Cont.)
|
|
|
M.
|
LONG-TERM BANK DEPOSITS
|
Long-term bank deposits are deposits with maturities of more than one year. These deposits are presented at cost and earn interest at market rates. Accumulated interest to be received over the next year is recorded as a current asset. The deposits and accumulated interest approximate fair value.
|
|
N.
|
PROPERTY, PLANT AND EQUIPMENT
|
Property, plant and equipment are stated at cost, net of accumulated depreciation and investment grants. For equipment produced for the Company’s own use, cost includes materials, labor and overhead (including interest costs, when applicable) but not in excess of the fair value of the equipment.
Depreciation is calculated by the straight-line method over the estimated useful life of the assets at the following annual rates:
|
%
|
||
|
Buildings and leasehold improvements (*)
|
2-20
|
|
|
Instruments, machinery and equipment
|
3-33
|
|
|
Office furniture and other
|
4-33
|
|
|
Motor vehicles
|
12-33
|
(Mainly 15%)
|
|
|
(*)
|
Prepayments for operating leases and leasehold improvements are amortized generally over the term of the lease or the useful life of the assets, whichever is shorter.
|
|
|
O.
|
OTHER INTANGIBLE ASSETS
|
Other identifiable intangible assets mainly consist of purchased technology, customer relations and trademarks. These intangible assets are stated at cost net of accumulated amortization and impairments, and are amortized over their useful life using the straight-line method, or the accelerated method, which ever better reflects the applicable expected utilization pattern.
|
|
P.
|
IMPAIRMENT OF LONG-LIVED ASSETS
|
The Company’s long-lived assets and finite-lived intangible assets are reviewed for impairment in accordance with ASC 360-10-35 “Property, Plant and Equipment – Subsequent Measurement” whenever events or changes in circumstances indicate that the carrying amount of an asset may not be recoverable.
Recoverability of assets (or assets group) to be held and used is measured by a comparison of the carrying amount of an asset to the future undiscounted cash flows expected to be generated by the asset. If an asset is determined to be impaired, the impairment to be recognized is measured by the amount by which the carrying amount of the asset exceeds its fair value. For each of the three years in the period ended December 31, 2012, no material impairment has been identified.
As required by ASC 820, “Fair Value Measurements”, the Company applies assumptions that marketplace participants would consider in determining the fair value of long-lived assets (or assets groups).
F - 19
ELBIT SYSTEMS LTD. AND SUBSIDIARIES
NOTES TO THE CONSOLIDATED FINANCIAL STATEMENTS (CONT.)
|
Note 2 -
|
SIGNIFICANT ACCOUNTING POLICIES (Cont.)
|
|
|
Q.
|
GOODWILL IMPAIRMENT
|
Goodwill is subject to an annual impairment test at the reporting unit level (or more frequently if impairment indicators arise).
The Company identified several reporting units based on the guidance of ASC 350, “Intangibles – Goodwill and Other”.
ASC 350 prescribes a two-phase process for impairment testing of goodwill. The first phase screens for impairment, while the second phase (if necessary) measures impairment.
Goodwill impairment is deemed to exist if the net book value of a reporting unit exceeds its estimated fair value. In such case, the second phase is then performed, and the Company measures impairment by comparing the carrying amount of the reporting unit’s goodwill to the implied fair value of that goodwill. An impairment loss is recognized in an amount equal to the excess. For each of the three years in the period ended December 31, 2012, no material impairment losses have been identified.
As required by ASC 820, “Fair Value Measurements”, the Company applies assumptions that market place participants would consider in determining the fair value of each reporting unit.
|
|
R.
|
SEVERANCE PAY
|
Elbit Systems’ and its Israeli subsidiaries’ obligations for severance pay are calculated pursuant to Israel’s Severance Pay Law based on the most recent salary of the employees multiplied by the number of years of employment, as of the balance sheet date and are presented on an undiscounted basis (the “Shut Down Method”). Employees are entitled to one month’s salary for each year of employment or a portion thereof. The obligation is provided by monthly deposits with insurance policies and by an accrual. The value of these policies is recorded as an asset on the Company’s balance sheet. The deposited funds may be withdrawn only upon the fulfillment of the obligation, pursuant to the Severance Pay Law or labor agreements. The value of the deposited funds is based on the cash surrender value of these policies and includes profits (or losses) accumulated to balance sheet date.
Elbit Systems and its Israeli subsidiaries have entered into an agreement with some of its employees implementing Section 14 of the Severance Pay Law and the General Approval of the Labor Minister dated June 30, 1998, issued in accordance to the said Section 14, mandating that upon termination of such employees’ employment, all the amounts accrued in their insurance policies shall be released to them. The severance pay liabilities and deposits covered by these plans are not reflected in the balance sheet as the severance pay risks have been irrevocably transferred to the severance funds.
Severance pay expenses for the years ended December 31, 2012, 2011 and 2010 amounted to approximately $58,326, $50,018 and $50,228, respectively.
|
|
S.
|
PENSION AND OTHER POSTRETIREMENT BENEFITS
|
The Company accounts, for its obligations for pension and other postretirement benefits, in accordance with ASC 715, “Compensation – Retirement Benefits” (See Note 17).
F - 20
ELBIT SYSTEMS LTD. AND SUBSIDIARIES
NOTES TO THE CONSOLIDATED FINANCIAL STATEMENTS (CONT.)
|
Note 2 -
|
SIGNIFICANT ACCOUNTING POLICIES (Cont.)
|
|
|
T.
|
REVENUE RECOGNITION
|
The Company generates revenues principally from long-term contracts involving the design, development, manufacture and integration of defense systems and products. In addition, to a minor extent, the Company provides support and services for such systems and products.
Revenues from long-term contracts are recognized primarily using ASC 605-35, “Construction-Type and Production-Type Contracts”, according to which revenues are recognized on the percentage-of-completion basis.
Sales under long-term fixed-price contracts which provide for a substantial level of development efforts in relation to total contract efforts are recorded using the cost-to-cost method of accounting as the basis to measure progress toward completing the contract and recognizing revenues using the percentage-of-completion basis. According to this method, sales and profits are recorded based on the ratio of costs incurred to estimated total costs at completion. In certain circumstances, when measuring progress toward completion, the Company considers other factors, such as achievement of performance milestones.
Sales and anticipated profit under long-term fixed-price contracts which provide for a substantial level of production effort are recorded on a percentage-of-completion basis, using the units-of-delivery as the basis to measure progress toward completing the contract and recognizing revenues. In certain circumstances, which involve long-term fixed-price production type contracts for non-homogenous units or small quantities of units, or when the achievement of performance milestones provides a more reliable and objective measure of the extent of progress toward completion, revenue is recognized based on the achievement of performance milestones.
Sales and anticipated profit under long-term fixed-price contracts that involve both development and production efforts are recorded using the cost-to-cost method and units-of-delivery method as applicable to each phase of the contract, as the basis to measure progress toward completion. In addition, when measuring progress toward completion under the development portion of the contract, in certain circumstances, the Company considers other factors, such as achievement of performance milestones.
The percentage-of-completion method of accounting requires management to estimate the cost and gross profit margin for each individual contract. Estimated gross profit or loss from long-term contracts may change due to differences between actual performance and original estimated forecasts.
Any changes in estimated gross profit from prior estimates are recognized in results of operations in the current period when they are reasonably determinable by management, for the inception-to-date effect of such changes (on a cumulative catch-up basis). Anticipated losses on contracts are charged to earnings when determined to be probable.
Sales under cost-reimbursement-type contracts are recorded as costs are incurred. Applicable estimated profits are included in earnings in the proportion that incurred costs bear to total estimated costs.
F - 21
ELBIT SYSTEMS LTD. AND SUBSIDIARIES
NOTES TO THE CONSOLIDATED FINANCIAL STATEMENTS (CONT.)
U.S. dollars (In thousands)
|
Note 2 -
|
SIGNIFICANT ACCOUNTING POLICIES (Cont.)
|
|
|
T.
|
REVENUE RECOGNITION (Cont.)
|
Amounts representing contract change orders, claims or other items are included in sales only when they can be reliably estimated and realization is probable. Penalties and awards applicable to performance on contracts are considered in estimating sales and profit rates and are recorded when they are probable and there is sufficient information to assess anticipated contract performance.
The Company believes that the use of the percentage-of-completion method is appropriate as the Company has the ability to make reasonably dependable estimates of the extent of progress towards completion, contract revenues and contract costs. In addition, contracts executed include provisions that clearly specify the enforceable rights regarding services to be provided and received by the parties to the contracts, the consideration to be exchanged and the manner and terms of settlement. In all cases, revenue is recognized when the Company expects to perform its contractual obligations, and its customers are expected to satisfy their obligations under the contract.
Management reviews periodically the estimates of progress towards completion and project costs. These estimates are determined based on engineering estimates and past experience, by personnel having the appropriate authority and expertise to make reasonable estimates of the related costs. Such engineering estimates are reviewed periodically for each specific contract by professional personnel from various disciplines within the organization. These estimates take into consideration the probability of achievement of certain milestones, as well as other factors that might impact the contract’s completion and project cost.
A number of internal and external factors affect the Company's cost estimates, including labor rates, estimated future prices of material, revised estimates of uncompleted work, efficiency variances, linkage to indices and exchange rates, customer specifications and testing requirement changes. If any of the above factors were to change, or if different assumptions were used in estimating progress cost and measuring progress towards completion, it is possible that materially different amounts would be reported in the Company’s consolidated financial statements.
In certain circumstances, sales under short-term fixed-price production type contracts or sale of products are accounted for in accordance with SAB No. 104, “Revenue Recognition in Financial Statements” (“SAB 104”), and recognized when all the following criteria are met: persuasive evidence of an arrangement exists, delivery has occurred, the seller’s price to the buyer is fixed or determinable, no further obligation exists and collectability is reasonably assured.
In cases where the contract involves the delivery of products and performance of services, or other obligations such as buy-back (See Note 20(B)), the Company follows the guidelines specified in ASC 605-25, “Revenue Recognition – Multiple-Element Arrangements” in order to allocate the contract consideration between the identified different elements using the relative selling price method to allocate the entire arrangement consideration.
The selling price for each element would be allocated by using a hierarchy of: (1) Vendor Specific Objective Evidence (“VSOE”); (2) third-party evidence of the selling price for that element; or (3) estimated selling price (“ESP”), for individual elements of an arrangement when VSOE or third-party evidence of the selling price is unavailable.
F - 22
ELBIT SYSTEMS LTD. AND SUBSIDIARIES
NOTES TO THE CONSOLIDATED FINANCIAL STATEMENTS (CONT.)
U.S. dollars (In thousands)
|
|
T.
|
REVENUE RECOGNITION (Cont.)
|
The Company determines ESP for the purposes of allocating the consideration to individual elements of an arrangement by considering several external and internal factors including, but not limited to, pricing practices, margin objectives, geographies in which the Company offers products and services and internal costs.
The determination of ESP is judgmental and is made through consultation with and approval by management.
Service revenues include contracts primarily for the provision of supplies or services other than associated with design, development or production activities. It may be a stand-alone service contract or a service element, which was separated from the design, development or production contract according to the criteria established in ASC 605-25. Service contracts primarily include operation and maintenance contracts, outsourcing-type arrangements, return and repair contracts, training, installation services, etc. Revenues from services were less than 10% of consolidated revenues in each of the years ended December 31, 2012, 2011 and 2010.
As for research and development costs accounted for as contract costs refer to Note 2(V).
|
|
U.
|
WARRANTY
|
The Company estimates the costs that may be incurred under its basic warranty. Such costs are: (1) estimated as part of the total contract’s cost or (2) recorded as a liability at the time revenue for delivered products is recognized. The specific terms and conditions of those warranties vary depending upon the product sold and the country in which the Company does business. Factors that affect the Company’s warranty cost include the number of delivered products, engineering estimates and anticipated rates of warranty claims. The Company periodically assesses the adequacy of its recorded warranty cost and adjusts the amount as necessary. Specific warranty reserves are recorded in the period defects or potential products failures are identified and recorded based on estimates made by management. The estimates are evaluated on a periodic basis.
Changes in the Company’s provision for warranty, which is included in other payables and accrued expenses in the Balance Sheet, are as follows:
|
|
|
2012
|
|
|
2011
|
|
||
|
Balance, at January 1
|
|
$
|
176,831
|
|
$
|
164,778
|
|
|
|
Warranties issued during the year
|
|
|
81,952
|
|
|
75,434
|
|
|
|
Reduction due to warranties forfeited or claimed during the
year
|
|
|
(69,070
|
) |
|
|
(63,381
|
) |
|
Balance, at December 31
|
|
$
|
189,713
|
|
$
|
176,831
|
|
|
|
|
V.
|
RESEARCH AND DEVELOPMENT COSTS
|
Research and development costs, net of participation grants, include costs incurred for independent research and development and bid and proposal efforts and are expensed as incurred unless the costs are related to certain contractual arrangements which are recorded as part of cost of revenues, over the period that revenue is recognized, consistent with the Company’s revenue recognition accounting policy. The Company does not have significant stand-alone research and development arrangements performed for others.
The Company has certain research and development contractual arrangements that meet the requirements for best efforts research and development accounting. Accordingly, the amounts funded by the customer are recognized as an offset to its research and development expenses rather than as contract revenues.
F - 23
ELBIT SYSTEMS LTD. AND SUBSIDIARIES
NOTES TO THE CONSOLIDATED FINANCIAL STATEMENTS (CONT.)
Note 2 - SIGNIFICANT ACCOUNTING POLICIES (Cont.)
|
|
V.
|
RESEARCH AND DEVELOPMENT COSTS (Cont.)
|
Elbit Systems and certain Israeli subsidiaries receive grants (mainly royalty-bearing) from the Israeli Chief Scientist’s Office (“OCS”) and from other sources for the purpose of partially funding approved research and development projects. The grants are not to be repaid, but instead Elbit Systems and certain Israeli subsidiaries are obliged to pay royalties as a percentage of future sales if and when sales from the funded projects are generated. These grants are recognized as a deduction from research and development costs at the time the applicable entity is entitled to such grants on the basis of the research and development costs incurred. Since the payment of royalties is not probable when the grants are received, the Company records a liability in the amount of the estimated royalties for each individual contract, when the related revenues are recognized, as part of cost of revenues. For more information regarding OCS royalties’ commitments see Note 20(A).
|
|
W.
|
INCOME TAXES
|
The Company accounts for income taxes and uncertain tax positions in accordance with ASC 740, “Income Taxes”. This guidance prescribes the use of the liability method whereby deferred tax asset and liability account balances are determined based on differences between financial reporting and tax bases of assets and liabilities and are measured using the enacted tax rates and laws that will be in effect when the differences are expected to reverse. The Company provides a valuation allowance, if necessary, to reduce deferred tax assets to amounts that are more likely than not to be realized.
The Company established reserves for uncertain tax positions based on the evaluation of whether or not the Company’s uncertain tax position is “more likely than not” to be sustained upon examination. The Company records interest and penalties pertaining to its uncertain tax positions in the financial statements as income tax expense.
|
|
X.
|
CONCENTRATION OF CREDIT RISKS
|
Financial instruments that potentially subject the Company to concentrations of credit risk consist principally of cash and cash equivalents, short and long-term deposits, marketable securities and trade receivables.
The majority of the Company’s cash and cash equivalents and short and long-term deposits are invested with major banks mainly in Israel and the United States. Deposits in the U.S. may be in excess of insured limits and are not insured in other jurisdictions. Management believes that the financial institutions that hold the Company’s investments have a high credit rating.
The Company's marketable securities include investments in corporate debentures, U.S. Treasury Bills, U.S. government agency debentures and Israeli Treasury Bills. The Company's investment policy limits the amount that the Company may invest in any one type of investment or issuer, thereby reducing credit risk concentrations.
The Company’s trade receivables are derived primarily from sales to large and stable customers and governments located mainly in Israel, the United States and Europe. The Company performs ongoing credit evaluations of its customers and has not experienced in recent years any unexpected material losses. An allowance for doubtful accounts is recognized with respect to those amounts that the Company has determined to be doubtful of collection.
F - 24
ELBIT SYSTEMS LTD. AND SUBSIDIARIES
NOTES TO THE CONSOLIDATED FINANCIAL STATEMENTS (CONT.)
Note 2 - SIGNIFICANT ACCOUNTING POLICIES (Cont.)
|
|
X.
|
CONCENTRATION OF CREDIT RISKS (Cont.)
|
The Company entered into foreign exchange forward contracts, cross currency interest rate swaps and option strategies (together “derivative instruments”) intended to protect against the increase in the dollar equivalent value of forecasted non-dollar currency cash flows and interest as applicable. These derivative instruments are designed to effectively hedge the Company’s non-dollar currency and interest rates exposures (See Note 2(AA)).
|
|
Y.
|
DERIVATIVE FINANCIAL INSTRUMENTS
|
The Company accounts for derivatives and hedging based on ASC 815, “Derivatives and Hedging”, which requires the Company to recognize all derivatives on the balance sheet at fair value. If a derivative meets the definition of a cash flow hedge and is so designated, changes in the fair value of the derivative will be recognized in other comprehensive income until the hedged item is recognized in earnings. The ineffective portion of a derivative’s change in fair value is recognized immediately in earnings. If a derivative does not meet the definition of a hedge, the changes in the fair value are included immediately in earnings in “Financial income (expenses), net”, in each reporting period (See Note 24).
As part of its hedging strategy, the Company enters into forward exchange contracts in order to protect the Company from the risk that the eventual dollar cash flows from the sale to international customers and purchase of products from international vendors will be adversely affected by changes in exchange rates.
The Company also enters into forward exchange contracts and options strategies in order to limit the exposure to exchange rate fluctuation associated with payroll expenses mainly incurred in NIS.
In connection with the issuance of the NIS 1.1 billion Series A Notes in 2010 and the issuance of an additional NIS 0.9 billion Series A Notes in 2012 on the Tel Aviv Stock Exchange (See Note 16), the Company entered into cross-currency interest rate swap transactions with a notional principal of the NIS 1.1 billion and NIS 0.9 billion to effectively hedge the effect of interest and exchange rate difference from NIS Series A Notes. The cross currency interest rate swap effectively converts the fixed interest rate of the debt to a floating interest rate. The terms of the swap agreements substantially match the terms of the debt. Under the terms of the swap agreements, the Company received interest payments semi-annually in NIS at an annual rate of 4.84% on the notional principal and pays interest semi-annually in U.S. Dollars at an annual weighted rate of 1.84% over the six-month LIBOR on the notional principal. The swap agreements are designated as a fair value hedge. The gains and losses related to changes in the fair value of the interest rate swaps are included in interest expense and substantially offset changes in the fair value of the hedged portion of the underlying hedged Series A Notes.
F - 25
ELBIT SYSTEMS LTD. AND SUBSIDIARIES
NOTES TO THE CONSOLIDATED FINANCIAL STATEMENTS (CONT.)
Note 2 - SIGNIFICANT ACCOUNTING POLICIES (Cont.)
|
|
Z.
|
STOCK-BASED COMPENSATION
|
The Company accounts for share-based arrangements under ASC 718, “Compensation – Stock Compensation”, which requires all share-based payments, including grants of employee stock options, to be recognized in the income statement based on their fair values.
The fair value based cost of employee stock options is estimated at the grant date using a lattice-based option valuation model with the following weighted average assumptions:
|
2012
|
2011
|
2010
|
||||||||||
|
Dividend yield
|
2.45 | % | 2.23 | % | 2.20 | % | ||||||
|
Expected volatility
|
36.07 | % | 31.59 | % | 31.92 | % | ||||||
|
Risk-free interest rate
|
0.83 | % | 2.01 | % | 1.56 | % | ||||||
|
Expected life
|
4 years
|
4 years
|
4 years
|
|||||||||
|
Forfeiture rate
|
0.56 | % | 0.56 | % | 0.56 | % | ||||||
|
Suboptimal factor
|
1.75 | 1.75 | 1.75 | |||||||||
Because lattice-based option valuation models incorporate ranges of assumptions for inputs, the average of those ranges are disclosed. Expected volatilities are based on implied volatilities from traded options on Elbit Systems’ stock, historical volatility of the stock and other factors. The Company uses historical data to estimate option exercise and employee termination within the valuation model. The expected term of options granted is derived from the output of the option valuation model and represents the period of time that options granted are expected to be outstanding. The average of the range, given above, results from certain groups of employees exhibiting different behavior. The risk-free interest rate for periods within the contractual life of the option is based on the U.S. Treasury yield curve in effect at the time of grant for periods within the contractual life of the option. The dividend yield assumption is based on historical dividends.
|
|
AA.
|
FAIR VALUE OF FINANCIAL INSTRUMENTS
|
The carrying amounts of cash and cash equivalents, short-term bank deposits, trade receivables, short-term bank credit and loans and trade payables approximate their fair values due to the short-term maturities of such instruments.
The fair value of long-term loans is estimated by discounting the future cash flows using current interest rates for loans of similar terms and maturities. The carrying amount of the long-term loans approximates their fair value.
As of December 31, 2012, the fair value of the Series A Notes based on quoted market price of the Tel-Aviv Stock Exchange was approximately $477,943.
The Company accounts for certain assets and liabilities at fair value under ASC 820, “Fair Value Measurements and Disclosures”. Fair value is an exit price, representing the amount that would be received to sell an asset or paid to transfer a liability in an orderly transaction between market participants. As such, fair value is a market-based measurement that should be determined based on assumptions that market participants would use in pricing an asset or a liability.
F - 26
ELBIT SYSTEMS LTD. AND SUBSIDIARIES
NOTES TO THE CONSOLIDATED FINANCIAL STATEMENTS (CONT.)
U.S. dollars (In thousands)
Note 2 - SIGNIFICANT ACCOUNTING POLICIES (Cont.)
|
|
AA.
|
FAIR VALUE OF FINANCIAL INSTRUMENTS (Cont.)
|
The hierarchy below lists three levels of fair value based on the extent to which inputs used in measuring fair value are observable in the market. The Company categorizes each of its fair value measurements in one of these three levels based on the lowest level input that is significant to the fair value measurement in its entirety.
The three levels of inputs that may be used to measure fair value are as follows:
Level 1 - Observable inputs that reflect quoted prices (unadjusted) for identical assets or liabilities in active markets;
Level 2 - Includes other inputs that are directly or indirectly observable in the marketplace, other than quoted prices included in Level 1, such as quoted prices for similar assets or liabilities in active markets, quoted prices for identical or similar assets or liabilities in markets with insufficient volume or infrequent transactions, or other inputs that are observable (model-derived valuations in which significant inputs are observable), or can be derived principally from or corroborated by observable market data; and
Level 3 - Unobservable inputs which are supported by little or no market activity.
The availability of observable inputs can vary from instrument to instrument and is affected by a wide variety of factors, including, for example, the type of instrument, the liquidity of markets and other characteristics particular to the transaction. To the extent that valuation is based on models or inputs that are less observable or unobservable in the market, the determination of fair value requires more judgment and the instrument are categorized as Level 3.
The Company’s cross-currency interest rate swaps are valued under an income approach using industry-standard models that consider various assumptions, including time value, volatility factors, current market and contractual prices for the underlying, and counterparty non-performance risk. Substantially all of these assumptions are observable in the marketplace throughout the full term of the instruments, can be derived from observable data or are supported by observable levels at which transactions are executed in the marketplace and accordingly are categorized as Level 2.
The Company measures its marketable equity securities, debt securities and foreign currency derivative instruments at fair value. Marketable equity securities and government debt securities are classified within Level 1. The Company's corporate debt marketable securities trade in markets that are not considered to be active, but are valued based on quoted market prices, broker or dealer quotations, or alternative pricing sources with reasonable levels of price transparency and accordingly are categorized as Level 2.
The Company’s foreign currency derivative instruments are classified within Level 2 when the valuation inputs are based on quoted prices and market observable data of similar instruments and in Level 3 when valuation inputs are based on significant unobservable data.
F - 27
ELBIT SYSTEMS LTD. AND SUBSIDIARIES
NOTES TO THE CONSOLIDATED FINANCIAL STATEMENTS (CONT.)
U.S. dollars (In thousands)
Note 2 - SIGNIFICANT ACCOUNTING POLICIES (Cont.)
|
|
AA.
|
FAIR VALUE OF FINANCIAL INSTRUMENTS (Cont.)
|
Assets and liabilities measured at fair value on a recurring basis are summarized below:
|
|
Fair value measurement at
December 31, 2012 using
|
|||||||||||
|
|
Quoted Prices
in Active
Markets for
Identical Assets
(Level 1)
|
Significant
Other
Observable
Inputs
(Level 2)
|
Significant
Unobservable
Inputs
(Level 3)
|
|||||||||
|
Description of Assets
|
|
|
|
|||||||||
|
Available-for-sale marketable debt securities:
|
|
|
|
|||||||||
|
Government bonds
|
$ | 12,620 | $ | - | $ | - | ||||||
|
Corporate bonds
|
- | 37,491 | - | |||||||||
|
Foreign currency derivatives and option contracts
|
- | 24,738 | - | |||||||||
|
Cross currency interest rate swap
|
- | 22,415 | - | |||||||||
|
Liabilities
|
||||||||||||
|
Foreign currency derivative and option contracts
|
- | (4,992 | ) | - | ||||||||
|
Total
|
$ | 12, 620 | $ | 79,652 | $ | - | ||||||
|
|
Fair value measurement at
December 31, 2011 using
|
|||||||||||
|
|
Quoted Prices
in Active
Markets for
Identical Assets
(Level 1)
|
Significant
Other
Observable
Inputs
(Level 2)
|
Significant
Unobservable
Inputs
(Level 3)
|
|||||||||
|
Description of Assets
|
|
|
|
|||||||||
|
Available-for-sale marketable debt securities:
|
|
|
|
|||||||||
|
Government bonds
|
$ | - | $ | - | $ | - | ||||||
|
Foreign currency derivatives and option contracts
|
- | 14,755 | - | |||||||||
| Cross Currency interest rate swap | - | 8,877 | - | |||||||||
|
Liabilities
|
||||||||||||
|
Foreign currency derivative and option contracts
|
- | (25,954 | ) | - | ||||||||
|
Total
|
$ | - | $ | (2,322 | ) | $ | - | |||||
|
|
AB.
|
BASIC AND DILUTED NET EARNINGS PER SHARE
|
Basic earnings per share are computed based on the weighted average number of outstanding ordinary shares during each year. Diluted earnings per share are computed based on the weighted average number of outstanding ordinary shares during each year, plus dilutive potential ordinary shares considered outstanding during the year. Outstanding stock options are excluded from the calculation of the diluted earnings per ordinary share when their effect is anti-dilutive.
The weighted average number of shares related to outstanding anti-dilutive stock options excluded from the calculations of diluted net earnings per share was 125,709, 76,815 and 23,041 for the years 2012, 2011 and 2010, respectively.
F - 28
ELBIT SYSTEMS LTD. AND SUBSIDIARIES
NOTES TO THE CONSOLIDATED FINANCIAL STATEMENTS (CONT.)
|
|
AC.
|
TREASURY SHARES
|
Elbit Systems’ shares held by Elbit Systems and its subsidiaries are recognized at cost and presented in treasury shares as a reduction of shareholders’ equity.
|
|
AD.
|
RECENT ACCOUNTING PRONOUNCEMENTS
|
|
|
Effective January 1, 2012, the Company retrospectively adopted a new standard issued by the Financial Accounting Standards Board by presenting total comprehensive income and the components of net income and other comprehensive income (loss) in two separate but consecutive statements. The adoption of this guidance resulted only in a change in how the Company presents other comprehensive income in the Company's consolidated financial statements and did not have any impact on the Company's results of operations, financial position or cash flows. Comparative prior periods amounts are also presented.
|
|
|
AE.
|
RECLASSIFICATIONS
|
Certain financial statement data for prior years has been reclassified to conform to current year financial statement presentation.
|
|
December 31,
|
|||||||
|
|
2012
|
2011
|
||||||
|
Receivables
(1)
|
$ | 454,641 | $ | 456,479 | ||||
|
Unbilled receivables
|
242,616 | 219,906 | ||||||
|
Less – allowance for doubtful accounts
|
(9,128 | ) | (6,861 | ) | ||||
|
|
$ | 688,129 | $ | 669,524 | ||||
|
|
||||||||
|
(1) Includes receivables due from affiliated companies
|
$ | 20,623 | $ | 20,030 | ||||
Unbilled receivables on long-term contracts principally represent sales recorded under the percentage-of-completion method of accounting, when sales or revenues based on performance attainment, though appropriately recognized, cannot be billed yet under terms of the contract as of the balance sheet date. Accounts receivable related to claims are items that the Company believes are earned, but are subject to uncertainty concerning determination of their ultimate realization. Such amounts were not material as of the balance sheet date. Accounts receivables and unbilled receivables, other than those detailed under Note 7, are expected to be billed and collected during 2013.
Short and long-term trade and unbilled receivables include receivables from IMOD in the amount of $417,536 and $404,104, as of December 31, 2012 and 2011, respectively.
As for long-term trade and unbilled receivables – see Note 7.
F - 29
ELBIT SYSTEMS LTD. AND SUBSIDIARIES
NOTES TO THE CONSOLIDATED FINANCIAL STATEMENTS (CONT.)
|
|
|
December 31,
|
|
|||||
|
|
|
2012
|
|
|
2011
|
|
||
|
Deferred income taxes, net
|
|
$
|
31,801
|
|
|
$
|
35,263
|
|
|
Prepaid expenses
|
|
|
45,219
|
|
|
|
37,504
|
|
|
Government institutions
|
|
|
56,340
|
|
|
|
72,266
|
|
|
Derivative instruments
|
|
|
35,580
|
|
|
|
20,520
|
|
|
Held-for-sale investment (*)
|
|
|
1,172
|
|
|
|
1,748
|
|
|
Other
|
|
|
9,991
|
|
|
|
12,723
|
|
|
|
|
$
|
180,103
|
|
|
$
|
180,024
|
|
(*) See Note 1(D).
|
|
|
December 31,
|
|
|||||
|
|
|
2012
|
|
|
2011
|
|
||
|
Cost incurred on long-term contracts in progress
|
|
$
|
832,642
|
|
|
$
|
866,325
|
|
|
Raw materials
|
|
|
119,416
|
|
|
|
110,528
|
|
|
Advances to suppliers and subcontractors
|
|
|
35,857
|
|
|
|
47,168
|
|
|
|
|
|
987,915
|
|
|
|
1,024,021
|
|
|
Less -
|
|
|
|
|
|
|||
|
Cost incurred on contracts in progress deducted from customer advances
|
|
|
68,306
|
|
|
|
38,048
|
|
|
Advances received from customers (*)
|
|
|
104,297
|
|
|
|
150,195
|
|
|
Provision for losses on long-term contracts
|
|
|
64,065
|
|
|
|
74,509
|
|
|
|
|
$
|
751,247
|
|
|
$
|
761,269
|
|
|
|
(*)
|
The Company has transferred legal title of inventories to certain customers as collateral for advances received. Advances are allocated to the relevant inventories on a per-project basis. In cases where advances are in excess of the inventories, the net amount is presented in customer advances (See Note 14).
|
|
|
Note 6 -
|
INVESTMENTS IN AFFILIATED COMPANIES, PARTNERSHIPS AND OTHER COMPANIES
|
|
|
A.
|
Investments in affiliated companies:
|
|
|
|
December 31,
|
|
|||||
|
|
|
2012
|
|
|
2011
|
|
||
|
Companies accounted for under the equity method
|
|
$
|
122,237
|
|
|
$
|
105,914
|
|
|
Companies accounted for on a cost basis
|
|
|
4,245
|
|
|
|
4,245
|
|
|
|
|
$
|
126,482
|
|
|
$
|
110,159
|
|
F - 30
ELBIT SYSTEMS LTD. AND SUBSIDIARIES
NOTES TO THE CONSOLIDATED FINANCIAL STATEMENTS (CONT.)
Note 6 -
INVESTMENTS IN AFFILIATED COMPANIES, PARTNERSHIPS AND OTHER COMPANIES (Cont.)
|
|
B.
|
Investments in companies accounted for under the equity method:
|
|
|
|
December 31,
|
|
|||||
|
|
|
2012
|
|
|
2011
|
|
||
|
SCD (1)
|
|
$
|
68,692
|
|
|
$
|
63,854
|
|
|
VSI (2)
|
|
|
16,715
|
|
|
|
8,154
|
|
|
Opgal (3)
|
|
|
13,470
|
|
|
|
14,626
|
|
|
Netcity (4)
|
|
|
12,129
|
|
|
|
10,418
|
|
|
Other(5)
|
|
|
11,231
|
|
|
|
8,862
|
|
|
|
|
$
|
122,237
|
|
|
$
|
105,914
|
|
|
|
(1)
|
Semi Conductor Devices (“SCD”) is an Israeli partnership, held 50% by the Company and 50% by Rafael Advanced Defense Systems Ltd. (“Rafael”). SCD is engaged in the development and production of various thermal detectors and laser diodes. SCD is jointly controlled and therefore is not consolidated in the Company’s financial statements.
|
|
|
(2)
|
Vision Systems International LLC (“VSI”) based in San Jose, is a California limited liability company that is held 50% by ESA and 50% by a subsidiary of Rockwell Collins Inc. VSI operates in the area of helmet mounted display systems for fixed-wing military aircraft. VSI is jointly controlled and therefore is not consolidated in the Company’s financial statements. In November
2012, Rockwell Collins and ESA established Rockwell Collins ESA Vision Systems LLC ("RCEVS"), a Delaware limited liability company, held 50% by each party, which will engage in similar activities to VSI.
|
|
|
(3)
|
Opgal Optronics Industries Ltd. (“Opgal”) is an Israeli company owned 50.1% by the Company and 49.9% by a subsidiary of Rafael. Opgal focuses mainly on commercial applications of thermal imaging and electro-optic technologies. The Company jointly controls Opgal with Rafael, and therefore Opgal is not consolidated in the Company’s financial statements.
|
|
|
(4)
|
UTI NETCITY Investments BV S.A ("Netcity") is a Romanian company held 40% by the Company. During 2011, the Company invested in Netcity approximately $8,100, in addition to $2,700 that were invested in 2010. Netcity is engaged in the construction of fiber-telecommunication networks in Romania.
|
|
|
(5)
|
During 2012, the Company invested in an Asian company approximately $2,789. The Asian company in which the Company holds 51%, is engaged in the assembly and maintenance of communication equipment. The Asian company is not controlled by the Company since the partner has participation rights in the day-to-day to operations, and therefore the Company is not consolidated in the Company’s financial statements.
|
|
|
(6)
|
Equity in net earnings of affiliated companies is as follows:
|
|
|
Year ended December 31,
|
|||||||||||
|
|
2012
|
2011
|
2010
|
|||||||||
|
SCD
|
$ | 5,524 | $ | 5,807 | $ | 11,470 | ||||||
|
VSI
|
8,403 | 8,454 | 6,265 | |||||||||
|
Other
|
(2,767 | ) | 1,116 | 1,061 | ||||||||
|
|
$ | 11,160 | $ | 15,377 | $ | 18,796 | ||||||
F - 31
ELBIT SYSTEMS LTD. AND SUBSIDIARIES
NOTES TO THE CONSOLIDATED FINANCIAL STATEMENTS (CONT.)
Note 6 -
INVESTMENTS IN AFFILIATED COMPANIES, PARTNERSHIPS AND OTHER COMPANIES (Cont.)
|
|
B.
|
Investments in companies accounted for under the equity method (Cont.)
|
|
|
(7)
|
The summarized aggregate financial information of companies accounted for under the equity method is as follows:
|
Balance Sheet Information:
|
|
December 31,
|
|
||||||
|
|
|
2012
|
|
|
2011
|
|
||
|
Current assets
|
|
$
|
278,751
|
|
$
|
272,274
|
|
|
|
Non-current assets
|
|
|
114,289
|
|
|
67,151
|
|
|
|
Total assets
|
|
$
|
393,040
|
|
$
|
339,425
|
|
|
|
|
|
|
|
|
|
|
||
|
Current liabilities
|
|
$
|
118,506
|
|
$
|
158,548
|
|
|
|
Non-current liabilities
|
|
|
44,137
|
|
|
24,809
|
|
|
|
Shareholders’ equity
|
|
|
230,397
|
|
|
156,068
|
|
|
|
|
|
$
|
393,040
|
|
$
|
339,425
|
|
|
Income Statement Information:
|
|
Year ended December 31,
|
|||||||||||
|
|
2012
|
2011
|
2010
|
|||||||||
|
Revenues
|
$ | 385,792 | $ | 402,438 | $ | 476,286 | ||||||
|
Gross profit
|
$ | 102,730 | $ | 117,222 | $ | 137,228 | ||||||
|
Net income
|
$ | 27,596 | $ | 38,131 | $ | 36,728 | ||||||
|
|
(8)
|
See Note 20(E) for guarantees.
|
|
|
|
December 31,
|
|
|||||
|
|
|
2012
|
|
|
2011
|
|
||
|
Receivables
|
|
$
|
201
|
|
|
$
|
5,303
|
|
|
Unbilled receivables
|
|
|
229,486
|
|
|
|
157,459
|
|
|
|
|
$
|
229,687
|
|
|
$
|
162,762
|
|
The majority of the long-term unbilled receivables are expected to be billed and collected during the years 2014 - 2016. Long-term trade and unbilled receivables are mainly related to the IMOD.
|
|
|
December 31,
|
|
|||||
|
|
|
2012
|
|
|
2011
|
|
||
|
Restricted deposits with banks (1)
|
|
$
|
-
|
|
|
$
|
2,271
|
|
|
Hedging receivables in respect to Series A Notes (See Note 16)
|
|
|
11,555
|
|
|
|
3,112
|
|
|
Deposits with banks and other long-term receivables (2)
|
|
|
7,714
|
|
|
|
6,832
|
|
|
|
|
$
|
19,269
|
|
|
$
|
12,215
|
|
|
|
(1)
|
Restricted deposits in respect of an issued bank guarantee.
|
|
|
(2)
|
Includes long-term balances of a non-qualified deferred compensation plan structured under Section 409A in the amount of $6,093 and $5,427 as of December 31, 2012 and 2011, respectively (See Note 17).
|
F - 32
ELBIT SYSTEMS LTD. AND SUBSIDIARIES
NOTES TO THE CONSOLIDATED FINANCIAL STATEMENTS (CONT.)
In 2012 the Company invested approximately $51,000 in available-for-sale marketable securities.
As of December 31, 2012, the fair value, amortized cost and gross unrealized holding gains and losses of such securities were as follows:
|
December 31, 2012
|
||||||||||||||||
|
Amortized cost
|
Gross unrealized gains
|
Gross unrealized losses
|
Fair value
|
|||||||||||||
|
Government debentures - fixed and floating interest rate
|
$ | 12,428 | 192 | - | $ | 12,620 | ||||||||||
|
Corporate debentures - fix and floating interest rate
|
36,901 | 594 | (4 | ) | 37,441 | |||||||||||
| $ | 49,329 | 786 | (4 | ) | $ | 50,111 | ||||||||||
The contractual maturities of the available-for-sale marketable securities in future years are as follows:
|
December 31,
2012
|
||||
|
2014
|
$ | 1,810 | ||
|
2015
|
9,735 | |||
|
2016
|
18,016 | |||
|
2017
|
13,659 | |||
|
2018 and after
|
2,920 | |||
| $ | 46,140 | |||
As of December 31, 2012, interest receivable amounted to $537, included in other receivables.
F - 33
ELBIT SYSTEMS LTD. AND SUBSIDIARIES
NOTES TO THE CONSOLIDATED FINANCIAL STATEMENTS (CONT.)
|
|
|
December 31,
|
|
|||||
|
|
|
2012
|
|
|
2011
|
|
||
|
Cost
(1)
:
|
|
|
|
|
|
|
||
|
Land, buildings and leasehold improvements
(2)
|
|
$
|
373,286
|
|
$
|
361,246
|
||
|
Instruments, machinery and equipment
(3)
|
|
|
641,911
|
|
|
629,290
|
||
|
Office furniture and other
|
|
|
95,080
|
|
|
76,939
|
||
|
Motor vehicles and airplanes
|
|
|
133,467
|
|
|
131,106
|
||
|
|
|
|
1,243,744
|
|
|
1,198,581
|
||
|
Accumulated depreciation
|
|
|
(742,458
|
) |
|
|
(680,973
|
) |
|
Depreciated cost
|
|
$
|
501,286
|
|
$
|
517,608
|
||
Depreciation expenses for the years ended December 31, 2012, 2011 and 2010 amounted to $89,551, $93,666 and $84,412, respectively.
|
|
(1)
|
Net of investment grants received (mainly for instruments, machinery and equipment) in the amounts of $36,990 and $29,367 as of December 31, 2012 and 2011, respectively.
|
|
|
(2)
|
Set forth below is additional information regarding the real estate owned or leased by the Company (in square feet):
|
|
Israel (a)
|
U.S. (b)
|
Other
Countries (c)
|
|||||||||||
|
Owned
|
2,158,000 | 710,000 | 891,000 | ||||||||||
|
Leased
|
1,896,000 | 631,000 | 303,000 | ||||||||||
|
|
(a)
|
Includes offices, development and engineering facilities, manufacturing facilities, maintenance facilities, hangar facilities and a landing strip in various locations in Israel used by Elbit Systems’ Israeli subsidiaries.
|
|
|
(b)
|
Includes offices, development and engineering facilities, manufacturing facilities and maintenance facilities of Elbit Systems of America primarily in Texas, New Hampshire, Florida, Alabama and Virginia.
|
|
|
(c)
|
Includes offices, design and engineering facilities and manufacturing facilities, mainly in Europe, Brazil, Australia and Asia.
|
|
|
(3)
|
Includes equipment produced by the Company for its own use in the aggregate amount of $239,758 and $173,649 as of December 31, 2012 and 2011, respectively.
|
As for pledges of assets – see Note 20(I).
F - 34
ELBIT SYSTEMS LTD. AND SUBSIDIARIES
NOTES TO THE CONSOLIDATED FINANCIAL STATEMENTS (CONT.)
|
|
A.
|
Composition
of
identifiable intangible assets:
|
|
|
|
Weighted average
|
|
|
|
|
|
|
|
|||
|
|
|
useful lives
|
|
|
December 31,
|
|
||||||
|
|
|
|
|
2012
|
|
|
2011
|
|
||||
|
Original cost:
|
|
|
|
|
|
|
|
|
|
|||
|
Technology
|
|
|
10
|
|
|
$
|
254,798
|
|
|
$
|
254,668
|
|
|
Customer relations
|
|
|
6
|
|
|
|
201,809
|
|
|
|
201,346
|
|
|
Trademarks and other
|
|
|
11
|
|
|
|
65,002
|
|
|
|
64,872
|
|
|
|
|
|
|
|
|
|
521,609
|
|
|
|
520,886
|
|
|
Accumulated amortization:
|
|
|
|
|
|
|
|
|
|
|
|
|
|
Technology
|
|
|
|
|
|
|
140,233
|
|
|
|
119,598
|
|
|
Customer relations
|
|
|
|
|
|
|
137,356
|
|
|
|
115,352
|
|
|
Trademarks and other
|
|
|
|
|
|
|
29,057
|
|
|
|
22,190
|
|
|
|
|
|
|
|
|
|
306,646
|
|
|
|
257,140
|
|
|
Amortized cost
|
|
|
|
|
|
$
|
214,963
|
|
|
$
|
263,746
|
|
|
|
B.
|
Amortization expenses amounted to $49,245, $56,952 and $47,729 for the years ended December 31, 2012, 2011 and 2010, respectively.
|
|
|
C.
|
The estimated aggregate amortization expense for each of the five succeeding fiscal years is:
|
|
2013
|
|
$
|
45,734
|
|
|
2014
|
|
|
43,219
|
|
|
2015
|
|
|
36,901
|
|
|
2016
|
|
|
28,106
|
|
|
2017
|
|
|
16,556
|
|
|
2018 and after
|
|
|
44,447
|
|
|
|
D.
|
Changes in goodwill, during 2012 are as follows:
|
|
|
|
|
|
2012
|
|
|
|
Balance, at January 1,
|
|
$
|
499,326
|
|
|
Net translation differences
(1)
|
|
|
1,272
|
|
|
|
|
|
|
|
|
Balance, at December 31,
|
|
$
|
500,598
|
|
|
|
(1)
|
Foreign currency translation differences resulting from goodwill allocated to reporting units, whose functional currency has been determined to be other than the U.S. dollar.
|
F - 35
ELBIT SYSTEMS LTD. AND SUBSIDIARIES
NOTES TO THE CONSOLIDATED FINANCIAL STATEMENTS (CONT.)
|
|
|
|
|
|
December 31,
|
|
||||||
|
|
|
Interest %
|
|
|
2012
|
|
|
2011
|
|
|||
|
Short-term loans
|
|
|
2.5%
|
|
|
$
|
-
|
|
|
$
|
158
|
|
|
Short-term bank credit
|
|
|
3.42-5%
|
|
|
|
181
|
|
|
|
2,840
|
|
|
|
|
|
|
|
$
|
181
|
|
|
$
|
2,998
|
|
|
|
Weighted average interest rate
|
|
|
2.40 %
|
|
|
|
|
|
|
|
|
|
|
|
|
December 31,
|
|
|||||
|
|
|
2012
|
|
|
2011
|
|
||
|
Payroll and related expenses
|
|
$
|
136,240
|
|
|
$
|
143,805
|
|
|
Provision for vacation pay
|
|
|
47,236
|
|
|
|
43,401
|
|
|
Provision for income tax, net of advances
|
|
|
35,269
|
|
|
|
26,858
|
|
|
Other income tax liabilities
|
|
|
34,451
|
|
|
|
36,707
|
|
|
Value added tax (“VAT”) payable
|
|
|
11,160
|
|
|
|
15,202
|
|
|
Provision for royalties
|
|
|
31,410
|
|
|
|
31,549
|
|
|
Provision for warranty
|
|
|
196,559
|
|
|
|
185,067
|
|
|
Derivative instruments
|
|
|
4,956
|
|
|
|
25,954
|
|
|
Deferred income tax, net
|
479
|
-
|
||||||
|
Provision for losses on long-term contracts
(1)
|
|
|
51,850
|
|
|
|
109,171
|
|
|
Other
(2)
|
|
|
154,840
|
|
|
|
138,815
|
|
|
|
|
$
|
704,450
|
|
|
$
|
756,529
|
|
|
|
(1)
|
Includes a provision of $5,167 and $43,900 as of December 31, 2012 and 2011, respectively, related to the cessation of a program with a foreign customer (See Note 1(C)).
|
|
|
(2)
|
Primarily includes provisions for estimated future costs in respect of (1) penalties and the probable loss from claims (legal or unasserted) in the ordinary course of business (e.g., damages caused by the items sold and claims as to the specific products ordered), and (2) unbilled services of service providers.
|
|
Note 14
|
CUSTOMER ADVANCES IN EXCESS OF COSTS INCURRED ON CONTRACTS IN PROGRESS
|
|
|
|
December 31,
|
|
|||||
|
|
|
2012
|
|
|
2011
|
|
||
|
Advances received
|
|
$
|
782,482
|
|
|
$
|
750,161
|
|
|
Less -
|
|
|
|
|
|
|
|
|
|
Advances presented under long-term liabilities
|
|
|
156,497
|
|
|
|
154,696
|
|
|
Advances deducted from inventories
|
|
|
104,297
|
|
|
|
150,195
|
|
|
|
|
521,688
|
|
|
|
445,270
|
|
|
|
Less -
|
|
|
|
|
|
|
||
|
Costs incurred on contracts in progress (See Note 5)
|
|
|
68,306
|
|
|
|
38,048
|
|
|
|
|
$
|
453,382
|
|
|
$
|
407,222
|
|
As for guarantees and liens, See Notes 20(E), 20(G) and 20(I).
F - 36
ELBIT SYSTEMS LTD. AND SUBSIDIARIES
NOTES TO THE CONSOLIDATED FINANCIAL STATEMENTS (CONT.)
|
|
|
|
Years of
|
December 31,
|
|||||||||
|
|
Currency
|
Interest %
|
maturity
|
2012
|
2011
|
||||||||
|
Long-term bank loans(*)
|
U.S. dollars
|
Libor+1.25-2.5%
|
mainly 2-3
|
$ | 174,381 | $ | 369,564 | ||||||
|
|
GBP
|
Libor + 1.11-3.28%
|
mainly 1-3
|
29,917 | 29,298 | ||||||||
|
|
Other
|
Libor + 1.7-4%
|
mainly 1-3
|
1,228 | 1,408 | ||||||||
|
|
|
|
|
205,525 | 400,270 | ||||||||
|
Less: current maturities
|
|
|
31,781 | 98,015 | |||||||||
|
|
|
|
|
$ | 173,745 | $ | 302,255 | ||||||
(*) For covenants see Note 20(F).
As of December 31, 2012 the LIBOR annual rate:
For long-term loans denominated in U.S. dollars was 1.25%.-2.5%.
For long-term loans denominated in GBP was 2.2%.
The maturities of these loans for periods after December 31, 2012 are as follows:
|
2013 – current maturities
|
|
$
|
31,781
|
|
|
2014
|
|
|
75,137
|
|
|
2015
|
|
|
16,895
|
|
|
2016
|
|
|
81,712
|
|
|
|
|
$
|
205,525
|
|
F - 37
ELBIT SYSTEMS LTD. AND SUBSIDIARIES
NOTES TO THE CONSOLIDATED FINANCIAL STATEMENTS (CONT.)
|
|
|
December 31,
|
|
|||||
|
|
|
2012
|
|
|
2011
|
|
||
|
Series A Notes
|
|
$
|
450,040
|
|
|
$
|
259,094
|
|
|
Less – Current maturities
|
|
|
(58,275
|
)
|
|
|
(29,612
|
)
|
|
Carrying amount adjustments on Series A Notes
(*)
|
|
|
16,158
|
|
|
|
7,412
|
|
|
Premium (discount) on Series A Notes, net
|
|
|
687
|
|
|
|
(1,575
|
)
|
|
|
|
$
|
408,610
|
|
|
$
|
235,319
|
|
|
(*)
|
As a result of fair value hedge accounting, described below, and in Notes 2(Y) and 2(AA). The carrying value of the Series A Notes is adjusted for changes in the interest rates.
|
In June 2010, the Company issued Series A Notes in the aggregate principal amount of NIS 1.1 billion (approximately $283,000), payable in 10 equal annual installments on June 30 of each of the years 2011 through 2020. The Series A Notes bear a fixed interest rate of 4.84% per annum, payable on June 30 and December 30 of each of the years 2010 through 2020 (the first interest payment was made on December 30, 2010, and the last interest payment will be made on June 30, 2020). Debt issuance costs were approximately $2,530, of which $2,164 was allocated to the Series A Notes discount, and $366 was allocated to deferred issuance costs and are amortized as financial expenses over the term of the Series A Notes due in 2020.
In March 2012, the Company issued additional Series A Notes in the aggregate principal amount of NIS 807 million (approximately $217,420). The immediate gross proceeds received by the Company for the issuance of the March 2012 Series A Notes were approximately NIS 831 million (approximately $224,000). Debt issuance costs were approximately $2,010, of which $1,795 was allocated to the Series A Notes discount, and $215 was allocated to deferred issuance costs and are amortized as financial expenses over the term of the Series A Notes due in 2020. Premium was approximately $3,675 and is amortized as financial income over the term of the Series A Notes due in December 2020.
In May 2012, the Company issued additional Series A Notes in an aggregate principal amount of NIS 92 million (approximately $24,407) through a private placement to Israeli institutional investors. The immediate gross proceeds received by the Company for the issuance of the May 2012 Series A Notes were approximately NIS 95 million (approximately $24,900). Debt issuance costs were approximately $94. These costs were allocated to deferred issuance costs and are amortized as financial expenses over the term of the Series A Notes due in 2020. Premium was approximately $260 and is amortized as financial income over the term of the Series A Notes due in December 2020.
The 2010 Series A Notes together with the 2012 Series A Notes form one single series with the same terms and conditions.
The Series A Notes (principal and interest) are not linked to any currency or index. The Series A Notes are unsecured, non convertible and do not restrict the Company’s ability to issue additional notes of any class or distribute dividends in the future. There are no covenants on the Series A Notes. The Series A Notes are listed for trading on the Tel-Aviv Stock Exchange.
During the years ended December 31, 2012, 2011 and 2010, the Company recorded $10,787, $5,753 and $4,395, respectively, as interest expenses and $153, $422 and $258, respectively, as amortization of debt issuance costs net on the Series A Notes.
F - 38
ELBIT SYSTEMS LTD. AND SUBSIDIARIES
NOTES TO THE CONSOLIDATED FINANCIAL STATEMENTS (CONT.)
The Company also entered into ten-year cross currency interest rate swap transactions in order to effectively hedge the effect of interest and exchange rate differences resulting from the 2010 NIS Series A Notes. Under the cross currency interest rate swaps, the Company will receive fixed NIS at a rate of 4.84% on NIS 1.1 billion and pay floating six-month USD LIBOR + an average spread of 1.65% on
$287,000, which reflects the U.S. dollar value of the Series A Notes on the specific dates the transactions were consumed. Both the debt and the swap instruments will pay semi-annual coupons on June 30 and December 31. The purpose of these transactions was to convert the NIS fixed rate Series A Notes into USD LIBOR (6 months) floating rate obligations. As a result of these agreements, the Company is currently paying an effective interest rate of six-month LIBOR (0.45% at December 31, 2012) plus an average of 1.65% on the principal amount, as compared to the original 4.84% fixed rate. The above transactions qualify for fair value hedge accounting.
On April 2012 and May 2012 the Company entered into cross currency interest rate swap transactions in order to effectively hedge the effect of interest and exchange rate differences resulting from the 2012 issuance of Series A Notes. Under these cross currency interest rate swaps, the Company will receive fixed NIS at a rate of 4.84% on NIS 807 million and NIS 92 million and pay floating six-month USD LIBOR + an average spread of 2.02% on $217,300 and 2.285% on $24,100, respectively, which reflects the U.S. dollar value of the 2012 issued Series A Notes on the specific dates the transactions were consumed. Both the debt and the swap instruments will pay semi-annual coupons on June 30 and December 31. The purpose of these transactions was to convert the NIS fixed rate Series A Notes into USD LIBOR (6 months) floating rate obligations. As a result of these agreements, the Company is currently paying an effective interest rate of six-month LIBOR (0.45% at December 31, 2012) plus an average of 1.84% on the 2012 principal amounts, as compared to the original 4.84% fixed rate. The above transactions qualify for fair value hedge accounting.
Future principal payments for the Series A Notes are as follows:
|
|
December
31,
2012
|
||
|
2013 (current maturities)
|
$
|
58,275
|
|
|
2014
|
|
58,275
|
|
|
2015
|
|
58,275
|
|
|
2016
|
|
58,275
|
|
|
2017
|
|
58,275
|
|
|
2018 and after
|
|
175,510
|
|
| $ |
466,885
|
F - 39
ELBIT SYSTEMS LTD. AND SUBSIDIARIES
NOTES TO THE CONSOLIDATED FINANCIAL STATEMENTS (CONT.)
The Company’s subsidiaries ESA, Telefunken and a European subsidiary sponsor benefit plans for their employees in the U.S., Germany and Belgium, respectively, as follows:
Defined Benefit Retirement Plan based on Employer’s Contributions
|
|
a)
|
ESA has three defined benefit pension plans (the “Plans”) which cover the employees of ESA’s subsidiaries EFW and Kollsman. Monthly benefits are based on years of benefit service and annual compensation. Annual contributions to the Plans are determined using the unit credit actuarial cost method and are equal to or exceed the minimum required by law. Pension fund assets of the Plans are invested primarily in stocks, bonds and cash through a financial institution, as the investment manager of the Plans’ assets. Pension expense is allocated between cost of sales and general and administrative expenses, depending on the responsibilities of the employee. The measurement date for the EFW and Kollsman benefit obligation is December 31.
|
Participation in ESA’s qualified defined benefit plans was frozen as of January 1, 2010 for non-represented employees. Current participants will continue to accrue benefits; however no new non-represented employees will be allowed to enter the plan.
|
|
b)
|
Telefunken Radio Communication Systems GmbH & Co. (“Telefunken”), a wholly-owned German subsidiary, has mainly one defined benefit pension plan (the “P3-plan”) which covers all employees. The P3-plan provides for yearly cash balance credits equal to a percentage of a participant’s compensation, which accumulate together with the respective interest credits on the employee’s cash balance accounts. In case of an insured event (retirement, death or disability) the benefits can be paid as a lump sum, in installments or as a life-long annuity. The P3-plan is an unfunded plan.
|
|
|
c)
|
A wholly-owned European subsidiary in Belgium has a defined benefit pension plan, which is divided into two categories:
|
|
|
1)
|
Normal retirement benefit plan, with eligibility at age 65. The lump sum is based on employee contributions of 2% of the final pensionable salary up to a certain breakpoint, plus 6% exceeding the breakpoint at a maximum of 5% of pensionable salary, and the employer contributions, with a maximum of 40 years. The vested benefit is equal to the retirement benefit calculated with the pensionable salary and pensionable service observed at the date of leaving service.
|
|
|
2)
|
Pre-retirement death benefit to employees.
|
|
|
The plan is funded and includes profit sharing.
|
F - 40
ELBIT SYSTEMS LTD. AND SUBSIDIARIES
NOTES TO THE CONSOLIDATED FINANCIAL STATEMENTS (CONT.)
Note 17 - BENEFIT PLANS AND ACCRUED TERMINATION LIABILITY (Cont.)
The following table sets forth the Plans’ funded status and amounts recognized in the consolidated financial statements for the years ended December 31, 2012 and 2011:
|
|
|
December 31,
|
|
|||||
| 2012 |
2011
|
|||||||
|
Changes in benefit obligation:
|
|
|
|
|
||||
|
Benefit obligation at beginning of year
|
|
$
|
153,097
|
|
$
|
119,983
|
|
|
|
Service cost
|
|
|
9,709
|
|
|
8,205
|
|
|
|
Interest cost
|
|
|
6,567
|
|
|
6,361
|
|
|
|
Exchange rate differences
|
|
|
299
|
|
|
(508
|
) | |
|
Actuarial losses
|
|
|
10,747
|
|
|
21,313
|
|
|
|
Benefits paid
|
|
|
(3,329
|
) |
|
|
(2,257
|
) |
|
Benefit obligation at end of year
|
|
$
|
177,090
|
|
$
|
153,097
|
|
|
|
Changes in the Plans’ Assets:
|
|
|
|
|
|
|
||
|
Fair value of Plans’ assets at beginning of year
|
|
|
81,780
|
|
|
69,493
|
|
|
|
Actual return on Plans’ assets (net of expenses)
|
|
|
11,002
|
|
|
(722
|
)
|
|
|
Employer contribution
|
|
|
12,341
|
|
|
15,266
|
|
|
|
Benefits paid
|
|
|
(3,329
|
) |
|
|
(2,257
|
)
|
|
Fair value of Plans’ assets at end of year
|
|
$
|
101,794
|
|
$
|
81,780
|
|
|
|
Accrued benefit cost, end of year:
|
|
|
|
|
|
|
||
|
Funded status
|
|
|
(75,296
|
) |
|
|
(71,317
|
)
|
|
Unrecognized net actuarial loss
|
|
|
63,178
|
|
|
60,650
|
|
|
|
Unrecognized prior service cost
|
|
|
498
|
|
|
584
|
|
|
|
|
|
$
|
(11,620
|
) |
|
$
|
(10,083
|
)
|
|
Amount recognized in the statement of financial position:
|
|
|
|
|
|
|
||
|
Accrued benefit liability, current
|
|
|
(85)
|
|
|
(85
|
)
|
|
|
Accrued benefit liability, non-current
|
|
|
(75,211
|
) |
|
|
(71,232
|
)
|
|
Accumulated other comprehensive income, pre-tax
|
|
|
63,676
|
|
|
61,234
|
|
|
|
Net amount recognized
|
|
$
|
(11,620
|
) |
|
$
|
(10,083
|
)
|
|
|
|
Year ended
December 31,
|
|
|||||||||
|
|
|
2012
|
|
|
2011
|
|
|
2010
|
|
|||
|
Components of the Plans’ net periodic pension cost:
|
|
|
|
|
|
|
|
|
|
|||
|
Service cost
|
|
$
|
9,709
|
|
$
|
8,205
|
|
|
$
|
7,031
|
|
|
|
Interest cost
|
|
|
6,567
|
|
|
6,361
|
|
|
|
5,858
|
|
|
|
Expected return on Plans’ assets
|
|
|
(6,400
|
) |
|
|
(5,512
|
)
|
|
|
(4,914
|
)
|
|
Amortization of prior service cost
|
|
|
172
|
|
|
104
|
|
|
|
95
|
|
|
|
Amortization of transition amount
|
|
|
(131
|
) |
|
|
(147
|
)
|
|
|
(130
|
)
|
|
Amortization of net actuarial loss
|
|
|
4,107
|
|
|
1,988
|
|
|
|
1,769
|
|
|
|
Total net periodic benefit cost
|
|
$
|
14,023
|
|
$
|
10,999
|
|
|
$
|
9,709
|
|
|
|
Additional information
|
|
|
|
|
|
|
|
|
|
|
|
|
|
Accumulated benefit obligation
|
|
$
|
167,667
|
|
$
|
144,682
|
|
|
$
|
112,643
|
|
|
|
|
|
December 31,
|
|
|||||
|
|
2012
|
|
|
2011
|
|
|||
| Weighted average assumptions: | ||||||||
|
Discount rate as of December 31
|
|
|
4.1
|
% |
|
4.4
|
%
|
|
|
Expected long-term rate of return on Plans’ assets
|
|
|
7.0
|
% |
|
7.3
|
%
|
|
|
Rate of compensation increase
|
|
|
2.2
|
% |
|
2.4
|
%
|
|
F - 41
ELBIT SYSTEMS LTD. AND SUBSIDIARIES
NOTES TO THE CONSOLIDATED FINANCIAL STATEMENTS (CONT.)
Note 17 - BENEFIT PLANS AND ACCRUED TERMINATION LIABILITY (Cont.)
Asset Allocation by Category as of December 31:
|
|
2012
|
|
|
2011
|
|
|||
|
Asset Category:
|
|
|
|
|
|
|
||
|
Equity Securities
|
|
|
57.5
|
% |
|
|
56.8
|
%
|
|
Debt Securities
|
|
|
34.8
|
% |
|
|
36.1
|
%
|
|
Other
|
|
|
7.7
|
% |
|
|
7.1
|
%
|
|
Total
|
|
|
100.0
|
% |
|
|
100.0
|
%
|
The investment policy of ESA is directed toward a broad range of securities. The diversified portfolio seeks to maximize investment return while minimizing the risk levels associated with investing. The investment policy is structured to consider the retirement plan’s obligations and the expected timing of benefit payments. The target asset allocation for the Plan years presented is as follows:
|
|
|
2012
|
|
|
2011
|
|
||
|
Asset Category:
|
|
|
|
|
|
|
||
|
Equity Securities
|
|
|
50
|
% |
|
|
56.0
|
%
|
|
Debt Securities
|
|
|
40
|
% |
|
|
41.2
|
%
|
|
Other
|
|
|
10
|
% |
|
|
2.8
|
%
|
|
Total
|
|
|
100.0
|
% |
|
|
100.0
|
%
|
The fair value of the asset values by category at December 31, 2012 is as follows:
|
|
|
|
|
|
Quoted Prices in Active Markets for Identical Assets
|
|
|
Significant Observable Inputs
|
|
|
Significant Unobservable Inputs
|
|
||||
|
Asset Category
|
|
Total
|
|
|
(Level 1)
|
|
|
(Level 2)
|
|
|
(Level 3)
|
|
||||
|
Cash
|
|
$
|
38
|
|
|
$
|
38
|
|
|
$
|
-
|
|
|
$
|
-
|
|
|
Cash Equivalents:
|
|
|
|
|
|
|
|
|
|
|
|
|
|
|
||
|
Money Market Funds (a)
|
|
|
4,153
|
|
|
|
4,153
|
|
|
|
-
|
|
|
|
-
|
|
|
Fixed Income Securities
:
|
||||||||||||||||
|
Mutual Funds (b)
|
|
|
36,618
|
|
|
|
36,618
|
|
|
|
-
|
|
|
|
-
|
|
|
Equity Securities:
|
|
|
|
|
|
|
|
|
|
|
|
|
|
|||
|
International Companies (c)
|
|
|
1,554
|
|
|
|
1,554
|
|
|
|
-
|
|
|
|
-
|
|
|
Mutual Funds (d)
|
|
|
47,091
|
|
|
|
47,091
|
|
|
|
-
|
|
|
|
-
|
|
|
Other
|
12,340
|
12,340
|
||||||||||||||
|
Total
|
|
$
|
101,794
|
|
|
$
|
101,794
|
|
|
$
|
-
|
|
|
$
|
-
|
|
|
(a)
|
This category includes highly liquid daily traded cash-like vehicles.
|
|
(b)
|
This category invests in highly liquid diverse mutual funds representing a diverse offering of debt issuance.
|
|
(c)
|
This change represents common stocks of companies domiciled outside of the U.S.; they can be represented by ordinary shares or ADRs.
|
|
(d)
|
This category represents highly liquid diverse equity mutual funds of varying asset classes and styles.
|
F - 42
ELBIT SYSTEMS LTD. AND SUBSIDIARIES
NOTES TO THE CONSOLIDATED FINANCIAL STATEMENTS (CONT.)
Note 17 - BENEFIT PLANS AND ACCRUED TERMINATION LIABILITY (Cont.)
In developing the overall expected long-term rate of return on assets assumption, ESA used a building block approach in which rates of return in excess of inflation were considered separately for equity securities, debt securities, real estate and all other assets. The excess returns were weighted by the representative target allocation and added along with an approximate rate of inflation to develop the overall expected long-term rate of return. It is the policy of ESA to meet the ERISA minimum contribution requirements for a Plan year. The minimum contribution requirements for the 2012 Plan year have been satisfied as of December 31, 2012. Benefit payments over the next five years are expected to be $4,072 in 2013; $4,659 in 2014, $5,258 in 2015, $5,879 in 2016 and $6,587 in 2017.
Retiree Medical Plan
Effective January 1, 2003, ESA commenced offering retiree medical benefits to a limited number of retirees at EFW.
The measurement date for ESA benefit obligation is December 31. The following table sets forth the retiree medical plans’ funded status and amounts recognized in the consolidated financial statements for the years ended December 31, 2012 and 2011:
|
|
|
December 31,
|
|
|||||
|
|
|
2012
|
|
|
2011
|
|
||
|
Change in Benefit Obligation:
|
|
|
|
|
|
|
||
|
Benefit obligation at beginning of period
|
|
$
|
3,145
|
|
$
|
2,914
|
|
|
|
Service cost
|
|
|
299
|
|
|
253
|
|
|
|
Interest cost
|
|
|
117
|
|
|
151
|
|
|
|
Actuarial (gain) loss
|
|
|
(688
|
) |
|
|
(63
|
)
|
|
Employee contribution
|
|
|
17
|
|
|
19
|
|
|
|
Benefits paid
|
|
|
(107
|
) |
|
|
(129
|
)
|
|
Benefit obligation at end of period
|
|
$
|
2,781
|
|
$
|
3,145
|
|
|
|
|
|
|
|
|
|
|
||
|
Change in Plan Assets:
|
|
|
|
|
|
|
||
|
Fair value of plan assets at beginning of period
|
|
$
|
-
|
|
$
|
-
|
|
|
|
Employer contribution
|
|
|
90
|
|
|
110
|
|
|
|
Employee contribution
|
|
|
17
|
|
|
19
|
|
|
|
Benefits paid
|
|
|
(107
|
) |
|
|
(129
|
)
|
|
Fair value of plan assets at end of period
|
|
$
|
-
|
|
$
|
-
|
|
|
F - 43
ELBIT SYSTEMS LTD. AND SUBSIDIARIES
NOTES TO THE CONSOLIDATED FINANCIAL STATEMENTS (CONT.)
Note 17 - BENEFIT PLANS AND ACCRUED TERMINATION LIABILITY (Cont.)
|
|
Year ended December 31,
|
|||||||
|
|
2012
|
2011
|
||||||
|
Accrued benefit cost, end of period:
|
|
|
||||||
|
Funded status
|
$ | (2,781 | ) | $ | (3,145 | ) | ||
|
Unrecognized net actuarial loss
|
246 | 455 | ||||||
|
Unrecognized prior service cost
|
- | - | ||||||
|
Accrued benefit cost, end of period
|
$ | (2,535 | ) | $ | (2,690 | ) | ||
|
Amounts recognized in the statement of financial position:
|
||||||||
|
Accrued benefit liability, current
|
$ | (175 | ) | $ | (111 | ) | ||
|
Accrued benefit liability, non-current
|
(2,606 | ) | (3,034 | ) | ||||
|
Accumulated other comprehensive loss, pretax
|
246 | 455 | ||||||
|
Net amount recognized
|
$ | (2,535 | ) | $ | (2,690 | ) | ||
|
Components of net periodic pension cost (for period):
|
|
|
||||||
|
Service cost
|
$ | 299 | $ | 253 | ||||
|
Interest cost
|
117 | 151 | ||||||
|
Amortization of prior service cost
|
12 | 74 | ||||||
|
Amortization of net actuarial loss
|
- | 22 | ||||||
|
Total net periodic benefit cost
|
$ | 428 | $ | 500 | ||||
|
Assumptions as of end of period:
|
||||||||
|
Discount rate
|
3.78 | % | 3.78 | % | ||||
|
Health care cost trend rate assumed for next year
|
8.00 | % | 8.50 | % | ||||
|
Ultimate health care cost trend rate
|
5.00 | % | 5.00 | % | ||||
The effect of a 1% change in the health care cost trend rate at December 31, 2012 is as follows:
|
|
|
1% increase
|
|
|
1% decrease
|
|
||
|
Net periodic benefit cost
|
|
$
|
53
|
|
|
$
|
(46
|
)
|
|
Benefit obligation
|
|
$
|
244
|
|
|
$
|
(216
|
)
|
Defined Contribution Plan
The 401(k) savings plan (“401(k) plan”) is a defined contribution retirement plan that covers all eligible ESA employees, as defined in section 401(k) of the U.S. Internal Revenue Code. Employees may elect to contribute a percentage of their annual gross compensation to the 401(k) plan. ESA may make discretionary matching contributions as determined by ESA. Total expense under the 401(k) plan amounted to $4,436, $4,356 and $3,896 for the years ended December 31, 2012, 2011 and 2010, respectively. Expense for the deferred 401(k) plan is allocated between cost of sales and general and administrative expenses depending on the responsibilities of the related employees.
F - 44
ELBIT SYSTEMS LTD. AND SUBSIDIARIES
NOTES TO THE CONSOLIDATED FINANCIAL STATEMENTS (CONT.)
Non-Qualified Defined Contribution Plan
In 2007, ESA implemented two new benefit plans for the executives of the organization. The non-qualified, defined contribution plan is structured under Section 409(A). The plan provides the employees at vice president level and above the opportunity to defer up to 100% of their salary to the 409(A) plan. ESA provides a match of 50 cents on the dollar up to 10% of the employees’ total salary and incentive based compensation. The contribution can be made into the 401(k) plan, the 409(A) plan or both plans. The purpose is to provide comparable defined contribution plan benefits for the senior management across three ESA locations. The 409(A) plan funds are contributed to several life insurance policies. Participant contributions to the plan were $742, $441 and $543 for the years ended December 31, 2012, 2011 and 2010 respectively, and the total ESA contribution to the plan was $133 for 2012. The cash and cash surrender value of these life insurance policies at December 31, 2012 was $3,867. The total liability related to the 409(A) plan was $3,976 at December 31, 2012.
The second plan implemented is a non-qualified, defined benefit plan for the top three executives of ESA. The plan provides a calculated, guaranteed payment in addition to their regular pension through the company upon retirement. The plan is funded with several life insurance policies. They are not segregated into a trust or otherwise effectively restricted. These policies are corporate owned assets that are subject to the claims of general creditors and cannot be considered as formal plan assets. The defined benefit plan put in place meets the ERISA definition of an unfunded deferred compensation plan maintained for the benefit of a select group of management or highly compensated employees. The plan assets of life insurance policies have a cash surrender of $2,199 at December 31, 2012. Related liability for the pension payments is $3,015 at December 31, 2012. As of December 31, 2012, all executives had partially vested balances in the plan.
|
|
A.
|
APPLICABLE TAX LAWS
|
|
|
(1)
|
Israeli Corporate Income Tax Rates
|
Corporate tax rates in Israel were 25% in 2010, 24% in 2011 and 25% in 2012.
In December 2011 the Knesset passed the Law for the Tax Burden Reform (Amended Legislation) – 2011 (“the Tax Burden Reform”), which came into effect on January 1, 2012. Pursuant to the Tax Burden Reform, the corporate tax rate is scheduled to remain at a rate of 25% for future tax years. In view of this increase in the corporate tax rate to 25% in 2012, the real capital gains tax rate and the real betterment tax rate were also increased accordingly.
The net effect of the Tax Burden Reform on the deferred tax balances of the Company was recognized in the period of enactment (fourth quarter of 2011). The implementation of the Tax Burden Reform by the Company and its Israeli subsidiaries did not have a material effect on the Company’s 2011 results.
F - 45
ELBIT SYSTEMS LTD. AND SUBSIDIARIES
NOTES TO THE CONSOLIDATED FINANCIAL STATEMENTS (CONT.)
Note 18 - TAXES ON INCOME (Cont.)
|
|
A.
|
APPLICABLE TAX LAWS (Cont.)
|
|
|
(2)
|
Tax benefits under Israel’s Law for the Encouragement of Industry (Taxes), 1969:
|
Elbit Systems and most of its subsidiaries in Israel are “Industrial Companies”, as defined by the Law for the Encouragement of Industry (Taxes), 1969, and as such, these companies are entitled to certain tax benefits, mainly amortization of costs relating to know-how and patents over eight years, accelerated depreciation and the right to deduct public issuance expenses for tax purposes.
|
|
(3)
|
Tax benefits under Israel’s Law for the Encouragement of Capital Investments, 1959:
|
Elbit Systems
’
and certain of its Israeli subsidiaries
’
(“the companies”) operations have been granted “Approved Enterprise” status under Israel’s Law for the Encouragement of Capital Investments, 1959 (the “Law”). Accordingly, certain income of the companies derived from the “Approved Enterprise” programs is tax exempt for two-years and subject to reduced tax rates of 25% for a five-year to eight-year period or tax exempt for a ten-year period, commencing in the first year in which the companies had taxable income (limited to twelve years from commencement of production or fourteen years from the date of approval, whichever is earlier).
An Amendment to the Law from 2005 defines the “Privileged Enterprise” status rather than the previous terminology of “Approved Enterprise” and limits the scope of enterprises which may qualify for “Privileged Enterprise” status by setting criteria such as that at least 25% of the Privileged Enterprise program’s income be derived from exports. Additionally, the 2005 Amendment enacted major changes in the manner in which tax benefits are awarded under the Law so that companies no longer require an Investment Center approval in order to qualify for tax benefits. Similar criteria have been set for the “Preferred Enterprise” status which was added in an Amendment to the Law in 2011. Companies are not required to receive an Investment Center approval in order to qualify for the tax benefits under the Preferred Enterprise status, however, companies which are under an Approved Enterprise or Privileged Enterprise program must waive their former benefits to elect the Preferred Enterprise benefits.
Tax-exempt income generated by the Company and certain of its Israeli subsidiaries’ Approved Enterprises will be subject to tax upon dividend distribution, tax-exempt income generated by the Company and certain of its Israeli subsidiaries’ Privileged Enterprise programs will be subject to tax upon dividend distribution or complete liquidation. Income generated under a Preferred Enterprise is not subject to additional taxation upon distribution or complete liquidation.
F - 46
ELBIT SYSTEMS LTD. AND SUBSIDIARIES
NOTES TO THE CONSOLIDATED FINANCIAL STATEMENTS (CONT.)
Note 18 - TAXES ON INCOME (Cont.)
|
|
A.
|
APPLICABLE TAX LAWS (Cont.)
|
The entitlement to the above benefits is subject to the companies’ fulfilling the conditions specified in the Law, regulations promulgated thereunder and the letters of approval for the specific investments in “Approved Enterprises”. In the event of failure to comply with these conditions, the benefits may be canceled and the companies may be required to refund the amount of the benefits, in whole or in part, including interest (
see Note 18(A)(3)).
As of December 31, 2012, the Company’s management believes that the Company and its Israeli subsidiaries have met all conditions of the Law and letters of approval.
As of December 31, 2012, the tax benefits for the Company’s Approved Enterprise and Privileged Enterprise existing programs will expire within the period of 2015 to 2021.
As of December 31, 2012, retained earnings of the Company included approximately $694,342 in tax-exempt profits earned by the company’s “Approved Enterprises” and “Privileged Enterprises”. If the retained tax-exempt income is distributed, with respect to the “Approved Enterprises” and the “Privileged Enterprises”, it would be taxed at the corporate tax rate applicable to such profits as if the Company had not elected the alternative tax benefits track (currently – 25%), and an income tax liability would be incurred of approximately $173,585 as of December 31, 2012.
The companies’ boards of directors have decided that their policy is not to declare dividends out of such tax-exempt income. Accordingly, no deferred income taxes have been provided on exempt income attributable to the companies’ “Approved Enterprises” and “Privileged Enterprise”, as such retained earnings are essentially permanent in duration.
In Israel, income from sources other than the “Approved Enterprise” and “Privileged Enterprise” during the benefit period will be subject to tax at the regular corporate tax rate.
Since the Company and its Israeli subsidiaries are operating under more than one approval, and since part of their taxable income is not entitled to tax benefits under the Law and is taxed at the regular tax rates, the effective tax rate is the result of a weighted combination of the various applicable rates and tax exemptions, and the computation is made for income derived from each approval on the basis of formulas specified in the law and in the approvals.
In January 2011, the Knesset enacted a reform to the Law, effective January 2011. According to the reform a flat rate tax would apply to companies eligible for the “Preferred Enterprise” status. In order to be eligible for a Preferred Enterprise status, a company must meet minimum requirements to establish that it contributes to the country’s economic growth and is a competitive factor for the Gross Domestic Product (a competitive enterprise).
Israeli companies which currently benefit from an Approved or Privileged Enterprise status and meet the criteria for qualification as a Preferred Enterprise can elect to apply the new Preferred Enterprise benefits by waiving their benefits under the Approved and Privileged Enterprise status.
Benefits granted to a Preferred Enterprise include reduced and gradually decreasing tax rates. In peripheral regions (Development Area A) the reduced tax rate will be 10% in 2012, 7% in 2013 and 2014 and 6% starting from 2015. In other regions the tax rate will be 15% and 2012, 12.5% in 2013 and 2014 and 12% starting from 2015. Preferred Enterprises in peripheral regions will be eligible for Investment Center grants, as well as the applicable reduced tax rates.
F - 47
ELBIT SYSTEMS LTD. AND SUBSIDIARIES
NOTES TO THE CONSOLIDATED FINANCIAL STATEMENTS (CONT.)
Note 18 - TAXES ON INCOME (Cont.)
|
|
A.
|
APPLICABLE TAX LAWS (Cont.)
|
A distribution from a Preferred Enterprise out of the “Preferred Income” would be subject to 15% withholding tax for Israeli-resident individuals and non-Israeli residents (subject to applicable treaty rates). A distribution from a Preferred Enterprise out of the “Preferred Income” would be exempt from withholding tax for an Israeli-resident company. A company electing to waive its Privileged Enterprise or Approved Enterprise status through June 30, 2015 may distribute “Approved Income” or “Privileged Income” subject to 15% withholding tax for Israeli resident individuals and non-Israeli residents (subject to applicable treaty rates) and exempt from withholding tax for an Israeli-resident company. Nonetheless, a distribution from income exempt under Privileged Enterprise and Approved Enterprise programs will subject the exempt income to tax at the reduced corporate income tax rates pertaining to the Privileged Enterprise and Approved Enterprise programs upon distribution, or complete liquidation in the case of a Privileged Enterprise’s exempt income.
In November 2012, the Knesset passed Amendment No. 69 to the Investment Law (the “Trapped Earnings Law”) which provides a temporary, partial, relief from taxation on a distribution from exempt income for companies which elect the relief through November 2013. The Trapped Earnings Law allows a company to qualify a portion of its exempt income (“Elected Earnings”) for a reduced tax rate ranging between 17.5% and 6%. While the reduced tax is payable within 30 days of election, an electing company is not required to actually distribute the Elected Earnings within a certain period of time. The applicable rate is based on a linear formula involving the portion of Elected Earnings to exempt income and the applicable tax rate prescribed in the Investment Law. A company electing to qualify its exempt income must undertake to make designated investments in productive fixed assets, research and development, or wages of new employees (“Designated Investment”). The Designated Investment amount is defined by a formula which considers the portion of Elected Earnings to the exempt income and the applicable tax rate prescribed by the Investment Law.
In addition to the reduced tax rate, a distribution of Elected Earnings would be subject to a 15% withholding tax. The Trapped Earnings Law provides an exemption from the 15% withholding tax for a distribution to an Israeli resident company for companies which have elected the Privileged Enterprise status and waived their Approved Enterprise and privileged Enterprise Status through June 2015.
The Company is currently evaluating the implications of an election under the Trapped Earnings Law on the Company and its Israeli subsidiaries.
|
|
B.
|
NON – ISRAELI SUBSIDIARIES
|
Non-Israeli subsidiaries are taxed based on tax laws in their countries of residence.
|
|
C.
|
INCOME FROM CONTINUING OPERATIONS BEFORE TAXES ON INCOME
|
|
|
|
Year ended
December 31,
|
|
|||||||||
|
|
|
2012
|
|
|
2011
|
|
|
2010
|
|
|||
|
Income before taxes on income
:
|
|
|
|
|
|
|
|
|
|
|||
|
Domestic
|
|
$
|
159,330
|
|
|
$
|
95,226
|
|
|
$
|
160,749
|
|
|
Foreign
|
|
|
17,712
|
|
|
|
8,778
|
|
|
|
38,612
|
|
|
|
|
$
|
177,042
|
|
|
$
|
104,004
|
|
|
$
|
199,361
|
|
F - 48
ELBIT SYSTEMS LTD. AND SUBSIDIARIES
NOTES TO THE CONSOLIDATED FINANCIAL STATEMENTS (CONT.)
Note 18 - TAXES ON INCOME (Cont.)
|
|
D.
|
TAXES ON INCOME FROM CONTINUING OPERATIONS
|
|
|
|
Year ended
December 31,
|
|
|||||||||
|
|
|
2012
|
|
|
2011
|
|
|
2010
|
|
|||
|
Current taxes
:
|
|
|
|
|
|
|
|
|
|
|||
|
Domestic
|
|
$
|
12,957
|
|
$
|
13,896
|
|
|
$
|
26,842
|
|
|
|
Foreign
|
|
|
6,454
|
|
|
1,328
|
|
|
|
16,616
|
|
|
|
|
|
|
19,411
|
|
|
15,224
|
|
|
|
43,458
|
|
|
|
Adjustment for previous years
:
|
|
|
|
|
|
|
|
|
|
|
||
|
Domestic
|
|
|
(4,898
|
) |
|
|
2,009
|
|
|
|
(3,889
|
)
|
|
Foreign
|
|
|
(633
|
) |
|
|
(2,308
|
)
|
|
|
1,885
|
|
|
|
|
|
(5,531
|
) |
|
|
(299
|
)
|
|
|
(2,004
|
)
|
|
Deferred income taxes
:
|
|
|
|
|
|
|
|
|
|
|||
|
Domestic
|
|
|
6,686
|
|
|
(2,861
|
)
|
|
|
(10,303
|
)
|
|
|
Foreign
|
|
|
(3,467
|
) |
|
|
1,560
|
|
|
|
(7,114
|
)
|
|
|
|
|
3,219
|
|
|
(1,301
|
)
|
|
|
(17,417
|
)
|
|
|
Total taxes on income from continuing operation
|
$ |
17,099
|
$ |
13,624
|
$ |
24,037
|
||||||
|
Total
:
|
||||||||||||
|
Domestic
|
$ |
14,745
|
$ |
13,044
|
$ |
12,650
|
||||||
|
Foreign
|
2,354
|
580
|
11,387
|
|||||||||
|
Total taxes on income from continuing operation
|
$ |
17,099
|
$ |
13,624
|
$ |
24,037
|
||||||
|
|
E.
|
UNCERTAIN TAX POSITIONS
|
A reconciliation of the beginning and ending amount of unrecognized tax benefits is as follows:
|
|
|
2012
|
|
|
2011
|
|
||
|
Balance at the beginning of the year
|
|
$
|
53,183
|
|
$
|
48,791
|
|
|
|
Additions related to interest and currency transaction
|
|
|
3,695
|
|
|
405
|
|
|
|
Additions based on tax positions taken during a prior period
|
|
|
5,925
|
|
|
5,336
|
|
|
|
Reduction related to tax positions taken during a prior period
|
|
|
(8,660
|
) |
|
|
(3,746
|
) |
|
Reductions related to settlement of tax matters
|
|
|
(117
|
) |
|
|
(4,684
|
) |
|
Additions based on tax positions taken during the current period
|
|
|
5,998
|
|
|
8,305
|
|
|
|
Reduction related to a lapse of applicable statute of limitation
|
|
|
(7,426
|
) |
|
(1,224
|
) | |
|
Balance at the end of the year
|
|
$
|
52,599
|
|
$
|
53,183
|
|
|
At December 31, 2012 and 2011, the Company had a liability for unrecognized tax benefits of $52,599 and $53,183, respectively, including an accrual of $8,449 and $5,916 for the payment of related interest and penalties, respectively. The Company recognizes interest and penalties related to unrecognized tax benefits in the provision for income taxes.
During 2011 and 2010, the Company settled certain income tax matters in Israel and the United States covering multiple years. As a result of the settlement of the tax matters, the Company recorded a reduction in “other income tax liabilities” of $4,684 and $1,508, respectively, related to settlement of tax matters of which income of $0 and $800, respectively, were recorded in the statements of income in “taxes on income.”
The Company operates in multiple jurisdictions throughout the world, and its tax returns are periodically audited or subject to review by both domestic and foreign authorities.
F - 49
ELBIT SYSTEMS LTD. AND SUBSIDIARIES
NOTES TO THE CONSOLIDATED FINANCIAL STATEMENTS (CONT.)
Note 18 - TAXES ON INCOME (Cont.)
|
|
E.
|
UNCERTAIN TAX POSITIONS (Cont.)
|
During 2012, Elbit Systems and its subsidiaries were subject to examination by various tax authorities in jurisdictions such as Israel, the United States and various countries in Europe.
As a result of ongoing examinations, tax proceedings in certain countries, and additions to unrecognized tax benefits for positions taken and interest and penalties, if any, arising in 2012, it is not possible to estimate the potential net increase or decrease to the Company’s unrecognized tax benefits during the next twelve months.
|
|
F.
|
DEFERRED INCOME TAXES
|
Significant components of net deferred tax assets and liabilities are based on separate tax jurisdictions as follows:
|
|
|
Deferred (1)
Tax Asset (Liability)
|
||||||||||
|
|
Total
|
Current
|
Non-current
|
|||||||||
|
As of December 31, 2012
|
|
|
|
|||||||||
|
Deferred tax assets:
|
|
|
|
|||||||||
|
Reserves and allowances
|
$ | 41,190 | $ | 10,451 | $ | 30,739 | ||||||
|
Inventory allowances
|
6,345 | 6,345 | - | |||||||||
|
Property, plant and equipment
|
7,414 | 1,317 | 6,097 | |||||||||
|
Other assets
|
17,819 | 6,899 | 10,920 | |||||||||
|
Net operating loss carry-forwards
|
18,989 | 7,399 | 11,590 | |||||||||
| 91,757 | 32,411 | 56,346 | ||||||||||
|
Valuation allowance
|
(3,527 | ) | (610 | ) | (2,917 | ) | ||||||
|
Net deferred tax assets
|
88,230 | 31,801 | 56,429 | |||||||||
|
Deferred tax liabilities:
|
||||||||||||
|
Intangible assets
|
(33,064 | ) | - | (33,064 | ) | |||||||
|
Property, plant and equipment
|
(18,882 | ) | (18 | ) | (18,864 | ) | ||||||
|
Reserves and allowances
|
(4,134 | ) | (461 | ) | (3,673 | ) | ||||||
|
|
(56,080 | ) | (479 | ) | (55,601 | ) | ||||||
|
Net deferred tax assets
|
$ | 32,150 | $ | 31,322 | $ | 828 | ||||||
|
As of December 31, 2011
|
||||||||||||
|
Deferred tax assets:
|
||||||||||||
|
Reserves and allowances
|
$ | 45,069 | $ | 15,939 | $ | 29,130 | ||||||
|
Inventory allowances
|
6,328 | 6,328 | - | |||||||||
|
Property, plant and equipment
|
4,134 | 1,087 | 3,047 | |||||||||
|
Other
|
22,415 | 10,242 | 12,173 | |||||||||
|
Net operating loss carry-forwards
|
20,881 | 1,667 | 19,214 | |||||||||
|
|
98,827 | 35,263 | 65,564 | |||||||||
|
Valuation allowance
|
(1,302 | ) | - | (1,302 | ) | |||||||
|
Net deferred tax assets
|
97,525 | 35,263 | 63,564 | |||||||||
|
Deferred tax liabilities:
|
||||||||||||
|
Intangible assets
|
(40,386 | ) | - | (40,386 | ) | |||||||
|
Property, plant and equipment
|
(17,737 | ) | - | (17,737 | ) | |||||||
|
Reserves and allowances
|
- | - | - | |||||||||
|
|
(58,123 | ) | - | (58,123 | ) | |||||||
|
Net deferred tax assets
|
$ | 39,402 | $ | 35,263 | $ | 4,139 | ||||||
F - 50
ELBIT SYSTEMS LTD. AND SUBSIDIARIES
NOTES TO THE CONSOLIDATED FINANCIAL STATEMENTS (CONT.)
|
F.
|
DEFERRED
INCOME TAXES (Cont.)
|
The deferred taxes, net are reflected in the balance sheet as follows
:
|
|
|
December 31,
|
||||||
|
|
|
2012
|
|
|
2011
|
|||
|
Current deferred income tax assets (Note 4)
|
|
$ |
31,801
|
$ |
35,263
|
|||
|
Current deferred income tax liabilities (Note 13)
|
|
$ |
479
|
$ |
-
|
|||
|
Non-current deferred income tax assets
|
|
$ |
31,465
|
$ |
36,130
|
|||
|
Non-current deferred income tax liabilities
|
|
$ |
30,639
|
$ |
31,991
|
|||
|
|
G.
|
As of December 31, 2012, Elbit Systems’ Israeli subsidiaries had estimated total available carry-forward tax losses of approximately $163,812 and its non-Israeli subsidiaries had estimated available carry-forward tax losses of approximately $43,526.
|
|
|
H.
|
Reconciliation of the actual tax expense as reported in the statements of operations to the amount computed by applying the Israeli statutory tax rate is as follows:
|
|
Year ended December 31,
|
||||||||||||
|
2012
|
2011
|
2010
|
||||||||||
|
Income before taxes as reported in the consolidated
statements of income
|
$ | 177,042 | $ | 104,004 | $ | 199,361 | ||||||
|
Statutory tax rate
|
25 | % | 24 | % | 25 | % | ||||||
|
Theoretical tax expense
|
$ | 44,261 | $ | 24,961 | $ | 49,840 | ||||||
|
Tax benefit arising from reduced rate as an “Approved
and Privileged Enterprise” and other tax benefits (*)
|
(26,098 | ) | (11,451 | ) | (20,528 | ) | ||||||
|
Tax adjustment in respect of different tax rates for
Foreign subsidiaries
|
5,469 | 2,721 | 5,382 | |||||||||
|
Changes in carry-forward losses and valuation
Allowances
|
1,643 | (125 | ) | (8,006 | ) | |||||||
|
Increase in taxes resulting from non-deductible expenses
|
1,426 | 1,105 | 3,020 | |||||||||
|
Difference in basis of measurement for financial
reporting and tax return purposes
|
(3,240 | ) | (2,375 | ) | (3,370 | ) | ||||||
|
Taxes in respect of prior years
|
(5,531 | ) | (299 | ) | (2,004 | ) | ||||||
|
Other differences, net
|
(831 | ) | (913 | ) | (237 | ) | ||||||
|
Actual tax expenses
|
$ | 17,099 | $ | 13,624 | $ | 24,037 | ||||||
|
Effective tax rate
|
9.66 | % | 13.10 | % | 12.06 | % | ||||||
|
(*) Net earnings per share – amounts of the benefit resulting from the
Approved and Privileged Enterprises
|
||||||||||||
|
Basic
|
$ | 0.62 | $ | 0.27 | $ | 0.48 | ||||||
|
Diluted
|
$ | 0.62 | $ | 0.27 | $ | 0.47 | ||||||
|
|
I.
|
Final tax assessments have been received by the Company up to and including the tax year ended December 31, 2005 and by certain subsidiaries, for the years 2004 – 2007.
|
F - 51
ELBIT SYSTEMS LTD. AND SUBSIDIARIES
NOTES TO THE CONSOLIDATED FINANCIAL STATEMENTS (CONT.)
|
|
A.
|
Derivative financial instruments are presented as other assets or other payables. For asset derivatives and liability derivatives, the fair value of the Company’s outstanding derivative instruments as of December 31, 2012 and December 31, 2011 is summarized below:
|
|
|
|
Asset Derivatives (*)
|
|
|
Liability Derivatives (**)
|
|
||||||||||
|
|
|
December 31,
2012
|
|
|
December 31,
2011
|
December 31, 2012
|
|
|
December 31,
2011
|
|
||||||
|
Derivatives designated as hedging instruments
|
|
|
|
|
|
|
|
|
|
|
|
|
||||
|
Foreign exchange contracts
|
|
$
|
21,100
|
|
|
$
|
9,908
|
|
|
$
|
3,095
|
|
|
$
|
23,914
|
|
|
Cross-currency interest rate swaps
|
|
|
22,415
|
|
|
|
8,877
|
|
|
|
-
|
|
|
-
|
|
|
|
|
|
|
43,515
|
|
|
|
18,785
|
|
|
|
3,095
|
|
|
|
23,914
|
|
|
Derivatives not designated as hedging instruments
|
|
|
|
|
|
|
|
|
|
|
|
|
||||
|
Foreign exchange contracts
|
|
|
3,638
|
|
|
|
4,847
|
|
|
|
1,897
|
|
|
1,363
|
|
|
|
Options exchange contracts
|
|
|
-
|
|
|
|
-
|
|
|
-
|
|
677
|
|
|||
|
|
|
$
|
3,638
|
|
|
$
|
4,847
|
|
|
$
|
1,897
|
|
|
$
|
2,040
|
|
(*) Presented as part of other assets receivables and long term other receivables.
(**) Presented as part of other payables and long term other payables.
|
|
B.
|
The effect of derivative instruments on cash flow hedging and the relationship between income and other comprehensive income for the years ended December 31, 2012 and December 31, 2011 is summarized below:
|
|
|
|
Gain (Loss) Recognized
in Other Comprehensive
Income on Effective-
Portion of Derivative, net
|
|
|
Gain (loss) on Effective Portion
of Derivative Reclassified
from Accumulated Other
Comprehensive Income (*)
|
|
|
Ineffective Portion of Gain of Derivative and Amount Excluded from Effectiveness Testing Recognized in Income (**)
|
|
|||||||||||||||
|
|
|
December 31,
2012
|
|
|
December 31,
2011
|
|
|
December 31,
2012
|
|
|
December 31,
2011
|
|
|
December 31,
2012
|
|
|
December 31,
2011
|
|
||||||
|
Derivatives designated as hedging instruments:
|
|
|
|
|
|
|
|
|
|
|
|
|
|
|
|
|
|
|
||||||
|
Foreign exchange
contracts
|
|
$
|
12,277
|
|
$
|
(13,914
|
)
|
|
$
|
(15,831
|
)
|
|
$
|
7,438
|
|
|
$
|
180
|
|
|
$
|
585
|
||
|
Derivatives not designated
as hedging instruments:
|
|
|
|
|
|
|
|
|
|
|
|
|
|
|
|
|
|
|
|
|||||
|
Foreign exchange
Contracts
|
|
$
|
-
|
|
|
$
|
-
|
|
|
$
|
-
|
|
$
|
-
|
|
|
$
|
150
|
|
|
$
|
461
|
||
(*) Presented as part of revenues/cost of sales
(**) Presented as part of financial income (expenses), net
F - 52
ELBIT SYSTEMS LTD. AND SUBSIDIARIES
NOTES TO THE CONSOLIDATED FINANCIAL STATEMENTS (CONT.)
|
|
C.
|
The net effect of the cross-currency swaps was approximately $11,981 of gain, of which approximately $2,900 was offset against exchange rate difference, related to Series A Notes and approximately $9,081 was offset against interest expenses.
|
|
|
D.
|
The notional amounts of outstanding foreign exchange forward contracts at December 31, 2012 and December 31, 2011, is summarized below:
|
|
|
|
Forward contracts
|
|
|||||||||||||
|
|
|
Buy
|
|
|
Sell
|
|
||||||||||
|
|
|
December 31,
|
|
|
December 31,
|
|
||||||||||
|
|
|
2012
|
|
|
2011
|
|
|
2012
|
|
|
2011
|
|
||||
|
Euro
|
|
$
|
60,665
|
|
|
$
|
57,022
|
|
|
$
|
131,696
|
|
|
$
|
154,251
|
|
|
GBP
|
|
|
45,262
|
|
|
|
30,868
|
|
|
|
28,268
|
|
|
|
45,095
|
|
|
NIS
|
|
|
386,017
|
|
|
|
654,105
|
|
|
|
-
|
|
|
|
-
|
|
|
Other
|
|
|
4,344
|
|
|
|
14,073
|
|
|
|
14,871
|
|
|
|
34,120
|
|
|
|
|
$
|
496,288
|
|
|
$
|
756,068
|
|
|
$
|
174,835
|
|
|
$
|
233,466
|
|
|
|
A.
|
ROYALTY COMMITMENTS
|
Elbit Systems and certain Israeli subsidiaries partially finance their research and development expenditures under grant programs sponsored by the OCS for the support of research and development activities conducted in Israel. At the time the grants were received from the OCS, successful development of the related projects was not assured.
In exchange for participation in the programs by the OCS, Elbit Systems and the subsidiaries agreed to pay 2% - 5% of total sales of products developed within the framework of these programs. The royalties will be paid up to a maximum amount equaling 100% to 150% of the grants provided by the OCS, linked to the dollar and for grants received after January 1, 1999, also bearing annual interest at a rate based on LIBOR. The obligation to pay these royalties is contingent on actual sales of the products, and in the absence of such sales payment of royalties is not required.
In some cases, the Government of Israel’s participation (through the OCS) is subject to export sales or other conditions. The maximum amount of royalties is increased in the event of production outside of Israel.
Elbit Systems and certain of its subsidiaries may also be obligated to pay certain amounts to the Israeli Ministry of Defense and others on certain sales including sales resulting from the development of certain technologies.
Royalties' expenses amounted to $2,976, $2,524 and $3,012 in 2012, 2011 and 2010, respectively.
F - 53
ELBIT SYSTEMS LTD. AND SUBSIDIARIES
NOTES TO THE CONSOLIDATED FINANCIAL STATEMENTS (CONT.)
Note 20 -
COMMITMENTS AND CONTINGENT LIABILITIES
(Cont.)
|
|
B.
|
COMMITMENTS IN RESPECT OF LONG-TERM PROJECTS
|
In connection with projects in certain countries, Elbit Systems and some of its subsidiaries have entered and may enter in the future into “buy-back” or “offset” agreements, required by a number of the Company’s customers for these projects as a condition to the Company obtaining orders for its products and services. These agreements are customary in the Company’s industry and are designed to facilitate economic flow back (buy-back) and/or technology transfer to businesses or government agencies in the applicable country.
These commitments may be satisfied by the Company’s placement of direct work or vendor orders for supplies and/or services, transfer of technology, investments or other forms of assistance in the applicable country. The buy-back rules and regulations, as well as the underlying contracts, may differ from one country to another. The ability to fulfill the buy-back obligations may depend, among other things, on the availability of local suppliers with sufficient capability to meet our requirements and which are competitive in cost, quality and schedule. In certain cases, the Company’s commitments may also be satisfied through transactions conducted by other parties.
The Company does not commit to buy-back agreements until orders for its products or services are definitive, but in some cases the orders for the Company’s products or services may become effective only after the Company’s corresponding buy-back commitments are in effect.
Buy-back programs generally extend at least over the relevant commercial contract period and may provide for penalties in the event the Company fails to perform in accordance with buy-back requirements. In some cases the Company provides guarantees in connection with the performance of its buy-back obligations.
Should the Company be unable to meet such obligations it may be subject to contractual penalties, and its chances of receiving additional business from the applicable customers could be reduced or, in certain cases, eliminated.
At December 31, 2012, the Company had outstanding buy-back obligations totaling approximately $748,000 that extend through 2020.
|
|
C.
|
LEGAL CLAIMS
|
Elbit Systems and its subsidiaries are involved in legal claims arising in the ordinary course of business, including claims by employees, consultants and others. The Company’s management, based on the opinion of its legal counsel, believes that the financial impact for the settlement of such claims in excess of the accruals recorded in the financial statements will not have a material adverse effect on the financial position or results of operations of the Company
.
|
|
(1)
|
In November 2012, a claim in the amount of approximately $40,000 regarding a commercial dispute was filed in the District Court of Tel-Aviv – Jaffa by Dr. Baruch Aminov against the Company, a European subsidiary of the Company and two of its officers. Based upon a preliminary review the Company believes that there is no merit to the allegations made in the claim and will respond accordingly in court.
|
F - 54
ELBIT SYSTEMS LTD. AND SUBSIDIARIES
NOTES TO THE CONSOLIDATED FINANCIAL STATEMENTS (CONT.)
Note 20 - COMMITMENTS AND CONTINGENT LIABILITIES (Cont.)
|
|
C.
|
LEGAL CLAIMS (Cont.)
|
|
(2)
|
In November 2012, Elbit Systems and its subsidiary Elop filed a lawsuit against the Government of Israel, for damages and expenses caused in connection with the cancellation of export licenses for a project of a foreign customer. This followed the unsuccessful efforts to reach an appropriate compensatory settlement with the Government. The approximately $74,000 lawsuit was filed with the District Court of the Central Region of Israel. (See also Note 1(C).)
|
|
(3)
|
In 2009, a claim in the amount of approximately $10,000 was filed in the District Court – Central District of Israel by Pinpoint Advance Corporation (“Pinpoint”) and four of its founders against Elbit Systems Holdings (1997) Ltd., as well as against a Company officer. Pinpoint is a special purpose acquisition company that was in negotiations with the Company and other shareholders of Kinetics, regarding the sale of shares in Kinetics during 2008. The transaction was not completed and negotiations were terminated. Pinpoint claims that the agreement was completed and thus entered into effect. Alternatively, Pinpoint claims that the Company’s decision not to complete the agreement was made in bad faith, and that under the circumstances Pinpoint and its founders are entitled to pecuniary compensation equal to their rights and entitlements under the alleged breached contract. The Company believes there is no merit to the allegations made in the claim and has responded accordingly to the court. The claim is in the preliminary proceedings stage.
|
|
(4)
|
In 2009, Elbit Systems filed a claim in the U.S. District Court for the Southern District of Illinois against Credit Suisse Group (“CSG”). The complaint seeks to recover approximately $16,000 that Elbit Systems believes was fraudulently obtained by CSG and by its subsidiary Credit Suisse Securities (USA) from Tadiran Communications Ltd. (“Tadiran Communications”) in 2007 in connection with auction rate securities purchased by Tadiran Communications through CSG. In 2008, Tadiran Communication was merged into Elbit Systems, and Tadiran Communications’ activities are currently performed as part of Elbit Systems’ wholly-owned Israeli subsidiary, Elbit Systems Land and C4I Ltd. CSG filed a motion to dismiss the claim based on a release signed by Tadiran Communications in 2007. In 2009, the case was moved to the U.S. District Court for the Southern District of New York. In January 2013, the court ruled in Elbit Systems’ favor on the motion to dismiss filed by CSG, and the case is proceeding to the discovery stage.
|
|
(5)
|
In 2010, a claim was filed in the Supreme Court of the State of New York, County of New York by certain minority security holders of ImageSat International N.V ("ImageSat") against ImageSat, IAI, Elbit Systems and Elop claiming a breach of the Security Holders Agreement between various security holders of ImageSat, based on an alleged failure to appoint independent directors to the ImageSat board of directors. Elop holds approximately 14% (7% on a fully diluted basis) of ImageSat’s issued share capital and is entitled to nominate one director to ImageSat’s board. Elbit Systems and Elop believe the claim is baseless and have filed corresponding responses to the court. In 2012, plaintiffs moved to enjoin defendants from taking any action to seat two specific individuals as independent directors on the ImageSat board of directors, however, this motion was denied by the court. Plaintiffs have filed a notice of appeal.
|
F - 55
ELBIT SYSTEMS LTD. AND SUBSIDIARIES
NOTES TO THE CONSOLIDATED FINANCIAL STATEMENTS (CONT.)
Note 20 - COMMITMENTS AND CONTINGENT LIABILITIES (Cont.)
|
|
C.
|
LEGAL CLAIMS (Cont.)
|
In 2010, Elbit Systems and Elop were served with an Application to Approve a Derivative Action (the “Application”) filed in the District Court of Petach Tikva, Israel, by certain minority shareholders of ImageSat. The Application named a number of respondents, including, among others, ImageSat, IAI, Elop, Elbit Systems and several former directors of ImageSat, including, among others, Michael Federmann, Joseph Ackerman and Joseph Gaspar (Elbit Systems, Elop and the above-named former directors are referred to as the “Elbit Defendants”). The Application requested the court to approve the filing of a derivative action on behalf of ImageSat for alleged breaches by some of the respondents of the applicants’ rights as minority shareholders in ImageSat. The claims contained various allegations that the defendants breached their fiduciary and/or contractual obligations to the detriment of the plaintiffs. In 2011, the court granted the Elbit Defendants motions to dismiss the Application, and in June 2011 the Applicants filed a Notice of Appeal of the court’s ruling with the Israeli Supreme Court. A hearing is scheduled for September 2013. The Elbit Defendants believe that there is no merit to the allegations made against them in this matter.
In January 2012, a group of minority shareholders of ImageSat (the “Petitioners”), provided ImageSat with a letter of notice, according to which the Petitioners intend to file a petition before the Joint Court of Justice of Aruba, Curacao, Saint Maarten and of Bonaire, St. Eustatia, and Sabato to make inquiry as to the policy and course of affairs at ImageSat and for other remedies authorized under the Civil Code of Curacao (the “Letter of Notice”). Although the Letter of Notice is directed at ImageSat, it contains various allegations against, among others, the Elbit Defendants (as described above in connection with the Israeli proceedings). The nature of the allegations is substantially similar to previously made in the Israeli action as described above. In March 2013, the court denied the Petitioners' request in the Letter of Notice. The Petitioners have the right to appeal the court's ruling.
IAI has agreed to indemnify Elbit Systems, Elop and the directors nominated by Elop to ImageSat’s board, for any losses arising out of any of the foregoing claims or legal proceedings, net of insurance proceeds received from ImageSat’s insurance policies and any indemnification proceeds received from ImageSat.
|
(6)
|
The Company is involved in other legal proceedings from time to time. Based on the advice of legal counsel, management believes such current proceedings will not have a material adverse effect on the Company’s financial position or results of operations.
|
F - 56
ELBIT SYSTEMS LTD. AND SUBSIDIARIES
NOTES TO THE CONSOLIDATED FINANCIAL STATEMENTS (CONT.)
Note 20 - COMMITMENTS AND CONTINGENT LIABILITIES (Cont.)
|
|
D.
|
LEASE COMMITMENTS
|
The future minimum lease commitments of the Company under various non-cancelable operating lease agreements in respect of premises, motor vehicles and office equipment as of December 31, 2012 are as follows:
|
2013
|
|
$
|
34,084
|
|
|
2014
|
|
|
29,197
|
|
|
2015
|
|
|
21,045
|
|
|
2016
|
|
|
18,698
|
|
|
2017
|
|
|
13,800
|
|
|
2018 and thereafter (*)
|
|
|
93,083
|
|
|
|
|
$
|
209,907
|
|
Lease expenses for the years ended December 31, 2012, 2011 and 2010 amounted to $16,466, $17,837 and $15,233, respectively.
|
(*)
|
During 2012 the Company entered into lease agreement for a new complex with Ogen
Yielding Real Estate Ltd. The lease period of the new complex is 15 years that
will begin after the conclusion of the construction during 2015. The expected lease fee
will be approximately $3,000 per annum.
|
|
|
E.
|
GUARANTEES
|
|
|
(1)
|
As of December 31, 2012, guarantees in the amount of approximately $1,069,700 were issued by banks on behalf of Company’s entities mainly in order to secure certain advances from customers and performance bonds.
|
|
|
(2)
|
Elbit Systems has provided, on a basis proportional basis to its ownership interest, guarantees for three of its investees in respect of credit lines granted to them by banks amounting to $7,514 as of December 31, 2012 (2011 - $7,656). The guarantees will exist as long as the credit lines are in effect. Elbit Systems would be liable under the guarantee for any debt for which the investees would be in default under the terms of the credit lines. The fair value of such guarantees, as of December 31, 2012, was not material.
|
|
|
In 2012, the Company has recorded an accrual for a contingent liability of $2,100, regarding a guarantee that was provided on a basis proportional to the company's ownership interest, in respect of a credit line of one of our investees.
|
F - 57
ELBIT SYSTEMS LTD. AND SUBSIDIARIES
NOTES TO THE CONSOLIDATED FINANCIAL STATEMENTS (CONT.)
|
|
F.
|
COVENANTS
|
In connection with bank credits and loans, including performance guarantees issued by banks and bank guarantees in order to secure certain advances from customers, the Company and certain subsidiaries are obligated to meet certain financial covenants. Such covenants include requirements for shareholders’ equity, current ratio, operating profit margin, tangible net worth, EBITDA, interest coverage ratio and total leverage. As a result of recognition of the expense due to the cessation of a program with a foreign customer in December 2011 (See Note 1(C)), as of December 31, 2011, the Company did not meet one of its covenants. Subsequent to the balance sheet date, in March 2012, the banks waived such covenant through March 31, 2013, and accordingly the Company’s bank credits and loans were not negatively affected as of December 31, 2011.
As of December 31, 2012, the Company met all financial covenants.
|
|
G.
|
CONTINGENT LIABILITIES AND GUARANTEES
|
As of December 31, 2012, one of the Company's subsidiaries had a project in a total amount of approximately $11,500. The subsidiary provided the Customer advance and performance guarantees related to the abovementioned project in the amount of approximately $2,700. The Company’s management, based on the opinion of legal counsel, believes that termination of the above project will not have a material adverse effect on the financial position or results of operations of the Company.
|
|
H.
|
CONTRACTUAL OBLIGATIONS
|
Substantially all of the Company’s purchase commitments relate to obligations under purchase orders and subcontracts entered into by the Company. These purchase orders and subcontracts are typically in standard formats proposed by the Company, with the subcontracts and purchase orders also reflecting provisions from the Company’s applicable prime contract that apply on a flow down basis to subcontractors and vendors. The terms typically included in these purchase orders and subcontracts are consistent with Uniform Commercial Code provisions in the United States for sales of goods, as well as with specific terms called for by its customers in international contracts. These terms include the Company’s right to terminate the purchase order or subcontract in the event of the vendor’s or subcontractor’s default, as well as the Company’s right to terminate the order or subcontract for the Company’s convenience (or if the Company’s prime contractor has so terminated the prime contract). Such purchase orders and subcontracts typically are not subject to variable price provisions. As of December 31, 2012 and 2011, the purchase commitments were $949,000 and $1,026,000, respectively.
|
|
I.
|
In order to secure bank loans and bank guarantees in the amount of $1,069,700 as of December 31, 2012, certain Company entities recorded fixed liens on most of their machinery and equipment, mortgages on most of their real estate and floating charges on most of their assets.
|
|
|
J.
|
A lien on the Company’s Approved Enterprises has been registered in favor of the State of Israel (see Note 18(A) (3) above).
|
F - 58
ELBIT SYSTEMS LTD. AND SUBSIDIARIES
NOTES TO THE CONSOLIDATED FINANCIAL STATEMENTS (CONT.)
|
|
A.
|
SHARE CAPITAL
|
Ordinary shares confer upon their holders voting rights and the right to receive dividends.
|
|
B.
|
2007 STOCK OPTION PLAN
|
In January 2007, Elbit Systems’ shareholders approved Elbit Systems’ 2007 Option Plan (the “Plan”). The purpose of the Plan is to provide the benefits arising from ownership of share capital by Elbit Systems’ and certain of its subsidiaries’ employees, who are expected to contribute to the Company’s future growth and success. The options were allocated, subject to the required approvals, in two tracks as follows: (i) Regular Options - up to 1,250,000 options exercisable into 1,250,000 shares of Elbit Systems in consideration for the exercise price, all or any portion of which may be granted as Incentive Stock Options (“Regular Options”) and (ii) Cashless Options - up to 1,250,000 options, which entitle the participant to exercise options for an amount reflecting only the benefit factor (“Cashless Options”). Each of the participants is granted an equal amount of Regular Options and Cashless Options. The exercise price for Israeli participants is the average closing price of an Elbit Systems share during 30 trading days preceding the options grant date. The exercise price of options granted to a non-Israeli participant residing in the United States is the fair market value of the share on the day the options were granted.
According to the Plan, the options granted on a certain date (the “Commencement Date”) will become vested and exercisable in accordance with the following vesting schedule:
|
|
(1)
|
Fifty percent (50%) of the options will be vested and exercisable from the second anniversary of the Commencement Date;
|
|
|
(2)
|
An additional twenty-five percent (25%) of the options will be vested and exercisable from the third anniversary of the Commencement Date; and
|
|
|
(3)
|
The remaining twenty-five (25%) of the options will be vested and exercisable from the fourth anniversary of the Commencement Date.
|
The options expire no later than five years from the date of grant, subject to the 2011 and 2012 amendments described below.
Elbit Systems granted options to Israeli participants in accordance with the provisions of Section 102 of the Israel Tax Ordinance.
As of December 31, 2012, 58,626 Options are available for future grant under the Plan (regular and cashless).
On November 15, 2011, pursuant to an amendment to the Plan, the Company extended the expiration date of certain fully vested options granted under the Plan for one additional year. Such options granted during 2007 will expire during 2013, no longer than six years from the date of grant. As a result of the amendment, the Company recorded one-time compensation expenses of approximately $980.
On November 13, 2012, pursuant to an amendment to the Plan, the Company extended the expiration date of certain fully vested options granted under the plan for one additional year, and recorded a one-time compensation expense of approximately $2,400.
F - 59
ELBIT SYSTEMS LTD. AND SUBSIDIARIES
NOTES TO THE CONSOLIDATED FINANCIAL STATEMENTS (CONT.)
Note 21 - SHAREHOLDERS’ EQUITY (Cont.)
|
|
C.
|
A summary of Elbit Systems’ share option activity under the stock option plan is as follows:
|
|
|
|
2012
|
|
|
2011
|
|
|
2010
|
|
|||||||||||||||
|
|
|
Number
of
options
|
|
|
Weighted
average
exercise
price
|
|
|
Number
of
options
|
|
|
Weighted
average
exercise
price
|
|
|
Number
of
options
|
|
|
Weighted
average
exercise
price
|
|
||||||
|
Outstanding – beginning of the year
|
|
1,450,890
|
$ |
37.07
|
|
|
|
1,635,305
|
|
|
$
|
35.96
|
|
|
|
1,858,250
|
|
|
$
|
35.24
|
|
|||
|
Granted
|
|
30,000
|
35.21
|
|
|
|
63,300
|
|
|
|
50.74
|
|
|
|
28,000
|
|
|
|
52.23
|
|
||||
|
Exercised
|
|
(69,898
|
) |
33.19
|
|
|
|
(226,965
|
)
|
|
|
32.41
|
|
|
|
(223,020
|
)
|
|
|
32.53
|
|
|||
|
Forfeited
|
|
(25,500
|
) |
51.83
|
|
|
|
(20,750
|
)
|
|
|
42.33
|
|
|
|
(27,925
|
)
|
|
|
31.91
|
|
|||
|
Outstanding – end of the
year
|
|
1,385,492
|
$ |
36.95
|
|
|
|
1,450,890
|
|
|
$
|
37.07
|
|
|
|
1,635,305
|
|
|
$
|
35.96
|
|
|||
|
Options exercisable at the
end of the year
|
|
1,271,266
|
$
|
36.07
|
|
|
|
1,292,806
|
|
|
$
|
35.17
|
|
|
|
963,289
|
|
|
$
|
34.70
|
|
|||
The aggregate intrinsic value represents the total intrinsic value (the difference between Elbit Systems’ closing stock price on the last trading day of the fourth quarter of the applicable fiscal year and the exercise price, multiplied by the number of in-the-money options) that would have been received by the option holders had all option holders exercised their options on December 31, of that year. This amount changes, based on the fair market value of the Company’s stock. Aggregate intrinsic value of outstanding options as of December 31, 2012 and 2011 amounted to $4,294 and $5,605, respectively. In addition, the total intrinsic value of options exercised for the year ended December 31, 2012 was $480. As of December 31, 2012, there was $982 of total unrecognized compensation cost related to share-based compensation arrangements granted under Elbit Systems’ stock option plan. That cost is expected to be recognized over a weighted average period of two years.
As of December 31, 2012, 1,384,852 options were vested and expected to be vested at a weighted average exercise price of $36.95 per share. The weighted average remaining contractual life of exercisable options as of December 31, 2012 is approximately one year and their aggregate intrinsic value is approximately $4,299.
|
|
D.
|
The options outstanding as of December 31, 2012, have been separated into ranges of exercise prices, as follows:
|
|
|
|
|
Options outstanding
|
|
|
Options exercisable
|
|
|||||||||||||||
|
Exercise price
|
|
|
Number
of
options
|
|
|
Weighted
average
remaining
contractual
life (years)
|
|
|
Weighted
average
exercise
price
per share
|
|
|
Number
of
options
|
|
|
Weighted
average
exercise
price
per share
|
|
||||||
|
$33.10 - $63.85
|
|
|
|
1,385,492
|
|
|
1.24
|
|
|
$
|
36.95
|
|
|
|
1,271,266
|
|
|
$
|
36.07
|
|
||
F - 60
ELBIT SYSTEMS LTD. AND SUBSIDIARIES
NOTES TO THE CONSOLIDATED FINANCIAL STATEMENTS (CONT.)
Note 21 - SHAREHOLDERS’ EQUITY (Cont.)
Compensation expense amounting to $3,326, $1,996 and $5,211 was recognized during the years ended December 31, 2012, 2011 and 2010, respectively. The expenses before tax were recorded as follows:
|
|
|
Year ended December 31,
|
|
|||||||||
|
|
|
2012
|
|
|
2011
|
|
|
2010
|
|
|||
|
Cost of revenues
|
|
$
|
1,785
|
|
|
$
|
924
|
|
|
$
|
2,353
|
|
|
R&D and marketing expenses
|
|
|
425
|
|
|
|
458
|
|
|
|
954
|
|
|
General and administration expenses
|
|
|
1,116
|
|
|
|
614
|
|
|
|
1,904
|
|
|
|
|
$
|
3,326
|
|
|
$
|
1,996
|
|
|
$
|
5,211
|
|
|
|
E.
|
The weighted average exercise price and fair value of options granted during the years ended December 31, 2012, 2011 and 2010 were:
|
|
|
|
Less than market price
|
|
|||||||||
|
|
|
Year ended December 31,
|
|
|||||||||
|
|
|
2012
|
|
|
2011
|
|
|
2010
|
|
|||
|
Weighted average exercise price per share
|
|
$
|
35.21
|
|
|
$
|
50.74
|
|
|
$
|
52.23
|
|
|
Weighted average fair value per share on grant date
|
|
$
|
8.45
|
|
|
$
|
12.12
|
|
|
$
|
11.99
|
|
|
|
F.
|
Computation of basic and diluted net earnings per share:
|
|
|
|
Year ended
December 31, 2012
|
|
|
Year ended
December 31, 2011
|
|
|
Year ended
December 31, 2010
|
|
|||||||||||||||||||||||||||
|
|
|
Net income
to shareholders
of ordinary
shares
|
|
|
Weighted
average
number
of
shares (*)
|
|
|
Per
Share
amount
|
|
|
Net income
to shareholders
of ordinary
shares
|
|
|
Weighted
average
number of
shares (*)
|
|
|
Per
Share
amount
|
|
|
Net income
to shareholders
of ordinary
shares
|
|
|
Weighted
average
number
of
shares (*)
|
|
|
Per
Share
amount
|
|
|||||||||
|
Basic net
earnings
|
|
$
|
167,879
|
42,190
|
|
$
|
3.98
|
|
|
$
|
90,288
|
|
|
|
42,764
|
|
|
$
|
2.11
|
|
|
$
|
183,498
|
|
|
|
42,645
|
|
|
$
|
4.30
|
|
||||
|
|
|
|
|
|
|
|
|
|
|
|
|
|
|
|
|
|
|
|
|
|
|
|
|
|
|
|
|
|||||||||
|
Effect of dilutive securities:
|
|
|
|
|
|
|
|
|
|
|
|
|
|
|
|
|
|
|
|
|
|
|
|
|
|
|
|
|||||||||
|
Employee stock options
|
|
|
-
|
87
|
|
|
|
|
-
|
|
|
|
367
|
|
|
|
|
|
|
|
-
|
|
|
|
572
|
|
|
|
|
|
||||||
|
Diluted net
earnings
|
|
$
|
167,879
|
42,277
|
|
$ |
3.97
|
|
|
$
|
90,288
|
|
|
|
43,131
|
|
|
$
|
2.09
|
|
|
$
|
183,498
|
|
|
|
43,217
|
|
|
$
|
4.25
|
|
||||
(*) In thousands
|
|
G.
|
SHARE REPURCHASE PROGRAM
|
In September 2011, the Board of Directors authorized the Company to repurchase up to one million of its ordinary shares over the next 12 months. The repurchases were to be made from time to time in the open market on the TASE. The repurchase activity depended on factors such as the Company’s working capital needs, its cash requirements, its stock price and economic and market conditions. The share repurchases were to be effected from time to time through open market purchases. In 2012, the Company repurchased 759,632 ordinary shares (240,368 in 2011) for approximately $26,006 ($10,101 in 2011).
F - 61
ELBIT SYSTEMS LTD. AND SUBSIDIARIES
NOTES TO THE CONSOLIDATED FINANCIAL STATEMENTS (CONT.)
|
|
H.
|
In December 2007, Elbit Systems U.S. Corp (“ESC”), a wholly-owned U.S. subsidiary of Elbit Systems, adopted a Stock Appreciation Rights Plan (the “SAR Plan”), for non-employee directors of ESA.
|
A SAR may only be exercised after it becomes vested. 25% of any SAR granted are exercisable on the first anniversary from the grant date and an additional 25% on each of the three subsequent anniversaries. The maximum term of a SAR is five years from the grant date. SAR’s do not provide any rights as a shareholder in the Stock.
SARs are considered liabilities under ASC 718 and as such compensation cost for each period until settlement is based on the change (or a portion of the change, depending on the percentage of the requisite service that has been rendered) in the fair value of the SARs for each reporting period.
As of December 31, 2012, there were 30,000 outstanding SARs, of which 27,750 were fully vested at a weighted average exercise price per share of $59.36.
|
|
I.
|
2012 PHANTOM OPTION RETENTION PLAN
|
In August 2012, the Company’s Board of Directors approved a “Phantom Option Retention Plan” for Senior Officers (the “Plan”).
The Plan provides for phantom options which entitle the recipients to receive payment in cash of an amount reflecting the “benefit factor”, which is linked to the performance of Elbit Systems’ stock price over the applicable periods (tranches) under the Plan. As of December 31, 2012, the Board of Directors approved a grant of 325,000 units with a basic price per unit, as defined in the Plan, of $33.00.
The benefit earned for each year of a tranche will be the difference between the basic price and the closing price of the Company’s shares for that year, as defined in the Plan, not to exceed an increase of 100% in the Company's share price from the basic price of the first year of a tranche.
The Company recorded an amount of approximately $312 in 2012 as compensation costs related to the phantom options granted in 2012 to senior officers under the Plan.
|
|
J.
|
DIVIDEND POLICY
|
Dividends declared by Elbit Systems are paid subject to statutory limitations. Elbit Systems’ Board of Directors has determined not to declare dividends out of tax exempt earnings.
F - 62
ELBIT SYSTEMS LTD. AND SUBSIDIARIES
NOTES TO THE CONSOLIDATED FINANCIAL STATEMENTS (CONT.)
The Company operates in one reportable segment (see Note 1 for a brief description of the Company’s business).
|
|
A.
|
Revenues are attributed to geographic areas based on location of the end customers as follows
:
|
|
|
|
2012
|
|
|
2011
|
|
|
2010
|
|
|||
|
Europe
|
|
$
|
561,142
|
|
|
$
|
552,379
|
|
$
|
541,749
|
|
|
|
North America.
|
|
|
909,395
|
|
|
|
890,686
|
|
|
|
843,985
|
|
|
Israel
|
|
|
519,852
|
|
|
|
697,261
|
|
|
|
650,956
|
|
|
Latin America
|
258,761
|
165,516
|
152,147
|
|||||||||
|
Asia Pacific
|
568,458
|
459,952
|
459,572
|
|||||||||
|
Other
|
|
|
70,999
|
|
|
|
51,671
|
|
|
|
21,724
|
|
|
|
|
$
|
2,888,607
|
|
$
|
2,817,465
|
|
|
$
|
2,670,133
|
|
|
|
|
B.
|
Revenues are generated by the following areas of operations
:
|
|
|
|
Year ended December 31,
|
|
|||||||||
|
|
|
2012
|
|
|
2011
|
|
|
2010
|
|
|||
|
Airborne systems
|
|
$
|
1,054,468
|
|
|
$
|
969,446
|
|
|
$
|
791,111
|
|
|
Land vehicles systems
|
|
|
374,487
|
|
|
|
405,294
|
|
|
|
363,245
|
|
|
C4ISR systems
|
|
|
1,017,638
|
|
|
|
996,382
|
|
|
|
1,019,068
|
|
|
Electro-optic systems
|
|
|
324,135
|
|
|
|
300,158
|
|
|
|
368,808
|
|
|
Other (*)
|
|
|
117,879
|
|
|
|
146,185
|
|
|
|
127,901
|
|
|
|
|
$
|
2,888,607
|
|
|
$
|
2,817,465
|
|
|
$
|
2,670,133
|
|
|
(*)
|
Mainly non-defense engineering and production services.
|
|
|
C.
|
Major customer data as a percentage of total revenues
:
|
|
|
|
Year ended December 31,
|
|
|||||||||
|
|
|
2012
|
|
|
2011
|
|
|
2010
|
|
|||
|
Israeli Ministry of Defense
|
|
|
15%
|
|
|
23
|
%
|
|
|
23
|
%
|
|
|
U.S. Government
|
|
|
8%
|
|
|
8
|
%
|
|
|
7
|
%
|
|
|
|
D.
|
Long-lived assets by geographic areas
:
|
|
|
|
Year ended December 31,
|
|
|||||||||
|
|
|
2012
|
|
|
2011
|
|
|
2010
|
|
|||
|
Israel
|
|
$
|
863,945
|
|
|
$
|
875,935
|
|
|
$
|
985,953
|
|
|
U.S.
|
|
|
208,309
|
|
|
|
208,640
|
|
|
|
225,217
|
|
|
Other
|
|
|
144,594
|
|
|
|
196,105
|
|
|
|
89,345
|
|
|
|
|
$
|
1,216,847
|
|
|
$
|
1,280,680
|
|
|
$
|
1,300,515
|
|
|
|
|
Year ended December 31,
|
|
|||||||||
|
|
|
2012
|
|
|
2011
|
|
|
2010
|
|
|||
|
Total expenses
|
|
$
|
276,458
|
|
$
|
288,668
|
|
|
$
|
268,578
|
|
|
|
Less – grants and participations
|
|
|
(43,071
|
) |
|
|
(47,576
|
) |
|
|
(34,447
|
) |
|
|
|
$
|
233,387
|
|
$
|
241,092
|
|
|
$
|
234,131
|
|
|
F - 63
ELBIT SYSTEMS LTD. AND SUBSIDIARIES
NOTES TO THE CONSOLIDATED FINANCIAL STATEMENTS (CONT.)
|
|
|
Year ended December 31,
|
|
|||||||||
|
|
|
2012
|
|
|
2011
|
|
|
2010
|
|
|||
|
Expenses
:
|
|
|
|
|
|
|
|
|
|
|||
|
Interest on long-term bank debt
|
|
$
|
(7,148
|
) |
|
$
|
(7,214
|
)
|
|
$
|
(6,968
|
)
|
|
Interest on Series A Notes
|
|
|
(10,787
|
) |
|
|
(5,753
|
)
|
|
|
(4,395
|
)
|
|
Interest on short-term bank credit and loans
|
|
|
(2,528
|
) |
|
|
(3,802
|
)
|
|
|
(1,699
|
)
|
|
Loss on marketable securities
|
|
|
-
|
|
|
(2,464
|
)
|
|
|
-
|
|
|
|
Gain (loss) from exchange rate differences, net
|
|
|
126
|
|
|
7,565
|
|
|
|
(9,094
|
)
|
|
|
Other
|
|
|
(9,922
|
) |
|
|
(10,839
|
)
|
|
|
(4,330
|
)
|
|
|
|
|
(30,259
|
) |
|
|
(22,507
|
)
|
|
|
(26,486
|
)
|
|
Income
:
|
|
|
|
|
|
|
|
|
|
|
||
|
Interest on cash, cash equivalents and bank deposits
|
|
|
1,821
|
|
|
2,579
|
|
|
|
3,224
|
|
|
|
Other
|
|
|
2,353
|
|
|
6,359
|
|
|
|
2,011
|
|
|
|
|
|
|
4,173
|
|
|
8,938
|
|
|
|
5,235
|
|
|
|
|
|
$
|
(26,086
|
) |
|
$
|
(13,569
|
)
|
|
$
|
(21,251
|
)
|
|
|
|
Year ended December 31
,
|
|
|||||||||
|
|
|
2012
|
|
|
2011
|
|
|
2010
|
|
|||
|
Gain from sale of Mediguide shares (*)
|
|
$
|
-
|
|
|
$
|
-
|
|
|
$
|
12,809
|
|
|
Other
|
|
|
78
|
|
|
|
1,909
|
|
|
|
450
|
|
|
|
|
$
|
78
|
|
|
$
|
1,909
|
|
|
$
|
13,259
|
|
|
|
(*)
|
Gain from the sale of Mediguide Inc. shares to St. Jude Medical in 2008, recognized during 2010.
|
|
Transactions
:
|
|
Year ended December 31,
|
|
|||||||||
|
|
|
2012
|
|
|
2011
|
|
|
2010
|
|
|||
|
Income -
|
|
|
|
|
|
|
|
|
|
|||
|
Sales to affiliated companies (*)
|
|
$
|
98,884
|
|
|
$
|
53,490
|
|
|
$
|
33,124
|
|
|
Participation in expenses
|
|
$
|
-
|
|
|
$
|
3,923
|
|
|
$
|
3,955
|
|
|
|
|
|
|
|
|
|
|
|
|
|
|
|
|
Cost and expenses -
|
|
|
|
|
|
|
|
|
|
|
|
|
|
Supplies from affiliated companies (**)
|
|
$
|
10,908
|
|
|
$
|
44,840
|
|
|
$
|
57,339
|
|
|
Balances
:
|
|
December 31,
|
|
|||||
|
|
|
2012
|
|
|
2011
|
|
||
|
Trade receivables and other receivables (*)
|
|
$
|
24,121
|
|
|
$
|
21,696
|
|
|
Trade payables and advances(**)
|
|
$
|
18,475
|
|
|
$
|
17,767
|
|
The purchases from related parties are made at arm’s length. The sales to the Company’s related parties in respect of U.S. government defense contracts are made on the basis of cost.
|
(*)
|
The significant sales and balances include sales of helmet mounted cueing systems purchased from the Company by VSI.
|
|
(**)
|
Includes electro-optics components and sensors, purchased by the Company from SCD, and e
lectro-optics products, purchased by the Company from Opgal.
|
F - 64
ELBIT SYSTEMS LTD. AND SUBSIDIARIES
Schedule II – Valuation and Qualifying Accounts
(In thousands of U.S. dollars)
|
|
|
Column A
|
|
Column B
|
|
Column C
|
|
Column D
|
|
Column E
|
|
|||
|
Description
|
|
Balance at
Beginning
of Period
|
|
Additions (Charged to Costs and Expenses)
|
|
Deductions (Write-Offs and Actual Losses Incurred)
|
|
Additions
Resulting
from
Acquisitions
|
|
Balance at
End of Period
|
|
|||
|
Year Ended December 31, 2012:
|
|
|
|
|
|
|
|
|
|
|
|
|
|
|
|
Provisions for Losses on Long-Term Contracts
(*)
|
|
|
196,980
|
|
32,996
|
|
|
100,761
|
|
–
|
|
|
129,215
|
|
|
Provisions for Claims and Potential Contractual Penalties and Others
|
|
|
8,236
|
|
648
|
|
|
2,038
|
|
–
|
|
|
6,846
|
|
|
Allowance for Doubtful Accounts
|
|
|
6,861
|
|
2,865
|
|
|
598
|
|
–
|
|
|
9,128
|
|
|
Valuation Allowance on Deferred Taxes
|
|
|
1,302
|
|
3,395
|
|
|
1,169
|
|
–
|
|
|
3,528
|
|
|
Year Ended December 31, 2011:
|
|
|
|
|
|
|
|
|
|
|
|
|
|
|
|
Provisions for Losses on Long-Term Contracts
(*)
|
|
|
136,070
|
|
104,560
|
|
|
43,650
|
|
–
|
|
|
196,980
|
|
|
Provisions for Claims and Potential Contractual Penalties and Others
|
|
|
6,618
|
|
2,160
|
|
|
542
|
|
–
|
|
|
8,236
|
|
|
Allowance for Doubtful Accounts
|
|
|
11,215
|
|
56
|
|
|
4,410
|
|
–
|
|
|
6,861
|
|
|
Valuation Allowance on Deferred Taxes
|
|
|
160
|
|
1,302
|
|
|
160
|
|
–
|
|
|
1,302
|
|
|
|
|
|
|
|
|
|
|
|
|
|
|
|
|
|
|
Year Ended December 31, 2010:
|
|
|
|
|
|
|
|
|
|
|
|
|
|
|
|
Provisions for Losses on Long-Term Contracts
(*)
|
|
|
136,341
|
|
35,443
|
|
|
36,360
|
|
646
|
|
|
136,070
|
|
|
Provisions for Claims and Potential Contractual Penalties and Others
|
|
|
5,864
|
|
1,262
|
|
|
1,103
|
|
595
|
|
|
6,618
|
|
|
Allowance for Doubtful Accounts
|
|
|
7,885
|
|
904
|
|
|
349
|
|
2,775
|
|
|
11,215
|
|
|
Valuation Allowance on Deferred Taxes (**)
|
|
|
34,776
|
|
–
|
|
|
34,616
|
|
–
|
|
|
160
|
|
|
__________________
|
|
*
|
An amount of $74,407, $74,509 and $64,065 as of December 31, 2010, 2011 and 2012, respectively, is presented as a deduction from inventories, and an amount of $61,663, $122,471 and $65,150 as of December 31, 2010, 2011 and 2012, respectively, is presented as part of other accrued expenses in the category of “Cost Provisions and Other.” An amount of $57,189 and $18,467 as of December 31, 2011 and 2012, respectively, is presented as other accrued expenses and is related to the cessation of a program with a foreign customer, of which $13,300 was included in long-term liabilities.
|
|
**
|
An amount of $21,500 was deducted as a result of a prior year adjustment.
|
S - 1
TABLE OF CONTENTS
Part IItem 1. Identity Of Directors, Senior Management and AdvisersItem 2. Offer Statistics and Expected TimetableItem 3. Key InformationItem 4. Information on The CompanyItem 4A. Unresolved Staff CommentsItem 5. Operating and Financial Review and ProspectsItem 6. Directors, Senior Management and EmployeesItem 7. Major Shareholders and Related Party TransactionsItem 8. Financial InformationItem 9. The Offer and ListingItem 10. Additional InformationItem 11. Quantitative and Qualitative Disclosures About Market RiskItem 12. Description Of Securities Other Than Equity SecuritiesItem 13. Defaults, Dividend Arrearages and DelinquenciesItem 14. Material Modifications To The Rights Of Security Holders and Use Of ProceedsItem 15. Controls and ProceduresItem 16A. Audit Committee Financial ExpertItem 16B. Code Of EthicsItem 16C. Principal Accountant Fees and ServicesItem 16D. Exemptions From The Listing Standards For Audit CommitteesItem 16E. Purchases Of Equity Securities By The Issuer and Affiliated PurchasersItem 16F. Changes in Registrant S Certifying AccountantItem 16G. Corporate GovernanceItem 16H. Mine Safety DisclosureItem 17. Financial StatementsItem 18. Financial StatementsItem 19. ExhibitsNote 1 - GeneralNote 1 - General (cont.)Note 2 - Significant Accounting PoliciesNote 2 - Significant Accounting Policies (cont.)Note 3 - Trade and Unbilled Receivables, NetNote 4 - Other Receivables and Prepaid ExpensesNote 5 - Inventories, Net Of Customer AdvancesNote 6 - Investments in Affiliated Companies, Partnerships and Other CompaniesNote 6 - Investments in Affiliated Companies, Partnerships and Other Companies (cont.)Note 7 - Long-term Trade and Unbilled ReceivablesNote 8 - Long-term Bank Deposits and Other ReceivablesNote 9 - Available-for-sale Marketable SecuritiesNote 10 - Property, Plant and Equipment, NetNote 11 - Goodwill and Other Intangible Assets, NetNote 12 - Short-term Bank Credit and LoansNote 13 - Other Payables and Accrued ExpensesNote 14 Customer Advances in Excess Of Costs Incurred on Contracts in ProgressNote 15 - Long-term Loans, Net Of Current MaturitiesNote 16 - Series A Notes, Net Of Current MaturitiesNote 16 - Series A Notes, Net Of Current Maturities (cont.)Note 17 - Benefit Plans and Obligations For Termination IndemnityNote 17 - Benefit Plans and Accrued Termination Liability (cont.)Note 18 - Taxes on IncomeNote 18 - Taxes on Income (cont.)Note 19 - Derivative Financial InstrumentsNote 19 - Derivative Financial Instruments (cont.)Note 20 - Commitments and Contingent LiabilitiesNote 20 - Commitments and Contingent Liabilities (cont.)Note 21 - Shareholders EquityNote 21 - Shareholders Equity (cont.)Note 22 - Major Customer and Geographic InformationNote 23 - Research and Development Expenses, NetNote 24 - Financial Expenses, NetNote 25 - Other Income, NetNote 26 - Related Parties Transactions and Balances