ESSENT GROUP LTD.
10-Ks and 10-Qs
|
|
|
|
|
|
|
|
|
|
|
|
|
|
|
|
|
|
|
|
|
|
|
|
|
|
|
|
|
|
|
|
|
|
|
|
|
|
|
|
|
|
|
|
UNITED STATES
SECURITIES AND EXCHANGE COMMISSION
Washington, D.C. 20549
FORM 10-K
(Mark One)
ý
ANNUAL REPORT PURSUANT TO SECTION 13 OR 15(d) OF THE SECURITIES EXCHANGE ACT OF 1934
For the fiscal year ended
December 31, 2017
o
TRANSITION REPORT PURSUANT TO SECTION 13 OR 15(d) OF THE SECURITIES EXCHANGE ACT OF 1934
For the transition period from to
Commission file number 001-36157
ESSENT GROUP LTD.
(Exact name of registrant as specified in its charter)
|
Bermuda
|
|
Not Applicable
|
|
(State or other jurisdiction of
incorporation or organization)
|
|
(I.R.S. Employer
Identification Number)
|
|
Clarendon House
2 Church Street
Hamilton HM11, Bermuda
(Address of principal executive offices and zip code)
(441) 297-9901
(Registrant’s telephone number, including area code)
|
||
Securities registered pursuant to Section 12(b) of the Act:
|
Title of each class
|
|
Name of each exchange on which registered
|
|
Common Shares, $0.015 par value
|
|
New York Stock Exchange
|
Securities registered pursuant to Section 12(g) of the Act:
None
Indicate by check mark if the registrant is a well-known seasoned issuer, as defined in Rule 405 of the Securities Act. Yes
ý
No
o
Indicate by check mark if the registrant is not required to file reports pursuant to Section 13 or Section 15(d) of the Act. Yes
o
No
ý
Indicate by check mark whether the registrant (1) has filed all reports required to be filed by Section 13 or 15(d) of the Securities Exchange Act of 1934 during the preceding 12 months (or for such shorter period that the registrant was required to file such reports), and (2) has been subject to such filing requirements for the past 90 days. Yes
ý
No
o
Indicate by check mark whether the registrant has submitted electronically and posted on its corporate Website, if any, every Interactive Data File required to be submitted and posted pursuant to Rule 405 of Regulation S-T (§232-405 of this chapter) during the preceding 12 months (or for such shorter period that the registrant was required to submit and post such files.) Yes
ý
No
o
Indicate by check mark if disclosure of delinquent filers pursuant to Item 405 of Regulation S-K is not contained herein, and will not be contained, to the best of registrant's knowledge, in definitive proxy or information statements incorporated by reference in Part III of this Form 10-K or any amendment to this Form 10-K.
o
Indicate by check mark whether the registrant is a large accelerated filer, an accelerated filer, a non-accelerated filer or a smaller reporting company. See the definitions of "large accelerated filer," "accelerated filer" and "smaller reporting company" in Rule 12b-2 of the Exchange Act.
|
Large accelerated filer
|
x
|
|
Accelerated filer
|
o
|
|
Non-accelerated filer
|
o
|
(Do not check if a smaller reporting company)
|
||
|
Smaller reporting company
|
o
|
|||
|
Emerging growth company
|
o
|
|||
Indicate by check mark whether the registrant is a shell company (as defined in Rule 12b-2 of the Exchange Act). Yes
o
No
ý
As of June 30,
2017
, the last business day of the registrant's most recently completed second fiscal quarter, the aggregate market value of common shares held by non-affiliates of the registrant was approximately
$3,059,519,774
(based upon the last reported sales price on The New York Stock Exchange on such date).
The number of the registrant's common shares outstanding as of
February 15, 2018
was
98,094,421
.
DOCUMENTS INCORPORATED BY REFERENCE
Portions of the registrant's proxy statement for the
2018
Annual General Meeting of Shareholders are incorporated by reference into Part III of this Annual Report on Form 10-K where indicated. Such Proxy Statement will be filed with the Securities and Exchange Commission within 120 days of the registrant's fiscal year ended December 31,
2017
.
TABLE OF CONTENTS
|
Page
|
||
|
|
||
|
|
||
|
|
||
|
|
||
i
SPECIAL NOTE REGARDING FORWARD-LOOKING STATEMENTS
This Annual Report on Form 10-K, or Annual Report, includes forward-looking statements pursuant to the "safe harbor" provisions of the Private Securities Litigation Reform Act of 1995. Forward-looking statements relate to expectations, beliefs, projections, future plans and strategies, anticipated events or trends and similar expressions concerning matters that are not historical facts or present facts or conditions, such as statements regarding our future financial condition or results of operations, our prospects and strategies for future growth, the introduction of new products and services, and the implementation of our marketing and branding strategies. In many cases, you can identify forward-looking statements by terms such as "may," "will," "should," "expects," "plans," "anticipates," "believes," "estimates," "predicts," "potential" or the negative of these terms or other comparable terminology.
The forward-looking statements contained in this Annual Report reflect our views as of the date of this Annual Report about future events and are subject to risks, uncertainties, assumptions and changes in circumstances that may cause events or our actual activities or results to differ significantly from those expressed in any forward-looking statement. Although we believe that the expectations reflected in the forward-looking statements are reasonable, we cannot guarantee future events, results, actions, levels of activity, performance or achievements. A number of important factors could cause actual results to differ materially from those indicated by the forward-looking statements, including, but not limited to, those factors described below, in Part I, Item 1A "Risk Factors," and in Part II, Item 7 "Management's Discussion and Analysis of Financial Condition and Results of Operations." These factors include, without limitation, the following:
|
•
|
changes in or to Fannie Mae and Freddie Mac, which we refer to collectively as the GSEs, whether through Federal legislation, restructurings or a shift in business practices;
|
|
•
|
failure to continue to meet the mortgage insurer eligibility requirements of the GSEs;
|
|
•
|
competition for our customers or the loss of a significant customer;
|
|
•
|
lenders or investors seeking alternatives to private mortgage insurance;
|
|
•
|
increase in the number of loans insured through Federal government mortgage insurance programs, including those offered by the Federal Housing Administration;
|
|
•
|
decline in the volume of low down payment mortgage originations;
|
|
•
|
uncertainty of loss reserve estimates;
|
|
•
|
decrease in the length of time our insurance policies are in force;
|
|
•
|
deteriorating economic conditions;
|
|
•
|
the scope of recently enacted U.S. Federal tax reform and its impact on us, our shareholders and our operations;
|
|
•
|
the definition of "Qualified Mortgage" reducing the size of the mortgage origination market or creating incentives to use government mortgage insurance programs;
|
|
•
|
the definition of "Qualified Residential Mortgage" reducing the number of low down payment loans or lenders and investors seeking alternatives to private mortgage insurance;
|
|
•
|
the implementation of the Basel III Capital Accord, which may discourage the use of private mortgage insurance;
|
|
•
|
management of risk in our investment portfolio;
|
|
•
|
fluctuations in interest rates;
|
|
•
|
inadequacy of the premiums we charge to compensate for our losses incurred;
|
|
•
|
dependence on management team and qualified personnel;
|
|
•
|
disturbance to our information technology systems;
|
ii
|
•
|
change in our customers' capital requirements discouraging the use of mortgage insurance;
|
|
•
|
declines in the value of borrowers' homes;
|
|
•
|
limited availability of capital;
|
|
•
|
unanticipated claims arise under and risks associated with our contract underwriting program;
|
|
•
|
industry practice that loss reserves are established only upon a loan default;
|
|
•
|
disruption in mortgage loan servicing;
|
|
•
|
risk of future legal proceedings;
|
|
•
|
customers' technological demands;
|
|
•
|
our non-U.S. operations becoming subject to U.S. Federal income taxation;
|
|
•
|
becoming considered a passive foreign investment company for U.S. Federal income tax purposes; and
|
|
•
|
potential inability of our insurance subsidiaries to pay dividends.
|
Readers are urged to consider these factors carefully in evaluating the forward-looking statements and are cautioned not to place undue reliance on these forward-looking statements. All of the forward-looking statements we have included in this Annual Report are based on information available to us on the date of this Annual Report. We undertake no obligation to publicly update or revise any forward-looking statement, whether as a result of new information, future events or otherwise, except as otherwise required by law.
iii
Unless the context otherwise indicates or requires, the terms "we," "our," "us," "Essent," and the "Company," as used in this Annual Report, refer to Essent Group Ltd. and its directly and indirectly owned subsidiaries, including our primary operating subsidiaries, Essent Guaranty, Inc. and Essent Reinsurance Ltd., as a combined entity, except where otherwise stated or where it is clear that the terms mean only Essent Group Ltd. exclusive of its subsidiaries.
Overview
We are an established and growing private mortgage insurance company. We were formed to serve the U.S. housing finance industry at a time when the demands of the financial crisis and a rapidly changing business environment created the need for a new, privately funded mortgage insurance company. Our primary U.S. mortgage insurance subsidiary, Essent Guaranty, Inc., received its certificate of authority from the Pennsylvania Insurance Department in July 2009. We subsequently acquired our mortgage insurance platform from a former private mortgage insurance industry participant and, in 2010, became the first private mortgage insurer to be approved by Fannie Mae and Freddie Mac, which we refer to collectively as the GSEs, since 1995. We are licensed to write coverage in all 50 states and the District of Columbia. We believe that our success in acquiring customers and growing our insurance in force has been driven by the unique opportunity we offer lenders to partner with a well-capitalized mortgage insurer, unencumbered by business originated prior to the financial crisis, that provides fair and transparent claims payment practices, and consistency and speed of service.
Private mortgage insurance plays a critical role in the U.S. housing finance system. Essent and other private mortgage insurers provide credit protection to lenders and mortgage investors by covering a portion of the unpaid principal balance of a mortgage and certain related expenses in the event of a default. In doing so, we provide private capital to mitigate mortgage credit risk, allowing lenders to make additional mortgage financing available to prospective homeowners.
Private mortgage insurance helps extend affordable home ownership by facilitating the sale of low down payment loans into the secondary market. The GSEs purchase residential mortgages from banks and other lenders and guaranty mortgage-backed securities that are offered to investors in the secondary mortgage market. The GSEs, which are U.S. Federal government-sponsored enterprises, are restricted by their charters from purchasing or guaranteeing low down payment loans, defined as loans with less than a 20% down payment, that are not covered by certain credit protections. Private mortgage insurance satisfies the GSEs' credit protection requirements for low down payment loans, supporting a robust secondary mortgage market in the United States.
We had master policy relationships with approximately
1,420
customers as of
December 31, 2017
. Our top ten customers represented approximately
45.8%
,
35.1%
and
36.6%
of our new insurance written, or NIW, on a flow basis for the years ended December 31,
2017
,
2016
and
2015
, respectively. We have a highly experienced, talented team of
397
employees as of
December 31, 2017
. Our holding company is domiciled in Bermuda and our U.S. insurance business is headquartered in Radnor, Pennsylvania. We operate additional underwriting and service centers in Winston-Salem, North Carolina and Irvine, California.
For the years ended
December 31, 2017
,
2016
and
2015
, we generated NIW of approximately
$43.9 billion
,
$34.9 billion
and
$26.2 billion
, respectively. As of
December 31, 2017
, we had approximately
$110.5 billion
of insurance in force. The financial strength rating of Essent Guaranty, Inc. is
Baa1
with a
stable
outlook by Moody's Investors Service and
BBB+
with a
stable
outlook by S&P Global Ratings.
We also offer mortgage-related insurance and reinsurance through our wholly-owned Bermuda-based subsidiary, Essent Reinsurance Ltd., which we refer to as "Essent Re." As of
December 31, 2017
, Essent Re provided insurance or reinsurance relating to the risk in force on loans in reference pools acquired by Freddie Mac and Fannie Mae covering approximately
$538.9 million
of risk, including in connection with Freddie Mac's Agency Credit Insurance Structure (ACIS) and Fannie Mae's Credit Insurance Risk Transfer (CIRT) programs. Essent Re has also reinsured 25% of Essent Guaranty, Inc.'s GSE-eligible mortgage insurance NIW originated since July 1, 2014 under a quota share reinsurance agreement. The insurer financial strength rating of Essent Re is
BBB+
with a
stable
outlook by S&P Global Ratings.
1
Our Industry
U.S. Mortgage Market
The U.S. residential mortgage market is one of the largest in the world, with over
$10.5 trillion
of debt outstanding as of
September 30, 2017
, and includes a range of private and government-sponsored participants. Private industry participants include mortgage banks, mortgage brokers, commercial, regional and investment banks, savings institutions, credit unions, REITs, mortgage insurers and other financial institutions. Public participants include government agencies such as the Federal Housing Administration, or FHA, the Veterans Administration, or VA, the U.S. Department of Agriculture Rural Development program and the Government National Mortgage Association, or Ginnie Mae, as well as government-sponsored enterprises such as Fannie Mae and Freddie Mac. The overall U.S. residential mortgage market encompasses both primary and secondary markets. The primary market consists of lenders originating home loans to borrowers, and includes loans made to support home purchases, which are referred to as purchase originations, and loans made to refinance existing mortgages, which are referred to as refinancing originations. The secondary market includes institutions buying and selling mortgages in the form of whole loans or securitized assets, such as mortgage-backed securities.
GSEs
The GSEs are the largest participants in the secondary mortgage market, buying residential mortgages from banks and other primary lenders as part of their government mandate to provide liquidity and stability in the U.S. housing finance system. According to the Federal Reserve, the GSEs held or guaranteed approximately
$4.7 trillion
, or
44.3%
, of total U.S. residential mortgage debt as of
September 30, 2017
. Their charters generally prohibit the GSEs from purchasing a low down payment loan unless that loan is insured by a GSE-approved mortgage insurer, the mortgage seller retains at least a 10% participation in the loan or the seller agrees to repurchase or replace the loan in the event of a default. Historically, private mortgage insurance has been the preferred method utilized to meet this GSE charter requirement. As a result, the private mortgage insurance industry in the United States is driven in large part by the business practices and mortgage insurance requirements of the GSEs.
Mortgage Insurance
Mortgage insurance plays a critical role in the U.S. residential mortgage market by facilitating secondary market sales and by providing lenders and investors a means to diversify their exposures and mitigate mortgage credit risk. Mortgage insurance is provided by both private companies, such as Essent, and government agencies, such as the FHA and the VA. From
1998
through
2017
, an average of
23.3%
of total annual mortgage origination volume utilized mortgage insurance.
Mortgage insurance industry volumes are influenced by total mortgage originations, and the mix between purchase and refinancing originations. Historically, mortgage insurance utilization has been meaningfully higher in purchase originations compared to refinancing originations. In
2017
, total U.S. residential mortgage origination volume was estimated at
$1.71 trillion
, comprised of
$1.11 trillion
of purchase originations and
$600 billion
of refinancing originations. In the years following the financial crisis, historically low interest rates and special refinance programs, such as the Home Affordable Refinance Program, or HARP, have caused refinancing volume to significantly outpace purchase originations. Purchase originations, however, are expected to account for an increasing percentage of the overall mortgage market as the economic recovery and favorable housing market fundamentals stimulate growth in home buying activity, and a rising interest rate environment slows refinancing volume.
The following graph provides detail on trends in total residential mortgage originations and the breakdown of the market between purchase and refinancing volume.
2
Residential Purchase vs. Refinancing Mortgage Originations ($ in billions)
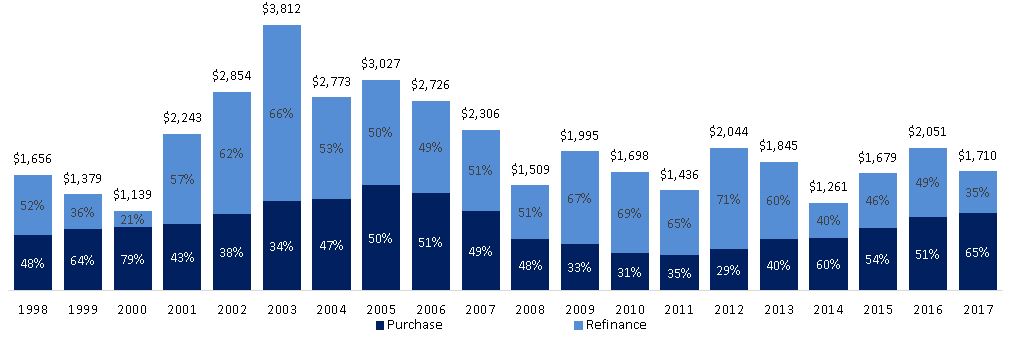
_______________________________________________________________________________
Source: Mortgage Bankers Association
Financial Crisis and Recovery
The severe economic and housing market dislocation experienced during the recent financial crisis had a profound impact on our industry. Incumbent insurers experienced record high claims activity and sustained significant financial losses, resulting in depleted capital positions. Three private mortgage insurers who wrote more than $125 billion of NIW in 2007, accounting for approximately 36% of total private mortgage insurance market NIW that year, have since exited the market, and several other insurers were forced to raise capital to repair their balance sheets and remain in operation. Although certain remaining incumbent insurers continue to deal with legacy challenges, the ongoing improvement of housing market fundamentals and the high credit quality of post-crisis new business are expected to support improved growth and profitability in the private mortgage insurance sector post-crisis.
Prior to the financial crisis, private mortgage insurers accounted for the majority of the insured mortgage origination market. In 2007, private mortgage insurance represented 77.3% of insured mortgages and covered 15.5% of the total residential mortgage origination volume. During the financial crisis, government agencies began to insure an increasing percentage of the market as incumbent private insurers came under significant financial stress. By 2009, private mortgage insurance represented only 15.4% of the insured mortgage market and covered 4.1% of the total residential mortgage origination volume.
The private mortgage insurance industry, however, continues to recover, more than doubling its share of the total insured market since 2009 and thereby leading to higher private mortgage insurance penetration of the total mortgage origination market. In
2017
, private mortgage insurance increased to an estimated
39%
of the total insured market and covered
16%
of the total mortgage origination volume. These gains have been driven in part by the improved financial position of incumbent insurers, the influx of private capital into the sector to support post-crisis entrants such as Essent, and aggregate increase since 2010 in the mortgage insurance premium rates and upfront fees charged for FHA insurance.
The charts below detail the relative share of the insured mortgage market covered by public and private participants, and historical NIW trends in the mortgage insurance market and private mortgage insurance penetration rates, which represents private mortgage insurance NIW to total U.S. residential mortgage origination volume.
3
Relative Share of Private and Public Mortgage Insurance
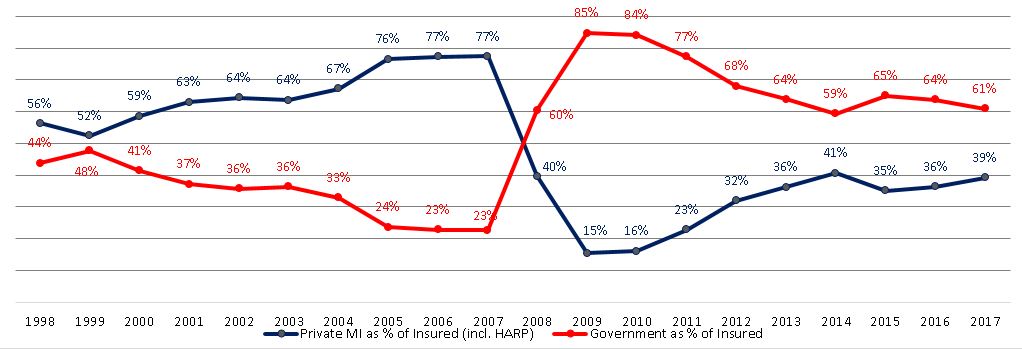
_______________________________________________________________________________
Source: Inside Mortgage Finance
Private mortgage insurance NIW ($ in billions)

_______________________________________________________________________________
Source: Inside Mortgage Finance, except for total originations for the purpose of calculating private mortgage insurance penetration, which is based on Mortgage Bankers Association. For 2011 through 2017, private mortgage insurance penetration includes private mortgage insurance NIW originated under HARP.
We view HARP as a modification of the coverage on existing insurance in force, and therefore when estimating our Market Share based on NIW, we exclude HARP NIW from total industry NIW. However, HARP is included as part of total industry NIW when showing private mortgage insurance penetration for the industry.
Competition
The private mortgage insurance industry is highly competitive. Private mortgage insurers generally compete on the basis of underwriting guidelines, pricing, terms and conditions, financial strength, reputation, customer relationships, the strength of management and field organizations, the effective use of technology, and innovation in the delivery and servicing of insurance products. The private mortgage insurance industry currently consists of six active private mortgage insurers, including Essent and each of Arch Mortgage Insurance Company (which also acquired United Guaranty Corporation in 2016), Genworth Financial Inc., Mortgage Guaranty Insurance Corporation, National Mortgage Insurance Corporation and Radian Guaranty Inc.
We and other private mortgage insurers compete directly with Federal and state governmental and quasi-governmental agencies that provide mortgage insurance, principally, the FHA and, to a lesser degree, the VA. As discussed above, the FHA's share of the mortgage insurance market increased as a result of the financial crisis and since 2009 has decreased as the private mortgage insurance industry has recovered and FHA premiums have increased in the aggregate. In addition to competition from the FHA and the VA, we and other private mortgage insurers currently face limited competition from state-sponsored
4
mortgage insurance funds in several states, including California and New York. From time to time, other state legislatures and agencies consider expanding the authority of their state governments to insure residential mortgages.
Our industry also competes with products designed to eliminate the need for private mortgage insurance, such as "piggyback loans," which combine a first lien loan with a second lien in order to meet the 80% loan-to-value threshold required for sale to the GSEs without certain credit protections. In addition, we compete with investors willing to hold credit risk on their own balance sheets without credit enhancement and, in some markets, with alternative forms of credit enhancement such as structured finance products and derivatives.
Our Products and Services
Mortgage Insurance
In general, there are two principal types of private mortgage insurance, primary and pool.
Primary Mortgage Insurance
Primary mortgage insurance provides protection on individual loans at specified coverage percentages. Primary mortgage insurance is typically offered to customers on individual loans at the time of origination on a flow (i.e., loan-by-loan) basis, but can also be written in bulk transactions (in which each loan in a portfolio of loans is insured in a single transaction). A substantial majority of our policies are primary mortgage insurance.
Customers that purchase our primary mortgage insurance select a specific coverage level for each insured loan. To be eligible for purchase by a GSE, a low down payment loan must comply with the coverage percentages established by that GSE. For loans not sold to the GSEs, the customer determines its desired coverage percentage. Generally, our risk across all policies written is approximately
25%
of the underlying primary insurance in force, but may vary from policy to policy between 6% and 35% coverage.
We file our premium rates with the insurance departments of the 50 states and the District of Columbia as required. Premium rates cannot be changed after the issuance of coverage and premiums applicable to an individual loan are based on a broad spectrum of risk variables including coverage percentages, loan-to-value, or LTV, loan and property attributes, and borrower risk characteristics. See "Management's Discussion and Analysis of Financial Condition and Results of Operations—Factors Affecting Our Results of Operations—Net Premiums Written and Earned" and "—Key Performance Indicators—Average Premium Rate."
Premium payments for primary mortgage insurance coverage are typically made by the borrower. Mortgage insurance paid directly by the borrower is referred to as borrower-paid mortgage insurance, or "BPMI." If the borrower is not required to pay the premium, then the premium is paid by the lender, who may recover the premium through an increase in the note rate on the mortgage or higher origination fees. Loans for which premiums are paid by the lender are referred to as lender-paid mortgage insurance, or "LPMI." In either case, the payment of premium to us generally is the legal responsibility of the insured.
Premiums are generally calculated as a percentage of the original principal balance and may be paid as follows:
•
monthly, where premiums are collected on a monthly basis over the life of the policy;
•
in a single payment, where the entire premium is paid upfront at the time the mortgage loan is originated;
•
annually, where premiums are paid in advance for the subsequent 12 months; or
•
on a "split" basis, where an initial premium is paid upfront along with subsequent monthly payments.
As of
December 31, 2017
, substantially all of our policies are monthly or single premium policies.
In general, we may not terminate mortgage insurance coverage except in the event there is non-payment of premiums or certain material violations of our mortgage insurance policies. The insured may cancel mortgage insurance coverage at any time at their option or upon mortgage repayment. GSE guidelines generally provide that a borrower meeting certain conditions may require the mortgage servicer to cancel mortgage insurance coverage upon the borrower's request when the principal balance of the loan is 80% or less of the property's current value. The Homeowners Protection Act of 1998, or HOPA, also requires the automatic termination of BPMI on most loans when the LTV ratio, based upon the original property value and amortized loan balance, reaches 78%, and provides for cancellation of BPMI upon a borrower's request when the LTV ratio, based on the current value of the property, reaches 80%, upon satisfaction of the conditions set forth in HOPA. In addition, some states impose their own mortgage insurance notice and cancellation requirements on mortgage loan servicers.
5
Pool Insurance
Pool insurance is typically used to provide additional credit enhancement for certain secondary market and other mortgage transactions. Pool insurance generally covers the excess of the loss on a defaulted mortgage loan that exceeds the claim payment under the primary coverage, if such loan has primary coverage, as well as the total loss on a defaulted mortgage loan that did not have primary coverage. Pool insurance may have a stated aggregate loss limit for a pool of loans and may also have a deductible under which no losses are paid by the insurer until losses on the pool of loans exceed the deductible. In another variation, generally referred to as modified pool insurance, policies are structured to include an exposure limit for each individual loan as well as an aggregate loss limit or a deductible for the entire pool.
Master Policy
We issue a master policy to each customer approved as a counterparty by our risk department before accepting their applications for insurance. The master policy, along with its related endorsements and certificates, sets forth the general terms and conditions of our mortgage insurance coverage, including loan eligibility requirements, coverage terms, policy administration, premium payment obligations, exclusions or reductions in coverage, conditions precedent to payment of a claim, claim payment requirements, subrogation and other matters attendant to our coverage.
Mortgage insurance master policies generally protect mortgage insurers from the risk of material misrepresentations and fraud in the origination of an insured loan by establishing the right to rescind coverage in such event. Pursuant to minimum standards for mortgage insurer master policies instituted by the GSEs and the Federal Housing Finance Agency, or FHFA, for mortgage insurance applications received after October 10, 2014, master policies provide rescission relief for loans that remain current up to 36 months after origination and that have not experienced more than two late payments of 30 days or more and have never been 60 days late, and are permitted to provide rescission relief after 12 payments provided the mortgage insurer can independently validate the representations for which it intends to give rescission relief. The standards require that the master policies reserve rescission rights with respect to fraud committed by the insured or those under its control and certain patterns of fraud. Our master policy forms satisfy these standards. The GSEs have published revised rules for rescission relief with an implementation schedule extending through 2018 that will require us to submit new master policy forms to the GSEs for approval. See "Risk Factors—Risks Relating to Our Business—
Changes in the business practices of the GSEs, including actions or decisions to decrease or discontinue the use of mortgage insurance or changes in the GSEs' eligibility requirements for mortgage insurers, could reduce our revenues or adversely affect our profitability and returns
" elsewhere in this Annual Report and "—Regulation—Direct U.S. Regulation—GSE Qualified Mortgage Insurer Requirements" below.
Contract Underwriting
In addition to offering mortgage insurance, we provide contract underwriting services on a limited basis. As a part of these services, we assess whether data provided by the customer relating to a mortgage application complies with the customer's loan underwriting guidelines. These services are provided for loans that require private mortgage insurance, as well as for loans that do not require private mortgage insurance. Under the terms of our contract underwriting agreements with customers and subject to contractual limitations on liability, we agree to indemnify the customer against losses incurred in the event that we make an underwriting error which materially restricts or impairs the saleability of a loan, results in a material reduction in the value of a loan or results in the customer being required to repurchase a loan. The indemnification may be in the form of monetary or other remedies, subject to per loan and annual limitations. See "Risk Factors—Risks Relating to Our Business—
We face risks associated with our contract underwriting business."
Bermuda-Based Insurance and Reinsurance
We offer mortgage-related insurance and reinsurance through Essent Re, a Class 3A insurance company licensed pursuant to Section 4 of the Bermuda Insurance Act 1978. Essent Re provides insurance or reinsurance relating to the risk in force on loans in reference pools acquired by Freddie Mac and Fannie Mae, including in connection with ACIS and CIRT programs. Essent Re also reinsures 25% of Essent Guaranty, Inc.'s GSE-eligible mortgage insurance NIW originated since July 1, 2014 under a quota share reinsurance agreement.
Our Mortgage Insurance Portfolio
All of our policies in force were written since May 2010. The following data presents information on our primary mortgage insurance portfolio for policies written by Essent Guaranty, Inc.
6
Insurance in Force by Policy Year
The following table sets forth our insurance in force, or IIF, as of December 31,
2017
, by year of policy origination. IIF refers to the unpaid principal balance of mortgage loans that we insure.
|
($ in thousands)
|
$
|
%
|
|||||
|
2017
|
$
|
42,058,537
|
|
38.1
|
%
|
||
|
2016
|
30,252,690
|
|
27.4
|
|
|||
|
2015
|
17,283,506
|
|
15.6
|
|
|||
|
2014
|
10,794,703
|
|
9.8
|
|
|||
|
2013
|
6,905,742
|
|
6.2
|
|
|||
|
2012 and prior
|
3,166,772
|
|
2.9
|
|
|||
|
$
|
110,461,950
|
|
100.0
|
%
|
|||
Portfolio Characteristics
The following tables reflect our IIF and risk in force, or RIF, amounts by borrower credit scores at origination, LTV at origination, and IIF by loan type and amortization, each as of December 31,
2017
and
2016
. RIF refers to the product of the coverage percentage applied to the unpaid principal balance of mortgage loans that we insure.
Portfolio by Credit Score
|
|
December 31,
|
|||||||||||||
|
Total IIF by FICO score
($ in thousands)
|
2017
|
2016
|
||||||||||||
|
>=760
|
$
|
48,668,705
|
|
44.1
|
%
|
$
|
37,858,422
|
|
45.5
|
%
|
||||
|
740-759
|
17,939,206
|
|
16.2
|
|
13,760,610
|
|
16.5
|
|
||||||
|
720-739
|
15,761,787
|
|
14.3
|
|
11,855,648
|
|
14.2
|
|
||||||
|
700-719
|
12,167,285
|
|
11.0
|
|
8,712,971
|
|
10.5
|
|
||||||
|
680-699
|
9,156,196
|
|
8.3
|
|
6,611,166
|
|
7.9
|
|
||||||
|
<=679
|
6,768,771
|
|
6.1
|
|
4,466,705
|
|
5.4
|
|
||||||
|
Total
|
$
|
110,461,950
|
|
100.0
|
%
|
$
|
83,265,522
|
|
100.0
|
%
|
||||
|
|
December 31,
|
|||||||||||||
|
Total RIF by FICO score
($ in thousands)
|
2017
|
2016
|
||||||||||||
|
>=760
|
$
|
12,058,196
|
|
43.9
|
%
|
$
|
9,319,522
|
|
45.2
|
%
|
||||
|
740-759
|
4,485,439
|
|
16.4
|
|
3,434,392
|
|
16.7
|
|
||||||
|
720-739
|
3,957,922
|
|
14.4
|
|
2,970,941
|
|
14.4
|
|
||||||
|
700-719
|
3,018,341
|
|
11.0
|
|
2,151,657
|
|
10.4
|
|
||||||
|
680-699
|
2,286,082
|
|
8.3
|
|
1,656,791
|
|
8.0
|
|
||||||
|
<=679
|
1,638,005
|
|
6.0
|
|
1,094,014
|
|
5.3
|
|
||||||
|
Total
|
$
|
27,443,985
|
|
100.0
|
%
|
$
|
20,627,317
|
|
100.0
|
%
|
||||
7
Portfolio by LTV
|
|
December 31,
|
|||||||||||||
|
Total IIF by LTV
($ in thousands)
|
2017
|
2016
|
||||||||||||
|
85.00% and below
|
$
|
12,917,751
|
|
11.7
|
%
|
$
|
9,756,578
|
|
11.7
|
%
|
||||
|
85.01% to 90.00%
|
34,794,108
|
|
31.5
|
|
27,409,202
|
|
32.9
|
|
||||||
|
90.01% to 95.00%
|
54,323,103
|
|
49.2
|
|
42,854,633
|
|
51.5
|
|
||||||
|
95.01% and above
|
8,426,988
|
|
7.6
|
|
3,245,109
|
|
3.9
|
|
||||||
|
Total
|
$
|
110,461,950
|
|
100.0
|
%
|
$
|
83,265,522
|
|
100.0
|
%
|
||||
|
|
December 31,
|
|||||||||||||
|
Total RIF by LTV
($ in thousands)
|
2017
|
2016
|
||||||||||||
|
85.00% and below
|
$
|
1,462,351
|
|
5.3
|
%
|
$
|
1,101,947
|
|
5.3
|
%
|
||||
|
85.01% to 90.00%
|
8,262,322
|
|
30.1
|
|
6,512,613
|
|
31.6
|
|
||||||
|
90.01% to 95.00%
|
15,576,125
|
|
56.8
|
|
12,234,306
|
|
59.3
|
|
||||||
|
95.01% and above
|
2,143,187
|
|
7.8
|
|
778,451
|
|
3.8
|
|
||||||
|
Total
|
$
|
27,443,985
|
|
100.0
|
%
|
$
|
20,627,317
|
|
100.0
|
%
|
||||
Portfolio by Loan Amortization Period
|
|
December 31,
|
|||||||||||||
|
Total IIF by Loan Amortization Period
($ in thousands)
|
2017
|
2016
|
||||||||||||
|
FRM 30 years and higher
|
$
|
100,592,946
|
|
91.1
|
%
|
$
|
75,428,964
|
|
90.6
|
%
|
||||
|
FRM 20-25 years
|
2,879,977
|
|
2.6
|
|
2,113,529
|
|
2.5
|
|
||||||
|
FRM 15 years
|
3,857,152
|
|
3.5
|
|
3,066,893
|
|
3.7
|
|
||||||
|
ARM 5 years and higher
|
3,131,875
|
|
2.8
|
|
2,656,136
|
|
3.2
|
|
||||||
|
Total
|
$
|
110,461,950
|
|
100.0
|
%
|
$
|
83,265,522
|
|
100.0
|
%
|
||||
Portfolio by Geography
Our in force portfolio is geographically diverse. As of December 31,
2017
, only
three
states accounted for greater than 5% of our portfolio and no single metropolitan statistical area accounted for greater than
3%
of our portfolio, as measured by either IIF or RIF. The following tables provide detail of the IIF and RIF in our top ten most concentrated states and our top ten most concentrated U.S. metropolitan statistical areas as of December 31,
2017
and
2016
.
8
Top Ten States
|
|
December 31,
|
|||||
|
|
2017
|
2016
|
||||
|
IIF by State
|
|
|
|
|
||
|
CA
|
9.4
|
%
|
9.4
|
%
|
||
|
TX
|
8.0
|
|
8.2
|
|
||
|
FL
|
7.0
|
|
6.6
|
|
||
|
WA
|
4.8
|
|
4.8
|
|
||
|
IL
|
4.0
|
|
4.0
|
|
||
|
NJ
|
3.7
|
|
3.5
|
|
||
|
NC
|
3.5
|
|
3.7
|
|
||
|
GA
|
3.4
|
|
3.4
|
|
||
|
OH
|
3.2
|
|
3.1
|
|
||
|
AZ
|
3.1
|
|
3.2
|
|
||
|
All Others
|
49.9
|
|
50.1
|
|
||
|
Total
|
100.0
|
%
|
100.0
|
%
|
||
|
|
December 31,
|
||||
|
|
2017
|
2016
|
|||
|
RIF by State
|
|
|
|
|
|
|
CA
|
9.1
|
%
|
9.0
|
%
|
|
|
TX
|
8.3
|
|
8.5
|
|
|
|
FL
|
7.1
|
|
6.9
|
|
|
|
WA
|
4.9
|
|
4.8
|
|
|
|
IL
|
3.9
|
|
4.0
|
|
|
|
NJ
|
3.6
|
|
3.5
|
|
|
|
NC
|
3.5
|
|
3.7
|
|
|
|
GA
|
3.5
|
|
3.5
|
|
|
|
OH
|
3.2
|
|
3.1
|
|
|
|
MN
|
3.2
|
|
3.3
|
|
|
|
All Others
|
49.7
|
|
49.7
|
|
|
|
Total
|
100.0
|
%
|
100.0
|
%
|
|
9
Top Ten Metropolitan Statistical Areas
|
|
December 31,
|
|||||
|
|
2017
|
2016
|
||||
|
IIF by Metropolitan Statistical Area
|
|
|
|
|
||
|
New York-Jersey City-White Plains, NY-NJ
|
2.9
|
%
|
2.8
|
%
|
||
|
Chicago-Naperville-Arlington Heights, IL
|
2.7
|
|
2.8
|
|
||
|
Minneapolis-St. Paul-Bloomington, MN-WI
|
2.6
|
|
2.8
|
|
||
|
Phoenix-Mesa-Scottsdale, AZ
|
2.6
|
|
2.6
|
|
||
|
Atlanta-Sandy Springs-Roswell, GA
|
2.5
|
|
2.5
|
|
||
|
Houston-The Woodlands-Sugar Land, TX
|
2.3
|
|
2.5
|
|
||
|
Seattle-Bellevue-Everett, WA
|
2.3
|
|
2.3
|
|
||
|
Washington-Arlington-Alexandria, DC-VA-MD-WV
|
2.3
|
|
2.1
|
|
||
|
Denver-Aurora-Lakewood, CO
|
1.9
|
|
1.8
|
|
||
|
Los Angeles-Long Beach-Glendale, CA
|
1.9
|
|
1.9
|
|
||
|
All Others
|
76.0
|
|
75.9
|
|
||
|
Total
|
100.0
|
%
|
100.0
|
%
|
||
|
|
December 31,
|
|||||
|
|
2017
|
2016
|
||||
|
RIF by Metropolitan Statistical Area
|
|
|
|
|
||
|
New York-Jersey City-White Plains, NY-NJ
|
2.8
|
%
|
2.7
|
%
|
||
|
Minneapolis-St. Paul-Bloomington, MN-WI
|
2.7
|
|
2.8
|
|
||
|
Chicago-Naperville-Arlington Heights, IL
|
2.6
|
|
2.8
|
|
||
|
Atlanta-Sandy Springs-Roswell, GA
|
2.6
|
|
2.6
|
|
||
|
Phoenix-Mesa-Scottsdale, AZ
|
2.5
|
|
2.5
|
|
||
|
Houston-The Woodlands-Sugar Land, TX
|
2.4
|
|
2.6
|
|
||
|
Seattle-Bellevue-Everett, WA
|
2.3
|
|
2.3
|
|
||
|
Washington-Arlington-Alexandria, DC-VA-MD-WV
|
2.2
|
|
2.1
|
|
||
|
Dallas-Plano-Irving, TX
|
1.9
|
|
1.9
|
|
||
|
Denver-Aurora-Lakewood, CO
|
1.9
|
|
1.8
|
|
||
|
All Others
|
76.1
|
|
75.9
|
|
||
|
Total
|
100.0
|
%
|
100.0
|
%
|
||
Customers
Our customers consist of originators of residential mortgage loans, such as regulated depository institutions, mortgage banks, credit unions and other lenders. We classify our customers into two broad categories and target our marketing efforts based on the customer's operating model and whether decisions to select a mortgage insurance provider are made centrally, or at the field or customer branch level:
|
•
|
Centralized
—Centralized customers make decisions regarding the placement and allocation of mortgage insurance among their approved private mortgage insurers at the corporate level. Generally, these customers consist of the larger, national mortgage originators which originate loans across multiple states, but there are several regional and mid-size lenders which use this method as well.
|
|
•
|
Decentralized
—Decentralized customers make mortgage insurance purchasing decisions at the field or branch level. These customers generally are more prevalent with regional and mid-size lenders which originate mortgages in a smaller geographic footprint, but are also seen, on a limited basis, among some national lenders.
|
10
We seek to maintain strong institutional relationships with all our customers. We provide them with ongoing risk, sales, training, service and product development support. We maintain regular and ongoing dialogue with our customers to develop an in-depth understanding of their strategies and needs, to share market perspectives and industry best practices, and to offer tailored solutions and training where necessary on a local level.
The following table provides detail on the percentage of our total NIW generated by centralized and decentralized customers, respectively, during the years ended December 31,
2017
,
2016
and
2015
.
|
|
Year Ended December 31,
|
||||||||
|
|
2017
|
2016
|
2015
|
||||||
|
Centralized
|
43.0
|
%
|
34.5
|
%
|
38.3
|
%
|
|||
|
Decentralized
|
57.0
|
|
65.5
|
|
61.7
|
|
|||
|
Total
|
100.0
|
%
|
100.0
|
%
|
100.0
|
%
|
|||
We had master policy relationships with approximately
1,420
customers as of December 31,
2017
. Our top ten customers generated
45.8%
of our NIW on a flow basis during the year ended December 31,
2017
, compared to
35.1%
and
36.6%
for the years ended December 31,
2016
and
2015
, respectively. For the year ended December 31,
2017
,
no
customer exceeded 10% of our consolidated revenue. The loss of any of our larger customers could have a material adverse impact on us and our business. See "Risk Factors—Risks Relating to Our Business—
Our revenues, profitability and returns would decline if we lose a significant customer
."
Sales and Marketing
Our sales and marketing efforts are designed to help us establish and maintain in-depth, quality customer relationships. We organize our sales and marketing efforts based on our centralized and decentralized customer segmentation, giving additional consideration to a customer's geographic location and whether its lending footprint is national or regional in nature.
We emphasize a collaborative approach with our customers that includes a number of educational offerings and joint product development and marketing initiatives:
|
•
|
Regular Portfolio and Risk Management Reviews.
We conduct periodic insured mortgage portfolio reviews with customers, including detailed loan performance metrics.
|
|
•
|
Joint Product Development and Marketing Initiatives.
We emphasize the development of specialized products and programs that provide increased opportunities for customers and address targeted segments of the market. We recognize the value in developing new products collaboratively with our customers. We also work closely with customers to understand their strategic priorities and business objectives while identifying opportunities that will enhance and complement the customers' marketing activities.
|
|
•
|
Customer Service, Support and Trainings.
We have an experienced and knowledgeable customer services team that strives to provide premier service to our customers. We dedicate service representatives to our customers so they can establish relationships with their customer peers and become thoroughly familiar with unique customer systems, processes and service needs. We have developed mortgage industry training courses that are offered to our customers as a value added service. We have an experienced team that maintains the course materials so that they are relevant and current and who facilitate training sessions for our customers.
|
We have an experienced team of national and regional account managers strategically deployed nationwide that markets our mortgage insurance products and support services.
We assign national account managers to each of the national lenders, providing a point of communication between us and the customer's senior management team. These professionals are responsible for the development and execution of sales and marketing strategies aimed at growing customer volumes and ensuring each customer's needs are understood and helping them to pursue their strategies. The national account managers also coordinate the direct communication of customers with our underwriting and risk management groups to provide a continual flow of information between the organizations.
11
We also have regional account managers and dedicated support staff operating in defined geographic regions. Our regional account managers play a similar role to our national account managers with respect to customer relationship management, education and customer training, serving as our primary point of contact for small and mid-sized regional lenders operating in a given territory. Regional account managers also support our national account team by assisting with our efforts to directly market and service the branch locations of certain national lenders.
We support our national and regional sales force, and improve their effectiveness in acquiring new customers, by raising our brand awareness through advertising and marketing campaigns, website enhancements, electronic communication strategies and sponsorship of industry and educational events.
We continue to build our sales force by hiring qualified mortgage professionals who generally have well-established relationships with industry-leading lenders and significant experience in both mortgage insurance and mortgage lending. Our approach is reflected in and supported by our compensation structure, pursuant to which we have successfully implemented a non-commission-based structure that includes an equity ownership program, which we believe aligns their efforts with our long-term corporate objectives, including providing better customer service and better risk selection.
Information Technology
We have a highly automated business that relies on information technology. We accept insurance applications through electronic submission and issue electronic insurance approvals. In order to facilitate this process, we establish direct connections to the origination and servicing systems of our customers and servicers, which may require a significant upfront investment. We also provide our customers secure access to our web-based mortgage insurance ordering and servicing systems to facilitate transactions.
We continue to upgrade and enhance our systems and technology, including:
|
•
|
investing in new customer-facing technology that enables our customers to transact business faster and easier, whether over an internet browser or through direct system-to-system interfacing with our customers' loan origination and servicing systems;
|
|
•
|
integrating our platform with third-party technology providers used by our customers in their loan origination process and for ordering mortgage insurance;
|
|
•
|
developing and implementing a business rules engine that automatically enforces our eligibility guidelines and pricing rules at the time the mortgage insurance application is submitted; and
|
|
•
|
implementing advanced business process management software that focuses on improving our underwriting productivity and that may also be used to improve our quality assurance and loss management functions.
|
We believe that our technology, together with our information technology team, greatly enhances our operating efficiency and creates competitive advantages. This team is experienced in large-scale project delivery, including mortgage insurance administration systems and the development of web-enabled servicing capabilities. Technology costs are managed by standardizing our technology infrastructure, consolidating application systems, managing project execution risks and using contract employees as needed.
Underwriting
We have established underwriting guidelines that we believe protect our balance sheet and result in the insurance of high quality business. Most applications for mortgage insurance are submitted to us electronically, and we rely upon the lender's representations and warranties that the data submitted is true and correct when making our insurance decision. Our underwriting guidelines incorporate credit eligibility requirements that, among other things, restrict our coverage to mortgages that meet our requirements with respect to borrower FICO scores, maximum debt-to-income levels, maximum LTV ratios and documentation requirements. Our underwriting guidelines also limit the coverage we provide for mortgages made with certain high risk features, including those for cash-out refinance, second homes or investment properties.
We regularly seek to enhance our underwriting guidelines through extensive data gathering, detailed loan level risk analysis, and assessments of trends in key macroeconomic factors such as housing prices, interest rates and employment. We utilize proprietary models that enable us to assess individual loan risks with a high degree of granularity and set pricing for our
12
policies within a risk-adjusted return framework. See "—Risk Management" below. We have adopted a balanced underwriting approach, which considers our risk analysis, return objectives and market factors.
At present, our underwriting guidelines are broadly consistent with those of the GSEs. Many of our customers use the GSEs' automated loan underwriting systems, Desktop Underwriter® and Loan Prospector®, for making credit determinations. We accept the underwriting decisions made by the GSEs' underwriting systems, subject to certain additional limitations and requirements. We monitor the GSEs for updates to these systems, and may engage in a deeper review for the more substantive releases. Our reviews may result in the maintenance or implementation of additional eligibility requirements. In addition, the performance results of loans scored via automated underwriting systems are monitored within our portfolio management protocols.
Our primary mortgage insurance policies are issued through one of two programs:
|
•
|
Delegated Underwriting.
We delegate to eligible customers the ability to underwrite the loans based on agreed-upon underwriting guidelines. To perform delegated underwriting, customers must be approved by our risk management group. See "—Risk Management—Loan Life Cycle Risk Management" below. Some customers prefer to assume underwriting responsibilities because it is more efficient within their loan origination process. Because this delegated underwriting is performed by third parties, we regularly perform quality assurance reviews on a sample of delegated loans to assess compliance with our guidelines. As of December 31,
2017
, approximately
60%
of our insurance in force had been originated on a delegated basis, compared to
59%
as of December 31,
2016
. See "Risk Factors—Risks Relating to Our Business—
Our delegated underwriting program may subject our mortgage insurance business to unanticipated claims
."
|
|
•
|
Non-Delegated Underwriting.
Customers who choose not to participate in, or do not qualify for, our delegated underwriting program submit loan files to us so that we may reach a decision as to whether we will insure the loan. In addition, customers participating in our delegated underwriting program may choose not to use their delegated authority, and instead may submit loans for our independent underwriting. Some customers prefer our non-delegated program because we assume underwriting responsibility and will not rescind coverage if we make an underwriting error, subject to the terms of our master policy. We seek to ensure that our employees properly underwrite our loans through quality assurance sampling, loan performance monitoring and training. As of December 31,
2017
, approximately
40%
of our insurance in force had been originated on a non-delegated basis, compared to
41%
as of December 31,
2016
.
|
We maintain primary underwriting centers in Radnor, Pennsylvania, Winston-Salem, North Carolina and Irvine, California. We believe that the geographical distribution of our underwriting staff allows us to make underwriting determinations across different time zones and to best serve customers across the United States. Although our employees conduct the substantial majority of our non-delegated underwriting, we engage underwriters on an outsourced basis from time to time in order to provide temporary underwriting capacity.
Risk Management
We have established risk management controls throughout our organization and have a risk management framework that we believe reduces the volatility of our financial results and capital position. The risk committee of our board of directors has formal oversight responsibility for the risks associated with our business and is supported by a management risk committee, chaired by our Chief Risk Officer, comprised of all senior members of our executive management team.
We believe that our risk management framework encompasses all of the major risks we face, including our mortgage insurance portfolio, investment risk, liquidity risk and regulatory compliance risk, among others. The majority of our risk analysis is directed toward the risks embedded in our mortgage insurance portfolio. As such, we have established a risk management approach that analyzes the risk across the full life cycle of a mortgage, into what we term the "loan life cycle."
Loan Life Cycle Risk Management
We generally break down the loan life cycle risk management process into three components:
|
•
|
Customer qualification
—customer review and approval process;
|
|
•
|
Policy acquisition
—loan underwriting, valuation and risk approval; and
|
13
|
•
|
Portfolio management
—loan performance and lender monitoring with continuous oversight through the settlement of a claim.
|
Customer qualification involves a process in which we diligence a potential customer's financial resources, operational practices, management experience and track record of originating quality mortgages prior to formalizing a customer relationship. We leverage the experience of our management team to pre-screen lenders prior to formally engaging and performing a lender qualification review. Once engaged, our counterparty risk management team conducts a lender qualification review with oversight from the management risk committee. Approved lenders are subject to clear parameters regarding underwriting delegation status, credit guideline requirements and variances and collateral thresholds and volume mix expectations for loan diversification.
The policy acquisition process involves the establishment of underwriting guidelines, pricing schedules and aggregate risk limits. See "—Underwriting" above. These guidelines and schedules are coded in our credit risk rule engine which is utilized to screen each loan underwritten, and are constructed to ensure prudent risk acquisition with adequate return on capital. These guidelines and schedules are maintained and periodically reviewed by our risk management team and adjusted to reflect the most current risk assessment based on ongoing experience in the insurance portfolio as well as industry loan quality trends.
The portfolio management process involves two main functions, quality assurance, or QA, reviews, and a comprehensive surveillance protocol, in order to provide customers timely feedback that fosters high quality loan production. Through our QA process, we review a statistically significant sample of individual mortgages from our customers to ensure that the loans accepted through our underwriting process meet our pre-determined eligibility and underwriting criteria. The QA process allows us to identify trends in lender underwriting and origination practices, as well as to back-test underlying reasons for delinquencies, defaults and claims within our portfolio. The information gathered from the QA process is incorporated into our policy acquisition function and is intended to prevent continued aggregation of underperforming risks. Our surveillance protocol maintains oversight over customer and vendor activities, industry dynamics, production trends and portfolio performance. The portfolio management process also involves loss mitigation aimed to reduce both frequency and severity of non-performing risk. See "—Defaults and Claims" below.
Modeling and Analytics
Our risk management professionals are supported by substantial data analysis and sophisticated risk models. We have a dedicated modeling and analytics team which is responsible for delivering actionable models, tools, analysis and reporting to inform our credit underwriting and pricing decisions. The team analyzes mortgage, financial, economic and housing data to develop proprietary behavioral models that help us assess credit, prepayment and loss severity trends and collateral valuation models to help inform business decisions. Performance and profitability are evaluated across customers and products to identify the emergence of potential weaknesses and adverse risks. Geographic housing market analysis also is utilized in establishing market restrictions for certain products and segments. We utilize an economic capital framework to evaluate risk-adjusted returns. We also perform stress tests on our portfolio to analyze how our book of business may perform under adverse scenarios. We believe that our economic capital framework and stress testing analysis helps to inform our optimal capitalization targets, allowing us to prudently manage and protect our balance sheet.
Defaults and Claims
Defaults
The default and claim cycle for a mortgage insurance policy begins with receipt of a default notice from the servicer. We consider a loan to be in default when we are notified by the servicer that the borrower has missed at least two consecutive monthly payments. Defaults may occur for a variety of reasons including death or illness, divorce or other family problems, unemployment, changes in economic conditions, declines in property values that cause the outstanding mortgage amount to exceed the value of a home or other events.
We expect servicers to make timely collection efforts on borrowers who have defaulted, and to attempt to restore the defaulted mortgage, and our mortgage insurance coverage, to current status. If the servicer cannot restore a borrower to current status, the servicer may be able to offer the borrower a forbearance or loan modification alternatives. Where these alternatives cannot cure the default, the servicer is responsible for pursuing remedies for the default, including foreclosure or acceptable foreclosure alternatives, certain of which, such as short sales and deeds in lieu of foreclosure, require our prior approval under the terms of our master policy. We have delegated limited authority to the GSEs and their servicers to exercise some of these alternatives. Among other requirements, servicers operate under protocols established by the GSEs. See "Risk Factors—Risks
14
Relating to Our Business—
If servicers fail to adhere to appropriate servicing standards or experience disruptions to their businesses, our losses could unexpectedly increase
."
The following table shows the number of primary insured loans and the percentage of loans insured by us that are in default as of December 31,
2017
and
2016
:
Number of Loans in Default and Default Rate
|
|
December 31,
|
|||||
|
|
2017
|
2016
|
||||
|
Number of policies in force
|
496,477
|
|
375,898
|
|
||
|
Loans in default
|
4,783
|
|
1,757
|
|
||
|
Percentage of loans in default
|
0.96
|
%
|
0.47
|
%
|
||
Loan Defaults by Originating Year
|
|
December 31, 2017
|
December 31, 2016
|
||||||||||||||||||
|
Originating Year
|
Loans in
Default
|
Percentage
of policies
written in
period
|
Defaulted
RIF
(in thousands)
|
Loans in
Default
|
Percentage
of policies
written in
period
|
Defaulted
RIF
(in thousands)
|
||||||||||||||
|
2010
|
—
|
|
—
|
%
|
$
|
—
|
|
1
|
|
0.1
|
%
|
$
|
23
|
|
||||||
|
2011
|
40
|
|
0.3
|
|
1,669
|
|
44
|
|
0.3
|
|
1,954
|
|
||||||||
|
2012
|
161
|
|
0.3
|
|
7,829
|
|
156
|
|
0.3
|
|
7,700
|
|
||||||||
|
2013
|
440
|
|
0.5
|
|
23,464
|
|
362
|
|
0.4
|
|
18,734
|
|
||||||||
|
2014
|
890
|
|
0.8
|
|
49,788
|
|
677
|
|
0.6
|
|
37,740
|
|
||||||||
|
2015
|
1,023
|
|
0.9
|
|
60,052
|
|
394
|
|
0.4
|
|
22,101
|
|
||||||||
|
2016
|
1,164
|
|
0.8
|
|
69,270
|
|
123
|
|
0.1
|
|
7,165
|
|
||||||||
|
2017
|
1,065
|
|
0.6
|
|
62,132
|
|
N/A
|
|
N/A
|
|
N/A
|
|
||||||||
|
Total
|
4,783
|
|
|
|
$
|
274,204
|
|
1,757
|
|
|
|
$
|
95,417
|
|
||||||
We have experienced a low level of defaults to date. This is due, in part, to the weighted average life of our mortgage insurance portfolio being
20.1
months as of
December 31, 2017
, whereas the peak default period for insured mortgage loans has historically been three to six years after loan origination. As a result, we do expect default levels to increase as our portfolio seasons. We believe that in recent years the underwriting practices in the industry have improved substantially and that the quality of mortgage loans originated has been high. Consequently, we expect that the default rate and losses on the business we have underwritten to date will be favorable in comparison to the default rate and losses experienced by the mortgage insurers that wrote business in 2006 through 2009. During the third quarter of 2017, certain regions of the U.S. experienced hurricanes which have impacted our insured portfolio’s performance. Specifically, on August 26, 2017, Hurricane Harvey made landfall in southeastern Texas and on September 10, 2017, Hurricane Irma made landfall in southern Florida and caused property damage in certain counties. Loans in default increased by
3,026
in the year ended December 31, 2017, including
2,288
defaults we identified as hurricane-related defaults. Based on prior industry experience, we expect the ultimate number of hurricane-related defaults that result in claims will be less than the default-to-claim experience of non-hurricane-related defaults.
Claims
Defaulted mortgages that are not cured turn into claims. The insured customer must acquire title to the property before submitting a claim. The time in which a customer may acquire title to a property through foreclosure varies, depending on the state in which the property is located. Historically, on average, mortgage insurers do not receive a request for claim payment until approximately 18 months following a default on a first-lien mortgage. This time lag has increased in recent years as the industry has experienced a slowdown in foreclosures (and, consequently, a slowdown in claims submitted to mortgage insurers) largely due to foreclosure moratoriums imposed by various government entities and lenders and increased scrutiny within the mortgage servicing industry on the foreclosure process.
15
Upon review and determination that a claim is valid, we generally have the following three settlement options:
|
•
|
Percentage option—determined by multiplying the claim amount by the applicable coverage percentage, with the customer retaining title to the property. The claim amount is defined in the master policy as consisting of the unpaid loan principal, plus past due interest, subject to a defined maximum, and certain expenses associated with the default;
|
|
•
|
Third-party sale option—pay the amount of the claim required to make the customer whole, commonly referred to as the "actual loss amount" (not to exceed our maximum liability as outlined under the percentage option), following an approved sale; or
|
|
•
|
Acquisition option—pay the full claim amount and acquire title to the property.
|
We believe there are opportunities to mitigate losses between the time a loan defaults and the ultimate loss we may experience. Because of the small number of defaults and filed claims in our insurance portfolio to date, our opportunities to pursue these activities have been limited. However, we expect both defaulted loan counts and claim filings to increase as our portfolio grows and matures, expanding the potential benefit from these loss mitigation activities. Our loss mitigation and claims area is led by seasoned personnel supported by default tracking and claims processing capabilities within our integrated platform. Our loss mitigation staff is also actively engaged with our servicers and the GSEs with regard to appropriate servicing and loss mitigation practices.
Investment Portfolio
Our investment portfolio, including cash, comprises the largest single component of our balance sheet, representing
87.8%
of our total assets at December 31,
2017
. Our primary objectives with respect to our investment portfolio are to preserve capital, generate investment income and maintain sufficient liquidity to cover operating expenses and pay future insurance claims. As of December 31,
2017
, predominantly all of our investment securities were rated investment-grade.
We have adopted and our board of directors has approved an investment policy that defines specific limits for asset sectors, single issuer, credit rating, asset duration, industry and geographic concentration and eligible and ineligible investments. Our senior management is responsible for the execution of our investment strategy and compliance with the adopted investment policy, and review of investment performance and strategy with the investment committee of the board of directors on a quarterly basis.
Our current strategy for the investment portfolio is focused primarily on the following: selecting fixed income securities; maintaining sufficient liquidity to meet expected and unexpected financial obligations; mitigating interest rate risk through management of asset durations; continuously monitoring investment quality; and limiting investments in assets that are highly correlated to the residential mortgage market.
We engage external asset managers to assist with the trading, investment research, investment due diligence and portfolio allocation within the guidelines that we have set. Approximately
88.1%
of our investment assets, excluding cash, were managed by external managers as of December 31,
2017
. Assets not managed by external managers include securities on deposit with state regulatory agencies in connection with the insurance licenses and bonds issued by the U.S. Treasury and U.S. government agencies. To date, we have not used any derivatives to hedge any investment or business risks that we are currently assuming. We measure investment performance against market benchmarks on both total return and return volatility dimensions.
See "Management's Discussion and Analysis of Financial Condition and Results of Operations—Financial Condition—Investments" for information regarding the performance of our investment portfolio.
Regulation
Direct U.S. Regulation
We are subject to comprehensive, detailed regulation by Federal regulators and state insurance departments. State regulations are principally designed for the protection of the public and our insured policyholders, rather than for the benefit of investors. Although their scope varies, state insurance laws generally grant broad supervisory powers to agencies or to officials to examine insurance companies and to enforce rules or to exercise discretion affecting almost every significant aspect of the insurance business.
16
GSE Qualified Mortgage Insurer Requirements
Pursuant to their charters, Fannie Mae and Freddie Mac purchase or guaranty low down payment loans insured by entities that they determine to be qualified mortgage insurance companies. Our primary insurance subsidiary, Essent Guaranty, Inc., is currently approved by both Fannie Mae and Freddie Mac as a mortgage insurer.
The FHFA, as the conservator of the GSEs since 2008, has the authority to establish the priorities of the GSEs and to control and direct their operations. The FHFA has established a strategic plan for the GSEs, including the development by the GSEs of aligned counterparty risk management standards for mortgage insurers that include uniform master policy and eligibility requirements. See "—Our Products and Services—Mortgage Insurance—Master Policy" above.
Effective December 31, 2015, Fannie Mae and Freddie Mac, at the direction of the FHFA, implemented new coordinated Private Mortgage Insurer Eligibility Requirements, which we refer to as the "PMIERs." The PMIERs represent the standards by which private mortgage insurers are eligible to provide mortgage insurance on loans owned or guaranteed by Fannie Mae and Freddie Mac. The PMIERs include financial strength requirements incorporating a risk-based framework that require approved insurers to have a sufficient level of liquid assets from which to pay claims. The PMIERs also include enhanced operational performance expectations and define remedial actions that apply should an approved insurer fail to comply with these requirements. As of
December 31, 2017
, Essent Guaranty, Inc., our GSE-approved mortgage insurance company, was in compliance with the PMIERs.
Based on a confidential draft proposal that we received from the GSEs, we believe that updated PMIERs may be finalized in the first half of 2018 and become effective no sooner than the second half of 2018, 180 days after their release.
State Insurance Regulation
Our U.S. insurance subsidiaries are required by the insurance regulatory authority of its state of domicile, and the insurance regulatory authority of each other jurisdiction in which they are licensed to transact business, to make various filings with those insurance regulatory authorities and with the National Association of Insurance Commissioners, or NAIC, including quarterly and annual financial statements prepared in accordance with statutory accounting principles. We are licensed to write mortgage insurance in all 50 states and the District of Columbia. Most states also regulate transactions between insurance companies and their affiliates and have restrictions on transactions that have the effect of inducing lenders to place business with the insurer. For a description of limits on dividends payable to Essent Group Ltd. from our insurance subsidiaries, see "Management's Discussion and Analysis of Financial Condition and Results of Operations—Liquidity and Capital Resources" and
Note 11
to our consolidated financial statements entitled "
Dividends Restrictions
" included elsewhere in this Annual Report.
In general, state regulation of our insurance business relates to:
|
•
|
licenses to transact business;
|
|
•
|
producer licensing;
|
|
•
|
approval of policy forms;
|
|
•
|
approval of premium rates;
|
|
•
|
limits on insurable loans;
|
|
•
|
quarterly, annual and other reports on our financial condition;
|
|
•
|
the basis upon which assets and liabilities must be stated;
|
|
•
|
requirements regarding contingency reserves;
|
|
•
|
minimum capital levels and adequacy ratios;
|
|
•
|
limitations on the types of investment instruments which may be held in our investment portfolio;
|
17
|
•
|
special deposits of securities;
|
|
•
|
limits on dividends payable;
|
|
•
|
advertising compliance;
|
|
•
|
establishment of reserves;
|
|
•
|
claims handling;
|
|
•
|
cybersecurity;
|
|
•
|
hazardous financial condition; and
|
|
•
|
enterprise risk management.
|
Mortgage insurance premium rates are regulated to protect policyholders against the adverse effects of excessive, inadequate or unfairly discriminatory rates and to encourage competition in the insurance marketplace. Any increase in premium rates must be actuarially justified, generally on the basis of the insurer's loss experience, expenses and future trend analysis. The general mortgage default experience may also be considered. Premium rates are subject to review and approval protocols maintained, and may be the subject of examination, by state regulators. See "Management's Discussion and Analysis—Liquidity and Capital Resources" for information about regulations governing our capital adequacy, information about our current capital and our expectations regarding our future capital position.
The insurance holding company laws and regulations of Pennsylvania, the state in which our U.S. insurance subsidiaries are domiciled, regulate, among other things, certain transactions between Essent Group Ltd., our insurance subsidiaries and other parties affiliated with us and certain transactions involving our common shares, including transactions that constitute a change of control of Essent Group Ltd. and, consequently, a change of control of our insurance subsidiaries. Specifically, these laws and regulations require that, before a person can acquire direct or indirect control of an insurer domiciled in the state, prior written approval must be obtained from the Pennsylvania Insurance Department. The Pennsylvania Insurance Department is required to consider various factors, including the financial strength of the acquirer, the integrity and management experience of the acquirer's board of directors and executive officers, and the acquirer's plans for the future operations of the reinsurer or insurer. Pursuant to applicable laws and regulations, "control" over an insurer is generally presumed to exist if any person, directly or indirectly, owns, controls, holds the power to vote or holds proxies representing, 10% or more of the voting securities of that reinsurer or insurer. Indirect ownership includes ownership of our common shares.
State insurance law, and not Federal bankruptcy law, would apply to any insolvency or financially hazardous condition of our U.S. insurance subsidiaries.
During 2012, the NAIC established a Mortgage Guaranty Insurance Working Group, which we refer to as the "MGIWG," to determine and make recommendations to the NAIC's Financial Condition Committee regarding what, if any, changes are deemed necessary to the solvency regulation of mortgage guaranty insurers. The MGIWG has advanced a draft revised Model Act and has engaged with certain industry members developing a risk-sensitive analytical model to assess and establish capital adequacy levels. The NAIC has engaged an independent firm to perform validation exercises on this capital model. The MGIWG is continuing its work in 2018.
Statutory Accounting
The preparation of financial statements in conformity with state-regulated statutory accounting principles requires management to make estimates and assumptions that affect the reported amounts of assets and liabilities. It also requires disclosure of contingent assets and liabilities at the date of the financial statements and the reported amounts of revenue and expenses during the period. Actual results could differ from those estimates.
We are required to establish statutory accounting contingency loss reserves in an amount equal to 50% of our net earned premiums. These amounts generally cannot be withdrawn for a period of 10 years, except as permitted by applicable insurance law and regulations. With regulatory approval, a mortgage guaranty insurance company may make early withdrawals from the contingency reserve when incurred losses exceed 35% of net premiums earned in a calendar year. For further information, see
Note 17
to our consolidated financial statements entitled "Statutory Accounting" included elsewhere in this Annual Report.
18
Federal Mortgage-Related Laws and Regulations
Certain Federal laws directly or indirectly affect private mortgage insurers. Private mortgage insurers are impacted indirectly by Federal laws and regulations affecting mortgage originators and lenders, purchasers of mortgage loans, such as the GSEs, and governmental insurers such as the FHA and the VA. For example, changes in Federal housing laws and regulation or other laws and regulations that affect the demand for private mortgage insurance may have a material adverse effect on us. In addition, mortgage origination and servicing transactions are subject to compliance with various Federal and state laws, including the Real Estate Settlement Procedures Act, or RESPA, the Equal Credit Opportunity Act, the Fair Housing Act, the Truth In Lending Act, or TILA, the Homeowners Protection Act of 1998, or HOPA, the Fair Credit Reporting Act of 1970 and the Fair Debt Collection Practices Act. Among other things, these laws and their implementing regulations prohibit payments for referrals of settlement service business, require fairness and non-discrimination in granting or facilitating the granting of credit, govern the circumstances under which companies may obtain and use consumer credit information, define the manner in which companies may pursue collection activities, and provide for other consumer protections.
Dodd-Frank Act
The Dodd-Frank Act Wall Street Reform and Consumer Protection Act of 2010, which we refer to as the Dodd-Frank Act, amended certain provisions of TILA and RESPA that may have a significant impact on our business prospects. The Consumer Financial Protection Bureau, or CFPB, a Federal agency created by the Dodd-Frank Act, is charged with implementation and enforcement of these provisions.
Qualified Mortgage Regulations—Ability To Repay Requirements
The Dodd-Frank Act established the CFPB to regulate the offering and provision of consumer financial products and services under Federal law, including residential mortgages. Under the Dodd-Frank Act, the CFPB is authorized to issue regulations governing a loan originator's determination that, at the time a loan is originated, the consumer has a reasonable ability to repay the loan. The Dodd-Frank Act provides for a statutory presumption that a borrower will have the ability to repay a loan if the loan has characteristics satisfying the qualified mortgage, or QM, definition. Creditors who violate the ability-to-repay, or ATR, standard can be liable for all interest and fees paid by the borrower as well as actual and statutory damages. Furthermore, the borrower may assert this as a defense by recoupment or set off without regard to any statute of limitation in any foreclosure action initiated by or on behalf of the creditor, assignee or any holder of the mortgage.
Pursuant to the CFPB's final rule regarding QMs, which we refer to as the QM Rule, a loan is deemed to be a QM if it meets certain specified requirements, including if:
|
•
|
the term of the mortgage is less than or equal to 30 years;
|
|
•
|
there is no negative amortization, interest only or balloon features;
|
|
•
|
the lender properly documents the loan in accordance with the requirements;
|
|
•
|
the total "points and fees" do not exceed certain thresholds, generally 3%; and
|
|
•
|
the total debt-to-income ratio does not exceed 43%.
|
The QM Rule provides a "safe harbor" for QM loans with annual percentage rates, or APRs, below the threshold of 150 basis points over the Average Prime Offer Rate, or APOR, and a "rebuttable presumption" for QM loans with an APR above that threshold.
The Dodd-Frank Act separately granted statutory authority to HUD (for FHA-insured loans), the VA (for VA-guaranteed loans) and certain other government agency insurance programs have developed their own definitions of a qualified mortgage in consultation with the CFPB. Under both the FHA's and the VA's QM standards, certain loans which would not qualify as QM loans in the conventional market would still be deemed to be QM loans if insured or guaranteed by FHA or VA. As a result, lenders may favor the use of FHA or VA insurance to achieve the legal protections of making a QM loan through these agencies, even if the same loan could be made at the same or lower cost to the borrower using private mortgage insurance, which could adversely impact our business. To the extent that the other government agencies adopt their own
definitions of a QM which are more favorable to lenders and mortgage holders than those applicable to the market in which we operate, our business may be adversely affected.
19
The QM Rule also provides for a second, temporary category that allows for more flexible underwriting requirements. To qualify under the temporary QM definition, a mortgage must meet the general product feature requirements and be eligible to be purchased or guaranteed by either of the GSEs (while they remain under FHFA conservatorship), the FHA, the VA, and the U.S. Department of Agriculture Rural Development program. This temporary QM category expires on January 10, 2021, or earlier if the Federal agencies issue their own qualified mortgage rules or, with respect to GSEs, if the FHFA's conservatorship ends.
Under the QM Rule, mortgage insurance premiums that are payable by the consumer at or prior to consummation of the loan are includible in the calculation of points and fees unless, and to the extent that the up-front premiums, or UFPs, are (i) less than or equal to the UFPs charged by the FHA, and (ii) are automatically refundable on a pro rata basis upon satisfaction of the loan. Our borrower-paid single premium products, both refundable and non-refundable, may be includible within the points and fees calculation under the QM Rule. As noted above, the QM Rule includes a limitation on points and fees in excess of 3% of the total loan amount. Because inclusion of mortgage insurance premiums in the calculation of points and fees will reduce the capacity for other points and fees in order for lenders to comply with the cap, mortgage originators may be less likely to utilize borrower-paid single premium mortgage insurance products. Even where the mortgage insurance premium is not directly included in the calculation of points and fees, it may limit the ability of the lender to charge other points and fees. The treatment of mortgage insurance premiums as a component of the points and fees calculation, or the potential indirect impact of mortgage insurance premiums on the total points and fees, may be a key determinant of whether a loan is in the safe harbor, receives a rebuttable presumption of ability to repay, or receives no presumption. As a result, the QM Rule may decrease demand for certain of our single premium products and may increase demand for monthly, annual and "split" premium mortgage insurance products that do not impact or have a smaller impact on the points and fees. See "Management's Discussion and Analysis of Financial Condition and Results of Operations—Factors Affecting Our Results of Operations—Persistency and Business Mix."
We expect that most lenders will continue to be reluctant to make non-QM loans because they will not be entitled to the presumption against civil liability under the Dodd-Frank Act, and mortgage investors may be reluctant to purchase mortgages or mortgage-backed securities that are not QMs due to potential assignee liability for such loans. As a result, we believe that the QM regulations have a direct impact on establishing a subset of borrowers who can meet the regulatory standards and directly affect the willingness of lenders and mortgage investors to extend mortgage credit and therefore the size of the residential mortgage market. See "Risk Factors—Risks Relating to Our Business—
Our business prospects and operating results could be adversely impacted if, and to the extent that, the Consumer Financial Protection Bureau's ("CFPB") final rule defining a qualified mortgage ("QM") reduces the size of the origination market or creates incentives to use government mortgage insurance programs."
Qualified Residential Mortgage Regulations—Risk Retention Requirements
The Dodd-Frank Act generally requires an issuer of an asset-backed security or a person who organizes and initiates an asset-backed transaction (a "securitizer") to retain at least 5% of the risk associated with securitized mortgage loans, although in some cases the retained risk may be allocated between the securitizer and the mortgage originator. This risk retention requirement does not apply to a mortgage loan that is a "qualified residential mortgage," or a "QRM," or that is insured or guaranteed by the FHA or other specified Federal agencies.
The QRM regulations align the definition of a QRM loan with that of a QM loan. If, however, the QRM definition is changed (or the QM definition is amended) in a manner that is unfavorable to us, such as to give no consideration to mortgage insurance in computing LTV or to require a large down payment for a loan to qualify as a QRM, the attractiveness of originating and securitizing loans with lower down payments may be reduced, which may adversely affect the future demand for mortgage insurance. See "Risk Factors—Risks Relating to Our Business—
The amount of insurance we write could be adversely affected by the implementation of the Dodd-Frank Act's risk retention requirements and the definition of Qualified Residential Mortgage ("QRM").
"
Mortgage Servicing Rules
The Dodd-Frank Act amended and expanded upon mortgage servicing requirements under TILA and RESPA, and in 2014 the CFPB amended Regulation Z (promulgated pursuant to TILA) and Regulation X (promulgated pursuant to RESPA) to conform these regulations accordingly. Included within these rules are new or enhanced requirements for handling escrow accounts, responding to borrower assertions of error and inquiries from borrower, special handling of loans that are in default, and loss mitigation in the event of borrower default. A provision of the required loss mitigation procedures prohibits the loan holder or servicer from commencing foreclosure until 120 days after the borrower's delinquency. Complying with the new rules could cause the servicing of mortgage loans to become more burdensome and costly than it had been prior to the
20
implementation of these rules. As to servicing of mortgage loans covered by our insurance policies, these rules could contribute to delays in realization upon collateral and have an adverse impact on resolution of claims.
Homeowners Protection Act of 1998
The Homeowners Protection Act of 1998, or HOPA, provides for the automatic termination, or cancellation upon a borrower's request, of private mortgage insurance upon satisfaction of certain conditions. HOPA requires that lenders give borrowers certain notices with regard to the automatic termination or cancellation of mortgage insurance. These provisions apply to borrower-paid mortgage insurance for purchase money, refinance and construction loans secured by the borrower's principal dwelling. FHA and VA loans are not covered by HOPA. Under HOPA, automatic termination of mortgage insurance would generally occur when the mortgage is first scheduled to reach an LTV of 78% of the home's original value, assuming that the borrower is current on the required mortgage payments. A borrower who has a "good payment history," as defined by HOPA, may generally request cancellation of mortgage insurance when the LTV is first scheduled to reach 80% of the home's original value or when actual payments reduce the loan balance to 80% of the home's original value, whichever occurs earlier. If mortgage insurance coverage is not cancelled at the borrower's request or by the automatic termination provision, the mortgage servicer must terminate mortgage insurance coverage by the first day of the month following the date that is the midpoint of the loan's amortization, assuming the borrower is current on the required mortgage payments.
Real Estate Settlement Procedures Act of 1974
Mortgage insurance generally may be considered to be a "settlement service" for purposes of RESPA under applicable regulations. Subject to limited exceptions, RESPA prohibits persons from giving or accepting anything of value in connection with the referral of a settlement service. RESPA authorizes the CFPB, the U.S. Department of Justice, state attorneys general and state insurance commissioners to bring civil enforcement actions, and also provides for criminal penalties and private rights of action. In the past, a number of lawsuits have challenged the actions of private mortgage insurers under RESPA, alleging that the insurers have violated the referral fee prohibition by entering into captive reinsurance arrangements or providing products or services to mortgage lenders at improperly reduced prices in return for the referral of mortgage insurance, including the provision of contract underwriting services. In addition to these private lawsuits, other private mortgage insurance companies have received "Civil Investigative Demands" from, and entered into consent orders with, the CFPB as part of its investigation to determine whether mortgage lenders and mortgage insurance providers engaged in acts or practices in connection with their captive mortgage insurance arrangements in violation of the RESPA, the Consumer Financial Protection Act and the Dodd-Frank Act. The CFPB’s ruling in its enforcement order against PHH Corporation for alleged RESPA violations stemming from captive mortgage insurance arrangements was overturned on appeal by a panel of the D.C. Circuit Court, a decision affirmed in January 2018 by the full D.C. Circuit Court of Appeals. Although we did not participate in the practices that were the subject of the CFPB consent orders or the PHH case, the private mortgage insurance industry and our insurance subsidiaries are subject to substantial Federal and state regulation. Increased Federal or state regulatory scrutiny could lead to new legal precedents, new regulations or new practices, or regulatory actions or investigations, which could adversely affect our financial condition and operating results.
SAFE Act (Mortgage Loan Originator Licensing)
The SAFE Act requires mortgage loan originators to be licensed and/or registered with the Nationwide Mortgage Licensing System and Registry, or the NMLS. The NMLS is a database established by the Conference of State Bank Supervisors and the American Association of Residential Mortgage Regulators. Among other things, the database was established to support the licensing of mortgage loan originators by each state. As part of this licensing and registration process, loan originators who are employees of institutions other than depository institutions or certain of their subsidiaries that are regulated by a Federal banking agency, must generally be licensed under the SAFE Act guidelines enacted by each state in which they engage in loan originator activities and registered with the NMLS. The SAFE Act generally prohibits employees of a depository institution (including certain of their subsidiaries that are regulated by a Federal banking agency) from originating residential mortgage loans without first registering with the NMLS and maintaining that registration. Certain of our underwriters are licensed pursuant to the SAFE Act.
Privacy and Information Security
The Gramm-Leach-Bliley Act of 1999, or GLB, imposes privacy requirements on financial institutions, including obligations to protect and safeguard consumers' nonpublic personal information and records, and limitations on the re-use of such information. Federal regulatory agencies have issued the Interagency Guidelines Establishing Information Security Standards, or "Security Guidelines," and interagency regulations regarding financial privacy, or "Privacy Rule," implementing sections of GLB. The Security Guidelines establish standards relating to administrative, technical, and physical safeguards to
21
ensure the security, confidentiality, integrity, and the proper disposal of consumer information. The Privacy Rule limits a financial institution's disclosure of nonpublic personal information to unaffiliated third parties unless certain notice requirements are met and the consumer does not elect to prevent or "opt out" of the disclosure. The Privacy Rule also requires that privacy notices provided to customers and consumers describe the financial institutions' policies and practices to protect the confidentiality and security of the information. With respect to our business, GLB is enforced by the U.S. Federal Trade Commission, or FTC, and state insurance regulators. Many states have enacted legislation implementing GLB and establishing information security regulation. Many states have enacted privacy and data security laws which impose compliance obligations beyond GLB, including obligations to protect social security numbers and provide notification in the event that a security breach results in a reasonable belief that unauthorized persons may have obtained access to consumer nonpublic information.
The New York Department of Financial Services, or NYDFS, adopted a Cybersecurity Regulation effective March 1, 2017 that applies to all individuals and entities licensed by the NYDFS. Licensees must file for exemption or submit an annual compliance certification by February 15 of each year. In February 2018, we submitted timely and unqualified certificates of compliance to the NYDFS with respect to its Cybersecurity Regulation.
Fair Credit Reporting Act
The Fair Credit Reporting Act of 1970, as amended, or FCRA, imposes restrictions on the permissible use of credit report information. FCRA has been interpreted by some FTC staff and Federal courts to require mortgage insurance companies to provide "adverse action" notices to consumers in the event an application for mortgage insurance is declined or offered at less than the best available rate for the loan program applied for on the basis of a review of the consumer's credit. We provide such notices as required. Although we have not been involved, there has been class action litigation over these FCRA adverse action notices involving the mortgage insurance industry, including court-approved settlements.
Housing Finance Reform
Presently, the Federal government plays a dominant role in the U.S. housing finance system through the involvement of the GSEs and the FHA, VA and Ginnie Mae. There is broad policy consensus toward the need for private capital to play a larger role and government credit risk to be reduced. However, to date there has been a lack of consensus with regard to the specific changes necessary to return a larger role for private capital and how small the eventual role of government should become. Since the GSEs were placed into conservatorship in September 2008, there have been a wide ranging set of GSE and secondary market reform advocacy proposals put forward, including nearly complete privatization and elimination of the role of the GSEs, recapitalization of the GSEs and a number of alternatives that combine a Federal role with private capital, some of which eliminate the GSEs and others of which envision an on-going role for the GSEs. Since 2011, a number of comprehensive GSE/secondary market legislative reform bills have also been introduced or discussed in the U.S. Congress, differing with regard to the future role of the GSEs, the overall structure of the secondary market and the role of the Federal government within the mortgage market. In addition, the size, complexity and centrality of the GSEs to the current housing finance system and the importance of housing to the economy make the transition to any new housing finance system difficult. On January 16, 2018, the FHFA offered its own perspectives on housing finance reform in a communication to Congressional leaders, including a proposal to privatize the GSEs with an explicit guarantee from the U.S. Government for catastrophic losses on their mortgage-backed securities in return for fees paid into a reserve fund.
The placement of the GSEs into the conservatorship of the FHFA increases the likelihood that the U.S. Congress will address the role and purpose of the GSEs in the U.S. housing market and potentially legislate structural and other changes to the GSEs and the functioning of the secondary mortgage market. New Federal legislation could reduce the level of private mortgage insurance coverage used by the GSEs as credit enhancement, eliminate the requirement altogether or otherwise alter or eliminate the role of the GSEs, and thereby materially affect our ability to compete, demand for our products and the profitability of our business.
There can be no assurance that other Federal laws and regulations affecting these institutions and entities will not change, or that new legislation or regulations will not be adopted that will adversely affect the private mortgage insurance industry. See "Risk Factors—Risks Relating to Our Business—
Legislative or regulatory actions or decisions to change the role of the GSEs in the U.S. housing market generally, or changes to the charters of the GSEs with regard to the use of credit enhancements generally and private mortgage insurance specifically, could reduce our revenues or adversely affect our profitability and returns
" and "—
Changes in the business practices of the GSEs, including actions or decisions to decrease or discontinue the use of mortgage insurance or changes in the GSEs' eligibility requirements for mortgage insurers, could reduce our revenues or adversely affect our profitability and returns.
"
22
Mortgage Insurance Tax Deduction
In 2006, Congress enacted the private mortgage insurance tax deduction in order to foster homeownership. The deduction was enacted on a temporary basis and it expired at the end of 2011. Since 2011, the private mortgage insurance tax deduction has been extended four times, most recently through December 31, 2017. Legislation has been introduced in Congress from time to time to extend the deduction for mortgage insurance premiums permanently, however, we cannot predict whether the tax deduction will be made permanent and if not, whether it will be extended for tax years after 2017.
FHA Reform
We compete with the single-family mortgage insurance programs of the FHA, which is part of HUD. The most recent FHA report to Congress dated
November 15, 2017
on the financial status of the FHA Mutual Mortgage Insurance Fund, or MMIF, showed the capital reserve ratio of the MMIF at
2.09%
, above the Congressionally mandated required minimum level of 2%. As a result of the financial improvements in the condition of the MMIF over the past few years and the stated desire to support the housing recovery, the FHA reduced its mortgage insurance premiums by 50 basis points in January 2015.
Federal Insurance Office
On December 9, 2013, the U.S. Department of the Treasury's Federal Insurance Office released a report entitled "How to Modernize and Improve the System of Insurance Regulation in the United States." This report, which was mandated by Title V of the Dodd-Frank Act, states that that mortgage insurance is "interconnected with other aspects of the federal housing finance system" and will be "an important component of any reform package as an alternative way to place private capital in front of any taxpayer risk." Given this role, the report recommends "national solvency and business practice standards" for mortgage insurers to ensure "confidence in the solvency and performance of housing finance." To the extent any such Federal oversight or standards as may be established exceed the current standards and oversight represented by the overlay of FHFA and GSE-driven eligibility requirements and the direct prudential and solvency regulatory and supervisory oversight of state insurance commissioners, it may adversely affect the results of our business operations.
Lobbying Disclosure Act of 1995
We employ an in-house lobbyist in order to engage in the public policy debates that have been referred to herein, and accordingly have registered with the Secretary of the Senate and the Clerk of the House of Representatives as required by the Lobbying Disclosure Act. The Lobbying Disclosure Act requires initial registration and periodic reports relative to an organization's Federal lobbying activities and expenditures.
Basel III
In 1988, the Basel Committee on Banking Supervision, which we refer to as the "Basel Committee," developed the Basel Capital Accord, which we refer to as "Basel I," which set out international benchmarks for assessing banks' capital adequacy requirements. In 2005, the Basel Committee issued Basel II, which, among other things, governs the capital treatment of mortgage insurance purchased and held on balance sheet by banks in respect of their origination and securitization activities. In July 2013, the Federal Reserve Board, the Office of the Comptroller of the Currency and the Federal Deposit Insurance Corporation approved publication of the Basel III Rules, which govern almost all U.S. banking organizations regardless of size or business model. The Basel III Rules revise and enhance the Federal banking agencies' general risk-based capital, advanced approaches and leverage rules. The Basel III Rules became effective on January 1, 2014, with a mandatory compliance date of January 1, 2015 for banking organizations other than advanced approaches banking organizations that are not savings and loan holding companies. On January 1, 2014, most banking organizations became required to begin a multi-year transition period to the full implementation of the new capital framework. The effective date and compliance period, and the beginning of the transitional period, was January 1, 2014 for advanced approaches banking organizations that are not savings and loan holding companies.
The Federal banking agencies' proposed rule to implement Basel III in the United States would have made extensive changes to the capital requirements for residential mortgages. In addition, the proposed rule would have eliminated existing capital recognition for certain low down payment mortgages if covered by mortgage insurance. After consideration of extensive comments with regard to the proposed capital rules for residential mortgages, the Federal banking agencies revised the Basel III Rules to retain the treatment for residential mortgage exposures under the general risk-based capital rules and the treatment of mortgage insurance. Consistent with such rules, the Basel III Rules assign a 50% or 100% risk weight to loans secured by one-to-four-family residential properties. Generally, residential mortgage exposures secured by a first lien on a one-to-four family residential property that are prudently underwritten and that are performing according to their original terms receive a 50% risk
23
weighting. All other one-to-four family residential mortgage loans are assigned a 100% risk weight. The Basel III Rules continue to afford FHA-insured loans a lower risk weighting than low down payment loans insured with private mortgage insurance, and Ginnie Mae mortgage-backed securities are afforded a lower risk weighting than Fannie Mae and Freddie Mac mortgage-backed securities.
If implementation of the Basel III Rules increases the capital requirements of banking organizations with respect to the residential mortgages we insure, it could adversely affect the size of the portfolio lending market, which in turn would reduce the demand for our mortgage insurance. If the Federal banking agencies revise the Basel III Rules to reduce or eliminate the capital benefit banks receive from insuring low down payment loans with private mortgage insurance, or if our bank customers believe that such adverse changes may occur at some time in the future, our current and future business may be adversely affected. In addition, with regard to the separate Basel III Rules applicable to general credit risk mitigation for banking exposures, insurance companies engaged predominantly in the business of providing credit protection, such as private mortgage insurance companies, are not eligible guarantors, which could affect our business prospects.
See "Risk Factors—Risks Relating to Our Business—
The implementation of the Basel III Capital Accord, or other changes to our customers' capital requirements, may discourage the use of mortgage insurance
."
Bermuda Insurance Regulation
The Insurance Act 1978 of Bermuda and related regulations, as amended, or the Insurance Act, regulates the insurance business of our Bermuda-based reinsurance subsidiary, Essent Reinsurance Ltd., and provides that no person may carry on any insurance business in or from within Bermuda unless registered as an insurer under the Insurance Act by the Bermuda Monetary Authority, or the BMA. In deciding whether to grant registration, the BMA has broad discretion to act as it thinks fit in the public interest. The BMA is required by the Insurance Act to determine whether the applicant is a fit and proper body to be engaged in the insurance business and, in particular, whether it has, or has available to it, adequate knowledge and expertise to operate an insurance business. In addition, the BMA is required by the Insurance Act to determine whether a person who proposes to control 10%, 20%, 33% or 50% (as applicable) of the voting powers of a Bermuda-registered insurer or its parent company is a fit and proper person to exercise such degree of control.
The continued registration of an applicant as an insurer is subject to the applicant complying with the terms of its registration and such other conditions as the BMA may impose from time to time. The Insurance Act also grants to the BMA powers to supervise, investigate and intervene in the affairs of insurance companies.
The Insurance Act imposes on Bermuda insurance companies solvency and liquidity standards as well as auditing and reporting requirements. Certain significant aspects of the Bermuda insurance regulatory framework are set forth below.
Classification of Insurers
The Insurance Act distinguishes between insurers carrying on long-term business, insurers carrying on special purpose business and insurers carrying on general business. There are six classifications of insurers carrying on general business (Classes 1, 2, 3, 3A, 3B, and 4) with Class 1 insurers subject to the lightest regulation and Class 4 insurers subject to the strictest regulation.
Essent Reinsurance Ltd., which is incorporated in Bermuda to carry on general insurance and reinsurance business, is registered as a Class 3A insurer in Bermuda and is regulated as such under the Insurance Act. We are not, however, licensed in Bermuda to carry on long-term business. Long-term business broadly includes life insurance and disability insurance with terms in excess of five years. General business broadly includes all types of insurance that is not long-term business.
Cancellation of Insurer's Registration
An insurer's registration may be cancelled by the BMA on certain grounds specified in the Insurance Act. Failure of the insurer to comply with its obligations under the Insurance Act, or if the BMA believes that the insurer has not been carrying on business in accordance with sound insurance principles, would be such grounds.
Principal Representative
An insurer is required to maintain a principal office in Bermuda and to appoint and maintain a principal representative in Bermuda. For the purpose of the Insurance Act, Essent Reinsurance Ltd.'s principal representative is Artex Risk Solutions and its principal office for these purposes is the offices of Artex. Without a reason acceptable to the BMA, an insurer may not
24
terminate the appointment of its principal representative, and the principal representative may not cease to act as such, unless 30 days' notice in writing to the BMA is given of the intention to do so. It is the duty of the principal representative to forthwith notify the BMA where the principal representative believes there is a likelihood of the insurer (for which the principal representative acts) becoming insolvent or that a reportable "event" has, to the principal representative's knowledge, occurred or is believed to have occurred. Examples of such a reportable "event" include failure by the insurer to comply substantially with a condition imposed upon the insurer by the BMA relating to a solvency margin or a liquidity or other ratio. Within 14 days of such notification to the BMA, the principal representative must furnish the BMA with a written report setting out all the particulars of the case that are available to the principal representative.
Independent Approved Auditor
A Class 3A insurer must appoint an independent auditor who will annually audit and report on the insurer's financial statements prepared under generally accepted accounting principles or international financial reporting standards, statutory financial statements and statutory financial returns each of which are required to be filed annually with the BMA. The auditor must be approved by the BMA as the independent auditor of the insurer. If the insurer fails to appoint an approved auditor or at any time fails to fill a vacancy for such auditor, the BMA may appoint an approved auditor for the insurer and shall fix the remuneration to be paid to the approved auditor within 14 days, if not agreed sooner by the insurer and the auditor.
Loss Reserve Specialist
A Class 3A insurer is required to submit an opinion of its approved loss reserve specialist with its statutory financial return in respect of its losses and loss expenses provisions. The loss reserve specialist will normally be a qualified casualty actuary and must be approved by the BMA.
Annual Financial Statements
A Class 3A insurer is required to prepare annual GAAP financial statements and statutory financial statements. The Insurance Act prescribes rules for the preparation and substance of statutory financial statements (which include, in statutory form, a balance sheet, income statement, a statement of capital and surplus, and notes thereto). The statutory financial statements include detailed information and analysis regarding premiums, claims, reinsurance and investments of the insurer. An insurer is required to file with the BMA the annual GAAP financial statements and statutory financial statements within four months from the end of the relevant financial year (unless specifically extended). The statutory financial statements do not form part of the public records maintained by the BMA but the GAAP financial statements are available for public inspection.
Annual Statutory Financial Return
An insurer is required to file with the BMA a statutory financial return no later than four months after its financial year end (unless specifically extended). The statutory financial return includes, among other matters, a report of the approved independent auditor on the statutory financial statements of the insurer, a general business solvency certificate, the statutory financial statements themselves and the opinion of the loss reserve specialist. The principal representative and at least two directors of the insurer must sign the solvency certificate. The directors are required to certify whether the minimum solvency margin has been met, and the independent approved auditor is required to state whether in its opinion it was reasonable for the directors to so certify. Where an insurer's accounts have been audited for any purpose other than compliance with the Insurance Act, a statement to that effect must be filed with the statutory financial return. The statutory financial return is not available for public inspection.
Minimum Solvency Margin, Enhanced Capital Requirement and Restrictions on Dividends and Distributions
A Class 3A insurer must maintain at all times a solvency margin and an enhanced capital requirement in accordance with the provisions of the Insurance Act. Each year the insurer is required to file with the BMA a capital and solvency return within four months of its relevant financial year end (unless specifically extended). The prescribed form of capital and solvency return comprises the insurer's Bermuda Solvency Capital Requirement model, a schedule of fixed income investments by rating categories, a schedule of net loss and loss expense provisions by line of business, a schedule of premiums written by line of business, a schedule of risk management and a schedule of fixed income securities.
The Insurance Act mandates certain actions and filings with the BMA if a Class 3A insurer fails to meet and/or maintain its enhanced capital requirement or solvency margin including the filing of a written report detailing the circumstances giving rise to the failure and the manner and time within which the insurer intends to rectify the failure. A Class 3A insurer is prohibited from declaring or paying a dividend if in breach of its enhanced capital requirement, solvency margin or minimum
25
liquidity ratio or if the declaration or payment of such dividend would cause such a breach. Where an insurer fails to meet its solvency margin or minimum liquidity ratio on the last day of any financial year, it is prohibited from declaring or paying any dividends during the next financial year without the approval of the BMA. Class 3A insurers must obtain the BMA's prior approval for a reduction by 15% or more of the total statutory capital as set forth in its previous year's financial statements. These restrictions on declaring or paying dividends and distributions under the Insurance Act are in addition to those under the Companies Act which apply to all Bermuda companies.
Minimum Liquidity Ratio
The Insurance Act provides a minimum liquidity ratio for general business. An insurer engaged in general business is required to maintain the value of its relevant assets at not less than 75% of the amount of its relevant liabilities. Relevant assets include cash and time deposits, quoted investments, unquoted bonds and debentures, first liens on real estate, investment income due and accrued, accounts and premiums receivable and reinsurance balances receivable.
There are certain categories of assets which, unless specifically permitted by the BMA, do not automatically qualify as relevant assets, such as unquoted equity securities, investments in and advances to affiliates and real estate and collateral loans.
The relevant liabilities are total general business insurance reserves and total other liabilities less deferred income tax and sundry liabilities (by interpretation, those not specifically defined).
Supervision, Investigation and Intervention
The BMA may appoint an inspector with powers to investigate the affairs of an insurer if the BMA believes that an investigation is required in the interests of the insurer's policyholders or potential policyholders. In order to verify or supplement information otherwise provided to the inspector, the BMA may direct an insurer to produce documents or information relating to matters connected with its business.
An inspector may examine on oath any past or present officer, employee or insurance manager of the insurer under investigation in relation to its business and apply to the court in Bermuda for an order that other persons may also be examined on any matter relevant to the investigation. It shall be the duty of any insurer in relation to whose affairs an inspector has been appointed and of any past or present officer, employee or insurance manager of such insurer, to produce to the inspector on request all books, records and documents relating to the insurer under investigation which are in its or his custody or control and otherwise to give to the inspector all assistance in connection with the investigation which it or he is reasonably able to give.
If it appears to the BMA that there is a risk of an insurer becoming insolvent, or that it is in breach of the Insurance Act or any conditions imposed upon its registration, the BMA may, among other things, direct the insurer (1) not to take on any new insurance business, (2) not to vary any insurance contract if the effect would be to increase its liabilities, (3) not to make certain investments, (4) to realize certain investments, (5) to maintain or transfer to the custody of a specified bank, certain assets, (6) not to declare or pay any dividends or other distributions or to restrict the making of such payments, (7) to limit its premium income, (8) not to enter into any specified transaction with any specified persons or persons of a specified class, (9) to provide such written particulars relating to the financial circumstances of the insurer as the BMA thinks fit, (10) to obtain the opinion of a loss reserve specialist and to submit it to the BMA and (11) to remove a controller or officer.
Disclosure of Information
In addition to powers under the Insurance Act to investigate the affairs of an insurer, the BMA may require certain information from an insurer (or certain other persons) to be produced to the BMA. Further, the BMA has been given powers to assist other regulatory authorities, including foreign insurance regulatory authorities, with their investigations involving insurance and reinsurance companies in Bermuda but subject to restrictions. For example, the BMA must be satisfied that the assistance being requested is in connection with the discharge of regulatory responsibilities of the foreign regulatory authority. Further, the BMA must consider whether cooperation is in the public interest. The grounds for disclosure are limited and the Insurance Act provides for sanctions for breach of the statutory duty of confidentiality.
Employees
As of December 31,
2017
, we had
397
employees, including
392
employees based in the United States and
5
employees in Bermuda. None of our employees are represented by a labor union and we consider our employee relations to be good. We also periodically engage contractors who provide services to us on a temporary basis.
26
Corporate Structure
Essent Group Ltd. was organized as a limited liability company under the laws of Bermuda on July 1, 2008. Our registered office is located at Clarendon House, 2 Church Street, Hamilton HM11, Bermuda and our telephone number is (441) 297-9901. Our corporate website address is www.essentgroup.com. The information contained on, or accessible through, our corporate website does not constitute part of this Annual Report.
Our primary mortgage insurance operations are conducted through Essent Guaranty, Inc., a Pennsylvania-domiciled insurer which is a monoline insurance company licensed in all 50 states and the District of Columbia. We also have a wholly-owned Bermuda-domiciled reinsurer, Essent Reinsurance Ltd., which has a Class 3A insurance license issued by the Bermuda Monetary Authority.
Available Information
We file annual reports on Form 10-K, quarterly reports on Form 10-Q and current reports on Form 8-K and other information with the SEC. Members of the public may read and copy materials that we file with the SEC at the SEC's Public Reference Room at 100 F Street, N.E., Washington, D.C. 20549. Members of the public may also obtain information on the Public Reference Room by calling the SEC at 1-800-732-0330. The SEC also maintains an Internet web site that contains reports, proxy and information statements and other information regarding issuers, including us, that file electronically with the SEC. The address of that site is http://www.sec.gov. Our annual reports on Form 10-K, quarterly reports on Form 10-Q and current reports on Form 8-K and other information filed by us with the SEC are available, without charge, on our Internet web site, http://www.essentgroup.com, as soon as reasonably practicable after they are filed electronically with the SEC. Copies are also available, without charge, by writing to Secretary, Essent Group Ltd., Clarendon House, 2 Church Street, Hamilton HM11, Bermuda. The information on our website is not a part of this Annual Report on Form 10-K.
27
Our current business and future results may be affected by a number of risks and uncertainties, including those described below. The risks and uncertainties described below are not the only risks and uncertainties we face. Additional risks and uncertainties not currently known to us or that we currently deem immaterial also may impair our business operations. If any of the following risks actually occur, our business, results of operations and financial condition could suffer. The risks discussed below also include forward-looking statements and our actual results may differ substantially from those discussed in these forward-looking statements.
Risks Relating to Our Business
Legislative or regulatory actions or decisions to change the role of the GSEs in the U.S. housing market generally, or changes to the charters of the GSEs with regard to the use of credit enhancements generally and private mortgage insurance specifically, could reduce our revenues or adversely affect our profitability and returns.
Since 2008, the Federal government has assumed an expanded role in many key aspects of the U.S. housing finance system. In particular, the Department of the Treasury and the FHFA placed the GSEs into conservatorship in September 2008, putting regulatory and operational control of the GSEs under the auspices of the FHFA. Although we believe the FHFA's conservatorship was intended to be temporary, the GSEs have remained in conservatorship for over nine years. During that time, there have been a wide-ranging set of GSE and secondary market reform advocacy proposals put forward, including nearly complete privatization of the mortgage market and elimination of the role of the GSEs, recapitalization of the GSEs and a set of alternatives that would combine a Federal role with private capital, some of which eliminate the GSEs and others which envision an ongoing role for the GSEs. Since 2011, a number of comprehensive GSE/secondary market legislative reform bills have also been introduced or announced, differing widely with regard to the future role of the GSEs, the overall structure of the secondary market and the role of the Federal government within the mortgage market. As a result of the uncertainty regarding resolution of the conservatorship of the GSEs and the proper structure of any new secondary mortgage market, as well as the Federal government's increased role within the housing market since the start of the recent financial crisis, we cannot predict how or when the role of the GSEs may change. In addition, the size, complexity and centrality of the GSEs to the current housing finance system and the importance of housing to the nation's economy make the transition to any new housing finance system difficult and present risks to market participants, including to us.
The charters of the GSEs currently require certain credit enhancement for low down payment mortgage loans in order for such loans to be eligible for purchase or guarantee by the GSEs, and lenders historically have relied on mortgage insurance to a significant degree in order to satisfy these credit enhancement requirements. Because the overwhelming majority of our current and expected future business is the provision of mortgage insurance on loans sold to the GSEs, if the charters of the GSEs are amended to change or eliminate the acceptability of private mortgage insurance in their purchasing practices, then our volume of new business and our revenue may decline significantly.
Changes to the statutory requirements of the FHFA's conservatorship of the GSEs, the elimination of the GSEs or the replacement of the GSEs with any successor entities or structures, or changes to the GSE charters would require Federal legislative action, which makes predicting the timing or substance of such changes difficult. As a result, it is uncertain what role the GSEs, the FHFA, the government and private capital, including private mortgage insurance, will play in the U.S. housing finance system in the future or the impact and timing of any such changes on the market and our business.
Changes in the business practices of the GSEs, including actions or decisions to decrease or discontinue the use of mortgage insurance or changes in the GSEs' eligibility requirements for mortgage insurers, could reduce our revenues or adversely affect our profitability and returns.
Changes in the business practices of the GSEs, which can be implemented by the GSEs at the FHFA's direction, could negatively impact our operating results and financial performance, including changes to:
|
•
|
the level of coverage when private mortgage insurance is used to satisfy the GSEs' charter requirements on low down payment mortgages;
|
|
•
|
the overall level of guaranty fees or the amount of loan level delivery fees that the GSEs assess on loans that require mortgage insurance;
|
|
•
|
the GSEs' influence in the mortgage lender's selection of the mortgage insurer providing coverage and, if so, any transactions that are related to that selection;
|
28
|
•
|
the underwriting standards that determine what loans are eligible for purchase by the GSEs, which can affect the volume and quality of the risk insured by the mortgage insurer;
|
|
•
|
the terms on which mortgage insurance coverage can be cancelled before reaching the cancellation thresholds established by law;
|
|
•
|
programs established by the GSEs intended to avoid or mitigate loss on insured mortgages and the circumstances in which mortgage servicers must implement such programs;
|
|
•
|
the extent to which the GSEs establish requirements for mortgage insurers' rescission practices or rescission settlement practices with lenders;
|
|
•
|
the size of loans that are eligible for purchase or guaranty by the GSEs, which if reduced or otherwise limited may reduce the overall level of business and the number of low down payment loans with mortgage insurance that the GSEs purchase or guaranty; and
|
|
•
|
requirements for a mortgage insurer to become and remain an approved eligible insurer for the GSEs, including, among other items, minimum capital adequacy targets and the terms that the GSEs require to be included in mortgage insurance master policies for loans that they purchase or guaranty.
|
Effective for insurance applications received after October 1, 2014, the GSEs, in coordination with the FHFA, instituted minimum standards for mortgage insurer master policies, including standards relating to rescission rights. The GSEs have published revised rules for rescission relief with an implementation schedule extending through 2018. As a result of these revised standards, we, along with the other private mortgage insurers, will be required to make additional changes to our master policy, some of which may not be favorable to us and which could result in us paying more claims than required under our prior master policy or could otherwise increase our operating costs. The imposition of standardized master policies may also make it more difficult for us to distinguish ourselves from our competitors on the basis of coverage terms. See "Business—Our Products and Services—Mortgage Insurance—Master Policy" above.
Effective December 31, 2015, Fannie Mae and Freddie Mac, at the direction of the FHFA, implemented new coordinated Private Mortgage Insurer Eligibility Requirements, which we refer to as the "PMIERs." The PMIERs represent the standards by which private mortgage insurers are eligible to provide mortgage insurance on loans owned or guaranteed by Fannie Mae and Freddie Mac. The PMIERs include financial strength requirements incorporating a risk-based framework that require approved insurers to have a sufficient level of liquid assets from which to pay claims. The PMIERs also include enhanced operational performance expectations and define remedial actions that apply should an approved insurer fail to comply with these requirements. Based on a confidential draft proposal that we received from the GSEs, we believe that updated PMIERs may be finalized in the first half of 2018 and become effective no sooner than the second half of 2018, 180 days after their release. These eligibility requirements could negatively impact our ability to write mortgage insurance at our current levels, generate the returns we anticipate from our business or otherwise participate in the private mortgage insurance market at all. See "Business—Regulation—Direct U.S. Regulation—GSE Qualified Mortgage Insurer Requirements" above.
Intense competition within the private mortgage insurance industry could result in the loss of customers, lower premiums, wider credit guidelines and other changes which could lower our revenues or raise our costs.
The private mortgage insurance industry is intensely competitive, with six private mortgage insurers currently approved and eligible to write business for the GSEs. We compete with other private mortgage insurers on the basis of pricing, terms and conditions, underwriting guidelines, loss mitigation practices, financial strength, reputation, customer relationships, service and other factors. One or more private mortgage insurers may seek increased market share from government-supported insurance programs, such as those sponsored by the FHA, or from other private mortgage insurers by reducing pricing, loosening their underwriting guidelines or relaxing their risk management practices, which could, in turn, improve their competitive position in the industry and negatively impact our level of NIW. A decline in industry NIW might result in increased competition as certain private mortgage insurance companies may seek to maintain their NIW levels within a smaller market. In addition, the perceived increase in the credit quality of loans that currently are being insured, the relative financial strength of the existing mortgage insurance companies and the possibility of the private mortgage insurance market acquiring a greater share of the overall mortgage insurance market may encourage new entrants into the private mortgage insurance industry, which could further increase competition in our business.
29
We believe that our financial strength has been a reason that some customers have done business with us. However, this competitive advantage may be mitigated if our competitors continue to improve their capital positions, profitability and financial strength ratings, or if we incur losses which weaken our financial position. Our customers may choose to diversify the mortgage insurers with which they do business due to weakness in our relative financial strength or other reasons, which could negatively affect our level of NIW and our market share.
Our revenues, profitability and returns would decline if we lose a significant customer.
Our mortgage insurance business depends on our relationships with our customers, and in particular, our relationships with our largest lending customers. Our top ten customers generated
45.8%
of our new insurance written, or NIW, during year ended December 31,
2017
, compared to
35.1%
and
36.6%
for the years ended December 31,
2016
and
2015
, respectively. For the year ended December 31,
2017
,
no
customer represented more than 10% of our consolidated revenues. Maintaining our business relationships and business volumes with our largest lending customers remains critical to the success of our business.
Our master policies do not, and by law cannot, require our customers to do business with us. Under the terms of our master policy, our customers, or the parties they designate to service the loans we insure, have the unilateral right to cancel our insurance coverage at any time for any loan that we insure. Upon cancellation of coverage, subject to the type of coverage, we may be required to refund unearned premiums, if any.
In addition, the economic downturn and challenging market conditions of the recent past adversely affected the financial condition of a number of our largest customers. If the U.S. economy enters into another recessionary period, these customers could again become subject to serious financial constraints that may jeopardize the viability of their business plans or their access to additional capital, forcing them to consider alternatives such as bankruptcy or consolidation with others in the industry. Other factors, such as rising interest rates, which could reduce mortgage origination volumes generally, rising costs associated with regulatory compliance and the relative cost of capital, may also result in consolidation among our customers. In the event our customers consolidate, they may revisit their relationships with individual mortgage insurers, such as us, which could result in a loss of customers or a reduction in our business. The loss of business from a significant customer could have a material adverse effect on the amount of new business we are able to write, and consequently, our revenue, and we can provide no assurance that any loss of business from a significant customer would be replaced from other new or existing lending customers.
The amount of insurance we may be able to write could be adversely affected if lenders and investors select alternatives to private mortgage insurance.
We compete for business with alternatives to private mortgage insurance, consisting primarily of government-supported mortgage insurance programs as well as home purchase or refinancing alternatives that do not use any form of mortgage insurance.
Government-supported mortgage insurance programs include, but are not limited to:
|
•
|
Federal mortgage insurance programs, including those offered by the FHA and VA; and
|
|
•
|
state-supported mortgage insurance funds, including, but not limited to, those funds supported by the states of California and New York.
|
Alternatives to mortgage insurance include, but are not limited to:
|
•
|
lenders and other investors holding mortgages in their portfolios and self-insuring;
|
|
•
|
investors using other risk mitigation techniques in conjunction with reduced levels of private mortgage insurance coverage, or accepting credit risk without credit enhancement;
|
|
•
|
mortgage sellers retaining at least a 10% participation in a loan or mortgage sellers agreeing to repurchase or replace a loan upon an event of default; and
|
|
•
|
lenders originating mortgages using "piggyback structures" which avoid private mortgage insurance, such as a first mortgage with an 80% loan-to-value ratio and a second mortgage with a 10%, 15% or 20% loan-to-value ratio (referred to as 80-10-10, 80-15-5 or 80-20 loans, respectively) rather than a first mortgage with a 90%, 95% or 100% loan-to-value ratio that has private mortgage insurance.
|
30
Any of these alternatives to private mortgage insurance could reduce or eliminate the demand for our product, cause us to lose business or limit our ability to attract the business that we would prefer to insure. In particular, there has been substantial competition from government-sponsored mortgage insurance programs in the wake of the recent financial crisis. Government-supported mortgage insurance programs are not subject to the same capital requirements, risk tolerance or business objectives that we and other private mortgage insurance companies are, and therefore, generally have greater financial flexibility in setting their pricing, guidelines and capacity, which could put us at a competitive disadvantage. In addition, loans insured under FHA and other Federal government-supported mortgage insurance programs are eligible for securitization in Ginnie Mae securities, which may be viewed by investors as more desirable than Fannie Mae and Freddie Mac securities due to the explicit backing of Ginnie Mae securities by the full faith and credit of the U.S. Federal government.
Consequently, if the FHA or other government-supported mortgage insurance programs maintain or increase their share of the mortgage insurance market, our business and industry could be affected. Factors that could cause the FHA or other government-supported mortgage insurance programs to maintain or increase their share of the mortgage insurance market include:
|
•
|
a reduction in the premiums charged for government mortgage insurance or a loosening of underwriting guidelines;
|
|
•
|
past and potential future capital constraints in the private mortgage insurance industry;
|
|
•
|
increases in premium rates or tightening of underwriting guidelines by private mortgage insurers based on past loan performance or other risk concerns;
|
|
•
|
increased levels of loss mitigation activity by private mortgage insurers on older vintage portfolios when compared to the more limited loss mitigation activities of government insurance programs;
|
|
•
|
imposition of additional loan level delivery fees by the GSEs on loans that require mortgage insurance;
|
|
•
|
increases in GSE guaranty fees and the difference in the spread between Fannie Mae mortgage-backed securities and Ginnie Mae mortgage-backed securities;
|
|
•
|
the perceived operational ease of using government insurance compared to the products of private mortgage insurers;
|
|
•
|
differences in the enforcement of program requirements by the FHA relative to the enforcement of policy terms by private entities;
|
|
•
|
the implementation of new or the amendment of current regulations under the Dodd-Frank Act (particularly with respect to the Qualified Mortgage and Qualified Residential Mortgage rules) and the Basel III Rules, which may be more favorable to the FHA than to private mortgage insurers (see "
—Our business prospects and operating results could be adversely impacted if, and to the extent that, the Consumer Financial Protection Bureau's ("CFPB") final rule defining a qualified mortgage ("QM") reduces the size of the origination market or creates incentives to use government mortgage insurance programs
", "—
The amount of insurance we write could be adversely affected by the implementation of the Dodd-Frank Act's risk retention requirements and the definition of Qualified Residential Mortgage ("QRM")
" and "—
The implementation of the Basel III Capital Accord, or other changes to our customers' capital requirements, may discourage the use of mortgage insurance
"); and
|
|
•
|
increases in FHA loan limits above GSE loan limits.
|
Further, at the direction of the FHFA, the GSEs have significantly expanded their credit risk sharing programs. These programs have included the use of structured finance vehicles and off-shore reinsurance. The growing success of these programs and the perception that some of these risk-sharing structures have beneficial features in comparison to private mortgage insurance (e.g. lower costs, reduced counterparty risk due to collateral on hand or more diversified insurance exposures) may create increased competition for mortgage insurance going forward on loans traditionally sold to the GSEs with private mortgage insurance. The GSEs have also shown an interest in directly placing mortgage insurance rather than having lenders place the mortgage insurance as part of their expanded risk sharing programs. No assurances can be given that these practices may not expand to loans traditionally insured by lenders with private mortgage insurance prior to sale to the GSEs, which could impact our business.
31
In addition, in the event that a government-supported mortgage insurance program in one of our markets reduces prices significantly or alters the terms and conditions of its mortgage insurance or other credit enhancement products in furtherance of political, social or other goals rather than a profit motive, we may be unable to compete in that market effectively, which could have an adverse effect on our business, financial condition and operating results.
If the volume of low down payment home mortgage originations declines, the amount of insurance that we write could decline, which would reduce our revenues.
Our ability to write new business depends, among other things, on the origination volume of low down payment mortgages that require mortgage insurance. Factors that affect the volume of low down payment mortgage originations include:
|
•
|
the level of home mortgage interest rates and the deductibility of mortgage interest and mortgage insurance for income tax purposes;
|
|
•
|
the health of the domestic economy as well as conditions in regional and local economies;
|
|
•
|
housing affordability;
|
|
•
|
population trends, including the rate of household formation;
|
|
•
|
the rate of home price appreciation, which in times of significant refinancing can affect whether refinance loans have loan-to-value ratios that require private mortgage insurance;
|
|
•
|
government housing policies encouraging loans to borrowers that may need low down payment financing, such as first-time homebuyers;
|
|
•
|
the extent to which the guaranty fees, loan-level price adjustments, credit underwriting guidelines and other business terms provided by the GSEs affect lenders' willingness to extend credit for low down payment mortgages;
|
|
•
|
requirements for ability-to-pay determinations prior to extending credit as discussed below;
|
|
•
|
restrictions on mortgage credit due to more stringent underwriting standards and the risk retention requirements for securitized mortgage loans affecting lenders as discussed below; and
|
|
•
|
changes in the credit standards, premiums or other terms of obtaining FHA, VA or USDA insurance, which competes directly with private mortgage insurance.
|
If the volume of low down payment loan originations declines, then our ability to write new policies may suffer, and our revenue and results of operations may be negatively impacted.
We expect our claims to increase as our portfolio matures.
We believe, based upon our experience and industry data, that claims incidence for mortgage insurance is generally highest in the third through sixth years after loan origination. Although the claims experience on new insurance written by us since we began to write coverage in 2010 has been favorable to date, we expect incurred losses and claims to increase as a greater amount of this book of insurance reaches its anticipated period of highest claim frequency. The actual default rate and the average reserve per default that we experience as our portfolio matures is difficult to predict and is dependent on the specific characteristics of our current in-force book (including the credit score of the borrower, the loan-to-value ratio of the mortgage, geographic concentrations, etc.), as well as the profile of new business we write in the future. In addition, the default rate and the average reserve per default will be affected by future macroeconomic factors such as housing prices, interest rates and employment. Incurred losses and claims could be further increased in the future in the event of general economic weakness or decreases in housing values. An increase in the number or size of claims, compared to what we anticipate, could adversely affect our results of operations or financial conditions.
Because we establish loss reserves only upon a loan default rather than based on estimates of our ultimate losses on risk in force, losses may have a disproportionate adverse effect on our earnings in certain periods.
In accordance with industry practice and statutory accounting rules applicable to mortgage guaranty insurance companies, we establish loss reserves only for loans in default. Reserves are established for reported insurance losses and loss
32
adjustment expenses based on when notices of default on insured mortgage loans are received. Reserves are also established for estimated losses incurred in connection with defaults that have not yet been reported. We establish reserves using estimated claim rates and claim amounts in estimating the ultimate loss. Because our reserving method does not account for the impact of future losses that could occur from loans that are not yet delinquent, our obligation for ultimate losses that we expect to occur under our policies in force at any period end is not reflected in our financial statements, except in the case where a premium deficiency exists. As a result, future losses may have a material impact on future results as defaults occur.
A downturn in the U.S. economy, a decline in the value of borrowers' homes from their value at the time their loans close and natural disasters, acts of terrorism or other catastrophic events may result in more homeowners defaulting and could increase our losses.
Losses result from events that reduce a borrower's ability to continue to make mortgage payments, such as increasing unemployment and whether the home of a borrower who defaults on his or her mortgage can be sold for an amount that will cover unpaid principal and interest and the expenses of the sale. In general, favorable economic conditions reduce the likelihood that borrowers will lack sufficient income to pay their mortgages and also favorably affect the value of homes, thereby reducing and in some cases even eliminating a loss from a mortgage default. Deterioration in economic conditions generally increases the likelihood that borrowers will not have sufficient income to pay their mortgages and can also adversely affect housing values, which in turn can decrease the willingness of borrowers with sufficient resources to make mortgage payments when the mortgage balance exceeds the value of the home. Housing values may decline even absent deterioration in economic conditions due to declines in demand for homes, which may result from changes in buyers' perceptions of the potential for future appreciation, restrictions on mortgage credit due to more stringent underwriting standards, liquidity issues affecting lenders or other factors, such as the phase-out of the mortgage interest deduction, reductions or elimination in the deductibility of mortgage insurance premiums or changes in the tax treatment of residential property. The residential mortgage market in the United States has for some time experienced a variety of worsening economic conditions and housing values that have recently begun to stabilize but may not continue to do so. If our loss projections are inaccurate, our loss payments could materially exceed our expectations resulting in an adverse effect on our financial position and operating results. If economic conditions, such as employment and home prices, are less favorable than we expect, our premiums and underwriting standards may prove inadequate to shield us from a material increase in losses. In addition, natural disasters, such as hurricanes and floods, and acts of terrorism or other catastrophic events could result in increased claims against policies that we have written due to the impact that such events may have on the employment and income of borrowers and the value of affected homes, resulting in defaults on and claims under our policies. We cannot assure you that any strategies we may employ to mitigate the impact on us of such events, including limitations under our master policy on the payment of claims in certain circumstances where a property is damaged, the dispersal of our risk by geography and the potential use of third-party reinsurance structures, will be successful.
Our business prospects and operating results could be adversely impacted if, and to the extent that, the Consumer Financial Protection Bureau's ("CFPB") final rule defining a qualified mortgage ("QM") reduces the size of the origination market or creates incentives to use government mortgage insurance programs.
The Dodd-Frank Act established the CFPB to regulate the offering and provision of consumer financial products and services under Federal law, including residential mortgages, and generally requires creditors to make a reasonable, good faith determination of a consumer's ability-to-repay any consumer credit transaction secured by a dwelling prior to effecting such transaction. The CFPB is authorized to issue the regulations governing a good faith determination; Dodd-Frank, however, provides a statutory presumption of eligibility of loans that satisfy the QM definition. The CFPB's final rule defining what constitutes a QM, which we refer to as the "QM Rule", a loan is deemed to be a QM if, among other factors:
|
•
|
the term of the loan is less than or equal to 30 years;
|
|
•
|
there are no negative amortization, interest only or balloon features;
|
|
•
|
the lender properly documents the loan in accordance with the requirements;
|
|
•
|
the total "points and fees" do not exceed certain thresholds, generally 3% of the total loan amount; and
|
|
•
|
the total debt-to-income ratio of the borrower does not exceed 43%.
|
The QM Rule provides a "safe harbor" for QM loans with annual percentage rates, or APRs, below the threshold of 150 basis points over the Average Prime Offer Rate, or APOR, and a "rebuttable presumption" for QM loans with an APR above that threshold.
33
The Dodd-Frank Act separately granted statutory authority to HUD (for FHA-insured loans), the VA (for VA-guaranteed loans) and certain other government agency insurance programs to develop their own definitions of a qualified mortgage in consultation with CFPB. Under both the FHA's and the VA's QM standards, certain loans which would not qualify as QM loans in the conventional market would still be deemed to be QM loans if insured or guaranteed by FHA or VA. As a result, lenders may favor the use of FHA or VA insurance to achieve the legal protections of a making a QM loan through these agencies, even if the same loan could be made at the same or lower cost to the borrower using private mortgage insurance, which could adversely impact our business. To the extent that the other government agencies adopt their own definitions of a QM which are more favorable to lenders and mortgage holders than those applicable to the market in which we operate, our business may be adversely affected.
The QM Rule also provides for a second temporary category with more flexible requirements if the loan is eligible to be (i) purchased or guaranteed by the GSEs while they are in conservatorship, which represents the overwhelming majority of our business, or (ii) insured by the FHA, the VA, the Department of Agriculture or the Rural Housing Service. The second temporary category still requires that loans satisfy certain criteria, including the requirement that the loans are fully amortizing, have terms of 30 years or less and have points and fees representing 3% or less of the total loan amount. This temporary QM category expires on January 10, 2021, or earlier if the Federal agencies issue their own qualified mortgage rules or, with respect to GSEs, if the FHFA's conservatorship ends.
Failure to comply with the ability-to-repay requirement exposes a lender to substantial potential liability. As a result, we believe that the QM regulations may cause changes in the lending standards and origination practices of our customers. Under the QM Rule, mortgage insurance premiums that are payable by the consumer at or prior to consummation of the loan may be included in the calculation of points and fees, including our borrower-paid single premium products. To the extent the use of private mortgage insurance causes a loan not to meet the definition of a QM, the volume of loans originated with mortgage insurance may decline or cause a change in the mix of premium plans and therefore our profitability.
The amount of insurance we write could be adversely affected by the implementation of the Dodd-Frank Act's risk retention requirements and the definition of Qualified Residential Mortgage ("QRM").
The Dodd-Frank Act requires an originator or issuer to retain a specified percentage of the credit risk exposure on securitized mortgages that do not meet the definition of QRM. As required by the Dodd-Frank Act, the Office of the Comptroller of the Currency, the Federal Reserve Board, the Federal Deposit Insurance Commission, the Federal Housing Finance Agency, the Securities and Exchange Commission and the Department of Housing and Urban Development adopted in 2015 a joint final rule implementing the Qualified Residential Mortgage, or QRM, which aligns the definition of a QRM loan with that of a QM loan. If, however, the QRM definition is changed (or if the QM definition is amended) in a manner that is unfavorable to us, such as to give no consideration to mortgage insurance in computing LTV or to require a large down payment for a loan to qualify as a QRM, the attractiveness of originating and securitizing loans with lower down payments may be reduced, which may adversely affect the future demand for mortgage insurance.
The implementation of the Basel III Capital Accord, or other changes to our customers' capital requirements, may discourage the use of mortgage insurance.
In 1988, the Basel Committee on Banking Supervision, which we refer to as the "Basel Committee," developed the Basel Capital Accord, which we refer to as "Basel I," which set out international benchmarks for assessing banks' capital adequacy requirements. In 2005, the Basel Committee issued an update to Basel I, which we refer to as "Basel II," which, among other things, governs the capital treatment of mortgage insurance purchased and held on balance sheet by banks in respect of their origination and securitization activities. In July 2013, the Federal Reserve Board, the Office of the Comptroller of the Currency and the Federal Deposit Insurance Corporation approved publication of final regulatory capital rules, which we refer to as the "Basel III Rules," which govern almost all U.S. banking organizations regardless of size or business model. The Basel III Rules revise and enhance the Federal banking agencies' general risk-based capital, advanced approaches and leverage rules. The Basel III Rules became effective on January 1, 2014, with a mandatory compliance date of January 1, 2015 for banking organizations other than advanced approaches banking organizations that are not savings and loans holding companies. On January 1, 2014, most banking organizations became required to begin a multi-year transition period to the full implementation of the new capital framework.
The Federal banking agencies' previously proposed Basel III rule would have made extensive changes to the capital requirements for residential mortgages, including eliminating capital recognition for certain low down payment mortgages covered by mortgage insurance. The Federal banking agencies decided to retain in the Basel III Rules the treatment for residential mortgage exposures that is currently set forth in the general risk-based capital rules and the treatment of mortgage
34
insurance. In addition, with regard to the separate Basel III Rules applicable to general credit risk mitigation for banking exposures, insurance companies engaged predominantly in the business of providing credit protection, such as private mortgage insurance companies, are not eligible guarantors.
If implementation of the Basel III Rules increases the capital requirements of banking organizations with respect to the residential mortgages we insure, it could adversely affect the size of the portfolio lending market, which in turn would reduce the demand for our mortgage insurance. If the Federal banking agencies revise the Basel III Rules to reduce or eliminate the capital benefit banks receive from insuring low down payment loans with private mortgage insurance, or if our bank customers believe that such adverse changes may occur at some time in the future, our current and future business may be adversely affected. Furthermore, if mortgage insurance companies do not meet the requirements to be an eligible guarantor for purposes of general credit mitigation, our future business prospects may be adversely affected.
Our success depends, in part, on our ability to manage risks in our investment portfolio.
Our investment portfolio consists predominantly of investment-grade debt obligations. Our investments are subject to fluctuations in value as a result of broad changes in market conditions as well as risks inherent in particular securities. Changing market conditions could materially impact the future valuation of securities in our investment portfolio, which may cause us to impair, in the future, some portion of the value of those securities and which could have a significant adverse effect on our liquidity, financial condition and operating results.
Income from our investment portfolio is a source of cash flow to support our operations and make claim payments. If we, or our investment advisors, improperly structure our investments to meet those future liabilities or we have unexpected losses, including losses resulting from the forced liquidation of investments before their maturity, we may be unable to meet those obligations. Our investments and investment policies are subject to state insurance laws, which results in our portfolio being predominantly limited to highly rated fixed income securities. If interest rates rise above the rates on our fixed income securities, the market value of our investment portfolio would decrease. Any significant decrease in the value of our investment portfolio would adversely impact our financial condition.
In addition, compared to historical averages, interest rates and investment yields on highly rated investments have generally been low during the period in which we purchased the securities in our portfolio, which limits the investment income we can generate. We depend on our investments as a source of revenue, and a prolonged period of low investment yields would have an adverse impact on our revenues and could adversely affect our operating results.
We may be forced to change our investments or investment policies depending upon regulatory, economic and market conditions, and our existing or anticipated financial condition and operating requirements, including the tax position, of our business. Our investment objectives may not be achieved. Although our portfolio consists predominantly of investment-grade fixed income securities and complies with applicable regulatory requirements, the success of our investment activity and the value of our portfolio is affected by general economic conditions, which may adversely affect the markets for credit and interest-rate-sensitive securities, including the extent and timing of investor participation in these markets and the level and volatility of interest rates.
If interest rates decline, house prices appreciate or mortgage insurance cancellation requirements change, the length of time that our policies remain in force could decline and cause a decline in our revenue.
Generally, in each year, most of our premiums are from insurance that has been written in prior years. As a result, the length of time insurance remains in force, which is also generally referred to as persistency, is a significant determinant of our revenues. A lower level of persistency could reduce our future revenues. Our annual persistency rate was
83.9%
,
77.7%
and
80.2%
at December 31,
2017
,
2016
and
2015
, respectively. The factors affecting the persistency of our insurance portfolio include:
|
•
|
the level of current mortgage interest rates compared to the mortgage interest rates on the insurance in force, which affects the incentives of borrowers we have insured to refinance;
|
|
•
|
the amount of equity in a home, as homeowners with more equity in their homes can generally more readily move to a new residence or refinance their existing mortgage;
|
|
•
|
the rate at which homeowners sell their existing homes and move to new locations, generally referred to as housing turnover, with more rapid economic growth and stronger job markets tending to increase housing turnover;
|
35
|
•
|
the mortgage insurance cancellation policies of mortgage investors along with the current values of the homes underlying the mortgages in the insurance in force; and
|
|
•
|
the cancellation of borrower-paid mortgage insurance mandated by law based on the amortization schedule of the loan, which generally occurs sooner the lower the note rate of the insured loan.
|
Mortgage interest rates have remained at near historic lows since the financial crisis, but may rise in response to expected future changes in monetary policy by the Federal Reserve. Some portion of our insured portfolio may still be able to refinance at the current level of mortgage rates, which may reduce our future revenues. If interest rates rise, persistency is likely to increase, which may extend the average life of our insured portfolio and result in higher levels of future claims as more loans remain outstanding.
The premiums we charge may not be adequate to compensate us for our liabilities for losses and, as a result, any inadequacy could materially affect our financial condition and results of operations.
Our mortgage insurance premium rates may not be adequate to cover future losses. We set premiums at the time a policy is issued based on a number of factors, including our expectations regarding likely mortgage performance over the expected life of the coverage as well as competition from other private mortgage insurers, government programs and other products. These expectations may prove to be incorrect. Generally, we cannot cancel mortgage insurance coverage or adjust renewal premiums during the life of a mortgage insurance policy. As a result, higher than anticipated claims generally cannot be offset by premium increases on policies in force or mitigated by our non-renewal or cancellation of insurance coverage. The premiums we charge, and the associated investment income, may not be adequate to compensate us for the risks and costs associated with the insurance coverage provided to customers. Should we wish to increase our premium rates, any such change would be prospectively applied to new policies written, and the changes would be subject to approval by state regulatory agencies, which may delay or limit our ability to increase our premium rates.
Our delegated underwriting program may subject our mortgage insurance business to unanticipated claims.
In our mortgage insurance business, we enter into agreements with our customers that commit us to insure loans made by them using pre-established underwriting guidelines. Once we accept a customer into our delegated underwriting program, we generally insure a loan originated by that customer without re-confirming the customer followed our specified underwriting guidelines. Under this program, a customer could commit us to insure a material number of loans with unacceptable risk profiles before we discover the problem and terminate that customer's delegated underwriting authority or pursue other rights that may be available to us, such as our rights to rescind coverage or deny claims, which rights are limited by the terms of our master policy.
We face risks associated with our contract underwriting business.
We provide contract underwriting services for certain of our customers, including on loans for which we are not providing mortgage insurance. For substantially all of the existing loans that were originated through our contract underwriting services, we have agreed that if we make a material error in providing these services and the error leads to a loss for the customer, the customer may, subject to certain conditions and limitations, claim a remedy. Accordingly, we have assumed some risk in connection with providing these services. We also face regulatory and litigation risk in providing these services.
Because loss reserve estimates are subject to uncertainties and are based on assumptions that may be volatile, ultimate losses may be substantially different than our loss reserves.
We establish reserves using estimated claim rates and claim amounts in estimating the ultimate loss on delinquent loans. The estimated claim rates and claim amounts represent our best estimates of what we will actually pay on the loans in default as of the reserve date. Our master policy provides us the right to rescind or deny claims under certain circumstances. Our reserve calculations do not currently include any estimate for claim rescissions, but we may be required to do so at some later time to ensure that our reserves meet the requirements of accounting principles generally accepted in the United States.
The establishment of loss reserves is subject to inherent uncertainty and requires judgment by management. Our estimates of claim rates and claim sizes will be strongly influenced by prevailing economic conditions, such as current rates or trends in unemployment, housing price appreciation and/or interest rates, and our best judgments as to the future values or trends of these macroeconomic factors. If prevailing economic conditions deteriorate suddenly and/or unexpectedly, our estimates of loss reserves could be materially understated, which may adversely impact our financial condition and operating results. Changes to our estimates could result in a material impact to our results of operations, even in a stable economic
36
environment, and there can be no assurance that actual claims paid by us will not be substantially different than our loss reserves.
A downgrade in our financial strength ratings may adversely affect the amount of business that we write.
Financial strength ratings, which various ratings organizations publish as a measure of an insurance company's ability to meet contractholder and policyholder obligations, are important to maintain confidence in our products and our competitive position. A downgrade in our financial strength ratings, or the announced potential for a downgrade, could have an adverse effect on our financial condition and results of operations in many ways, including: (i) increased scrutiny of us and our financial condition by our customers, potentially resulting in a decrease in the amount of new insurance policies that we write; (ii) requiring us to reduce the premiums that we charge for mortgage insurance in order to remain competitive; and (iii) adversely affecting our ability to obtain reinsurance or to obtain reasonable pricing on reinsurance. A ratings downgrade could also increase our cost of capital and limit our access to the capital markets.
In addition, if the GSEs renew their historical focus on financial strength or other third-party credit ratings as components of their eligibility requirements for private mortgage insurers and do not set such requirements at a level that we can satisfy, or if as a result of a downgrade we would no longer comply with such rating requirements, our revenues and results of operations would be materially adversely affected. See "—
Changes in the business practices of the GSEs, including actions or decisions to decrease or discontinue the use of mortgage insurance or changes in the GSEs' eligibility requirements for mortgage insurers, could reduce our revenues or adversely affect our profitability and returns"
and "Business—Regulation—Direct U.S. Regulation—GSE Qualified Mortgage Insurer Requirements."
We rely on our senior management team and our business could be harmed if we are unable to retain qualified personnel.
Our success depends, in part, on the skills, working relationships and continued services of our senior management team. We have employment agreements with each of our senior executives. The departure of any of our key executives could adversely affect the conduct of our business. In such an event, we would be required to obtain other personnel to manage and operate our business, and there can be no assurance that we would be able to employ a suitable replacement for the departing individual, or that a replacement could be hired on terms that are favorable to us. Volatility or lack of performance in our share price may affect our ability to retain our key personnel or attract replacements should key personnel depart.
If servicers fail to adhere to appropriate servicing standards or experience disruptions to their businesses, our losses could unexpectedly increase.
We depend on reliable, consistent third-party servicing of the loans that we insure. Among other things, our mortgage insurance policies require our policyholders and their servicers to timely submit premium and monthly insurance in force and default reports and utilize commercially reasonable efforts to limit and mitigate loss when a loan is in default. If one or more servicers were to experience adverse effects to its business, such servicers could experience delays in their reporting and premium payment requirements. Without reliable, consistent third-party servicing, our insurance subsidiaries may be unable to correctly record new loans as they are underwritten, receive and process payments on insured loans and/or properly recognize and establish loss reserves on loans when a default exists or occurs but is not reported to us. In addition, if these servicers fail to limit and mitigate losses when appropriate, our losses may unexpectedly increase. Significant failures by large servicers or disruptions in the servicing of mortgage loans covered by our insurance policies would adversely impact our business, financial condition and operating results.
Furthermore, we have delegated to the GSEs, who have in turn delegated to most of their servicers, authority to accept modifications, short sales and deeds-in-lieu of foreclosure on loans we insure. Servicers are required to operate under protocols established by the GSEs in accepting these loss mitigation alternatives. We are dependent upon servicers in making these decisions and mitigating our exposure to losses. In some cases, loss mitigation decisions favorable to the GSEs may not be favorable to us, and may increase the incidence of paid claims. Inappropriate delegation protocols or failure of servicers to service in accordance with the protocols may increase the magnitude of our losses and have an adverse effect on our business, financial condition and operating results. Our delegation of loss mitigation decisions to the GSEs is subject to cancellation but exercise of our cancellation rights may have an adverse impact on our relationship with the GSEs and lenders.
Our information technology systems may become outmoded, be temporarily interrupted or fail thereby causing us to fail to meet our customers' demands.
Our business is highly dependent on the effective operation of our information technology systems, which are vulnerable to damage or interruption from power outages, computer and telecommunications failures, computer viruses, cyber-attacks,
37
security breaches, catastrophic events and errors in usage. Although we have disaster recovery and business continuity plans in place, we may not be able to adequately execute these plans in a timely fashion. Additionally, we may not satisfy our customers' requirements if we fail to invest sufficient resources in, or otherwise are unable to maintain and upgrade our information technology systems. Because we rely on our information technology systems for many critical functions, including connecting with our customers, if such systems were to fail or become outmoded, we may experience a significant disruption in our operations and in the business we receive, which could negatively affect our operating results, financial condition and profitability.
The security of our information technology systems may be compromised and confidential information, including non-public personal information that we maintain, could be improperly disclosed.
Our information technology systems may be vulnerable to physical or electronic intrusions, computer viruses or other attacks. As part of our business, we maintain large amounts of confidential information, including non-public personal information on consumers and our employees. Breaches in security could result in the loss or misuse of this information, which could, in turn, result in potential regulatory actions or litigation, including material claims for damages, interruption to our operations, damage to our reputation or otherwise have a material adverse effect on our business, financial condition and operating results. Although we believe that we have appropriate information security policies and systems in place in order to prevent unauthorized use or disclosure of confidential information, including non-public personal information, there can be no assurance that such use or disclosure will not occur.
Our holding company structure and certain regulatory and other constraints, including adverse business performance, could negatively impact our liquidity and potentially require us to raise more capital.
Essent Group Ltd. serves as the holding company for our insurance and other subsidiaries and does not have any significant operations of its own. As a result, its principal source of funds is income from our investment portfolio, dividends and other distributions from our insurance and other subsidiaries, including permitted payments under our expense-sharing arrangements, and funds that may be raised from time to time in the capital markets. Our dividend income is limited to upstream dividend payments from our insurance and other subsidiaries, which may be restricted by applicable state insurance laws. Under Pennsylvania law, our insurance subsidiaries may pay ordinary dividends without prior approval of the Pennsylvania Insurance Commissioner (the "Commissioner"), but are not permitted to pay extraordinary dividends without the prior approval of the Commissioner. An extraordinary dividend is a dividend or distribution which, together with other dividends and distributions made within the preceding 12 months, exceeds the greater of (i) 10% of our surplus as shown in our last annual statement on file with the Commissioner, or (ii) our net income for the period covered by such statement, but shall not include pro rata distributions of any class of our own securities. Moreover, under Pennsylvania law, dividends and other distributions may only be paid out of unassigned surplus unless approved by the Commissioner. Our primary operating subsidiary, Essent Guaranty, Inc., had unassigned surplus of approximately
$70.7 million
as of
December 31, 2017
. In addition, Essent Guaranty of PA, Inc. had unassigned surplus of approximately
$6.5 million
as of
December 31, 2017
. For further information, see
Note 11
to our consolidated financial statements entitled "
Dividends Restrictions
" included elsewhere in this Annual Report. As a result of these dividend limitations, we likely will not receive dividend income from our subsidiaries for several years and, consequently, Essent Group Ltd. may have limited liquidity and may be required to raise additional capital.
We may need additional capital to fund our operations or expand our business, and if we are unable to obtain sufficient financing or such financing is obtained on adverse terms, we may not be able to operate or expand our business as planned, which could negatively affect our results of operations and future growth.
We may require incremental capital to support our growth and comply with regulatory requirements. To the extent that we require capital in the future, we may need to obtain financing from the capital markets or other third-party sources of financing. Potential investors or lenders may be unable to provide us with financing that is attractive to us. Our access to such financing will depend, in part, on:
|
•
|
general market conditions;
|
|
•
|
the market's perception of our growth potential;
|
|
•
|
our debt levels, if any;
|
|
•
|
our expected results of operations;
|
|
•
|
our cash flow; and
|
38
|
•
|
the market price of our common shares.
|
Our principal capital demands include funds for (i) the expansion of our business, (ii) the payment of certain corporate operating expenses, (iii) capital support for our subsidiaries, and (iv) Federal, state and local taxes. We may need to provide additional capital support to our insurance subsidiaries if required pursuant to insurance laws and regulations or by the GSEs. If we were unable to meet our obligations, our insurance subsidiaries could lose GSE approval or be required to cease writing business in one or more states, which would adversely impact our business, financial condition and operating results.
Our success will depend on our ability to maintain and enhance effective operating procedures and internal controls.
Operational risk and losses can result from, among other things, fraud, errors, failure to document transactions properly or to obtain proper internal authorization, failure to comply with regulatory requirements, information technology failures, failure to appropriately transition new hires or external events. We continue to enhance our operating procedures and internal controls to effectively support our business and our regulatory and reporting requirements. Our management does not expect that our disclosure controls or our internal controls will prevent all potential errors and fraud. A control system, no matter how well conceived and operated, can provide only reasonable, not absolute, assurance that the objectives of the control system are met. Further, the design of a control system must reflect the fact that there are resource constraints, and the benefits of controls must be considered relative to their costs. As a result of the inherent limitations in all control systems, no evaluation of controls can provide absolute assurance that all control issues and instances of fraud, if any, within the company have been detected. These inherent limitations include the realities that judgments in decision making can be faulty, and that breakdowns can occur because of simple error or mistake. Additionally, controls can be circumvented by the individual acts of some persons or by collusion of two or more people. The design of any system of controls also is based in part upon certain assumptions about the likelihood of future events, and there can be no assurance that any design will succeed in achieving its stated goals under all potential future conditions; over time, controls may become inadequate because of changes in conditions, or the degree of compliance with the policies or procedures may deteriorate. As a result of the inherent limitations in a cost-effective control system, misstatement due to error or fraud may occur and not be detected. Accordingly, our disclosure controls and procedures are designed to provide reasonable, not absolute, assurance that the disclosure controls and procedures are met. Any ineffectiveness in our controls or procedures could have a material adverse effect on our business.
We have a risk management framework designed to assess and monitor our risks. However, there can be no assurance that we can effectively review and monitor all risks or that all of our employees will operate within our risk management framework, nor can there can be any assurance that our risk management framework will result in accurately identifying all risks and accurately limiting our exposures based on our assessments. Moreover, risk management is expected to be a new and important focus of regulatory examinations of companies under supervision. There can be no assurance that our risk management framework and documentation will meet the expectations of such regulators.
The mortgage insurance industry is, and as a participant in that industry we are, subject to litigation and regulatory risk generally.
The mortgage insurance industry faces litigation risk in the ordinary course of operations, including the risk of class action lawsuits and administrative enforcement by Federal and state agencies. Litigation relating to capital markets transactions and securities-related matters in general has increased and is expected to continue to increase as a result of the recent financial crisis. Consumers are bringing a growing number of lawsuits against home mortgage lenders and settlement service providers. Mortgage insurers have been involved in class action litigation alleging violations of Section 8 of the Real Estate Settlement Procedures Act of 1974, or RESPA, and the Fair Credit Reporting Act, or FCRA. Section 8 of RESPA generally precludes mortgage insurers from paying referral fees to mortgage lenders for the referral of mortgage insurance business. This limitation also can prohibit providing services or products to mortgage lenders free of charge, charging fees for services that are lower than their reasonable or fair market value and paying fees for services that mortgage lenders provide that are higher than their reasonable or fair market value, in exchange for the referral of mortgage insurance business services. Violations of the referral fee limitations of RESPA may be enforced by the CFPB, HUD, the Department of Justice, state attorneys general and state insurance commissioners, as well as by private litigants in class actions. In the past, a number of lawsuits have challenged the actions of private mortgage insurers under RESPA, alleging that the insurers have violated the referral fee prohibition by entering into captive reinsurance arrangements or providing products or services to mortgage lenders at improperly reduced prices in return for the referral of mortgage insurance, including the provision of contract underwriting services. In addition to these private lawsuits, other private mortgage insurance companies have received civil investigative demands from, and entered into consent orders with, the CFPB as part of its investigation to determine whether mortgage lenders and mortgage insurance providers engaged in acts or practices in connection with their captive mortgage insurance arrangements in violation of RESPA, the Consumer Financial Protection Act and the Dodd-Frank Act. The CFPB’s ruling in its enforcement order against PHH
39
Corporation for alleged RESPA violations stemming from captive mortgage insurance arrangements was overturned on appeal by a panel of the D.C. Circuit Court, a decision affirmed in January 2018 by the full D.C. Circuit Court of Appeals. Although we did not participate in the practices that were the subject of the CFPB consent orders or the PHH case, the private mortgage insurance industry and our insurance subsidiaries are subject to substantial Federal and state regulation. Increased Federal or state regulatory scrutiny could lead to new legal precedents, new regulations or new practices, or regulatory actions or investigations, which could adversely affect our financial condition and operating results.
Our operating insurance and reinsurance subsidiaries are subject to regulation in various jurisdictions, and material changes in the regulation of their operations could adversely affect us.
Our insurance and reinsurance subsidiaries are subject to government regulation in each of the jurisdictions in which they are licensed or authorized to do business. Governmental agencies have broad administrative power to regulate many aspects of the insurance business, which may include trade and claim practices, accounting methods, premium rates, marketing practices, advertising, policy forms, and capital adequacy. These agencies are concerned primarily with the protection of policyholders rather than shareholders. Moreover, insurance laws and regulations, among other things:
|
•
|
establish solvency requirements, including minimum reserves and capital and surplus requirements;
|
|
•
|
limit the amount of dividends, tax distributions, intercompany loans and other payments our insurance subsidiaries can make without prior regulatory approval; and
|
|
•
|
impose restrictions on the amount and type of investments we may hold.
|
The NAIC examines existing state insurance laws and regulations in the United States. During 2012, the NAIC established a Mortgage Guaranty Insurance Working Group, which we refer to as the "MGIWG," to determine and make recommendations to the NAIC's Financial Condition Committee regarding what, if any, changes are deemed necessary to the solvency regulation of mortgage guaranty insurers. The MGIWG has advanced a draft revised Model Act and has engaged with certain industry members developing a risk-sensitive analytical model to assess and establish capital adequacy levels. The NAIC has engaged an independent firm to perform validation exercises on this capital model. The MGIWG is continuing its work in 2018.
If the NAIC were to adopt a revised Mortgage Guaranty Insurance Model Act, it may result in state legislatures enacting and implementing the revised provisions. We cannot predict the effect that any NAIC recommendations or proposed or future legislation or rule-making in the United States or elsewhere may have on our financial condition or operations.
If our Bermuda principal operating subsidiary becomes subject to insurance statutes and regulations in jurisdictions other than Bermuda or if there is a change in Bermuda law or regulations or the application of Bermuda law or regulations, there could be a significant and negative impact on our business.
Our reinsurance subsidiary, Essent Reinsurance Ltd., is a registered Bermuda Class 3A insurer pursuant to Section 4 of the Insurance Act 1978. As such, it is subject to regulation and supervision in Bermuda and is not licensed or admitted to do business in any jurisdiction except Bermuda. Generally, Bermuda insurance statutes and regulations applicable to Essent Reinsurance Ltd. are less restrictive than those that would be applicable if they were governed by the laws of any state in the United States. We do not presently intend for Essent Reinsurance Ltd. to be admitted to do business in the United States, the U.K. or any jurisdiction other than Bermuda. However, recent scrutiny of the insurance and reinsurance industry in the United States and other countries could subject Essent Reinsurance Ltd. to additional regulation in the future that may make it unprofitable or illegal to operate a reinsurance business through our Bermuda subsidiary. We cannot assure you that insurance regulators in the United States, the U.K. or elsewhere will not review the activities of Essent Reinsurance Ltd. or its subsidiaries or agents and assert that Essent Reinsurance Ltd. is subject to such jurisdiction's licensing requirements. If in the future Essent Reinsurance Ltd. becomes subject to any insurance laws of the United States or any state thereof or of any other jurisdiction, we cannot assure you that Essent Reinsurance Ltd. would be in compliance with such laws or that complying with such laws would not have a significant and negative effect on our business.
The process of obtaining licenses is very time consuming and costly, and Essent Reinsurance Ltd. may not be able to become licensed in jurisdictions other than Bermuda should we choose to do so. The modification of the conduct of our business that would result if we were required or chose to become licensed in certain jurisdictions could significantly and negatively affect our financial condition and results of operations. In addition, our inability to comply with insurance statutes and regulations could significantly and adversely affect our financial condition and results of operations by limiting our ability to conduct business as well as subject us to penalties and fines.
40
Because Essent Reinsurance Ltd. is a Bermuda company, it is subject to changes in Bermuda law and regulation that may have an adverse impact on our operations, including through the imposition of tax liability or increased regulatory supervision. Bermuda insurance statutes and the regulations, and policies of the BMA, require Essent Reinsurance Ltd. to, among other things:
|
•
|
maintain a minimum level of capital and surplus;
|
|
•
|
maintain an enhanced capital requirement, general business solvency margins and a minimum liquidity ratio;
|
|
•
|
restrict dividends and distributions;
|
|
•
|
obtain prior approval regarding the ownership and transfer of shares;
|
|
•
|
maintain a principal office and appoint and maintain a principal representative in Bermuda;
|
|
•
|
file annual financial statements, an annual statutory financial return and an annual capital and solvency return; and
|
|
•
|
allow for the performance of certain periodic examinations of Essent Reinsurance Ltd. and its financial condition.
|
These statutes and regulations may restrict Essent Reinsurance Ltd.'s ability to write insurance and reinsurance policies, distribute funds and pursue its investment strategy. In addition, Essent Reinsurance Ltd. is exposed to any changes in the political environment in Bermuda. The Bermuda insurance and reinsurance regulatory framework recently has become subject to increased scrutiny in many jurisdictions, including the U.K. As a result of the delay in implementation of Solvency II Directive 2009/138/EC ("Solvency II"), it is unclear when the European Commission will make a final decision on whether or not it will recognize the solvency regime in Bermuda to be equivalent to that laid down in Solvency II. While we cannot predict the future impact on our operations of changes in the laws and regulation to which we are or may become subject, any such changes could have a material adverse effect on our business, financial condition and results of operations.
Risks Relating to Taxes
We and our non-U.S. subsidiaries may become subject to U.S. Federal income and branch profits taxation.
Essent Group Ltd. and Essent Reinsurance Ltd. intend to operate their business in a manner that will not cause them to be treated as engaged in a trade or business in the United States and, thus, will not be required to pay U.S. Federal income and branch profits taxes (other than U.S. excise taxes on insurance and reinsurance premium and withholding taxes on certain U.S. source investment income) on their income. However, because there is uncertainty as to the activities which constitute being engaged in a trade or business in the United States, there can be no assurances that the U.S. Internal Revenue Service (the "IRS") will not contend successfully that Essent Group Ltd. or its non-U.S. subsidiaries are engaged in a trade or business in the United States. In addition, Section 845 of the Internal Revenue Code of 1986, as amended (the "Code"), was amended in 2004 to permit the IRS to reallocate, recharacterize or adjust items of income, deduction or certain other items related to a reinsurance contract between related parties to reflect the proper "amount, source or character" for each item (in contrast to prior law, which only covered "source and character"). Any U.S. Federal income and branch profits taxes levied upon earnings from our Bermuda operations could materially adversely affect our shareholders' equity and earnings.
Holders of 10% or more of our common shares may be subject to U.S. income taxation under the "controlled foreign corporation" ("CFC") rules.
The Tax Cuts and Jobs Act of 2017 (“TCJA”) contains substantial law changes to the CFC rules, and such changes could impact our shareholders under certain circumstances summarized below.
If you are a "10% U.S. Shareholder" of a non-U.S. corporation defined to be a "U.S. Person" (as defined below) who owns (directly, indirectly through non-U.S. entities) or ("constructively," as defined below) at least 10% of the total combined value or voting power of all classes of stock, and such non-U.S. corporation is a CFC at any time during a taxable year, you must include in your gross income for U.S. Federal income tax purposes your pro rata share of the CFC's "subpart F income," even if the subpart F income is not distributed. Also, due to attribution rule changes contained in TCJA, the Company believes that, based upon ownership of its U.S. subsidiaries, its foreign reinsurer (Essent Reinsurance Ltd.), and foreign intermediate holding company (Essent Irish Intermediate Holdings Ltd.) will both be deemed CFC’s. Accordingly, any shareholder who becomes a “10% U.S. Shareholder” at any time during the calendar year, may be subject to a "Subpart F income" inclusion on a
41
per share per day basis. Subpart F income of a non-U.S. insurance corporation typically includes "foreign personal holding company income" (such as interest, dividends and other types of passive income), as well as insurance and reinsurance income (including underwriting and investment income).
For purposes of this discussion, the term "U.S. Person" means: (i) an individual citizen or resident of the United States, (ii) a partnership or corporation, created in or organized under the laws of the United States, or organized under the laws of any political subdivision thereof, (iii) an estate the income of which is subject to U.S. Federal income taxation regardless of its source, (iv) a trust if either (x) a court within the United States is able to exercise primary supervision over the administration of such trust and one or more U.S. Persons have the authority to control all substantial decisions of such trust or (y) the trust has a valid election in effect to be treated as a U.S. Person for U.S. Federal income tax purposes; or (v) any other person or entity that is treated for U.S. Federal income tax purposes as if it were one of the foregoing.
U.S. Persons who hold our shares may be subject to U.S. income taxation at ordinary income rates on their proportionate share of our "related party insurance income" ("RPII").
If the RPII (determined on a gross basis) of Essent Reinsurance Ltd. were to equal or exceed 20% of Essent Reinsurance Ltd.'s gross insurance income in any taxable year and direct or indirect policyholders (and persons related to those policyholders) own directly or indirectly through entities 20% or more of the voting power or value of the Company, then a U.S. Person who owns any shares of Essent Reinsurance Ltd. (directly or indirectly through non-U.S. entities) on the last day of the taxable year on which it is an RPII CFC would be required to include in its income for U.S. Federal income tax purposes such person's pro rata share of Essent Reinsurance Ltd.'s RPII for the entire taxable year, determined as if such RPII were distributed proportionately only to U.S. Persons at that date regardless of whether such income is distributed, in which case your investment could be materially adversely affected. In addition, any RPII that is includible in the income of a U.S. tax-exempt organization may be treated as unrelated business taxable income. The amount of RPII earned by a non-U.S. insurance subsidiary (generally, premium and related investment income from the indirect or direct insurance or reinsurance of any direct or indirect U.S. holder of shares or any person related to such holder) will depend on a number of factors, including the identity of persons directly or indirectly insured or reinsured by the company. We do not expect gross RPII of Essent Reinsurance Ltd. to equal or exceed 20% of its gross insurance income in any taxable year for the foreseeable future, but we cannot be certain that this will be the case because some of the factors which determine the extent of RPII may be beyond our control.
U.S. Persons who dispose of our shares may be subject to U.S. Federal income taxation at the rates applicable to dividends on a portion of such disposition.
Section 1248 of the Code in conjunction with the RPII rules provides that if a U.S. Person disposes of shares in a non-U.S. corporation that earns insurance income in which U.S. Persons own 25% or more of the shares (even if the amount of gross RPII is less than 20% of the corporation's gross insurance income and the ownership of its shares by direct or indirect policyholders and related persons is less than the 20% threshold), any gain from the disposition will generally be treated as a dividend to the extent of the holder's share of the corporation's undistributed earnings and profits that were accumulated during the period that the holder owned the shares (whether or not such earnings and profits are attributable to RPII). In addition, such a holder will be required to comply with certain reporting requirements, regardless of the amount of shares owned by the holder. These RPII rules should not apply to dispositions of our shares because the Company will not itself be directly engaged in the insurance business. The RPII provisions, however, have never been interpreted by the courts or the U.S. Treasury in final regulations, and regulations interpreting the RPII provisions of the Code exist only in proposed form. It is not certain whether these regulations will be adopted in their proposed form or what changes or clarifications might ultimately be made thereto or whether any such changes, as well as any interpretation or application of the RPII rules by the IRS, the courts, or otherwise, might have retroactive effect. The U.S. Treasury has authority to impose, among other things, additional reporting requirements with respect to RPII. Accordingly, the meaning of the RPII provisions and the application thereof to us is uncertain.
U.S. Persons who hold our shares will be subject to adverse tax consequences if we are considered to be a passive foreign investment company ("PFIC") for U.S. Federal income tax purposes.
The TCJA contains substantial law changes to the PFIC rules, and such changes could impact our shareholders under certain circumstances summarized below.
Due to changes to the PFIC rules contained in the TCJA, we believe that Essent Reinsurance Ltd. will be deemed a PFIC, and any U.S. Person owning shares in the company could be subject to adverse tax consequences. Based upon the current relative value of its U.S. subsidiaries vs. foreign subsidiaries, management believes that Essent Group Ltd. is not currently a PFIC. However, in the event that future business circumstances (i.e. relative value changes) and/or tax law changes occur, Essent Group Ltd. may be considered a PFIC. Management has operated, and intends to continue to operate, in a manner such as to avoid Essent Group Ltd. being deemed a PFIC based upon relative value of its subsidiaries; however, there can be no guaranty that management will be successful in the future. Also, if future tax law changes re-define whom may be considered a
42
“U.S. Person” subject to PFIC income inclusion, then any U.S. Person who owns any of our shares could be subject to adverse tax consequences, including becoming subject to a greater tax liability than might otherwise apply and to tax on amounts in advance of when tax would otherwise be imposed, in which case your investment could be materially adversely affected. In addition, if Essent Group Ltd. were considered a PFIC, upon the death of any U.S. individual owning shares, such individual's heirs or estate would not be entitled to a "step-up" in the basis of the shares that might otherwise be available under U.S. Federal income tax laws.
We believe that Essent Group Ltd. is not, has not been, and currently does not expect to become, a PFIC for U.S. Federal income tax purposes. We cannot assure you, however, that Essent Group Ltd. will not be deemed a PFIC by the IRS in the future. If Essent Group Ltd. were considered a PFIC, it could have material adverse tax consequences for an investor that is subject to U.S. Federal income taxation. New regulations or pronouncements interpreting or clarifying these rules contained in TCJA may be forthcoming, which may include changes to the definition of “U.S. Person” subject to PFIC income inclusions to include “indirect” or “downstream” foreign subsidiaries, in which case, investors in Essent Group Ltd. would be adversely affected due to the indirect ownership of Essent Reinsurance Ltd., which will be deemed a PFIC under the rule changes contained in TCJA.
U.S. tax-exempt organizations who own our shares may recognize unrelated business taxable income.
A U.S. tax-exempt organization may recognize unrelated business taxable income if a portion of the insurance income of any of our non-U.S. insurance subsidiaries is allocated to the organization, which generally would be the case if the tax-exempt shareholder is a 10% U.S. Shareholder or if there is RPII, and certain exceptions do not apply, and the tax-exempt organization owns any of our shares. Although we do not believe that any U.S. Persons should be allocated such insurance income, we cannot be certain that this will be the case. U.S. tax-exempt investors are advised to consult their own tax advisors.
There is the potential foreign bank account reporting and reporting of "Specified Foreign Financial Assets."
U.S. Persons holding our common shares should consider their possible obligation to file a FinCEN Form 114, Report of Foreign Bank and Financial Accounts with respect to their shares. Additionally, such U.S. and non-U.S. persons should consider their possible obligations to annually report certain information with respect to us with their U.S. Federal income tax returns. Shareholders should consult their tax advisors with respect to these or any other reporting requirement which may apply with respect to their ownership of our common shares.
Reduced tax rates for qualified dividend income may not be available in the future.
We believe that the dividends paid on the common shares should qualify as "qualified dividend income" if, as is intended, our common shares remain listed on a national securities exchange and we are not a PFIC. Qualified dividend income received by non-corporate U.S. Persons is generally eligible for long-term capital gain rates. There has been proposed legislation before the U.S. Senate and House of Representatives that would exclude shareholders of certain foreign corporations from this advantageous tax treatment. If such legislation were to become law, non-corporate U.S. Persons would no longer qualify for the reduced tax rate on the dividends paid by us.
Proposed U.S. tax legislation could have an adverse impact on us or holders of our common shares.
It is possible that legislation could be introduced and enacted by the current Congress or future Congresses that could have an adverse impact on us or holders of our common shares. It is also possible that Treasury Regulations, and/or IRS administrative rulings could be written under the TCJA that could have an adverse impact on the Company or the holders of our common shares. Specifically, as discussed above, new Treasury Regulations addressing TCJA changes to the PFIC rules could cause a U.S. Person to be subject to PFIC income inclusion from an indirectly owned foreign subsidiary. We cannot be certain if, when or in what form such Treasury Regulations or IRS administrative pronouncements may be provided and whether such guidance will have a retroactive effect, and/or a negative impact upon an investor subject to U.S. taxation.
The TCJA contains provisions intended to eliminate certain perceived tax advantages of companies (including insurance companies) that have legal domiciles outside the United States but have certain affiliate transactions, U.S. connections, and/or United States persons investing in such companies. For example, the TCJA includes a base erosion anti-abuse tax or “BEAT” that could make certain levels of affiliate reinsurance between United States and non-U.S. members of our group economically unfeasible. Further, it is possible that other legislation could be introduced and enacted by the current Congress or future Congresses that could have an adverse impact on us.
U.S. federal income tax laws and interpretations regarding whether a company is engaged in a trade or business within the U.S. is a PFIC, or whether U.S. Persons would be required to include in their gross income the "subpart F income" of a CFC or RPII are subject to change, possibly on a retroactive basis. There currently are only recently proposed regulations regarding the application of the PFIC rules to insurance companies, and the regulations regarding RPII have been in proposed form since
43
1991. New regulations or pronouncements interpreting or clarifying such rules may be forthcoming. We cannot be certain if, when, or in what form such regulations or pronouncements may be implemented or made, or whether such guidance will have a retroactive effect.
Risks Relating to Ownership of Our Common Shares
Our share price may be volatile or may decline regardless of operating performance.
The market price of our common shares may fluctuate significantly in the future. Some of the factors that could negatively affect the market price of our common shares include:
|
•
|
actual or anticipated variations in our quarterly operating results;
|
|
•
|
changes in our earnings estimates or publication of research reports about us or the real estate industry;
|
|
•
|
changes in market valuations of similar companies;
|
|
•
|
any indebtedness we incur in the future;
|
|
•
|
changes in credit markets and interest rates;
|
|
•
|
changes in government policies, laws and regulations;
|
|
•
|
changes impacting Fannie Mae, Freddie Mac or Ginnie Mae;
|
|
•
|
additions to or departures of our key management personnel;
|
|
•
|
actions by shareholders;
|
|
•
|
speculation in the press or investment community;
|
|
•
|
strategic actions by us or our competitors;
|
|
•
|
changes in our credit ratings;
|
|
•
|
general market and economic conditions;
|
|
•
|
our failure to meet, or the lowering of, our earnings estimates or those of any securities analysts; and
|
|
•
|
price and volume fluctuations in the stock market generally.
|
The stock markets have experienced extreme volatility in recent years that has been unrelated to the operating performance of particular companies. These broad market fluctuations may adversely affect the trading price of our common shares. In the past, securities class action litigation has often been instituted against companies following periods of volatility in their stock price. This type of litigation, even if it does not result in liability for us, could result in substantial costs to us and divert management's attention and resources.
Future sales of shares by existing shareholders could cause our share price to decline.
Sales of substantial amounts of our common shares in the public market, or the perception that these sales could occur, could cause the market price of our common shares to decline. As of
February 15, 2018
, we had
98,094,421
outstanding common shares. In the future, we may issue additional common shares or other equity or debt securities convertible into common shares in connection with a financing, acquisition, and litigation settlement or employee arrangement or otherwise. Any of these issuances could result in substantial dilution to our existing shareholders and could cause the trading price of our common shares to decline.
44
If securities or industry analysts do not publish research or publish misleading or unfavorable research about our business, our share price and trading volume could decline.
The trading market for our common shares depends in part on the research and reports that securities or industry analysts publish about us or our business. If one or more of these analysts downgrades our shares or publishes misleading or unfavorable research about our business, our share price would likely decline. If one or more of these analysts ceases coverage of our Company or fails to publish reports on us regularly, demand for our shares could decrease, which could cause our share price or trading volume to decline.
We do not intend to pay dividends on our common shares and, consequently, your ability to achieve a return on your investment will depend on appreciation in the price of our common shares.
We do not intend to declare and pay dividends on our share capital for the foreseeable future. We currently intend to retain all our future earnings, if any, to fund our growth. Therefore, you are not likely to receive any dividends on your common shares for the foreseeable future and the success of an investment in our common shares will depend upon any future appreciation in their value. There is no guarantee that our common shares will appreciate in value or even maintain the price at which our shareholders have purchased their shares. Furthermore, our subsidiaries are restricted by state insurance laws and regulations from declaring dividends to us. See "—
Our holding company structure and certain regulatory and other constraints, including adverse business performance, could negatively impact our liquidity and potentially require us to raise more capital.
"
Holders of our shares may have difficulty effecting service of process on us or enforcing judgments against us in the United States.
We are a Bermuda exempted company. As a result, the rights of holders of our common shares are governed by Bermuda law and our memorandum of association and bye-laws. The rights of shareholders under Bermuda law may differ from the rights of shareholders of companies incorporated in other jurisdictions. Certain of our directors are not residents of the United States, and a substantial portion of our assets are owned by subsidiaries domiciled outside the United States. As a result, it may be difficult for investors to effect service of process on those persons in the United States or to enforce in the United States judgments obtained in U.S. courts against us or those persons based on the civil liability provisions of the U.S. securities laws. It is doubtful whether courts in Bermuda will enforce judgments obtained in other jurisdictions, including the United States, against us or our directors or officers under the securities laws of those jurisdictions or entertain actions in Bermuda against us or our directors or officers under the securities laws of other jurisdictions.
U.S. persons who own our shares may have more difficulty in protecting their interests than U.S. persons who are shareholders of a U.S. corporation.
The Bermuda Companies Act 1981 (the "Companies Act"), which applies to us, differs in certain material respects from laws generally applicable to U.S. corporations and their shareholders. Set forth below is a summary of certain significant provisions of the Companies Act and our bye-laws which differ in certain respects from provisions of Delaware corporate law. Because the following statements are summaries, they do not discuss all aspects of Bermuda law that may be relevant to us and our shareholders.
Interested Directors:
Bermuda law provides that if a director has an interest in a material contract or proposed material contract with us or any of our subsidiaries or has a material interest in any person that is a party to such a contract, the director must disclose the nature of that interest at the first opportunity either at a meeting of directors or in writing to the board. Under Delaware law such transaction would not be voidable if:
|
•
|
the material facts as to such interested director's relationship or interests were disclosed or were known to the board of directors and the board of directors had in good faith authorized the transaction by the affirmative vote of a majority of the disinterested directors;
|
|
•
|
such material facts were disclosed or were known to the shareholders entitled to vote on such transaction and the transaction were specifically approved in good faith by vote of the majority of shares entitled to vote thereon; or
|
|
•
|
the transaction was fair as to the corporation as of the time it was authorized, approved or ratified. Under Delaware law, the interested director could be held liable for a transaction in which the director derived an improper personal benefit.
|
45
Business Combinations with Large Shareholders or Affiliates.
As a Bermuda company, we may enter into business combinations with our large shareholders or affiliates, including mergers, asset sales and other transactions in which a large shareholder or affiliate receives, or could receive, a financial benefit that is greater than that received, or to be received, by other shareholders, without obtaining prior approval from our board of directors or from our shareholders. If we were a Delaware company, we would need prior approval from our board of directors or a supermajority of our shareholders to enter into a business combination with an interested shareholder for a period of three years from the time the person became an interested shareholder, unless we opted out of the relevant Delaware statute. Our bye-laws also include a provision restricting business combinations with interested shareholders consistent with the corresponding Delaware statute.
Shareholders' Suits.
The rights of shareholders under Bermuda law are not as extensive as the rights of shareholders in many U.S. jurisdictions. Class actions and derivative actions are generally not available to shareholders under the laws of Bermuda. However, the Bermuda courts ordinarily would be expected to follow English case law precedent, which would permit a shareholder to commence an action in the name of the company to remedy a wrong done to the company where an act is alleged to be beyond the corporate power of the company, is illegal or would result in the violation of our memorandum of association or bye-laws. Furthermore, a court would consider acts that are alleged to constitute a fraud against the minority shareholders or where an act requires the approval of a greater percentage of our shareholders than actually approved it. The prevailing party in such an action generally would be able to recover a portion of attorneys' fees incurred in connection with such action. Our bye-laws provide that shareholders waive all claims or rights of action that they might have, individually or in the right of the company, against any director or officer for any act or failure to act in the performance of such director's or officer's duties, except with respect to any fraud or dishonesty of such director or officer. Class actions and derivative actions generally are available to shareholders under Delaware law for, among other things, breach of fiduciary duty, corporate waste and actions not taken in accordance with applicable law. In such actions, the court has discretion to permit the winning party to recover attorneys' fees incurred in connection with such action.
Indemnification of Directors.
We may indemnify our directors or officers or any person appointed to any committee by the board of directors acting in their capacity as such in relation to any of our affairs for any loss arising or liability attaching to them by virtue of any rule of law in respect of any negligence, default, breach of duty or breach of trust of which such person may be guilty in relation to the company other than in respect of his own fraud or dishonesty. Under Delaware law, a corporation may indemnify a director or officer of the corporation against expenses (including attorneys' fees), judgments, fines and amounts paid in settlement actually and reasonably incurred in defense of an action, suit or proceeding by reason of such position if such director or officer acted in good faith and in a manner he or she reasonably believed to be in or not be opposed to the best interests of the corporation and, with respect to any criminal action or proceeding, such director or officer had no reasonable cause to believe his or her conduct was unlawful.
We may repurchase a shareholder's common shares without the shareholder's consent.
Under our bye-laws and subject to Bermuda law, we have the option, but not the obligation, to require a shareholder to sell to us at fair market value the minimum number of common shares which is necessary to avoid or cure any adverse tax consequences or materially adverse legal or regulatory treatment to us, our subsidiaries or our shareholders if our board of directors reasonably determines, in good faith, that failure to exercise our option would result in such adverse consequences or treatment.
Provisions in our bye-laws may reduce or increase the voting rights of our shares.
In general, and except as provided under our bye-laws and as provided below, our shareholders have one vote for each common share held by them and are entitled to vote, on a non-cumulative basis, at all meetings of shareholders. However, if, and so long as, the shares of a shareholder are treated as "controlled shares" (as determined pursuant to sections 957 and 958 of the Code) of any U.S. Person that owns shares directly or indirectly through non-U.S. entities) and such controlled shares constitute 9.5% or more of the votes conferred by our issued shares, the voting rights with respect to the controlled shares owned by such U.S. Person will be limited, in the aggregate, to a voting power of less than 9.5%, under a formula specified in our bye-laws. The formula is applied repeatedly until the voting power of all 9.5% U.S. Shareholders has been reduced to less than 9.5%. In addition, our board of directors may limit a shareholder's voting rights when it deems it appropriate to do so to (i) avoid the existence of any 9.5% U.S. Shareholder; and (ii) avoid certain material adverse tax, legal or regulatory consequences to us, any of our subsidiaries or any direct or indirect shareholder or its affiliates. "Controlled shares" include, among other things, all shares that a U.S. Person is deemed to own directly, indirectly or constructively (within the meaning of section 958 of the Code). The amount of any reduction of votes that occurs by operation of the above limitations will generally be reallocated proportionately among our other shareholders whose shares were not "controlled shares" of the 9.5% U.S. Shareholder so long as such reallocation does not cause any person to become a 9.5% U.S. Shareholder.
46
Under these provisions, certain shareholders may have their voting rights limited, while other shareholders may have voting rights in excess of one vote per share. Moreover, these provisions could have the effect of reducing the votes of certain shareholders who would not otherwise be subject to the 9.5% limitation by virtue of their direct share ownership.
We are authorized under our bye-laws to request information from any shareholder for the purpose of determining whether a shareholder's voting rights are to be reallocated under the bye-laws. If any holder fails to respond to this request or submits incomplete or inaccurate information, we may, in our sole discretion, eliminate the shareholder's voting rights.
There are regulatory limitations on the ownership and transfer of our common shares.
Common shares may be offered or sold in Bermuda only in compliance with the provisions of the Companies Act and the Bermuda Investment Business Act 2003, which regulates the sale of securities in Bermuda. In addition, the BMA must approve all issues and transfers of shares of a Bermuda exempted company. However, the BMA has pursuant to its statement of June 1, 2005 given its general permission under the Exchange Control Act 1972 (and related regulations) for the issue and free transfer of our common shares to and among persons who are non-residents of Bermuda for exchange control purposes as long as the shares are listed on an appointed stock exchange, which includes the New York Stock Exchange. This general permission would cease to apply if the Company were to cease to be so listed. We have obtained consent under the Bermuda Exchange Control Act 1972 (and its related regulations) from the BMA for the issue and transfer of our common shares to and between residents and non-residents of Bermuda for exchange control purposes provided our common shares remain listed on an appointed stock exchange, which includes the NYSE. Bermuda insurance law requires that any person who becomes a holder of at least 10%, 20%, 33% or 50% of the common shares of an insurance or reinsurance company or its parent company must notify the BMA in writing within 45 days of becoming such a holder or 30 days from the date they have knowledge of having such a holding, whichever is later. The BMA may, by written notice, object to a person holding 10%, 20%, 33% or 50% of our common shares if it appears to the BMA that the person is not fit and proper to be such a holder. The BMA may require the holder to reduce their shareholding in us and may direct, among other things, that the voting rights attaching to their shares shall not be exercisable. A person that does not comply with such a notice or direction from the BMA will be guilty of an offense.
The insurance holding company laws and regulations of the Commonwealth of Pennsylvania, the state in which our insurance subsidiaries are domiciled, require that, before a person can acquire direct or indirect control of an insurer domiciled in the state, prior written approval must be obtained from the Pennsylvania Insurance Department. The state insurance regulators are required to consider various factors, including the financial strength of the acquirer, the integrity and management experience of the acquirer's board of directors and executive officers, and the acquirer's plans for the future operations of the reinsurer or insurer. Pursuant to applicable laws and regulations, "control" over an insurer is generally presumed to exist if any person, directly or indirectly, owns, controls, holds the power to vote or holds proxies representing, 10% or more of the voting securities of that reinsurer or insurer. Indirect ownership includes ownership of our common shares.
Except in connection with the settlement of trades or transactions entered into through the facilities of the NYSE, our board of directors may generally require any shareholder or any person proposing to acquire our shares to provide the information required under our bye-laws. If any such shareholder or proposed acquirer does not provide such information, or if the board of directors has reason to believe that any certification or other information provided pursuant to any such request is inaccurate or incomplete, the board of directors may decline to register any transfer or to effect any issuance or purchase of shares to which such request is related. Although these restrictions on transfer will not interfere with the settlement of trades on the NYSE, we may decline to register transfers in accordance with our bye-laws and board of directors resolutions after a settlement has taken place.
Future offerings of debt or equity securities, which may rank senior to our common shares, may restrict our operating flexibility and adversely affect the market price of our common shares.
If we decide to issue debt securities in the future, it is likely that they will be governed by an indenture or other instrument containing covenants restricting our operating flexibility. Additionally, any equity securities or convertible or exchangeable securities that we issue in the future may have rights, preferences and privileges more favorable than those of our common shares and may adversely affect the market price of our common shares. Any such debt or preference equity securities will rank senior to our common shares and will also have priority with respect to any distributions upon a liquidation, dissolution or similar event, which could result in the loss of all or a portion of your investment. Our decision to issue such securities will depend on market conditions and other factors beyond our control, and we cannot predict or estimate the amount, timing or nature of our future offerings.
47
Not applicable.
We lease office facilities in Radnor, Pennsylvania and additional offices in Winston-Salem, North Carolina, and Irvine, California for our U.S. operations headquarters, and we lease office facilities in Bermuda for our Bermuda-based reinsurance company. We believe our current facilities are adequate for our current needs and that suitable additional space will be available as and when needed.
We are not currently subject to any material legal proceedings.
Not applicable.
48
Our common shares trade on the New York Stock Exchange (NYSE) under the symbol "ESNT." The following table sets forth, for the periods indicated, the high and low intra-day sales prices of our common shares as reported by the NYSE for the years ended December 31,
2017
and
2016
:
|
2017
|
2016
|
|||||||||||||||
|
High
|
Low
|
High
|
Low
|
|||||||||||||
|
First Quarter
|
$
|
38.10
|
|
$
|
31.54
|
|
$
|
21.66
|
|
$
|
16.48
|
|
||||
|
Second Quarter
|
$
|
39.50
|
|
$
|
34.08
|
|
$
|
22.33
|
|
$
|
19.30
|
|
||||
|
Third Quarter
|
$
|
41.44
|
|
$
|
35.75
|
|
$
|
28.62
|
|
$
|
20.96
|
|
||||
|
Fourth Quarter
|
$
|
47.29
|
|
$
|
39.32
|
|
$
|
33.94
|
|
$
|
25.84
|
|
||||
As of
February 15, 2018
, we had approximately
11
holders of record of our common shares.
Performance Graph
The following performance graph compares, for the period from October 31, 2013 (the date our common shares commenced trading on the NYSE) through
December 31, 2017
, the cumulative total shareholder return of an investment in (i) our common shares, (ii) the S&P 500 and (iii) a composite peer group selected by us consisting of Arch Capital Group Ltd., Genworth Financial, Inc., MGIC Investment Corporation, NMI Holdings, Inc. and Radian Group Inc. We selected the members of this peer group because each is a direct competitor of ours in the private mortgage insurance industry.
The graph assumes an initial investment of $100 and the reinvestment of dividends, if any. Such returns are based on historical results and are not intended to suggest future performance.
|
10/31/2013
|
12/31/2013
|
12/31/2014
|
12/31/2015
|
12/31/2016
|
12/31/2017
|
|||||||||||||||||
|
S&P 500
|
$100.00
|
$
|
105.23
|
|
$
|
117.21
|
|
$
|
116.36
|
|
$
|
127.46
|
|
$
|
152.21
|
|
||||||
|
Peer Index
|
$100.00
|
$
|
100.90
|
|
$
|
101.24
|
|
$
|
133.32
|
|
$
|
166.77
|
|
$
|
173.37
|
|
||||||
|
ESNT
|
$100.00
|
$
|
114.57
|
|
$
|
122.43
|
|
$
|
104.24
|
|
$
|
154.14
|
|
$
|
206.76
|
|
||||||
49
The performance graph and related information shall not be deemed "soliciting material" or to be "filed" with the Securities and Exchange Commission for purposes of Section 18 of the Securities Exchange Act of 1934, as amended, or the Exchange Act, or otherwise subject to the liabilities under that Section, and shall not be deemed to be incorporated by reference into any future filing under the Securities Act of 1933, as amended, or the Exchange Act, except to the extent that we specifically incorporate it by reference into such filing.
Dividends
We have not declared or paid any dividends during the past two fiscal years, and we do not currently expect to declare or pay dividends on our Common Shares for the foreseeable future. Instead, we intend to retain earnings to finance the growth and development of our business and general corporate purposes. Any payment of dividends will be at the discretion of our board of directors and will depend upon various factors then existing, including earnings, financial condition, results of operations, capital requirements, level of indebtedness, contractual restrictions with respect to payment of dividends, restrictions imposed by applicable law, general business conditions and other factors that our board of directors may deem relevant. In addition, the ability of our insurance subsidiaries to pay dividends to Essent Group Ltd. is limited by state insurance laws and under certain agreements with counterparties. See "Management's Discussion and Analysis of Financial Condition and Results of Operations—Liquidity and Capital Resources" and "Risk Factors—Risks Relating to Our Business—
Our holding company structure and certain regulatory and other constraints, including adverse business performance, could negatively impact our liquidity and potentially require us to raise more capital.
" In addition, under the Bermuda Companies Act, we may only declare or pay a dividend if, among other matters, there are reasonable grounds for believing that we are, and would after the payment be, able to pay our respective liabilities as they become due and that the realizable value of our assets will, and after the payment would, exceed our liabilities.
Securities Authorized for Issuance Under Equity Compensation Plans as of December 31,
2017
The following table sets forth, as of December 31,
2017
, information concerning equity compensation plans under which our securities are authorized for issuance. The table does not reflect grants, awards, exercises, terminations or expirations since that date.
|
Plan Category
|
Number of Securities
to be Issued Upon Exercise of Outstanding Options, Warrants and Rights |
Weighted Average
Exercise Price of Outstanding Options, Warrants and Rights |
Number of Securities
Remaining Available for Future Issuance Under Equity Compensation Plans |
|
|||||||
|
|
(a)
|
(b)
|
(c)
|
|
|||||||
|
Equity compensation plans approved by security holders
|
535,698
|
|
(1)
|
(2)
|
4,934,173
|
|
(3)
|
||||
|
Equity compensation plans not approved by security holders
|
—
|
|
|
—
|
|
—
|
|
|
|||
|
Total
|
535,698
|
|
|
—
|
|
4,934,173
|
|
|
|||
_______________________________________________________________________________
|
(1)
|
All of these shares are subject to outstanding restricted common share unit awards. This number does not include
2,005,407
shares that are subject to then-outstanding, but unvested, restricted common share awards because those securities have been subtracted from the number of securities remaining available for future issuance under column (c).
|
|
(2)
|
Not applicable because all outstanding awards reflected in column (a) will be issued upon the vesting of outstanding restricted common share units.
|
|
(3)
|
All of the shares that remained available for future issuance as of December 31,
2017
were available under the 2013 Essent Group Ltd. Long-Term Incentive Plan, as amended and restated effective May 3, 2017 (the "2013 Plan"). Subject to certain express limits of the 2013 Plan, shares available for award purposes under the 2013 Plan generally may be used for any type of award authorized under that plan including options, stock appreciation rights, and other forms of awards granted or denominated in our common shares including, without limitation, stock bonuses, restricted stock, restricted stock units and performance shares. A total of 7,500,000 common shares are reserved and available for delivery under the amended and restated 2013 Plan. Common shares underlying awards that are settled in cash, cancelled, forfeited, or otherwise terminated without delivery to a participant will again be available for issuance under the 2013 Plan. Common shares withheld or surrendered in connection with the payment of an exercise price of an award or to satisfy tax withholding will not again become available for issuance under the 2013 Plan.
|
50
Issuer Purchase of Equity Securities
The table below sets forth information regarding repurchases of our common shares during the fourth quarter of
2017
. All of the shares represent common shares that were tendered to the Company by employees in connection with the vesting of restricted shares to satisfy tax withholding obligations. We do not consider these transactions to be a share buyback program.
|
Period
|
Total
Number of Shares Purchased |
Average Price
Paid Per Share |
Total Number of
Shares Purchased as Part of Publicly Announced Plans or Programs |
Maximum Number
of Shares that May Yet Be Purchased Under the Plans or Programs |
|||||||
|
October 1 - October 31, 2017
|
570
|
|
$40.34
|
—
|
|
—
|
|
||||
|
November 1 - November 30, 2017
|
—
|
|
N/A
|
—
|
|
—
|
|
||||
|
December 1 - December 31, 2017
|
—
|
|
N/A
|
—
|
|
—
|
|
||||
|
Total
|
570
|
|
|
—
|
|
—
|
|
||||
51
|
|
Year Ended December 31,
|
|||||||||||||||||||
|
Summary of Operations
(In thousands, except per share amounts)
|
2017
|
2016
|
2015
|
2014
|
2013
|
|||||||||||||||
|
Revenues:
|
|
|
|
|
|
|
|
|
|
|
||||||||||
|
Net premiums written
|
$
|
570,186
|
|
$
|
441,278
|
|
$
|
370,568
|
|
$
|
276,778
|
|
$
|
186,200
|
|
|||||
|
Increase in unearned premiums
|
(40,056
|
)
|
(18,571
|
)
|
(44,097
|
)
|
(53,549
|
)
|
(62,829
|
)
|
||||||||||
|
Net premiums earned
|
530,130
|
|
422,707
|
|
326,471
|
|
223,229
|
|
123,371
|
|
||||||||||
|
Net investment income
|
40,226
|
|
27,890
|
|
19,885
|
|
12,285
|
|
4,110
|
|
||||||||||
|
Realized investment gains, net
|
2,015
|
|
1,934
|
|
2,554
|
|
925
|
|
116
|
|
||||||||||
|
Other income
|
4,140
|
|
5,727
|
|
4,380
|
|
3,028
|
|
3,806
|
|
||||||||||
|
Total revenues
|
576,511
|
|
458,258
|
|
353,290
|
|
239,467
|
|
131,403
|
|
||||||||||
|
Losses and expenses:
|
|
|
|
|
|
|
|
|
|
|
||||||||||
|
Provision for losses and LAE
|
27,232
|
|
15,525
|
|
11,905
|
|
6,308
|
|
2,321
|
|
||||||||||
|
Other underwriting and operating expenses
|
145,533
|
|
130,425
|
|
112,987
|
|
97,232
|
|
71,055
|
|
||||||||||
|
Interest expense
|
5,178
|
|
426
|
|
—
|
|
—
|
|
—
|
|
||||||||||
|
Total losses and expenses
|
177,943
|
|
146,376
|
|
124,892
|
|
103,540
|
|
73,376
|
|
||||||||||
|
Income before income taxes
|
398,568
|
|
311,882
|
|
228,398
|
|
135,927
|
|
58,027
|
|
||||||||||
|
Income tax expense (benefit)
|
18,821
|
|
89,276
|
|
71,067
|
|
47,430
|
|
(7,386
|
)
|
||||||||||
|
Net income
|
$
|
379,747
|
|
$
|
222,606
|
|
$
|
157,331
|
|
$
|
88,497
|
|
$
|
65,413
|
|
|||||
|
Earnings per share (EPS)(1):
|
|
|
|
|
|
|
|
|
|
|
||||||||||
|
Basic:
|
|
|
|
|
|
|
|
|
|
|
||||||||||
|
Common Shares
|
$
|
4.07
|
|
$
|
2.45
|
|
$
|
1.74
|
|
$
|
1.05
|
|
$
|
0.90
|
|
|||||
|
Diluted:
|
|
|
|
|
|
|
|
|
|
|
||||||||||
|
Common Shares
|
$
|
3.99
|
|
$
|
2.41
|
|
$
|
1.72
|
|
$
|
1.03
|
|
$
|
0.70
|
|
|||||
|
Weighted average common shares outstanding:
|
|
|
|
|
|
|
|
|
|
|
||||||||||
|
Basic:
|
|
|
|
|
|
|
|
|
|
|
||||||||||
|
Common Shares
|
93,330
|
|
90,913
|
|
90,351
|
|
83,986
|
|
14,044
|
|
||||||||||
|
Diluted:
|
|
|
|
|
|
|
|
|
|
|
||||||||||
|
Common Shares
|
95,211
|
|
92,245
|
|
91,738
|
|
85,602
|
|
18,103
|
|
||||||||||
|
|
December 31,
|
|||||||||||||||||||
|
Balance sheet data
($ in thousands)
|
2017
|
2016
|
2015
|
2014
|
2013
|
|||||||||||||||
|
Total investments
|
$
|
2,305,065
|
|
$
|
1,615,102
|
|
$
|
1,276,634
|
|
$
|
1,057,613
|
|
$
|
332,555
|
|
|||||
|
Cash
|
43,524
|
|
27,531
|
|
24,606
|
|
24,411
|
|
477,655
|
|
||||||||||
|
Total assets
|
2,674,368
|
|
1,882,998
|
|
1,469,099
|
|
1,181,461
|
|
853,970
|
|
||||||||||
|
Reserve for losses and LAE
|
46,850
|
|
28,142
|
|
17,760
|
|
8,427
|
|
3,070
|
|
||||||||||
|
Unearned premium reserve
|
259,672
|
|
219,616
|
|
201,045
|
|
156,948
|
|
103,399
|
|
||||||||||
|
Credit facility borrowings
|
248,591
|
|
100,000
|
|
N/A
|
|
N/A
|
|
N/A
|
|
||||||||||
|
Amounts due under Asset Purchase Agreement
|
—
|
|
—
|
|
—
|
|
—
|
|
4,949
|
|
||||||||||
|
Total stockholders' equity
|
$
|
1,940,436
|
|
$
|
1,343,773
|
|
$
|
1,119,241
|
|
$
|
955,738
|
|
$
|
722,141
|
|
|||||
52
|
|
December 31,
|
|||||||||||||||||||
|
Selected additional data
($ in thousands)
|
2017
|
2016
|
2015
|
2014
|
2013
|
|||||||||||||||
|
New insurance written(2)
|
$
|
43,858,322
|
|
$
|
34,949,319
|
|
$
|
26,193,656
|
|
$
|
24,799,434
|
|
$
|
21,152,638
|
|
|||||
|
Loss ratio(3)
|
5.1
|
%
|
3.7
|
%
|
3.6
|
%
|
2.8
|
%
|
1.9
|
%
|
||||||||||
|
Expense ratio(4)
|
27.5
|
|
30.9
|
|
34.6
|
|
43.6
|
|
57.6
|
|
||||||||||
|
Combined ratio
|
32.6
|
%
|
34.5
|
%
|
38.3
|
%
|
46.4
|
%
|
59.5
|
%
|
||||||||||
|
|
December 31,
|
|||||||||||||||||||
|
Insurance portfolio
($ in thousands)
|
2017
|
2016
|
2015
|
2014
|
2013
|
|||||||||||||||
|
Insurance in force
|
$
|
110,461,950
|
|
$
|
83,265,522
|
|
$
|
65,242,453
|
|
$
|
50,762,594
|
|
$
|
32,028,196
|
|
|||||
|
Risk in force
|
$
|
27,443,985
|
|
$
|
20,627,317
|
|
$
|
16,073,174
|
|
$
|
12,227,270
|
|
$
|
7,768,605
|
|
|||||
|
Policies in force
|
496,477
|
|
375,898
|
|
297,437
|
|
229,721
|
|
141,417
|
|
||||||||||
|
Loans in default
|
4,783
|
|
1,757
|
|
1,028
|
|
457
|
|
159
|
|
||||||||||
|
Percentage of loans in default
|
0.96
|
%
|
0.47
|
%
|
0.35
|
%
|
0.20
|
%
|
0.11
|
%
|
||||||||||
|
Insurance company capital
($ in thousands)
|
|
|
|
|
|
|
|
|
||||||||||||
|
U.S. Mortgage Insurance
|
|
|
|
|
|
|
|
|
||||||||||||
|
Subsidiaries
|
|
|
|
|
|
|
|
|
||||||||||||
|
Combined statutory capital(5)
|
$
|
1,528,869
|
|
$
|
1,144,279
|
|
$
|
913,182
|
|
$
|
705,890
|
|
$
|
469,424
|
|
|||||
|
Risk-to-capital ratios:
|
|
|
|
|
|
|
|
|
||||||||||||
|
Essent Guaranty, Inc.
|
14.7:1
|
|
15.3:1
|
|
15.7:1
|
|
16.4:1
|
|
16.6:1
|
|
||||||||||
|
Essent Guaranty of PA, Inc.
|
5.4:1
|
|
6.8:1
|
|
9.7:1
|
|
14.6:1
|
|
17.1:1
|
|
||||||||||
|
Combined(6)
|
14.2:1
|
|
14.7:1
|
|
15.2:1
|
|
16.2:1
|
|
16.5:1
|
|
||||||||||
|
|
|
|
|
|
|
|
|
|||||||||||||
|
Essent Reinsurance Ltd.
|
|
|
|
|
|
|
|
|
||||||||||||
|
Stockholder's equity (GAAP basis)
|
$
|
662,819
|
|
$
|
401,273
|
|
$
|
220,178
|
|
$
|
155,123
|
|
$
|
389
|
|
|||||
|
Net risk in force(7)
|
$
|
6,299,437
|
|
$
|
4,181,737
|
|
$
|
2,364,692
|
|
$
|
835,976
|
|
N/A
|
|
||||||
_______________________________________________________________________________
|
(1)
|
Prior to the initial public offering ("IPO") which was completed on November 5, 2013, the Company had two classes of common shares outstanding: Class A common shares and Class B-2 common shares. The Class A common shares accrued a 10% cumulative dividend and the Class B-2 common shares had no stated dividend rate with any dividends being declared at the discretion of the Company's Board of Directors. Accordingly, earnings (loss) per common share was calculated using the "two-class" method which provides that earnings and losses be allocated to each class of common shares according to dividends declared and their respective participation rights. Substantially all of the net income for the periods prior to the IPO was allocated to the Class A common shares for purposes of determining earnings per share. Upon the completion of the IPO, all of the Class A common shares and the Class B-2 common shares converted into a single class of common shares (the "Common Shares"). The weighted average Common Shares outstanding for 2013 in the table above includes: (a) the weighted average Common Shares outstanding for the period from November 5, 2013 until December 31, 2013, and (b) the weighted average Class B-2 common shares outstanding (adjusted for the 2 for 3 share split) for the period from January 1, 2013 until the date of the conversion to Common Shares at the IPO. For purposes of determining EPS in 2013, the net income allocated to the Class B-2 common shares and all net income of the Company for the period following the IPO are allocated to the Common Shares.
|
|
(2)
|
New insurance written ("NIW") includes NIW on a flow basis (in which loans are insured in individual, loan-by-loan transactions) and bulk insurance that we write (in which each loan in a portfolio of loans is insured in a single transaction).
|
|
(3)
|
Loss ratio is calculated by dividing the provision for losses and loss adjustment expenses ("LAE") by net premiums earned.
|
53
|
(4)
|
Expense ratio is calculated by dividing other underwriting and operating expenses by net premiums earned.
|
|
(5)
|
Combined statutory capital equals the sum of statutory capital of Essent Guaranty, Inc. plus Essent Guaranty of PA, Inc., after eliminating the impact of intercompany transactions.
|
|
(6)
|
Combined risk-to-capital ratio equals the sum of net risk in force of Essent Guaranty, Inc. and Essent Guaranty of PA, Inc. divided by combined statutory capital.
|
|
(7)
|
Net risk in force represents total risk in force, net of reinsurance ceded and net of exposures on policies for which loss reserves have been established.
|
54
The following discussion should be read in conjunction with the "Selected Financial Data" and our financial statements and related notes thereto included elsewhere in this report. In addition to historical information, this discussion contains forward-looking statements that involve risks, uncertainties and assumptions that could cause actual results to differ materially from management’s expectations. Factors that could cause such differences are discussed in the sections entitled "Special Note Regarding Forward-Looking Statements" and "Risk Factors." We are not undertaking any obligation to update any forward-looking statements or other statements we may make in the following discussion or elsewhere in this document even though these statements may be affected by events or circumstances occurring after the forward-looking statements or other statements were made.
Overview
We are an established and growing private mortgage insurance company. We were formed to serve the U.S. housing finance industry at a time when the demands of the financial crisis and a rapidly changing business environment created the need for a new, privately funded mortgage insurance company. We believe that our success in acquiring customers and growing our insurance in force has been driven by the unique opportunity we offer lenders to partner with a well-capitalized mortgage insurer, unencumbered by business originated prior to the financial crisis, that provides fair and transparent claims payment practices, and consistency and speed of service. Essent Guaranty, Inc., our wholly-owned insurance subsidiary, is licensed to write coverage in all 50 states and the District of Columbia. The financial strength of Essent Guaranty, Inc. is rated
Baa1
with a
stable
outlook by Moody's Investors Service ("Moody's") and
BBB+
with a
stable
outlook by S&P Global Ratings ("S&P").
We had master policy relationships with approximately
1,420
customers as of
December 31, 2017
. Our top ten customers represented approximately
45.8%
,
35.1%
and
36.6%
of our new insurance written, or NIW, on a flow basis for the
years ended December 31, 2017
,
2016
and
2015
, respectively. Our holding company is domiciled in Bermuda and our U.S. insurance business is headquartered in Radnor, Pennsylvania. We operate additional underwriting and service centers in Winston-Salem, North Carolina and Irvine, California. We have a highly experienced, talented team with
397
employees as of
December 31, 2017
. For the years ended
December 31, 2017
,
2016
and
2015
, we generated NIW of approximately
$43.9 billion
,
$34.9 billion
and
$26.2 billion
, respectively. As of
December 31, 2017
, we had approximately
$110.5 billion
of insurance in force.
We also offer mortgage-related insurance and reinsurance through our wholly-owned Bermuda-based subsidiary, Essent Reinsurance Ltd., which we refer to as "Essent Re." As of
December 31, 2017
, Essent Re provided insurance or reinsurance relating to the risk in force on loans in reference pools acquired by Freddie Mac and Fannie Mae covering approximately
$538.9 million
of risk, including in connection with Freddie Mac's Agency Credit Insurance Structure ("ACIS") and Fannie Mae's Credit Insurance Risk Transfer ("CIRT") programs. Essent Re has also reinsured 25% of Essent Guaranty, Inc.'s GSE-eligible mortgage insurance NIW originated since July 1, 2014 under a quota share reinsurance agreement. The insurer financial strength rating of Essent Re is
BBB+
with a
stable
outlook by S&P.
Legislative and Regulatory Developments
Our results are significantly impacted by, and our future success may be affected by, legislative and regulatory developments affecting the housing finance industry. Key regulatory and legislative developments that may affect us include:
Housing Finance, GSE Reform and GSE Qualified Mortgage Insurer Requirements
Because a substantial majority of our current and expected future business is the provision of mortgage insurance on loans sold to the GSEs, changes to the business practices of the GSEs or any regulation relating to the GSEs may impact our business and our results of operations. The Federal Housing Finance Agency ("FHFA") is the regulator and conservator of the GSEs with authority to control and direct their operations. The FHFA has directed, and is likely to continue to direct, changes to the business operations of the GSEs in ways that affect the mortgage insurance industry.
It is likely that Federal legislation will be necessary to resolve the conservatorship of the GSEs, and such legislation could materially affect the role and charter of the GSEs and the operation of the housing finance system. In 2011, the U.S. Department of the Treasury recommended options for winding down the GSEs and using a combination of Federal housing policy changes to contract the government's footprint in housing finance and restore a larger role for private capital. Since 2011, members of Congress have introduced several bills intended to reform the secondary market and the role of the GSEs, although no comprehensive housing finance or GSE reform legislation has been enacted to date. On January 16, 2018, the FHFA offered its own perspectives on housing finance reform in a communication to Congressional leaders, including a proposal to privatize the GSEs with an explicit guarantee from the U.S. Government for catastrophic losses on their mortgage-backed securities in
55
return for fees paid into a reserve fund. See "Business—Regulation—Federal Mortgage-Related Laws and Regulations—Housing Finance Reform," "Risk Factors—Risks Relating to Our Business—
Legislative or regulatory actions or decisions to change the role of the GSEs in the U.S. housing market generally, or changes to the charters of the GSEs with regard to the use of credit enhancements generally and private mortgage insurance specifically, could reduce our revenues or adversely affect our profitability and returns,
" and "—
Changes in the business practices of the GSEs, including actions or decisions to decrease or discontinue the use of mortgage insurance or changes in the GSEs' eligibility requirements for mortgage insurers, could reduce our revenues or adversely affect our profitability and returns.
"
Effective December 31, 2015, Fannie Mae and Freddie Mac, at the direction of the FHFA, implemented new coordinated Private Mortgage Insurer Eligibility Requirements, which we refer to as the "PMIERs." The PMIERs represent the standards by which private mortgage insurers are eligible to provide mortgage insurance on loans owned or guaranteed by Fannie Mae and Freddie Mac. The PMIERs include financial strength requirements incorporating a risk-based framework that require approved insurers to have a sufficient level of liquid assets from which to pay claims. The PMIERs also include enhanced operational performance expectations and define remedial actions that apply should an approved insurer fail to comply with these requirements. As of
December 31, 2017
, Essent Guaranty, Inc., our GSE-approved mortgage insurance company, was in compliance with the PMIERs.
Based on a confidential draft proposal that we received from the GSEs, we believe that updated PMIERs may be finalized in the first half of 2018 and become effective no sooner than the second half of 2018, 180 days after their release.
Dodd-Frank Act
Various regulatory agencies have produced, and are now in the process of developing additional, new rules under the Dodd-Frank Act that are expected to have a significant impact on the housing finance industry, including the Qualified Mortgage, or QM, definition and the risk retention requirement and related Qualified Residential Mortgage, or QRM, definition.
QM Definition
Under the Dodd-Frank Act, the Consumer Financial Protection Bureau ("CFPB") is authorized to issue regulations governing a loan originator's determination that, at the time a loan is originated, the consumer has a reasonable ability to repay the loan. The Dodd-Frank Act provides a statutory presumption that a borrower will have the ability to repay a loan if the loan has characteristics satisfying the QM definition. Under the CFPB's final rule regarding QMs, which we refer to as the "QM Rule", a loan is deemed to be a QM if it has certain loan features, satisfies extensive documentation requirements and meets limitations on fees and points and APRs. The QM Rule provides a "safe harbor" for QM loans with annual percentage rates, or APRs, below the threshold of 150 basis points over the Average Prime Offer Rate, or APOR, and a "rebuttable presumption" for QM loans with an APR above that threshold.
We expect that most lenders will be reluctant to make non-QM loans because they will not be entitled to the presumption against civil liability under the Dodd-Frank Act, and mortgage investors may be reluctant to purchase mortgages or mortgage-backed securities that are not QMs due to potential assignee liability for such loans. As a result, we believe that the QM regulations have a direct impact on establishing a subset of borrowers who can meet the regulatory standards and directly affect the willingness of lenders and mortgage investors to extend mortgage credit and therefore the size of the residential mortgage market. To the extent the use of private mortgage insurance causes a loan not to meet the definition of a QM, the volume of loans originated with mortgage insurance may decline. In addition, the impact of the mortgage insurance premiums on the calculation of points and fees for purposes of QM may influence the use of mortgage insurance, as well as our mix of premium plans and therefore our profitability. See "—Factors Affecting Our Results of Operations—Persistency and Business Mix" and "Risk Factors—Risks Relating to Our Business—
Our business prospects and operating results could be adversely impacted if, and to the extent that, the Consumer Financial Protection Bureau's ("CFPB") final rule defining a qualified mortgage ("QM") reduces the size of the origination market or creates incentives to use government mortgage insurance programs."
Risk Retention Requirements and QRM Definition
The Dodd-Frank Act provides for an originator or issuer risk retention requirement on securitized mortgage loans that do not meet the definition of a QRM. The QRM regulations align the definition of a QRM loan with that of a QM loan. If, however, the QRM definition is changed (or the QM definition is amended) in a manner that is unfavorable to us, such as to give no consideration to mortgage insurance in computing LTV or to require a large down payment for a loan to qualify as a QRM, the attractiveness of originating and securitizing loans with lower down payments may be reduced, which may adversely affect the future demand for mortgage insurance. See "Business—Regulation—Federal Mortgage-Related Laws and Regulation
56
—Dodd-Frank Act—Qualified Residential Mortgage Regulations—Risk Retention Requirements" and "Risk Factors—Risks Relating to Our Business—
The amount of insurance we write could be adversely affected by the implementation of the Dodd-Frank Act's risk retention requirements and the definition of Qualified Residential Mortgage ("QRM")
."
FHA Reform
We compete with the single-family mortgage insurance programs of the FHA, which is part of the Department of Housing and Urban Development. The most recent FHA report to Congress dated
November 15, 2017
on the financial status of the FHA's Mutual Mortgage Insurance Fund, or MMIF, showed the capital reserve ratio of the MMIF at
2.09%
, above the Congressionally mandated required minimum level of 2%. As a result of the financial improvements in the condition of the MMIF over the past few years and the stated desire to support the housing recovery, the FHA reduced its mortgage insurance premiums by 50 basis points in January 2015. See "Risk Factors—Risks Relating to Our Business—
The amount of insurance we may be able to write could be adversely affected if lenders and investors select alternatives to private mortgage insurance.
"
Tax Reform
On December 22, 2017, the “Tax Cuts and Jobs Act” (“TCJA”) was enacted. The provisions of TCJA include broad tax reforms that are applicable to the Company, including a reduction in the U.S. corporate tax rate from 35% to 21% effective January 1, 2018. This change in tax rates required us to remeasure our deferred tax assets and liabilities as of the enactment date resulting in a one-time $85.1 million income tax benefit in the accompanying consolidated statement of comprehensive income for the year ended December 31, 2017. In addition, TCJA includes a base erosion and anti-abuse tax (“BEAT”). The BEAT is an alternative tax which must be paid if it is greater than the Company's regular tax liability. This alternative base erosion tax, if applicable, may limit or eliminate the tax benefit associated with certain base erosion payments. Premiums ceded by Essent Guaranty, Inc. under the quota share reinsurance agreement to Essent Re are considered base erosion payments under TCJA. The Company may be subject to the BEAT tax in future periods depending on the earnings of the Company’s U.S. insurance companies and the level of premiums ceded to Essent Re. See "Risk Factors—Risks Relating to Taxes—
Proposed U.S. tax legislation could have an adverse impact on us or holders of our common shares.
"
Factors Affecting Our Results of Operations
Net Premiums Written and Earned
Premiums associated with our U.S. mortgage insurance business are based on insurance in force, or IIF, during all or a portion of a period. A change in the average IIF during a period causes premiums to increase or decrease as compared to prior periods. Average premium rates in effect during a given period will also cause premiums to differ when compared to earlier periods. IIF at the end of a reporting period is a function of the IIF at the beginning of such reporting period plus NIW less policy cancellations (including claims paid) during the period. As a result, premiums are generally influenced by:
|
•
|
NIW, which is the aggregate principal amount of the new mortgages that are insured during a period. Many factors affect NIW, including, among others, the volume of low down payment home mortgage originations and the competition to provide credit enhancement on those mortgages;
|
|
•
|
Cancellations of our insurance policies, which are impacted by payments on mortgages, home price appreciation, or refinancings, which in turn are affected by mortgage interest rates. Cancellations are also impacted by the levels of claim payments and rescissions;
|
|
•
|
Premium rates, which represent the amount of the premium due as a percentage of IIF. Premium rates are based on the risk characteristics of the loans insured, the percentage of coverage on the loans, competition from other mortgage insurers and general industry conditions; and
|
|
•
|
Premiums ceded or assumed under reinsurance arrangements. To date, we have not ceded any premiums under third-party reinsurance contracts.
|
Premiums are paid either on a monthly installment basis ("monthly premiums"), in a single payment at origination ("single premiums"), or in some cases as an annual premium. For monthly premiums, we receive a monthly premium payment which is recorded as net premiums earned in the month the coverage is provided. Monthly premium payments are based on the
original mortgage amount rather than the amortized loan balance. Net premiums written may be in excess of net premiums earned due to single premium policies. For single premiums, we receive a single premium payment at origination, which is recorded as
57
"unearned premium" and earned over the estimated life of the policy, which ranges from 36 to 156 months depending on the term of the underlying mortgage and loan-to-value ratio at date of origination. If single premium policies are cancelled due to repayment of the underlying loan and the premium is non-refundable, the remaining unearned premium balance is immediately recognized as earned premium revenue. Substantially all of our single premium policies in force as of
December 31, 2017
were non-refundable. Premiums collected on annual policies are recognized as net premiums earned on a straight-line basis over the year of coverage. For the year ended
December 31, 2017
, monthly and single premium policies comprised
83.7%
and
16.3%
of our NIW, respectively.
Premiums associated with our GSE risk share transactions are based on the level of risk in force.
Persistency and Business Mix
The percentage of IIF that remains on our books after any 12-month period is defined as our persistency rate. Because our insurance premiums are earned over the life of a policy, higher persistency rates can have a significant impact on our profitability. The persistency rate on our portfolio was
83.9%
at
December 31, 2017
. Generally, higher prepayment speeds lead to lower persistency.
Prepayment speeds and the relative mix of business between single premium policies and monthly premium policies also impact our profitability. Our premium rates include certain assumptions regarding repayment or prepayment speeds of the mortgages. Because premiums are paid at origination on single premium policies, assuming all other factors remain constant, if loans are prepaid earlier than expected, our profitability on these loans is likely to increase and, if loans are repaid slower than expected, our profitability on these loans is likely to decrease. By contrast, if monthly premium loans are repaid earlier than anticipated, our premium earned with respect to those loans and therefore our profitability declines. Currently, the expected return on single premium policies is less than the expected return on monthly policies.
Net Investment Income
Our investment portfolio was predominantly comprised of investment-grade fixed income securities and money market funds as of
December 31, 2017
. The principal factors that influence investment income are the size of the investment portfolio and the yield on individual securities. As measured by amortized cost (which excludes changes in fair market value, such as from changes in interest rates), the size of our investment portfolio is mainly a function of increases in capital and cash generated from or used in operations which is impacted by net premiums received, investment earnings, net claim payments and expenses. Realized gains and losses are a function of the difference between the amount received on the sale of a security and the security's amortized cost, as well as any "other-than-temporary" impairments recognized in earnings. The amount received on the sale of fixed income securities is affected by the coupon rate of the security compared to the yield of comparable securities at the time of sale.
Other Income
In connection with the acquisition of our mortgage insurance platform, we entered into a services agreement with Triad Guaranty Inc. and its wholly-owned subsidiary, Triad Guaranty Insurance Corporation, which we refer to collectively as "Triad," to provide certain information technology maintenance and development and customer support-related services. In return for these services, we receive a fee which is recorded in other income. This fee is adjusted monthly based on the number of Triad’s mortgage insurance policies in force and, accordingly, will decrease over time as Triad’s existing policies are cancelled. The services agreement was automatically extended until November 30, 2018 and provides for one subsequent one-year renewal at Triad’s option. See
Note 5
to our consolidated financial statements.
Other income also includes revenues associated with contract underwriting services and changes in the fair value of derivative instruments. The level of contract underwriting revenue is dependent upon the number of customers who have engaged us for this service and the number of loans underwritten for these customers. Through June 30, 2016, the insurance and certain of the reinsurance policies issued by Essent Re in connection with the ACIS program were previously accounted for as derivatives under U.S. generally accepted accounting principles ("GAAP") with the fair value of these policies reported as an asset or liability and changes in the fair value of these policies reported in earnings. Changes in the fair value of these policies were impacted by changes in market observable factors. In the quarter ended September 30, 2016, these policies were amended and are now accounted for as insurance rather than as derivatives. See
Note 16
to our consolidated financial statements.
58
Provision for Losses and Loss Adjustment Expenses
The provision for losses and loss adjustment expenses reflects the current expense that is recorded within a particular period to reflect actual and estimated loss payments that we believe will ultimately be made as a result of insured loans that are in default.
Losses incurred are generally affected by:
|
•
|
the overall state of the economy, which broadly affects the likelihood that borrowers may default on their loans and have the ability to cure such defaults;
|
|
•
|
changes in housing values, which affect our ability to mitigate our losses through the sale of properties with loans in default as well as borrower willingness to continue to make mortgage payments when the value of the home is below or perceived to be below the mortgage balance;
|
|
•
|
the product mix of IIF, with loans having higher risk characteristics generally resulting in higher defaults and claims;
|
|
•
|
the size of loans insured, with higher average loan amounts tending to increase losses incurred;
|
|
•
|
the loan-to-value ratio, with higher average loan-to-value ratios tending to increase losses incurred;
|
|
•
|
the percentage of coverage on insured loans, with deeper average coverage tending to increase losses incurred;
|
|
•
|
credit quality of borrowers, including higher debt-to-income ratios and lower FICO scores, which tend to increase incurred losses;
|
|
•
|
the rate at which we rescind policies. Because of tighter underwriting standards generally in the mortgage lending industry and terms set forth in our master policy, we expect that our level of rescission activity will be lower than rescission activity seen in the mortgage insurance industry for vintages originated prior to the financial crisis; and
|
|
•
|
the distribution of claims over the life of a book. The average age of our insurance portfolio is young with
81%
of our IIF as of
December 31, 2017
having been originated since January 1,
2015
. As a result, based on historical industry performance, we expect the number of defaults and claims we experience, as well as our provision for losses and loss adjustment expenses, to increase as our portfolio seasons. See "—Mortgage Insurance Earnings and Cash Flow Cycle" below.
|
We establish loss reserves for delinquent loans when we are notified that a borrower has missed at least two consecutive monthly payments ("Case Reserves"), as well as estimated reserves for defaults that may have occurred but not yet been reported to us ("IBNR Reserves"). We also establish reserves for the associated loss adjustment expenses ("LAE"), consisting of the estimated cost of the claims administration process, including legal and other fees. Using both internal and external information, we establish our reserves based on the likelihood that a default will reach claim status and estimated claim severity. See "—Critical Accounting Policies" for further information.
We believe, based upon our experience and industry data, that claims incidence for mortgage insurance is generally highest in the third through sixth years after loan origination. As of
December 31, 2017
,
81%
of our IIF relates to business written since January 1,
2015
and was less than three years old. Although the claims experience on new insurance written by us to date has been favorable, we expect incurred losses and claims to increase as a greater amount of this book of insurance reaches its anticipated period of highest claim frequency. The actual default rate and the average reserve per default that we experience as our portfolio matures is difficult to predict and is dependent on the specific characteristics of our current in-force book (including the credit score of the borrower, the loan-to-value ratio of the mortgage, geographic concentrations, etc.), as well as the profile of new business we write in the future. In addition, the default rate and the average reserve per default will be affected by future macroeconomic factors such as housing prices, interest rates and employment.
During the third quarter of 2017, certain regions of the U.S. experienced hurricanes which have impacted our insured portfolio’s performance. Specifically, on August 26, 2017, Hurricane Harvey made landfall in southeastern Texas and on September 10, 2017, Hurricane Irma made landfall in southern Florida and caused property damage in certain counties. Loans in default increased by
3,026
in the year ended December 31, 2017, including
2,288
defaults we identified as hurricane-related defaults. Based on prior industry experience, we expect the ultimate number of hurricane-related defaults that result in claims will be less than the default-to-claim experience of non-hurricane-related defaults. In addition, under our master policy, our
59
exposure may be limited on hurricane-related claims. For example, we are permitted to exclude a claim entirely where damage to the property underlying a mortgage was the proximate cause of the default and adjust a claim where the property underlying a mortgage in default is subject to unrestored physical damage. Accordingly, when establishing our loss reserves as of December 31, 2017, we applied a lower estimated claim rate to new default notices received in the fourth quarter of 2017 from the affected areas than the claim rate we apply to other notices in our default inventory. The impact on our reserves in future periods will be dependent upon the performance of the hurricane-related defaults and our expectations for the amount of ultimate losses on these delinquencies.
Other Underwriting and Operating Expenses
Our other underwriting and operating expenses include components that are substantially fixed, as well as expenses that generally increase or decrease in line with the level of NIW.
Our most significant expense is compensation and benefits for our employees, which represented
63%
,
64%
and
64%
of other underwriting and operating expenses for the years ended December 31,
2017
,
2016
and
2015
, respectively. Compensation and benefits expense includes base and incentive cash compensation, stock compensation expense, benefits and payroll taxes. Compensation and benefits expense has steadily increased as we have increased our staffing from
332
employees at January 1,
2015
to
397
at December 31,
2017
, primarily in our business development and operations functions to support the growth of our business. The growth in our sales organization contributed to the growth of our active customers and NIW. We also expanded our underwriting and customer service teams to support this new business.
Underwriting and other expenses include legal, consulting, other professional fees, premium taxes, travel, entertainment, marketing, licensing, supplies, hardware, software, rent, utilities, depreciation and amortization and other expenses. We anticipate that as we continue to add customers and increase our IIF, our expenses will also continue to increase. In addition, as a result of the increase in our IIF, we expect that our net premiums earned will grow faster than our underwriting and other expenses resulting in a decline in our expense ratio for the full year 2018 as compared to 2017.
Interest Expense
Interest expense is incurred as a result of borrowings under our amended and restated
four
-year, secured credit facility with a committed capacity of
$375 million
(the “Credit Facility”). Borrowings under the Credit Facility may be used for working capital and general corporate purposes, including, without limitation, capital contributions to Essent’s insurance and reinsurance subsidiaries. Borrowings accrue interest at a floating rate tied to a standard short-term borrowing index, selected at the Company’s option, plus an applicable margin.
Income Taxes
Income taxes are incurred based on the amount of earnings or losses generated in the jurisdictions in which we operate and the applicable tax rates and regulations in those jurisdictions. Our U.S. insurance subsidiaries are generally not subject to income taxes in the states in which we operate; however, our non-insurance subsidiaries are subject to state income taxes. In lieu of state income taxes, our insurance subsidiaries pay premium taxes that are recorded in other underwriting and operating expenses.
Essent Group Ltd. and its wholly-owned subsidiary, Essent Re, are domiciled in Bermuda, which does not have a corporate income tax. Effective July 2014, Essent Re began to reinsure 25% of GSE-eligible new insurance written of Essent Guaranty, Inc., an affiliate. Essent Re also provides insurance and reinsurance to Freddie Mac and Fannie Mae.
The amount of income tax expense or benefit recorded in future periods will be dependent on the jurisdictions in which we operate and the tax laws and regulations in effect.
Mortgage Insurance Earnings and Cash Flow Cycle
In general, the majority of any underwriting profit (premium revenue minus losses) that a book generates occurs in the early years of the book, with the largest portion of any underwriting profit realized in the first year. Subsequent years of a book generally result in modest underwriting profit or underwriting losses. This pattern generally occurs because relatively few of the claims that a book will ultimately experience typically occur in the first few years of the book, when premium revenue is highest, while subsequent years are affected by declining premium revenues, as the number of insured loans decreases (primarily due to loan prepayments), and by increasing losses.
60
Key Performance Indicators
Insurance In Force
As discussed above, premiums we collect and earn are generated based on our IIF, which is a function of our NIW and cancellations. From 2010, when we first began writing policies, through December 31,
2017
, we have increased our NIW annually. We have also grown the number of customers who have approved us to provide mortgage insurance over this period, as well as increased our NIW from certain customers. The following table includes a summary of the change in our IIF for the years ended December 31,
2017
,
2016
and
2015
for our U.S. mortgage insurance portfolio. In addition, this table includes our risk in force ("RIF") at the end of each period.
|
|
Year Ended December 31,
|
|||||||||||
|
($ in thousands)
|
2017
|
2016
|
2015
|
|||||||||
|
IIF, beginning of period
|
$
|
83,265,522
|
|
$
|
65,242,453
|
|
$
|
50,762,594
|
|
|||
|
NIW
|
43,858,322
|
|
34,949,319
|
|
26,193,656
|
|
||||||
|
Cancellations
|
(16,661,894
|
)
|
(16,926,250
|
)
|
(11,713,797
|
)
|
||||||
|
IIF, end of period
|
$
|
110,461,950
|
|
$
|
83,265,522
|
|
$
|
65,242,453
|
|
|||
|
Average IIF during the period
|
$
|
96,039,418
|
|
$
|
72,970,600
|
|
$
|
57,754,846
|
|
|||
|
RIF, end of period
|
$
|
27,443,985
|
|
$
|
20,627,317
|
|
$
|
16,073,174
|
|
|||
The following is a summary of our IIF at
December 31, 2017
by vintage:
|
($ in thousands)
|
$
|
%
|
|||||
|
2017
|
$
|
42,058,537
|
|
38.1
|
%
|
||
|
2016
|
30,252,690
|
|
27.4
|
|
|||
|
2015
|
17,283,506
|
|
15.6
|
|
|||
|
2014
|
10,794,703
|
|
9.8
|
|
|||
|
2013
|
6,905,742
|
|
6.2
|
|
|||
|
2012 and prior
|
3,166,772
|
|
2.9
|
|
|||
|
|
$
|
110,461,950
|
|
100.0
|
%
|
||
Average Premium Rate
Our average premium rate is dependent on a number of factors, including: (1) the risk characteristics and average coverage on the mortgages we insure; (2) the mix of monthly premiums compared to single premiums in our portfolio; (3) cancellations of non-refundable single premiums during the period; and (4) changes to our pricing. For the years ended December 31,
2017
,
2016
and
2015
, our average premium rate was
0.53%
,
0.57%
and
0.56%
, respectively.
Persistency Rate
The measure for assessing the impact of policy cancellations on IIF is our persistency rate, defined as the percentage of IIF that remains on our books after any twelve-month period. See additional discussion regarding the impact of the persistency rate on our performance in "—Factors Affecting Our Results of Operations—Persistency and Business Mix."
Risk-to-Capital
The risk-to-capital ratio has historically been used as a measure of capital adequacy in the U.S. mortgage insurance industry and is calculated as a ratio of net risk in force to statutory capital. Net risk in force represents total risk in force net of reinsurance ceded and net of exposures on policies for which loss reserves have been established. Statutory capital for our U.S. insurance companies is computed based on accounting practices prescribed or permitted by the Pennsylvania Insurance Department. See additional discussion in "—Liquidity and Capital Resources—Insurance Company Capital."
As of
December 31, 2017
, our combined net risk in force for our U.S. insurance companies was
$21.6 billion
and our combined statutory capital was
$1.5 billion
, resulting in a risk-to-capital ratio of
14.2:1
. The amount of capital required varies
61
in each jurisdiction in which we operate; however, generally, the maximum permitted risk-to-capital ratio is 25.0 to 1. State insurance regulators are currently examining their respective capital rules to determine whether, in light of the recent financial crisis, changes are needed to more accurately assess mortgage insurers' ability to withstand stressful economic conditions. As a result, the capital metrics under which they assess and measure capital adequacy may change in the future. Independent of the state regulator and GSE capital requirements, management continually assesses the risk of our insurance portfolio and current market and economic conditions to determine the appropriate levels of capital to support our business.
Results of Operations
The following table sets forth our results of operations for the periods indicated:
|
|
Year Ended December 31,
|
|||||||||||
|
Summary of Operations
(In thousands)
|
2017
|
2016
|
2015
|
|||||||||
|
Revenues:
|
|
|
|
|
|
|
||||||
|
Net premiums written
|
$
|
570,186
|
|
$
|
441,278
|
|
$
|
370,568
|
|
|||
|
Increase in unearned premiums
|
(40,056
|
)
|
(18,571
|
)
|
(44,097
|
)
|
||||||
|
Net premiums earned
|
530,130
|
|
422,707
|
|
326,471
|
|
||||||
|
Net investment income
|
40,226
|
|
27,890
|
|
19,885
|
|
||||||
|
Realized investment gains, net
|
2,015
|
|
1,934
|
|
2,554
|
|
||||||
|
Other income
|
4,140
|
|
5,727
|
|
4,380
|
|
||||||
|
Total revenues
|
576,511
|
|
458,258
|
|
353,290
|
|
||||||
|
Losses and expenses:
|
|
|
|
|
|
|
||||||
|
Provision for losses and LAE
|
27,232
|
|
15,525
|
|
11,905
|
|
||||||
|
Other underwriting and operating expenses
|
145,533
|
|
130,425
|
|
112,987
|
|
||||||
|
Interest expense
|
5,178
|
|
426
|
|
—
|
|
||||||
|
Total losses and expenses
|
177,943
|
|
146,376
|
|
124,892
|
|
||||||
|
Income before income taxes
|
398,568
|
|
311,882
|
|
228,398
|
|
||||||
|
Income tax expense
|
18,821
|
|
89,276
|
|
71,067
|
|
||||||
|
Net income
|
$
|
379,747
|
|
$
|
222,606
|
|
$
|
157,331
|
|
|||
Year Ended
December 31, 2017
Compared to the Year Ended
December 31, 2016
For the year ended
December 31, 2017
, we reported net income of
$379.7 million
, compared to net income of
$222.6 million
for the year ended
December 31, 2016
. The
increase
in our operating results in
2017
over
2016
was primarily due to the
increase
in net premiums earned associated with the growth of our IIF, the increase in net investment income and the decrease in income taxes due largely to an
$85.1 million
income tax benefit associated with the one-time impact of the reduced U.S. corporate income tax rate on the company's net deferred tax liability position. These increases were partially offset by increases in other underwriting and operating expenses, the provision for losses and loss adjustment expenses and interest expense.
Net Premiums Written and Earned
Net premiums earned
increase
d in the year ended
December 31, 2017
by
25%
compared to the year ended
December 31, 2016
primarily due to the
increase
in our average IIF from
$73.0 billion
in
2016
to
$96.0 billion
in
2017
, partially offset by the decrease in average premium rate from
0.57%
for the year ended
December 31, 2016
to
0.53%
for the year ended
December 31, 2017
. The decrease in the average premium rate during the year ended
December 31, 2017
is due primarily to the decrease in premium earned on the cancellation of non-refundable single premium policies.
Net premiums written
increase
d in the year ended
December 31, 2017
by
29%
over the prior year. The increase was due primarily to the increase in average IIF of
32%
for the year ended
December 31, 2017
as compared to the year ended
December 31, 2016
.
62
In the year ended
December 31, 2017
, unearned premiums
increase
d by
$40.1 million
as a result of net premiums written on single premium policies of
$114.3 million
which was partially offset by
$74.2 million
of unearned premium that was recognized in earnings during the year. In the year ended
December 31, 2016
, unearned premiums increased by
$18.6 million
as a result of net premiums written on single premium policies of
$99.4 million
which was partially offset by
$80.8 million
of unearned premium that was recognized in earnings during the year. Included in unearned premium recognized was
$23.2 million
and
$36.9 million
related to policy cancellations for the year ended December 31,
2017
and
2016
, respectively.
Net Investment Income
Our net investment income was derived from the following sources for the periods indicated:
|
|
Year Ended December 31,
|
|||||||
|
(In thousands)
|
2017
|
2016
|
||||||
|
Fixed maturities
|
$
|
41,935
|
|
$
|
29,865
|
|
||
|
Short-term investments
|
1,019
|
|
142
|
|
||||
|
Gross investment income
|
42,954
|
|
30,007
|
|
||||
|
Investment expenses
|
(2,728
|
)
|
(2,117
|
)
|
||||
|
Net investment income
|
$
|
40,226
|
|
$
|
27,890
|
|
||
The
increase
in net investment income to
$40.2 million
for the year ended December 31,
2017
as compared to
$27.9 million
for the year ended December 31,
2016
was due to the
increase
in the weighted average balance of our investment portfolio and the increase in the pre-tax investment income yield. The average cash and investment portfolio balance increased to
$1.9 billion
during the year ended December 31,
2017
from
$1.4 billion
during the year ended December 31,
2016
, primarily as a result of investing cash flows generated from operations, proceeds from the public offering of common shares completed in August and borrowings under our Credit Facility. The pre-tax investment income yield increased from
2.1%
in the year ended December 31,
2016
to
2.2%
in the year ended December 31,
2017
primarily due to the increase in the portion of our investment portfolio invested in spread and duration assets. The pre-tax investment income yields are calculated based on amortized cost and exclude investment expenses. See "—Liquidity and Capital Resources" for further details of our investment portfolio.
Other Income
Other income includes fees earned for information technology and customer support services provided to Triad and contract underwriting revenues. In 2016, other income also included changes in the fair value of the insurance and certain reinsurance policies issued by Essent Re under the ACIS program. These policies were amended in the three months ended September 30, 2016 and are accounted for as insurance rather than as derivatives subsequent to their amendment. The
decrease
in other income for the year ended December 31,
2017
as compared to the same period in
2016
, was primarily due to the favorable net valuation adjustments recorded in 2016 associated with ACIS contracts formerly accounted for as insurance rather than as derivatives, and the decrease in Triad service fees associated with the reduction in the number of Triad's mortgage insurance policies in force. The fees earned from Triad will continue to decrease over time as Triad's existing policies are cancelled.
Provision for Losses and Loss Adjustment Expenses
The
increase
in the provision for losses and LAE in
2017
as compared to
2016
was primarily due to the
increase
in the number of insured loans in default, partially offset by previously identified defaults that cured.
63
The following table presents a rollforward of insured loans in default for the periods indicated:
|
|
Year Ended December 31,
|
|||||
|
|
2017
|
2016
|
||||
|
Beginning default inventory
|
1,757
|
|
1,028
|
|
||
|
Plus: new defaults
|
8,229
|
|
3,746
|
|
||
|
Less: cures
|
(4,970
|
)
|
(2,857
|
)
|
||
|
Less: claims paid
|
(229
|
)
|
(154
|
)
|
||
|
Less: rescissions and denials, net
|
(4
|
)
|
(6
|
)
|
||
|
Ending default inventory
|
4,783
|
|
1,757
|
|
||
The
increase
in the number of defaults at December 31,
2017
compared to December 31,
2016
was primarily due to the
increase
in defaulted loans in the areas impacted by Hurricanes Harvey and Irma, as well as the increase in our IIF and policies in force, along with further seasoning of our insurance portfolio. In 2017, loans in default increased by a total of
3,026
, including
2,288
defaults we identified as hurricane-related defaults.
The following table includes additional information about our loans in default as of the dates indicated:
|
|
As of December 31,
|
|||||||
|
|
2017
|
2016
|
||||||
|
Case reserves (in thousands)
|
$
|
42,868
|
|
$
|
25,758
|
|
||
|
Total reserves (in thousands)
|
$
|
46,850
|
|
$
|
28,142
|
|
||
|
Ending default inventory
|
4,783
|
|
1,757
|
|
||||
|
Average case reserve per default (in thousands)
|
$
|
9.0
|
|
$
|
14.7
|
|
||
|
Average total reserve per default (in thousands)
|
$
|
9.8
|
|
$
|
16.0
|
|
||
|
Default rate
|
0.96
|
%
|
0.47
|
%
|
||||
|
Claims received included in ending default inventory
|
45
|
|
44
|
|
||||
The decrease in the average total reserve per default was primarily due to a lower total reserve per hurricane-related default. Based on prior industry experience, we expect the ultimate number of hurricane-related defaults that result in claims will be less than the default-to-claim experience of non-hurricane-related defaults. Accordingly, when establishing our loss reserves as of December 31, 2017, we applied a lower estimated claim rate to new default notices received in the fourth quarter of 2017 from the affected areas than the claim rate we apply to other notices in our default inventory. The reserve for losses and LAE on hurricane-related defaults was $11.1 million at December 31, 2017. Also contributing to the decrease in the average case reserve per default were changes in the composition (such as mark-to-market loan-to-value ratios, risk in force, and number of months past due) of the underlying loans in default and improvements in economic fundamentals.
The following tables provide a reconciliation of the beginning and ending reserve balances for losses and LAE and a detail of reserves and defaulted RIF by the number of missed payments and pending claims:
|
|
Year Ended December 31,
|
|||||||
|
(In thousands)
|
2017
|
2016
|
||||||
|
Reserve for losses and LAE at beginning of year
|
$
|
28,142
|
|
$
|
17,760
|
|
||
|
Add provision for losses and LAE occurring in:
|
||||||||
|
Current year
|
38,178
|
|
21,889
|
|
||||
|
Prior years
|
(10,946
|
)
|
(6,364
|
)
|
||||
|
Incurred losses during the current year
|
27,232
|
|
15,525
|
|
||||
|
Deduct payments for losses and LAE occurring in:
|
||||||||
|
Current year
|
633
|
|
927
|
|
||||
|
Prior years
|
7,891
|
|
4,216
|
|
||||
|
Loss and LAE payments during the current year
|
8,524
|
|
5,143
|
|
||||
|
Reserve for losses and LAE at end of year
|
$
|
46,850
|
|
$
|
28,142
|
|
||
64
|
|
As of December 31, 2017
|
|||||||||||||||||||
|
($ in thousands)
|
Number of
Policies in Default |
Percentage of
Policies in Default |
Amount of
Reserves |
Percentage of
Reserves |
Defaulted
RIF |
Reserves as a
Percentage of Defaulted RIF |
||||||||||||||
|
Missed payments:
|
|
|
|
|
|
|
|
|
|
|
|
|
||||||||
|
Three payments or less
|
3,243
|
|
68
|
%
|
$
|
15,925
|
|
37
|
%
|
$
|
187,163
|
|
9
|
%
|
||||||
|
Four to eleven payments
|
1,284
|
|
27
|
|
18,087
|
|
42
|
|
73,547
|
|
25
|
|
||||||||
|
Twelve or more payments
|
211
|
|
4
|
|
6,781
|
|
16
|
|
11,139
|
|
61
|
|
||||||||
|
Pending claims
|
45
|
|
1
|
|
2,075
|
|
5
|
|
2,355
|
|
88
|
|
||||||||
|
Total case reserves
|
4,783
|
|
100
|
%
|
42,868
|
|
100
|
%
|
$
|
274,204
|
|
16
|
|
|||||||
|
IBNR
|
|
|
|
|
3,215
|
|
|
|
|
|
|
|
||||||||
|
LAE and other
|
|
|
|
|
767
|
|
|
|
|
|
|
|
||||||||
|
Total reserves for losses and LAE
|
|
|
|
|
$
|
46,850
|
|
|
|
|
|
|
|
|||||||
|
|
As of December 31, 2016
|
|||||||||||||||||||
|
($ in thousands)
|
Number of
Policies in Default |
Percentage of
Policies in Default |
Amount of
Reserves |
Percentage of
Reserves |
Defaulted
RIF |
Reserves as a
Percentage of Defaulted RIF |
||||||||||||||
|
Missed payments:
|
|
|
|
|
|
|
|
|
|
|
|
|
||||||||
|
Three payments or less
|
914
|
|
52
|
%
|
$
|
6,615
|
|
26
|
%
|
$
|
50,737
|
|
13
|
%
|
||||||
|
Four to eleven payments
|
620
|
|
35
|
|
11,505
|
|
45
|
|
32,833
|
|
35
|
|
||||||||
|
Twelve or more payments
|
179
|
|
10
|
|
5,678
|
|
22
|
|
9,575
|
|
59
|
|
||||||||
|
Pending claims
|
44
|
|
3
|
|
1,960
|
|
7
|
|
2,272
|
|
86
|
|
||||||||
|
Total case reserves
|
1,757
|
|
100
|
%
|
25,758
|
|
100
|
%
|
$
|
95,417
|
|
27
|
|
|||||||
|
IBNR
|
|
|
|
|
1,932
|
|
|
|
|
|
|
|
||||||||
|
LAE and other
|
|
|
|
|
452
|
|
|
|
|
|
|
|
||||||||
|
Total reserves for losses and LAE
|
|
|
|
|
$
|
28,142
|
|
|
|
|
|
|
|
|||||||
During the year ended December 31,
2017
, the provision for losses and LAE was
$27.2 million
, comprised of
$38.2 million
of current year losses partially offset by
$10.9 million
of
favorable
prior years' loss development. During the year ended December 31,
2016
, the provision for losses and LAE was
$15.5 million
, comprised of
$21.9 million
of current year losses partially offset by
$6.4 million
of
favorable
prior years' loss development. In both periods, the
favorable
prior years' loss development was the result of a re-estimation of amounts ultimately to be paid on prior year defaults in the default inventory, including the impact of previously identified defaults that cured.
The following table includes additional information about our claims paid and claim severity as of the dates indicated:
|
|
Year Ended December 31,
|
|||||||
|
($ in thousands)
|
2017
|
2016
|
||||||
|
Number of claims paid
|
229
|
|
154
|
|
||||
|
Amount of claims paid
|
$
|
8,280
|
|
$
|
5,028
|
|
||
|
Claim severity
|
83
|
%
|
73
|
%
|
||||
65
Other Underwriting and Operating Expenses
Following are the components of our other underwriting and operating expenses for the periods indicated:
|
|
Year Ended December 31,
|
|||||||||||||
|
|
2017
|
2016
|
||||||||||||
|
($ in thousands)
|
$
|
%
|
$
|
%
|
||||||||||
|
Compensation and benefits
|
$
|
90,964
|
|
63
|
%
|
$
|
84,044
|
|
64
|
%
|
||||
|
Other
|
54,569
|
|
37
|
|
46,381
|
|
36
|
|
||||||
|
|
$
|
145,533
|
|
100
|
%
|
$
|
130,425
|
|
100
|
%
|
||||
|
Number of employees at end of period
|
397
|
|
|
|
376
|
|
||||||||
The significant factors contributing to the change in other underwriting and operating expenses are:
|
•
|
Compensation and benefits increased primarily due to increases in the size of our workforce and stock compensation. Our workforce increased to
397
at December 31,
2017
from
366
at January 1,
2016
, as additional employees were hired to support the growth in our business, primarily in our business development and operations functions. Compensation and benefits includes salaries, wages and bonus, stock compensation expense, benefits and payroll taxes.
|
|
•
|
Other expenses increased as a result of the continued expansion of our business. Other expenses include premium taxes, travel, marketing, hardware, software, rent, depreciation and amortization and other facilities expenses.
|
Income Taxes
Our subsidiaries in the United States file a consolidated U.S. Federal income tax return. Our income tax expense was
$18.8 million
for the year ended December 31,
2017
compared to
$89.3 million
for the year ended December 31,
2016
. Income tax expense for the year ended
December 31, 2017
was calculated using an effective tax rate of 26.9% and was reduced by
$85.1 million
of income tax benefits associated with the one-time impact of the reduced U.S. statutory corporate income tax rate on the company's net deferred tax liability position and
$3.2 million
of excess tax benefits associated with the vesting of common shares and common share units during the period as required by ASU 2016-09,
Improvements to Employee Share-Based Payment Accounting
(Topic 718), adopted on January 1, 2017. Prior to the adoption of ASU 2016-09, excess tax benefits were recognized in additional paid-in-capital. Our effective tax rate was
28.6%
for the year ended
2016
. During
2017
, the proportion of our consolidated earnings generated in Bermuda increased as a result of insurance and reinsurance contracts executed with Freddie Mac and Fannie Mae and the quota share reinsurance agreement between Essent Guaranty, Inc. and Essent Re. Bermuda does not have a corporate income tax. In
2018
, as a result of the reduction of the U.S. statutory corporate income tax rate to 21% and the expected portion of our consolidated earnings to be generated in Bermuda, we anticipate that our effective tax rate will be approximately 16%-17%.
At December 31,
2017
and
2016
, we concluded that it was more likely than not that our deferred tax assets would be realized.
Year Ended
December 31, 2016
Compared to the Year Ended
December 31, 2015
For the year ended
December 31, 2016
, we reported net income of
$222.6 million
, compared to net income of
$157.3 million
for the year ended
December 31, 2015
. The increase in our operating results in
2016
over
2015
was primarily due to an increase in net premiums earned associated with the growth of our IIF and increases in net investment income, partially offset by increases in other underwriting and operating expenses, the provision for losses and loss adjustment expenses and income taxes.
Net Premiums Written and Earned
Net premiums earned increased in the year ended
December 31, 2016
by 29% compared to the year ended
December 31, 2015
primarily due to the increase in our average IIF from $57.8 billion in
2015
to $73.0 billion in
2016
, as well as an increase in average premium rate from 0.56% for the year ended
December 31, 2015
to 0.57% for the year ended
December 31, 2016
.
66
The increase in the average premium rate during the year ended
December 31, 2016
is due primarily to an increase in premium earned on the cancellation of non-refundable single premium policies.
Net premiums written increased in the year ended
December 31, 2016
by 19% over the prior year. The increase was due primarily to the increase in average IIF of 26% for the year ended
December 31, 2016
as compared to the year ended
December 31, 2015
.
In the year ended
December 31, 2016
, unearned premiums increased by $18.6 million as a result of net premiums written on single premium policies of $99.4 million which was partially offset by $80.8 million of unearned premium that was recognized in earnings during the year. In the year ended
December 31, 2015
, unearned premiums increased by $44.1 million as a result of net premiums written on single premium policies of $101.1 million which was partially offset by $57.0 million of unearned premium that was recognized in earnings during the year. Included in unearned premium recognized was $36.9 million and $21.8 million related to policy cancellations for the year ended
December 31, 2016
and
2015
, respectively.
Net Investment Income
Our net investment income was derived from the following sources for the period indicated:
|
|
Year Ended December 31,
|
|||||||
|
(In thousands)
|
2016
|
2015
|
||||||
|
Fixed maturities
|
$
|
29,865
|
|
$
|
21,693
|
|
||
|
Short-term investments
|
142
|
|
63
|
|
||||
|
Gross investment income
|
30,007
|
|
21,756
|
|
||||
|
Investment expenses
|
(2,117
|
)
|
(1,871
|
)
|
||||
|
Net investment income
|
$
|
27,890
|
|
$
|
19,885
|
|
||
The increase in net investment income to
$27.9 million
for the year ended
December 31, 2016
as compared to
$19.9 million
for the year ended
December 31, 2015
, was due to an increase in the weighted average balance of our investment portfolio and an increase in the pre-tax investment income yield. The average cash and investment portfolio balance increased to
$1.4 billion
during the year ended
December 31, 2016
from $1.2 billion during the year ended
December 31, 2015
primarily as a result of investing cash flows generated from operations. The pre-tax investment income yield increased from 1.9% in the year ended
December 31, 2015
to 2.1% in the year ended
December 31, 2016
primarily due to the increase in the portion of our investment portfolio invested in spread and duration assets. The pre-tax investment income yields are calculated based on amortized cost and exclude investment expenses. See "—Liquidity and Capital Resources" for further details of our investment portfolio.
Other Income
Other income includes fees earned for information technology and customer support services provided to Triad, contract underwriting revenues and changes in the fair value of the insurance and certain reinsurance policies issued by Essent Re under the ACIS program. The increase in other income for the year ended
December 31, 2016
compared to the same period in
2015
was primarily due to an increase in favorable net valuation adjustments associated with ACIS contracts formerly accounted for as insurance rather than as derivatives and an increase in contract underwriting revenue, partially offset by a decrease in Triad service fees associated with a reduction in the number of Triad's mortgage insurance policies in force. The fees earned from Triad will continue to decrease over time as Triad's existing policies are cancelled.
Provision for Losses and Loss Adjustment Expenses
The increase in the provision for losses and LAE in
2016
as compared to
2015
was primarily due to an increase in the number of insured loans in default, partially offset by previously identified defaults that cured.
67
The following table presents a rollforward of insured loans in default for the periods indicated:
|
|
Year Ended December 31,
|
|||||
|
|
2016
|
2015
|
||||
|
Beginning default inventory
|
1,028
|
|
457
|
|
||
|
Plus: new defaults
|
3,746
|
|
2,034
|
|
||
|
Less: cures
|
(2,857
|
)
|
(1,384
|
)
|
||
|
Less: claims paid
|
(154
|
)
|
(79
|
)
|
||
|
Less: rescissions and denials, net
|
(6
|
)
|
—
|
|
||
|
Ending default inventory
|
1,757
|
|
1,028
|
|
||
The increase in the number of defaults at
December 31, 2016
compared to
December 31, 2015
was primarily due to an increase in our IIF and policies in force, as well as further seasoning of our insurance portfolio.
The following table includes additional information about our loans in default as of the dates indicated:
|
|
As of December 31,
|
|||||||
|
|
2016
|
2015
|
||||||
|
Case reserves (in thousands)
|
$
|
25,758
|
|
$
|
16,272
|
|
||
|
Ending default inventory
|
1,757
|
|
1,028
|
|
||||
|
Average case reserve per default (in thousands)
|
$
|
14.7
|
|
$
|
15.8
|
|
||
|
Default rate
|
0.47
|
%
|
0.35
|
%
|
||||
|
Claims received included in ending default inventory
|
44
|
|
21
|
|
||||
The decrease in the average reserve per default was primarily due to changes in the composition (such as mark-to-market loan-to-value ratios, risk in force, and number of months past due) of the underlying loans in default and improvements in economic fundamentals.
The following tables provide a reconciliation of the beginning and ending reserve balances for losses and LAE and a detail of reserves and defaulted RIF by the number of missed payments and pending claims.
|
|
Year Ended December 31,
|
|||||||
|
(In thousands)
|
2016
|
2015
|
||||||
|
Reserve for losses and LAE at beginning of year
|
$
|
17,760
|
|
$
|
8,427
|
|
||
|
Add provision for losses and LAE occurring in:
|
|
|
||||||
|
Current year
|
21,889
|
|
14,956
|
|
||||
|
Prior years
|
(6,364
|
)
|
(3,051
|
)
|
||||
|
Incurred losses during the current year
|
15,525
|
|
11,905
|
|
||||
|
Deduct payments for losses and LAE occurring in:
|
|
|
||||||
|
Current year
|
927
|
|
544
|
|
||||
|
Prior years
|
4,216
|
|
2,028
|
|
||||
|
Loss and LAE payments during the current year
|
5,143
|
|
2,572
|
|
||||
|
Reserve for losses and LAE at end of year
|
$
|
28,142
|
|
$
|
17,760
|
|
||
68
|
|
As of December 31, 2016
|
|||||||||||||||||||
|
($ in thousands)
|
Number of
Policies in Default |
Percentage of
Policies in Default |
Amount of
Reserves |
Percentage of
Reserves |
Defaulted
RIF |
Reserves as a
Percentage of Defaulted RIF |
||||||||||||||
|
Missed payments:
|
|
|
|
|
|
|
|
|
|
|
|
|
||||||||
|
Three payments or less
|
914
|
|
52
|
%
|
$
|
6,615
|
|
26
|
%
|
$
|
50,737
|
|
13
|
%
|
||||||
|
Four to eleven payments
|
620
|
|
35
|
|
11,505
|
|
45
|
|
32,833
|
|
35
|
|
||||||||
|
Twelve or more payments
|
179
|
|
10
|
|
5,678
|
|
22
|
|
9,575
|
|
59
|
|
||||||||
|
Pending claims
|
44
|
|
3
|
|
1,960
|
|
7
|
|
2,272
|
|
86
|
|
||||||||
|
Total case reserves
|
1,757
|
|
100
|
%
|
25,758
|
|
100
|
%
|
$
|
95,417
|
|
27
|
|
|||||||
|
IBNR
|
|
|
|
|
1,932
|
|
|
|
|
|
|
|
||||||||
|
LAE and other
|
|
|
|
|
452
|
|
|
|
|
|
|
|
||||||||
|
Total reserves for losses and LAE
|
|
|
|
|
$
|
28,142
|
|
|
|
|
|
|
|
|||||||
|
|
As of December 31, 2015
|
|||||||||||||||||||
|
($ in thousands)
|
Number of
Policies in Default |
Percentage of
Policies in Default |
Amount of
Reserves |
Percentage of
Reserves |
Defaulted
RIF |
Reserves as a
Percentage of Defaulted RIF |
||||||||||||||
|
Missed payments:
|
|
|
|
|
|
|
|
|
|
|
|
|
||||||||
|
Three payments or less
|
535
|
|
52
|
%
|
$
|
4,492
|
|
28
|
%
|
$
|
29,003
|
|
15
|
%
|
||||||
|
Four to eleven payments
|
383
|
|
37
|
|
8,283
|
|
51
|
|
20,825
|
|
40
|
|
||||||||
|
Twelve or more payments
|
89
|
|
9
|
|
2,688
|
|
16
|
|
4,299
|
|
63
|
|
||||||||
|
Pending claims
|
21
|
|
2
|
|
809
|
|
5
|
|
844
|
|
96
|
|
||||||||
|
Total case reserves
|
1,028
|
|
100
|
%
|
16,272
|
|
100
|
%
|
$
|
54,971
|
|
30
|
|
|||||||
|
IBNR
|
|
|
|
|
1,220
|
|
|
|
|
|
|
|
||||||||
|
LAE and other
|
|
|
|
|
268
|
|
|
|
|
|
|
|
||||||||
|
Total reserves for losses and LAE
|
|
|
|
|
$
|
17,760
|
|
|
|
|
|
|
|
|||||||
During the year ended
December 31, 2016
, the provision for losses and LAE was
$15.5 million
, comprised of
$21.9 million
of current year losses partially offset by
$6.4 million
of favorable prior years' loss development. During the year ended
December 31, 2015
, the provision for losses and LAE was
$11.9 million
, comprised of
$15.0 million
of current year losses partially offset by
$3.1 million
of favorable prior years' loss development. In both periods, the favorable prior years' loss development was the result of a re-estimation of amounts ultimately to be paid on prior year defaults in the default inventory, including the impact of previously identified defaults that cured.
The following table includes additional information about our claims paid and claim severity as of the dates indicated:
|
|
Year Ended December 31,
|
|||||||
|
($ in thousands)
|
2016
|
2015
|
||||||
|
Number of claims paid
|
154
|
|
79
|
|
||||
|
Amount of claims paid
|
$
|
5,028
|
|
$
|
2,498
|
|
||
|
Claim severity
|
73
|
%
|
92
|
%
|
||||
69
Other Underwriting and Operating Expenses
Following are the components of our other underwriting and operating expenses for the periods indicated:
|
|
Year Ended December 31,
|
|||||||||||||
|
|
2016
|
2015
|
||||||||||||
|
($ in thousands)
|
$
|
%
|
$
|
%
|
||||||||||
|
Compensation and benefits
|
$
|
84,044
|
|
64
|
%
|
$
|
72,229
|
|
64
|
%
|
||||
|
Other
|
46,381
|
|
36
|
|
40,758
|
|
36
|
|
||||||
|
$
|
130,425
|
|
100
|
%
|
$
|
112,987
|
|
100
|
%
|
|||||
|
Number of employees at end of period
|
376
|
|
366
|
|
||||||||||
The significant factors contributing to the change in other underwriting and operating expenses are:
|
•
|
Compensation and benefits increased primarily due to increases in incentive compensation, stock compensation and the size of our workforce, which increased to
376
at
December 31, 2016
from 332 at January 1,
2015
, as additional employees were hired to support the growth in our business, including in our sales organization. Compensation and benefits includes salaries, wages and bonus, stock compensation expense, benefits and payroll taxes.
|
|
•
|
Other expenses increased as a result of the continued expansion of our business. Other expenses include premium taxes, travel, marketing, hardware, software, rent, depreciation and amortization and other facilities expenses.
|
Income Taxes
Our subsidiaries in the United States file a consolidated U.S. Federal income tax return. Our income tax expense was
$89.3 million
for the year ended
December 31, 2016
compared to
$71.1 million
for the year ended
December 31, 2015
. Our effective tax rate was
28.6%
and
31.1%
for the years ended
December 31, 2016
and
2015
, respectively. During
2016
, the proportion of our consolidated earnings generated in Bermuda increased as a result of insurance and reinsurance contracts executed with Freddie Mac and Fannie Mae and the quota share reinsurance agreement between Essent Guaranty, Inc. and Essent Re. Bermuda does not have a corporate income tax.
At
December 31, 2016
and
2015
, we concluded that it was more likely than not that our deferred tax assets would be
realized.
Liquidity and Capital Resources
Overview
Our sources of funds consist primarily of:
|
•
|
our investment portfolio and interest income on the portfolio;
|
|
•
|
net premiums that we will receive from our existing IIF as well as policies that we write in the future;
|
|
•
|
borrowings under our Credit Facility; and
|
|
•
|
issuance of capital shares.
|
Our obligations consist primarily of:
|
•
|
claim payments under our policies;
|
|
•
|
interest payments and repayment of borrowings under our Credit Facility; and
|
70
|
•
|
the other costs and operating expenses of our business.
|
As of
December 31, 2017
, we had substantial liquidity with cash of
$43.5 million
, short-term investments of
$312.7 million
and fixed maturity investments of
$2.0 billion
. We also had
$125 million
available under our Credit Facility, with
$250 million
of borrowings outstanding under our Credit Facility. Borrowings under the Credit Facility contractually mature on May 17, 2021 and accrue interest at a floating rate tied to a standard short-term borrowing index, selected at the Company’s option, plus an applicable margin and are paid monthly. Our cash and short term investment position increased during the year ended December 31, 2017 primarily as a result of net proceeds of $197.7 million from our public offering of 5.0 million common shares which was completed in August 2017, net borrowings under the Credit Facility plus cash flows from operations, net of amounts invested in our fixed income portfolio. At
December 31, 2017
, net cash and investments at the holding company were
$104.2 million
.
Management believes that the Company has sufficient liquidity available both at the holding company and in its insurance and other operating subsidiaries to meet its operating cash needs and obligations and committed capital expenditures for the next 12 months.
While the Company and all of its subsidiaries are expected to have sufficient liquidity to meet all their expected obligations, additional capital may be required to meet any new capital requirements that are adopted by regulatory authorities or the GSEs, or to provide additional capital related to the growth of our risk in force in our mortgage insurance portfolio, or to fund new business initiatives including the insurance activities of Essent Re. We continually evaluate opportunities based upon market conditions to further increase our financial flexibility through the issuance of equity or debt, or other options including reinsurance or credit risk transfer transactions. There can be no guarantee that any such opportunities will be available on acceptable terms or at all.
At the operating subsidiary level, liquidity could be impacted by any one of the following factors:
|
•
|
significant decline in the value of our investments;
|
|
•
|
inability to sell investment assets to provide cash to fund operating needs;
|
|
•
|
decline in expected revenues generated from operations;
|
|
•
|
increase in expected claim payments related to our IIF; or
|
|
•
|
increase in operating expenses.
|
Our U.S. insurance subsidiaries are subject to certain capital and dividend rules and regulations prescribed by jurisdictions in which they are authorized to operate and the GSEs. Under the insurance laws of the Commonwealth of Pennsylvania, the insurance subsidiaries may pay dividends during any twelve-month period in an amount equal to the greater of (i) 10% of the preceding year-end statutory policyholders' surplus or (ii) the preceding year's statutory net income. The Pennsylvania statute also requires that dividends and other distributions be paid out of positive unassigned surplus without prior approval. At
December 31, 2017
, Essent Guaranty, Inc., had unassigned surplus of approximately
$70.7 million
and has paid no dividends since its inception. Essent Guaranty of PA, Inc. had unassigned surplus of approximately
$6.5 million
as of
December 31, 2017
. Essent Re is subject to certain dividend restrictions as prescribed by the Bermuda Monetary Authority and under certain agreements with counterparties. In connection with a quota share reinsurance agreement with Essent Guaranty, Inc., Essent Re has agreed to maintain a minimum total equity of
$100 million
. As of
December 31, 2017
, Essent Re had total equity of
$662.8 million
. In connection with its insurance and reinsurance activities, Essent Re is required to maintain assets in trusts for the benefit of its contractual counterparties. See
Note 3
to our consolidated financial statements. At
December 31, 2017
, our insurance subsidiaries were in compliance with these rules, regulations and agreements.
71
Cash Flows
The following table summarizes our consolidated cash flows from operating, investing and financing activities:
|
|
Year Ended December 31,
|
|||||||||||
|
(In thousands)
|
2017
|
2016
|
2015
|
|||||||||
|
Net cash provided by operating activities
|
$
|
368,573
|
|
$
|
274,559
|
|
$
|
226,559
|
|
|||
|
Net cash used in investing activities
|
(690,142
|
)
|
(365,316
|
)
|
(220,712
|
)
|
||||||
|
Net cash provided by (used in) financing activities
|
337,562
|
|
93,682
|
|
(5,652
|
)
|
||||||
|
Net increase in cash
|
$
|
15,993
|
|
$
|
2,925
|
|
$
|
195
|
|
|||
Operating Activities
Cash flow provided by operating activities totaled
$368.6 million
for the year ended December 31,
2017
, as compared to
$274.6 million
for the year ended December 31,
2016
and
$226.6 million
for the year ended December 31,
2015
. The
increase
in cash flow from operations of
$94.0 million
in
2017
and
$48.0 million
in
2016
was primarily a result of increases in premium collected and net investment income, partially offset by increases in expenses paid.
Investing Activities
Cash flow used in investing activities totaled
$690.1 million
for the year ended December 31,
2017
, as compared to cash used in investing activities of
$365.3 million
for the year ended December 31,
2016
and
$220.7 million
for the year ended December 31,
2015
. The
increase
in cash flow used in investing activities primarily related to investing cash flows from the business, proceeds from the public offering of common shares in August 2017 and net increased borrowings under the Credit Facility in
2017
and
2016
.
Financing Activities
Cash flow provided by financing activities totaled
$337.6 million
for the year ended December 31,
2017
, as compared to cash flow provided by financing activities of
$93.7 million
for the year ended December 31,
2016
. The
increase
in cash flow provided by financing activities was primarily related to the completion of a public offering of common shares for
$197.7 million
in net proceeds, as well as $150 million of net increased borrowings under the Credit Facility. These cash inflows were partially offset by an increase in treasury stock acquired from employees to satisfy tax withholding obligations.
Cash flow provided by financing activities totaled
$93.7 million
for the year ended December 31,
2016
, as compared to cash flow used in financing activities of
$5.7 million
for the year ended December 31,
2015
. The increase in cash flow provided by financing activities of
$99.3 million
was primarily related to the $100 million borrowing under the Credit Facility. The proceeds of this borrowing were contributed to Essent Re to support new business.
Insurance Company Capital
We compute a risk-to-capital ratio for our U.S. insurance companies on a separate company statutory basis, as well as for our combined insurance operations. The risk-to-capital ratio is our net risk in force divided by our statutory capital. Our net risk in force represents risk in force net of reinsurance ceded, if any, and net of exposures on policies for which loss reserves have been established. Statutory capital consists primarily of statutory policyholders' surplus (which increases as a result of statutory net income and decreases as a result of statutory net loss and dividends paid), plus the statutory contingency reserve. The statutory contingency reserve is reported as a liability on the statutory balance sheet. A mortgage insurance company is required to make annual contributions to the contingency reserve of 50% of net premiums earned. These contributions must generally be maintained for a period of ten years. However, with regulatory approval, a mortgage insurance company may make early withdrawals from the contingency reserve when incurred losses exceed 35% of net premiums earned in a calendar year.
During the year ended
December 31, 2017
Essent US Holdings, Inc. made capital contributions to Essent Guaranty, Inc. of $125 million to support new and existing business. During the year ended December 31,
2016
, no capital contributions were made to our U.S. insurance subsidiaries.
72
Our combined risk-to-capital calculation for our U.S. insurance subsidiaries as of
December 31, 2017
was as follows:
|
Combined statutory capital:
($ in thousands) |
|
|||
|
Policyholders’ surplus
|
$
|
807,027
|
|
|
|
Contingency reserves
|
721,842
|
|
||
|
Combined statutory capital
|
$
|
1,528,869
|
|
|
|
Combined net risk in force
|
$
|
21,637,409
|
|
|
|
Combined risk-to-capital ratio
|
14.2:1
|
|
||
For additional information regarding regulatory capital see
Note 17
to our consolidated financial statements. Our combined statutory capital equals the sum of statutory capital of Essent Guaranty, Inc. plus Essent Guaranty of PA, Inc., after eliminating the impact of intercompany transactions. The combined risk-to-capital ratio equals the sum of the net risk in force of Essent Guaranty, Inc. and Essent Guaranty of PA, Inc. divided by combined statutory capital. The information above has been derived from the annual and quarterly statements of our insurance subsidiaries, which have been prepared in conformity with accounting practices prescribed or permitted by the Pennsylvania Insurance Department. Such practices vary from accounting principles generally accepted in the United States.
Essent Re has entered into risk share insurance and reinsurance transactions with Freddie Mac and Fannie Mae. Essent Re also executed a quota share reinsurance transaction with Essent Guaranty, Inc. to reinsure 25% of Essent Guaranty, Inc.’s GSE-eligible NIW effective July 1, 2014. Essent Group Ltd. made capital contributions to Essent Re of
$165.0 million
and
$130.0 million
during the years ended
December 31, 2017
and
2016
, respectively, to support new business. As of
December 31, 2017
, Essent Re had total stockholders’ equity of
$662.8 million
and net risk in force of
$6.3 billion
.
Financial Strength Ratings
The insurer financial strength rating of Essent Guaranty, Inc., our principal mortgage insurance subsidiary, is
Baa1
with a
stable
outlook by
Moody's
and
BBB+
with a
stable
outlook by
S&P
. The insurer financial strength rating of Essent Re is BBB+ with a stable outlook by S&P.
Private Mortgage Insurer Eligibility Requirements
Effective December 31, 2015, Fannie Mae and Freddie Mac, at the direction of the FHFA, implemented new coordinated Private Mortgage Insurer Eligibility Requirements, which we refer to as the "PMIERs." The PMIERs represent the standards by which private mortgage insurers are eligible to provide mortgage insurance on loans owned or guaranteed by Fannie Mae and Freddie Mac. The PMIERs include financial strength requirements incorporating a risk-based framework that require approved insurers to have a sufficient level of liquid assets from which to pay claims. This risk-based framework provides that an insurer must hold a substantially higher level of required assets for insured loans that are in default compared to a performing loan. The PMIERs also include enhanced operational performance expectations and define remedial actions that apply should an approved insurer fail to comply with these requirements. As of
December 31, 2017
, Essent Guaranty, Inc., our GSE-approved mortgage insurance company, was in compliance with the PMIERs. As of
December 31, 2017
, Essent Guaranty, Inc.'s Available Assets were
$1.59 billion
and its Minimum Required Assets were
$1.54 billion
based on our interpretation of the PMIERs.
Financial Condition
Stockholders' Equity
As of
December 31, 2017
, stockholders’ equity was
$1.9 billion
compared to
$1.3 billion
as of
December 31, 2016
. This increase was primarily due to net income generated in
2017
and the completion of a public offering of common shares in August 2017.
73
Investments
The total fair value of our investment portfolio was
$2.3 billion
as of
December 31, 2017
and
$1.6 billion
as of
December 31, 2016
. In addition, our total cash was
$43.5 million
as of
December 31, 2017
, compared to
$27.5 million
as of
December 31, 2016
. The increase in investments and cash was primarily due to investing net cash flows from operations, the proceeds from the public offering of common shares and the net borrowings under the Credit Facility during the year ended
December 31, 2017
.
Investment Portfolio by Asset Class
|
Asset Class
|
December 31, 2017
|
December 31, 2016
|
||||||||||||
|
($ in thousands)
|
Fair Value
|
Percent
|
Fair Value
|
Percent
|
||||||||||
|
U.S. Treasury securities
|
$
|
227,805
|
|
9.9
|
%
|
$
|
191,548
|
|
11.9
|
%
|
||||
|
U.S. agency securities
|
33,114
|
|
1.4
|
|
18,441
|
|
1.1
|
|
||||||
|
U.S. agency mortgage-backed securities
|
456,037
|
|
19.8
|
|
316,494
|
|
19.6
|
|
||||||
|
Municipal debt securities(1)
|
465,255
|
|
20.2
|
|
334,324
|
|
20.7
|
|
||||||
|
Corporate debt securities(2)
|
611,728
|
|
26.5
|
|
456,357
|
|
28.3
|
|
||||||
|
Residential and commercial mortgage securities
|
79,407
|
|
3.5
|
|
68,336
|
|
4.2
|
|
||||||
|
Asset-backed securities
|
167,922
|
|
7.3
|
|
127,172
|
|
7.9
|
|
||||||
|
Money market funds
|
263,797
|
|
11.4
|
|
102,430
|
|
6.3
|
|
||||||
|
Total Investments
|
$
|
2,305,065
|
|
100.0
|
%
|
$
|
1,615,102
|
|
100.0
|
%
|
||||
_______________________________________________________________________________
|
|
December 31,
|
December 31,
|
||||
|
(1) The following table summarizes municipal debt securities as of :
|
2017
|
2016
|
||||
|
Special revenue bonds
|
63.6
|
%
|
63.6
|
%
|
||
|
General obligation bonds
|
30.7
|
|
29.7
|
|
||
|
Certificate of participation bonds
|
4.4
|
|
4.9
|
|
||
|
Tax allocation bonds
|
0.8
|
|
1.1
|
|
||
|
Special tax bonds
|
0.5
|
|
0.7
|
|
||
|
Total
|
100.0
|
%
|
100.0
|
%
|
||
|
|
December 31,
|
December 31,
|
||||
|
(2) The following table summarizes corporate debt securities as of :
|
2017
|
2016
|
||||
|
Financial
|
45.9
|
%
|
40.6
|
%
|
||
|
Consumer, non-cyclical
|
16.2
|
|
18.6
|
|
||
|
Energy
|
7.8
|
|
9.3
|
|
||
|
Communications
|
7.3
|
|
6.0
|
|
||
|
Industrial
|
6.3
|
|
5.6
|
|
||
|
Consumer, cyclical
|
5.3
|
|
6.3
|
|
||
|
Utilities
|
5.3
|
|
6.0
|
|
||
|
Technology
|
3.9
|
|
4.3
|
|
||
|
Basic materials
|
2.0
|
|
3.3
|
|
||
|
Total
|
100.0
|
%
|
100.0
|
%
|
||
74
Investment Portfolio by Rating
|
Rating(1)
|
December 31, 2017
|
December 31, 2016
|
||||||||||||
|
($ in thousands)
|
Fair Value
|
Percent
|
Fair Value
|
Percent
|
||||||||||
|
Aaa
|
$
|
1,160,200
|
|
50.3
|
%
|
$
|
780,513
|
|
48.3
|
%
|
||||
|
Aa1
|
115,237
|
|
5.0
|
|
88,977
|
|
5.5
|
|
||||||
|
Aa2
|
123,551
|
|
5.4
|
|
101,772
|
|
6.3
|
|
||||||
|
Aa3
|
127,785
|
|
5.6
|
|
89,421
|
|
5.5
|
|
||||||
|
A1
|
205,369
|
|
8.9
|
|
143,938
|
|
8.9
|
|
||||||
|
A2
|
157,651
|
|
6.8
|
|
126,113
|
|
7.8
|
|
||||||
|
A3
|
148,246
|
|
6.4
|
|
95,926
|
|
6.0
|
|
||||||
|
Baa1
|
115,178
|
|
5.0
|
|
85,864
|
|
5.3
|
|
||||||
|
Baa2
|
87,869
|
|
3.8
|
|
71,950
|
|
4.5
|
|
||||||
|
Baa3
|
43,024
|
|
1.9
|
|
24,544
|
|
1.5
|
|
||||||
|
Below Baa3
|
20,955
|
|
0.9
|
|
6,084
|
|
0.4
|
|
||||||
|
Total Investments
|
$
|
2,305,065
|
|
100.0
|
%
|
$
|
1,615,102
|
|
100.0
|
%
|
||||
_______________________________________________________________________________
|
(1)
|
Based on ratings issued by Moody's, if available. S&P or Fitch Ratings ("Fitch") rating utilized if Moody's not available.
|
Investment Portfolio by Effective Duration
|
Effective Duration
|
December 31, 2017
|
December 31, 2016
|
||||||||||||
|
($ in thousands)
|
Fair Value
|
Percent
|
Fair Value
|
Percent
|
||||||||||
|
< 1 Year
|
$
|
628,958
|
|
27.3
|
%
|
$
|
329,901
|
|
20.4
|
%
|
||||
|
1 to < 2 Years
|
164,856
|
|
7.2
|
|
153,184
|
|
9.5
|
|
||||||
|
2 to < 3 Years
|
280,177
|
|
12.2
|
|
156,620
|
|
9.7
|
|
||||||
|
3 to < 4 Years
|
263,799
|
|
11.4
|
|
176,896
|
|
11.0
|
|
||||||
|
4 to < 5 Years
|
263,273
|
|
11.4
|
|
139,115
|
|
8.6
|
|
||||||
|
5 or more Years
|
704,002
|
|
30.5
|
|
659,386
|
|
40.8
|
|
||||||
|
Total Investments
|
$
|
2,305,065
|
|
100.0
|
%
|
$
|
1,615,102
|
|
100.0
|
%
|
||||
75
Top Ten Portfolio Holdings
|
|
December 31, 2017
|
|||||||||||||||
|
Rank
($ in thousands) |
Security
|
Fair Value
|
Amortized
Cost |
Unrealized
Gain (Loss)(1) |
Credit
Rating(2) |
|||||||||||
|
1
|
U.S. Treasury 5.250% 11/15/2028
|
$
|
29,358
|
|
$
|
30,001
|
|
$
|
(643
|
)
|
Aaa
|
|||||
|
2
|
U.S. Treasury 1.500% 8/15/2026
|
19,067
|
|
20,402
|
|
(1,335
|
)
|
Aaa
|
||||||||
|
3
|
U.S. Treasury 0.000% 1/4/2018
|
14,999
|
|
14,999
|
|
—
|
|
Aaa
|
||||||||
|
4
|
Freddie Mac 4.000% 7/1/2037
|
12,639
|
|
12,630
|
|
9
|
|
Aaa
|
||||||||
|
5
|
Fannie Mae 1.500% 6/22/2020
|
11,165
|
|
11,308
|
|
(143
|
)
|
Aaa
|
||||||||
|
6
|
Ginnie Mae 4.000% 7/20/2045
|
10,964
|
|
11,323
|
|
(359
|
)
|
Aaa
|
||||||||
|
7
|
Freddie Mac 2.500% 10/1/2030
|
10,877
|
|
11,129
|
|
(252
|
)
|
Aaa
|
||||||||
|
8
|
Ginnie Mae 4.000% 8/20/2045
|
10,666
|
|
11,014
|
|
(348
|
)
|
Aaa
|
||||||||
|
9
|
Freddie Mac 3.000% 9/1/2046
|
10,173
|
|
10,513
|
|
(340
|
)
|
Aaa
|
||||||||
|
10
|
U.S. Treasury 2.250% 11/15/2025
|
9,949
|
|
10,057
|
|
(108
|
)
|
Aaa
|
||||||||
|
Total
|
$
|
139,857
|
|
$
|
143,376
|
|
$
|
(3,519
|
)
|
|
||||||
|
Percent of Investment Portfolio
|
6.1
|
%
|
|
|
|
|
|
|||||||||
_______________________________________________________________________________
|
(1)
|
As of
December 31, 2017
, for securities in unrealized loss positions, management believes decline in fair values is principally associated with the changes in the interest rate environment subsequent to their purchase. Also, see
Note 3
to our consolidated financial statements, which summarizes the aggregate amount of gross unrealized losses by asset class in which the fair value of investments has been less than cost for less than 12 months and for 12 months or more.
|
|
(2)
|
Based on ratings issued by Moody’s, if available. S&P or Fitch rating utilized if Moody’s not available
.
|
|
Rank |
December 31, 2016
|
|||||
|
($ in thousands)
|
Security
|
Fair Value
|
||||
|
1
|
U.S. Treasury 2.125% 5/15/2025
|
$
|
19,687
|
|
||
|
2
|
U.S. Treasury 1.500% 8/15/2026
|
18,833
|
|
|||
|
3
|
U.S. Treasury 2.250% 11/15/2024
|
16,385
|
|
|||
|
4
|
U.S. Treasury 0.000% 1/12/2017
|
14,998
|
|
|||
|
5
|
Ginnie Mae 4.000% 7/20/2045
|
14,504
|
|
|||
|
6
|
Ginnie Mae 4.000% 8/20/2045
|
14,374
|
|
|||
|
7
|
U.S. Treasury 5.250% 11/15/2028
|
13,119
|
|
|||
|
8
|
Freddie Mac 2.500% 10/1/2030
|
12,780
|
|
|||
|
9
|
Fannie Mae 3.000% 7/25/2045
|
10,953
|
|
|||
|
10
|
Freddie Mac 3.000% 8/1/2046
|
10,810
|
|
|||
|
Total
|
$
|
146,443
|
|
|||
|
Percent of Investment Portfolio
|
9.1
|
%
|
||||
76
The following tables includes municipal securities for states that represent more than 10% of the total municipal bond position as of
December 31, 2017
:
|
($ in thousands)
|
Fair Value
|
Amortized
Cost |
Credit
Rating (1), (2) |
|||||||
|
Texas
|
|
|
|
|
|
|||||
|
State of Texas
|
$
|
10,212
|
|
$
|
10,052
|
|
Baa1
|
|||
|
The Texas A&M University System
|
6,241
|
|
6,208
|
|
Aaa
|
|||||
|
City of Houston
|
3,409
|
|
3,303
|
|
Aa3
|
|||||
|
University of Houston System
|
3,319
|
|
3,321
|
|
Aa2
|
|||||
|
Dallas/Fort Worth International Airport
|
2,951
|
|
2,727
|
|
A1
|
|||||
|
City of El Paso
|
2,448
|
|
2,440
|
|
Aa2
|
|||||
|
City of Austin
|
2,368
|
|
2,202
|
|
Aa3
|
|||||
|
Irving Independent School District
|
2,032
|
|
2,010
|
|
Aaa
|
|||||
|
North Texas Municipal Water District
|
2,027
|
|
2,050
|
|
Aaa
|
|||||
|
Harris County Cultural Education
|
2,001
|
|
2,000
|
|
A1
|
|||||
|
Carrollton-Farmers Branch Independent School District
|
1,922
|
|
1,949
|
|
Aaa
|
|||||
|
City of Dallas
|
1,796
|
|
1,725
|
|
Aa1
|
|||||
|
Alamo Community College District
|
1,614
|
|
1,615
|
|
Aaa
|
|||||
|
Tarrant Regional Water District
|
1,559
|
|
1,517
|
|
Aaa
|
|||||
|
City of College Station
|
1,418
|
|
1,447
|
|
Aa2
|
|||||
|
City of Garland
|
1,406
|
|
1,424
|
|
Aa1
|
|||||
|
Bryan Independent School District
|
1,308
|
|
1,333
|
|
Aaa
|
|||||
|
City of San Antonio
|
1,300
|
|
1,221
|
|
A1
|
|||||
|
Spring Independent School District
|
1,232
|
|
1,245
|
|
Aaa
|
|||||
|
City of Corpus Christi
|
1,163
|
|
1,109
|
|
A1
|
|||||
|
Pharr-San Juan-Alamo Independent School District
|
1,071
|
|
1,089
|
|
Aaa
|
|||||
|
Port Arthur Independent School District
|
992
|
|
1,002
|
|
Aaa
|
|||||
|
San Jacinto Community College District
|
877
|
|
849
|
|
Aa3
|
|||||
|
Harlandale Independent School District
|
872
|
|
873
|
|
Aaa
|
|||||
|
Austin-Bergstrom Landhost Enterprises, Inc.
|
614
|
|
608
|
|
A3
|
|||||
|
|
$
|
56,152
|
|
$
|
55,319
|
|
|
|||
77
|
($ in thousands)
|
Fair Value
|
Amortized
Cost |
Credit
Rating (1), (2) |
|||||||
|
Florida
|
||||||||||
|
JEA
|
$
|
4,286
|
|
$
|
4,229
|
|
Aa2
|
|||
|
The School District of Hillsborough County
|
3,791
|
|
3,827
|
|
Aa2
|
|||||
|
County of Orange
|
3,692
|
|
3,717
|
|
Aa3
|
|||||
|
City of Miami Beach
|
3,654
|
|
3,606
|
|
Aa3
|
|||||
|
County of Miami-Dade
|
3,181
|
|
3,027
|
|
Baa1
|
|||||
|
City of Cape Coral
|
2,866
|
|
2,828
|
|
A1
|
|||||
|
State of Florida
|
2,569
|
|
2,590
|
|
A1
|
|||||
|
County of Hillsborough
|
2,399
|
|
2,317
|
|
A1
|
|||||
|
City of Jacksonville
|
2,396
|
|
2,436
|
|
Aa3
|
|||||
|
Solid Waste Authority of Palm Beach County
|
2,109
|
|
2,082
|
|
Aa2
|
|||||
|
Jacksonville Transportation Authority
|
2,001
|
|
2,004
|
|
Aa2
|
|||||
|
School District of Palm Beach County
|
1,804
|
|
1,779
|
|
Aa3
|
|||||
|
The Orange County Public School District
|
1,784
|
|
1,753
|
|
Aa2
|
|||||
|
Duval County Public Schools
|
1,756
|
|
1,647
|
|
Aa3
|
|||||
|
Lake County Schools
|
1,615
|
|
1,625
|
|
Aa2
|
|||||
|
St. Lucie Public Schools
|
1,492
|
|
1,456
|
|
A2
|
|||||
|
Hillsborough County Aviation Authority
|
1,248
|
|
1,187
|
|
A1
|
|||||
|
City of Hollywood
|
1,224
|
|
1,210
|
|
A1
|
|||||
|
City of Miami
|
1,123
|
|
1,096
|
|
Baa1
|
|||||
|
Citizens Property Insurance Corporation
|
1,073
|
|
1,059
|
|
A1
|
|||||
|
Village Center Community Development District
|
1,000
|
|
1,000
|
|
A1
|
|||||
|
Florida State Board Education Revenue
|
812
|
|
813
|
|
Aa1
|
|||||
|
County of Broward
|
708
|
|
707
|
|
A1
|
|||||
|
Leon County School Board
|
555
|
|
547
|
|
Aa3
|
|||||
|
$
|
49,138
|
|
$
|
48,542
|
|
|||||
_______________________________________________________________________________
|
(1)
|
None of the above securities include financial guaranty insurance. Certain securities include state enhancements. The above ratings exclude the effect of such state enhancements
.
|
|
(2)
|
Based on ratings issued by Moody’s, if available. S&P or Fitch rating utilized if Moody’s not available
.
|
Contractual Obligations
As of
December 31, 2017
, the approximate future payments under our contractual obligations of the type described in the table below are as follows:
|
|
Payments due by period
|
|||||||||||||||||||
|
($ in thousands)
|
Total
|
Less than
1 year
|
1 - 3 years
|
3 - 5 years
|
More than
5 years
|
|||||||||||||||
|
Credit facility borrowings
|
$
|
250,000
|
|
$
|
—
|
|
$
|
—
|
|
$
|
250,000
|
|
$
|
—
|
|
|||||
|
Estimated loss and LAE payments(1)
|
46,850
|
|
23,593
|
|
23,257
|
|
—
|
|
—
|
|
||||||||||
|
Operating lease obligations
|
17,600
|
|
2,479
|
|
5,243
|
|
5,361
|
|
4,517
|
|
||||||||||
|
Total
|
$
|
314,450
|
|
$
|
26,072
|
|
$
|
28,500
|
|
$
|
255,361
|
|
$
|
4,517
|
|
|||||
_______________________________________________________________________________
|
(1)
|
Our estimate of loss and LAE payments reflects the application of accounting policies described below in "—Critical Accounting Policies—Reserve for Losses and Loss Adjustment Expenses." The payments due by period are based on management's estimates and assume that all of the loss and LAE reserves included in the table will result in payments.
|
78
We lease office space in Pennsylvania, North Carolina, California and Bermuda under leases accounted for as operating leases. A portion of the space leased in North Carolina has been subleased to Triad; minimum lease payments shown above have not been reduced by minimum sublease rental income of
$0.1 million
due in
2018
under the non-cancelable sublease.
Off-Balance Sheet Arrangements
We do not have any off-balance sheet arrangements or financing activities with special-purpose entities.
Critical Accounting Policies
Our discussion and analysis of our financial condition and results of operation are based upon our consolidated financial statements, which have been prepared in conformity with U.S. generally accepted accounting principles ("GAAP"). In preparing our consolidated financial statements, management has made estimates, assumptions and judgments that affect the reported amounts of assets and liabilities at the date of the financial statements and the reported amounts of revenues and expenses during the reporting periods. In preparing these financial statements, management has utilized available information, including our past history, industry standards and the current and projected economic and housing environment, among other factors, in forming its estimates, assumptions and judgments, giving due consideration to materiality. Because the use of estimates is inherent in GAAP, actual results could differ from those estimates. In addition, other companies may utilize different estimates, which may impact comparability of our results of operations to those of companies in similar businesses. A summary of the accounting policies that management believes are critical to the preparation of our consolidated financial statements is set forth below.
Insurance Premium Revenue Recognition
Mortgage guaranty insurance policies are contracts that are generally non-cancelable by the insurer, are renewable at a fixed price, and provide for payment of premium on a monthly, annual or single basis. Upon renewal, we are not able to re-underwrite or re-price our policies. Consistent with industry accounting practices, premiums written on a monthly basis are earned as coverage is provided. Premiums written on an annual basis are amortized on a pro rata basis over the year of coverage. Primary mortgage insurance written on policies covering more than one year are referred to as single premium policies. A portion of the revenue from single premium policies is recognized in earned premium in the current period, and the remaining portion is deferred as unearned premium and earned over the expected life of the policy. If single premium policies related to insured loans are cancelled due to repayment by the borrower, and the premium is non-refundable, then the remaining unearned premium related to each cancelled policy is recognized as earned premium upon notification of the cancellation. Unearned premium represents the portion of premium written that is applicable to the estimated unexpired risk of insured loans. Rates used to determine the earning of single premium policies are estimates based on an analysis of the expiration of risk.
Reserve for Losses and Loss Adjustment Expenses
We establish reserves for losses based on our best estimate of ultimate claim costs for defaulted loans using the general principles contained in ASC No. 944, in accordance with industry practice. However, consistent with industry standards for mortgage insurers, we do not establish loss reserves for future claims on insured loans which are not currently in default. Loans are classified as defaulted when the borrower has missed two consecutive payments. Once we are notified that a borrower has defaulted, we will consider internal and third-party information and models, including the status of the loan as reported by its servicer and the type of loan product to determine the likelihood that a default will reach claim status. In addition, we will project the amount that we will pay if a default becomes a claim (referred to as "claim severity"). Based on this information, at each reporting date we determine our best estimate of loss reserves at a given point in time. Included in loss reserves are reserves for incurred but not reported ("IBNR") claims. IBNR reserves represent our estimated unpaid losses on loans that are in default, but have not yet been reported to us as delinquent by our customers. We will also establish reserves for associated loss adjustment expenses, consisting of the estimated cost of the claims administration process, including legal and other fees and expenses associated with administering the claims process. Establishing reserves is inherently subjective as it requires estimates that are susceptible to significant revision as more information becomes available. Our estimates of claim rates and claim sizes will be strongly influenced by prevailing economic conditions, such as the overall state of the economy, current rates or trends in unemployment, changes in housing values and/or interest rates, and our best judgments as to the future values or trends of these macroeconomic factors. Losses incurred are also generally affected by the characteristics of our insured loans, such as the loan amount, loan-to-value ratio, the percentage of coverage on the insured loan and the credit quality of the borrower.
79
Income Taxes
Deferred income tax assets and liabilities are determined using the asset and liability (or balance sheet) method. Under this method, we determine the net deferred tax asset or liability based on the tax effects of the temporary differences between the book and tax bases of the various assets and liabilities and give current recognition to changes in tax rates and laws. Changes in tax laws, rates, regulations and policies, or the final determination of tax audits or examinations, could materially affect our tax estimates. We evaluate the realizability of the deferred tax asset and recognize a valuation allowance if, based on the weight of all available positive and negative evidence, it is more likely than not that some portion or all of the deferred tax asset will not be realized. When evaluating the realizability of the deferred tax asset, we consider estimates of expected future taxable income, existing and projected book/tax differences, carryback and carryforward periods, tax planning strategies available, and the general and industry specific economic outlook. This realizability analysis is inherently subjective, as it requires management to forecast changes in the mortgage market, as well as the related impact on mortgage insurance, and the competitive and general economic environment in future periods. Changes in the estimate of deferred tax asset realizability, if applicable, are included in income tax expense on the consolidated statements of comprehensive income. ASC No. 740 provides a recognition threshold and measurement attribute for the financial statement recognition and measurement of a tax position taken or expected to be taken in a tax return.
In accordance with ASC No. 740, before a tax benefit can be recognized, a tax position is evaluated using a threshold that it is more likely than not that the tax position will be sustained upon examination. When evaluating the more-likely-than-not recognition threshold, ASC No. 740 provides that a company should presume the tax position will be examined by the appropriate taxing authority that has full knowledge of all relevant information. If the tax position meets the more-likely-than-not recognition threshold, it is initially and subsequently measured as the largest amount of benefit that is greater than 50% likely of being realized upon ultimate settlement. This analysis is inherently subjective, as it requires management to forecast the outcome of future tax examinations and the amount of tax benefits that will ultimately be realized given the facts, circumstances, and information available at the reporting date. New information may become available in future periods that could cause the actual amount of tax benefits to vary from management's estimates.
Investments Available for Sale
Our entire investment portfolio is classified as available for sale and is reported at fair value. The related unrealized gains or losses are, after considering the related tax expense or benefit, recognized as a component of accumulated other comprehensive income (loss) in stockholders' equity. Realized investment gains and losses are reported in income based upon specific identification of securities sold. Each quarter we perform reviews of all of our investments in order to determine whether declines in fair value below amortized cost were considered other-than-temporary in accordance with applicable guidance. In evaluating whether a decline in fair value is other-than-temporary, we consider several factors including, but not limited to:
|
•
|
our intent to sell the security or whether it is more likely than not that we will be required to sell the security before recovery;
|
|
•
|
extent and duration of the decline;
|
|
•
|
failure of the issuer to make scheduled interest or principal payments;
|
|
•
|
credit ratings from third-party rating agencies and changes in these credit ratings below investment-grade;
|
|
•
|
current credit spreads, downgrade trends, industry and asset sector trends, and issuer disclosures and financial reports to determine if credit ratings from third-party credit agencies are reasonable; and
|
|
•
|
adverse conditions specifically related to the security, an industry, or a geographic area.
|
Under the current guidance a debt security impairment is deemed other-than-temporary if we either intend to sell the security, or it is more likely than not that we will be required to sell the security before recovery or we do not expect to collect cash flows sufficient to recover the amortized cost basis of the security. During the years ended
December 31, 2017
,
2016
and
2015
, the unrealized losses recorded in the investment portfolio principally resulted from fluctuations in market interest rates and credit spreads. Each issuer is current on its scheduled interest and principal payments. We recorded other-than-temporary impairments of
$0.1 million
,
$0.1 million
and
$0.3 million
in the years ended
December 31, 2017
,
2016
and
2015
, respectively, for securities in an unrealized loss position. The impairments resulted from our intent to sell these securities subsequent to the reporting date.
80
For information on our material holdings in an unrealized loss position, see "—Financial Condition—Investments."
Recently Issued Accounting Pronouncements
There are no recently issued accounting standards that are expected to have a material effect on our financial condition, results of operations or cash flows. See
Note 2
of our consolidated financial statements.
81
We own and manage a large investment portfolio of various holdings, types and maturities. Investment income is one of our primary sources of cash flow supporting operations and claim payments. The assets within the investment portfolio are exposed to the same factors that affect overall financial market performance. While our investment portfolio is exposed to factors affecting markets worldwide, it is most sensitive to fluctuations in the drivers of U.S. markets.
We manage market risk via a defined investment policy implemented by our treasury function with oversight from our board of directors and our senior management. Important drivers of our market risk exposure monitored and managed by us include but are not limited to:
|
•
|
Changes to the level of interest rates.
Increasing interest rates may reduce the value of certain fixed-rate bonds held in the investment portfolio. Higher rates may cause variable-rate assets to generate additional income. Decreasing rates will have the reverse impact. Significant changes in interest rates can also affect persistency and claim rates which may in turn require that the investment portfolio be restructured to better align it with future liabilities and claim payments. Such restructuring may cause investments to be liquidated when market conditions are adverse.
|
|
•
|
Changes to the term structure of interest rates.
Rising or falling rates typically change by different amounts along the yield curve. These changes may have unforeseen impacts on the value of certain assets.
|
|
•
|
Market volatility/changes in the real or perceived credit quality of investments.
Deterioration in the quality of investments, identified through changes to our own or third-party (e.g., rating agency) assessments, will reduce the value and potentially the liquidity of investments.
|
|
•
|
Concentration Risk.
If the investment portfolio is highly concentrated in one asset, or in multiple assets whose values are highly correlated, the value of the total portfolio may be greatly affected by the change in value of just one asset or a group of highly correlated assets.
|
|
•
|
Prepayment Risk.
Bonds may have call provisions that permit debtors to repay prior to maturity when it is to their advantage. This typically occurs when rates fall below the interest rate of the debt.
|
Market risk is measured for all investment assets at the individual security level. Market risks that are not fully captured by the quantitative analysis are highlighted. In addition, material market risk changes that occur from the last reporting period to the current are discussed. Changes to how risks are managed will also be identified and described.
At
December 31, 2017
, the effective duration of our investment portfolio, including cash, was
3.4
years, which means that an instantaneous parallel shift (movement up or down) in the yield curve of 100 basis points would result in a change of
3.4
% in fair value of our investment portfolio. Excluding cash, our investment portfolio effective duration was
3.9
years, which means that an instantaneous parallel shift (movement up or down) in the yield curve of 100 basis points would result in a change of
3.9
% in fair value of our investment portfolio.
82
INDEX TO FINANCIAL STATEMENTS
|
|
Page
|
|
CONSOLIDATED FINANCIAL STATEMENTS
|
|
|
Report of Independent Registered Public Accounting Firm
|
|
|
Consolidated Balance Sheets
|
|
|
Consolidated Statements of Comprehensive Income
|
|
|
Consolidated Statements of Changes in Stockholders' Equity
|
|
|
Consolidated Statements of Cash Flows
|
|
|
Notes to Consolidated Financial Statements
|
|
|
FINANCIAL STATEMENT SCHEDULES
|
|
|
Schedule I—Summary of Investments—Other Than Investments in Related Parties as of December 31, 2017
|
|
|
Schedule II—Condensed Financial Information of Registrant at December 31, 2017 and 2016 and for each of the three years in the period ended December 31, 2017
|
|
83
Report of Independent Registered Public Accounting Firm
To the Board of Directors and Stockholders of Essent Group Ltd.
Opinions on the Financial Statements and Internal Control over Financial Reporting
We have audited the accompanying consolidated
balance sheets of Essent Group Ltd. and its subsidiaries
as of December 31, 2017 and December 31, 2016, and the related consolidated statements of comprehensive income, changes in stockholders’ equity and cash flows for each of the three years in the period ended December 31, 2017, including the related notes and schedules listed in the accompanying index (collectively referred to as the “consolidated financial statements”).
We also have audited the Company's internal control over financial reporting as of December 31, 2017 based on criteria established in
Internal Control - Integrated Framework
(2013)
issued by the Committee of Sponsoring Organizations of the Treadway Commission (COSO).
In our opinion, the consolidated
financial statements referred to above present fairly, in all material respects, the financial position of the Company as of December 31, 2017 and December 31, 2016 and the results of their
operations and their
cash flows for each of the three years in the period ended December 31, 2017
in conformity with accounting principles generally accepted in the United States of America. Also in our opinion, the Company maintained, in all material respects, effective internal control over financial reporting as of December 31, 2017 based on criteria established in
Internal Control - Integrated Framework
(2013)
issued by the COSO.
Basis for Opinions
The Company's management is responsible for these consolidated financial statements, for maintaining effective internal control over financial reporting, and for its assessment of the effectiveness of internal control over financial reporting, included in Management’s Report on Internal Control Over Financial Reporting appearing under item 9A. Our responsibility is to express opinions on the Company’s consolidated
financial statements and on the Company's internal control over financial reporting based on our audits. We are a public accounting firm registered with the Public Company Accounting Oversight Board (United States) ("PCAOB") and are required to be independent with respect to the Company in accordance with the U.S. federal securities laws and the applicable rules and regulations of the Securities and Exchange Commission and the PCAOB.
We conducted our audits in accordance with the standards of the PCAOB. Those standards require that we plan and perform the audits to obtain reasonable assurance about whether the consolidated financial statements are free of material misstatement, whether due to error or fraud, and whether effective internal control over financial reporting was maintained in all material respects.
Our audits of the consolidated financial statements included performing procedures to assess the risks of material misstatement of the consolidated financial statements, whether due to error or fraud, and performing procedures that respond to those risks. Such procedures included examining, on a test basis, evidence regarding the amounts and disclosures in the consolidated financial statements. Our audits also included evaluating the accounting principles used and significant estimates made by management, as well as evaluating the overall presentation of the consolidated financial statements. Our audit of internal control over financial reporting included obtaining an understanding of internal control over financial reporting, assessing the risk that a material weakness exists, and testing and evaluating the design and operating effectiveness of internal control based on the assessed risk. Our audits also included performing such other procedures as we considered necessary in the circumstances. We believe that our audits provide a reasonable basis for our opinions.
Definition and Limitations of Internal Control over Financial Reporting
A company’s internal control over financial reporting is a process designed to provide reasonable assurance regarding the reliability of financial reporting and the preparation of financial statements for external purposes in accordance with generally accepted accounting principles. A company’s internal control over financial reporting includes those policies and procedures that (i) pertain to the maintenance of records that, in reasonable detail, accurately and fairly reflect the transactions and dispositions of the assets of the company; (ii) provide reasonable assurance that transactions are recorded as necessary to permit preparation of financial statements in accordance with generally accepted accounting principles, and that receipts and expenditures of the company are being made only in accordance with authorizations of management and directors of the company; and (iii) provide reasonable assurance regarding prevention or timely detection of unauthorized acquisition, use, or disposition of the company’s assets that could have a material effect on the financial statements.
84
Because of its inherent limitations, internal control over financial reporting may not prevent or detect misstatements. Also, projections of any evaluation of effectiveness to future periods are subject to the risk that controls may become inadequate because of changes in conditions, or that the degree of compliance with the policies or procedures may deteriorate.
/s/ PricewaterhouseCoopers LLP
Philadelphia, Pennsylvania
February 20, 2018
We have served as the Company’s auditor since 2009.
85
Essent Group Ltd. and Subsidiaries
|
|
December 31,
|
|||||||
|
(In thousands, except per share amounts)
|
2017
|
|
2016
|
|||||
|
Assets
|
|
|
|
|
||||
|
Investments available for sale, at fair value
|
|
|
|
|
||||
|
Fixed maturities (amortized cost: 2017 — $1,994,200; 2016 — $1,497,186)
|
$
|
1,992,371
|
|
$
|
1,482,754
|
|
||
|
Short-term investments (amortized cost: 2017 — $312,714; 2016 — $132,352)
|
312,694
|
|
132,348
|
|
||||
|
Total investments
|
2,305,065
|
|
1,615,102
|
|
||||
|
Cash
|
43,524
|
|
27,531
|
|
||||
|
Accrued investment income
|
12,807
|
|
9,488
|
|
||||
|
Accounts receivable
|
29,752
|
|
21,632
|
|
||||
|
Deferred policy acquisition costs
|
15,354
|
|
13,400
|
|
||||
|
Property and equipment (at cost, less accumulated depreciation of $50,466 in 2017 and $46,543 in 2016)
|
6,979
|
|
8,119
|
|
||||
|
Prepaid federal income tax
|
252,157
|
|
181,272
|
|
||||
|
Other assets
|
8,730
|
|
6,454
|
|
||||
|
Total assets
|
$
|
2,674,368
|
|
$
|
1,882,998
|
|
||
|
Liabilities and Stockholders' Equity
|
|
|
|
|
||||
|
Liabilities
|
|
|
|
|
||||
|
Reserve for losses and LAE
|
$
|
46,850
|
|
$
|
28,142
|
|
||
|
Unearned premium reserve
|
259,672
|
|
219,616
|
|
||||
|
Net deferred tax liability
|
127,636
|
|
142,587
|
|
||||
|
Credit facility borrowings (at carrying value, less unamortized deferred costs of $1,409 in 2017 and $0 in 2016)
|
248,591
|
|
100,000
|
|
||||
|
Securities purchases payable
|
14,999
|
|
14,999
|
|
||||
|
Other accrued liabilities
|
36,184
|
|
33,881
|
|
||||
|
Total liabilities
|
733,932
|
|
539,225
|
|
||||
|
Commitments and contingencies (see Note 8)
|
|
|
|
|
||||
|
Stockholders' Equity
|
|
|
|
|
||||
|
Common Shares, $0.015 par value:
|
|
|
|
|
||||
|
Authorized - 233,333; issued and outstanding - 98,434 shares in 2017 and 93,105 shares in 2016
|
1,476
|
|
1,397
|
|
||||
|
Additional paid-in capital
|
1,127,137
|
|
918,296
|
|
||||
|
Accumulated other comprehensive loss
|
(3,252
|
)
|
(12,255
|
)
|
||||
|
Retained earnings
|
815,075
|
|
436,335
|
|
||||
|
Total stockholders' equity
|
1,940,436
|
|
1,343,773
|
|
||||
|
Total liabilities and stockholders' equity
|
$
|
2,674,368
|
|
$
|
1,882,998
|
|
||
See accompanying notes to consolidated financial statements.
86
Essent Group Ltd. and Subsidiaries
|
|
Year Ended December 31,
|
|||||||||||
|
(In thousands, except per share amounts)
|
2017
|
2016
|
2015
|
|||||||||
|
Revenues:
|
|
|
|
|
|
|
||||||
|
Net premiums written
|
$
|
570,186
|
|
$
|
441,278
|
|
$
|
370,568
|
|
|||
|
Increase in unearned premiums
|
(40,056
|
)
|
(18,571
|
)
|
(44,097
|
)
|
||||||
|
Net premiums earned
|
530,130
|
|
422,707
|
|
326,471
|
|
||||||
|
Net investment income
|
40,226
|
|
27,890
|
|
19,885
|
|
||||||
|
Realized investment gains, net
|
2,015
|
|
1,934
|
|
2,554
|
|
||||||
|
Other income
|
4,140
|
|
5,727
|
|
4,380
|
|
||||||
|
Total revenues
|
576,511
|
|
458,258
|
|
353,290
|
|
||||||
|
Losses and expenses:
|
|
|
|
|
|
|
||||||
|
Provision for losses and LAE
|
27,232
|
|
15,525
|
|
11,905
|
|
||||||
|
Other underwriting and operating expenses
|
145,533
|
|
130,425
|
|
112,987
|
|
||||||
|
Interest expense
|
5,178
|
|
426
|
|
—
|
|
||||||
|
Total losses and expenses
|
177,943
|
|
146,376
|
|
124,892
|
|
||||||
|
Income before income taxes
|
398,568
|
|
311,882
|
|
228,398
|
|
||||||
|
Income tax expense
|
18,821
|
|
89,276
|
|
71,067
|
|
||||||
|
Net income
|
$
|
379,747
|
|
$
|
222,606
|
|
$
|
157,331
|
|
|||
|
Earnings per share:
|
|
|
|
|
|
|
||||||
|
Basic
|
$
|
4.07
|
|
$
|
2.45
|
|
$
|
1.74
|
|
|||
|
Diluted
|
3.99
|
|
2.41
|
|
1.72
|
|
||||||
|
Weighted average common shares outstanding:
|
|
|
|
|
|
|
||||||
|
Basic
|
93,330
|
|
90,913
|
|
90,351
|
|
||||||
|
Diluted
|
95,211
|
|
92,245
|
|
91,738
|
|
||||||
|
Net income
|
$
|
379,747
|
|
$
|
222,606
|
|
$
|
157,331
|
|
|||
|
Other comprehensive income (loss):
|
|
|
|
|
|
|
||||||
|
Change in unrealized appreciation (depreciation) of investments, net of tax expense (benefit) of $4,519 in 2017, ($2,941) in 2016 and ($1,285) in 2015
|
8,068
|
|
(12,156
|
)
|
(4,766
|
)
|
||||||
|
Total other comprehensive income (loss)
|
8,068
|
|
(12,156
|
)
|
(4,766
|
)
|
||||||
|
Comprehensive income
|
$
|
387,815
|
|
$
|
210,450
|
|
$
|
152,565
|
|
|||
See accompanying notes to consolidated financial statements.
87
Essent Group Ltd. and Subsidiaries
Consolidated Statements of Changes in Stockholders' Equity
|
(In thousands)
|
Common
Shares
|
Additional
Paid-In
Capital
|
Accumulated
Other
Comprehensive
Income (Loss)
|
Retained
Earnings
|
Treasury
Stock
|
Total
Stockholders'
Equity
|
||||||||||||||||||
|
Balance at January 1, 2015
|
$
|
1,388
|
|
$
|
893,285
|
|
$
|
4,667
|
|
$
|
56,398
|
|
$
|
—
|
|
$
|
955,738
|
|
||||||
|
Net income
|
|
|
|
|
|
|
157,331
|
|
|
|
157,331
|
|
||||||||||||
|
Other comprehensive loss
|
|
|
|
|
(4,766
|
)
|
|
|
|
|
(4,766
|
)
|
||||||||||||
|
Issuance of management incentive shares
|
6
|
|
(6
|
)
|
|
|
|
|
|
|
—
|
|
||||||||||||
|
Forfeiture of management incentive shares
|
(1
|
)
|
1
|
|
|
|
|
|
|
|
—
|
|
||||||||||||
|
Stock-based compensation expense
|
|
|
13,633
|
|
|
|
|
|
|
|
13,633
|
|
||||||||||||
|
Excess tax benefits from stock-based compensation expense
|
|
|
2,420
|
|
|
|
|
|
|
|
2,420
|
|
||||||||||||
|
Treasury stock acquired
|
|
|
|
|
|
|
|
|
(5,168
|
)
|
(5,168
|
)
|
||||||||||||
|
Cancellation of treasury stock
|
(3
|
)
|
(5,165
|
)
|
|
|
|
|
5,168
|
|
—
|
|
||||||||||||
|
Other equity transactions
|
53
|
|
53
|
|
||||||||||||||||||||
|
Balance at December 31, 2015
|
$
|
1,390
|
|
$
|
904,221
|
|
$
|
(99
|
)
|
$
|
213,729
|
|
$
|
—
|
|
$
|
1,119,241
|
|
||||||
|
Net income
|
|
|
|
|
|
|
222,606
|
|
|
|
222,606
|
|
||||||||||||
|
Other comprehensive loss
|
|
|
|
|
(12,156
|
)
|
|
|
|
|
(12,156
|
)
|
||||||||||||
|
Issuance of management incentive shares
|
10
|
|
(10
|
)
|
|
|
|
|
|
|
—
|
|
||||||||||||
|
Forfeiture of management incentive shares
|
—
|
|
—
|
|
|
|
|
|
|
|
—
|
|
||||||||||||
|
Stock-based compensation expense
|
|
|
16,881
|
|
|
|
|
|
|
|
16,881
|
|
||||||||||||
|
Excess tax benefits from stock-based compensation expense
|
|
|
1,083
|
|
|
|
|
|
|
|
1,083
|
|
||||||||||||
|
Treasury stock acquired
|
|
|
|
|
|
|
|
|
(4,024
|
)
|
(4,024
|
)
|
||||||||||||
|
Cancellation of treasury stock
|
(3
|
)
|
(4,021
|
)
|
|
|
|
|
4,024
|
|
—
|
|
||||||||||||
|
Other equity transactions
|
142
|
|
142
|
|
||||||||||||||||||||
|
Balance at December 31, 2016
|
$
|
1,397
|
|
$
|
918,296
|
|
$
|
(12,255
|
)
|
$
|
436,335
|
|
$
|
—
|
|
$
|
1,343,773
|
|
||||||
|
Net income
|
379,747
|
|
379,747
|
|
||||||||||||||||||||
|
Other comprehensive income
|
8,068
|
|
8,068
|
|
||||||||||||||||||||
|
Issuance of Common Shares, net of issuance cost of $1,802
|
75
|
|
197,623
|
|
197,698
|
|
||||||||||||||||||
|
Issuance of management incentive shares
|
8
|
|
(8
|
)
|
—
|
|
||||||||||||||||||
|
Stock-based compensation expense
|
|
|
18,688
|
|
18,688
|
|
||||||||||||||||||
|
Cumulative effect of ASU 2016-09 adoption
|
111
|
|
(72
|
)
|
39
|
|
||||||||||||||||||
|
Treasury stock acquired
|
|
|
|
|
(7,577
|
)
|
(7,577
|
)
|
||||||||||||||||
|
Cancellation of treasury stock
|
(4
|
)
|
(7,573
|
)
|
7,577
|
|
—
|
|
||||||||||||||||
|
Reclassification of certain income tax effects resulting from tax reform
|
935
|
|
(935
|
)
|
—
|
|
||||||||||||||||||
|
Balance at December 31, 2017
|
$
|
1,476
|
|
$
|
1,127,137
|
|
$
|
(3,252
|
)
|
$
|
815,075
|
|
$
|
—
|
|
$
|
1,940,436
|
|
||||||
See accompanying notes to consolidated financial statements.
88
Essent Group Ltd. and Subsidiaries
|
|
Year Ended December 31,
|
|||||||||||
|
(In thousands)
|
2017
|
2016
|
2015
|
|||||||||
|
Operating Activities
|
|
|
|
|
|
|
||||||
|
Net income
|
$
|
379,747
|
|
$
|
222,606
|
|
$
|
157,331
|
|
|||
|
Adjustments to reconcile net income to net cash provided by operating activities:
|
|
|
|
|
||||||||
|
Gain on the sale of investments, net
|
(2,015
|
)
|
(1,934
|
)
|
(2,554
|
)
|
||||||
|
Depreciation and amortization
|
3,923
|
|
4,064
|
|
3,219
|
|
||||||
|
Stock-based compensation expense
|
18,688
|
|
16,881
|
|
13,633
|
|
||||||
|
Amortization of premium on investment securities
|
12,038
|
|
10,486
|
|
10,004
|
|
||||||
|
Deferred income tax provision
|
(19,431
|
)
|
57,564
|
|
52,157
|
|
||||||
|
Change in:
|
|
|
|
|
||||||||
|
Accrued investment income
|
(3,319
|
)
|
(1,720
|
)
|
(2,020
|
)
|
||||||
|
Accounts receivable
|
(8,160
|
)
|
(4,955
|
)
|
(2,828
|
)
|
||||||
|
Deferred policy acquisition costs
|
(1,954
|
)
|
(1,871
|
)
|
(1,932
|
)
|
||||||
|
Prepaid federal income tax
|
(70,885
|
)
|
(61,860
|
)
|
(59,739
|
)
|
||||||
|
Other assets
|
(1,408
|
)
|
(526
|
)
|
(724
|
)
|
||||||
|
Reserve for losses and LAE
|
18,708
|
|
10,382
|
|
9,333
|
|
||||||
|
Unearned premium reserve
|
40,056
|
|
18,571
|
|
44,097
|
|
||||||
|
Other accrued liabilities
|
2,585
|
|
6,871
|
|
6,582
|
|
||||||
|
Net cash provided by operating activities
|
368,573
|
|
274,559
|
|
226,559
|
|
||||||
|
Investing Activities
|
|
|
|
|
|
|
||||||
|
Net change in short-term investments
|
(180,346
|
)
|
(46,352
|
)
|
124,692
|
|
||||||
|
Purchase of investments available for sale
|
(833,298
|
)
|
(656,768
|
)
|
(798,891
|
)
|
||||||
|
Proceeds from maturity of investments available for sale
|
71,908
|
|
27,186
|
|
8,613
|
|
||||||
|
Proceeds from sales of investments available for sale
|
254,377
|
|
313,780
|
|
449,834
|
|
||||||
|
Purchase of property and equipment
|
(2,783
|
)
|
(3,162
|
)
|
(4,960
|
)
|
||||||
|
Net cash used in investing activities
|
(690,142
|
)
|
(365,316
|
)
|
(220,712
|
)
|
||||||
|
Financing Activities
|
|
|
|
|
|
|
||||||
|
Issuance of common shares, net of costs
|
197,829
|
|
—
|
|
(537
|
)
|
||||||
|
Credit facility borrowings
|
200,000
|
|
100,000
|
|
—
|
|
||||||
|
Credit facility repayments
|
(50,000
|
)
|
—
|
|
—
|
|
||||||
|
Treasury stock acquired
|
(7,577
|
)
|
(4,024
|
)
|
(5,168
|
)
|
||||||
|
Payment of issuance costs for credit facility
|
(2,690
|
)
|
(2,436
|
)
|
—
|
|
||||||
|
Other financing activities
|
—
|
|
142
|
|
53
|
|
||||||
|
Net cash provided by (used in) financing activities
|
337,562
|
|
93,682
|
|
(5,652
|
)
|
||||||
|
Net increase in cash
|
15,993
|
|
2,925
|
|
195
|
|
||||||
|
Cash at beginning of year
|
27,531
|
|
24,606
|
|
24,411
|
|
||||||
|
Cash at end of year
|
$
|
43,524
|
|
$
|
27,531
|
|
$
|
24,606
|
|
|||
|
Supplemental Disclosure of Cash Flow Information
|
|
|
|
|
|
|
||||||
|
Income tax payments
|
$
|
(40,300
|
)
|
$
|
(30,800
|
)
|
$
|
(15,500
|
)
|
|||
|
Interest payments
|
(4,685
|
)
|
(324
|
)
|
—
|
|
||||||
|
Noncash Transactions
|
|
|
|
|
|
|
||||||
|
Repayment of borrowings with term loan proceeds (see Note 7)
|
$
|
(125,000
|
)
|
$
|
—
|
|
$
|
—
|
|
|||
See accompanying notes to consolidated financial statements.
89
Essent Group Ltd. and Subsidiaries
Notes to Consolidated Financial Statements
In these notes to
consolidated financial statements, “Essent”, “Company”, “we”, “us”, and “our” refer to
Essent Group Ltd.
and its subsidiaries, unless the context otherwise requires
.
Essent Group Ltd. (“Essent Group”) is a Bermuda-based holding company, which, through its wholly-owned subsidiaries, offers private mortgage insurance and reinsurance for mortgages secured by residential properties located in the United States. Mortgage insurance facilitates the sale of low down payment (generally less than
20%
) mortgage loans into the secondary mortgage market, primarily to two government-sponsored enterprises ("GSEs"), Fannie Mae and Freddie Mac.
The primary mortgage insurance operations are conducted through Essent Guaranty, Inc. ("Essent Guaranty"), which is domiciled in the state of Pennsylvania. Essent Guaranty is headquartered in Radnor, Pennsylvania and maintains operations centers in Winston-Salem, North Carolina and Irvine, California. Essent Guaranty is approved as a qualified mortgage insurer by the GSEs and is licensed to write mortgage insurance in all
50
states and the District of Columbia. Effective July 2014, Essent Guaranty began to reinsure
25%
of GSE-eligible new insurance written to Essent Reinsurance Ltd. (“Essent Re”), an affiliated Bermuda domiciled Class 3A Insurer licensed pursuant to Section 4 of the Bermuda Insurance Act 1978 that provides insurance and reinsurance coverage of mortgage credit risk. Essent Re also provides insurance and reinsurance to Freddie Mac and Fannie Mae. In 2016, Essent Re formed Essent Agency (Bermuda) Ltd., a wholly-owned subsidiary, which provides underwriting services to third-party reinsurers. In accordance with certain state law requirements, Essent Guaranty also reinsures that portion of the risk that is in excess of
25%
of the mortgage balance with respect to any loan insured, after consideration of other reinsurance, to Essent Guaranty of PA, Inc. (“Essent PA”), an affiliate domiciled in the state of Pennsylvania.
In addition to offering mortgage insurance, we provide contract underwriting services on a limited basis through CUW Solutions, LLC ("CUW Solutions"), a Delaware limited liability company, that provides, among other things, mortgage contract underwriting services to lenders and mortgage insurance underwriting services to affiliates. CUW Solutions is headquartered in Radnor, Pennsylvania and it maintains operations centers in Winston-Salem, North Carolina and Irvine, California that are subleased from Essent Guaranty.
The Company operates as a single segment for reporting purposes as substantially all business operations, assets and liabilities relate to the private mortgage insurance business and management reviews operating results for the Company as a whole to make operating decisions and assess performance.
The consolidated financial statements have been prepared in accordance with
U.S. generally accepted accounting principles
("
GAAP
") and include the accounts of
Essent Group
and its consolidated subsidiaries. All intercompany balances and transactions have been eliminated in consolidation.
Certain amounts in prior years have been reclassified to conform to the current year presentation.
Note 2
. Summary of Significant Accounting Policies
Use of Estimates
The preparation of financial statements in accordance with GAAP requires management to make estimates and assumptions that affect the reported amounts of assets and liabilities and disclosure of contingent assets and liabilities at the date of the financial statements and the reported amounts of revenues and expenses during the reporting periods. Actual results could differ from those estimates.
Investments Available for Sale
Investments available for sale include securities that we sell from time to time to provide liquidity and in response to changes in the market. Debt and equity securities classified as available for sale are reported at fair value with unrealized gains and losses on these securities reported in other comprehensive income, net of deferred income taxes. See
Note 16
for a description of the valuation methods for investments available for sale.
90
Essent Group Ltd. and Subsidiaries
Notes to Consolidated Financial Statements (Continued)
We monitor our fixed maturities for unrealized losses that appear to be other-than-temporary. A fixed maturity security is considered to be other-than-temporarily impaired when the security's fair value is less than its amortized cost basis and 1) we intend to sell the security, 2) it is more likely than not that we will be required to sell the security before recovery of the security's amortized cost basis, or 3) we believe we will be unable to recover the entire amortized cost basis of the security (i.e., a credit loss has occurred). When we determine that a credit loss has been incurred, but we do not intend to sell the security and it is not more likely than not that we will be required to sell the security before recovery of the security's amortized cost basis, the portion of the other-than-temporary impairment that is credit related is recorded as a realized loss in the consolidated statements of comprehensive income, and the portion of the other-than-temporary impairment that is not credit related is included in other comprehensive income. For those fixed maturities for which an other-than-temporary impairment has occurred, we adjust the amortized cost basis of the security and record a realized loss in the consolidated statements of comprehensive income.
We recognize purchase premiums and discounts in interest income using the interest method over the term of the securities. Gains and losses on the sales of securities are recorded on the trade date and are determined using the specific identification method.
Short-term investments are defined as short-term, highly liquid investments, both readily convertible to cash and having maturities at acquisition of twelve months or less.
Long-Lived Assets
Property and equipment are stated at cost less accumulated depreciation and amortization. Depreciation is calculated using the straight-line method over the estimated useful lives of the assets. Repairs and maintenance are charged to expense as incurred. Estimated useful lives are
5 years
for furniture and fixtures and
2
to
3 years
for equipment, computer hardware and purchased software. Certain costs associated with the acquisition or development of internal-use software are capitalized. Once the software is ready for its intended use, these costs are amortized on a straight-line basis over the software's expected useful life, which is generally
3 years
. We amortize leasehold improvements over the shorter of the lives of the leases or estimated service lives of the leasehold improvements. The balances by type were as follows at December 31:
|
|
2017
|
2016
|
||||||||||||||
|
(In thousands)
|
Cost
|
Accumulated
Depreciation/
Amortization
|
Cost
|
Accumulated
Depreciation/
Amortization
|
||||||||||||
|
Furniture and fixtures
|
$
|
2,074
|
|
$
|
(1,592
|
)
|
$
|
2,042
|
|
$
|
(1,298
|
)
|
||||
|
Office equipment
|
640
|
|
(602
|
)
|
625
|
|
(513
|
)
|
||||||||
|
Computer hardware
|
6,837
|
|
(5,413
|
)
|
5,700
|
|
(4,260
|
)
|
||||||||
|
Purchased software
|
35,710
|
|
(34,620
|
)
|
35,148
|
|
(33,304
|
)
|
||||||||
|
Costs of internal-use software
|
7,965
|
|
(6,773
|
)
|
7,140
|
|
(6,075
|
)
|
||||||||
|
Leasehold improvements
|
4,219
|
|
(1,466
|
)
|
4,007
|
|
(1,093
|
)
|
||||||||
|
Total
|
$
|
57,445
|
|
$
|
(50,466
|
)
|
$
|
54,662
|
|
$
|
(46,543
|
)
|
||||
Deferred Policy Acquisition Costs
We defer certain personnel costs and premium tax expense directly related to the successful acquisition of new insurance policies and amortize these costs over the period the related estimated gross profits are recognized in order to match costs and revenues. We do not defer any underwriting costs associated with our contract underwriting services. Costs related to the acquisition of mortgage insurance business are initially deferred and reported as deferred policy acquisition costs. Consistent with industry accounting practice, amortization of these costs for each underwriting year book of business is recognized in proportion to estimated gross profits. Estimated gross profits are composed of earned premium, interest income, losses and loss adjustment expenses. The deferred costs are adjusted as appropriate for policy cancellations to be consistent with our revenue recognition policy. We estimate the rate of amortization to reflect actual experience and any changes to persistency or loss development. Deferred policy acquisition costs are reviewed periodically to determine that they do not exceed recoverable amounts, after considering investment income. Policy acquisition costs deferred were
$8.0 million
,
$7.7 million
and
$6.6 million
for the years ended December 31,
2017
,
2016
and
2015
, respectively. Amortization of deferred policy acquisition costs
91
Essent Group Ltd. and Subsidiaries
Notes to Consolidated Financial Statements (Continued)
totaled
$6.0 million
,
$5.8 million
and
$4.7 million
for the years ended December 31,
2017
,
2016
and
2015
, respectively, and was included in other underwriting and operating expenses on the consolidated statements of comprehensive income.
Insurance Premium Revenue Recognition
Mortgage guaranty insurance policies are contracts that are generally non-cancelable by the insurer, are renewable at a fixed price, and provide for payment of premium on a monthly, annual or single basis. Upon renewal, we are not able to re-underwrite or re-price our policies. Consistent with industry accounting practices, premiums written on a monthly basis are earned as coverage is provided. Monthly policies accounted for
86%
of earned premium in
2017
. Premiums written on an annual basis are amortized on a pro rata basis over the year of coverage. Primary mortgage insurance written on policies covering more than
one year
are referred to as single premium policies. A portion of the revenue from single premium policies is recognized in earned premium in the current period, and the remaining portion is deferred as unearned premium and earned over the expected life of the policy. If single premium policies related to insured loans are cancelled due to repayment by the borrower, and the premium is non-refundable, then the remaining unearned premium related to each cancelled policy is recognized as earned premium upon notification of the cancellation. The Company recorded
$23.2 million
and
$36.9 million
of earned premium related to policy cancellations for the years ended December 31,
2017
and
2016
, respectively. Unearned premium represents the portion of premium written that is applicable to the estimated unexpired risk of insured loans. Rates used to determine the earning of single premium policies are estimates based on an analysis of the expiration of risk.
Reserve for Losses and Loss Adjustment Expenses
We establish reserves for losses based on our best estimate of ultimate claim costs for defaulted loans using the general principles contained in ASC No. 944, in accordance with industry practice. However, consistent with industry standards for mortgage insurers, we do not establish loss reserves for future claims on insured loans which are not currently in default. Loans are classified as in default when the borrower has missed
two
consecutive payments. Once we are notified that a borrower has defaulted, we will consider internal and third-party information and models, including the status of the loan as reported by its servicer and the type of loan product to determine the likelihood that a default will reach claim status. In addition, we will project the amount that we will pay if a default becomes a claim (referred to as "claim severity"). Based on this information, at each reporting date we determine our best estimate of loss reserves at a given point in time. Included in loss reserves are reserves for incurred but not reported ("IBNR") claims. IBNR reserves represent our estimated unpaid losses on loans that are in default, but have not yet been reported to us as delinquent by our customers. We will also establish reserves for associated loss adjustment expenses, consisting of the estimated cost of the claims administration process, including legal and other fees and expenses associated with administering the claims process. Establishing reserves is inherently subjective as it requires estimates that are susceptible to significant revision as more information becomes available. Our estimates of claim rates and claim sizes will be strongly influenced by prevailing economic conditions, such as the overall state of the economy, current rates or trends in unemployment, changes in housing values and/or interest rates, and our best judgments as to the future values or trends of these macroeconomic factors. Losses incurred are also generally affected by the characteristics of our insured loans, such as the loan amount, loan-to-value ratio, the percentage of coverage on the insured loan and the credit quality of the borrower.
Premium Deficiency Reserve
We are required to establish a premium deficiency reserve if the net present value of the expected future losses and expenses for a particular group of policies exceeds the net present value of expected future premium, anticipated investment income and existing reserves for that specified group of policies. We reassess our expectations for premium, losses and expenses of our mortgage insurance business periodically and update our premium deficiency analysis accordingly. As of December 31,
2017
and
2016
, we concluded that
no
premium deficiency reserve was required to be recorded in the accompanying consolidated financial statements.
Derivative Instruments
Through June 30, 2016, insurance and certain reinsurance policies issued by Essent Re in connection with Freddie Mac's Agency Credit Insurance Structure ("ACIS") program were accounted for as derivatives under GAAP with the fair value of these policies reported as an asset or liability and changes in the fair value of these policies reported in earnings as a component of other income. During the quarter ended September 30, 2016, these contracts were amended and are accounted for as
92
Essent Group Ltd. and Subsidiaries
Notes to Consolidated Financial Statements (Continued)
insurance contracts rather than as derivatives subsequent to their amendment. As of December 31,
2017
and
2016
, the Company had no derivative instruments.
Stock-Based Compensation
We measure the cost of employee services received in exchange for awards of equity instruments at the grant date of the award using a fair value based method. Prior to our initial public offering, we estimated the fair value of each nonvested share grant on the date of grant based on management's best estimate using methods further described in
Note 10
of our consolidated financial statements. Subsequent to our initial public offering, fair value is determined on the date of grant based on quoted market prices. We recognize compensation expense on nonvested shares over the vesting period of the award. We adopted ASU 2016-09
Improvements to Employee Share-Based Payment Accounting (Topic 718)
on January 1, 2017 and recorded a charge of
$0.1 million
to retained earnings as of that date representing a cumulative-effect adjustment associated with our election to recognize forfeitures as they occur rather than on an estimated basis. In connection with the adoption of this ASU, beginning in 2017, excess tax benefits and tax deficiencies associated with share-based payments are recognized as income tax expense or benefit in the income statement and treated as discrete items in the reporting period. Through December 31, 2016, excess tax benefits were recognized in additional paid-in-capital.
Income Taxes
Deferred income tax assets and liabilities are determined using the asset and liability (or balance sheet) method. Under this method, we determine the net deferred tax asset or liability based on the tax effects of the temporary differences between the book and tax bases of the various assets and liabilities and give current recognition to changes in tax rates and laws. Changes in tax laws, rates, regulations and policies, or the final determination of tax audits or examinations, could materially affect our tax estimates. We evaluate the realizability of the deferred tax asset and recognize a valuation allowance if, based on the weight of all available positive and negative evidence, it is more likely than not that some portion or all of the deferred tax asset will not be realized. When evaluating the realizability of the deferred tax asset, we consider estimates of expected future taxable income, existing and projected book/tax differences, carryback and carryforward periods, tax planning strategies available, and the general and industry specific economic outlook. This realizability analysis is inherently subjective, as it requires management to forecast changes in the mortgage market, as well as the related impact on mortgage insurance, and the competitive and general economic environment in future periods. Changes in the estimate of deferred tax asset realizability, if applicable, are included in income tax expense on the consolidated statements of comprehensive income.
ASC No. 740 provides a recognition threshold and measurement attribute for the financial statement recognition and measurement of a tax position taken or expected to be taken in a tax return. In accordance with ASC No. 740, before a tax benefit can be recognized, a tax position is evaluated using a threshold that it is more likely than not that the tax position will be sustained upon examination. When evaluating the more-likely-than-not recognition threshold, ASC No. 740 provides that a company should presume the tax position will be examined by the appropriate taxing authority that has full knowledge of all relevant information. If the tax position meets the more-likely-than-not recognition threshold, it is initially and subsequently measured as the largest amount of benefit that is greater than 50% likely of being realized upon ultimate settlement.
As described in
Note 12
, we purchase non-interest-bearing United States Mortgage Guaranty Tax and Loss Bonds ("T&L Bonds") issued by the Treasury Department. These assets are carried at cost and are reported as prepaid federal income tax on the consolidated balance sheets.
It is our policy to classify interest and penalties as income tax expense.
Earnings per Share
Basic earnings per common share amounts are calculated based on income available to common stockholders and the weighted average number of common shares outstanding during the reporting period. Diluted earnings per common share amounts are calculated based on income available to common stockholders and the weighted average number of common and potential common shares outstanding during the reporting period. Potential common shares, composed of the incremental common shares issuable upon vesting of unvested common shares and common share units, are included in the earnings per share calculation to the extent that they are dilutive.
93
Essent Group Ltd. and Subsidiaries
Notes to Consolidated Financial Statements (Continued)
Recently Issued Accounting Standards
In May 2014, the Financial Accounting Standards Board ("FASB") issued Accounting Standards Update ("ASU") ASU 2014-09,
Revenue from Contracts with Customers (Topic 606)
. This update is intended to provide a consistent approach in recognizing revenue. In accordance with the new standard, recognition of revenue occurs when a customer obtains control of promised goods or services in an amount that reflects the consideration to which the entity expects to be entitled in exchange for those goods or services. In addition, the new standard requires that reporting companies disclose the nature, amount, timing, and uncertainty of revenue and cash flows arising from contracts with customers. In July 2015, the FASB delayed the effective date for this update to interim and annual periods beginning after December 15, 2017. In December 2016, the FASB clarified that all contracts that are within the scope of Topic 944,
Financial Services-Insurance
, are excluded from the scope of ASU 2014-09. Accordingly, this update will not impact the recognition of revenue related to insurance premiums or investments, which represent a significant portion of our total revenues. The adoption of this ASU is not expected to have a material effect on the Company's consolidated operating results or financial position.
In January 2016, the FASB issued ASU 2016-01,
Financial Instruments-Overall (Subtopic 825-10): Recognition and Measurement of Financial Assets and Financial Liabilities.
This update requires certain equity investments (except those accounted for under the equity method of accounting or result in consolidation of the investee) to be measured at fair value with changes in fair value recognized in net income. An entity may choose to measure equity investments that do not have readily determinable fair values at cost minus impairment, if any, plus or minus changes resulting from observable price changes in orderly transactions for the identical or a similar investment of the same issuer. A qualitative assessment for impairment is required for equity investments without readily determinable fair values. This update also requires public entities to use the exit price notion when measuring the fair value of financial instruments for disclosure purposes. In addition, an entity is required to evaluate the need for a valuation allowance on a deferred tax asset related to available-for-sale investment securities in combination with the entity’s other deferred tax assets. The provisions of this update are effective for interim and annual periods beginning after December 15, 2017. The adoption of this ASU is not expected to have a material effect on the Company's consolidated operating results or financial position.
In February 2016, the FASB issued ASU 2016-02,
Leases (Topic 842)
. This update will require organizations that lease assets to recognize on the balance sheet the assets and liabilities for the rights and obligations created by those leases. The new guidance will also require additional disclosures about the amount, timing and uncertainty of cash flows arising from leases. The provisions of this update are effective for annual and interim periods beginning after December 15, 2018. The Company expects a gross-up of its consolidated balance sheets as a result of recognizing lease liabilities and right of use assets. The Company is still evaluating the impact the adoption of this ASU will have on the consolidated financial statements.
In June 2016, the FASB issued ASU 2016-13,
Measurement of Credit Losses on Financial Instruments (Topic 326)
. This update is intended to provide financial statement users with more information about the expected credit losses on financial instruments and other commitments to extend credit held by a reporting entity at each reporting date. The amendments in this ASU replace the incurred loss impairment methodology in current GAAP with a methodology that reflects expected credit losses and requires consideration of a broader range of reasonable and supportable information to inform credit loss estimates. The new guidance requires financial assets measured at amortized cost to be presented at the net amount expected to be collected through the use of an allowance for credit losses. Credit losses relating to available-for-sale debt securities will also be recorded through an allowance rather than as a write-down of the amortized cost of the securities. The provisions of this update are effective for annual and interim periods beginning after December 15, 2019. While the Company is still evaluating this ASU, we do not expect it to impact our accounting for insurance losses and loss adjustment expenses ("LAE") as these items are not within the scope of this ASU.
In February 2018, the FASB issued ASU 2018-02,
Income Statement- Reporting Comprehensive Income (Topic 220)
. This update permits entities to elect to reclassify the income tax effects of the Tax Cuts and Jobs Act (“TCJA”) on items within accumulated other comprehensive income to retained earnings. The provisions of this update are effective for annual and interim periods beginning after December 15, 2018 and early adoption is permitted. The Company adopted this ASU retrospective to 2017 and elected to reclassify the income tax effects of TCJA, totaling
$0.9 million
, from accumulated other comprehensive income to retained earnings. It is the Company’s policy to use the portfolio approach to release income tax effects from accumulated other comprehensive income.
94
Essent Group Ltd. and Subsidiaries
Notes to Consolidated Financial Statements (Continued)
Note 3
. Investments Available for Sale
Investments available for sale consist of the following
:
|
December 31, 2017 (In thousands)
|
Amortized
Cost
|
Unrealized
Gains
|
Unrealized
Losses
|
Fair Value
|
||||||||||||
|
U.S. Treasury securities
|
$
|
231,905
|
|
$
|
2
|
|
$
|
(4,102
|
)
|
$
|
227,805
|
|
||||
|
U.S. agency securities
|
33,669
|
|
—
|
|
(555
|
)
|
33,114
|
|
||||||||
|
U.S. agency mortgage-backed securities
|
462,986
|
|
567
|
|
(7,516
|
)
|
456,037
|
|
||||||||
|
Municipal debt securities(1)
|
457,418
|
|
9,098
|
|
(1,261
|
)
|
465,255
|
|
||||||||
|
Corporate debt securities(2)
|
610,516
|
|
4,249
|
|
(3,037
|
)
|
611,728
|
|
||||||||
|
Residential and commercial mortgage securities
|
78,974
|
|
791
|
|
(358
|
)
|
79,407
|
|
||||||||
|
Asset-backed securities
|
167,638
|
|
467
|
|
(183
|
)
|
167,922
|
|
||||||||
|
Money market funds
|
263,808
|
|
—
|
|
(11
|
)
|
263,797
|
|
||||||||
|
Total investments available for sale
|
$
|
2,306,914
|
|
$
|
15,174
|
|
$
|
(17,023
|
)
|
$
|
2,305,065
|
|
||||
|
December 31, 2016 (In thousands)
|
Amortized
Cost
|
Unrealized
Gains
|
Unrealized
Losses
|
Fair Value
|
||||||||||||
|
U.S. Treasury securities
|
$
|
195,990
|
|
$
|
55
|
|
$
|
(4,497
|
)
|
$
|
191,548
|
|
||||
|
U.S. agency securities
|
18,785
|
|
—
|
|
(344
|
)
|
18,441
|
|
||||||||
|
U.S. agency mortgage-backed securities
|
324,654
|
|
335
|
|
(8,495
|
)
|
316,494
|
|
||||||||
|
Municipal debt securities(1)
|
334,048
|
|
3,649
|
|
(3,373
|
)
|
334,324
|
|
||||||||
|
Corporate debt securities(2)
|
457,842
|
|
2,343
|
|
(3,828
|
)
|
456,357
|
|
||||||||
|
Residential and commercial mortgage securities
|
68,430
|
|
488
|
|
(582
|
)
|
68,336
|
|
||||||||
|
Asset-backed securities
|
127,359
|
|
260
|
|
(447
|
)
|
127,172
|
|
||||||||
|
Money market funds
|
102,430
|
|
—
|
|
—
|
|
102,430
|
|
||||||||
|
Total investments available for sale
|
$
|
1,629,538
|
|
$
|
7,130
|
|
$
|
(21,566
|
)
|
$
|
1,615,102
|
|
||||
_______________________________________________________________________________
|
|
December 31,
|
December 31,
|
||||
|
(1) The following table summarizes municipal debt securities as of :
|
2017
|
2016
|
||||
|
Special revenue bonds
|
63.6
|
%
|
63.6
|
%
|
||
|
General obligation bonds
|
30.7
|
|
29.7
|
|
||
|
Certificate of participation bonds
|
4.4
|
|
4.9
|
|
||
|
Tax allocation bonds
|
0.8
|
|
1.1
|
|
||
|
Special tax bonds
|
0.5
|
|
0.7
|
|
||
|
Total
|
100.0
|
%
|
100.0
|
%
|
||
95
Essent Group Ltd. and Subsidiaries
Notes to Consolidated Financial Statements (Continued)
|
|
December 31,
|
December 31,
|
||||
|
(2) The following table summarizes corporate debt securities as of :
|
2017
|
2016
|
||||
|
Financial
|
45.9
|
%
|
40.6
|
%
|
||
|
Consumer, non-cyclical
|
16.2
|
|
18.6
|
|
||
|
Energy
|
7.8
|
|
9.3
|
|
||
|
Communications
|
7.3
|
|
6.0
|
|
||
|
Industrial
|
6.3
|
|
5.6
|
|
||
|
Consumer, cyclical
|
5.3
|
|
6.3
|
|
||
|
Utilities
|
5.3
|
|
6.0
|
|
||
|
Technology
|
3.9
|
|
4.3
|
|
||
|
Basic materials
|
2.0
|
|
3.3
|
|
||
|
Total
|
100.0
|
%
|
100.0
|
%
|
||
The amortized cost and fair value of investments available for sale at
December 31, 2017
,
by contractual maturity, are shown below. Expected maturities will differ from contractual maturities because borrowers may have the right to call or prepay obligations with or without call or prepayment penalties. Because most U.S. agency mortgage-backed securities, residential and commercial mortgage securities and asset-backed securities provide for periodic payments throughout their lives, they are listed below in separate categories
.
|
(In thousands)
|
Amortized
Cost
|
Fair
Value
|
||||||
|
U.S. Treasury securities:
|
|
|
|
|
||||
|
Due in 1 year
|
$
|
58,429
|
|
$
|
58,411
|
|
||
|
Due after 1 but within 5 years
|
72,469
|
|
71,661
|
|
||||
|
Due after 5 but within 10 years
|
71,006
|
|
68,376
|
|
||||
|
Due after 10 years
|
30,001
|
|
29,357
|
|
||||
|
Subtotal
|
231,905
|
|
227,805
|
|
||||
|
U.S. agency securities:
|
|
|
|
|
||||
|
Due in 1 year
|
—
|
|
—
|
|
||||
|
Due after 1 but within 5 years
|
33,669
|
|
33,114
|
|
||||
|
Subtotal
|
33,669
|
|
33,114
|
|
||||
|
Municipal debt securities:
|
|
|
|
|
||||
|
Due in 1 year
|
33,038
|
|
32,998
|
|
||||
|
Due after 1 but within 5 years
|
97,637
|
|
97,831
|
|
||||
|
Due after 5 but within 10 years
|
179,245
|
|
183,610
|
|
||||
|
Due after 10 years
|
147,498
|
|
150,816
|
|
||||
|
Subtotal
|
457,418
|
|
465,255
|
|
||||
|
Corporate debt securities:
|
|
|
|
|
||||
|
Due in 1 year
|
80,177
|
|
80,093
|
|
||||
|
Due after 1 but within 5 years
|
332,105
|
|
331,790
|
|
||||
|
Due after 5 but within 10 years
|
196,289
|
|
197,848
|
|
||||
|
Due after 10 years
|
1,945
|
|
1,997
|
|
||||
|
Subtotal
|
610,516
|
|
611,728
|
|
||||
|
U.S. agency mortgage-backed securities
|
462,986
|
|
456,037
|
|
||||
|
Residential and commercial mortgage securities
|
78,974
|
|
79,407
|
|
||||
|
Asset-backed securities
|
167,638
|
|
167,922
|
|
||||
|
Money market funds
|
263,808
|
|
263,797
|
|
||||
|
Total investments available for sale
|
$
|
2,306,914
|
|
$
|
2,305,065
|
|
||
96
Essent Group Ltd. and Subsidiaries
Notes to Consolidated Financial Statements (Continued)
Gross gains and losses realized on the sale of investments available for sale were as follows:
|
|
Year Ended December 31,
|
|||||||||||
|
(In thousands)
|
2017
|
2016
|
2015
|
|||||||||
|
Realized gross gains
|
$
|
2,504
|
|
$
|
2,822
|
|
$
|
3,908
|
|
|||
|
Realized gross losses
|
425
|
|
788
|
|
1,073
|
|
||||||
The fair value of investments in an unrealized loss position and the related unrealized losses were as follows
:
|
|
Less than 12 months
|
12 months or more
|
Total
|
|||||||||||||||||||||
|
December 31, 2017 (In thousands)
|
Fair
Value |
Gross
Unrealized Losses |
Fair
Value |
Gross
Unrealized Losses |
Fair
Value |
Gross
Unrealized Losses |
||||||||||||||||||
|
U.S. Treasury securities
|
$
|
151,119
|
|
$
|
(1,240
|
)
|
$
|
69,454
|
|
$
|
(2,862
|
)
|
$
|
220,573
|
|
$
|
(4,102
|
)
|
||||||
|
U.S. agency securities
|
17,320
|
|
(190
|
)
|
15,794
|
|
(365
|
)
|
33,114
|
|
(555
|
)
|
||||||||||||
|
U.S. agency mortgage-backed securities
|
180,443
|
|
(1,394
|
)
|
217,944
|
|
(6,122
|
)
|
398,387
|
|
(7,516
|
)
|
||||||||||||
|
Municipal debt securities
|
124,171
|
|
(817
|
)
|
23,492
|
|
(444
|
)
|
147,663
|
|
(1,261
|
)
|
||||||||||||
|
Corporate debt securities
|
214,371
|
|
(1,213
|
)
|
94,261
|
|
(1,824
|
)
|
308,632
|
|
(3,037
|
)
|
||||||||||||
|
Residential and commercial mortgage securities
|
29,842
|
|
(179
|
)
|
5,988
|
|
(179
|
)
|
35,830
|
|
(358
|
)
|
||||||||||||
|
Asset-backed securities
|
58,798
|
|
(133
|
)
|
5,828
|
|
(50
|
)
|
64,626
|
|
(183
|
)
|
||||||||||||
|
Money market funds
|
59,489
|
|
(11
|
)
|
—
|
|
—
|
|
59,489
|
|
(11
|
)
|
||||||||||||
|
Total
|
$
|
835,553
|
|
$
|
(5,177
|
)
|
$
|
432,761
|
|
$
|
(11,846
|
)
|
$
|
1,268,314
|
|
$
|
(17,023
|
)
|
||||||
|
|
Less than 12 months
|
12 months or more
|
Total
|
|||||||||||||||||||||
|
December 31, 2016 (In thousands)
|
Fair
Value |
Gross
Unrealized Losses |
Fair
Value |
Gross
Unrealized Losses |
Fair
Value |
Gross
Unrealized Losses |
||||||||||||||||||
|
U.S. Treasury securities
|
$
|
160,018
|
|
$
|
(4,497
|
)
|
$
|
—
|
|
$
|
—
|
|
$
|
160,018
|
|
$
|
(4,497
|
)
|
||||||
|
U.S. agency securities
|
18,441
|
|
(344
|
)
|
—
|
|
—
|
|
18,441
|
|
(344
|
)
|
||||||||||||
|
U.S. agency mortgage-backed securities
|
289,282
|
|
(8,402
|
)
|
1,812
|
|
(93
|
)
|
291,094
|
|
(8,495
|
)
|
||||||||||||
|
Municipal debt securities
|
149,368
|
|
(3,351
|
)
|
6,015
|
|
(22
|
)
|
155,383
|
|
(3,373
|
)
|
||||||||||||
|
Corporate debt securities
|
213,965
|
|
(3,704
|
)
|
8,344
|
|
(124
|
)
|
222,309
|
|
(3,828
|
)
|
||||||||||||
|
Residential and commercial mortgage securities
|
18,026
|
|
(434
|
)
|
14,014
|
|
(148
|
)
|
32,040
|
|
(582
|
)
|
||||||||||||
|
Asset-backed securities
|
28,294
|
|
(57
|
)
|
47,597
|
|
(390
|
)
|
75,891
|
|
(447
|
)
|
||||||||||||
|
Total
|
$
|
877,394
|
|
$
|
(20,789
|
)
|
$
|
77,782
|
|
$
|
(777
|
)
|
$
|
955,176
|
|
$
|
(21,566
|
)
|
||||||
The gross unrealized losses on these investment securities are principally associated with the changes in market interest rates and credit spreads subsequent to their purchase. Each issuer is current on its scheduled interest and principal payments. We assess our intent to sell these securities and whether we will be required to sell these securities before the recovery of their amortized cost basis when determining whether an impairment is other-than-temporary. We recorded other-than-temporary impairments of
$0.1 million
,
$0.1 million
and
$0.3 million
in the years ended
December 31, 2017
,
2016
and
2015
, respectively, on securities in an unrealized loss position. The impairments resulted from our intent to sell these securities subsequent to the reporting dates.
The fair value of investments deposited with insurance regulatory authorities to meet statutory requirements was
$8.6 million
at
December 31, 2017
and
$8.5 million
at
December 31, 2016
.
In connection with its insurance and reinsurance activities, Essent Re is required to maintain assets in trusts for the benefit of its contractual counterparties. The fair value of the investments on deposit in these trusts
was
$615.8 million
at
December 31, 2017
and
$349.6 million
at
December 31, 2016
.
97
Essent Group Ltd. and Subsidiaries
Notes to Consolidated Financial Statements (Continued)
Net investment income consists of:
|
|
Year Ended December 31,
|
|||||||||||
|
(In thousands)
|
2017
|
2016
|
2015
|
|||||||||
|
Fixed maturities
|
$
|
41,935
|
|
$
|
29,865
|
|
$
|
21,693
|
|
|||
|
Short-term investments
|
1,019
|
|
142
|
|
63
|
|
||||||
|
Gross investment income
|
42,954
|
|
30,007
|
|
21,756
|
|
||||||
|
Investment expenses
|
(2,728
|
)
|
(2,117
|
)
|
(1,871
|
)
|
||||||
|
Net investment income
|
$
|
40,226
|
|
$
|
27,890
|
|
$
|
19,885
|
|
|||
Accounts receivable consists of the following at December 31:
|
(In thousands)
|
2017
|
2016
|
||||||
|
Premiums receivable
|
$
|
29,027
|
|
$
|
21,265
|
|
||
|
Other receivables
|
725
|
|
367
|
|
||||
|
Total accounts receivable
|
29,752
|
|
21,632
|
|
||||
|
Less: Allowance for doubtful accounts
|
—
|
|
—
|
|
||||
|
Accounts receivable, net
|
$
|
29,752
|
|
$
|
21,632
|
|
||
Premiums receivable consists of premiums due on our mortgage insurance policies. If mortgage insurance premiums are unpaid for more than
90 days
, the receivable is written off against earned premium and the related insurance policy is cancelled. For all periods presented,
no
provision or allowance for doubtful accounts was required.
Note 5
. Triad Transaction
On December 1, 2009, under the terms of an asset purchase agreement (the "Asset Purchase Agreement") dated October 7, 2009 between Essent Guaranty and Triad Guaranty, Inc. and Triad Guaranty Insurance Corporation (collectively referred to as "Triad"), we acquired all of Triad's proprietary mortgage insurance information technology and operating platform, certain software and substantially all of the supporting hardware, as well as furniture and fixtures, in exchange for fixed payments of
$15 million
, contingent payments of
$15 million
, and the assumption of certain contractual obligations. The final contingent payment was made in the year ended December 31, 2014 and no further amounts are due to Triad under the Asset Purchase Agreement.
Effective with the completion of the transaction, Essent Guaranty began providing information systems maintenance and development services, customer service and policy administration support to Triad under the terms of a services agreement dated December 1, 2009. Triad retains the obligation for all risks insured under its existing insurance contracts and will continue to directly manage loss mitigation and claim activity on its insured business. Under the terms of the services agreement, we provide the following services to Triad in exchange for fees: (i) maintain and support the licensed technology and equipment and provide to Triad certain information and technology services; (ii) access to the Triad technology platform in order to support Triad's business pursuant to the license grant outlined in the services agreement; (iii) customer support-related services; and (iv) technology development services. Effective December 1, 2010, the fee is based principally on the number of Triad's insurance policies in force on a monthly basis. Accordingly, this fee is reduced as Triad's policies in force decline. We earned fees under the services agreement of
$1.1 million
,
$1.4 million
and
$1.8 million
for the years ended December 31,
2017
,
2016
and
2015
, respectively, which are included in other income in the accompanying consolidated statements of comprehensive income.
98
Essent Group Ltd. and Subsidiaries
Notes to Consolidated Financial Statements (Continued)
Note 6
. Reserve for Losses and Loss Adjustment Expenses
The following table provides a reconciliation of the beginning and ending reserve balances for losses and loss adjustment expenses ("LAE") for the years ended December 31:
|
($ in thousands)
|
2017
|
2016
|
||||||
|
Reserve for losses and LAE at beginning of year
|
$
|
28,142
|
|
$
|
17,760
|
|
||
|
Less: Reinsurance recoverables
|
—
|
|
—
|
|
||||
|
Net reserve for losses and LAE at beginning of year
|
28,142
|
|
17,760
|
|
||||
|
Add provision for losses and LAE, net of reinsurance, occurring in:
|
|
|
|
|
||||
|
Current year
|
38,178
|
|
21,889
|
|
||||
|
Prior years
|
(10,946
|
)
|
(6,364
|
)
|
||||
|
Net incurred losses during the current year
|
27,232
|
|
15,525
|
|
||||
|
Deduct payments for losses and LAE, net of reinsurance, occurring in:
|
|
|
|
|
||||
|
Current year
|
633
|
|
927
|
|
||||
|
Prior years
|
7,891
|
|
4,216
|
|
||||
|
Net loss and LAE payments during the current year
|
8,524
|
|
5,143
|
|
||||
|
Net reserve for losses and LAE at end of year
|
46,850
|
|
28,142
|
|
||||
|
Plus: Reinsurance recoverables
|
—
|
|
—
|
|
||||
|
Reserve for losses and LAE at end of year
|
$
|
46,850
|
|
$
|
28,142
|
|
||
|
Loans in default at end of year
|
4,783
|
|
1,757
|
|
||||
For the year ended December 31,
2017
,
$7.9 million
was paid for incurred claims and claim adjustment expenses attributable to insured events of prior years. There has been a
$10.9 million
favorable prior year development during the year ended December 31,
2017
. Reserves remaining as of December 31,
2017
for prior years are
$9.3 million
as a result of re-estimation of unpaid losses and loss adjustment expenses. For the year ended December 31,
2016
,
$4.2 million
was paid for incurred claims and claim adjustment expenses attributable to insured events of prior years. There was a
$6.4 million
favorable prior year development during the year ended December 31,
2016
. Reserves remaining as of December 31,
2016
for prior years were
$7.2 million
as a result of re-estimation of unpaid losses and loss adjustment expenses. In both periods, the favorable prior years' loss development was the result of a re-estimation of amounts ultimately to be paid on prior year defaults in the default inventory, including the impact of previously identified defaults that cured. Original estimates are increased or decreased as additional information becomes known regarding individual claims.
During the third quarter of 2017, certain regions of the U.S. experienced hurricanes which have impacted our insured portfolio’s performance. Specifically, on August 26, 2017, Hurricane Harvey made landfall in southeastern Texas and on September 10, 2017, Hurricane Irma made landfall in southern Florida and caused property damage in certain counties. Loans in default increased by
3,026
in the year ended December 31, 2017, including
2,288
defaults we identified as hurricane-related defaults. Based on prior industry experience, we expect the ultimate number of hurricane-related defaults that result in claims will be less than the default-to-claim experience of non-hurricane-related defaults. In addition, under our master policy, our exposure may be limited on hurricane-related claims. For example, we are permitted to exclude a claim entirely where damage to the property underlying a mortgage was the proximate cause of the default and adjust a claim where the property underlying a mortgage in default is subject to unrestored physical damage. Accordingly, when establishing our loss reserves as of December 31, 2017, we applied a lower estimated claim rate to new default notices received in the fourth quarter of 2017 from the affected areas than the claim rate we apply to other notices in our default inventory. The reserve for losses and LAE on hurricane-related defaults was
$11.1 million
at December 31, 2017. The impact on our reserves in future periods will be dependent upon the performance of the hurricane-related defaults and our expectations for the amount of ultimate losses on these delinquencies.
99
Essent Group Ltd. and Subsidiaries
Notes to Consolidated Financial Statements (Continued)
The following table summarizes incurred loss and allocated loss adjustment expense development, IBNR plus expected development on reported defaults and the cumulative number of reported defaults. The information about incurred loss development for the years ended December 31, 2010 to 2016 is presented as supplementary information.
|
($ in thousands)
|
Incurred Loss and Allocated LAE,
For the Years Ended December 31,
|
As of December 31, 2017
|
|||||||||||||||||||||||||||||||||||||
|
Accident Year
|
2010
Unaudited
|
2011
Unaudited
|
2012
Unaudited
|
2013
Unaudited
|
2014
Unaudited
|
2015
Unaudited
|
2016 Unaudited
|
2017
|
Total of IBNR plus Expected Development on Reported Defaults
|
Cumulative Number of Reported Defaults (1)
|
|||||||||||||||||||||||||||||
|
2010
|
$
|
—
|
|
$
|
—
|
|
$
|
—
|
|
$
|
—
|
|
$
|
—
|
|
$
|
—
|
|
$
|
—
|
|
$
|
—
|
|
$
|
—
|
|
—
|
|
||||||||||
|
2011
|
57
|
|
—
|
|
—
|
|
—
|
|
—
|
|
—
|
|
—
|
|
—
|
|
1
|
|
|||||||||||||||||||||
|
2012
|
1,523
|
|
858
|
|
814
|
|
781
|
|
748
|
|
809
|
|
—
|
|
19
|
|
|||||||||||||||||||||||
|
2013
|
2,986
|
|
2,461
|
|
2,008
|
|
1,997
|
|
2,060
|
|
12
|
|
52
|
|
|||||||||||||||||||||||||
|
2014
|
6,877
|
|
4,312
|
|
3,323
|
|
2,984
|
|
14
|
|
98
|
|
|||||||||||||||||||||||||||
|
2015
|
14,956
|
|
9,625
|
|
8,893
|
|
134
|
|
238
|
|
|||||||||||||||||||||||||||||
|
2016
|
21,889
|
|
11,890
|
|
482
|
|
388
|
|
|||||||||||||||||||||||||||||||
|
2017
|
38,178
|
|
2,573
|
|
4,494
|
|
|||||||||||||||||||||||||||||||||
|
Total
|
|
|
|
|
|
$
|
64,814
|
|
|||||||||||||||||||||||||||||||
|
(1)
Cumulative number of reported defaults includes cumulative paid claims plus loans in default by accident year as of December 31, 2017.
|
|||||||||||||||||||||||||||||||||||||||
The following table summarizes cumulative paid losses and allocated loss adjustment expenses, net of reinsurance. The information about paid loss development for the years ended December 31, 2010 through 2016 is presented as supplementary information.
|
($ in thousands)
|
Cumulative Paid Losses and Allocated LAE
For the Years Ended December 31,
|
|||||||||||||||||||||||||||||||
|
Accident Year
|
2010
Unaudited
|
2011
Unaudited
|
2012
Unaudited
|
2013
Unaudited
|
2014
Unaudited
|
2015
Unaudited
|
2016 Unaudited
|
2017
|
||||||||||||||||||||||||
|
2010
|
$
|
—
|
|
$
|
—
|
|
$
|
—
|
|
$
|
—
|
|
$
|
—
|
|
$
|
—
|
|
$
|
—
|
|
—
|
|
|||||||||
|
2011
|
|
|
—
|
|
—
|
|
—
|
|
—
|
|
—
|
|
—
|
|
—
|
|
||||||||||||||||
|
2012
|
24
|
|
535
|
|
659
|
|
665
|
|
665
|
|
808
|
|
||||||||||||||||||||
|
2013
|
239
|
|
928
|
|
1,501
|
|
1,775
|
|
1,880
|
|
||||||||||||||||||||||
|
2014
|
138
|
|
1,587
|
|
2,463
|
|
2,787
|
|
||||||||||||||||||||||||
|
2015
|
544
|
|
3,610
|
|
6,960
|
|
||||||||||||||||||||||||||
|
2016
|
927
|
|
4,896
|
|
||||||||||||||||||||||||||||
|
2017
|
633
|
|
||||||||||||||||||||||||||||||
|
Total
|
|
|
|
|
|
$
|
17,964
|
|
||||||||||||||||||||||||
|
All outstanding liabilities before 2010, net of reinsurance
|
—
|
|
||||||||||||||||||||||||||||||
|
Reserve for losses and LAE, net of reinsurance
|
$
|
46,850
|
|
|||||||||||||||||||||||||||||
For our mortgage insurance portfolio, our average annual payout of losses as of December 31,
2017
is as follows:
|
Average Annual Percentage Payout of Incurred Losses and Allocated LAE by Year
|
||||||||||||||||||
|
Year
|
1
|
2
|
3
|
4
|
5
|
6
|
||||||||||||
|
Average Payout
|
6
|
%
|
43
|
%
|
28
|
%
|
8
|
%
|
3
|
%
|
18
|
%
|
||||||
100
Essent Group Ltd. and Subsidiaries
Notes to Consolidated Financial Statements (Continued)
Note 7
. Debt Obligations
Credit Facility
On May 17, 2017, Essent Group and its subsidiaries, Essent Irish Intermediate Holdings Limited and Essent US Holdings, Inc. (collectively, the "Borrowers"), entered into an amended and restated
four
-year, secured credit facility with a committed capacity of
$375 million
(the “Credit Facility”). The Credit Facility amends and restates the
three
-year, secured revolving credit facility entered into on April 19, 2016, and provides for (i) an increase in the revolving credit facility from
$200 million
to
$250 million
, (ii) the issuance of term loans of
$125 million
, the proceeds of which were used at closing to pay down borrowings outstanding under the revolving credit facility, and (iii) a
$75 million
uncommitted line that may be exercised at the Borrowers’ option so long as the Borrowers receive commitments from the lenders. Borrowings under the Credit Facility may be used for working capital and general corporate purposes, including, without limitation, capital contributions to Essent’s insurance and reinsurance subsidiaries. Borrowings will accrue interest at a floating rate tied to a standard short-term borrowing index, selected at the Company’s option, plus an applicable margin. A commitment fee is due quarterly on the average daily amount of the undrawn revolving commitment. The applicable margin and the commitment fee are based on the senior unsecured debt rating or long-term issuer rating of Essent Group to the extent available, or the insurer financial strength rating of Essent Guaranty. The current annual commitment fee rate is
0.35%
. The obligations under the Credit Facility are secured by certain assets of the Borrowers, excluding the stock and assets of its insurance and reinsurance subsidiaries. The Credit Facility contains several covenants, including financial covenants relating to minimum net worth, capital and liquidity levels, maximum debt to capitalization level and Essent Guaranty's compliance with the PMIERs (see
Note 17
). The
$125 million
term loans contractually mature on May 17, 2021. This description is not intended to be complete in all respects and is qualified in its entirety by the terms of the Credit Facility, including its covenants. As of
December 31, 2017
, the Company was in compliance with the covenants and
$250 million
had been borrowed under the Credit Facility with a weighted average interest rate of
3.49%
. As of
December 31, 2016
,
$100 million
had been borrowed with a weighted average interest rate of
2.73%
.
Note 8
. Commitments and Contingencies
Obligations under Guarantees
Under the terms of CUW Solutions' contract underwriting agreements with lenders and subject to contractual limitations on liability, we agree to indemnify certain lenders against losses incurred in the event that we make an error in determining whether loans processed meet specified underwriting criteria, to the extent that such error materially restricts or impairs the salability of such loan, results in a material reduction in the value of such loan or results in the lender repurchasing the loan. The indemnification may be in the form of monetary or other remedies. For the years ended
December 31, 2017
and
2016
, we paid
$0.2 million
and
$0.1 million
, respectively, related to remedies. As of
December 31, 2017
, management believes any potential claims for indemnification related to contract underwriting services through
December 31, 2017
are not material to our consolidated financial position or results of operations.
In addition to the indemnifications discussed above, in the normal course of business, we enter into agreements or other relationships with third parties pursuant to which we may be obligated under specified circumstances to indemnify the counterparties with respect to certain matters. Our contractual indemnification obligations typically arise in the context of agreements entered into by us to, among other things, purchase or sell services, finance our business and business transactions, lease real property and license intellectual property. The agreements we enter into in the normal course of business generally require us to pay certain amounts to the other party associated with claims or losses if they result from our breach of the agreement, including the inaccuracy of representations or warranties. The agreements we enter into may also contain other indemnification provisions that obligate us to pay amounts upon the occurrence of certain events, such as the negligence or willful misconduct of our employees, infringement of third-party intellectual property rights or claims that performance of the agreement constitutes a violation of law. Generally, payment by us under an indemnification provision is conditioned upon the other party making a claim, and typically we can challenge the other party's claims. Further, our indemnification obligations may be limited in time and/or amount, and in some instances, we may have recourse against third parties for certain payments made by us under an indemnification agreement or obligation. As of
December 31, 2017
, contingencies triggering material indemnification obligations or payments have not occurred historically and are not expected to occur. The nature of the indemnification provisions in the various types of agreements and relationships described above are believed to be low risk and pervasive, and we consider them to have a remote risk of loss or payment. We have not recorded any provisions on the consolidated balance sheets related to these indemnifications.
101
Essent Group Ltd. and Subsidiaries
Notes to Consolidated Financial Statements (Continued)
Commitments
We lease office space for use in our operations under leases accounted for as operating leases. Total rent expense was
$2.1 million
,
$1.9 million
and
$1.9 million
for the years ended December 31,
2017
,
2016
and
2015
, respectively. The future minimum lease payments of non-cancelable operating leases are as follows at
December 31, 2017
:
|
Year Ended December 31 (In thousands)
|
||||
|
2018
|
$
|
2,479
|
|
|
|
2019
|
2,649
|
|
||
|
2020
|
2,594
|
|
||
|
2021
|
2,651
|
|
||
|
2022
|
2,710
|
|
||
|
2023 and thereafter
|
4,517
|
|
||
|
Total minimum payments required
|
$
|
17,600
|
|
|
Minimum lease payments shown above have not been reduced by minimum sublease rental income of
$0.1 million
due in
2018
under the non-cancelable sublease.
Note 9
. Capital Stock
Our authorized share capital consists of
233.3 million
shares of a single class of common shares (the "Common Shares"). The Common Shares have no pre-emptive rights or other rights to subscribe for additional shares, and no rights of redemption, conversion or exchange. Under certain circumstances and subject to the provisions of Bermuda law and our bye-laws, we may be required to make an offer to repurchase shares held by members. The Common Shares rank pari passu with one another in all respects as to rights of payment and distribution. In general, holders of Common Shares will have
one
vote for each Common Share held by them and will be entitled to vote, on a non-cumulative basis, at all meetings of shareholders. In the event that a shareholder is considered a
9.5%
Shareholder under our bye-laws, such shareholder's votes will be reduced by whatever amount is necessary so that after any such reduction the votes of such shareholder will not result in any other person being treated as a
9.5%
Shareholder with respect to the vote on such matter. Under these provisions certain shareholders may have their voting rights limited to less than
one
vote per share, while other shareholders may have voting rights in excess of
one
vote per share.
In August 2017, Essent Group completed the sale of
5.0 million
Common Shares in a public offering at a price of
$39.90
per share. The total net proceeds from this offering were approximately
$197.7 million
after deducting underwriting discounts, commissions and other offering expenses.
Note 10
. Stock-Based Compensation
In connection with the IPO in 2013, Essent Group's Board of Directors adopted, and Essent Group's shareholders approved, the Essent Group Ltd. 2013 Long-Term Incentive Plan (the "2013 Plan"), which was effective upon completion of the initial public offering. The types of awards available under the 2013 Plan include nonvested shares, nonvested share units, non-qualified share options, incentive stock options, share appreciation rights, and other share-based or cash-based awards. Amendments to our 2013 Plan were approved by shareholders and effective as of May 3, 2017. These amendments included a reduction in the maximum number of shares and share units available for issuance to
7.5 million
under the Amended and Restated 2013 Plan (inclusive of approximately
2.6 million
nonvested shares and share units outstanding as of May 3, 2017), down from the approximately
14.7 million
shares and share units originally available for issuance under the 2013 Plan. As of December 31,
2017
, there were
4.9 million
Common Shares available for future grant under the 2013 Plan.
In September 2013 and February 2014, certain members of senior management were granted nonvested Common Shares under the 2013 Plan that were subject to time-based and performance-based vesting. The time-based share awards granted in September 2013 vest in
four
equal installments on January 1, 2015, 2016, 2017 and 2018. The time-based share awards granted in February 2014 vested in
three
equal installments on March 1, 2015, 2016 and 2017. The performance-based share awards vest based upon our compounded annual book value per share growth percentage during a
three
-year performance period that
102
Essent Group Ltd. and Subsidiaries
Notes to Consolidated Financial Statements (Continued)
commenced on January 1, 2014. The September 2013 performance-based share awards vest on the
one
-year anniversary of the completion of the performance period, and the February 2014 performance-based share awards vested on March 1, 2017.
In February 2015, certain members of senior management were granted nonvested Common Shares under the 2013 Plan that were subject to time-based and performance-based vesting. The time-based share awards granted in February 2015 vest in
three
equal installments on March 1, 2016, 2017 and 2018. The performance-based share awards granted in February 2015 vest based upon our compounded annual book value per share growth percentage during a
three
-year performance period that commenced on January 1, 2015 and vest on March 1, 2018.
In May 2015, nonvested Common Shares were granted to an employee in connection with an employment agreement that are subject to time-based and performance-based vesting. The time-based share award vests in
four
equal installments on July 1, 2016, 2017, 2018 and 2019. The performance-based share award vests based upon our compounded annual book value per share growth percentage during a
three
-year performance period that commenced on January 1, 2015 and vests on July 1, 2019.
In February 2016, certain members of senior management were granted nonvested common shares under the 2013 Plan that are subject to time-based and performance-based vesting. The time-based share awards granted in February 2016 vest in
three
equal installments on March 1, 2017, 2018 and 2019. The performance-based share awards granted in February 2016 vest based upon our compounded annual book value per share growth percentage during a
three
-year performance period that commenced on January 1, 2016 and vest on March 1, 2019.
In February 2017, certain members of senior management were granted nonvested common shares under the 2013 Plan that were subject to time-based and performance-based vesting. The time-based share awards granted in February 2017 vest in
three
equal installments on March 1, 2018, 2019 and 2020. The performance-based share awards granted in February 2017 vest based upon our compounded annual book value per share growth percentage during a
three
-year performance period that commenced on January 1, 2017 and vest on March 1, 2020.
The portion of the nonvested performance-based share awards that will be earned based upon the achievement of compounded annual book value per share growth is as follows:
|
2017 Performance-Based Grants
|
2016 Performance-Based Grants
|
2013, 2014 and 2015 Performance-Based Grants
|
||||||||||||||||
|
Performance level
|
Compounded Annual Book Value
Per Share Growth |
Nonvested
Common Shares Earned |
Compounded Annual Book Value
Per Share Growth
|
Nonvested
Common
Shares Earned
|
Compounded Annual Book Value
Per Share Growth
|
Nonvested
Common Shares Earned |
||||||||||||
|
|
<16
|
%
|
0
|
%
|
<13
|
%
|
0
|
%
|
<11
|
%
|
0
|
%
|
||||||
|
Threshold
|
16
|
%
|
25
|
%
|
13
|
%
|
25
|
%
|
11
|
%
|
10
|
%
|
||||||
|
|
17
|
%
|
50
|
%
|
14
|
%
|
50
|
%
|
12
|
%
|
36
|
%
|
||||||
|
|
18
|
%
|
75
|
%
|
15
|
%
|
75
|
%
|
13
|
%
|
61
|
%
|
||||||
|
14
|
%
|
87
|
%
|
|||||||||||||||
|
Maximum
|
≥19
|
%
|
100
|
%
|
≥16
|
%
|
100
|
%
|
≥15
|
%
|
100
|
%
|
||||||
In the event that the compounded annual book value per share growth falls between the performance levels shown above, the nonvested Common Shares earned will be determined on a straight-line basis between the respective levels shown. The compounded annual book value per share growth for each of the 2013, 2014 and 2015 performance-based grants exceeded the maximum performance level and have vested or will vest at
100%
.
In connection with our incentive program covering bonus awards for performance year 2013, in February 2014, time-based share awards and share units were issued to certain employees that vested in
three
equal installments on January 1, 2015, 2016 and 2017. In connection with our incentive program covering bonus awards for performance year 2014, in February 2015, time-based share awards and share units were issued to certain employees that vest in
three
equal installments on March 1, 2016, 2017 and 2018. In connection with our incentive program covering bonus awards for performance year 2015, in February 2016, time-based share awards and share units were issued to certain employees that vest in
three
equal installments on March 1, 2017, 2018 and 2019. In January 2017, time-based share units were issued to all vice president and staff level employees that vest in
three
equal installments in January 2018, 2019 and 2020. In connection with our incentive program
103
Essent Group Ltd. and Subsidiaries
Notes to Consolidated Financial Statements (Continued)
covering bonus awards for performance year 2016, in February 2017, time-based share awards and share units were issued to certain employees that vest in
three
equal installments on March 1, 2018, 2019 and 2020.
In May of each year, 2015 through 2017, time-based share units were granted to non-employee directors that vest
one year
from the date of grant.
The following tables summarize nonvested Common Share and nonvested Common Share unit activity for the year ended December 31:
|
|
2017
|
||||||||||||||||||||
|
|
Time and Performance-
Based Share Awards
|
Time-Based
Share Awards
|
Share Units
|
||||||||||||||||||
|
(Shares in thousands)
|
Number of
Shares
|
Weighted
Average
Grant Date
Fair Value
|
Number of
Shares
|
Weighted
Average
Grant Date
Fair Value
|
Number of
Share Units
|
Weighted
Average
Grant Date
Fair Value
|
|||||||||||||||
|
Outstanding at beginning of year
|
1,503
|
|
$
|
15.41
|
|
605
|
|
$
|
16.32
|
|
493
|
|
$
|
19.24
|
|
||||||
|
Granted
|
140
|
|
36.29
|
|
91
|
|
36.29
|
|
387
|
|
33.40
|
|
|||||||||
|
Vested
|
(48
|
)
|
22.48
|
|
(286
|
)
|
15.74
|
|
(321
|
)
|
19.00
|
|
|||||||||
|
Forfeited
|
—
|
|
N/A
|
|
—
|
|
N/A
|
|
(23
|
)
|
30.49
|
|
|||||||||
|
Outstanding at end of year
|
1,595
|
|
$
|
17.03
|
|
410
|
|
$
|
21.12
|
|
536
|
|
$
|
29.13
|
|
||||||
|
|
2016
|
||||||||||||||||||||
|
|
Time and Performance-
Based Share Awards
|
Time-Based
Share Awards
|
Share Units
|
||||||||||||||||||
|
(Shares in thousands)
|
Number of
Shares
|
Weighted
Average
Grant Date
Fair Value
|
Number of
Shares
|
Weighted
Average
Grant Date
Fair Value
|
Number of
Share Units
|
Weighted
Average
Grant Date
Fair Value
|
|||||||||||||||
|
Outstanding at beginning of year
|
1,294
|
|
$
|
15.15
|
|
890
|
|
$
|
12.31
|
|
544
|
|
$
|
19.84
|
|
||||||
|
Granted
|
209
|
|
17.01
|
|
181
|
|
17.01
|
|
215
|
|
18.21
|
|
|||||||||
|
Vested
|
—
|
|
N/A
|
|
(461
|
)
|
9.04
|
|
(254
|
)
|
19.71
|
|
|||||||||
|
Forfeited
|
—
|
|
N/A
|
|
(5
|
)
|
0.23
|
|
(12
|
)
|
18.12
|
|
|||||||||
|
Outstanding at end of year
|
1,503
|
|
$
|
15.41
|
|
605
|
|
$
|
16.32
|
|
493
|
|
$
|
19.24
|
|
||||||
|
|
2015
|
||||||||||||||||||||
|
|
Time and Performance-
Based Share Awards
|
Time-Based
Share Awards
|
Share Units
|
||||||||||||||||||
|
(Shares in thousands)
|
Number of
Shares
|
Weighted
Average
Grant Date
Fair Value
|
Number of
Shares
|
Weighted
Average
Grant Date
Fair Value
|
Number of
Share Units
|
Weighted
Average
Grant Date
Fair Value
|
|||||||||||||||
|
Outstanding at beginning of year
|
1,290
|
|
$
|
14.83
|
|
1,472
|
|
$
|
9.04
|
|
664
|
|
$
|
18.32
|
|
||||||
|
Granted
|
50
|
|
24.58
|
|
109
|
|
24.51
|
|
129
|
|
24.47
|
|
|||||||||
|
Vested
|
—
|
|
N/A
|
|
(644
|
)
|
6.67
|
|
(239
|
)
|
18.18
|
|
|||||||||
|
Forfeited
|
(46
|
)
|
16.40
|
|
(47
|
)
|
15.50
|
|
(10
|
)
|
17.89
|
|
|||||||||
|
Outstanding at end of year
|
1,294
|
|
$
|
15.15
|
|
890
|
|
$
|
12.31
|
|
544
|
|
$
|
19.84
|
|
||||||
Quoted market prices are used for the valuation of Common Shares granted subsequent to our initial public offering. For nonvested Common Shares granted in September 2013, prior to our IPO, the valuation estimate was based on analysis provided by the underwriters regarding the estimated fair value of Essent and the estimated IPO price range. Factors considered in determining the IPO price range and Common Share valuation included prevailing market conditions, estimates of the
104
Essent Group Ltd. and Subsidiaries
Notes to Consolidated Financial Statements (Continued)
Company's business potential and earnings prospects, the Company's historical operating results, market valuations of companies deemed comparable to the Company and an assessment of risks and opportunities.
The total fair value of nonvested shares or share units that vested was
$22.4 million
,
$15.6 million
and
$22.4 million
for the years ended December 31,
2017
,
2016
and
2015
, respectively. As of
December 31, 2017
, there was
$18.4 million
of total unrecognized compensation expense related to nonvested shares or share units outstanding at
December 31, 2017
and we expect to recognize the expense over a weighted average period of
1.8
years.
In connection with our incentive program covering bonus awards for performance year
2017
, in February
2018
,
90,283
nonvested Common Share units were issued to certain employees and are subject to time-based vesting. In February
2018
,
185,896
nonvested Common Shares were granted to certain members of senior management and are subject to time-based and performance-based vesting.
Employees have the option to tender shares to Essent Group to pay the minimum employee statutory withholding taxes associated with shares upon vesting. Common Shares tendered by employees to pay employee withholding taxes totaled
223,027
,
184,583
and
201,553
in
2017
,
2016
and
2015
, respectively. The tendered shares were recorded at cost and included in treasury stock. All treasury stock has been cancelled as of December 31,
2017
and
2016
.
Compensation expense, net of forfeitures, and related tax effects recognized in connection with nonvested shares were as follows for the years ended December 31:
|
(In thousands)
|
2017
|
2016
|
2015
|
|||||||||
|
Compensation expense
|
$
|
18,688
|
|
$
|
16,881
|
|
$
|
13,633
|
|
|||
|
Income tax benefit
|
6,017
|
|
5,455
|
|
4,378
|
|
||||||
Note 11
.
Dividends Restrictions
Our U.S. insurance subsidiaries are subject to certain capital and dividend rules and regulations as prescribed by jurisdictions in which they are authorized to operate. Under the insurance laws of the Commonwealth of Pennsylvania, Essent Guaranty and Essent PA may pay dividends during any
12
-month period in an amount equal to the greater of (i)
10%
of the preceding year-end statutory policyholders' surplus or (ii) the preceding year's statutory net income. The Pennsylvania statute also specifies that dividends and other distributions can be paid out of positive unassigned surplus without prior approval. At December 31,
2017
, Essent Guaranty had unassigned surplus of approximately
$70.7 million
. Essent Guaranty paid
no
dividends to Essent Group or any intermediate holding companies in the years ended December 31,
2017
,
2016
or
2015
. Essent PA had unassigned surplus of approximately
$6.5 million
as of
December 31, 2017
. In the years ended December 31,
2017
and
2016
, Essent PA paid to its parent company, Essent US Holdings, Inc. ("Essent Holdings") a dividend of
$5 million
and
$3.75 million
, respectively. Essent PA did
no
t pay a dividend in
2015
.
Essent Re is subject to certain dividend restrictions as prescribed by the Bermuda Monetary Authority and under certain agreements with counterparties. In connection with the quota share reinsurance agreement with Essent Guaranty, Essent Re has agreed to maintain a minimum total equity of
$100 million
. As of December 31,
2017
, Essent Re had total equity of
$662.8 million
.
At December 31,
2017
, our insurance subsidiaries were in compliance with these rules, regulations and agreements.
Note 12
. Income Taxes
Through December 31,
2017
, the statutory income tax rates of the countries where the Company does business are
35%
in the United States and
0.0%
in Bermuda. The statutory income tax rate of each country is applied against the taxable income from each country to calculate the income tax expense. On December 22, 2017, the “Tax Cuts and Jobs Act” (“TCJA”) was enacted. The provisions of TCJA include broad tax reforms that are applicable to the Company, including a reduction in the U.S. statutory corporate income tax rate from 35% to 21% effective January 1, 2018. This change in tax rates required us to remeasure our deferred tax assets and liabilities as of the enactment date resulting in a one-time
$85.1 million
income tax benefit for the year ended December 31, 2017.
105
Essent Group Ltd. and Subsidiaries
Notes to Consolidated Financial Statements (Continued)
Income tax expense consists of the following components for the years ended December 31:
|
(In thousands)
|
2017
|
2016
|
2015
|
|||||||||
|
Current
|
$
|
38,252
|
|
$
|
31,712
|
|
$
|
18,910
|
|
|||
|
Deferred
|
65,660
|
|
57,564
|
|
52,157
|
|
||||||
|
Remeasurement of net deferred tax liability for enacted changes in tax law
|
(85,091
|
)
|
—
|
|
—
|
|
||||||
|
Total income tax expense
|
$
|
18,821
|
|
$
|
89,276
|
|
$
|
71,067
|
|
|||
For the year ended December 31,
2017
pre-tax income attributable to Bermuda and U.S. operations was
$86.3 million
and
$312.3 million
, respectively, as compared to
$51.6 million
and
$260.3 million
, respectively, for the year ended December 31,
2016
and
$21.4 million
and
$207.0 million
, respectively, for the year ended December 31,
2015
.
Income tax expense is different from that which would be obtained by applying the applicable statutory income tax rates to income before taxes by jurisdiction (i.e. U.S.
35%
; Bermuda
0.0%
). The reconciliation of the difference between income tax expense and the expected tax provision at the weighted average tax rate was as follows for the years ended December 31:
|
($ in thousands)
|
2017
|
% of pretax
income
|
2016
|
% of pretax
income
|
2015
|
% of pretax
income
|
|||||||||||||||
|
Tax provision at weighted average statutory rates
|
$
|
109,309
|
|
27.4
|
%
|
$
|
91,092
|
|
29.2
|
%
|
$
|
72,461
|
|
31.7
|
%
|
||||||
|
Change in valuation of net deferred tax liability
|
(85,091
|
)
|
(21.3
|
)
|
—
|
|
—
|
|
—
|
|
—
|
|
|||||||||
|
Excess tax benefits from stock-based compensation
|
(3,227
|
)
|
(0.8
|
)
|
—
|
|
—
|
|
—
|
|
—
|
|
|||||||||
|
Tax exempt interest, net of proration
|
(2,608
|
)
|
(0.7
|
)
|
(2,181
|
)
|
(0.7
|
)
|
(1,741
|
)
|
(0.8
|
)
|
|||||||||
|
Non-deductible expenses
|
392
|
|
0.1
|
|
378
|
|
0.1
|
|
381
|
|
0.2
|
|
|||||||||
|
Other
|
46
|
|
0.0
|
|
(13
|
)
|
0.0
|
|
(34
|
)
|
0.0
|
|
|||||||||
|
Total income tax expense
|
$
|
18,821
|
|
4.7
|
%
|
$
|
89,276
|
|
28.6
|
%
|
$
|
71,067
|
|
31.1
|
%
|
||||||
We provide deferred taxes to reflect the estimated future tax effects of the differences between the financial statement and tax bases of assets and liabilities using currently enacted tax laws. The net deferred tax liability was comprised of the following at December 31:
|
(In thousands)
|
2017
|
2016
|
||||||
|
Deferred tax assets
|
$
|
28,696
|
|
$
|
43,291
|
|
||
|
Deferred tax liabilities
|
(156,332
|
)
|
(185,878
|
)
|
||||
|
Net deferred tax liability
|
$
|
(127,636
|
)
|
$
|
(142,587
|
)
|
||
106
Essent Group Ltd. and Subsidiaries
Notes to Consolidated Financial Statements (Continued)
The components of the net deferred tax liability were as follows at December 31:
|
(In thousands)
|
2017
|
2016
|
||||||
|
Contingency reserves
|
$
|
(151,586
|
)
|
$
|
(181,031
|
)
|
||
|
Unearned premium reserve
|
14,454
|
|
19,722
|
|
||||
|
Nonvested shares
|
6,442
|
|
8,445
|
|
||||
|
Deferred policy acquisition costs
|
(3,224
|
)
|
(4,690
|
)
|
||||
|
Unearned ceding commissions
|
2,815
|
|
3,568
|
|
||||
|
Fixed assets
|
2,529
|
|
4,702
|
|
||||
|
Start-up expenditures, net
|
1,951
|
|
3,705
|
|
||||
|
Unrealized (gain) loss on investments
|
(1,403
|
)
|
2,181
|
|
||||
|
Accrued expenses
|
335
|
|
775
|
|
||||
|
Loss reserves
|
158
|
|
170
|
|
||||
|
Prepaid expenses
|
(119
|
)
|
(157
|
)
|
||||
|
Organizational expenditures
|
12
|
|
23
|
|
||||
|
Net deferred tax liability
|
$
|
(127,636
|
)
|
$
|
(142,587
|
)
|
||
As a mortgage guaranty insurer, we are eligible for a tax deduction, subject to certain limitations, under Section 832(e) of the IRC for amounts required by state law or regulation to be set aside in statutory contingency reserves. The deduction is allowed only to the extent that we purchase T&L Bonds in an amount equal to the tax benefit derived from deducting any portion of our statutory contingency reserves. During the years ended December 31,
2017
and
2016
, we had net purchases of T&L Bonds in the amount of
$70.9 million
and
$61.9 million
, respectively, and held
$252.2 million
and
$181.3 million
of T&L Bonds as of December 31,
2017
and
2016
, respectively.
In evaluating our ability to realize the benefit of our deferred tax assets, we consider the relevant impact of all available positive and negative evidence including our past operating results and our forecasts of future taxable income. At December 31,
2017
and
2016
, after weighing all the evidence, management concluded that it was more likely than not that our deferred tax assets would be realized.
Under current Bermuda law, the parent company, Essent Group, and its Bermuda subsidiary, Essent Re, are not required to pay any taxes on income and capital gains. In the event that there is a change such that these taxes are imposed, these companies would be exempted from any such tax until March of 2035 pursuant to the Bermuda Exempt Undertakings Tax Protection Act of 1966, and the Exempt Undertakings Tax Protection Amendment Act of 2011.
Essent Holdings and its subsidiaries are subject to income taxes imposed by U.S. law and file a U.S. Consolidated Income Tax Return. Each subsidiary has executed a tax sharing agreement with its parent company, which provides that taxes are settled in cash between parent and subsidiary on a quarterly basis based on separate company pro-forma calculations. Should Essent Holdings pay a dividend to its parent company, Essent Irish Intermediate Holdings Limited, withholding taxes at a rate of
5%
under the U.S./Ireland tax treaty would likely apply assuming the Company avails itself of Treaty benefits under the U.S./Ireland tax treaty. Absent treaty benefits, the withholding rate on outbound dividends would be
30%
. Currently, however,
no
withholding taxes are accrued with respect to such unremitted earnings as management has no intention of remitting these earnings. Similarly,
no
foreign income taxes have been provided on the un-remitted earnings of the Company's U.S. subsidiaries as management has neither the intention of remitting these earnings, nor would any Ireland tax be due, as any Irish tax would be expected to be fully offset by credit for taxes paid to the U.S. An estimate of the cumulative amount of U.S. earnings that would be subject to withholding tax, if distributed outside of the U.S., is approximately
$846.8 million
. The associated withholding tax liability under the U.S./Ireland tax treaty would be approximately
$42.3 million
.
Essent is not subject to income taxation other than as stated above. There can be no assurance that there will not be changes in applicable laws, regulations, or treaties which might require Essent to change the way it operates or becomes subject to taxation.
107
Essent Group Ltd. and Subsidiaries
Notes to Consolidated Financial Statements (Continued)
At December 31,
2017
and
2016
, the Company had
no
unrecognized tax benefits. As of December 31,
2017
, the U.S. federal income tax returns for the tax years
2014
through
2016
remain subject to examination. The Company has not recorded any uncertain tax positions as of December 31,
2017
or December 31,
2016
.
The Company is a party to an investment advisory agreement with Goldman Sachs Asset Management, L.P., a subsidiary of The Goldman Sachs Group, Inc. ("Goldman Sachs"), one of Essent Group's investors prior to 2017. Through the date of our IPO, Goldman Sachs beneficially owned
11.35%
of our outstanding shares. Subsequent to the IPO and prior to 2017, Goldman Sachs directly held less than
10%
of our outstanding shares. Investment expense incurred under the investment advisory agreement totaled
$0.8 million
and
$0.7 million
for the years ended December 31,
2016
and
2015
, respectively. Goldman Sachs is also one of several lenders under our Credit Facility discussed in
Note 7
and was paid an upfront fee of
$0.1 million
in 2016. Commitment fees and interest expense incurred under the Credit Facility allocable to Goldman Sachs totaled
$0.1 million
in 2016.
Note 14
. Earnings per Share (EPS)
The following table reconciles the net income and the weighted average common shares outstanding used in the computations of basic and diluted earnings per common share for the years ended December 31:
|
(In thousands, except per share amounts)
|
2017
|
2016
|
2015
|
|||||||||
|
Net income
|
$
|
379,747
|
|
$
|
222,606
|
|
$
|
157,331
|
|
|||
|
Less: Common Shares dividends declared
|
—
|
|
—
|
|
—
|
|
||||||
|
Undistributed net income
|
$
|
379,747
|
|
$
|
222,606
|
|
$
|
157,331
|
|
|||
|
Net income allocable to Common
|
$
|
379,747
|
|
$
|
222,606
|
|
$
|
157,331
|
|
|||
|
|
|
|
|
|
|
|||||||
|
Basic earnings per share
|
$
|
4.07
|
|
$
|
2.45
|
|
$
|
1.74
|
|
|||
|
Diluted earnings per share
|
$
|
3.99
|
|
$
|
2.41
|
|
$
|
1.72
|
|
|||
|
Basic weighted average Common Shares outstanding
|
93,330
|
|
90,913
|
|
90,351
|
|
||||||
|
Dilutive effect of nonvested shares
|
1,881
|
|
1,332
|
|
1,387
|
|
||||||
|
Diluted weighted average Common Shares outstanding
|
95,211
|
|
92,245
|
|
91,738
|
|
||||||
There were
44,540
,
96,251
and
78,198
antidilutive shares for the years ended December 31,
2017
,
2016
and
2015
, respectively.
The nonvested performance-based share awards are considered contingently issuable for purposes of the EPS calculation. Based on the compounded annual book value per share growth as of December 31,
2017
,
2016
and
2015
,
100%
of the performance-based share awards would be issuable under the terms of the arrangements at each date if December 31 was the end of the contingency period.
108
Essent Group Ltd. and Subsidiaries
Notes to Consolidated Financial Statements (Continued)
The following table shows the rollforward of accumulated other comprehensive income (loss) for the
year ended December 31
:
|
|
2017
|
|||||||||||
|
(In thousands)
|
Before Tax
|
Tax Effect
|
Net of Tax
|
|||||||||
|
Balance at beginning of year
|
$
|
(14,436
|
)
|
$
|
2,181
|
|
$
|
(12,255
|
)
|
|||
|
Other comprehensive income (loss):
|
|
|
|
|
|
|
||||||
|
Unrealized holding gains (losses) on investments:
|
||||||||||||
|
Unrealized holding gains arising during the period
|
14,602
|
|
(5,239
|
)
|
9,363
|
|
||||||
|
Less: Reclassification adjustment for gains included in net income (1)
|
(2,015
|
)
|
720
|
|
(1,295
|
)
|
||||||
|
Net unrealized gains on investments
|
12,587
|
|
(4,519
|
)
|
8,068
|
|
||||||
|
Other comprehensive income
|
12,587
|
|
(4,519
|
)
|
8,068
|
|
||||||
|
Reclassification of certain income tax effects resulting from tax reform
|
—
|
|
935
|
|
935
|
|
||||||
|
Balance at end of year
|
$
|
(1,849
|
)
|
$
|
(1,403
|
)
|
$
|
(3,252
|
)
|
|||
|
|
2016
|
|||||||||||
|
(In thousands)
|
Before Tax
|
Tax Effect
|
Net of Tax
|
|||||||||
|
Balance at beginning of year
|
$
|
661
|
|
$
|
(760
|
)
|
$
|
(99
|
)
|
|||
|
Other comprehensive income (loss):
|
|
|
|
|
|
|
||||||
|
Unrealized holding gains (losses) on investments:
|
||||||||||||
|
Unrealized holding losses arising during the period
|
(13,156
|
)
|
2,376
|
|
(10,780
|
)
|
||||||
|
Less: Reclassification adjustment for gains included in net income (1)
|
(1,941
|
)
|
565
|
|
(1,376
|
)
|
||||||
|
Net unrealized losses on investments
|
(15,097
|
)
|
2,941
|
|
(12,156
|
)
|
||||||
|
Other comprehensive loss
|
(15,097
|
)
|
2,941
|
|
(12,156
|
)
|
||||||
|
Balance at end of year
|
$
|
(14,436
|
)
|
$
|
2,181
|
|
$
|
(12,255
|
)
|
|||
_______________________________________________________________________________
|
(1)
|
Included in net realized investments gains on our consolidated statements of comprehensive income.
|
Note 16
. Fair Value of Financial Instruments
We carry certain of our financial instruments at fair value. We define fair value as the current amount that would be exchanged to sell an asset or transfer a liability, other than in a forced liquidation.
Fair Value Hierarchy
ASC No. 820 specifies a hierarchy of valuation techniques based on whether the inputs to those valuation techniques are observable or unobservable. Observable inputs reflect market data obtained from independent sources, while unobservable inputs reflect our market assumptions. The level within the fair value hierarchy to measure the financial instrument shall be determined based on the lowest level input that is significant to the fair value measurement. The three levels of the fair value hierarchy are as follows:
|
•
|
Level 1—Quoted prices for identical instruments in active markets accessible at the measurement date.
|
|
•
|
Level 2—Quoted prices for similar instruments in active markets; quoted prices for identical or similar instruments in markets that are not active; and valuations in which all significant inputs are observable in active markets. Inputs are observable for substantially the full term of the financial instrument.
|
|
•
|
Level 3—Valuations derived from one or more significant inputs that are unobservable.
|
109
Essent Group Ltd. and Subsidiaries
Notes to Consolidated Financial Statements (Continued)
Determination of Fair Value
When available, we generally use quoted market prices to determine fair value and classify the financial instrument in Level 1. In cases where quoted market prices for similar financial instruments are available, we utilize these inputs for valuation techniques and classify the financial instrument in Level 2. In cases where quoted market prices are not available, fair values are based on estimates using discounted cash flows, present value or other valuation techniques. Those techniques are significantly affected by the assumptions used, including the discount rates and estimates of future cash flows and we classify the financial instrument in Level 3. Accordingly, the fair value estimates may not be realized in an immediate settlement of the instrument.
We used the following methods and assumptions in estimating fair values of financial instruments:
|
•
|
Investments available for sale—Investments available for sale are valued using quoted market prices in active markets, when available, and those investments are classified as Level 1 of the fair value hierarchy. Level 1 investments available for sale include investments such as U.S. Treasury securities and money market funds. Investments available for sale are classified as Level 2 of the fair value hierarchy if quoted market prices are not available and fair values are estimated using quoted prices of similar securities or recently executed transactions for the securities. U.S. agency securities, U.S. agency mortgage-backed securities, municipal debt securities, corporate debt securities, residential and commercial mortgage securities and asset-backed securities are classified as Level 2 investments.
|
We use independent pricing sources to determine the fair value of securities available for sale in Level 1 and Level 2 of the fair value hierarchy. We use one primary pricing service to provide individual security pricing based on observable market data and receive one quote per security. To ensure securities are appropriately classified in the fair value hierarchy, we review the pricing techniques and methodologies of the independent pricing service and believe that their policies adequately consider market activity, either based on specific transactions for the issue valued or based on modeling of securities with similar credit quality, duration, yield and structure that were recently traded. U.S. agency securities, U.S. agency mortgage-backed securities, municipal and corporate debt securities are valued by our primary vendor using recently executed transactions and proprietary models based on observable inputs, such as interest rate spreads, yield curves and credit risk. Residential and commercial mortgage securities and asset-backed securities are valued by our primary vendor using proprietary models based on observable inputs, such as interest rate spreads, prepayment speeds and credit risk. As part of our evaluation of investment prices provided by our primary pricing service, we obtained and reviewed their pricing methodologies which include a description of how each security type is evaluated and priced. We review the reasonableness of prices received from our primary pricing service by comparison to prices obtained from additional pricing sources. We have not made any adjustments to the prices obtained from our primary pricing service.
|
•
|
Derivative liabilities—Through June 30, 2016, certain of our Freddie Mac ACIS contracts were accounted for as derivatives. In determining an exit market, we considered the fact that there is not a principal market for these contracts. In the absence of a principal market, we valued these ACIS contracts in a hypothetical market where market participants, and potential counterparties, included other mortgage guaranty insurers or reinsurers with similar credit quality to us. We believed that in the absence of a principal market, this hypothetical market provided the most relevant information with respect to fair value estimates. These ACIS contracts were classified as Level 3 of the fair value hierarchy. During the quarter ended September 30, 2016, these contracts were amended and are now accounted for as insurance contracts rather than as derivatives. As of December 31,
2017
and
2016
, the Company had
no
derivative instruments.
|
Through June 30, 2016, we determined the fair value of our derivative instruments primarily using internally-generated models. We utilized market observable inputs, such as the performance of the underlying pool of mortgages, mortgage prepayment speeds and pricing spreads on the reference STACR notes issued by Freddie Mac, whenever they were available. There was a high degree of uncertainty about our fair value estimates since our contracts were not traded or exchanged, which made external validation and corroboration of our estimates difficult. Considerable judgment was required to interpret market data to develop the estimates of fair value. Accordingly, the estimates may not have been indicative of amounts we could have realized in a market exchange or negotiated termination. The use of different market assumptions or estimation methodologies may have had a material effect on the estimated fair value amounts.
110
Essent Group Ltd. and Subsidiaries
Notes to Consolidated Financial Statements (Continued)
Assets and Liabilities Measured at Fair Value
All assets measured at fair value are categorized in the table below based upon the lowest level of significant input to the valuations. All fair value measurements at the reporting date were on a recurring basis.
|
December 31, 2017 (In thousands)
|
Quoted Prices
in Active
Markets for
Identical
Instruments
(Level 1)
|
Significant
Other
Observable
Inputs
(Level 2)
|
Significant
Unobservable
Inputs
(Level 3)
|
Total
|
||||||||||||
|
Recurring fair value measurements
|
|
|
|
|
|
|
|
|
||||||||
|
Financial Assets:
|
|
|
|
|
|
|
|
|
||||||||
|
U.S. Treasury securities
|
$
|
227,805
|
|
$
|
—
|
|
$
|
—
|
|
$
|
227,805
|
|
||||
|
U.S. agency securities
|
—
|
|
33,114
|
|
—
|
|
33,114
|
|
||||||||
|
U.S. agency mortgage-backed securities
|
—
|
|
456,037
|
|
—
|
|
456,037
|
|
||||||||
|
Municipal debt securities
|
—
|
|
465,255
|
|
—
|
|
465,255
|
|
||||||||
|
Corporate debt securities
|
—
|
|
611,728
|
|
—
|
|
611,728
|
|
||||||||
|
Residential and commercial mortgage securities
|
—
|
|
79,407
|
|
—
|
|
79,407
|
|
||||||||
|
Asset-backed securities
|
—
|
|
167,922
|
|
—
|
|
167,922
|
|
||||||||
|
Money market funds
|
263,797
|
|
—
|
|
—
|
|
263,797
|
|
||||||||
|
Total assets at fair value
|
$
|
491,602
|
|
$
|
1,813,463
|
|
$
|
—
|
|
$
|
2,305,065
|
|
||||
|
December 31, 2016 (In thousands)
|
Quoted Prices
in Active
Markets for
Identical
Instruments
(Level 1)
|
Significant
Other
Observable
Inputs
(Level 2)
|
Significant
Unobservable
Inputs
(Level 3)
|
Total
|
||||||||||||
|
Recurring fair value measurements
|
|
|
|
|
|
|
|
|
||||||||
|
Financial Assets:
|
|
|
|
|
|
|
|
|
||||||||
|
U.S. Treasury securities
|
$
|
191,548
|
|
$
|
—
|
|
$
|
—
|
|
$
|
191,548
|
|
||||
|
U.S. agency securities
|
—
|
|
18,441
|
|
—
|
|
18,441
|
|
||||||||
|
U.S. agency mortgage-backed securities
|
—
|
|
316,494
|
|
—
|
|
316,494
|
|
||||||||
|
Municipal debt securities
|
—
|
|
334,324
|
|
—
|
|
334,324
|
|
||||||||
|
Corporate debt securities
|
—
|
|
456,357
|
|
—
|
|
456,357
|
|
||||||||
|
Residential and commercial mortgage securities
|
—
|
|
68,336
|
|
—
|
|
68,336
|
|
||||||||
|
Asset-backed securities
|
—
|
|
127,172
|
|
—
|
|
127,172
|
|
||||||||
|
Money market funds
|
102,430
|
|
—
|
|
—
|
|
102,430
|
|
||||||||
|
Total assets at fair value
|
$
|
293,978
|
|
$
|
1,321,124
|
|
$
|
—
|
|
$
|
1,615,102
|
|
||||
111
Essent Group Ltd. and Subsidiaries
Notes to Consolidated Financial Statements (Continued)
Changes in Level 3 Recurring Fair Value Measurements
The following table presents changes during the years ended
December 31, 2017
and
2016
in Level 3 liabilities measured at fair value on a recurring basis, and the net realized and unrealized losses (gains) related to the Level 3 liabilities in the consolidated balance sheets at
December 31, 2017
and
2016
. During the years ended
December 31, 2017
and
2016
, we had
no
Level 3 assets.
|
Year Ended
December 31, |
|||||||
|
(In thousands)
|
2017
|
2016
|
|||||
|
Level 3 Liabilities
|
|||||||
|
Fair value of derivative liabilities at beginning of period
|
$
|
—
|
|
$
|
1,232
|
|
|
|
Net realized and unrealized losses (gains) included in income
|
—
|
|
(1,934
|
)
|
|||
|
Other comprehensive (income) loss
|
—
|
|
—
|
|
|||
|
Purchases, sales, issues and settlements, net
|
—
|
|
702
|
|
|||
|
Gross transfers in
|
—
|
|
—
|
|
|||
|
Gross transfers out
|
—
|
|
—
|
|
|||
|
Fair value of derivative liabilities at end of period
|
$
|
—
|
|
$
|
—
|
|
|
|
Changes in net unrealized losses (gains) included in income on instruments held at end of period
|
$
|
—
|
|
$
|
(1,934
|
)
|
|
Note 17
. Statutory Accounting
Our U.S. insurance subsidiaries prepare statutory-basis financial statements in accordance with the accounting practices prescribed or permitted by their respective state’s department of insurance, which is a comprehensive basis of accounting other than GAAP. We did not use any prescribed or permitted statutory accounting practices (individually or in the aggregate) that resulted in reported statutory surplus or capital that was significantly different from the statutory surplus or capital that would have been reported had National Association of Insurance Commissioners’ statutory accounting practices been followed. The following table presents Essent Guaranty’s and Essent PA’s statutory net income, statutory surplus and contingency reserve liability as of and for the years ended December 31:
|
(In thousands)
|
2017
|
2016
|
2015
|
|||||||||
|
Essent Guaranty
|
|
|
|
|
||||||||
|
Statutory net income
|
$
|
261,811
|
|
$
|
215,951
|
|
$
|
172,688
|
|
|||
|
Statutory surplus
|
761,006
|
|
578,887
|
|
522,172
|
|
||||||
|
Contingency reserve liability
|
678,701
|
|
480,829
|
|
315,058
|
|
||||||
|
Essent PA
|
|
|
|
|
||||||||
|
Statutory net income
|
$
|
10,250
|
|
$
|
12,978
|
|
$
|
15,200
|
|
|||
|
Statutory surplus
|
45,509
|
|
47,387
|
|
47,139
|
|
||||||
|
Contingency reserve liability
|
43,141
|
|
36,401
|
|
27,502
|
|
||||||
Net income determined in accordance with statutory accounting practices differs from GAAP. In
2017
and
2016
, the more significant differences between net income determined under statutory accounting practices and GAAP for Essent Guaranty and Essent PA relate to policy acquisition costs and income taxes. Under statutory accounting practices, policy acquisition costs are expensed as incurred while such costs are capitalized and amortized to expense over the life of the policy under GAAP. As discussed in
Note 12
, we are eligible for a tax deduction, subject to certain limitations for amounts required by state law or regulation to be set aside in statutory contingency reserves when we purchase T&L Bonds. Under statutory accounting practices, this deduction reduces the tax provision recorded by Essent Guaranty and Essent PA and, as a result, increases statutory net income and surplus as compared to net income and equity determined in accordance with GAAP.
112
Essent Group Ltd. and Subsidiaries
Notes to Consolidated Financial Statements (Continued)
At
December 31, 2017
and
2016
, the statutory capital of our U.S. insurance subsidiaries, which is defined as the total of statutory surplus and contingency reserves, was in excess of the statutory capital necessary to satisfy their regulatory requirements.
Effective December 31, 2015, Fannie Mae and Freddie Mac, at the direction of the Federal Housing Finance Agency, implemented new coordinated Private Mortgage Insurer Eligibility Requirements, which we refer to as the "PMIERs." The PMIERs represent the standards by which private mortgage insurers are eligible to provide mortgage insurance on loans owned or guaranteed by Fannie Mae and Freddie Mac. The PMIERs include financial strength requirements incorporating a risk-based framework that require approved insurers to have a sufficient level of liquid assets from which to pay claims. The PMIERs also include enhanced operational performance expectations and define remedial actions that apply should an approved insurer fail to comply with these requirements. As of
December 31, 2017
, Essent Guaranty, our GSE-approved mortgage insurance company, was in compliance with the PMIERs.
Statement of Statutory Accounting Principles No.
58
,
Mortgage Guaranty Insurance,
requires mortgage insurers to establish a special contingency reserve for statutory accounting purposes included in total liabilities equal to
50%
of earned premium for that year. During
2017
, Essent Guaranty increased its contingency reserve by
$197.9 million
and Essent PA increased its contingency reserve by
$6.7 million
. This reserve is required to be maintained for a period of
120 months
to protect against the effects of adverse economic cycles. After
120 months
, the reserve is released to unassigned funds. In the event an insurer’s loss ratio in any calendar year exceeds
35%
, however, the insurer may, after regulatory approval, release from its contingency reserves an amount equal to the excess portion of such losses. Essent Guaranty and Essent PA did not release any amounts from their contingency reserves in
2017
,
2016
or
2015
.
Under The Insurance Act 1978, as amended, and related regulations of Bermuda (the "Insurance Act"), Essent Re is required to annually prepare statutory financial statements and a statutory financial return in accordance with the financial reporting provisions of the Insurance Act, which is a basis other than GAAP. The Insurance Act also requires that Essent Re maintain minimum share capital of
$1 million
and must ensure that the value of its general business assets exceeds the amount of its general business liabilities by an amount greater than the prescribed minimum solvency margins and enhanced capital requirement pertaining to its general business. At
December 31, 2017
and
2016
, all such requirements were met.
Essent Re's statutory capital and surplus was
$662.6 million
and
$401.1 million
as of
December 31, 2017
and
2016
, respectively, and statutory net income was
$96.9 million
and
$56.7 million
, respectively. Statutory capital and surplus and net income determined in accordance with statutory accounting practices were not significantly different than the amounts determined under GAAP.
Essent Guaranty has a capital maintenance agreement with Essent PA under which Essent Guaranty agreed to contribute funds, under specified conditions, to maintain Essent PA's risk-to-capital ratio at or below
25.0
to 1 in return for a surplus note. As of
December 31, 2017
, Essent PA's risk-to-capital ratio was
5.4
:1 and there were
no
amounts outstanding related to this agreement.
113
Essent Group Ltd. and Subsidiaries
Notes to Consolidated Financial Statements (Continued)
The following table summarizes the unaudited results of operations for each quarter of
2017
and
2016
. We have prepared the consolidated quarterly information on a basis consistent with the audited consolidated financial statements. In the opinion of management, the financial information reflects all adjustments (which include normal recurring adjustments) required for a fair presentation of the financial information for the quarters presented. This information should be read in conjunction with our audited financial statements and the related notes. The results of interim periods are not necessarily indicative of the results for the full year.
|
|
2017
|
|||||||||||||||
|
(In thousands, except per share amounts)
|
December 31
|
September 30
|
June 30
|
March 31
|
||||||||||||
|
Net premiums earned
|
$
|
147,976
|
|
$
|
137,940
|
|
$
|
126,563
|
|
$
|
117,651
|
|
||||
|
Other revenues
|
13,134
|
|
12,263
|
|
11,043
|
|
9,941
|
|
||||||||
|
Provision for losses and LAE
|
17,456
|
|
4,313
|
|
1,770
|
|
3,693
|
|
||||||||
|
Other underwriting and operating expenses
|
36,480
|
|
37,035
|
|
35,686
|
|
36,332
|
|
||||||||
|
Interest expense
|
1,817
|
|
1,456
|
|
1,189
|
|
716
|
|
||||||||
|
Income before income taxes
|
105,357
|
|
107,399
|
|
98,961
|
|
86,851
|
|
||||||||
|
Net income
|
162,638
|
|
78,393
|
|
72,118
|
|
66,598
|
|
||||||||
|
Basic earnings per Common Share
|
$
|
1.69
|
|
$
|
0.83
|
|
$
|
0.79
|
|
$
|
0.73
|
|
||||
|
Diluted earnings per Common Share
|
$
|
1.65
|
|
$
|
0.82
|
|
$
|
0.77
|
|
$
|
0.72
|
|
||||
|
Basic weighted average Common Shares outstanding
|
96,429
|
|
94,185
|
|
91,381
|
|
91,258
|
|
||||||||
|
Diluted weighted average Common Shares outstanding
|
98,497
|
|
96,094
|
|
93,162
|
|
93,023
|
|
||||||||
|
|
2016
|
|||||||||||||||
|
(In thousands, except per share amounts)
|
December 31
|
September 30
|
June 30
|
March 31
|
||||||||||||
|
Net premiums earned
|
$
|
116,792
|
|
$
|
110,801
|
|
$
|
100,711
|
|
$
|
94,403
|
|
||||
|
Other revenues
|
9,581
|
|
10,453
|
|
7,454
|
|
8,063
|
|
||||||||
|
Provision for losses and LAE
|
3,865
|
|
4,965
|
|
2,964
|
|
3,731
|
|
||||||||
|
Other underwriting and operating expenses
|
34,836
|
|
32,792
|
|
31,409
|
|
31,388
|
|
||||||||
|
Interest expense
|
370
|
|
56
|
|
—
|
|
—
|
|
||||||||
|
Income before income taxes
|
87,302
|
|
83,441
|
|
73,792
|
|
67,347
|
|
||||||||
|
Net income
|
62,686
|
|
59,711
|
|
52,258
|
|
47,951
|
|
||||||||
|
Basic earnings per Common Share
|
$
|
0.69
|
|
$
|
0.66
|
|
$
|
0.57
|
|
$
|
0.53
|
|
||||
|
Diluted earnings per Common Share
|
$
|
0.68
|
|
$
|
0.65
|
|
$
|
0.57
|
|
$
|
0.52
|
|
||||
|
Basic weighted average Common Shares outstanding
|
90,991
|
|
90,961
|
|
90,912
|
|
90,785
|
|
||||||||
|
Diluted weighted average Common Shares outstanding
|
92,577
|
|
92,399
|
|
92,138
|
|
91,859
|
|
||||||||
114
Essent Group Ltd. and Subsidiaries
Schedule I—Summary of Investments—Other Than Investments in Related Parties
December 31,
2017
|
Type of Investment
(In thousands)
|
Amortized
Cost
|
Fair
Value
|
Amount at which
shown in the
Balance Sheet
|
|||||||||
|
Fixed maturities:
|
|
|
|
|
|
|
||||||
|
Bonds:
|
|
|
|
|
|
|
||||||
|
United States Government and government agencies and authorities
|
$
|
679,654
|
|
$
|
668,059
|
|
$
|
668,059
|
|
|||
|
States, municipalities and political subdivisions
|
457,418
|
|
465,255
|
|
465,255
|
|
||||||
|
Residential and commercial mortgage securities
|
78,974
|
|
79,407
|
|
79,407
|
|
||||||
|
Asset-backed securities
|
167,638
|
|
167,922
|
|
167,922
|
|
||||||
|
All other corporate bonds
|
610,516
|
|
611,728
|
|
611,728
|
|
||||||
|
Total fixed maturities
|
1,994,200
|
|
1,992,371
|
|
1,992,371
|
|
||||||
|
Short-term investments
|
312,714
|
|
312,694
|
|
312,694
|
|
||||||
|
Total investments
|
$
|
2,306,914
|
|
$
|
2,305,065
|
|
$
|
2,305,065
|
|
|||
115
Essent Group Ltd. and Subsidiaries
Schedule II—Condensed Financial Information of Registrant
Balance Sheets
Parent Company Only
|
|
December 31,
|
|||||||
|
(In thousands)
|
2017
|
2016
|
||||||
|
Assets
|
|
|
|
|
||||
|
Investments
|
||||||||
|
Fixed maturities (amortized cost: 2017 — $0; 2016 — $10,002)
|
$
|
—
|
|
$
|
10,004
|
|
||
|
Short-term investments (amortized cost: 2017 — $97,926; 2016 — $32,039)
|
97,917
|
|
32,036
|
|
||||
|
Total investments
|
97,917
|
|
42,040
|
|
||||
|
Cash
|
6,250
|
|
4,521
|
|
||||
|
Due from affiliates
|
987
|
|
1,750
|
|
||||
|
Investment in consolidated subsidiaries
|
1,956,955
|
|
1,393,720
|
|
||||
|
Other assets
|
2,662
|
|
2,452
|
|
||||
|
Total Assets
|
$
|
2,064,771
|
|
$
|
1,444,483
|
|
||
|
Liabilities and stockholders' equity
|
|
|
|
|
||||
|
Liabilities
|
|
|
|
|
||||
|
Credit facility borrowings (at carrying value, less unamortized deferred costs of $1,409 in 2017 and $0 in 2016)
|
$
|
123,591
|
|
$
|
100,000
|
|
||
|
Other accrued liabilities
|
744
|
|
710
|
|
||||
|
Total liabilities
|
124,335
|
|
100,710
|
|
||||
|
Commitments and contingencies
|
|
|
|
|
||||
|
Stockholders' Equity
|
|
|
|
|
||||
|
Common shares
|
1,476
|
|
1,397
|
|
||||
|
Additional paid-in capital
|
1,127,137
|
|
918,296
|
|
||||
|
Accumulated other comprehensive loss
|
(3,252
|
)
|
(12,255
|
)
|
||||
|
Retained earnings
|
815,075
|
|
436,335
|
|
||||
|
Total stockholders' equity
|
1,940,436
|
|
1,343,773
|
|
||||
|
Total liabilities and stockholders' equity
|
$
|
2,064,771
|
|
$
|
1,444,483
|
|
||
See accompanying supplementary notes to Parent Company condensed
financial information and the consolidated financial statements and notes thereto.
116
Essent Group Ltd. and Subsidiaries
Schedule II—Condensed Financial Information of Registrant
Condensed Statements of Comprehensive Income
Parent Company Only
|
|
Year Ended December 31,
|
|||||||||||
|
(In thousands)
|
2017
|
|
2016
|
|
2015
|
|||||||
|
Revenues:
|
|
|
|
|
|
|
||||||
|
Net investment income
|
$
|
494
|
|
$
|
284
|
|
$
|
421
|
|
|||
|
Realized investment (losses) gains, net
|
(2
|
)
|
111
|
|
(181
|
)
|
||||||
|
Administrative service fees from subsidiaries
|
489
|
|
473
|
|
437
|
|
||||||
|
Total revenues
|
981
|
|
868
|
|
677
|
|
||||||
|
Expenses:
|
|
|
|
|
|
|
||||||
|
Administrative service fees to subsidiaries
|
2,127
|
|
1,760
|
|
1,762
|
|
||||||
|
Other operating expenses
|
4,968
|
|
4,832
|
|
3,554
|
|
||||||
|
Interest expense
|
4,371
|
|
426
|
|
—
|
|
||||||
|
Total expenses
|
11,466
|
|
7,018
|
|
5,316
|
|
||||||
|
Loss before income taxes and equity in undistributed net income in subsidiaries
|
(10,485
|
)
|
(6,150
|
)
|
(4,639
|
)
|
||||||
|
Loss before equity in undistributed net income of subsidiaries
|
(10,485
|
)
|
(6,150
|
)
|
(4,639
|
)
|
||||||
|
Equity in undistributed net income of subsidiaries
|
390,232
|
|
228,756
|
|
161,970
|
|
||||||
|
Net income
|
$
|
379,747
|
|
$
|
222,606
|
|
$
|
157,331
|
|
|||
|
Other comprehensive income (loss):
|
|
|
|
|
|
|
||||||
|
Change in unrealized appreciation (depreciation) of investments, net of tax expense (benefit) of $4,519 in 2017, ($2,941) in 2016 and ($1,285) in 2015
|
8,068
|
|
(12,156
|
)
|
(4,766
|
)
|
||||||
|
Total other comprehensive income (loss)
|
8,068
|
|
(12,156
|
)
|
(4,766
|
)
|
||||||
|
Comprehensive income
|
$
|
387,815
|
|
$
|
210,450
|
|
$
|
152,565
|
|
|||
See accompanying supplementary notes to Parent Company condensed
financial information and the consolidated financial statements and notes thereto.
117
Essent Group Ltd. and Subsidiaries
Schedule II—Condensed Financial Information of Registrant
Condensed Statements of Cash Flows
Parent Company Only
|
|
Year Ended December 31,
|
|||||||||||
|
(In thousands)
|
2017
|
2016
|
2015
|
|||||||||
|
Operating Activities
|
|
|
|
|
|
|
||||||
|
Net income
|
$
|
379,747
|
|
$
|
222,606
|
|
$
|
157,331
|
|
|||
|
Adjustments to reconcile net income to net cash provided by operating activities:
|
|
|
|
|
|
|
||||||
|
Equity in net income of subsidiaries
|
(390,232
|
)
|
(228,756
|
)
|
(161,970
|
)
|
||||||
|
Loss (gain) on the sale of investments, net
|
2
|
|
(111
|
)
|
181
|
|
||||||
|
Stock-based compensation expense
|
807
|
|
880
|
|
880
|
|
||||||
|
Amortization of premium on investment securities
|
—
|
|
169
|
|
399
|
|
||||||
|
Changes in assets and liabilities:
|
|
|
|
|
|
|
||||||
|
Other assets
|
1,421
|
|
121
|
|
(40
|
)
|
||||||
|
Other accrued liabilities
|
18,236
|
|
17,433
|
|
15,153
|
|
||||||
|
Net cash provided by operating activities
|
9,981
|
|
12,342
|
|
11,934
|
|
||||||
|
Investing Activities
|
|
|
|
|
|
|
||||||
|
Net change in short-term investments
|
(65,887
|
)
|
(6,525
|
)
|
91,119
|
|
||||||
|
Investments in subsidiaries
|
(164,927
|
)
|
(130,101
|
)
|
(61,328
|
)
|
||||||
|
Purchase of investments available for sale
|
—
|
|
—
|
|
(130,461
|
)
|
||||||
|
Proceeds from maturity of investments available for sale
|
10,000
|
|
10,000
|
|
—
|
|
||||||
|
Proceeds from sales of investments available for sale
|
—
|
|
16,582
|
|
94,429
|
|
||||||
|
Net cash used in investing activities
|
(220,814
|
)
|
(110,044
|
)
|
(6,241
|
)
|
||||||
|
Financing Activities
|
|
|
|
|
|
|
||||||
|
Issuance of common shares, net of costs
|
197,829
|
|
—
|
|
(537
|
)
|
||||||
|
Credit facility borrowings
|
75,000
|
|
100,000
|
|
—
|
|
||||||
|
Credit facility repayments
|
(50,000
|
)
|
—
|
|
—
|
|
||||||
|
Treasury stock acquired
|
(7,577
|
)
|
(4,024
|
)
|
(5,168
|
)
|
||||||
|
Payment of issuance costs for credit facility
|
(2,690
|
)
|
(2,436
|
)
|
—
|
|
||||||
|
Other financing activities
|
—
|
|
142
|
|
53
|
|
||||||
|
Net cash provided by (used in) financing activities
|
212,562
|
|
93,682
|
|
(5,652
|
)
|
||||||
|
Net increase (decrease) in cash
|
1,729
|
|
(4,020
|
)
|
41
|
|
||||||
|
Cash at beginning of year
|
4,521
|
|
8,541
|
|
8,500
|
|
||||||
|
Cash at end of year
|
$
|
6,250
|
|
$
|
4,521
|
|
$
|
8,541
|
|
|||
|
Supplemental Disclosure of Cash Flow Information
|
|
|
|
|
|
|
||||||
|
Interest payments
|
$
|
(4,045
|
)
|
$
|
(324
|
)
|
$
|
—
|
|
|||
|
Noncash Transactions
|
||||||||||||
|
Repayment of borrowings with term loan proceeds (see Note C)
|
$
|
(125,000
|
)
|
$
|
—
|
|
$
|
—
|
|
|||
See accompanying supplementary notes to Parent Company condensed
financial information and the consolidated financial statements and notes thereto.
118
Essent Group Ltd. and Subsidiaries
Schedule II—Condensed Financial Information of Registrant
Parent Company Only
Supplementary Notes
Note A
The accompanying Parent Company financial statements should be read in conjunction with the consolidated financial statements and notes to consolidated financial statements. These financial statements have been prepared on the same basis and using the same accounting policies as described in the consolidated financial statements included herein, except that the Parent Company uses the equity-method of accounting for its majority-owned subsidiaries.
Note B
Under the insurance laws of the Commonwealth of Pennsylvania, the insurance subsidiaries may pay dividends during any
12
-month period in an amount equal to the greater of (i)
10%
of the preceding year-end statutory policyholders' surplus or (ii) the preceding year's statutory net income. The Pennsylvania statute also requires that dividends and other distributions be paid out of positive unassigned surplus without prior approval. As of December 31,
2017
, Essent Guaranty had unassigned surplus of approximately
$70.7 million
. Essent PA had unassigned surplus of approximately
$6.5 million
as of
December 31, 2017
.
During the three years ending
December 31, 2017
, the Parent Company did
no
t receive any dividends from its subsidiaries.
Note C
As more fully discussed in
Note 7
of our consolidated financial statements, during 2017, the Parent Company and its subsidiaries entered into an amended and restated
four
-year, secured credit facility with a committed capacity of
$375 million
(the “Credit Facility”). The Credit Facility amends and restates the
three
-year, secured revolving credit facility entered into on April 19, 2016, and provides for (i) an increase in the revolving credit facility from
$200 million
to
$250 million
, (ii) the issuance of term loans of
$125 million
, the proceeds of which were used at closing to pay down borrowings outstanding under the revolving credit facility, and (iii) a
$75 million
uncommitted line that may be exercised at the Borrowers’ option so long as the Borrowers receive commitments from the lenders. At
December 31, 2017
, the Parent Company's borrowings under the Credit Facility contractually mature in 2021.
119
None.
Disclosure Controls and Procedures
Our management carried out an evaluation, under the supervision and with the participation of our chief executive officer and chief financial officer, of the effectiveness of our disclosure controls and procedures (as such term is defined in Rules 13a-15(e) and 15d-15(e) under the Exchange Act) as of the end of the period covered by this Annual Report. Based on this evaluation, our chief executive officer and chief financial officer concluded that our disclosure controls and procedures were effective as of
December 31, 2017
, the end of the period covered by this Annual Report.
Management's Report on Internal Control Over Financial Reporting
Management is responsible for establishing and maintaining adequate internal control over financial reporting as defined in Rules 13a-15(f) and 15d-15(f) under the Exchange Act. The Company's internal control over financial reporting is a process designed to provide reasonable assurance regarding the reliability of financial reporting and the preparation of financial statements for external purposes in accordance with generally accepted accounting principles.
Because of its inherent limitations, internal control over financial reporting may not prevent or detect misstatements. Also, projections of any evaluation of effectiveness to future periods are subject to the risk that controls may become inadequate because of changes in conditions, or that the degree of compliance with policies or procedures may deteriorate.
Management, including our chief executive officer and chief financial officer, assessed the effectiveness of internal control over financial reporting as of
December 31, 2017
. Management based this assessment on criteria for effective internal control over financial reporting described in "Internal Control—Integrated Framework (2013)" issued by the Committee of Sponsoring Organizations of the Treadway Commission. Based on this assessment, management determined that, as of
December 31, 2017
, the Company maintained effective internal control over financial reporting to provide reasonable assurance regarding the reliability of financial reporting and the preparation of financial statements for external purposes in accordance with generally accepted accounting principles.
The effectiveness of the Company's internal control over financial reporting as of
December 31, 2017
has been audited by PricewaterhouseCoopers LLP, an independent registered public accounting firm, as stated in their report, which is included in this Annual Report on Form 10-K.
Changes in Internal Control Over Financial Reporting
During our most recent fiscal quarter, there has not been any change in our internal control over financial reporting (as such term is defined in Rules 13a-15(f) and 15d-15(f) under the Exchange Act) that has materially affected, or is reasonably likely to materially affect, our internal control over financial reporting.
Not applicable.
120
Incorporated herein by reference to our definitive proxy statement to be filed with respect to our
2018
Annual General Meeting of Shareholders.
Incorporated herein by reference to our definitive proxy statement to be filed with respect to our
2018
Annual General Meeting of Shareholders.
|
ITEM 12.
|
SECURITY OWNERSHIP OF CERTAIN BENEFICIAL OWNERS AND MANAGEMENT AND RELATED STOCKHOLDER MATTERS
|
Incorporated herein by reference to our definitive proxy statement to be filed with respect to our
2018
Annual General Meeting of Shareholders.
|
ITEM 13.
|
CERTAIN RELATIONSHIPS AND RELATED TRANSACTIONS, AND DIRECTOR INDEPENDENCE
|
Incorporated herein by reference to our definitive proxy statement to be filed with respect to our
2018
Annual General Meeting of Shareholders.
Incorporated herein by reference to our definitive proxy statement to be filed with respect to our
2018
Annual General Meeting of Shareholders.
121
|
(a)
|
The following documents are filed as part of this Annual Report:
|
|
1.
|
Financial Statements. See the "Index to Financial Statements—Consolidated Financial Statements" included in Item 8 of Part II of this Annual Report for a list of the financial statements filed as a part of this Annual Report.
|
|
2.
|
Financial Statements Schedules. See the "Index to Financial Statements—Financial Statement Schedules" included in Item 8 of Part II of this Annual Report for a list of the financial statements filed as a part of this Annual Report.
|
|
3.
|
Exhibits.
|
|
Exhibit No.
|
Description
|
|
|
Memorandum of Association (incorporated herein by reference to Exhibit 3.1 of the Registration Statement on Form S-1 (File No. 333-191193) filed on September 16, 2013)
|
||
|
Certificate of Deposit of Memorandum of Increase of Share Capital, dated as of February 18, 2009 (incorporated herein by reference to Exhibit 3.2 of the Registration Statement on Form S-1 (File No. 333-191193) filed on September 16, 2013)
|
||
|
Certificate of Deposit of Memorandum of Increase of Share Capital, dated as of October 3, 2013 (incorporated herein by reference to Exhibit 3.2.1 of Amendment No.3 to the Registration Statement on Form S-1 (File No. 333-191193) filed on October 21, 2013)
|
||
|
Amended and Restated Bye-laws (incorporated herein by reference to Exhibit 3.3 of the Form 10-K (File No. 001-36157) filed on March 10, 2014)
|
||
|
Form of Common Share Certificate (incorporated herein by reference to Exhibit 4.1 of Amendment No.3 to the Registration Statement on Form S-1 (File No. 333-191193) filed on October 21, 2013)
|
||
|
Third Amended and Restated Registration Rights Agreement, dated as of November 11, 2014, among Essent Group Ltd. and the shareholders party thereto (incorporated herein by reference to Exhibit 4.1 of the Form 10-Q (File No. 001-36157) filed on November 14, 2014)
|
||
|
Asset Purchase Agreement, dated as of October 7, 2009, between Essent Guaranty, Inc. and Triad Guaranty Insurance Corporation (incorporated herein by reference to Exhibit 10.4 of the Registration Statement on Form S-1 (File No. 333-191193) filed on September 16, 2013)
|
||
|
†
|
Leadership Bonus Program (incorporated herein by reference to Exhibit 10.8 of the Annual Report on Form 10-K (File No. 001-36157) filed on February 29, 2016)
|
|
|
†
|
2013 Long-Term Incentive Plan (incorporated herein by reference to Appendix B to the Company's Definitive Proxy Statement on Schedule 14A (File No. 333-191193) filed on April 3, 2017)
|
|
|
†
|
Form of Time-Based Restricted Share Agreement (incorporated herein by reference to Exhibit 10.11 of Amendment No.1 to the Registration Statement on Form S-1 (File No. 333-191193) filed on September 26, 2013)
|
|
|
†
|
Form of Performance-Based Restricted Share Agreement (incorporated herein by reference to Exhibit 10.11 of the Annual Report on Form 10-K (File No. 001-36157) filed on February 27, 2015)
|
|
|
†
|
Annual Incentive Plan (incorporated herein by reference to Exhibit 10.13 of Amendment No.1 to the Registration Statement on Form S-1 (File No. 333-191193) filed on September 26, 2013)
|
|
|
†
|
Employment Agreement, dated as of September 25, 2013, by and between Essent US Holdings, Inc. and Mark Casale (incorporated herein by reference to Exhibit 10.14 of Amendment No.2 to the Registration Statement on Form S-1 (File No. 333-191193) filed on October 4, 2013)
|
|
|
†
|
Employment Agreement, dated as of September 26, 2013, by and between Essent US Holdings, Inc. and Vijay Bhasin (incorporated herein by reference to Exhibit 10.16 of Amendment No.2 to the Registration Statement on Form S-1 (File No. 333-191193) filed on October 4, 2013)
|
|
|
†
|
Employment Agreement, dated as of September 26, 2013, by and between Essent US Holdings, Inc. and Lawrence E. McAlee (incorporated herein by reference to Exhibit 10.16 of the Annual Report on Form 10-K (File No. 001-36157) filed on February 27, 2015)
|
|
|
†
|
Employment Agreement, dated as of September 26, 2013, by and between Essent US Holdings, Inc. and Mary Lourdes Gibbons (incorporated herein by reference to Exhibit 10.17 of the Annual Report on Form 10-K (File No. 001-36157) filed on February 27, 2015)
|
|
|
†
|
Employment Agreement, dated as of March 13, 2015, by and between Essent Reinsurance Ltd. and Joseph Hissong (incorporated herein by reference to Exhibit 10.18 of the Annual Report on Form 10-K (File No. 001-36157) filed on February 29, 2016)
|
|
122
|
†
|
Employment Agreement, dated as of September 26, 2013, by and between Essent Guaranty, Inc. and Jeff Cashmer (incorporated herein by reference to Exhibit 10.19 of the Annual Report on Form 10-K (File No. 001-36157) filed on February 16, 2017)
|
|
|
†
|
Form of Director and Officer Indemnification Agreement (incorporated herein by reference to Exhibit 10.17 of the Registration Statement on Form S-1 (File No. 333-191193) filed on September 16, 2013)
|
|
|
†
|
Section 409A Specified Employee Policy (incorporated herein by reference to Exhibit 10.18 of Amendment No.2 to the Registration Statement on Form S-1 (File No. 333-191193) filed on October 4, 2013)
|
|
|
Amended and Restated Credit Agreement, dated as of May 17, 2017, by and among Essent Group Ltd., Essent Irish Intermediate Holdings Limited, and Essent US Holdings, Inc., as borrowers, the several banks and other financial institutions or entities from time to time parties to this agreement, as lenders, and JPMorgan Chase Bank, N.A., as administrative agent (incorporated herein by reference to Exhibit 1.1 of the Current Report on Form 8-K (File No. 001-36157) filed on May 18, 2017)
|
||
|
|
List of Subsidiaries (filed herewith)
|
|
|
|
Consent of PricewaterhouseCoopers LLP (filed herewith)
|
|
|
|
Certification of Chief Executive Officer required by Rule 13a-14(a) or Rule 15d-14(a) of the Securities Exchange Act of 1934, as adopted pursuant to Section 302 of the Sarbanes-Oxley Act of 2002 (filed herewith)
|
|
|
|
Certification of Chief Financial Officer required by Rule 13a-14(a) or Rule 15d-14(a) of the Securities Exchange Act of 1934, as adopted pursuant to Section 302 of the Sarbanes-Oxley Act of 2002 (filed herewith)
|
|
|
|
Certification of Chief Executive Officer and Chief Financial Officer pursuant to 18 U.S.C. 1350, as adopted pursuant to Section 906 of the Sarbanes-Oxley Act of 2002 (filed herewith)
|
|
|
101
|
*
|
The following financial information from this Annual Report on Form 10-K for the year ended December 31, 2017, formatted in XBRL (Extensible Business Reporting Language) and filed electronically herewith: (i) the Consolidated Balance Sheets as of December 31, 2017 and December 31, 2016; (ii) the Consolidated Statements of Comprehensive Income for the years ended December 31, 2017, 2016 and 2015; (iii) the Consolidated Statements of Changes in Stockholders' Equity for the years ended December 31, 2017, 2016 and 2015; (iv) the Consolidated Statements of Cash Flows for the years ended December 31, 2017, 2016 and 2015; and (v) the Notes to Consolidated Financial Statements, tagged as blocks of text.
|
|
†
|
Management contract or compensatory plan or arrangement.
|
|
|
*
|
Pursuant to applicable securities laws and regulations, this interactive data file is deemed not filed or part of a registration statement or prospectus for purposes of Sections 11 or 12 of the Securities Act of 1933, as amended, is deemed not filed for purposes of Section 18 of the Securities Exchange Act of 1934, as amended, and otherwise is not subject to liability under those sections.
|
|
123
SIGNATURES
Under the requirements of Section 13 or 15(d) of the Securities Exchange Act of 1934, this report was signed on behalf of the Registrant by the authorized person named below in Radnor, Pennsylvania on the
20th
day of February, 2018
.
|
|
|
ESSENT GROUP LTD.
|
||||
|
|
|
By:
|
|
/s/ MARK A. CASALE
|
||
|
|
|
|
|
Name:
|
|
Mark A. Casale
|
|
|
|
|
|
Title:
|
|
Chairman of the Board of Directors, Chief Executive Officer and President
|
________________________________________________________________________________________________________________________
Under the requirements of the Securities Exchange Act of 1934, this report was signed by the following persons on behalf of the Registrant and in the capacities and on the date indicated.
|
Signature
|
|
Title
|
|
Date
|
|
|
|
|
|
|
|
/s/ MARK A. CASALE
|
|
Chairman of the Board of Directors,
Chief Executive Officer and President
|
|
February 20, 2018
|
|
Mark A. Casale
|
|
|
||
|
/s/ LAWRENCE E. MCALEE
|
|
Senior Vice President, Chief Financial Officer
|
|
February 20, 2018
|
|
Lawrence E. McAlee
|
|
|
||
|
/s/ DAVID B. WEINSTOCK
|
Vice President, Chief Accounting Officer
|
February 20, 2018
|
||
|
David B. Weinstock
|
|
|
||
|
/s/ ADITYA DUTT
|
Director
|
February 20, 2018
|
||
|
Aditya Dutt
|
|
|
||
|
/s/ ROBERT GLANVILLE
|
Director
|
February 20, 2018
|
||
|
Robert Glanville
|
|
|
||
|
/s/ ROY J. KASMAR
|
Director
|
February 20, 2018
|
||
|
Roy J. Kasmar
|
|
|
||
|
/s/ ALLAN LEVINE
|
Director
|
February 20, 2018
|
||
|
Allan Levine
|
|
|
||
124
|
Signature
|
|
Title
|
|
Date
|
|
|
|
|
|
|
|
/s/ DOUGLAS J. PAULS
|
Director
|
February 20, 2018
|
||
|
Douglas J. Pauls
|
|
|
||
|
/s/ WILLIAM SPIEGEL
|
Director
|
February 20, 2018
|
||
|
William Spiegel
|
|
|
||
|
/s/ ANDREW TURNBULL
|
Director
|
February 20, 2018
|
||
|
Andrew Turnbull
|
|
|
||
125
QuickLinks
126
127
TABLE OF CONTENTS
Part IItem 1. BusinessItem 1A. Risk FactorsItem 1B. Unresolved Staff CommentsItem 2. PropertiesItem 3. Legal ProceedingsItem 4. Mine Safety DisclosuresPart IIItem 5. Market For The Company's Common Equity, Related Stockholder Matters and Issuer Purchases Of Equity SecuritiesItem 6. Selected Financial DataItem 7. Management's Discussion and Analysis Of Financial Condition and Results Of OperationsItem 7A. Quantitative and Qualitative Disclosures About Market RiskItem 8. Financial Statements and Supplementary DataNote 1. Nature Of Operations and Basis Of PresentationNote 2. Summary Of Significant Accounting PoliciesNote 3. Investments Available For SaleNote 4. Accounts ReceivableNote 5. Triad TransactionNote 6. Reserve For Losses and Loss Adjustment ExpensesNote 7. Debt ObligationsNote 8. Commitments and ContingenciesNote 9. Capital StockNote 10. Stock-based CompensationNote 11. Dividends RestrictionsNote 12. Income TaxesNote 13. Related Party TransactionsNote 14. Earnings Per Share (eps)Note 15. Accumulated Other Comprehensive Income (loss)Note 16. Fair Value Of Financial InstrumentsNote 17. Statutory AccountingNote 18. Capital Maintenance AgreementNote 19. Quarterly Financial Data (unaudited)Item 9. Changes in and Disagreements with Accountants on Accounting and Financial DisclosureItem 9A. Controls and ProceduresItem 9B. Other InformationPart IIIItem 10. Directors, Executive Officers and Corporate GovernanceItem 11. Executive CompensationItem 12. Security Ownership Of Certain Beneficial Owners and Management and Related Stockholder MattersItem 13. Certain Relationships and Related Transactions, and Director IndependenceItem 14. Principal Accounting Fees and ServicesPart IVItem 15. Exhibits, Financial Statement Schedules