EMPIRE STATE REALTY TRUST, INC.
10-Ks and 10-Qs
|
|
|
|
|
|
|
|
|
|
|
|
|
|
|
|
|
|
|
|
|
|
|
|
|
|
|
|
|
|
|
|
|
|
|
|
|
|
|
|
|
|
|
|
UNITED STATES SECURITIES AND EXCHANGE COMMISSION
Washington, D.C. 20549
FORM 10-K
|
x
|
ANNUAL REPORT PURSUANT TO SECTION 13 OR 15(d) OF THE SECURITIES EXCHANGE ACT OF 1934
|
For the fiscal year ended December 31, 2016
|
o
|
TRANSITION REPORT PURSUANT TO SECTION 13 OR 15(d) OF THE SECURITIES EXCHANGE ACT OF 1934
|
For the transition period from to
Commission File Number: 001-36105
EMPIRE STATE REALTY TRUST, INC.
(Exact name of Registrant as specified in its charter)
|
Maryland
|
|
37-1645259
|
|
(State or other jurisdiction of incorporation or organization)
|
|
(I.R.S. Employer Identification No.)
|
111 West 33rd Street, 12th Floor
New York, New York 10120
(Address of principal executive offices) (Zip Code)
(212) 687-8700
(Registrant's telephone number, including area code)
|
Securities registered pursuant to Section 12(b) of the Act:
|
||
|
Title of Each Class
|
Name of Each Exchange on Which Registered
|
|
|
Class A Common Stock, par value $0.01 per share
|
|
New York Stock Exchange
|
|
Securities registered pursuant to Section 12(g) of the Act:
|
||
|
None
|
||
Indicate by check mark if the Registrant is a well-known seasoned issuer, as defined in Rule 405 of the Securities Act. Yes
x
No
o
Indicate by check mark if the Registrant is not required to file reports pursuant to Section 13 or Section 15(d) of the Act. Yes
o
No
x
Indicate by check mark whether the registrant (1) has filed all reports required to be filed by Section 13 or 15(d) of the Securities Exchange Act of 1934 during the preceding 12 months (or for such shorter period that the registrant was required to file such reports), and (2) has been subject to such filing requirements for the past 90 days. Yes
x
No
o
Indicate by check mark whether the registrant has submitted electronically and posted on its corporate Web site, if any, every Interactive Data File required to be submitted and posted pursuant to Rule 405 of Regulation S-T (§232.405 of this chapter) during the preceding 12 months (or for such shorter period that the registrant was required to submit and post such files). Yes
x
No
o
Indicate by check mark if disclosure of delinquent filers pursuant to Item 405 of Regulation S-K is not contained herein, and will not be contained, to the best of the registrant's knowledge, in definitive proxy or information statements incorporated by reference in Part III of this Form 10-K or any amendment to this Form 10-K.
x
Indicate by check mark whether the registrant is a large accelerated filer, an accelerated filer, a non-accelerated filer or a smaller reporting company. See definition of “large accelerated filer,” “accelerated filer” and “smaller reporting company” in Rule 12b-2 of the Exchange Act.
|
Large accelerated filer
x
|
Accelerated filer
|
|
|
Non-accelerated filer
(Do not check if a smaller reporting company)
|
Smaller reporting company
|
|
Indicate by check mark whether the registrant is a shell company (as defined in Rule 12b-2 of the Exchange Act). Yes
o
No
x
The aggregate market value of the voting stock held by non-affiliates of the registrant as of the last business day of the registrant's most recently completed second fiscal quarter was $2,331,614,000 based on the June 30, 2016 closing price of our Class A common stock of $18.99 per share on the New York Stock Exchange.
As of February 21, 2017, there were 155,451,733 shares of the Registrants' Class A Common Stock outstanding and 1,095,737 shares of the Registrants' Class B Common Stock outstanding.
DOCUMENTS INCORPORATED BY REFERENCE
Portions of Empire State Realty Trust, Inc.'s Proxy Statement for its 2017 Annual Stockholders' Meeting (which is scheduled to be held on May 11, 2017) to be filed within 120 days after the end of the Registrant's fiscal year are incorporated by reference into Part III of this Annual Report on Form 10-K.
|
EMPIRE STATE REALTY TRUST, INC.
|
||
|
FORM 10-K
|
||
|
TABLE OF CONTENTS
|
||
|
PAGE
|
||
|
PART I.
|
||
|
1.
|
Business
|
|
|
1A.
|
Risk Factors
|
|
|
1B.
|
Unresolved Staff Comments
|
|
|
2.
|
Properties
|
|
|
3.
|
Legal Proceedings
|
|
|
4.
|
Mine Safety Disclosures
|
|
|
PART II.
|
||
|
5.
|
Market for Registrant's Common Equity, Related Stockholders Matters and Issuer Purchases of Equity Securities
|
|
|
6.
|
Selected Financial Data
|
|
|
7.
|
Management's Discussion and Analysis of Financial Condition and Results of Operations
|
|
|
7A.
|
Quantitative and Qualitative Disclosure about Market Risk
|
|
|
8.
|
Financial Statements and Supplementary Data
|
|
|
9.
|
Changes in and Disagreements with Accountants on Accounting and Financial Disclosure
|
|
|
9A.
|
Controls and Procedures
|
|
|
9B.
|
Other Information
|
|
|
PART III
|
||
|
10.
|
Directors, Executive Officers and Corporate Governance
|
|
|
11.
|
Executive Compensation
|
|
|
12.
|
Security Ownership of Certain Beneficial Owners and Management and Related Stockholder Matters
|
|
|
13.
|
Certain Relationships and Related Transactions, and Director Independence
|
|
|
14.
|
Principal Accounting Fees and Services
|
|
|
PART IV
|
||
|
15.
|
Exhibits, Financial Statements and Schedules
|
|
1
DEFINITIONS
|
•
|
"annualized rent" represents annualized base rent and current reimbursement for operating expenses and real estate taxes;
|
|
•
|
"formation transactions" mean a series of transactions pursuant to which we acquired, substantially currently with the completion of the Offering through a series of contributions and merger transactions, our portfolio of real estate assets that were held by the existing entities, the ownership interests in the certain management entities of our predecessor and one development parcel;
|
|
•
|
"fully diluted basis" means all outstanding shares of our Class A common stock at such time plus shares of Class A common stock that may be issuable upon the exchange of operating partnership units on a one-for-one basis and shares of Class A common stock issuable upon the conversion of Class B common stock on a one-for-one basis, which is not the same as the meaning of “fully diluted” under generally accepted accounting principles in the United States of America, or "GAAP";
|
|
•
|
"enterprise value" means all outstanding shares of our Class A common stock at such time plus shares of Class A common stock that may be issuable upon the exchange of operating partnership units on a one-for-one basis and shares of Class A common stock issuable upon the conversion of Class B common stock on a one-for-one basis multiplied by the Class A common share price at December 31, 2016, plus private perpetual preferred units plus consolidated debt at December 31, 2016;
|
|
•
|
"Malkin Group” means all of the following, as a group: Anthony E. Malkin, Peter L. Malkin and each of their spouses and lineal descendants (including spouses of such descendants), any estates of any of the foregoing, any trusts now or hereafter established for the benefit of any of the foregoing, or any corporation, partnership, limited liability company or other legal entity controlled by Anthony E. Malkin or any permitted successor in such entity for the benefit of any of the foregoing; provided, however that solely with respect to tax protection rights and parties who entered into the contribution agreements with respect to the formation transactions, the Malkin Group shall also include the lineal descendants of Lawrence A. Wien and his spouse (including spouses of such descendants), any estates of the foregoing, any trusts now or hereafter established for the benefit of any of the foregoing, or any corporation, partnership, limited liability company or other legal entity controlled by Anthony E. Malkin for the benefit of the foregoing;
|
|
•
|
the "Offering" means the initial public offering of our Class A common stock which was completed on October 7, 2013;
|
|
•
|
"our company," "we," "us" and "our" refer to Empire State Realty Trust, Inc., a Maryland real estate investment trust, together with its consolidated subsidiaries, including Empire State Realty OP, L.P., a Delaware limited partnership, which we refer to as "our operating partnership";
|
|
•
|
"securityholder" means holders of our Class A common stock and Class B common stock and holders of our operating partnership's Series ES, Series 250, Series 60 and Series PR operating partnership units;
|
|
•
|
"traded OP units" mean our operating partnership's Series ES, Series 250 and Series 60 operating partnership units.
|
2
Overview
We are a self-administered and self-managed real estate investment trust, or REIT, that owns, manages, operates, acquires and repositions office and retail properties in Manhattan and the greater New York metropolitan area, including the Empire State Building, the world's most famous building.
As of
December 31, 2016
, our total portfolio, containing
10.1 million
rentable square feet of office and retail space, was
88.1%
occupied. Including signed leases not yet commenced, our total portfolio was
90.2%
leased. As of
December 31, 2016
, we owned 14 office properties (including three long-term ground leasehold interests) encompassing approximately
9.4 million
rentable square feet of office space, which were approximately
88.0%
occupied or
90.2%
leased including signed leases not yet commenced. Nine of these properties are located in the midtown Manhattan market and encompass approximately
7.6 million
rentable square feet of office space, including the Empire State Building. Our Manhattan office properties also contain
501,653
rentable square feet of premier retail space on their ground floor and/or contiguous levels. Our remaining five office properties are located in Fairfield County, Connecticut and Westchester County, New York, encompassing approximately
1.9 million
rentable square feet. The majority of square footage for these five properties is located in densely populated metropolitan communities with immediate access to mass transportation. Additionally, we have entitled land at the Stamford Transportation Center in Stamford, Connecticut, adjacent to one of our office properties, that will support the development of an approximately 380,000 rentable square foot office building and garage, which we refer to herein as Metro Tower. As of
December 31, 2016
, our portfolio also included four standalone retail properties located in Manhattan and two standalone retail properties located in the city center of Westport, Connecticut, encompassing
204,452
rentable square feet in the aggregate. As of
December 31, 2016
, our standalone retail properties were
99.4%
leased in the aggregate.
The Empire State Building offers panoramic views of New York and neighboring states from its world-famous 86th
and 102nd
floor observatories that draw millions of visitors per year. The number of visitors to the observatories was approximately 4.25 million and 4.06 million for the years ended December 31, 2016 and 2015, respectively. The 86th
floor observatory has a 360-degree outdoor deck as well as indoor viewing galleries to accommodate guests day and night, all year-round. The 102nd
floor observatory is entirely indoors and offers a 360-degree view of New York City from 1,250 feet above ground.
We were organized as a Maryland corporation on July 29, 2011. Our operating partnership holds substantially all of our assets and conducts substantially all of our business. As of
December 31, 2016
, we owned approximately 52.1% of the aggregate operating partnership units in our operating partnership. Our company, as the sole general partner in our operating partnership, has responsibility and discretion in the management and control in our operating partnership, and the limited partners in our operating partnership, in such capacity, have no authority to transact business for, or participate in the management activities of, our operating partnership. We elected to be taxed as a real estate investment trust ("REIT") and operate in a manner that we believe allows us to qualify as a REIT for federal income tax purposes commencing with our taxable year ended December 31, 2013.
Our Competitive Strengths
We believe that we distinguish ourselves from other owners and operators of office and retail properties as a result of the following competitive strengths:
|
•
|
Irreplaceable Portfolio of Office Properties in Midtown Manhattan
. Our Manhattan office properties are located in one of the most prized office markets in the world due to a combination of supply constraints, high barriers to entry, near-term and long-term prospects for job creation, vacancy absorption and rental rate growth. Management believes these properties could not be replaced today on a cost-competitive basis, if at all. As of
December 31, 2016
, we owned nine Manhattan office properties (including three long-term ground leasehold interests) encompassing approximately
7.6 million
rentable square feet of office space, including the Empire State Building, our flagship property. Unlike traditional office buildings, the Empire State Building provides us with a significant source of income from its observatory and broadcasting operations. All of these properties include premier retail space on their ground floor and/or contiguous levels, which comprise
501,653
rentable square feet in the aggregate and some of which have recently undergone significant redevelopments. We believe the high quality of our buildings, services and amenities, their desirable locations and commuter access to mass transportation should allow us to increase rents and occupancy to generate positive cash flow and growth.
|
3
|
•
|
Expertise in Repositioning and Redeveloping Manhattan Office Properties
. We have substantial expertise in redeveloping and repositioning Manhattan office properties, having invested a total of approximately
$719.0 million
(excluding tenant improvement costs and leasing commissions) in our Manhattan office properties since we assumed full control of the day-to-day management of these properties beginning with One Grand Central Place in November 2002 through 2006. We have substantial experience in upgrading, redeveloping and modernizing building lobbies, corridors, bathrooms, elevator cabs and old, antiquated spaces to include new ceilings, lighting, pantries and base building systems (including electric distribution and air conditioning), as well as enhanced tenant amenities. We have successfully aggregated and are continuing to aggregate smaller spaces to offer larger blocks of space, including multiple floors, that are attractive to larger, higher credit-quality tenants and to offer new, pre-built suites with improved layouts. As part of this program, we have converted some or all of the second floor office space of certain of our Manhattan office properties to higher rent retail space. We believe that the post-redevelopment high quality of our buildings and the service we provide also attract higher credit-quality tenants for larger spaces at rents above similar vintage buildings, and below new construction, thus defining a new price point and allowing us to drive superior returns on invested capital per square foot. In addition, we believe that, based on the results of our base building energy efficiency retrofit, and energy efficient tenant build-outs, at the Empire State Building, the lessons of which we are applying throughout our portfolio, we derive cost savings through innovative energy efficiency retrofitting and sustainability initiatives, reducing direct and indirect energy costs paid both by tenants and by us throughout our other Manhattan office properties and greater New York metropolitan area office properties, which improves our competitive position.
|
|
•
|
Leader in Energy Efficiency Retrofitting
. We have pioneered certain practices in energy efficiency, and at the Empire State Building we have partnered with the Clinton Climate Initiative, Johnson Controls Inc., Jones Lang LaSalle and the Rocky Mountain Institute to create and implement a groundbreaking, replicable process for integrating energy efficiency retrofits in the existing built environment. The reduced energy consumption reduces costs for us and our tenants, and we believe creates a competitive advantage for our properties. We believe that higher quality tenants in general place a higher priority on sustainability, controlling costs, and minimizing contributions to greenhouse gases. We believe our expertise in this area gives us the opportunity to attract higher quality tenants at higher rental rates and to reduce our expenses. As a result of our efforts, approximately 74.0% of our portfolio square feet is Energy Star certified, including the Empire State Building. As a result of the energy efficiency retrofits, we estimate that the Empire State Building will save at least 38% of its pre-retrofit level of energy use, resulting in at least $4.4 million of annual energy cost savings. Johnson Controls Inc. has guaranteed minimum energy cost savings of $2.2 million annually, from 2010 through 2025, with respect to certain of the retrofits in which Johnson Controls Inc. was project leader. Actual 2015 energy cost savings was $3.2 million. We are implementing cost justified energy efficiency retrofit projects in our Manhattan and greater New York metropolitan area office properties based on our work at the Empire State Building. Finally, we maintain a series of management practices utilizing recycling of tenant and construction waste, recycled content carpets, low off-gassing paints and adhesives, “green” pest control and cleaning solutions and recycled paper products throughout our office portfolio. We believe that our portfolio’s attractiveness is enhanced by these practices and that this should result in higher rental rates, longer lease terms and higher quality tenants.
|
|
•
|
Attractive Retail Locations in Densely Populated Metropolitan Communities
. As of
December 31, 2016
, our portfolio also included six standalone retail properties and retail space at the ground floor and/or lower levels of our Manhattan office properties, encompassing
706,105
rentable square feet in the aggregate, which were approximately
88.6%
occupied in the aggregate. All of these properties are located in dynamic retail corridors with convenient access to mass transportation, a diverse tenant base and high pedestrian traffic and/or main destination locations. Our retail portfolio includes 684,672 rentable square feet located in Manhattan and 21,433 rentable square feet located in Westport, Connecticut. Our current retail rents are meaningfully below current market rents, and as we recapture and redevelop retail space, we are able to drive strong positive spreads on newly leased space. We have significant retail expirations in the coming years that will allow us to further increase our cash flows as we continue our redevelopment program. Our retail tenants cover a number of industries, and include Allen Edmonds; Ann Taylor; AT&T; Bank of America; Bank Santander (Sovereign Bank); Best Buy Mobile; Charles Schwab; Chipotle; Duane Reade; FedEx/Kinko’s; Food Emporium; FootLocker; HSBC; JP Morgan Chase; Lululemon; Men’s Wearhouse; Nike; Panera Bread; Potbelly Sandwich Works; Sephora; Shake Shack; Sprint; Starbucks; Theory; TJ Maxx; Urban Outfitters; and Walgreens. Our Westport, Connecticut retail properties are located on Main Street, the main pedestrian thoroughfare in Westport, Connecticut, and have the advantage of being adjacent to one of the few available large-scale parking lots in town.
|
|
•
|
Experienced and Committed Management Team with Proven Track Record
. Our senior management team is highly regarded in the real estate community and has extensive relationships with a broad range of brokers, owners, tenants and lenders. We have developed relationships we believe enable us to both secure high credit-quality tenants on
|
4
attractive terms, as well as provide us with potential acquisition opportunities. We have substantial in-house expertise and resources in asset and property management, leasing, marketing, acquisitions, construction, development and financing and a platform that is highly scalable. Members of our senior management team have worked in the real estate industry for an average of approximately 32 years with extensive experience in Greater New York area real estate, through many economic cycles. We take an intensive, hands-on approach to the management of our portfolio and quality brand building. As of
December 31, 2016
, our named executive officers owned 11.6% of our common stock on a fully diluted basis (including shares of common stock and operating partnership units as to which Anthony E. Malkin disclaims beneficial ownership except to the extent of his pecuniary interest therein), and therefore their interests are aligned with those of our securityholders and they are incentivized to maximize returns to our securityholders.
|
•
|
|
Business and Growth Strategies
Our primary business objectives are to maximize cash flow and total returns to our securityholders and to increase the value of our properties through the pursuit of the following business and growth strategies:
|
•
|
Vacating, Redeveloping, and Leasing of Redeveloped Space at Our Manhattan Office Properties
. As of
December 31, 2016
, our Manhattan office properties (excluding the retail component of these properties) were approximately
86.8%
occupied, or
89.1%
leased including signed leases not commenced, and had approximately
0.8 million
rentable square feet of available space (excluding signed leases not commenced). Our program of redevelopment necessarily includes vacating older less desirable suites; demolishing them for re-leasing as full or multi-floor blocks, or as new pre-built suites; and re-leasing them. We believe our redevelopment and repositioning program for our Manhattan office properties results in our leasing space to better credit tenants and higher rents, while achieving returns of six to 20 percent. Over time, as we have created and redeveloped large blocks of available space, we have leased them to higher quality tenants at higher rents, and intend to continue to execute on this program over the years to come. To date we believe these efforts have accelerated our ability to lease space to new higher credit-quality tenants, many of which have expanded the office space they lease from us over time. We also employ a pre-built suite strategy in selected portions of some of our properties to appeal to many credit-worthy smaller tenants by fitting out some available space with new ceilings, lighting, pantries and base building systems (including electric distribution and air conditioning) for immediate occupancy. These pre-built suites deploy energy efficiency strategies developed in our work at the Empire State Building and are designed with efficient layouts sought by a wide array of users which we believe will require only minor painting and carpeting for future re-leasing thus reducing our future costs. We expect to achieve returns on investment of six to 19 percent on our pre-built suites. Over time, as we have redeveloped the spaces in our buildings, we believe we will increase our occupancy.
|
|
•
|
Increase Existing Below-Market Rents
.
The purpose of our redevelopment is to sign leases for larger amounts of space to better credit tenants at higher rents. To date, we have capitalized on this opportunity and we believe we have significant embedded, de-risked growth that we can capture as we execute on the successful repositioning of our Manhattan office portfolio and improving market fundamentals to increase rents. For example, we expect to benefit from the re-leasing of
7.2%
, or approximately
541,877
rentable square feet (including month-to-month leases), of our Manhattan office leases expiring during 2017, which we generally believe are currently at below market rates. These expiring leases represent a weighted average base rent of
$48.98
per square foot based on current measurements. As older leases expire, we expect to continue to upgrade certain space to further increase rents. Our concentration in Manhattan and the greater New York metropolitan area should also enable us to benefit from increased rents associated with current and anticipated near-term improvements in the financial and economic environment in these areas. We also expect to benefit from our price positioning as we command prices that are above comparable vintage properties due to the quality of our newly developed space and our attractive amenities but below new construction.
|
5
|
•
|
Complete the Redevelopment and Repositioning of Our Current Portfolio
. We intend to continue to increase occupancy, improve tenant quality and enhance cash flow and value by completing the redevelopment and repositioning of our Manhattan office properties. We intend selectively to continue to allow leases for smaller spaces to expire or relocate smaller tenants in order to aggregate, demolish and re-demise existing office space into larger blocks of vacant space, which we believe will attract higher credit-quality tenants at higher rental rates. We apply rigorous underwriting analysis to determine if aggregation of vacant space for future leasing to larger tenants will improve our cash flows over the long term. In addition, we are a leader in developing economically justified energy efficiency retrofitting and sustainability and have made it a portfolio-wide initiative. We believe this makes our properties desirable to high credit-quality tenants at higher rental rates and longer lease terms.
|
|
•
|
Pursue Attractive Acquisition and Development Opportunities
. We will opportunistically pursue attractive opportunities to acquire office and retail properties. For the foreseeable future, we intend to focus our acquisition strategy primarily on Manhattan office properties and, to a lesser extent, office and multi-tenanted retail properties in densely populated communities in the greater New York metropolitan area and other markets we may identify in the future. We believe we can utilize our industry relationships (including well-known real estate owners in Manhattan), brand recognition, and our expertise in redeveloping and repositioning office properties to identify acquisition opportunities where we believe we can increase occupancy and rental rates. We also believe there is significant growth opportunity to acquire and reposition additional stand-alone retail spaces. Our strong balance sheet, access to capital, and ability to offer operating partnership units in tax deferred acquisition transactions should give us significant flexibility in structuring and consummating acquisitions. Further, we have a development site, Metro Tower at the Stamford Transportation Center, which is adjacent to our Metro Center property, which we believe to be one of the premier office buildings in Connecticut. All required zoning approvals have been obtained to allow development of an approximately 380,000 rentable square foot office tower and garage. We intend to develop this site when we deem the appropriate combination of market and other conditions are in place.
|
|
•
|
Proactively Manage Our Portfolio
. We believe our proactive, service-intensive approach to asset and property management helps increase occupancy and rental rates. We utilize our comprehensive building management services and our strong commitment to tenant and broker relationships and satisfaction to negotiate attractive leasing deals and to attract high credit-quality tenants. We proactively manage our rent roll and maintain continuous communication with our tenants. We foster strong tenant relationships by being responsive to tenant needs. We do this through the amenities we provide, the quality of our buildings and services, our employee screening and training, energy efficiency initiatives, and preventative maintenance and prompt repairs. Our attention to detail is integral to serving our clients and building our brand. Our properties have received numerous industry awards for their operational efficiency. We believe long-term tenant relationships will improve our operating results over time by reducing leasing, marketing and tenant improvement costs and reducing tenant turnover. We do extensive diligence on our tenants’ (current and prospective) balance sheets, businesses and business models to determine if we will establish long-term relationships in which they will both renew with us and expand over time.
|
Leasing
We are focused on maintaining a brand that tenants associate with a consistently high level of quality of services, installations, maintenance and amenities with long term financial stability. Through our commitment to brokers, we have developed long-term relationships that focus on negotiating attractive transactions with high credit-quality tenants. We proactively manage and cultivate our industry relationships and make the most senior members of our management team available to our constituencies. We believe that our consistent, open dialogue with our tenants and brokers enables us to maximize our redevelopment and repositioning opportunities. Our focus on performance and perspective allows us to concentrate on the ongoing management of our portfolio, while seeking opportunities for growth in the future.
Property Management
We protect our investments by regularly monitoring our properties, performing routine preventive maintenance, and implementing capital improvement programs in connection with property redevelopment and life cycle replacement of equipment and systems. We presently self-manage all of our properties. We proactively manage our properties and rent rolls to (i) aggregate smaller demised spaces to create large blocks of vacant space, to attract high credit-quality tenants at higher rental rates, and (ii) create efficient, modern, pre-built offices that can be rented through several lease cycles and attract better credit-quality tenants. We aggressively manage and control operating expenses at all of our properties. In addition, we have made energy efficiency retrofitting and sustainability a portfolio-wide initiative driven by economic return. We pass on cost savings achieved by such improvements to our tenants through lower utility costs and reduced operating expense escalations. We believe these initiatives make our properties more desirable to a broader tenant base than the properties of our competitors.
6
Business Segments
Our reportable segments consist of a real estate segment and an observatory segment. Our real estate segment includes all activities related to the ownership, management, operation, acquisition, repositioning and disposition of our real estate assets. Our observatory segment operates the 86th and 102nd floor observatories at the Empire State Building. These
two
lines of businesses are managed separately because each business requires different support infrastructures, provides different services and has dissimilar economic characteristics such as investments needed, stream of revenues and different marketing strategies. We account for intersegment sales and rent as if the sales or rent were to third parties, that is, at current market prices. We include our construction operation in "Other" and it includes all activities related to providing construction services to tenants and to other entities within and outside our company. As of March 27, 2015, we no longer solicited new business for our construction management business. We completed all projects that were in progress. See Note 13 to our consolidated financial statements for further information on our reportable segments.
Regulation
General
The properties in our portfolio are subject to various laws, ordinances and regulations, including regulations relating to common areas. We believe each of the existing properties has the necessary permits and approvals to operate its business.
Americans with Disabilities Act
Our properties must comply with Title III of the Americans with Disabilities Act, or ADA, to the extent that such properties are “public accommodations” as defined by the ADA. The ADA may require removal of structural barriers to access by persons with disabilities in certain public areas of our properties where such removal is readily achievable. We believe the existing properties are in substantial compliance with the ADA and that we will not be required to make substantial capital expenditures to address the requirements of the ADA. However, noncompliance with the ADA could result in imposition of fines or an award of damages to private litigants. The obligation to make readily achievable accommodations is an ongoing one, and we will continue to assess our properties and to make alterations as appropriate in this respect.
Environmental Matters
Under various federal, state and/or local laws, ordinances and regulations, as a current or former owner or operator of real property, we may be liable for costs and damages resulting from the presence or release of hazardous substances, waste, or petroleum products at, on, in, under or from such property, including costs for investigation or remediation, natural resource damages, or third party liability for personal injury or property damage. These laws often impose liability without regard to whether the owner or operator knew of, or was responsible for, the presence or release of such materials, and the liability may be joint and several. Some of our properties have been or may be impacted by contamination arising from current or prior uses of the property or adjacent properties for commercial, industrial or other purposes. Such contamination may arise from spills of petroleum or hazardous substances or releases from tanks used to store such materials. We also may be liable for the costs of remediating contamination at off-site disposal or treatment facilities when we arrange for disposal or treatment of hazardous substances at such facilities, without regard to whether we comply with environmental laws in doing so. The presence of contamination or the failure to remediate contamination on our properties may adversely affect our ability to attract and/or retain tenants, and our ability to develop or sell or borrow against those properties. In addition to potential liability for cleanup costs, private plaintiffs may bring claims for personal injury, property damage or for similar reasons. Environmental laws also may create liens on contaminated sites in favor of the government for damages and costs it incurs to address such contamination. Moreover, if contamination is discovered on our properties, environmental laws may impose restrictions on the manner in which that property may be used or how businesses may be operated on that property.
Some of our properties are adjacent to or near other properties used for industrial or commercial purposes or that have contained or currently contain underground storage tanks used to store petroleum products or other hazardous or toxic substances. Releases from these properties could impact our properties. In addition, some of our properties have previously been used by former owners or tenants for commercial or industrial activities, e.g., gas stations and dry cleaners, and a portion of the Metro Tower site is currently used for automobile parking and fueling, that may release petroleum products or other hazardous or toxic substances at such properties or to surrounding properties. While certain properties contain or contained uses that could have or have impacted our properties, we are not aware of any liabilities related to environmental contamination that we believe will have a material adverse effect on our operations.
7
Soil contamination has been identified at 69-97 Main Street in Westport, Connecticut. The affected soils are more than four feet below the ground surface. An Environmental Land Use Restriction has been imposed on this site to ensure the soil is not exposed, excavated or disturbed such that it could create a risk of migration of pollutants or a potential hazard to human health or the environment. While the contamination is currently contained, the potential resale value of this property and our ability to finance or refinance this property in the future may be adversely affected as a result of such contamination. In addition, pursuant to the Environmental Land Use Restriction, plans for the redevelopment of the property would be subject to the review of the Town of Westport, Connecticut among other conditions.
The property situated at 500 Mamaroneck Avenue in Harrison, New York was the subject of a voluntary remedial action work cleanup plan performed by the former owner following its conveyance of title to the present owners under an agreement with the New York State Department of Environmental Conservation, or NYDEC. As a condition to the issuance of a “no further action” letter, NYDEC required that certain restrictive and affirmative covenants be recorded against the subject property. In substantial part, these include prohibition against construction that would disturb the soil cap isolating certain contaminated subsurface soil, limiting the use of such property to commercial uses, implementing engineering controls to assure that improvements be kept in good condition, not using ground water at the site for potable purposes without treatment, implementing safety procedures for workers to follow excavating at the site to protect their health and safety and filing an annual certification that the controls implemented in accordance with the voluntary remedial action work cleanup plan remain in place. Furthermore, a substantial portion of the site that had been substantially unimproved prior to acquisition may not be further developed.
In addition, our properties are subject to various federal, state and local environmental and health and safety laws and regulations. Noncompliance with these environmental and health and safety laws and regulations could subject us or our tenants to liability. These liabilities could affect a tenant’s ability to make rental payments to us. Moreover, changes in laws could increase the potential costs of compliance with such laws and regulations or increase liability for noncompliance. This may result in significant unanticipated expenditures or may otherwise materially and adversely affect our operations, or those of our tenants, which could in turn have a material adverse effect on us. We sometimes require our tenants to comply with environmental and health and safety laws and regulations and to indemnify us for any related liabilities in our leases with them. But in the event of the bankruptcy or inability of any of our tenants to satisfy such obligations, we may be required to satisfy such obligations. We are not presently aware of any instances of material non-compliance with environmental or health and safety laws or regulations at our properties, and we believe that we and/or our tenants have all material permits and approvals necessary under current laws and regulations to operate our properties.
As the owner or operator of real property, we may also incur liability based on various building conditions. For example, buildings and other structures on properties that we currently own or operate or those we acquire or operate in the future contain, may contain, or may have contained, asbestos-containing material, or ACM. Environmental and health and safety laws require that ACM be properly managed and maintained and may impose fines or penalties on owners, operators or employers for non-compliance with those requirements. These requirements include special precautions, such as removal, abatement or air monitoring, if ACM would be disturbed during maintenance, redevelopment or demolition of a building, potentially resulting in substantial costs. In addition, we may be subject to liability for personal injury or property damage sustained as a result of releases of ACM into the environment. We are not presently aware of any material liabilities related to building conditions, including any instances of material non-compliance with asbestos requirements or any material liabilities related to asbestos.
In addition, our properties may contain or develop harmful mold or suffer from other indoor air quality issues, which could lead to liability for adverse health effects or property damage or costs for remediation. When excessive moisture accumulates in buildings or on building materials, mold growth may occur, particularly if the moisture problem remains undiscovered or is not addressed over a period of time. Some molds may produce airborne toxins or irritants. Indoor air quality issues can also stem from inadequate ventilation, chemical contamination from indoor or outdoor sources, and other biological contaminants such as pollen, viruses and bacteria. Indoor exposure to airborne toxins or irritants above certain levels can be alleged to cause a variety of adverse health effects and symptoms, including allergic or other reactions. As a result, the presence of significant mold or other airborne contaminants at any of our properties could require us to undertake a costly remediation program to contain or remove the mold or other airborne contaminants from the affected property or increase indoor ventilation. In addition, the presence of significant mold or other airborne contaminants could expose us to liability from our tenants, employees of our tenants or others if property damage or personal injury occurs. We are not presently aware of any material adverse indoor air quality issues at our properties.
8
Insurance
We carry comprehensive liability, fire, extended coverage, earthquake, terrorism and rental loss insurance covering all of our Manhattan properties and our greater New York metropolitan area properties under a blanket policy. We carry additional all-risk property and business insurance, which includes terrorism insurance, on the Empire State Building through ESRT Captive Insurance Company L.L.C., or ESRT Captive Insurance, our wholly owned captive insurance company. ESRT Captive Insurance covers terrorism insurance for $1.2 billion in losses in excess of $800 million per occurrence suffered by the Empire State Building, providing us with aggregate terrorism coverage of $2 billion at that property. ESRT Captive Insurance fully reinsures the 16% coinsurance under the Terrorism Risk Insurance Program Reauthorization Act of 2015 (TRIPRA) and the difference between the TRIPRA captive deductible and policy deductible of $25,000 for non-Nuclear, Biological, Chemical and Radiological exposures. We purchased a $50 million limit of Nuclear, Biological, Chemical and Radiological (NBCR) insurance in excess of a $1.0 million deductible in the commercial insurance market. ESRT Captive Insurance provides NBCR insurance with a limit of $1.95 billion in excess of the $50 million policy. As a result, we remain only liable for the 16% coinsurance under TRIPRA for NBCR exposures within ESRT Captive Insurance, as well as a deductible equal to 20% of ESRT Captive Insurance’s prior year’s premium. As long as we own ESRT Captive Insurance, we are responsible for ESRT Captive Insurance’s liquidity and capital resources, and ESRT Captive Insurance’s accounts are part of our consolidated financial statements. If we experience a loss and ESRT Captive Insurance is required to pay under its insurance policy, we would ultimately record the loss to the extent of its required payment. The policies described above cover certified terrorism losses as defined under the Terrorism Risk Insurance Act of 2002 (TRIA) and subsequent extensions. On January 12, 2015, the President of the United States signed into law TRIPRA, which extends TRIA through December 31, 2020. TRIA provides for a system of shared public and private compensation for insured losses resulting from acts of terrorism. As a result, the certified terrorism coverage provided by ESRT Captive Insurance is eligible for 84% coinsurance provided by the United States Treasury in excess of a statutorily calculated deductible. ESRT Captive Insurance reinsures 100% of its 16% coinsurance for non-NBCR exposures. The 16% coinsurance on NBCR exposures is retained by ESRT Captive Insurance.
Reinsurance contracts do not relieve ESRT Captive Insurance from its primary obligations to its policyholders. Additionally, failure of the various reinsurers to honor their obligations could result in significant losses to ESRT Captive Insurance. The reinsurance has been ceded to reinsurers approved by the State of Vermont. ESRT Captive Insurance continually evaluates the reinsurers’ financial condition by considering published financial stability ratings of the reinsurers and other factors. There can be no assurance that reinsurance will continue to be available to ESRT Captive Insurance to the same extent and at the same cost. ESRT Captive Insurance may choose in the future to reevaluate the use of reinsurance to increase or decrease the amounts of risk it cedes.
In addition to insurance held through ESRT Captive Insurance described above, we carry terrorism insurance on all of our properties in an amount and with deductibles which we believe are commercially reasonable.
Competition
The leasing of real estate is highly competitive in Manhattan and the greater New York metropolitan market in which we operate. We compete with numerous acquirers, developers, owners and operators of commercial real estate, many of which own or may seek to acquire or develop properties similar to ours in the same markets in which our properties are located. The principal means of competition are rent charged, location, services provided and the nature and condition of the facility to be leased. In addition, we face competition from other real estate companies including other REITs, private real estate funds, domestic and foreign financial institutions, life insurance companies, pension trusts, partnerships, individual investors and others that may have greater financial resources or access to capital than we do or that are willing to acquire properties in transactions which are more highly leveraged or are less attractive from a financial viewpoint than we are willing to pursue. In addition, competition from new and existing observatories and/or broadcasting operations could have a negative impact on revenues from our observatory operations and/or broadcasting revenues. Adverse impacts on domestic travel and changes in foreign currency exchange rates may also decrease demand in the future, which could have a material adverse effect on our results of operations, financial condition and ability to make distributions to our securityholders. If our competitors offer space at rental rates below current market rates, below the rental rates we currently charge our tenants, in better locations within our markets or in higher quality facilities, we may lose potential tenants and we may be pressured to reduce our rental rates below those we currently charge in order to retain tenants when our tenants’ leases expire.
Our Tax Status
We elected to be taxed as a REIT and operate in a manner that we believe allows us to qualify as a REIT for federal income tax purposes commencing with our taxable year ended December 31, 2013. We believe we have been organized in conformity with the requirements for qualification and taxation as a REIT under the Internal Revenue Code of 1986, as
9
amended, the ("Code"), and that our intended manner of operation will enable us to meet the requirements for qualification and taxation as a REIT. So long as we qualify as a REIT, we generally will not be subject to U.S. federal income tax on our net taxable income that we distribute currently to our securityholders. If we fail to qualify as a REIT in any taxable year and do not qualify for certain statutory relief provisions, we will be subject to U.S. federal income tax at regular corporate rates and may be precluded from qualifying as a REIT for the subsequent four taxable years following the year during which we lost our REIT qualification. Even if we qualify for taxation as a REIT, we may be subject to certain U.S. federal, state and local taxes on our income or property.
Inflation
Substantially all of our leases provide for separate real estate tax and operating expense escalations. In addition, many of the leases provide for fixed base rent increases. We believe inflationary increases may be at least partially offset by the contractual rent increases and expense escalations described above. We do not believe inflation has had a material impact on our historical financial position or results of operations.
Seasonality
Our observatory business is subject to tourism trends and weather, and therefore does experience some seasonality. During the past ten years of our annual observatory revenue, approximately 16% to 18% was realized in the first quarter, 26.0% to 28.0% was realized in the second quarter, 31.0% to 33.0% was realized in the third quarter and 23.0% to 25.0% was realized in the fourth quarter. We do not consider the balance of our business to be subject to material seasonal fluctuations.
Employees
As of
December 31, 2016
, we had 819 employees, 127 of whom were managers and professionals. There are currently collective bargaining agreements which cover the workforce that services all of our office properties. Management believes that its relationship with employees is good.
Offices
Our principal executive offices are located at 111 West 33rd Street, 12th floor, New York, New York 10120. In addition, we have six additional regional leasing and property management offices in Manhattan
and the greater New York metropolitan area. Our current facilities are adequate for our present and future operations, although we may add regional offices, depending upon our future operations.
Available Information
Our website address is
http://www.empirestaterealtytrust.com.
The information found on, or otherwise accessible through, our website is not incorporated information and does not form a part of this Annual Report on Form 10-K or any other report or document we file with or furnish to the SEC. We make available, free of charge, on or through the SEC Filings section of our website, annual reports on Form 10-K, quarterly reports on Form 10-Q, current reports on Form 8-K and amendments to those reports filed or furnished pursuant to Section 13(a) or 15(d) of the Securities Exchange Act of 1934, as amended, as soon as reasonably practicable after we electronically file such material with, or furnish it to, the SEC. We have also posted on our website the Audit Committee Charter, Compensation Committee Charter, Finance Committee Charter, Nominating and Corporate Governance Committee Charter, Corporate Governance Guidelines and Code of Business Conduct and Ethics, which govern our directors, officers and employees. Within the time period required by the SEC, we will post on our website any amendment to our Code of Business Conduct and Ethics and any waiver applicable to our senior financial officers, and our executive officers or directors. You can also read and copy any materials we file with the SEC at its Public Reference Room at 100 F Street, NE, Washington, DC 20549 (1-800-SEC-0330). The SEC maintains an Internet site
(
http://www.sec.gov
)
that contains reports, proxy and information statements, and other information regarding issuers that file electronically with the SEC.
10
RISK FACTORS
You should carefully consider these risk factors, together with all of the other information included in this Annual Report on Form 10-K, including our consolidated financial statements and the related notes thereto, before you decide whether to make an investment in our securities. The risks set out below are not the only risks we face. Additional risks and uncertainties not currently known to us or that we currently deem to be immaterial also may materially and adversely affect our business, prospects, financial condition, cash flows, liquidity, funds from operations, results of operations, share price, ability to service our indebtedness, and/or ability to make cash distributions to our securityholders (including those necessary to maintain our REIT qualification). In such case, the value of our common stock and the trading price of our securities could decline, and you may lose all or a significant part of your investment. Some statements in the following risk factors constitute forward looking statements. See the section entitled “Forward-Looking Statements.”
Risks Related to Our Properties and Our Business
All of our properties are located in Manhattan and the greater New York metropolitan area, in particular midtown Manhattan, and adverse economic or regulatory developments in this area could materially and adversely affect us.
All of our properties are located in Manhattan and the greater New York metropolitan area, in particular midtown Manhattan, as well as nearby markets in Fairfield County, Connecticut and Westchester County, New York. Nine of our 14 office properties are located in midtown Manhattan. As a result, our business is dependent on the condition of the New York City economy in general and the market for office space in midtown Manhattan in particular, which exposes us to greater economic risks than if we owned a more geographically diverse portfolio. We are susceptible to adverse developments in the New York City economic and regulatory environment (such as business layoffs or downsizing, industry slowdowns, relocations of businesses, increases in real estate and other taxes, costs of complying with governmental regulations or increased regulation). Such adverse developments could materially reduce the value of our real estate portfolio and our rental revenues, and thus materially and adversely affect our ability to service current debt and to pay distributions to securityholders. We could also be impacted by adverse developments in the Fairfield County, Connecticut and Westchester County, New York markets. We cannot assure you that these markets will grow or that underlying real estate fundamentals will be favorable to owners and operators of office or retail properties. Our operations may also be affected if competing properties are built in either of these markets.
Adverse economic and geopolitical conditions in general and in Manhattan and the greater New York metropolitan area commercial office and retail markets in particular, could have a material adverse effect on our results of operations, financial condition, ability to service debt and our ability to make distributions to our securityholders
.
Our business may be affected by the volatility and illiquidity in the financial and credit markets, a general global economic recession and other market or economic challenges experienced by the real estate industry or the U.S. economy as a whole. Our business may also be materially and adversely affected by local economic conditions, as substantially all of our revenues are derived from our properties located in Manhattan and the greater New York metropolitan area, particularly in Manhattan, Fairfield County and Westchester County. Because our portfolio consists primarily of commercial office and retail buildings (as compared to a more diversified real estate portfolio) located principally in Manhattan, if economic conditions persist or deteriorate, then our results of operations, financial condition, ability to service current debt and to make distributions to our securityholders may be materially and adversely affected by the following, among other potential conditions:
|
•
|
the financial condition of our tenants, many of which are consumer goods, financial, legal and other professional firms, may be adversely affected, which may result in tenant defaults under leases due to bankruptcy, lack of liquidity, operational failures or other reasons;
|
|
•
|
significant job losses in the financial and professional services industries have occurred and may continue to occur, which may decrease demand for our office space, causing market rental rates and property values to be impacted negatively;
|
|
•
|
our ability to borrow on terms and conditions that we find acceptable, or at all, may be limited, which could reduce our ability to pursue acquisition and development opportunities, engage in our redevelopment and repositioning activities and refinance existing debt, reduce our returns from both our existing operations and our acquisition and development activities and increase our future interest expense;
|
|
•
|
reduced values of our properties may limit our ability to dispose of assets at attractive prices or to obtain debt financing secured by our properties and may reduce the availability of unsecured loans;
|
|
•
|
reduced liquidity in debt markets and increased credit risk premiums for certain market participants may impair our ability to access capital or make such access more expensive; and
|
|
•
|
the value and liquidity of our short-term investments and cash deposits could be reduced as a result of a deterioration of the financial condition of the institutions that hold our cash deposits or the institutions or assets in which we have
|
11
made short-term investments, the dislocation of the markets for our short-term investments, increased volatility in market rates for such investments or other factors.
These conditions may continue or worsen in the future, which could materially and adversely affect our results of operations, financial condition and ability to make distributions to our securityholders.
There can be no assurance that our redevelopment and repositioning program will be completed in its entirety in accordance with the anticipated timing or at the anticipated cost, or that we will achieve the results we expect from our redevelopment and repositioning program, which could materially and adversely affect our financial condition and results of operations
.
We have been undertaking a comprehensive redevelopment and repositioning program of our Manhattan office properties that has included the physical improvement through upgrades and modernization of, and tenant upgrades in, such properties. We may experience conditions which delay or preclude program completion. In addition, we may not be able to lease available space on favorable terms or at all. Further, our redevelopment and repositioning program may lead to temporary increased vacancy rates at the properties undergoing redevelopment. There can be no assurance that our redevelopment and repositioning program will be completed in its entirety in accordance with the anticipated timing or at the anticipated cost, or that we will achieve the results we expect from our redevelopment and repositioning program or that we will be able to achieve anticipated results which could materially and adversely affect our financial condition and results of operations.
We rely on six properties for a significant portion of our rental revenue
.
For the year ended
December 31, 2016
, six of our properties, the Empire State Building, One Grand Central Place, 1400 Broadway, 111 West 33rd Street, First Stamford Place and 250 West 57th Street together accounted for approximately 71.4% of our portfolio’s rental revenues, and no other property accounted for more than approximately 5.0% of our portfolio’s rental revenues. For the year ended
December 31, 2016
, the Empire State Building individually accounted for approximately 32.6% of our portfolio’s rental revenues. Our revenue and cash available for distribution to our securityholders would be materially and adversely affected if the Empire State Building, One Grand Central Place, 1400 Broadway, 111 West 33rd Street, First Stamford Place or 250 West 57th Street were materially damaged or destroyed. Additionally, our revenue and cash available for distribution to our securityholders would be materially adversely affected if a significant number of our tenants at these properties experienced a downturn in their business which may weaken their financial condition and result in their failure to make timely rental payments, defaulting under their leases or filing for bankruptcy.
The observatory operations at the Empire State Building are not traditional real estate operations, and competition and changes in tourist trends may subject us to additional risks, which could materially and adversely affect us.
During the year ended
December 31, 2016
, we derived approximately
$124.8 million
of revenue from the Empire State Building’s observatory operations, representing approximately
40.6%
of the Empire State Building’s total revenue for this period. Demand for our observatory is highly dependent on domestic and overseas tourists. In addition, competition from other new and existing observatories could have a negative impact on revenues from our observatory operations which could have a material adverse effect on our results of operations, financial condition and ability to make distributions to our securityholders. Adverse impacts on domestic travel and changes in foreign currency exchange rates may also decrease demand in the future, which could have a material adverse effect on our results of operations, financial condition and ability to make distributions to our securityholders.
We may be unable to renew leases, lease vacant space or re-lease space on favorable terms or at all as leases expire, which could materially and adversely affect our financial condition, results of operations and cash flow.
As of
December 31, 2016
, we had approximately
1.0 million
rentable square feet of vacant space (excluding leases signed but not yet commenced). In addition, leases representing
7.0%
and
8.1%
of the square footage of the properties in our portfolio will expire in 2017 and 2018, respectively (including month to month leases). We cannot assure you that expiring leases will be renewed or that our properties will be re-leased at net effective rental rates equal to or above the current average net effective rental rates. Above-market rental rates at some of the properties in our portfolio may force us to renew some expiring leases or re-lease properties at lower rates. If the rental rates of our properties decrease, our existing tenants do not renew their leases or we do not re-lease a significant portion of our available space and space for which leases will expire, our financial condition, results of operations, cash flow, per share/unit trading price of our Class A common stock and our traded OP units and our ability to satisfy our principal and interest obligations and to make distributions to our securityholders would be materially and adversely affected.
The actual rents we receive for the properties in our portfolio may be less than our asking rents, and we may experience a decline in realized rental rates from time to time, which could materially and adversely affect our financial condition, results of operations and cash flow.
As a result of various factors, including competitive pricing pressure in our markets, a general economic downturn and the desirability of our properties compared to other properties in our markets, we may be unable to realize our asking rents
12
across the properties in our portfolio. In addition, the degree of discrepancy between our asking rents and the actual rents we are able to obtain may vary both from property to property and among different leased spaces within a single property. If we are unable to obtain sufficient rental rates across our portfolio, then our ability to generate cash flow growth will be negatively impacted. In addition, depending on market rental rates at any given time as compared to expiring leases in our portfolio, from time to time rental rates for expiring leases may be higher than starting rental rates for new leases.
We are exposed to risks associated with property redevelopment and development that could materially and adversely affect our financial condition and results of operations.
We have engaged, and continue to engage, in development and redevelopment activities with respect to our Manhattan office properties. In addition, we own entitled land at the Stamford Transportation Center in Stamford, Connecticut that can support the development of an approximately 380,000 rentable square foot office building and garage. To the extent that we continue to engage in development and redevelopment activities, we will be subject to certain risks, including, without limitation:
|
•
|
the availability and pricing of financing on favorable terms or at all;
|
|
•
|
the availability and timely receipt of zoning and other regulatory approvals;
|
|
•
|
the potential for the fluctuation of occupancy rates and rents at properties due to a number of factors, including market and economic conditions, which may result in our investment not being profitable;
|
|
•
|
start up, repositioning and redevelopment costs may be higher than anticipated;
|
|
•
|
the cost and timely completion of construction (including risks beyond our control, such as weather or labor conditions, or material shortages);
|
|
•
|
the potential that we may fail to recover expenses already incurred if we abandon development or redevelopment opportunities after we begin to explore them;
|
|
•
|
the potential that we may expend funds on and devote management time to projects which we do not complete;
|
|
•
|
the inability to complete construction and leasing of a property on schedule, resulting in increased debt service expense and construction or redevelopment costs; and
|
|
•
|
the possibility that properties will be leased at below expected rental rates.
|
These risks could result in substantial unanticipated delays or expenses and, under certain circumstances, could prevent the initiation of development and redevelopment activities or the completion of development and redevelopment activities once undertaken, any of which could have an adverse effect on our financial condition, results of operations, cash flow, per share/unit trading price of our Class A common stock and our traded OP units and ability to satisfy our principal and interest obligations and to make distributions to our securityholders.
We may be required to make rent or other concessions and/or significant capital expenditures to improve our properties in order to retain and attract tenants, which could materially and adversely affect us, including our financial condition, results of operations and cash flow
.
To the extent there are adverse economic conditions in the real estate market and demand for office space decreases, upon expiration of leases at our properties and with respect to our current vacant space, we will be required to increase rent or other concessions to tenants, accommodate increased requests for renovations, build-to-suit remodeling and other improvements or provide additional services to our tenants. In addition, eight of our existing properties are pre-war office properties, which may require more frequent and costly maintenance to retain existing tenants or attract new tenants than newer properties. As a result, we would have to make significant capital or other expenditures in order to retain tenants whose leases expire and to attract new tenants in sufficient numbers. Additionally, we may need to raise capital to make such expenditures. If we are unable to do so or capital is otherwise unavailable, we may be unable to make the required expenditures. This could result in non-renewals by tenants upon expiration of their leases and our vacant space remaining untenanted, which could materially and adversely affect our financial condition, results of operations, cash flow and per share/unit trading price of our Class A common stock and our traded OP units. As of
December 31, 2016
, we had approximately
1.0 million
rentable square feet of vacant space (excluding leases signed but not yet commenced), and leases representing
7.0%
and
8.1%
of the square footage of the properties in our portfolio will expire in the in 2017 and 2018, respectively (including month to month leases).
We depend on significant tenants in our office portfolio, including Global Brands Group, Coty, Inc., LinkedIn, Sephora and PVH Corp., which together represented approximately 16.3% of our total portfolio’s annualized rent as of
December 31, 2016
.
As of
December 31, 2016
, our five largest tenants together represented 16.3% of our total portfolio’s annualized rent. Our largest tenant is Global Brands Group. As of
December 31, 2016
, Global Brands Group leased an aggregate of
0.7 million
rentable square feet of office space at three of our office properties, representing approximately
6.8%
of the total rentable square feet and approximately
6.2%
of the annualized rent in our portfolio. Our rental revenue depends on entering into leases with and collecting rents from tenants. General and regional economic conditions, such as the current challenging economic climate described above, may adversely affect our major tenants and potential tenants in our markets. Our major tenants may experience a material business downturn, weakening their financial condition and potentially resulting in their failure to make
13
timely rental payments and/or a default under their leases. In many cases, we have made substantial up front investments in the applicable leases, through tenant improvement allowances and other concessions, as well as typical transaction costs (including professional fees and commissions) that we may not be able to recover. In the event of any tenant default, we may experience delays in enforcing our rights as landlord and may incur substantial costs in protecting our investment.
The bankruptcy or insolvency of a major tenant also may adversely affect the income produced by our properties. If any tenant becomes a debtor in a case under the United States Bankruptcy Code of 1978, as amended, we cannot evict the tenant solely because of the bankruptcy. In addition, the bankruptcy court might authorize the tenant to reject and terminate their lease with us. The bankruptcy of a tenant or lease guarantor could delay our efforts to collect past due balances under the relevant leases, and could ultimately preclude collection of these sums. If a lease is rejected by a tenant in bankruptcy, we would have only a general unsecured claim for damages. Any unsecured claim we hold may be paid only to the extent that funds are available and only in the same percentage as is paid to all other holders of unsecured claims, and there are restrictions under bankruptcy laws that limit the amount of the claim we can make if a lease is rejected.
Our revenue and cash flow could be materially adversely affected if any of our significant tenants were to become bankrupt or insolvent, or suffer a downturn in their business, default under their leases or fail to renew their leases at all or renew on terms less favorable to us than their current terms.
Competition may impede our ability to attract or retain tenants or re-let space, which could materially and adversely affect our results of operations and cash flow.
The leasing of real estate in the greater New York metropolitan area is highly competitive. The principal means of competition are rent charged, location, services provided and the nature and condition of the premises to be leased. We directly compete with all lessors and developers of similar space in the areas in which our properties are located as well as properties in other submarkets. Demand for retail space may be impacted by the bankruptcy of retail companies, a general trend toward consolidation in the retail industry, and the impact of internet retailing which could adversely affect the ability of our company to attract and retain tenants. In addition, retailers at our properties face increasing competition from outlet malls, discount shopping clubs, electronic commerce, direct mail and telemarketing, which could (i) reduce rents payable to us, (ii) reduce our ability to attract and retain tenants at our properties and (iii) lead to increased vacancy rates at our properties, any of which could materially and adversely affect us.
Our office properties are concentrated in highly developed areas of midtown Manhattan and densely populated metropolitan communities in Fairfield County and Westchester County. Manhattan is the largest office market in the United States. The number of competitive office properties in the markets in which our properties are located (which may be newer or better located than our properties) could have a material adverse effect on our ability to lease office space at our properties, and on the effective rents we are able to charge.
If our tenants are unable to secure financing necessary to continue to operate their businesses and pay us rent, we could be materially and adversely affected.
Many of our tenants rely on external sources of financing to operate their businesses. If our tenants are unable to secure financing necessary to continue to operate their businesses, they may be unable to meet their rent obligations or be forced to declare bankruptcy and reject their leases, which could materially and adversely affect us.
Our dependence on smaller businesses to rent our office space could materially and adversely affect our cash flow and results of operations.
The majority of the tenants in our properties (measured by number of tenants as opposed to aggregate square footage) are smaller businesses that generally do not have the financial strength of larger corporate tenants. Smaller companies generally experience a higher rate of failure than large businesses. There is a current risk with these companies of a higher rate of tenant defaults, turnover and bankruptcies, which could materially and adversely affect our distributable cash flow and results of operations.
Our dependence on rental income may materially and adversely affect our cash flow and results of operations.
A substantial portion of our income is derived from rental income from real property. As a result, our performance depends on our ability to collect rent from tenants. Our income and funds for distribution would be negatively affected if a significant number of our tenants, or any of our major tenants (as discussed in more detail below):
|
•
|
delay lease commencements;
|
|
•
|
decline to extend or renew leases upon expiration;
|
|
•
|
fail to make rental payments when due; or
|
|
•
|
declare bankruptcy.
|
Any of these actions could result in the termination of the tenants’ leases and the loss of rental income attributable to the terminated leases. In these events, we cannot be sure that any tenant whose lease expires will renew that lease or that we will be able to re-lease space on economically advantageous terms or at all. The loss of rental revenues from a number of our
14
tenants and our inability to replace such tenants may adversely affect our profitability, our ability to meet debt and other financial obligations and our ability to make distributions to our securityholders.
The broadcasting operations at the Empire State Building are not traditional real estate operations, and competition and changes in the broadcasting of signals over air may subject us to additional risks, which could materially and adversely affect us.
The Empire State Building and its broadcasting mast provides radio and data communications services and supports delivery of broadcasting signals to cable and satellite systems and television and radio receivers. We license the use of the broadcasting mast to third party television and radio broadcasters. During the year ended
December 31, 2016
, we derived approximately $20.9 million of revenue (excluding tenant reimbursement income) from the Empire State Building’s broadcasting licenses and related leased space, representing approximately 6.8% of the Empire State Building’s total revenue for this period. Competition from other broadcasting operations could have a negative impact on revenues from our broadcasting operations, and require lease renewal proposals which could yield reduced revenue, higher operating expenses and/ or higher capital expenditures. Our broadcast television and radio licensees also face a range of competition from advances in technologies and alternative methods of content delivery in their respective industries, as well as from changes in consumer behavior driven by new technologies and methods of content delivery, which may reduce the demand for over-the-air broadcast licenses in the future. New government regulations affecting broadcasters, including the implementation of the Federal Communications Commission's (the "FCC") National Broadband Plan, (the "FCC Plan"), also might materially and adversely affect our results of operations by reducing the demand for broadcast licenses. Among other things, the FCC Plan urges Congress to make more spectrum available for wireless broadband service providers by encouraging over-the-air broadcast licensees to relinquish spectrum through a voluntary auction process, which raises many issues that could impact the broadcast industry. At this time we cannot predict whether Congress or the FCC will adopt or implement any of the FCC Plan’s recommendations or the rule changes as proposed, or how any such actions might affect our broadcasting operations. Any of these risks might materially and adversely affect us.
We may not be able to control our operating costs, or our expenses may remain constant or increase, even if income from our properties decreases, causing our results of operations to be adversely affected.
Our financial results depend substantially on leasing space in our properties to tenants on terms favorable to us. Costs associated with real estate investment, such as real estate taxes, insurance and maintenance costs, generally are not reduced even when a property is not fully occupied, rental rates decrease or other circumstances cause a reduction in income from the property. As a result, cash flow from the operations of our properties may be reduced if a tenant does not pay its rent or we are unable to rent our properties on favorable terms. Under those circumstances, we might not be able to enforce our rights as landlord without delays and may incur substantial legal costs. The terms of our leases may also limit our ability to charge our tenants for all or a portion of these expenses. Additionally, new properties that we may acquire or redevelop may not produce significant revenue immediately, and the cash flow from existing operations may be insufficient to pay the operating expenses and principal and interest on debt associated with such properties until they are fully leased.
Our breach of or the expiration of our ground leases could materially and adversely affect our results of operations.
Our interest in three of our commercial office properties, 1350 Broadway, 111 West 33rd Street and 1400 Broadway are long-term leaseholds of the land and the improvements, rather than a fee interest in the land and the improvements. If we are found to be in breach of these ground leases, we could lose the right to use the properties. In addition, unless we purchase the underlying fee interest in these properties or extend the terms of our leases for these properties before expiration on terms significantly comparable to our current leases, we will lose our right to operate these properties and our leasehold interests in these properties upon expiration of the leases or we will continue to operate them at much lower profitability, which would significantly adversely affect our results of operations. In addition, if we are perceived to have breached the terms of these leases, the fee owner may initiate proceedings to terminate the leases. The long-term leases, including unilateral extension rights available to us, expire, on July 31, 2050 for 1350 Broadway, December 31, 2063 for 1400 Broadway and June 10, 2077 for 111 West 33rd Street.
Pursuant to the ground leases, we, as tenant under the ground leases, perform the functions traditionally performed by owners, as landlords, with respect to our subtenants. In addition to collecting rent from our subtenants, we also maintain the properties and pay expenses relating to the properties. We do not have a right, pursuant to the terms of our leases or otherwise, to acquire the fee interests in these properties.
We will not recognize any increase in the value of the land or improvements subject to our ground leases, and we may only receive a portion of compensation paid in any eminent domain proceeding with respect to these properties, which could materially and adversely affect us.
We have no economic interest in the land or improvements at the expiration of our ground leases at 1350 Broadway, 111 West 33
rd
Street and 1400 Broadway, and therefore we will not share in any increase in value of the land or improvements beyond the term of our ground leases, notwithstanding our capital outlay to purchase our interest in the properties.
15
Furthermore, if the state or federal government seizes the properties subject to the ground leases under its eminent domain power, we may only be entitled to a portion of any compensation awarded for the seizure. In addition, if the value of the properties has increased, it may be more expensive for us to renew our ground leases.
We may be unable to identify and successfully complete acquisitions and even if acquisitions are identified and completed, we may fail to operate successfully acquired properties, which could materially and adversely affect us and impede our growth.
Our current portfolio consists entirely of properties that we acquired (or received the right to acquire) in connection with the formation transactions. Our ability to identify and acquire additional properties on favorable terms and successfully operate or redevelop them may be exposed to the following significant risks:
|
•
|
even if we enter into agreements for the acquisition of properties, these agreements are subject to customary conditions to closing, including completion of due diligence investigations to our satisfaction and other conditions that are not within our control, which may not be satisfied, and we may be unable to complete an acquisition after making a non-refundable deposit and incurring certain other acquisition-related costs;
|
|
•
|
we may be unable to finance the acquisition on favorable terms in the time period we desire, or at all;
|
|
•
|
we may spend more than budgeted to make necessary improvements or redevelopments to acquired properties;
|
|
•
|
we may not be able to obtain adequate insurance coverage for new properties;
|
|
•
|
acquired properties may be located in new markets where we may face risks associated with a lack of market knowledge or understanding of the local economy, lack of business relationships in the area and unfamiliarity with local governmental and permitting procedures;
|
|
•
|
we may be unable to integrate quickly and efficiently new acquisitions, particularly acquisitions of portfolios of properties, into our existing operations, and as a result our results of operations and financial condition could be adversely affected;
|
|
•
|
market conditions may result in higher than expected vacancy rates and lower than expected rental rates; and
|
|
•
|
we may incur significant costs and divert management attention in connection with evaluating and negotiating potential acquisitions, including ones that we are subsequently unable to complete.
|
Any delay or failure on our part to identify, negotiate, finance and consummate such acquisitions in a timely manner and on favorable terms, or operate acquired properties to meet our financial expectations, could impede our growth and adversely affect our financial condition, results of operations, cash flow and per share/unit trading price of our Class A common stock and traded OP units.
Competition for acquisitions may reduce the number of acquisition opportunities available to us and increase the costs of those acquisitions, which may impede our growth.
We plan to acquire properties as we are presented with attractive opportunities. We may face significant competition for acquisition opportunities in the greater New York metropolitan area with other investors, particularly private investors who can incur more leverage, and this competition may adversely affect us by subjecting us to the following risks:
|
•
|
an inability to acquire a desired property because of competition from other well-capitalized real estate investors, including publicly traded and privately held REITs, private real estate funds, domestic and foreign financial institutions, life insurance companies, sovereign wealth funds, pension trusts, commercial developers, partnerships and individual investors; and
|
|
•
|
an increase in the purchase price for such acquisition property, in the event we are able to acquire such desired property.
|
The significant competition for acquisitions of commercial office and retail properties in the greater New York metropolitan area may impede our growth.
Acquired properties may expose us to unknown liability, which could adversely affect our results of operations, cash flow and the market value of our securities.
We may acquire properties subject to liabilities and without any recourse, or with only limited recourse, against the prior owners or other third parties with respect to unknown liabilities. As a result, if a liability were asserted against us based upon ownership of those properties, we might have to pay substantial sums to settle or contest it, which could adversely affect our results of operations, cash flow and the market value of our securities. Unknown liabilities with respect to acquired properties might include:
|
•
|
liabilities for clean-up of undisclosed environmental contamination;
|
|
•
|
claims by tenants, vendors or other persons against the former owners of the properties;
|
|
•
|
liabilities incurred in the ordinary course of business; and
|
16
|
•
|
claims for indemnification by general partners, directors, officers and others indemnified by the former owners of the properties.
|
We may acquire properties or portfolios of properties through tax deferred contribution transactions, which could result in securityholder dilution and limit our ability to sell such assets.
In the future we may acquire properties or portfolios of properties through tax deferred contribution transactions in exchange for partnership interests in our operating partnership, which may result in stockholder/unitholder dilution. This acquisition structure may have the effect of, among other things, reducing the amount of tax depreciation we could deduct over the tax life of the acquired properties, and may require that we agree to protect the contributors’ ability to defer recognition of taxable gain through restrictions on our ability to dispose of the acquired properties and/or the allocation of partnership debt to the contributors to maintain their tax bases. These restrictions could limit our ability to sell an asset at a time, or on terms, that would be favorable absent such restrictions.
Should we decide at some point in the future to expand into new markets, we may not be successful, which could adversely affect our financial condition, result of operations, cash flow and trading price of our Class A common stock and traded OP units.
If opportunities arise, we may explore acquisitions of properties in new markets. Each of the risks applicable to our ability to acquire and integrate successfully and operate properties in our current markets is also applicable to our ability to acquire and integrate successfully and operate properties in new markets. In addition to these risks, we will not possess the same level of familiarity with the dynamics and market conditions of any new markets that we may enter, which could adversely affect the results of our expansion into those markets, and we may be unable to build a significant market share or achieve a desired return on our investments in new markets. If we are unsuccessful in expanding into new markets, it could adversely affect our financial condition, results of operations, cash flow, trading price of our Class A common stock and traded OP units and ability to satisfy our principal and interest obligations and to make distributions to our securityholders.
Our growth depends on external sources of capital that are outside of our control, which may affect our ability to seize strategic opportunities, satisfy debt obligations and make distributions to our securityholders.
In order to qualify as a REIT, we must distribute to our securityholders, on an annual basis, at least 90% of our REIT taxable income, determined without regard to the deduction for distributions paid and excluding net capital gains. In addition, we will be subject to U.S. federal income tax at regular corporate rates to the extent that we distribute less than 100% of our net taxable income (including net capital gains) and will be subject to a 4% nondeductible excise tax on the amount by which our distributions in any calendar year are less than a minimum amount specified under U.S. federal income tax laws. Because of these distribution requirements, we may not be able to fund future capital needs, including any necessary acquisition financing, from operating cash flow. Consequently, we may need to rely on third-party sources to fund our capital needs. We may not be able to obtain financing on favorable terms, in the time period we desire, or at all. Any additional debt we incur will increase our leverage. Our access to third-party sources of capital depends, in part, on:
|
•
|
general market conditions;
|
|
•
|
the market’s perception of our growth potential;
|
|
•
|
our current debt levels;
|
|
•
|
our current and expected future earnings;
|
|
•
|
our cash flow and cash distributions; and
|
|
•
|
the market price per share/unit of our Class A common stock
and traded OP units.
|
If we cannot obtain capital from third-party sources, we may not be able to acquire or redevelop properties when strategic opportunities exist, satisfy our principal and interest obligations or make the cash distributions to our securityholders necessary to maintain our qualification as a REIT.
If we are unable to sell, dispose of or refinance one or more properties in the future, we may be unable to realize our investment objectives, and our business may be adversely affected.
The real estate investments made, and to be made, by us are relatively difficult to sell quickly. Return of capital and realization of gains from an investment generally will occur upon disposition or refinancing of the underlying property. In addition, the Internal Revenue Code of 1986, as amended (the "Code"), imposes restrictions on the ability of a REIT to dispose of properties that are not applicable to other types of real estate companies. We may be unable to realize our investment objectives by sale, other disposition or refinancing at attractive prices within any given period of time or may otherwise be
17
unable to complete any exit strategy. In particular, these risks could arise from weakness in or even the lack of an established market for a property, changes in the financial condition or prospects of prospective purchasers, changes in national or international economic conditions and changes in laws, regulations or fiscal policies of jurisdictions in which our properties are located.
Our outstanding indebtedness, including preferred units, reduces cash available for distribution and may expose us to the risk of default under our debt obligations and may include covenants that restrict
our financial and operational flexibility and
our ability to make distributions.
As of
December 31, 2016
, we had total debt outstanding of approximately
$1.6 billion
. As of
December 31, 2016
, we had approximately
$336.0 million
of debt maturing in 2017 and
$262.2 million
maturing in 2018. As of
December 31, 2016
, we had 13 mortgage loans outstanding secured by 11 of our properties. As of
December 31, 2016
, these loans had an aggregate estimated principal balance at maturity of approximately
$752.8 million
with maturity dates ranging from 2017 through 2030. See Note 5 to our consolidated financial statements for required payments of our indebtedness. We may incur significant additional debt to finance future acquisition and redevelopment activities. Payments of principal and interest on borrowings may leave us with insufficient cash resources to operate our properties or to pay the distributions currently contemplated or necessary to qualify as a REIT. Our level of debt and the limitations imposed on us by our loan documents could have significant adverse consequences, including the following:
|
•
|
our cash flow may be insufficient to meet our required principal and interest payments;
|
|
•
|
we may be unable to borrow additional funds as needed or on favorable terms;
|
|
•
|
we may be unable to refinance our indebtedness at maturity or the refinancing terms may be less favorable than the terms of our original indebtedness;
|
|
•
|
to the extent we borrow debt that bears interest at variable rates, increases in interest rates could materially increase our interest expense;
|
|
•
|
we may be forced to dispose of one or more of our properties, possibly on disadvantageous terms;
|
|
•
|
we may default on our obligations or violate restrictive covenants, in which case the lenders or mortgagees may accelerate our debt obligations, foreclose on the properties that secure their loans and/or take control of our properties that secure their loans and collect rents and other property income;
|
|
•
|
we may violate restrictive covenants in our loan documents, which would entitle the lenders to accelerate our debt obligations or reduce our ability to make, or prohibit us from making, distributions; and
|
|
•
|
our default under any one of our mortgage loans with cross default provisions could result in a default on other indebtedness.
|
In addition, o
ur unsecured revolving credit facility, our Series A, Series B and Series C senior notes and our senior unsecured term loan facility requires us to maintain designated ratios, including but not limited to, total debt-to-assets, secured debt-to-assets, adjusted EBITDA to consolidated fixed charges, net operating income from unencumbered properties to interest expense on unsecured debt, unsecured debt to unencumbered assets and secured recourse debt-to-assets, and contains a minimum tangible net worth requirement. Our unsecured revolving credit facility, our Series A, Series B and Series C senior notes and our senior unsecured term loan facility do not generally contain restrictions on the payment of dividends or other distributions.
The indenture governing our outstanding senior unsecured notes
, our Series A, Series B and Series C senior notes and our senior unsecured term loan facility
do not contain financial or operational covenants or restrictions on the payments of dividends; however, upon the occurrence of fundamental changes described in the indenture, holders of our outstanding senior unsecured notes
, our Series A, Series B and Series C senior notes and our senior unsecured term loan facility
may require our operating partnership to repurchase for cash all or part of their notes at a repurchase price equal to 100% of the principal amount of the notes to be repurchased, plus accrued and unpaid interest, subject to certain conditions. Further, upon the occurrence of any make-whole fundamental change described in the indenture, the exchange rate for holders who exchange their notes in connection with any such make-whole fundamental change may be increased. See "Item 7. Management's Discussion and Analysis of Financial Condition and Results of Operations - Liquidity and Capital Resources."
The provisions in the partnership agreement of our operating partnership that govern the preferred units may restrict our ability to pay dividends if we fail to pay the cumulative preferential cash distributions thereon. See "Item 7. Management's Discussion and Analysis of Financial Condition and Results of Operations - Private Perpetual Preferred Units.”
If any one of these events were to occur, our financial condition, results of operations, cash flow, per share/unit trading price of our Class A common stock and traded OP units and our ability to satisfy our principal, interest and preferred unit distribution obligations and to make distributions to our securityholders could be adversely affected. In addition, in connection with our debt agreements we may enter into lockbox and cash management agreements pursuant to which substantially all of the income generated by our properties will be deposited directly into lockbox accounts and then swept into cash management
18
accounts for the benefit of our various lenders and from which cash will be distributed to us only after funding of improvement, leasing and maintenance reserves and the payment of principal and interest on our debt, insurance, taxes, operating expenses and extraordinary capital expenditures and leasing expenses. As a result, we may be forced to borrow additional funds in order to make distributions to our securityholders (including, potentially, to make distributions necessary to allow us to qualify as a REIT). See "Item 7. Management's Discussion and Analysis of Financial Condition and Results of Operations - Liquidity and Capital Resources."
Our degree of leverage and the lack of a limitation on the amount of indebtedness we may incur could materially and adversely affect us.
Our organizational documents do not contain any limitation on the amount of indebtedness we may incur. We consider factors other than debt-to-EBITDA in making decisions regarding the incurrence of indebtedness, such as the purchase price of properties to be acquired with debt financing, the estimated market value of our properties upon refinancing and the ability of particular properties and our business as a whole to generate cash flow to cover expected debt service.
Our degree of leverage could affect our ability to obtain additional financing for working capital, capital expenditures, acquisitions, development or other general corporate purposes. Our degree of leverage could also make us more vulnerable to a downturn in business or the economy generally. If we become more leveraged in the future, the resulting increase in debt service requirements could cause us to default on our obligations, which could materially and adversely affect us.
Mortgage debt obligations expose us to the possibility of foreclosure, which could result in the loss of our investment in a property or group of properties subject to mortgage debt.
Incurring mortgage and other secured debt obligations increases our risk of property losses because defaults on indebtedness secured by properties may result in foreclosure actions initiated by lenders and ultimately our loss of the property securing any loans for which we are in default. Any foreclosure on a mortgaged property or group of properties could adversely affect the overall value of our portfolio of properties. For tax purposes, a foreclosure of any of our properties that is subject to a nonrecourse mortgage loan would be treated as a sale of the property for a purchase price equal to the outstanding balance of the debt secured by the mortgage. If the outstanding balance of the debt secured by the mortgage exceeds our tax basis in the property, we would recognize taxable income on foreclosure, but would not receive any cash proceeds, which could hinder our ability to meet the distribution requirements applicable to REITs under the Code. Foreclosures could also trigger our tax indemnification obligations under the terms of our agreements with certain continuing investors with respect to sales of certain properties, and obligate us to make certain levels of indebtedness available for them to guarantee which.
High mortgage rates and/or unavailability of mortgage debt may make it difficult for us to finance or refinance properties, which could reduce the number of properties we can acquire, our net income and the amount of cash distributions we can make.
If mortgage debt is unavailable at reasonable rates, we may not be able to finance the purchase of properties. If we place mortgage debt on properties, we may be unable to refinance the properties when the loans become due, or to refinance on favorable terms. If interest rates are higher when we refinance our properties, our income could be reduced. If any of these events occur, our cash flow could be reduced. This, in turn, could reduce cash available for distribution to our securityholders and may hinder our ability to raise more capital by issuing more stock or by borrowing more money. In addition, to the extent we are unable to refinance the properties when the loans become due, we will have fewer debt guarantee opportunities available to offer under our tax protection agreement. If we are unable to offer certain guarantee opportunities to the protected parties under the tax protection agreement, or otherwise are unable to allocate sufficient liabilities of our operating partnership to those parties, it could trigger an indemnification obligation of our company under the tax protection agreement.
Some of our financing arrangements involve balloon payment obligations, which may adversely affect our ability to make distributions.
As some of our financing arrangements require us to make a lump-sum or "balloon" payment at maturity. Our ability to make a balloon payment at maturity is uncertain and may depend upon our ability to obtain additional financing or our ability to sell the property. At the time the balloon payment is due, we may or may not be able to refinance the existing financing on terms as favorable as the original loan or sell the property at a price sufficient to make the balloon payment. The effect of a refinancing or sale could affect the rate of return to securityholders and the projected time of disposition of our
19
assets. In addition, payments of principal and interest made to service our debts may leave us with insufficient cash to make distributions necessary to meet the distribution requirements applicable to REITs under the Code.
Our tax protection agreements could limit our ability either to sell certain properties or to engage in a strategic transaction, or to reduce our level of indebtedness, which could materially and adversely affect us.
In connection with the formation transactions, we entered into a tax protection agreement with Anthony E. Malkin and Peter L. Malkin pursuant to which we have agreed to indemnify the Malkin Group and one additional third party investor in Metro Center (who was one of the original landowners and was involved in the development of the property) against certain tax liabilities if those tax liabilities result from (i) the operating partnership’s sale, transfer, conveyance, or other taxable disposition of four specified properties (First Stamford Place, Metro Center, 10 Bank Street and 1542 Third Avenue) acquired by the operating partnership in 2013 for a period of 12 years with respect to First Stamford Place and for the later of (x) October 2021 or (y) the death of both Peter L. Malkin and Isabel W. Malkin who are 83 and 80 years old, respectively, for the three other properties, (ii) the operating partnership failing to maintain until maturity the indebtedness secured by those properties or failing to use commercially reasonable efforts to refinance such indebtedness upon maturity in an amount equal to the principal balance of such indebtedness, or, if the operating partnership is unable to refinance such indebtedness at its current principal amount, at the highest principal amount possible, or (iii) the operating partnership failing to make available to any of these continuing investors the opportunity to guarantee, or otherwise bear the risk of loss, for U.S. federal income tax purposes, of their allocable share of $160 million of aggregate indebtedness meeting certain requirements, until such continuing investor owns less than the aggregate number of operating partnership units and shares of common stock equal to 50% of the aggregate number of such units and shares such continuing investor received in the formation transactions. In addition, in connection with our sale of a 9.9% fully diluted interest in our Company to Q REIT Holding LLC, a Qatar Financial Centre limited liability company and a wholly owned subsidiary of the Qatar Investment Authority, a governmental authority of the State of Qatar ("QIA") in August 2016, we agreed, subject to certain minimum thresholds and conditions, to indemnify QIA for certain applicable U.S. federal and state taxes payable by QIA in connection with any dividends we pay that are attributable to capital gains from the sale or exchange of any U.S. real property interests. If we were to trigger our tax indemnification obligations under these agreements, we would be required to pay damages for the resulting tax consequences to the Malkin Group, the additional third party investor in Metro Center or QIA, as applicable, and we have acknowledged that a calculation of damages with respect to the tax protection agreement with the Malkin Group and the additional third party investor in Metro Center will not be based on the time value of money or the time remaining within the restricted period. Moreover, these obligations may restrict our ability to engage in a strategic transaction, require us to maintain more or different indebtedness than we would otherwise require for our business, and/or inhibit our selling or disposing of a property that might otherwise be in the best interest of the securityholders to do so.
We face risks which would arise if any of our tenants were designated “Prohibited Persons” by the Office of Foreign Assets Control.
Pursuant to Executive Order 13224 and other laws, the Office of Foreign Assets Control of the United States Department of the Treasury (“OFAC”) maintains a list of persons designated as terrorists or who are otherwise blocked or banned (“Prohibited Persons”). OFAC regulations and other laws prohibit us from conducting business or engaging in transactions with Prohibited Persons (the “OFAC Requirements”). We have established a compliance program whereby tenants are checked against the OFAC list of Prohibited Persons prior to entering into any lease. Our leases and other agreements, in general, require the other party to comply with OFAC Requirements. If a tenant or other party with whom we contract is placed on the OFAC list or is otherwise a party with which we are prohibited from doing business, we may be required by the OFAC Requirements to terminate the lease or other agreement. Any such termination could result in a loss of revenue or otherwise negatively affect our financial results and cash flows.
The continuing threat of a terrorist event may materially and adversely affect our properties, their value and our ability to generate cash flow.
There may be a decrease in demand for space in Manhattan and the greater New York metropolitan area because it is considered at risk for a future terrorist event, and this decrease may reduce our revenues from property rentals. In the aftermath of a terrorist event, tenants in Manhattan and the greater New York metropolitan area may choose to relocate their businesses to less populated, lower-profile areas of the United States that are not as likely to be targets of future terrorist activity. This in turn could trigger a decrease in the demand for space in Manhattan and the greater New York metropolitan area, which could increase vacancies in our properties and force us to lease our properties on less favorable terms. Further, certain of our properties, including the Empire State Building, may be considered to be susceptible to increased risks of a future terrorist event due to the high-profile nature of the property. In addition, a terrorist event could cause insurance premiums at certain of
20
our properties to increase significantly. As a result, the value of our properties and the level of our revenues could materially decline.
Potential losses, such as those from adverse weather conditions, natural disasters, possible rise in ocean levels, terrorist events and title claims, may not be fully covered by our insurance policies, and such losses could materially and adversely affect us.
Our business operations are susceptible to, and could be significantly affected by, adverse weather conditions, terrorist events, possible rise in ocean levels and natural disasters that could cause significant damage to the properties in our portfolio. Our insurance may not be adequate to cover business interruption or losses resulting from such events. In addition, our insurance policies include substantial self-insurance portions and significant deductibles and co-payments for such events, and hurricanes in the United States have affected the availability and price of such insurance. As a result, we may incur significant costs in the event of adverse weather conditions, terrorist events and natural disasters. We may discontinue certain insurance coverage on some or all of our properties in the future if the cost of premiums for any of these policies in our judgment exceeds the value of the coverage discounted for the risk of loss. See "Item 1. Business - Insurance."
Furthermore, we do not carry insurance for certain losses, including, but not limited to, losses caused by war. In addition, while our title insurance policies insure for the current aggregate market value of our portfolio, we do not intend to increase our title insurance policies as the market value of our portfolio increases. As a result, we may not have sufficient coverage against all losses that we may experience, including from adverse title claims.
If we experience a loss that is uninsured or which exceeds our policy limits, we could incur significant costs and lose the capital invested in the damaged properties as well as the anticipated future cash flows from those properties. In addition, if the damaged properties are subject to recourse indebtedness, we would continue to be liable for the indebtedness, even if these properties were irreparably damaged.
In addition, certain of our properties could not be rebuilt to their existing height or size at their existing location under current land-use laws and policies. In the event that we experience a substantial or comprehensive loss of one of our properties, we may not be able to rebuild such property to its existing specifications and otherwise may have to upgrade such property to meet current code requirements.
Our debt instruments, consisting of mortgage loans secured by our properties (which are generally non-recourse to us), ground leases, our unsecured term loan and our unsecured revolving credit facility, contain customary covenants requiring us to maintain insurance, including terrorism insurance. While we do not believe it will be likely, there can be no assurance that the lenders or ground lessors under these instruments will not take the position that a total or partial exclusion from “all-risk” insurance coverage for losses due to terrorist acts is a breach of these debt and ground lease instruments that allows the lenders or ground lessors to declare an event of default and accelerate repayment of debt or recapture of ground lease positions for those properties in our portfolio which are not insured against terrorist events. In addition, if lenders insist on full coverage for these risks and prevail in asserting that we are required to maintain such coverage, it could result in substantially higher insurance premiums.
Certain mortgages on our properties contain requirements concerning the financial ratings of the insurers who provide policies covering the property. We provide the lenders on a regular basis with the identity of the insurance companies in our insurance programs. While the ratings of our insurers currently satisfy the rating requirements in some of our loan agreements, in the future, we may be unable to obtain insurance with insurers which satisfy the rating requirements which could give rise to an event of default under such loan agreements. Additionally, in the future our ability to obtain debt financing secured by individual properties, or the terms of such financing, may be adversely affected if lenders generally insist on ratings for insurers which are difficult to obtain or which result in a commercially unreasonable premium.
We may become subject to liability relating to environmental and health and safety matters, which could have a material and adverse effect on us.
Under various federal, state and/or local laws, ordinances and regulations, as a current or former owner or operator of real property, we may be liable for costs and damages resulting from the presence or release of hazardous substances, waste, or petroleum products at, on, in, under or from such property, including costs for investigation or remediation, natural resource damages, or third party liability for personal injury or property damage. These laws often impose liability without regard to whether the owner or operator knew of, or was responsible for, the presence or release of such materials, and the liability may
21
be joint and several. Some of our properties have been or may be impacted by contamination arising from current or prior uses of the property or adjacent properties for commercial, industrial or other purposes. Such contamination may arise from spills of petroleum or hazardous substances or releases from tanks used to store such materials. We also may be liable for the costs of remediating contamination at off-site disposal or treatment facilities when we arrange for disposal or treatment of hazardous substances at such facilities, without regard to whether we comply with environmental laws in doing so. The presence of contamination or the failure to remediate contamination on our properties may adversely affect our ability to attract and/or retain tenants and our ability to develop or sell or borrow against those properties. In addition to potential liability for cleanup costs, private plaintiffs may bring claims for personal injury, property damage or for similar reasons. Environmental laws also may create liens on contaminated sites in favor of the government for damages and costs it incurs to address such contamination. Moreover, if contamination is discovered on our properties, environmental laws may impose restrictions on the manner in which that property may be used or how businesses may be operated on that property. For example, our property at 69-97 Main Street is subject to an Environmental Land Use Restriction that imposes certain restrictions on the use, occupancy and activities of the affected land beneath the property. This restriction may prevent us from conducting certain redevelopment activities at the property, which may adversely affect its resale value and may adversely affect our ability to finance or refinance this property. See “Item 1. Business - Environmental Matters.”
Some of our properties are adjacent to or near other properties used for industrial or commercial purposes or that have contained or currently contain underground storage tanks used to store petroleum products or other hazardous or toxic substances. Releases from these properties could impact our properties. In addition, some of our properties have previously been used by former owners or tenants for commercial or industrial activities, e.g., gas stations and dry cleaners, and a portion of the Metro Tower site is currently used for automobile parking and fueling, that may release petroleum products or other hazardous or toxic substances at such properties or to surrounding properties.
In addition, our properties are subject to various federal, state and local environmental and health and safety laws and regulations. Noncompliance with these environmental and health and safety laws and regulations could subject us or our tenants to liability. These liabilities could affect a tenant’s ability to make rental payments to us. Moreover, changes in laws could increase the potential costs of compliance with such laws and regulations or increase liability for noncompliance. This may result in significant unanticipated expenditures or may otherwise materially and adversely affect our operations, or those of our tenants, which could in turn have a material adverse effect on us.
As the owner or operator of real property, we may also incur liability based on various building conditions. For example, buildings and other structures on properties that we currently own or operate or those we acquire or operate in the future contain, may contain, or may have contained, asbestos-containing material, or ACM. Environmental and health and safety laws require that ACM be properly managed and maintained and may impose fines or penalties on owners, operators or employers for non-compliance with those requirements. These requirements include special precautions, such as removal, abatement or air monitoring, if ACM would be disturbed during maintenance, redevelopment or demolition of a building, potentially resulting in substantial costs. In addition, we may be subject to liability for personal injury or property damage sustained as a result of releases of ACM into the environment.
In addition, our properties may contain or develop harmful mold or suffer from other indoor air quality issues, which could lead to liability for adverse health effects or property damage or costs for remediation. When excessive moisture accumulates in buildings or on building materials, mold growth may occur, particularly if the moisture problem remains undiscovered or is not addressed over a period of time. Some molds may produce airborne toxins or irritants. Indoor air quality issues can also stem from inadequate ventilation, chemical contamination from indoor or outdoor sources, and other biological contaminants such as pollen, viruses and bacteria. Indoor exposure to airborne toxins or irritants above certain levels can be alleged to cause a variety of adverse health effects and symptoms, including allergic or other reactions. As a result, the presence of significant mold or other airborne contaminants at any of our properties could require us to undertake a costly remediation program to contain or remove the mold or other airborne contaminants from the affected property or increase indoor ventilation. In addition, the presence of significant mold or other airborne contaminants could expose us to liability from our tenants, employees of our tenants or others if property damage or personal injury occurs.
We cannot assure you that costs or liabilities incurred as a result of environmental issues will not affect our ability to make distributions to our securityholders or that such costs, liabilities, or other remedial measures will not have a material adverse effect on our financial condition and results of operations.
22
Monetary policy actions by the U.S Federal Reserve could adversely impact our financial condition and our ability to make distributions to our stockholders.
In December 2016, the U.S. Federal Reserve raised the target range for the federal funds rate to a range from 0.50 to 0.75 percent, which followed a similar quarter-point raise in December 2015. These decisions ended the low-interest-rate policy that has been in effect for the last seven years. The targeted federal funds rate increase will likely result in an increase in market interest rates, which may increase our interest expense under our unhedged variable-rate borrowings and the costs of refinancing existing indebtedness or obtaining new debt. In addition, increases in market interest rates may result in a decrease in the value of our real estate and a decrease in the market price of our common stock. Increases in market interest rates may also adversely affect the securities markets generally, which could reduce the market price of our common stock without regard to our operating performance. Any such unfavorable changes to our borrowing costs and stock price could significantly impact our ability to raise new debt and equity capital going forward.
Failure to hedge interest rates effectively could have a material and adverse effect on us.
We may seek to manage our exposure to interest rate volatility by using interest rate hedging arrangements that involve risk, such as the risk that counterparties may fail to honor their obligations under these arrangements, and that these arrangements may not be effective in reducing our exposure to interest rate changes. Moreover, there can be no assurance that our hedging arrangements will qualify for hedge accounting or that our hedging activities will have the desired beneficial impact on our results of operations. Should we desire to terminate a hedging agreement, there could be significant costs and cash requirements involved to fulfill our initial obligation under the hedging agreement. Failure to hedge effectively against interest rate changes may adversely affect our results of operations.
When a hedging agreement is required under the terms of a mortgage loan, it is often a condition that the hedge counterparty maintains a specified credit rating. When there is volatility in the financial markets, there is an increased risk that hedge counterparties could have their credit rating downgraded to a level that would not be acceptable under the loan provisions. If we were unable to renegotiate the credit rating condition with the lender or find an alternative counterparty with acceptable credit rating, we could be in default under the loan and the lender could seize that property through foreclosure.
We may incur significant costs complying with the ADA and similar laws, which could adversely affect our financial condition, results of operations, cash flow and per share/unit trading price of our Class A common stock and traded OP units.
Under the Americans with Disabilities Act of 1990, or the ADA, all public accommodations must meet federal requirements related to access and use by disabled persons. If one or more of the properties in our portfolio is not in compliance with the ADA, we would be required to incur additional costs to bring the property into compliance. Additional federal, state and local laws also may require modifications to our properties, or restrict our ability to renovate our properties. We cannot predict the ultimate cost of compliance with the ADA or other legislation. If we incur substantial costs to comply with the ADA and any other legislation, our financial condition, results of operations, cash flow, per share/unit trading price of our Class A common stock and traded OP units and our ability to satisfy our principal and interest obligations and to make distributions to our securityholders could be adversely affected.
Changes in generally accepted accounting principles could adversely affect the operating results and the reported financial performance of us and our tenants.
Accounting policies and methods are fundamental to how we record and report our financial condition and results of operations. Uncertainties posed by various initiatives of accounting standard-setting by the Financial Accounting Standards Board and the Securities and Exchange Commission, which create and interpret applicable accounting standards for U.S. companies, may change the financial accounting and reporting standards or their interpretation and application of these standards that govern the preparation of our financial statements. Proposed changes include, but are not limited to, changes in lease accounting and the adoption of accounting standards likely to require the increased use of “fair-value” measures.
These changes could have a material impact on our reported financial condition and results of operations. In some cases, we could be required to apply a new or revised standard retroactively, resulting in potentially material restatements of prior period financial statements. Similarly, these changes could have a material impact on our tenants’ reported financial condition or results of operations or could affect our tenants’ preferences regarding leasing real estate.
Recent legislation modifies the rules applicable to partnership tax audits.
23
A recent law change enacted under the Bipartisan Budget Act of 2015, effective for taxable years beginning after December 31, 2017, requires our operating partnership and any subsidiary partnership to pay the hypothetical increase in partner-level taxes (including interest and penalties) resulting from an adjustment of partnership tax items on audit or in other tax proceedings, unless the partnership elects an alternative method under which the taxes resulting from the adjustment (and interest and penalties) are assessed at the partner level. Many uncertainties remain as to the application of these rules, including the application of the alternative method to partners that are REITs, and the impact they will have on us. However, it is possible, that partnerships in which we invest may be subject to U.S. federal income tax, interest and penalties in the event of a U.S. federal income tax audit as a result of these law changes.
Our state and local taxes could increase due to property tax rate changes, reassessment and/or changes in state and local tax laws which could impact our cash flows.
Even if we qualify as a REIT for U.S. federal income tax purposes, we will be required to pay state and local taxes on our properties. From time to time changes in state and local tax laws or regulations are enacted, which may result in an increase in our tax liability. A shortfall in tax revenues for states and municipalities in which we operate may lead to an increase in the frequency and size of such changes. If such changes occur, we may be required to pay additional taxes on our assets or income. These increased tax costs could adversely affect our financial condition and results of operations and the amount of cash available for the payment of dividends and distributions to our securityholders.
The real property taxes on our properties may increase as property tax rates change or as our properties are assessed or reassessed by taxing authorities. Therefore, the amount of property taxes we pay in the future may increase substantially from what we have paid in the past. If the property taxes we pay increase, our financial condition, results of operations, cash flows, per share trading price of our Class A common stock and our ability to satisfy our principal and interest obligations and to make distributions to our securityholders could be adversely affected.
We may become subject to litigation, which could have a material and adverse effect on our financial condition, results of operations, cash flow and per share/unit trading price of our Class A common stock and our traded OP units.
In the future we may become subject to litigation, including claims relating to our operations, offerings, and otherwise in the ordinary course of business. Some of these claims may result in significant defense costs and potentially significant judgments against us, some of which are not, or cannot be, insured against. We generally intend to defend ourselves vigorously; however, we cannot be certain of the ultimate outcomes of any claims that may arise in the future. Resolution of these types of matters against us may result in our having to pay significant fines, judgments, or settlements, which, if uninsured, or if the fines, judgments, and settlements exceed insured levels, could adversely impact our earnings and cash flows, thereby having an adverse effect on our financial condition, results of operations, cash flow and per share/unit trading price of our Class A common stock and our traded OP units. Certain litigation or the resolution of certain litigation may affect the availability or cost of some of our insurance coverage, which could adversely impact our results of operations and cash flows, expose us to increased risks that would be uninsured, and/or adversely impact our ability to attract officers and directors. There is currently arbitration pending, and the potential for additional legal proceedings, associated with the consolidation. We may incur costs for these proceedings. Please see Note 9 “Commitments and Contingencies” to the financial statements of this Annual Report in Form 10-K for a further description.
We face risks relating to cybersecurity attacks that could cause loss of confidential information and other business disruptions.
We rely extensively on computer systems to process transactions and manage our business, and our business is increasingly at risk from and may be impacted by cybersecurity attacks that continue to increase in number, intensity and sophistication. These could include internal and external attempts to gain unauthorized access to our data and computer systems to disrupt operations, corrupt data, or steal confidential information. As our reliance on technology has increased, so have the risks posed to our systems, both internal and those we have outsourced. Attacks can be both individual and/or highly organized attempts organized by very sophisticated hacking organizations. We employ a number of processes, procedures and controls to prevent, detect and mitigate these threats, which include password protection, frequent password change events, firewall detection systems, frequent backups, a redundant data system for core applications and annual penetration testing; however, there is no guarantee such measures, as well as our increased awareness of a risk of a cybersecurity attack, will be successful in preventing such an attack. A cybersecurity attack could compromise the confidential information of our employees, tenants and vendors. A successful attack could disrupt and materially affect our business operations, including damaging relationships with tenants, customers and vendors. Any compromise of our security could also result in a violation of applicable privacy and other laws, significant legal and financial exposure, damage to our reputation, loss or misuse of the
24
information (which may be confidential, proprietary and/or commercially sensitive in nature) and a loss of confidence in our security measures, which could harm our business.
Our failure to maintain satisfactory labor relations could have a material adverse effect on our business.
As of December 31, 2016, we employed 819 employees. There are currently collective bargaining agreements which cover 599 employees, or 73% of our workforce, that service all of our office properties. We have not experienced a strike or work stoppage at any of our properties and in the opinion of management overall employee relations are good and no labor stoppages are anticipated. Our inability to negotiate acceptable contracts with any of these unions as existing agreements expire could result in strikes or work stoppages by the affected workers. If our unionized employees were to engage in a strike or other work stoppage, we could experience a significant disruption of our operations, which could adversely affect our business, financial condition and results of operations. In the event of a work stoppage for any extended period of time, we would likely seek to engage temporary workers to provide tenant services, which would result in increased operating costs.
Risks Related to Our Organization and Structure
Holders of our Class B common stock have a significant vote in matters submitted to a vote of our securityholders.
As part of our formation, original investors were offered the opportunity to contribute their interests to us in exchange for Class A common stock, operating partnership units, a combination of one share of Class B common stock for each 50 operating partnership units to which an investor was entitled, resulting in one share of Class B common stock and 49 operating partnership units, or a combination of any of the above. Each outstanding share of Class B common stock, when accompanied by 49 operating partnership units, entitles the holder thereof to 50 votes on all matters on which Class A common securityholders are entitled to vote, including the election of directors. Holders of our Class B common stock are entitled to share equally, on a per share basis, in all distributions payable with respect to shares of our Class A common stock. Holders of our Class B common stock may have interests that differ from those holders of our Class A common stock, including by reason of their interest in our operating partnership, and may accordingly vote as a stockholder in ways that may not be consistent with the interests of holders of our Class A common stock. This significant voting influence over certain matters may have the effect of delaying, preventing or deterring a change of control of our company, or could deprive holders of our Class A common stock of an opportunity to receive a premium for their Class A common stock as part of a sale of our company. Class B common stock has been issued only in connection with the formation transactions as described above, and any such share is automatically converted to a share of Class A common stock (having a single vote) upon its holder conveying the related 49 operating partnership units to any person other than a family member, affiliate or controlled entity of such person.
The departure of any of our key personnel could materially and adversely affect us.
Our success depends on the efforts of key personnel, particularly Anthony E. Malkin, our Chairman and Chief Executive Officer. Among the reasons Anthony E. Malkin is important to our success is that he has a national industry reputation that benefits us in many ways. He has led the acquisition, operating and repositioning of our assets for the last two decades. If we lost his services, our external relationships and internal leadership resources would be materially diminished.
Other members of our senior management team also have strong industry reputations and experience, which aid us in attracting, identifying and exploiting opportunities. The loss of the services of one or more members of our senior management team, particularly Anthony E. Malkin, could have a material and adverse impact on us.
Tax consequences to holders of operating partnership units upon a sale or refinancing of our properties may cause the interests of certain members of our senior management team to differ from your own.
As a result of the unrealized built-in gain attributable to a property at the time of contribution, some holders of operating partnership units, including Anthony E. Malkin and Peter L. Malkin, may suffer different and more adverse tax consequences than holders of our Class A common stock upon the sale or refinancing of the properties owned by our operating partnership, including disproportionately greater allocations of items of taxable income and gain upon a realization event. As those holders will not receive a correspondingly greater distribution of cash proceeds, they may have different objectives regarding the appropriate pricing, timing and other material terms of any sale or refinancing of certain properties, or whether to sell or refinance such properties at all. As a result, the effect of certain transactions on Anthony E. Malkin and Peter L. Malkin may influence their decisions affecting these properties and may cause such members of our senior management team to attempt to delay, defer or prevent a transaction that might otherwise be in the best interests of our other securityholders. In connection with the formation transactions, we entered into a tax protection agreement with Anthony E. Malkin and Peter L.
25
Malkin pursuant to which we have agreed to indemnify the Malkin Group and one additional third party investor in Metro Center (who was one of the original landowners and was involved in the development of the property) against certain tax liabilities if those tax liabilities result from (i) the operating partnership’s sale, transfer, conveyance, or other taxable disposition of four specified properties (First Stamford Place, Metro Center, 10 Bank Street and 1542 Third Avenue) acquired by the operating partnership in the consolidation for a period of 12 years from the consolidation in 2013 with respect to First Stamford Place and for the later of (x) eight years from the consolidation in 2013 or (y) the death of both Peter L. Malkin and Isabel W. Malkin who are 83 and 80 years old, respectively, for the three other properties, (ii) the operating partnership failing to maintain until maturity the indebtedness secured by those properties or failing to use commercially reasonable efforts to refinance such indebtedness upon maturity in an amount equal to the principal balance of such indebtedness, or, if the operating partnership is unable to refinance such indebtedness at its current principal amount, at the highest principal amount possible, or (iii) the operating partnership failing to make available to any of these continuing investors the opportunity to guarantee, or otherwise bear the risk of loss, for U.S. federal income tax purposes, of their allocable share of $160 million of aggregate indebtedness meeting certain requirements, until such continuing investor owns less than the aggregate number of operating partnership units and shares of common stock equal to 50% of the aggregate number of such units and shares such continuing investor received in the formation transactions. As a result of entering into the tax protection agreement, Anthony E. Malkin and Peter L. Malkin may have an incentive to cause us to enter into transactions from which they may personally benefit.
Our Chairman and Chief Executive Officer has outside business interests that take his time and attention away from us, which could materially and adversely affect us.
Anthony E. Malkin, our Chairman and Chief Executive Officer, has agreed to devote a majority of his business time and attention to our business and, under his employment agreement, he may also devote time to the excluded properties, the excluded businesses and certain family investments to the extent that such activities do not materially interfere with the performance of his duties to us. He owns interests in the excluded properties and excluded businesses that were not contributed to us in the formation transactions, some of which are managed by our company and certain non-real estate family investments. In some cases, Anthony E. Malkin or his affiliates have certain management and fiduciary obligations that may conflict with such person’s responsibilities as an officer or director of our company and may adversely affect our operations. In addition, under his employment agreement, Anthony E. Malkin has agreed not to engage in certain business activities in competition with us (both during, and for a period of time following, his employment with us). We may choose not to enforce, or to enforce less vigorously, our rights under this agreement because of our desire to maintain our ongoing relationship with our Chairman and Chief Executive Officer given his significant knowledge of our business, relationships with our customers and significant equity ownership in us, and this could have a material adverse effect on our business.
Our rights and the rights of our securityholders to take action against our directors and officers are limited, which could limit your recourse in the event of actions not in your best interest.
Our charter limits the liability of our present and former directors and officers to us and our securityholders for money damages to the maximum extent permitted under Maryland law. Under current Maryland law, our present and former directors and officers will not have any liability to us or our securityholders for money damages other than liability resulting from (1) actual receipt of an improper benefit or profit in money, property or services or (2) active and deliberate dishonesty by the director or officer that was established by a final judgment and is material to the cause of action. As a result, we and our securityholders may have limited rights against our present and former directors and officers, as well as persons who served as members, managers, shareholders, directors, partners, officers, controlling persons certain agents of our predecessor, which could limit your recourse in the event of actions not in your best interest.
Conflicts of interest exist or could arise in the future between the interests of our securityholders and the interests of holders of operating partnership units, which may impede business decisions that could benefit our securityholders.
Conflicts of interest exist or could arise in the future as a result of the relationships between us and our affiliates, on the one hand, and our operating partnership or any partner thereof, on the other. Our directors and officers have duties to our company under applicable Maryland law in connection with their management of our company. At the same time, we, as the general partner in our operating partnership, have fiduciary duties and obligations to our operating partnership and its limited partners under Delaware law and the partnership agreement of our operating partnership in connection with the management of our operating partnership. Our fiduciary duties and obligations as general partner to our operating partnership and its partners may come into conflict with the duties of our directors and officers to our company.
Additionally, the partnership agreement provides that we and our directors and officers will not be liable or accountable to our operating partnership for losses sustained, liabilities incurred or benefits not derived if we, or such director
26
or officer acted in good faith. The partnership agreement also provides that we will not be liable to the operating partnership or any partner for monetary damages for losses sustained, liabilities incurred or benefits not derived by the operating partnership or any limited partner, except for liability for our intentional harm or gross negligence. Moreover, the partnership agreement provides that our operating partnership is required to indemnify its directors and officers, us and our directors and officers and authorizes our operating partnership to indemnify present and former members, managers, shareholders, directors, limited partners, general partners, officers or controlling persons of our predecessor and authorizes us to indemnify members, partners, employees and agents of us or our predecessor, in each case for actions taken by them in those capacities from and against any and all claims that relate to the operations of our operating partnership, except (1) if the act or omission of the person was material to the matter giving rise to the action and either was committed in bad faith or was the result of active and deliberate dishonesty, (2) for any transaction for which the indemnified party received an improper personal benefit, in money, property or services or otherwise, in violation or breach of any provision of the partnership agreement or (3) in the case of a criminal proceeding, if the indemnified person had reasonable cause to believe that the act or omission was unlawful. No reported decision of a Delaware appellate court has interpreted provisions similar to the provisions of the partnership agreement of our operating partnership that modify and reduce our fiduciary duties or obligations as the general partner or reduce or eliminate our liability for money damages to the operating partnership and its partners, and we have not obtained an opinion of counsel as to the enforceability of the provisions set forth in the partnership agreement that purport to modify or reduce the fiduciary duties that would be in effect were it not for the partnership agreement.
We could increase or decrease the number of authorized shares of stock, classify and reclassify unissued stock and issue stock without stockholder approval, which could prevent a change in our control and negatively affect the market value of our shares.
Our board of directors, without stockholder approval, has the power under our charter to amend our charter from time to time to increase or decrease the aggregate number of shares of stock or the number of shares of stock of any class or series that we are authorized to issue, to authorize us to issue authorized but unissued shares of our common stock or preferred stock and to classify or reclassify any unissued shares of our common stock or preferred stock into one or more classes or series of stock and set the terms of such newly classified or reclassified shares. As a result, we may issue series or classes of common stock or preferred stock with preferences, distributions, powers and rights, voting or otherwise, that are senior to, or otherwise conflict with, the rights of holders of our common stock. Any such issuance could dilute our existing securityholders’ interests. Although our board of directors has no such intention at the present time, it could establish a class or series of preferred stock that could, depending on the terms of such series, delay, defer or prevent a transaction or a change of control that might involve a premium price for our common stock or that our securityholders otherwise believe to be in their best interest.
Our operating partnership may issue additional operating partnership units without the consent of our securityholders, which could have a dilutive effect on our securityholders.
Our operating partnership may issue additional operating partnership units to third parties without the consent of our securityholders, which would reduce our ownership percentage in our operating partnership and would have a dilutive effect on the amount of distributions made to us by our operating partnership and, therefore, the amount of distributions we can make to our securityholders. Any such issuances, or the perception of such issuances, could materially and adversely affect the market price of our Class A common stock.
Certain provisions in the partnership agreement of our operating partnership may delay or prevent unsolicited acquisitions of us.
Provisions in the partnership agreement of our operating partnership may delay or make more difficult unsolicited acquisitions of us or changes of our control. These provisions could discourage third parties from making proposals involving an unsolicited acquisition of us or change of our control, although some securityholders might consider such proposals, if made, desirable. These provisions include, among others:
|
•
|
redemption rights of qualifying parties;
|
|
•
|
transfer restrictions on operating partnership units;
|
|
•
|
our ability, as general partner, in some cases, to amend the partnership agreement and to cause the operating partnership to issue units with terms that could delay, defer or prevent a merger or other change of control of us or our operating partnership without the consent of the limited partners;
|
|
•
|
the right of the limited partners to consent to transfers of the general partnership interest and mergers or other transactions involving us under specified circumstances; and
|
27
|
•
|
a redemption premium payable to the holders of our operating partnership’s preferred units if our operating partnership decides, at its option, to redeem preferred units for cash upon the occurrence of certain fundamental transactions, such as a change of control.
|
Our charter, bylaws, the partnership agreement of our operating partnership and Maryland law also contain other provisions that may delay, defer or prevent a transaction or a change of control that might involve a premium price for our common stock or that our securityholders otherwise believe to be in their best interest.
Our charter contains stock ownership limits, which may delay or prevent a change of control.
In order for us to qualify as a REIT no more than 50% in value of our outstanding capital stock may be owned, directly or indirectly, by five or fewer individuals during the last half of any calendar year, and at least 100 persons must beneficially own our stock during at least 335 days of a taxable year of 12 months, or during a proportionate portion of a shorter taxable year. “Individuals” for this purpose include natural persons, private foundations, some employee benefit plans and trusts and some charitable trusts. To assist us in complying with these limitations, among other purposes, our charter generally prohibits any person from directly or indirectly owning more than 9.8% in value or number of shares, whichever is more restrictive, of the outstanding shares of our capital stock or more than 9.8% in value or number of shares, whichever is more restrictive, of the outstanding shares of our common stock. These ownership limitations could have the effect of discouraging a takeover or other transaction in which holders of our common stock might receive a premium for their shares over the then prevailing market price or which holders might believe to be otherwise in their best interests. We have entered into a waiver of the 9.8% ownership limit with an institutional investor to permit this investor to own up to 15% of the outstanding shares of our Class A common stock, as well as an additional waiver to permit affiliates of QIA to own an aggregate amount of Class A common stock equal to a 9.9% fully diluted economic interest in the Company (inclusive of all outstanding common OP units and LTIP units), which currently equals in excess of 19.1% of our outstanding Class A common stock.
Our charter’s constructive ownership rules are complex and may cause the outstanding shares owned by a group of related individuals or entities to be deemed to be constructively owned by one individual or entity. As a result, the acquisition of less than these percentages of the outstanding shares by an individual or entity could cause that individual or entity to own constructively in excess of these percentages of the outstanding shares and thus violate the share ownership limits. Our charter also provides that any attempt to own or transfer shares of our common stock or preferred stock (if and when issued) in excess of the stock ownership limits without the consent of our board of directors or in a manner that would cause us to be “closely held” under Section 856(h) of the Code (without regard to whether the shares are held during the last half of a taxable year) will result in the shares being deemed to be transferred to a trustee for a charitable trust or, if the transfer to the charitable trust is not automatically effective to prevent a violation of the share ownership limits or the restrictions on ownership and transfer of our shares, any such transfer of our shares will be null and void.
The concentration of our voting power may adversely affect the ability of new investors to influence our policies.
As of
December 31, 2016
, Anthony E. Malkin, our Chairman and Chief Executive Officer, together with the Malkin Group, has the right to vote 42,101,592 shares of our common stock, which represents approximately 20.1% of the voting power of our outstanding common stock. Consequently, Mr. Malkin has the ability to influence the outcome of matters presented to our securityholders, including the election of our board of directors and approval of significant corporate transactions, including business combinations, consolidations and mergers and the determination of our day-to-day corporate and management policies.
As of December 31, 2016, QIA had a 9.9% fully diluted interest in us, which represented 19.1% of the outstanding Class A common stock. Pursuant to the terms of our stockholders agreement with QIA, QIA generally has the right (but not the obligation) to maintain its fully diluted economic interest in us by purchasing additional shares of our Class A common stock when we or our operating partnership issue additional common equity securities from time to time. While QIA has agreed to limit its voting power on all matters presented to our securityholders to no more than 9.9% of total number of votes entitled to be cast, QIA has also agreed to vote its shares in favor of the election of all director nominees recommended by our board of directors.
The interests of Mr. Malkin and QIA could conflict with or differ from your interests as a holder of our common stock, and these large securityholders may exercise their right as securityholders to restrict our ability to take certain actions that may otherwise be in the best interests of our securityholders. This concentration of voting power might also have the effect of delaying or preventing a change of control that our securityholders may view as beneficial.
28
Our board of directors may change our strategies, policies or procedures without stockholder consent, which may subject us to different and more significant risks in the future.
Our investment, financing, leverage and distribution policies and our policies with respect to all other activities, including growth, debt, capitalization and operations, will be determined by our board of directors. These policies may be amended or revised at any time and from time to time at the discretion of the board of directors without notice to or a vote of our securityholders. This could result in our conducting operational matters, making investments or pursuing different business or growth strategies. Under these circumstances, we may expose ourselves to different and more significant risks in the future, which could have a material adverse effect on our business and growth. In addition, the board of directors may change our policies with respect to conflicts of interest provided that such changes are consistent with applicable legal requirements. A change in these policies could have an adverse effect on our financial condition, results of operations, cash flow, per share/unit trading price of our Class A common stock and traded OP units and ability to satisfy our principal and interest obligations and to make distributions to our securityholders.
Our board of directors has approved very broad investment guidelines for our company and will not review or approve each investment decision made by our senior management team.
Our senior management team is authorized to follow broad investment guidelines and, therefore, has great latitude in determining the types of assets that are proper investments for us, as well as the individual investment decisions. Our senior management team may make investments with lower rates of return than those anticipated under current market conditions and/or may make investments with greater risks to achieve those anticipated returns. Our board of directors will not review or approve each proposed investment by our senior management team.
Risks Related to our Common Stock and Traded OP Units
Our cash available for distribution may not be sufficient to make distributions at expected levels.
We intend to make distributions to holders of shares of our common stock and holders of operating partnership units. All dividends and distributions will be made at the discretion of our board of directors and will depend on our earnings, financial condition, maintenance of REIT qualification and other factors as our board of directors may deem relevant from time to time. If sufficient cash is not available for distribution from our operations, we may have to fund distributions from working capital or to borrow to provide funds for such distribution, or to reduce the amount of such distribution. We cannot assure you that our distributions will be made or sustained. Any distributions we pay in the future will depend upon our actual results of operations, economic conditions and other factors that could differ materially from our current expectations.
The market price of shares of our Class A common stock and traded OP units could be adversely affected by our level of cash distributions.
The market value of the equity securities of a REIT is based primarily upon the market’s perception of the REIT’s growth potential and its current and potential future cash distributions, whether from operations, sales or refinancings, and is secondarily based upon the real estate market value of the underlying assets. For that reason, our Class A common stock and traded OP units may trade at prices that are higher or lower than our net asset value per share. To the extent we retain operating cash flow for investment purposes, working capital reserves or other purposes, these retained funds, while increasing the value of our underlying assets, may not correspondingly increase the market price of our Class A common stock and traded OP units. Our failure to meet the market’s expectations with regard to future earnings and cash distributions likely would adversely affect the market price of our Class A common stock and traded OP units.
The future exercise of registration rights may adversely affect the market price of our common stock.
We cannot predict whether future issuances of shares of our common stock or operating partnership units or the availability of shares for resale in the open market will decrease the market price per share/unit of our common stock and traded OP units. In August 2016, we entered into a registration rights agreement with QIA in connection with its purchase of 29,610,854 shares of our Class A common stock, which requires us to use commercially reasonable efforts to file with the Securities and Exchange Commission within 180 days following the closing of the sale, a resale shelf registration statement providing for the resale of QIA’s shares. We filed the resale shelf registration statement with the SEC on February 2, 2017. Subsequently, QIA will be entitled to cause us to include in the registration statement such additional shares of our Class A common stock as QIA may acquire from time to time, up to a 9.9% fully diluted interest in us. We will bear the costs of
29
registering the securities subject to the registration rights agreement, and once these shares are registered, they will be freely tradable, subject to any applicable lock-up agreements. The registration and availability of such a significant number of securities for trading in the public market may have an adverse effect on the market price of our common stock and could impair our ability to raise additional capital through the sale of equity securities in the future. In particular, as of December 31, 2016, QIA owns in excess of 19.1% of the outstanding shares of our Class A common stock. If QIA decides to sell all or a substantial portion of its shares, it could have a material adverse impact on the market price of our common stock.
Future issuances of debt securities or preferred units and future issuances of equity securities (including operating partnership units), may materially and adversely affect the market price of shares of our Class A common stock and traded OP units.
In the future, we may issue debt or equity securities or make other borrowings. Upon liquidation, holders of our debt securities, preferred units and other loans and preferred shares will receive a distribution of our available assets before holders of shares of our common stock. We are not required to offer any such additional debt or equity securities to existing securityholders on a preemptive basis. Therefore, additional shares of our common stock issuances, directly or through convertible or exchangeable securities (including operating partnership units), warrants or options, will dilute the holdings of our existing common securityholders and such issuances or the perception of such issuances may reduce the market price of shares of our common stock. Our preferred units or shares, if issued, would likely have a preference on distribution payments, periodically or upon liquidation, which could limit our ability to make distributions to holders of shares of our common stock. Because our decision to issue debt or equity securities or otherwise incur debt in the future will depend on market conditions and other factors beyond our control, we cannot predict or estimate the amount, timing or nature of our future capital raising efforts. Thus, holders of shares of our common stock bear the risk that our future issuances of debt or equity securities or our other borrowings will reduce the market price of shares of our Class A common stock and traded OP units and dilute their ownership in us.
Our balance sheet includes significant amounts of goodwill. The impairment of a significant portion of this goodwill could negatively affect our business, financial condition and results of operations.
Our balance sheet includes goodwill of approximately
$491.5 million
at
December 31, 2016
. These assets consist primarily of goodwill associated with our acquisition of the controlling interest in Empire State Building Company L.L.C. and 501 Seventh Avenue Associates L.L.C. We also expect to engage in additional acquisitions, which may result in our recognition of additional goodwill. Under accounting standards goodwill is not amortized. On an annual basis and whenever events or changes in circumstances indicate the carrying value or goodwill may be impaired, we are required to assess whether there have been impairments in the carrying value of goodwill. If the carrying value of the asset is determined to be impaired, then it is written down to fair value by a charge to operating earnings. An impairment of goodwill could have a material adverse effect on our business, financial condition and results of operations.
Tax Risks Related to Ownership of Our Shares
Our failure to qualify or remain qualified as a REIT would subject us to U.S. federal income tax and applicable state and local taxes, which would reduce the amount of cash available for distribution to our securityholders.
We have been organized and we intend to operate in a manner that we believe will enable us to qualify as a REIT for U.S. federal income tax purposes commencing with our taxable year ended December 31, 2013. We have not requested and do not intend to request a ruling from the Internal Revenue Service, or the IRS, that we qualify as a REIT. Qualification as a REIT involves the application of highly technical and complex Code provisions and Treasury Regulations promulgated thereunder for which there are limited judicial and administrative interpretations. The complexity of these provisions and of applicable Treasury Regulations is greater in the case of a REIT that, like us, holds its assets through partnerships. To qualify as a REIT, we must meet, on an ongoing basis, various tests regarding the nature and diversification of our assets and our income, the ownership of our outstanding shares, and the amount of our distributions. Our ability to satisfy these asset tests depends upon our analysis of the characterization and fair market values of our assets, some of which are not susceptible to a precise determination, and for which we will not obtain independent appraisals. Our compliance with the REIT income and quarterly asset requirements also depends upon our ability to manage successfully the composition of our income and assets on an ongoing basis. Moreover, new legislation, court decisions or administrative guidance, in each case possibly with retroactive effect, may make it more difficult or impossible for us to qualify as a REIT. Thus, while we intend to operate so that we will qualify as a REIT, given the highly complex nature of the rules governing REITs, the ongoing importance of factual
30
determinations, and the possibility of future changes in our circumstances, no assurance can be given that we will so qualify for any particular year. These considerations also might restrict the types of assets that we can acquire in the future.
If we fail to qualify as a REIT in any taxable year, and we do not qualify for certain statutory relief provisions, we would be required to pay U.S. federal income tax, including any applicable alternative minimum tax, on our taxable income at regular corporate rates, and distributions to our securityholders would not be deductible by us in determining our taxable income. In such a case, we might need to borrow money, sell assets, or reduce or even cease making distributions in order to pay our taxes. Our payment of income tax would reduce significantly the amount of cash available for distribution to our securityholders. Furthermore, if we fail to maintain our qualification as a REIT, we no longer would be required to distribute substantially all of our net taxable income to our securityholders. In addition, unless we were eligible for certain statutory relief provisions, we could not re-elect to qualify as a REIT until the fifth calendar year following the year in which we failed to qualify.
Failure to qualify as a domestically-controlled REIT could subject our non-U.S. securityholders to adverse federal income tax consequences.
A foreign person (other than a “qualified shareholder” or a “qualified foreign pension plan”) disposing of a U.S. real property interest, including shares of a U.S. corporation whose assets consist principally of U.S. property interests, is generally subject to tax under the Foreign Investment in Real Property Tax Act of 1980 ("FIRPTA") on the gain recognized on the disposition. FIRPTA does not apply, however, to the disposition of stock in a REIT if the REIT is a “domestically controlled REIT.” In general, we will be a domestically controlled REIT if at all times during a specified testing period, less than 50% in value of our shares is held directly or indirectly by non-U.S. holders. While we intend to continue to qualify as a "domestically controlled" REIT, we cannot assure that result, as our Class A common stock is publicly traded, QIA (a non-U.S. holder) recently acquired more than 19% of our common stock and other non-U.S. holders may now or in the future hold additional shares. If we were to fail to qualify, gain realized by a foreign investor (other than a “qualified shareholder” or a “qualified foreign pension plan”) on a sale of our common stock would be subject to FIRPTA unless (a) our common stock was traded on an established securities market and the foreign investor did not at any time during a specific testing period directly or indirectly own more than 10% of the value of our outstanding common stock, or (b) another exemption from FIRPTA were applicable.
Complying with the REIT requirements may cause us to forego and/or liquidate otherwise attractive investments.
To qualify as a REIT, we must ensure that we meet the REIT gross income tests annually. In addition, we must ensure that, at the end of each calendar quarter, at least 75% of the value of our total assets consists of cash, cash items, government securities and qualified REIT real estate assets, including certain mortgage loans and certain kinds of mortgage-backed securities. The remainder of our investment in securities (other than government securities, securities of corporations that are treated as Taxable REIT Subsidiaries ("TRSs") and qualified REIT real estate assets) generally cannot include more than 10% of the outstanding voting securities of any one issuer or more than 10% of the total value of the outstanding securities of any one issuer. In addition, in general, no more than 5% of the value of our assets (other than government securities and qualified real estate assets) can consist of the securities of any one issuer, and no more than 25% (20% for taxable years beginning after December 31, 2017) of the value of our total securities can be represented by securities of one or more TRSs. If we fail to comply with these asset requirements at the end of any calendar quarter, we must correct the failure within 30 days after the end of the calendar quarter or qualify for certain statutory relief provisions to avoid losing our REIT qualification and suffering adverse tax consequences.
To meet these tests, we may be required to take or forego taking actions that we would otherwise consider advantageous. For instance, in order to satisfy the gross income or asset tests applicable to REITs under the Code, we may be required to forego investments that we otherwise would make. Furthermore, we may be required to liquidate from our portfolio otherwise attractive investments. In addition, we may be required to make distributions to securityholders at disadvantageous times or when we do not have funds readily available for distribution. These actions could have the effect of reducing our income and amounts available for distribution to our securityholders. Thus, compliance with the REIT requirements may hinder our investment performance.
The REIT distribution requirements could require us to borrow funds during unfavorable market conditions or subject us to tax, which would reduce the cash available for distribution to our securityholders.
In order to qualify as a REIT, we must distribute to our securityholders, on an annual basis, at least 90% of our REIT taxable income, determined without regard to the deduction for dividends paid and excluding net capital gains. In addition, we
31
will be subject to U.S. federal income tax at regular corporate rates to the extent that we distribute less than 100% of our net taxable income (including net capital gains) and will be subject to a 4% nondeductible excise tax on the amount by which our distributions in any calendar year are less than a minimum amount specified under U.S. federal income tax laws. We intend to distribute our net income to our securityholders in a manner intended to satisfy the REIT 90% distribution requirement and to avoid U.S. federal income tax and the 4% nondeductible excise tax.
In addition, our taxable income may exceed our net income as determined by GAAP because, for example, realized capital losses will be deducted in determining our GAAP net income, but may not be deductible in computing our taxable income. In addition, we may incur nondeductible capital expenditures or be required to make debt or amortization payments. As a result of the foregoing, we may generate less cash flow than taxable income in a particular year and we may incur U.S. federal income tax and the 4% nondeductible excise tax on that income if we do not distribute such income to securityholders in that year. In that event, we may be required to use cash reserves, incur debt or liquidate assets at rates or times that we regard as unfavorable or make a taxable distribution of our shares in order to satisfy the REIT 90% distribution requirement and to avoid U.S. federal income tax and the 4% nondeductible excise tax in that year.
If our operating partnership is treated as a corporation for U.S. federal income tax purposes, we will cease to qualify as a REIT.
We believe our operating partnership qualifies as a partnership for U.S. federal income tax purposes. Assuming that it qualifies as a partnership for U.S. federal income tax purposes, our operating partnership will not be subject to U.S. federal income tax on its income. Instead, each of its partners, including us, is required to pay tax on its allocable share of the operating partnership’s income. No assurance can be provided, however, that the IRS will not challenge our operating partnership’s status as a partnership for U.S. federal income tax purposes, or that a court would not sustain such a challenge. If the IRS were successful in treating our operating partnership as a corporation for U.S. federal income tax purposes, we would fail to meet the gross income tests and certain of the asset tests applicable to REITs and, therefore, cease to qualify as a REIT and our operating partnership would become subject to U.S. federal, state and local income tax. The payment by our operating partnership of income tax would reduce significantly the amount of cash available to our partnership to satisfy obligations to make principal and interest payments on its debt and to make distribution to its partners, including us.
If we are not able to continue to lease the Empire State Building observatory to a TRS in a manner consistent with the ruling that we have received from the IRS, or if we are not able to maintain our broadcast licenses in a manner consistent with the ruling we have received from the IRS, we would be required to restructure our operations in a manner that could adversely affect the value of our stock.
Rents from real property are generally not qualifying income for purposes of the REIT gross income tests if the rent is treated as “related party rent.” Related party rent generally includes (i) any rent paid by a corporation if the REIT (or any person who owns 10% or more of the stock of the REIT by value) directly or indirectly owns 10% or more of the stock of the corporation by vote or value and (ii) rent paid by a partnership if the REIT (or any person who owns 10% or more of the stock of the REIT by value) directly or indirectly owns an interest of 10% or more in the assets or net profits of the partnership. Under an exception to this rule, related party rent is treated as qualifying income for purposes of the REIT gross income tests if it is paid by a TRS of the REIT and (i) at least 90% of the leased space in the relevant property is rented to persons other than either TRSs or other related parties of the REIT, and (ii) the amounts paid to the REIT as rent from real property are substantially comparable to the rents paid by unrelated tenants of the REIT for comparable space.
Income from admissions to the Empire State Building observatory, and certain other income generated by the observatory, would not likely be qualifying income for purposes of the REIT gross income tests. We jointly elected with Observatory TRS, which is the current lessee and operator of the observatory and which is wholly owned by our operating partnership, for Observatory TRS to be treated as a TRS of ours for U.S. federal income tax purposes. Observatory TRS leases the Empire State Building observatory from the operating partnership pursuant to a lease that provides for fixed base rental payments and variable rental payments equal to certain percentages of Observatory TRS’s gross receipts from the operation of the observatory. Given the unique nature of the real estate comprising the observatory, we do not believe that there is any space in the Empire State Building or in the same geographic area as the Empire State Building that is likely to be considered sufficiently comparable to the observatory for the purpose of applying the exception to related party rent described above. We have received from the IRS a private letter ruling that the rent that our operating partnership receives from Observatory TRS pursuant to the lease of the Empire State Building observatory is qualifying income for purposes of the REIT gross income tests so long as such rent reflects the fair market rental value of the Empire State Building observatory as determined by an appraisal rendered by a qualified third party appraiser.
32
In addition, our operating partnership has acquired various license agreements (i) granting certain third party broadcasters the right to use space on the tower on the top of the Empire State Building for certain broadcasting and other communication purposes and (ii) granting certain third party vendors the right to operate concession stands in the observatory. We have received from the IRS a private letter ruling that the license fees that our operating partnership receives under the license agreements described above constitute qualifying income for purposes of the REIT gross income tests.
We are entitled to rely upon these private letter rulings only to the extent that we did not misstate or omit a material fact in the ruling request and that we continue to operate in accordance with the material facts described in such request, and no assurance can be given that we will always be able to do so. If we were not able to treat the rent that our operating partnership receives from Observatory TRS as qualifying income for purposes of the REIT gross income tests, we would be required to restructure the manner in which we operate the observatory, which would likely require us to cede operating control of the observatory by leasing the observatory to an affiliate or third party operator. If we were not able to treat the license fees that our operating partnership will receive from the license agreements described above as qualifying income for purposes of the REIT gross income tests, we would be required to enter into the license agreements described above through a TRS, which would cause the license fees to be subject to U.S. federal income tax and accordingly reduce the amount of our cash flow available to be distributed to our securityholders. In either case, if we are not able to appropriately restructure our operations in a timely manner, we would likely realize significant income that does not qualify for the REIT gross income tests, which could cause us to fail to qualify as a REIT.
Although our use of TRSs may partially mitigate the impact of meeting certain requirements necessary to maintain our qualification as a REIT, there are limits on our ability to own TRSs, and a failure to comply with the limits would jeopardize our REIT qualification and may result in the application of a 100% excise tax.
A REIT may own up to 100% of the stock of one or more TRSs. A TRS may hold assets and earn income that would not be qualifying assets or income if held or earned directly by a REIT. Both the subsidiary and the REIT must jointly elect to treat the subsidiary as a TRS. A corporation of which a TRS directly or indirectly owns more than 35% of the voting power or value of the stock will automatically be treated as a TRS. Overall, no more than 25% (20% for taxable years beginning after December 31, 2017) of the value of a REIT’s assets may consist of securities of one or more TRSs. In addition, the TRS rules limit the deductibility of interest paid or accrued by a TRS to its parent REIT to assure that the TRS is subject to an appropriate level of corporate taxation. The rules also impose a 100% excise tax on certain transactions between a TRS and its parent REIT that are not conducted on an arm’s-length basis.
We have jointly elected with each of Observatory TRS and Holding TRS, for each of Observatory TRS and Holding TRS to be treated as a TRS under the Code for U.S. federal income tax purposes in 2013. Observatory TRS, Holding TRS, and any other TRSs that we form pay U.S. federal, state and local income tax on their taxable income, and their after-tax net income is available for distribution to us but is not required to be distributed to us unless necessary to maintain our REIT qualification. Although we monitor the aggregate value of the securities of such TRSs and intend to conduct our affairs so that such securities will represent less than 25% (20% for taxable years beginning after December 31, 2017) of the value of our total assets, there can be no assurance that we will be able to comply with the TRS limitation in all market conditions.
Dividends payable by REITs do not qualify for the reduced tax rates on dividend income from regular corporations, which could adversely affect the value of our Class A common stock.
The maximum U.S. federal income tax rate for certain qualified dividends payable to U.S. securityholders that are individuals, trusts and estates is 20% as of December 31, 2016. Dividends payable by REITs, however, are generally not eligible for the reduced rates and therefore may be subject to a 39.6% maximum U.S. federal income tax rate on ordinary income when paid to such securityholders. Although the reduced U.S. federal income tax rate applicable to dividend income from regular corporate dividends does not adversely affect the taxation of REITs or dividends paid by REITs, the more favorable rates applicable to regular corporate dividends could cause investors who are individuals, trusts and estates to perceive investments in REITs to be relatively less attractive than investments in the stocks of non-REIT corporations that pay dividends, which could adversely affect the value of the shares of REITs, including our Class A common stock.
The ability of our board of directors to revoke our REIT election without stockholder approval may cause adverse consequences to our securityholders.
Our charter provides that the board of directors may revoke or otherwise terminate our REIT election, without the approval of our securityholders, if the board determines that it is no longer in our best interest to continue to qualify as a REIT. If we cease to qualify as a REIT, we would become subject to U.S. federal income tax on our net taxable income and we
33
generally would no longer be required to distribute any of our net taxable income to our securityholders, which may have adverse consequences on our total return to our securityholders.
We may have inherited tax liabilities from the entities that have been merged into our company or our subsidiaries in the formation transactions.
Pursuant to the formation transactions, Malkin Properties of Connecticut, Inc., a Connecticut corporation, or Malkin Properties CT, and Malkin Construction Corp., a Connecticut corporation, or Malkin Construction merged with and into a subsidiary of ours, with the subsidiary surviving, in a transaction that was intended to be treated as a reorganization under the Code. Each of Malkin Properties CT and Malkin Construction had previously elected to be treated as an S Corporation for U.S. federal income tax purposes under Section 1361 of the Code with respect to periods preceding our formation transaction. If either of Malkin Properties CT or Malkin Construction had failed to qualify as an S corporation with respect to periods preceding our formation transaction, we could have assumed material U.S. federal income tax liabilities in connection with the formation transactions and/or may be subject to certain other adverse tax consequences. In addition, to qualify as a REIT under these circumstances, we would be required to distribute, prior to the close of our first taxable year in which we elect to be taxed as a REIT under the Code, any earnings and profits of these entities to which we were deemed to succeed. No rulings from the IRS were requested and no opinions of counsel were rendered regarding the U.S. federal income tax treatment of any of Malkin Properties CT or Malkin Construction with respect to periods preceding our formation transaction. Accordingly, no assurance can be given that Malkin Properties CT or Malkin Construction qualified as an S corporation for U.S. federal income tax purposes during such periods, or that these entities did not have any other tax liabilities. In addition, the supervisor merged with a subsidiary of our operating partnership in the formation transactions, and as a result, we may have inherited any liabilities, including any tax liabilities, of the supervisor.
Legislative or regulatory tax changes related to REITs and other business entities could materially and adversely affect our business.
At any time, the U.S. federal income tax laws or regulations governing REITs or the administrative interpretations of those laws or regulations may be changed, possibly with retroactive effect. We cannot predict if or when any new U.S. federal income tax law, regulation or administrative interpretation, or any amendment to any existing U.S. federal income tax law, regulation or administrative interpretation, will be adopted, promulgated or become effective or whether any such law, regulation or interpretation may take effect retroactively. We and our securityholders could be adversely affected by any such change in, or any new, U.S. federal income tax law, regulation or administrative interpretation.
In addition, according to publicly released statements, a top legislative priority of the Trump administration and the next Congress may be significant reform of the Code, including significant changes to taxation of business entities and the deductibility of interest expense. There is a substantial lack of clarity around the likelihood, timing and details of any such tax reform and the impact of any potential tax reform on our business and on the price of our common stock.
Your investment has various tax risks.
Although this section describes certain tax risks relevant to an investment in shares of our Class A common stock, you should consult your tax advisor concerning the effects of U.S. federal, state, local and foreign tax laws to you with regard to an investment in shares of our Class A common stock.
If a transaction intended to qualify as a Section 1031 Exchange is later determined to be taxable, we may face adverse consequences, and if the laws applicable to such transactions are amended or repealed, we may not be able to dispose of properties on a tax deferred basis
.
From time to time we may dispose of properties in transactions that are intended to qualify as Section 1031 Exchanges. It is possible that the qualification of a transaction as a Section 1031 Exchange could be successfully challenged and determined to be currently taxable. In such case, our taxable income and earnings and profits would increase. This could increase the dividend income to our stockholders by reducing any return of capital they received. In some circumstances, we may be required to pay additional dividends or, in lieu of that, corporate income tax, possibly including interest and penalties. As a result, we may be required to borrow funds in order to pay additional dividends or taxes, and the payment of such taxes could cause us to have less cash available to distribute to our stockholders. In addition, if a Section 1031 Exchange were later to be determined to be taxable, we may be required to amend our tax returns for the applicable year in question, including any information reports we sent our stockholders. Moreover, it is possible that legislation could be enacted that could modify or
34
repeal the laws with respect to Section 1031 Exchanges, which could make it more difficult or not possible for us to dispose of properties on a tax deferred basis.
As of
December 31, 2016
, we did not have any unresolved comments with the staff of the SEC.
35
Our Portfolio Summary
As of
December 31, 2016
, our portfolio consisted of 14 office properties and six standalone retail properties totaling approximately
10.1 million
rentable square feet and was approximately
88.1%
occupied, yielding approximately
$489.2 million
of annualized rent. Giving effect to leases signed but not yet commenced, our portfolio was approximately
90.2%
leased as of
December 31, 2016
. In addition, we owned entitled land that will support the development of an approximately 380,000 rentable square foot office building and garage (Metro Tower) at the Stamford Transportation Center in Stamford, Connecticut, adjacent to one of our office properties. The table below presents an overview of our portfolio as of
December 31, 2016
.
|
Annualized
|
||||||||||||||||
|
Rentable
|
Rent per
|
|||||||||||||||
|
Square
|
Percent
|
Annualized
|
Occupied
|
Number of
|
||||||||||||
|
Property Name
|
Location or Sub-Market
|
Feet
(1)
|
Occupied
(2)
|
Rent
(3)
|
Square Foot
(4)
|
Leases
(5)
|
||||||||||
|
Manhattan Office Properties - Office
|
|
|
|
|
|
|||||||||||
|
The Empire State Building
(6)
|
Penn Station -Times Sq. South
|
2,706,202
|
|
91.3
|
%
|
$
|
127,563,431
|
|
$
|
51.65
|
|
182
|
|
|||
|
One Grand Central Place
|
Grand Central
|
1,241,665
|
|
84.4
|
%
|
56,698,775
|
|
54.10
|
|
236
|
|
|||||
|
1400 Broadway
(7)
|
Penn Station -Times Sq. South
|
905,880
|
|
92.2
|
%
|
38,131,012
|
|
45.65
|
|
47
|
|
|||||
|
111 West 33rd Street
(8)
|
Penn Station -Times Sq. South
|
636,949
|
|
55.4
|
%
|
18,230,207
|
|
51.66
|
|
17
|
|
|||||
|
250 West 57th Street
|
Columbus Circle - West Side
|
488,877
|
|
75.7
|
%
|
20,450,783
|
|
55.26
|
|
96
|
|
|||||
|
501 Seventh Avenue
|
Penn Station -Times Sq. South
|
459,329
|
|
98.8
|
%
|
19,232,207
|
|
42.39
|
|
37
|
|
|||||
|
1359 Broadway
|
Penn Station -Times Sq. South
|
455,303
|
|
90.9
|
%
|
20,513,574
|
|
49.59
|
|
35
|
|
|||||
|
1350 Broadway
(9)
|
Penn Station -Times Sq. South
|
373,602
|
|
88.7
|
%
|
17,869,821
|
|
53.91
|
|
65
|
|
|||||
|
1333 Broadway
|
Penn Station -Times Sq. South
|
292,629
|
|
98.8
|
%
|
13,773,871
|
|
47.64
|
|
10
|
|
|||||
|
Manhattan Office Properties - Office
|
7,560,436
|
|
86.8
|
%
|
332,463,681
|
|
50.65
|
|
725
|
|
||||||
|
|
|
|
|
|
|
|
||||||||||
|
Manhattan Office Properties - Retail
|
|
|
|
|
|
|||||||||||
|
The Empire State Building
(10)
|
Penn Station -Times Sq. South
|
115,568
|
|
73.8
|
%
|
13,587,056
|
|
159.35
|
|
15
|
|
|||||
|
One Grand Central Place
|
Grand Central
|
66,810
|
|
99.4
|
%
|
7,194,415
|
|
108.39
|
|
14
|
|
|||||
|
1400 Broadway
(7)
|
Penn Station -Times Sq. South
|
21,803
|
|
63.4
|
%
|
1,517,622
|
|
109.81
|
|
8
|
|
|||||
|
112 West 34th Street
(8)
|
Penn Station -Times Sq. South
|
86,934
|
|
54.2
|
%
|
18,082,376
|
|
383.81
|
|
3
|
|
|||||
|
250 West 57th Street
|
Columbus Circle - West Side
|
48,962
|
|
100.0
|
%
|
8,010,165
|
|
163.60
|
|
8
|
|
|||||
|
501 Seventh Avenue
|
Penn Station -Times Sq. South
|
35,558
|
|
96.9
|
%
|
1,940,753
|
|
56.35
|
|
9
|
|
|||||
|
1359 Broadway
|
Penn Station -Times Sq. South
|
27,243
|
|
100.0
|
%
|
2,155,646
|
|
79.13
|
|
6
|
|
|||||
|
1350 Broadway
|
Penn Station -Times Sq. South
|
31,774
|
|
100.0
|
%
|
6,711,102
|
|
211.21
|
|
6
|
|
|||||
|
1333 Broadway
|
Penn Station -Times Sq. South
|
67,001
|
|
100.0
|
%
|
8,397,109
|
|
125.33
|
|
4
|
|
|||||
|
Manhattan Office Properties - Retail
|
501,653
|
|
84.1
|
%
|
67,596,244
|
|
160.18
|
|
73
|
|
||||||
|
Sub-Total/Weighted Average Manhattan Office Properties - Office and Retail
|
8,062,089
|
|
86.7
|
%
|
400,059,925
|
|
57.27
|
|
798
|
|
||||||
|
|
|
|
|
|
|
|
||||||||||
36
|
Greater New York Metropolitan Area Office Properties
|
|
|
|
|
|
|
||||||||||
|
First Stamford Place
(11)
|
Stamford, CT
|
794,623
|
|
95.7
|
%
|
32,537,043
|
|
42.80
|
|
58
|
|
|||||
|
Metro Center
|
Stamford, CT
|
285,228
|
|
95.8
|
%
|
15,299,888
|
|
56.01
|
|
29
|
|
|||||
|
383 Main Street
|
Norwalk, CT
|
262,501
|
|
91.5
|
%
|
7,548,885
|
|
31.44
|
|
22
|
|
|||||
|
500 Mamaroneck Avenue
|
Harrison, NY
|
294,821
|
|
92.0
|
%
|
7,861,196
|
|
28.99
|
|
34
|
|
|||||
|
10 Bank Street
|
White Plains, NY
|
235,285
|
|
83.4
|
%
|
7,015,578
|
|
35.75
|
|
32
|
|
|||||
|
Sub-Total/Weighted Average Greater New York Metropolitan Office Properties
|
1,872,458
|
|
93.0
|
%
|
70,262,590
|
|
40.36
|
|
175
|
|
||||||
|
|
|
|
|
|
|
|
||||||||||
|
Standalone Retail Properties
|
|
|
|
|
|
|||||||||||
|
10 Union Square
|
Union Square
|
58,005
|
|
98.0
|
%
|
6,212,594
|
|
109.34
|
|
12
|
|
|||||
|
1542 Third Avenue
|
Upper East Side
|
56,250
|
|
100.0
|
%
|
3,468,724
|
|
61.67
|
|
4
|
|
|||||
|
1010 Third Avenue
|
Upper East Side
|
44,662
|
|
100.0
|
%
|
3,539,989
|
|
79.26
|
|
2
|
|
|||||
|
77 West 55th Street
|
Midtown
|
24,102
|
|
100.0
|
%
|
2,733,043
|
|
113.39
|
|
3
|
|
|||||
|
69-97 Main Street
|
Westport, CT
|
17,103
|
|
100.0
|
%
|
2,196,199
|
|
128.41
|
|
5
|
|
|||||
|
103-107 Main Street
|
Westport, CT
|
4,330
|
|
100.0
|
%
|
714,348
|
|
164.98
|
|
1
|
|
|||||
|
Sub-Total/Weighted Average Standalone Retail Properties
|
204,452
|
|
99.4
|
%
|
18,864,897
|
|
92.81
|
|
27
|
|
||||||
|
Portfolio Total
|
10,138,999
|
|
88.1
|
%
|
$
|
489,187,412
|
|
$
|
54.78
|
|
1,000
|
|
||||
|
|
|
|
|
|
|
|
||||||||||
|
Total/Weighted Average Office Properties
|
9,432,894
|
|
88.0
|
%
|
$
|
402,726,271
|
|
$
|
48.49
|
|
900
|
|
||||
|
Total/Weighted Average Retail Properties
(12)
|
706,105
|
|
88.6
|
%
|
86,461,141
|
|
138.28
|
|
100
|
|
||||||
|
Portfolio Total
|
10,138,999
|
|
88.1
|
%
|
$
|
489,187,412
|
|
$
|
54.78
|
|
1,000
|
|
||||
|
(1)
|
Excludes (i) 151,618 square feet of space across our portfolio attributable to building management use and tenant amenities and (ii) 69,789 square feet of space attributable to our observatory.
|
|
(2)
|
Based on leases signed and commenced as of
December 31, 2016
and calculated as (i) rentable square feet less available square feet divided by (ii) rentable square feet.
|
|
(3)
|
Represents annualized base rent and current reimbursement for operating expenses and real estate taxes.
|
|
(4)
|
Represents annualized rent under leases commenced as of
December 31, 2016
divided by occupied square feet.
|
|
(5)
|
Represents the number of leases at each property or on a portfolio basis. If a tenant has more than one lease, whether or not at the same property, but with different expirations, the number of leases is calculated equal to the number of leases with different expirations.
|
|
(6)
|
Includes 75,161 rentable square feet of space leased by our broadcasting tenants.
|
|
(7)
|
Denotes a ground leasehold interest in the property with a remaining term, including unilateral extension rights available to the Company, of approximately 47 years (expiring December 31, 2063).
|
|
(8)
|
Denotes a ground leasehold interest in the property with a remaining term, including unilateral extension rights available to the Company, of approximately 61 years (expiring May 31, 2077).
|
|
(9)
|
Denotes a ground leasehold interest in the property with a remaining term, including unilateral extension rights available to us, of approximately 34 years (expiring July 31, 2050).
|
|
(10)
|
Includes 5,300 rentable square feet of space leased by WDFG North America, a licensee of our observatory.
|
|
(11)
|
First Stamford Place consists of three buildings.
|
|
(12)
|
Includes 501,653 rentable square feet of retail space in our Manhattan office properties.
|
Tenant Diversification
As of
December 31, 2016
, our office and retail portfolios were leased to a diverse tenant base consisting of approximately
1,000
leases. Our tenants represent a broad array of industries as follows:
37
|
Diversification by Industry
|
Percent
(1)
|
|
|
Arts and entertainment
|
1.3
|
%
|
|
Broadcast
|
2.2
|
%
|
|
Consumer goods
|
21.5
|
%
|
|
Finance, insurance, real estate
|
17.6
|
%
|
|
Government entity
|
1.9
|
%
|
|
Healthcare
|
1.4
|
%
|
|
Industrials and natural resources
|
0.9
|
%
|
|
Legal services
|
3.1
|
%
|
|
Media and advertising
|
3.8
|
%
|
|
Non-profit
|
4.2
|
%
|
|
Professional services (not including legal services)
|
11.4
|
%
|
|
Retail
|
16.9
|
%
|
|
Technology
|
8.5
|
%
|
|
Others
|
5.3
|
%
|
|
Total
|
100.0
|
%
|
|
(1)
Based on annualized rent.
|
||
The following table sets forth information regarding the 20 largest tenants in our portfolio based on annualized rent as of
December 31, 2016
.
|
Weighted
|
Percent of
|
||||||||||||
|
Average
|
Total
|
Portfolio
|
Percent of
|
||||||||||
|
Remaining
|
Occupied
|
Rentable
|
Portfolio
|
||||||||||
|
Lease
|
Lease
|
Square
|
Square
|
Annualized
|
Annualized
|
||||||||
|
Tenant
|
Property
|
Expiration
(1)
|
Term
(2)
|
Feet
(3)
|
Feet
(4)
|
Rent
(5)
|
Rent
(6)
|
||||||
|
Global Brands Group
|
ESB, 1333 B'Way, 111 West 33rd
|
June 2017-Oct. 2028
|
10.7 years
|
688,600
|
|
6.8
|
%
|
$
|
30,543,248
|
|
6.2
|
%
|
|
|
Coty
|
Empire State Building
|
Jan. 2030
|
13.1 years
|
312,700
|
|
3.1
|
%
|
15,463,374
|
|
3.2
|
%
|
||
|
LinkedIn
|
Empire State Building
|
Feb. 2026
|
9.2 years
|
278,023
|
|
2.7
|
%
|
14,395,469
|
|
2.9
|
%
|
||
|
Sephora
|
112 West 34th Street
|
Jan. 2029
|
12.1 years
|
11,334
|
|
0.1
|
%
|
10,432,766
|
|
2.1
|
%
|
||
|
PVH Corp.
|
501 West 57th Street
|
June 2017-Oct. 2028
|
11.5 years
|
217,293
|
|
2.1
|
%
|
9,142,695
|
|
1.9
|
%
|
||
|
Thomson Reuters
|
Metro Center, First Stamford Place
|
Apr. 2018-Apr. 2020
|
2.6 years
|
147,208
|
|
1.5
|
%
|
7,523,906
|
|
1.5
|
%
|
||
|
Li & Fung
|
1359 Broadway
|
Oct. 2021-Oct. 2027
|
7.3 years
|
149,436
|
|
1.5
|
%
|
7,172,674
|
|
1.5
|
%
|
||
|
Federal Deposit Insurance Corp.
|
Empire State Building
|
Jan. 2020
|
3.1 years
|
121,879
|
|
1.2
|
%
|
6,841,176
|
|
1.4
|
%
|
||
|
Macy's
|
111 West 33rd Street
|
May 2030
|
13.4 years
|
131,117
|
|
1.3
|
%
|
6,626,117
|
|
1.4
|
%
|
||
|
Urban Outfitters
|
1333 Broadway
|
Sept. 2029
|
12.8 years
|
56,730
|
|
0.6
|
%
|
6,594,879
|
|
1.3
|
%
|
||
|
Footlocker
|
112 West 34th Street
|
Sept. 2031
|
14.8 years
|
34,192
|
|
0.3
|
%
|
6,214,260
|
|
1.3
|
%
|
||
|
Duane Reade/Walgreen's
|
ESB, 1350 B'Way, 250 West 57th
|
Feb. 2021-Sept. 2027
|
7.9 years
|
47,541
|
|
0.5
|
%
|
6,203,743
|
|
1.3
|
%
|
||
|
Legg Mason
|
First Stamford Place
|
Sept. 2024
|
7.8 years
|
137,583
|
|
1.4
|
%
|
6,200,427
|
|
1.3
|
%
|
||
|
On Deck Capital
|
1400 Broadway
|
Dec. 2026
|
10.0 years
|
107,800
|
|
1.1
|
%
|
5,743,805
|
|
1.2
|
%
|
||
|
WDFG North America
|
Empire State Building
|
Dec. 2025
|
9.0 years
|
5,300
|
|
0.1
|
%
|
5,351,699
|
|
1.1
|
%
|
||
|
Shutterstock
|
Empire State Building
|
Apr. 2029
|
12.3 years
|
110,236
|
|
1.1
|
%
|
4,886,141
|
|
1.0
|
%
|
||
|
Kohl's
|
1400 Broadway
|
May 2029
|
12.4 years
|
113,032
|
|
1.1
|
%
|
4,802,479
|
|
1.0
|
%
|
||
|
HNTB Corporation
|
Empire State Building
|
Feb. 2026
|
9.2 years
|
78,361
|
|
0.8
|
%
|
4,466,577
|
|
0.9
|
%
|
||
|
Odyssey America Reinsurance
|
First Stamford Place
|
Sept. 2022
|
5.8 years
|
101,619
|
|
1.0
|
%
|
4,249,775
|
|
0.9
|
%
|
||
|
The Interpublic Group of Companies
|
1400 Broadway
|
Jul. 2024
|
7.6 years
|
87,076
|
|
0.9
|
%
|
3,962,524
|
|
0.8
|
%
|
||
|
Total
|
|
|
2,937,060
|
|
29.2
|
%
|
$
|
166,817,734
|
|
34.2
|
%
|
||
|
(1)
|
Expiration dates are per lease and do not assume exercise of renewal or extension options. For tenants with more than two leases, the lease expiration is shown as a range.
|
|
(2)
|
Represents the weighted average lease term, based on annualized rent.
|
|
(3)
|
Based on leases signed and commenced as of
December 31, 2016
.
|
|
(4)
|
Represents the percentage of rentable square feet of our office and retail portfolios in the aggregate.
|
|
(5)
|
Represents annualized base rent and current reimbursement for operating expenses and real estate taxes.
|
|
(6)
|
Represents the percentage of annualized rent of our office and retail portfolios in the aggregate.
|
38
Lease Expirations
We expect to benefit from the re-leasing of
7.2%
, or approximately
541,877
rentable square feet, of our Manhattan office leases expiring during 2017, which we generally believe are currently at below-market rates. During 2014, 2015 and 2016, we generally obtained higher base rents on new and renewed leases at our Manhattan office properties. These increased rents are partly due to an increase in the total rentable square footage of such space as a result of remeasurement and application of market loss factors to our space.
During the year ended
December 31, 2016
, we entered into new and renewed leases at our Manhattan office properties representing approximately 724,417 rentable square feet. The last weighted average annualized fully escalated gross rent prior to the renewal or re-leasing of these leases was $41.36 per rentable square foot compared to $58.83 per rentable square foot based on the weighted average annualized contractual first monthly base rent (after free rent periods) for the new and renewed leases, representing a 42.2% increase in mark-to-market rent. During the year ended December 31, 2015, we entered into new and renewed leases at our Manhattan office properties representing approximately 958,704 rentable square feet. The last weighted average annualized fully escalated gross rent prior to the renewal or re-leasing of these leases was $38.27 per rentable square foot compared to $54.84 per rentable square foot based on the weighted average annualized contractual first monthly base rent (after free rent periods) for the new and renewed leases, representing a 43.3% increase in mark-to-market rent. During the year ended December 31, 2014, we entered into new and renewed leases at our Manhattan office properties representing approximately 621,224 rentable square feet. The last weighted average annualized fully escalated gross rent prior to the renewal or re-leasing of these leases was $40.86 per rentable square foot compared to $50.42 per rentable square foot based on the weighted average annualized contractual first monthly base rent (after free rent periods) for the new and renewed leases, representing a 23.4% increase in mark-to-market rent.
The following tables set forth a summary schedule of the lease expirations for leases in place as of
December 31, 2016
plus available space for each of the ten calendar years beginning with the year ending December 31, 2017 at the properties in our portfolio. The information set forth in the table assumes that tenants exercise no renewal options and all early termination rights.
All properties
|
Percent of
|
||||||||||||||||
|
Rentable
|
Portfolio
|
Annualized
|
||||||||||||||
|
Number
|
Square
|
Rentable
|
Percent of
|
Rent Per
|
||||||||||||
|
of Leases
|
Feet
|
Square Feet
|
Annualized
|
Annualized
|
Rentable
|
|||||||||||
|
Year of Lease Expiration
|
Expiring
(1)
|
Expiring
(2)
|
Expiring
|
Rent
(3)
|
Rent
|
Square Foot
|
||||||||||
|
Available
|
—
|
|
993,286
|
|
9.8
|
%
|
$
|
—
|
|
—
|
%
|
$
|
—
|
|
||
|
Signed leases not commenced
|
27
|
|
215,526
|
|
2.1
|
%
|
—
|
|
—
|
%
|
—
|
|
||||
|
2017
|
176
|
|
705,873
|
|
7.0
|
%
|
34,476,553
|
|
7.0
|
%
|
48.84
|
|
||||
|
2018
|
171
|
|
822,372
|
|
8.1
|
%
|
41,727,230
|
|
8.5
|
%
|
50.74
|
|
||||
|
2019
|
131
|
|
756,760
|
|
7.5
|
%
|
37,827,413
|
|
7.7
|
%
|
49.99
|
|
||||
|
2020
|
135
|
|
897,033
|
|
8.8
|
%
|
47,752,884
|
|
9.8
|
%
|
53.23
|
|
||||
|
2021
|
96
|
|
697,973
|
|
6.9
|
%
|
37,323,479
|
|
7.6
|
%
|
53.47
|
|
||||
|
2022
|
64
|
|
549,039
|
|
5.4
|
%
|
31,934,831
|
|
6.5
|
%
|
58.16
|
|
||||
|
2023
|
51
|
|
543,385
|
|
5.4
|
%
|
30,627,106
|
|
6.3
|
%
|
56.36
|
|
||||
|
2024
|
43
|
|
488,731
|
|
4.8
|
%
|
27,727,453
|
|
5.7
|
%
|
56.73
|
|
||||
|
2025
|
38
|
|
320,016
|
|
3.2
|
%
|
24,413,546
|
|
5.0
|
%
|
76.29
|
|
||||
|
2026
|
39
|
|
944,620
|
|
9.3
|
%
|
49,591,862
|
|
10.1
|
%
|
52.50
|
|
||||
|
Thereafter
|
56
|
|
2,204,385
|
|
21.7
|
%
|
125,785,055
|
|
25.8
|
%
|
57.06
|
|
||||
|
Total
|
1,027
|
|
10,138,999
|
|
100.0
|
%
|
$
|
489,187,412
|
|
100.0
|
%
|
$
|
54.78
|
|
||
39
Manhattan Office Properties
(4)
|
Percent of
|
||||||||||||||||
|
Rentable
|
Portfolio
|
Annualized
|
||||||||||||||
|
Number
|
Square
|
Rentable
|
Percent of
|
Rent Per
|
||||||||||||
|
of Leases
|
Feet
|
Square Feet
|
Annualized
|
Annualized
|
Rentable
|
|||||||||||
|
Year of Lease Expiration
|
Expiring
(1)
|
Expiring
(2)
|
Expiring
|
Rent
(3)
|
Rent
|
Square Foot
|
||||||||||
|
Available
|
—
|
|
822,129
|
|
10.9
|
%
|
$
|
—
|
|
—
|
%
|
$
|
—
|
|
||
|
Signed leases not commenced
|
19
|
|
174,295
|
|
2.3
|
%
|
—
|
|
—
|
%
|
—
|
|
||||
|
2017
|
146
|
|
541,877
|
|
7.2
|
%
|
26,542,389
|
|
8.0
|
%
|
48.98
|
|
||||
|
2018
|
134
|
|
561,814
|
|
7.4
|
%
|
30,295,048
|
|
9.1
|
%
|
53.92
|
|
||||
|
2019
|
101
|
|
494,725
|
|
6.5
|
%
|
24,421,526
|
|
7.3
|
%
|
49.36
|
|
||||
|
2020
|
99
|
|
609,742
|
|
8.1
|
%
|
32,349,929
|
|
9.7
|
%
|
53.06
|
|
||||
|
2021
|
58
|
|
442,918
|
|
5.9
|
%
|
22,867,415
|
|
6.9
|
%
|
51.63
|
|
||||
|
2022
|
40
|
|
256,320
|
|
3.4
|
%
|
14,515,812
|
|
4.4
|
%
|
56.63
|
|
||||
|
2023
|
37
|
|
398,977
|
|
5.3
|
%
|
20,553,291
|
|
6.2
|
%
|
51.51
|
|
||||
|
2024
|
26
|
|
301,019
|
|
4.0
|
%
|
14,772,797
|
|
4.4
|
%
|
49.08
|
|
||||
|
2025
|
21
|
|
201,891
|
|
2.7
|
%
|
11,048,309
|
|
3.3
|
%
|
54.72
|
|
||||
|
2026
|
29
|
|
824,755
|
|
10.9
|
%
|
43,655,894
|
|
13.1
|
%
|
52.93
|
|
||||
|
Thereafter
|
34
|
|
1,929,974
|
|
25.4
|
%
|
91,441,271
|
|
27.6
|
%
|
47.38
|
|
||||
|
Total
|
744
|
|
7,560,436
|
|
100.0
|
%
|
$
|
332,463,681
|
|
100.0
|
%
|
$
|
50.65
|
|
||
Greater New York Metropolitan Area Office Properties
|
Percent of
|
||||||||||||||||
|
Rentable
|
Portfolio
|
Annualized
|
||||||||||||||
|
Number
|
Square
|
Rentable
|
Percent of
|
Rent Per
|
||||||||||||
|
of Leases
|
Feet
|
Square Feet
|
Annualized
|
Annualized
|
Rentable
|
|||||||||||
|
Year of Lease Expiration
|
Expiring
(1)
|
Expiring
(2)
|
Expiring
|
Rent
(3)
|
Rent
|
Square Foot
|
||||||||||
|
Available
|
—
|
|
97,606
|
|
5.2
|
%
|
$
|
—
|
|
—
|
%
|
$
|
—
|
|
||
|
Signed leases not commenced
|
6
|
|
33,946
|
|
1.8
|
%
|
—
|
|
—
|
%
|
—
|
|
||||
|
2017
|
20
|
|
119,282
|
|
6.4
|
%
|
4,989,533
|
|
7.1
|
%
|
41.83
|
|
||||
|
2018
|
31
|
|
236,882
|
|
12.7
|
%
|
8,897,104
|
|
12.7
|
%
|
37.56
|
|
||||
|
2019
|
21
|
|
229,887
|
|
12.3
|
%
|
8,946,856
|
|
12.7
|
%
|
38.92
|
|
||||
|
2020
|
26
|
|
230,508
|
|
12.3
|
%
|
9,856,388
|
|
14.0
|
%
|
42.76
|
|
||||
|
2021
|
31
|
|
225,410
|
|
12.0
|
%
|
9,696,998
|
|
13.8
|
%
|
43.02
|
|
||||
|
2022
|
14
|
|
230,418
|
|
12.3
|
%
|
8,973,890
|
|
12.8
|
%
|
38.95
|
|
||||
|
2023
|
8
|
|
95,771
|
|
5.1
|
%
|
4,543,159
|
|
6.5
|
%
|
47.44
|
|
||||
|
2024
|
4
|
|
154,688
|
|
8.3
|
%
|
6,995,826
|
|
10.0
|
%
|
45.23
|
|
||||
|
2025
|
10
|
|
83,805
|
|
4.5
|
%
|
2,971,218
|
|
4.2
|
%
|
35.45
|
|
||||
|
2026
|
1
|
|
45,361
|
|
2.4
|
%
|
1,393,214
|
|
2.0
|
%
|
30.71
|
|
||||
|
Thereafter
|
9
|
|
88,894
|
|
4.7
|
%
|
2,998,404
|
|
4.2
|
%
|
33.73
|
|
||||
|
Total
|
181
|
|
1,872,458
|
|
100.0
|
%
|
$
|
70,262,590
|
|
100.0
|
%
|
$
|
40.36
|
|
||
40
Retail
(5)
|
Percent of
|
||||||||||||||||
|
Rentable
|
Portfolio
|
Annualized
|
||||||||||||||
|
Number
|
Square
|
Rentable
|
Percent of
|
Rent Per
|
||||||||||||
|
of Leases
|
Feet
|
Square Feet
|
Annualized
|
Annualized
|
Rentable
|
|||||||||||
|
Year of Lease Expiration
|
Expiring
(1)
|
Expiring
(2)
|
Expiring
|
Rent
(3)
|
Rent
|
Square Foot
|
||||||||||
|
Available
|
—
|
|
73,551
|
|
10.4
|
%
|
$
|
—
|
|
—
|
%
|
$
|
—
|
|
||
|
Signed leases not commenced
|
2
|
|
7,285
|
|
1.0
|
%
|
—
|
|
—
|
%
|
—
|
|
||||
|
2017
|
10
|
|
44,714
|
|
6.3
|
%
|
2,944,631
|
|
3.4
|
%
|
65.85
|
|
||||
|
2018
|
6
|
|
23,676
|
|
3.4
|
%
|
2,535,078
|
|
2.9
|
%
|
107.07
|
|
||||
|
2019
|
9
|
|
32,148
|
|
4.6
|
%
|
4,459,031
|
|
5.2
|
%
|
138.70
|
|
||||
|
2020
|
10
|
|
56,783
|
|
8.0
|
%
|
5,546,567
|
|
6.4
|
%
|
97.68
|
|
||||
|
2021
|
7
|
|
29,645
|
|
4.2
|
%
|
4,759,066
|
|
5.5
|
%
|
160.54
|
|
||||
|
2022
|
10
|
|
62,301
|
|
8.8
|
%
|
8,445,129
|
|
9.8
|
%
|
135.55
|
|
||||
|
2023
|
6
|
|
48,637
|
|
6.9
|
%
|
5,530,656
|
|
6.4
|
%
|
113.71
|
|
||||
|
2024
|
13
|
|
33,024
|
|
4.7
|
%
|
5,958,830
|
|
6.9
|
%
|
180.44
|
|
||||
|
2025
|
7
|
|
34,320
|
|
4.9
|
%
|
10,394,019
|
|
12.0
|
%
|
302.86
|
|
||||
|
2026
|
9
|
|
74,504
|
|
10.6
|
%
|
4,542,754
|
|
5.3
|
%
|
60.97
|
|
||||
|
Thereafter
|
13
|
|
185,517
|
|
26.2
|
%
|
31,345,380
|
|
36.2
|
%
|
168.96
|
|
||||
|
Total
|
102
|
|
706,105
|
|
100.0
|
%
|
$
|
86,461,141
|
|
100.0
|
%
|
$
|
138.28
|
|
||
The Empire State Building
(6)
|
Percent of
|
||||||||||||||||
|
Rentable
|
Portfolio
|
Annualized
|
||||||||||||||
|
Number
|
Square
|
Rentable
|
Percent of
|
Rent Per
|
||||||||||||
|
of Leases
|
Feet
|
Square Feet
|
Annualized
|
Annualized
|
Rentable
|
|||||||||||
|
Year of Lease Expiration
|
Expiring
(1)
|
Expiring
(2)
|
Expiring
|
Rent
(3) (7)
|
Rent
|
Square Foot
|
||||||||||
|
Available
|
—
|
|
199,749
|
|
7.4
|
%
|
$
|
—
|
|
—
|
%
|
$
|
—
|
|
||
|
Signed leases not commenced
|
4
|
|
36,858
|
|
1.4
|
%
|
—
|
|
—
|
%
|
—
|
|
||||
|
2017
|
27
|
|
95,849
|
|
3.5
|
%
|
5,317,993
|
|
4.2
|
%
|
55.48
|
|
||||
|
2018
|
19
|
|
68,554
|
|
2.5
|
%
|
3,884,488
|
|
3.0
|
%
|
56.66
|
|
||||
|
2019
|
17
|
|
72,186
|
|
2.7
|
%
|
3,492,419
|
|
2.7
|
%
|
48.38
|
|
||||
|
2020
|
39
|
|
305,273
|
|
11.3
|
%
|
17,226,096
|
|
13.5
|
%
|
56.43
|
|
||||
|
2021
|
19
|
|
118,447
|
|
4.4
|
%
|
6,296,146
|
|
4.9
|
%
|
53.16
|
|
||||
|
2022
|
13
|
|
61,509
|
|
2.3
|
%
|
3,817,551
|
|
3.0
|
%
|
62.06
|
|
||||
|
2023
|
10
|
|
53,885
|
|
2.0
|
%
|
3,326,228
|
|
2.6
|
%
|
61.73
|
|
||||
|
2024
|
8
|
|
66,859
|
|
2.5
|
%
|
3,781,898
|
|
3.0
|
%
|
56.57
|
|
||||
|
2025
|
6
|
|
57,433
|
|
2.1
|
%
|
3,003,760
|
|
2.4
|
%
|
52.30
|
|
||||
|
2026
|
11
|
|
497,393
|
|
18.4
|
%
|
26,856,836
|
|
21.1
|
%
|
54.00
|
|
||||
|
Thereafter
|
13
|
|
1,072,207
|
|
39.5
|
%
|
50,560,016
|
|
39.6
|
%
|
47.16
|
|
||||
|
Total
|
186
|
|
2,706,202
|
|
100.0
|
%
|
$
|
127,563,431
|
|
100.0
|
%
|
$
|
51.65
|
|
||
41
The Empire State Building Broadcasting Licenses and Leases
|
Annualized
|
Percent of
|
||||||||||||||
|
Annualized
|
Expense
|
Annualized
|
Annualized
|
||||||||||||
|
Year of Lease Expiration
|
Base Rent
(8)
|
Reimbursements
|
Rent
(3)
|
Rent
|
|||||||||||
|
2017
|
$
|
5,341,238
|
|
$
|
3,649,488
|
|
$
|
8,990,726
|
|
30.9
|
%
|
||||
|
2018
|
5,226,644
|
|
2,762,405
|
|
7,989,049
|
|
27.5
|
%
|
|||||||
|
2019
|
212,240
|
|
47,628
|
|
259,868
|
|
0.9
|
%
|
|||||||
|
2020
|
1,513,053
|
|
412,901
|
|
1,925,954
|
|
6.6
|
%
|
|||||||
|
2021
|
2,186,388
|
|
328,181
|
|
2,514,569
|
|
8.6
|
%
|
|||||||
|
2022
|
2,101,006
|
|
330,299
|
|
2,431,305
|
|
8.4
|
%
|
|||||||
|
2023
|
651,922
|
|
113,019
|
|
764,941
|
|
2.6
|
%
|
|||||||
|
2024
|
44,558
|
|
43,054
|
|
87,612
|
|
0.3
|
%
|
|||||||
|
2025
|
1,599,000
|
|
287,415
|
|
1,886,415
|
|
6.5
|
%
|
|||||||
|
2026
|
750,000
|
|
177,666
|
|
927,666
|
|
3.2
|
%
|
|||||||
|
Thereafter
|
1,113,800
|
|
195,507
|
|
1,309,307
|
|
4.5
|
%
|
|||||||
|
Total
|
$
|
20,739,849
|
|
$
|
8,347,563
|
|
$
|
29,087,412
|
|
100.0
|
%
|
||||
|
(1)
|
If a lease has two different expiration dates, it is considered to be two leases (for the purposes of lease count and square footage).
|
|
(2)
|
Excludes (i) 151,618 rentable square feet across our portfolio attributable to building management use and tenant amenities and (ii) 69,789 square feet of space attributable to our observatory.
|
|
(3)
|
Represents annualized base rent and current reimbursement for operating expenses and real estate taxes.
|
|
(4)
|
Excludes (i) retail space in our Manhattan office properties and (ii) the Empire State Building broadcasting licenses and observatory operations.
|
|
(5)
|
Includes an aggregate of 501,653 rentable square feet of retail space in our Manhattan office properties. Excludes the Empire State Building broadcasting licenses and observatory operations.
|
|
(6)
|
Excludes retail space, broadcasting licenses and observatory operations.
|
|
(7)
|
Includes approximately $5.9 million of annualized rent related to physical space occupied by broadcasting tenants for their broadcasting operations. Does not include license fees charges to broadcast tenants.
|
|
(8)
|
Represents license fees for the use of the Empire State Building mast and base rent for the physical space occupied by broadcasting tenants.
|
Undeveloped Properties
We own entitled land that will support the development of a 17-story, multi-tenanted commercial office building that is expected to comprise approximately 380,000 rentable square feet on 13 floors of office space, which we refer to as Metro Tower. The site is directly adjacent to Metro Center, one of our office properties, and the Stamford Transportation Center. All required zoning approvals have been obtained to allow for development of Metro Tower. We intend to develop this site when we deem the appropriate combination of market and other conditions are in place.
Redevelopment and Repositioning
From 20
02 through 2006, we gradually gained full control of the day-to-day management of our Manhattan office properties (with the estate of Leona M. Helmsley previously holding certain approval rights at some of these properties as a result of its interest in the entities owning the properties). Since then, we have been undertaking a comprehensive redevelopment and repositioning strategy of our Manhattan office properties that has included the physical improvement through upgrades and modernization of, and tenant upgrades in, such properties. Since we assumed full control of the day-to-day management of our Manhattan office properties beginning with One Grand Central Place in 2002, and through
December 31, 2016
, we have invested a total of approximately
$719.0 million
(excluding tenant improvement costs and leasing commissions) in our Manhattan office properties pursuant to this program. Of the
$719.0 million
invested pursuant to this program,
$379.0 million
was invested at the Empire State Building. We intend to fund capital improvements through a combination of operating cash flow, cash on hand, and borrowings.
These improvements, within our redevelopment and repositioning program, include restored, renovated and upgraded or new lobbies; elevator modernization; renovated public areas and bathrooms; refurbished or new windows; upgrade and standardization of retail storefront and signage; façade restorations; modernization of building-wide systems; and enhanced tenant amenities. These improvements are designed to improve the overall value and attractiveness of our properties and have contributed significantly to our tenant repositioning efforts, which seek to increase our occupancy; raise our rental rates;
42
increase our rentable square feet; increase our aggregate rental revenue; lengthen our average lease term; increase our average lease size; and improve our tenant credit quality. We have also aggregated smaller spaces in order to offer larger blocks of office space, including multiple floors, that are attractive to larger, higher credit-quality tenants and to offer new, pre-built suites with improved layouts. This strategy has shown what we believe to be attractive results to date, and we believe has the potential to improve our operating margins and cash flows in the future. We believe we will continue to enhance our tenant base and improve rents as our pre-redevelopment leases continue to expire and be re-leased.
Please see Note 9 “Commitments and Contingencies” to the financial statements of this Annual Report in Form 10-K for a description of such legal proceedings.
Not applicable.
43
Market Information
Our Class A common stock is listed on the New York Stock Exchange (the "NYSE"), under the symbol "ESRT." Our Class B common stock is not listed on any exchange and is not traded. Each share of Class B common stock may be converted to one share of Class A common stock at any time.
Our operating partnership has four series of partnership units ("OP Units") - Series PR OP Units, Series ES OP Units, Series 60 OP Units and Series 250 OP Units. The Series ES OP Units, Series 60 OP Units and Series 250 OP Units (together the "traded OP units") are listed on the NYSE Arca, Inc. exchange ("NYSE Arca") under the symbols "ESBA," "OGCP," and "FISK," respectively. The Series PR OP Units are not listed on any exchange and are not traded.
On February 21, 2017, the last sales price for our Class A common stock on the NYSE was $21.49 per share.
The following table sets forth the high and low sales prices per share of our Class A common stock reported on the NYSE and the distributions declared and paid by us during the calendar quarters of 2016 and 2015:
|
2016 Quarters
|
|||||||||||||||
|
First
|
Second
|
Third
|
Fourth
|
||||||||||||
|
High
|
$
|
18.00
|
|
$
|
19.77
|
|
$
|
22.31
|
|
$
|
20.94
|
|
|||
|
Low
|
$
|
14.58
|
|
$
|
17.31
|
|
$
|
18.47
|
|
$
|
18.62
|
|
|||
|
Dividend per share
|
$
|
0.085
|
|
$
|
0.105
|
|
$
|
0.105
|
|
$
|
0.105
|
|
|||
|
2015 Quarters
|
|||||||||||||||
|
First
|
Second
|
Third
|
Fourth
|
||||||||||||
|
High
|
$
|
19.16
|
|
$
|
19.00
|
|
$
|
17.99
|
|
$
|
18.73
|
|
|||
|
Low
|
$
|
17.24
|
|
$
|
16.97
|
|
$
|
15.85
|
|
$
|
16.79
|
|
|||
|
Dividend per share
|
$
|
0.085
|
|
$
|
0.085
|
|
$
|
0.085
|
|
$
|
0.085
|
|
|||
Holders
As of February 21, 2017, we had 519 registered holders of our Class A common stock and 719 registered holders of our Class B common stock. As of February 21, 2017, our operating partnership had 797 registered holders of Series PR OP Units, 2,045 registered holders of Series ES OP Units, 666 registered holders of Series 60 OP Units and 450 registered holders of Series 250 OP Units. Such information was obtained through our registrar and transfer agent. Certain shares of common stock and OP Units are held in "street" name and accordingly, the number of beneficial owners of such shares of common stock and OP Units is not known or included in the foregoing number.
Dividends
We intend to pay regular quarterly dividends to holders of our Class A common stock and Class B common stock. Any distributions we pay in the future will depend upon our actual results of operations, economic conditions and other factors that could differ materially from our current expectations. Our actual results of operations will be affected by a number of factors, including the revenue we receive from our properties, our operating expenses, interest expense, the ability of our tenants to meet their obligations and unanticipated expenditures.
Distributions declared by us will be authorized by our board of directors in its sole discretion out of funds legally available therefor and will be dependent upon a number of factors, including restrictions under applicable law, our capital requirements and the distribution requirements necessary to maintain our qualification as a REIT. See Item 1A, "Risk Factors," and Item 7, "Management's Discussion and Analysis of Financial Conditions and Results of Operations," of this Annual Report on Form 10-K, for information regarding the sources of funds used for dividends and for a discussion of factors, if any, which may adversely affect our ability to make distributions to our securityholders.
44
Earnings and profits, which determine the tax treatment of distributions to securityholders, will differ from income reported for financial reporting purposes due to the differences for federal income tax purposes, including, but not limited to, treatment of loss on extinguishment of debt, revenue recognition, compensation expense, and basis of depreciable assets and estimated useful lives used to compute depreciation. The 2016 dividends of $0.40 per share are classified for income tax purposes as 100.0% taxable ordinary dividends.
Stockholder Return Performance
The following graph is a comparison of the cumulative total stockholder return on our Class A common stock, the Standard & Poor's 500 Index (the "S&P 500 Index"), the NAREIT All Equity Index (the "NAREIT All Equity Index") and the NAREIT Office Index ("NAREIT Office Index"). The graph assumes that $100.00 was invested on October 7, 2013 and dividends were reinvested without the payment of any commissions. There can be no assurance that the performance of our shares will continue in line with the same or similar trends depicted in the graph below.
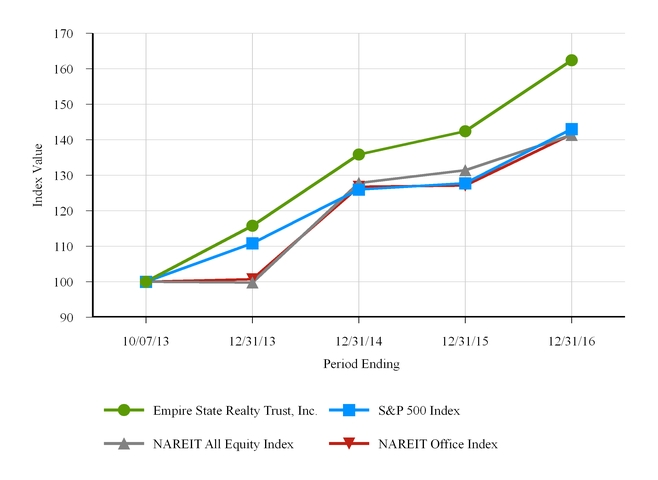
|
October 7, 2013
|
December 31, 2013
|
December 31, 2014
|
December 31, 2015
|
December 31, 2016
|
|||||||||||||||
|
Empire State Realty Trust, Inc.
|
$
|
100.00
|
|
$
|
115.77
|
|
$
|
135.85
|
|
$
|
142.39
|
|
$
|
162.43
|
|
||||
|
S&P 500 Index
|
$
|
100.00
|
|
$
|
110.84
|
|
$
|
126.01
|
|
$
|
127.75
|
|
$
|
143.03
|
|
||||
|
NAREIT All Equity Index
|
$
|
100.00
|
|
$
|
99.83
|
|
$
|
127.81
|
|
$
|
131.42
|
|
$
|
141.39
|
|
||||
|
NAREIT Office Index
|
$
|
100.00
|
|
$
|
100.71
|
|
$
|
126.75
|
|
$
|
127.11
|
|
$
|
141.60
|
|
||||
The graph shall not be deemed incorporated by reference by any general statement of incorporation by reference in any filing made under the Securities Act of 1933, as amended (the "Securities Act"), or the Securities Exchange Act of 1934, as amended (the "Exchange Act" and, together with the Securities Act, the "Acts"), and shall not otherwise be deemed filed under such Acts.
45
Securities Authorized For Issuance Under Equity Compensation Plans
During 2013, we adopted our Empire State Realty Trust, Inc. Empire State Realty OP, L.P. 2013 Equity Incentive Plan, as amended and restated as of April 4, 2016 (the "Plan"). The Plan provides for grants of stock options, shares of restricted Class A common stock, dividend equivalent rights and other equity-based awards, including LTIP Units, up to an aggregate of 12.2 million shares of our common stock. For a further discussion of the Plan, see Note 10 to the consolidated financial statements included under Item 8 "Financial Statements and Supplementary Data" of this Annual Report on Form 10-K.
The following table presents certain information about our equity compensation plans as of
December 31, 2016
:
|
Number of securities to be issued upon exercise of outstanding options, warrants and rights
|
Weighted-average exercise price of outstanding options, warrants and rights
|
Number of securities remaining available for future issuance under equity compensation plans (excluding securities reflected in the first column of this table)
|
|||||||
|
Plan Category
|
|||||||||
|
Equity compensation plans approved by securityholders
|
N/A
|
N/A
|
8,290,874
|
|
|||||
|
Equity compensation plans not approved by securityholders
|
—
|
|
—
|
|
—
|
|
|||
|
Total
|
N/A
|
N/A
|
8,290,874
|
|
|||||
As of
December 31, 2016
, we issued
219,673
shares of restricted stock and
3,709,968
LTIP units under the Plan.
Recent Sales of Unregistered Securities Use of Proceeds from Registered Securities; Repurchases
None.
The following table sets forth our selected financial data and should be read in conjunction with our Financial Statements and notes thereto included in Item 8, "Financial Statements and Supplementary Data" and Item 7, "Management's Discussion and Analysis of Financial Condition and Results of Operations" in this Annual Report on Form 10-K.
46
|
The Company
|
The Predecessor
|
||||||||||||||||||||||
|
Year Ended December 31,
|
October 7, through December 31, 2013
|
January 1, through October 6, 2013
|
Year Ended December 31, 2012
|
||||||||||||||||||||
|
(amounts in thousands, except per share data)
|
2016
|
2015
|
2014
|
||||||||||||||||||||
|
Operating Data
|
|||||||||||||||||||||||
|
Total revenues
|
$
|
678,000
|
|
$
|
657,634
|
|
$
|
635,326
|
|
$
|
127,583
|
|
$
|
206,072
|
|
$
|
260,294
|
|
|||||
|
Operating expenses:
|
|
|
|
||||||||||||||||||||
|
Property operating expenses
|
153,850
|
|
158,638
|
|
148,676
|
|
33,074
|
|
41,297
|
|
55,707
|
|
|||||||||||
|
Ground rent expenses
|
9,326
|
|
9,326
|
|
5,339
|
|
398
|
|
—
|
|
—
|
|
|||||||||||
|
General and administrative expenses
|
49,078
|
|
38,073
|
|
39,037
|
|
16,379
|
|
23,600
|
|
20,963
|
|
|||||||||||
|
Observatory expenses
|
29,833
|
|
32,174
|
|
31,413
|
|
6,668
|
|
—
|
|
—
|
|
|||||||||||
|
Construction expenses
|
—
|
|
3,222
|
|
38,596
|
|
5,468
|
|
19,821
|
|
19,592
|
|
|||||||||||
|
Real estate taxes
|
96,061
|
|
93,165
|
|
82,131
|
|
17,191
|
|
24,331
|
|
30,406
|
|
|||||||||||
|
Formation transaction expenses
|
—
|
|
—
|
|
—
|
|
—
|
|
4,507
|
|
2,247
|
|
|||||||||||
|
Acquisition expenses
|
98
|
|
193
|
|
3,382
|
|
138,140
|
|
—
|
|
—
|
|
|||||||||||
|
Depreciation and amortization
|
155,211
|
|
171,474
|
|
145,431
|
|
27,375
|
|
38,963
|
|
42,690
|
|
|||||||||||
|
Total operating expenses
|
493,457
|
|
506,265
|
|
494,005
|
|
244,693
|
|
152,519
|
|
171,605
|
|
|||||||||||
|
Operating income (loss)
|
184,543
|
|
151,369
|
|
141,321
|
|
(117,110
|
)
|
53,553
|
|
88,689
|
|
|||||||||||
|
Other income (expense):
|
|||||||||||||||||||||||
|
Equity in net income of non-controlled entities
|
—
|
|
—
|
|
—
|
|
—
|
|
14,875
|
|
14,348
|
|
|||||||||||
|
Interest expense
|
(71,147
|
)
|
(67,492
|
)
|
(66,456
|
)
|
(13,147
|
)
|
(50,660
|
)
|
(54,394
|
)
|
|||||||||||
|
Settlement expense
|
—
|
|
—
|
|
—
|
|
—
|
|
(55,000
|
)
|
—
|
|
|||||||||||
|
Gain on consolidation of non-controlled entities
|
—
|
|
—
|
|
—
|
|
322,563
|
|
—
|
|
—
|
|
|||||||||||
|
Income (loss) before income taxes
|
113,396
|
|
83,877
|
|
74,865
|
|
192,306
|
|
(37,232
|
)
|
48,643
|
|
|||||||||||
|
Income tax (expense) benefit
|
(6,146
|
)
|
(3,949
|
)
|
(4,655
|
)
|
1,125
|
|
—
|
|
—
|
|
|||||||||||
|
Net income (loss)
|
107,250
|
|
79,928
|
|
70,210
|
|
193,431
|
|
(37,232
|
)
|
48,643
|
|
|||||||||||
|
Private perpetual preferred unit distributions
|
(936
|
)
|
(936
|
)
|
(476
|
)
|
—
|
|
—
|
|
—
|
|
|||||||||||
|
Net income attributable to non-controlling interests
|
(54,858
|
)
|
(45,262
|
)
|
(43,067
|
)
|
(118,186
|
)
|
—
|
|
—
|
|
|||||||||||
|
Net income (loss) attributable to the predecessor
|
—
|
|
—
|
|
—
|
|
—
|
|
37,232
|
|
(48,643
|
)
|
|||||||||||
|
Net income attributable to common stockholders
|
$
|
51,456
|
|
$
|
33,730
|
|
$
|
26,667
|
|
$
|
75,245
|
|
$
|
—
|
|
$
|
—
|
|
|||||
|
Dividends and distributions declared and paid per share
|
$
|
0.40
|
|
$
|
0.34
|
|
$
|
0.34
|
|
$
|
0.0795
|
|
|||||||||||
|
Net income per share attributable to common stockholders - basic
|
$
|
0.38
|
|
$
|
0.30
|
|
$
|
0.27
|
|
$
|
0.79
|
|
|||||||||||
|
Net income per share attributable to common stockholders - diluted
|
$
|
0.38
|
|
$
|
0.29
|
|
$
|
0.27
|
|
$
|
0.79
|
|
|||||||||||
|
Total weighted average shares - basic
|
133,881
|
|
114,245
|
|
97,941
|
|
95,463
|
|
|||||||||||||||
|
Total weighted average shares - diluted
|
277,568
|
|
266,621
|
|
254,506
|
|
244,420
|
|
|||||||||||||||
|
Balance Sheet Data
|
|||||||||||||||||||||||
|
Commercial real estate properties, at cost
|
$
|
2,458,629
|
|
$
|
2,276,330
|
|
$
|
2,139,863
|
|
$
|
1,649,423
|
|
$
|
939,330
|
|
||||||||
|
Total assets
|
$
|
3,890,953
|
|
$
|
3,300,650
|
|
$
|
3,283,497
|
|
$
|
2,459,862
|
|
$
|
1,052,553
|
|
||||||||
|
Debt
|
$
|
1,612,331
|
|
$
|
1,632,416
|
|
$
|
1,598,654
|
|
$
|
1,191,913
|
|
$
|
996,489
|
|
||||||||
|
Equity
|
$
|
1,982,863
|
|
$
|
1,372,686
|
|
$
|
1,381,097
|
|
$
|
1,003,185
|
|
$
|
—
|
|
||||||||
|
Predecessor owners' equity (deficit)
|
$
|
—
|
|
$
|
—
|
|
$
|
—
|
|
$
|
—
|
|
$
|
(10,859
|
)
|
||||||||
|
Other Data
|
|||||||||||||||||||||||
|
Funds from operations attributable to common stockholders and non-controlling interests
(1)
|
$
|
260,519
|
|
$
|
249,924
|
|
$
|
214,849
|
|
$
|
220,783
|
|
$
|
7,432
|
|
$
|
97,943
|
|
|||||
|
Modified funds from operations attributable to common stockholders and non-controlling interests
(2)
|
$
|
268,350
|
|
$
|
257,755
|
|
$
|
219,452
|
|
$
|
221,181
|
|
$
|
7,432
|
|
$
|
97,943
|
|
|||||
|
Core funds from operations attributable to common stockholders and non-controlling interests
(3)
|
$
|
269,000
|
|
$
|
257,677
|
|
$
|
227,422
|
|
$
|
41,793
|
|
$
|
62,432
|
|
$
|
97,943
|
|
|||||
|
Net cash provided by (used in) operating activities
|
$
|
218,583
|
|
$
|
203,187
|
|
$
|
138,558
|
|
$
|
(131,927
|
)
|
$
|
73,381
|
|
$
|
94,353
|
|
|||||
|
Net cash used in investing activities
|
$
|
(181,838
|
)
|
$
|
(142,316
|
)
|
$
|
(299,057
|
)
|
$
|
(620,307
|
)
|
$
|
(56,450
|
)
|
$
|
(108,281
|
)
|
|||||
|
Net cash provided by (used in) financing activities
|
$
|
470,941
|
|
$
|
(59,918
|
)
|
$
|
145,488
|
|
$
|
696,017
|
|
$
|
48,530
|
|
$
|
(20,889
|
)
|
|||||
47
______________
|
(1)
|
We compute Funds From Operations ("FFO") in accordance with the “White Paper” on FFO published by the National Association of Real Estate Investment Trusts, or NAREIT, which defines FFO as net income (loss) (determined in accordance with GAAP), excluding impairment writedowns of investments in depreciable real estate and investments in in-substance real estate investments, gains or losses from debt restructurings and sales of depreciable operating properties, plus real estate-related depreciation and amortization (excluding amortization of deferred financing costs), less distributions to non-controlling interests and gains/losses from discontinued operations and after adjustments for unconsolidated partnerships and joint ventures. FFO is a widely recognized non-GAAP financial measure for REITs that we believe, when considered with financial statements determined in accordance with GAAP, is useful to investors in understanding financial performance and providing a relevant basis for comparison among REITs. In addition, FFO is useful to investors as it captures features particular to real estate performance by recognizing that real estate has generally appreciated over time or maintains residual value to a much greater extent than do other depreciable assets. Investors should review FFO, along with GAAP net income, when trying to understand an equity REIT’s operating performance. We present FFO because we consider it an important supplemental measure of our operating performance and believe that it is frequently used by securities analysts, investors and other interested parties in the evaluation of REITs. However, because FFO excludes depreciation and amortization and captures neither the changes in the value of our properties that result from use or market conditions nor the level of capital expenditures and leasing commissions necessary to maintain the operating performance of our properties, all of which have real economic effect and could materially impact our results from operations, the utility of FFO as a measure of performance is limited. There can be no assurance that FFO presented by us is comparable to similarly titled measures of other REITs. FFO does not represent cash generated from operating activities and should not be considered as an alternative to net income (loss) determined in accordance with GAAP or to cash flow from operating activities determined in accordance with GAAP. FFO is not indicative of cash available to fund ongoing cash needs, including the ability to make cash distributions. Although FFO is a measure used for comparability in assessing the performance of REITs, as the NAREIT White Paper only provides guidelines for computing FFO, the computation of FFO may vary from one company to another. For a reconciliation of FFO, see "Item 7. Management's Discussion and Analysis of Financial Condition and Results of Operations - Funds from Operations."
|
|
(2)
|
Modified FFO adds back an adjustment for any above or below-market ground lease amortization to traditionally defined FFO. We consider this a useful supplemental measure in evaluating our operating performance due to the non-cash accounting treatment under GAAP, which stems from the third quarter 2014 acquisition of two option properties following our formation transactions as they carry significantly below market ground leases, the amortization of which is material to our overall results. We present Modified FFO because we consider it an important supplemental measure of our operating performance in that it adds back the non-cash amortization of below-market ground leases. There can be no assurance that Modified FFO presented by us is comparable to similarly titled measures of other REITs. Modified FFO does not represent cash generated from operating activities and should not be considered as an alternative to net income (loss) determined in accordance with GAAP or to cash flow from operating activities determined in accordance with GAAP. Modified FFO is not indicative of cash available to fund ongoing cash needs, including the ability to make cash distributions.
|
|
(3)
|
Core FFO adds back to traditionally defined FFO the following items associated with our initial public offering, or IPO, and formation transactions: gain on consolidation of non-controlling entities, acquisition expenses, severance expenses and retirement equity compensation expenses. It also adds back private perpetual preferred exchange offering expenses, acquisition expenses, prepayment penalty and deferred financing costs write-off and gain on settlement of lawsuit related to the Observatory, net of income taxes and ground lease amortization, construction severance expenses and acquisition break-up fee. We present Core FFO because we consider it an important supplemental measure of our operating performance in that it excludes items associated with the Offering and formation transactions. There can be no assurance that Core FFO presented by us is comparable to similarly titled measures of other REITs. Core FFO does not represent cash generated from operating activities and should not be considered as an alternative to net income (loss) determined in accordance with GAAP or to cash flow from operating activities determined in accordance with GAAP. Core FFO is not indicative of cash available to fund ongoing cash needs, including the ability to make cash distributions.
For a reconciliation of Core FFO, see "Item 7. Management's Discussion and Analysis of Financial Condition and Results of Operations - Core Funds from Operations."
|
48
FORWARD-LOOKING STATEMENTS
This Annual Report on Form 10-K contains forward-looking statements within the meaning of Section 27A of the Securities Act of 1933, as amended (the “Securities Act"), and Section 21E of the Securities Exchange Act of 1934, as amended (the “Exchange Act”). For these statements, we claim the protections of the safe harbor for forward-looking statements contained in such Section. Forward-looking statements are subject to substantial risks and uncertainties, many of which are difficult to predict and are generally beyond our control. In particular, statements pertaining to our capital resources, portfolio performance, dividend policy and results of operations contain forward-looking statements. Likewise, all of our statements regarding anticipated growth in our portfolio from operations, acquisitions and anticipated market conditions, demographics and results of operations are forward-looking statements. Forward-looking statements involve numerous risks and uncertainties and you should not rely on them as predictions of future events. You can identify forward-looking statements by the use of forward-looking terminology such as “believes,” “expects,” “may,” “will,” “should,” “seeks,” “approximately,” “intends,” “plans,” “estimates,” “contemplates,” “aims,” “continues,” “would” or “anticipates” or the negative of these words and phrases or similar words or phrases. Forward-looking statements depend on assumptions, data or methods which may be incorrect or imprecise and we may not be able to realize them. We do not guarantee that the transactions and events described will happen as described (or that they will happen at all). The following factors, among others, could cause actual results and future events to differ materially from those set forth or contemplated in the forward-looking statements:
• the factors included in this Annual Report on Form 10-K, including those set forth under the heading "Business," Risk Factors," and "Management’s Discussion and Analysis of Financial Condition and Results of Operations";
• changes in our industry, the real estate markets, either nationally or in Manhattan or the greater New York metropolitan area;
• resolution of legal proceedings involving the company;
• reduced demand for office or retail space;
• new office development in our market;
•
general volatility of the capital and credit markets and the market price of our Class A common stock and our publicly-traded OP Units;
• changes in our business strategy;
• changes in technology and market competition, which affect utilization of our broadcast or other facilities;
• changes in domestic or international tourism, including geopolitical events and currency exchange rates;
• defaults on, early terminations of, or non-renewal of leases by, tenants;
• bankruptcy or insolvency of a major tenant or a significant number of smaller tenants;
• fluctuations in interest rates;
• increased operating costs;
• declining real estate valuations and impairment charges;
• termination or expiration of our ground leases;
• availability, terms and deployment of capital;
• our failure to obtain necessary outside financing, including our unsecured revolving credit facility;
• our leverage;
• decreased rental rates or increased vacancy rates;
• our failure to generate sufficient cash flows to service our outstanding indebtedness;
• our failure to redevelop and reposition properties successfully or on the anticipated timeline or at the anticipated costs;
• difficulties in identifying properties to acquire and completing acquisitions;
• risks of real estate development (including our Metro Tower development site), including the cost of construction delays and cost overruns;
• inability to manage our properties and our growth effectively;
• inability to make distributions to our securityholders in the future;
• impact of changes in governmental regulations, tax law and rates and similar matters;
• failure to continue to qualify as a real estate investment trust, or REIT;
• a future terrorist event in the U.S.;
• environmental uncertainties and risks related to adverse weather conditions and natural disasters;
• lack or insufficient amounts of insurance;
• misunderstanding of our competition;
• changes in real estate and zoning laws and increases in real property tax rates;
49
• inability to comply with the laws, rules and regulations applicable to similar companies; and
• risks associated with security breaches through cyberattacks, cyber intrusions or otherwise, as well as other significant disruptions of our technology (IT) networks related systems, which support our operations and our buildings.
While forward-looking statements reflect our good faith beliefs, they are not guarantees of future performance. Actual results may differ materially from our current projection. We disclaim any obligation to publicly update or revise any forward-looking statement to reflect changes in underlying assumptions or factors, of new information, data or methods, future events or other changes after the date of this Annual Report on Form 10-K, except as required by applicable law. For a further discussion of these and other factors that could impact our future results, performance or transactions, see the section entitled “Risk Factors" of this Annual Report on Form 10-K. You should not place undue reliance on any forward-looking statements, which are based only on information currently available to us.
Overview
Unless the context otherwise requires or indicates, references in this section to "we," "our" and "us" refer to (i) our company and its consolidated subsidiaries.
The following discussion and analysis should be read in conjunction with "Selected Financial Data," and our consolidated financial statements as of December 31, 2016 and 2015 and for the years ended December 31, 2016, 2015 and 2014 and the notes related thereto which are included in this Annual Report on Form 10-K.
2016 Highlights
|
•
|
Achieved net income attributable to the Company of $51.5 million and Core FFO of $269.0 million.
|
|
•
|
Occupancy and leased percentages at December 31, 2016:
|
|
•
|
Total portfolio was 88.1% occupied; including signed leases not commenced (“SLNC”), the total portfolio was 90.2% leased.
|
|
•
|
Manhattan office portfolio (excluding the retail component of these properties) was 86.8% occupied; including SLNC, the Manhattan office portfolio was 89.1% leased.
|
|
•
|
Retail portfolio was 88.6% occupied; including SLNC, the retail portfolio was 89.6% leased.
|
|
•
|
Empire State Building was 90.5% occupied; including SLNC, the Empire State Building was 91.8% leased.
|
|
•
|
Executed 207 leases, representing 991,806 rentable square feet across the total portfolio, achieving a 32.7% increase in mark-to-market rent over previously fully escalated rents on new, renewal, and expansion leases; 155 of these leases, representing 724,417 rentable square feet, were within the Manhattan office portfolio (excluding the retail component of these properties) capturing a 42.2% increase in mark-to-market rent over previously fully escalated rents on new, renewal and expansion leases.
|
|
•
|
Executed 19 leases, representing 47,835 rentable square feet within the Manhattan retail portfolio, achieving a 35.0% increase in mark-to-market rent over previously fully escalated rents on new, renewal, and expansion leases.
|
|
•
|
Signed 78 new leases representing 542,190 rentable square feet in 2016 for the Manhattan office portfolio (excluding the retail component of these properties), achieving an increase of 50.6% in mark-to-market rent over expired previously fully escalated rents.
|
|
•
|
The Empire State Building Observatory revenue grew 11.2% to $124.8 million from $112.2 million in 2015.
|
|
•
|
Issued 29,610,854 Class A common shares at $21.00 per share in a private placement transaction with QIA which raised approximately $622 million in gross proceeds.
|
|
•
|
Increased the Company’s committed borrowing capacity under the unsecured revolving credit facility from $800 million to $1.1 billion.
|
50
|
•
|
Declared and paid aggregate dividends of $0.40 per share during 2016, an 18% increase from the previous year.
|
As of
December 31, 2016
, our total portfolio, contained
10.1 million
rentable square feet of office and retail space. We owned 14 office properties (including three long-term ground leasehold interests) encompassing approximately 9.4 million rentable square feet of office space. Nine of these properties are located in the midtown Manhattan market and aggregate approximately 7.6 million rentable square feet of office space, including the Empire State Building. Our Manhattan office properties also contain an aggregate of 501,653 rentable square feet of premier retail space on their ground floor and/or contiguous levels. Our remaining five office properties are located in Fairfield County, Connecticut and Westchester County, New York, encompassing in the aggregate approximately 1.9 million rentable square feet. The majority of square footage for these five properties is located in densely populated metropolitan communities with immediate access to mass transportation. Additionally, we have entitled land at the Stamford Transportation Center in Stamford, Connecticut, adjacent to one of our office properties, that will support the development of an approximately 380,000 rentable square foot office building and garage, which we refer to herein as Metro Tower. As of
December 31, 2016
, our portfolio included four standalone retail properties located in Manhattan and two standalone retail properties located in the city center of Westport, Connecticut, encompassing 204,452 rentable square feet in the aggregate.
The Empire State Building is our flagship property. The Empire State Building provides us with a diverse source of revenue through its office and retail leases, observatory operations and broadcasting licenses, and related leased space. Our observatory operations are a separate reporting segment. Our observatory operations are subject to regular patterns of tourist activity in Manhattan. During the past ten years, approximately 16% to 18% of our annual observatory revenue was realized in the first quarter, 26.0% to 28.0% was realized in the second quarter, 31.0% to 33.0% was realized in the third quarter, and 23.0% to 25.0% was realized in the fourth quarter.
The components of the Empire State Building revenue are as follows (dollars in thousands):
|
Year Ended December 31,
|
|||||||||||||
|
2016
|
2015
|
||||||||||||
|
Office leases
|
$
|
120,082
|
|
39.1
|
%
|
$
|
108,873
|
|
37.5
|
%
|
|||
|
Retail leases
|
9,313
|
|
3.0
|
%
|
11,092
|
|
3.8
|
%
|
|||||
|
Tenant reimbursements & other income
|
24,153
|
|
7.9
|
%
|
28,061
|
|
9.7
|
%
|
|||||
|
Observatory operations
|
124,814
|
|
40.6
|
%
|
112,172
|
|
38.7
|
%
|
|||||
|
Broadcasting licenses and leases
|
28,905
|
|
9.4
|
%
|
29,837
|
|
10.3
|
%
|
|||||
|
Total
|
$
|
307,267
|
|
100.0
|
%
|
$
|
290,035
|
|
100.0
|
%
|
|||
We have been undertaking a comprehensive redevelopment and repositioning strategy of our Manhattan office properties. This strategy is designed to improve the overall value and attractiveness of our properties and has: contributed significantly to our tenant repositioning efforts, which seek to increase our occupancy; raise our rental rates; increase our rentable square feet; increase our aggregate rental revenue; lengthen our average lease term; increase our average lease size; and improve our tenant credit quality. These improvements include: restored, renovated and upgraded or new lobbies; elevator modernization; renovated public areas and bathrooms; refurbished or new windows; upgrade and standardization of retail storefront and signage; façade restorations; modernization of building-wide systems; and enhanced tenant amenities. We
have also aggregated smaller spaces in order to offer larger blocks of office space, including multiple floors, that are attractive to larger, higher credit-quality tenants and to offer new, pre-built suites with improved layouts. This strategy has shown what we believe to be attractive results to date, and we believe has the potential to improve our operating margins and cash flows in the future. We believe we will continue to enhance our tenant base and improve rents as our pre-redevelopment leases continue to expire and be re-leased. From 2002 through
December 31, 2016
, we have invested a total of approximately
$719.0 million
(excluding tenant improvement costs and leasing commissions) in our Manhattan office properties pursuant to this program. We are in the process of substantially completing the redevelopment and repositioning program as originally contemplated. We intend to fund these capital improvements through a combination of operating cash flow, cash on hand and borrowings.
As of
December 31, 2016
, excluding principal amortization, we have approximately
$336.0 million
of debt maturing in 2017 and approximately
$262.2 million
of debt maturing in 2018, and we have total debt outstanding of approximately
$1.6 billion
, with a weighted average interest rate of
4.19%
(excluding premiums and discount) and a weighted average maturity of
4.7
years and
83.6%
of which is fixed-rate indebtedness. Our consolidated net debt to total market capitalization was approximately 14.9% as of
December 31, 2016
.
51
As of March 27, 2015, we no longer solicited new business for our construction management business. We have since completed all projects that were in progress and closed that business.
Results of Operations
Overview
The discussion below relates to the financial condition and results of operations for the years ended December 31, 2016, 2015, and 2014.
Year Ended
December 31, 2016
Compared to the Year Ended
December 31, 2015
The following table summarizes the historical results of operations for the years ended
December 31, 2016
and 2015
(amounts in thousands)
:
|
Years Ended December 31,
|
|||||||||||||
|
2016
|
2015
|
Change
|
%
|
||||||||||
|
Revenues:
|
|||||||||||||
|
Rental revenue
|
$
|
460,653
|
|
$
|
447,784
|
|
$
|
12,869
|
|
2.9
|
%
|
||
|
Tenant expense reimbursement
|
73,459
|
|
79,516
|
|
(6,057
|
)
|
(7.6
|
)%
|
|||||
|
Observatory revenue
|
124,814
|
|
112,172
|
|
12,642
|
|
11.3
|
%
|
|||||
|
Construction revenue
|
—
|
|
1,981
|
|
(1,981
|
)
|
(100.0
|
)%
|
|||||
|
Third-party management and other fees
|
1,766
|
|
2,133
|
|
(367
|
)
|
(17.2
|
)%
|
|||||
|
Other revenues and fees
|
17,308
|
|
14,048
|
|
3,260
|
|
23.2
|
%
|
|||||
|
Total revenues
|
678,000
|
|
657,634
|
|
20,366
|
|
3.1
|
%
|
|||||
|
Operating expenses:
|
|||||||||||||
|
Property operating expenses
|
153,850
|
|
158,638
|
|
(4,788
|
)
|
(3.0
|
)%
|
|||||
|
Ground rent expenses
|
9,326
|
|
9,326
|
|
—
|
|
—
|
%
|
|||||
|
General and administrative expenses
|
49,078
|
|
38,073
|
|
11,005
|
|
28.9
|
%
|
|||||
|
Observatory expenses
|
29,833
|
|
32,174
|
|
(2,341
|
)
|
(7.3
|
)%
|
|||||
|
Construction expenses
|
—
|
|
3,222
|
|
(3,222
|
)
|
(100.0
|
)%
|
|||||
|
Real estate taxes
|
96,061
|
|
93,165
|
|
2,896
|
|
3.1
|
%
|
|||||
|
Acquisition expenses
|
98
|
|
193
|
|
(95
|
)
|
(49.2
|
)%
|
|||||
|
Depreciation and amortization
|
155,211
|
|
171,474
|
|
(16,263
|
)
|
(9.5
|
)%
|
|||||
|
Total operating expenses
|
493,457
|
|
506,265
|
|
(12,808
|
)
|
(2.5
|
)%
|
|||||
|
Operating income
|
184,543
|
|
151,369
|
|
33,174
|
|
21.9
|
%
|
|||||
|
Interest expense
|
(71,147
|
)
|
(67,492
|
)
|
(3,655
|
)
|
5.4
|
%
|
|||||
|
Income before income taxes
|
113,396
|
|
83,877
|
|
29,519
|
|
35.2
|
%
|
|||||
|
Income tax expense
|
(6,146
|
)
|
(3,949
|
)
|
(2,197
|
)
|
55.6
|
%
|
|||||
|
Net income
|
107,250
|
|
79,928
|
|
27,322
|
|
34.2
|
%
|
|||||
|
Private perpetual preferred unit distributions
|
(936
|
)
|
(936
|
)
|
—
|
|
—
|
%
|
|||||
|
Net income attributable to non-controlling interests
|
(54,858
|
)
|
(45,262
|
)
|
(9,596
|
)
|
(21.2
|
)%
|
|||||
|
Net income attributable to common shareholders
|
$
|
51,456
|
|
$
|
33,730
|
|
$
|
17,726
|
|
52.6
|
%
|
||
Rental Revenue
The increase in rental income was primarily attributable to increased rental rates.
Tenant Expense Reimbursement
The decrease in tenant expense reimbursement was primarily due to a decrease in property operating expenses in the year ended December 31, 2016.
Observatory Revenue
The increase in observatory revenues was due to increased tourist visits, ticket price increases, changes in ticket mix and more favorable weather conditions in 2016.
52
Construction Revenue
The construction business ceased operations in 2015, which is reflected in the elimination of construction revenues.
Third-Party Management and Other Fees
The decrease reflects lower management fee income due to the wind-down of activities in managed entities.
Other Revenues and Fees
The increase in other revenues and fees was primarily due to higher lease cancellation income of $5.7 million in 2016, partially offset by a $2.5 million acquisition break-up fee received in 2015.
Property Operating Expenses
The decrease in property operating expenses was primarily due to lower repairs and maintenance costs and lower utility costs.
Ground Rent Expenses
The ground rent expense was consistent with 2015.
General and Administrative Expenses
The increase in general and administrative expenses was due to $5.2 million related to higher 2016 incentive compensation bonus accruals and salaries, $4.2 million related to higher equity compensation expense and $1.7 million of incremental legal costs pertaining to formation transactions litigation.
Observatory Expenses
The decrease in Observatory expenses primarily reflects lower personnel costs and lower professional fees.
Construction Expenses
The construction business ceased operations in 2015, which is reflected in the elimination of construction expenses.
Real Estate Taxes
The increase in real estate taxes was primarily attributable to higher assessed values for several properties.
Acquisition Expenses
Acquisition expenses were consistent with 2015.
Depreciation and Amortization
The decrease in depreciation and amortization was primarily attributable to assets that became fully depreciated during 2015 and 2016.
Interest Expense
The increase in interest expense was due to higher interest rates. In March 2015, we issued $350.0 million of senior unsecured notes with a weighted average fixed interest rate of 4.08%. The proceeds were partially used to repay our unsecured revolving credit facility which had a variable interest rate of 1.33% in the first quarter 2015.
Income Taxes
The increase in income tax expense was attributable to activities within our taxable REIT subsidiaries, primarily due to higher Observatory taxable income.
Private Perpetual Preferred Unit Distributions
Represents distributions to holders of private perpetual preferred units which were issued in August 2014.
53
Net Income Attributable to Non-controlling Interests
The increase is due to an increase in net income offset by a lower non-controlling ownership percentage due to issuance of new Class A common shares and redemption of operating partnership units into Class A common shares.
Year Ended December 31, 2015 Compared to the Year Ended December 31, 2014
The following table summarizes the historical results of operations for years ended December 31, 2015 and 2014 (amounts in thousands):
|
Years Ended December 31,
|
||||||||||||||
|
2015
|
2014
|
Change
|
%
|
|||||||||||
|
Revenues:
|
||||||||||||||
|
Rental revenue
|
$
|
447,784
|
|
$
|
400,825
|
|
$
|
46,959
|
|
11.7
|
%
|
|||
|
Tenant expense reimbursement
|
79,516
|
|
67,651
|
|
11,865
|
|
17.5
|
%
|
||||||
|
Observatory revenue
|
112,172
|
|
111,541
|
|
631
|
|
0.6
|
%
|
||||||
|
Construction revenue
|
1,981
|
|
38,648
|
|
(36,667
|
)
|
(94.9
|
)%
|
||||||
|
Third-party management and other fees
|
2,133
|
|
2,376
|
|
(243
|
)
|
(10.2
|
)%
|
||||||
|
Other revenues and fees
|
14,048
|
|
14,285
|
|
(237
|
)
|
(1.7
|
)%
|
||||||
|
Total revenues
|
657,634
|
|
635,326
|
|
22,308
|
|
3.5
|
%
|
||||||
|
Operating expenses:
|
|
|||||||||||||
|
Property operating expenses
|
158,638
|
|
148,676
|
|
9,962
|
|
6.7
|
%
|
||||||
|
Ground rent expenses
|
9,326
|
|
5,339
|
|
3,987
|
|
74.7
|
%
|
||||||
|
General and administrative expenses
|
38,073
|
|
39,037
|
|
(964
|
)
|
(2.5
|
)%
|
||||||
|
Observatory expenses
|
32,174
|
|
31,413
|
|
761
|
|
2.4
|
%
|
||||||
|
Construction expenses
|
3,222
|
|
38,596
|
|
(35,374
|
)
|
(91.7
|
)%
|
||||||
|
Real estate taxes
|
93,165
|
|
82,131
|
|
11,034
|
|
13.4
|
%
|
||||||
|
Acquisition expenses
|
193
|
|
3,382
|
|
(3,189
|
)
|
(94.3
|
)%
|
||||||
|
Depreciation and amortization
|
171,474
|
|
145,431
|
|
26,043
|
|
17.9
|
%
|
||||||
|
Total operating expenses
|
506,265
|
|
494,005
|
|
12,260
|
|
2.5
|
%
|
||||||
|
Operating income (loss)
|
151,369
|
|
141,321
|
|
10,048
|
|
7.1
|
%
|
||||||
|
Interest expense
|
(67,492
|
)
|
(66,456
|
)
|
(1,036
|
)
|
1.6
|
%
|
||||||
|
Income before income taxes
|
83,877
|
|
74,865
|
|
9,012
|
|
12.0
|
%
|
||||||
|
Income tax (expense) benefit
|
(3,949
|
)
|
(4,655
|
)
|
706
|
|
(15.2
|
)%
|
||||||
|
Net income
|
79,928
|
|
70,210
|
|
9,718
|
|
13.8
|
%
|
||||||
|
Private perpetual preferred unit distributions
|
(936
|
)
|
(476
|
)
|
(460
|
)
|
96.6
|
%
|
||||||
|
Net income attributable to non-controlling interests
|
(45,262
|
)
|
(43,067
|
)
|
(2,195
|
)
|
5.1
|
%
|
||||||
|
Net income attributable to common shareholders
|
$
|
33,730
|
|
$
|
26,667
|
|
$
|
7,063
|
|
26.5
|
%
|
|||
Rental Revenue
The increase in rental income was primarily attributable to the acquisition of two properties during July 2014 which increased rental income by $38.6 million. The remaining increase is primarily due to increased rental rates.
Tenant Expense Reimbursement
The increase in tenant expense reimbursement was primarily attributable to the acquisition of two properties during July 2014 which increased tenant expense reimbursements by $6.1 million. Higher real estate tax reimbursements, electric submeter expense reimbursements and cleaning reimbursements also contributed to the increase.
54
Observatory Revenue
2015 Observatory revenues were consistent with the 2014 revenues.
Construction Revenue
The construction business ceased operations during 2015, which is reflected in the decline in construction revenues.
Third-Party Management and Other Fees
The decrease in third party management and other fees revenue was primarily due to the acquisition of two properties during July 2014 and the subsequent elimination of fees due to the consolidation of these properties.
Other Revenues and Fees
The decrease in other revenues and fees was primarily due to lower lease cancellation income of $4.1 million offset by $2.5 million acquisition break-up fee income and increased parking income of $0.7 million.
Property Operating Expenses
The increase in property operating expenses was primarily attributable to the acquisition of two properties during July 2014 which increased property operating expenses by $10.1 million.
Ground Rent Expenses
The increase in ground rent expenses was attributable to the acquisition of two properties during July 2014.
General and Administrative Expenses
The variance was primarily due to private perpetual preferred exchange offering costs of $1.4 million which were incurred in the year ended 2014 and no such costs in 2015.
Observatory Expenses
2015 Observatory expenses were consistent with the 2014 expenses.
Construction Expenses
The decline in construction expenses correlated with the lower revenues due to the construction business ceasing operation in 2015. Construction expenses in 2015 included severance expenses of $0.9 million.
Real Estate Taxes
The increase in real estate taxes was primarily attributable to the acquisition of two properties during July 2014 which increased real estate taxes by $5.9 million, as well as higher taxes of $5.1 million resulting from higher assessed values and rates for several properties.
Acquisition Expenses
The decrease in acquisition expenses was primarily attributable to the acquisition of two properties during July 2014.
Depreciation and Amortization
The increase in depreciation and amortization was primarily attributable to the acquisition of two properties during July 2014 which increased depreciation and amortization by $23.4 million.
Interest Expense
The increase in interest expense was attributable to the acquisition of two properties during July 2014 and the write-off of $1.7 million of deferred finance costs related to the recast of the credit facility and the early repayments of mortgage loans. These higher expenses were partially offset by reductions in interest rates for debt refinanced during 2014 and 2015.
55
Income Taxes
Income taxes decreased due to taxable income activities within our TRSs, primarily lower taxable income related to our construction operations and Observatory operations.
Private Perpetual Preferred Unit Distributions
Represents distributions to holders of private perpetual preferred units which were issued in August 2014.
Net Income Attributable to Non-controlling Interests
The increase is due to an increase in net income offset by a lower non-controlling ownership percentage due to redemption of operating partnership units into Class A common shares.
Liquidity and Capital Resources
Liquidity is a measure of our ability to meet potential cash requirements, including ongoing commitments to repay borrowings, fund and maintain our assets and operations, including lease-up costs, fund our redevelopment and repositioning programs, acquire properties, make distributions to our securityholders and other general business needs. Based on the historical experience of our management and our business strategy, in the foreseeable future we anticipate we will generate positive cash flows from operations. In order to qualify as a REIT, we are required under the Code to distribute to our securityholders, on an annual basis, at least 90% of our REIT taxable income, determined without regard to the deduction for dividends paid and excluding net capital gains. We expect to make quarterly distributions to our securityholders.
While we may be able to anticipate and plan for certain liquidity needs, there may be unexpected increases in uses of cash that are beyond our control and which would affect our financial condition and results of operations. For example, we may be required to comply with new laws or regulations that cause us to incur unanticipated capital expenditures for our properties, thereby increasing our liquidity needs. Even if there are no material changes to our anticipated liquidity requirements, our sources of liquidity may be fewer than, and the funds available from such sources may be less than, anticipated or needed. Our primary sources of liquidity will generally consist of cash on hand and cash generated from our operating activities, debt issuances and unused borrowing capacity under our unsecured revolving credit facility. We expect to meet our short-term liquidity requirements, including distributions, operating expenses, working capital, debt service, and capital expenditures from cash flows from operations, debt issuances, and available borrowing capacity under our unsecured revolving credit facility. The availability of these borrowings is subject to the conditions set forth in the applicable loan agreements. We expect to meet our long-term capital requirements, including acquisitions, redevelopments and capital expenditures through our cash flows from operations, our unsecured revolving credit facility, mortgage financings, debt issuances, common and/or preferred equity issuances and asset sales. Our properties require periodic investments of capital for individual lease related tenant improvements allowances, general capital improvements and costs associated with capital expenditures. Our overall leverage will depend on our mix of investments and the cost of leverage. Our charter does not restrict the amount of leverage that we may use.
At
December 31, 2016
, we had approximately
$554.4 million
available in cash and cash equivalents and there was
$1.1 billion
available under our unsecured revolving credit facility.
On August 23, 2016, QIA purchased 29,610,854 newly issued Class A common shares at $21.00 per share, equivalent to a 9.9% economic interest in us on a fully diluted basis (representing a 19.4% ownership of Class A common shares), however, QIA can only vote shares equivalent to 9.9% of all voting securities, with the balance of their shares to be voted by us in accord with the votes of all other voting securities. QIA has a top-up right to maintain their ownership stake at 9.9% over time. We received approximately $621.8 million in gross proceeds from the sale. Proceeds from the investment were used to pay down the $45.0 million balance on our revolving credit facility. We intend to use the remaining proceeds for general corporate purposes, including redevelopment of the portfolio and future investments.
In addition, for an initial period of five years from August 23, 2016, QIA will have a right of first offer to co-invest with us as a joint venture partner in real estate investment opportunities initiated by us where we have elected, at our discretion, to seek out a joint venture partner. The right of first offer period will be extended for 30 months so long as at least one joint venture transaction is consummated by us and QIA during the initial term, and will be extended for a further 30-month term if at least one more joint venture transaction is consummated during such initial extension period.
As of
December 31, 2016
, we had approximately
$1.6 billion
of total consolidated indebtedness outstanding, with a weighted average interest rate of
4.19%
and a weighted average maturity of
4.7
years. As of
December 31, 2016
, exclusive of
56
principal amortization, we have approximately
$336.0 million
of debt maturing in 2017 and approximately
$262.2 million
of debt maturing in 2018. Given our current liquidity, including availability under our unsecured revolving credit facility, we believe we will be able to refinance the maturing debt.
Unsecured Revolving Credit Facility
On January 23, 2015, we entered into an unsecured revolving credit agreement, which is referred to herein as the “unsecured revolving credit facility,” with Bank of America, Merrill Lynch, Goldman Sachs and the other lenders party thereto. Merrill Lynch acted as joint lead arranger; Bank of America acted as administrative agent; and Goldman Sachs acted as syndication agent and joint lead arranger.
Amount.
The unsecured revolving credit facility is comprised of a revolving credit facility in the maximum original principal amount of $800.0 million. The unsecured revolving credit facility contains an accordion feature that would allow us to increase the maximum aggregate principal amount to $1.25 billion under specified circumstances. On July 6, 2016, we partially exercised the accordion feature and increased our borrowing capacity under the unsecured revolving credit facility from $800 million to $1.1 billion.
Guarantors.
Certain of our subsidiaries are guarantors of our obligations under the unsecured revolving credit facility.
Interest.
Amounts outstanding under the unsecured revolving credit facility will bear interest at a floating rate equal to, at our election, (x) a Eurodollar rate, plus a spread that we expect will range from 0.875% to 1.600% depending upon its leverage ratio and credit rating; or (y) a base rate, plus a spread that we expect will range from 0.000% to 0.600% depending upon its leverage ratio and credit rating. In addition, the unsecured revolving credit facility permits us to borrow at competitive bid rates determined in accordance with the procedures described in the unsecured revolving credit facility.
Maturity.
The unsecured revolving credit facility has an initial maturity of January 23, 2019. We have the option to extend the initial term of the unsecured revolving credit facility for up to two additional six-month periods, subject to certain conditions, including the payment of an extension fee equal to 0.075% of the then outstanding commitments under the unsecured revolving credit facility.
Financial Covenants.
The unsecured revolving credit facility includes the following financial covenants: (i) maximum leverage ratio of total indebtedness to total asset value of the loan parties and their consolidated subsidiaries will not exceed 60%, (ii) consolidated secured indebtedness will not exceed 40% of total asset value, (iii) tangible net worth will not be less than $745.4 million plus 75% of net equity proceeds received by the operating partnership (other than proceeds received within ninety (90) days after the redemption, retirement or repurchase of ownership or equity interests in the operating partnership up to the amount paid by the operating partnership in connection with such redemption, retirement or repurchase, where, the net effect is that the operating partnership shall not have increased its net worth as a result of any such proceeds), (iv) adjusted EBITDA (as defined in the unsecured revolving credit facility) to consolidated fixed charges will not be less than 1.50x, (v) the aggregate net operating income with respect to all unencumbered eligible properties to the portion of interest expense attributable to unsecured indebtedness will not be less than 1.75x, (vi) the ratio of total unsecured indebtedness to unencumbered asset value will not exceed 60%, and (vii) consolidated secured recourse indebtedness will not exceed 10% of total asset value (provided, however, this covenant shall not apply at any time after either the company or the operating partnership achieves debt ratings from at least two of Moody’s, S&P and Fitch, and such debt ratings are Baa3 or better (in the case of a rating by Moody’s) or BBB- or better (in the case of a rating by S&P or Fitch)). As of
December 31, 2016
, we were in compliance with the covenants, as described below:
|
Financial covenant
|
Required
|
December 31, 2016
|
In Compliance
|
||||
|
Maximum total leverage
|
< 60%
|
|
24.5
|
%
|
Yes
|
||
|
Maximum secured debt
|
< 40%
|
|
11.5
|
%
|
Yes
|
||
|
Minimum fixed charge coverage
|
> 1.50x
|
|
4.1x
|
Yes
|
|||
|
Minimum unencumbered interest coverage
|
> 1.75x
|
|
7.5x
|
Yes
|
|||
|
Maximum unsecured leverage
|
< 60%
|
|
21.8
|
%
|
Yes
|
||
|
Maximum secured recourse indebtedness
|
<10%
|
|
—
|
%
|
Yes
|
||
|
Minimum tangible net worth
|
$
|
1,203,815
|
|
$
|
1,648,433
|
|
Yes
|
57
Other Covenants.
The unsecured revolving credit facility contains customary covenants, including limitations on liens, investment, debt, fundamental changes, and transactions with affiliates, and requires certain customary financial reports.
Events of Default.
The unsecured revolving credit facility contains customary events of default (subject in certain cases to specified cure periods), including but not limited to non-payment, breach of covenants, representations or warranties, cross defaults, bankruptcy or other insolvency events, judgments, ERISA events, invalidity of loan documents, loss of real estate investment trust qualification, and occurrence of a change of control (defined in the definitive documentation for the unsecured credit facility).
Senior Unsecured Notes
During March 2015, we issued and sold an aggregate principal amount of $350.0 million of senior unsecured notes ("Series A, B and C Senior Notes") in a private placement to entities affiliated with Prudential Capital Group. The Series A, B and C Senior Notes consist of $100 million of 3.93% Series A Senior Notes due 2025, $125 million of 4.09% Series B Senior Notes due 2027, and $125 million of 4.18% Series C Senior Notes due 2030.
The Series A, B and C Senior Notes are senior unsecured obligations and are unconditionally guaranteed by each of our subsidiaries that guarantees indebtedness under the unsecured revolving credit facility. Interest on the Series A, B and C Senior Notes is payable quarterly.
The terms of the Series A, B and C Senior Notes include customary covenants, including limitations on liens, investment, debt, fundamental changes, and transactions with affiliates and require certain customary financial reports. The Series A, B and C Senior Notes also require compliance with financial ratios consistent with the unsecured credit facility including a maximum leverage ratio, a maximum secured leverage ratio, a minimum amount of tangible net worth, a minimum fixed charge coverage ratio, a minimum unencumbered interest coverage ratio, a maximum unsecured leverage ratio and a maximum amount of secured recourse indebtedness.
As of
December 31, 2016
, we were in compliance with the covenants under the
Series A, B and C Senior Notes.
Unsecured Term Loan Facility
During August 2015, we closed on a seven year $265.0 million senior unsecured term loan facility ("term loan facility"). The term loan facility matures on August 24, 2022. The term loan facility bears interest at a floating rate equal to, at our election, a LIBOR rate, plus a spread ranging from 1.400% to 2.350%; or a base rate, plus a spread ranging from 0.400% to 1.350%. In each case such spread is determined by our leverage ratio and credit rating. Pursuant to a forward interest rate swap agreement, we effectively fixed LIBOR at 2.1485% for $265.0 million of the term loan facility for the period from August 31, 2017 through maturity.
The terms of the term loan facility agreement include
customary covenants, including limitations on liens, investment, debt, fundamental changes, and transactions with affiliates and require certain customary financial reports. The term loan facility
requires compliance with financial ratios including a maximum leverage ratio, a maximum secured leverage ratio, a minimum amount of tangible net worth, a minimum fixed charge coverage ratio, a minimum unencumbered interest coverage ratio, a maximum unsecured leverage ratio and a maximum amount of secured recourse indebtedness. The term loan facility also contains customary events of default (subject in certain cases to specified cure periods). These terms in the term loan facility agreement are consistent with the terms under our unsecured revolving credit facility agreement. As of
December 31, 2016
, we were in compliance with the covenants under the term loan facility.
Senior Unsecured Notes - Exchangeable
During August 2014, we issued $250.0 million principal amount of 2.625% Exchangeable Senior Notes (“Senior Notes”) due August 2019. In connection with this offering, we received net proceeds of $246.9 million, after deducting the related underwriting discounts and commissions and issuance costs.
As of
December 31, 2016
, we had mortgage debt outstanding of
$759.0 million
. During 2016, we refinanced at a lower rate a $20.2 million 6% mortgage loan secured by 10 Union Square East with a new $50.0 million mortgage loan due
58
2026 which bears interest at a fixed rate of 3.7%. During 2015, we repaid a mortgage collateralized by 1359 Broadway and we repaid a mortgage collateralized by One Grand Central Place.
Leverage Policies
We expect to employ leverage in our capital structure in amounts determined from time to time by our board of directors. Although our board of directors has not adopted a policy that limits the total amount of indebtedness that we may incur, we anticipate that our board of directors will consider a number of factors in evaluating our level of indebtedness from time to time, as well as the amount of such indebtedness that will be either fixed or floating rate. Our charter and bylaws do not limit the amount or percentage of indebtedness that we may incur nor do they restrict the form in which our indebtedness will be taken (including, but not limited to, recourse or non-recourse debt and cross collateralized debt). Our overall leverage will depend on our mix of investments and the cost of leverage, however, we initially intend to maintain a level of indebtedness consistent with our plan to seek an investment grade credit rating. Our board of directors may from time to time modify our leverage policies in light of the then-current economic conditions, relative costs of debt and equity capital, market values of our properties, general market conditions for debt and equity securities, fluctuations in the market price of our common stock, growth and acquisition opportunities and other factors.
Capital Expenditures
The following tables summarize our tenant improvement costs, leasing commission costs and our capital expenditures for each of the periods presented (dollars in thousands, except per square foot amounts).
Office Properties
(1)
|
|
Years Ended December 31,
|
||||||||||
|
Total New Leases, Expansions, and Renewals
|
2016
|
2015
|
2014
|
||||||||
|
Number of leases signed
(2)
|
187
|
|
233
|
|
229
|
|
|||||
|
Total square feet
|
941,008
|
|
1,138,205
|
|
766,635
|
|
|||||
|
Leasing commission costs
(3)
|
$
|
15,408
|
|
$
|
16,452
|
|
$
|
10,000
|
|
||
|
Tenant improvement costs
(3)
|
55,088
|
|
59,790
|
|
34,720
|
|
|||||
|
Total leasing commissions and tenant improvement costs
(3)
|
$
|
70,496
|
|
$
|
76,242
|
|
$
|
44,720
|
|
||
|
Leasing commission costs per square foot
(3)
|
$
|
16.37
|
|
$
|
14.45
|
|
$
|
13.04
|
|
||
|
Tenant improvement costs per square foot
(3)
|
58.54
|
|
52.53
|
|
45.29
|
|
|||||
|
Total leasing commissions and tenant improvement costs per square foot
(3)
|
$
|
74.91
|
|
$
|
66.98
|
|
$
|
58.33
|
|
||
Retail Properties
(4)
|
|
Years Ended December 31,
|
||||||||||
|
Total New Leases, Expansions, and Renewals
|
2016
|
2015
|
2014
|
||||||||
|
Number of leases signed
(2)
|
20
|
|
12
|
|
10
|
|
|||||
|
Total Square Feet
|
50,798
|
|
70,940
|
|
18,166
|
|
|||||
|
Leasing commission costs
(3)
|
$
|
2,847
|
|
$
|
10,262
|
|
$
|
1,116
|
|
||
|
Tenant improvement costs
(3)
|
4,744
|
|
2,234
|
|
448
|
|
|||||
|
Total leasing commissions and tenant improvement costs
(3)
|
$
|
7,591
|
|
$
|
12,496
|
|
$
|
1,564
|
|
||
|
Leasing commission costs per square foot
(3)
|
$
|
56.03
|
|
$
|
144.67
|
|
$
|
61.43
|
|
||
|
Tenant improvement costs per square foot
(3)
|
93.40
|
|
31.49
|
|
24.66
|
|
|||||
|
Total leasing commissions and tenant improvement costs per square foot
(3)
|
$
|
149.43
|
|
$
|
176.16
|
|
$
|
86.09
|
|
||
_______________
|
(1)
|
Excludes an aggregate of 501,653 rentable square feet of retail space in our Manhattan office properties. Includes the Empire State Building broadcasting licenses and observatory operations.
|
|
(2)
|
Presents a renewed and expansion lease as one lease signed.
|
|
(3)
|
Presents all tenant improvement and leasing commission costs as if they were incurred in the period in which the lease was signed, which may be different than the period in which they were actually paid.
|
|
(4)
|
Includes an aggregate of 501,653 rentable square feet of retail space in our Manhattan office properties. Excludes the Empire State Building broadcasting licenses and observatory operations.
|
59
|
|
Years Ended December 31,
|
||||||||||
|
2016
|
2015
|
2014
|
|||||||||
|
Total Portfolio
|
|||||||||||
|
Capital expenditures
(1)
|
$
|
80,043
|
|
$
|
54,811
|
|
$
|
64,788
|
|
||
_______________
|
(1)
|
Includes all capital expenditures, excluding tenant improvements and leasing commission costs, which are primarily attributable to the redevelopment and repositioning program conducted at our Manhattan office properties.
|
As of
December 31, 2016
, we expect to incur additional costs relating to obligations under signed new leases of approximately
$57.3 million
, consisting of approximately
$56.2 million
for tenant improvements and other improvements related to new leases and approximately
$1.1 million
on leasing commissions. We intend to fund the tenant improvements and leasing commission costs through a combination of operating cash flow, cash on hand and borrowings under the unsecured revolving credit facility.
Capital expenditures are considered part of both our short-term and long-term liquidity requirements. We intend to fund the capital improvements to complete the redevelopment and repositioning program through a combination of operating cash flow, cash on hand and borrowings under the unsecured revolving credit facility.
Contractual Obligations
The following table summarizes the amounts due in connection with our contractual obligations described below for the years ending December 31, 2017 through 2021 and thereafter (amounts in thousands).
|
Years Ended December 31,
|
|||||||||||||||||||||||||||
|
2017
|
2018
|
2019
|
2020
|
2021
|
Thereafter
|
Total
|
|||||||||||||||||||||
|
Mortgages and other debt
(1)
|
|||||||||||||||||||||||||||
|
Interest expense
|
$
|
58,514
|
|
$
|
34,931
|
|
$
|
31,349
|
|
$
|
24,721
|
|
$
|
24,624
|
|
$
|
103,180
|
|
$
|
277,319
|
|
||||||
|
Amortization
|
9,904
|
|
2,880
|
|
2,188
|
|
2,268
|
|
2,350
|
|
7,356
|
|
26,946
|
|
|||||||||||||
|
Principal repayment
|
336,009
|
|
262,210
|
|
250,000
|
|
—
|
|
—
|
|
742,675
|
|
1,590,894
|
|
|||||||||||||
|
Ground lease
|
1,518
|
|
1,518
|
|
1,518
|
|
1,518
|
|
1,518
|
|
55,212
|
|
62,802
|
|
|||||||||||||
|
Tenant improvement and leasing commission costs
|
53,025
|
|
3,568
|
|
746
|
|
—
|
|
—
|
|
—
|
|
57,339
|
|
|||||||||||||
|
Total
|
$
|
458,970
|
|
$
|
305,107
|
|
$
|
285,801
|
|
$
|
28,507
|
|
$
|
28,492
|
|
$
|
908,423
|
|
$
|
2,015,300
|
|
||||||
_______________
|
(1)
|
Assumes no extension options are exercised.
|
|
(2)
|
Does not include various standing or renewal service contracts with vendors related to our property management.
|
Off-Balance Sheet Arrangements
As of
December 31, 2016
, we did not have any off-balance sheet arrangements.
Distribution Policy
In order to qualify as a REIT, we must distribute to our securityholders, on an annual basis, at least 90% of our REIT taxable income, determined without regard to the deduction for dividends paid and excluding net capital gains. In addition, we will be subject to U.S. federal income tax at regular corporate rates to the extent that we distribute less than 100% of our net taxable income (including net capital gains) and will be subject to a 4% nondeductible excise tax on the amount, if any, by which our distributions in any calendar year are less than a minimum amount specified under U.S. federal income tax laws. We intend to distribute our net income to our securityholders in a manner intended to satisfy the REIT 90% distribution requirement and to avoid U.S. federal income tax liability on our income and the 4% nondeductible excise tax.
Before we pay any distribution, whether for U.S. federal income tax purposes or otherwise, we must first meet both our operating requirements and obligations to make payments of principal and interest, if any. However, under some circumstances, we may be required to use cash reserves, incur debt or liquidate assets at rates or times that we regard as unfavorable or make a taxable distribution of our shares in order to satisfy the REIT 90% distribution requirement and to avoid U.S. federal income tax and the 4% nondeductible excise tax in that year.
60
Distribution to Equity Holders
Distributions and dividends have been made to equity holders in 2014, 2015 and 2016 as follows (amounts in thousands):
|
Year ended December 31, 2014
|
$
|
87,721
|
|
|
Year ended December 31, 2015
|
91,900
|
|
|
|
Year ended December 31, 2016
|
114,954
|
|
|
Cash Flows
Comparison of Year Ended
December 31, 2016
to the Year Ended
December 31, 2015
Net cash
. Cash on hand was $
554.4 million
and
$46.7 million
, respectively, as of
December 31, 2016
and
2015
. The increase was primarily due to net proceeds on issuance of common stock to QIA in 2016.
Operating activities
. Net cash provided by operating activities increased by $15.4 million to
$218.6 million
for the year ended December 31, 2016 compared to
$203.2 million
for the year ended December 31, 2015 primarily due to higher cash rents.
Investing activities
. Net cash used in investing activities increased by $39.5 million to $181.8 million for the year ended December 31, 2016 compared to $142.3 million for the year ended December 31, 2015. The increase was primarily due to higher expenditures on building and tenant improvements.
Financing activities
. Net cash provided by financing activities increased by $530.8 million to $470.9 million for the year ended December 31, 2016 compared to $(59.9) million used in financing activities for the year ended December 31, 2015. The increase was from the net proceeds on issuance of common stock to QIA in 2016.
Comparison of Year Ended December 31, 2015 to the Year Ended December 31, 2014
Net cash
. Cash on hand was $46.7 million and $45.7 million, respectively, as of December 31, 2015 and 2014.
Operating activities
. Net cash provided by operating activities increased by $64.6 million to $203.2 million for the year ended December 31, 2015 compared to $138.6 million for the year ended December 31, 2014. This was primarily due to the acquisition of two properties in July 2014 and the expirations of free rent periods.
Investing activities
. Net cash used in investing activities decreased by $156.8 million to $142.3 million for the year ended December 31, 2015 compared to $299.1 million for the year ended December 31, 2014. The decrease was primarily due to the acquisition of two properties in 2014 partially offset by higher expenditures on tenant improvements.
Financing activities
. Net cash (used in) provided by financing activities decreased by $205.4 million to $(59.9) million for the year ended December 31, 2015 compared to $145.5 million for the year ended December 31, 2014. The decrease was primarily due to financing associated with the acquisition of two properties in 2014.
Net Operating Income
Our financial reports include a discussion of property net operating income, or NOI. NOI is a non-GAAP financial measure of performance. NOI is used by our management to evaluate and compare the performance of our properties and to determine trends in earnings and to compute the fair value of our properties as it is not affected by: (i) the cost of funds of the property owner, (ii) the impact of depreciation and amortization expenses as well as gains or losses from the sale of operating real estate assets that are included in net income computed in accordance with GAAP, (iii) acquisition expenses and break-up fee, or (iv) general and administrative expenses and other gains and losses that are specific to the property owner. The cost of funds is eliminated from NOI because it is specific to the particular financing capabilities and constraints of the owner. The cost of funds is eliminated because it is dependent on historical interest rates and other costs of capital as well as past decisions made by us regarding the appropriate mix of capital which may have changed or may change in the future. Depreciation and amortization expenses as well as gains or losses from the sale of operating real estate assets are eliminated because they may not accurately represent the actual change in value in our office or retail properties that result from use of the properties or changes in market conditions. While certain aspects of real property do decline in value over time in a manner that is reasonably captured by depreciation and amortization, the value of the properties as a whole have historically increased or decreased as a result of changes in overall economic conditions instead of from actual use of the property or the passage of time. Gains and losses from the sale of real property vary from property to property and are affected by market conditions at the time of sale which will usually change from period to period. These gains and losses can create distortions
61
when comparing one period to another or when comparing our operating results to the operating results of other real estate companies that have not made similarly-timed purchases or sales. We believe that eliminating these costs from net income is useful because the resulting measure captures the actual revenue, generated and actual expenses incurred in operating our properties as well as trends in occupancy rates, rental rates and operating costs.
However, the usefulness of NOI is limited because it excludes general and administrative costs, interest expense, depreciation and amortization expense and gains or losses from the sale of properties, and other gains and losses as stipulated by GAAP, the level of capital expenditures and leasing costs necessary to maintain the operating performance of our properties, all of which are significant economic costs. NOI may fail to capture significant trends in these components of net income which further limits its usefulness.
NOI is a measure of the operating performance of our properties but does not measure our performance as a whole. NOI is therefore not a substitute for net income as computed in accordance with GAAP. This measure should be analyzed in conjunction with net income computed in accordance with GAAP and discussions elsewhere in this Management’s Discussion and Analysis of Financial Condition and Results of Operations regarding the components of net income that are eliminated in the calculation of NOI. Other companies may use different methods for calculating NOI or similarly titled measures and, accordingly, our NOI may not be comparable to similarly titled measures reported by other companies that do not define the measure exactly as we do.
The following table presents a reconciliation of our net income, the most directly comparable GAAP measure, to NOI for the periods presented (amounts in thousands):
|
Years Ended December 31,
|
|||||||||||
|
2016
|
2015
|
2014
|
|||||||||
|
Net income
|
$
|
107,250
|
|
$
|
79,928
|
|
$
|
70,210
|
|
||
|
Add:
|
|||||||||||
|
General and administrative expenses
|
49,078
|
|
38,073
|
|
39,037
|
|
|||||
|
Depreciation and amortization
|
155,211
|
|
171,474
|
|
145,431
|
|
|||||
|
Interest expense
|
71,147
|
|
67,492
|
|
66,456
|
|
|||||
|
Construction expenses
|
—
|
|
3,222
|
|
38,596
|
|
|||||
|
Acquisition expenses
|
98
|
|
193
|
|
3,382
|
|
|||||
|
Income tax expense
|
6,146
|
|
3,949
|
|
4,655
|
|
|||||
|
Less:
|
|
|
|||||||||
|
Construction revenue
|
—
|
|
(1,981
|
)
|
(38,648
|
)
|
|||||
|
Third-party management and other fees
|
(1,766
|
)
|
(2,133
|
)
|
(2,376
|
)
|
|||||
|
Acquisition break-up fee
|
—
|
|
(2,500
|
)
|
—
|
|
|||||
|
Gain on settlement of lawsuit related to the Observatory
|
—
|
|
—
|
|
(975
|
)
|
|||||
|
Net operating income
|
$
|
387,164
|
|
$
|
357,717
|
|
$
|
325,768
|
|
||
|
Other Net Operating Income Data
|
|||||||||||
|
Straight line rental revenue
|
$
|
30,147
|
|
$
|
21,056
|
|
$
|
39,715
|
|
||
|
Net increase in rental revenue from the amortization of above and below-market lease assets and liabilities
|
$
|
8,794
|
|
$
|
19,353
|
|
$
|
14,095
|
|
||
|
Amortization of acquired below-market ground leases
|
$
|
7,831
|
|
$
|
7,831
|
|
$
|
4,603
|
|
||
Funds from Operations ("FFO")
We present below a discussion of FFO. We
compute FFO in accordance with the “White Paper” on FFO published by the National Association of Real Estate Investment Trusts, or NAREIT, which defines FFO as net income (loss) (determined in accordance with GAAP), excluding impairment writedowns of investments in depreciable real estate and investments in in-substance real estate investments, gains or losses from debt restructurings and sales of depreciable operating properties, plus real estate-related depreciation and amortization (excluding amortization of deferred financing costs), less distributions to non-controlling interests and gains/losses from discontinued operations and after adjustments for unconsolidated partnerships and joint ventures. FFO is a widely recognized non-GAAP financial measure for REITs that we
62
believe, when considered with financial statements determined in accordance with GAAP, is useful to investors in understanding financial performance and providing a relevant basis for comparison among REITS. In addition, FFO is useful to investors as it captures features particular to real estate performance by recognizing that real estate has generally appreciated over time or maintains residual value to a much greater extent than do other depreciable assets. Investors should review FFO, along with GAAP net income, when trying to understand an equity REIT’s operating performance. We present FFO because we consider it an important supplemental measure of our operating performance and believe that it is frequently used by securities analysts, investors and other interested parties in the evaluation of REITs. However, because FFO excludes depreciation and amortization and captures neither the changes in the value of our properties that result from use or market conditions nor the level of capital expenditures and leasing commissions necessary to maintain the operating performance of our properties, all of which have real economic effect and could materially impact our results of operations, the utility of FFO as a measure of performance is limited. There can be no assurance that FFO presented by us is comparable to similarly titled measures of other REITs. FFO does not represent cash generated from operating activities and should not be considered as an alternative to net income (loss) determined in accordance with GAAP or to cash flow from operating activities determined in accordance with GAAP. FFO is not indicative of cash available to fund ongoing cash needs, including the ability to make cash distributions. Although FFO is a measure used for comparability in assessing the performance of REITs, as the NAREIT White Paper only provides guidelines for computing FFO, the computation of FFO may vary from one company to another.
Modified Funds From Operations ("Modified FFO")
Modified FFO adds back an adjustment for any above or below-market ground lease amortization to traditionally defined FFO. We consider this a useful supplemental measure in evaluating our operating performance due to the non-cash accounting treatment under GAAP, which stems from the third quarter 2014 acquisition of two option properties following our formation transactions as they carry significantly below market ground leases, the amortization of which is material to our overall results. We present Modified FFO because we consider it an important supplemental measure of our operating performance in that it adds back the non-cash amortization of below-market ground leases. There can be no assurance that Modified FFO presented by us is comparable to similarly titled measures of other REITs. Modified FFO does not represent cash generated from operating activities and should not be considered as an alternative to net income (loss) determined in accordance with GAAP or to cash flow from operating activities determined in accordance with GAAP. Modified FFO is not indicative of cash available to fund ongoing cash needs, including the ability to make cash distributions.
Core Funds From Operations ("Core FFO")
Core FFO adds back to traditionally defined FFO the following items associated with the Company's initial public offering, or IPO, and formation transactions: gain on consolidation of non-controlling entities, acquisition expenses, severance expenses and retirement equity compensation expenses. It also adds back private perpetual preferred exchange offering expenses, prepayment penalty expense, deferred financing costs write-off, acquisition expenses, gain on settlement of lawsuit related to the Observatory, net of income taxes, ground lease amortization, construction severance expenses and acquisition break-up fee. The Company presents Core FFO because it considers it an important supplemental measure of its operating performance in that it excludes items associated with its IPO and formation transactions and other non-recurring items. There can be no assurance that Core FFO presented by the Company is comparable to similarly titled measures of other REITs. Core FFO does not represent cash generated from operating activities and should not be considered as an alternative to net income (loss) determined in accordance with GAAP or to cash flow from operating activities determined in accordance with GAAP. Core FFO is not indicative of cash available to fund ongoing cash needs, including the ability to make cash distributions. In future periods, we may also exclude other items from Core FFO that we believe may help investors compare our results.
The following table presents a reconciliation of net income, the most directly comparable GAAP measure, to FFO, Modified FFO and Core FFO for the periods presented (amounts in thousands):
63
|
Years Ended December 31,
|
|||||||||||
|
2016
|
2015
|
2014
|
|||||||||
|
Net income
|
$
|
107,250
|
|
$
|
79,928
|
|
$
|
70,210
|
|
||
|
Private perpetual preferred unit distributions
|
(936
|
)
|
(936
|
)
|
(476
|
)
|
|||||
|
Real estate depreciation and amortization
|
154,205
|
|
170,932
|
|
145,115
|
|
|||||
|
Funds from operations attributable to common stockholders and non-controlled interests
|
260,519
|
|
249,924
|
|
214,849
|
|
|||||
|
Amortization of below-market ground leases
|
7,831
|
|
7,831
|
|
4,603
|
|
|||||
|
Modified funds from operations attributable to common stockholders and non-controlled interests
|
268,350
|
|
257,755
|
|
219,452
|
|
|||||
|
Prepayment penalty expense and deferred financing costs write-off
|
552
|
|
1,749
|
|
3,771
|
|
|||||
|
Acquisition expenses
|
98
|
|
193
|
|
3,382
|
|
|||||
|
Acquisition break-up fee
|
—
|
|
(2,500
|
)
|
—
|
|
|||||
|
Construction severance expenses, net of income taxes
|
—
|
|
480
|
|
—
|
|
|||||
|
Gain on settlement of lawsuit related to the Observatory, net of income taxes
|
—
|
|
—
|
|
(540
|
)
|
|||||
|
Private perpetual preferred exchange offering expenses
|
—
|
|
—
|
|
1,357
|
|
|||||
|
Core funds from operations attributable to common stockholders and non-controlled interests
|
$
|
269,000
|
|
$
|
257,677
|
|
$
|
227,422
|
|
||
|
Weighted average shares and Operating Partnership units
|
|||||||||||
|
Basic
|
276,848
|
|
265,914
|
|
254,506
|
|
|||||
|
Diluted
|
277,568
|
|
265,914
|
|
254,506
|
|
|||||
Factors That May Influence Future Results of Operations
Rental Revenue
We derive revenues primarily from rents, rent escalations, expense reimbursements and other income received from tenants under existing leases at each of our properties. “Escalations and expense reimbursements” consist of payments made by tenants to us under contractual lease obligations to reimburse a portion of the property operating expenses and real estate taxes incurred at each property.
We believe that the average rental rates for in-place leases at our properties are generally below the current market rates, although individual leases at particular properties presently may be leased above, at or below the current market rates within its particular submarket.
The amount of net rental income and reimbursements that we receive depends principally on our ability to lease currently available space, re-lease space to new tenants upon the scheduled or unscheduled termination of leases or renew expiring leases and to maintain or increase our rental rates. Factors that could affect our rental incomes include, but are not limited to: local, regional or national economic conditions; an oversupply of, or a reduction in demand for, office or retail space; changes in market rental rates; our ability to provide adequate services and maintenance at our properties; and fluctuations in interest rates, all of which could adversely affect our rental income in future periods. Future economic or regional downturns affecting our submarkets, or downturns in our tenants’ industries, could impair our ability to lease vacant space and renew or re-lease space as well as the ability of our tenants to fulfill their lease commitments, and could adversely affect our ability to maintain or increase the occupancy at our properties.
Tenant Credit Risk
The economic condition of our tenants may also deteriorate, which could negatively impact their ability to fulfill their lease commitments and in turn adversely affect our ability to maintain or increase the occupancy level and/or rental rates of our properties. Potential tenants may look to consolidate, reduce overhead and preserve operating capital and may also defer strategic decisions, including entering into new, long-term leases at properties.
64
Leasing
We signed 1.0 million, 1.2 million, and 0.8 million rentable square feet of new leases, expansions and lease renewals, for the years ended December 31, 2016, 2015, and 2014, respectively.
Due to the relatively small number of leases that are signed in any particular quarter, one or more larger leases may have a disproportionately positive or negative impact on average rent, tenant improvement and leasing commission costs for that period. As a result, we believe it is more appropriate when analyzing trends in average rent and tenant improvement and leasing commission costs to review activity over multiple quarters or years. Tenant improvement costs include expenditures for general improvements occurring concurrently with, but that are not directly related to, the cost of installing a new tenant. Leasing commission costs are similarly subject to significant fluctuations depending upon the length of leases being signed and the mix of tenants from quarter to quarter.
As of
December 31, 2016
, there were approximately
1.0 million
rentable square feet of space in our portfolio available to lease (excluding leases signed but not yet commenced) representing
9.8%
of the net rentable square footage of the properties in our portfolio. In addition, leases representing
7.0%
and
8.1%
of net rentable square footage of the properties in our portfolio will expire in 2017 and in 2018, respectively. These leases are expected to represent approximately
7.0%
and
8.5%
, respectively, of our annualized rent for such periods. Our revenues and results of operations can be impacted by expiring leases that are not renewed or re-leased or that are renewed or re-leased at base rental rates equal to, above or below the current average base rental rates. Further, our revenues and results of operations can also be affected by the costs we incur to re-lease available space, including payment of leasing commissions, redevelopments and build-to-suit remodeling that may not be borne by the tenant.
We believe that as we complete the redevelopment and repositioning of our properties we will, over the long-term, experience increased occupancy levels and rents. Over the short term, as we renovate and reposition our properties, which includes aggregating smaller spaces to offer large blocks of space, we may experience lower occupancy levels as a result of having to relocate tenants to alternative space and the strategic expiration of existing leases. We believe that despite the short-term lower occupancy levels we may experience, we will continue to experience increased rental revenues as a result of the increased rents which we expect to obtain in following the redevelopment and repositioning of our properties.
Market Conditions
The properties in our portfolio are located in Manhattan and the greater New York metropolitan area, which includes Fairfield County, Connecticut and Westchester County, New York. Positive or negative changes in conditions in these markets, such as business hirings or layoffs or downsizing, industry growth or slowdowns, relocations of businesses, increases or decreases in real estate and other taxes, costs of complying with governmental regulations or changed regulation, can impact our overall performance.
Observatory and Broadcasting Operations
For the year ended
December 31, 2016
, the Empire State Building Observatory hosted
4.25 million
visitors, compared to
4.06 million
visitors for the same period in 2015. Observatory revenue for the year ended December 31, 2016 was
$124.8 million
, an
11.2%
increase from
$112.2 million
for the year ended December 31, 2015. For the year ended December 31, 2016, there were 45 bad weather days, 13 of which fell on weekend days compared to 67 bad weather days, 15 of which fell on weekend days, in the year ended December 31, 2015.
Observatory revenues and admissions are dependent upon the following: (i) the number of tourists (domestic and international) that come to New York City and visit the observatory, as well as any related tourism trends; (ii) the prices per admission that can be charged; (iii) seasonal trends affecting the number of visitors to the observatory; (iv) competition, in particular from other new and existing observatories; and (v) weather trends.
We license the use of the Empire State Building mast to third party television and radio broadcasters and providers of data communications. We also lease space in the upper floors of the building to such licensees to house their transmission equipment and related facilities. During the year ended December 31, 2016, we derived $20.9 million of revenue and $8.0 million of expense reimbursements from the Empire State Building’s broadcasting licenses and related leases. The broadcasting licenses and related leases generally expire between 2017 and 2031. The business of broadcasting TV and radio signals over the air is in flux, due to deteriorating industry fundamentals and the ongoing Federal Communications Commission spectrum auction, and there is competition from other broadcasting operations.
65
We have renewed and extended our leases with Univision Television Group from their current expirations in 2016 and 2018 to a new expiration in December 2025. Three of our existing broadcast tenants, CBS Broadcasting, NBC Universal Media and WNET, have notified us that they will vacate the Empire State Building at the end of their current lease terms. The non-renewing leases with CBS, NBC and WNET generated approximately $5.9 million in aggregate revenue in 2016, inclusive of expense reimbursements, and their leases expire in 2018. Revenue from Univision totaled approximately $2.9 million, inclusive of expense reimbursements in 2015. Effective January 2016, annual revenue from Univision adjusted to an initial amount of $1.9 million, and is subject to escalations.
During 2016, we renewed and extended our lease and licenses with Emmis Communications, which operates three FM radio stations at the Empire State Building, for 16 years. For the year ended December 31, 2015, revenue from Emmis Communications totaled approximately $1.7 million (inclusive of expense reimbursements). Effective January 2016, annual revenue from Emmis Communications adjusted to an initial amount of $1.3 million, and is subject to escalations.
With respect to certain of our other remaining broadcasters, we have made preliminary renewal proposals which, if accepted, would yield reduced revenues and higher capital expenditures.
We have renewed and extended an additional lease and license with two broadcast tenants with terms subject to a confidentiality agreement.
Operating Expenses
Our operating expenses generally consist of depreciation and amortization, real estate taxes, ground lease expenses, repairs and maintenance, security, utilities, property-related payroll, insurance and bad debt expense. Factors that may affect our ability to control these operating costs include: increases in insurance premiums, tax rates, the cost of periodic repair, redevelopment costs and the cost of re-leasing space, the cost of compliance with governmental regulation, including zoning and tax laws, the potential for liability under applicable laws and interest rate levels. If our operating costs increase as a result of any of the foregoing factors, our future cash flow and results of operations may be adversely affected.
The expenses of owning and operating a property are not necessarily reduced when circumstances, such as market factors and competition, cause a reduction in income from the property. If revenues drop, we may not be able to reduce our expenses accordingly. Costs associated with real estate investments, such as real estate taxes and maintenance generally, will not be materially reduced even if a property is not fully occupied or other circumstances cause our revenues to decrease. As a result, if revenues decrease in the future, static operating costs may adversely affect our future cash flow and results of operations. If similar economic conditions exist in the future, we may experience future losses.
Cost of Funds and Interest Rates
We expect future changes in interest rates will impact our overall performance. Subject to maintaining our qualification as a REIT for U.S. federal income tax purposes, we may mitigate the risk of interest rate volatility through the use of hedging instruments, such as interest rate swap agreements and interest rate cap agreements. As of December 31, 2016, we entered into forward starting interest rate LIBOR swap agreement with an aggregate notional value of $890.0 million that fixed LIBOR rates at pay rates between 2.1485% to 2.7620% for periods from July 2017 to June 2028. While we may seek to manage our exposure to future changes in rates, portions of our overall outstanding debt will likely remain at floating rates. As of
December 31, 2016
, our variable rate debt represented
16.4%
of our indebtedness and 3.4% of total enterprise value. This variable rate debt included
$265.0 million
of borrowings as of
December 31, 2016
. Our variable rate debt may increase to the extent we use available borrowing capacity to fund capital improvements. We continually evaluate our debt maturities, and, based on management’s current assessment, believe we have viable financing and refinancing alternatives that will not materially adversely impact our expected financial results. As of
December 31, 2016
, excluding principal amortization, we have approximately
$336.0 million
of debt maturing in 2017 and approximately
$262.2 million
of debt maturing in 2018.
Competition
The leasing of real estate is highly competitive in Manhattan and the greater New York metropolitan market in which we operate. We compete with numerous acquirers, developers, owners and operators of commercial real estate, many of which own or may seek to acquire or develop properties similar to ours in the same markets in which our properties are located. The principal means of competition are rent charged, location, services provided and the nature and condition of the facility to be leased. In addition, we face competition from other real estate companies including other REITs, private real estate funds, domestic and foreign financial institutions, life insurance companies, pension trusts, partnerships, individual investors and others that may have greater financial resources or access to capital than we do or that are willing to acquire properties in
66
transactions which are more highly leveraged or are less attractive from a financial viewpoint than we are willing to pursue. In addition, competition from new and existing observatories and/or broadcasting operations could have a negative impact on revenues from our observatory and/or broadcasting operations. Adverse impacts on domestic travel and changes in foreign currency exchange rates may also decrease demand in the future, which could have a material adverse effect on our results of operations. If our competitors offer space at rental rates below current market rates, below the rental rates we currently charge our tenants, in better locations within our markets or in higher quality facilities, we may lose potential tenants and may be pressured to reduce our rental rates below those we currently charge in order to retain tenants when our tenants’ leases expire.
Critical Accounting Estimates
Basis of Presentation and Principles of Consolidation
The accompanying consolidated financial statements have been prepared in conformity with GAAP and with the rules and regulations of the SEC represent our assets and liabilities and operating results. The consolidated financial statements include our accounts and our wholly owned subsidiaries as well as our operating partnership and its subsidiaries. All significant intercompany balances and transactions have been eliminated in consolidation. For purposes of comparison, certain items shown in the 2014 and 2015 consolidated financial statements have been reclassified to conform to the presentation used for 2016.
We consolidate entities in which we have a controlling financial interest. In determining whether we have a controlling financial interest in a partially owned entity and the requirement to consolidate the accounts of that entity, we consider factors such as ownership interest, board representation, management representation, authority to make decisions, and contractual and substantive participating rights of the partners/members as well as whether the entity is a variable interest entity (“VIE”) and we are the primary beneficiary. The primary beneficiary of a VIE is the entity that has (i) the power to direct the activities that most significantly impact the entity's economic performance and (ii) the obligation to absorb losses of the VIE or the right to receive benefits from the VIE that could be significant to the VIE. The primary beneficiary is required to consolidate the VIE.
We will assess the accounting treatment for each investment we may have in the future. This assessment will include a review of each entity’s organizational agreement to determine which party has what rights and whether those rights are protective or participating. For all VIEs, we will review such agreements in order to determine which party has the power to direct the activities that most significantly impact the entity’s economic performance and benefit. In situations where we or our partner could approve, among other things, the annual budget, or leases that cover more than a nominal amount of space relative to the total rentable space at each property, we would not consolidate the investment as we consider these to be substantive participation rights that result in shared power of the activities that would most significantly impact the performance and benefit of such joint venture investment.
A non-controlling interest in a consolidated subsidiary is defined as the portion of the equity (net assets) in a subsidiary not attributable, directly or indirectly, to a parent. Non-controlling interests are required to be presented as a separate component of equity in the consolidated balance sheets and in the consolidated statements of operations by requiring earnings and other comprehensive income to be attributed to controlling and non-controlling interests.
Goodwill
Goodwill is tested annually for impairment and is tested for impairment more frequently if events and circumstances indicate that the asset might be impaired. An impairment loss is recognized to the extent that the carrying amount, including goodwill, exceeds the reporting unit’s fair value and the implied fair value of goodwill is less than the carrying amount of that goodwill. Non-amortizing intangible assets, such as trade names and trademarks, are subject to an annual impairment test based on fair value and amortizing intangible assets are tested whenever events or changes in circumstances indicate that the carrying amount may not be recoverable.
We performed an annual review of goodwill for impairment and concluded there was no impairment of goodwill. Our methodology to review goodwill impairment, which includes a significant amount of judgment and estimates, provides a reasonable basis to determine whether impairment has occurred. However, many of the factors employed in determining whether or not goodwill is impaired are outside of our control and it is reasonably likely that assumptions and estimates will change in future periods.
67
Income Taxes
We elected to be taxed as a REIT under sections 856 through 860 of the Internal Revenue Code of 1986, as amended, commencing with the taxable year ended December 31, 2013 and believe we qualify as a REIT at December 31, 2016. REITs are subject to a number of organizational and operational requirements, including a requirement that 90% of ordinary “REIT taxable income” (as determined without regard to the dividends paid deduction or net capital gains) be distributed. As a REIT, we will generally not be subject to U.S. federal income tax to the extent that we meet the organizational and operational requirements and our distributions equal or exceed REIT taxable income. For all periods subsequent to the effective date of our REIT election, we have met the organizational and operational requirements and distributions have exceeded net taxable income. Accordingly, no provision has been made for federal and state income taxes.
We have elected to treat ESRT Observatory TRS, L.L.C., our subsidiary which holds our observatory operations, and ESRT Holdings TRS, L.L.C., our subsidiary that holds our third party management, construction (through cessation of our construction business in the first quarter of 2015), restaurant, cafeterias, health clubs and certain cleaning operations, as taxable REIT subsidiaries. Taxable REIT subsidiaries may participate in non-real estate activities and/or perform non-customary services for tenants and their operations are generally subject to regular corporate income taxes. Our taxable REIT subsidiaries account for their income taxes in accordance with GAAP, which includes an estimate of the amount of taxes payable or refundable for the current year and deferred tax liabilities and assets for the future tax consequences of events that have been recognized in our financial statements or tax returns. The calculation of the taxable REIT subsidiaries' tax provisions may require interpreting tax laws and regulations and could result in the use of judgments or estimates which could cause its recorded tax liability to differ from the actual amount due. Deferred income taxes reflect the net tax effects of temporary differences between the carrying amounts of assets and liabilities for financial reporting purposes and the amounts used for income tax purposes. The taxable REIT subsidiaries periodically assess the realizability of deferred tax assets and the adequacy of deferred tax liabilities, including the results of local, state, or federal statutory tax audits or estimates and judgments used.
We apply provisions for measuring and recognizing tax benefits associated with uncertain income tax positions. Penalties and interest, if incurred, would be recorded as a component of income tax expense. As of
December 31, 2016
and 2015, we do not have a liability for uncertain tax positions. As of December 31, 2016, the tax years ended December 31, 2013 through December 31, 2016 remain open for an audit by the Internal Revenue Service, state or local authorities.
Share-Based Compensation
Share-based compensation is measured at the fair value of the award on the date of grant and recognized as an expense on a straight-line basis over the vesting period. The determination of fair value of these awards is subjective and involves significant estimates and assumptions including expected volatility of our stock, expected dividend yield, expected term, and assumptions of whether these awards will achieve parity with other operating partnership units or achieve performance thresholds. We believe that the assumptions and estimates utilized are appropriate based on the information available to management at the time of grant.
Segment Reporting
We have identified
two
reportable segments: (1) Real Estate and (2) Observatory. Our real estate segment includes all activities related to the ownership, management, operation, acquisition, repositioning and disposition of our real estate assets. Our observatory segment operates the 86th and 102nd floor observatories at the Empire State Building. These
two
lines of businesses are managed separately because each business requires different support infrastructures, provides different services and has dissimilar economic characteristics such as investments needed, stream of revenues and different marketing strategies. We account for intersegment sales and transfers as if the sales or transfers were to third parties, that is, at current market prices. We include our construction operation in "Other" and includes all activities related to providing construction services to tenants and to other entities within and outside our company. As of March 27, 2015, we no longer solicited new business for our construction management business. We have since completed all projects that were in progress and closed that business.
Our future income, cash flows and fair values relevant to financial instruments are dependent upon prevalent market interest rates. Market risk refers to the risk of loss from adverse changes in market prices and interest rates. One of the principal market risks facing us is interest rate risk on our variable rate indebtedness. As of
December 31, 2016
, our variable rate debt of $
265.0 million
represented 3.4% of our total enterprise value.
68
Subject to maintaining our qualification as a REIT for U.S. federal income tax purposes, we may mitigate the risk of interest rate volatility through the use of hedging instruments, such as interest rate swap agreements and interest rate cap agreements. Our primary objectives when undertaking hedging transactions and derivative positions will be to reduce our floating rate exposure and to fix a portion of the interest rate for anticipated financing and refinancing transactions. This in turn will reduce the risk that the variability of cash flows will impose on floating rate debt. However, we can provide no assurances that our efforts to manage interest rate volatility will successfully mitigate the risks of such volatility on our portfolio. We are not subject to foreign currency risk.
We are exposed to interest rate changes primarily on our term loan, unsecured revolving credit facility and mortgage refinancings. Our objectives with respect to interest rate risk are to limit the impact of interest rate changes on operations and cash flows, and to lower our overall borrowing costs. To achieve these objectives, we may borrow at fixed rates and may enter into derivative financial instruments such as interest rate swaps or caps in order to mitigate our interest rate risk on a related floating rate financial instrument. We do not enter into derivative or interest rate transactions for speculative purposes.
During 2016, we entered into five interest rate LIBOR swaps with effective dates of January 5, 2018 and June 1, 2018 and an aggregate notional value of $425.0 million, which fix interest rates at 2.486% and 2.762% and mature between January 5, 2028 and June 1, 2028. During 2015, we entered into three interest rate LIBOR swaps with effective dates of July 5, 2017 and August 31, 2017 and an aggregate notional value of $465.0 million, which fix interest rates at 2.1485% and 2.5050%, and mature between August 24, 2022 and July 5, 2027. These interest rate swaps have been designated as cash flow hedges and are deemed effective as of
December 31, 2016
with a fair value of $0.6 million which is included in prepaid expenses and other assets and ($5.6 million) which is included in accounts payable and accrued expenses on the condensed consolidated balance sheet.
Based on our variable balances, interest expense would have increased by approximately $2.6 million for the year ended
December 31, 2016
, if short-term interest rates had been 1% higher. As of
December 31, 2016
, the weighted average interest rate on the
$1.4 billion
of fixed-rate indebtedness outstanding was 4.54% per annum, each with maturities at various dates through March 27, 2030.
As of
December 31, 2016
, the fair value of our outstanding debt was approximately
$1.6 billion
which was approximately
$30.0 million
more than the historical book value as of such date. Interest risk amounts were determined by considering the impact of hypothetical interest rates on our financial instruments. These analyses do not consider the effect of any change in overall economic activity that could occur in that environment. Further, in the event of a change of that magnitude, we may take actions to further mitigate our exposure to the change. However, due to the uncertainty of the specific actions that would be taken and their possible effects, these analyses assume no changes in our financial structure.
The financial statements beginning on Page F-1 of this Annual Report on Form 10-K are incorporated herein by reference.
None.
Evaluation of Disclosure Controls and Procedures
We maintain disclosure controls and procedures (as such term is defined in Rule 13a-15(e) and 15d-15(e) under the Exchange Act) that are designed to ensure that information required to be disclosed in our reports under the Exchange Act is processed, recorded, summarized and reported within the time periods specified in the SEC’s rules and regulations and that such information is accumulated and communicated to management, including our Chief Executive Officer and Chief Financial Officer, as appropriate, to allow for timely decisions regarding required disclosure. In designing and evaluating the disclosure controls and procedures, management recognizes that any controls and procedures, no matter how well designed and operated, can provide only reasonable assurance of achieving the desired control objectives, and management is required to apply its judgment in evaluating the cost-benefit relationship of possible controls and procedures.
As of
December 31, 2016
, the end of the period covered by this Report, we carried out an evaluation, under the supervision and with the participation of management, including our Chief Executive Officer and Chief Financial Officer, regarding the effectiveness of our disclosure controls and procedures at the end of the period covered by this Report. Based on
69
the foregoing, our Chief Executive Officer and Chief Financial Officer concluded, as of that time, that our disclosure controls and procedures were effective in ensuring that information required to be disclosed by us in reports filed or submitted under the Exchange Act (i) is processed, recorded, summarized and reported within the time periods specified in the SEC’s rules and forms and (ii) is accumulated and communicated to our management, including our Chief Executive Officer and our Chief Financial Officer, as appropriate to allow for timely decisions regarding required disclosure.
Changes in Internal Control over Financial Reporting
No significant changes to our internal control over financial reporting were identified in connection with the evaluation referenced above that occurred during the period covered by this report that have materially affected, or are reasonably likely to materially affect, our internal control over financial reporting.
(a) Management's Report on Internal Control over Financial Reporting
Management of Empire State Realty Trust, Inc. is responsible for establishing and maintaining adequate internal control over financial reporting, as such term is defined in the Securities Exchange Act of 1934 Rule 13(a)-15(f). Under the supervision and with the participation of our management, including our Chief Executive Officer and Chief Financial Officer, we conducted an evaluation of the effectiveness of our internal control over financial reporting as of
December 31, 2016
as required by the Securities Exchange Act of 1934 Rule 13(a)-15(c). In making this assessment, we used the criteria set forth in the framework in Internal Control–Integrated Framework (2013) issued by the Committee of Sponsoring Organizations of the Treadway Commission (the "COSO criteria"). Based on our evaluation under the COSO criteria, our management concluded that our internal control over financial reporting was effective as of December 31, 2016 to provide reasonable assurance regarding the reliability of financial reporting and the preparation of financial statements for external reporting purposes in accordance with U.S. generally accepted accounting principles.
Ernst & Young LLP, an independent registered public accounting firm that audited our Financial Statements included in this Annual Report, has issued an attestation report on our internal control over financial reporting as of
December 31, 2016
, which appears in paragraph (b) of this Item 9A.
(b) Attestation report of the independent registered public accounting firm
Report of Independent Registered Public Accounting Firm
The Board of Directors and Stockholders of Empire State Realty Trust, Inc.
We have audited Empire State Realty Trust, Inc.’s (the “Company”) internal control over financial reporting as of
December 31, 2016
, based on criteria established in Internal Control-Integrated Framework issued by the Committee of Sponsoring Organizations of the Treadway Commission (2013 framework) (the COSO criteria). The Company’s management is responsible for maintaining effective internal control over financial reporting, and for its assessment of the effectiveness of internal control over financial reporting included in the accompanying Management's Report on Internal Control over Financial Reporting. Our responsibility is to express an opinion on the company’s internal control over financial reporting based on our audit.
We conducted our audit in accordance with the standards of the Public Company Accounting Oversight Board (United States). Those standards require that we plan and perform the audit to obtain reasonable assurance about whether effective internal control over financial reporting was maintained in all material respects. Our audit included obtaining an understanding of internal control over financial reporting, assessing the risk that a material weakness exists, testing and evaluating the design and operating effectiveness of internal control based on the assessed risk, and performing such other procedures as we considered necessary in the circumstances. We believe that our audit provides a reasonable basis for our opinion.
A company’s internal control over financial reporting is a process designed to provide reasonable assurance regarding the reliability of financial reporting and the preparation of financial statements for external purposes in accordance with generally accepted accounting principles. A company’s internal control over financial reporting includes those policies and procedures that (1) pertain to the maintenance of records that, in reasonable detail, accurately and fairly reflect the transactions and dispositions of the assets of the company; (2) provide reasonable assurance that transactions are recorded as necessary to permit preparation of financial statements in accordance with generally accepted accounting principles, and that receipts and expenditures of the company are being made only in accordance with authorizations of management and directors of the company; and (3) provide reasonable assurance regarding prevention or timely detection of unauthorized acquisition, use, or disposition of the company’s assets that could have a material effect on the financial statements.
70
Because of its inherent limitations, internal control over financial reporting may not prevent or detect misstatements. Also, projections of any evaluation of effectiveness to future periods are subject to the risk that controls may become inadequate because of changes in conditions, or that the degree of compliance with the policies or procedures may deteriorate.
In our opinion, Empire State Realty Trust, Inc. maintained, in all material respects, effective internal control over financial reporting as of
December 31, 2016
, based on the COSO criteria.
We also have audited, in accordance with the standards of the Public Company Accounting Oversight Board (United States), the consolidated balance sheets of Empire State Realty Trust, Inc. as of December 31, 2016 and 2015, and the related consolidated statements of operations, comprehensive income, stockholders’ equity and cash flows for each of the three years in the period ended December 31, 2016 of Empire State Realty Trust, Inc. and our report dated February 27, 2017 expressed an unqualified opinion thereon.
/s/ Ernst & Young LLP
New York, New York
February 27, 2017
None.
The information required by Item 10 will be set forth in our definitive proxy statement for our 2017 Annual Meeting of Stockholders (which is scheduled to be held on May 11, 2017), to be filed pursuant to Regulation 14A under the Securities and Exchange Act of 1934, as amended, or our Proxy Statement, and is incorporated herein by reference.
The information required by Item 11 will be set forth in our Proxy Statement and is incorporated herein by reference.
The information required by Item 12 will be set forth in our Proxy Statement and is incorporated herein by reference.
The information under Item 5 of this Form 10-K under the heading “Securities Authorized For Issuance Under Equity Compensation Plans” is incorporated herein by reference.
The information required by Item 13 will be set forth in our Proxy Statement and is incorporated herein by reference.
The information required by Item 14 will be set forth in our Proxy Statement and is incorporated herein by reference.
71
(a) The following documents are filed as part of this report:
|
1.
|
The consolidated financial statements are set forth in Item 8 of this Annual Report on Form 10-K.
|
|
2.
|
The following financial statement schedules should be read in conjunction with the financial statements included in Item 8 of this Annual Report on Form 10-K.
|
Schedule II-Valuation and Qualifying Accounts for the years ended December 31, 2016, 2015 and 2014 on page F-44.
Schedule III-Real Estate and Accumulated Depreciation as of December 31, 2016 on page F-45.
Schedules other than those listed are omitted as they are not applicable or the required or equivalent information has been included in the financial statements or notes thereto.
(b) The exhibits required by Item 601 of Regulation S-K are listed in the Exhibit Index on page 74 of this Annual Report on Form 10-K and is incorporated herein by reference.
None.
SIGNATURES
Pursuant to the requirements of Section 13 or 15(d) of the Securities Exchange Act of 1934, as amended, the registrant has duly caused this report to be signed on its behalf by the undersigned thereunto duly authorized.
EMPIRE STATE REALTY TRUST, INC.
Date: February 27, 2017 By:
/s/ Anthony E. Malkin
Chairman and Chief Executive Officer
Date: February 27, 2017 By:
/s/ David A. Karp
Executive Vice President and Chief Financial Officer
Date: February 27, 2017 By:
/s/ Andrew J. Prentice
Senior Vice President,
Chief Accounting Officer and Treasurer
Pursuant to the requirements of the Securities Exchange Act of 1934, as amended, this report has been signed below by the following persons on behalf of the registrant and in the capacities and on the dates indicated.
|
Signature
|
Title
|
Date
|
||
|
/s/ Anthony E. Malkin
|
Chairman of the Board of Directors and Chief Executive Officer
|
February 27, 2017
|
||
|
Anthony E. Malkin
|
||||
|
(Principal Executive Officer)
|
||||
|
/s/ David A. Karp
|
Executive Vice President and Chief Financial Officer
|
February 27, 2017
|
||
|
David A. Karp
|
||||
|
(Principal Financial Officer)
|
||||
|
/s/ Andrew J. Prentice
|
Senior Vice President, Chief Accounting Officer and Treasurer
|
February 27, 2017
|
||
|
Andrew J. Prentice
|
(Principal Accounting Officer)
|
|||
|
/s/ William H. Berkman
|
Director
|
February 27, 2017
|
||
|
William H. Berkman
|
||||
|
/s/ Thomas J. DeRosa
|
Director
|
February 27, 2017
|
||
|
Thomas J. DeRosa
|
||||
|
/s/ Steven J. Gilbert
|
Lead Independent Director
|
February 27, 2017
|
||
|
Steven J. Gilbert
|
||||
|
/s/ S. Michael Giliberto
|
Director
|
February 27, 2017
|
||
|
S. Michael Giliberto
|
||||
|
/s/ James D. Robinson IV
|
Director
|
February 27, 2017
|
||
|
James D. Robinson IV
|
||||
73
Exhibit Index
|
Exhibit No.
|
Description
|
|
3.1
|
Articles of Amendment and Restatement of Empire State Realty Trust, Inc., incorporated by reference to Exhibit 3.1 to Amendment No. 8 to the Registrant's Form S-11 (Registration No. 333-179485), filed with the SEC on September 27, 2013.
|
|
3.2
|
Amended and Restated Bylaws of Empire State Realty Trust, Inc., incorporated by reference to Exhibit 3.1 to the Registrant’s Form 8-K filed with the SEC on February 19, 2015.
|
|
4.1
|
Specimen Class A Common Stock Certificate of Empire State Realty Trust, Inc., incorporated by reference to Exhibit 4.1 to Amendment No. 3 to the Registrant's Form S-11 (Registration No. 333-179485), filed with the SEC on November 2, 2012.
|
|
4.2
|
Specimen Class B Common Stock Certificate of Empire State Realty Trust, Inc., incorporated by reference to Exhibit 4.2 to Amendment No. 3 to the Registrant's Form S-11 (Registration No. 333-179485), filed with the SEC on November 2, 2012.
|
|
4.3
|
Indenture, dated August 12, 2014, by and among Empire State Realty OP, L.P., as issuer, Empire State Realty Trust, Inc., and Wilmington Trust, National Association, as trustee, incorporated by reference to Exhibit 4.1 to the Registrant’s Form 8-K filed with the SEC on August 12, 2014.
|
|
4.4
|
Form of Global Note representing Empire State Realty OP, L.P.’s 2.625% Exchangeable Senior Notes due 2019 (included in Exhibit 4.3).
|
|
10.1
|
Contribution Agreement among Empire Realty Trust, Inc., Empire Realty Trust, L.P. and certain members of the Malkin Group listed on the signature pages thereto, dated November 28, 2011, incorporated by reference to Exhibit 10.8 to the Registrant's Form S-11 (Registration No. 333-179485), filed with the SEC on February 13, 2012.
|
|
10.2
|
Amended and Restated Contribution Agreement among Empire Realty Trust, Inc., Empire Realty Trust, L.P. and certain entities affiliated with the Helmsley estate listed on the signature pages thereto, dated July 2, 2012, incorporated by reference to Exhibit 10.11 to Amendment No. 7 to the Registrant's Form S-11 (Registration No. 333-179485), filed with the SEC on September 19, 2013.
|
|
10.3
|
Form of Contribution Agreement among Empire Realty Trust, Inc., Empire Realty Trust, L.P. and each of the private existing entities that contributed properties in the consolidation, incorporated by reference to Exhibit 10.10 to the Registrant's Form S-11 (Registration No. 333-179485), filed with the SEC on February 13, 2012.
|
|
10.4
|
Form of Contribution Agreement among Empire State Realty Trust, Inc., Empire Realty OP, L.P. and each of the public existing entities that contributed properties in the consolidation, incorporated by reference to Exhibit 10.11 to the Registrant's Form S-11 (Registration No. 333-179485), filed with the SEC on February 13, 2012.
|
|
10.5
|
Representation, Warranty and Indemnity Agreement among Empire Realty Trust, Inc., Empire Realty Trust, L.P., Anthony E. Malkin, Cynthia M. Blumenthal and Scott D. Malkin, dated November 28, 2011, incorporated by reference to Exhibit 10.13 to the Registrant's Form S-11 (Registration No. 333-179485), filed with the SEC on February 13, 2012.
|
|
10.6
|
Form of Merger Agreement among Empire Realty Trust, Inc., Empire Realty Trust, L.P. and each of the predecessor management companies, incorporated by reference to Exhibit 10.12 to the Registrant's Form S-11 (Registration No. 333-179485), filed with the SEC on February 13, 2012.
|
|
10.7+
|
First Amended and Restated Empire State Realty Trust, Inc. Empire State Realty OP, L.P. 2013 Equity Incentive Plan (as amended and restated as of April 4, 2016), incorporated by reference to Exhibit 10.10 to the Registrant's Form 10-Q filed with the SEC on May 5, 2016.
|
|
10.8+
|
Form of Restricted Stock Agreement (Performance-Based)), incorporated by reference to Exhibit 10.11 to the Registrant’s Form 10-K, filed with the SEC on March 24, 2014.
|
|
10.9+
|
Form of Restricted Stock Agreement (Time-Based), incorporated by reference to Exhibit 10.12 to the Registrant’s Form 10-K, filed with the SEC on March 24, 2014.
|
|
10.10+
|
Form of LTIP Agreement (Performance-Based), incorporated by reference to Exhibit 10.31 to the Registrant’s Form 10-K, filed with the SEC on March 24, 2014.
|
|
10.11+
|
Form of LTIP Agreement (Time-Based), incorporated by reference to Exhibit 10.14 to the Registrant’s Form 10-K, filed with the SEC on March 24, 2014.
|
|
10.12
|
Amended and Restated Agreement of Limited Partnership of Empire State Realty OP, L.P., dated October 1, 2013, incorporated by reference to Exhibit 10.1 to the Registrant's Form 10-Q filed with the SEC on November 12, 2013.
|
|
10.13
|
Amendment No. 1 to the First Amended and Restated Agreement of Limited Partnership of Empire State Realty OP, L.P., dated August 26, 2014, incorporated by reference to Exhibit 10.1 to the Registrant’s Form 8-K filed with the SEC on August 26, 2014.
|
74
|
10.14
|
Registration Rights Agreement among Empire State Realty Trust, Inc. and the persons named therein, dated October 7, 2013, incorporated by reference to Exhibit 10.2 to the Registrant's Form 10-Q filed with the SEC on November 12, 2013.
|
|
10.15
|
Tax Protection Agreement among Empire State Realty Trust, Inc., Empire State Realty OP, L.P., and the parties named therein, dated October 7, 2013, incorporated by reference to Exhibit 10.3 to the Registrant's Form 10-Q filed with the SEC on November 12, 2013.
|
|
10.16
|
Indemnification Agreement among Empire State Realty Trust, Inc. and Peter L. Malkin, dated October 7, 2013, incorporated by reference to Exhibit 10.4 to the Registrant's Form 10-Q filed with the SEC on November 12, 2013.
|
|
10.17
|
Indemnification Agreement among Empire State Realty Trust, Inc. and Anthony E. Malkin, dated October 7, 2013, incorporated by reference to Exhibit 10.5 to the Registrant's Form 10-Q filed with the SEC on November 12, 2013.
|
|
10.18
|
Indemnification Agreement among Empire State Realty Trust, Inc. and David A. Karp, dated October 7, 2013, incorporated by reference to Exhibit 10.6 to the Registrant's Form 10-Q filed with the SEC on November 12, 2013.
|
|
10.19
|
Indemnification Agreement among Empire State Realty Trust, Inc. and Thomas P. Durels, dated October 7, 2013, incorporated by reference to Exhibit 10.7 to the Registrant's Form 10-Q filed with the SEC on November 12, 2013.
|
|
10.20
|
Indemnification Agreement among Empire State Realty Trust, Inc. and Thomas N. Keltner, Jr., dated October 7, 2013, incorporated by reference to Exhibit 10.8 to the Registrant's Form 10-Q filed with the SEC on November 12, 2013.
|
|
10.21
|
Indemnification Agreement among Empire State Realty Trust, Inc. and John B. Kessler, dated February 1, 2015, incorporated by reference to Exhibit 10.24 to the Registrant's Form 10-K filed with the SEC on February 27, 2015.
|
|
10.22
|
Indemnification Agreement among Empire State Realty Trust, Inc. and William H. Berkman, dated October 7, 2013, incorporated by reference to Exhibit 10.9 to the Registrant's Form 10-Q filed with the SEC on November 12, 2013.
|
|
10.23
|
Indemnification Agreement among Empire State Realty Trust, Inc. and Alice M. Connell, dated October 7, 2013, incorporated by reference to Exhibit 10.10 to the Registrant's Form 10-Q filed with the SEC on November 12, 2013.
|
|
10.24
|
Indemnification Agreement among Empire State Realty Trust, Inc. and Thomas J. DeRosa, dated October 7, 2013, incorporated by reference to Exhibit 10.11 to the Registrant's Form 10-Q filed with the SEC on November 12, 2013.
|
|
10.25
|
Indemnification Agreement among Empire State Realty Trust, Inc. and Steven J. Gilbert, dated October 7, 2013, incorporated by reference to Exhibit 10.12 to the Registrant's Form 10-Q filed with the SEC on November 12, 2013.
|
|
10.26
|
Indemnification Agreement among Empire State Realty Trust, Inc. and S. Michael Giliberto, dated October 7, 2013, incorporated by reference to Exhibit 10.13 to the Registrant's Form 10-Q filed with the SEC on November 12, 2013.
|
|
10.27
|
Indemnification Agreement among Empire State Realty Trust, Inc. and Lawrence E. Golub, dated October 7, 2013, incorporated by reference to Exhibit 10.14 to the Registrant's Form 10-Q filed with the SEC on November 12, 2013.
|
|
10.28
|
Indemnification Agreement among Empire State Realty Trust, Inc. and James D. Robinson IV, dated December 23, 2014, incorporated by reference to Exhibit 10.31 to the Registrant's Form 10-K filed with the SEC on February 27, 2015.
|
|
10.29+
|
Amended and Restated Employment Agreement between Empire State Realty Trust, Inc. and Anthony E. Malkin, dated April 5, 2016, incorporated by reference to Exhibit 10.32 to the Registrant's Form 10-Q filed with the SEC on May 5, 2016.
|
|
10.30+
|
Amended and Restated Change in Control Severance Agreement between Empire State Realty Trust, Inc. and David A. Karp, dated April 5, 2016, incorporated by reference to Exhibit 10.33 to the Registrant's Form 10-Q filed with the SEC on May 5, 2016.
|
|
10.31+
|
Amended and Restated Change in Control Severance Agreement between Empire State Realty Trust, Inc. and Thomas N. Keltner, Jr., dated April 5, 2016, incorporated by reference to Exhibit 10.34 to the Registrant's Form 10-Q filed with the SEC on May 5, 2016.
|
|
10.32+
|
Amended and Restated Change in Control Severance Agreement between Empire State Realty Trust, Inc. and Thomas P. Durels, dated April 5, 2016, incorporated by reference to Exhibit 10.35 to the Registrant's Form 10-Q filed with the SEC on May 5, 2016.
|
|
10.33+
|
Change in Control Severance Agreement between Empire State Realty Trust, Inc. and John B. Kessler, dated February 1, 2015, incorporated by reference to Exhibit 10.36 to the Registrant's Form 10-K filed with the SEC on February 27, 2015.
|
75
|
10.34
|
Credit Agreement (Unsecured Revolving Credit Facility) dated January 23, 2015 among Empire State Realty OP, L.P., ESRT Empire State Building, L.L.C., Empire State Realty Trust, Inc., the subsidiaries of Empire State Realty OP, L.P. from time to time party thereto, Bank of America, N.A., Merrill Lynch, Pierce, Fenner & Smith Incorporated, Goldman Sachs Bank USA and the other lenders party thereto, incorporated by reference to Exhibit 10.37 to the Registrant's Form 10-K filed with the SEC on February 27, 2015.
|
|
10.35
|
Term Loan Agreement, dated August 24, 2015, among Empire State Realty OP, L.P., Empire State Realty Trust, Inc. as borrower, Wells Fargo Bank, National Association, as administrative agent, the lenders party thereto, Capital One, National Association, as syndication agent, and PNC Bank, National Association, as documentation agent, incorporated by reference to Exhibit 10.1 to the Registrant’s Form 8-K filed with the SEC on August 25, 2015
|
|
10.36
|
Note Purchase Agreement, dated March 27, 2015, among Empire State Realty OP, L.P., Empire State Realty Trust, Inc. and the purchasers named therein, incorporated by reference to Exhibit 10.1 to the Registrant's Form 8-K filed with the SEC on March 30, 2015.
|
|
10.37
|
Registration Rights Agreement among Empire State Realty Trust, Inc. and the persons named therein, dated July 15, 2014, incorporated by reference to Exhibit 10.4 to the Registrant's Form 8-K filed with the SEC on July 21, 2014.
|
|
10.38
|
Registration Rights Agreement, dated August 12, 2014, by and among Empire State Realty OP, L.P., Empire State Realty Trust, Inc. and Goldman, Sachs & Co., incorporated by reference to Exhibit 10.1 to the Registrant’s Form 8-K filed with the SEC on August 12, 2014.
|
|
10.39
|
Form of Asset and Property Management Agreement, incorporated by reference to Exhibit 10.18 to Amendment No. 6 to the Registrant's Form S-11 (Registration No. 333-179485), filed with the SEC on September 6, 2013.
|
|
10.40
|
Form of Services Agreement, incorporated by reference to Exhibit 10.19 to Amendment No. 6 to the Registrant's Form S-11 (Registration No. 333-179485), filed with the SEC on September 6, 2013.
|
|
10.41
|
Stockholders Agreement dated as of August 23, 2016, by and between Empire State Realty Trust, Inc. and Q REIT Holding LLC, incorporated by reference to Exhibit 10.1 to the Registrant's Form 8-K filed with the SEC on August 23, 2016.
|
|
10.42
|
Registration Rights Agreement dated as of August 23, 2016, by and between Empire State Realty Trust, Inc. and Q REIT Holding LLC, incorporated by reference to Exhibit 10.2 to the Registrant's Form 8-K filed with the SEC on August 23, 2016.
|
|
21.1*
|
Subsidiaries of Registrant
|
|
23.1*
|
Consent of Ernst & Young LLP
|
|
31.1*
|
Certification of Chief Executive Officer pursuant to Rule 13a-14(a)/15d-14(a) of the Securities Exchange Act of 1934, as amended, as adopted pursuant to Section 302 of the Sarbanes-Oxley Act of 2002.
|
|
31.2*
|
Certification of Chief Financial Officer pursuant to Rule 13a-14(a)/15d-14(a) of the Securities Exchange Act of 1934, as amended, as adopted pursuant to Section 302 of the Sarbanes-Oxley Act of 2002.
|
|
32.1*
|
Certification of Chief Executive Officer pursuant to 18 U.S.C. 1350, as adopted pursuant to Section 906 of the Sarbanes-Oxley Act of 2002.
|
|
32.2*
|
Certification of Chief Financial Officer pursuant to 18 U.S.C. 1350, as adopted pursuant to Section 906 of the Sarbanes-Oxley Act of 2002.
|
|
101.INS*
|
XBRL Instance Document
|
|
101.SCH*
|
XBRL Taxonomy Extension Schema Document
|
|
101.CAL*
|
XBRL Taxonomy Extension Calculation Document
|
|
101.DEF*
|
XBRL Taxonomy Extension Definitions Document
|
|
101.LAB*
|
XBRL Taxonomy Extension Labels Document
|
|
101.PRE*
|
XBRL Taxonomy Extension Presentation Document
|
|
Notes:
|
|
|
* Filed herewith.
|
|
|
+ Indicates management contract or compensatory plan or arrangement required to be filed or incorporated by reference as an exhibit to this Form 10-K pursuant to Item 15(b) of Form 10-K.
|
|
76
EMPIRE STATE REALTY TRUST
INDEX TO FINANCIAL STATEMENTS
|
PAGE
|
|||
|
Report of Independent Registered Public Accounting Firm
|
|||
|
Consolidated Balance Sheets as of December 31, 2016 and 2015
|
|||
|
Consolidated Statements of Operations for the years ended December 31, 2016, 2015 and 2014
|
|||
|
Consolidated Statements of Comprehensive Income for the years ended December 31, 2016, 2015 and 2014
|
|||
|
Consolidated Statements of Stockholders' Equity for the years ended December 31, 2016, 2015 and 2014
|
|||
|
Consolidated Statements of Cash Flows for the years ended December 31, 2016, 2015 and 2014
|
|||
|
Notes to Consolidated Financial Statements
|
|||
|
Financial Statement Schedules:
|
|||
|
Schedule II - Valuation and Qualifying Accounts
|
|||
|
Schedule III - Real Estate and Accumulated Depreciation
|
|||
77
Report of Independent Registered Public Accounting Firm
The Board of Directors and Stockholders of Empire State Realty Trust, Inc.
We have audited the accompanying consolidated balance sheets of Empire State Realty Trust, Inc. (the Company) as of December 31, 2016 and 2015, and the related consolidated statements of operations, comprehensive income, stockholders’ equity and cash flows for each of the three years in the period ended December 31, 2016. Our audits also included the financial statement schedules listed in the Index at Item 15(a). These financial statements and schedules are the responsibility of the Company's management. Our responsibility is to express an opinion on these financial statements and schedules based on our audits.
We conducted our audits in accordance with the standards of the Public Company Accounting Oversight Board (United States). Those standards require that we plan and perform the audit to obtain reasonable assurance about whether the financial statements are free of material misstatement. An audit includes examining, on a test basis, evidence supporting the amounts and disclosures in the financial statements. An audit also includes assessing the accounting principles used and significant estimates made by management, as well as evaluating the overall financial statement presentation. We believe that our audits provide a reasonable basis for our opinion.
In our opinion, the financial statements referred to above present fairly, in all material respects, the consolidated financial position of Empire State Realty Trust, Inc. at December 31, 2016 and 2015, and the consolidated results of its operations and its cash flows for each of the three years in the period ended December 31, 2016, in conformity with U.S. generally accepted accounting principles. Also, in our opinion, the related financial statement schedules, when considered in relation to the basic financial statements taken as a whole, present fairly in all material respects the information set forth therein.
We also have audited, in accordance with the standards of the Public Company Accounting Oversight Board (United States), Empire State Realty Trust, Inc.’s internal control over financial reporting as of December 31, 2016, based on criteria established in Internal Control-Integrated Framework issued by the Committee of Sponsoring Organizations of the Treadway Commission (2013 framework), and our report dated February 27, 2017 expressed an unqualified opinion thereon.
/s/ Ernst & Young LLP
New York, New York
February 27, 2017
F-1
Empire State Realty Trust, Inc.
Consolidated Balance Sheets
(amounts in thousands, except share and per share amounts)
|
ASSETS
|
December 31, 2016
|
December 31, 2015
|
|||||
|
Commercial real estate properties, at cost:
|
|||||||
|
Land
|
$
|
201,196
|
|
$
|
201,196
|
|
|
|
Development costs
|
7,951
|
|
7,498
|
|
|||
|
Building and improvements
|
2,249,482
|
|
2,067,636
|
|
|||
|
2,458,629
|
|
2,276,330
|
|
||||
|
Less: accumulated depreciation
|
(556,546
|
)
|
(465,584
|
)
|
|||
|
Commercial real estate properties, net
|
1,902,083
|
|
1,810,746
|
|
|||
|
Cash and cash equivalents
|
554,371
|
|
46,685
|
|
|||
|
Restricted cash
|
61,514
|
|
65,880
|
|
|||
|
Tenant and other receivables, net of allowance of $3,333 and $2,792 in 2016 and 2015, respectively
|
22,542
|
|
18,782
|
|
|||
|
Deferred rent receivables, net of allowance of $390 and $245 in 2016 and 2015, respectively
|
152,074
|
|
122,048
|
|
|||
|
Prepaid expenses and other assets
|
53,749
|
|
50,460
|
|
|||
|
Deferred costs, net
|
277,081
|
|
310,679
|
|
|||
|
Acquired below market ground leases, net
|
376,060
|
|
383,891
|
|
|||
|
Goodwill
|
491,479
|
|
491,479
|
|
|||
|
Total assets
|
$
|
3,890,953
|
|
$
|
3,300,650
|
|
|
|
LIABILITIES AND EQUITY
|
|||||||
|
Liabilities:
|
|||||||
|
Mortgage notes payable
|
$
|
759,016
|
|
$
|
747,661
|
|
|
|
Senior unsecured notes
|
590,388
|
|
587,018
|
|
|||
|
Unsecured term loan facility
|
262,927
|
|
262,545
|
|
|||
|
Unsecured revolving credit facility
|
—
|
|
35,192
|
|
|||
|
Accounts payable and accrued expenses
|
134,064
|
|
111,099
|
|
|||
|
Acquired below market leases, net
|
82,300
|
|
104,171
|
|
|||
|
Deferred revenue and other liabilities
|
32,212
|
|
31,388
|
|
|||
|
Tenants’ security deposits
|
47,183
|
|
48,890
|
|
|||
|
Total liabilities
|
1,908,090
|
|
1,927,964
|
|
|||
|
Commitments and contingencies
|
|
|
|
|
|||
|
Equity:
|
|||||||
|
Empire State Realty Trust, Inc. stockholders' equity:
|
|||||||
|
Preferred stock, $0.01 par value per share, 50,000,000 shares authorized, none issued or outstanding
|
—
|
|
—
|
|
|||
|
Class A common stock, $0.01 par value per share, 400,000,000 shares authorized, 154,744,740 and 118,903,312 shares issued and outstanding in 2016 and 2015, respectively
|
1,547
|
|
1,189
|
|
|||
|
Class B common stock, $0.01 par value per share, 50,000,000 shares authorized, 1,095,737 and 1,120,067 shares issued and outstanding in 2016 and 2015, respectively
|
11
|
|
11
|
|
|||
|
Additional paid-in capital
|
1,104,463
|
|
469,152
|
|
|||
|
Accumulated other comprehensive loss
|
(2,789
|
)
|
(883
|
)
|
|||
|
Retained earnings
|
50,904
|
|
55,260
|
|
|||
|
Total Empire State Realty Trust, Inc.'s stockholders' equity
|
1,154,136
|
|
524,729
|
|
|||
|
Non-controlling interests in operating partnership
|
820,723
|
|
839,953
|
|
|||
|
Private perpetual preferred units, $16.62 per unit liquidation preference, 1,560,360 issued and outstanding in 2016 and 2015
|
8,004
|
|
8,004
|
|
|||
|
Total equity
|
1,982,863
|
|
1,372,686
|
|
|||
|
Total liabilities and equity
|
$
|
3,890,953
|
|
$
|
3,300,650
|
|
|
The accompanying notes are an integral part of these financial statements
F-2
Empire State Realty Trust, Inc.
(amounts in thousands, except per share amounts)
|
For the Year Ended December 31,
|
|||||||||||
|
|
2016
|
2015
|
2014
|
||||||||
|
Revenues:
|
|||||||||||
|
Rental revenue
|
$
|
460,653
|
|
$
|
447,784
|
|
$
|
400,825
|
|
||
|
Tenant expense reimbursement
|
73,459
|
|
79,516
|
|
67,651
|
|
|||||
|
Observatory revenue
|
124,814
|
|
112,172
|
|
111,541
|
|
|||||
|
Construction revenue
|
—
|
|
1,981
|
|
38,648
|
|
|||||
|
Third-party management and other fees
|
1,766
|
|
2,133
|
|
2,376
|
|
|||||
|
Other revenue and fees
|
17,308
|
|
14,048
|
|
14,285
|
|
|||||
|
Total revenues
|
678,000
|
|
657,634
|
|
635,326
|
|
|||||
|
Operating expenses:
|
|||||||||||
|
Property operating expenses
|
153,850
|
|
158,638
|
|
148,676
|
|
|||||
|
Ground rent expenses
|
9,326
|
|
9,326
|
|
5,339
|
|
|||||
|
General and administrative expenses
|
49,078
|
|
38,073
|
|
39,037
|
|
|||||
|
Observatory expenses
|
29,833
|
|
32,174
|
|
31,413
|
|
|||||
|
Construction expenses
|
—
|
|
3,222
|
|
38,596
|
|
|||||
|
Real estate taxes
|
96,061
|
|
93,165
|
|
82,131
|
|
|||||
|
Acquisition expenses
|
98
|
|
193
|
|
3,382
|
|
|||||
|
Depreciation and amortization
|
155,211
|
|
171,474
|
|
145,431
|
|
|||||
|
Total operating expenses
|
493,457
|
|
506,265
|
|
494,005
|
|
|||||
|
Total operating income
|
184,543
|
|
151,369
|
|
141,321
|
|
|||||
|
Interest expense
|
(71,147
|
)
|
(67,492
|
)
|
(66,456
|
)
|
|||||
|
Income before income taxes
|
113,396
|
|
83,877
|
|
74,865
|
|
|||||
|
Income tax expense
|
(6,146
|
)
|
(3,949
|
)
|
(4,655
|
)
|
|||||
|
Net income
|
107,250
|
|
79,928
|
|
70,210
|
|
|||||
|
Private perpetual preferred unit distributions
|
(936
|
)
|
(936
|
)
|
(476
|
)
|
|||||
|
Net income attributable to non-controlling interests
|
(54,858
|
)
|
(45,262
|
)
|
(43,067
|
)
|
|||||
|
Net income attributable to common stockholders
|
$
|
51,456
|
|
$
|
33,730
|
|
$
|
26,667
|
|
||
|
Total weighted average shares:
|
|||||||||||
|
Basic
|
133,881
|
|
114,245
|
|
97,941
|
|
|||||
|
Diluted
|
277,568
|
|
266,621
|
|
254,506
|
|
|||||
|
Net income per share attributable to common stockholders:
|
|||||||||||
|
Basic
|
$
|
0.38
|
|
$
|
0.30
|
|
$
|
0.27
|
|
||
|
Diluted
|
$
|
0.38
|
|
$
|
0.29
|
|
$
|
0.27
|
|
||
The accompanying notes are an integral part of these financial statements
F-3
Empire State Realty Trust, Inc.
Consolidated Statements of Comprehensive Income
(amounts in thousands)
|
For the Year Ended December 31,
|
|||||||||||
|
2016
|
2015
|
2014
|
|||||||||
|
Net income
|
$
|
107,250
|
|
$
|
79,928
|
|
$
|
70,210
|
|
||
|
Other comprehensive loss:
|
|||||||||||
|
Unrealized loss on valuation of interest rate swap agreements
|
(3,054
|
)
|
(1,922
|
)
|
—
|
|
|||||
|
Other comprehensive loss
|
(3,054
|
)
|
(1,922
|
)
|
—
|
|
|||||
|
Comprehensive income
|
104,196
|
|
78,006
|
|
70,210
|
|
|||||
|
Net income attributable to non-controlling interests and private perpetual preferred unitholders
|
(55,794
|
)
|
(46,198
|
)
|
(43,543
|
)
|
|||||
|
Other comprehensive loss attributable to non-controlling interests
|
1,576
|
|
1,100
|
|
—
|
|
|||||
|
Comprehensive income attributable to common stockholders
|
$
|
49,978
|
|
$
|
32,908
|
|
$
|
26,667
|
|
||
The accompanying notes are an integral part of these financial statements
F-4
Empire State Realty Trust, Inc.
Consolidated Statements of Stockholders' Equity
(amounts in thousands)
|
Number of Class A Common Shares
|
Class A Common Stock
|
Number of Class B Common Shares
|
Class B Common Stock
|
Additional Paid-In Capital
|
Accumulated Other Comprehensive Income (Loss)
|
Retained Earnings
|
Total Stockholders' Equity
|
Non-controlling Interests
|
Private Perpetual Preferred Units
|
Total Equity
|
|||||||||||||||||||||||||||||||
|
Balance at December 31, 2013
|
94,484
|
|
$
|
945
|
|
1,122
|
|
$
|
11
|
|
$
|
316,558
|
|
$
|
—
|
|
$
|
67,644
|
|
$
|
385,158
|
|
$
|
618,027
|
|
$
|
—
|
|
$
|
1,003,185
|
|
||||||||||
|
Issuance of Class A common stock, Class B common stock, and non-controlling interests related to the acquisition of the option properties
|
2,556
|
|
25
|
|
110
|
|
1
|
|
44,372
|
|
—
|
|
—
|
|
44,398
|
|
334,930
|
|
—
|
|
379,328
|
|
|||||||||||||||||||
|
Redemption of operating partnership units
|
—
|
|
—
|
|
—
|
|
—
|
|
—
|
|
—
|
|
—
|
|
—
|
|
(829
|
)
|
—
|
|
(829
|
)
|
|||||||||||||||||||
|
Issuance of private perpetual preferred units in exchange for common units
|
—
|
|
—
|
|
—
|
|
—
|
|
—
|
|
—
|
|
—
|
|
—
|
|
(8,004
|
)
|
8,004
|
|
—
|
|
|||||||||||||||||||
|
Equity component of senior unsecured notes
|
—
|
|
—
|
|
—
|
|
—
|
|
4,857
|
|
—
|
|
—
|
|
4,857
|
|
8,347
|
|
—
|
|
13,204
|
|
|||||||||||||||||||
|
Conversion of operating partnership units and Class B shares to Class A shares
|
8,995
|
|
90
|
|
(71
|
)
|
—
|
|
40,611
|
|
—
|
|
—
|
|
40,701
|
|
(40,701
|
)
|
—
|
|
—
|
|
|||||||||||||||||||
|
Equity compensation:
|
|
|
|
|
|||||||||||||||||||||||||||||||||||||
|
LTIP units
|
—
|
|
—
|
|
—
|
|
—
|
|
—
|
|
—
|
|
—
|
|
—
|
|
3,265
|
|
—
|
|
3,265
|
|
|||||||||||||||||||
|
Restricted stock, net of forfeitures
|
(5
|
)
|
—
|
|
—
|
|
—
|
|
455
|
|
—
|
|
—
|
|
455
|
|
—
|
|
—
|
|
455
|
|
|||||||||||||||||||
|
Dividends and distributions
|
—
|
|
—
|
|
—
|
|
—
|
|
—
|
|
—
|
|
(33,598
|
)
|
(33,598
|
)
|
(53,647
|
)
|
(476
|
)
|
(87,721
|
)
|
|||||||||||||||||||
|
Net income
|
—
|
|
—
|
|
—
|
|
—
|
|
—
|
|
—
|
|
26,667
|
|
26,667
|
|
43,067
|
|
476
|
|
70,210
|
|
|||||||||||||||||||
|
Balance at December 31, 2014
|
106,030
|
|
1,060
|
|
1,161
|
|
12
|
|
406,853
|
|
—
|
|
60,713
|
|
468,638
|
|
904,455
|
|
8,004
|
|
1,381,097
|
|
|||||||||||||||||||
|
Conversion of operating partnership units and Class B shares to Class A shares
|
12,859
|
|
129
|
|
(41
|
)
|
(1
|
)
|
62,003
|
|
(61
|
)
|
—
|
|
62,070
|
|
(62,070
|
)
|
—
|
|
—
|
|
|||||||||||||||||||
|
Equity compensation:
|
|
|
|
|
|||||||||||||||||||||||||||||||||||||
|
LTIP units, net of forfeitures
|
—
|
|
—
|
|
—
|
|
—
|
|
—
|
|
—
|
|
—
|
|
—
|
|
5,187
|
|
—
|
|
5,187
|
|
|||||||||||||||||||
|
Restricted stock, net of forfeitures
|
14
|
|
—
|
|
—
|
|
—
|
|
296
|
|
—
|
|
—
|
|
296
|
|
—
|
|
—
|
|
296
|
|
|||||||||||||||||||
|
Dividends and distributions
|
—
|
|
—
|
|
—
|
|
—
|
|
—
|
|
—
|
|
(39,183
|
)
|
(39,183
|
)
|
(51,781
|
)
|
(936
|
)
|
(91,900
|
)
|
|||||||||||||||||||
|
Net income
|
—
|
|
—
|
|
—
|
|
—
|
|
—
|
|
—
|
|
33,730
|
|
33,730
|
|
45,262
|
|
936
|
|
79,928
|
|
|||||||||||||||||||
|
Unrealized loss on valuation of interest rate swap agreements
|
—
|
|
—
|
|
—
|
|
—
|
|
—
|
|
(822
|
)
|
—
|
|
(822
|
)
|
(1,100
|
)
|
—
|
|
(1,922
|
)
|
|||||||||||||||||||
|
Balance at December 31, 2015
|
118,903
|
|
1,189
|
|
1,120
|
|
11
|
|
469,152
|
|
(883
|
)
|
55,260
|
|
524,729
|
|
839,953
|
|
8,004
|
|
1,372,686
|
|
|||||||||||||||||||
|
Issuance of Class A shares, net of costs
|
29,611
|
|
296
|
|
—
|
|
—
|
|
610,910
|
|
—
|
|
—
|
|
611,206
|
|
—
|
|
—
|
|
611,206
|
|
|||||||||||||||||||
|
Conversion of operating partnership units and Class B shares to Class A shares
|
6,191
|
|
62
|
|
(24
|
)
|
—
|
|
24,044
|
|
(428
|
)
|
—
|
|
23,678
|
|
(23,678
|
)
|
—
|
|
—
|
|
|||||||||||||||||||
|
Equity compensation:
|
—
|
|
—
|
|
|||||||||||||||||||||||||||||||||||||
|
LTIP Units
|
—
|
|
—
|
|
—
|
|
—
|
|
—
|
|
—
|
|
—
|
|
—
|
|
9,372
|
|
—
|
|
9,372
|
|
|||||||||||||||||||
|
Restricted stock, net of forfeitures
|
40
|
|
—
|
|
—
|
|
—
|
|
357
|
|
—
|
|
—
|
|
357
|
|
—
|
|
—
|
|
357
|
|
|||||||||||||||||||
|
Dividends and distributions
|
—
|
|
—
|
|
—
|
|
—
|
|
—
|
|
—
|
|
(55,812
|
)
|
(55,812
|
)
|
(58,206
|
)
|
(936
|
)
|
(114,954
|
)
|
|||||||||||||||||||
|
Net income
|
—
|
|
—
|
|
—
|
|
—
|
|
—
|
|
—
|
|
51,456
|
|
51,456
|
|
54,858
|
|
936
|
|
107,250
|
|
|||||||||||||||||||
|
Unrealized loss on valuation of interest rate swap agreements
|
—
|
|
—
|
|
—
|
|
—
|
|
—
|
|
(1,478
|
)
|
—
|
|
(1,478
|
)
|
(1,576
|
)
|
—
|
|
(3,054
|
)
|
|||||||||||||||||||
|
Balance at December 31, 2016
|
154,745
|
|
$
|
1,547
|
|
1,096
|
|
$
|
11
|
|
$
|
1,104,463
|
|
$
|
(2,789
|
)
|
$
|
50,904
|
|
$
|
1,154,136
|
|
$
|
820,723
|
|
$
|
8,004
|
|
$
|
1,982,863
|
|
||||||||||
The accompanying notes are an integral part of these financial statements
F-5
Empire State Realty Trust, Inc.
(amounts in thousands)
|
For the Year Ended December 31,
|
|||||||||||
|
|
2016
|
2015
|
2014
|
||||||||
|
Cash Flows From Operating Activities
|
|||||||||||
|
Net income
|
$
|
107,250
|
|
$
|
79,928
|
|
$
|
70,210
|
|
||
|
Adjustments to reconcile net income to net cash provided by operating activities:
|
|||||||||||
|
Depreciation and amortization
|
155,211
|
|
171,474
|
|
145,431
|
|
|||||
|
Amortization of deferred finance costs and debt premiums and discount
|
739
|
|
1,698
|
|
3,956
|
|
|||||
|
Amortization of acquired above and below-market leases, net
|
(8,795
|
)
|
(19,353
|
)
|
(14,095
|
)
|
|||||
|
Amortization of acquired below-market ground leases
|
7,831
|
|
7,996
|
|
4,603
|
|
|||||
|
Straight-lining of rental revenue
|
(30,147
|
)
|
(21,220
|
)
|
(39,715
|
)
|
|||||
|
Equity based compensation
|
9,729
|
|
5,483
|
|
3,720
|
|
|||||
|
Increase (decrease) in cash flows due to changes in operating assets and liabilities (excluding the effect of acquisitions):
|
|||||||||||
|
Restricted cash
|
2,121
|
|
2,954
|
|
(4,987
|
)
|
|||||
|
Tenant and other receivables
|
(3,760
|
)
|
4,963
|
|
3,135
|
|
|||||
|
Deferred leasing costs
|
(22,622
|
)
|
(31,367
|
)
|
(12,132
|
)
|
|||||
|
Prepaid expenses and other assets
|
(3,289
|
)
|
(1,956
|
)
|
(13,052
|
)
|
|||||
|
Accounts payable and accrued expenses
|
3,491
|
|
(925
|
)
|
(14,756
|
)
|
|||||
|
Deferred revenue and other liabilities
|
824
|
|
3,512
|
|
6,240
|
|
|||||
|
Net cash provided by operating activities
|
218,583
|
|
203,187
|
|
138,558
|
|
|||||
|
Cash Flows From Investing Activities
|
|||||||||||
|
Decrease (increase) in restricted cash for investing activities
|
538
|
|
(119
|
)
|
9,345
|
|
|||||
|
Additions to building and improvements
|
(181,923
|
)
|
(141,685
|
)
|
(121,287
|
)
|
|||||
|
Development costs
|
(453
|
)
|
(512
|
)
|
(527
|
)
|
|||||
|
Acquisition of real estate property, net of cash received
|
—
|
|
—
|
|
(186,588
|
)
|
|||||
|
Net cash used in investing activities
|
(181,838
|
)
|
(142,316
|
)
|
(299,057
|
)
|
|||||
The accompanying notes are an integral part of these financial statements
F-6
Empire State Realty Trust, Inc.
Consolidated Statements of Cash Flows (continued)
(amounts in thousands)
|
For the Year Ended December 31,
|
|||||||||||
|
2016
|
2015
|
2014
|
|||||||||
|
Cash Flows From Financing Activities
|
|||||||||||
|
Proceeds from unsecured revolving credit facility
|
50,000
|
|
655,000
|
|
—
|
|
|||||
|
Repayments of unsecured revolving credit facility
|
(90,000
|
)
|
(615,000
|
)
|
—
|
|
|||||
|
Proceeds from mortgage notes payable
|
50,000
|
|
—
|
|
191,000
|
|
|||||
|
Repayment of mortgage notes payable
|
(32,305
|
)
|
(146,918
|
)
|
(348,308
|
)
|
|||||
|
Proceeds from senior unsecured notes
|
—
|
|
350,000
|
|
250,000
|
|
|||||
|
Proceeds from unsecured term loan
|
—
|
|
265,000
|
|
—
|
|
|||||
|
Proceeds from term loan and credit facility
|
—
|
|
—
|
|
435,600
|
|
|||||
|
Repayments of term loan and credit facility
|
—
|
|
(470,000
|
)
|
(290,600
|
)
|
|||||
|
Deferred financing costs
|
(3,006
|
)
|
(6,100
|
)
|
(4,483
|
)
|
|||||
|
Net proceeds from the sale of common stock
|
611,206
|
|
—
|
|
—
|
|
|||||
|
Private perpetual preferred unit distributions
|
(936
|
)
|
(936
|
)
|
(476
|
)
|
|||||
|
Dividends paid to common stockholders
|
(55,812
|
)
|
(39,183
|
)
|
(33,598
|
)
|
|||||
|
Distributions paid to noncontrolling interests in the operating partnership
|
(58,206
|
)
|
(51,781
|
)
|
(53,647
|
)
|
|||||
|
Net cash provided by (used in) financing activities
|
470,941
|
|
(59,918
|
)
|
145,488
|
|
|||||
|
Net increase (decrease) in cash and cash equivalents
|
507,686
|
|
953
|
|
(15,011
|
)
|
|||||
|
Cash and cash equivalents—beginning of period
|
46,685
|
|
45,732
|
|
60,743
|
|
|||||
|
Cash and cash equivalents—end of period
|
$
|
554,371
|
|
$
|
46,685
|
|
$
|
45,732
|
|
||
|
Supplemental disclosures of cash flow information:
|
|||||||||||
|
Cash paid for interest
|
$
|
69,062
|
|
$
|
64,808
|
|
$
|
60,621
|
|
||
|
Cash paid for income taxes
|
$
|
6,238
|
|
$
|
4,465
|
|
$
|
3,690
|
|
||
|
Non-cash investing and financing activities:
|
|||||||||||
|
Building and improvements included in accounts payable and accrued expenses
|
$
|
66,620
|
|
$
|
51,315
|
|
$
|
36,920
|
|
||
|
Derivative instruments at fair values included in prepaid expenses and other assets
|
614
|
|
—
|
|
—
|
|
|||||
|
Derivative instruments at fair values included in accounts payable and accrued expenses
|
5,591
|
|
1,922
|
|
—
|
|
|||||
|
Conversion of operating partnership units and Class B shares to Class A shares
|
23,678
|
|
62,003
|
|
40,611
|
|
|||||
|
Issuance of Class A Common Stock, Class B Common Stock, and operating partnership units in connection with the acquisition of real estate properties
|
—
|
|
—
|
|
379,328
|
|
|||||
|
Debt assumed with the acquisition of real estate properties
|
—
|
|
—
|
|
182,851
|
|
|||||
|
Acquisition of working capital (deficit), net of cash
|
—
|
|
—
|
|
(4,749
|
)
|
|||||
|
Redemption of operating partnership units to repay other receivable
|
—
|
|
—
|
|
829
|
|
|||||
The accompanying notes are an integral part of these financial statements
F-7
Empire State Realty Trust, Inc.
Notes to Consolidated Financial Statements
1. Description of Business and Organization
As used in these consolidated financial statements, unless the context otherwise requires, “we,” “us,” "our," the "company,” and "ESRT" mean Empire State Realty Trust, Inc. and its consolidated subsidiaries.
We are a self-administered and self-managed real estate investment trust, or REIT, that owns, manages, operates, acquires and repositions office and retail properties in Manhattan and the greater New York metropolitan area. We were organized as a Maryland corporation on July 29, 2011.
As of
December 31, 2016
, our total portfolio contained
10.1 million
rentable square feet of office and retail space. We owned
14
office properties (including
three
long-term ground leasehold interest) encompassing approximately
9.4 million
rentable square feet of office space.
Nine
of these properties are located in the midtown Manhattan market and encompass in the aggregate approximately
7.6 million
rentable square feet of office space, including the Empire State Building. Our Manhattan office properties also contain an aggregate of
501,653
rentable square feet of premier retail space on their ground floor and/or lower levels. Our remaining
five
office properties are located in Fairfield County, Connecticut and Westchester County, New York, encompassing in the aggregate approximately
1.9 million
rentable square feet. The majority of square footage for these
five
properties is located in densely populated metropolitan communities with immediate access to mass transportation. Additionally, we have entitled land at the Stamford Transportation Center in Stamford, Connecticut, adjacent to one of our office properties, that will support the development of an approximately
380,000
rentable square foot office building and garage, which we refer to herein as Metro Tower. As of December 31, 2016, our portfolio also included
four
standalone retail properties located in Manhattan and
two
standalone retail properties located in the city center of Westport, Connecticut, encompassing
204,452
rentable square feet in the aggregate.
Empire State Realty OP, L.P. (the "operating partnership") holds substantially all of our assets and conducts substantially all of our business. As of
December 31, 2016
, we owned approximately
52.1%
of the aggregate operating partnership units in our operating partnership. We, as the sole general partner in our operating partnership, have responsibility and discretion in the management and control of our operating partnership, and the limited partners in our operating partnership, in such capacity, have no authority to transact business for, or participate in the management activities of our operating partnership. Accordingly, our operating partnership has been consolidated by us.
We elected to be taxed as a REIT and operate in a manner that we believe allows us to qualify as a REIT for federal income tax purposes commencing with our taxable year ended December 31, 2013. We have
two
entities that elected to be treated as taxable REIT subsidiaries, or TRSs, and are owned by our operating partnership. The TRSs, through several wholly owned limited liability companies, conduct third-party services businesses, which include the Empire State Building Observatory, cleaning services, cafeteria, restaurant and fitness center and asset and property management services.
2. Summary of Significant Accounting Policies
Basis of Presentation and Principles of Consolidation
The accompanying consolidated financial statements have been prepared in conformity with accounting principles generally accepted in the United States of America (“GAAP”) and with the rules and regulations of the Securities and Exchange Commission (the "SEC") represent our assets and liabilities and operating results. The consolidated financial statements include our accounts and our wholly owned subsidiaries as well as our operating partnership and its subsidiaries. All significant intercompany balances and transactions have been eliminated in consolidation.
We consolidate entities in which we have a controlling financial interest. In determining whether we have a controlling financial interest in a partially owned entity and the requirement to consolidate the accounts of that entity, we consider factors such as ownership interest, board representation, management representation, authority to make decisions, and contractual and substantive participating rights of the partners/members as well as whether the entity is a variable interest entity (“VIE”) and we are the primary beneficiary. The primary beneficiary of a VIE is the entity that has (i) the power to direct the activities that most significantly impact the entity's economic performance and (ii) the obligation to absorb losses of the VIE or the right to receive benefits from the VIE that could be significant to the VIE. The primary beneficiary is required to consolidate the VIE.
F-8
On January 1, 2016, we adopted accounting guidance under the Financial Accounting Standards Board ("FASB") Accounting Standards Codification Topic 810, Consolidation, modifying the analysis we must perform to determine whether we should consolidate certain types of legal entities. The guidance does not amend the existing disclosure requirements for variable interest entities or voting interest model entities. The guidance, however, modified the requirements to qualify under the voting interest model. Under the revised guidance, our operating partnership, Empire State Realty OP, L.P., is a variable interest entity of our company, Empire State Realty Trust, Inc. As the operating partnership is already consolidated in the financial statements of Empire State Realty Trust, Inc., the identification of this entity as a variable interest entity had no impact on our consolidated financial statements. There were no other legal entities qualifying under the scope of the revised guidance that were consolidated as a result of the adoption.
We will assess the accounting treatment for each investment we may have in the future. This assessment will include a review of each entity’s organizational agreement to determine which party has what rights and whether those rights are protective or participating. For all VIEs, we will review such agreements in order to determine which party has the power to direct the activities that most significantly impact the entity’s economic performance and benefit. In situations where we or our partner could approve, among other things, the annual budget, or leases that cover more than a nominal amount of space relative to the total rentable space at each property, we would not consolidate the investment as we consider these to be substantive participation rights that result in shared power of the activities that would most significantly impact the performance and benefit of such joint venture investment.
A non-controlling interest in a consolidated subsidiary is defined as the portion of the equity (net assets) in a subsidiary not attributable, directly or indirectly, to a parent. Non-controlling interests are required to be presented as a separate component of equity in the consolidated balance sheets and in the consolidated statements of operations by requiring earnings and other comprehensive income to be attributed to controlling and non-controlling interests.
Accounting Estimates
The preparation of the consolidated financial statements in accordance with GAAP requires management to use estimates and assumptions that in certain circumstances affect the reported amounts of assets and liabilities, the disclosure of contingent assets and liabilities, and the reported revenues and expenses. Significant items subject to such estimates and assumptions include allocation of the purchase price of acquired real estate properties among tangible and intangible assets, determination of the useful life of real estate properties and other long-lived assets, valuation and impairment analysis of commercial real estate properties and other long-lived assets, estimate of tenant expense reimbursements, estimate of percentage of completion on construction contracts, valuation of the allowance for doubtful accounts, and valuation of derivative instruments, senior unsecured notes,
mortgage notes payable, unsecured term loan and revolving credit facilities,
and equity based compensation. These estimates are prepared using management’s best judgment, after considering past, current, and expected events and economic conditions. Actual results could differ from those estimates.
Revenue Recognition
Rental Revenue
Rental revenue includes base rents that each tenant pays in accordance with the terms of its respective lease and is reported on a straight-line basis over the non-cancellable term of the lease which includes the effects of rent steps and rent abatements under the leases. In general, we commence rental revenue recognition when the tenant takes possession of the leased space or controls the physical use of the leased space and the leased space is substantially ready for its intended use. We account for all of our leases as operating leases. Deferred rent receivables, including free rental periods and leasing arrangements allowing for increased base rent payments, are accounted for in a manner that provides an even amount of fixed lease revenues over the respective non-cancellable lease terms. Differences between rental income recognized and amounts due under the respective lease agreements are recognized as an increase or decrease to deferred rents receivable.
In addition to base rent, our tenants also generally will pay their pro rata share of increases in real estate taxes and operating expenses for the building over a base year. In some leases, in lieu of paying additional rent based upon increases in building operating expenses, the tenant will pay additional rent based upon increases in an index such as the Consumer Price Index over the index value in effect during a base year, or contain fixed percentage increases over the base rent to cover escalations.
We will recognize rental revenue of acquired in-place above- and below-market leases at their fair values over the terms of the respective leases, including, for below-market leases, fixed option renewal periods, if any.
F-9
Lease cancellation fees are recognized when the fees are determinable, tenant vacancy has occurred, collectability is reasonably assured, we have no continuing obligation to provide services to such former tenants and the payment is not subject to any conditions that must be met or waived. Total lease cancellation fees for the years ended
December 31, 2016
, 2015, and 2014 were
$7.7 million
,
$2.0 million
, and
$6.1 million
, respectively. Such fees are included in other income and fees in our consolidated statements of operations.
Observatory Revenue
Revenues from the sale of Observatory tickets are recognized upon admission or ticket expirations. Deferred income related to unused and unexpired tickets as of
December 31, 2016
and 2015 was
$4.1 million
and
$5.1 million
, respectively.
Construction Revenue
Revenues from construction contracts are recognized under the percentage-of completion method. Under this method, progress towards completion is recognized according to the ratio of incurred costs to estimated total costs. This method is used because management considers the “cost-to-cost” method the most appropriate in the circumstances.
Contract costs include all direct material, direct labor and other direct costs and an allocation of certain overhead related to contract performance. General and administrative costs are charged to expense as incurred. Provisions for estimated losses on uncompleted contracts are made in the period in which such losses are determined. Changes in job performance, job conditions and estimated profitability, including those arising from settlements, may result in revisions to costs and income and are recognized in the period in which the revisions are determined.
Gains on Sale of Real Estate
We record a gain on sale of real estate when title is conveyed to the buyer and we have no substantial economic involvement with the property. If the sales criteria for the full accrual method are not met, we defer some or all of the gain recognition and account for the continued operations of the property by applying the finance, leasing, profit sharing, deposit, installment or cost recovery methods, as appropriate, until the sales criteria are met.
Third-Party Management, Leasing and Other Fees
We earn revenue arising from contractual agreements with related party entities for asset and property management services. This revenue is recognized as the related services are performed under the respective agreements in place.
Advertising and Marketing Costs
Advertising and marketing costs are expensed as incurred. The expense for the years ended
December 31, 2016
, 2015, and 2014 was
$9.4 million
,
$8.7 million
and
$10.0 million
, respectively, and is included within operating expenses in our consolidated statements of operations.
Real Estate Properties and Related Intangible Assets
Land and buildings and improvements are recorded at cost less accumulated depreciation and amortization. The recorded cost includes cost of acquisitions, development and construction and tenant allowances and improvements. Expenditures for ordinary repairs and maintenance are charged to operations as incurred. Significant replacements and betterments which improve or extend the life of the asset are capitalized. Tenant improvements which improve or extend the life of the asset are capitalized. If a tenant vacates its space prior to the contractual termination of its lease, the unamortized balance of any tenant improvements are written off if they are replaced or have no future value. For developed properties, direct and indirect costs that clearly relate to projects under development are capitalized. Costs include construction costs, professional services such as architectural and legal costs, capitalized interest and direct payroll costs. We begin capitalization when the project is probable. Capitalization of interest ceases when the property is ready for its intended use, which is generally near the date that a certificate of occupancy is obtained.
Depreciation and amortization are computed using the straight-line method for financial reporting purposes. Buildings and improvements are depreciated over the shorter of
39
years, the useful life, or the remaining term of any leasehold interest. Tenant improvement costs, which are included in building and improvements in the consolidated balance sheets, are depreciated over the shorter of (i) the related remaining lease term or (ii) the life of the improvement. Corporate equipment, which is included in “Other assets,” is depreciated over
three
to
seven
years.
F-10
Acquisitions of properties are accounted for utilizing the acquisition method and accordingly the purchase cost is allocated to tangible and intangible assets and liabilities based on their fair values. The fair value of tangible assets acquired is determined by valuing the property as if it were vacant, applying methods similar to those used by independent appraisers of income-producing property. The resulting value is then allocated to land, buildings and improvements, and tenant improvements based on our determination of the fair value of these assets. The assumptions used in the allocation of fair values to assets acquired are based on our best estimates at the time of evaluation.
Fair value is assigned to above-market and below-market leases based on the difference between (a) the contractual amounts to be paid by the tenant based on the existing lease and (b) our estimate of current market lease rates for the corresponding in-place leases, over the remaining terms of the in-place leases. Capitalized above-market lease amounts are amortized as a decrease to rental revenue over the remaining terms of the respective leases. Capitalized below-market lease amounts are amortized as an increase to rental revenue over the remaining terms of the respective leases. If a tenant vacates its space prior to the contractual termination of the lease and no rental payments are being made on the lease, any unamortized balance of the related intangible will be written off.
The aggregate value of other acquired intangible assets consists of acquired ground leases and acquired in-place leases and tenant relationships. The fair value allocated to acquired in-place leases consists of a variety of components including, but not necessarily limited to: (a) the value associated with avoiding the cost of originating the acquired in-place leases (i.e. the market cost to execute a lease, including leasing commissions and legal fees, if any); (b) the value associated with lost revenue related to tenant reimbursable operating costs estimated to be incurred during the assumed lease-up period (i.e. real estate taxes, insurance and other operating expenses); (c) the value associated with lost rental revenue from existing leases during the assumed lease-up period; and (d) the value associated with any other inducements to secure a tenant lease.
We assess the potential for impairment of our long-lived assets, including real estate properties, annually or whenever events occur or a change in circumstances indicate that the recorded value might not be fully recoverable. We determine whether impairment in value has occurred by comparing the estimated future undiscounted cash flows expected from the use and eventual disposition of the asset to its carrying value. If the undiscounted cash flows do not exceed the carrying value, the real estate is adjusted to fair value and an impairment loss is recognized. Assets held for sale are recorded at the lower of cost or fair value less costs to sell. We do not believe that the value of any of our properties and intangible assets were impaired during the years ended December 31, 2016, 2015 and 2014.
Cash and Cash Equivalents
Cash and cash equivalents consist of cash on hand, government money markets, demand deposits with financial institutions and short-term liquid investments with original maturities of three months or less when purchased. Cash and cash equivalents held at major commercial banks may at times exceed the Federal Deposit Insurance Corporation limit. To date, we have not experienced any losses on our invested cash.
Restricted Cash
Restricted cash consists of amounts held for tenants in accordance with lease agreements such as security deposits and amounts held by lenders and/or escrow agents to provide for future real estate tax expenditures and insurance expenditures, tenant vacancy related costs and debt service obligations.
Tenant and Other Receivables
Tenant and other receivables, other than deferred rent receivable, are generally expected to be collected within one year.
Allowance for Doubtful Accounts
We maintain an allowance against tenant and other receivables and deferred rents receivables for future potential tenant credit losses. The credit assessment is based on the estimated accrued rental revenue that is recoverable over the term of the respective lease. The computation of this allowance is based on the tenants’ payment history and current credit status. If our estimate of collectability differs from the cash received, then the timing and amount of our reported revenue could be impacted. Bad debt expense is included in operating expenses on our consolidated statements of operations and includes the impact of changes in the allowance for doubtful accounts on our consolidated balance sheets.
F-11
Deferred Leasing Costs
Deferred leasing costs consist of fees and direct costs incurred to initiate and renew leases, are amortized on a straight-line basis over the related lease term and the expense is included in depreciation and amortization in our consolidated statements of operations. Upon the early termination of a lease, unamortized deferred leasing costs are charged to expense.
Deferred Financing Costs
Fees and costs incurred to obtain long-term financing have been deferred and are being amortized as a component of interest expense in our consolidated statements of operations over the life of the respective long-term financing on the straight-line method which approximates the effective interest method. Unamortized deferred financing costs are expensed when the associated debt is refinanced or repaid before maturity. Costs incurred in seeking debt, which do not close, are expensed in the period in which it is determined that the financing will not close.
Equity Method Investments
We account for investments under the equity method of accounting where we do not have control but have the ability to exercise significant influence. Under this method, investments are recorded at cost, and the investment accounts are adjusted for our share of the entities’ income or loss and for distributions and contributions. Equity income (loss) is allocated based on the portion of the ownership interest that is controlled by us. The agreements may designate different percentage allocations among investors for profits and losses; however, our recognition of the entity’s income or loss generally follows the entity’s distribution priorities, which may change upon the achievement of certain investment return thresholds.
To the extent that we contributed assets to an entity, our investment in the entity is recorded at cost basis in the assets that were contributed to the entity. Upon contributing assets to an entity, we make a judgment as to whether the economic substance of the transaction is a sale. If so, gain or loss is recognized on the portion of the asset to which the other partners in the entity obtain an interest.
To the extent that the carrying amount of these investments on our combined balance sheets is different than the basis reflected at the entity level, the basis difference would be amortized over the life of the related asset and included in our share of equity in net income of the entity.
On a periodic basis, we assess whether there are any indicators that the carrying value of our investments in entities may be impaired on an other than temporary basis. An investment is impaired only if management’s estimate of the fair value of the investment is less than the carrying value of the investment on an other than temporary basis. To the extent impairment has occurred, the loss shall be measured as the excess of the carrying value of the investment over the fair value of the investment.
As of
December 31, 2016
and 2015, we had no equity method investments.
Goodwill
Goodwill is tested annually for impairment and is tested for impairment more frequently if events and circumstances indicate that the asset might be impaired. An impairment loss is recognized to the extent that the carrying amount, including goodwill, exceeds the reporting unit’s fair value and the implied fair value of goodwill is less than the carrying amount of that goodwill. Non-amortizing intangible assets, such as trade names and trademarks, are subject to an annual impairment test based on fair value and amortizing intangible assets are tested whenever events or changes in circumstances indicate that the carrying amount may not be recoverable.
Fair Value
Fair value is a market-based measurement, not an entity-specific measurement, and should be determined based on the assumptions that market participants would use in pricing the asset or liability. As a basis for considering market participant assumptions in fair value measurements, the Financial Accounting Standards Board ("FASB") guidance establishes a fair value hierarchy that distinguishes between market participant assumptions based on market data obtained from sources independent of the reporting entity (observable inputs that are classified within levels one and two of the hierarchy) and the reporting entity's own assumptions about market participant assumptions (unobservable inputs classified within Level 3 of the hierarchy).
We use the following methods and assumptions in estimating fair value disclosures for financial instruments.
F-12
For cash and cash equivalents, restricted cash, tenant and other receivables, prepaid expenses and other assets, deferred revenue, tenant security deposits, accounts payable and accrued expenses in our consolidated balance sheets approximate their fair value due to the short term maturity of these instruments.
The fair value of our senior unsecured notes - exchangeable was derived from quoted prices in active markets and is classified as Level 2 since trading volumes are low.
The fair value of derivative instruments is determined using widely accepted valuation techniques, including discounted cash flow analysis on the expected cash flows of each derivative. Although the majority of the inputs used to value our derivatives fall within Level 2 of the fair value hierarchy, the credit valuation adjustments associated with our derivatives utilize Level 3 inputs, such as estimates of current credit spreads to evaluate the likelihood of default by ourselves and our counterparties. The impact of such credit valuation adjustments, determined based on the fair value of each individual contract, was not significant to the overall valuation. As a result, all of our derivatives were classified as Level 2 of the fair value hierarchy.
The fair value of our mortgage notes payable, term loan and credit facility, and senior unsecured notes - Series A, B and C which are determined using Level 3 inputs, are estimated by discounting the future cash flows using current interest rates at which similar borrowings could be made to us.
The methodologies used for valuing financial instruments have been categorized into three broad levels as follows:
Level 1 - Quoted prices in active markets for identical instruments.
Level 2 - Valuations based principally on other observable market parameters, including:
|
•
|
Quoted prices in active markets for similar instruments;
|
|
•
|
Quoted prices in less active or inactive markets for identical or similar instruments;
|
|
•
|
Other observable inputs (such as risk free interest rates, yield curves, volatilities, prepayment speeds, loss severities, credit risks and default rates); and
|
|
•
|
Market corroborated inputs (derived principally from or corroborated by observable market data).
|
Level 3 - Valuations based significantly on unobservable inputs, including:
|
•
|
Valuations based on third-party indications (broker quotes or counterparty quotes) which were, in turn, based significantly on unobservable inputs or were otherwise not supportable as Level 3 valuations; and
|
|
•
|
Valuations based on internal models with significant unobservable inputs.
|
These levels form a hierarchy. We follow this hierarchy for our financial instruments measured or disclosed at fair value on a recurring and nonrecurring basis and other required fair value disclosures. The classifications are based on the lowest level of input that is significant to the fair value measurement.
Derivative Instruments
We are exposed to the effect of interest rate changes and manage these risks by following policies and procedures including the use of derivatives. To manage exposure to interest rates, derivatives are used primarily to fix the rate on debt based on floating-rate indices. We record all derivatives on the balance sheet at fair value. We incorporate credit valuation adjustments to appropriately reflect both our own nonperformance risk and the respective counterparty’s nonperformance risk in the fair value measurements. We measure the credit risk of our derivative instruments that are subject to master netting agreements on a net basis by counterparty portfolio. For derivatives that qualify as cash flow hedges, we report the effective portion of changes in the fair value of a derivative designated as a hedge as part of other comprehensive income (loss) and subsequently reclassify the effective portion into income in the period that the hedged item affects income. We account for the ineffective portion of changes in the fair value of a derivative directly in income. Reported net income and equity may increase or decrease prospectively, depending on future levels of interest rates and other variables affecting the fair values of derivative instruments and hedged items, but will have no effect on cash flows.
F-13
Income Taxes
We elected to be taxed as a REIT under sections 856 through 860 of the Internal Revenue Code of 1986, as amended, commencing with the taxable year ended December 31, 2013 and believe we qualify as a REIT at December 31, 2016. REITs are subject to a number of organizational and operational requirements, including a requirement that 90% of ordinary “REIT taxable income” (as determined without regard to the dividends paid deduction or net capital gains) be distributed. As a REIT, we will generally not be subject to U.S. federal income tax to the extent that we meet the organizational and operational requirements and our distributions equal or exceed REIT taxable income. For all periods subsequent to the effective date of our REIT election, we have met the organizational and operational requirements and distributions have exceeded net taxable income. Accordingly, no provision has been made for federal and state income taxes.
We have elected to treat ESRT Observatory TRS, L.L.C., our subsidiary which holds our observatory operations, and ESRT Holdings TRS, L.L.C., our subsidiary that holds our third party management, construction (through cessation of our construction business in the first quarter of 2015), restaurant, cafeteria, health clubs and certain cleaning operations, as taxable REIT subsidiaries. Taxable REIT subsidiaries may participate in non-real estate activities and/or perform non-customary services for tenants and their operations are generally subject to regular corporate income taxes. Our taxable REIT subsidiaries accounts for its income taxes in accordance with GAAP, which includes an estimate of the amount of taxes payable or refundable for the current year and deferred tax liabilities and assets for the future tax consequences of events that have been recognized in our financial statements or tax returns. The calculation of the taxable REIT subsidiaries' tax provisions may require interpreting tax laws and regulations and could result in the use of judgments or estimates which could cause its recorded tax liability to differ from the actual amount due. Deferred income taxes reflect the net tax effects of temporary differences between the carrying amounts of assets and liabilities for financial reporting purposes and the amounts used for income tax purposes. The taxable REIT subsidiaries periodically assess the realizability of deferred tax assets and the adequacy of deferred tax liabilities, including the results of local, state, or federal statutory tax audits or estimates and judgments used.
We apply provisions for measuring and recognizing tax benefits associated with uncertain income tax positions. Penalties and interest, if incurred, would be recorded as a component of income tax expense. As of
December 31, 2016
and 2015, we do not have a liability for uncertain tax positions. As of
December 31, 2016
, the tax years ended December 31, 2013 through December 31, 2016 remain open for an audit by the Internal Revenue Service, state or local authorities.
Share-Based Compensation
Share-based compensation is measured at the fair value of the award on the date of grant and recognized as an expense on a straight-line basis over the vesting period. The determination of fair value of these awards is subjective and involves significant estimates and assumptions including expected volatility of our stock, expected dividend yield, expected term, and assumptions of whether these awards will achieve parity with other operating partnership units or achieve performance thresholds. We believe that the assumptions and estimates utilized are appropriate based on the information available to management at the time of grant.
Per Share Data
Basic and diluted earnings per share are computed based upon the weighted average number of shares outstanding during the respective period.
Segment Reporting
We have identified
two
reportable segments: (1) Real Estate and (2) Observatory. Our real estate segment includes all activities related to the ownership, management, operation, acquisition, repositioning and disposition of our real estate assets. Our observatory segment operates the 86th and 102nd floor observatories at the Empire State Building. These
two
lines of businesses are managed separately because each business requires different support infrastructures, provides different services and has dissimilar economic characteristics such as investments needed, stream of revenues and different marketing strategies. We account for intersegment sales and rent as if the sales or rent were to third parties, that is, at current market prices. We include our construction operation in "Other" and it includes all activities related to providing construction services to tenants and to other entities within and outside our company. As of March 27, 2015, we no longer solicited new business for our construction management business. We completed all projects that were in progress.
F-14
Reclassification
Certain prior year balances have been reclassified to conform to our current year presentation. Certain Empire State Building public relations costs previously included in property operating expenses are included in observatory expenses. For the years ended December 31, 2016, 2015 and 2014, these costs were
$2.4 million
,
$2.3 million
and
$2.4 million
, respectively.
Recently Issued or Adopted Accounting Standards
During January 2017, the FASB issued Accounting Standards Update ("ASU") No. 2017-01, Business Combinations (Topic 805): Clarifying the Definition of a Business, which contain amendments to clarify the definition of a business with the objective of adding guidance to assist entities with evaluating whether transactions should be accounted for as acquisitions (or disposals) of assets or businesses. The amendments in ASU No. 2017-01 provide a screen to determine when an integrated set of assets and activities (collectively referred to as a “set”) is not a business. The screen requires that when substantially all of the fair value of the gross assets acquired (or disposed of) is concentrated in a single identifiable asset or a group of similar identifiable assets, the set is not a business. This screen reduces the number of transactions that need to be further evaluated. If the screen is not met, the amendments (1) require that to be considered a business, a set must include, at a minimum, an input and a substantive process that together significantly contribute to the ability to create output and (2) remove the evaluation of whether a market participant could replace missing elements. The amendments provide a framework to assist entities in evaluating whether both an input and a substantive process are present. Additionally, these amendments narrow the definition of the term output so that the term is consistent with how outputs are described in Topic 606, Revenue from Contracts with Customers. ASU No. 2017-01 will be effective for annual periods beginning after December 15, 2017, including interim periods within those periods. The amendments should be applied prospectively on or after the effective date. No disclosures are required at transition. We are evaluating the impact of adopting this new accounting standard on our consolidated financial statements.
During November 2016, the FASB issued ASU No. 2016-18, Statement of Cash Flows (Topic 230): Restricted Cash, which contain amendments that require that a statement of cash flows explain the change during the period in the total of cash, cash equivalents, and amounts generally described as restricted cash or restricted cash equivalents. Therefore, amounts generally described as restricted cash and restricted cash equivalents should be included with cash and cash equivalents when reconciling the beginning-of-period and end-of-period total amounts shown on the statement of cash flows. ASU No. 2016-18 will be effective for fiscal years beginning after December 15, 2017, and interim periods within those fiscal years. Early adoption is permitted, including adoption in an interim period. The amendments should be applied using a retrospective transition method to each period presented. We are evaluating the impact of adopting this new accounting standard on our consolidated financial statements.
During August 2016, the FASB issued ASU No. 2016-15, Statement of Cash Flows (Topic 230): Classification of Certain Cash Receipts and Cash Payments, which addresses eight specific cash flow issues with the objective of reducing the existing diversity in practice in how certain cash receipts and cash payments are presented and classified in the statement of cash flows. ASU No. 2016-15 will be effective for fiscal years beginning after December 15, 2017, including interim periods within those fiscal years. Earlier adoption is permitted including adoption in an interim period. We are evaluating the impact of adopting this new accounting standard on our consolidated financial statements.
During June 2016, the FASB issued ASU No. 2016-13, Financial Instruments-Credit Losses (Topic 326): Measurement of Credit Losses on Financial Instruments, which contains amendments that replace the incurred loss impairment methodology in current GAAP with a methodology that reflects expected credit losses and requires consideration of a broader range of reasonable and supportable information to inform credit loss estimates. ASU No. 2016-13 will be effective for fiscal years beginning after December 15, 2019, including interim periods within those fiscal years. Earlier adoption as of the fiscal years beginning after December 15, 2018, including interim periods within those fiscal years, is permitted. The amendments must be adopted through a cumulative-effect adjustment to retained earnings as of the beginning of the first reporting period in which the guidance is effective (that is, a modified retrospective approach). We are evaluating the impact of adopting this new accounting standard on our consolidated financial statements.
During February 2016, the FASB issued ASU No. 2016-02, Leases (Topic 842), which requires that a lessee recognize in the statement of financial position a liability to make lease payments (the lease liability) and a right-of-use asset representing its right to use the underlying asset for the lease term. For leases with a term of 12 months or less, a lessee is permitted to make an accounting policy election by class of underlying asset not to recognize lease assets and lease liabilities. ASU No. 2016-02 leaves the accounting for leases by lessors largely unchanged from previous GAAP. ASU No. 2016-02 will be effective for fiscal years beginning after December 15, 2018 and subsequent interim periods. The new standard must be adopted using a
F-15
modified retrospective transition, and provides for certain practical expedients. Transition will require application of the new guidance at the beginning of the earliest comparative period presented. This ASU is expected to result in the recognition of a right-to-use asset and related liability to account for our future obligations under our ground lease agreements for which we are the lessee. As of December 31, 2016, the remaining contractual payments under our ground lease agreements aggregated
$62.8 million
. We continue to evaluate the impact of adopting this new accounting standard on our consolidated financial statements.
During April 2015, the FASB issued ASU No. 2015-03, Interest - Imputation of Interest (Subtopic 835-30): Simplifying the Presentation of Debt Issuance Costs, which amends the requirements for the presentation of debt issuance costs and requires that debt issuance costs related to a recognized debt liability be presented in the balance sheet as a direct deduction from the carrying amount of that debt liability, consistent with debt discounts. ASU No. 2015-03 is effective for fiscal years, beginning after December 15, 2015 and interim periods within those fiscal years. ASU No. 2015-03 was amended in August 2015 by ASU No. 2015-15, Interest - Imputation of Interest (Subtopic 835-30) - Presentation and Subsequent Measurement of Debt Issuance Costs Associated with Line-of-Credit Arrangements, to add to the Codification SEC staff guidance that the SEC staff will not object to an entity presenting the costs of securing line-of-credit arrangements as an asset, regardless of whether there are any outstanding borrowings. The SEC Observer to the Emerging Issues Task Force announced the staff guidance in response to questions that arose after the FASB issued ASU No. 2015-03. We adopted ASU 2015-03 as of December 31, 2015.
During February 2015, the FASB issued ASU No. 2015-02, Consolidation (Topic 810)—Amendments to the Consolidation Analysis, which amends the criteria for determining which entities are considered VIEs, amends the criteria for determining if a service provider possesses a variable interest in a VIE and ends the deferral granted to investment companies for application of the VIE consolidation model. ASU No. 2015-02 is effective for annual periods, and interim periods therein, beginning after December 15, 2015 and interim periods within those fiscal years. The implementation of this update did not cause any material changes to our consolidated financial statements.
During May 2014, the FASB issued ASU No. 2014-09, Revenue from Contracts with Customers (Topic 606). This new standard will replace all current U.S. GAAP guidance related to revenue recognition and eliminate all industry-specific guidance. The new revenue recognition standard provides a unified model to determine when and how revenue is recognized. The core principle is that a company should recognize revenue to depict the transfer of promised goods or services to customers in an amount that reflects the consideration to which the entity expects to be entitled in exchange for those goods or services. This guidance will be effective beginning in 2017 and can be applied either retrospectively to each period presented or as a cumulative-effect adjustment as of the date of adoption. ASU No. 2014-09 was amended in August 2015 by ASU No. 2015-14 Revenue from Contracts with Customers (Topic 606): Deferral of the Effective Date, which defers the effective date of ASU No. 2014-09 for all entities by one year. Public business entities, certain not-for-profit entities, and certain employee benefit plans should apply the guidance in ASU No. 2014-09 to annual reporting periods beginning after December 15, 2017, including interim reporting periods within that reporting period. Earlier application is permitted only as of annual reporting periods beginning after December 15, 2016, including interim reporting periods within that reporting period. ASU No. 2014-09 was further amended in December 2016 by ASU No. 2016-20 Technical Corrections and Improvements to Topic 606, Revenue from Contracts with Customers which contain amendments that are intended to clarify or correct unintended application of the guidance. Those items generally are not expected to have a significant effect on current accounting practice or create a significant administrative cost for most entities. The effective date and transition requirements for the amendments are the same as the effective date and transition requirements for Topic 606. Our initial analysis of this ASU indicates that it will not have a material effect on our observatory revenue and third party management and other fee revenue in our consolidated financial statements. We are still in the process of evaluating this new accounting standard as it relates to our rental revenue and tenant expense reimbursements.
3. Acquisitions
2014 Acquisitions
On July 15, 2014, we acquired the ground and operating lease at 111 West 33rd Street (and the fee title to 122 West 34th Street) for
$423.6 million
, consisting of
$87.7 million
by assumption of existing mortgage debt,
$106.9 million
in cash and
$229.0 million
in shares of Class A and Class B common stock and Series PR OP units. In connection with this transaction, we issued
1,217,685
shares of Class A common stock and
77,945
shares of Class B common stock at a share price of
$16.65
and
12,457,379
Series PR OP Units at a unit price of
$16.65
.
On July 15, 2014, we acquired the ground lease at 1400 Broadway for
$310.0 million
, consisting of
$80.0 million
by assumption of existing mortgage debt,
$79.7 million
in cash and
$150.3 million
in shares of Class A and Class B common stock
F-16
and Series PR OP units. In connection with this transaction, we issued
1,338,488
shares of Class A common stock and
32,452
shares of Class B common stock at a share price of
$16.65
and
7,658,516
Series PR OP Units at a unit price of
$16.65
.
The following table is an allocation of the purchase price for the assets and liabilities acquired (amounts in thousands):
|
Consideration paid:
|
|||
|
Cash and issuance of Class A Common Stock, Class B Common Stock, and Series PR OP units
|
$
|
565,916
|
|
|
Debt assumed
|
167,684
|
|
|
|
Total consideration paid
|
$
|
733,600
|
|
|
Net assets acquired:
|
|||
|
Land and building and improvements
|
$
|
354,429
|
|
|
Acquired below-market ground leases
|
334,178
|
|
|
|
Acquired above-market leases
|
13,088
|
|
|
|
Acquired in place lease value and deferred leasing costs
|
88,374
|
|
|
|
Mortgage notes payable, inclusive of premium
|
(182,851
|
)
|
|
|
Acquired below-market leases
|
(36,553
|
)
|
|
|
Other liabilities, net of other assets
|
(4,749
|
)
|
|
|
Total net assets acquired
|
$
|
565,916
|
|
4. Deferred Costs, Acquired Lease Intangibles and Goodwill
Deferred costs, net, consisted of the following at December 31, 2016 and 2015 (amounts in thousands):
|
2016
|
2015
|
||||||
|
Leasing costs
|
$
|
140,325
|
|
$
|
121,864
|
|
|
|
Acquired in-place lease value and deferred leasing costs
|
253,113
|
|
285,902
|
|
|||
|
Acquired above-market leases
|
74,770
|
|
81,680
|
|
|||
|
468,208
|
|
489,446
|
|
||||
|
Less: accumulated amortization
|
(195,617
|
)
|
(178,767
|
)
|
|||
|
Total deferred costs, net, excluding net deferred financing costs
|
$
|
272,591
|
|
$
|
310,679
|
|
|
At December 31, 2016,
$4.5 million
of net deferred financing costs associated with the unsecured revolving credit facility was included in deferred costs, net on the consolidated balance sheet.
Amortization expense related to deferred leasing and acquired deferred leasing costs was
$24.2 million
,
$25.4 million
, and
$21.9 million
, for the years ended
December 31, 2016
, 2015, and 2014, respectively. Amortization expense related to acquired lease intangibles was
$24.6 million
,
$37.7 million
and
$33.7 million
for the years ended
December 31, 2016
, 2015 and 2014, respectively.
Amortizing acquired intangible assets and liabilities consisted of the following at December 31, 2016 and 2015 (amounts in thousands):
|
2016
|
2015
|
||||||
|
Acquired below-market ground leases
|
$
|
396,916
|
|
$
|
396,916
|
|
|
|
Less: accumulated amortization
|
(20,856
|
)
|
(13,025
|
)
|
|||
|
Acquired below-market ground leases, net
|
$
|
376,060
|
|
$
|
383,891
|
|
|
F-17
|
2016
|
2015
|
||||||
|
Acquired below-market leases
|
$
|
(135,026
|
)
|
$
|
(163,290
|
)
|
|
|
Less: accumulated amortization
|
52,726
|
|
59,119
|
|
|||
|
Acquired below-market leases, net
|
$
|
(82,300
|
)
|
$
|
(104,171
|
)
|
|
Rental revenue related to the amortization of below market leases, net of above market leases was
$8.8 million
,
$19.4 million
and
$14.1 million
for the years ended
December 31, 2016
, 2015 and 2014, respectively. The remaining weighted-average amortization period as of
December 31, 2016
is
25.5
years,
4.9
years,
3.9
years and
4.4
years for below-market ground leases, in-place leases and deferred leasing costs, above-market leases and below-market leases, respectively. We expect to recognize amortization expense and rental revenue from the acquired intangible assets and liabilities as follows (amounts in thousands):
|
For the year ending:
|
Future Ground Rent Amortization
|
Future Amortization Expense
|
Future Rental Revenue
|
||||||||
|
2017
|
$
|
7,831
|
|
$
|
24,359
|
|
$
|
6,092
|
|
||
|
2018
|
7,831
|
|
19,021
|
|
6,378
|
|
|||||
|
2019
|
7,831
|
|
16,338
|
|
6,557
|
|
|||||
|
2020
|
7,831
|
|
13,284
|
|
3,453
|
|
|||||
|
2021
|
7,831
|
|
11,420
|
|
2,825
|
|
|||||
|
Thereafter
|
336,905
|
|
52,169
|
|
15,829
|
|
|||||
|
$
|
376,060
|
|
$
|
136,591
|
|
$
|
41,134
|
|
|||
As of
December 31, 2016
, we had goodwill of
$491.5 million
. In 2013, we acquired the interests in Empire State Building Company, L.L.C. and 501 Seventh Avenue Associates, L.L.C. for an amount in excess of their net tangible and identified intangible assets and liabilities and as a result we recorded goodwill related to the transaction. Goodwill was allocated
$227.5 million
to the observatory operations of the Empire State Building,
$250.8 million
to Empire State Building, and
$13.2 million
to 501 Seventh Avenue.
We performed an annual review of goodwill for impairment and concluded there was no impairment of goodwill. Our methodology to review goodwill impairment, which includes a significant amount of judgment and estimates, provides a reasonable basis to determine whether impairment has occurred. However, many of the factors employed in determining whether or not goodwill is impaired are outside of our control and it is reasonably likely that assumptions and estimates will change in future periods.
5. Debt
Debt consisted of the following as of
December 31, 2016
and
2015
(amounts in thousands):
F-18
|
As of December 31, 2016
|
||||||||||||||||
|
Principal Balance as
of December 31, 2016 |
Principal Balance as
of December 31, 2015 |
Stated
Rate |
Effective
Rate (1) |
Maturity
Date (2) |
||||||||||||
|
Mortgage debt collateralized by:
|
||||||||||||||||
|
Fixed rate mortgage debt
|
||||||||||||||||
|
10 Bank Street
|
$
|
31,544
|
|
$
|
32,214
|
|
5.72
|
%
|
6.22
|
%
|
6/1/2017
|
|||||
|
1542 Third Avenue
|
17,795
|
|
18,222
|
|
5.90
|
%
|
6.62
|
%
|
6/1/2017
|
|||||||
|
First Stamford Place
|
235,067
|
|
238,765
|
|
5.65
|
%
|
6.18
|
%
|
7/5/2017
|
|||||||
|
1010 Third Avenue and 77 West 55th Street
|
26,502
|
|
27,064
|
|
5.69
|
%
|
6.39
|
%
|
7/5/2017
|
|||||||
|
383 Main Avenue
|
28,654
|
|
29,269
|
|
5.59
|
%
|
6.04
|
%
|
7/5/2017
|
|||||||
|
1333 Broadway
|
67,656
|
|
68,646
|
|
6.32
|
%
|
3.75
|
%
|
1/5/2018
|
|||||||
|
1400 Broadway
|
||||||||||||||||
|
(first lien mortgage loan)
|
67,714
|
|
68,732
|
|
6.12
|
%
|
3.41
|
%
|
2/5/2018
|
|||||||
|
(second lien mortgage loan)
|
9,389
|
|
9,600
|
|
3.35
|
%
|
3.36
|
%
|
2/5/2018
|
|||||||
|
112 West 34th Street
|
||||||||||||||||
|
(first lien mortgage loan)
|
75,261
|
|
76,406
|
|
6.01
|
%
|
3.38
|
%
|
4/5/2018
|
|||||||
|
(second lien mortgage loan)
|
9,509
|
|
9,640
|
|
6.56
|
%
|
3.68
|
%
|
4/5/2018
|
|||||||
|
1350 Broadway
|
37,764
|
|
38,348
|
|
5.87
|
%
|
3.74
|
%
|
4/5/2018
|
|||||||
|
Metro Center
|
95,985
|
|
97,950
|
|
3.59
|
%
|
3.67
|
%
|
11/5/2024
|
|||||||
|
10 Union Square
(3)
|
50,000
|
|
20,289
|
|
3.70
|
%
|
3.99
|
%
|
4/1/2026
|
|||||||
|
Total mortgage debt
|
752,840
|
|
735,145
|
|
||||||||||||
|
Senior unsecured notes - exchangeable
|
250,000
|
|
250,000
|
|
2.63
|
%
|
3.93
|
%
|
8/15/2019
|
|||||||
|
Senior unsecured notes payable:
|
||||||||||||||||
|
Series A
|
100,000
|
|
100,000
|
|
3.93
|
%
|
4.03
|
%
|
3/27/2025
|
|||||||
|
Series B
|
125,000
|
|
125,000
|
|
4.09
|
%
|
4.19
|
%
|
3/27/2027
|
|||||||
|
Series C
|
125,000
|
|
125,000
|
|
4.18
|
%
|
4.28
|
%
|
3/27/2030
|
|||||||
|
Unsecured revolving credit facility
|
—
|
|
40,000
|
|
(4)
|
(4)
|
1/23/2019
|
|||||||||
|
Unsecured term loan facility
|
265,000
|
|
265,000
|
|
(5)
|
(5)
|
8/24/2022
|
|||||||||
|
Total principal
|
1,617,840
|
|
1,640,145
|
|
||||||||||||
|
Unamortized premiums, net of unamortized discount
|
905
|
|
5,181
|
|
||||||||||||
|
Deferred financing costs, net
|
(6,414
|
)
|
(12,910
|
)
|
||||||||||||
|
Total
|
$
|
1,612,331
|
|
$
|
1,632,416
|
|
||||||||||
______________
|
(1)
|
The effective rate is the yield as of December 31, 2016, including the effects of debt issuance costs and the amortization of the fair value of debt adjustment.
|
|
(2)
|
Pre-payment is generally allowed for each loan upon payment of a customary pre-payment penalty.
|
|
(3)
|
The mortgage loan collateralized by 10 Union Square was refinanced in March 2016.
|
|
(4)
|
At December 31, 2016, the unsecured revolving credit facility bears a floating rate at 30 day LIBOR plus
1.15%
. The rate at December 31, 2016 was
1.92%
.
|
|
(5)
|
The unsecured term loan facility bears a floating rate at 30 day LIBOR plus
1.60%
. The rate at December 31, 2016 was
2.37%
. Pursuant to a forward interest rate swap agreement, the LIBOR rate is fixed at
2.1485%
for the period beginning on August 31, 2017 through maturity.
|
F-19
Principal Payments
Aggregate required principal payments at
December 31, 2016
are as follows (amounts in thousands):
|
Year
|
Amortization
|
Maturities
|
Total
|
||||||||
|
2017
|
$
|
9,904
|
|
$
|
336,009
|
|
$
|
345,913
|
|
||
|
2018
|
2,880
|
|
262,210
|
|
265,090
|
|
|||||
|
2019
|
2,188
|
|
250,000
|
|
252,188
|
|
|||||
|
2020
|
2,268
|
|
—
|
|
2,268
|
|
|||||
|
2021
|
2,350
|
|
—
|
|
2,350
|
|
|||||
|
Thereafter
|
7,356
|
|
742,675
|
|
750,031
|
|
|||||
|
Total principal maturities
|
$
|
26,946
|
|
$
|
1,590,894
|
|
$
|
1,617,840
|
|
||
Deferred Financing Costs
Deferred financing costs, net, consisted of the following at December 31, 2016 and 2015 (amounts in thousands):
|
2016
|
2015
|
||||||
|
Financing costs
|
$
|
23,145
|
|
$
|
20,882
|
|
|
|
Less: accumulated amortization
|
(12,241
|
)
|
(7,972
|
)
|
|||
|
Total deferred financing costs, net
|
$
|
10,904
|
|
$
|
12,910
|
|
|
At December 31, 2016,
$4.5 million
of net deferred financing costs associated with the unsecured revolving credit facility were included in deferred costs, net on the consolidated balance sheet.
Amortization expense related to deferred financing costs was
$5.0 million
,
$6.1 million
, and
$7.6 million
, for the years ended
December 31, 2016
, 2015, and 2014, respectively, and was included in interest expense.
Unsecured Revolving Credit Facility
On January 23, 2015, we entered into an unsecured revolving credit agreement, which is referred to herein as the “unsecured revolving credit facility,” with Bank of America, Merrill Lynch, Goldman Sachs and the other lenders party thereto. Merrill Lynch acted as joint lead arranger; Bank of America acted as administrative agent; and Goldman Sachs acted as syndication agent and joint lead arranger.
The unsecured revolving credit facility is comprised of a revolving credit facility in the maximum original principal amount of
$800.0 million
. The unsecured revolving credit facility contains an accordion feature that would allow us to increase the maximum aggregate principal amount to
$1.25 billion
under specified circumstances. On July 6, 2016, we partially exercised the accordion feature and increased our committed borrowing capacity under the unsecured revolving credit facility from
$800 million
to
$1.1 billion
.
Amounts outstanding under the unsecured revolving credit facility will bear interest at a floating rate equal to, at our election, (x) a Eurodollar rate, plus a spread that we expect will range from
0.875%
to
1.600%
depending upon our leverage ratio and credit rating; or (y) a base rate, plus a spread that we expect will range from
0.000%
to
0.600%
depending upon our leverage ratio and credit rating. In addition, the unsecured revolving credit facility permits us to borrow at competitive bid rates determined in accordance with the procedures described in the unsecured revolving credit facility agreement. We paid certain customary fees and expense reimbursements to enter into the unsecured revolving credit facility.
The initial maturity of the unsecured revolving credit facility is January 2019. We have the option to extend the initial term of the unsecured revolving credit facility for up to
two
additional
6
-month periods, subject to certain conditions, including the payment of an extension fee equal to
0.075%
of the then outstanding commitments under the unsecured revolving credit facility.
F-20
The unsecured revolving credit facility includes the following financial covenants: (i) maximum leverage ratio of total indebtedness to total asset value of the loan parties and their consolidated subsidiaries will not exceed
60%
, (ii) consolidated secured indebtedness will not exceed
40%
of total asset value, (iii) tangible net worth will not be less than
$745.4 million
plus
75%
of net equity proceeds received by us (other than proceeds received within ninety (90) days after the redemption, retirement or repurchase of ownership or equity interests in us up to the amount paid by us in connection with such redemption, retirement or repurchase, where, the net effect is that we shall not have increased our net worth as a result of any such proceeds), (iv) adjusted EBITDA (as defined in the unsecured revolving credit facility) to consolidated fixed charges will not be less than
1.50
x, (v) the aggregate net operating income with respect to all unencumbered eligible properties to the portion of interest expense attributable to unsecured indebtedness will not be less than
1.75
x, (vi) the ratio of total unsecured indebtedness to unencumbered asset value will not exceed
60%
, and (vii) consolidated secured recourse indebtedness will not exceed
10%
of total asset value (provided, however, this covenant shall not apply at any time after we achieve a debt ratings from at least two of Moody’s, S&P and Fitch, and such debt ratings are Baa3 or better (in the case of a rating by Moody’s) or BBB- or better (in the case of a rating by S&P or Fitch)).
The unsecured revolving credit facility contains customary covenants, including limitations on liens, investment, debt, fundamental changes, and transactions with affiliates, and will require certain customary financial reports. The unsecured revolving credit facility contains customary events of default (subject in certain cases to specified cure periods), including but not limited to non-payment, breach of covenants, representations or warranties, cross defaults, bankruptcy or other insolvency events, judgments, ERISA events, invalidity of loan documents, loss of real estate investment trust qualification, and occurrence of a change of control (defined in the definitive documentation for the unsecured credit facility).
As of
December 31, 2016
, we were in compliance with the covenants under the unsecured revolving credit facility.
Senior Unsecured Notes
Exchangeable Senior Notes
During August 2014, we issued
$250.0 million
principal amount of
2.625%
Exchangeable Senior Notes (“
2.625%
Exchangeable Senior Notes”) due August 15, 2019. In connection with this offering, we received net proceeds of
$246.9 million
, after deducting the related underwriting discounts and commissions and issuance costs.
Interest on the
2.625%
Exchangeable Senior Notes will be payable semi-annually in arrears on February 15 and August 15 of each year, beginning February 15, 2015. The
2.625%
Exchangeable Senior Notes are senior unsecured obligations and rank equally in right of payment with all of our other senior unsecured indebtedness and effectively subordinated in right of payment to all of our secured indebtedness (to the extent of the value of the collateral securing such indebtedness) and structurally subordinated to all liabilities and preferred equity of our subsidiaries.
The
2.625%
Exchangeable Senior Notes will mature on August 15, 2019, unless earlier exchanged, redeemed or repurchased. Holders may exchange their Senior Notes at their option at any time prior to the close of business on the business day immediately preceding May 15, 2019 only under the following circumstances: (i) during any calendar quarter beginning after September 30, 2014 (and only during such quarter) if the closing sale price of our Class A common stock is more than
130%
of the then current exchange price for at least
20
trading days (whether or not consecutive) in the period of the
30
consecutive trading days ending on the last trading day of the previous calendar quarter; (ii) during the
five
consecutive business-day period following any
five
consecutive trading-day period in which the trading price per
1,000
principal amount of the
2.625%
Exchangeable Senior Notes for each trading day during such
five
consecutive trading-day period in which the trading price per
1,000
principal amount of the
2.625%
Exchangeable Senior Notes for each trading day during such
five
trading-day period was less than
98%
of the closing sale price of our Class A common stock, for each trading day during such
five
trading-day period multiplied by the then current exchange rate; (iii) if we call any or all of the
2.625%
Exchangeable Senior Notes for redemption, at any time prior to the close of business on the scheduled trading day immediately preceding the redemption date; or (iv) upon the occurrence of specified corporate transactions (significant consolidation, sale, merger, share exchange, fundamental change, etc.).
On or after May 15, 2019, and on or prior to the second scheduled trading day immediately preceding the maturity date, holders may exchange their notes without regard to the foregoing conditions.
The
2.625%
Exchangeable Senior Notes will be exchangeable into cash, shares of Class A common stock or a combination of cash and shares of Class A common stock, at our election. We have asserted it is our intent and ability to settle the principal amount of the
2.625%
Exchangeable Senior Notes in cash. The initial exchange rate of
2.625%
Exchangeable
F-21
Senior Notes is
51.4059
shares per
$1,000
principal amount of notes (equivalent to an initial exchange price of approximately
$19.45
per share of Class A common stock), subject to adjustment, as described in the related indenture governing the
2.625%
Exchangeable Senior Notes. As of
December 31, 2016
, the exchange rate of the
2.625%
Exchangeable Senior Notes was
51.5600
shares per $1,000 principal amount of notes (equivalent to an initial exchange price of approximately
$19.39
per share of Class A common stock), subject to adjustment, as described in the related indenture governing the
2.625%
Exchangeable Senior Notes.
Following certain corporate transactions which constitute a make-whole fundamental change (defined in the indenture), we will increase the exchange rate for holders who elect to exchange their
2.625%
Exchangeable Senior Notes in connection with such make whole fundamental change in certain circumstances. Following certain corporate transactions which constitute a fundamental change, holders may require us to repurchase the
2.625%
Exchangeable Senior Notes for cash at a price equal to
100%
of the principal amount of the notes to be purchased plus any accrued and unpaid interest to, but excluding, the repurchase date.
We have separately accounted for the liability and equity components of the
2.625%
Exchangeable Senior Notes by bifurcating gross proceeds between the indebtedness, or liability component, and the embedded conversion option, or the equity component. The bifurcation was done by estimating an effective interest rate as of the date of the issuance for similar notes which do not contain an embedded conversion option. This effective interest rate was estimated to be
3.8%
and was used to compute the fair value at the time of issuance for the indebtedness of
$236.6 million
. The gross proceeds from the issuance of the
2.625%
Exchangeable Senior Notes less the initial amount allocated to the indebtedness resulted in a
$13.4 million
allocation to the embedded conversion option which is included in Equity, net of financing costs, in the consolidated balance sheets as of
December 31, 2016
and 2015. The resulting debt discount is being amortized over the
five
year period in which the
2.625%
Exchangeable Senior Notes are expected to be outstanding (that is, through maturity date) as additional non-cash interest expense. As of
December 31, 2016
and 2015, the unamortized discount was
$7.0 million
and
$9.7 million
, respectively. The additional non-cash interest expense attributable to the
2.625%
Exchangeable Senior Notes will increase in subsequent reporting periods through the maturity date as the
2.625%
Exchangeable Senior Notes accrete to their par value over the same period.
Underwriting discounts and commissions and issuance costs totaled
$3.1 million
and were allocated to the indebtedness and the embedded conversion option on a pro-rata basis and accounted as debt issuance costs and equity issuance costs, respectively. In this connection,
$2.9 million
attributable to the indebtedness was recorded as part of deferred costs, to be subsequently amortized using the effective interest method as interest expense over the expected term of the
2.625%
Exchangeable Senior Notes, and
$0.2 million
attributable to the embedded conversion option was recorded as a reduction to Equity in the consolidated balance sheets as of
December 31, 2016
and 2015.
For the years ended
December 31, 2016
, 2015 and 2014, total interest expense related to the
2.625%
Exchangeable Senior Notes was
$9.9 million
,
$9.9 million
and
$3.8 million
, respectively, consisting of (i) the contractual interest expense of
$6.6 million
,
$6.6 million
and
$2.5 million
, respectively, (ii) the additional non-cash interest expense of
$2.7 million
,
$2.7 million
and
$1.1 million
, respectively, related to the accretion of the debt discount, and (iii) the amortization of deferred financing costs of
$0.6 million
,
$0.6 million
and
$0.2 million
, respectively.
Series A, Series B, and Series C Senior Notes
During March 2015, we issued and sold an aggregate principal amount of
$350 million
senior unsecured notes consisting of
$100 million
of
3.93%
Series A Senior Notes due 2025,
$125 million
of
4.09%
Series B Senior Notes due 2027, and
$125 million
of
4.18%
Series C Senior Notes due 2030 (together, the “Series A, B and C Senior Notes”). Interest on the Series A, B and C Senior Notes is payable quarterly.
The terms of the Series A, B and C Senior Notes agreement include customary covenants, including limitations on liens, investment, debt, fundamental changes, and transactions with affiliates and will require certain customary financial reports. It also requires compliance with financial ratios consistent with our unsecured revolving credit facility including a maximum leverage ratio, a maximum secured leverage ratio, a minimum amount of tangible net worth, a minimum fixed charge coverage ratio, a minimum unencumbered interest coverage ratio, a maximum unsecured leverage ratio and a maximum amount of secured recourse indebtedness. As of
December 31, 2016
, we were in compliance with the covenants under the Series A, B and C Senior Notes.
F-22
Senior Unsecured Term Loan Facility
During August
2015, we entered into a
$265.0 million
senior unsecured term loan facility,
which is referred to herein as the
“term loan facility” with Wells Fargo Bank, National Association, as administrative agent, Capital One, National Association, as syndication agent, PNC Bank, National Association, as documentation agent, and the lenders from time to time party thereto.
Amounts outstanding under the term loan facility bear interest at a floating rate equal to, at our election, (x) a LIBOR rate, plus a spread that ranges from
1.400%
to
2.350%
depending upon our leverage ratio and credit rating; or (y) a base rate, plus a spread that ranges from
0.400%
to
1.350%
depending upon our leverage ratio and credit rating. Pursuant to a forward interest rate swap agreement, we effectively fixed LIBOR at
2.1485%
for
$265.0 million
of the term loan facility for the period beginning on August 31, 2017 through maturity. In connection with the closing of the term loan facility, we paid certain customary fees and expense reimbursements.
The term loan facility matures on August 24, 2022. We may prepay loans under the term loan facility at any time, subject to certain notice requirements. To the extent that we prepay all or any portion of a loan on or prior to August 24, 2017, we will pay a prepayment premium equal to (i) if such prepayment occurs on or prior to August 24, 2016,
2.00%
of the principal amount so prepaid, and (ii) if such prepayment occurs after August 24, 2016 but on or prior to August 24, 2017,
1.00%
of the principal amount so prepaid.
The terms of the term loan facility agreement include
customary covenants, including limitations on liens, investment, debt, fundamental changes, and transactions with affiliates and will require certain customary financial reports. The term loan facility
requires compliance with financial ratios including a maximum leverage ratio, a maximum secured leverage ratio, a minimum amount of tangible net worth, a minimum fixed charge coverage ratio, a minimum unencumbered interest coverage ratio, a maximum unsecured leverage ratio and a maximum amount of secured recourse indebtedness. It also contains customary events of default (subject in certain cases to specified cure periods). These terms in the term loan facility agreement are consistent with the terms under our unsecured revolving credit facility agreement. As of
December 31, 2016
, we were in compliance with the covenants under the term loan facility.
6. Accounts Payable and Accrued Expenses
Accounts payable and accrued expenses consist of the following as of
December 31, 2016
and
2015
(amounts in thousands):
|
2016
|
2015
|
||||||
|
Accounts payable and accrued expenses
|
$
|
102,866
|
|
$
|
83,352
|
|
|
|
Payable to the estate of Leona M. Helmsley
(1)
|
18,367
|
|
18,367
|
|
|||
|
Interest rate swap agreements liability
|
5,591
|
|
1,922
|
|
|||
|
Accrued interest payable
|
6,230
|
|
5,555
|
|
|||
|
Due to affiliated companies
|
1,010
|
|
1,903
|
|
|||
|
Accounts payable and accrued expenses
|
$
|
134,064
|
|
$
|
111,099
|
|
|
___________
|
(1)
|
Reflects a payable to the estate of Leona M. Helmsley for New York City transfer taxes
which would have been payable in absence of the estate's exemption from such tax.
|
7. Financial Instruments and Fair Values
Derivative Financial Instruments
We use derivative financial instruments primarily to manage interest rate risk and such derivatives are not considered speculative. These derivative instruments are typically in the form of interest rate swap and forward agreements and the primary objective is to minimize interest rate risks associated with investing and financing activities. The counterparties of these arrangements are major financial institutions with which we may also have other financial relationships. We are exposed to credit risk in the event of non-performance by these counterparties; however, we currently do not anticipate that any of the counterparties will fail to meet their obligations.
F-23
We have agreements with our derivative counterparties that contain a provision where if we either default or are capable of being declared in default on any of our indebtedness, then we could also be declared in default on our derivative obligations. As of December 31, 2016, the fair value of derivatives in a net liability position, which includes accrued interest but excludes any adjustment for nonperformance risk, related to these agreements was
$5.1 million
. If we had breached any of these provisions at December 31, 2016, we could have been required to settle our obligations under the agreements at their termination value of
$5.1 million
.
As of
December 31, 2016
and 2015, respectively, we had interest rate LIBOR swaps with an aggregate notional value of
$890.0 million
and
$465.0 million
, respectively. The notional value does not represent exposure to credit, interest rate or market risks. As of
December 31, 2016
, the fair value of these derivative instruments amounted to
$0.6 million
which is included in prepaid expenses and other assets and (
$5.6 million
) which is included in accounts payable and accrued expenses on the consolidated balance sheet. As of December 31, 2015, the fair value of these derivative instruments amounted to (
$1.9 million
) which is included in accounts payable and accrued expenses on the consolidated balance sheet. These interest rate swaps have been designated as cash flow hedges and hedge the future cash outflows on our mortgage debt and also on our term loan facility that is subject to a floating interest rate. As of
December 31, 2016
and 2015, these cash flow hedges are deemed effective and a net unrealized loss of
$3.1 million
and
$1.9 million
, respectively, is reflected in the consolidated statements of comprehensive income (loss). Amounts reported in accumulated other comprehensive income (loss) related to derivatives will be reclassified to interest expense as interest payments are made on these debt. We estimate that
$1.0 million
of the current balance held in accumulated other comprehensive loss will be reclassified into interest expense within the next 12 months relating to the interest rate swap contracts in effect as of December 31, 2016.
The table below summarizes the terms of agreements and the fair values of our derivative financial instruments as of
December 31, 2016
and 2015 (dollar amounts in thousands):
|
As of December 31, 2016
|
December 31, 2016
|
December 31, 2015
|
|||||||||||||||||||||
|
Derivative
|
Notional Amount
|
Receive Rate
|
Pay Rate
|
Effective Date
|
Expiration Date
|
Asset
|
Liability
|
Asset
|
Liability
|
||||||||||||||
|
Interest rate swap
|
$
|
265,000
|
|
1 Month LIBOR
|
2.1485
|
%
|
August 31, 2017
|
August 24, 2022
|
$
|
—
|
|
$
|
(1,634
|
)
|
$
|
—
|
|
$
|
(1,620
|
)
|
|||
|
Interest rate swap
|
100,000
|
|
3 Month LIBOR
|
2.5050
|
%
|
July 5, 2017
|
July 5, 2027
|
—
|
|
(684
|
)
|
—
|
|
(148
|
)
|
||||||||
|
Interest rate swap
|
100,000
|
|
3 Month LIBOR
|
2.5050
|
%
|
July 5, 2017
|
July 5, 2027
|
—
|
|
(685
|
)
|
—
|
|
(154
|
)
|
||||||||
|
Interest rate swap
|
100,000
|
|
3 Month LIBOR
|
2.4860
|
%
|
January 5, 2018
|
January 5, 2028
|
224
|
|
—
|
|
—
|
|
—
|
|
||||||||
|
Interest rate swap
|
100,000
|
|
3 Month LIBOR
|
2.4860
|
%
|
January 5, 2018
|
January 5, 2028
|
223
|
|
—
|
|
—
|
|
—
|
|
||||||||
|
Interest rate swap
|
75,000
|
|
3 Month LIBOR
|
2.4860
|
%
|
January 5, 2018
|
January 5, 2028
|
167
|
|
—
|
|
—
|
|
—
|
|
||||||||
|
Interest rate swap
|
75,000
|
|
3 Month LIBOR
|
2.7620
|
%
|
June 1, 2018
|
June 1, 2028
|
—
|
|
(1,295
|
)
|
—
|
|
—
|
|
||||||||
|
Interest rate swap
|
75,000
|
|
3 Month LIBOR
|
2.7620
|
%
|
June 1, 2018
|
June 1, 2028
|
—
|
|
(1,293
|
)
|
—
|
|
—
|
|
||||||||
|
$
|
614
|
|
$
|
(5,591
|
)
|
$
|
—
|
|
$
|
(1,922
|
)
|
||||||||||||
The table below shows the effect of our derivative financial instruments designated as cash flow hedges for the years ended December 31, 2016 and 2015 (amounts in thousands):
|
Effects of Cash Flow Hedges
|
December 31, 2016
|
December 31, 2015
|
|||||
|
Amount of gain (loss) recognized in other comprehensive income (loss) - effective portion
|
$
|
(3,054
|
)
|
(1,922
|
)
|
||
|
Amount of gain (loss) reclassified from accumulated other comprehensive income (loss) into interest expense - effective portion
|
—
|
|
—
|
|
|||
|
Amount of gain (loss) recognized in other Income/expense - ineffective portion
|
—
|
|
—
|
|
|||
Fair Valuation
The estimated fair values at
December 31, 2016
and
2015
were determined by management, using available market information and appropriate valuation methodologies. Considerable judgment is necessary to interpret market data and develop estimated fair value. Accordingly, the estimates presented herein are not necessarily indicative of the amounts we could realize
F-24
on disposition of the financial instruments. The use of different market assumptions and/or estimation methodologies may have a material effect on the estimated fair value amounts.
The following tables summarize the carrying and estimated fair values of our financial instruments as of
December 31, 2016
and
2015
(amounts in thousands):
|
December 31, 2016
|
||||||||||||||||||||
|
Carrying Value
|
Estimated Fair Value
|
|||||||||||||||||||
|
|
Total
|
Level 1
|
Level 2
|
Level 3
|
||||||||||||||||
|
Interest rate swaps included in prepaid expenses and other assets
|
$
|
614
|
|
$
|
614
|
|
$
|
—
|
|
$
|
614
|
|
$
|
—
|
|
|||||
|
Interest rate swaps included in accounts payable and accrued expenses
|
5,591
|
|
5,591
|
|
—
|
|
5,591
|
|
—
|
|
||||||||||
|
Mortgage notes payable
|
759,016
|
|
755,640
|
|
—
|
|
—
|
|
755,640
|
|
||||||||||
|
Senior unsecured notes - exchangeable
|
241,474
|
|
282,435
|
|
—
|
|
282,435
|
|
—
|
|
||||||||||
|
Senior unsecured notes - Series A, B, and C
|
348,914
|
|
339,274
|
|
—
|
|
—
|
|
339,274
|
|
||||||||||
|
Unsecured term loan facility
|
262,927
|
|
265,000
|
|
—
|
|
—
|
|
265,000
|
|
||||||||||
|
December 31, 2015
|
||||||||||||||||||||
|
Carrying Value
|
Estimated Fair Value
|
|||||||||||||||||||
|
|
Total
|
Level 1
|
Level 2
|
Level 3
|
||||||||||||||||
|
Interest rate swaps included in accounts payable and accrued expenses
|
$
|
1,922
|
|
$
|
1,922
|
|
$
|
—
|
|
$
|
1,922
|
|
$
|
—
|
|
|||||
|
Mortgage notes payable
|
747,661
|
|
752,350
|
|
—
|
|
—
|
|
752,350
|
|
||||||||||
|
Senior unsecured notes - exchangeable
|
238,208
|
|
261,563
|
|
—
|
|
261,563
|
|
—
|
|
||||||||||
|
Senior unsecured notes - Series A, B, and C
|
348,810
|
|
344,501
|
|
—
|
|
—
|
|
344,501
|
|
||||||||||
|
Unsecured revolving credit facility
|
35,192
|
|
40,000
|
|
—
|
|
—
|
|
40,000
|
|
||||||||||
|
Unsecured term loan facility
|
262,545
|
|
265,000
|
|
—
|
|
—
|
|
265,000
|
|
||||||||||
Disclosure about the fair value of financial instruments is based on pertinent information available to us as of
December 31, 2016
and
2015
. Although we are not aware of any factors that would significantly affect the reasonable fair value amounts, such amounts have not been comprehensively revalued for purposes of these financial statements since that date and current estimates of fair value may differ significantly from the amounts presented herein.
8. Rental Income
We lease various office spaces to tenants over terms ranging from
one
to
16
years. Certain leases have renewal options for additional terms. The leases provide for base monthly rentals and reimbursements for real estate taxes, escalations linked to the consumer price index or common area maintenance known as operating expense escalation. Operating expense reimbursements are reflected in our consolidated statements of operations as tenant expense reimbursement.
As of
December 31, 2016
, we were entitled to the following future contractual minimum lease payments on non-cancellable operating leases to be received which expire on various dates through 2032 (amounts in thousands):
|
2017
|
$
|
453,715
|
|
||
|
2018
|
426,589
|
|
|||
|
2019
|
393,269
|
|
|||
|
2020
|
354,588
|
|
|||
|
2021
|
316,917
|
|
|||
|
Thereafter
|
1,471,708
|
|
|||
|
$
|
3,416,786
|
|
|||
The above future minimum lease payments exclude tenant recoveries, amortization of deferred rent receivables and the net accretion of above-below-market lease intangibles. Some leases are subject to termination options generally upon
F-25
payment of a termination fee. The preceding table is prepared assuming such options are not exercised.
9. Commitments and Contingencies
Legal Proceedings
Litigation
Except as described below, as of
December 31, 2016
, we were not involved in any material litigation, nor, to our knowledge, was any material litigation threatened against us or our properties, other than routine litigation arising in the ordinary course of business such as disputes with tenants. We believe that the costs and related liabilities, if any, which may result from such actions will not materially affect our condensed consolidated financial position, operating results or liquidity.
On or about October 14, 2014,
12
former investors in Empire State Building Associates L.L.C. (“ESBA”), which prior to the initial public offering of our company owned the fee title to the Empire State Building, filed an arbitration with the American Arbitration Association against Peter L. Malkin, Anthony E. Malkin, Thomas N. Keltner, Jr., and our subsidiary ESRT MH Holdings LLC, the former supervisor of ESBA, as respondents. The statement of claim alleges breach of fiduciary duty and related claims in connection with the Offering and formation transactions. These investors had opted out of a prior class action brought regarding the Offering and formation transactions that was settled with court approval. The statement of claim in the arbitration seeks monetary damages and declaratory relief. The respondents filed an answering statement and counterclaims. On December 18, 2014, these claimants also filed a complaint in the United States District Court for the Southern District of New York alleging the same claims that they asserted in the arbitration. As alleged in the complaint, the claimants filed this lawsuit to toll the statute of limitations on their claims in the event it is determined that the claims are not subject to arbitration, and they planned to move to stay the lawsuit in favor of the pending arbitration. On February 2, 2015, the claimants filed an amended complaint adding an additional claim and making other non-substantive modifications to the original complaint. On March 12, 2015, the court stayed the action on consent of all parties pending the arbitration. The arbitration hearings commenced May 24, 2016 and have proceeded for a number of days over several hearing sessions. There are additional hearing sessions scheduled for April and May 2017.
The Respondents believe the allegations in the arbitration are entirely without merit, and they intend to defend vigorously.
In connection with the Offering and formation transactions, we entered into indemnification agreements with our directors, executive officers and chairman emeritus, providing for the indemnification by us for certain liabilities and expenses incurred as a result of actions brought, or threatened to be brought, against them. As a result, Anthony E. Malkin, Peter L. Malkin and Thomas N. Keltner, Jr. have defense and indemnity rights from us with respect to the above-referenced arbitration.
Additionally, there is a risk that other third parties will assert claims against us or any other party entitled to defense and indemnity from us. As a result, we may incur costs associated with defending or settling such litigation or paying any judgment if we lose.
Ground Lease Commitments
We make payments under ground leases related to
three
of our properties. Minimum rent is expensed on a straight-line basis over the non-cancellable term of the leases. The ground leases are due to expire between the years 2050 and 2077. Future minimum lease payments to be paid over the terms of the leases are as follows (amounts in thousands):
|
2017
|
$
|
1,518
|
|
||
|
2018
|
1,518
|
|
|||
|
2019
|
1,518
|
|
|||
|
2020
|
1,518
|
|
|||
|
2021
|
1,518
|
|
|||
|
Thereafter
|
55,212
|
|
|||
|
Total
|
$
|
62,802
|
|
||
Unfunded Capital Expenditures
At
December 31, 2016
, we estimate that we will incur approximately
$57.3 million
of capital expenditures (including tenant improvements and leasing commissions) on our properties pursuant to existing lease agreements. We
F-26
expect to fund these capital expenditures with operating cash flow, additional property level mortgage financings, our unsecured credit facility, cash on hand and other borrowings. Future property acquisitions may require substantial capital investments for refurbishment and leasing costs. We expect that these financing requirements will be met in a similar fashion.
Concentration of Credit Risk
Financial instruments that subject us to credit risk consist primarily of cash and cash equivalents, restricted cash, tenant and other receivables and deferred rent receivables. At
December 31, 2016
, we held on deposit at various major financial institutions cash and cash equivalents and restricted cash balances in excess of amounts insured by the Federal Deposit Insurance Corporation.
Real Estate Investments
Our properties are located in Manhattan, New York; Fairfield County, Connecticut; and Westchester County, New York. The latter locations are suburbs of the city of New York. The ability of the tenants to honor the terms of their respective leases is dependent upon the economic, regulatory and social factors affecting the markets in which the tenants operate. We perform ongoing credit evaluations of our tenants for potential credit losses.
Tenant Credit Evaluations
Our investments in real estate properties are subject to risks incidental to the ownership and operation of commercial real estate. These risks include, among others, the risks normally associated with changes in general economic conditions, trends in the real estate industry, creditworthiness of tenants, competition of tenants and customers, changes in tax laws, interest rate levels, the availability and cost of financing, and potential liability under environmental and other laws.
We may require tenants to provide some form of credit support such as corporate guarantees and/or other financial guarantees and we perform ongoing credit evaluations of tenants. Although the tenants operate in a variety of industries, to the extent we have a significant concentration of rental revenue from any single tenant, the inability of that tenant to make its lease payments could have an adverse effect on our company.
Major Customers and Other Concentrations
For the year ended December 31, 2016, other than
five
tenants who accounted for
6.4%
,
3.3%
,
2.9%
,
2.3%
and
2.0%
of rental revenues, no other tenant in our portfolio accounted for more than 2.0% of rental revenues. For the year ended December 31, 2015, other than
three
tenants who accounted for
6.7%
,
3.5%
and
2.0%
of rental revenues, no other tenant in our portfolio accounted for more than 2.0% of rental revenues.
For the years ended
December 31, 2016
and 2015,
six
properties accounted for the following percent of total rental revenues. No other property accounted for more than 5.0% of total rental revenues.
|
Year Ended December 31,
|
||||||
|
2016
|
2015
|
|||||
|
Empire State Building
|
32.6
|
%
|
31.4
|
%
|
||
|
One Grand Central Place
|
12.5
|
%
|
12.2
|
%
|
||
|
1400 Broadway
|
7.8
|
%
|
7.7
|
%
|
||
|
111 West 33rd Street
|
6.8
|
%
|
8.3
|
%
|
||
|
First Stamford Place
|
6.4
|
%
|
6.5
|
%
|
||
|
250 West 57th Street
|
5.3
|
%
|
4.8
|
%
|
||
Asset Retirement Obligations
We are required to accrue costs that we are legally obligated to incur on retirement of our properties which result from acquisition, construction, development and/or normal operation of such properties. Retirement includes sale, abandonment or disposal of a property. Under that standard, a conditional asset retirement obligation represents a legal obligation to perform an asset retirement activity in which the timing and/or method of settlement is conditional on a future event that may or may not be within a company’s control and a liability for a conditional asset retirement obligation must be recorded if the fair value of the obligation can be reasonably estimated. Environmental site assessments and investigations have identified asbestos or asbestos-containing building materials in certain of our properties. As of
December 31, 2016
, management has no plans to remove or alter these properties in a manner that would trigger federal and other applicable regulations for asbestos removal,
F-27
and accordingly, the obligations to remove the asbestos or asbestos-containing building materials from these properties have indeterminable settlement dates. As such, we are unable to reasonably estimate the fair value of the associated conditional asset retirement obligation. However ongoing asbestos abatement, maintenance programs and other required documentation are carried out as required and related costs are expensed as incurred.
Other Environmental Matters
Certain of our properties have been inspected for soil contamination due to pollutants, which may have occurred prior to our ownership of these properties or subsequently in connection with its development and/or its use. Required remediation to such properties has been completed and as of
December 31, 2016
, management believes that there are no obligations related to environmental remediation other than maintaining the affected sites in conformity with the relevant authority’s mandates and filing the required documents. All such maintenance costs are expensed as incurred. We expect that resolution of the environmental matters relating to the above will not have a material impact on our business, assets, consolidated and combined financial condition, results of operations or liquidity. However, we cannot be certain that we have identified all environmental liabilities at our properties, that all necessary remediation actions have been or will be undertaken at our properties or that we will be indemnified, in full or at all, in the event that such environmental liabilities arise.
Insurance Coverage
We carry insurance coverage on our properties of types and in amounts with deductibles that we believe are in line with coverage customarily obtained by owners of similar properties.
Multiemployer Pension and Defined Contribution Plans
We contribute to a number of multiemployer defined benefit pension plans under the terms of collective bargaining agreements that cover our union-represented employees. The risks of participating in these multiemployer plans are different from single-employer plans in the following aspects:
|
•
|
Assets contributed to the multiemployer plan by one employer may be used to provide benefits to employees of other participating employers.
|
|
•
|
If a participating employer stops contributing to the plan, the unfunded obligations of the plan may be borne by the remaining participating employers.
|
|
•
|
If we choose to stop participating in some of our multiemployer plans, we may be required to pay those plans an amount based on the underfunded status of the plan, referred to as a withdrawal liability.
|
We participate in various unions. The union which has significant employees and costs is as follows:
32BJ
We participate in the Building Service 32BJ, or Union, Pension Plan and Health Plan. The Pension Plan is a multi-employer, non-contributory defined benefit pension plan that was established under the terms of collective bargaining agreements between the Service Employees International Union, Local 32BJ, the Realty Advisory Board on Labor Relations, Inc. and certain other employers. This Pension Plan is administered by a joint board of trustees consisting of union trustees and employer trustees and operates under employer identification number 13-1879376. The Pension Plan year runs from July 1 to June 30. Employers contribute to the Pension Plan at a fixed rate on behalf of each covered employee. Separate actuarial information regarding such pension plans is not made available to the contributing employers by the union administrators or trustees, since the plans do not maintain separate records for each reporting unit. However, on September 26, 2014, September 28, 2015 and September 28, 2016, the actuary certified that for the plan years beginning July 1, 2014, July 1, 2015 and July 1, 2016, respectively, the Pension Plan was in critical status under the Pension Protection Act of 2006. The Pension Plan trustees adopted a rehabilitation plan consistent with this requirement. For each of the years ended June 30, 2016, 2015 and 2014, the Pension Plan received contributions from employers totaling
$249.5
million,
$242.3 million
and
$224.5 million
, respectively.
The Health Plan was established under the terms of collective bargaining agreements between the Union, the Realty Advisory Board on Labor Relations, Inc. and certain other employers. The Health Plan provides health and other benefits to eligible participants employed in the building service industry who are covered under collective bargaining agreements, or
F-28
other written agreements, with the Union. The Health Plan is administered by a Board of Trustees with equal representation by the employers and the Union and operates under employer identification number 13-2928869. The Health Plan receives contributions in accordance with collective bargaining agreements or participation agreements. Generally, these agreements provide that the employers contribute to the Health Plan at a fixed rate on behalf of each covered employee. For the years ended June 30, 2016, 2015 and 2014, the Health Plan received contributions from employers totaling
$1.2
billion,
$1.1 billion
and
$1.0
billion, respectively.
Terms of Collective Bargaining Agreements
The most recent collective bargaining agreement for Local 32BJ commenced from January 1, 2016 through December 31, 2019 (prior agreement was from January 1, 2012 through December 31, 2015).
Contributions
Contributions we made to the multi-employer plans for the years ended December 31, 2016, 2015 and 2014 are included in the table below (amounts in thousands):
|
Benefit Plan
|
2016
|
2015
|
2014
|
|||||||||
|
Pension Plans (pension and annuity)*
|
$
|
3,155
|
|
$
|
3,077
|
|
$
|
2,871
|
|
|||
|
Health Plans**
|
8,280
|
|
8,296
|
|
7,628
|
|
||||||
|
Other***
|
542
|
|
619
|
|
319
|
|
||||||
|
Total plan contributions
|
$
|
11,977
|
|
$
|
11,992
|
|
$
|
10,818
|
|
|||
|
*
|
Pension plans include
$0.8
million,
$0.7
million and
$0.8
million for the years ended 2016, 2015 and 2014, respectively, to multiemployer plans not discussed above.
|
** Health plans include
$1.6
million,
$1.4
million and
$1.5
million for the years ended 2016, 2015 and 2014, respectively, to multiemployer plans not discussed above.
*** Other includes
$0.2
million,
$0.2
million and
$0.08
million for the years ended 2016, 2015 and 2014, respectively, in connection with other multiemployer plans not discussed above for union costs which were not itemized between pension and health plans.
Benefit plan contributions are included in property operating expenses in our consolidated statements of operations. The increase in plan contributions in 2015 is mainly due to the acquisition of
two
properties during July 2014 which resulted in a full year's contributions in 2015 for the employees covered by these benefit plans.
10. Equity
During 2016, Q REIT Holding LLC, a Qatar Financial Centre limited liability company and a wholly owned subsidiary of the Qatar Investment Authority, a governmental authority of the State of Qatar ("QIA"), purchased
29,610,854
newly issued Class A common shares at
$21.00
per share, equivalent to a
9.9%
economic interest in us on a fully diluted basis (representing a
19.4%
ownership of Class A common shares). However, QIA can only vote shares equivalent to
9.9%
of all voting securities, with the balance of their shares to be voted by us in accord with the votes of all other voting securities. QIA has a top-up right to maintain their ownership stake at
9.9%
over time. We received approximately
$621.8 million
in gross proceeds from the sale.
Shares and Units
An operating partnership unit ("OP Unit") and a share of our common stock have essentially the same economic characteristics as they receive the same per unit profit distributions of our operating partnership. On the one-year anniversary of issuance, an OP Unit may be tendered for redemption for cash, however, we have sole and absolute discretion and the authorized common stock to exchange for shares of common stock on a one-for-one basis instead of cash.
Long-term incentive plan ("LTIP") units are a special class of partnership interests in our operating partnership. Each LTIP unit awarded will be deemed equivalent to an award of one share of stock under the 2013 Equity Incentive Plan ("2013 Plan"), reducing the availability for other equity awards on a one-for-one basis. The vesting period for LTIP units, if any, will be determined at the time of issuance. Cash distributions on each LTIP unit, whether vested or not, will be the same as those made on the OP Units. Under the terms of the LTIP units, our operating partnership will revalue for tax purposes its assets upon the occurrence of certain specified events, and any increase in valuation from the time of grant until such event will be allocated first to the holders of LTIP units to equalize the capital accounts of such holders with the capital accounts of OP
F-29
unitholders. Subject to any agreed upon exceptions, once vested and having achieved parity with OP unitholders, LTIP units are convertible into OP Units in our operating partnership on a one-for-one basis.
With the exception of performance based LTIP units granted in 2016, all LTIP units issued in connection with annual equity awards, whether vested or not, receive the same per unit distributions as operating partnership units, which equal per share dividends (both regular and special) on our common stock. Performance based LTIP units granted in 2016 receive
10%
of such distributions currently, unless and until such LTIP units are earned based on performance, at which time they will receive the accrued and unpaid
90%
and will commence receiving
100%
of such distributions thereafter.
The following is net income attributable to common stockholders and the issuance of our class A shares in exchange for the conversion of OP units into common stock (amounts in thousands):
|
Year ended December 31, 2016
|
Year ended December 31, 2015
|
Year ended December 31, 2014
|
|||||||||
|
Net income attributable to common stockholders
|
$
|
51,456
|
|
$
|
33,730
|
|
$
|
26,667
|
|
||
|
Increase in additional paid-in capital for the conversion of OP units into common stock
|
24,044
|
|
62,003
|
|
40,611
|
|
|||||
|
Change from net income attributable to common stockholders and transfers from noncontrolling interests
|
$
|
75,500
|
|
$
|
95,733
|
|
$
|
67,278
|
|
||
As of
December 31, 2016
, there were approximately
299.1 million
OP Units outstanding, of which approximately
155.8 million
, or
52.1%
, were owned by us and approximately
143.3 million
, or
47.9%
, were owned by other partners, including certain directors, officers and other members of executive management.
Private Perpetual Preferred Units
As of
December 31, 2016
, there were
1,560,360
Private Perpetual Preferred Units ("Preferred Units") which have a liquidation preference of
$16.62
per unit and which are entitled to receive cumulative preferential annual cash distributions of
$0.60
per unit payable in arrears on a quarterly basis. The Preferred Units are not redeemable at the option of the holders and are redeemable at our option only in the case of specific defined events.
Dividends and Distributions
The following table summarizes the dividends paid on our Class A common stock and Class B common stock for the years ended December 31, 2016, 2015 and 2014:
|
Record Date
|
Payment Date
|
Amount per Share
|
||
|
December 15, 2016
|
December 29, 2016
|
$0.105
|
||
|
September 19, 2016
|
September 30, 2016
|
$0.105
|
||
|
June 15, 2016
|
June 30, 2016
|
$0.105
|
||
|
March 16, 2016
|
March 31, 2016
|
$0.085
|
||
|
December 15, 2015
|
December 31, 2015
|
$0.085
|
||
|
September 15, 2015
|
September 30, 2015
|
$0.085
|
||
|
June 15, 2015
|
June 30, 2015
|
$0.085
|
||
|
March 13, 2015
|
March 31, 2015
|
$0.085
|
||
|
December 15, 2014
|
December 31, 2014
|
$0.085
|
||
|
September 15, 2014
|
September 30, 2014
|
$0.085
|
||
|
June 13, 2014
|
June 30, 2014
|
$0.085
|
||
|
March 14, 2014
|
March 31, 2014
|
$0.085
|
||
Total dividends paid to common securityholders during 2016, 2015 and 2014 were
$55.8 million
,
$39.2 million
and
$33.6 million
, respectively. Total distributions paid to OP unitholders, excluding inter-company distributions, during 2016,
F-30
2015 and 2014 totaled
$58.2 million
,
$51.8 million
and
$53.6 million
, respectively. Total distributions paid to Preferred unitholders during 2016, 2015 and 2014 were
$0.9 million
,
$0.9 million
and
$0.5 million
, respectively.
Earnings and profits, which determine the tax treatment of distributions to securityholders, will differ from income reported for financial reporting purposes due to the differences for federal income tax purposes, including, but not limited to, treatment of loss on extinguishment of debt, revenue recognition, compensation expense, and basis of depreciable assets and estimated useful lives used to compute depreciation. The 2016 dividends of
$0.40
per share and the 2015 and 2014 dividends of
$0.34
per share are classified for income tax purposes as
100.0%
taxable ordinary dividend.
Incentive and Share-Based Compensation
The 2013 Plan provides for grants to our directors, employees and consultants consisting of stock options, restricted stock, dividend equivalents, stock payments, performance shares, LTIP units, stock appreciation rights and other incentive awards. An aggregate of approximately
12.2 million
shares of our common stock are authorized for issuance under awards granted pursuant to the 2013 Plan, and as of
December 31, 2016
, approximately
8.3 million
shares of common stock remain available for future issuance.
In June 2016, we made grants of LTIP units to our non-employee directors under the 2013 Plan. At such time, we granted a total of
43,257
LTIP units that are subject to time-based vesting with fair market values of
$0.8 million
. The awards vest ratably over
three
years from the date of the grant, subject generally to the director's continued service on our Board of Directors.
In February 2016, we made grants of LTIP units to executive officers under the 2013 Plan. At such time, we granted a total of
368,225
LTIP units that are subject to time-based vesting and
1,230,228
LTIP units that are subject to performance-based vesting, with fair market values of
$5.6 million
for the time-based vesting awards and
$8.8 million
for the performance-based vesting awards. The awards subject to time-based vesting vest ratably over
four
years from January 1, 2016, subject generally to the grantee's continued employment. The first installment vests on January 1, 2017 and the remainder will vest thereafter in
three
equal annual installments. The vesting of the LTIP units subject to performance-based vesting is based on the achievement of absolute and relative total stockholder return hurdles over a
three
-year performance period, commencing on January 1, 2016. Following the completion of the
three
-year performance period, our compensation committee will determine the number of LTIP units to which the grantee is entitled based on our performance relative to the performance hurdles set forth in the LTIP unit award agreements the grantee entered into in connection with the award grant. These units then vest in
two
installments, with the first installment vesting on January 1, 2019 and the second installment vesting on January 1, 2020, subject generally to the grantee's continued employment on those dates.
In February 2016, we made a grant of LTIP units to an executive officer under the 2013 Plan. We granted a total of
62,814
LTIP units with a fair market value of
$1.0 million
. The award is subject to time-based vesting of
30%
after three years,
30%
after four years, and
40%
after five years, subject to the grantee's continued employment.
In February 2016, we made grants of LTIP units and restricted stock to certain other employees under the 2013 Plan. At such time, we granted a total of
47,168
LTIP units and
44,198
shares of restricted stock that are subject to time-based vesting and
112,925
LTIP units that are subject to performance-based vesting, with fair market values of
$1.4 million
for the time-based vesting awards and
$0.8 million
for the performance-based vesting awards. The awards subject to time-based vesting vest ratably over
four
years from January 1, 2016, subject generally to the grantee's continued employment. The first installment vests on January 1, 2017 and the remainder will vest thereafter in
three
equal annual installments. The vesting of the awards subject to performance-based vesting is based on the achievement of absolute and relative total stockholder return hurdles over a
three
-year performance period, commencing on January 1, 2016. Following the completion of the
three
-year
performance period, our compensation committee will determine the number of LTIP units to which the grantee is entitled based on our performance relative to the performance hurdles set forth in the award agreements the grantee entered into in connection with the award grant. These units and shares then vest in
two
installments, with the first installment vesting on January 1, 2019 and the second installment vesting on January 1, 2020, subject generally to the grantee's continued employment on those dates.
We made other grants during 2016 with fair market values of
$0.1 million
in the aggregate.
In June 2015, we made grants of LTIP units to our non-employee directors under the 2013 Plan. At such time, we granted a total of
35,082
LTIP units that are subject to time-based vesting, with fair market values of
$0.6 million
. The awards vest ratably over
three
years from the date of the grant, subject generally to the director's continued service on our Board of Directors.
F-31
In February 2015, we made grants of LTIP units to executive officers under the 2013 Plan. At such time, we granted a total of
168,033
LTIP units that are subject to time-based vesting and
154,266
LTIP units that are subject to performance-based vesting, with fair market values of
$2.9 million
for the time-based vesting awards and
$1.3 million
for the performance-based vesting awards. The awards subject to time-based vesting vest ratably over
four
years from January 1, 2015, subject generally to the grantee's continued employment. The first installment vests on the first-year anniversary date of January 1, 2015 and the remainder will vest thereafter in
three
equal annual installments. The vesting of the LTIP units subject to performance-based vesting is based on the achievement of absolute and relative total stockholder return hurdles over a
three
-year performance period, commencing on January 1, 2015. Following the completion of the
three
-year performance period, our compensation committee will determine the number of LTIP units to which the grantee is entitled based on our performance relative to the performance hurdles set forth in the LTIP unit award agreements the grantee entered into in connection with the award grant. These units then vest in
two
installments, with the first installment vesting on January 1, 2018 and the second installment vesting on January 1, 2019, subject generally to the grantee's continued employment on those dates.
In February 2015, we made grants of LTIP units and restricted stock to certain other employees under the 2013 Plan. At such time, we granted a total of
33,398
LTIP units and
14,315
shares of restricted stock that are subject to time-based vesting and
33,398
LTIP units and
14,315
shares of restricted stock that are subject to performance-based vesting, with fair market values of
$0.8 million
for the time-based vesting awards and
$0.4 million
for the performance-based vesting awards. The awards subject to time-based vesting vest ratably over
four
years from January 1, 2015, subject generally to the grantee's continued employment. The first installment vests on the first-year anniversary date of January 1, 2015 and the remainder will vest thereafter in
three
equal annual installments. The vesting of the awards subject to performance-based vesting is based on the achievement of absolute and relative total stockholder return hurdles over a
three
-year performance period, commencing on January 1, 2015. Following the completion of the
three
-year performance period, our compensation committee will determine the number of LTIP units or shares to which the grantee is entitled based on our performance relative to the performance hurdles set forth in the award agreements the grantee entered into in connection with the award grant. These units and shares then vest in
two
installments, with the first installment vesting on January 1, 2018 and the second installment vesting on January 1, 2019, subject generally to the grantee's continued employment on those dates.
In February 2015, we made a grant of LTIP units to an executive officer under the 2013 Plan. At such time, we granted a total of
13,736
LTIP units that are subject to time-based vesting and
13,736
LTIP units that are subject to performance-based vesting, with fair market values of
$0.2 million
for the time-based vesting awards and
$0.1 million
for the performance-based vesting awards. The awards subject to time-based vesting vest ratably over
four
years from the date of the grant, subject generally to the grantee's continued employment. The first installment vests on the
first
-year anniversary date of the grant and the remainder will vest thereafter in
three
equal annual installments. The vesting of the LTIP units subject to performance-based vesting is based on the achievement of absolute and relative total stockholder return hurdles over a
three
-year performance period, commencing on February 1, 2015. Following the completion of the
three
-year performance period, our compensation committee will determine the number of LTIP units to which the grantee is entitled based on our performance relative to the performance hurdles set forth in the LTIP unit award agreements the grantee entered into in connection with the award grant. These units then vest in
two
installments, with the first installment vesting on February 1, 2018 and the second installment vesting on February 1, 2019, subject generally to the grantee's continued employment on those dates.
In January 2015, we made a grant of LTIP units to an employee under the 2013 Plan. We granted a total of
9,531
LTIP units with a fair market value of
$0.2 million
. The award is subject to time-based vesting and all LTIP units vest on April 1, 2020, subject generally to the grantee's continued employment.
We made other grants during 2015 with fair market values of less than
$0.1 million
in the aggregate.
Share-based compensation is measured at the fair value of the award on the date of grant and recognized as an expense on a straight-line basis over the vesting period. For the performance-based LTIP units and restricted stock awards, the fair value of the awards was estimated using a Monte Carlo Simulation model. Our stock price, along with the prices of the comparative indexes, is assumed to follow the Geometric Brownian Motion Process. Geometric Brownian motion is a common assumption when modeling in financial markets, as it allows the modeled quantity (in this case, the stock price) to vary randomly from its current value and take any value greater than
zero
. The volatilities of the returns on our stock price and the comparative indexes were estimated based on implied volatilities and historical volatilities using a
six
-year look-back period. The expected growth rate of the stock prices over the performance period is determined with consideration of the risk free rate as of the grant date. For LTIP units and restricted stock grants that are time-vesting, we estimate the stock compensation expense based on the fair value of the stock at the grant date.
F-32
S
hare-based compensation expense has been adjusted by an amount of estimated forfeitures. Forfeitures are estimated based on historical experience at the time of grant and revised, if necessary, in subsequent periods if actual forfeitures differ from those estimates. Based on an analysis of historical data, we have calculated a
0%
annual forfeiture rate for members of the Board of Directors, a
0%
annual forfeiture rate for executive officers, and for all other employees a
5%
annual forfeiture rate. We reevaluate this analysis periodically and adjust these estimated forfeiture rates as necessary. To the extent actual results or updated estimates differ from our current estimates, such amounts will be recorded as a cumulative adjustment in the period estimates are revised.
LTIP units and restricted stock issued during the year ended December 31, 2016, 2015 and 2014 were valued at
$18.4 million
,
$6.6 million
and
$5.4 million
, respectively. The weighted-average per unit or share fair value was
$9.60
,
$13.36
and
$10.65
for grants issued in 2016, 2015 and 2014, respectively. The per unit or share granted in 2016 was estimated on the respective dates of grant using the following assumptions: an expected life of
2.8
years, a dividend rate of
2.10%
, a risk-free interest rate of
0.84%
and an expected price volatility of
24.0%
. The per unit or share granted in 2015 was estimated on the respective dates of grant using the following assumptions: an expected life of
3.0
and
2.9
years, a dividend rate of
1.9%
, a risk-free interest rate of
0.8%
and
1.0%
, and an expected price volatility between
24.0%
and
29.0%
. The per unit or share granted in 2014 was estimated on the respective dates of grant using the following assumptions: an expected life of
3.0
years, a dividend rate of
2.60%
a risk-free interest rate of
0.8%
, and an expected price volatility of
26.0%
.
No other stock options, dividend equivalents, or stock appreciation rights were issued or outstanding in 2016, 2015 and 2014.
The following is a summary of restricted stock and LTIP unit activity for the year ended
December 31, 2016
:
|
Restricted Stock
|
LTIP Units
|
Weighted Average Grant Fair Value
|
|||||||
|
Unvested balance at December 31, 2015
|
97,592
|
|
1,415,895
|
|
$
|
11.04
|
|
||
|
Vested
|
(36,592
|
)
|
(402,895
|
)
|
11.69
|
|
|||
|
Granted
|
47,071
|
|
1,868,629
|
|
9.58
|
|
|||
|
Forfeited
|
(278
|
)
|
—
|
|
17.97
|
|
|||
|
Unvested balance at December 31, 2016
|
107,793
|
|
2,881,629
|
|
$
|
10.01
|
|
||
The total fair value of LTIP units and restricted stock that vested during 2016, 2015 and 2014 was
$5.1 million
,
$3.5 million
and
$3.0 million
, respectively.
The LTIP unit and restricted stock award agreements will immediately vest when a grantee attains the (i) age of
60
and (ii) the date on which grantee has first completed
ten
years of continuous service with our company or its affiliates. For award agreements that qualify, we recognize noncash compensation expense on the grant date for the time-based awards and ratably over the vesting period for the performance-based awards, and accordingly we recognized
$0.7 million
,
$0.5 million
and
$0.2 million
for the years ended December 31, 2016, 2015 and 2014, respectively. Unrecognized compensation expense was
$0.4 million
at December 31, 2016, which will be recognized over a weighted average period of
1.9 years
.
For the remainder of the LTIP unit and restricted stock awards, we recognize noncash compensation expense ratably over the vesting period, and accordingly, we recognized
$9.0 million
,
$5.0 million
and
$3.5 million
in noncash compensation expense for the years ended December 31, 2016, 2015 and 2014, respectively. Unrecognized compensation expense was
$18.5 million
at December 31, 2016, which will be recognized over a weighted average period of
2.4 years
.
F-33
Earnings Per Share
Earnings per share for the years ended
December 31, 2016
, 2015 and 2014 is computed as follows (amounts in thousands, except per share amounts):
|
Year ended December 31, 2016
|
Year ended December 31, 2015
|
Year ended December 31, 2014
|
|||||||||
|
Numerator - Basic:
|
|||||||||||
|
Net income
|
$
|
107,250
|
|
$
|
79,928
|
|
$
|
70,210
|
|
||
|
Private perpetual preferred unit distributions
|
(936
|
)
|
(936
|
)
|
(476
|
)
|
|||||
|
Net income attributable to non-controlling interests
|
(54,858
|
)
|
(45,262
|
)
|
(43,067
|
)
|
|||||
|
Earnings allocated to unvested shares
|
(36
|
)
|
(24
|
)
|
(33
|
)
|
|||||
|
Net income attributable to common stockholders - basic
|
$
|
51,420
|
|
$
|
33,706
|
|
$
|
26,634
|
|
||
|
Numerator - Diluted:
|
|||||||||||
|
Net income
|
$
|
107,250
|
|
$
|
79,928
|
|
$
|
70,210
|
|
||
|
Private perpetual preferred unit distributions
|
(936
|
)
|
(936
|
)
|
(476
|
)
|
|||||
|
Earnings allocated to unvested shares
|
(36
|
)
|
(550
|
)
|
(482
|
)
|
|||||
|
Net income attributable to common stockholders - diluted
|
$
|
106,278
|
|
$
|
78,442
|
|
$
|
69,252
|
|
||
|
Denominator:
|
|||||||||||
|
Weighted average shares outstanding - basic
|
133,881
|
|
114,245
|
|
97,941
|
|
|||||
|
Operating partnership units
|
142,967
|
|
151,669
|
|
156,565
|
|
|||||
|
Effect of dilutive securities:
|
|||||||||||
|
Stock-based compensation plans
|
454
|
|
707
|
|
—
|
|
|||||
|
Exchangeable senior notes
|
266
|
|
—
|
|
—
|
|
|||||
|
Weighted average shares outstanding - diluted
|
277,568
|
|
266,621
|
|
254,506
|
|
|||||
|
Earnings per share - basic
|
$
|
0.38
|
|
$
|
0.30
|
|
$
|
0.27
|
|
||
|
Earnings per share - diluted
|
$
|
0.38
|
|
$
|
0.29
|
|
$
|
0.27
|
|
||
There were
800,746
,
zero
, and
631,251
antidilutive shares for the years ended December 31, 2016, 2015 and 2014, respectively.
F-34
11. Related Party Transactions
QIA
Securities Purchase Agreement
On August 23, 2016, we entered into a securities purchase agreement (the “Securities Purchase Agreement”) with QIA, pursuant to which QIA purchased from us
29,610,854
shares (the “Shares”) of our Class A common stock, par value
$0.01
per share, at a purchase price of
$21.00
per share. The Shares represent a
9.9%
fully diluted economic interest in us (inclusive of all outstanding common operating partnership units and long term incentive plan units of Empire State Realty OP, L.P., our operating partnership).
We received approximately
$621.8 million
in gross proceeds at the closing for the purchase and sale of the Shares (the “Closing”).
Stockholders Agreement
In connection with the sale of the Shares to QIA, we and QIA entered into a stockholders agreement, dated as of August 23, 2016 (the “Stockholders Agreement”), which sets forth certain rights and obligations of us and QIA, relating to QIA’s ownership of our Class A common stock, including the following:
QIA could not transfer any Shares during the six-month period that followed the Closing, and may not transfer more than 50% of the Shares during the period that began six months after the Closing and ends on the one-year anniversary of the Closing.
QIA has agreed to limit its voting power on all matters coming before our stockholders (whether at a meeting or by written consent) to no more than
9.9%
of the total number of votes entitled to be cast on such matter. Any shares of Class A common stock held by QIA in excess of such
9.9%
threshold will be voted in the same manner and proportion as the votes cast by all other stockholders on such matters. QIA granted our Board of Directors an irrevocable proxy to vote in such manner any shares of Class A common stock it holds in excess of such
9.9%
. Further, QIA must vote in favor of the election of each member of any slate of director nominees recommended by our Board of Directors.
For so long as QIA maintains at least a
5.0%
fully diluted economic interest in us and remains in material compliance with the terms of the Stockholders Agreement, QIA will have the right (but not the obligation) to purchase, at the time of any new issuance by us of common equity securities, an amount of newly issued Class A common stock which will enable QIA to own
9.9%
of the aggregate of such new issuance. These “top up” rights are generally exercisable on a quarterly basis, or sooner if we or the operating partnership issues new equity securities in an issuance in excess of
$1.0 million
.
For an initial period of five years from the date of the Closing, to the extent QIA remains in material compliance with the terms of the Stockholders Agreement, QIA will have the right of first offer to co-invest with us as a joint venture partner in real estate investment opportunities initiated by us where we have elected, at our discretion, to seek a joint venture partner. The right of first offer period will be extended for a 30-month term if at least one joint venture transaction is consummated by us and QIA during the initial five-year term, and will be extended for a further 30-month term if at least one joint venture transaction is consummated during such initial 30-month extension term.
Subject to certain minimum thresholds and conditions, we will indemnify QIA for certain applicable U.S. federal and state taxes payable by QIA in connection with dividends paid by us on the Shares (and any “top up” shares) that are attributable to capital gains from the sale or exchange of any U.S. real property interests. Our obligation to indemnify QIA will terminate one year following the date on which the sum of the Shares and any “top up” shares then owned by QIA falls below
10%
of our outstanding common shares.
Registration Rights Agreement
In connection with the sale of the Shares to QIA, we and QIA entered into a registration rights agreement, dated as of August 23, 2016 (the “Registration Rights Agreement”), which required us, among other things, to file with the SEC within 180 days following the Closing, a resale shelf registration statement providing for the resale of the Shares. We filed the resale shelf registration statement with the SEC on February 2, 2017. In addition, QIA will be entitled to cause us to include in the
F-35
registration statement such additional “top up” shares of Class A common stock as QIA may acquire from time to time in the future, up to a
9.9%
fully diluted economic interest in us. The registration rights are subject to certain conditions and limitations, including restrictions on sales of shares by the holder in connection with certain public offerings and our right to delay or withdraw a registration statement under certain circumstances. We will generally pay all registration expenses in connection with our obligations under the Registration Rights Agreement.
Tax Protection Agreement
In 2013, we entered into a tax protection agreement with Anthony E. Malkin and Peter L. Malkin that is intended to protect to a limited extent the Malkin Group and an additional third party investor in Metro Center (who was one of the original landowners and was involved in the development of the property) against certain tax consequences arising from a transaction involving one of
four
properties, which we refer to in this section as the protected assets.
First, this agreement provides that our operating partnership will not sell, exchange, transfer or otherwise dispose of such protected assets, or any interest in a protected asset, until (i) October 7, 2025, with respect to one protected asset, First Stamford Place, and (ii) the later of (x) October 7, 2021 and (y) the death of both Peter L. Malkin and Isabel W. Malkin, who are 83 and 80 years old, respectively, for the three other protected assets, Metro Center, 10 Bank Street and 1542 Third Avenue, unless:
(1)
Anthony E. Malkin consents to the sale, exchange, transfer or other disposition; or
(2)
our operating partnership delivers to each protected party thereunder a cash payment intended to approximate the tax liability arising from the recognition of the pre-contribution built-in gain resulting from the sale, exchange, transfer or other disposition of such protected asset (with the pre-contribution “built-in gain” being not more than the taxable gain that would have been recognized by such protected party if the protected asset been sold for fair market value in a taxable transaction at the time of the consolidation) plus an additional amount so that, after the payment of all taxes on amounts received pursuant to the agreement (including any tax liability incurred as a result of receiving such payment), the protected party retains an amount equal to such protected party’s total tax liability incurred as a result of the recognition of the pre-contribution built-in gain pursuant to such sale, exchange, transfer or other disposition; or
(3)
the disposition does not result in a recognition of any built-in gain by the protected party.
Second, with respect to the Malkin Group, including Anthony E. Malkin and Peter L. Malkin, and one additional third party investor in Metro Center (who was one of the original landowners and was involved in the development of the property), to protect against gain recognition resulting from a reduction in such continuing investor’s share of the operating partnership liabilities, the agreement provides that during the period from October 7, 2013 until such continuing investor owns less than the aggregate number of operating partnership units and shares of common stock equal to
50%
of the aggregate number of such units and shares such investor received in the formation transactions, which we refer to in this section as the tax protection period, our operating partnership will (i) refrain from prepaying any amounts outstanding under any indebtedness secured by the protected assets and (ii) use its commercially reasonable efforts to refinance such indebtedness at or prior to maturity at its current principal amount, or, if our operating partnership is unable to refinance such indebtedness at its current principal amount, at the highest principal amount possible. The agreement also provides that, during the tax protection period, our operating partnership will make available to such continuing investors the opportunity (i) to enter into a “bottom dollar” guarantee of their allocable share of
$160.0 million
of aggregate indebtedness of our operating partnership meeting certain requirements or (ii) in the event our operating partnership has recourse debt outstanding and such a continuing investor agrees, in lieu of guaranteeing debt pursuant to clause (i) above, to enter into a deficit restoration obligation, in each case, in a manner intended to provide an allocation of operating partnership liabilities to the continuing investor. In the event that a continuing investor guarantees debt of our operating partnership, such continuing investor will be responsible, under certain circumstances, for the repayment of the guaranteed amount to the lender in the event that the lender would otherwise recognize a loss on the loan, such as, for example, if property securing the loan was foreclosed and the value was not sufficient to repay a certain amount of the debt. A deficit restoration obligation is a continuing investor’s obligation, under certain circumstances, to contribute a designated amount of capital to our operating partnership upon our operating partnership’s liquidation in the event that the assets of our operating partnership are insufficient to repay our operating partnership liabilities.
Because we expect that our operating partnership will at all times have sufficient liabilities to allow it to meet its obligations to allocate liabilities to its partners that are protected parties under the tax protection agreement, our operating partnership’s indemnification obligation with respect to “certain tax liabilities” would generally arise only in the event that the operating partnership disposes in a taxable transaction of a protected asset within the period specified above in a taxable
F-36
transaction. In the event of such a disposition, the amount of our operating partnership’s indemnification obligation would depend on several factors, including the amount of “built-in gain,” if any, recognized and allocated to the indemnified partners with respect to such disposition and the effective tax rate to be applied to such gain at the time of such disposition.
The operating partnership agreement requires that allocations with respect to such acquired property be made in a manner consistent with Section 704(c) of the Code. Treasury Regulations issued under Section 704(c) of the Code provide partnerships with a choice of several methods of allocating book-tax differences. Under the tax protection agreement, our operating partnership has agreed to use the “traditional method” for accounting for book-tax differences for the properties acquired by our operating partnership in the consolidation. Under the traditional method, which is the least favorable method from our perspective, the carryover basis of the acquired properties in the hands of our operating partnership (i) may cause us to be allocated lower amounts of depreciation and other deductions for tax purposes than would be allocated to us if all of the acquired properties were to have a tax basis equal to their fair market value at the time of acquisition and (ii) in the event of a sale of such properties, could cause us to be allocated gain in excess of its corresponding economic or book gain (or taxable loss that is less than its economic or book loss), with a corresponding benefit to the partners transferring such properties to our operating partnership for interests in our operating partnership.
Registration Rights
We entered into a registration rights agreement with certain persons receiving shares of our common stock or operating partnership units in the formation transactions, including certain members of our senior management team and our other continuing investors. In connection therewith, on October 7, 2014, which we refer to as the shelf effective date, we filed an automatically effective shelf registration statement, along with a prospectus supplement, with respect to, among other things, shares of our Class A common stock that may be issued upon redemption of operating partnership units or issued upon conversion of shares of Class B common stock to continuing investors in the public existing entities. Pursuant to the registration rights agreement, under certain circumstances, we will also be required to undertake an underwritten offering upon the written request of the Malkin Group, which we refer to as the holder, provided (i) the registrable shares to be registered in such offering will have a market value of at least
$150.0 million
, (ii) we will not be obligated to effect more than
two
underwritten offerings during any 12-month period following the shelf effective date; and (iii) the holder will not have the ability to effect more than
four
underwritten offerings. In addition, if we file a registration statement with respect to an underwritten offering for our own account or on behalf of the holder, the holder will have the right, subject to certain limitations, to register such number of registrable shares held by him, her or it as each such holder requests. With respect to underwritten offerings on behalf of the holder, we will have the right to register such number of primary shares as we request; provided, however, that if cut backs are required by the managing underwriters of such an offering, our primary shares shall be cutback first (but in no event will our shares be cut back to less than
$25.0 million
).
We have also agreed to indemnify the persons receiving rights against specified liabilities, including certain potential liabilities arising under the Securities Act, or to contribute to the payments such persons may be required to make in respect thereof. We have agreed to pay all of the expenses relating to the registration and any underwritten offerings of such securities, including, without limitation, all registration, listing, filing and stock exchange or FINRA fees, all fees and expenses of complying with securities or “blue sky” laws, all printing expenses and all fees and disbursements of counsel and independent public accountants retained by us, but excluding underwriting discounts and commissions, any out-of-pocket expenses (except we will pay any holder’s out-of-pocket fees (including disbursements of such holder’s counsel, accountants and other advisors) up to
$25,000
in the aggregate for each underwritten offering and each filing of a resale shelf registration statement or demand registration statement), and any transfer taxes.
Employment Agreement and Change in Control Severance Agreements
We entered into an employment agreement with Anthony E. Malkin, which provides for salary, bonuses and other benefits, including among other things, severance benefits upon a termination of employment under certain circumstances and the issuance of equity awards. In addition, we entered into change in control severance agreements with Thomas P. Durels, David A. Karp, Thomas N. Keltner, Jr. and John B. Kessler.
Indemnification of Our Directors and Officers
We entered into indemnification agreements with each of our directors, executive officers, chairman emeritus and certain other parties, providing for the indemnification by us for certain liabilities and expenses incurred as a result of actions brought, or threatened to be brought, against (i) our directors, executive officers and chairman emeritus and (ii) our executive
F-37
officers, chairman emeritus and certain other parties who are former members, managers, securityholders, directors, limited partners, general partners, officers or controlling persons of our predecessor in such capacities.
Excluded Properties and Businesses
The Malkin Group, including Anthony E. Malkin, our Chairman and Chief Executive Officer, owns non-controlling interests in, and Anthony E. Malkin and Peter L. Malkin control the general partners or managers of, the entities that own interests in
seven
multi-family properties,
six
net leased retail properties, (including
one
single tenant retail property in Greenwich, Connecticut), and a parcel that is being developed for residential use. The Malkin Group also owns non-controlling interests in
one
Manhattan office property,
two
Manhattan retail properties and several retail properties outside of Manhattan, none of which were contributed to us in the formation transactions. We refer to the non-controlling interests described above collectively as the excluded properties. In addition, the Malkin Group owns interests in
two
mezzanine and senior equity funds,
three
industrial funds, and
five
residential properties, and which we refer to collectively as the excluded businesses. Other than the Greenwich retail property, we do not believe that the excluded properties or the excluded businesses are consistent with our portfolio geographic or property type composition, management or strategic direction.
Pursuant to management and/or service agreements with the owners of interests in those excluded properties and services agreements with the
five
residential property managers and the managers of certain other excluded businesses which historically were managed by affiliates of our predecessor, we are designated as the asset manager (supervisor) and/or property manager of the excluded properties and will provide services to the owners of certain of the excluded properties and the
five
residential property managers and provide services and access to office space to the existing managers of the other excluded businesses. As the manager or service provider, we are paid a management or other fee with respect to those excluded properties and excluded businesses where our predecessor had previously received a management fee on the same terms as the fee paid to our predecessor, and reimbursed for our costs in providing the management and other services to those excluded properties and businesses where our predecessor had not previously received a management fee. Our management of the excluded properties and provision of services to the five residential property managers and the existing managers of the other excluded businesses represent a minimal portion of our overall business. There is no established time period in which we will manage such properties or provide services to the owners of certain of the excluded properties and the
five
residential property managers and provide services and access to office space to the existing managers of the other excluded businesses; and Peter L. Malkin and Anthony E. Malkin expect to sell certain of these properties or unwind certain of these businesses over time. We are not precluded from acquiring all or certain interests in the excluded properties or businesses. If we were to attempt any such acquisition, we anticipate that Anthony E. Malkin, our Chairman and Chief Executive Officer, will not participate in the negotiation process on our behalf with respect to our potential acquisition of any of these excluded properties or businesses, and the approval of a majority of our independent directors will be required to approve any such acquisition.
Services are and were provided by us to excluded properties and businesses. These transactions are reflected in our consolidated statements of operations as third-party management and other fees.
We earned asset management (supervisory) and service fees from excluded properties and businesses of
$1.4 million
,
$1.8 million
and
$2.0 million
during the years ended
December 31, 2016
, 2015 and 2014, respectively.
We earned property management fees from excluded properties of
$0.4 million
,
$0.3 million
and
$0.4 million
during the years ended
December 31, 2016
, 2015 and 2014 respectively.
Other
We were reimbursed at allocable cost for
647
square feet of shared office space, equipment, and administrative support shared with us in our corporate offices, as was done prior to our formation, and we received rent generally at market rental rate for
3,074
square feet of leased space, from entities affiliated with Anthony E. Malkin at
one
of our properties. Total revenue aggregated
$0.2 million
,
$0.2 million
and
$0.1 million
, for the years ended December 31, 2016, 2015 and 2014, respectively.
During August 2016, such entities moved from the previously shared office and leased spaces to relocate to a new
5,351
square foot leased space at
one
of our properties, paying rent generally at a market rental rate. Under such new lease, the tenant has the right to cancel such lease without special payment on
90
days’ notice. We now have a shared use agreement with such tenant, to occupy a portion of the leased premises as the office location for Peter L. Malkin, our chairman emeritus and employee, utilizing approximately
15%
of the space, for which we pay an allocable pro rata share of the cost to such tenant. Total revenue aggregated
$0.1 million
for the year ended December 31, 2016.
F-38
During 2016 and in connection with our office move, Peter L. Malkin purchased miscellaneous furniture and artwork from us at their appraised value of
$23,300
. Remaining office furniture was disposed.
One
of our directors is a general partner in an investment fund, which owns more than a 10% economic and voting interest in one of our tenants with an annualized rent of
$5.7 million
and
$4.4 million
as of December 31, 2016 and 2015, respectively.
12. Income Taxes
TRS Holdings and Observatory TRS are taxable entities and their consolidated provision for income taxes consisted of the following for the years ended
December 31, 2016
, 2015 and 2014 (amounts in thousands):
|
For the Year Ended December 31,
|
|||||||||||
|
2016
|
2015
|
2014
|
|||||||||
|
Current:
|
|||||||||||
|
Federal
|
$
|
(3,632
|
)
|
$
|
(2,714
|
)
|
$
|
(3,253
|
)
|
||
|
State and local
|
(2,055
|
)
|
(1,502
|
)
|
(1,792
|
)
|
|||||
|
Total current
|
(5,687
|
)
|
(4,216
|
)
|
(5,045
|
)
|
|||||
|
Deferred:
|
|||||||||||
|
Federal
|
(291
|
)
|
169
|
|
247
|
|
|||||
|
State and local
|
(168
|
)
|
98
|
|
143
|
|
|||||
|
Total deferred
|
(459
|
)
|
267
|
|
390
|
|
|||||
|
Income tax expense
|
$
|
(6,146
|
)
|
$
|
(3,949
|
)
|
$
|
(4,655
|
)
|
||
The effective income tax rate is
44.8%
,
44.7%
and
44.7%
for the years ended
December 31, 2016
, 2015 and 2014, respectively. The actual tax provision differed from that computed at the federal statutory corporate rate as follows (amounts in thousands):
|
For the Year Ended December 31,
|
|||||||||||
|
2016
|
2015
|
2014
|
|||||||||
|
Federal tax expense at 34% statutory rate
|
$
|
(4,629
|
)
|
$
|
(3,003
|
)
|
$
|
(3,576
|
)
|
||
|
State income taxes, net of federal benefit
|
(1,517
|
)
|
(946
|
)
|
(1,079
|
)
|
|||||
|
Income tax expense
|
$
|
(6,146
|
)
|
$
|
(3,949
|
)
|
$
|
(4,655
|
)
|
||
The income tax effects of temporary differences that give rise to deferred tax assets are presented below as of
December 31, 2016
, 2015 and 2014 (amounts in thousands):
|
2016
|
2015
|
2014
|
|||||||||
|
Deferred tax assets:
|
|||||||||||
|
Deferred revenue on unredeemed observatory admission ticket sales
|
$
|
198
|
|
$
|
267
|
|
$
|
390
|
|
||
Deferred tax assets at December 31, 2016, 2015 and 2014, respectively, are attributable to the inclusion of deferred revenue on Observatory admission ticket sales not redeemed at year-end in determining income for tax reporting purposes. No valuation allowance has been recorded against the deferred tax asset because the Company believes that the deferred tax asset will, more likely than not, be realized. This determination is based on the Observatory TRS’s anticipated future taxable income and the reversal of the deferred tax asset.
At
December 31, 2016
, 2015 and 2014, the TRS entities have no amount of unrecognized tax benefits.
For tax years 2016, 2015, 2014 and 2013, the United States federal and state tax returns are open for examination.
F-39
13. Segment Reporting
We have identified
two
reportable segments: (1) Real Estate and (2) Observatory. Our real estate segment includes all activities related to the ownership, management, operation, acquisition, repositioning and disposition of our real estate assets. Our observatory segment operates the 86th and 102nd floor observatories at the Empire State Building. These
two
lines of businesses are managed separately because each business requires different support infrastructures, provides different services and has dissimilar economic characteristics such as investments needed, stream of revenues and different marketing strategies. We account for intersegment sales and transfers as if the sales or transfers were to third parties, that is, at current market prices. We include our historical construction operation in "Other," and it includes all activities related to providing construction services to tenants and to other entities within and outside our company. As of March 27, 2015, we no longer solicited new business for our construction management business. We completed all projects that were in progress.
The following tables provide components of segment profit for each segment for the years ended
December 31, 2016
, 2015 and 2014, as reviewed by management (amounts in thousands):
|
2016
|
||||||||||||||||
|
Real Estate
|
Observatory
|
Intersegment Elimination
|
Total
|
|||||||||||||
|
Revenues:
|
||||||||||||||||
|
Rental revenue
|
$
|
460,653
|
|
$
|
—
|
|
$
|
—
|
|
$
|
460,653
|
|
||||
|
Intercompany rental revenue
|
75,658
|
|
—
|
|
(75,658
|
)
|
—
|
|
||||||||
|
Tenant expense reimbursement
|
73,459
|
|
—
|
|
—
|
|
73,459
|
|
||||||||
|
Observatory revenue
|
—
|
|
124,814
|
|
—
|
|
124,814
|
|
||||||||
|
Third-party management and other fees
|
1,766
|
|
—
|
|
—
|
|
1,766
|
|
||||||||
|
Other revenue and fees
|
17,293
|
|
15
|
|
—
|
|
17,308
|
|
||||||||
|
Total revenues
|
628,829
|
|
124,829
|
|
(75,658
|
)
|
678,000
|
|
||||||||
|
Operating expenses:
|
||||||||||||||||
|
Property operating expenses
|
153,850
|
|
—
|
|
—
|
|
153,850
|
|
||||||||
|
Intercompany rent expense
|
—
|
|
75,658
|
|
(75,658
|
)
|
—
|
|
||||||||
|
Ground rent expense
|
9,326
|
|
—
|
|
—
|
|
9,326
|
|
||||||||
|
General and administrative expenses
|
49,078
|
|
—
|
|
—
|
|
49,078
|
|
||||||||
|
Observatory expenses
|
—
|
|
29,833
|
|
—
|
|
29,833
|
|
||||||||
|
Real estate taxes
|
96,061
|
|
—
|
|
—
|
|
96,061
|
|
||||||||
|
Acquisition expenses
|
98
|
|
—
|
|
—
|
|
98
|
|
||||||||
|
Depreciation and amortization
|
154,817
|
|
394
|
|
—
|
|
155,211
|
|
||||||||
|
Total operating expenses
|
463,230
|
|
105,885
|
|
(75,658
|
)
|
493,457
|
|
||||||||
|
Total operating income
|
165,599
|
|
18,944
|
|
—
|
|
184,543
|
|
||||||||
|
Interest expense
|
(71,147
|
)
|
—
|
|
—
|
|
(71,147
|
)
|
||||||||
|
Income before income taxes
|
94,452
|
|
18,944
|
|
—
|
|
113,396
|
|
||||||||
|
Income tax expense
|
(1,361
|
)
|
(4,785
|
)
|
—
|
|
(6,146
|
)
|
||||||||
|
Net income
|
$
|
93,091
|
|
$
|
14,159
|
|
$
|
—
|
|
$
|
107,250
|
|
||||
|
Segment assets
|
$
|
3,641,844
|
|
$
|
249,109
|
|
$
|
—
|
|
$
|
3,890,953
|
|
||||
|
Expenditures for segment assets
|
$
|
197,680
|
|
$
|
—
|
|
$
|
—
|
|
$
|
197,680
|
|
||||
F-40
|
2015
|
||||||||||||||||||||
|
Real Estate
|
Observatory
|
Other
|
Intersegment Elimination
|
Total
|
||||||||||||||||
|
Revenues:
|
||||||||||||||||||||
|
Rental revenue
|
$
|
447,784
|
|
$
|
—
|
|
$
|
—
|
|
$
|
—
|
|
$
|
447,784
|
|
|||||
|
Intercompany rental revenue
|
68,255
|
|
—
|
|
—
|
|
(68,255
|
)
|
—
|
|
||||||||||
|
Tenant expense reimbursement
|
79,516
|
|
—
|
|
—
|
|
—
|
|
79,516
|
|
||||||||||
|
Observatory revenue
|
—
|
|
112,172
|
|
—
|
|
—
|
|
112,172
|
|
||||||||||
|
Construction revenue
|
—
|
|
—
|
|
5,696
|
|
(3,715
|
)
|
1,981
|
|
||||||||||
|
Third-party management and other fees
|
2,133
|
|
—
|
|
—
|
|
—
|
|
2,133
|
|
||||||||||
|
Other revenue and fees
|
14,048
|
|
—
|
|
—
|
|
—
|
|
14,048
|
|
||||||||||
|
Total revenues
|
611,736
|
|
112,172
|
|
5,696
|
|
(71,970
|
)
|
657,634
|
|
||||||||||
|
Operating expenses:
|
||||||||||||||||||||
|
Property operating expenses
|
158,638
|
|
—
|
|
—
|
|
—
|
|
158,638
|
|
||||||||||
|
Intercompany rent expense
|
—
|
|
68,255
|
|
—
|
|
(68,255
|
)
|
—
|
|
||||||||||
|
Ground rent expense
|
9,326
|
|
—
|
|
—
|
|
—
|
|
9,326
|
|
||||||||||
|
General and administrative expenses
|
38,073
|
|
—
|
|
—
|
|
—
|
|
38,073
|
|
||||||||||
|
Observatory expenses
|
—
|
|
32,174
|
|
—
|
|
—
|
|
32,174
|
|
||||||||||
|
Construction expenses
|
—
|
|
—
|
|
6,539
|
|
(3,317
|
)
|
3,222
|
|
||||||||||
|
Real estate taxes
|
93,165
|
|
—
|
|
—
|
|
—
|
|
93,165
|
|
||||||||||
|
Acquisition expenses
|
193
|
|
—
|
|
—
|
|
—
|
|
193
|
|
||||||||||
|
Depreciation and amortization
|
171,035
|
|
338
|
|
101
|
|
—
|
|
171,474
|
|
||||||||||
|
Total operating expenses
|
470,430
|
|
100,767
|
|
6,640
|
|
(71,572
|
)
|
506,265
|
|
||||||||||
|
Total operating income (loss)
|
141,306
|
|
11,405
|
|
(944
|
)
|
(398
|
)
|
151,369
|
|
||||||||||
|
Interest expense
|
(67,492
|
)
|
—
|
|
—
|
|
—
|
|
(67,492
|
)
|
||||||||||
|
Income (loss) before income taxes
|
73,814
|
|
11,405
|
|
(944
|
)
|
(398
|
)
|
83,877
|
|
||||||||||
|
Income tax (expense) benefit
|
(1,498
|
)
|
(2,791
|
)
|
340
|
|
—
|
|
(3,949
|
)
|
||||||||||
|
Net income (loss)
|
$
|
72,316
|
|
$
|
8,614
|
|
$
|
(604
|
)
|
$
|
(398
|
)
|
$
|
79,928
|
|
|||||
|
Segment assets
|
$
|
3,058,250
|
|
$
|
241,511
|
|
$
|
889
|
|
$
|
—
|
|
$
|
3,300,650
|
|
|||||
|
Expenditures for segment assets
|
$
|
156,543
|
|
$
|
211
|
|
$
|
—
|
|
$
|
—
|
|
$
|
156,754
|
|
|||||
F-41
|
2014
|
||||||||||||||||||||
|
Real Estate
|
Observatory
|
Other
|
Intersegment Elimination
|
Total
|
||||||||||||||||
|
Revenues:
|
||||||||||||||||||||
|
Rental revenue
|
$
|
400,825
|
|
$
|
—
|
|
$
|
—
|
|
$
|
—
|
|
$
|
400,825
|
|
|||||
|
Intercompany rental revenue
|
69,293
|
|
—
|
|
—
|
|
(69,293
|
)
|
—
|
|
||||||||||
|
Tenant expense reimbursement
|
67,651
|
|
—
|
|
—
|
|
—
|
|
67,651
|
|
||||||||||
|
Observatory revenue
|
—
|
|
111,541
|
|
—
|
|
—
|
|
111,541
|
|
||||||||||
|
Construction revenue
|
—
|
|
—
|
|
44,989
|
|
(6,341
|
)
|
38,648
|
|
||||||||||
|
Third-party management and other fees
|
2,376
|
|
—
|
|
—
|
|
—
|
|
2,376
|
|
||||||||||
|
Other revenue and fees
|
13,280
|
|
982
|
|
23
|
|
—
|
|
14,285
|
|
||||||||||
|
Total revenues
|
553,425
|
|
112,523
|
|
45,012
|
|
(75,634
|
)
|
635,326
|
|
||||||||||
|
Operating expenses:
|
||||||||||||||||||||
|
Property operating expenses
|
148,676
|
|
—
|
|
—
|
|
—
|
|
148,676
|
|
||||||||||
|
Intercompany rent expense
|
—
|
|
69,293
|
|
—
|
|
(69,293
|
)
|
—
|
|
||||||||||
|
Ground rent expense
|
5,339
|
|
—
|
|
—
|
|
—
|
|
5,339
|
|
||||||||||
|
General and administrative expenses
|
39,037
|
|
—
|
|
—
|
|
—
|
|
39,037
|
|
||||||||||
|
Observatory expenses
|
—
|
|
31,413
|
|
—
|
|
—
|
|
31,413
|
|
||||||||||
|
Construction expenses
|
—
|
|
—
|
|
44,185
|
|
(5,589
|
)
|
38,596
|
|
||||||||||
|
Real estate taxes
|
82,131
|
|
—
|
|
—
|
|
—
|
|
82,131
|
|
||||||||||
|
Acquisition expenses
|
3,382
|
|
—
|
|
—
|
|
—
|
|
3,382
|
|
||||||||||
|
Depreciation and amortization
|
145,121
|
|
295
|
|
15
|
|
—
|
|
145,431
|
|
||||||||||
|
Total operating expenses
|
423,686
|
|
101,001
|
|
44,200
|
|
(74,882
|
)
|
494,005
|
|
||||||||||
|
Total operating income (loss)
|
129,739
|
|
11,522
|
|
812
|
|
(752
|
)
|
141,321
|
|
||||||||||
|
Interest expense
|
(66,456
|
)
|
—
|
|
—
|
|
—
|
|
(66,456
|
)
|
||||||||||
|
Income (loss) before income taxes
|
63,283
|
|
11,522
|
|
812
|
|
(752
|
)
|
74,865
|
|
||||||||||
|
Income tax expense
|
(1,437
|
)
|
(2,876
|
)
|
(342
|
)
|
—
|
|
(4,655
|
)
|
||||||||||
|
Net income (loss)
|
$
|
61,846
|
|
$
|
8,646
|
|
$
|
470
|
|
$
|
(752
|
)
|
$
|
70,210
|
|
|||||
|
Segment assets
|
$
|
3,023,089
|
|
$
|
252,376
|
|
$
|
8,032
|
|
$
|
—
|
|
$
|
3,283,497
|
|
|||||
|
Expenditures for segment assets
|
$
|
497,645
|
|
$
|
99
|
|
$
|
—
|
|
$
|
—
|
|
$
|
497,744
|
|
|||||
F-42
14. Summary of Quarterly Financial Information (unaudited)
The quarterly results of operations of our company for the years ended
December 31, 2016
, 2015 and 2014 are as follows (amounts in thousands):
|
March 31, 2016
|
June 30, 2016
|
September 30, 2016
|
December 31, 2016
|
||||||||||||
|
Revenues
|
$
|
157,074
|
|
$
|
165,815
|
|
$
|
175,848
|
|
$
|
179,263
|
|
|||
|
Operating income
|
$
|
34,114
|
|
$
|
44,192
|
|
$
|
53,586
|
|
$
|
52,651
|
|
|||
|
Net income
|
$
|
16,705
|
|
$
|
24,640
|
|
$
|
32,897
|
|
$
|
33,008
|
|
|||
|
Net income attributable to common stockholders
|
$
|
7,428
|
|
$
|
11,089
|
|
$
|
15,973
|
|
$
|
16,966
|
|
|||
|
Net income per share attributable to common stockholders:
|
|||||||||||||||
|
Basic and diluted
|
$
|
0.06
|
|
$
|
0.09
|
|
$
|
0.12
|
|
$
|
0.11
|
|
|||
|
March 31, 2015
|
June 30, 2015
|
September 30, 2015
|
December 31, 2015
|
||||||||||||
|
Revenues
|
$
|
151,882
|
|
$
|
164,773
|
|
$
|
175,779
|
|
$
|
165,200
|
|
|||
|
Operating income
|
$
|
23,757
|
|
$
|
45,039
|
|
$
|
45,343
|
|
$
|
37,230
|
|
|||
|
Net income
|
$
|
7,888
|
|
$
|
26,585
|
|
$
|
26,085
|
|
$
|
19,370
|
|
|||
|
Net income attributable to common stockholders
|
$
|
3,138
|
|
$
|
11,120
|
|
$
|
11,220
|
|
$
|
8,252
|
|
|||
|
Net income per share attributable to common stockholders:
|
|||||||||||||||
|
Basic and diluted
|
$
|
0.03
|
|
$
|
0.10
|
|
$
|
0.10
|
|
$
|
0.07
|
|
|||
|
March 31, 2014
|
June 30, 2014
|
September 30, 2014
|
December 31, 2014
|
||||||||||||
|
Revenues
|
$
|
140,306
|
|
$
|
155,168
|
|
$
|
169,441
|
|
$
|
170,411
|
|
|||
|
Operating income
|
$
|
24,088
|
|
$
|
42,539
|
|
$
|
43,412
|
|
$
|
31,282
|
|
|||
|
Net income
|
$
|
11,231
|
|
$
|
25,281
|
|
$
|
22,734
|
|
$
|
10,964
|
|
|||
|
Net income attributable to common stockholders
|
$
|
4,369
|
|
$
|
9,834
|
|
$
|
8,322
|
|
$
|
4,142
|
|
|||
|
Net income per share attributable to common stockholders:
|
|||||||||||||||
|
Basic and diluted
|
$
|
0.05
|
|
$
|
0.10
|
|
$
|
0.09
|
|
$
|
0.04
|
|
|||
15. Subsequent Events
On February 17, 2017, our Board of Directors declared a dividend of
$0.105
per share for the first quarter 2017, payable to holders of our Class A common stock and Class B common stock and to holders of Empire State Realty OP, L.P.'s Series ES, Series 250 and Series 60 OP Units (NYSE Arca: ESBA, FISK and OGCP, respectively) and Series PR OP Units. The dividend will be payable in cash on March 31, 2017 to securityholders of record at the close of business on March 15, 2017.
F-43
Empire State Realty Trust, Inc.
Schedule II—Valuation and Qualifying Accounts
(amounts in thousands)
|
Description
|
Balance At
Beginning of Year |
Additions
Charged Against Operations |
Uncollectible
Accounts Written-Off |
Balance
at End of Year |
||||||||||||
|
Year ended December 31, 2016
|
||||||||||||||||
|
Allowance for doubtful accounts
|
$
|
3,037
|
|
$
|
908
|
|
$
|
(222
|
)
|
$
|
3,723
|
|
||||
|
Year ended December 31, 2015
|
||||||||||||||||
|
Allowance for doubtful accounts
|
$
|
1,847
|
|
$
|
1,298
|
|
$
|
(108
|
)
|
$
|
3,037
|
|
||||
|
Year ended December 31, 2014
|
||||||||||||||||
|
Allowance for doubtful accounts
|
$
|
715
|
|
$
|
2,006
|
|
$
|
(874
|
)
|
$
|
1,847
|
|
||||
F-44
Empire State Realty Trust, Inc.
Schedule III—Real Estate and Accumulated Depreciation
(amounts in thousands)
|
Initial Cost to
the Company |
Cost Capitalized
Subsequent to Acquisition |
Gross Amount at
which Carried at 12/31/16 |
||||||||||||||||||||||||||||||||||||||||||
|
Development
|
Type
|
Encumbrances
|
Land
|
Building &
Improvements |
Improvements
|
Carrying
Costs |
Land
|
Buildings &
Improvements |
Total
|
Accumulated
Depreciation |
Date of
Construction |
Date
Acquired |
Life on
which depreciation in latest income statement is computed |
|||||||||||||||||||||||||||||||
|
111 West 33rd Street, New York, NY
|
office /
retail |
$
|
87,656
|
|
$
|
13,630
|
|
$
|
244,461
|
|
$
|
46,954
|
|
n/a
|
|
$
|
13,630
|
|
$
|
291,415
|
|
$
|
305,045
|
|
$
|
(20,781
|
)
|
1954
|
2014
|
various
|
||||||||||||||
|
1400 Broadway, New York, NY
|
office /
retail |
79,237
|
|
—
|
|
96,338
|
|
19,908
|
|
—
|
|
—
|
|
116,246
|
|
116,246
|
|
(19,003
|
)
|
1930
|
2014
|
various
|
||||||||||||||||||||||
|
1333 Broadway, New York, NY
|
office /
retail |
69,520
|
|
91,435
|
|
120,190
|
|
4,965
|
|
n/a
|
|
91,435
|
|
125,155
|
|
216,590
|
|
(14,064
|
)
|
1915
|
2013
|
various
|
||||||||||||||||||||||
|
1350 Broadway, New York, NY
|
office /
retail |
38,842
|
|
—
|
|
102,518
|
|
18,986
|
|
—
|
|
—
|
|
121,504
|
|
121,504
|
|
(14,154
|
)
|
1929
|
2013
|
various
|
||||||||||||||||||||||
|
250 West 57th Street, New York, NY
|
office/
retail |
—
|
|
2,117
|
|
5,041
|
|
95,233
|
|
n/a
|
|
2,117
|
|
100,274
|
|
102,391
|
|
(27,130
|
)
|
1921
|
1953
|
various
|
||||||||||||||||||||||
|
501 Seventh Avenue, New York, NY
|
office/
retail |
—
|
|
1,100
|
|
2,600
|
|
89,650
|
|
n/a
|
|
1,100
|
|
92,250
|
|
93,350
|
|
(36,636
|
)
|
1923
|
1950
|
various
|
||||||||||||||||||||||
|
1359 Broadway, New York, NY
|
office/
retail |
—
|
|
1,233
|
|
1,809
|
|
52,461
|
|
n/a
|
|
1,233
|
|
54,270
|
|
55,503
|
|
(21,296
|
)
|
1924
|
1953
|
various
|
||||||||||||||||||||||
|
350 Fifth Avenue (Empire State Building), New York, NY
|
office/
retail |
—
|
|
21,551
|
|
38,934
|
|
691,784
|
|
n/a
|
|
21,551
|
|
730,718
|
|
752,269
|
|
(137,791
|
)
|
1930
|
2013
|
various
|
||||||||||||||||||||||
|
One Grand Central Place,
New York, NY |
office/
retail |
—
|
|
7,240
|
|
17,490
|
|
201,322
|
|
n/a
|
|
7,222
|
|
218,830
|
|
226,052
|
|
(87,075
|
)
|
1930
|
1954
|
various
|
||||||||||||||||||||||
|
First Stamford Place, Stamford, CT
|
office
|
234,953
|
|
22,952
|
|
122,739
|
|
46,409
|
|
n/a
|
|
24,862
|
|
167,238
|
|
192,100
|
|
(70,988
|
)
|
1986
|
2001
|
various
|
||||||||||||||||||||||
|
One Station Place, Stamford, CT (Metro Center)
|
office
|
95,574
|
|
5,313
|
|
28,602
|
|
13,069
|
|
n/a
|
|
5,313
|
|
41,671
|
|
46,984
|
|
(27,860
|
)
|
1987
|
1984
|
various
|
||||||||||||||||||||||
|
383 Main Avenue, Norwalk, CT
|
office
|
28,639
|
|
2,262
|
|
12,820
|
|
15,281
|
|
n/a
|
|
2,262
|
|
28,101
|
|
30,363
|
|
(10,776
|
)
|
1985
|
1994
|
various
|
||||||||||||||||||||||
|
500 Mamaroneck Avenue, Harrison, NY
|
office
|
—
|
|
4,571
|
|
25,915
|
|
18,784
|
|
n/a
|
|
4,571
|
|
44,699
|
|
49,270
|
|
(20,129
|
)
|
1987
|
1999
|
various
|
||||||||||||||||||||||
|
10 Bank Street, White Plains, NY
|
office
|
31,531
|
|
5,612
|
|
31,803
|
|
14,665
|
|
n/a
|
|
5,612
|
|
46,468
|
|
52,080
|
|
(19,174
|
)
|
1989
|
1999
|
various
|
||||||||||||||||||||||
|
10 Union Square, New York, NY
|
retail
|
48,824
|
|
5,003
|
|
12,866
|
|
1,661
|
|
n/a
|
|
5,003
|
|
14,527
|
|
19,530
|
|
(6,954
|
)
|
1987
|
1996
|
various
|
||||||||||||||||||||||
|
1542 Third Avenue, New York, NY
|
retail
|
17,784
|
|
2,239
|
|
15,266
|
|
391
|
|
n/a
|
|
2,239
|
|
15,657
|
|
17,896
|
|
(6,925
|
)
|
1991
|
1999
|
various
|
||||||||||||||||||||||
|
1010 Third Avenue, New York, NY and 77 West 55th Street, New York, NY
|
retail
|
26,456
|
|
4,462
|
|
15,817
|
|
774
|
|
n/a
|
|
4,462
|
|
16,591
|
|
21,053
|
|
(7,740
|
)
|
1962
|
1998
|
various
|
||||||||||||||||||||||
|
69-97 Main Street, Westport, CT
|
retail
|
—
|
|
2,782
|
|
15,766
|
|
918
|
|
n/a
|
|
2,782
|
|
16,684
|
|
19,466
|
|
(6,165
|
)
|
1922
|
2003
|
various
|
||||||||||||||||||||||
|
103-107 Main Street, Westport, CT
|
retail
|
—
|
|
1,243
|
|
7,043
|
|
158
|
|
n/a
|
|
1,260
|
|
7,184
|
|
8,444
|
|
(1,905
|
)
|
1900
|
2006
|
various
|
||||||||||||||||||||||
|
Property for development at the Transportation Hub in Stamford CT
|
land
|
—
|
|
4,542
|
|
—
|
|
7,951
|
|
—
|
|
12,493
|
|
—
|
|
12,493
|
|
—
|
|
n/a
|
n/a
|
n/a
|
||||||||||||||||||||||
|
Totals
|
$
|
759,016
|
|
$
|
199,287
|
|
$
|
918,018
|
|
$
|
1,341,324
|
|
$
|
—
|
|
$
|
209,147
|
|
$
|
2,249,482
|
|
$
|
2,458,629
|
|
$
|
(556,546
|
)
|
|||||||||||||||||
F-45
Empire State Realty Trust, Inc.
Notes to Schedule III—Real Estate and Accumulated Depreciation
(amounts in thousands)
1
.
Reconciliation of Investment Properties
The changes in our investment properties for the years ended December 31, 2016, 2015 and 2014 are as follows:
|
2016
|
2015
|
2014
|
|||||||||
|
Balance, beginning of year
|
$
|
2,276,330
|
|
$
|
2,139,863
|
|
$
|
1,649,423
|
|
||
|
Acquisition of new properties
|
—
|
|
—
|
|
354,429
|
|
|||||
|
Improvements
|
197,680
|
|
156,754
|
|
143,315
|
|
|||||
|
Disposals
|
(15,381
|
)
|
(20,287
|
)
|
(7,304
|
)
|
|||||
|
Balance, end of year
|
$
|
2,458,629
|
|
$
|
2,276,330
|
|
$
|
2,139,863
|
|
||
The unaudited aggregate cost of investment properties for federal income tax purposes as of December 31, 2016 was
$2,117,615
.
2
.
Reconciliation of Accumulated Depreciation
The changes in our accumulated depreciation for the years ended December 31, 2016, 2015 and 2014 are as follows:
|
2016
|
2015
|
2014
|
||||||||||
|
Balance, beginning of year
|
$
|
465,584
|
|
$
|
377,552
|
|
$
|
295,351
|
|
|||
|
Depreciation expense
|
106,343
|
|
108,319
|
|
89,505
|
|
||||||
|
Disposals
|
(15,381
|
)
|
(20,287
|
)
|
(7,304
|
)
|
||||||
|
Balance, end of year
|
$
|
556,546
|
|
$
|
465,584
|
|
$
|
377,552
|
|
|||
Depreciation of investment properties reflected in the combined statements of operations is calculated over the estimated original lives of the assets as follows:
|
Buildings
|
39 years
|
|
|
Building improvements
|
39 years or useful life
|
|
|
Tenant improvements
|
Term of related lease
|
|
F-46
TABLE OF CONTENTS
Part IItem 1. BusinessItem 1A. Risk FactorsItem 1B. Unresolved Staff CommentsItem 2. PropertiesItem 3. Legal ProceedingsItem 4. Mine Safety DisclosurePart IIItem 5. Market For Registrant's Common Equity, Related Stockholder Matters and Issuer Purchases Of Equity SecuritiesItem 6. Selected Financial DataItem 7. Management S Discussion and Analysis Of Financial Condition and Results Of OperationsItem 7A. Quantitative and Qualitative Disclosures About Market RiskItem 8. Financial Statements and Supplementary DataItem 9. Changes in and Disagreements with Accountants on Accounting and Financial DisclosureItem 9A. Controls and ProceduresItem 9B. Other InformationPart IIIItem 10. Directors, Executive Officers and Corporate GovernanceItem 11. Executive CompensationItem 12. Security Ownership Of Certain Beneficial Owners and Management and Related Stockholder MattersItem 13. Certain Relationships and Related Transactions, and Director IndependenceItem 14. Principal Accounting Fees and ServicesPart IVItem 15. Exhibits, Financial Statements and SchedulesItem 16. Form 10-k Summary