ESSEX PROPERTY TRUST, INC.
10-Ks and 10-Qs
|
|
|
|
|
|
|
|
|
|
|
|
|
|
|
|
|
|
|
|
|
|
|
|
|
|
|
|
|
|
|
|
|
|
|
|
|
|
|
|
|
|
|
|
|
|
|
|
|
|
|
|
|
|
|
|
UNITED STATES
SECURITIES AND EXCHANGE COMMISSION
Washington, D.C. 20549
FORM
10-K
(MARK ONE)
|
x
|
ANNUAL REPORT PURSUANT TO SECTION 13 OR 15(d) OF THE SECURITIES EXCHANGE ACT OF 1934
|
For the fiscal year ended December 31, 2012
OR
|
o
|
TRANSITION REPORT PURSUANT TO SECTION 13 OR 15(d) OF THE SECURITIES EXCHANGE ACT OF 1934
|
FOR THE TRANSITION PERIOD FROM ___________ TO _____________
Commission file number
1-13106

Essex Property Trust, Inc.
(Exact name of Registrant as Specified in its Charter)
|
Maryland
|
77-0369576
|
|
|
(State or Other Jurisdiction of Incorporation or Organization)
|
(I.R.S. Employer Identification Number)
|
925 East Meadow Drive
Palo Alto, California 94303
(Address of Principal Executive Offices including Zip Code)
(650) 494-3700
(Registrant's Telephone Number, Including Area Code)
Securities registered pursuant to Section 12(b) of the Act:
|
Title of each class
|
Name of each exchange on which registered
|
|
|
Common Stock, $.0001 par value
|
New York Stock Exchange
|
|
|
4.875% Series G Cumulative Convertible Preferred Stock
|
New York Stock Exchange
|
|
|
7.125% Series H Cumulative Redeemable Preferred Stock
|
New York Stock Exchange
|
Securities registered pursuant to Section 12(g) of the Act: None
Indicate by check mark if the registrant is a well-known seasoned issuer, as defined in Rule 405 of the Securities Act.
Yes
x
No
o
Indicate by check mark if the registrant is not required to file reports pursuant to Section 13 or Section 15(d) of the Act.
Yes
o
No
x
Indicate by check mark whether the registrant (1) has filed all reports required to be filed by Section 13 or 15(d) of the Securities Exchange Act of 1934 during the preceding 12 months (or for such shorter period that the registrant was required to file such reports), and (2) has been subject to such filing requirements for the past 90 days.
Yes
x
No
o
Indicate by check mark whether the registrant has submitted electronically and posted on its corporate Web site, if any, every Interactive Data File required to be submitted and posted pursuant to Rule 405 of Regulation S-T (§232.405 of this chapter) during the preceding 12 months (or for such shorter period that the registrant was required to submit and post such files). Yes
x
No
o
Indicate by check mark if disclosure of delinquent filers pursuant to Item 405 of Regulation S-K is not contained herein, and will not be contained, to the best of Registrant's knowledge, in definitive proxy or information statements incorporated by reference in Part III of this Form 10-K, or any amendment to this Form 10-K.
o
Indicate by check mark whether the registrant is a large accelerated filer, an accelerated filer, a non-accelerated filer, or a smaller reporting company. See the definitions of “large accelerated filer,” “accelerated filer” and “smaller reporting company” in Rule 12b-2 of the Exchange Act. (Check one):
|
Large accelerated filer
x
|
Accelerated filer
o
|
Non-accelerated filer
o
(Do not check if a smaller
reporting company)
|
Smaller reporting company
o
|
Indicate by check mark whether the registrant is a shell company (as defined in Rule 12b-2 of the Act).
Yes
o
No
x
As of June 30, 2012, the aggregate market value of the voting stock held by non-affiliates of the registrant was $5,325,843,948. The aggregate market value was computed with reference to the closing price on the New York Stock Exchange on such date. Shares of common stock held by executive officers, directors and holders of more than ten percent of the outstanding common stock have been excluded from this calculation because such persons may be deemed to be affiliates. This exclusion does not reflect a determination that such persons are affiliates for any other purposes.
As of February 20, 2013, 37,907,305 shares of common stock ($.0001 par value) were outstanding.
DOCUMENTS INCORPORATED BY REFERENCE:
The following document is incorporated by reference in Part III of the Annual Report on Form 10-K: Proxy statement for the annual meeting of stockholders of Essex Property Trust, Inc. to be held May 14, 2013.
ii
Essex Property Trust, Inc.
2012 ANNUAL REPORT ON FORM 10-K
|
Part I.
|
Page
|
|
|
Item 1.
|
1
|
|
|
Item 1A.
|
7
|
|
|
Item 1B.
|
17
|
|
|
Item 2.
|
17
|
|
|
Item 3.
|
23
|
|
|
Item 4.
|
23
|
|
|
Part II.
|
||
|
Item 5.
|
24
|
|
|
Item 6.
|
27
|
|
|
Item 7.
|
28
|
|
|
Item 7A.
|
42
|
|
|
Item 8.
|
43
|
|
|
Item 9.
|
43
|
|
|
Item 9A.
|
43
|
|
|
Item 9B.
|
43
|
|
|
Part III.
|
||
|
Item 10.
|
44
|
|
|
Item 11.
|
44
|
|
|
Item 12.
|
44
|
|
|
Item 13.
|
44
|
|
|
Item 14.
|
44
|
|
|
Part IV.
|
||
|
Item 15.
|
45
|
|
|
S-1
|
Forward Looking Statements
This Form 10-K contains forward-looking statements within the meaning of Section 27A of the Securities Act of 1933 and Section 21E of the Securities Exchange Act of 1934. Such forward-looking statements are described in Item 7, Management’s Discussion and Analysis of Financial Condition and Results of Operations, in the section, “Forward Looking Statements.” Actual results could differ materially from those set forth in each forward-looking statement. Certain factors that might cause such a difference are discussed in this report, including Item 1A, Risk Factors of this Form 10-K.
OVERVIEW
Essex Property Trust, Inc. (“Essex” or the “Company”) is a Maryland corporation that operates as a self-administered and self-managed real estate investment trust (“REIT”). The Company owns all of its interest in its real estate investments directly or indirectly through Essex Portfolio, L.P. (the “Operating Partnership” or “EPLP”). The Company is the sole general partner of the Operating Partnership and as of December 31, 2012 owns a 94.5% general partnership interest. In this report, the terms “Essex” or the “Company” also refer to Essex Property Trust, Inc., its Operating Partnership and the Operating Partnership’s subsidiaries.
The Company has elected to be treated as a REIT for federal income tax purposes, commencing with the year ended December 31, 1994 as the Company completed an initial public offering on June 13, 1994. In order to maintain compliance with REIT tax rules, the Company utilizes taxable REIT subsidiaries for various revenue generating or investment activities. All taxable REIT subsidiaries are consolidated by the Company.
The Company is engaged primarily in the ownership, operation, management, acquisition, development and redevelopment of predominantly apartment communities. As of December 31, 2012, the Company owned or held an interest in 163 communities, aggregating 33,468 units, located along the West Coast, as well as five commercial buildings (totaling approximately 315,900 square feet), and nine active development projects with 2,495 units in various stages of development (collectively, the “Portfolio”).
The Company’s website address is
http://www.essexpropertytrust.com
. The Company’s annual reports on Form 10-K, quarterly reports on Form 10-Q, current reports on Form 8-K and all amendments to those reports, and the Proxy Statement for its Annual Meeting of Stockholders are available, free of charge, on its website as soon as practicable after the Company files the reports with the Securities and Exchange Commission (“SEC”).
BUSINESS STRATEGIES
The following is a discussion of the Company’s business strategies in regards to real estate investment and management.
Business Strategies
Research Driven Approach to Investments
–
The Company believes that successful real estate investment decisions and portfolio growth begin with extensive regional economic research and local market knowledge. The Company continually assesses markets where the Company operates, as well as markets where the Company considers future investment opportunities by evaluating the following:
|
|
·
|
Focus on markets in major metropolitan areas that have regional population in excess of one million;
|
|
|
·
|
Constraints on new supply driven by: (i) low availability of developable land sites where competing housing could be economically built; (ii) political growth barriers, such as protected land, urban growth boundaries, and potential lengthy and expensive development permit processes; and (iii) natural limitations to development, such as mountains or waterways;
|
|
|
·
|
Rental demand is enhanced by affordability of rents relative to costs of for-sale housing; and
|
|
|
·
|
Housing demand that is based on proximity to jobs, high median incomes, the quality of life and related commuting factors, as well as potential job growth.
|
Recognizing that all real estate markets are cyclical, the Company regularly evaluates the results of its regional economic, and its local market research, and adjusts the geographic focus of its portfolio accordingly. The Company seeks to increase its Portfolio allocation in markets projected to have the strongest local economies and to decrease such allocations in markets projected to have declining economic conditions. Likewise, the Company also seeks to increase its portfolio allocation in markets that have attractive property valuations and to decrease such allocations in markets that have inflated valuations and low relative yields.
Property Operations
– The Company manages its communities by focusing on activities that generate above-average rental growth, tenant retention/satisfaction and long-term asset appreciation. The Company intends to achieve this by utilizing the strategies set forth below:
|
|
·
|
Property Management
–
Oversee delivery of and quality of the housing provided to our residents and are responsible for the properties financial performance.
|
|
|
·
|
Capital Preservation –
Asset Management is responsible for the planning, budgeting and completion of major capital improvement projects at the Company’s communities.
|
|
|
·
|
Business Planning and Control –
Comprehensive business plans are implemented in conjunction with every investment decision. These plans include benchmarks for future financial performance, based on collaborative discussions between on-site managers and senior management.
|
|
|
·
|
Development and Redevelopment –
The Company focuses on acquiring and developing apartment communities in supply constrained markets, and redeveloping its existing communities to improve the financial and physical aspects of the Company’s communities.
|
CURRENT BUSINESS ACTIVITIES
Acquisitions of Real Estate
Acquisitions are an important component of the Company’s business plan, and during 2012, the Company acquired ownership interests in fifteen communities totaling $801.9 million. The following is a summary of its 2012 acquisitions:
|
Essex
|
Assumed
|
Assumed
|
Assumed
|
||||||||||||||||||||||||||||
|
Ownership
|
Purchase
|
Debt
|
Debt Stated
|
Debt Effective
|
|||||||||||||||||||||||||||
|
Property Name
|
Location
|
Units
|
Percentage
|
Ownership
|
Date
|
Price
|
Principal
|
Rate
|
Rate
|
||||||||||||||||||||||
|
Bon Terra
|
Redmond, WA
|
60 | 100 | % |
EPLP
|
Q1 2012 | $ | 16,000 | $ | - | - | - | |||||||||||||||||||
|
Reed Square
|
Sunnyvale, CA
|
100 | 100 | % |
EPLP
|
Q1 2012 | 23,000 | - | - | - | |||||||||||||||||||||
|
Park Catalina
|
Los Angeles, CA
|
90 | 100 | % |
EPLP
|
Q2 2012 | 23,650 | - | - | - | |||||||||||||||||||||
|
Skyline (1)
|
Santa Ana, CA
|
349 | 100 | % |
EPLP
|
Q2 2012 | 85,000 | - | - | - | |||||||||||||||||||||
|
The Huntington
|
Huntington Beach, CA
|
276 | 100 | % |
EPLP
|
Q2 2012 | 48,250 | 30,300 | 5.7 | % | 3.3 | % | |||||||||||||||||||
|
Domaine
|
Seattle, WA
|
92 | 100 | % |
EPLP
|
Q3 2012 | 34,000 | 14,600 | 5.7 | % | 3.0 | % | |||||||||||||||||||
|
Montebello
|
Kirkland, WA
|
248 | 100 | % |
EPLP
|
Q3 2012 | 52,000 | 26,515 | 5.6 | % | 3.1 | % | |||||||||||||||||||
|
Park West
|
San Francisco, CA
|
126 | 100 | % |
EPLP
|
Q3 2012 | 31,600 | - | - | - | |||||||||||||||||||||
|
Riley Square
|
Santa Clara, CA
|
156 | 50 | % |
Wesco I
|
Q3 2012 | 38,250 | 17,500 | 5.2 | % | 3.1 | % | |||||||||||||||||||
|
Ascent
|
Kirkland, WA
|
90 | 100 | % |
EPLP
|
Q4 2012 | 15,850 | - | - | - | |||||||||||||||||||||
|
Bennett Lofts (2)
|
San Francisco, CA
|
113 | 100 | % |
EPLP
|
Q4 2012 | 73,730 | - | - | - | |||||||||||||||||||||
|
Haver Hill
|
Fullerton, CA
|
264 | 50 | % |
Wesco III
|
Q4 2012 | 45,600 | - | - | - | |||||||||||||||||||||
|
Madrid
|
Mission Viejo, CA
|
230 | 50 | % |
Wesco I
|
Q4 2012 | (3 | ) | 33,266 | 5.3 | % | 2.6 | % | ||||||||||||||||||
|
Pacific Electric Lofts
|
Los Angeles, CA
|
314 | 50 | % |
Wesco I
|
Q4 2012 | (3 | ) | 46,939 | 4.0 | % | 2.5 | % | ||||||||||||||||||
|
Willow Lake
|
San Jose, CA
|
508 | 100 | % |
EPLP
|
Q4 2012 | 148,000 | - | - | - | |||||||||||||||||||||
|
Total 2012
|
3,016 | $ | 801,930 | $ | 169,120 | ||||||||||||||||||||||||||
|
|
(1) In April 2012, the Company purchased the joint venture partner's remaining membership interest in the co-investment Essex Skyline at MacArthur Place for a purchase price of $85 million. The property is now consolidated.
|
|
(2)
Approximately 75% of the property was acquired in December and the remainder in January 2013 for $22.2 million.
|
|
(3)
In accordance with terms of the purchase agreements, purchase price of the properties are not being disclosed by the Company.
|
Dispositions of Real Estate
As part of its strategic plan to own quality real estate in supply-constrained markets, the Company continually evaluates all the communities and sells those which no longer meet its strategic criteria. The Company may use the capital generated from the dispositions to invest in higher-return communities or other real estate investments, or repay debts. The Company believes that the sale of these communities will not have a material impact on its future results of operations or cash flows nor will their sale materially affect its ongoing operations. Generally, the Company seeks to have any impact of earnings dilution resulting from these dispositions offset by the positive impact of its acquisitions, development and redevelopment activities.
During 2012, the Company sold two apartment communities, for a total of $28.3 million resulting in a gain of $10.9 million. Also, Essex Apartment Value Fund II sold seven communities for a total of $413.0 million. The total gain on the transaction was $106 million, of which the Company’s pro-rata share was $29.1 million.
Development Pipeline
The Company defines development projects as new communities that are in various stages of active development, or the community is in lease-up and phases of the project are not completed. As of December 31, 2012, the Company had two consolidated development projects and seven joint venture development projects comprised of 2,495 units for an estimated cost of $928.4 million, of which $463.9 million remains to be expended.
The Company defines the predevelopment projects as proposed communities in negotiation or in the entitlement process with a high likelihood of becoming entitled development projects. As of December 31, 2012, the Company had two consolidated predevelopment projects and one unconsolidated joint venture predevelopment project aggregating 449 units. The Company may also acquire land for future development purposes or sale.
The following table sets forth information regarding the Company’s development pipeline:
|
Essex
|
As of 12/31/12 ($ in millions)
|
|||||||||||||||||||||
|
Ownership
|
Incurred
|
Estimated
|
Estimated
|
Projected
|
||||||||||||||||||
|
Development Pipeline
|
Location
|
%
|
Units
|
Project Cost
|
Remaining Cost
|
Project Cost
(1)
|
Stabilization
|
|||||||||||||||
|
Development Projects - Consolidated
|
||||||||||||||||||||||
|
64th & Christie
|
Emeryville, CA
|
100 | % | 190 | $ | 18.1 | $ | 40.1 | $ | 58.2 |
Feb-15
|
|||||||||||
|
Valley Village
|
Valley Village, CA
|
(2 | ) | 121 | 1.5 | 36.1 | 37.6 |
Jun-14
|
||||||||||||||
|
Total - Consolidated Development Projects
|
311 | 19.6 | 76.2 | 95.8 | ||||||||||||||||||
|
Development Projects - Joint Venture
|
||||||||||||||||||||||
|
Expo
|
Seattle, WA
|
50 | % | 275 | 64.5 | 5.5 | 70.0 |
Apr-13
|
||||||||||||||
|
Epic - Phase I and II
|
San Jose, CA
|
55 | % | 569 | 128.2 | 63.4 | 191.6 |
Dec-14
|
||||||||||||||
|
Connolly Station (fka Linc)
|
Dublin, CA
|
55 | % | 309 | 51.6 | 42.9 | 94.5 |
May-14
|
||||||||||||||
|
The Huxley (fka Fountain at La Brea)
|
West Hollywood, CA
|
50 | % | 187 | 46.2 | 28.8 | 75.0 |
Jul-14
|
||||||||||||||
|
The Dylan (fka Santa Monica at La Brea)
|
West Hollywood, CA
|
50 | % | 184 | 41.3 | 34.1 | 75.4 |
Oct-14
|
||||||||||||||
|
Folsom and Fifth
|
San Francisco, CA
|
55 | % | 463 | 88.5 | 161.5 | 250.0 |
Mar-15
|
||||||||||||||
|
Elkhorn
|
San Mateo, CA
|
55 | % | 197 | 24.6 | 51.5 | 76.1 |
Dec-14
|
||||||||||||||
|
Total - Joint Venture Development Projects
|
2,184 | 444.9 | 387.7 | 832.6 | ||||||||||||||||||
|
Predevelopment Projects
|
||||||||||||||||||||||
|
City Centre
|
Moorpark, CA
|
100 | % | 200 | 9.7 | - | 9.7 | |||||||||||||||
|
Epic - Phase III
|
San Jose, CA
|
55 | % (3) | 200 | 19.8 | - | 19.8 | |||||||||||||||
|
Main Street
|
Walnut Creek, CA
|
50 | % | 49 | 28.5 | - | 28.5 | |||||||||||||||
|
Other Projects
|
- | 1.6 | - | 1.6 | ||||||||||||||||||
|
Total - Predevelopment Projects
|
449 | 59.6 | - | 59.6 | ||||||||||||||||||
|
Land Held for Future Development or Sale
|
||||||||||||||||||||||
|
Palo Alto, CA
|
(4 | ) | 50 | 7.5 | - | 7.5 | ||||||||||||||||
|
Grand Total - Development Pipeline
|
2,994 | $ | 531.6 | $ | 463.9 | $ | 995.5 | |||||||||||||||
|
|
(1)
|
Includes incurred costs and estimated costs to complete these development projects.
|
|
|
(2)
|
The Company invested $1.0 million and has incurred $0.5 million of additional internal costs as part of an agreement to purchase the property upon receipt of temporary certificate of occupancy for total estimated cost of $37.6 million, which is expected in the first quarter of 2014.
|
|
|
(3)
|
The Company accounts for this joint venture predevelopment project on the equity method.
|
|
|
(4)
|
This property was sold in January 2013 for $9.1 million, representing a gain on sale of $1.5 million.
|
Redevelopment Pipeline
The Company defines redevelopment pipeline as existing properties owned or recently acquired, which have been targeted for additional investment by the Company with the expectation of increased financial returns through property improvement. During redevelopment, apartment units may not be available for rent and, as a result, may have less than stabilized operations. As of December 31, 2012, the Company had ownership interests in five redevelopment communities aggregating 1,056 apartment units with estimated redevelopment costs of $64.9 million, of which approximately $20.7 million remains to be expended.
During 2012, the Company paid off $237.7 million in secured debt including secured mortgage debt totaling $202.6 million at an average interest rate of 5.5% and $35.1 million of tax-exempt bonds. Also, the Essex Skyline secured loan was repaid for $80.0 million.
During 2012, the Company issued $200 million of unsecured bonds through private placement offerings at an average rate of 4.3%.
In August 2012, the Company issued $300.0 million of senior unsecured bonds due August 2022 with a coupon rate of 3.625% per annum.
Bank Debt
During 2012, the Company increased the capacity of the unsecured line of credit facility from $425.0 million to $500.0 million, and the facility was increased to $600.0 million in January 2013. This facility matures in December 2015 with two one-year extension options. In November, Fitch Ratings upgraded the Company’s credit rating to BBB+ with a stable outlook from BBB with a positive outlook. As a result, the pricing on the Company’s unsecured credit facility was reduced from LIBOR + 120 basis points to LIBOR + 107.5 basis points, and the pricing for the Company’s $350.0 term loan was reduced from LIBOR + 130 basis points to LIBOR + 120 basis points.
During 2012, the Company increased the size of the unsecured term loan from $200 million to $350 million. The Company entered into interest rate swap contracts for a term of five years with a notional amount totaling $300 million, which effectively converted the interest rate on $300 million of the term loan to a fixed rate. As of December 31, 2012, the Company had $350 million outstanding on the unsecured term loan outstanding at an average interest rate of 2.7%.
Equity Transactions
During 2012, the Company issued 2,404,096 million shares of common stock at an average share price of $150.26 for $357.7 million, net of fees and commissions. During the first quarter of 2013 through February 21, 2013, the Company has issued 758,644 shares of common stock at an average price of $151.70 for $114.0 million, net of fees and commissions. The Company used the net proceeds from the stock offerings to pay down debt, fund redevelopment and development pipelines, fund acquisitions, and for general corporate purposes.
ESSEX APARTMENT VALUE FUND II
Essex Apartment Value Fund II, L.P. (“Fund II”) is an investment fund formed by the Company to add value through rental growth and asset appreciation, utilizing the Company's development, redevelopment, and property and asset management capabilities.
Fund II has eight institutional investors, and the Company, with combined partner equity contributions of $265.9 million. The Company contributed $75.0 million to Fund II, which represents a 28.2% interest as general partner and limited partner, and the Company uses the equity method of accounting for its investment in Fund II. Fund II utilized leverage equal to approximately 55% upon the initial acquisition of the underlying real estate. Fund II invested in fourteen apartment communities in the Company’s targeted West Coast markets and sold seven of those communities in 2012. As of December 31, 2012, Fund II owned seven apartment communities with 1,284 units. The Company records revenue for its asset management, property management, development, and redevelopment services when earned, and promote income when realized, if Fund II exceeds certain financial return benchmarks.
In 2011, the Company entered into a 50/50 programmatic joint venture, Wesco I LLC (“Wesco I”), with an institutional partner for a total equity commitment of $300.0 million. Each partner’s equity commitment was $150.0 million, and Wesco I utilized debt as leverage equal to approximately 50% of the underlying real estate. The Company has contributed $150.0 million to Wesco I, and as of December 31, 2012, Wesco I owned nine apartment communities with 2,713 units with an aggregate carrying value of $660.5 million. Investments must meet certain criteria to qualify for inclusion in the joint venture and both partners must approve any new acquisitions and material dispositions. The Company receives asset and property management fees, and may earn a promoted interest.
During 2012, the Company entered into a 50/50 programmatic joint venture, Wesco III LLC (“Wesco III”), with an institutional partner for a total equity commitment from the parties of $120.0 million. Wesco III will utilize debt as leverage equal to approximately 50% of the underlying real estate. The Company has contributed $10.0 million to Wesco III, and provided a $26.0 million short term bridge loan to Wesco III at a rate of LIBOR + 2.5%. As of December 31, 2012, Wesco III owned one apartment community with 264 units for a purchase price of $45.6 million. Permanent secured financing is expected to be placed on the property in the first quarter of 2013. Investments must meet certain criteria to qualify for inclusion in the joint venture and both partners must approve any new acquisitions and material dispositions. The joint venture has an investment period of up to two years. The Company receives asset and property management fees, and may earn a promoted interest.
OFFICES AND EMPLOYEES
The Company is headquartered in Palo Alto, California, and has regional offices in Woodland Hills, California; Irvine, California; San Diego, California and Bellevue, Washington. As of December 31, 2012, the Company had 1,144 employees.
INSURANCE
The Company carries comprehensive liability, fire, extended coverage and rental loss insurance for each of the communities. Under comprehensive liability claims, the Company has insurance to cover claims in excess of $100,000 per incident. Under property casualty claims, the Company reinsures the primary carrier for losses up to $5.0 million deductible per incident. There are, however, certain types of extraordinary losses, such as, losses from terrorism and earthquakes, for which the Company does not have insurance. Substantially all of the communities are located in areas that are subject to earthquakes.
The Company believes it has a proactive approach to its potential earthquake losses. The Company utilizes third-party seismic consultants for its acquisitions and may perform seismic upgrades to those acquisitions that are determined to have a higher level of potential loss from an earthquake. The Company utilizes third-party loss models to help to determine its exposure. The majority of the communities are lower density garden-style apartments which may be less susceptible to material earthquake damage. The Company will continue to monitor third-party earthquake insurance pricing and conditions and may consider obtaining third-party coverage if it deems it cost effective
.
Although the Company may carry insurance for potential losses associated with its communities, employees, residents, and compliance with applicable laws, it may still incur losses due to uninsured risks, deductibles, co-payments or losses in excess of applicable insurance coverage and those losses may be material.
COMPETITION
There are numerous housing alternatives that compete with the Company’s communities in attracting residents. These include other apartment communities, and single-family homes. The communities also compete for residents with new and existing condominiums. If the demand for the Company’s communities is reduced or if competitors develop and/or acquire competing housing, rental rates and occupancy may drop which may have a material adverse affect on the Company’s financial condition and results of operations.
The Company faces competition from other real estate investment trusts, businesses and other entities in the acquisition, development and operation of apartment communities. Some competitors are larger and have greater financial resources than the Company. This competition may result in increased costs of apartment communities the Company acquires and or develops.
WORKING CAPITAL
The Company believes that cash flows generated by its operations, existing cash and marketable securities balances, availability under existing lines of credit, access to capital markets and the ability to generate cash from the disposition of real estate are sufficient to meet all of its reasonably anticipated cash needs during 2013. The timing, source and amounts of cash flows provided by financing activities and used in investing activities are sensitive to changes in interest rates and other fluctuations in the capital markets environment, which can affect its plans for acquisitions, dispositions, development and redevelopment activities.
ENVIRONMENTAL CONSIDERATIONS
See the discussion under the caption, “
The Company’s Portfolio may have unknown environmental liabilities
” in Item 1A, Risk Factors, for information concerning the potential effect of environmental regulations on its operations, which discussion under the caption “
The Company’s Portfolio may have unknown environmental liabilities
” is incorporated by reference into this Item 1.
OTHER MATTERS
Certain Policies of the Company
The Company intends to continue to operate in a manner that will not subject it to regulation under the Investment Company Act of 1940. The Company has in the past five years and may in the future (i) issue securities senior to its common stock, (ii) fund acquisition activities with borrowings under its line of credit and (iii) offer shares of common stock and/or units of limited partnership interest in the Operating Partnership or affiliated partnerships as partial consideration for property acquisitions. The Company from time to time acquires partnership interests in partnerships and joint ventures, either directly or indirectly through subsidiaries of the Company, when such entities’ underlying assets are real estate.
The Company invests primarily in apartment communities that are located in predominantly coastal markets within Southern California, the San Francisco Bay Area, and the Seattle metropolitan area. The Company currently intends to continue to invest in apartment communities in such regions. However, these practices may be reviewed and modified periodically by management.
The Company’s business, operating results, cash flows and financial condition are subject to various risks and uncertainties, including, without limitation, those set forth below, any one of which could cause the Company’s actual results to vary materially from recent results or from the Company’s anticipated future results.
The Company depends on its key personnel.
The Company’s success depends on its ability to attract and retain executive officers, senior officers and company managers. There is substantial competition for qualified personnel in the real estate industry and the loss of any of the Company’s key personnel could have an adverse effect on the Company.
Capital and credit market conditions may affect the Company’s access to sources of capital and/or the cost of capital, which could negatively affect the Company’s business, results of operations, cash flows and financial condition.
In periods when the capital and credit markets experience significant volatility, the amounts, sources and cost of capital available to the Company may be adversely affected. The Company’s strong balance sheet, the debt capacity available on the unsecured line of credit with a bank group and access to the private placement market and Fannie Mae and Freddie Mac secured debt financing provides some insulation from volatile markets. The Company has benefited from borrowing from Fannie Mae and Freddie Mac, and there are no assurances that these entities will lend to the Company in the future. To the extent that the Company’s access to capital and credit is at a higher cost than the Company has experienced in recent years (reflected in higher interest rates for debt financing or a lower stock price for equity financing) the Company’s ability to make acquisitions, develop communities, obtain new financing, and refinance existing borrowing at competitive rates could be adversely impacted. For the past two years the Company has primarily issued unsecured debt and repaid secured debt when it has matured to place less reliance on mortgage debt financing.
Debt financing has inherent risks.
At December 31, 2012, the Company had approximately $2.82 billion of indebtedness (including $692.9 million of variable rate indebtedness, of which $300.0 million is subject to interest rate swaps effectively fixing the interest rate and $187.8 million is subject to interest rate protection agreements). The Company is subject to the risks normally associated with debt financing, including the following:
|
|
·
|
cash flow may not be sufficient to meet required payments of principal and interest;
|
|
|
·
|
inability to refinance maturing indebtedness on encumbered apartment communities;
|
|
|
·
|
inability to comply with debt covenants could cause an acceleration of the maturity date; and
|
|
|
·
|
repaying debt before the scheduled maturity date could result in prepayment penalties.
|
The Company may not be able to refinance its indebtedness. The communities subject to these mortgages could be foreclosed upon or otherwise transferred to the lender. This could cause the Company to lose income and asset value. The Company may be required to refinance the debt at higher interest rates or on terms that may not be as favorable as the terms of existing indebtedness.
Debt financing of communities may result in insufficient cash flow to service debt.
Where appropriate, the Company intends to continue to use leverage to increase the rate of return on the Company’s investments and to provide for additional investments that the Company could not otherwise make. There is a risk that the cash flow from the communities will be insufficient to meet both debt payment obligations and the distribution requirements of the real estate investment trust provisions of the Internal Revenue Code of 1986, as amended. The Company may obtain additional debt financing in the future through mortgages on some or all of the communities. These mortgages may be recourse, non-recourse, or cross-collateralized.
Our ability to make payments on and to refinance our indebtedness and to fund our operations, working capital and capital expenditures, depends on our ability to generate cash in the future. To a certain extent, our cash flow is subject to general economic, industry, regional, financial, competitive, operating, legislative, regulatory and other factors, many of which are beyond our control.
As of December 31, 2012, the Company had 55 of its 139 consolidated communities encumbered by debt. With respect to the 55 communities encumbered by debt, all of them are secured by deeds of trust relating solely to those communities. The holders of this indebtedness will have rights with respect to these communities and lenders may seek foreclosure of communities which would reduce the Company’s income and net asset value.
Rising interest rates may affect the Company’s costs of capital and financing activities and results of operation.
Interest rates could increase, which could result in higher interest expense on the Company’s variable rate indebtedness or increase interest rates when refinancing maturing fixed rate debt. Prolonged interest rate increases could negatively impact the Company’s ability to make acquisitions and develop apartment communities with positive economic returns on investment and the Company’s ability to refinance existing borrowings.
Interest rate hedging arrangements may result in losses.
Periodically, the Company has entered into agreements to reduce the risks associated with increases in interest rates, and may continue to do so. Although these agreements may partially protect against rising interest rates, they also may reduce the benefits to the Company if interest rates decline. If a hedging arrangement is not indexed to the same rate as the indebtedness that is hedged, the Company may be exposed to losses to the extent that the rate governing the indebtedness and the rate governing the hedging arrangement change independently of each other. Finally, nonperformance by the other party to the hedging arrangement may subject the Company to increased credit risks. In order to minimize counterparty credit risk, the Company’s policy is to enter into hedging arrangements only with financial institutions that have a current rating of A or higher.
Bond compliance requirements may limit income from certain communities.
At December 31, 2012, the Company had approximately $201.9 million of variable rate tax-exempt financing. This tax-exempt financing provides for certain deed restrictions and restrictive covenants. The Company expects to engage in tax-exempt financings in the future. The Internal Revenue Code and rules and regulations thereunder impose various restrictions, conditions and requirements in order to allow the noteholder to exclude interest on qualified bond obligations from gross income for federal income tax purposes. The Internal Revenue Code also requires that at least 20% of apartment units be made available to residents with gross incomes that do not exceed a specified percentage, generally 50%, of the median income for the applicable family size as determined by the Housing and Urban Development Department of the federal government. Certain state and local authorities may impose additional rental restrictions. These restrictions may limit income from the tax-exempt financed communities if the Company is required to lower rental rates to attract residents who satisfy the median income test. If the Company does not reserve the required number of apartment homes for residents satisfying these income requirements, the tax-exempt status of the bonds may be terminated, the obligations under the bond documents may be accelerated and the Company may be subject to additional contractual liability.
General real estate investment risks may adversely affect property income and values.
Real estate investments are subject to a variety of risks. If the communities do not generate sufficient income to meet operating expenses, including debt service and capital expenditures, cash flow and the ability to make distributions to stockholders will be adversely affected. Income from the communities may be further adversely affected by, among other things, the following factors:
|
|
·
|
the general economic climate;
|
|
|
·
|
local economic conditions in which the communities are located, such as oversupply of housing or a reduction in demand for rental housing;
|
|
|
·
|
the attractiveness of the communities to tenants;
|
|
|
·
|
competition from other available housing; and
|
|
|
·
|
the Company’s ability to provide for adequate maintenance and insurance.
|
As leases at the communities expire, tenants may enter into new leases on terms that are less favorable to the Company. Income and real estate values also may be adversely affected by such factors as applicable laws (e.g., the Americans with Disabilities Act of 1990 and tax laws). Real estate investments are relatively illiquid and, therefore, the Company’s ability to vary its portfolio promptly in response to changes in economic or other conditions may be quite limited.
National and regional economic environments can negatively impact the Company’s operating results.
During recent years, a confluence of factors has resulted in job losses, turmoil and volatility in the capital markets, and caused a national and global recession. The Company's forecast for the national economy assumes the return of growth, with estimated gross domestic product growth of the national economy and the economies of the western states. In the event of another recession, the Company could incur reduction in rental rates, occupancy levels, property valuations and increases in operating costs such as advertising and turnover expenses.
Inflation/Deflation may affect rental rates and operating expenses.
Substantial inflationary or deflationary pressures could have a negative effect on rental rates and property operating expenses.
Acquisitions of communities may fail to meet expectations
. The Company intends to continue to acquire apartment communities. However, there are risks that acquisitions will fail to meet the Company’s expectations. The Company’s estimates of future income, expenses and the costs of improvements or redevelopment that is necessary to allow the Company to market an acquired apartment community as originally intended may prove to be inaccurate. The Company expects to finance future acquisitions, in whole or in part, under various forms of secured or unsecured financing or through the issuance of partnership units by the Operating Partnership or related partnerships or additional equity by the Company. The use of equity financing, rather than debt, for future developments or acquisitions could dilute the interest of the Company’s existing stockholders. If the Company finances new acquisitions under existing lines of credit, there is a risk that, unless the Company obtains substitute financing, the Company may not be able to secure further lines of credit for new development or such lines of credit may be not available on advantageous terms.
Development and redevelopment activities may be delayed, not completed, and/or not achieve expected results
. The Company pursues development and redevelopment projects and these projects generally require various governmental and other approvals, which have no assurance of being received. The Company’s development and redevelopment activities generally entail certain risks, including the following:
|
|
·
|
funds may be expended and management's time devoted to projects that may not be completed;
|
|
|
·
|
construction costs of a project may exceed original estimates possibly making the project economically unfeasible;
|
|
|
·
|
projects may be delayed due to, without limitation, adverse weather conditions, labor or material shortage;
|
|
|
·
|
occupancy rates and rents at a completed project may be less than anticipated; and
|
|
|
·
|
expenses at completed development projects may be higher than anticipated.
|
These risks may reduce the funds available for distribution to the Company’s stockholders. Further, the development and redevelopment of communities is also subject to the general risks associated with real estate investments. For further information regarding these risks, please see the risk factor “
General real estate investment risks may adversely affect property income and values
.”
The geographic concentration of the Company’s communities and fluctuations in local markets may adversely impact the Company’s financial condition and operating results
. The Company generated significant amounts of rental revenues for the year ended December 31, 2012, from the Company’s communities concentrated in Southern California (Los Angeles, Orange, Santa Barbara, San Diego, and Ventura counties), Northern California (the San Francisco Bay Area), and the Seattle metropolitan area. For the year ended December 31, 2012, 82% of the Company’s rental revenues were generated from communities located in California. This geographic concentration could present risks if local property market performance falls below expectations. The economic condition of these markets could affect occupancy, property revenues, and expenses, from the communities and their underlying asset values. The financial results of major local employers also may impact the cash flow and value of certain of the communities. This could have a negative impact on the Company’s financial condition and operating results, which could affect the Company’s ability to pay expected dividends to its stockholders.
Competition in the apartment community market may adversely affect operations and the rental demand for the Company’s communities.
There are numerous housing alternatives that compete with the Company’s communities in attracting residents. These include other apartment communities and single-family homes that are available for rent in the markets in which the communities are located. If the demand for the Company’s communities is reduced or if competitors develop and/or acquire competing apartment communities, rental rates may drop, which may have a material adverse effect on the Company’s financial condition and results of operations. The Company also faces competition from other real estate investment trusts, businesses and other entities in the acquisition, development and operation of apartment communities. This competition may result in an increase in costs and prices of apartment communities that the Company acquires and/or develops.
The price per share of the Company’s stock may fluctuate significantly.
The market price per share of the Company’s common stock may fluctuate significantly in response to many factors, including without limitation:
|
|
·
|
regional, national and global economic conditions;
|
|
|
·
|
actual or anticipated variations in the Company’s quarterly operating results or dividends;
|
|
|
·
|
changes in the Company’s funds from operations or earnings estimates;
|
|
|
·
|
issuances of common stock, preferred stock or convertible debt securities;
|
|
|
·
|
publication of research reports about the Company or the real estate industry;
|
|
|
·
|
the general reputation of real estate investment trusts and the attractiveness of their equity securities in comparison to other equity securities (including securities issued by other real estate based companies);
|
|
|
·
|
general stock and bond market conditions, including changes in interest rates on fixed income securities, that may lead prospective purchasers of the Company’s stock to demand a higher annual yield from dividends;
|
|
|
·
|
availability to capital markets and cost of capital;
|
|
|
·
|
a change in analyst ratings or the Company’s credit ratings;
|
|
|
·
|
terrorist activity may adversely affect the markets in which the Company’s securities trade, possibly increasing market volatility and causing erosion of business and consumer confidence and spending; and
|
|
|
·
|
Natural disasters such as earthquakes.
|
Many of the factors listed above are beyond the Company’s control. These factors may cause the market price of shares of the Company’s common stock to decline, regardless of the Company’s financial condition, results of operations, or business prospects.
The Company’s future issuances of common stock, preferred stock or convertible debt securities could adversely affect the market price of the Company’s common stock
.
In order to finance the Company’s acquisition and development activities, the Company has issued and sold common stock, preferred stock and convertible debt securities. For example, during 2012 and 2011, the Company issued and sold 2.4 million and 2.5 million shares of common stock for $357.7 million and $323.9 million, net of fees and commissions, respectively. The Company may in the future sell further shares of common stock, including pursuant to its equity distribution programs with Cantor Fitzgerald & Co., KeyBanc Capital Markets Inc., Barclays Capital Inc., BMO Capital Markets Corp., Liquidnet, Inc., and Mitsubishi UFJ Securities (USA), Inc, and Citigroup Global Markets Inc. In 2011, the Company issued 2,950,000 shares of 7.125% Series H Cumulative Redeemable Preferred Stock at a price of $25.00 per share for net proceeds of $71.2 million, net of costs and original issuance discounts.
In 2010, the Company filed a new shelf registration statement with the SEC, allowing the Company to sell an undetermined number of equity and debt securities as defined in the prospectus. Future sales of common stock, preferred stock or convertible debt securities may dilute stockholder ownership in the Company and could adversely affect the market price of the common stock.
The indenture governing the notes, which we issued in August 2012, contains restrictive covenants that limit our operating flexibility.
In August
2012, the Company, through the Operating Partnership, issued $300 million of senior notes. The Operating Partnership has also agreed to conduct an offer to exchange these senior notes for a new series of publicly registered notes (the “exchange notes”) with substantially identical terms. The indenture, which governs both the senior notes issued in August 2012 and the exchange notes, contains financial and operating covenants that, among other things,
restrict our ability to take specific actions, even if we believe them to be in our best interest, including
restrictions on our ability to:
|
·
|
consummate a merger, consolidation or sale of all or substantially all of our assets; and
|
|
·
|
incur additional secured and unsecured indebtedness.
|
In addition, the instruments governing our other unsecured indebtedness require us to meet specified financial covenants, including covenants relating to net worth, fixed charge coverage, debt service coverage, the amounts of total indebtedness and secured indebtedness, leverage and certain investment limitations. These covenants may restrict our ability to expand or fully pursue our business strategies. Our ability to comply with these provisions and those contained in the indenture governing the notes, may be affected by changes in our operating and financial performance, changes in general business and economic conditions, adverse regulatory developments or other events adversely impacting us. The breach of any of these covenants, including those contained in our indenture, could result in a default under our indebtedness, which could cause those and other obligations to become due and payable. If any of our indebtedness is accelerated, we may not be able to repay it.
A downgrade in our investment grade credit rating could materially and adversely affect our business and financial condition.
The Company plans to manage its operations to maintain its investment grade credit rating with a capital structure consistent with its current profile, but there can be no assurance that it will be able to maintain its current credit ratings. Any downgrades in terms of ratings or outlook by any of the rating agencies could have a material adverse impact on the Company’s cost and availability of capital, which could in turn have a material adverse impact on its financial condition, results of operations and liquidity.
The Company’s Chairman is involved in other real estate activities and investments, which may lead to conflicts of interest.
The Company’s Chairman, George M. Marcus is not an employee of the Company, and is involved in other real estate activities and investments, which may lead to conflicts of interest. Mr. Marcus owns interests in various other real estate-related businesses and investments. He is the Chairman of the Marcus & Millichap Company (“TMMC”), which is a holding company for certain real estate brokerage and services companies. TMMC has an interest in Pacific Urban Residential and Summerhill Homes, companies that invest in apartment communities.
Mr. Marcus has agreed not to divulge any confidential or proprietary information that may be received by him in his capacity as Chairman of the Company to any of his affiliated companies and that he will abstain his vote on any and all resolutions by the Company Board of Directors regarding any proposed acquisition and/or development of an apartment community where it appears that there may be a conflict of interest with any of his affiliated companies. Notwithstanding this agreement, Mr. Marcus and his affiliated entities may potentially compete with the Company in acquiring and/or developing apartment communities, which competition may be detrimental to the Company. In addition, due to such potential competition for real estate investments, Mr. Marcus and his affiliated entities may have a conflict of interest with the Company, which may be detrimental to the interests of the Company’s stockholders.
The influence of executive officers, directors and significant stockholders may be detrimental to holders of common stock
. As of December 31, 2012, George M. Marcus, the Chairman of the Company’s Board of Directors, wholly or partially owned 1.6 million shares of common stock (including shares issuable upon exchange of limited partnership interests in the Operating Partnership and certain other partnerships and assuming exercise of all vested options). This represents approximately 4.4% of the outstanding shares of the Company’s common stock. Mr. Marcus currently does not have majority control over the Company. However, he currently has, and likely will continue to have, significant influence with respect to the election of directors and approval or disapproval of significant corporate actions. Consequently, his influence could result in decisions that do not reflect the interests of all the Company’s stockholders.
Under the partnership agreement of the Operating Partnership, the consent of the holders of limited partnership interests is generally required for any amendment of the agreement and for certain extraordinary actions. Through their ownership of limited partnership interests and their positions with the Company, the Company’s directors and executive officers, including Mr. Marcus, have substantial influence on the Company. Consequently, their influence could result in decisions that do not reflect the interests of all stockholders.
The voting rights of preferred stock may allow holders of preferred stock to impede actions that otherwise benefit holders of common stock.
Essex currently has outstanding shares of 7.125% Series H Cumulative Redeemable Preferred Stock (“Series H Preferred Stock”). In general, the holders of the Company’s outstanding shares of Series H Preferred Stock do not have any voting rights. However, if full distributions are not made on outstanding Series H Preferred Stock for six quarterly distributions periods, the holders of Series H Preferred Stock, together with holders of other series of preferred stock upon which like voting rights have been conferred, will have the right to elect two additional directors to serve on Essex’s Board of Directors.
These voting rights continue until all distributions in arrears and distributions for the current quarterly period on the Series H Preferred Stock have been paid in full. At that time, the holders of the Series H Preferred Stock are divested of these voting rights, and the term of office of the directors so elected immediately terminates.
While any shares of the Company’s Series H Preferred Stock are outstanding, the Company may not, without the consent of the holders of two-thirds of the outstanding shares of Series H Preferred Stock:
|
|
·
|
authorize or create any class or series of stock that ranks senior to the Series H Preferred Stock with respect to the payment of dividends, rights upon liquidation, dissolution or winding-up of the Company’s business; or
|
|
|
·
|
amend, alter or repeal the provisions of the Company’s Charter, including by merger or consolidation, that would materially and adversely affect the rights of the Series H Preferred Stock; provided that in the case of a merger or consolidation, so long as the Series H Preferred Stock remains outstanding with the terms thereof materially unchanged or the holders of shares of Series H Preferred Stock receive shares of stock or other equity securities with rights, preferences, privileges and voting powers substantially similar to that of the Series H Preferred Stock, the occurrence of such merger or consolidation shall not be deemed to materially and adversely affect the rights of the holders of the Series H Preferred Stock.
|
These voting rights of the holders of the Series H Preferred Stock and of other preferred stock may allow such holders to impede or veto actions that would otherwise benefit the holders of the Company’s common stock.
The Maryland business combination law may not allow certain transactions between the Company and its affiliates to proceed without compliance with such law
.
Under Maryland law, “business combinations” between a Maryland corporation and an interested stockholder or an affiliate of an interested stockholder are prohibited for five years after the most recent date on which the interested stockholder becomes an interested stockholder. These business combinations include a merger, consolidation, share exchange, or, in circumstances specified in the statute, an asset transfer or issuance or reclassification of equity securities. An interested stockholder is defined as any person (and certain affiliates of such person) who beneficially owns ten percent or more of the voting power of the then-outstanding voting stock. The law also requires a supermajority stockholder vote for such transactions. This means that the transaction must be approved by at least:
|
|
·
|
80% of the votes entitled to be cast by holders of outstanding voting shares; and
|
|
|
·
|
Two-thirds of the votes entitled to be cast by holders of outstanding voting shares other than shares held by the interested stockholder with whom the business combination is to be effected.
|
The statute permits various exemptions from its provisions, including business combinations that are exempted by the board of directors prior to the time that the interested stockholder becomes an interested stockholder. These voting provisions do not apply if the stockholders receive a minimum price, as defined under Maryland law. As permitted by the statute, the Board of Directors of the Company irrevocably has elected to exempt any business combination by the Company, George M. Marcus, who is the chairman of the Company, and TMMC or any entity owned or controlled by Mr. Marcus and TMMC. Consequently, the five-year prohibition and supermajority vote requirement described above will not apply to any business combination between the Company, Mr. Marcus, or TMMC. As a result, the Company may in the future enter into business combinations with Mr. Marcus and TMMC, without compliance with the supermajority vote requirements and other provisions of the Maryland General Corporation Law.
Anti-takeover provisions contained in the Operating Partnership agreement, charter, bylaws, and certain provisions of Maryland law could delay, defer or prevent a change in control
.
While the Company is the sole general partner of the Operating Partnership, and generally has full and exclusive responsibility and discretion in the management and control of the Operating Partnership, certain provisions of the Operating Partnership agreement place limitations on the Company’s ability to act with respect to the Operating Partnership. Such limitations could delay, defer or prevent a transaction or a change in control that might involve a premium price for the Company’s stock or otherwise be in the best interest of the stockholders or that could otherwise adversely affect the interest of the Company’s stockholders. The partnership agreement provides that if the limited partners own at least 5% of the outstanding units of partnership interest in the Operating Partnership, the Company cannot, without first obtaining the consent of a majority-in-interest of the limited partners in the Operating Partnership, transfer all or any portion of the Company’s general partner interest in the Operating Partnership to another entity. Such limitations on the Company’s ability to act may result in the Company’s being precluded from taking action that the Board of Directors believes is in the best interests of the Company’s stockholders. As of December 31, 2012, the limited partners held or controlled approximately 5.5% of the outstanding units of partnership interest in the Operating Partnership, allowing such actions to be blocked by the limited partners.
The Company’s Charter authorizes the issuance of additional shares of common stock or preferred stock and the setting of the preferences, rights and other terms of such preferred stock without the approval of the holders of the common stock. The Company may establish one or more series of preferred stock that could delay defer or prevent a transaction or a change in control. Such a transaction might involve a premium price for the Company’s stock or otherwise be in the best interests of the holders of common stock. Also, such a class of preferred stock could have dividend, voting or other rights that could adversely affect the interest of holders of common stock.
The Company’s Charter contains other provisions that may delay, defer or prevent a transaction or a change in control that might be in the best interest of the Company’s stockholders. The Charter contains ownership provisions limiting the transferability and ownership of shares of capital stock, which may have the effect of delaying, deferring or preventing a transaction or a change in control. For example, subject to receiving an exemption from the Board of Directors, potential acquirers may not purchase more than 6% in value of the stock (other than qualified pension trusts which can acquire 9.9%). This may discourage tender offers that may be attractive to the holders of common stock and limit the opportunity for stockholders to receive a premium for their shares of common stock.
The Maryland General Corporations Law restricts the voting rights of shares deemed to be “control shares.” Under the Maryland General Corporations Law, “control shares” are those which, when aggregated with any other shares held by the acquirer, entitle the acquirer to exercise voting power within specified ranges. Although the Bylaws exempt the Company from the control share provisions of the Maryland General Corporations Law, the Board of Directors may amend or eliminate the provisions of the Bylaws at any time in the future. Moreover, any such amendment or elimination of such provision of the Bylaws may result in the application of the control share provisions of the Maryland General Corporations Law not only to control shares which may be acquired in the future, but also to control shares previously acquired. If the provisions of the Bylaws are amended or eliminated, the control share provisions of the Maryland General Corporations Law could delay, defer or prevent a transaction or change in control that might involve a premium price for the stock or otherwise be in the best interests of the Company’s stockholders.
The Company’s Charter and bylaws also contain other provisions that may impede various actions by stockholders without approval of the Company’s board of directors, which in turn may delay, defer or prevent a transaction, including a change in control. Those provisions include:
|
|
·
|
the Company’s directors have terms of office of three years and the board of directors is divided into three classes with staggered terms; as a result, less than a majority of directors are up for re-election to the board in any one year;
|
|
|
·
|
directors may be removed, without cause, only upon a two-thirds vote of stockholders, and with cause, only upon a majority vote of stockholders;
|
|
|
·
|
the Company’s board can fix the number of directors and fill vacant directorships upon the vote of a majority of the directors;
|
|
|
·
|
stockholders must give advance notice to nominate directors or propose business for consideration at a stockholders’ meeting; and
|
|
|
·
|
for stockholders to call a special meeting, the meeting must be requested by not less than a majority of all the votes entitled to be cast at the meeting.
|
The Company’s joint ventures and joint ownership of communities and partial interests in corporations and limited partnerships could limit the Company’s ability to control such communities and partial interests
.
Instead of purchasing and developing apartment communities directly, the Company has invested and may continue to invest in joint ventures. Joint venture partners often have shared control over the development and operation of the joint venture assets. Therefore, it is possible that a joint venture partner in an investment might become bankrupt, or have economic or business interests or goals that are inconsistent with the Company’s business interests or goals, or be in a position to take action contrary to the Company’s instructions or requests, or its policies or objectives. Consequently, a joint venture partners’ actions might subject property owned by the joint venture to additional risk. Although the Company seeks to maintain sufficient influence over any joint venture to achieve its objectives, the Company may be unable to take action without its joint venture partners’ approval, or joint venture partners could take actions binding on the joint venture without its consent. Should a joint venture partner become bankrupt, the Company could become liable for such partner’s share of joint venture liabilities. In some instances, the Company and the joint venture partner may each have the right to trigger a buy-sell arrangement, which could cause the Company to sell its interest, or acquire a partner’s interest, at a time when the Company otherwise would have not have initiated such a transaction.
From time to time, the Company, through the Operating Partnership, invests in corporations, limited partnerships, limited liability companies or other entities that have been formed for the purpose of acquiring, developing, financing, or managing real property. In certain circumstances, the Operating Partnership’s interest in a particular entity may be less than a majority of the outstanding voting interests of that entity. Therefore, the Operating Partnership’s ability to control the daily operations of such an entity may be limited. Furthermore, the Operating Partnership may not have the power to remove a majority of the board of directors (in the case of a corporation) or the general partner or partners (in the case of a limited partnership) of such an entity in the event that its operations conflict with the Operating Partnership’s objectives. The Operating Partnership may not be able to dispose of its interests in such an entity. In the event that such an entity becomes insolvent, the Operating Partnership may lose up to its entire investment in and any advances to the entity. The Company may also incur losses if any guarantees were made by the Company. The Company has, and in the future may, enter into transactions that could require the Company to pay the tax liabilities of partners, which contribute assets into joint ventures or the Operating Partnership, in the event that certain taxable events, which are within the Company’s control, occur. Although the Company plans to hold the contributed assets or defer recognition of gain on sale pursuant to the like-kind exchange rules under Section 1031 of the Internal Revenue Code, the Company can provide no assurance that the Company will be able to do so and if such tax liabilities were incurred they can expect to have a material impact on its financial position.
There are risks that Fund II may operate in ways that may adversely impact the Company’s interests.
The Company is the general partner of Essex Apartment Value Fund II, L.P. (“Fund II”), and with Fund II there are the following risks:
|
|
·
|
the Company’s partners in Fund II might remove the Company as the general partner of Fund II;
|
|
|
·
|
the Company’s partners in Fund II might have economic or business interests or goals that are inconsistent with the Company’s business interests or goals; or
|
|
|
·
|
the Company’s partners in Fund II might fail to approve decisions regarding Fund II that are in the Company’s best interest.
|
Investments in mortgages and other real estate securities could affect the Company’s ability to make distributions to stockholders
. The Company may invest in securities related to real estate, which could adversely affect the Company’s ability to make distributions to stockholders. The Company may purchase securities issued by entities which own real estate and invest in mortgages or unsecured debt obligations. These mortgages may be first, second or third mortgages that may or may not be insured or otherwise guaranteed. In general, investments in mortgages include the following risks:
|
·
|
that the value of mortgaged property may be less than the amounts owed, causing realized or unrealized losses;
|
|
|
·
|
the borrower may not pay indebtedness under the mortgage when due, requiring the Company to foreclose, and the amount recovered in connection with the foreclosure may be less than the amount owed;
|
|
|
·
|
that interest rates payable on the mortgages may be lower than the Company’s cost of funds; and
|
|
|
·
|
in the case of junior mortgages, that foreclosure of a senior mortgage could eliminate the junior mortgage.
|
If any of the above were to occur, cash flows from operations and the Company’s ability to make expected dividends to stockholders could be adversely affected.
Compliance with laws benefiting disabled persons may require the Company to make significant unanticipated expenditures or impact the Company’s investment strategy.
A number of federal, state and local laws (including the Americans with Disabilities Act) and regulations exist that may require modifications to existing buildings or restrict certain renovations by requiring improved access to such buildings by disabled persons and may require other structural features which add to the cost of buildings under construction. Legislation or regulations adopted in the future may impose further burdens or restrictions on the Company with respect to improved access by disabled persons. The costs of compliance with these laws and regulations may be substantial.
The Company’s Portfolio may have unknown environmental liabilities.
Under various federal, state and local laws, ordinances and regulations, an owner or operator of real estate is liable for the costs of removal or remediation of certain hazardous or toxic substances on, in, to or migrating from such property. Such laws often impose liability without regard as to whether the owner or operator knew of, or was responsible for, the presence of such hazardous or toxic substances. The presence of such substances, or the failure to properly remediate such substances, may adversely affect the owner’s or operator’s ability to sell or rent such property or to borrow using such property as collateral. Persons exposed to such substances, either through soil vapor or ingestion of the substances may claim personal injury damages. Persons who arrange for the disposal or treatment of hazardous or toxic substances or wastes also may be liable for the costs of removal or remediation of such substances at the disposal or treatment facility to which such substances or wastes were sent, whether or not such facility is owned or operated by such person. Certain environmental laws impose liability for release of asbestos-containing materials (“ACMs”) into the air, and third parties may seek recovery from owners or operators of apartment communities for personal injury associated with ACMs. In connection with the ownership (direct or indirect), operation, management and development of apartment communities, the Company could be considered an owner or operator of such properties or as having arranged for the disposal or treatment of hazardous or toxic substances and, therefore, may be potentially liable for removal or remediation costs, as well as certain other costs, including governmental fines and costs related to injuries of persons and property.
Investments in real property create a potential for environmental liabilities on the part of the owner of such real property. The Company carries certain limited insurance coverage for this type of environmental risk. The Company has conducted environmental studies which revealed the presence of groundwater contamination at certain communities. Such contamination at certain of these apartment communities was reported to have migrated on-site from adjacent industrial manufacturing operations. The former industrial users of the communities were identified as the source of contamination. The environmental studies noted that certain communities are located adjacent to or possibly down gradient from sites with known groundwater contamination, the lateral limits of which may extend onto such apartment communities. The environmental studies also noted that at certain of these apartment communities, contamination existed because of the presence of underground fuel storage tanks, which have been removed. In general, in connection with the ownership, operation, financing, management and development of apartment communities, the Company may be potentially liable for removal or clean-up costs, as well as certain other costs and environmental liabilities. The Company may also be subject to governmental fines and costs related to injuries to persons and property.
There have been an increasing number of lawsuits against owners and managers of apartment communities alleging personal injury and property damage caused by the presence of mold in residential real estate. Some of these lawsuits have resulted in substantial monetary judgments or settlements. The Company has been sued for mold related matters and has settled some, but not all, of such matters. Insurance carriers have reacted to mold related liability awards by excluding mold related claims from standard policies and pricing mold endorsements at prohibitively high rates. The Company has, however, purchased pollution liability insurance, which includes some coverage for mold. The Company has adopted policies for promptly addressing and resolving reports of mold when it is detected, and to minimize any impact mold might have on residents of the property. The Company believes its mold policies and proactive response to address any known existence, reduces its risk of loss from these cases. There can be no assurance that the Company has identified and responded to all mold occurrences. Liabilities resulting from such mold related matters are not expected to have a material adverse effect on the Company’s financial condition, results of operations or cash flows. As of December 31, 2012, potential liabilities for mold and other environmental liabilities are not considered probable or the loss cannot be quantified or estimated.
California has enacted legislation commonly referred to as “Proposition 65” requiring that “clear and reasonable” warnings be given to consumers who are exposed to chemicals known to the State of California to cause cancer or reproductive toxicity, including tobacco smoke. Although the Company has sought to comply with Proposition 65 requirements, the Company cannot assure you that the Company will not be adversely affected by litigation relating to Proposition 65.
Methane gas is a naturally-occurring gas that is commonly found below the surface in several areas, particularly in the Southern California coastal areas. Methane is a non-toxic gas, but can be ignitable in confined spaces. Although naturally-occurring, methane gas is not regulated at the state or federal level, however some local governments, such as the County of Los Angeles, have imposed requirements that new buildings install detection systems in areas where methane gas is known to be located. Methane gas is also associated with certain industrial activities, such as former municipal waste landfills. Radon is also a naturally-occurring gas that is found below the surface. The Company cannot assure you that it will not be adversely affected by costs related to its compliance with methane or radon gas related requirements or litigation costs related to methane or radon gas.
The Company has almost no indemnification agreements from third parties for potential environmental clean-up costs at its communities. The Company has no way of determining at this time the magnitude of any potential liability to which it may be subject arising out of unknown environmental conditions or violations with respect to communities formerly owned by the Company. No assurance can be given that existing environmental studies with respect to any of the communities reveal all environmental liabilities, that any prior owner or operator of an apartment community did not create any material environmental condition not known to the Company, or that a material environmental condition does not exist as to any one or more of the communities. The Company has limited insurance coverage for the types of environmental liabilities described above.
The Company may incur general uninsured losses.
The Company carries comprehensive liability, fire, extended coverage and rental loss insurance for each of the communities. There are, however, certain types of extraordinary losses, such as, for example, losses from terrorism or earthquakes, for which the Company does not have insurance coverage. Substantially all of the communities are located in areas that are subject to earthquake activity. In January 2007, the Company canceled its then existing earthquake policy and established a wholly owned insurance subsidiary, Pacific Western Insurance LLC (“PWI”). Through PWI, the Company is self-insured as it relates to earthquake related losses. Additionally, since January 2008, PWI has provided property and casualty insurance coverage for the first $5.0 million of the Company’s property level insurance claims per incident.
Although the Company may carry insurance for potential losses associated with its communities, employees, residents, and compliance with applicable laws, it may still incur losses due to uninsured risks, deductibles, co-payments or losses in excess of applicable insurance coverage and those losses may be material. In the event of a substantial loss, insurance coverage may not be able to cover the full replacement cost of the Company’s lost investment, or the insurance carrier may become insolvent and not be able to cover the full amount of the insured losses. Changes in building codes and ordinances, environmental considerations and other factors might also affect the Company’s ability to replace or renovate an apartment community after it has been damaged or destroyed.
Changes in real estate tax and other laws may adversely affect the Company’s results of operations
. Generally, the Company does not directly pass through costs resulting from changes in real estate tax laws to residential property tenants. The Company also does not generally pass through increases in income, service or other taxes, to tenants under leases. These costs may adversely affect funds from operations and the ability to make distributions to stockholders. Similarly, compliance with changes in (i) laws increasing the potential liability for environmental conditions existing on apartment communities or the restrictions on discharges or other conditions or (ii) rent control or rent stabilization laws or other laws regulating housing may result in significant unanticipated decrease in revenue or increase in expenditures, which would adversely affect funds from operations and the ability to make distributions to stockholders.
Adverse changes in laws may affect our liability relating to our properties and our operations.
Increases in real estate taxes and income, service and transfer taxes cannot always be passed through to residents or users in the form of higher rents, and may adversely affect our cash available for distribution and our ability to make distributions to our shareholders and pay amounts due on our debt. Similarly, changes in laws increasing the potential liability for environmental conditions existing on properties or increasing the restrictions on discharges or other conditions, as well as changes in laws affecting development, construction and safety requirements, may result in significant unanticipated expenditures, which could have a material adverse effect on us and our ability to make distributions to our shareholders and pay amounts due on our debt. In addition, future enactment of rent control or rent stabilization laws or other laws regulating multifamily housing may reduce rental revenues or increase operating costs.
Changes in the Company’s financing policy may lead to higher levels of indebtedness.
The Company has adopted a policy of maintaining a limit on debt financing consistent with the existing covenants required to maintain the Company’s unsecured line of credit bank facility, unsecured debt and senior unsecured bonds. The Company’s organizational documents do not limit the amount or percentage of indebtedness that may be incurred. If the Company changed this policy, the Company could incur more debt, resulting in an increased risk of default on the Company’s obligations and the obligations of the Operating Partnership, and an increase in debt service requirements that could adversely affect the Company’s financial condition and results of operations. Such increased debt could exceed the underlying value of the communities.
The Company is subject to various tax risks
. The Company has elected to be taxed as a REIT under the Internal Revenue Code. The Company’s qualification as a REIT requires it to satisfy numerous requirements (some on an annual and quarterly basis) established under highly technical and complex Internal Revenue Code provisions for which there are only limited judicial or administrative interpretations, and involves the determination of various factual matters and circumstances not entirely within the Company’s control. Although the Company intends that its current organization and method of operation enables it to qualify as a REIT, it cannot assure you that it so qualifies or that it will be able to remain so qualified in the future. Future legislation, new regulations, administrative interpretations or court decisions (any of which could have retroactive effect) could adversely affect the Company’s ability to qualify as a REIT or adversely affect the Company’s stockholders. If the Company fails to qualify as a REIT in any taxable year, the Company would be subject to U.S. federal income tax (including any applicable alternative minimum tax) on the Company’s taxable income at corporate rates, and the Company would not be allowed to deduct dividends paid to its shareholders in computing its taxable income. The Company may also be disqualified from treatment as a REIT for the four taxable years following the year in which the Company failed to qualify. The additional tax liability would reduce its net earnings available for investment or distribution to stockholders, and the Company would no longer be required to make distributions to its stockholders. Even if the Company continues to qualify as a REIT, it will continue to be subject to certain federal, state and local taxes on the Company’s income and property.
The Company has established several taxable REIT subsidiaries (“TRSs”). Despite its qualification as a REIT, the Company’s TRSs must pay U.S. federal income tax on their taxable income. While the Company will attempt to ensure that its dealings with its TRSs do not adversely affect its REIT qualification, it cannot provide assurance that it will successfully achieve that result. Furthermore, it may be subject to a 100% penalty tax, or its TRSs may be denied deductions, to the extent its dealings with its TRSs are not deemed to be arm’s length in nature. No assurances can be given that the Company’s dealings with its TRSs will be arm’s length in nature.
From time to time, the Company may transfer or otherwise dispose of some of its Properties. Under the Internal Revenue Code, any gain resulting from transfers of Properties that the Company holds as inventory or primarily for sale to customers in the ordinary course of business would be treated as income from a prohibited transaction subject to a 100% penalty tax. Since the Company acquires properties for investment purposes, it does not believe that its occasional transfers or disposals of property are prohibited transactions. However, whether property is held for investment purposes is a question of fact that depends on all the facts and circumstances surrounding the particular transaction. The Internal Revenue Service may contend that certain transfers or disposals of properties by the Company are prohibited transactions. If the Internal Revenue Service were to argue successfully that a transfer or disposition of property constituted a prohibited transaction, then the Company would be required to pay a 100% penalty tax on any gain allocable to it from the prohibited transaction and the Company’s ability to retain future gains on real property sales may be jeopardized. Income from a prohibited transaction might adversely affect the Company’s ability to satisfy the income tests for qualification as a REIT for U.S. federal income tax purposes. Therefore, no assurances can be given that the Company will be able to satisfy the income tests for qualification as a REIT.
The U.S. federal tax rate on certain corporate dividends paid to certain individuals and other non-corporate taxpayers is at a reduced rate of 15%; a rate of 20% applies to certain high-income individual taxpayers. Dividends paid by REITs to individuals and other non-corporate stockholders are not eligible for the reduced 15% dividend rates. This may cause investors to view REIT investments to be less attractive than investments in non-REIT corporations, which in turn may adversely affect the value of stock in REITs, including the Company’s stock.
None
.
The Company’s Portfolio as of December 31, 2012 (including communities owned by unconsolidated joint ventures, but excluding communities underlying preferred equity investments) was comprised of 163 apartment communities (comprising 33,468 apartment units), of which 15,444 units are located in Southern California, 10,189 units are located in the San Francisco Bay Area, and 7,835 units are located in the Seattle metropolitan area. The Company’s apartment communities accounted for 98.4% of the Company’s revenues for the year ended December 31, 2012.
Occupancy Rates
The Company’s average financial occupancies for the Company’s stabilized communities or “2012/2011 Same-Properties” (stabilized properties consolidated by the Company for the years ended December 31, 2012 and 2011) was unchanged at 96.3% for the years ended December 31, 2012, and 2011. Financial occupancy is defined as the percentage resulting from dividing actual rental revenue by total possible rental revenue. When calculating actual rents for occupied units and market rents for vacant units, delinquencies and concessions are not taken into account. Total possible rental revenue represents the value of all apartment units, with occupied units valued at contractual rental rates pursuant to leases and vacant units valued at estimated market rents. The Company believes that financial occupancy is a meaningful measure of occupancy because it considers the value of each vacant unit at its estimated market rate. Financial occupancy may not completely reflect short-term trends in physical occupancy and financial occupancy rates as disclosed by other REITs may not be comparable to the Company’s calculation of financial occupancy. Market rates are determined using a variety of factors such as effective rental rates at the property based on recently signed leases and asking rates for comparable properties in the market. The recently signed effective rates at the property are used as the starting point in the determination of the market rates of vacant units. The Company then increases or decreases these rates based on the supply and demand in the apartment community’s market. The Company will check the reasonableness of these rents based on its position within the market and compare the rents against the asking rents by comparable properties in the market.
For communities that are development properties in lease-up without stabilized occupancy figures, the Company believes the physical occupancy rate is the appropriate performance metric. While a community is in the lease-up phase, the Company’s primary motivation is to stabilize the property which may entail the use of rent concessions and other incentives, and thus financial occupancy which is based on contractual revenue is not considered the best metric to quantify occupancy.
Communities
The Company’s communities are primarily suburban garden-style communities and town homes comprising multiple clusters of two and three-story buildings situated on three to fifteen acres of land. As of December 31, 2012, the Company’s communities include 117 garden-style, 43 mid-rise, and 3 high-rise communities. The communities have an average of approximately 206 units, with a mix of studio, one, two and some three-bedroom units. A wide variety of amenities are available at the Company’s communities, including covered parking, fireplaces, swimming pools, clubhouses with fitness facilities, volleyball and playground areas and tennis courts.
The Company hires, trains and supervises on-site service and maintenance personnel. The Company believes that the following primary factors enhance the Company’s ability to retain tenants:
|
|
·
|
located near employment centers;
|
|
●
|
attractive communities that are well maintained; and
|
|
●
|
proactive customer service approach.
|
Commercial Buildings
The Company’s corporate headquarters is located in two office buildings with approximately 31,900 square feet located at 925/935 East Meadow Drive, Palo Alto, California. The Company owns an office building with approximately 110,000 square feet located in Irvine, California, of which the Company occupies approximately 7,150 square feet at December 31, 2012. The Company owns Essex-Hollywood, a 35,000 square foot commercial building as a future development site that is currently 100% leased as a production studio.
During 2011, the Company purchased a retail site in Santa Clara for $20.6 million. The plans for this project are to entitle the site for 494 apartment units. The site is currently improved with a 139,000 square foot retail space that is 100% leased.
The following tables describe the Company’s Portfolio as of December 31, 2012. The first table describes the Company’s communities and the second table describes the Company’s other real estate assets. (See Note 7 of the Company’s consolidated financial statements for more information about the Company’s secured mortgage debt and Schedule III for a list of secured mortgage loans related to the Company’s Portfolio.)
|
Rentable
|
||||||||||||||||||||||
|
Square
|
Year
|
Year
|
||||||||||||||||||||
|
Communities (1)
|
Location
|
Units
|
Footage
|
Built
|
Acquired
|
Occupancy(2)
|
||||||||||||||||
|
Southern California
|
||||||||||||||||||||||
|
Alpine Village
|
Alpine, CA
|
301 | 254,400 | 1971 | 2002 | 97 | % | |||||||||||||||
|
Anavia
|
Anaheim, CA
|
250 | 312,343 | 2009 | 2010 | 95 | % | |||||||||||||||
|
Barkley, The(3)(4)
|
Anaheim, CA
|
161 | 139,800 | 1984 | 2000 | 97 | % | |||||||||||||||
|
Bonita Cedars
|
Bonita, CA
|
120 | 120,800 | 1983 | 2002 | 96 | % | |||||||||||||||
|
Camarillo Oaks
|
Camarillo, CA
|
564 | 459,000 | 1985 | 1996 | 96 | % | |||||||||||||||
|
Camino Ruiz Square
|
Camarillo, CA
|
160 | 105,448 | 1990 | 2006 | 97 | % | |||||||||||||||
|
Cambridge
|
Chula Vista, CA
|
40 | 22,100 | 1965 | 2002 | 95 | % | |||||||||||||||
|
Mesa Village
|
Clairemont, CA
|
133 | 43,600 | 1963 | 2002 | 97 | % | |||||||||||||||
|
Regency at Encino
|
Encino, CA
|
75 | 78,487 | 1989 | 2009 | 97 | % | |||||||||||||||
|
Valley Park(4)
|
Fountain Valley, CA
|
160 | 169,700 | 1969 | 2001 | 97 | % | |||||||||||||||
|
Capri at Sunny Hills(4)
|
Fullerton, CA
|
100 | 128,100 | 1961 | 2001 | 95 | % | |||||||||||||||
|
Haver Hill(5)
|
Fullerton, CA
|
264 | 224,130 | 1973 | 2012 | 96 | % | |||||||||||||||
|
Wilshire Promenade
|
Fullerton, CA
|
149 | 128,000 | 1992 | 1997 | 96 | % | |||||||||||||||
|
Montejo(4)
|
Garden Grove, CA
|
124 | 103,200 | 1974 | 2001 | 97 | % | |||||||||||||||
|
CBC Apartments
|
Goleta, CA
|
148 | 91,538 | 1962 | 2006 | 95 | % | |||||||||||||||
|
Sweeps, The (Chimney Sweep Apartments)
|
Goleta, CA
|
91 | 88,370 | 1967 | 2006 | 84 | % | |||||||||||||||
|
416 on Broadway
|
Glendale, CA
|
115 | 126,782 | 2009 | 2010 | 95 | % | |||||||||||||||
|
Hampton Court
|
Glendale, CA
|
83 | 71,500 | 1974 | 1999 | 97 | % | |||||||||||||||
|
Hampton Place
|
Glendale, CA
|
132 | 141,500 | 1970 | 1999 | 97 | % | |||||||||||||||
|
Devonshire
|
Hemet, CA
|
276 | 207,200 | 1988 | 2002 | 92 | % | |||||||||||||||
|
Huntington Breakers
|
Huntington Beach, CA
|
342 | 241,700 | 1984 | 1997 | 95 | % | |||||||||||||||
|
The Huntington
|
Huntington Beach, CA
|
276 | 202,256 | 1975 | 2012 | 97 | % | |||||||||||||||
|
Axis 2300
|
Irvine, CA
|
115 | 170,714 | 2010 | (6) | 2010 | 95 | % | ||||||||||||||
|
Hillsborough Park
|
La Habra, CA
|
235 | 215,500 | 1999 | 1999 | 96 | % | |||||||||||||||
|
Trabuco Villas
|
Lake Forest, CA
|
132 | 131,000 | 1985 | 1997 | 96 | % | |||||||||||||||
|
Madrid Apartments(7)
|
Mission Viejo, CA
|
230 | 228,099 | 2000 | 2012 | 97 | % | |||||||||||||||
|
Marbrisa
|
Long Beach, CA
|
202 | 122,800 | 1987 | 2002 | 97 | % | |||||||||||||||
|
Pathways
|
Long Beach, CA
|
296 | 197,700 | 1975 | (8) | 1991 | 96 | % | ||||||||||||||
|
Belmont Station
|
Los Angeles, CA
|
275 | 225,000 | 2008 | 2008 | 96 | % | |||||||||||||||
|
Bellerive
|
Los Angeles, CA
|
63 | 79,296 | 2011 | 2011 | 98 | % | |||||||||||||||
|
Bunker Hill
|
Los Angeles, CA
|
456 | 346,600 | 1968 | 1998 | 96 | % | |||||||||||||||
|
Cochran Apartments
|
Los Angeles, CA
|
58 | 51,400 | 1989 | 1998 | 96 | % | |||||||||||||||
|
Kings Road
|
Los Angeles, CA
|
196 | 132,100 | 1979 | 1997 | 96 | % | |||||||||||||||
|
Marbella, The
|
Los Angeles, CA
|
60 | 50,108 | 1991 | 2005 | 96 | % | |||||||||||||||
|
Pacific Electric Lofts(7)
|
Los Angeles, CA
|
314 | 277,980 | 2006 | 2012 | 100 | % | |||||||||||||||
|
Park Catalina
|
Los Angeles, CA
|
90 | 72,864 | 2002 | 2012 | 98 | % | |||||||||||||||
|
Park Place
|
Los Angeles, CA
|
60 | 48,000 | 1988 | 1997 | 96 | % | |||||||||||||||
|
Renaissance, The(9)
|
Los Angeles, CA
|
169 | 154,268 | 1990 | (10) | 2006 | 98 | % | ||||||||||||||
|
Santee Court
|
Los Angeles, CA
|
165 | 132,040 | 2004 | 2010 | 97 | % | |||||||||||||||
|
Santee Village
|
Los Angeles, CA
|
73 | 69,817 | 2011 | 2010 | 97 | % | |||||||||||||||
|
Windsor Court
|
Los Angeles, CA
|
58 | 46,600 | 1988 | 1997 | 96 | % | |||||||||||||||
|
Marina City Club(11)
|
Marina Del Rey, CA
|
101 | 127,200 | 1971 | 2004 | 97 | % | |||||||||||||||
|
Mirabella
|
Marina Del Rey, CA
|
188 | 176,800 | 2000 | 2000 | 96 | % | |||||||||||||||
|
Mira Monte
|
Mira Mesa, CA
|
355 | 262,600 | 1982 | 2002 | 97 | % | |||||||||||||||
|
Hillcrest Park
|
Newbury Park, CA
|
608 | 521,900 | 1973 | 1998 | 97 | % | |||||||||||||||
|
Fairways(12)
|
Newport Beach, CA
|
74 | 107,100 | 1972 | 1999 | 95 | % | |||||||||||||||
|
Muse
|
North Hollywood, CA
|
152 | 135,292 | 2011 | 2011 | 96 | % | |||||||||||||||
|
Country Villas
|
Oceanside, CA
|
180 | 179,700 | 1976 | 2002 | 96 | % | |||||||||||||||
|
Mission Hills
|
Oceanside, CA
|
282 | 244,000 | 1984 | 2005 | 97 | % | |||||||||||||||
|
Mariners Place
|
Oxnard, CA
|
105 | 77,200 | 1987 | 2000 | 98 | % | |||||||||||||||
|
Monterey Villas
|
Oxnard, CA
|
122 | 122,100 | 1974 | 1997 | 97 | % | |||||||||||||||
|
Tierra Vista
|
Oxnard, CA
|
404 | 387,100 | 2001 | 2001 | 96 | % | |||||||||||||||
|
Arbors Parc Rose(7)
|
Oxnard, CA
|
373 | 503,196 | 2001 | 2011 | 96 | % | |||||||||||||||
|
Monterra del Mar
|
Pasadena, CA
|
123 | 74,400 | 1972 | 1997 | 97 | % | |||||||||||||||
|
Monterra del Rey
|
Pasadena, CA
|
84 | 73,100 | 1972 | 1999 | 97 | % | |||||||||||||||
|
Monterra del Sol
|
Pasadena, CA
|
85 | 69,200 | 1972 | 1999 | 97 | % | |||||||||||||||
|
Villa Angelina(4)
|
Placentia, CA
|
256 | 217,600 | 1970 | 2001 | 97 | % | |||||||||||||||
|
Rentable
|
||||||||||||||||||||||
|
Square
|
Year
|
Year
|
||||||||||||||||||||
|
Communities (1)
|
Location
|
Units
|
Footage
|
Built
|
Acquired
|
Occupancy(2)
|
||||||||||||||||
|
Southern California (continued)
|
||||||||||||||||||||||
|
Fountain Park
|
Playa Vista, CA
|
705 | 608,900 | 2002 | 2004 | 97 | % | |||||||||||||||
|
Highridge(4)
|
Rancho Palos Verdes, CA
|
255 | 290,200 | 1972 | (13) | 1997 | 94 | % | ||||||||||||||
|
CentrePointe (The Bluffs II)
|
San Diego, CA
|
224 | 126,700 | 1974 | (14) | 1997 | 94 | % | ||||||||||||||
|
Summit Park
|
San Diego, CA
|
300 | 229,400 | 1972 | 2002 | 96 | % | |||||||||||||||
|
Vista Capri - North
|
San Diego, CA
|
106 | 51,800 | 1975 | 2002 | 97 | % | |||||||||||||||
|
Brentwood(4)
|
Santa Ana, CA
|
140 | 154,800 | 1970 | 2001 | 98 | % | |||||||||||||||
|
Essex Skyline at MacArthur Place (15)
|
Santa Ana, CA
|
349 | 512,791 | 2008 | (6) | 2010 | 95 | % | ||||||||||||||
|
Fairhaven (Treehouse)(4)
|
Santa Ana, CA
|
164 | 135,700 | 1970 | 2001 | 96 | % | |||||||||||||||
|
Hope Ranch Collection
|
Santa Barbara, CA
|
108 | 126,700 |
1965 &73
|
2007 | 98 | % | |||||||||||||||
|
Hidden Valley(16)
|
Simi Valley, CA
|
324 | 310,900 | 2004 | 2004 | 96 | % | |||||||||||||||
|
Meadowood
|
Simi Valley, CA
|
320 | 264,500 | 1986 | 1996 | 96 | % | |||||||||||||||
|
Shadow Point
|
Spring Valley, CA
|
172 | 131,200 | 1983 | 2002 | 96 | % | |||||||||||||||
|
Coldwater Canyon
|
Studio City, CA
|
39 | 34,125 | 1979 | 2007 | 96 | % | |||||||||||||||
|
Allegro
|
Valley Village, CA
|
97 | 127,812 | 2010 | (6) | 2010 | 97 | % | ||||||||||||||
|
Lofts at Pinehurst, The
|
Ventura, CA
|
118 | 71,100 | 1971 | 1997 | 96 | % | |||||||||||||||
|
Pinehurst(17
|
Ventura, CA
|
28 | 21,200 | 1973 | 2004 | 99 | % | |||||||||||||||
|
Woodside Village
|
Ventura, CA
|
145 | 136,500 | 1987 | 2004 | 97 | % | |||||||||||||||
|
Walnut Heights
|
Walnut, CA
|
163 | 146,700 | 1964 | 2003 | 96 | % | |||||||||||||||
|
Reveal(7)
|
Woodland Hills, CA
|
438 | 414,892 | 2010 | 2011 | 93 | % | |||||||||||||||
|
Avondale at Warner Center
|
Woodland Hills, CA
|
446 | 331,000 | 1970 | (18) | 1997 | 97 | % | ||||||||||||||
| 15,444 | 13,717,248 | 96 | % | |||||||||||||||||||
|
Northern California
|
||||||||||||||||||||||
|
Belmont Terrace
|
Belmont, CA
|
71 | 72,951 | 1974 | 2006 | 98 | % | |||||||||||||||
|
Carlmont Woods(9)
|
Belmont, CA
|
195 | 107,200 | 1971 | 2004 | 96 | % | |||||||||||||||
|
Davey Glen(9)
|
Belmont, CA
|
69 | 65,974 | 1962 | 2006 | 96 | % | |||||||||||||||
|
Fourth and U
|
Berkeley, CA
|
171 | 146,255 | 2010 | 2010 | 96 | % | |||||||||||||||
|
Commons, The
|
Campbell, CA
|
264 | 153,168 | 1973 | 2010 | 97 | % | |||||||||||||||
|
Pointe at Cupertino, The
|
Cupertino, CA
|
116 | 135,200 | 1963 | (19) | 1998 | 97 | % | ||||||||||||||
|
Harbor Cove(9)
|
Foster City, CA
|
400 | 306,600 | 1971 | 2004 | 96 | % | |||||||||||||||
|
Stevenson Place
|
Fremont, CA
|
200 | 146,200 | 1971 | 1983 | 97 | % | |||||||||||||||
|
Boulevard
|
Fremont, CA
|
172 | 131,200 | 1978 | (20) | 1996 | 95 | % | ||||||||||||||
|
Briarwood(7)
|
Fremont, CA
|
160 | 111,160 | 1975 | 2011 | 96 | % | |||||||||||||||
|
The Woods(7)
|
Fremont, CA
|
160 | 105,280 | 1978 | 2011 | 97 | % | |||||||||||||||
|
City View
|
Hayward, CA
|
572 | 462,400 | 1975 | (21) | 1998 | 96 | % | ||||||||||||||
|
Alderwood Park(9)
|
Newark, CA
|
96 | 74,624 | 1987 | 2006 | 97 | % | |||||||||||||||
|
Bridgeport
|
Newark, CA
|
184 | 139,000 | 1987 | (22) | 1987 | 97 | % | ||||||||||||||
|
The Grand
|
Oakland, CA
|
243 | 205,026 | 2009 | 2009 | 99 | % | |||||||||||||||
|
San Marcos
|
Richmond, CA
|
432 | 407,600 | 2003 | 2003 | 98 | % | |||||||||||||||
|
Mt. Sutro
|
San Francisco, CA
|
99 | 64,000 | 1973 | 2001 | 96 | % | |||||||||||||||
|
Park West
|
San Francisco, CA
|
126 | 90,060 | 1958 | 2012 | 82 | % | |||||||||||||||
|
Bennett Lofts
|
San Francisco, CA
|
113 | 142,667 | 2004 | 2012 | 93 | % | |||||||||||||||
|
101 San Fernando
|
San Jose, CA
|
323 | 296,078 | 2001 | 2010 | 97 | % | |||||||||||||||
|
Willow Lake
|
San Jose, CA
|
508 | 471,744 | 1989 | 2012 | 95 | % | |||||||||||||||
|
Bella Villagio
|
San Jose, CA
|
231 | 227,511 | 2004 | 2010 | 98 | % | |||||||||||||||
|
Carlyle, The
|
San Jose, CA
|
132 | 129,200 | 2000 | 2000 | 97 | % | |||||||||||||||
|
Esplanade
|
San Jose, CA
|
278 | 279,000 | 2002 | 2004 | 97 | % | |||||||||||||||
|
Waterford, The
|
San Jose, CA
|
238 | 219,600 | 2000 | 2000 | 97 | % | |||||||||||||||
|
Hillsdale Garden
|
San Mateo, CA
|
697 | 611,505 | 1948 | 2006 | 97 | % | |||||||||||||||
|
Bel Air
|
San Ramon, CA
|
462 | 391,000 | 1988/2000 | 1997 | 96 | % | |||||||||||||||
|
Canyon Oaks
|
San Ramon, CA
|
250 | 237,894 | 2005 | 2007 | 97 | % | |||||||||||||||
|
Foothill Gardens
|
San Ramon, CA
|
132 | 155,100 | 1985 | 1997 | 95 | % | |||||||||||||||
|
Mill Creek at Windermere
|
San Ramon, CA
|
400 | 381,060 | 2005 | 2007 | 96 | % | |||||||||||||||
|
Twin Creeks
|
San Ramon, CA
|
44 | 51,700 | 1985 | 1997 | 95 | % | |||||||||||||||
|
1000 Kiely
|
Santa Clara, CA
|
121 | 128,486 | 1971 | 2011 | 96 | % | |||||||||||||||
|
Le Parc Luxury Apartments
|
Santa Clara, CA
|
140 | 113,200 | 1975 | 1994 | 97 | % | |||||||||||||||
|
Marina Cove(23)
|
Santa Clara, CA
|
292 | 250,200 | 1974 | (24) | 1994 | 96 | % | ||||||||||||||
|
Riley Square(7)
|
Santa Clara, CA
|
156 | 126,900 | 1972 | 2012 | 94 | % | |||||||||||||||
|
Chestnut Street
|
Santa Cruz, CA
|
96 | 87,640 | 2002 | 2008 | 95 | % | |||||||||||||||
|
Harvest Park
|
Santa Rosa, CA
|
104 | 116,628 | 2004 | 2007 | 97 | % | |||||||||||||||
|
Bristol Commons
|
Sunnyvale, CA
|
188 | 142,600 | 1989 | 1997 | 97 | % | |||||||||||||||
|
Rentable
|
||||||||||||||||||||||
|
Square
|
Year
|
Year
|
||||||||||||||||||||
|
Communities (1)
|
Location
|
Units
|
Footage
|
Built
|
Acquired
|
Occupancy(2)
|
||||||||||||||||
|
Northern California (continued)
|
||||||||||||||||||||||
|
Brookside Oaks(4)
|
Sunnyvale, CA
|
170 | 119,900 | 1973 | 2000 | 96 | % | |||||||||||||||
|
Magnolia Lane(25)
|
Sunnyvale, CA
|
32 | 31,541 | 2001 | (26) | 2007 | 96 | % | ||||||||||||||
|
Montclaire, The
|
Sunnyvale, CA
|
390 | 294,100 | 1973 | (27) | 1988 | 97 | % | ||||||||||||||
|
Reed Square
|
Sunnyvale, CA
|
100 | 95,440 | 1970 | 2011 | 96 | % | |||||||||||||||
|
Summerhill Park
|
Sunnyvale, CA
|
100 | 78,500 | 1988 | 1988 | 98 | % | |||||||||||||||
|
Magnolia Square (4)
|
Sunnyvale, CA
|
156 | 110,824 | 1969 | (26) | 2007 | 96 | % | ||||||||||||||
|
Sunnyvale, CA
|
216 | 161,800 | 1989 | 1989 | 97 | % | ||||||||||||||||
| Via |
Sunnyvale, CA
|
284 | 309,421 | 2011 | 2011 | 97 | % | |||||||||||||||
|
Vista Belvedere
|
Tiburon, CA
|
76 | 78,300 | 1963 | 2004 | 96 | % | |||||||||||||||
|
Tuscana
|
Tracy, CA
|
30 | 29,088 | 2007 | 2007 | 93 | % | |||||||||||||||
| 10,189 | 8,792,525 | 97 | % | |||||||||||||||||||
|
Seattle, Washington Metropolitan Area
|
||||||||||||||||||||||
|
Cedar Terrace
|
Bellevue, WA
|
180 | 174,200 | 1984 | 2005 | 96 | % | |||||||||||||||
|
Courtyard off Main
|
Bellevue, WA
|
109 | 108,388 | 2000 | 2010 | 97 | % | |||||||||||||||
|
Emerald Ridge
|
Bellevue, WA
|
180 | 144,000 | 1987 | 1994 | 96 | % | |||||||||||||||
|
Foothill Commons
|
Bellevue, WA
|
388 | 288,300 | 1978 | (28) | 1990 | 94 | % | ||||||||||||||
|
Palisades, The
|
Bellevue, WA
|
192 | 159,700 | 1977 | 1990 | 97 | % | |||||||||||||||
|
Sammamish View
|
Bellevue, WA
|
153 | 133,500 | 1986 | 1994 | 98 | % | |||||||||||||||
|
Woodland Commons
|
Bellevue, WA
|
236 | 172,300 | 1978 | (29) | 1990 | 88 | % | ||||||||||||||
|
Canyon Pointe
|
Bothell, WA
|
250 | 210,400 | 1990 | 2003 | 96 | % | |||||||||||||||
|
Inglenook Court
|
Bothell, WA
|
224 | 183,600 | 1985 | 1994 | 96 | % | |||||||||||||||
|
Salmon Run at Perry Creek
|
Bothell, WA
|
132 | 117,100 | 2000 | 2000 | 98 | % | |||||||||||||||
|
Stonehedge Village
|
Bothell, WA
|
196 | 214,800 | 1986 | 1997 | 98 | % | |||||||||||||||
|
Highlands at Wynhaven
|
Issaquah, WA
|
333 | 424,674 | 2000 | 2008 | 96 | % | |||||||||||||||
|
Park Hill at Issaquah
|
Issaquah, WA
|
245 | 277,700 | 1999 | 1999 | 97 | % | |||||||||||||||
|
Wandering Creek
|
Kent, WA
|
156 | 124,300 | 1986 | 1995 | 98 | % | |||||||||||||||
|
Ascent
|
Kirkland, WA
|
90 | 75,840 | 1988 | 2012 | 94 | % | |||||||||||||||
|
Bridle Trails
|
Kirkland, WA
|
108 | 99,700 | 1986 | (30) | 1997 | 97 | % | ||||||||||||||
|
Corbella at Juanita Bay
|
Kirkland, WA
|
169 | 103,339 | 1978 | 2010 | 97 | % | |||||||||||||||
|
Evergreen Heights
|
Kirkland, WA
|
200 | 188,300 | 1990 | 1997 | 95 | % | |||||||||||||||
|
Montebello
|
Kirkland, WA
|
248 | 272,734 | 1996 | 2012 | 96 | % | |||||||||||||||
|
Laurels at Mill Creek, The
|
Mill Creek, WA
|
164 | 134,300 | 1981 | 1996 | 95 | % | |||||||||||||||
|
Morning Run(9)
|
Monroe, WA
|
222 | 221,786 | 1991 | 2005 | 97 | % | |||||||||||||||
|
The Elliot at Mukilteo (Anchor Village)(4)
|
Mukilteo, WA
|
301 | 245,900 | 1981 | 1997 | 95 | % | |||||||||||||||
|
Castle Creek
|
Newcastle, WA
|
216 | 191,900 | 1997 | 1997 | 97 | % | |||||||||||||||
|
Delano/Bon Terra
|
Redmond, WA
|
126 | 116,340 | 2011/2005 | 2011/2012 | 96 | % | |||||||||||||||
|
Elevation
|
Redmond, WA
|
157 | 138,916 | 1986 | 2010 | 94 | % | |||||||||||||||
|
Vesta (Redmond Hill East)(7)
|
Redmond, WA
|
440 | 381,675 | 1998 | 2011 | 96 | % | |||||||||||||||
|
Redmond Hill West(7)
|
Redmond, WA
|
442 | 350,275 | 1985 | 2011 | 96 | % | |||||||||||||||
|
Brighton Ridge
|
Renton, WA
|
264 | 201,300 | 1986 | 1996 | 97 | % | |||||||||||||||
|
Fairwood Pond
|
Renton, WA
|
194 | 189,200 | 1997 | 2004 | 96 | % | |||||||||||||||
|
Forest View
|
Renton, WA
|
192 | 182,500 | 1998 | 2003 | 97 | % | |||||||||||||||
|
Bernard, The
|
Seattle, WA
|
63 | 43,151 | 2008 | 2011 | 97 | % | |||||||||||||||
|
Cairns, The
|
Seattle, WA
|
100 | 70,806 | 2006 | 2007 | 96 | % | |||||||||||||||
|
Domaine
|
Seattle, WA
|
92 | 79,421 | 2012 | 2012 | 88 | % | |||||||||||||||
|
Eastlake 2851(9)
|
Seattle, WA
|
133 | 234,086 | 2008 | 2008 | 96 | % | |||||||||||||||
|
Fountain Court
|
Seattle, WA
|
320 | 207,000 | 2000 | 2000 | 95 | % | |||||||||||||||
|
Joule (31)
|
Seattle, WA
|
295 | 191,109 | 2010 | 2010 | 96 | % | |||||||||||||||
|
Linden Square
|
Seattle, WA
|
183 | 142,200 | 1994 | 2000 | 96 | % | |||||||||||||||
|
Wharfside Pointe
|
Seattle, WA
|
142 | 119,200 | 1990 | 1994 | 95 | % | |||||||||||||||
| 7,835 | 6,913,940 | 96 | % | |||||||||||||||||||
|
Total/Weighted Average
|
33,468 | 29,423,713 | 96 | % | ||||||||||||||||||
|
Rentable
|
||||||||||||||||||||||
|
Square
|
Year
|
Year
|
||||||||||||||||||||
|
Other real estate assets
(1)
|
Location
|
Tenants
|
Footage
|
Built
|
Acquired
|
Occupancy
(2)
|
||||||||||||||||
|
Office Buildings
|
||||||||||||||||||||||
|
925 / 935 East Meadow Drive(32)
|
Palo Alto, CA
|
1 | 31,900 | 1988 / 1962 | 1997 / 2007 | 100 | % | |||||||||||||||
|
6230 Sunset Blvd(33)
|
Los Angeles, CA
|
1 | 35,000 | 1938 | 2006 | 100 | % | |||||||||||||||
|
17461 Derian Ave(34)
|
Irvine, CA
|
6 | 110,000 | 1983 | 2000 | 93 | % | |||||||||||||||
|
Santa Clara Retail
|
Santa Clara, CA
|
3 | 139,000 | 1970 | 2011 | 100 | % | |||||||||||||||
|
Total Office Buildings
|
11 | 315,900 | 99 | % | ||||||||||||||||||
Footnotes to the Company’s Portfolio Listing as of December 31, 2012
|
|
(1)
|
Unless otherwise specified, the Company has a 100% ownership interest in each community.
|
|
|
(2)
|
For communities, occupancy rates are based on financial occupancy for the year ended December 31, 2012; for the commercial buildings or properties which have not yet stabilized, or have insufficient operating history, occupancy rates are based on physical occupancy as of December 31, 2012. For an explanation of how financial occupancy and physical occupancy are calculated, see “Properties-Occupancy Rates” in this Item 2.
|
|
|
(3)
|
The community is subject to a ground lease, which, unless extended, will expire in 2082.
|
|
|
(4)
|
The Company holds a 1% special limited partner interest in the partnerships which own these apartment communities. These investments were made under arrangements whereby EMC became the 1% sole general partner and the other limited partners were granted the right to require the applicable partnership to redeem their interest for cash. Subject to certain conditions, the Company may, however, elect to deliver an equivalent number of shares of the Company’s common stock in satisfaction of the applicable partnership’s cash redemption obligation.
|
|
|
(5)
|
This community is owned by Wesco III. The Company has a 50% interest in Wesco III which is accounted for using the equity method of accounting.
|
|
|
(6)
|
The Company completed development of the property in 2010.
|
|
|
(7)
|
This community is owned by Wesco I. The Company has a 50% interest in Wesco I which is accounted for using the equity method of accounting.
|
|
|
(8)
|
The Company completed a $10.8 million redevelopment in 2009.
|
|
|
(9)
|
This community is owned by Fund II. The Company has a 28.2% interest in Fund II which is accounted for using the equity method of accounting.
|
|
|
(10)
|
Fund II completed a $5.3 million redevelopment in 2008.
|
|
|
(11)
|
This community is subject to a ground lease, which, unless extended, will expire in 2067.
|
|
|
(12)
|
This community is subject to a ground lease, which, unless extended, will expire in 2027.
|
|
|
(13)
|
The Company completed a $16.6 million redevelopment in 2009.
|
|
|
(14)
|
The Company is in the process of performing a $10.2 million redevelopment.
|
|
|
(15)
|
The Company has a 97% interest. A 50% voting interest was acquired in April 2012 when the Company acquired the joint venture partner’s membership interest.
|
|
|
(16)
|
The Company and EMC have a 74.0% and a 1% member interest, respectively.
|
|
|
(17)
|
The Community is subject to a ground lease, which, unless extended, will expire in 2028.
|
|
|
(18)
|
The Company completed a $12.0 million redevelopment in 2008.
|
|
|
(19)
|
The Company is in the process of performing a $10.0 million redevelopment
|
|
|
(20)
|
The Company completed an $8.9 million redevelopment in 2008.
|
|
|
(21)
|
The Company completed a $9.4 million redevelopment in 2009.
|
|
|
(22)
|
The Company completed a $4.6 million redevelopment in 2009.
|
|
|
(23)
|
A portion of this community on which 84 units are presently located is subject to a ground lease, which, unless extended, will expire in 2028.
|
|
|
(24)
|
The Company is in the process of performing a $9.9 million redevelopment.
|
|
|
(25)
|
The community is subject to a ground lease, which, unless extended, will expire in 2070.
|
|
|
(26)
|
The Company is in the process of performing a $13.3 million redevelopment.
|
|
|
(27)
|
The Company completed a $12.5 million redevelopment in 2009.
|
|
|
(28)
|
The Company completed a $36.3 million redevelopment in 2012, which included the construction of 28 in-fill units in 2009.
|
|
|
(29)
|
The Company completed the construction of 66 additional apartment homes in 2012 and is in the process of performing a redevelopment for a total cost of $21.6 million.
|
|
|
(30)
|
The Company completed a $5.1 million redevelopment and completed construction of 16 units of the community’s 108 units in 2006.
|
|
|
(31)
|
The Company has 99% ownership in this community.
|
|
|
(32)
|
The Company occupies 100% of this property.
|
|
|
(33)
|
The property is leased through July 2014 to a single tenant.
|
|
|
(34)
|
The Company occupies 7% of this property.
|
There have been have been an increasing number of lawsuits against owners and managers of apartment communities alleging personal injury and property damage caused by the presence of mold in residential real estate. Some of these lawsuits have resulted in substantial monetary judgments or settlements. The Company has been sued for mold related matters and has settled some, but not all, of such matters. Insurance carriers have reacted to mold related liability awards by excluding mold related claims from standard policies and pricing mold endorsements at prohibitively high rates. The Company has, however, purchased pollution liability insurance, which includes some coverage for mold. The Company has adopted policies for promptly addressing and resolving reports of mold when it is detected, and to minimize any impact mold might have on residents of the property. The Company believes its mold policies and proactive response to address any known existence, reduces its risk of loss from these cases. There can be no assurances that the Company has identified and responded to all mold occurrences, but the Company promptly addresses all known reports of mold. Liabilities resulting from such mold related matters are not expected to have a material adverse effect on the Company’s financial condition, results of operations or cash flows. As of December 31, 2012, potential liabilities for mold and other environmental liabilities are not quantifiable and an estimate of possible loss cannot be made.
The Company is subject to various other lawsuits in the normal course of its business operations. Such lawsuits are not expected to have a material adverse effect on the Company’s financial condition, results of operations or cash flows.
Not Applicable.
The shares of the Company’s common stock are traded on the New York Stock Exchange (“NYSE”) under the symbol ESS.
Market Information
The Company’s common stock has been traded on the NYSE since June 13, 1994. The high, low and closing price per share of common stock reported on the NYSE for the quarters indicated are as follows:
|
Quarter Ended
|
High
|
Low
|
Close
|
|||||||||
|
December 31, 2012
|
$ | 150.71 | $ | 136.38 | $ | 146.65 | ||||||
|
September 30, 2012
|
$ | 160.64 | $ | 147.38 | $ | 148.24 | ||||||
|
June 30, 2012
|
$ | 161.53 | $ | 146.05 | $ | 153.92 | ||||||
|
March 31, 2012
|
$ | 151.54 | $ | 136.43 | $ | 151.51 | ||||||
|
December 31, 2011
|
$ | 148.44 | $ | 111.25 | $ | 140.51 | ||||||
|
September 30, 2011
|
$ | 145.40 | $ | 119.15 | $ | 120.04 | ||||||
|
June 30, 2011
|
$ | 138.31 | $ | 122.67 | $ | 135.29 | ||||||
|
March 31, 2011
|
$ | 124.41 | $ | 109.98 | $ | 124.00 | ||||||
The closing price as of February 20, 2013 was $152.41.
Holders
The approximate number of holders of record of the shares of the Company’s common stock was
259 as of February 20, 2013
.
This number does not include stockholders whose shares are held in investment accounts by other entities. The Company believes the actual number of stockholders is greater than the number of holders of record.
Return of Capital
Under provisions of the Internal Revenue Code of 1986, as amended, the portion of the cash dividend, if any, that exceeds earnings and profits is considered a return of capital. The return of capital is generated due to a variety of factors, including the deduction of non-cash expenses, primarily depreciation, in the determination of earnings and profits.
The status of the cash dividends distributed for the years ended December 31, 2012, 2011, and 2010 related to common stock, and Series F, G and Series H preferred stock for tax purposes are as follows:
|
2012
|
2011
|
2010
|
||||||||||
|
Common Stock
|
||||||||||||
|
Ordinary income
|
70.58 | % | 63.68 | % | 82.46 | % | ||||||
|
Capital gain
|
8.75 | % | 11.16 | % | 5.61 | % | ||||||
|
Unrecaptured section 1250 capital gain
|
7.97 | % | 0.74 | % | 0.00 | % | ||||||
|
Return of capital
|
12.70 | % | 24.42 | % | 11.93 | % | ||||||
| 100.00 | % | 100.00 | % | 100.00 | % | |||||||
|
2012
|
2011
|
2010
|
||||||||||
|
Series F, G, and H Preferred stock
|
||||||||||||
|
Ordinary income
|
80.85 | % | 100.00 | % | 93.63 | % | ||||||
|
Capital gains
|
10.02 | % | 0.00 | % | 6.37 | % | ||||||
|
Unrecaptured section 1250 capital gain
|
9.13 | % | 0.00 | % | 0.00 | % | ||||||
| 100.00 | % | 100.00 | % | 100.00 | % | |||||||
Dividends and Distributions
Since its initial public offering on June 13, 1994, the Company has paid regular quarterly dividends to its stockholders. The Company has paid the following dividends per share of common stock:
|
Year Ended
|
Annual Dividend
|
Quarter Ended
|
2012
|
2011
|
2010
|
||||||||||||||
|
1995
|
$ | 1.685 |
March 31,
|
$ | 1.100 | $ | 1.040 | $ | 1.033 | ||||||||||
|
1996
|
$ | 1.720 |
June 30,
|
1.100 | 1.040 | 1.033 | |||||||||||||
|
1997
|
$ | 1.770 |
September 30,
|
1.100 | 1.040 | 1.033 | |||||||||||||
|
1998
|
$ | 1.950 |
December 31,
|
1.100 | 1.040 | 1.033 | |||||||||||||
|
1999
|
$ | 2.150 | |||||||||||||||||
|
2000
|
$ | 2.380 |
Annual Dividend
|
$ | 4.400 | $ | 4.160 | $ | 4.130 | ||||||||||
|
2001
|
$ | 2.800 | |||||||||||||||||
|
2002
|
$ | 3.080 | |||||||||||||||||
|
2003
|
$ | 3.120 | |||||||||||||||||
|
2004
|
$ | 3.160 | |||||||||||||||||
|
2005
|
$ | 3.240 | |||||||||||||||||
|
2006
|
$ | 3.360 | |||||||||||||||||
|
2007
|
$ | 3.720 | |||||||||||||||||
|
2008
|
$ | 4.080 | |||||||||||||||||
|
2009
|
$ | 4.120 | |||||||||||||||||
Future distributions by the Company will be at the discretion of the Board of Directors and will depend on the actual cash flows from operations of the Company, its financial condition, capital requirements, the annual distribution requirements under the REIT provisions of the Internal Revenue Code, applicable legal restrictions and such other factors as the Board of Directors deem relevant. There are currently no contractual restrictions on the Company’s present or future ability to pay dividends.
On February 20, 2013, the Company announced the Board of Directors approved a $0.44 per share increase to the annualized cash dividend. Accordingly, the first quarter dividend distribution, payable on April 12, 2013 to stockholders as of record as of March 28, 2013, will be $1.21 per share. On an annualized basis, the dividend represents a distribution of $4.84 per common share.
Dividend Reinvestment and Share Purchase Plan
The Company has adopted a dividend reinvestment and share purchase plan designed to provide holders of common stock with a convenient and economical means to reinvest all or a portion of their cash dividends in shares of common stock and to acquire additional shares of common stock through voluntary purchases. Computershare, LLC, which serves as the Company’s transfer agent, administers the dividend reinvestment and share purchase plan. For a copy of the plan, contact Computershare, LLC at (312) 360-5354.
Securities Authorized for Issuance under Equity Compensation Plans
See the Company’s disclosure in the 2013 Proxy Statement under the heading “Equity Compensation Plan Information”, which disclosure is incorporated herein by reference.
Issuance of Registered Equity Securities
During 2012, the Company sold 2,404,096 shares of common stock for $357.7 million, net of commissions, at an average price of $150.26. During the first quarter of 2013 through February 21, 2013, the Company has issued 758,644 shares of common stock at an average price of $151.70 for $114.0 million, net of fees and commissions. These sales were pursuant to a registration statement and the Company used the net proceeds from the stock offerings to pay down debt, fund redevelopment and development pipelines, fund acquisitions, and for general corporate purposes.
Issuer Purchases of Equity Securities – Common Stock, Series G Cumulative Convertible Preferred Stock
In August 2007, the Company’s Board of Directors authorized a stock repurchase plan to allow the Company to acquire shares in an aggregate of up to $200 million. The Company did not repurchase any shares during 2012, 2011 and 2010. Since the Company announced the inception of the stock repurchase plan, the Company has repurchased and retired 816,659 shares for $66.6 million at an average stock price of $81.56 per share, including commissions as of December 31, 2012.
Performance Graph
The line graph below compares the cumulative total stockholder return on the Company’s common stock for the last five years with the cumulative total return on the S&P 500 and the NAREIT All Equity REIT index over the same period. This comparison assumes that the value of the investment in the common stock and each index was $100 on December 31, 2007 and that all dividends were reinvested
(1).
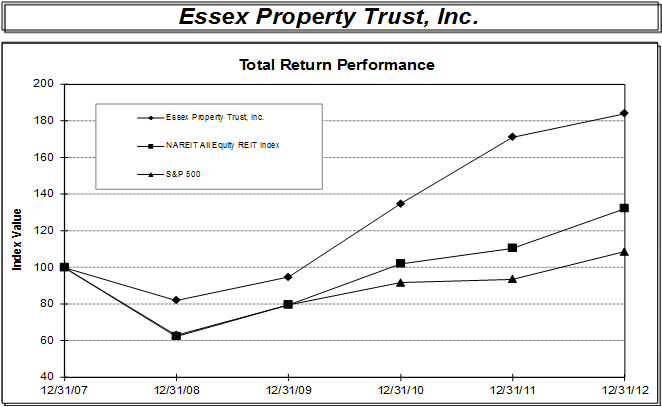
|
Period Ending
|
||||||||||||||||||||||||
|
Index
|
12/31/07
|
12/31/08
|
12/31/09
|
12/31/10
|
12/31/11
|
12/31/12
|
||||||||||||||||||
|
Essex Property Trust, Inc.
|
100.00 | 81.99 | 94.78 | 134.70 | 171.15 | 183.99 | ||||||||||||||||||
|
NAREIT All Equity REIT Index
|
100.00 | 62.27 | 79.70 | 101.98 | 110.42 | 132.18 | ||||||||||||||||||
|
S&P 500
|
100.00 | 63.00 | 79.68 | 91.68 | 93.61 | 108.59 | ||||||||||||||||||
(1) Common stock performance data is provided by SNL Financial.
The graph and other information furnished under the above caption “Performance Graph” in this Part II Item 5 of this Form 10-K shall not deemed to be “soliciting material” or to be “filed” with the SEC or subject to Regulation 14A or 14C, or to the liabilities of the Exchange Act, as amended.
The following tables set forth summary financial and operating information for the Company from January 1, 2008 through December 31, 2012.
|
Years Ended December 31,
|
||||||||||||||||||||
|
2012
|
2011
|
2010
|
2009
|
2008
|
||||||||||||||||
|
($ in thousands, except per share amounts)
|
||||||||||||||||||||
|
OPERATING DATA:
|
||||||||||||||||||||
|
REVENUES
|
||||||||||||||||||||
|
Rental and other property
|
$ | 531,936 | $ | 465,713 | $ | 405,728 | $ | 401,550 | $ | 397,673 | ||||||||||
|
Management and other fees from affiliates
|
11,489 | 6,780 | 4,551 | 4,325 | 5,166 | |||||||||||||||
| 543,425 | 472,493 | 410,279 | 405,875 | 402,839 | ||||||||||||||||
|
EXPENSES
|
||||||||||||||||||||
|
Property operating expenses
|
174,088 | 159,234 | 143,164 | 137,457 | 130,328 | |||||||||||||||
|
Depreciation
|
170,592 | 151,428 | 128,221 | 116,540 | 108,221 | |||||||||||||||
|
General and administrative
|
23,307 | 20,694 | 23,255 | 24,966 | 24,725 | |||||||||||||||
|
Cost of management and other fees
|
6,513 | 4,610 | 2,707 | 3,096 | 2,959 | |||||||||||||||
|
Impairment and other charges
|
- | - | 2,302 | 13,084 | 650 | |||||||||||||||
| 374,500 | 335,966 | 299,649 | 295,143 | 266,883 | ||||||||||||||||
|
Earnings from operations
|
168,925 | 136,527 | 110,630 | 110,732 | 135,956 | |||||||||||||||
|
Interest expense before amortization expense
|
(100,244 | ) | (91,694 | ) | (82,756 | ) | (81,196 | ) | (78,203 | ) | ||||||||||
|
Amortization expense
|
(11,644 | ) | (11,474 | ) | (4,828 | ) | (4,820 | ) | (6,860 | ) | ||||||||||
|
Interest and other income
|
13,833 | 17,139 | 27,841 | 13,040 | 11,337 | |||||||||||||||
|
Equity income (loss) from co-investments
|
41,745 | (467 | ) | (1,715 | ) | 670 | 7,820 | |||||||||||||
| Gain on remeasurement of co-investment | 21,947 | - | - | - | - | |||||||||||||||
|
(Loss) gain on early retirement of debt
|
(5,009 | ) | (1,163 | ) | (10 | ) | 4,750 | 3,997 | ||||||||||||
|
Gain on the sales of real estate
|
- | - | - | 103 | 4,578 | |||||||||||||||
|
Income before discontinued operations
|
129,553 | 48,868 | 49,162 | 43,279 | 78,625 | |||||||||||||||
|
Income from discontinued operations
|
10,037 | 8,648 | 1,620 | 10,460 | 5,770 | |||||||||||||||
|
Net income
|
139,590 | 57,516 | 50,782 | 53,739 | 84,395 | |||||||||||||||
|
Net income attributable to noncontrolling interest
|
(14,306 | ) | (10,446 | ) | (14,848 | ) | (16,631 | ) | (22,255 | ) | ||||||||||
|
Net income attributable to controlling interest
|
125,284 | 47,070 | 35,934 | 37,108 | 62,140 | |||||||||||||||
|
Dividends to preferred stockholders
|
(5,472 | ) | (4,753 | ) | (2,170 | ) | (4,860 | ) | (9,241 | ) | ||||||||||
|
Excess (deficit) of the carrying amount of preferred stock redeemed over the cash paid to redeem preferred stock
|
- | (1,949 | ) | - | 49,952 | - | ||||||||||||||
|
Net income available to common stockholders
|
$ | 119,812 | $ | 40,368 | $ | 33,764 | $ | 82,200 | $ | 52,899 | ||||||||||
|
Per share data:
|
||||||||||||||||||||
|
Basic:
|
||||||||||||||||||||
|
Income before discontinued operations available to common stockholders
|
$ | 3.15 | $ | 0.99 | $ | 1.09 | $ | 2.66 | $ | 1.88 | ||||||||||
|
Net income available to common stockholders
|
$ | 3.42 | $ | 1.24 | $ | 1.14 | $ | 3.01 | $ | 2.10 | ||||||||||
|
Weighted average common stock outstanding
|
35,032 | 32,542 | 29,667 | 27,270 | 25,205 | |||||||||||||||
|
Diluted:
|
||||||||||||||||||||
|
Income before discontinued operations available to common stockholders
|
$ | 3.14 | $ | 0.99 | $ | 1.09 | $ | 2.56 | $ | 1.87 | ||||||||||
|
Net income available to common stockholders
|
$ | 3.41 | $ | 1.24 | $ | 1.14 | $ | 2.91 | $ | 2.09 | ||||||||||
|
Weighted average common stock outstanding
|
35,125 | 32,629 | 29,734 | 29,747 | 25,347 | |||||||||||||||
|
Cash dividend per common share
|
$ | 4.40 | $ | 4.16 | $ | 4.13 | $ | 4.12 | $ | 4.08 | ||||||||||
|
As of December 31,
|
||||||||||||||||||||
|
2012
|
2011
|
2010
|
2009
|
2008
|
||||||||||||||||
|
($ in thousands)
|
||||||||||||||||||||
|
BALANCE SHEET DATA:
|
||||||||||||||||||||
|
Investment in rental properties (before accumulated depreciation)
|
$ | 5,033,672 | $ | 4,313,064 | $ | 3,964,561 | $ | 3,412,930 | $ | 3,279,788 | ||||||||||
|
Net investment in rental properties
|
3,952,155 | 3,393,038 | 3,189,008 | 2,663,466 | 2,639,762 | |||||||||||||||
|
Real estate under development
|
66,851 | 44,280 | 217,531 | 274,965 | 272,273 | |||||||||||||||
|
Total assets
|
4,847,223 | 4,036,964 | 3,732,887 | 3,254,637 | 3,164,823 | |||||||||||||||
|
Total secured indebtedness
|
1,565,599 | 1,745,858 | 2,082,745 | 1,832,549 | 1,588,931 | |||||||||||||||
|
Total unsecured indebtedness
|
1,253,084 | 615,000 | 176,000 | 14,893 | 165,457 | |||||||||||||||
|
Cumulative convertible preferred stock
|
4,349 | 4,349 | 4,349 | 4,349 | 145,912 | |||||||||||||||
|
Cumulative redeemable preferred stock
|
73,750 | 73,750 | 25,000 | 25,000 | 25,000 | |||||||||||||||
|
Stockholders' equity
|
1,764,804 | 1,437,527 | 1,149,946 | 1,053,096 | 852,227 | |||||||||||||||
|
As of and for the years ended December 31,
|
||||||||||||||||||||
|
2012
|
2011
|
2010
|
2009
|
2008
|
||||||||||||||||
|
OTHER DATA:
|
||||||||||||||||||||
|
Net income
|
$ | 139,590 | $ | 57,516 | $ | 50,782 | $ | 53,739 | $ | 84,395 | ||||||||||
|
Interest expense before amortization expense
|
100,244 | 91,694 | 82,756 | 81,196 | 78,203 | |||||||||||||||
|
Amortization expense
|
11,644 | 11,474 | 4,828 | 4,820 | 6,860 | |||||||||||||||
|
Tax benefit
|
- | (1,682 | ) | - | - | - | ||||||||||||||
|
Depreciation
(1)
|
170,686 | 152,543 | 129,712 | 118,522 | 113,294 | |||||||||||||||
|
EBITDA
(2)
|
$ | 422,164 | $ | 311,545 | $ | 268,078 | $ | 258,277 | $ | 282,752 | ||||||||||
|
|
(1)
|
Includes amounts classified within discontinued operations.
|
|
|
(2)
|
EBITDA is an operating measure and is defined as net income before interest expense, income taxes, depreciation and amortization. EBITDA, as defined by the Company, is not a recognized measurement under U.S. generally accepted accounting principles, or GAAP. This measurement should not be considered in isolation or as a substitute for net income, cash flows from operating activities and other income or cash flow statement data prepared in accordance with GAAP, or as a measure of profitability or liquidity. The Company’s definition may not be comparable to that of other companies.
|
The following discussion and analysis should be read in conjunction with the accompanying consolidated financial statements and notes thereto. These consolidated financial statements include all adjustments which are, in the opinion of management, necessary to reflect a fair statement of the results and all such adjustments are of a normal recurring nature.
OVERVIEW
The Company is a self-administered and self-managed REIT that acquires, develops, redevelops and manages apartment communities in selected residential areas located primarily in the West Coast of the United States. The Company owns all of its interests in its real estate investments, directly or indirectly, through the Operating Partnership. The Company is the sole general partner of the Operating Partnership and, as of December 31, 2012, had an approximately 94.5% general partner interest in the Operating Partnership.
The Company’s investment strategy has two components: constant monitoring of existing markets, and evaluation of new markets to identify areas with the characteristics that underlie rental growth. The Company’s strong financial condition supports its investment strategy by enhancing its ability to quickly shift acquisition, development, and disposition activities to markets that will optimize the performance of the portfolio.
As of December 31, 2012, the Company had ownership interests in 163 communities, comprising 33,468 apartment units, and the apartment communities are located in the following major West Coast regions:
Southern California
(Los Angeles, Orange, Riverside, Santa Barbara, San Diego, and Ventura counties)
Northern California
(the San Francisco Bay Area)
Seattle
Metro
(Seattle metropolitan area)
As of December 31, 2012, the Company also had ownership interests in five commercial buildings (with approximately 315,900 square feet).
As of December 31, 2012, the Company’s development pipeline was comprised of two consolidated projects under development, seven unconsolidated joint venture projects under development, two consolidated predevelopment project, one unconsolidated joint venture predevelopment project and one consolidated land parcel held for future development or sale aggregating 2,994 units, with total incurred costs of $531.6 million, and estimated remaining project costs of approximately $463.9 million for total estimated project costs of $995.5 million. By region, the Company's operating results for 2012 and 2011 and projections for 2013 new housing supply, job growth, and rental income are as follows:
Southern California Region
: As of December 31, 2012, this region represented 47% of the Company’s consolidated apartment units. During the year ended December 31, 2012, revenues for “2012/2011 Same-Properties” (as defined below), or “Same-Property revenues,” increased 4.2% in 2012 as compared to 2011. In 2013, the Company expects new residential supply of 11,500 multifamily and 7,135 single family homes, which represents a total new multifamily supply of 0.5% and 0.3% of total housing stock, respectively. The Company assumes an increase of 117,500 jobs or 1.7%, and an increase in rental income of 3.8% to 5.3% in 2013.
Northern California Region
: As of December 31, 2012, this region represented 31% of the Company’s consolidated apartment units. Same-Property revenues increased 9.6% in 2012 as compared to 2011. In 2013, the Company expects new residential supply of 9,900 multifamily and 4,479 single family homes, which represents a total new multifamily supply of 1.1% and 0.6%, respectively, of total housing stock. The Company assumes an increase of 68,500 jobs or 2.4%, and an increase in rental income of 6.5% to 8.0% in 2013.
Seattle Metro Region
:
As of December 31, 2012, this region represented 22% of the Company’s consolidated apartment units. Same-Property revenues increased 8.4% in 2012 as compared to 2011. In 2013, the Company expects new residential supply of 6,900 multifamily and 5,888 single family homes, which represents a total new multifamily supply of 1.7% and 1.1%, respectively, of total housing stock. The Company assumes an increase of 41,000 jobs or 2.8%, and an increase in rental income of 6.0% to 7.5% in 2013.
The Company expects 2013 Same-Property revenues to increase between 5.0% and 6.5% compared to 2012 results, as renewal and new leases are signed at higher rents in 2013 than 2012. The Company expects 2013 Same-Property financial occupancy to be consistent with 2012 at 96.3%, and thus 2013 revenues will increase 5.0% to 6.5% due to a similar increase in scheduled rent. Same-Property operating expenses are expected to increase from 2.0% in 2012, to a range of 3.0% to 4.0% in 2013, and forecasted increases in property taxes account for approximately 45% of the forecasted increase in property expenses in 2013 compared to 2012. Finally, Same-Property net operating income (“NOI”) which is defined as Same-Property revenues less Same-Property operating expenses is expected to moderate from a 9.2% increase for 2012 to a range of an increase of 6.0% to 8.0% in 2013.
The Company’s consolidated communities are as follows:
|
As of December 31, 2012
|
As of December 31, 2011
|
|||||||||||||||
|
Apartment Units
|
%
|
Apartment Units
|
%
|
|||||||||||||
|
Southern California
|
13,656 | 47 | % | 13,205 | 48 | % | ||||||||||
|
Northern California
|
8,987 | 31 | % | 8,106 | 30 | % | ||||||||||
|
Seattle Metro
|
6,598 | 22 | % | 6,108 | 22 | % | ||||||||||
|
Total
|
29,241 | 100 | % | 27,419 | 100 | % | ||||||||||
Co-investments including Fund II, Wesco I and Wesco III communities, and preferred equity co-investment communities are not included in the table presented above for both years.
RESULTS OF OPERATIONS
Comparison of Year Ended December 31, 2012 to the Year Ended December 31, 2011
The Company’s average financial occupancies for the Company’s stabilized apartment communities or “2012/2011 Same-Properties” (stabilized properties consolidated by the Company for the years ended December 31, 2012 and 2011) remained consistent at 96.3% for 2012 and 2011. Financial occupancy is defined as the percentage resulting from dividing actual rental revenue by total possible rental revenue. Actual rental revenue represents contractual rental revenue pursuant to leases without considering delinquency and concessions. Total possible rental revenue represents the value of all apartment units, with occupied units valued at contractual rental rates pursuant to leases and vacant units valued at estimated market rents. We believe that financial occupancy is a meaningful measure of occupancy because it considers the value of each vacant unit at its estimated market rate.
Market rates are determined using a variety of factors such as effective rental rates at the property based on recently signed leases and asking rates for comparable properties in the market. The recently signed effective rates at the property are used as the starting point in the determination of the market rates of vacant units. The Company then increases or decreases these rates based on the supply and demand in the apartment community’s market. The Company will check the reasonableness of these rents based on its position within the market and compare the rents against the asking rents by comparable properties in the market. Financial occupancy may not completely reflect short-term trends in physical occupancy and financial occupancy rates as disclosed by other REITs may not be comparable to the Company’s calculation of financial occupancy.
The Company does not take into account delinquency and concessions to calculate actual rent for occupied units and market rents for vacant units. The calculation of financial occupancy compares contractual rates for occupied units to estimated market rents for unoccupied units, thus the calculation compares the gross value of all apartment units excluding delinquency and concessions. For apartment communities that are development properties in lease-up without stabilized occupancy figures, the Company believes the physical occupancy rate is the appropriate performance metric. While an apartment community is in the lease-up phase, the Company’s primary motivation is to stabilize the property which may entail the use of rent concessions and other incentives, and thus financial occupancy which is based on contractual revenue is not considered the best metric to quantify occupancy.
The regional breakdown of the Company’s 2012/2011 Same-Property portfolio for financial occupancy for the years ended December 31, 2012 and 2011 is as follows:
|
Years ended
|
||||||||
|
December 31,
|
||||||||
|
2012
|
2011
|
|||||||
|
Southern California
|
96.1 | % | 96.1 | % | ||||
|
Northern California
|
96.7 | % | 96.7 | % | ||||
|
Seattle Metro
|
96.1 | % | 96.1 | % | ||||
The following table provides a breakdown of revenue amounts, including the revenues attributable to 2012/2011 Same-Properties.
|
Years Ended
|
||||||||||||||||||||
|
Number of
|
December 31,
|
Dollar
|
Percentage
|
|||||||||||||||||
|
Properties
|
2012
|
2011
|
Change
|
Change
|
||||||||||||||||
|
Property Revenues
($ in thousands)
|
||||||||||||||||||||
|
2012/2011 Same-Properties:
|
||||||||||||||||||||
|
Southern California
|
58 | $ | 227,768 | $ | 218,626 | $ | 9,142 | 4.2 | % | |||||||||||
|
Northern California
|
33 | 159,993 | 146,008 | 13,985 | 9.6 | |||||||||||||||
|
Seattle Metro
|
28 | 85,373 | 78,785 | 6,588 | 8.4 | |||||||||||||||
|
Total 2011/2010 Same-Property revenues
|
119 | 473,134 | 443,419 | 29,715 | 6.7 | |||||||||||||||
|
2012/2011 Non-Same Property Revenues (1)
|
58,802 | 22,294 | 36,508 | 163.8 | ||||||||||||||||
|
Total property revenues
|
$ | 531,936 | $ | 465,713 | $ | 66,223 | 14.2 | % | ||||||||||||
(1) Includes thirteen communities acquired after January 1, 2011, one redevelopment community, five development communities, and three commercial buildings.
2012/2011 Same-Property Revenues
increased by $29.7 million or 6.7% to $473.1 million for 2012 compared to $443.4 million in 2011. The increase was primarily attributable to an increase in scheduled rents of $27.9 million as reflected in an increase of 6.4% in average rental rates from $1,388 per unit for 2011 to $1,478 per unit for 2012. Scheduled rents increased in all regions by 3.8%, 9.5%, and 8.2% in Southern California, Northern California, and Seattle Metro, respectively. Income from utility billings and other income increased by $1.3 million and $1.4 million, respectively in 2012 compared to 2011. Occupancy was consistent between years at 96.3%.
2012/2011 Non-Same Property Revenues
revenue increased by $36.5 million or 164% to $58.8 million in 2012 compared to $22.3 million to 2011. The increase was primarily due to revenue generated from five development communities (Via, Allegro, Bellerive, Muse, and Santee Village), thirteen communities acquired or consolidated since January 1, 2011 (Bernard, 1000 Kiely, Delano/Bon Terra, Reed Square, Essex Skyline at MacArthur Place, Park Catalina, The Huntington, Montebello, Park West, Domaine, Ascent, Willow Lake, and Bennett Lofts).
Management and other fees from affiliates
increased $4.7 million or 69.5% to $11.5 million in 2012 compared to $6.8 million in 2011. The increase is primarily due to the asset and property management fees earned from Wesco I and II co-investments formed during 2011, and development fees earned from the joint ventures formed in 2011 and 2012 to develop Epic, Expo, Connolly Station, Elkhorn, Folsom and Fifth, The Huxley and The Dylan development projects.
Property operating expenses, excluding real estate taxes
increased $9.9 million or 8.6% for 2012 compared to 2011, primarily due to the acquisition of thirteen communities and the lease-up of five development properties. 2012/2011 Same-Property operating expenses excluding real estate taxes, increased by $2.2 million or 2.0% for the 2012 compared to 2011, due mainly to a $1.5 million increase in salaries, marketing, and administration costs and a $0.3 million increase in utilities due to increases in rates for water and sewer.
Real estate taxes
increased $4.9 million or 11.3% for 2012 compared to 2011, due primarily to the acquisition of thirteen communities and expensing property taxes instead of capitalizing the cost for communities that were previously under development. 2012/2011 Same-Property real estate taxes increased by $0.9 million or 2.3% for the 2012 compared to 2011 due to an increase of 5.6% in property taxes for the Seattle Metro and a 2.0% in property taxes for the majority of the properties located in California regulated by Prop. 13 offset by temporary reductions in assessed property valuations for select communities located in California.
Depreciation expense
increased by $19.2 million or 12.7% for 2012 compared to 2011, due to the acquisition of thirteen communities and the lease-up of five development properties. Also, the increase is due to the capitalization of approximately $97.9 million in additions to rental properties in 2012, including $40.2 million spent on redevelopment, $13.7 million spent on improvement to recent acquisitions, and $7.7 million spent on revenue generating capital expenditures, and the capitalization of approximately $95.3 million in additions to rental properties for 2011, including $45.1 million spent on redevelopment, $16.4 million spent on improvements to recent acquisitions, and $7.6 million spent on revenue generating capital expenditures.
General and administrative expense
increased $2.6 million or 12.6% for 2012 compared to 2011 primarily due to an increase of acquisitions cost of $1.3 million compared to 2011 related to the increase in acquisitions in 2012 compared to 2011, annual compensation adjustments for merit, and the cost of hiring additional staff to manage the new acquisitions.
Cost of management and other fees
increased $1.9 million or 41.3% for 2012 compared to 2011 primarily due to an increase in administrative costs due to hiring of additional staff to assist with the management of the Company’s co-investments including Wesco I and II and the development joint ventures formed in 2011 and 2012.
Interest expense before amortization
increased $8.6 million or 9.3% in 2012
,
primarily due to the payoff of the $250 million secured line of credit in the fourth quarter of 2011 which had an average interest rate of 1.3%. The Company replaced the secured line with an unsecured term loan at an average interest rate of 2.7%. Also, on March 31, 2011, the Company issued $150 million of private placement notes with an average interest rate of 4.5%, on August 15, 2012 the Company issued $300 million of new unsecured bonds with an interest rate of 3.625%, and the Company drew an additional $150 million on a bank term loan in the fourth quarter of 2012. Thus, interest expense increased due to an increase in average outstanding debt for the funding of 2012 acquisitions and the development pipeline and a higher average interest rate for 2012 compared to 2011.
Interest and other income
decreased by $3.3 million for 2012 primarily due to $2.3 million of promote income earned from achieving certain performance hurdles related to the Essex Skyline co-investment and the sale of marketable securities for a gain of $0.8 million in 2012, compared to a gain of $5.0 million from the sale of marketable securities, $0.2 gain from the sale of a land parcel, and a $1.7 million income tax benefit from a taxable REIT subsidiary that met the “more likely than not” threshold in the fourth quarter of 2011. This tax benefit relates to the write-off of an investment in a joint venture development project recognized during 2009.
Equity income (loss) in co-investments
was income of $41.7 million in 2012 compared to a loss of $0.5 million in 2011. The increase was primarily due to the Company’s pro-rata share of the gain of $29.1 million from the sale of seven properties owned by Fund II, and income of $13.5 million in 2012 compared to $3.5 million for 2011, related to the Company’s preferred equity investments made in 2011.
In the fourth quarter of 2011, the Company made a preferred equity investment in Wesco II which earned $9.0 million for 2012 compared to $0.5 million in 2011.
Gain on remeasurement of co-investment
of $21.9 million in 2012
was due to the Company’s acquisition of the joint venture partner’s membership interest in Essex Skyline at MacArthur Place which the Company subsequently consolidated. Upon consolidation, a gain was recorded equal to the amount by which the fair value of the Company’s previously noncontrolling interest exceeded its carrying value.
Loss on early retirement of debt
was $5.0 million for 2012 was due to the write-off of deferred financing costs and prepayment penalties related to the early termination of secured debt related to six communities. The loss for 2012 also included the Company’s pro-rata share of the write-off of deferred financing costs and prepayment penalties incurred for the prepayment of the secured debt for the Essex Skyline joint venture and seven Fund II communities sold in 2012. During 2011, the loss on early retirement of debt was due to the write-off of deferred financing costs related to the termination of the Company’s $250 million secured line of credit with Freddie Mac and mortgages paid-off before maturity in 2011.
Income from discontinued operations
for 2012 was $10.0 million and included a gain of $9.8 million from the sale of Tierra del Sol/Norte and Alpine Country, net of internal disposition costs. For 2011,
income from
discontinued operations was $8.6 million and included a gain of $7.5 million from the sale of Woodlawn Colonial and Clarendon, net of internal disposition costs, and the operating results of the two communities sold in 2011 and 2012.
Comparison of Year Ended December 31, 2011 to the Year Ended December 31, 2010
The Company’s average financial occupancies for the Company’s stabilized apartment communities for “2011/2010 Same-Properties” (stabilized properties consolidated by the Company for the years ended December 31, 2011 and 2010) decreased 50 basis points to 96.4% in 2011 from 96.9% in 2010. The regional breakdown of the Company’s stabilized 2011/2010 Same-Property portfolio for financial occupancy for the years ended December 31, 2011 and 2010 is as follows:
|
Years ended
|
||||||||
|
December 31,
|
||||||||
|
2011
|
2010
|
|||||||
|
Southern California
|
96.3 | % | 96.8 | % | ||||
|
Northern California
|
96.6 | % | 97.2 | % | ||||
|
Seattle Metro
|
96.4 | % | 96.9 | % | ||||
The following table provides a breakdown of revenue amounts, including the revenues attributable to 2011/2010 Same-Properties.
|
Years Ended
|
||||||||||||||||||||
|
Number of
|
December 31,
|
Dollar
|
Percentage
|
|||||||||||||||||
|
Properties
|
2011
|
2010
|
Change
|
Change
|
||||||||||||||||
|
Property Revenues
($ in thousands)
|
||||||||||||||||||||
|
2011/2010 Same-Properties:
|
||||||||||||||||||||
|
Southern California
|
58 | $ | 204,748 | $ | 199,348 | $ | 5,400 | 2.7 | % | |||||||||||
|
Northern California
|
28 | 123,451 | 116,796 | 6,655 | 5.7 | |||||||||||||||
|
Seattle Metro
|
23 | 61,827 | 59,101 | 2,726 | 4.6 | |||||||||||||||
|
Total 2010/2009 Same-Property revenues
|
109 | 390,026 | 375,245 | 14,781 | 3.9 | |||||||||||||||
|
2011/2010 Non-Same Property Revenues (1)
|
75,687 | 30,483 | 45,204 | 148.3 | ||||||||||||||||
|
Total property revenues
|
$ | 465,713 | $ | 405,728 | $ | 59,985 | 14.8 | % | ||||||||||||
(1) Includes twelve communities acquired after January 1, 2010, two redevelopment communities, eight development communities, and three commercial buildings.
2011/2010 Same-Property Revenues
increased by $14.8 million or 3.9% to $390.0 million for 2011 compared to $375.2 million in 2010. The increase was primarily attributable to an increase in scheduled rents of $15.1 million as reflected in an increase of 4.1% in average rental rates from $1,318 per unit for 2010 to $1,372 per unit for 2011. Scheduled rents increased in all regions by 2.7%, 6.2%, and 4.8% in Southern California, Northern California, and Seattle Metro, respectively. Other income and free rent also increased by $0.6 million and $1.6 million, respectively in 2011 compared to 2010. Occupancy decreased 50 basis points in 2011 to 96.4% compared to 96.9% in 2010 which resulted in a decrease in revenue of $2.5 million due to the Company’s focus on increasing renewal and new lease rents at the communities compared to 2010 and 2009 when high occupancy was the primary objective due to market conditions.
2011/2010 Non-Same Property Revenues
revenue increased $45.2 million or 148% to $75.7 million in 2011 compared to $30.5 million in 2010. The increase was primarily generated from the acquisition of twelve operating properties since January 1, 2010 (Santee Court, Courtyard off Main, Corbella at Juanita Bay, Anavia, 416 on Broadway, 101 San Fernando, The Commons, Bella Villagio, Elevation, 1000 Kiely, The Bernard, and Delano). The increase in 2011/2010 Non-Same Property revenue is also attributable to revenue earned from eight development communities (Via, Santee Village, Bellerive, Muse, Allegro, Axis 2300, Fourth & U and Joule) and the acquisition of the Santa Clara retail center.
Management and other fees from affiliates
increased $2.2 million or 49.0% to $6.8 million in 2011 compared to $4.6 million in 2010. The increase is primarily due to the asset and property management fees earned from Wesco I and II co-investments formed during 2011, and development fees earned from the joint ventures formed in 2011 to develop Epic, West Dublin, The Huxley (formerly Fountain at La Brea), The Dylan (formerly Santa Monica at La Brea), and Expo (formerly Queen Anne) development projects.
Property operating expenses, excluding real estate taxes
increased $11.5 million or 11.0% for 2011 compared to 2010, primarily due to the acquisition of twelve communities and one retail center, and the lease-up of eight development properties. 2011/2010 Same-Property operating expenses excluding real estate taxes increased by $2.1 million or 2.2% for 2011 compared to 2010, due primarily to an increase of $1.1 million in repairs and maintenance expenses including a $0.5 million increase in turnover costs.
Real estate taxes
increased $4.6 million or 11.7% for 2011 compared to 2010, due primarily to the acquisition of twelve communities and one retail center and expensing property taxes instead of capitalizing the cost for communities that were previously under development. Same-Property real estate taxes decreased by $0.7 million or 1.9% for 2011 compared to the 2010 due to a reduction in assessed property valuations for select communities located in California and a decrease in assessed valuations for select properties in the Seattle Metro.
Depreciation expense
increased by $23.2 million or 18.1% for 2011 compared to 2010, due to the acquisition of twelve communities, the completion of eight development communities, and the capitalization of approximately $95.3 million in additions to rental properties for 2011, including $45.1 million spent on redevelopment, $16.4 million spent on improvements to recent acquisitions, $7.6 million on revenue generating capital, and the capitalization of approximately $51.4 million in additions to rental properties for 2010, including the capitalization of approximately $15.7 million spent on redevelopment and revenue generating capital and $6.4 million on acquisition capital.
General and administrative expense
decreased $2.6 million or 11.0% for 2011 compared to 2010 primarily due to $1.6 million in non-recurring compensation costs related to the CEO’s retirement in 2010 and certain staff in 2011 reallocated to manage newly formed co-investments including Wesco I and II.
Cost of management and other fees
increased $1.9 million or 70.3% compared to 2010 primarily due to an increase in administrative costs due to hiring of additional staff to assist with the management of the Company’s co-investments including Wesco I and II and the development joint ventures formed in 2011.
Impairment and other charges
of $2.3 million in 2010
relates to an expense recorded by the Company due to the hedge ineffectiveness of certain forward-starting swaps that were settled in 2010.
Interest expense before amortization
increased $8.9 million or 10.8% in 2011
,
primarily due to the increase in average outstanding debt, and a decrease in capitalized interest of $1.2 million compared to 2010.
Amortization expense
increased by $6.6 million in 2011 compared to 2010 due primarily to the settlement of forward starting swaps in the third and fourth quarters of 2010 that were applied to new 10-year secured mortgage loans, and as a result, the settlement amounts are being amortized over the ten years.
Interest and other income
decreased by $10.7 million for 2011 primarily due to a decrease of $7.5 million in gains from the sales of marketable securities. The Company sold marketable securities for a gain of $5.0 million during 2011 compared to $12.5 million in gains generated from the sale of marketable securities for 2010. Additionally, interest on notes receivables decreased by $3.4 million in 2011 compared to 2010. This primarily relates to the settlement of the Santee Court note in 2010 upon the Company’s acquisition of the Santee Court property and a full year of interest in 2011 on a note purchased at a discount during the fourth quarter of 2010. Finally, interest and dividends on marketable securities decreased by $1.6 million in 2011 compared to 2010 due to lower average investment balances, and this decrease was offset by a $1.6 million increase in other income resulting from an income tax benefit from a taxable REIT subsidiary that met the “more likely than not” threshold in the fourth quarter of 2011. This tax benefit relates to the write-off of an investment in a joint venture development project recognized during 2009.
Equity income (loss) in co-investments
was a loss of $0.5 million in 2011 compared to a loss of $1.7 million in 2010 due primarily to the gain on the sale of a co-investment of $0.9 million and an increase in income of $3.3 million related to the Company’s preferred equity investments made in 2010 and 2011, partially offset by an increase in losses attributable to Wesco I and Essex Skyline at MacArthur Place. Essex Skyline at MacArthur Place achieved stabilization in second quarter of 2011.
Loss on early retirement of debt
was $1.2 million for 2011 due to the write-off of deferred financing costs related to the termination of the Company’s $250 million secured line of credit with Freddie Mac and mortgages paid-off before maturity in 2011.
Income from discontinued operations
for 2011 was $8.6 million and includes a gain of $7.5 million on the sale of Woodlawn Colonial and Clarendon, net of internal disposition costs. For 2011 and 2010 discontinued operations consisted of the operating results of the two properties sold in 2011 and the operating results of Tierra del Sol/Norte and Alpine Country which were sold in 2012.
Excess of the carrying amount of preferred stock redeemed over the cash paid to redeem preferred stock
for 2011 was $1.9 million due to the redemption of all of the Series B preferred units, which resulted in excess of cash paid of $1.0 million over the carrying value of Series B preferred units and the redemption of Series F preferred stock which resulted in excess of cash paid of $0.9 million over the carrying value of Series F preferred stock due to deferred offering costs and original issuance discounts.
Liquidity and Capital Resources
Fitch Ratings ("Fitch"), Moody’s Investor Service, and Standard and Poor's (“S&P”) credit agencies rate Essex Property Trust, Inc. and Essex Portfolio, L.P. BBB+/Stable, Baa2/Stable, and BBB/Stable, respectively.
At December 31, 2012, the Company had $18.6 million of unrestricted cash and cash equivalents and $92.7 million in marketable securities, of which $40.7 million were held available for sale. The Company believes that cash flows generated by its operations, existing cash, cash equivalents, and marketable securities balances, availability under existing lines of credit, access to capital markets and the ability to generate cash from the disposition of real estate are sufficient to meet all of the Company’s reasonably anticipated cash needs during 2013. The timing, source and amounts of cash flows provided by financing activities and used in investing activities are sensitive to changes in interest rates and other fluctuations in the capital markets environment, which can affect the Company’s plans for acquisitions, dispositions, development and redevelopment activities.
The Company has two lines of credit aggregating $525.0 million as of December 31, 2012. The Company had a $500.0 million unsecured line of credit that was increased to $600.0 million in January 2013. As of December 31, 2012 there was a $141.0 million balance on this unsecured line. The underlying interest rate on the $500.0 million facility is based on a tiered rate structure tied to Fitch and S&P ratings on the credit facility and the rate was LIBOR plus 1.075% as of December 31, 2012. This facility matures in December 2015 with two one-year extensions, exercisable by the Company. The Company has a working capital unsecured line of credit agreement for $25.0 million. This facility matures in January 2014, with a one year extension option. As of December 31, 2012 there was no balance outstanding on this unsecured line. The underlying interest rate on the $25.0 million line is based on a tiered rate structure tied to Fitch and S&P ratings on the credit facility of LIBOR plus 1.075%.
As of December 31 2012, the Company had $465 million of unsecured bonds outstanding at an average interest rate of 4.5%. During the second quarter of 2012, the Company issued through private placements, $100 million of bonds and $50 million of bonds at 4.27% and 4.30%, respectively, due in 2021 and during the third quarter of 2012, $50 million of bonds at 4.37% due in 2021.
As of December 31, 2012, the Company had a $350 million unsecured term loan outstanding at an average interest rate of 2.7%. The term loan has a variable interest rate of LIBOR plus 1.2%. During the fourth quarter of 2012, the Company increased the size of the term loan from $200 million to $350 million. The Company entered into interest rate swap contracts for a term of five years with a notional amount totaling $300 million, which effectively converted the interest rate on $300 million of the term loan to a fixed rate.
During the third quarter of 2012, the Company issued $300 million of senior unsecured bonds due August 2022 with a coupon rate of 3.625% per annum and payable on February 15
th
and August 15
th
of each year, beginning February 15, 2013.
The Company’s unsecured line of credit and unsecured debt agreements contain debt covenants related to limitations on indebtedness and liabilities and maintenance of minimum levels of consolidated earnings before depreciation, interest and amortization. The Company was in compliance with the debt covenants as of December 31, 2012 and 2011.
During March 2010, the Company filed a new shelf registration statement with the SEC, allowing the Company to sell an undetermined number or amount of certain equity and debt securities as defined in the prospectus. The Company intends to file a new shelf registration statement in March 2013.
In the second quarter of 2011, the Company issued 2,950,000 shares of 7.125% Series H Cumulative Redeemable Preferred Stock (“Series H”) at a price of $25.00 per share for net proceeds of $71.2 million, net of costs and original issuance discounts. The Series H has no maturity date and generally may not be called by the Company before April 13, 2016. Net proceeds from the Series H offering were used to redeem all of the 7.875% Series B Cumulative Redeemable Preferred Units of Essex Portfolio, L.P. (“Series B”) with a liquidation value of $80.0 million. The Company also redeemed its 7.8125% Series F Preferred Stock (“Series F”) at liquidation value for $25.0 million.
As of December 31, 2012, the Company’s mortgage notes payable totaled $1.6 billion which consisted of $1.4 billion in fixed rate debt with interest rates varying from 4.3% to 6.4% and maturity dates ranging from 2013 to 2021 and $201.9 million of tax-exempt variable rate demand notes with a weighted average interest rate of 1.9%. The tax-exempt variable rate demand notes have maturity dates ranging from 2013 to 2039, and $187.8 million are subject to interest rate caps.
The Company pays quarterly dividends from cash available for distribution. Until it is distributed, cash available for distribution is invested by the Company primarily in investment grade securities held available for sale or is used by the Company to reduce balances outstanding under its line of credit.
Derivative Activity
The Company has entered into interest rate swap contracts with an aggregate notional amount of $300 million that effectively fixed the interest rate on $300 million of the $350 million unsecured term loan at 2.7%. These derivatives qualify for hedge accounting.
As of December 31, 2012 the Company also had twelve interest rate cap contracts totaling a notional amount of $187.8 million that qualify for hedge accounting as they effectively limit the Company’s exposure to interest rate risk by providing a ceiling on the underlying variable interest rate for $187.8 million of the $202.1 million of the Company’s tax exempt variable rate debt.
During the third quarter 2012, the Company terminated a swap transaction with respect to the $38.0 million of tax-exempt bonds for the 101 San Fernando apartment community with Citibank because the bonds were repurchased by the Company at par.
As of December 31, 2012 and 2011 the aggregate carrying value of the interest rate swap contracts was a liability of $6.6 million and $1.4 million, respectively. The aggregate carrying value of the interest rate cap contracts was zero on the balance sheet as of December 31, 2012, and was an asset of $0.2 million as of December 31, 2011.
During the first quarter of 2011, the Company settled its remaining $20.0 million forward starting swap contract for $2.3 million which was applied to the $32.0 million mortgage obtained in February 2011, increasing the effective borrowing rate from 5.4% to 6.2%.
During 2010, the Company settled $355 million in forward-starting swap contracts for $81.3 million, which was applied to 10-year mortgage loans obtained in 2010. The settlement of the forward-starting swaps increased the average effective interest rate on the 2010 mortgage loans from 4.5% to 6.8%. During 2010, the Company incurred $2.3 million in expense related to the ineffectiveness of certain of the settled forward-starting swap hedges, which is included in impairment and other charges in the accompanying consolidated statement of operations for the year ended December 31, 2010. No hedge ineffectiveness on cash flow hedges was incurred during the years ended December 31, 2012 and 2011.
Issuance of Common Stock
The Company has entered into equity distribution agreements with Cantor Fitzgerald & Co, KeyBanc Capital Markets Inc., Barclays Capital Inc., BMO Capital Markets Corp., Liquidnet, Inc., Mitsubishi UFJ Securities (USA), Inc., and Citigroup Global Markets Inc. Pursuant to its equity distribution program, in 2012, the Company issued 2,404,096 million shares of common stock for $357.7 million, net of fees and commissions, and in 2011, the Company issued 2,459,947 million shares of common stock for $323.9 million, net of fees and commissions. During the first quarter of 2013 through February 21, 2013, the Company has issued 758,644 shares of common stock at an average price of $151.70 for $114.0 million, net of fees and commissions. Under this program, the Company may from time to time sell shares of common stock into the existing trading market at current market prices, and the Company anticipates using the net proceeds to pay down debt, acquire apartment communities and fund the development pipeline. As of February 21, 2013, the Company may sell an additional 1,343,239 shares under the current equity distribution program.
Capital Expenditures
Non-revenue generating capital expenditures are improvements and upgrades that extend the useful life of the property. For the year ended December 31, 2012, non-revenue generating capital expenditures totaled approximately $1,101 per unit. The Company expects to incur approximately $1,150 per unit in non-revenue generating capital expenditures for the year ending December 31, 2013. These expenditures do not include the improvements required in connection with the origination of mortgage loans, expenditures for deferred maintenance on acquisition properties, and expenditures for property renovations and improvements which are expected to generate additional revenue. The Company expects that cash from operations and/or its lines of credit will fund such expenditures. However, there can be no assurance that the actual expenditures incurred during 2013 and/or the funding thereof will not be significantly different than the Company’s current expectations.
Development and Predevelopment Pipeline
The Company defines development activities as new communities that are in various stages of active development, or the community is in lease-up and phases of the project are not completed. As of December 31, 2012, the Company had two consolidated development projects comprised of 311 units with an estimated cost of $95.8 million of which $76.2 million remains to be expended, and seven unconsolidated joint venture active development projects comprised of 2,184 units with an estimated cost of $832.6 million, of which $387.7 million remains to be expended. See discussion in the section, “
Development and redevelopment activities may be delayed, not completed, and/or not achieve expected results
” in Item 1A, Risk Factors, of this Form 10-K.
The Company defines the predevelopment pipeline as proposed communities in negotiation or in the entitlement process with a high likelihood of becoming entitled development projects. As of December 31, 2012, the Company had two consolidated joint venture development that classified as predevelopment projects aggregating 249 units for a total estimated cost of $39.8 million, and one unconsolidated joint venture predevelopment project aggregating 200 units for a total estimated cost of $19.8 million. The Company may also acquire land for future development purposes or sale. The Company had incurred $7.5 million in costs related to a land parcel held for future development or sale as of December 31, 2012, which was sold in the first quarter of 2013.
The Company expects to fund the development and predevelopment pipeline by using a combination of some or all of the following sources: its working capital, amounts available on its lines of credit, construction loans, net proceeds from public and private equity and debt issuances, and proceeds from the disposition of properties, if any.
Redevelopment Pipeline
The Company defines redevelopment communities as existing properties owned or recently acquired, which have been targeted for additional investment by the Company with the expectation of increased financial returns through property improvement. During redevelopment, apartment units may not be available for rent and, as a result, may have less than stabilized operations. As of December 31, 2012, the Company had ownership interests in five major redevelopment communities aggregating 1,056 apartment units with estimated redevelopment costs of $64.9 million, of which approximately $20.7 million remains to be expended.
Alternative Capital Sources
Fund II has eight institutional investors, and the Company, with combined partner equity contributions of $265.9 million. The Company contributed $75.0 million to Fund II, which represents a 28.2% interest as general partner and limited partner, and the Company uses the equity method of accounting for its investment in Fund II. Fund II utilized leverage equal to approximately 55% upon the initial acquisition of the underlying real estate. Fund II invested in apartment communities in the Company’s targeted West Coast markets and, as of December 31, 2012, owned seven apartment communities. The Company records revenue for its asset management, property management, development and redevelopment services when earned, and promote income when realized if Fund II exceeds certain financial return benchmarks. Seven communities were sold during 2012 from Fund II, and it is anticipated that the remaining seven communities will be sold during 2013.
Wesco, I LLC (“Wesco I”) is a 50/50 programmatic joint venture with an institutional partner for a total equity commitment of $300.0 million. Each partner’s equity commitment is $150.0 million. Wesco I will utilize debt as leverage equal to approximately 50% of the underlying real estate. The Company has contributed $150.0 million to Wesco I, and as of December 31, 2012, Wesco I owned nine apartment communities with 2,713 units with an aggregate carrying value of $660.5 million.
During 2012, the Company entered into a 50/50 programmatic joint venture, Wesco III LLC (“Wesco III”), with an institutional partner for a total equity commitment from the parties of $120.0 million. Each partner’s commitment is $60.0 million. Wesco III will utilize debt as leverage equal to approximately 50% of the underlying real estate. The Company has contributed $10.0 million to Wesco III, and provided a $26.0 million short term bridge loan to Wesco III at a rate of LIBOR + 2.5%, and as of December 31, 2012, Wesco III owned one apartment community with 264 units for a purchase price of $45.6 million. Permanent secured financing is expected to be placed on the property in the first quarter of 2013.
Contractual Obligations and Commercial Commitments
The following table summarizes the maturation or due dates of the Company’s contractual obligations and other commitments at December 31, 2012, and the effect such obligations could have on the Company’s liquidity and cash flow in future periods ($ in thousands):
|
2014 and
|
2016 and
|
|||||||||||||||||||
|
2013
|
2015
|
2017
|
Thereafter
|
Total
|
||||||||||||||||
|
Mortgage notes payable
|
$ | 57,621 | $ | 134,268 | $ | 197,957 | $ | 1,175,753 | $ | 1,565,599 | ||||||||||
|
Unsecured debt
|
- | - | 540,000 | 572,084 | 1,112,084 | |||||||||||||||
|
Lines of credit
|
- | 141,000 | - | - | 141,000 | |||||||||||||||
|
Interest on indebtedness (1)
|
119,547 | 226,264 | 180,971 | 225,038 | 751,820 | |||||||||||||||
|
Development commitments (including co-investments)
|
198,400 | 87,700 | - | - | 286,100 | |||||||||||||||
|
Redevelopment commitments
|
13,820 | 6,908 | - | - | 20,728 | |||||||||||||||
| $ | 389,388 | $ | 596,140 | $ | 918,928 | $ | 1,972,875 | $ | 3,877,331 | |||||||||||
(1) Interest on indebtedness for variable debt was calculated using interest rates as of December 31, 2012.
Variable Interest Entities
In accordance with accounting standards for consolidation of variable interest entities, the Company consolidates 19 DownREIT limited partnerships (comprising twelve communities). The Company consolidates these entities because it is deemed the primary beneficiary. The consolidated total assets and liabilities related to these VIEs, net of intercompany eliminations, were approximately $201.1 million and $178.6 million, respectively, as of December 31, 2012, and $199.8 million and $171.5 million, respectively, as of December 31, 2011. Interest holders in VIEs consolidated by the Company are allocated net income equal to the cash payments made to those interest holders for services rendered or distributions from cash flow. The remaining results of operations are generally allocated to the Company. As of December 31, 2012, the Company did not have any VIE’s of which it was not deemed to be the primary beneficiary.
Critical Accounting Policies and Estimates
The preparation of consolidated financial statements, in accordance with U.S. generally accepted accounting principles, requires the Company to make estimates and judgments that affect the reported amounts of assets, liabilities, revenues and expenses and related disclosures of contingent assets and liabilities. The Company defines critical accounting policies as those accounting policies that require the Company's management to exercise their most difficult, subjective and complex judgments. The Company’s critical accounting policies relate principally to the following key areas: (i) consolidation under applicable accounting standards of various entities; (ii) assessing the carrying values of the Company's real estate and investments in and advances to joint ventures and affiliates; and (iii) internal cost capitalization. The Company bases its estimates on historical experience, current market conditions, and on various other assumptions that are believed to be reasonable under the circumstances. Actual results may differ from those estimates made by management.
The Company assesses each entity in which it has an investment or contractual relationship to determine if it may be deemed to be a VIE. If such an entity is a VIE, then the Company performs an analysis to determine who is the primary beneficiary. If the Company is the primary beneficiary, then the entity is consolidated. The analysis required to identify VIEs and primary beneficiaries is complex and judgmental, and the analysis must be applied to various types of entities and legal structures.
The Company assesses the carrying value of its real estate investments by monitoring investment market conditions and performance compared to budget for operating properties and joint ventures, and by monitoring estimated costs for properties under development. Local market knowledge and data is used to assess carrying values of properties and the market value of acquisition opportunities. Whenever events or changes in circumstances indicate that the carrying amount of a property held for investment may not be fully recoverable, the carrying amount is evaluated. If the sum of the property’s expected future cash flows (undiscounted and without interest charges) is less than the carrying amount of the property, then the Company will recognize an impairment loss equal to the excess of the carrying amount over the fair value of the property. Adverse changes in market conditions or poor operating results of real estate investments could result in impairment charges. When the Company determines that a property is held for sale, it discontinues the periodic depreciation of that property. The criteria for determining when a property is held for sale requires judgment and has potential financial statement impact as depreciation would cease and an impairment loss could occur upon determination of held for sale status. Assets held for sale are reported at the lower of the carrying amount or estimated fair value less costs to sell. With respect to investments in and advances to joint ventures and affiliates, the Company looks to the underlying properties to assess performance and the recoverability of carrying amounts for those investments in a manner similar to direct investments in real estate properties.
Further, the Company evaluates whether its co-investments have other than temporary impairment and, if so, records a write down.
The Company capitalizes all direct and certain indirect costs, including interest and real estate taxes, incurred during development and redevelopment activities. Interest is capitalized on real estate assets that require a period of time to get them ready for their intended use. The amount of interest capitalized is based upon the average amount of accumulated development expenditures during the reporting period. Included in capitalized costs are management’s accounting estimates of the direct and incremental personnel costs and indirect project costs associated with the Company's development and redevelopment activities. Indirect project costs consist primarily of personnel costs associated with construction administration and development, including accounting, legal fees, and various office costs that clearly relate to projects under development.
The Company bases its accounting estimates on historical experience and on various other assumptions that are believed to be reasonable under the circumstances. Actual results may vary from those estimates and those estimates could be different under different assumptions or conditions.
Forward Looking Statements
Certain statements in this "Management's Discussion and Analysis of Financial Condition and Results of Operations," and elsewhere in this Annual Report on Form 10-K which are not historical facts may be considered forward looking statements within the meaning of Section 27A of the Securities Act of 1933, as amended, and Section 21E of the Securities and Exchange Act of 1934, as amended, including statements regarding the Company's expectations, hopes, intentions, beliefs and strategies regarding the future. Forward looking statements include statements regarding the Company's expectations as to the timing of completion of current development and redevelopment projects and the stabilization dates of such projects, expectation as to the total projected costs of development and redevelopment projects, beliefs as to the adequacy of future cash flows to meet operating requirements and anticipated cash needs and to provide for dividend payments in accordance with REIT requirements, expectations as to the amount of non-revenue generating capital expenditures, future acquisitions, the Company's development and redevelopment pipeline and the sources of funding for it, the anticipated performance of existing properties, the effect of property sales on future results, anticipated property and growth trends in various geographic regions, statements regarding the Company’s expected 2013 rental income, 2013 Same-Property revenue, 2013 Same-Property financial occupancy, 2013 Same-Property operating expenses and 2013 Same-Property net operating income, statements regarding the Company's financing activities, and the use of proceeds from such activities.
Such forward-looking statements involve known and unknown risks, uncertainties and other factors including, but not limited to, that the Company will fail to achieve its business objectives, that the actual completion of development and redevelopment projects will be subject to delays, that the stabilization dates of such projects will be delayed, that the total projected costs of current development and redevelopment projects will exceed expectations, that such development and redevelopment projects will not be completed, that development and redevelopment projects and acquisitions will fail to meet expectations, that estimates of future income from an acquired property may prove to be inaccurate, that future cash flows will be inadequate to meet operating requirements and/or will be insufficient to provide for dividend payments in accordance with REIT requirements, that the actual non-revenue generating capital expenditures will exceed the Company's current expectations, that there may be a downturn in the markets in which the Company's communities are located, that the terms of any refinancing may not be as favorable as the terms of existing indebtedness, as well as those risks, special considerations, and other factors discussed in Item 1A, Risk Factors, of this Form 10-K, and those risk factors and special considerations set forth in the Company’s other filings with the Securities and Exchange Commission (the "SEC") which may cause the actual results, performance or achievements of the Company to be materially different from any future results, performance or achievements expressed or implied by such forward-looking statements. All forward-looking statements are made as of today, and the Company assumes no obligation to update this information.
Funds from Operations ("FFO")
FFO is a financial measure that is commonly used in the REIT industry. The Company presents funds from operations as a supplemental operating performance measure. FFO is not used by the Company, nor should it be considered to be, as an alternative to net earnings computed under GAAP as an indicator of the Company’s operating performance or as an alternative to cash from operating activities computed under GAAP as an indicator of the Company's ability to fund its cash needs.
FFO is not meant to represent a comprehensive system of financial reporting and does not present, nor does the Company intend it to present, a complete picture of its financial condition and operating performance. The Company believes that net earnings computed under GAAP remains the primary measure of performance and that FFO is only meaningful when it is used in conjunction with net earnings. Further, the Company believes that its consolidated financial statements, prepared in accordance with GAAP, provide the most meaningful picture of its financial condition and its operating performance.
In calculating FFO, the Company follows the definition for this measure published by the National Association of Real Estate Investment Trusts (“NAREIT”), which is a REIT trade association. The Company believes that, under the NAREIT FFO definition, the two most significant adjustments made to net income are (i) the exclusion of historical cost depreciation and (ii) the exclusion of gains and losses from the sale of previously depreciated properties. Essex agrees that these two NAREIT adjustments are useful to investors for the following reasons:
|
(a)
|
historical cost accounting for real estate assets in accordance with GAAP assumes, through depreciation charges, that the value of real estate assets diminishes predictably over time. NAREIT stated in its White Paper on Funds from Operations “since real estate asset values have historically risen or fallen with market conditions, many industry investors have considered presentations of operating results for real estate companies that use historical cost accounting to be insufficient by themselves.” Consequently, NAREIT’s definition of FFO reflects the fact that real estate, as an asset class, generally appreciates over time and depreciation charges required by GAAP do not reflect the underlying economic realities.
|
|
(b)
|
REITs were created as a legal form of organization in order to encourage public ownership of real estate as an asset class through investment in firms that were in the business of long-term ownership and management of real estate. The exclusion, in NAREIT’s definition of FFO, of gains from the sales of previously depreciated operating real estate assets allows investors and analysts to readily identify the operating results of the long-term assets that form the core of a REIT’s activity and assists in comparing those operating results between periods.
|
Management has consistently applied the NAREIT definition of FFO to all periods presented. However, other REITs in calculating FFO may vary from the NAREIT definition for this measure, and thus their disclosure of FFO may not be comparable to the Company’s calculation.
The following table sets forth the Company’s calculation of FFO and Core FFO for 2012 ($ in thousands).
|
For the year
|
||||||||||||||||||||
|
ended
|
For the quarter ended
|
|||||||||||||||||||
|
12/31/12
|
12/31/12
|
9/30/12
|
6/30/12
|
3/31/12
|
||||||||||||||||
|
Net income available to common stockholders
|
$ | 119,812 | $ | 43,793 | $ | 16,219 | $ | 37,078 | $ | 22,722 | ||||||||||
|
Adjustments:
|
||||||||||||||||||||
|
Depreciation and amortization
|
170,686 | 45,017 | 43,041 | 41,801 | 40,827 | |||||||||||||||
|
Gains not included in FFO, net of internal disposition costs
|
(60,842 | ) | (29,112 | ) | - | (21,947 | ) | (9,783 | ) | |||||||||||
|
Depreciation add back from unconsolidated co-investments and add back convertible preferred dividend - Series G
|
14,467 | 3,365 | 3,352 | 3,366 | 4,384 | |||||||||||||||
|
Noncontrolling interests related to Operating Partnership units
|
7,950 | 2,781 | 1,077 | 2,502 | 1,590 | |||||||||||||||
|
Depreciation attributable to third party of co-investments
|
(1,223 | ) | (319 | ) | (312 | ) | (303 | ) | (289 | ) | ||||||||||
|
Funds from operations
|
$ | 250,850 | $ | 65,525 | $ | 63,377 | $ | 62,497 | $ | 59,451 | ||||||||||
|
Funds from operations per share - diluted
|
$ | 6.71 | $ | 1.72 | $ | 1.67 | $ | 1.69 | $ | 1.63 | ||||||||||
|
Non-core items:
|
||||||||||||||||||||
|
Loss on early retirement of debt
|
5,009 | 2,348 | 1,211 | 1,450 | - | |||||||||||||||
|
Acquisition costs
|
2,255 | 1,480 | 277 | 312 | 186 | |||||||||||||||
|
Gain on sales of marketable securities
|
(819 | ) | (298 | ) | - | (521 | ) | - | ||||||||||||
|
Co-investment promote income
|
(2,299 | ) | - | - | (2,299 | ) | - | |||||||||||||
|
Funds from operations excluding non-core items
|
$ | 254,996 | $ | 69,055 | $ | 64,865 | $ | 61,439 | $ | 59,637 | ||||||||||
|
Core funds from operations per share - diluted
|
$ | 6.82 | $ | 1.81 | $ | 1.71 | $ | 1.66 | $ | 1.64 | ||||||||||
|
Weighted average number of shares outstanding, diluted
(1)
|
37,377,986 | 38,182,569 | 37,969,407 | 36,947,477 | 36,396,641 | |||||||||||||||
The following table sets forth the Company’s calculation of FFO and Core FFO for 2011 ($ in thousands).
|
For the year
|
||||||||||||||||||||
|
ended
|
For the quarter ended
|
|||||||||||||||||||
|
12/31/11
|
12/31/11
|
9/30/11
|
6/30/11
|
3/31/11
|
||||||||||||||||
|
Net income available to common stockholders
|
$ | 40,368 | $ | 13,937 | $ | 7,687 | $ | 10,325 | $ | 8,419 | ||||||||||
|
Adjustments:
|
- | |||||||||||||||||||
|
Depreciation and amortization
|
152,544 | 39,863 | 38,137 | 37,510 | 37,034 | |||||||||||||||
|
Gains not included in FFO, net of internal disposition costs.
|
(7,543 | ) | (3,159 | ) | 880 | (5,264 | ) | - | ||||||||||||
|
Depreciation add back from unconsolidated co-investments and add back convertible preferred dividend - Series G
|
12,642 | 4,145 | 3,502 | 1,957 | 3,038 | |||||||||||||||
|
Noncontrolling interests related to
|
||||||||||||||||||||
|
Operating Partnership units
|
3,228 | 1,027 | 583 | 987 | 631 | |||||||||||||||
|
Depreciation attributable to third party of co-investments
|
(1,066 | ) | (277 | ) | (266 | ) | (260 | ) | (263 | ) | ||||||||||
|
Funds from operations
|
$ | 200,173 | $ | 55,536 | $ | 50,523 | $ | 45,255 | $ | 48,859 | ||||||||||
|
Funds from operations per share - diluted
|
$ | 5.74 | $ | 1.55 | $ | 1.43 | $ | 1.32 | $ | 1.45 | ||||||||||
|
Non-core items:
|
||||||||||||||||||||
|
Loss on early retirement of debt
|
1,163 | 343 | 567 | 253 | - | |||||||||||||||
|
Acquisition costs
|
1,231 | 181 | 210 | 510 | 330 | |||||||||||||||
|
Gain on sales of marketable securities
|
(4,956 | ) | (414 | ) | - | - | (4,542 | ) | ||||||||||||
|
Tax benefit - TRS activity
|
(1,682 | ) | (1,682 | ) | - | - | - | |||||||||||||
|
Gain on sale of co-investment
|
(919 | ) | - | (919 | ) | - | - | |||||||||||||
|
Gain on sale of land
|
(180 | ) | - | (180 | ) | - | - | |||||||||||||
|
Excess of cash paid to redeem preferred stock and units over the carrying value
|
1,949 | - | - | 1,949 | - | |||||||||||||||
|
Funds from operations excluding non-core items
|
$ | 196,779 | $ | 53,964 | $ | 50,201 | $ | 47,967 | $ | 44,647 | ||||||||||
|
Core funds from operations per share - diluted
|
$ | 5.64 | $ | 1.51 | $ | 1.42 | $ | 1.40 | $ | 1.32 | ||||||||||
|
Weighted average number of shares outstanding, diluted
(1)
|
34,860,521 | 35,818,631 | 35,437,693 | 34,365,418 | 33,787,332 | |||||||||||||||
|
(1)
|
Assumes conversion of all dilutive outstanding operating partnership interests in the Operating Partnership.
|
The following table sets forth the Company’s cash flows for 2012 and 2011 ($ in thousands).
|
For the year
|
||||||||||||||||||||
|
ended
|
For the quarter ended
|
|||||||||||||||||||
|
12/31/12
|
12/31/2012
|
9/30/2012
|
6/30/2012
|
3/31/2012
|
||||||||||||||||
|
Cash flow provided by (used in):
|
||||||||||||||||||||
|
Operating activities
|
$ | 267,499 | $ | 48,164 | $ | 89,943 | $ | 57,232 | $ | 72,160 | ||||||||||
|
Investing activities
|
(812,138 | ) | (294,072 | ) | (201,888 | ) | (272,127 | ) | (44,051 | ) | ||||||||||
|
Financing activities
|
550,356 | 262,571 | 109,756 | 205,283 | (27,254 | ) | ||||||||||||||
|
For the year
|
||||||||||||||||||||
|
ended
|
For the quarter ended
|
|||||||||||||||||||
|
12/31/11
|
12/31/2011
|
9/30/2011
|
6/30/2011
|
3/31/2011
|
||||||||||||||||
|
Cash flow provided by (used in):
|
||||||||||||||||||||
|
Operating activities
|
$ | 216,571 | $ | 45,877 | $ | 66,343 | $ | 47,044 | $ | 57,307 | ||||||||||
|
Investing activities
|
(425,783 | ) | (167,271 | ) | (108,393 | ) | (65,933 | ) | (84,186 | ) | ||||||||||
|
Financing activities
|
208,348 | 125,263 | 42,261 | (69,985 | ) | 110,809 | ||||||||||||||
Net Operating Income (“NOI”)
Same-Property net operating income (“NOI”) is considered by management to be an important supplemental performance measure to earnings from operations included in the Company’s consolidated statements of operations. The presentation of same-property NOI assists with the presentation of the Company’s operations prior to the allocation of depreciation and any corporate-level or financing-related costs. NOI reflects the operating performance of a community and allows for an easy comparison of the operating performance of individual communities or groups of communities. In addition, because prospective buyers of real estate have different financing and overhead structures, with varying marginal impacts to overhead by acquiring real estate, NOI is considered by many in the real estate industry to be a useful measure for determining the value of a real estate asset or group of assets. The Company defines Same-Property NOI as Same-Property revenue less Same-Property operating expenses, including property taxes. Please see the reconciliation of earnings from operations to Same-Property NOI, which in the table below is the NOI for stabilized properties consolidated by the Company for the periods presented:
|
2012
|
2011
|
2010
|
||||||||||
|
Earnings from operations
|
$ | 168,925 | $ | 136,527 | $ | 110,630 | ||||||
|
Adjustments:
|
||||||||||||
|
General and administrative
|
23,307 | 20,694 | 23,255 | |||||||||
|
Cost of management and other fees
|
6,513 | 4,610 | 2,707 | |||||||||
|
Depreciation
|
170,592 | 151,428 | 128,221 | |||||||||
|
Impairment and other charges
|
- | - | 2,302 | |||||||||
|
Management and other fees from affiliates
|
(11,489 | ) | (6,780 | ) | (4,551 | ) | ||||||
|
Net operating income
|
357,848 | 306,479 | 262,564 | |||||||||
|
Less: Non Same-Property NOI
|
(39,569 | ) | (14,907 | ) | (22,867 | ) | ||||||
|
Same-Property NOI
|
$ | 318,279 | $ | 291,572 | $ | 239,697 | ||||||
Interest Rate Hedging Activities
The Company’s objective in using derivatives is to add stability to interest expense and to manage its exposure to interest rate movements or other identified risks. To accomplish this objective, the Company uses interest rate swaps as part of its cash flow hedging strategy. As of December 31, 2012, the Company has entered into ten interest rate swap contracts to mitigate the risk of changes in the interest-related cash outflows on $300.0 million of the five-year unsecured term debt. As of December 31, 2012, the Company also had $201.9 million of variable rate indebtedness, of which $187.8 million is subject to interest rate cap protection. All of the Company’s derivative instruments are designated as cash flow hedges, and the Company does not have any fair value hedges as of December 31, 2012. The following table summarizes the notional amount, carrying value, and estimated fair value of the Company’s derivative instruments used to hedge interest rates as of December 31, 2012. The notional amount represents the aggregate amount of a particular security that is currently hedged at one time, but does not represent exposure to credit, interest rates or market risks. The table also includes a sensitivity analysis to demonstrate the impact on the Company’s derivative instruments from an increase or decrease in 10-year Treasury bill interest rates by 50 basis points, as of December 31, 2012.
|
Carrying and
|
Estimated Carrying Value
|
|||||||||||||||||||
|
Notional
|
Maturity
|
Estimate Fair
|
+ 50 | - 50 | ||||||||||||||||
|
($ in thousands
)
|
Amount
|
Date Range
|
Value
|
Basis Points
|
Basis Points
|
|||||||||||||||
|
Cash flow hedges:
|
||||||||||||||||||||
|
Interest rate swaps
|
$ | 300,000 | 2016-2017 | $ | (6,606 | ) | $ | (474 | ) | $ | (11,619 | ) | ||||||||
|
Interest rate caps
|
187,788 | 2013-2018 | - | 102 | - | |||||||||||||||
|
Total cash flow hedges
|
$ | 487,788 | 2013-2018 | $ | (6,606 | ) | $ | (372 | ) | $ | (11,619 | ) | ||||||||
Interest Rate Sensitive Liabilities
The Company is exposed to interest rate changes primarily as a result of its line of credit and long-term debt used to maintain liquidity and fund capital expenditures and expansion of the Company’s real estate investment portfolio and operations. The Company’s interest rate risk management objective is to limit the impact of interest rate changes on earnings and cash flows and to lower its overall borrowing costs. To achieve its objectives the Company borrows primarily at fixed rates and may enter into derivative financial instruments such as interest rate swaps, caps and treasury locks in order to mitigate its interest rate risk on a related financial instrument. The Company does not enter into derivative or interest rate transactions for speculative purposes.
The Company’s interest rate risk is monitored using a variety of techniques. The table below presents the principal amounts and weighted average interest rates by year of expected maturity to evaluate the expected cash flows. Management has estimated that the fair value of the Company’s $2.13 billion and $1.77 billion of fixed rate debt at December 31, 2012 and 2011 respectively, to be $2.24 billion and $1.88 billion. Management has estimated the fair value of the Company’s $692.9 million and $593.7 million of variable rate debt at December 31, 2012 and 2011, respectively, is $671.7 million and $572.3 million based on the terms of existing mortgage notes payable and variable rate demand notes compared to those available in the marketplace ($ in thousands).
|
For the Years Ended December 31,
|
|||||||||||||||||||||||||||||||||
|
2013
|
2014
|
2015
|
2016
|
2017
|
Thereafter
|
Total
|
Fair value
|
||||||||||||||||||||||||||
|
Fixed rate debt
|
$ | 38,201 | $ | 47,994 | $ | 68,926 | $ | 162,656 | $ | 225,301 | $ | 1,582,737 | $ | 2,125,815 | $ | 2,237,462 | |||||||||||||||||
|
Average interest rate
|
5.6 | % | 5.2 | % | 5.2 | % | 4.5 | % | 5.5 | % | 5.4 | % | |||||||||||||||||||||
|
Variable rate debt
|
$ | 19,420 | $ | - | $ | 141,000 | $ | 200,000 | $ | 150,000 | $ | 182,448 | (1 | ) | $ | 692,868 | $ | 671,651 | |||||||||||||||
|
Average interest rate
|
1.5 | % | - | 2.3 | % | 2.6 | % | 2.7 | % | 1.9 | % | ||||||||||||||||||||||
(1) $187.8 million subject to interest rate caps.
The table incorporates only those exposures that exist as of December 31, 2012; it does not consider those exposures or positions that could arise after that date. As a result, the Company’s ultimate realized gain or loss, with respect to interest rate fluctuations and hedging strategies would depend on the exposures that arise during the period.
The response to this item is submitted as a separate section of this Form 10-K. See Item 15.
Not applicable.
As of December 31, 2012, the Company carried out an evaluation, under the supervision and with the participation of management, including its Chief Executive Officer and Chief Financial Officer, of the effectiveness of the design and operation of its disclosure controls and procedures (as defined in Rules 13a-15(e) and 15d-15(e) under the Securities Exchange Act of 1934, as amended (the “Exchange Act”)). Based upon that evaluation, the Company’s Chief Executive Officer and Chief Financial Officer concluded that as of December 31, 2012, the Company’s disclosure controls and procedures were effective to ensure that the information required to be disclosed by the Company in the reports that the Company files or submits under the Exchange Act were recorded, processed, summarized and reported within the time periods specified in the SEC's rules and forms and that such disclosure controls and procedures were also effective to ensure that information required to be disclosed in the reports that the Company files or submits under the Exchange Act is accumulated and communicated to the Company’s management, including the Company’s Chief Executive Officer and Chief Financial Officer, to allow timely decisions regarding required disclosure.
There were no changes in the Company's internal control over financial reporting, that occurred during the quarter ended December 31, 2012, that have materially affected, or are reasonably likely to materially affect, the Company's internal control over financial reporting.
Management’s Report on Internal Control Over Financial Reporting
The Company’s management is responsible for establishing and maintaining adequate internal control over financial reporting (as defined in Rule 13a-15(f) under the Securities Exchange Act of 1934, as amended). The Company’s management assessed the effectiveness of the Company’s internal control over financial reporting as of December 31, 2012. In making this assessment, the Company’s management used the criteria set forth by the Committee of Sponsoring Organizations of the Treadway Commission (“COSO”) in Internal Control-Integrated Framework. The Company’s management has concluded that, as of December 31, 2012, its internal control over financial reporting was effective based on these criteria. The Company’s independent registered public accounting firm, KPMG LLP, has issued an audit report on the effectiveness of its internal control over financial reporting, which is included herein.
None.
The information required by Item 10 is incorporated by reference from the Company’s definitive proxy statement for its annual stockholders’ meeting to be held on May 14, 2013.
The information required by Item 11 is incorporated by reference from the Company’s definitive proxy statement for its annual stockholders’ meeting to be held on May 14, 2013.
The information required by Item 12 is incorporated by reference from the Company’s definitive proxy statement for its annual stockholders’ meeting to be held on May 14, 2013.
The information required by Item 13 is incorporated by reference from the Company’s definitive proxy statement for its annual stockholders’ meeting to be held on May 14, 2013.
The information required by Item 14 is incorporated by reference from the Company’s definitive proxy statement for its annual stockholders’ meeting to be held on May 14, 2013
.
(A) Financial Statements
|
(1) Consolidated Financial Statements
|
Page
|
|
Reports of Independent Registered Public Accounting Firm
|
F-1
|
|
Consolidated Balance Sheets:
As of December 31, 2012 and 2011
|
F-4
|
|
Consolidated Statements of Operations:
Years ended December 31, 2012, 2011, and 2010
|
F-5
|
|
Consolidated Statements of Comprehensive Income (Loss):
Years ended December 31, 2012, 2011, and 2010
|
F-6
|
|
Consolidated Statements of Equity:
Years ended December 31, 2012, 2011, and 2010
|
F-7
|
|
Consolidated Statements of Cash Flows:
Years ended December 31, 2012, 2011, and 2010
|
F-
8
|
|
Notes to the Consolidated Financial Statements
|
F-
10
|
|
(2) Financial Statement Schedule - Schedule III - Real Estate and Accumulated Depreciation as of December 31, 2011
|
F-3
8
|
|
(3) See the Exhibit Index immediately following the signature page and certifications for a list of exhibits filed or incorporated by reference as part of this report.
|
(B) Exhibits
The Company hereby files, as exhibits to this Form 10-K, those exhibits listed on the Exhibit Index referenced in Item 15(A)(3) above.
Report of Independent Registered Public Accounting Firm
The Board of Directors and Stockholders
Essex Property Trust, Inc.:
We have audited the accompanying consolidated balance sheets of Essex Property Trust, Inc. and subsidiaries as of December 31, 2012 and 2011, and the related consolidated statements of operations, comprehensive income (loss), equity, and cash flows for each of the years in the three-year period ended December 31, 2012. In connection with our audits of the consolidated financial statements, we have also audited the accompanying financial statement schedule III. These consolidated financial statements and the accompanying financial statement schedule III are the responsibility of Essex Property Trust Inc.’s management. Our responsibility is to express an opinion on these consolidated financial statements and the accompanying financial statement schedule III based on our audits.
We conducted our audits in accordance with the standards of the Public Company Accounting Oversight Board (United States). Those standards require that we plan and perform the audit to obtain reasonable assurance about whether the financial statements are free of material misstatement. An audit includes examining, on a test basis, evidence supporting the amounts and disclosures in the financial statements. An audit also includes assessing the accounting principles used and significant estimates made by management, as well as evaluating the overall financial statement presentation. We believe that our audits provide a reasonable basis for our opinion.
In our opinion, the consolidated financial statements referred to above present fairly, in all material respects, the financial position of Essex Property Trust, Inc. and subsidiaries as of December 31, 2012 and 2011, and the results of their operations and their cash flows for each of the years in the three-year period ended December 31, 2012, in conformity with U.S. generally accepted accounting principles. Also in our opinion, the related financial statement schedule III, when considered in relation to the basic consolidated financial statements taken as a whole, presents fairly, in all material respects, the information set forth therein.
We also have audited, in accordance with the standards of the Public Company Accounting Oversight Board (United States), Essex Property Trust, Inc.’s internal control over financial reporting as of December 31, 2012, based on criteria established in Internal Control–Integrated Framework issued by the Committee of Sponsoring Organizations of the Treadway Commission (COSO), and our report dated February 22, 2013 expressed an unqualified opinion on the effectiveness of Essex Property Trust, Inc.’s internal control over financial reporting.
| /S/ KPMG LLP | |
| KPMG LLP |
San Francisco, California
February 22, 2013
Report of Independent Registered Public Accounting Firm
The Board of Directors and Stockholders
Essex Property Trust, Inc.:
We have audited Essex Property Trust, Inc.’s internal control over financial reporting as of December 31, 2012, based on criteria established in Internal Control–Integrated Framework issued by the Committee of Sponsoring Organizations of the Treadway Commission (COSO). Essex Property Trust, Inc.’s management is responsible for maintaining effective internal control over financial reporting and for its assessment of the effectiveness of internal control over financial reporting, included in Management’s Report on Internal Control over Financial Reporting, appearing under Item 9A. Our responsibility is to express an opinion on Essex Property Trust Inc.'s internal control over financial reporting based on our audit.
We conducted our audit in accordance with the standards of the Public Company Accounting Oversight Board (United States). Those standards require that we plan and perform the audit to obtain reasonable assurance about whether effective internal control over financial reporting was maintained in all material respects. Our audit included obtaining an understanding of internal control over financial reporting, assessing the risk that a material weakness exists, and testing and evaluating the design and operating effectiveness of internal control, based on the assessed risk. Our audit also included performing such other procedures as we considered necessary in the circumstances. We believe that our audit provides a reasonable basis for our opinion.
A company’s internal control over financial reporting is a process designed to provide reasonable assurance regarding the reliability of financial reporting and the preparation of financial statements for external purposes in accordance with generally accepted accounting principles. A company’s internal control over financial reporting includes those policies and procedures that (1) pertain to the maintenance of records that, in reasonable detail, accurately and fairly reflect the transactions and dispositions of the assets of the company; (2) provide reasonable assurance that transactions are recorded as necessary to permit preparation of financial statements in accordance with generally accepted accounting principles, and that receipts and expenditures of the company are being made only in accordance with authorizations of management and directors of the company; and (3) provide reasonable assurance regarding prevention or timely detection of unauthorized acquisition, use, or disposition of the company’s assets that could have a material effect on the financial statements.
Because of its inherent limitations, internal control over financial reporting may not prevent or detect misstatements. Also, projections of any evaluation of effectiveness to future periods are subject to the risk that controls may become inadequate because of changes in conditions, or that the degree of compliance with the policies or procedures may deteriorate.
In our opinion, Essex Property Trust, Inc. maintained, in all material respects, effective internal control over financial reporting as of December 31, 2012, based on criteria established in Internal Control–Integrated Framework issued by the Committee of Sponsoring Organizations of the Treadway Commission (COSO).
We also have audited, in accordance with the standards of the Public Company Accounting Oversight Board (United States), the consolidated balance sheets of Essex Property Trust, Inc. and subsidiaries as of December 31, 2012 and 2011, and the related consolidated statements of operations, comprehensive income (loss), equity, and cash flows for each of the years in the three-year period ended December 31, 2012, and our report dated February 22, 2013, expressed an unqualified opinion on those consolidated financial statements.
| /S/ KPMG LLP | |
| KPMG LLP |
San Francisco, California
February 22, 2013
ESSEX PROPERTY TRUST, INC. AND SUBSIDIARIES
December 31, 2012 and 2011
(Dollars in thousands, except share amounts)
|
2012
|
2011
|
|||||||
|
ASSETS
|
||||||||
|
Real estate:
|
||||||||
|
Rental properties:
|
||||||||
|
Land and land improvements
|
$ | 1,003,171 | $ | 860,661 | ||||
|
Buildings and improvements
|
4,030,501 | 3,452,403 | ||||||
| 5,033,672 | 4,313,064 | |||||||
|
Less: accumulated depreciation
|
(1,081,517 | ) | (920,026 | ) | ||||
| 3,952,155 | 3,393,038 | |||||||
|
Real estate under development
|
66,851 | 44,280 | ||||||
|
Co-investments
|
571,345 | 383,412 | ||||||
| 4,590,351 | 3,820,730 | |||||||
|
Cash and cash equivalents-unrestricted
|
18,606 | 12,889 | ||||||
|
Cash and cash equivalents-restricted
|
23,520 | 22,574 | ||||||
|
Marketable securities
|
92,713 | 74,275 | ||||||
|
Notes and other receivables
|
66,163 | 66,369 | ||||||
|
Prepaid expenses and other assets
|
35,003 | 22,682 | ||||||
|
Deferred charges, net
|
20,867 | 17,445 | ||||||
|
Total assets
|
$ | 4,847,223 | $ | 4,036,964 | ||||
|
LIABILITIES AND EQUITY
|
||||||||
|
Mortgage notes payable
|
$ | 1,565,599 | $ | 1,745,858 | ||||
|
Unsecured debt
|
1,112,084 | 465,000 | ||||||
|
Lines of credit
|
141,000 | 150,000 | ||||||
|
Accounts payable and accrued liabilities
|
64,858 | 48,324 | ||||||
|
Construction payable
|
5,392 | 6,505 | ||||||
|
Dividends payable
|
45,052 | 39,611 | ||||||
|
Derivative liabilities
|
6,606 | 3,061 | ||||||
|
Other liabilities
|
22,167 | 20,528 | ||||||
|
Total liabilities
|
2,962,758 | 2,478,887 | ||||||
|
Commitments and contingencies
|
||||||||
|
Cumulative convertible 4.875% Series G preferred stock; $.0001 par value: 5,890,000 issued, and 178,249 outstanding
|
4,349 | 4,349 | ||||||
|
Equity:
|
||||||||
|
Common stock; $.0001 par value, 656,020,000 shares authorized; 36,442,994 and 33,888,082 shares issued and outstanding
|
3 | 3 | ||||||
|
Cumulative redeemable preferred stock at liquidation value
|
73,750 | 73,750 | ||||||
|
Excess stock, $.0001 par value, 330,000,000 shares authorized and no shares issued or outstanding
|
- | - | ||||||
|
Additional paid-in capital
|
2,204,778 | 1,844,611 | ||||||
|
Distributions in excess of accumulated earnings
|
(444,466 | ) | (408,066 | ) | ||||
|
Accumulated other comprehensive loss
|
(69,261 | ) | (72,771 | ) | ||||
|
Total stockholders' equity
|
1,764,804 | 1,437,527 | ||||||
|
Noncontrolling interest
|
115,312 | 116,201 | ||||||
|
Total equity
|
1,880,116 | 1,553,728 | ||||||
|
Total liabilities and equity
|
$ | 4,847,223 | $ | 4,036,964 | ||||
See accompanying notes to consolidated financial statements.
ESSEX PROPERTY TRUST, INC. AND SUBSIDIARIES
Years ended December 31, 2012, 2011 and 2010
(Dollars in thousands, except per share and share amounts)
|
2012
|
2011
|
2010
|
||||||||||
|
Revenues:
|
||||||||||||
|
Rental and other property
|
$ | 531,936 | $ | 465,713 | $ | 405,728 | ||||||
|
Management and other fees from affiliates
|
11,489 | 6,780 | 4,551 | |||||||||
| 543,425 | 472,493 | 410,279 | ||||||||||
|
Expenses:
|
||||||||||||
|
Property operating, excluding real estate taxes
|
125,437 | 115,528 | 104,049 | |||||||||
|
Real estate taxes
|
48,651 | 43,706 | 39,115 | |||||||||
|
Depreciation
|
170,592 | 151,428 | 128,221 | |||||||||
|
General and administrative
|
23,307 | 20,694 | 23,255 | |||||||||
|
Cost of management and other fees
|
6,513 | 4,610 | 2,707 | |||||||||
|
Impairment and other charges
|
- | - | 2,302 | |||||||||
| 374,500 | 335,966 | 299,649 | ||||||||||
|
Earnings from operations
|
168,925 | 136,527 | 110,630 | |||||||||
|
Interest expense before amortization
|
(100,244 | ) | (91,694 | ) | (82,756 | ) | ||||||
|
Amortization expense
|
(11,644 | ) | (11,474 | ) | (4,828 | ) | ||||||
|
Interest and other income
|
13,833 | 17,139 | 27,841 | |||||||||
|
Equity income (loss) from co-investments
|
41,745 | (467 | ) | (1,715 | ) | |||||||
|
Gain on remeasurement of co-investment
|
21,947 | - | - | |||||||||
|
Loss on early retirement of debt
|
(5,009 | ) | (1,163 | ) | (10 | ) | ||||||
|
Income before discontinued operations
|
129,553 | 48,868 | 49,162 | |||||||||
|
Income from discontinued operations
|
10,037 | 8,648 | 1,620 | |||||||||
|
Net income
|
139,590 | 57,516 | 50,782 | |||||||||
|
Net income attributable to noncontrolling interest
|
(14,306 | ) | (10,446 | ) | (14,848 | ) | ||||||
|
Net income attributable to controlling interest
|
125,284 | 47,070 | 35,934 | |||||||||
|
Dividends to preferred stockholders
|
(5,472 | ) | (4,753 | ) | (2,170 | ) | ||||||
|
Excess of cash paid to redeem preferred stock and units over the carrying value
|
- | (1,949 | ) | - | ||||||||
|
Net income available to common stockholders
|
$ | 119,812 | $ | 40,368 | $ | 33,764 | ||||||
|
Per share data:
|
||||||||||||
|
Basic:
|
||||||||||||
|
Income before discontinued operations available to common stockholders
|
$ | 3.15 | $ | 0.99 | $ | 1.09 | ||||||
|
Income from discontinued operations available to common stockholders
|
0.27 | 0.25 | 0.05 | |||||||||
|
Net income available to common stockholders
|
$ | 3.42 | $ | 1.24 | $ | 1.14 | ||||||
|
Weighted average number of shares outstanding during the year
|
35,032,491 | 32,541,792 | 29,667,064 | |||||||||
|
Diluted:
|
||||||||||||
|
Income before discontinued operations available to common stockholders
|
$ | 3.14 | $ | 0.99 | $ | 1.09 | ||||||
|
Income from discontinued operations available to common stockholders
|
0.27 | 0.25 | 0.05 | |||||||||
|
Net income available to common stockholders
|
$ | 3.41 | $ | 1.24 | $ | 1.14 | ||||||
|
Weighted average number of shares outstanding during the year
|
35,124,921 | 32,628,714 | 29,734,383 | |||||||||
See accompanying notes to consolidated financial statements.
ESSEX PROPERTY TRUST, INC. AND SUBSIDIARIES
Consolidated Statements of Comprehensive Income (Loss)
Years ended December 31, 2012, 2011 and 2010
(Dollars in thousands)
|
2012
|
2011
|
2010
|
||||||||||
|
|
||||||||||||
|
Net income
|
$ | 139,590 | $ | 57,516 | $ | 50,782 | ||||||
|
Other comprehensive income (loss):
|
||||||||||||
|
Changes in fair value of cash flow hedges and amortization of settlement swaps
|
3,402 | 7,707 | (50,437 | ) | ||||||||
|
Changes in fair value of marketable securities
|
1,411 | 1,330 | 5,357 | |||||||||
|
Reversal of unrealized gains upon the sale of marketable securities
|
(1,082 | ) | (4,286 | ) | (12,027 | ) | ||||||
|
Total other comprehensive income (loss)
|
3,731 | 4,751 | (57,107 | ) | ||||||||
|
Comprehensive income (loss)
|
143,321 | 62,267 | (6,325 | ) | ||||||||
|
Comprehensive income attributable to noncontrolling interest
|
(14,527 | ) | (10,751 | ) | (10,752 | ) | ||||||
|
Comprehensive income (loss) attributable to the Company
|
$ | 128,794 | $ | 51,516 | $ | (17,077 | ) | |||||
See accompanying notes to consolidated financial statements.
ESSEX PROPERTY TRUST, INC. AND SUBSIDIARIES
Consolidated Statements of Equity
Years ended December 31, 2012, 2011 and 2010
(Dollars and shares in thousands)
|
Distributions
|
Accumulated
|
|||||||||||||||||||||||||||||||||||
|
|
Additional
|
in excess of
|
other
|
|||||||||||||||||||||||||||||||||
|
Preferred stock
|
Common stock
|
paid-in
|
accumulated
|
comprehensive
|
Noncontrolling
|
|||||||||||||||||||||||||||||||
|
Shares
|
Amount
|
Shares
|
Amount
|
capital
|
earnings
|
(loss) income
|
Interest
|
Total
|
||||||||||||||||||||||||||||
|
Balances at December 31, 2009
|
1,000 | $ | 25,000 | 28,849 | $ | 3 | $ | 1,275,251 | $ | (222,952 | ) | $ | (24,206 | ) | $ | 220,445 | $ | 1,273,541 | ||||||||||||||||||
|
Net income
|
- | - | - | - | - | 35,934 | - | 14,848 | 50,782 | |||||||||||||||||||||||||||
|
Reversal of unrealized gains upon the sale of marketable securities
|
- | - | - | - | - | - | (11,163 | ) | (864 | ) | (12,027 | ) | ||||||||||||||||||||||||
|
Changes in fair value of cash flow hedges and amortization of settlement swaps
|
- | - | - | - | - | - | (46,817 | ) | (3,620 | ) | (50,437 | ) | ||||||||||||||||||||||||
|
Changes in fair value of marketable securities
|
- | - | - | - | - | - | 4,969 | 388 | 5,357 | |||||||||||||||||||||||||||
|
Issuance of common stock under:
|
||||||||||||||||||||||||||||||||||||
|
Stock option plans
|
- | - | 122 | - | 5,803 | - | - | - | 5,803 | |||||||||||||||||||||||||||
|
Sale of common stock
|
- | - | 2,354 | - | 251,455 | - | - | - | 251,455 | |||||||||||||||||||||||||||
|
Equity based compensation costs
|
- | - | - | - | (260 | ) | - | - | 2,474 | 2,214 | ||||||||||||||||||||||||||
|
Retirement of exchangeable bonds
|
- | - | - | - | (434 | ) | - | - | - | (434 | ) | |||||||||||||||||||||||||
|
Contributions of noncontrolling interest
|
- | - | - | - | - | - | - | 4,038 | 4,038 | |||||||||||||||||||||||||||
|
Redemptions of noncontrolling interest
|
- | - | - | - | (16,347 | ) | - | - | (7,839 | ) | (24,186 | ) | ||||||||||||||||||||||||
|
Distributions to noncontrolling interest
|
- | - | - | - | - | - | - | (24,802 | ) | (24,802 | ) | |||||||||||||||||||||||||
|
Common and preferred stock dividends declared
|
- | - | - | - | - | (126,290 | ) | - | - | (126,290 | ) | |||||||||||||||||||||||||
|
Balances at December 31, 2010
|
1,000 | 25,000 | 31,325 | 3 | 1,515,468 | (313,308 | ) | (77,217 | ) | 205,068 | 1,355,014 | |||||||||||||||||||||||||
|
Net income
|
- | - | - | - | - | 47,070 | - | 10,446 | 57,516 | |||||||||||||||||||||||||||
|
Reversal of unrealized gains upon the sale of marketable securities
|
- | - | - | - | - | - | (4,011 | ) | (275 | ) | (4,286 | ) | ||||||||||||||||||||||||
|
Changes in fair value of cash flow hedges and amortization of settlement swaps
|
- | - | - | - | - | - | 7,212 | 495 | 7,707 | |||||||||||||||||||||||||||
|
Changes in fair value of marketable securities
|
- | - | - | - | - | - | 1,245 | 85 | 1,330 | |||||||||||||||||||||||||||
|
Issuance of common stock under:
|
||||||||||||||||||||||||||||||||||||
|
Stock option plans
|
- | - | 103 | - | 8,412 | - | - | - | 8,412 | |||||||||||||||||||||||||||
|
Sale of common stock
|
- | - | 2,460 | - | 323,931 | - | - | - | 323,931 | |||||||||||||||||||||||||||
|
Equity based compensation costs
|
- | - | - | - | (725 | ) | - | - | 1,598 | 873 | ||||||||||||||||||||||||||
|
Issuance of Series H Preferred
|
2,950 | 73,750 | - | - | (2,541 | ) | - | - | - | 71,209 | ||||||||||||||||||||||||||
|
Redemptions of Series F Preferred
|
(1,000 | ) | (25,000 | ) | - | - | - | - | - | - | (25,000 | ) | ||||||||||||||||||||||||
|
Redemptions of Series B Preferred
|
- | - | - | - | 1,200 | - | - | (80,000 | ) | (78,800 | ) | |||||||||||||||||||||||||
|
Redemptions of noncontrolling interest
|
- | - | - | - | (1,134 | ) | - | - | (4,253 | ) | (5,387 | ) | ||||||||||||||||||||||||
|
Distributions to noncontrolling interest
|
- | - | - | - | - | - | - | (16,963 | ) | (16,963 | ) | |||||||||||||||||||||||||
|
Common and preferred stock dividends declared
|
- | - | - | - | - | (141,828 | ) | - | - | (141,828 | ) | |||||||||||||||||||||||||
|
Balances at December 31, 2011
|
2,950 | 73,750 | 33,888 | 3 | 1,844,611 | (408,066 | ) | (72,771 | ) | 116,201 | 1,553,728 | |||||||||||||||||||||||||
|
Net income
|
- | - | - | - | - | 125,284 | - | 14,306 | 139,590 | |||||||||||||||||||||||||||
|
Reversal of unrealized gains upon the sale of marketable securities
|
- | - | - | - | - | - | (1,018 | ) | (64 | ) | (1,082 | ) | ||||||||||||||||||||||||
|
Changes in fair value of cash flow hedges and amortization of settlement swaps
|
- | - | - | - | - | - | 3,183 | 219 | 3,402 | |||||||||||||||||||||||||||
|
Changes in fair value of marketable securities
|
- | - | - | - | - | - | 1,345 | 66 | 1,411 | |||||||||||||||||||||||||||
|
Issuance of common stock under:
|
||||||||||||||||||||||||||||||||||||
|
Stock option plans
|
- | - | 151 | - | 4,675 | - | - | - | 4,675 | |||||||||||||||||||||||||||
|
Sale of common stock
|
- | - | 2,404 | - | 357,720 | - | - | - | 357,720 | |||||||||||||||||||||||||||
|
Equity based compensation costs
|
- | - | - | - | (430 | ) | - | - | 2,231 | 1,801 | ||||||||||||||||||||||||||
|
Contributions from noncontrollong interest
|
- | - | - | - | - | - | - | 4,232 | 4,232 | |||||||||||||||||||||||||||
|
Redemptions of noncontrolling interest
|
- | - | - | - | (1,798 | ) | - | - | (5,188 | ) | (6,986 | ) | ||||||||||||||||||||||||
|
Distributions to noncontrolling interest
|
- | - | - | - | - | - | - | (16,691 | ) | (16,691 | ) | |||||||||||||||||||||||||
|
Common and preferred stock dividends declared
|
- | - | - | - | - | (161,684 | ) | - | - | (161,684 | ) | |||||||||||||||||||||||||
|
Balances at December 31, 2012
|
2,950 | $ | 73,750 | 36,443 | $ | 3 | $ | 2,204,778 | $ | (444,466 | ) | $ | (69,261 | ) | $ | 115,312 | $ | 1,880,116 | ||||||||||||||||||
See accompanying notes to consolidated financial statements.
ESSEX PROPERTY TRUST, INC. AND SUBSIDIARIES
Years ended December 31, 2012, 2011 and 2010
(Dollars in thousands)
|
2012
|
2011
|
2010
|
||||||||||
|
Cash flows from operating activities:
|
||||||||||||
|
Net income
|
$ | 139,590 | $ | 57,516 | $ | 50,782 | ||||||
|
Adjustments to reconcile net income to net cash provided by operating activities:
|
||||||||||||
|
Gain on sale of marketable securities
|
(819 | ) | (4,956 | ) | (12,491 | ) | ||||||
|
Gain on remeasurement of co-investment
|
(21,947 | ) | - | - | ||||||||
|
Company's share of gain on the sales of co-investment
|
(29,112 | ) | (919 | ) | - | |||||||
|
Gain on the sales of real estate
|
(10,870 | ) | (8,562 | ) | - | |||||||
|
Loss on early retirement of debt
|
5,009 | 1,163 | 10 | |||||||||
|
Co-investments
|
1,626 | 7,929 | 1,715 | |||||||||
|
Amortization expense
|
11,644 | 11,474 | 4,828 | |||||||||
|
Amortization of discount on notes receivables
|
(1,832 | ) | (1,757 | ) | (4,806 | ) | ||||||
|
Amortization of discount on marketable securities
|
(5,127 | ) | (4,794 | ) | (3,714 | ) | ||||||
|
Loss on derivative instruments - ineffectiveness
|
- | - | 2,301 | |||||||||
|
Depreciation
|
170,686 | 152,542 | 129,711 | |||||||||
|
Equity-based compensation
|
4,141 | 2,927 | 3,251 | |||||||||
|
Changes in operating assets and liabilities:
|
||||||||||||
|
Prepaid expenses and other assets
|
(9,488 | ) | (1,172 | ) | (2,771 | ) | ||||||
|
Accounts payable and accrued liabilities
|
12,360 | 3,620 | 4,302 | |||||||||
|
Other liabilities
|
1,638 | 1,560 | 2,412 | |||||||||
|
Net cash provided by operating activities
|
267,499 | 216,571 | 175,530 | |||||||||
|
Cash flows from investing activities:
|
||||||||||||
|
Additions to real estate:
|
||||||||||||
|
Acquisitions of real estate
|
(393,771 | ) | (57,478 | ) | (279,607 | ) | ||||||
|
Improvements to recent acquisitions
|
(13,704 | ) | (16,446 | ) | (6,388 | ) | ||||||
|
Redevelopment
|
(40,200 | ) | (45,130 | ) | (14,096 | ) | ||||||
|
Revenue generating capital expenditures
|
(7,620 | ) | (7,616 | ) | (1,584 | ) | ||||||
|
Non-revenue generating capital expenditures
|
(30,491 | ) | (26,090 | ) | (29,278 | ) | ||||||
|
Acquisition of and additions to real estate under development
|
(29,196 | ) | (79,194 | ) | (155,267 | ) | ||||||
|
Acquisition of membership interest in co-investment
|
(85,000 | ) | - | - | ||||||||
|
Dispositions of real estate
|
27,800 | 23,003 | - | |||||||||
|
Changes in restricted cash and refundable deposits
|
(6,069 | ) | (1,376 | ) | (4,414 | ) | ||||||
|
Purchases of marketable securities
|
(73,735 | ) | (8,048 | ) | (49,974 | ) | ||||||
|
Sales and maturities marketable securities
|
61,703 | 32,998 | 102,039 | |||||||||
|
Proceeds from tax investor
|
- | - | 1,223 | |||||||||
|
Purchases of and advances under notes and other receivables
|
(26,000 | ) | (12,325 | ) | (37,627 | ) | ||||||
|
Collections of notes and other receivables
|
14,525 | 884 | 1,855 | |||||||||
|
Contributions to co-investments
|
(260,153 | ) | (246,106 | ) | (79,450 | ) | ||||||
|
Non-operating distributions from co-investments
|
49,773 | 17,141 | 41,700 | |||||||||
|
Net cash used in investing activities
|
(812,138 | ) | (425,783 | ) | (510,868 | ) | ||||||
|
Cash flows from financing activities:
|
||||||||||||
|
Borrowings under debt agreements
|
1,745,853 | 1,514,684 | 1,214,216 | |||||||||
|
Repayment of debt
|
(1,371,317 | ) | (1,435,135 | ) | (882,646 | ) | ||||||
|
Additions to deferred charges
|
(6,707 | ) | (5,533 | ) | (4,109 | ) | ||||||
|
Payments to settle derivative instruments
|
- | (2,395 | ) | (81,282 | ) | |||||||
|
Retirement of exchangeable bonds
|
- | - | (5,396 | ) | ||||||||
|
Net proceeds from issuance of Preferred stock, Series H
|
- | 71,209 | - | |||||||||
|
Retirement of Series B preferred units and Series F Preferred stock
|
- | (103,800 | ) | - | ||||||||
|
Equity related issuance cost
|
(309 | ) | (627 | ) | - | |||||||
|
Net proceeds from stock options exercised
|
2,643 | 6,986 | 4,765 | |||||||||
|
Net proceeds from issuance of common stock
|
357,720 | 323,931 | 251,455 | |||||||||
|
Contributions from noncontrolling interest
|
2,400 | - | 4,038 | |||||||||
|
Distributions to noncontrolling interest
|
(16,691 | ) | (16,963 | ) | (24,795 | ) | ||||||
|
Redemption of noncontrolling interest
|
(6,986 | ) | (5,387 | ) | (24,186 | ) | ||||||
|
Common and preferred stock dividends paid
|
(156,250 | ) | (138,622 | ) | (123,629 | ) | ||||||
|
Net cash provided by financing activities
|
550,356 | 208,348 | 328,431 | |||||||||
|
Net increase (decrease) in cash and cash equivalents
|
5,717 | (864 | ) | (6,907 | ) | |||||||
|
Cash and cash equivalents at beginning of year
|
12,889 | 13,753 | 20,660 | |||||||||
|
Cash and cash equivalents at end of year
|
$ | 18,606 | $ | 12,889 | $ | 13,753 | ||||||
(Continued)
ESSEX PROPERTY TRUST, INC. AND SUBSIDIARIES
Consolidated Statements of Cash Flows
Years ended December 31, 2012, 2011 and 2010
(Dollars in thousands)
|
2012
|
2011
|
2010
|
||||||||||
|
Supplemental disclosure of cash flow information:
|
||||||||||||
|
Cash paid for interest, net of $10,346, $8,240, and $9,486 capitalized in 2012, 2011 and 2010, respectively
|
$ | 95,597 | $ | 89,691 | $ | 83,497 | ||||||
|
Supplemental disclosure of noncash investing and financing activities:
|
||||||||||||
|
Transfer from real estate under development to rental properties
|
$ | 6,632 | $ | 165,214 | $ | 170,940 | ||||||
|
Transfer from co-investments to rental properties
|
$ | 148,053 | $ | - | $ | - | ||||||
|
Mortgage notes assumed in connection with purchases of real estate including the loan premiums recorded
|
$ | 82,133 | $ | 20,927 | $ | 87,336 | ||||||
|
Transfer from real estate under development to co-investments
|
$ | - | $ | 54,472 | $ | - | ||||||
|
Note receivable settled when the company purchased the property securing the note receivable
|
$ | - | $ | - | $ | 25,750 | ||||||
|
Contribution of note receivable to co-investment
|
$ | 12,325 | $ | - | $ | - | ||||||
|
Change in accrual of dividends
|
$ | 5,441 | $ | 3,206 | $ | 2,655 | ||||||
|
Change in fair value of derivative liabilities
|
$ | 4,461 | $ | 230 | $ | 1,907 | ||||||
|
Change in fair value of marketable securities
|
$ | 459 | $ | 2,836 | $ | 6,670 | ||||||
|
Change in construction payable
|
$ | 1,113 | $ | 2,518 | $ | 1,304 | ||||||
See accompanying notes to consolidated financial statements.
ESSEX PROPERTY TRUST, INC. AND SUBSIDIARIES
NOTES TO CONSOLIDATED FINANCIAL STATEMENTS
December 31, 2012, 2011, and 2010
(1) Organization
The accompanying consolidated financial statements present the accounts of Essex Property Trust, Inc. (the “Company”), which include the accounts of the Company and Essex Portfolio, L.P. (the “Operating Partnership,” which holds the operating assets of the Company).
The Company is the sole general partner in the Operating Partnership with a 94.5% general partner interest and the limited partners owned a 5.5% interest as of December 31, 2012. The limited partners may convert their Operating Partnership units into an equivalent number of shares of common stock. Total Operating Partnership units outstanding were 2,122,381 and 2,229,230 as of December 31, 2012 and 2011, respectively, and the redemption value of the units, based on the closing price of the Company’s common stock totaled $311.2 million and $313.2 million, as of December 31, 2012 and 2011, respectively. The Company has reserved shares of common stock for such conversions. These conversion rights may be exercised by the limited partners at any time through 2026.
As of December 31, 2012, the Company owned or had ownership interests in 163 apartment communities, (aggregating 33,468 units), five commercial buildings, and nine active development projects (collectively, the “Portfolio”). The communities are located in Southern California (Los Angeles, Orange, Riverside, Santa Barbara, San Diego, and Ventura counties), Northern California (the San Francisco Bay Area) and the Seattle metropolitan area.
(2) Summary of Critical and Significant Accounting Policies
(a) Principles of Consolidation
The accounts of the Company, its controlled subsidiaries and the variable interest entities (“VIEs”) in which it is the primary beneficiary are consolidated in the accompanying financial statements. All significant inter-company accounts and transactions have been eliminated.
Noncontrolling interest includes the 5.5% and 6.2% limited partner interests in the Operating Partnership not held by the Company at December 31, 2012 and 2011, respectively. These percentages include the Operating Partnership’s vested long term incentive plan units (see Note 13).
The Company consolidates 19 DownREIT limited partnerships (comprising twelve communities), since the Company is the primary beneficiary of these variable interest entities (“VIEs”). The consolidated total assets and liabilities related to these VIEs, net of intercompany eliminations, were approximately $201.1 million and $178.6 million, respectively, as of December 31, 2012, and $199.8 million and $171.5
million, respectively, as of December 31, 2011.
The DownREIT VIEs collectively own twelve apartment communities in which Essex Management Company (“EMC”) is the general partner, the Operating Partnership is a special limited partner, and the other limited partners were granted rights of redemption for their interests. Such limited partners can request to be redeemed and the Company can elect to redeem their rights for cash or by issuing shares of its common stock on a one share per unit basis. Conversion values will be based on the market value of the Company's common stock at the time of redemption multiplied by the number of units stipulated under the above arrangements. The other limited partners receive distributions based on the Company's current dividend rate times the number of units held. Total DownREIT units outstanding were 1,039,431 and 1,063,848 as of December 31, 2012 and 2011 respectively, and the redemption value of the units, based on the closing price of the Company’s common stock totaled $152.4 million and $149.5 million, as of December 31, 2012 and 2011, respectively. As of December 31, 2012 and 2011, the carrying value of the other limited partners' interests is presented at their historical cost and is classified within noncontrolling interest in the accompanying consolidated balance sheets.
Interest holders in VIEs consolidated by the Company are allocated a priority of net income equal to the cash payments made to those interest holders or distributions from cash flow. The remaining results of operations are generally allocated to the Company.
As of December 31, 2012 and 2011, the Company did not have any VIE’s of which it was not deemed to be the primary beneficiary.
ESSEX PROPERTY TRUST, INC. AND SUBSIDIARIES
NOTES TO CONSOLIDATED FINANCIAL STATEMENTS
December 31, 2012, 2011, and 2010
(b) Real Estate Rental Properties
Significant expenditures, which improve or extend the life of an asset and have a useful life of greater than one year, are capitalized. Operating real estate assets are stated at cost and consist of land, buildings and improvements, furniture, fixtures and equipment, and other costs incurred during their development, redevelopment and acquisition. Expenditures for maintenance and repairs are charged to expense as incurred.
The depreciable life of various categories of fixed assets is as follows:
|
Computer software and equipment
|
3 - 5 years
|
|
|
Interior unit improvements
|
5 years
|
|
|
Land improvements and certain exterior components of real property
|
10 years
|
|
|
Real estate structures
|
30 years
|
The Company capitalizes all costs incurred with the predevelopment, development or redevelopment of real estate assets or are associated with the construction or expansion of real property. Such capitalized costs include land, land improvements, allocated costs of the Company’s project management staff, construction costs, as well as interest and related loan fees, property taxes and insurance. Capitalization begins for predevelopment, development, and redevelopment projects when activity commences. Capitalization ends when the apartment home is completed and the property is available for a new resident or if the development activities are put on hold. The Company ceases to capitalize costs such as property taxes, insurance, and interest expenses once the development activities are put on hold.
The Company allocates the purchase price of real estate to land and building, and identifiable intangible assets, such as the value of above, below and in-place leases. The values of the above and below market leases are amortized and recorded as either a decrease (in the case of above market leases) or an increase (in the case of below market leases) to rental revenue over the remaining term of the associated leases acquired, which in the case of below market leases the Company assumes lessees will elect to renew their leases. The value of acquired in-place leases are amortized to expense over the term the Company expects to retain the acquired tenant, which is generally 20 months.
The Company performs the following evaluation for communities acquired:
|
(1)
|
Adjust the purchase price for any fair value adjustments resulting from such things as assumed debt or contingencies.
|
|
(2)
|
estimate the value of the real estate “as if vacant” as of the acquisition date;
|
|
(3)
|
allocate that value among land and building;
|
|
(4)
|
compute the value of the difference between the “as if vacant” value and the adjusted purchase price, which will represent the total intangible assets;
|
|
(5)
|
compute the value of the above and below market leases and determine the associated life of the above market/ below market leases;
|
|
(6)
|
compute the value of the in-place leases and customer relationships, if any, and the associated lives of these assets.
|
Whenever events or changes in circumstances indicate that the carrying amount of a property held for investment or held for sale may not be fully recoverable, the carrying amount will be evaluated for impairment. If the sum of the expected future cash flows (undiscounted and without interest charges) is less than the carrying amount (including intangible assets) of a property held for investment, then the Company will recognize an impairment loss equal to the excess of the carrying amount over the fair value of the property. Fair value of a property is determined using conventional real estate valuation methods, such as discounted cash flow, the property’s unleveraged yield in comparison to the unleveraged yields and sales prices of similar communities that have been recently sold, and other third party information, if available. Communities held for sale are carried at the lower of cost and fair value less estimated costs to sell. As of December 31, 2012 and 2011, no communities were classified as held for sale and no impairment charges were recorded in 2012, 2011 or 2010.
In the normal course of business, the Company will receive purchase offers for its communities, either solicited or unsolicited. For those offers that are accepted, the prospective buyer will usually require a due diligence period before consummation of the transaction. It is not unusual for matters to arise that result in the withdrawal or rejection of the offer during this process. The Company classifies real estate as "held for sale" when all criteria under the accounting standard for the disposals of long-lived assets have been met. In accordance with the standard, the Company presents income and gains/losses on communities sold or held for sale as discontinued operations. The Company’s equity in income or loss from real estate investments accounted for under the equity method of accounting remain classified in continuing operations upon disposition. (See Note 6 for a description of the Company’s discontinued operations for 2012, 2011, and 2010).
ESSEX PROPERTY TRUST, INC. AND SUBSIDIARIES
NOTES TO CONSOLIDATED FINANCIAL STATEMENTS
December 31, 2012, 2011, and 2010
(c) Co-investments
The Company owns investments in joint ventures (“co-investments”) in which it has significant influence, but its ownership interest does not meet the criteria for consolidation in accordance with the accounting standards. Therefore, the Company accounts for these investments using the equity method of accounting. Under the equity method of accounting, the investment is carried at the cost of assets contributed, plus the Company’s equity in earnings less distributions received and the Company’s share of losses. For preferred equity investments the Company recognizes its preferred interest as its equity in earnings.
A majority of the co-investments, excluding the preferred equity investments, compensate the Company for its asset management services and some of these investments may provide promote distributions if certain financial return benchmarks are achieved. Asset management fees are recognized when earned, and promote fees are recognized when the earnings events have occurred and the amount is determinable and collectible. Any promote distributions are reflected in equity (loss) income in co-investments. In 2012, the Company recorded a $2.3 million promote fee in connection with acquisition of our joint venture partner's remaining membership interest in the co-investment Essex Skyline at MacArthur Place for a purchase price of $85 million. The property is now consolidated. There were no promote fees recognized in 2011 and 2010 in the accompanying consolidated statements of operations.
(d) Revenues and Gains on Sale of Real Estate
Revenues from tenants renting or leasing apartment units are recorded when due from tenants and are recognized monthly as they are earned, which is not materially different than on a straight-line basis. Units are rented under short-term leases (generally, lease terms of 6 to 12 months) and may provide no rent for one or two months, depending on the market conditions and leasing practices of the Company’s competitors in each sub-market at the time the leases are executed. Revenues from tenants leasing commercial space are recorded on a straight-line basis over the life of the respective lease.
The Company recognizes gains on sales of real estate when a contract is in place, a closing has taken place, the buyer’s initial and continuing investment is adequate to demonstrate a commitment to pay for the property and the Company does not have a substantial continuing involvement in the property.
(e) Cash Equivalents and Restricted Cash
Highly liquid investments with maturities of three months or less when purchased are classified as cash equivalents. Restricted cash balances relate primarily to reserve requirements for capital replacement at certain communities in connection with the Company’s mortgage debt.
(f) Marketable Securities
The Company reports its available for sale securities at fair value, based on quoted market prices (Level 2 for the unsecured bonds and Level 1 for the common stock and investment funds, as defined by the Financial Accounting Standards Board (“FASB”) standard for fair value measurements as discussed later in Note 2), and any unrealized gain or loss is recorded as other comprehensive income (loss). There were no other than temporary impairment charges for the years ended December 31, 2012, 2011 and 2010. Realized gains and losses, interest income, and amortization of purchase discounts are included in interest and other income on the consolidated statement of operations.
As of December 31, 2012 and 2011, marketable securities consisted primarily of investment-grade unsecured bonds, common stock, investments in mortgage backed securities and investment funds that invest in U.S. treasury or agency securities. As of December 31, 2012 and 2011, the Company classified its investments in mortgage backed securities, which mature in November 2019 and September 2020, as held to maturity, and accordingly, these securities are stated at their amortized cost. The estimated fair values of the mortgage backed securities (Level 2 securities) are approximately equal to the carrying values.
ESSEX PROPERTY TRUST, INC. AND SUBSIDIARIES
NOTES TO CONSOLIDATED FINANCIAL STATEMENTS
December 31, 2012, 2011, and 2010
As of December 31, 2012 and 2011 marketable securities consist of the following ($ in thousands):
|
December 31, 2012
|
||||||||||||
|
Gross
|
||||||||||||
|
Amortized
|
Unrealized
|
Carrying
|
||||||||||
|
Cost
|
Gain
|
Value
|
||||||||||
|
Available for sale:
|
||||||||||||
|
Investment-grade unsecured bonds
|
$ | 5,143 | $ | 98 | $ | 5,241 | ||||||
|
Investment funds - US treasuries
|
14,120 | 729 | 14,849 | |||||||||
|
Common stock
|
18,917 | 1,704 | 20,621 | |||||||||
|
Held to maturity:
|
||||||||||||
|
Mortgage backed securities
|
52,002 | - | 52,002 | |||||||||
|
Total
|
$ | 90,182 | $ | 2,531 | $ | 92,713 | ||||||
|
December 31, 2011
|
||||||||||||
|
Gross
|
||||||||||||
|
Amortized
|
Unrealized
|
Carrying
|
||||||||||
|
Cost
|
Gain
|
Value
|
||||||||||
|
Available for sale:
|
||||||||||||
|
Investment-grade unsecured bonds
|
$ | 3,615 | $ | 399 | $ | 4,014 | ||||||
|
Investment funds - US treasuries
|
11,783 | 121 | 11,904 | |||||||||
|
Common stock
|
10,067 | 1,552 | 11,619 | |||||||||
|
Held to maturity:
|
||||||||||||
|
Mortgage backed securities
|
46,738 | - | 46,738 | |||||||||
|
Total
|
$ | 72,203 | $ | 2,072 | $ | 74,275 | ||||||
The Company uses the specific identification method to determine the cost basis of a security sold and to reclassify amounts from accumulated other comprehensive income for securities sold. For the years ended December 31, 2012, 2011 and 2010, the proceeds from sales of available for sale securities totaled $61.7 million, $33.0 million and $102.0 million, respectively. These sales all resulted in gains, which totaled $0.8 million, $5.0 million and $12.5 million for the years ended December 31, 2012, 2011 and 2010, respectively.
(g) Notes Receivable
Notes receivable relate to real estate financing arrangements including mezzanine and bridge loans and are secured by real estate. Interest is recognized over the life of the note.
Each note is analyzed to determine if it is impaired. A note is impaired if it is probable that the Company will not collect all principal and interest contractually due. The Company does not accrue interest when a note is considered impaired and a loan allowance is recorded for any principal and previously accrued interest that are not believed to be collectable. All cash receipts on impaired notes are applied to reduce the principal amount of such notes until the principal has been recovered and, thereafter, are recognized as interest income. As of December 31, 2012 and 2011, no notes were impaired.
(h) Capitalization Policy
The Company capitalizes all direct and certain indirect costs, including interest and real estate taxes, incurred during development and redevelopment activities. Interest is capitalized on real estate assets that require a period of time to get them ready for their intended use. The amount of interest capitalized is based upon the average amount of accumulated development expenditures during the reporting period. Included in capitalized costs are management’s accounting estimates of the direct and incremental personnel costs and indirect project costs associated with the Company's development and redevelopment activities. Indirect project costs consist primarily of personnel costs associated with construction administration and development, including accounting, legal fees, and various office costs that clearly relate to projects under development. The Company’s capitalized internal costs related to development and redevelopment projects totaled $4.4 million, $4.3 million and $4.0 million for the years ended December 31, 2012, 2011 and 2010, respectively, most of which relates to development projects. These totals include capitalized salaries of $2.4 million, $2.2 million and $2.1 million, for the years ended December 31, 2012, 2011 and 2010, respectively.
ESSEX PROPERTY TRUST, INC. AND SUBSIDIARIES
NOTES TO CONSOLIDATED FINANCIAL STATEMENTS
December 31, 2012, 2011, and 2010
(i) Interest and Other Income
Interest income is generated primarily from cash balances and marketable securities as well as notes receivables. Other income primarily consists of gains on sales of marketable securities. Total interest and other income is comprised of the following for the years ended December 31 ($ in thousands):
|
2012
|
2011
|
2010
|
||||||||||
|
Interest income
|
$ | 10,715 | $ | 10,501 | $ | 15,350 | ||||||
|
Co-investment promote fee
|
2,299 | - | - | |||||||||
|
Gains on sales of marketable securities
|
819 | 4,956 | 12,491 | |||||||||
|
Tax benefit - taxable REIT subsidiary
|
- | 1,682 | - | |||||||||
| $ | 13,833 | $ | 17,139 | $ | 27,841 | |||||||
(j) Fair Value of Financial Instruments
The Company values its financial instruments based on the fair value hierarchy of valuation techniques described in the FASB’s accounting standard for fair value measurements. Level 1 inputs are unadjusted, quoted prices in active markets for identical assets or liabilities at the measurement date. Level 2 inputs include quoted prices for similar assets and liabilities in active markets and inputs other than quoted prices observable for the asset or liability. Level 3 inputs are unobservable inputs for the asset or liability. The Company uses Level 1 inputs for the fair values of its cash equivalents and its marketable securities except for unsecured bonds and mortgage backed securities. The Company uses Level 2 inputs for its investments in unsecured bonds, mortgage backed securities, notes receivable, notes payable, and derivative liabilities. These inputs include interest rates for similar financial instruments. The Company’s valuation methodology for derivatives is described in more detail in Note 9. The Company's valuation methodology for the swap related to the multifamily revenue refunding bonds for the 101 San Fernando community, which the Company terminated in 2012, is described in detail in Note 9. The Company does not use Level 3 inputs to estimate fair values of any of its financial instruments. The Company’s assessment of the significance of a particular input to the fair value measurement in its entirety requires judgment, and considers factors specific to the asset or liability.
Management believes that the carrying amounts of its amounts outstanding under lines of credit, notes receivable and other receivables approximate fair value as of December 31, 2012 and 2011, because interest rates, yields and other terms for these instruments are consistent with yields and other terms currently available for similar instruments. Management has estimated that the fair value of the Company’s $2.13 billion and $1.77 billion of fixed rate debt at December 31, 2012 and 2011, respectively, to be $2.24 billion and $1.88 billion. Management has estimated the fair value of the Company’s $692.9 million and $593.7 million of variable rate debt at December 31, 2012 and 2011, respectively, is $671.7 million and $572.3 million based on the terms of the Company’s existing variable rate debt compared to those available in the marketplace. Management believes that the carrying amounts of cash and cash equivalents, restricted cash, accounts payable and accrued liabilities, construction payables, other liabilities and dividends payable approximate fair value as of December 31, 2012 and 2011 due to the short-term maturity of these instruments. The fair values of the Company’s investments in mortgage backed securities are approximately equal to the amortized cost carrying value of these securities. Marketable securities and derivative liabilities are carried at fair value as of December 31, 2012.
ESSEX PROPERTY TRUST, INC. AND SUBSIDIARIES
NOTES TO CONSOLIDATED FINANCIAL STATEMENTS
December 31, 2012, 2011, and 2010
(k) Interest Rate Protection, Swap, and Forward Contracts
The Company uses interest rate swaps, interest rate cap contracts, and forward starting swaps to manage interest rate risks. As of December 31, 2012, there were no outstanding forward starting swaps. The valuation of these derivative instruments is determined using widely accepted valuation techniques including discounted cash flow analysis on the expected cash flows of each derivative. This analysis reflects the contractual terms of the derivatives, including the period to maturity, and uses observable market-based inputs, including interest rate curves. The fair values of forward starting interest rate swaps were determined using the market standard methodology of netting the discounted future fixed cash receipts (or payments) and the discounted expected variable cash payments (or receipts). The variable cash payments (or receipts) were based on an expectation of future interest rates (forward curves) derived from observable market interest rate curves. The Company incorporates credit valuation adjustments to appropriately reflect both its own nonperformance risk and the respective counterparty’s nonperformance risk in the fair value measurements. The Company records all derivatives on its consolidated balance sheet at fair value. The accounting for changes in the fair value of derivatives depends on the intended use of the derivative and the resulting designation. Derivatives used to hedge the exposure to changes in the fair value of an asset, liability, or firm commitment attributable to a particular risk, such as interest rate risk, are considered fair value hedges. Derivatives used to hedge the exposure to variability in expected future cash flows, or other types of forecasted transactions, are considered cash flow hedges.
For derivatives designated as fair value hedges, changes in the fair value of the derivative and the hedged item related to the hedged risk are recognized in earnings. For derivatives designated as cash flow hedges, the effective portion of changes in the fair value of the derivative is initially reported in other comprehensive income (outside of earnings) and subsequently reclassified to earnings when the hedged transaction affects earnings, and the ineffective portion of changes in the fair value of the derivative is recognized directly in earnings. The Company assesses the initial and ongoing effectiveness of each hedging relationship by comparing the changes in fair value or cash flows of the derivative hedging instrument with the changes in fair value or cash flows of the designated hedged item or transaction.
For derivatives not designated as cash flow hedges, changes in fair value are recognized in earnings. All of the Company’s interest rate swaps and interest rate caps are considered cash flow hedges except for the swap related to the multifamily revenue refunding bonds for the 101 San Fernando community that was terminated in 2012 as described in detail in Note 9. The Company did not have any fair value hedges during the years end December 31, 2012, 2011 and 2010.
The Company’s objective in using derivatives is to add stability to interest expense and to manage its exposure to interest rate movements or other identified risks. To accomplish this objective, the Company primarily used interest rate swaps and interest rate forward-starting swaps as part of its cash flow hedging strategy. The Company was hedging its exposure to the variability in future cash flows for a portion of its forecasted transactions.
(l) Deferred Charges
Deferred charges are principally comprised of loan fees and related costs which are amortized over the terms of the related borrowing in a manner which approximates the effective interest method.
(m) Income Taxes
Generally in any year in which the Company qualifies as a real estate investment trust (“REIT”) under the Internal Revenue Code (the “IRC”), it is not subject to federal income tax on that portion of its income that it distributes to stockholders. No provision for federal income taxes, other than the taxable REIT subsidiaries discussed below, has been made in the accompanying consolidated financial statements for each of the years in the three-year period ended December 31, 2012 as the Company has elected to be and believes it qualifies under the IRC as a REIT and has made distributions during the periods in amounts to preclude the Company from paying federal income tax.
In order to maintain compliance with REIT tax rules, the Company utilizes taxable REIT subsidiaries
for various revenue generating or investment activities. The taxable REIT subsidiaries are consolidated by the Company. The activities and tax related provisions, assets and liabilities are not material.
ESSEX PROPERTY TRUST, INC. AND SUBSIDIARIES
NOTES TO CONSOLIDATED FINANCIAL STATEMENTS
December 31, 2012, 2011, and 2010
The status of cash dividends distributed for the years ended December 31, 2012, 2011, and 2010 related to common stock, Series F, Series G, and Series H preferred stock are classified for tax purposes as follows:
|
2012
|
2011
|
2010
|
||||||||||
|
Common Stock
|
||||||||||||
|
Ordinary income
|
70.58 | % | 63.68 | % | 82.46 | % | ||||||
|
Capital gain
|
8.75 | % | 11.16 | % | 5.61 | % | ||||||
|
Unrecaptured section 1250 capital gain
|
7.97 | % | 0.74 | % | 0.00 | % | ||||||
|
Return of capital
|
12.70 | % | 24.42 | % | 11.93 | % | ||||||
| 100.00 | % | 100.00 | % | 100.00 | % | |||||||
| 2012 | 2011 | 2010 | ||||||||||
|
Series F, G, and H Preferred stock
|
||||||||||||
|
Ordinary income
|
80.85 | % | 100.00 | % | 93.63 | % | ||||||
|
Capital gains
|
10.02 | % | 0.00 | % | 6.37 | % | ||||||
|
Unrecaptured section 1250 capital gain
|
9.13 | % | 0.00 | % | 0.00 | % | ||||||
| 100.00 | % | 100.00 | % | 100.00 | % | |||||||
(n) Preferred Stock
The Company’s Series G Cumulative Convertible Preferred Stock (“Series G Preferred Stock”) contains fundamental change provisions that allow the holder to redeem the preferred stock for cash if certain events occur. The redemption under these provisions is not solely within the Company’s control, thus the Company has classified the Series G Preferred Stock as temporary equity in the accompanying consolidated balance sheets.
The Company’s Series H Cumulative Redeemable Preferred Stock (“Series H Preferred Stock”), issued during 2011, contains fundamental change provisions that allow the holder to redeem the preferred stock for cash if certain events occur. The redemption under these provisions is within the Company’s control, and thus the Company has classified the Series H Preferred Stock as permanent equity in the accompanying consolidated balance sheets as of December 31, 2012 and 2011.
(o) Equity-based Compensation
The cost of share and unit based compensation awards is measured at the grant date based on the estimated fair value of the awards. The estimated fair value of stock options and restricted stock granted by the Company are being amortized over the vesting period. The estimated grant date fair values of the long term incentive plan units (discussed in Note 13) are being amortized over the expected service periods.
(p) Accounting Estimates
The preparation of consolidated financial statements, in accordance with U.S. generally accepted accounting principles (“GAAP”), requires the Company to make estimates and judgments that affect the reported amounts of assets, liabilities, revenues and expenses and related disclosures of contingent assets and liabilities. On an on-going basis, the Company evaluates its estimates, including those related to acquiring, developing and assessing the carrying values of its real estate portfolio, its investments in and advances to joint ventures and affiliates, its notes receivable and its qualification as a REIT. The Company bases its estimates on historical experience, current market conditions, and on various other assumptions that are believed to be reasonable under the circumstances. Actual results may vary from those estimates and those estimates could be different under different assumptions or conditions.
ESSEX PROPERTY TRUST, INC. AND SUBSIDIARIES
NOTES TO CONSOLIDATED FINANCIAL STATEMENTS
December 31, 2012, 2011, and 2010
(3) Real Estate Investments
(a)
Acquisitions of Real Estate
For the year ended December 31, 2012, the Company purchased eleven communities consisting of 2,052 units for $551.1 million.
During the first quarter of 2012, the Company acquired Bon Terra, a 60 unit community located adjacent to Delano in Redmond, Washington for $16.0 million. The Company also acquired Reed Square, a 100 unit community located in Sunnyvale, California for $23.0 million.
During the second quarter of 2012, the Company purchased the joint venture partner’s membership interest in the co-investment Essex Skyline at MacArthur Place, a 349 unit premier high-rise apartment community located in Santa Ana, California, for a total purchase price of $85.0 million. The Company recorded promote income of $2.3 million included in interest and other income on the consolidated statements of operations, earned as a result of achieving certain performance hurdles as defined in the joint venture agreement. Upon the acquisition of partner’s membership interest, the property was consolidated and a gain on remeasurement of the Company’s co-investment interest of $21.9 million was recorded equal to the amount by which the fair value of the Company’s previously owned noncontrolling interest exceeded its carrying value. The secured $80.0 million loan was repaid early as part of this transaction.
Also during the second quarter 2012, the Company purchased Park Catalina, a 90 unit property located in the Koreatown submarket of Los Angeles, California for a total purchase price of $23.7 million. In addition, the Company purchased The Huntington, a 276 unit property located in Huntington Beach, California for a purchase price of $48.3 million. The Company assumed a $30.3 million loan secured by the property at a fixed rate of 5.7% for seven years. The interest rate on the loan was unfavorable compared to currently available market rates for mortgage loans, and thus in conjunction with the purchase price allocation, the Company recorded a $4.3 million loan premium to reflect the debt at fair value. This results in an effective interest rate for this loan of 3.3%.
During the third quarter of 2012, the Company purchased Montebello, a 248 unit property located in Kirkland, Washington, for a purchase price of $52.0 million from a related party entity. The Company assumed a $26.5 million mortgage loan secured by the property at a fixed rate of 5.6% for eight years. The interest rate on the loan was unfavorable compared to currently available market rates for mortgage loans, and thus in conjunction with the purchase price allocation, the Company recorded a $4.1 million loan premium to reflect the debt at fair value. This results in an effective interest rate for this loan of 3.1%.
Also during the third quarter 2012, the Company acquired Park West, a 126 unit apartment community located in San Francisco, California, for $31.6 million. The Company intends to renovate the exterior of the community for $8 million. In addition, the Company acquired Domaine, a 92 unit property located in Seattle, Washington for $34.0 million. In connection with the purchase, the Company assumed a $14.6 million loan at a fixed rate of 5.7% for an 8 year term. The interest rate on the loan was unfavorable compared to currently available market rates for mortgage loans, and thus in conjunction with the purchase price allocation, the Company recorded a $2.4 million loan premium to reflect the debt at fair value. This results in an effective interest rate for this loan of 3.0%.
During the fourth quarter 2012, the Company acquired Ascent, a 90 unit community located in Kirkland, Washington, for $15.9 million and Willow Lake Apartments, a 508 unit property located in San Jose, California for $148.0 million. Also during the fourth quarter 2012, the Company purchased Bennett Lofts (formerly Q Lofts), a 147 unit apartment community located in San Francisco, California, for a total purchase price of $96.0 million. Approximately 75% of the property was acquired in December for $73.8 million, and the remainder was purchased in January 2013 for $22.2 million.
ESSEX PROPERTY TRUST, INC. AND SUBSIDIARIES
NOTES TO CONSOLIDATED FINANCIAL STATEMENTS
December 31, 2012, 2011, and 2010
For the year ended December 31, 2011, the Company purchased five communities for approximately $103.3 million, consisting of the following communities ($ in thousands):
|
Communities
|
Location
|
Purchase Price
|
Units
|
|||||||
|
Delano
|
Redmond, WA
|
$ | 14,100 | 66 | ||||||
|
Bernard
|
Seattle, WA
|
13,800 | 63 | |||||||
|
Bellerive
|
Los Angeles, CA
|
27,000 | 63 | |||||||
|
Santee Village
|
Los Angeles, CA
|
17,000 | 73 | |||||||
|
1000 Kiely
|
Santa Clara, CA
|
31,400 | 121 | |||||||
|
Total 2011 purchases
|
$ | 103,300 | 386 | |||||||
(b) Sales of Real Estate investments
For the year ended December 31, 2012, the Company sold $28.3 million of real estate which resulted in a gain of $10.9 million.
During the first quarter of 2012, the Company sold Tierra Del Sol/Norte, a 156 unit community located in San Diego, California for $17.2 million for a gain of $7.0 million. The Company also sold Alpine Country, a 108 unit community located in San Diego metropolitan area, for $11.1 million for a gain of $3.9 million.
During the second quarter of 2011, the Company disposed of Woodlawn Colonial, a 159-unit community located in Chula Vista, California for $16.0 million which resulted in a gain of $5.2 million. The property was purchased in 2002 as part of the John M. Sachs, Inc. merger.
During the third quarter 2011, the Company sold the View Pointe land parcel located in Newcastle, Washington for net proceeds of $1.4 million and a gain of $0.2 million.
During the fourth quarter of 2011, the Company sold the Clarendon office building in Woodland Hills, California for $7.4 million which resulted in a gain of $3.2 million on the sale.
No communities were held for sale as of December 31, 2012 or 2011.
(c) Co-investments
The Company has joint venture investments in co-investments which are accounted for under the equity method. The co-investments’ accounting policies are similar to the Company’s accounting policies. The joint ventures own, operate, and develop apartment communities.
Wesco I, LLC
Wesco, I LLC (“Wesco I”) is a 50/50 programmatic joint venture with an institutional partner for a total equity commitment of $300.0 million. Each partner’s equity commitment is $150.0 million. Wesco I will utilize debt as leverage equal to approximately 50% of the underlying real estate. The Company has contributed $150.0 million to Wesco I, and as of December 31, 2012, Wesco I owned nine apartment communities with 2,713 units with an aggregate carrying value of $660.5 million.
During the third quarter 2012, Wesco I acquired Riley Square (formerly Waterstone Santa Clara) for $38.3 million from a related party entity. The property contains 156 units and is located in Santa Clara, California. Wesco I assumed a $17.5 million mortgage loan secured by the property at a fixed rate of 5.2% for a term of 8 years. The interest rate on the loan was unfavorable compared to currently available market rates for mortgage loans, and thus in conjunction with the purchase price allocation, Wesco I recorded a $2.3 million loan premium to reflect the debt at fair value. This results in an effective interest rate for this loan of 3.1%.
ESSEX PROPERTY TRUST, INC. AND SUBSIDIARIES
NOTES TO CONSOLIDATED FINANCIAL STATEMENTS
December 31, 2012, 2011, and 2010
During the fourth quarter 2012, Wesco I acquired Madrid, a 230 unit community located in Mission Viejo, California for an undisclosed price (per an agreement with the seller). Also during the quarter, Wesco I acquired Pacific Electric Lofts for an undisclosed amount (per an agreement with the seller). The property contains 314 units along with 22,100 square feet of retail.
For the year ended December 31, 2011, the Company purchased five communities under the Wesco I joint venture for approximately $429.2 million, consisting of the following communities ($ in thousands):
|
Communities
|
Location
|
Purchase Price
|
Units
|
|||||||
|
Arbors Parc Rose
|
Oxnard, CA
|
$ | 92,000 | 373 | ||||||
|
Redmond Hill
|
Redmond, WA
|
151,300 | 882 | |||||||
|
Reveal
|
Woodland Hills, CA
|
132,900 | 438 | |||||||
|
Briarwood
|
Fremont, CA
|
27,800 | 160 | |||||||
|
The Woods
|
Fremont, CA
|
25,200 | 160 | |||||||
|
Total 2011 purchases
|
$ | 429,200 | 2,013 | |||||||
Wesco III, LLC
During 2012, the Company entered into a 50/50 programmatic joint venture, Wesco III LLC (“Wesco III”), with an institutional partner for a total equity commitment from the parties of $120.0 million. Each partner’s equity commitment is $60.0 million. Wesco III will utilize debt as leverage equal to approximately 50% of the underlying real estate. The Company has contributed $10.0 million to Wesco III, and provided a $26.0 million short term bridge loan to Wesco III at a rate of LIBOR + 2.5%.
During the fourth quarter 2012, Wesco III acquired Haver Hill, a 264 unit community located in Fullerton, California for $45.6 million.
Essex Apartment Value Fund II, L.P.
Essex Apartment Value Fund II, L.P. (“Fund II”), has eight institutional investors with combined partner equity contributions of $265.9 million. The Company contributed $75.0 million to Fund II, which represents a 28.2% interest as general partner and limited partner. Fund II utilized debt as leverage equal to approximately 55% upon the initial acquisition of the underlying real estate. Fund II invested in apartment communities in the Company’s targeted West Coast markets with an emphasis on investment opportunities in the Seattle metropolitan area and the San Francisco Bay Area. As of October 2006, Fund II was fully invested and closed for any future acquisitions or development. As of December 31, 2012, Fund II owned seven apartment communities.
During the fourth quarter 2012, Fund II sold seven communities for gross proceeds of $413.0 million, consisting of the following communities ($ in thousands):
|
Communities
|
Location
|
Purchase Price
|
Units
|
|||||||
|
Parcwood
|
Corona, CA
|
$ | 42,200 | 312 | ||||||
|
Regency Tower
|
Oakland, CA
|
31,000 | 178 | |||||||
|
Studio 40-41
|
Studio City, CA
|
56,300 | 149 | |||||||
|
Tower @ 801
|
Seattle, WA
|
50,100 | 173 | |||||||
|
Cielo
|
Chatsworth, CA
|
33,100 | 119 | |||||||
|
Echo Ridge
|
Snoqualmie, WA
|
26,500 | 120 | |||||||
|
The Enclave
|
San Jose, CA
|
173,750 | 637 | |||||||
|
Total 2012 sales
|
$ | 412,950 | 1,688 | |||||||
In conjunction with the sale of the assets, the Company incurred a prepayment penalty on debt obligations of $2.3 million during the fourth quarter 2012 for its pro-rata share of Fund II’s debt. The total gain on the transaction was $106 million, of which the Company’s pro rata share was $29.1 million.
ESSEX PROPERTY TRUST, INC. AND SUBSIDIARIES
NOTES TO CONSOLIDATED FINANCIAL STATEMENTS
December 31, 2012, 2011, and 2010
Canada Pension Plan Investment Board – Joint Venture Developments
The Company has entered into four development joint ventures with the Canada Pension Plan Investment Board (“CPPIB”) to develop four apartment communities. For each joint venture the Company holds a 55% non controlling interest in the venture and will earn customary management fees and may earn development, asset, and property management fees. The Company may also earn a promote interest. These co-investments are not variable interest entities since they have sufficient equity without additional subordinated support, and the Company and CPPIB jointly have the power to direct activities that most significantly impact the co-investments’ economic performance. Each of the co-investments between the Company and CPPIB has a single general partner, which is subsidiary consolidated by the Company. However, the Company, as general partner of the co-investments, does not control the co-investments because the limited partners have substantive participating rights. Therefore, the presumption of control by the Company as general partner is overcome by the rights held by CPPIB, and the Company records the co-investments with CPPIB on the equity method of accounting.
The following are the CPPIB development joint ventures:
|
Ownership
|
Estimated
|
Construction
|
||||||||||||
|
Development Projects - CPPIB Joint Venture
|
Location
|
%
|
Units
|
Total Cost
|
Start
|
|||||||||
|
Epic - Phase I and II
|
San Jose, CA
|
55% | 569 | $ | 191.6 |
Aug-11
|
||||||||
|
Connolly Station (fka Linc)
|
Dublin, CA
|
55% | 309 | 94.5 |
Aug-11
|
|||||||||
|
Folsom and Fifth
|
San Francisco, CA
|
55% | 463 | 250.0 |
Jun-12
|
|||||||||
|
Elkhorn
|
San Mateo, CA
|
55% | 197 | 76.1 |
Aug-12
|
|||||||||
|
Total - CPPIB Joint Venture Development Projects
|
1,538 | $ | 612.2 | |||||||||||
The Huxley and The Dylan (formerly Fountain and Santa Monica at La Brea) – Joint Venture Developments
During the third quarter 2011, the Company entered into a development joint venture with a regional developer for the construction of The Huxley, a 187 unit community with approximately 18,200 square feet of retail located in West Hollywood, California. The regional developer contributed the land and the Company contributed approximately $9.0 million in cash for a 50% interest in the venture. The joint venture obtained bond financing for the project in the amount of $54.5 million with a maturity date of October 2046 and entered into an interest rate swap transaction with respect to the bonds that terminates in September 2016 that effectively converts the interest rate to the Securities Industry and Financial Market Association index (“SIFMA”) plus 150 basis points through December 2016.
In the fourth quarter 2011, the Company entered into another development joint venture with the same regional developer for the construction of The Dylan, a 184 unit apartment community with approximately 12,750 square feet of retail located in West Hollywood, California. The 50/50 joint venture was created with the contribution of $5.8 million by the Company and the contribution of entitled land by the regional developer. The joint venture secured bond financing in the amount of $59.9 million, maturing in December 2046. The joint venture entered into a total return swap agreement that effectively converts the interest rate to SIFMA plus 150 basis points through December 2016.
The bond financing for these two development projects have joint and several liability for the joint venture partners. Additionally, if either partner fails to make capital contributions to one of these joint ventures in certain instances, then the ownership interest of the defaulting partner in the other joint venture may be reduced.
Expo (formerly Queen Anne) – Joint Venture Development
During December 2010, the Company entered into a development joint venture with a partner who contributed a land parcel during the first quarter of 2011 in return for a 50% interest in the venture and the Company contributed cash equal to the value of the land in return for a 50% interest in the joint venture. The 275-unit community is under development in Seattle, Washington. The Expo joint venture obtained a $45.0 million construction loan at a rate of LIBOR plus 195 basis points, due July 2014, with two one-year extension options exercisable at the joint venture’s option.
ESSEX PROPERTY TRUST, INC. AND SUBSIDIARIES
NOTES TO CONSOLIDATED FINANCIAL STATEMENTS
December 31, 2012, 2011, and 2010
Preferred Equity Investments
During the second quarter 2012, the Company made a $14 million preferred equity investment in an apartment community located in Cupertino, California to a related party entity. The investment has a preferred return of 9.5% and matures in May 2016. The preferred equity agreement provides for up to $4 million of additional funding for renovation costs.
During the first quarter 2011, the Company invested $9.7 million as preferred equity investments in two apartment communities located in downtown Los Angeles. The investments are for ten years with a preferred return of 9% for five years, increasing to a minimum of 10% and a maximum of 12.5% thereafter.
During the second quarter of 2011, the Company completed a $13.0 million preferred equity investment in an entity owning an apartment community located in downtown Los Angeles. The Company’s preferred return is 10% and the Company’s investment has a five-year term.
During the third quarter of 2011, the Company sold its preferred stock investments in MyNewPlace.com, a real estate technology company for net proceeds of $1.6 million and a gain of $0.9 million.
During the fourth quarter of 2011, the Company entered into a 50/50 joint venture with an institutional partner, Wesco II, LLC (“Wesco II”), which in turn closed a $175 million preferred equity investment in Park Merced, a 3,221-unit apartment community located in San Francisco, California. The preferred equity investment has a stated term of 7 years and a preferred return of 10.1%. The investment cannot be repaid during the first two years, and there is a prepayment penalty in the third through the fifth year of the investment. The community is encumbered with a $450 million senior mortgage loan with a fixed interest rate of 3.83% due in 2018. The senior loan represents roughly a 60% loan to value, and the projected debt service coverage is approximately 110% including Wesco II’s preferred equity investment (unaudited).
ESSEX PROPERTY TRUST, INC. AND SUBSIDIARIES
NOTES TO CONSOLIDATED FINANCIAL STATEMENTS
December 31, 2012, 2011, and 2010
The carrying values of the Company’s co-investments as of December 31, 2012 and 2011 are as follows ($ in thousands):
|
2012
|
2011
|
|||||||
|
Investments in joint ventures accounted for under the equity method of accounting:
|
||||||||
|
Membership interest in Wesco I
|
$ | 143,874 | $ | 75,588 | ||||
|
Partnership interest in Fund II
|
53,601 | 64,294 | ||||||
|
Membership interest in Wesco III
|
9,941 | - | ||||||
|
Membership interest in a limited liability company that owns Essex Skyline at MacArthur Place
|
- | 24,063 | ||||||
|
Total operating co-investments
|
207,416 | 163,945 | ||||||
|
Membership interests in limited liability companies that own and are developing Epic, Connolly Station, Folsom and Fifth, and Elkhorn
|
186,362 | 62,897 | ||||||
|
Membership interest in a limited liability company that owns and is developing Expo
|
18,752 | 17,981 | ||||||
|
Membership interests in limited liability companies that own and are developing The Huxley and The Dylan
|
16,552 | 15,194 | ||||||
|
Total development co-investments
|
221,666 | 96,072 | ||||||
|
Membership interest in Wesco II that owns a preferred equity interest in Parkmerced with a perferred return of 10.1%
|
91,843 | 88,075 | ||||||
|
Preferred interests in limited liability companies that own apartment communities in downtown Los Angeles with preferred returns of 9% and 10%
|
22,807 | 22,792 | ||||||
|
Preferred interests in related party limited liability company that owns Sage at Cupertino with a preferred return of 9.5%
|
14,438 | - | ||||||
|
Preferred interest in a related party limited liability company that owns Madison Park at Anaheim with a preferred return of 13%
|
13,175 | 12,528 | ||||||
|
Total preferred interest investments
|
142,263 | 123,395 | ||||||
|
Total co-investments
|
$ | 571,345 | $ | 383,412 | ||||
ESSEX PROPERTY TRUST, INC. AND SUBSIDIARIES
NOTES TO CONSOLIDATED FINANCIAL STATEMENTS
December 31, 2012, 2011, and 2010
The combined summarized financial information of co-investments, which are accounted for under the equity method, is as follows ($ in thousands):
|
December 31,
|
||||||||
|
2012
|
2011
|
|||||||
|
Balance sheets:
|
||||||||
|
Rental properties and real estate under development
|
$ | 1,745,147 | $ | 1,659,078 | ||||
|
Other assets
|
168,061 | 63,847 | ||||||
|
Total assets
|
$ | 1,913,208 | $ | 1,722,925 | ||||
|
Debt
|
$ | 820,895 | $ | 900,095 | ||||
|
Other liabilities
|
91,922 | 48,518 | ||||||
|
Equity
|
1,000,391 | 774,312 | ||||||
|
Total liabilities and partners' equity
|
$ | 1,913,208 | $ | 1,722,925 | ||||
|
Company's share of equity
|
$ | 571,345 | $ | 383,412 | ||||
|
Years ended
|
||||||||||||
|
December 31,
|
||||||||||||
|
2012
|
2011
|
2010
|
||||||||||
|
Statements of operations:
|
||||||||||||
|
Property revenues
|
$ | 130,128 | $ | 106,386 | $ | 54,699 | ||||||
|
Property operating expenses
|
(55,990 | ) | (43,066 | ) | (24,098 | ) | ||||||
|
Net operating income
|
74,138 | 63,320 | 30,601 | |||||||||
|
Gain on sale of real estate
|
106,016 | - | - | |||||||||
|
Interest expense
|
(34,959 | ) | (27,843 | ) | (13,619 | ) | ||||||
|
General and administrative
|
(3,697 | ) | (1,748 | ) | (709 | ) | ||||||
|
Depreciation and amortization
|
(47,917 | ) | (44,412 | ) | (20,850 | ) | ||||||
|
Net income (loss)
|
$ | 93,581 | $ | (10,683 | ) | $ | (4,577 | ) | ||||
|
Company's share of net income (loss)
|
$ | 41,745 | $ | (467 | ) | $ | (1,715 | ) | ||||
(d) Real Estate for Development
The Company defines development activities as new properties that are being constructed, or are newly constructed and, in the case of development communities, are in a phase of lease-up and have not yet reached stabilized operations. As of December 31, 2012, the Company had two consolidated development projects, and seven unconsolidated joint venture development projects aggregating 2,495 units for an estimated total cost of $928.4 million, of which $463.9 million remains to be expended.
As of December 31, 2012, the Company had two consolidated predevelopment projects and one unconsolidated predevelopment joint venture project consisting of 449 units for a total cost of $59.6 million. In addition, the Company owned one land parcel held for future development or sale as of December 31, 2012. The Company expects to fund the development and predevelopment pipeline by using a combination of some or all of the following sources: its working capital, amounts available on its lines of credit, net proceeds from public and private equity and debt issuances, and proceeds from the disposition of properties, if any.
ESSEX PROPERTY TRUST, INC. AND SUBSIDIARIES
NOTES TO CONSOLIDATED FINANCIAL STATEMENTS
December 31, 2012, 2011, and 2010
(4) Notes and Other Receivables
Notes receivables, secured by real estate, and other receivables consist of the following as December 31, 2012 and 2011 ($ in thousands):
|
2012
|
2011
|
|||||||
|
Note receivable, secured, bearing interest at 9.8%, paid in full January 2012
|
$ | - | $ | 7,331 | ||||
|
Note receivable, secured, bearing interest at 5.0%, due November 2012
(1)
|
- | 12,428 | ||||||
|
Note receivable, secured, bearing interest at LIBOR + 8.0%, paid in full December 2012
|
- | 6,422 | ||||||
|
Note receivable, secured, bearing interest at 8.8%, due February 2014
(2)
|
10,800 | 10,928 | ||||||
|
Note receivable, secured, bearing interest at 8.0%, due November 2013
|
971 | 971 | ||||||
|
Note receivable, secured, effective interest at 9.6%, due February 2014
|
18,499 | 17,646 | ||||||
|
Note receivable, secured, bearing interest at 4.0%, due December 2014
(3)
|
3,212 | 3,221 | ||||||
|
Notes and other receivables from affiliates
(4)
|
28,896 | 2,734 | ||||||
|
Other receivables
|
3,785 | 4,688 | ||||||
| $ | 66,163 | $ | 66,369 | |||||
|
|
(1)
|
$12.4 million note receivable was contributed to the Elkhorn co-investment during the first quarter of 2012.
|
|
|
(2)
|
During the fourth quarter of 2012, the Company amended the loan to extend the maturity date to February 2014.
|
|
|
(3)
|
During the first quarter 2012, the Company amended the loan secured by Vacationer RV Park to extend the maturity date to December 2014. Beginning January 1, 2012 the note which has a carrying value of $3.2 million, bears interest at a rate of 4%, and the borrower funds an impound account for capital replacement.
|
|
|
(4)
|
The Company provided a $26.0 million short-term bridge loan to Wesco III at a rate of LIBOR + 2.5%.
|
(5) Related Party Transactions
Management and other fees from affiliates is comprised primarily of asset management, property management, development and redevelopment fees from co-investments. These fees from affiliates total $10.9 million, $6.1 million, and $4.1 million for the years ended December 31, 2012, 2011, and 2010, respectively, and a property acquisition fee of $0.5 million from the limited liability company that owns Skyline at MacArthur Place for the year ended December 31, 2010. All of these fees are net of intercompany amounts eliminated by the Company.
The Company provided a $26.0 million short-term bridge loan to Wesco III at a rate of
LIBOR + 2.5%
, to assist with the purchase of Haver Hill.
The Company’s Chairman and founder, Mr. George Marcus, is the Chairman of The Marcus & Millichap Company (“TMMC”), which is a holding company for certain real estate brokerage services and other subsidiary companies. For further discussion of the Company’s policies and procedures with respect to related party transactions see the caption, “
Certain Relationships and Related Persons Transactions”
in the Company’s 2013 Definitive Proxy Statement which is incorporated by reference in Item 13 of the Company's December 31, 2012 Form 10-K. Fund II paid a brokerage commission totaling $0.4 million to an affiliate of TMMC related to the sale of a property in 2012 and no brokerage commissions during 2011 or 2010, and no brokerage commissions were paid by the Company to TMMC or its affiliates during 2012, 2011, and 2010.
In January 2013, the Company invested $8.6 million as a preferred equity interest investment in an entity affiliated with TMMC that owns an apartment development in Redwood City, California. The investment has a preferred return of 9.5% and matures in January 2016. Independent members of the Company’s Board of Directors that serve on the Nominating and Audit Committees approved the investment in this entity.
During the third quarter of 2012, the Company invested $14.0 million as a preferred equity interest investment in an entity affiliated with TMMC that owns an apartment community in Cupertino, California. The investment has a preferred return of 9.5% and matures in May 2016. The Company will invest an additional $4.0 million in preferred equity to fund renovation costs. Independent directors (other than Mr. Marcus) on the Company’s Board of Directors approved the investment in this entity.
ESSEX PROPERTY TRUST, INC. AND SUBSIDIARIES
NOTES TO CONSOLIDATED FINANCIAL STATEMENTS
December 31, 2012, 2011, and 2010
Also during the third quarter of 2012, the Company acquired Montebello, a 248 unit apartment community in Kirkland, Washington for $52.0 million from an entity affiliated with TMMC, and Wesco I acquired Riley Square (formerly Waterstone Santa Clara), a 156 unit apartment community in Santa Clara, California for $38.3 million from an entity affiliated with TMMC. Independent directors (other than Mr. Marcus) on the Company’s Board of Directors approved the acquisitions of Montebello and Riley Square.
During the third quarter of 2010, the Company invested $12.0 million as a preferred equity interest investment in a related party entity that owns a 768-unit apartment community in Anaheim, California. The entity that owns the property is an affiliate of TMMC. The Company’s independent directors (other than Mr. Marcus) approved the investment in this entity. The preferred return for this investment during the first five years is 13% per annum, and the preferred return increases to 15% thereafter.
During the second quarter of 2010, the independent directors (other than Mr. Marcus) approved the partial redemption for cash by the Operating Partnership of limited Operating Partnership units that were held by Mr. Marcus, at $106.76 per unit representing a 2% discount from the closing price of the Company’s common stock on May 17, 2010. The Operating Partnership purchased 187,334 units from Mr. Marcus. Under the Operating Partnership’s partnership agreement, limited partnership units are exchangeable on a one-for-one basis into shares of the Company’s common stock.
An Executive Vice President of the Company has invested $4.0 million for a 3% limited partnership interest in a partnership with the Company that owns Essex Skyline at MacArthur Place. The Executive Vice President’s investment is equal to a pro-rata share of the contributions to the limited partnership. The Executive Vice President’s investment also receives pro-rata distributions resulting from distributable cash generated by the property if and when distributions are made. The Executive Vice President does not participate in fees paid to the Company by the property.
(6) Discontinued Operations
During 2012, the Company sold Tierra Del Sol/Norte, a 156 unit community located in the San Diego, California for $17.2 million for a gain of $7.0 million. Also during 2012, the Company sold Alpine Country, a 108 unit community located in San Diego metropolitan area, for $11.1 million for a gain of $3.9 million. As of December 31, 2012 and 2011 no communities were held for sale.
During 2011, the Company sold one apartment community, Woodlawn Colonial, and one office building, Clarendon, for a total of $23.4 million resulting in gains totaling $8.4 million.
The Company has recorded the gains and operations for these various assets sold described above as part of discontinued operations in the accompanying consolidated statements of operations. The components of discontinued operations are outlined below and include the results of operations for the respective periods that the Company owned such assets, as described above ($ in thousands):
|
2012
|
2011
|
2010
|
||||||||||
|
Revenues
|
$ | 608 | $ | 4,081 | $ | 5,453 | ||||||
|
Property operating expenses
|
(260 | ) | (1,861 | ) | (2,342 | ) | ||||||
|
Depreciation and amortization
|
(94 | ) | (1,115 | ) | (1,491 | ) | ||||||
|
Expenses
|
(354 | ) | (2,976 | ) | (3,833 | ) | ||||||
|
Operating income from real estate sold
|
254 | 1,105 | 1,620 | |||||||||
|
Gain on sale of real estate
|
10,870 | 8,382 | - | |||||||||
|
Internal disposition costs
|
(1,087 | ) | (839 | ) | - | |||||||
|
Income from discontinued operations
|
$ | 10,037 | $ | 8,648 | $ | 1,620 | ||||||
ESSEX PROPERTY TRUST, INC. AND SUBSIDIARIES
NOTES TO CONSOLIDATED FINANCIAL STATEMENTS
December 31, 2012, 2011, and 2010
(7) Mortgage Notes Payable
Mortgage notes payable consist of the following as of December 31, 2012 and 2011 ($ in thousands):
|
2012
|
2011
|
|||||||
|
Fixed rate mortgage notes payable
|
$ | 1,363,731 | $ | 1,502,208 | ||||
|
Variable rate mortgage notes payable
(1)
|
201,868 | 243,650 | ||||||
| $ | 1,565,599 | $ | 1,745,858 | |||||
|
Number of properties securing mortgage notes
|
55 | 68 | ||||||
|
Remaining terms
|
1-27 years
|
1-28 years
|
||||||
|
Weighted average interest rate
|
5.4 | % | 5.4 | % | ||||
The aggregate scheduled principal payments of mortgage notes payable are as follows ($ in thousands):
|
2013
|
$ | 57,621 | ||
|
2014
|
47,994 | |||
|
2015
|
68,926 | |||
|
2016
|
12,656 | |||
|
2017
|
185,301 | |||
|
Thereafter
|
1,193,101 | |||
| $ | 1,565,599 |
|
(1)
|
Variable rate mortgage notes payable consists of multifamily housing mortgage revenue bonds secured by deeds of trust on rental properties and guaranteed by collateral pledge agreements, payable monthly at a variable rate as defined in the Loan Agreement (approximately 1.9% at December 2012 and 2.0% at December 2011) plus credit enhancement and underwriting fees ranging from approximately 1.2% to 1.9%. Among the terms imposed on the properties, which are security for the bonds, is a requirement that 20% of the units are subject to tenant income criteria. Principal balances are due in full at various maturity dates from September 2013 through December 2039. Of these bonds $187.8 million are subject to various interest rate cap agreements which limit the maximum interest rate to such bonds.
|
For the Company’s mortgage notes payable as of December 31, 2012, monthly interest expense and principal amortization, excluding balloon payments, totaled approximately $7.0 million and $2.0 million, respectively. Second deeds of trust accounted for $87.3 million of the $1.6 billion in mortgage notes payable as of December 31, 2012. Repayment of debt before the scheduled maturity date could result in prepayment penalties. The prepayment penalty on the majority of the Company’s mortgage notes payable are computed by the greater of (a) 1% of the amount of the principal being prepaid or (b) the present value of the mortgage note payable which is calculated by multiplying the principal being prepaid by the difference between the interest rate of the mortgage note and the stated yield rate on a specified U.S. treasury security as defined in the mortgage note agreement. (See Schedule III for a list of mortgage loans related to each community in the Company’s Portfolio.)
(8) Unsecured Debt and Lines of Credit
Unsecured debt and lines of credit consist of the following as of December 31, 2012 and 2011 ($ in thousands):
|
Weighted Average
|
||||||||||||
|
Maturity
|
||||||||||||
|
2012
|
2011
|
In Years
|
||||||||||
|
Bonds private placement - fixed rate
|
$ | 465,000 | $ | 265,000 | 6.2 | |||||||
|
Term loan - variable rate
|
350,000 | 200,000 | 4.2 | |||||||||
|
Bonds public offering - fixed rate
|
297,084 | - | 9.6 | |||||||||
|
Unsecured debt
|
1,112,084 | 465,000 | ||||||||||
|
Lines of credit
|
141,000 | 150,000 | 3.0 | |||||||||
|
Total unsecured debt
|
$ | 1,253,084 | $ | 615,000 | ||||||||
|
Weighted average interest rate on fixed rate unsecured bonds
|
4.2 | % | 4.5 | % | ||||||||
|
Weighted average interest rate on variable rate term loan
|
2.7 | % | 2.7 | % | ||||||||
|
Weighted average interest rate on line of credit
|
2.3 | % | 2.5 | % | ||||||||
ESSEX PROPERTY TRUST, INC. AND SUBSIDIARIES
NOTES TO CONSOLIDATED FINANCIAL STATEMENTS
December 31, 2012, 2011, and 2010
The following is a summary of the Company’s unsecured private placement bonds as of December 31, 2012 and 2011 ($ in thousands):
|
Coupon
|
|||||||||||||
|
Maturity
|
2012
|
2011
|
Rate
|
||||||||||
|
Senior unsecured private placement notes
|
March 2016
|
$ | 150,000 | $ | 150,000 | 4.36 | % | ||||||
|
Senior unsecured private placement notes
|
September 2017
|
40,000 | 40,000 | 4.50 | % | ||||||||
|
Senior unsecured private placement notes
|
December 2019
|
75,000 | 75,000 | 4.92 | % | ||||||||
|
Senior unsecured private placement notes
|
April 2021
|
100,000 | - | 4.27 | % | ||||||||
|
Senior unsecured private placement notes
|
June 2021
|
50,000 | - | 4.30 | % | ||||||||
|
Senior unsecured private placement notes
|
August 2021
|
50,000 | - | 4.37 | % | ||||||||
| $ | 465,000 | $ | 265,000 | ||||||||||
The Company has two lines of credit aggregating $525.0 million as of December 31, 2012. The Company had a $500.0 million unsecured line of credit that was increased to $600.0 million in January 2013. As of December 31, 2012 there was a $141.0 million balance on this unsecured line. The underlying interest rate on the $500.0 million facility is based on a tiered rate structure tied to Fitch and S&P ratings on the credit facility and the rate was LIBOR plus 1.075% as of December 31, 2012. This facility matures in December 2015 with two one-year extensions, exercisable by the Company. The Company has a working capital unsecured line of credit agreement for $25.0 million. This facility matures in January 2014, with a one year extension option. As of December 31, 2012 there was no balance outstanding on this unsecured line. The underlying interest rate on the $25.0 million line is based on a tiered rate structure tied to Fitch and S&P ratings on the credit facility of LIBOR plus 1.075%.
As of December 31 2012, the Company had $465 million of unsecured bonds outstanding at an average effective interest rate of 4.5%. During the second quarter of 2012, the Company issued through private placements, $100 million of bonds and $50 million of bonds at 4.27% and 4.30%, respectively, due in 2021, and during the third quarter of 2012, $50 million of bonds at 4.37% due in 2021.
As of December 31, 2012, the Company had a $350 million unsecured term loan outstanding at an average interest rate of 2.7%. The term loan has a variable interest rate of LIBOR plus 1.2%. During the fourth quarter of 2012, the Company increased the size of the term loan from $200 million to $350 million. The Company entered into interest rate swap contracts for a term of five years with a notional amount totaling $300 million, which effectively converted the interest rate on the $300 million of the term loan to a fixed rate.
During the third quarter 2012, the Company issued $300.0 million of senior unsecured notes due August 2022 with a coupon rate of 3.625% per annum and are payable on February 15th and August 15th of each year, beginning February 15, 2013 (the 2022 Notes). The 2022 Notes were offered to investors at a price of 98.99% of par value. The 2022 Notes are general unsecured senior obligations of the Operating Partnership, rank equally in right of payment with all other senior unsecured indebtedness of the Operating Partnership and are fully and unconditionally guaranteed by Essex Property Trust, Inc.
On August 15th, 2012, in connection with the 2022 Notes issuance, the Company entered into a registration rights agreement whereby the Operating Partnership agreed to conduct an offer to exchange the 2022 Notes for a new series of publicly registered notes with substantially identical terms. If the Operating Partnership does not fulfill certain of its obligation under the registration rights agreement, it will be required to pay registration default damages to the holders of the 2022 Notes. No separate contingent obligation was recorded as no registration default damages became probable as of December 31, 2012.
The Company’s unsecured line of credit and unsecured debt agreements contain debt covenants related to limitations on indebtedness and liabilities and maintenance of minimum levels of consolidated earnings before depreciation, interest and amortization. The Company was in compliance with the debt covenants as of December 31, 2012 and 2011.
(9) Derivative Instruments and Hedging Activities
The Company uses interest rate swaps and interest rate cap contracts to manage certain interest rate risks. The valuation of these instruments is determined using widely accepted valuation techniques including discounted cash flow analysis on the expected cash flows of each derivative. This analysis reflects the contractual terms of the derivatives, including the period to maturity, and uses observable market-based inputs, including interest rate curves. The fair values of interest rate swaps are determined using the market standard methodology of netting the discounted future fixed cash receipts (or payments) and the discounted expected variable cash payments (or receipts). The variable cash payments (or receipts) are based on an expectation of future interest rates (forward curves) derived from observable market interest rate curves. The Company incorporates credit valuation adjustments to appropriately reflect both its own nonperformance risk and the respective counterparty’s nonperformance risk in the fair value measurements.
ESSEX PROPERTY TRUST, INC. AND SUBSIDIARIES
NOTES TO CONSOLIDATED FINANCIAL STATEMENTS
December 31, 2012, 2011, and 2010
The Company has entered into interest rate swap contracts with an aggregate notional amount of $300 million that effectively fixed the interest rate on $300 million of the $350 million unsecured term loan at 2.7% through November 2016. These derivatives qualify for hedge accounting.
As of December 31, 2012 the Company also had twelve interest rate cap contracts totaling a notional amount of $187.8 million that qualify for hedge accounting as they effectively limit the Company’s exposure to interest rate risk by providing a ceiling on the underlying variable interest rate for $201.9 million of the Company’s tax exempt variable rate debt.
As of December 31, 2012 and December 31, 2011 the aggregate carrying value of the interest rate swap contracts was a liability of $6.6 million and $1.4 million, respectively. The aggregate carrying value of the interest rate cap contracts was zero on the balance sheet as of December 31, 2012, and was an asset of $0.2 million as of December 31, 2011.
During the third quarter 2012, the Company terminated a swap transaction with respect to the $38.0 million of tax-exempt bonds for the 101 San Fernando apartment community with Citibank because the bonds were repurchased by the Company at par.
During 2011, the Company settled its remaining $20.0 million forward starting swap contract for $2.3 million which was applied to the $32.0 million mortgage obtained in February 2011, increasing the effective borrowing rate from 5.4% to 6.2%.
During 2010, the Company settled $355 million in forward-starting swap contracts for $81.3 million, which was applied to 10-year mortgage loans obtained in 2010. The settlement of the forward-starting swaps increased the average effective interest rate on the 2010 mortgage loans from 4.5% to 6.8%. During 2010, the Company incurred $2.3 million in expense related to the ineffectiveness of certain of the settled forward-starting swap hedges, which is included in impairment and other charges in the accompanying consolidated statement of operations for the year ended December 31, 2010. No hedge ineffectiveness on cash flow hedges was incurred during the years ended December 31, 2012 and 2011.
(10) Lease Agreements
As of December 31, 2012 the Company is a lessor for four commercial buildings and the commercial portions of 20 mixed use communities. The tenants’ lease terms expire at various times through 2028. The future minimum non-cancelable base rent to be received under these operating leases for each of the years ending after December 31 is summarized as follows ($ in thousands):
|
Future
|
||||
|
Minimum
|
||||
|
Rent
|
||||
|
2013
|
$ | 8,592 | ||
|
2014
|
8,395 | |||
|
2015
|
6,933 | |||
|
2016
|
4,512 | |||
|
2017
|
2,781 | |||
|
Thereafter
|
14,562 | |||
| $ | 45,775 | |||
ESSEX PROPERTY TRUST, INC. AND SUBSIDIARIES
NOTES TO CONSOLIDATED FINANCIAL STATEMENTS
December 31, 2012, 2011, and 2010
(11) Equity Transactions
Preferred Securities Offerings
As of December 31, 2012, the Company has the following cumulative preferred securities outstanding:
|
Shares
|
Shares
|
Liquidation
|
||||||||
|
Description
|
Issue Date
|
Authorized
|
Outstanding
|
Preference
|
||||||
|
7.125% Series H
|
April 2011
|
8,000,000
|
2,950,000
|
$ | 73,750 | |||||
|
4.875% Series G
|
July 2006
|
5,980,000
|
178,249
|
$ | 4,456 | |||||
During the second quarter of 2011, the Company issued 2,950,000 shares of 7.125% Series H Cumulative Redeemable Preferred Stock (“Series H”) at a price of $25.00 per share for net proceeds of $71.2 million, net of costs and original issuance discounts. The Series H has no maturity date and generally may not be called by the Company before April 13, 2016. Net proceeds from the Series H offering were used to redeem all of the 7.875% Series B Cumulative Redeemable Preferred Units of Essex Portfolio, L.P. (“Series B”) with a liquidation value of $80.0 million, which resulted in excess of cash paid of $1.0 million over the carrying value of Series B due to deferred offering costs and original issuance discounts.
Also during the second quarter of 2011, the Company redeemed its 7.8125% Series F Preferred Stock (“Series F”) at liquidation value for $25.0 million which resulted in excess of cash paid of $0.9 million over the carrying value of Series F due to deferred offering costs and original issuance discounts.
During the third quarter of 2006, the Company sold 5,980,000 shares of 4.875% Series G Cumulative Convertible Preferred Stock (“Series G”) for gross proceeds of $149.5 million. Holders may convert Series G into shares of the Company’s common stock subject to certain conditions. The conversion rate was initially .1830 shares of common stock per the $25 share liquidation preference, which is equivalent to an initial conversion price of approximately $136.62 per share of common stock (the conversion rate will be subject to adjustment upon the occurrence of specified events). The Company may, under certain circumstances, cause some or all of the Series G to be converted into that number of shares of common stock at the then prevailing conversion rate. As of December 31, 2012 and 2011, shares of Series G with an aggregate liquidation value of $4.5 million were outstanding.
Common Stock Offerings
During 2012, the Company sold 2.4 million shares of common stock for $357.7 million, net of fees and commissions, at an average price of $150.26. During the first quarter of 2013, through February 21, 2013, the Company sold 758,644 shares of common stock for $114.0 million, net of fees and commissions at an average price of $151.70.
During 2011 and 2010, the Company issued 2.5 million and 2.4 million shares of common stock for $323.9 million and $251.4 million, net of fees and commissions, respectively. The Company used the net proceeds from such sales to pay down debt, repurchase preferred stock, fund redevelopment and development pipelines, fund acquisitions, and for general corporate purposes.
ESSEX PROPERTY TRUST, INC. AND SUBSIDIARIES
NOTES TO CONSOLIDATED FINANCIAL STATEMENTS
December 31, 2012, 2011, and 2010
(12) Net Income Per Common Share
Basic and diluted income from continuing operations per share are calculated as follows for the years ended December 31
($ in thousands, except share and per share amounts
):
|
2012
|
2011
|
2010
|
||||||||||||||||||||||||||||||||||
|
Weighted-
|
Per
|
Weighted-
|
Per
|
Weighted-
|
Per
|
|||||||||||||||||||||||||||||||
|
average
|
Common
|
average
|
Common
|
average
|
Common
|
|||||||||||||||||||||||||||||||
|
Common
|
Share
|
Common
|
Share
|
Common
|
Share
|
|||||||||||||||||||||||||||||||
|
Income
|
Shares
|
Amount
|
Income
|
Shares
|
Amount
|
Income
|
Shares
|
Amount
|
||||||||||||||||||||||||||||
|
Basic:
|
||||||||||||||||||||||||||||||||||||
|
Income from continuing operations available to common stockholders
|
$ | 110,373 | 35,032,491 | $ | 3.15 | $ | 32,256 | 32,541,792 | $ | 0.99 | $ | 32,251 | 29,667,064 | $ | 1.09 | |||||||||||||||||||||
|
Income from discontinued operations available to common stockholders
|
9,439 | 35,032,491 | 0.27 | 8,112 | 32,541,792 | 0.25 | 1,513 | 29,667,064 | 0.05 | |||||||||||||||||||||||||||
| 119,812 | 3.42 | 40,368 | 1.24 | 33,764 | 1.14 | |||||||||||||||||||||||||||||||
|
Effect of Dilutive Securities (1)
|
- | 92,430 | - | 86,922 | - | 67,319 | ||||||||||||||||||||||||||||||
|
Diluted:
|
||||||||||||||||||||||||||||||||||||
|
Income from continuing operations available to common stockholders (1)
|
$ | 110,373 | 35,124,921 | $ | 3.14 | $ | 32,256 | 32,628,714 | $ | 0.99 | $ | 32,251 | 29,734,383 | $ | 1.09 | |||||||||||||||||||||
|
Income from discontinued operations available to common stockholders
|
9,439 | 35,124,921 | 0.27 | 8,112 | 32,628,714 | 0.25 | 1,513 | 29,734,383 | 0.05 | |||||||||||||||||||||||||||
| $ | 119,812 | $ | 3.41 | $ | 40,368 | $ | 1.24 | $ | 33,764 | $ | 1.14 | |||||||||||||||||||||||||
|
|
(1)
|
Weighted convertible limited partnership units of 2,219,046, 2,231,807 and 2,293,886, which include vested Series Z incentive units
,
for the years ended December 31, 2012, 2011 and 2010, respectively, were not included in the determination of diluted EPS because they were anti-dilutive. The Company has the ability to redeem DownREIT limited partnership units for cash and does not consider them to be potentially dilutive securities.
|
Stock options of 263,613; 175,500; and 123,164; for the years ended December 31, 2012, 2011, and 2010, respectively, were not included in the diluted earnings per share calculation because the exercise price of these options were greater than the average market price of the common shares for the years ended and, therefore, were anti-dilutive.
All shares of cumulative convertible preferred stock Series G have been excluded from diluted earnings per share for the years ended 2012, 2011, and 2010 respectively, as the effect was anti-dilutive.
(13) Equity Based Compensation Plans
Stock Options and Restricted Stock
The Essex Property Trust, Inc. 2004 Stock Incentive Plan provides incentives to attract and retain officers, directors and key employees. The Stock Incentive Plan provides for the grants of options to purchase a specified number of shares of common stock or grants of restricted shares of common stock. Under the Stock Incentive Plan, the total number of shares available for grant is approximately 1,200,000. The 2004 Stock Incentive Plan is administered by the Compensation Committee of the Board of Directors. The Compensation Committee is comprised of independent directors. The Compensation Committee is authorized to establish the exercise price; however, the exercise price cannot be less than 100% of the fair market value of the common stock on the grant date. The Company’s options have a life of seven to ten years. Option grants for officers and employees fully vest between one year and five years after the grant date.
Stock-based compensation expense for options and restricted stock under the fair value method totaled $2.0 million, $1.5 million, and $1.0 million for years ended December 31, 2012, 2011 and 2010 respectively. Stock-based compensation capitalized for options and restricted stock totaled $0.3 million for the year ended December 31, 2012, and $0.2 million for each of the years ended December 31, 2011 and 2010. The intrinsic value of the options exercised totaled $2.9 million, $3.8 million, and $2.9 million, for the years ended December 31, 2012, 2011, and 2010 respectively. The intrinsic value of the options outstanding and fully vested totaled $9.9 million, $10.6 million, and $7.7 million, for the years ended December 31, 2012, 2011 and 2010, respectively.
Total unrecognized compensation cost related to unvested share-based compensation granted for stock options totaled $3.2 million as of December 31, 2012. The unrecognized compensation cost is expected to be recognized over a period of 1 to 5 years for the stock option plans.
ESSEX PROPERTY TRUST, INC. AND SUBSIDIARIES
NOTES TO CONSOLIDATED FINANCIAL STATEMENTS
December 31, 2012, 2011, and 2010
The average fair value of stock options granted for the years ended December 31, 2012, 2011 and 2010 was $12.64, $14.49 and $18.39, respectively. The stock options granted during the fourth quarter of 2012 included a $75 cap on the appreciation of the market price over the exercise price. The stock options granted during 2011 and through the third quarter of 2012 included a $100 cap on the appreciation of the market price over the exercise price. The fair value of stock options was estimated on the date of grant using the Black-Scholes option pricing model with the following weighted average assumptions used for grants:
|
2012
|
2011
|
2010
|
|||||||
|
Stock price
|
$143.95 | $131.87 | $107.21 | ||||||
|
Risk-free interest rates
|
1.16% | 2.23% | 3.50% | ||||||
|
Expected lives
|
5 - 10 years
|
10 years
|
10 years
|
||||||
|
Volatility
|
20.05% | 19.63% | 22.00% | ||||||
|
Dividend yield
|
3.26% | 3.29% | 3.85% |
A summary of the status of the Company’s stock option plans as of December 31, 2012, 2011, and 2010 and changes during the years ended on those dates is presented below:
|
2012
|
2011
|
2010
|
||||||||||||||||||||||
|
Weighted-
|
Weighted-
|
Weighted-
|
||||||||||||||||||||||
|
average
|
average
|
average
|
||||||||||||||||||||||
|
exercise
|
exercise
|
exercise
|
||||||||||||||||||||||
|
Shares
|
price
|
Shares
|
price
|
Shares
|
price
|
|||||||||||||||||||
|
Outstanding at beginning of year
|
415,020 | $ | 109.71 | 300,642 | $ | 88.11 | 378,542 | $ | 82.08 | |||||||||||||||
|
Granted
|
263,113 | 143.95 | 197,500 | 131.87 | 18,214 | 107.21 | ||||||||||||||||||
|
Exercised
|
(41,603 | ) | 77.21 | (83,122 | ) | 84.24 | (78,381 | ) | 63.97 | |||||||||||||||
|
Forfeited and canceled
|
(13,096 | ) | 128.36 | - | 0.00 | (17,733 | ) | 105.40 | ||||||||||||||||
|
Outstanding at end of year
|
623,434 | 125.96 | 415,020 | 109.71 | 300,642 | 88.11 | ||||||||||||||||||
|
Options exercisable at year end
|
250,620 | 107.12 | 219,820 | 92.31 | 265,770 | 86.28 | ||||||||||||||||||
The following table summarizes information about stock options outstanding as of December 31, 2012:
|
Options outstanding
|
Options exercisable
|
||||||||||||||||
|
Number
|
Weighted-
|
Number
|
|||||||||||||||
|
outstanding
|
average
|
Weighted-
|
exercisable
|
Weighted-
|
|||||||||||||
|
as of
|
remaining
|
average
|
as of
|
average
|
|||||||||||||
|
Range of
|
December 31,
|
contractual
|
exercise
|
December 31,
|
exercise
|
||||||||||||
|
exercise prices
|
2012
|
life
|
price
|
2012
|
price
|
||||||||||||
|
$51.01 - 79.05
|
34,973 |
3.0 years
|
$ | 69.97 | 34,973 | $ | 69.97 | ||||||||||
|
79.25 - 125.84
|
144,498 |
3.9 years
|
99.10 | 130,498 | 98.69 | ||||||||||||
|
126.73 - 155.34
|
443,963 |
7.9 years
|
139.10 | 85,149 | 135.31 | ||||||||||||
| 623,434 |
6.7 years
|
125.96 | 250,620 | 107.12 | |||||||||||||
During 2012, 2011, and 2010 the Company issued 1,614, 1,540, and 14,415 shares of restricted stock, respectively. The unrecognized compensation cost granted under the restricted stock program of $1.9 million as of December 31, 2012 will be recognized straight-line over a period of 1 to 7 years.
ESSEX PROPERTY TRUST, INC. AND SUBSIDIARIES
NOTES TO CONSOLIDATED FINANCIAL STATEMENTS
December 31, 2012, 2011, and 2010
The following table summarizes information about restricted stock outstanding as of December 31, 2012, 2011 and 2010 and changes during the years ended:
|
2012
|
2011
|
2010
|
||||||||||||||||||||||
|
Weighted-
|
Weighted-
|
Weighted-
|
||||||||||||||||||||||
|
average
|
average
|
average
|
||||||||||||||||||||||
|
grant
|
grant
|
grant
|
||||||||||||||||||||||
|
Shares
|
price
|
Shares
|
price
|
Shares
|
price
|
|||||||||||||||||||
|
Unvested at beginning of year
|
35,219 | $ | 98.57 | 44,877 | $ | 102.46 | 37,727 | $ | 99.43 | |||||||||||||||
|
Granted
|
1,614 | 149.68 | 1,540 | 134.44 | 14,415 | 109.62 | ||||||||||||||||||
|
Vested
|
(8,641 | ) | 106.69 | (9,532 | ) | 104.91 | (6,126 | ) | 102.27 | |||||||||||||||
|
Forfeited and canceled
|
(3,270 | ) | 102.00 | (1,666 | ) | 94.35 | (1,139 | ) | 93.92 | |||||||||||||||
|
Unvested at end of year
|
24,922 | 104.52 | 35,219 | 98.57 | 44,877 | 102.46 | ||||||||||||||||||
Long Term Incentive Plan – Z Units
The Company has adopted an incentive program involving the issuance of Series Z Incentive Units and Series Z-1 Incentive Units (collectively referred to as “Z Units”) of limited partnership interest in the Operating Partnership.
Vesting in the Z Units is based on performance criteria established in the plan. The criteria can be revised at the beginning of the year by the Board's Compensation Committee if the Committee deems that the plan's criterion is unachievable for any given year. The sale of Z Units is contractually prohibited. Z Units are convertible into Operating Partnership units which are exchangeable for shares of the Company’s common stock that have marketability restrictions. The estimated fair value of a Z Unit is determined on the grant date and considers the company's current stock price, the dividends that are not paid on unvested units and a marketability discount for the 8 to 15 years of illiquidity. Compensation expense is calculated by multiplying estimated vesting increases for the period by the estimated fair value as of the grant date less its $1.00 per unit purchase price.
Stock-based compensation expense for Z Units under the fair value method totaled approximately $2.1 million, $1.5 million and $2.3 million for the years ended December 31, 2012, 2011 and 2010, respectively. Stock-based compensation capitalized for Z Units totaled approximately $0.5 million, $0.3 million, and $0.6 million, for the years ended December 31, 2012, 2011, and 2010, respectively. The intrinsic value of the unvested Z Units totaled $20.8 million as of December 31, 2012. Total unrecognized compensation cost related to the unvested Z Units under the Z Units plans totaled $7.3 million as of December 31, 2012. The unamortized cost is recognized up to 14 years subject to the achievement of the stated performance criteria.
The issuance of Z Units is administered by the Compensation Committee which has the authority to select participants and determine the awards to be made up to a maximum of 600,000 Z Units. Effective January 1 of each year for each participating executive who remains employed by the Company if the Company has met a specified “funds from operations” per share target, or such other target as the Compensation Committee deems appropriate, for the prior year, up to a maximum conversion ratchet of 100%. Z units issued in 2011 and 2010 are discussed below.
During 2010, the Operating Partnership issued 108,000 Series Z-1 Incentive Units (the “2010 Z-1 Units”) of limited partner interest to twenty executives of the Company. The conversion ratchet (accounted for as vesting) of the 2010 Z-1 Units into common units, increased to 20 percent effective January 1, 2011 because the Company achieved the FFO minimum target of $4.75 per diluted share in 2010. Once the units are vested, Z-1 Unit holders receive quarterly distributions of approximately the dividend rate paid on common shares. Each year thereafter, vesting of the 2010 Z-1 Units will be consistent with the Company’s annual FFO growth, but is not to be less than zero or greater than 14 percent.
During 2011, the Operating Partnership issued 46,500 Series Z-1 Incentive Units (the “2011 Z-1 Units”) of limited partner interest to fourteen executives of the Company in exchange for cash from eight executive officers of the Company, and a capital commitment from the remaining six executives of $1.00 per 2011 Z-1 Unit. The 2011 Z-1 Units are convertible one-for-one into common units of the Operating Partnership (which, in turn, are convertible into common stock of the Company) upon the earlier to occur of 100 percent vesting of the units or the year 2026. The conversion ratchet (accounted for as vesting) of the 2011 Z-1 Units into common units, increased to 10 percent effective January 1, 2012 because the Company achieved the FFO minimum target of $5.65 per diluted share in 2011. Each year thereafter, vesting of the 2011 Z-1 Units will be consistent with the Company’s annual FFO growth, but is not to be less than zero or greater than 14 percent. The 2011 Z-1 Unit holders are entitled to receive approximately the same as dividends distributed to common stockholders on vested units.
ESSEX PROPERTY TRUST, INC. AND SUBSIDIARIES
NOTES TO CONSOLIDATED FINANCIAL STATEMENTS
December 31, 2012, 2011, and 2010
The following table summarizes information about the Z Units outstanding as of December 31, 2012 ($ in thousands):
|
Long Term Incentive Plan - Z Units
|
||||||||||||||||||||||
|
Aggregate
|
Weighted-
|
|||||||||||||||||||||
|
Intrinsic
|
Weighted-
|
average
|
||||||||||||||||||||
|
Total
|
Total
|
Value
|
Total
|
average
|
Remaining
|
|||||||||||||||||
|
Vested
|
Unvested
|
of Unvested
|
Outstanding
|
Grant-date
|
Contractual
|
|||||||||||||||||
|
Units
|
Units
|
Units
|
Units
|
Fair Value
|
Life
|
|||||||||||||||||
|
Balance, December 2009
|
288,651 | 105,881 | $ | 8,751 | 394,532 | $ | 39.36 |
8.2 years
|
||||||||||||||
|
Granted
|
- | 108,000 | 108,000 | |||||||||||||||||||
|
Vested
|
37,629 | (37,629 | ) | - | ||||||||||||||||||
|
Cancelled
|
(4,350 | ) | (4,350 | ) | ||||||||||||||||||
|
Balance, December 2010
|
326,280 | 171,902 | 19,463 | 498,182 | 54.15 |
11.2 years
|
||||||||||||||||
|
Granted
|
- | 46,500 | 46,500 | |||||||||||||||||||
|
Vested
|
44,520 | (44,520 | ) | - | ||||||||||||||||||
|
Converted
|
(191,718 | ) | - | (191,718 | ) | |||||||||||||||||
|
Cancelled
|
- | (3,863 | ) | (3,863 | ) | |||||||||||||||||
|
Balance, December 2011
|
179,082 | 170,019 | 23,719 | 349,101 | 58.17 |
12.3 years
|
||||||||||||||||
|
Granted
|
- | - | - | |||||||||||||||||||
|
Vested
|
28,163 | (28,163 | ) | - | ||||||||||||||||||
|
Converted
|
(16,541 | ) | - | (16,541 | ) | |||||||||||||||||
|
Cancelled
|
- | (1,813 | ) | (1,813 | ) | |||||||||||||||||
|
Balance, December 2012
|
190,704 | 140,043 | $ | 20,800 | 330,747 | $ | 58.44 |
11.3 years
|
||||||||||||||
ESSEX PROPERTY TRUST, INC. AND SUBSIDIARIES
NOTES TO CONSOLIDATED FINANCIAL STATEMENTS
December 31, 2012, 2011, and 2010
(14) Segment Information
The Company defines its reportable operating segments as the three geographical regions in which its communities are located: Southern California, Northern California and Seattle Metro. Excluded from segment revenues are communities classified in discontinued operations, management and other fees from affiliates, and interest and other income. Non-segment revenues and net operating income included in the following schedule also consist of revenue generated from commercial properties. Other non-segment assets include real estate under development, co-investments, cash and cash equivalents, marketable securities, notes and other receivables, prepaid expenses and other assets and deferred charges.
The revenues and net operating income for each of the reportable operating segments are summarized as follows for the years ended December 31, 2012, 2011, and 2010 ($ in thousands):
|
Years Ended December 31,
|
||||||||||||
|
2012
|
2011
|
2010
|
||||||||||
|
Revenues:
|
||||||||||||
|
Southern California
|
$ | 249,524 | $ | 223,304 | $ | 200,541 | ||||||
|
Northern California
|
175,325 | 149,457 | 127,302 | |||||||||
|
Seattle Metro
|
94,708 | 81,967 | 70,348 | |||||||||
|
Other real estate assets
|
12,379 | 10,985 | 7,537 | |||||||||
|
Total property revenues
|
$ | 531,936 | $ | 465,713 | $ | 405,728 | ||||||
|
Net operating income:
|
||||||||||||
|
Southern California
|
$ | 166,162 | $ | 146,519 | $ | 132,150 | ||||||
|
Northern California
|
120,540 | 99,047 | 82,288 | |||||||||
|
Seattle Metro
|
62,076 | 52,173 | 43,006 | |||||||||
|
Other real estate assets
|
9,070 | 8,740 | 5,120 | |||||||||
|
Total net operating income
|
357,848 | 306,479 | 262,564 | |||||||||
|
Depreciation
|
(170,592 | ) | (151,428 | ) | (128,221 | ) | ||||||
|
Interest expense before amortization
|
(100,244 | ) | (91,694 | ) | (82,756 | ) | ||||||
|
Amortization expense
|
(11,644 | ) | (11,474 | ) | (4,828 | ) | ||||||
|
Management and other fees from affiliates
|
11,489 | 6,780 | 4,551 | |||||||||
|
General and administrative
|
(23,307 | ) | (20,694 | ) | (23,255 | ) | ||||||
|
Cost of management and other fees
|
(6,513 | ) | (4,610 | ) | (2,707 | ) | ||||||
|
Impairment and other charges
|
- | - | (2,302 | ) | ||||||||
|
Interest and other income
|
13,833 | 17,139 | 27,841 | |||||||||
|
Loss on early retirement of debt
|
(5,009 | ) | (1,163 | ) | (10 | ) | ||||||
|
Equity income (loss) income from co-investments
|
41,745 | (467 | ) | (1,715 | ) | |||||||
|
Gain on remeasurement of co-investment
|
21,947 | - | - | |||||||||
|
Income before discontinued operations
|
$ | 129,553 | $ | 48,868 | $ | 49,162 | ||||||
ESSEX PROPERTY TRUST, INC. AND SUBSIDIARIES
NOTES TO CONSOLIDATED FINANCIAL STATEMENTS
December 31, 2012, 2011, and 2010
Total assets for each of the reportable operating segments are summarized as follows as of December 31, 2012 and 2011 ($ in thousands):
|
As of December 31,
|
||||||||
|
Assets:
|
2012
|
2011
|
||||||
|
Southern California
|
$ | 1,675,265 | $ | 1,478,018 | ||||
|
Northern California
|
1,489,095 | 1,241,320 | ||||||
|
Seattle Metro
|
699,465 | 579,612 | ||||||
|
Other real estate assets
|
88,330 | 94,088 | ||||||
|
Net reportable operating segments - real estate assets
|
3,952,155 | 3,393,038 | ||||||
|
Real estate under development
|
66,851 | 44,280 | ||||||
|
Co-investments
|
571,345 | 383,412 | ||||||
|
Cash and cash equivalents, including restricted cash
|
42,126 | 35,463 | ||||||
|
Marketable securities
|
92,713 | 74,275 | ||||||
|
Notes and other receivables
|
66,163 | 66,369 | ||||||
|
Other non-segment assets
|
55,870 | 40,127 | ||||||
|
Total assets
|
$ | 4,847,223 | $ | 4,036,964 | ||||
(15) 401(k) Plan
The Company has a 401(k) benefit plan (the “Plan”) for all full-time employees who have completed six months of service. Employee contributions are limited by the maximum allowed under Section 401(k) of the Internal Revenue Code. The Company matches the employee contributions for non-highly compensated personnel, up to 50% of their contribution up to a specified maximum. Company contributions to the Plan were approximately $0.2 million, $0.3 million, and $0.3 million for the years ended December 31, 2012, 2011, and 2010, respectively.
(16) Commitments and Contingencies
As of December 31, 2012, the Company had six non-cancelable land leases for certain apartment communities and buildings that expire between 2027 and 2080. Land lease payments are typically the greater of a stated minimum or a percentage of gross rents generated by these apartment communities. Total minimum lease commitments, under land leases and operating leases, are approximately $1.7 million per year for the next five years.
To the extent that an environmental matter arises or is identified in the future that has other than a remote risk of having a material impact on the financial statements, the Company will disclose the estimated range of possible outcomes, and, if an outcome is probable, accrue an appropriate liability for remediation and other potential liability. The Company will consider whether such occurrence results in an impairment of value on the affected property and, if so, impairment will be recognized.
Except with respect to three communities, the Company has no indemnification agreements from third parties for potential environmental clean-up costs at its communities. The Company has no way of determining at this time the magnitude of any potential liability to which it may be subject arising out of unknown environmental conditions or violations with respect to the communities formerly owned by the Company. No assurance can be given that existing environmental studies with respect to any of the communities reveal all environmental liabilities, that any prior owner or operator of a Property did not create any material environmental condition not known to the Company, or that a material environmental condition does not otherwise exist as to any one or more of the communities. The Company has limited insurance coverage for the types of environmental liabilities described above.
The Company has entered into transactions that may require the Company to pay the tax liabilities of the partners in the Operating Partnership or in the DownREIT entities. These transactions are within the Company’s control. Although the Company plans to hold the contributed assets or defer recognition of gain on their sale pursuant to like-kind exchange rules under Section 1031 of the Internal Revenue Code the Company can provide no assurance that it will be able to do so and if such tax liabilities were incurred they may to have a material impact on the Company’s financial position.
ESSEX PROPERTY TRUST, INC. AND SUBSIDIARIES
NOTES TO CONSOLIDATED FINANCIAL STATEMENTS
December 31, 2012, 2011, and 2010
There have been an increasing number of lawsuits against owners and managers of apartment communities alleging personal injury and property damage caused by the presence of mold in residential real estate. Some of these lawsuits have resulted in substantial monetary judgments or settlements. The Company has been sued for mold related matters and has settled some, but not all, of such matters. Insurance carriers have reacted to mold related liability awards by excluding mold related claims from standard policies and pricing mold endorsements at prohibitively high rates. The Company has, however, purchased pollution liability insurance, which includes some coverage for mold. The Company has adopted policies to promptly address and resolve reports of mold when it is detected, and to minimize any impact mold might have on residents of the property. The Company believes its mold policies and proactive response to address any known existence, reduces its risk of loss from these cases. There can be no assurances that the Company has identified and responded to all mold occurrences, but the company promptly addresses all known reports of mold. Liabilities resulting from such mold related matters are not expected to have a material adverse effect on the Company’s financial condition, results of operations or cash flows. As of December 31, 2012, potential liabilities for mold and other environmental liabilities are not quantifiable and an estimate of possible loss cannot be made.
The Company carries comprehensive liability, fire, extended coverage and rental loss insurance for each of the communities. Under comprehensive liability claims, the Company has insurance to cover claims in excess of $100,000 per incident. Under property casualty claims, the Company reinsures the primary carrier for losses up to $5.0 million deductible per incident. There are, however, certain types of extraordinary losses, such as, for example, losses from terrorism and earthquake, for which the Company does not have insurance. Substantially all of the communities are located in areas that are subject to earthquakes.
The Company provided a loan and construction completion guarantee to the lender in order to fulfill the lender’s standard financing requirements related to the construction of the Expo community. The outstanding balance for the construction loan is included in the debt line item in the balance sheet of the co-investments included in Note 3. The construction completion guarantee is for the life of the loan, which is scheduled to mature on July 1, 2014, with two, one-year extension options at the Expo joint venture’s option. As of December 31, 2012, the Company was in compliance with all terms of the construction loan and the construction of the community is expected to be completed on time and within budget. The maximum exposure of the guarantee as of December 31, 2012 was $70.0 million based on the construction costs that were budgeted to be incurred to complete the construction.
The Company provided a payment guarantee to the counterparties in relation to the total return swaps entered into by the joint venture responsible for the development of The Huxley (formerly Fountain at La Brea) and The Dylan (formerly Santa Monica at La Brea) communities. Further the Company has guaranteed completion of development and made certain debt service guarantees for The Huxley and The Dylan. The outstanding balance for the loans is included in the debt line item in the balance sheet of the co-investments included in Note 3. The payment guarantee is for the payment of the amounts due to the counterparty related total return swaps which are scheduled to mature in September and December 2016. The maximum exposure of the guarantee as of December 31, 2012 was $55.7 million based on the aggregate outstanding debt amount.
The Company is subject to various other lawsuits in the normal course of its business operations. Such lawsuits are not expected to have a material adverse effect on the Company’s financial condition, results of operations or cash flows.
(17) Subsequent Events
In January 2013, the Company sold the land parcel held for future development located in Palo Alto, California for $9.1 million, resulting in a gain of $1.5 million.
In January 2013, the Company acquired Annaliese, a 56 unit community located in Seattle, Washington for $19.0 million. The property was built in 2009 and located in the South Lake Union submarket.
In January 2013, the Company sold $20.3 million of a common stock investment for a gain of $1.8 million.
In February 2013, the Company acquired Fox Plaza, a 444 unit property located in San Francisco, California for $135.0 million. The 29 story high rise tower was built in 1968, and the Fox Plaza apartments are located on floors 14 through 29. The purchase did not include the 12 floors of commercial office space but did include an adjacent two story building comprised of 37,800 square feet of space leased to retail and office tenants and a two story underground parking garage comprised of 405 stalls.
ESSEX PROPERTY TRUST, INC. AND SUBSIDIARIES
NOTES TO CONSOLIDATED FINANCIAL STATEMENTS
December 31, 2012, 2011, and 2010
(18) Quarterly Results of Operations (Unaudited)
The following is a summary of quarterly results of operations for 2012 and 2011 (
$ in thousands, except per share and dividend amounts
):
|
Quarter ended
|
Quarter ended
|
Quarter ended
|
Quarter ended
|
|||||||||||||
|
December 31
|
September 30
|
June 30
|
March 31
|
|||||||||||||
|
2012:
|
||||||||||||||||
|
Total property revenues
|
$ | 141,628 | $ | 135,070 | $ | 129,764 | $ | 125,474 | ||||||||
|
Income before discontinued operations
|
$ | 49,640 | $ | 20,221 | $ | 42,490 | $ | 17,202 | ||||||||
|
Net income
|
$ | 49,640 | $ | 20,221 | $ | 42,490 | $ | 27,239 | ||||||||
|
Net income available to common stockholders
|
$ | 43,793 | $ | 16,219 | $ | 37,078 | $ | 22,722 | ||||||||
|
Per share data:
|
||||||||||||||||
|
Net income:
|
||||||||||||||||
|
Basic
|
$ | 1.22 | $ | 0.46 | $ | 1.07 | $ | 0.67 | ||||||||
|
Diluted
|
$ | 1.22 | $ | 0.45 | $ | 1.07 | $ | 0.67 | ||||||||
|
Market price:
|
||||||||||||||||
|
High
|
$ | 150.71 | $ | 160.64 | $ | 161.53 | $ | 151.54 | ||||||||
|
Low
|
$ | 136.38 | $ | 147.38 | $ | 146.05 | $ | 136.43 | ||||||||
|
Close
|
$ | 146.65 | $ | 148.24 | $ | 153.92 | $ | 151.51 | ||||||||
|
Dividends declared
|
$ | 1.10 | $ | 1.10 | $ | 1.10 | $ | 1.10 | ||||||||
|
2011:
|
||||||||||||||||
|
Total property revenues
|
$ | 122,373 | $ | 117,226 | $ | 114,906 | $ | 111,208 | ||||||||
|
Income before discontinued operations
|
$ | 14,493 | $ | 11,767 | $ | 10,502 | $ | 12,106 | ||||||||
|
Net income
|
$ | 17,868 | $ | 11,085 | $ | 16,052 | $ | 12,511 | ||||||||
|
Net income available to common stockholders
|
$ | 13,937 | $ | 7,687 | $ | 10,326 | $ | 8,418 | ||||||||
|
Per share data:
|
||||||||||||||||
|
Net income:
|
||||||||||||||||
|
Basic
|
$ | 0.42 | $ | 0.23 | $ | 0.32 | $ | 0.27 | ||||||||
|
Diluted
|
$ | 0.42 | $ | 0.23 | $ | 0.32 | $ | 0.27 | ||||||||
|
Market price:
|
||||||||||||||||
|
High
|
$ | 148.44 | $ | 145.40 | $ | 138.31 | $ | 124.41 | ||||||||
|
Low
|
$ | 111.25 | $ | 119.15 | $ | 122.67 | $ | 109.98 | ||||||||
|
Close
|
$ | 140.51 | $ | 120.04 | $ | 135.29 | $ | 124.00 | ||||||||
|
Dividends declared
|
$ | 1.04 | $ | 1.04 | $ | 1.04 | $ | 1.04 | ||||||||
ESSEX PROPERTY TRUST, INC. AND SUBSIDIARIES
NOTES TO CONSOLIDATED FINANCIAL STATEMENTS
December 31, 2012, 2011, and 2010
|
Costs
|
||||||||||||||||||||||||||
|
Initial cost
|
capitalized
|
Gross amount carried at close of period
|
||||||||||||||||||||||||
|
Buildings and
|
subsequent to
|
Land and
|
Buildings and
|
Accumulated
|
Date of
|
Date
|
Lives
|
|||||||||||||||||||
|
Property
|
Units
|
Location
|
Encumbrance
|
Land
|
improvements
|
acquisition
|
improvements
|
improvements
|
Total
(1)
|
depreciation
|
construction
|
acquired
|
(years)
|
|||||||||||||
|
Encumbered communities
|
||||||||||||||||||||||||||
|
Anchor Village(The Elliot at Mukilteo)
|
301
|
Mukilteo, WA
|
10,750
|
2,498
|
10,595
|
11,861
|
2,824
|
22,130
|
24,954
|
(9,585)
|
1981
|
01/97
|
3-30
|
|||||||||||||
|
Avondale at Warner Center
|
446
|
Woodland Hills, CA
|
46,761
|
10,536
|
24,522
|
14,571
|
10,601
|
39,028
|
49,629
|
(19,625)
|
1970
|
01/97
|
3-30
|
|||||||||||||
|
Bridgeport
|
184
|
Newark, CA
|
21,724
|
1,608
|
7,582
|
6,107
|
1,525
|
13,772
|
15,297
|
(9,783)
|
1987
|
07/87
|
3-30
|
|||||||||||||
|
Barkley, The
(2)
|
161
|
Anaheim, CA
|
16,784
|
-
|
8,520
|
4,533
|
2,353
|
10,700
|
13,053
|
(4,485)
|
1984
|
04/00
|
3-30
|
|||||||||||||
|
Bel Air
|
462
|
San Ramon, CA
|
55,835
|
12,105
|
18,252
|
22,959
|
12,682
|
40,634
|
53,316
|
(18,970)
|
1988
|
01/97
|
3-30
|
|||||||||||||
|
Belmont Station
|
275
|
Los Angeles, CA
|
30,045
|
8,100
|
66,666
|
2,765
|
8,267
|
69,264
|
77,531
|
(13,106)
|
2008
|
12/08
|
3-30
|
|||||||||||||
|
Bella Villagio
|
231
|
San Jose, CA
|
38,088
|
17,247
|
40,343
|
1,515
|
17,247
|
41,858
|
59,105
|
(3,304)
|
2004
|
09/10
|
3-30
|
|||||||||||||
|
Brentwood
|
140
|
Santa Ana, CA
|
19,283
|
2,833
|
11,303
|
5,482
|
3,502
|
16,116
|
19,618
|
(5,786)
|
1970
|
11/01
|
3-30
|
|||||||||||||
|
Brighton Ridge
|
264
|
Renton, WA
|
14,644
|
2,623
|
10,800
|
2,779
|
2,656
|
13,546
|
16,202
|
(7,375)
|
1986
|
12/96
|
3-30
|
|||||||||||||
|
Brookside Oaks
|
170
|
Sunnyvale, CA
|
19,974
|
7,301
|
16,310
|
19,923
|
10,328
|
33,206
|
43,534
|
(11,170)
|
1973
|
06/00
|
3-30
|
|||||||||||||
|
Camarillo Oaks
|
564
|
Camarillo, CA
|
47,350
|
10,953
|
25,254
|
2,634
|
11,075
|
27,766
|
38,841
|
(15,403)
|
1985
|
07/96
|
3-30
|
|||||||||||||
|
Camino Ruiz Square
|
160
|
Camarillo, CA
|
21,110
|
6,871
|
26,119
|
831
|
6,931
|
26,890
|
33,821
|
(5,525)
|
1990
|
12/06
|
3-30
|
|||||||||||||
|
Canyon Oaks
|
250
|
San Ramon, CA
|
28,989
|
19,088
|
44,473
|
1,338
|
19,088
|
45,811
|
64,899
|
(8,857)
|
2005
|
05/07
|
3-30
|
|||||||||||||
|
Canyon Pointe
|
250
|
Bothell, WA
|
14,391
|
4,692
|
18,288
|
3,507
|
4,693
|
21,794
|
26,487
|
(7,095)
|
1990
|
10/03
|
3-30
|
|||||||||||||
|
Carlyle, The
|
132
|
San Jose, CA
|
18,613
|
3,954
|
15,277
|
9,847
|
5,801
|
23,277
|
29,078
|
(9,265)
|
2000
|
04/00
|
3-30
|
|||||||||||||
|
City View
|
572
|
Hayward, CA
|
63,159
|
9,883
|
37,670
|
20,699
|
10,350
|
57,902
|
68,252
|
(29,059)
|
1975
|
03/98
|
3-30
|
|||||||||||||
|
Coldwater Canyon
|
39
|
Studio City, CA
|
5,538
|
1,674
|
6,640
|
1,178
|
1,676
|
7,816
|
9,492
|
(1,972)
|
1979
|
05/07
|
3-30
|
|||||||||||||
|
Courtyard off Main
|
109
|
Bellevue, WA
|
16,261
|
7,465
|
21,405
|
2,627
|
7,465
|
24,032
|
31,497
|
(1,806)
|
2000
|
10/10
|
3-30
|
|||||||||||||
|
Domaine
|
92
|
Seattle, WA
|
16,866
|
9,059
|
27,177
|
167
|
9,059
|
27,344
|
36,403
|
(266)
|
2009
|
09/12
|
3-30
|
|||||||||||||
|
Elevation
|
157
|
Redmond, WA
|
11,839
|
4,758
|
14,285
|
4,666
|
4,757
|
18,951
|
23,708
|
(2,019)
|
1986
|
06/10
|
3-30
|
|||||||||||||
|
Esplanade
|
278
|
San Jose, CA
|
44,928
|
18,170
|
40,086
|
5,765
|
18,429
|
45,592
|
64,021
|
(13,226)
|
2002
|
11/04
|
3-30
|
|||||||||||||
|
Fairhaven(Treehouse)
|
164
|
Santa Ana, CA
|
17,269
|
2,626
|
10,485
|
4,806
|
2,957
|
14,960
|
17,917
|
(5,128)
|
1970
|
11/01
|
3-30
|
|||||||||||||
|
Fairwood Pond
|
194
|
Renton, WA
|
13,307
|
5,296
|
15,564
|
2,054
|
5,297
|
17,617
|
22,914
|
(5,257)
|
1997
|
10/04
|
3-30
|
|||||||||||||
|
Fountain Park
|
705
|
Playa Vista, CA
|
97,450
|
25,073
|
94,980
|
21,849
|
25,203
|
116,699
|
141,902
|
(36,486)
|
2002
|
02/04
|
3-30
|
|||||||||||||
|
Harvest Park
|
104
|
Santa Rosa, CA
|
10,691
|
6,700
|
15,479
|
888
|
6,690
|
16,377
|
23,067
|
(3,401)
|
2004
|
03/07
|
3-30
|
|||||||||||||
|
Hampton Place /Hampton Court
|
215
|
Glendale, CA
|
21,296
|
6,695
|
16,753
|
5,266
|
6,733
|
21,981
|
28,714
|
(9,914)
|
1970
|
06/99
|
3-30
|
|||||||||||||
|
Hidden Valley
|
324
|
Simi Valley, CA
|
30,603
|
14,174
|
34,065
|
1,404
|
9,725
|
39,918
|
49,643
|
(11,368)
|
2004
|
12/04
|
3-30
|
|||||||||||||
|
Highridge
|
255
|
Rancho Palos Verdes, CA
|
44,807
|
5,419
|
18,347
|
23,194
|
6,073
|
40,887
|
46,960
|
(17,025)
|
1972
|
05/97
|
3-30
|
|||||||||||||
|
Highlands at Wynhaven
|
333
|
Issaquah, WA
|
33,343
|
16,271
|
48,932
|
4,331
|
16,271
|
53,263
|
69,534
|
(8,371)
|
2000
|
08/08
|
3-30
|
|||||||||||||
|
Hillcrest Park
|
608
|
Newbury Park, CA
|
69,555
|
15,318
|
40,601
|
14,623
|
15,755
|
54,787
|
70,542
|
(25,168)
|
1973
|
03/98
|
3-30
|
|||||||||||||
|
Hillsborough Park
|
235
|
La Habra, CA
|
37,909
|
6,291
|
15,455
|
1,414
|
6,272
|
16,888
|
23,160
|
(7,487)
|
1999
|
09/99
|
3-30
|
|||||||||||||
|
Huntington, The
|
276
|
Huntington Beach, CA
|
34,121
|
10,374
|
41,495
|
646
|
10,374
|
42,141
|
52,515
|
(757)
|
1975
|
06/12
|
3-30
|
|||||||||||||
|
Huntington Breakers
|
342
|
Huntington Beach, CA
|
38,734
|
9,306
|
22,720
|
5,399
|
9,315
|
28,110
|
37,425
|
(13,781)
|
1984
|
10/97
|
3-30
|
|||||||||||||
|
Inglenook Court
|
224
|
Bothell, WA
|
8,300
|
3,467
|
7,881
|
5,494
|
3,474
|
13,368
|
16,842
|
(8,091)
|
1985
|
10/94
|
3-30
|
|||||||||||||
|
Magnolia Square
|
156
|
Sunnyvale, CA
|
18,314
|
8,190
|
24,736
|
5,097
|
8,191
|
29,832
|
38,023
|
(5,069)
|
1969
|
09/07
|
3-30
|
|||||||||||||
|
Marbrisa
|
202
|
Long Beach, CA
|
18,959
|
4,700
|
18,605
|
3,082
|
4,760
|
21,627
|
26,387
|
(7,385)
|
1987
|
09/02
|
3-30
|
|||||||||||||
|
Mirabella
|
188
|
Marina Del Rey, CA
|
46,338
|
6,180
|
26,673
|
12,934
|
6,270
|
39,517
|
45,787
|
(14,326)
|
2000
|
05/00
|
3-30
|
|||||||||||||
|
Mill Creek at Windermere
|
400
|
San Ramon, CA
|
50,027
|
29,551
|
69,032
|
1,594
|
29,551
|
70,626
|
100,177
|
(12,721)
|
2005
|
09/07
|
3-30
|
|||||||||||||
|
Montclaire, The
|
390
|
Sunnyvale, CA
|
47,283
|
4,842
|
19,776
|
19,907
|
4,997
|
39,528
|
44,525
|
(27,380)
|
1973
|
12/88
|
3-30
|
|||||||||||||
|
Montebello
|
248
|
Kirkland, WA
|
30,158
|
13,857
|
41,575
|
3,810
|
13,858
|
45,384
|
59,242
|
(684)
|
1996
|
07/12
|
3-30
|
|||||||||||||
|
Montejo
|
124
|
Garden Grove, CA
|
13,307
|
1,925
|
7,685
|
2,264
|
2,194
|
9,680
|
11,874
|
(3,760)
|
1974
|
11/01
|
3-30
|
|||||||||||||
|
Park Hill at Issaquah
|
245
|
Issaquah, CA
|
29,477
|
7,284
|
21,937
|
1,905
|
7,284
|
23,842
|
31,126
|
(6,882)
|
1999
|
02/99
|
3-30
|
|||||||||||||
|
Palisades, The
|
192
|
Bellevue, WA
|
21,277
|
1,560
|
6,242
|
10,331
|
1,565
|
16,568
|
18,133
|
(10,156)
|
1977
|
05/90
|
3-30
|
|||||||||||||
|
Pathways
|
296
|
Long Beach, CA
|
38,219
|
4,083
|
16,757
|
18,076
|
6,239
|
32,677
|
38,916
|
(20,789)
|
1975
|
02/91
|
3-30
|
|||||||||||||
|
Stevenson Place
|
200
|
Fremont, CA
|
22,034
|
996
|
5,582
|
6,974
|
1,001
|
12,551
|
13,552
|
(8,698)
|
1971
|
04/83
|
3-30
|
|||||||||||||
(Continued)
ESSEX PROPERTY TRUST, INC. AND SUBSIDIARIES
NOTES TO CONSOLIDATED FINANCIAL STATEMENTS
December 31, 2012, 2011, and 2010
|
Costs
|
||||||||||||||||||||||||||
|
Initial cost
|
capitalized
|
Gross amount carried at close of period
|
||||||||||||||||||||||||
|
Buildings and
|
subsequent to
|
Land and
|
Buildings and
|
Accumulated
|
Date of
|
Date
|
Lives
|
|||||||||||||||||||
|
Property
|
Units
|
Location
|
Encumbrance
|
Land
|
improvements
|
acquisition
|
improvements
|
improvements
|
Total
(1)
|
depreciation
|
construction
|
acquired
|
(years)
|
|||||||||||||
|
Encumbered communities (continued)
|
||||||||||||||||||||||||||
|
Stonehedge Village
|
196
|
Bothell, WA
|
12,657
|
3,167
|
12,603
|
4,531
|
3,201
|
17,100
|
20,301
|
(8,471)
|
1986
|
10/97
|
3-30
|
|||||||||||||
|
Summerhill Park
|
100
|
Sunnyvale, CA
|
13,769
|
2,654
|
4,918
|
1,069
|
2,656
|
5,985
|
8,641
|
(4,530)
|
1988
|
09/88
|
3-30
|
|||||||||||||
|
The Bernard
|
63
|
Seattle, CA
|
10,064
|
3,699
|
11,345
|
43
|
3,689
|
11,398
|
15,087
|
(490)
|
2008
|
09/11
|
3-30
|
|||||||||||||
|
Tierra Vista
|
404
|
Oxnard, CA
|
57,444
|
13,652
|
53,336
|
3,030
|
13,661
|
56,357
|
70,018
|
(16,376)
|
2001
|
01/01
|
3-30
|
|||||||||||||
|
Valley Park
|
160
|
Fountain Valley, CA
|
22,592
|
3,361
|
13,420
|
3,210
|
3,761
|
16,230
|
19,991
|
(6,161)
|
1969
|
11/01
|
3-30
|
|||||||||||||
|
Villa Angelina
|
256
|
Placentia, CA
|
27,542
|
4,498
|
17,962
|
4,726
|
4,962
|
22,224
|
27,186
|
(7,778)
|
1970
|
11/01
|
3-30
|
|||||||||||||
|
Vista Belvedere
|
76
|
Tiburon, CA
|
10,272
|
5,573
|
11,901
|
4,180
|
5,573
|
16,081
|
21,654
|
(5,201)
|
1963
|
08/04
|
3-30
|
|||||||||||||
|
Wandering Creek
|
156
|
Kent, WA
|
5,300
|
1,285
|
4,980
|
3,366
|
1,296
|
8,335
|
9,631
|
(4,945)
|
1986
|
11/95
|
3-30
|
|||||||||||||
|
Waterford, The
|
238
|
San Jose, CA
|
31,975
|
11,808
|
24,500
|
12,418
|
15,165
|
33,561
|
48,726
|
(13,735)
|
2000
|
06/00
|
3-30
|
|||||||||||||
|
Wilshire Promenade
|
149
|
Fullerton, CA
|
18,276
|
3,118
|
7,385
|
6,683
|
3,797
|
13,389
|
17,186
|
(6,013)
|
1992
|
01/97
|
3-30
|
|||||||||||||
|
1,565,599
|
424,411
|
1,295,274
|
366,352
|
439,119
|
1,646,917
|
2,086,036
|
(541,466)
|
|||||||||||||||||||
|
Unencumbered communities
|
||||||||||||||||||||||||||
|
Allegro
|
97
|
Valley Village, CA
|
5,869
|
23,977
|
949
|
5,869
|
24,926
|
30,795
|
(2,624)
|
2010
|
10/10
|
3-30
|
||||||||||||||
|
Alpine Village
|
301
|
Alpine, CA
|
4,967
|
19,728
|
3,690
|
4,982
|
23,403
|
28,385
|
(8,158)
|
1971
|
12/02
|
3-30
|
||||||||||||||
|
Anavia
|
250
|
Anaheim, CA
|
15,925
|
63,712
|
5,469
|
15,925
|
69,181
|
85,106
|
(4,704)
|
2009
|
12/10
|
3-30
|
||||||||||||||
|
Ascent
|
90
|
Kirkland, CA
|
3,924
|
11,862
|
271
|
3,924
|
12,133
|
16,057
|
(86)
|
1988
|
10/12
|
3-30
|
||||||||||||||
|
Axis 2300
|
115
|
Irvine, CA
|
5,405
|
33,585
|
518
|
5,405
|
34,103
|
39,508
|
(3,659)
|
2010
|
08/10
|
3-30
|
||||||||||||||
|
Bellerive
|
63
|
Los Angeles, CA
|
5,401
|
21,803
|
517
|
5,401
|
22,320
|
27,721
|
(1,347)
|
2011
|
08/11
|
3-30
|
||||||||||||||
|
Belmont Terrace
|
71
|
Belmont, CA
|
4,446
|
10,290
|
2,250
|
4,473
|
12,513
|
16,986
|
(3,635)
|
1974
|
10/06
|
3-30
|
||||||||||||||
|
Bennett Lofts
|
113
|
San Francisco, CA
|
21,771
|
50,800
|
80
|
21,771
|
50,880
|
72,651
|
(212)
|
2004
|
12/12
|
3-30
|
||||||||||||||
|
Bonita Cedars
|
120
|
Bonita, CA
|
2,496
|
9,913
|
1,584
|
2,503
|
11,490
|
13,993
|
(4,124)
|
1983
|
12/02
|
3-30
|
||||||||||||||
|
Boulevard
|
172
|
Fremont, CA
|
3,520
|
8,182
|
10,469
|
3,580
|
18,591
|
22,171
|
(9,989)
|
1978
|
01/96
|
3-30
|
||||||||||||||
|
Bridle Trails
|
108
|
Kirkland, WA
|
1,500
|
5,930
|
5,304
|
1,531
|
11,203
|
12,734
|
(5,243)
|
1986
|
10/97
|
3-30
|
||||||||||||||
|
Bristol Commons
|
188
|
Sunnyvale, CA
|
5,278
|
11,853
|
2,033
|
5,293
|
13,871
|
19,164
|
(7,384)
|
1989
|
01/97
|
3-30
|
||||||||||||||
|
416 on Broadway
|
115
|
Glendale, CA
|
8,557
|
34,235
|
756
|
8,557
|
34,991
|
43,548
|
(2,448)
|
2009
|
12/10
|
3-30
|
||||||||||||||
|
Bunker Hill
|
456
|
Los Angeles, CA
|
11,498
|
27,871
|
7,472
|
11,639
|
35,202
|
46,841
|
(15,732)
|
1968
|
03/98
|
3-30
|
||||||||||||||
|
Cairns, The
|
100
|
Seattle, WA
|
6,937
|
20,679
|
364
|
6,939
|
21,041
|
27,980
|
(3,941)
|
2006
|
06/07
|
3-30
|
||||||||||||||
|
Cambridge
|
40
|
Chula Vista, CA
|
497
|
1,973
|
324
|
498
|
2,296
|
2,794
|
(831)
|
1965
|
12/02
|
3-30
|
||||||||||||||
|
Capri at Sunny Hills
|
100
|
Fullerton, CA
|
3,337
|
13,320
|
6,230
|
4,048
|
18,839
|
22,887
|
(6,863)
|
1961
|
09/01
|
3-30
|
||||||||||||||
|
Castle Creek
|
216
|
Newcastle, WA
|
4,149
|
16,028
|
2,097
|
4,833
|
17,441
|
22,274
|
(9,292)
|
1997
|
12/97
|
3-30
|
||||||||||||||
|
CBC Apartments
|
148
|
Goleta, CA
|
6,283
|
24,000
|
2,418
|
6,288
|
26,413
|
32,701
|
(6,800)
|
1962
|
01/06
|
3-30
|
||||||||||||||
|
CentrePointe (The Bluffs II)
|
224
|
San Diego, CA
|
3,405
|
7,743
|
14,218
|
3,442
|
21,924
|
25,366
|
(5,977)
|
1974
|
06/97
|
3-30
|
||||||||||||||
|
Cedar Terrace
|
180
|
Bellevue, WA
|
5,543
|
16,442
|
3,572
|
5,652
|
19,905
|
25,557
|
(6,150)
|
1984
|
01/05
|
3-30
|
||||||||||||||
|
Chestnut Street
|
96
|
Santa Cruz, CA
|
6,582
|
15,689
|
955
|
6,582
|
16,644
|
23,226
|
(2,602)
|
2002
|
07/08
|
3-30
|
||||||||||||||
|
Commons, The
|
264
|
Campbell, CA
|
12,555
|
29,307
|
3,566
|
12,556
|
32,872
|
45,428
|
(3,067)
|
1973
|
07/10
|
3-30
|
||||||||||||||
|
Corbella at Juanita Bay
|
169
|
Kirkland, WA
|
5,801
|
17,415
|
852
|
5,801
|
18,267
|
24,068
|
(1,373)
|
1978
|
11/10
|
3-30
|
||||||||||||||
|
Country Villas
|
180
|
Oceanside, CA
|
4,174
|
16,583
|
2,443
|
4,187
|
19,013
|
23,200
|
(6,884)
|
1976
|
12/02
|
3-30
|
||||||||||||||
|
Delano/Bon Terra
|
126
|
Redmond, WA
|
7,470
|
22,511
|
561
|
7,470
|
23,072
|
30,542
|
(773)
|
2005/2011
|
12/11
|
3-30
|
||||||||||||||
|
Devonshire
|
276
|
Hemet, CA
|
3,470
|
13,786
|
2,282
|
3,482
|
16,056
|
19,538
|
(5,780)
|
1988
|
12/02
|
3-30
|
||||||||||||||
|
Emerald Ridge - North
|
180
|
Bellevue, WA
|
3,449
|
7,801
|
2,828
|
3,449
|
10,629
|
14,078
|
(6,697)
|
1987
|
11/94
|
3-30
|
||||||||||||||
|
Essex Skyline at MacAuthur Place
|
349
|
Santa Ana, CA
|
21,537
|
146,099
|
463
|
21,537
|
146,562
|
168,099
|
(3,536)
|
2008
|
04/12
|
3-30
|
||||||||||||||
|
Evergreen Heights
|
200
|
Kirkland, WA
|
3,566
|
13,395
|
3,346
|
3,649
|
16,658
|
20,307
|
(8,384)
|
1990
|
06/97
|
3-30
|
||||||||||||||
|
Fairways
(3)
|
74
|
Newport Beach, CA
|
-
|
7,850
|
4,218
|
9
|
12,059
|
12,068
|
(4,634)
|
1972
|
06/99
|
3-30
|
||||||||||||||
|
Foothill Commons
|
388
|
Bellevue, WA
|
2,435
|
9,821
|
30,872
|
2,440
|
40,688
|
43,128
|
(18,651)
|
1978
|
03/90
|
3-30
|
||||||||||||||
|
Foothill Gardens/Twin Creeks
|
176
|
San Ramon, CA
|
5,875
|
13,992
|
4,360
|
5,964
|
18,263
|
24,227
|
(9,093)
|
1985
|
02/97
|
3-30
|
||||||||||||||
|
Forest View
|
192
|
Renton, WA
|
3,731
|
14,530
|
1,212
|
3,731
|
15,742
|
19,473
|
(5,132)
|
1998
|
10/03
|
3-30
|
||||||||||||||
(Continued)
ESSEX PROPERTY TRUST, INC. AND SUBSIDIARIES
NOTES TO CONSOLIDATED FINANCIAL STATEMENTS
December 31, 2012, 2011, and 2010
|
|
Costs
|
|||||||||||||||||||||||||
|
Initial cost
|
capitalized
|
Gross amount carried at close of period
|
||||||||||||||||||||||||
|
Buildings and
|
subsequent to
|
Land and
|
Buildings and
|
Accumulated
|
Date of
|
Date
|
Lives
|
|||||||||||||||||||
|
Property
|
Units
|
Location
|
Encumbrance
|
Land
|
improvements
|
acquisition
|
improvements
|
improvements
|
Total
(1)
|
depreciation
|
construction
|
acquired
|
(years)
|
|||||||||||||
|
Unencumbered communities (continued)
|
||||||||||||||||||||||||||
|
Fountain Court
|
320
|
Seattle, WA
|
6,702
|
27,306
|
4,214
|
6,985
|
31,237
|
38,222
|
(13,626)
|
2000
|
03/00
|
3-30
|
||||||||||||||
|
Fourth & U
|
171
|
Berkeley, CA
|
8,879
|
52,351
|
1,821
|
8,879
|
54,172
|
63,051
|
(5,429)
|
2010
|
04/10
|
3-30
|
||||||||||||||
|
Hillsdale Garden Apartments
|
697
|
San Mateo, CA
|
22,000
|
94,681
|
17,407
|
22,244
|
111,844
|
134,088
|
(23,317)
|
1948
|
09/06
|
3-30
|
||||||||||||||
|
Hope Ranch Collection
|
108
|
Santa Barbara, CA
|
4,078
|
16,877
|
2,291
|
4,208
|
19,038
|
23,246
|
(3,366)
|
1965
|
03/07
|
3-30
|
||||||||||||||
|
Joule
|
295
|
Seattle, WA
|
14,558
|
69,417
|
2,473
|
14,558
|
71,890
|
86,448
|
(7,421)
|
2010
|
03/10
|
3-30
|
||||||||||||||
|
1000 Kiely
|
121
|
Santa Clara, CA
|
9,359
|
21,845
|
3,675
|
9,359
|
25,520
|
34,879
|
(1,590)
|
1971
|
03/11
|
3-30
|
||||||||||||||
|
Kings Road
|
196
|
Los Angeles, CA
|
4,023
|
9,527
|
7,646
|
4,031
|
17,165
|
21,196
|
(7,801)
|
1979
|
06/97
|
3-30
|
||||||||||||||
|
Le Parc Luxury Apartments
|
140
|
Santa Clara, CA
|
3,090
|
7,421
|
10,766
|
3,092
|
18,185
|
21,277
|
(9,041)
|
1975
|
02/94
|
3-30
|
||||||||||||||
|
Linden Square
|
183
|
Seattle, WA
|
4,374
|
11,588
|
1,886
|
4,202
|
13,646
|
17,848
|
(5,673)
|
1994
|
06/00
|
3-30
|
||||||||||||||
|
Lofts at Pinehurst, The
|
118
|
Ventura, CA
|
1,570
|
3,912
|
4,197
|
1,618
|
8,061
|
9,679
|
(3,461)
|
1971
|
06/97
|
3-30
|
||||||||||||||
|
Magnolia Lane
(4)
|
32
|
Sunnyvale, CA
|
-
|
5,430
|
210
|
-
|
5,640
|
5,640
|
(1,080)
|
2001
|
06/07
|
3-30
|
||||||||||||||
|
Marina City Club
(5)
|
101
|
Marina Del Rey, CA
|
-
|
28,167
|
6,696
|
-
|
34,863
|
34,863
|
(10,453)
|
1971
|
01/04
|
3-30
|
||||||||||||||
|
Marina Cove
(6)
|
292
|
Santa Clara, CA
|
5,320
|
16,431
|
8,311
|
5,324
|
24,738
|
30,062
|
(13,558)
|
1974
|
06/94
|
3-30
|
||||||||||||||
|
Mariners Place
|
105
|
Oxnard, CA
|
1,555
|
6,103
|
1,748
|
1,562
|
7,844
|
9,406
|
(3,476)
|
1987
|
05/00
|
3-30
|
||||||||||||||
|
Meadoweood
|
320
|
Simi Valley, CA
|
7,852
|
18,592
|
5,498
|
7,898
|
24,044
|
31,942
|
(12,206)
|
1986
|
11/96
|
3-30
|
||||||||||||||
|
Mesa Village
|
133
|
Clairemont, CA
|
1,888
|
7,498
|
1,001
|
1,894
|
8,493
|
10,387
|
(2,890)
|
1963
|
12/02
|
3-30
|
||||||||||||||
|
Mira Monte
|
355
|
Mira Mesa, CA
|
7,165
|
28,459
|
7,652
|
7,186
|
36,090
|
43,276
|
(14,088)
|
1982
|
12/02
|
3-30
|
||||||||||||||
|
Miracle Mile/Marbella
|
236
|
Los Angeles, CA
|
7,791
|
23,075
|
10,885
|
7,886
|
33,865
|
41,751
|
(15,215)
|
1988
|
08/97
|
3-30
|
||||||||||||||
|
Mission Hills
|
282
|
Oceanside, CA
|
10,099
|
38,778
|
3,677
|
10,167
|
42,387
|
52,554
|
(11,755)
|
1984
|
07/05
|
3-30
|
||||||||||||||
|
Monterra del Mar/Rey/Sol
|
292
|
Pasadena, CA
|
2,202
|
4,794
|
28,101
|
8,385
|
26,712
|
35,097
|
(12,072)
|
1972
|
04/99
|
3-30
|
||||||||||||||
|
Monterey Villas
|
122
|
Oxnard, CA
|
2,349
|
5,579
|
5,217
|
2,424
|
10,721
|
13,145
|
(4,670)
|
1974
|
07/97
|
3-30
|
||||||||||||||
|
Mt. Sutro
|
99
|
San Francisco, CA
|
2,334
|
8,507
|
2,988
|
2,809
|
11,020
|
13,829
|
(4,924)
|
1973
|
06/01
|
3-30
|
||||||||||||||
|
Muse
|
152
|
Hollywood, CA
|
7,822
|
33,436
|
1,136
|
7,823
|
34,571
|
42,394
|
(3,117)
|
2011
|
02/11
|
3-30
|
||||||||||||||
|
Park Catalina
|
90
|
Los Angeles, CA
|
4,710
|
18,839
|
293
|
4,710
|
19,132
|
23,842
|
(346)
|
2002
|
06/12
|
3-30
|
||||||||||||||
|
Park West
|
126
|
San Francisco, CA
|
9,424
|
21,988
|
659
|
9,424
|
22,647
|
32,071
|
(215)
|
1958
|
09/12
|
3-30
|
||||||||||||||
|
Pinehurst
(7)
|
28
|
Ventura, CA
|
355
|
1,356
|
377
|
6
|
2,082
|
2,088
|
(733)
|
1973
|
12/04
|
3-30
|
||||||||||||||
|
Pointe at Cupertino, The
|
116
|
Cupertino, CA
|
4,505
|
17,605
|
8,388
|
4,505
|
25,993
|
30,498
|
(6,545)
|
1963
|
08/98
|
3-30
|
||||||||||||||
|
Reed Square
|
100
|
Sunnyvale, CA
|
6,873
|
16,037
|
1,897
|
6,873
|
17,934
|
24,807
|
(550)
|
1970
|
01/12
|
3-30
|
||||||||||||||
|
Regency at Encino
|
75
|
Encino, CA
|
3,184
|
12,737
|
1,348
|
3,184
|
14,084
|
17,268
|
(1,730)
|
1989
|
12/09
|
3-30
|
||||||||||||||
|
Salmon Run at Perry Creek
|
132
|
Bothell, WA
|
3,717
|
11,483
|
1,119
|
3,801
|
12,518
|
16,319
|
(5,024)
|
2000
|
10/00
|
3-30
|
||||||||||||||
|
101 San Fernando
|
323
|
San Jose, CA
|
4,173
|
58,961
|
3,678
|
4,173
|
62,639
|
66,812
|
(5,392)
|
2001
|
07/10
|
3-30
|
||||||||||||||
|
Sammamish View
|
153
|
Bellevue, WA
|
3,324
|
7,501
|
5,677
|
3,331
|
13,171
|
16,502
|
(8,094)
|
1986
|
11/94
|
3-30
|
||||||||||||||
|
San Marcos
|
432
|
Richmond, CA
|
15,563
|
36,204
|
26,282
|
22,866
|
55,183
|
78,049
|
(17,358)
|
2003
|
11/03
|
3-30
|
||||||||||||||
|
Santee Court
|
165
|
Los Angeles, CA
|
6,177
|
24,716
|
956
|
6,177
|
25,672
|
31,849
|
(1,992)
|
2004
|
10/10
|
3-30
|
||||||||||||||
|
Santee Village
|
73
|
Los Angeles, CA
|
3,404
|
15,601
|
1,391
|
3,404
|
16,992
|
20,396
|
(997)
|
2011
|
07/11
|
3-30
|
||||||||||||||
|
Shadow Point
|
172
|
Spring Valley, CA
|
2,812
|
11,170
|
1,747
|
2,820
|
12,909
|
15,729
|
(4,606)
|
1983
|
12/02
|
3-30
|
||||||||||||||
|
Summit Park
|
300
|
San Diego, CA
|
5,959
|
23,670
|
3,273
|
5,977
|
26,925
|
32,902
|
(9,704)
|
1972
|
12/02
|
3-30
|
||||||||||||||
|
The Laurels at Mill Creek
|
164
|
Mill Creek, WA
|
1,559
|
6,430
|
4,945
|
1,595
|
11,339
|
12,934
|
(5,607)
|
1981
|
12/96
|
3-30
|
||||||||||||||
|
The Grand
|
243
|
Oakland, CA
|
4,531
|
89,208
|
3,969
|
4,531
|
93,177
|
97,708
|
(13,803)
|
2009
|
01/09
|
3-30
|
||||||||||||||
|
The Sweep Apartments
|
91
|
Goleta, CA
|
5,558
|
21,320
|
1,866
|
5,618
|
23,126
|
28,744
|
(6,481)
|
1967
|
01/06
|
3-30
|
||||||||||||||
|
Trabucco Villas
|
132
|
Lake Forest, CA
|
3,638
|
8,640
|
2,035
|
3,890
|
10,423
|
14,313
|
(4,949)
|
1985
|
10/97
|
3-30
|
||||||||||||||
|
Tuscana
|
30
|
Tracy, CA
|
2,828
|
6,599
|
154
|
2,870
|
6,711
|
9,581
|
(1,260)
|
2007
|
02/07
|
3-30
|
||||||||||||||
|
Via
|
284
|
Sunnyvale, CA
|
22,000
|
82,270
|
169
|
22,016
|
82,423
|
104,439
|
(4,617)
|
2011
|
07/11
|
3-30
|
||||||||||||||
|
Vista Capri - North
|
106
|
San Diego, CA
|
1,663
|
6,609
|
830
|
1,668
|
7,434
|
9,102
|
(2,526)
|
1975
|
12/02
|
3-30
|
||||||||||||||
|
Walnut Heights
|
163
|
Walnut, CA
|
4,858
|
19,168
|
2,212
|
4,887
|
21,351
|
26,238
|
(6,775)
|
1964
|
10/03
|
3-30
|
||||||||||||||
|
Wharfside Pointe
|
142
|
Seattle, WA
|
2,245
|
7,020
|
6,010
|
2,258
|
13,017
|
15,275
|
(6,954)
|
1990
|
06/94
|
3-30
|
||||||||||||||
|
Willow Lake
|
508
|
San Jose, CA
|
43,194
|
101,030
|
857
|
43,194
|
101,887
|
145,081
|
(707)
|
1989
|
10/12
|
3-30
|
||||||||||||||
|
Windsor Ridge
|
216
|
Sunnyvale, CA
|
4,017
|
10,315
|
6,281
|
4,021
|
16,592
|
20,613
|
(11,252)
|
1989
|
03/89
|
3-30
|
||||||||||||||
|
Woodland Commons
|
236
|
Bellevue, WA
|
2,040
|
8,727
|
16,655
|
2,044
|
25,378
|
27,422
|
(10,043)
|
1978
|
03/90
|
3-30
|
||||||||||||||
|
Woodside Village
|
145
|
Ventura, CA
|
5,331
|
21,036
|
2,828
|
5,341
|
23,854
|
29,195
|
(6,678)
|
1987
|
12/04
|
3-30
|
||||||||||||||
|
29,207
|
1,565,599
|
948,416
|
3,263,992
|
740,286
|
980,247
|
3,972,447
|
4,952,694
|
(1,062,438)
|
|
|||||||||||||||||
(Continued)
ESSEX PROPERTY TRUST, INC. AND SUBSIDIARIES
NOTES TO CONSOLIDATED FINANCIAL STATEMENTS
December 31, 2012, 2011, and 2010
|
Costs
|
||||||||||||||||||||||||||||||||||
|
Rentable
|
Initial cost
|
capitalized
|
Gross amount carried at close of period
|
|||||||||||||||||||||||||||||||
|
Square
|
Buildings and
|
subsequent to
|
Land and
|
Buildings and
|
Accumulated
|
Date of
|
Date
|
Lives
|
||||||||||||||||||||||||||
|
Property
|
Footage
|
Location
|
Encumbrance
|
Land
|
improvements
|
acquisition
|
improvements
|
improvements
|
Total
(1)
|
depreciation
|
construction
|
acquired
|
(years)
|
|||||||||||||||||||||
|
Other real estate assets
|
||||||||||||||||||||||||||||||||||
|
Office Buildings
|
||||||||||||||||||||||||||||||||||
|
Essex Hollywood
|
35,000 |
Los Angeles, CA
|
10,200 | 13,800 | 2,177 | 10,200 | 15,977 | 26,177 | (4,243) | 1938 | 07/06 | 3-30 | ||||||||||||||||||||||
|
Santa Clara Square retail
|
139,000 |
Santa Clara, CA
|
6,472 | 11,704 | 2,636 | 6,472 | 14,340 | 20,812 | (1,711) | 1970 | 09/11 | 3-30 | ||||||||||||||||||||||
|
925/935 East Meadow
|
31,900 |
Palo Alto, CA
|
1,401 | 3,172 | 7,985 | 3,147 | 9,411 | 12,558 | (3,866) | 1988 | 11/97 | 3-30 | ||||||||||||||||||||||
|
17461 Derian
|
110,000 |
Irvine, CA
|
3,079 | 12,315 | 6,037 | 3,105 | 18,326 | 21,431 | (9,259) | 1983 | 07/00 | 3-30 | ||||||||||||||||||||||
|
Consolidated Development Pipeline
|
31,957 | - | 34,894 | 66,851 | - | 66,851 | - | |||||||||||||||||||||||||||
|
Total apartment communities and other real estate assets
|
$ | 1,565,599 | $ | 1,001,525 | $ | 3,304,983 | $ | 794,015 | $ | 1,070,022 | $ | 4,030,501 | $ | 5,100,523 | $ | (1,081,517) | ||||||||||||||||||
|
(1)
|
The aggregate cost for federal income tax purposes is approximately $4.0 billion (unaudited).
|
|
(2)
|
The land is leased pursuant to a ground lease expiring 2082.
|
|
(3)
|
The land is leased pursuant to a ground lease expiring 2027.
|
|
(4)
|
The land is leased pursuant to a ground lease expiring 2070.
|
|
(5)
|
The land is leased pursuant to a ground lease expiring 2067.
|
|
(6)
|
A portion of land is leased pursuant to a ground lease expiring in 2028.
|
|
(7)
|
The land is leased pursuant to a ground lease expiring in 2028.
|
|
2012
|
2011
|
2010
|
2012
|
2011
|
2010
|
||||||||||||||||||||
|
Rental properties:
|
Accumulated depreciation:
|
||||||||||||||||||||||||
|
Balance at beginning of year
|
$ | 4,313,064 | $ | 3,964,561 | $ | 3,310,152 |
Balance at beginning of year
|
$ | 920,026 | $ | 775,553 | $ | 646,686 | ||||||||||||
|
Improvements
|
97,947 | 219,692 | 51,101 |
Depreciation expense - Acquisitions
|
3,744 | 1,279 | 2,505 | ||||||||||||||||||
|
Acquisition of real estate
|
619,743 | 103,300 | 387,300 |
Depreciation expense - Discontinued operations
|
2,108 | 315 | 700 | ||||||||||||||||||
|
Development of real estate
|
25,545 | 44,280 | 216,008 |
Depreciation expense - Rental properties
|
161,492 | 148,337 | 125,662 | ||||||||||||||||||
|
Disposition of real estate
|
(22,627 | ) | (18,769 | ) | - |
Dispositions
|
(5,853 | ) | (5,458 | ) | - | ||||||||||||||
|
Balance at the end of year
|
$ | 5,033,672 | $ | 4,313,064 | $ | 3,964,561 |
Balance at the end of year
|
$ | 1,081,517 | $ | 920,026 | $ | 775,553 | ||||||||||||
See accompanying report of independent registered public accounting firm.
Pursuant to the requirements of Section 13 of 15(d) of the Securities Exchange Act of 1934, the Registrant has duly caused this report to be signed on its behalf by the undersigned, thereunto duly authorized.
|
ESSEX PROPERTY TRUST, INC.
|
|
|
(Registrant)
|
|
|
Date: February 22, 2013
|
|
|
By: /S/ MICHAEL T. DANCE
|
|
|
|
Michael T. Dance
|
|
|
Executive Vice President, Chief Financial Officer
|
|
(Authorized Officer, Principal Financial Officer)
|
|
|
By: /S/ BRYAN G. HUNT
|
|
|
Bryan G. Hunt
|
|
|
First Vice President, Chief Accounting Officer
|
KNOWN ALL PERSONS BY THESE PRESENTS, that each person whose signature appears below constitutes and appoints Michael J. Schall and Michael T. Dance, and each of them, his attorney-in-fact, each with the power of substitution, for him in any and all capacities, to sign any amendments to this Report on Form 10-K and to file the same, with exhibits thereto and other documents in connection therewith, with the Securities and Exchange Commission, hereby ratifying and confirming all that each of said attorney-in-fact, or his substitute or substitutes, may do or cause to be done by virtue hereof.
Pursuant to the requirements of the Securities Exchange Act of 1934, this report has been signed below by the following persons on behalf of the Registrant and in the capacity and on the date indicated.
|
Signature
|
Title
|
Date
|
|
/S/ MICHAEL J. SCHALL
|
Chief Executive Officer and President, and Director
|
February 22, 2013
|
|
Michael J. Schall
|
(Principal Executive Officer)
|
|
|
/S/ KEITH R. GUERICKE
|
Director, and Vice Chairman of the Board
|
February 22, 2013
|
|
Keith R. Guericke
|
||
|
/S/ GEORGE M. MARCUS
|
Director and Chairman of the Board
|
February 22, 2013
|
|
George M. Marcus
|
||
|
/S/ DAVID W. BRADY
|
Director
|
February 22, 2013
|
|
David W. Brady
|
||
|
/S/ GARY P. MARTIN
|
Director
|
February 22, 2013
|
|
Gary P. Martin
|
||
|
/S/ ISSIE N. RABINOVITCH
|
Director
|
February 22, 2013
|
|
Issie N. Rabinovitch
|
|
Signature
|
Title
|
Date
|
|
/S/ THOMAS E. RANDLETT
|
Director
|
February 22, 2013
|
|
Thomas E. Randlett
|
||
|
/S/ BYRON A. SCORDELIS.
|
Director
|
February 22, 2013
|
|
Byron A. Scordelis
|
||
|
/S/ JANICE L. SEARS.
|
Director
|
February 22, 2013
|
|
Janice L. Sears
|
||
|
/S/ CLAUDE J. ZINNGRABE
|
Director
|
February 22, 2013
|
|
Claude J. Zinngrabe
|
EXHIBIT INDEX
|
Exhibit No.
|
Document
|
|
3.1
|
Articles of Restatement of Essex Property Trust, Inc., attached as Exhibit 3.1 to the Company's Current Report on Form 8-K, filed February 16, 2012, and incorporated herein by reference.
|
|
3.2
|
Second Amended and Restated Bylaws of Essex Property Trust, Inc., dated as of September 16, 2008, attached as Exhibit 3.1 to the Company’s Current Report on Form 8-K, filed September 22, 2008, and incorporated herein by reference.
|
|
4.1
|
Form of 4.875% Series G Cumulative Convertible Preferred Stock Certificate, attached as Exhibit 4.1 to the Company’s Current Report on Form 8-K, filed July 27, 2006, and incorporated herein by reference.
|
|
4.2
|
Form of 7.125% Series H Cumulative Redeemable Preferred Stock Certificate, attached as Exhibit 4.1 to the Company's Current Report on Form 8-K, filed April 13, 2011, and incorporated herein by reference.
|
|
4.3
|
Indenture, dated August 15, 2012, among Essex Portfolio, L.P., Essex Property Trust, Inc., and U.S. Bank National Association, as trustee, including the form of 3.625% Senior Notes due 2022 and the guarantee thereof, attached as Exhibit 4.1 to the Company’s Current Report on Form 8-K, filed August 15, 2012, and incorporated herein by reference.
|
|
10.1
|
Essex Property Trust, Inc. 1994 Stock Incentive Plan, (amended and restated), attached as Exhibit 10.1 to the Company's Form 10-Q for the quarter ended June 30, 2000 and incorporated herein by reference.*
|
|
10.2
|
Form of Essex Property Trust, Inc. 1994 Non-Employee and Director Stock Incentive Plan, attached as Exhibit 10.3 to the Company's Registration Statement on Form S-11 (Registration No. 33-76578), which became effective on June 6, 1994, and incorporated herein by reference.*
|
|
10.3
|
Agreement between Essex Property Trust, Inc. and George M. Marcus, dated March 27, 2003 attached as Exhibit 10.32 to the Company's Form 10-K for the year ended December 31, 2002 and incorporated herein by reference.
|
|
10.4
|
Essex Property Trust, Inc. 2004 Stock Incentive Plan, attached as Exhibit 10.1 to the Company's Quarterly Report on Form 10-Q for the quarter ended June 30, 2004, and incorporated herein by reference.*
|
|
10.5
|
2005 Deferred Compensation Plan (as amended and restated) of Essex Portfolio, L.P., dated as of December 2, 2008, attached as Exhibit 10.1 to the Company's Current Report on Form 8-K, filed December 8, 2008, and incorporated herein by reference.*
|
|
10.6
|
Executive Severance Plan of Essex Property Trust, Inc., amended and restated effective as of December 31, 2008, attached as Exhibit 10.2 to the Company's Current Report on Form 8-K, filed December 8, 2008, and incorporated herein by reference.*
|
|
10.7
|
Second Amended and Restated Agreement of Limited Partnership of Essex Portfolio, L.P., dated as of May 27, 2009, attached as Exhibit 10.1 to the Company's Current Report on Form 8-K, filed May 27, 2009, and incorporated herein by reference.*
|
|
10.8
|
First Amendment to the Second Amended and Restated Agreement of Limited Partnership of Essex Portfolio, L.P., dated as of December 23, 2009, attached as Exhibit 10.1 to the Company's Current Report on Form 8-K, filed December 30, 2009, and incorporated herein by reference.*
|
|
10.9
|
Form of Indemnification Agreement between Essex Property Trust, Inc. and its directors and officers, attached as Exhibit 99.1 to the Company's Current Report on Form 8-K, filed February 25, 2011, and incorporated herein by reference.*
|
|
10.10
|
Note Purchase Agreement, dated as of March 31, 2011, among Essex Portfolio, L.P., Essex Property Trust, Inc. and the purchasers of the notes party thereto (including the form of the 4.36% Senior Guaranteed Notes, due March 31, 2016), attached as Exhibit 10.1 to the Company's Current Report on Form 8-K, filed April 1, 2011, and incorporated herein by reference.†
|
|
10.11
|
Second Amendment to the Second Amended and Restated Agreement of Limited Partnership of Essex Portfolio, L.P., dated as of April 13, 2011, attached as Exhibit 10.1 to the Company's Current Report on Form 8-K, filed April 13, 2011, and incorporated herein by reference.
|
|
10.12
|
Note Purchase Agreement, dated as of June 30, 2011, among Essex Portfolio, L.P., Essex Property Trust, Inc. and the purchasers of the notes party thereto (including the forms of the 4.50% Senior Guaranteed Notes, Series A, due September 30, 2017, and the 4.92% Senior Guaranteed Notes, Series B, due December 30, 2019) , attached as Exhibit 10.1 to the Company's Current Report on Form 8-K, filed July 5, 2011, and incorporated herein by reference.†
|
|
10.13
|
Amended and Restated 2004 Non-Employee Director Equity Award Program, dated May 1, 2011, attached as Exhibit 10.1 to the Company’s Quarterly Report on Form 10-Q for the quarter ended June 30, 2011, and incorporated herein by reference.*
|
|
10.14
|
Amended and Restated Revolving Credit Agreement, dated as of September 16, 2011, by and among Essex Portfolio, L.P., PNC Bank, National Association, as Administrative Agent, Swing Line Lender and L/C Issuer, and other lenders as specified therein, attached as Exhibit 10.1 to the Company’s Quarterly Report on Form 10-Q for the quarter ended September 30, 2011, and incorporated herein by reference.
|
|
10.15
|
Equity Distribution Agreement between the Company and Cantor Fitzgerald & Co. dated March 5, 2012 (relating to common stock), attached as exhibit 10.1 to the Company’s Current Report on Form 8-K, filed on March 7, 2012, and incorporated herein by reference.
|
|
10.16
|
Equity Distribution Agreement between the Company and Cantor Fitzgerald & Co. dated March 5, 2012 (relating to preferred stock), attached as exhibit 10.2 to the Company’s Current Report on Form 8-K, filed on March 7, 2012, and incorporated herein by reference.
|
|
10.17
|
Note Purchase Agreement, dated as of March 14, 2012, among Essex Portfolio, L.P., the Company and the purchasers of the notes party thereto (including the forms of the 4.27% Senior Guaranteed Notes, Series C, due April 30, 2021, the 4.30% Senior Guaranteed Notes, Series D, due June 29, 2021, and the 4.37% Senior Guaranteed Notes, Series E, due August 30, 2021), attached as Exhibit 10.1 to the Company’s Current Report on Form 8-K, filed on March 20, 2012, and incorporated herein by reference. †
|
|
10.18
|
First Amendment to Amended and Restated Revolving Credit Agreement, dated May 31, 2012, filed as Exhibit 10.1 to the Company’s Quarterly Report on Form 10-Q for the quarter ended June 30, 2012, and incorporated herein by reference.
|
|
10.19
|
Modification Agreement, dated July 30, 2012, filed as Exhibit 10.2 to the Company’s Quarterly Report on Form 10-Q for the quarter ended June 30, 2012, and incorporated herein by reference
|
|
10.20
|
Registration Rights Agreement, dated August 15, 2012, among Essex Portfolio, L.P., the Company and Citigroup Global Markets Inc., J.P. Morgan Securities LLC and Wells Fargo Securities, LLC as representatives of the several initial purchasers, attached as Exhibit 10.1 to the Company's Current Report on Form 8-K, filed on August 15, 2012, and incorporated herein by reference.
|
|
10.21
|
Amendment to Agreement, dated as of September 11, 2012, between the Company and George Marcus, attached as Exhibit 10.2 to the Company's Quarterly Report on Form 10-Q for the quarter ended September 30, 2012, and incorporated herein by reference.
|
|
10.22
|
Third Amendment to the Second Amended and Restated Agreement of Limited Partnership of Essex Portfolio, L.P., as amended, dated December 4, 2012, attached as Exhibit 10.1 to the Company’s Current Report on Form 8-K, filed on December 10, 2012, and incorporated herein by reference.
|
|
Schedule of Computation of Ratio of Earnings to Fixed Charges and Preferred Stock Dividends.
|
|
|
14.1
|
Code of Business Conduct and Ethics, attached as Exhibit 14.1 to the Company’s Annual Report on Form 10-K for the year ended December 31, 2011, and incorporated herein by reference.
|
|
List of Subsidiaries of Essex Property Trust, Inc.
|
|
Consent of KPMG LLP, Independent Registered Public Accounting Firm.
|
|
|
24.1
|
Power of Attorney (see signature page)
|
|
Certification of Michael J. Schall, Principal Executive Officer, pursuant to Section 302 of the Sarbanes-Oxley Act of 2002.
|
|
|
Certification of Michael T. Dance, Principal Financial Officer, pursuant to Section 302 of the Sarbanes-Oxley Act of 2002.
|
|
|
Certification of Michael J. Schall, Principal Executive Officer, pursuant to Section 906 of the Sarbanes-Oxley Act of 2002.
|
|
|
Certification of Michael T. Dance, Principal Financial Officer, pursuant to Section 906 of the Sarbanes-Oxley Act of 2002.
|
|
|
101.INS**
|
XBRL Instance Document
|
|
101.SCH**
|
XBRL Taxonomy Extension Schema Document
|
|
101.CAL**
|
XBRL Taxonomy Extension Calculation Linkbase Document
|
|
101.DEF**
|
XBRL Taxonomy Extension Definition Linkbase Document
|
|
101.LAB**
|
XBRL Taxonomy Extension Label Linkbase Document
|
|
101.PRE**
|
XBRL Taxonomy Extension Presentation Linkbase Document
|
* Management contract or compensatory plan or arrangement.
† The schedules and certain exhibits to this agreement, as set forth in the agreement, have not been filed herewith. The Company agrees to furnish supplementally a copy of any omitted schedule or exhibit to the Securities and Exchange Commission upon request.
** XBRL (Extensible Business Reporting Language) information is furnished and not filed herewith, is not part of a registration statement or Prospectus for purposes of Section 11 or 12 of the Securities Act of 1933, is deemed not filed for purposes of section 18 of the Securities Exchange Act of 1934, and otherwise is not subject to liability under these sections.
TABLE OF CONTENTS
Part IItem 1. BusinessItem 1A. Risk FactorsItem 1B. Unresolved Staff CommentsItem 2. PropertiesItem 3. Legal ProceedingsItem 4. Mine Safety DisclosuresPart IIItem 5. Market For Registrant S Common Equity, Related Stockholder Matters and Issuer Purchases Of Equity SecuritiesItem 6. Selected Financial DataItem 7. Management S Discussion and Analysis Of Financial Condition and Results Of OperationsItem 7A. Quantitative and Qualitative Disclosures About Market RisksItem 8. Financial Statements and Supplementary DataItem 9. Changes in and Disagreements with Accountants on Accounting and Financial DisclosureItem 9A. Controls and ProceduresItem 9B. Other InformationPart IIIItem 10. Directors, Executive Officers and Corporate GovernanceItem 11. Executive CompensationItem 12. Security Ownership Of Certain Beneficial Owners and Management and Related Stockholder MattersItem 13. Certain Relationships and Related Transactions and Director IndependenceItem 14. Principal Accounting Fees and ServicesPart IVItem 15 . Exhibits and Financial Statement Schedules