UNITED STATES
SECURITIES AND EXCHANGE COMMISSION
Washington, D.C. 20549
FORM 10-K
|
þ
|
ANNUAL REPORT PURSUANT TO SECTION 13 OR 15(d) OF THE SECURITIES EXCHANGE ACT OF 1934
|
For the fiscal year ended December 31, 2018
or
|
o
|
TRANSITION REPORT PURSUANT TO SECTION 13 OR 15(d) OF THE SECURITIES EXCHANGE ACT OF 1934
|
For the transition period from ___________ to ___________
Commission File Number: 001-38593
Establishment Labs Holdings Inc.
(Exact name of Registrant as specified in its charter)
|
British Virgin Islands
|
Not applicable
|
|
|
State or Other Jurisdiction of Incorporation or Organization
|
I.R.S. Employer Identification No.
|
|
|
Building B15 and 25
Coyol Free Zone
Alajuela
Costa Rica
|
Not applicable
|
|
|
Address of Principal Executive Offices
|
Zip Code
|
|
|
+506 2434 2400
|
||||
|
Registrant’s Telephone Number, Including Area Code
|
||||
|
Not applicable
|
||||
|
Former Name, Former Address and Former Fiscal Year, if Changed Since Last Report
|
||||
Securities registered pursuant to Section 12(b) of the Act
:
|
Title of Each Class
|
Name of Each Exchange on Which Registered
|
|
|
Common Shares, No Par Value
|
The Nasdaq Capital Market
|
|
Securities registered pursuant to Section 12(g) of the Act:
None.
__________________________________________________
Indicate by check mark if the registrant is a well-known seasoned issuer, as defined in Rule 405 of the Securities Act. Yes
o
No
þ
Indicate by check mark if the registrant is not required to file reports pursuant to Section 13 or 15(d) of the Act. Yes
o
No
þ
Indicate by check mark whether the registrant (1) has filed all reports required to be filed by Section 13 or 15(d) of the Securities Exchange Act of 1934 during the preceding 12 months (or for such shorter period that the registrant was required to file such reports) and (2) has been subject to such filing requirements for the past 90 days. Yes
þ
No
o
Indicate by check mark whether the registrant has submitted electronically every Interactive Data File required to be submitted pursuant to Rule 405 of Regulation S-T (§ 232.405 of this chapter) during the preceding 12 months (or for such shorter period that the registrant was required to submit such files).
Yes
þ
No
o
Indicate by check mark if disclosure of delinquent filers pursuant to Item 405 of Regulation S-K (229.405 of this chapter) is not contained herein, and will not be contained, to the best of registrant’s knowledge, in definitive proxy or information statements incorporated by reference in Part III of this Form 10-K or any amendment to this Form 10-K.
þ
Indicate by check mark whether the registrant is a large accelerated filer, an accelerated filer, a non-accelerated filer, a smaller reporting company, or an emerging growth company. See the definitions of “large accelerated filer,” “accelerated filer”, “smaller reporting company”, and "emerging growth company" in Rule 12b-2 of the Exchange Act. (Check one)
|
Large accelerated filer
|
o
|
Accelerated filer
|
o
|
|
|
Non-accelerated filer
|
þ
|
Smaller reporting company
|
þ
|
|
|
Emerging growth company
|
þ
|
|||
If an emerging growth company, indicate by check mark if the registrant has elected not to use the extended transition period for complying with any new or revised financial accounting standards provided pursuant to Section 13(a) of the Exchange Act.
o
Indicate by check mark whether the registrant is a shell company (as defined in Exchange Act Rule 12b-2). Yes
o
No
þ
The aggregate market value of the common stock held by non-affiliates of the registrant on June 30, 2018, based on the July 19, 2018 initial public offering price of $18.00 per share of common stock was approximately
$157,196,610
. The registrant has elected to use the initial public offering price, as the registrant was a privately held company on June 30, 2018. Shares of the registrant’s common stock held by each executive officer, director and holder of 5% or more of the outstanding common stock have been excluded in that such persons may be deemed to be affiliates. This calculation does not reflect a determination that certain persons are affiliates of the registrant for any other purpose. The registrant has no non-voting equity.
As of March 19, 2019, the number of the registrant’s common shares outstanding was
20,389,103
.
DOCUMENTS INCORPORATED BY REFERENCE
Portions of the Registrant’s definitive proxy statement relating to its 2019 annual meeting of shareholders are incorporated by reference into Part III of this Annual Report on Form 10-K where indicated. The 2019 Proxy Statement will be filed with the U.S. Securities Exchange Commission within 120 days after the end of the fiscal year to which this report relates.
TABLE OF CONTENTS
|
|
|
Page
|
i
EXPLANATORY NOTE
In this report, unless the context indicates otherwise, the terms “Establishment Labs,” “Company,” “we”, “us” and “our” refer to Establishment Labs Holdings Inc., a British Virgin Islands entity, and its consolidated subsidiaries.
We own, or have rights to, trademarks and trade names that we use in connection with the operation of our business, including Establishment Labs and our logo as well as other brands such as Motiva Implants, SilkSurface/SmoothSilk, VelvetSurface, ProgressiveGel, TrueMonobloc, BluSeal, Divina, Ergonomix and MotivaImagine, among others. Other trademarks and trade names appearing in this report are the property of their respective owners. Solely for your convenience, some of the trademarks and trade names referred to in this report are listed without the ® and TM symbols, but we will assert, to the fullest extent under applicable law, our rights to our trademarks and trade names.
SPECIAL NOTE ABOUT FORWARD-LOOKING STATEMENTS
This report contains forward-looking statements within the meaning of Section 27A of the Securities Act of 1933, as amended, and Section 21E of the Securities Exchange Act of 1934, as amended (the “Exchange Act”). You can find many (but not all) of these statements by looking for words such as “approximates,” “believes,” “expects,” “anticipates,” “estimates,” “intends,” “plans,” “would,” “may” or other similar expressions in this report. Any statements that refer to projections of our future financial or operating performance, anticipated trends in our business, our goals, strategies, focus and plans, and other characterizations of future events or circumstances, including statements expressing general optimism about future operating results, are forward-looking statements.
We claim the protection of the safe harbor contained in the Private Securities Litigation Reform Act of 1995. We caution investors that any forward-looking statements presented in this report, or that we may make orally or in writing from time to time, are expressions of our beliefs and expectations based on currently available information at the time such statements are made. Such statements are based on assumptions, and the actual outcome will be affected by known and unknown risks, trends, uncertainties and factors that are beyond our control. Although we believe that our assumptions are reasonable, they are not guarantees of future performance, and some will inevitably prove to be incorrect. As a result, our actual future results may differ from our expectations, and those differences may be material.
Factors that could cause or contribute to these differences include, among others, those risks and uncertainties discussed under the sections contained in this
Form 10-K entitled Item 1A. “Risk Factors”; Item 7. “Management’s Discussion and Analysis of Financial Condition and Results of Operations”; and Item 7A. “Quantitative and Qualitative Disclosure about Market Risk”
, and our other filings with the Securities and Exchange Commission. The risks included in those documents are not exhaustive, and additional factors could adversely affect our business and financial performance. We operate in a very competitive and rapidly changing environment. New risk factors emerge from time to time, and it is not possible for us to predict all such risk factors, nor can we assess the impact of all such risk factors on our business or the extent to which any factor, or combination of factors, may cause actual results to differ materially from those contained in any forward-looking statements.
We are not undertaking any obligation to update any forward-looking statements. Accordingly, investors should use caution in relying on past forward-looking statements, which are based on known results and trends at the time they are made, to anticipate future results or trends.
1
PART I
ITEM 1. BUSINESS
Overview
We are a medical technology company focused on improving patient safety and aesthetic outcomes, initially in the breast aesthetics and reconstruction market. We initially incorporated as Establishment Labs, S.A., a Sociedad Anónima in Costa Rica on January 18, 2004 and subsequently reorganized under a parent holding company in the British Virgin Islands on October 9, 2013. Our line of silicone gel-filled breast implants, branded as Motiva Implants, is the centerpiece of our MotivaImagine medical technology platform. Post-market surveillance data, which was not generated in connection with an FDA PMA approval study and was self-collected rather than collected at mandatory follow-ups, and published third-party data indicates that Motiva Implants show low rates of adverse events (including rupture, capsular contracture, and safety related reoperations) that we believe compare favorably with those of our competitors. We believe the proprietary technologies that differentiate our Motiva Implants enable improved safety and aesthetic outcomes and have helped drive our revenue growth. Our MotivaImagine platform enables surgical techniques that we promote as Motiva branded surgeries. We have developed other complementary products and services on our MotivaImagine platform, which are aimed at further enhancing patient outcomes.
To date, most of our revenues have been generated from sales of our Motiva Implants. We began selling Motiva Implants outside the United States in October 2010; since then, we have introduced four generations of Motiva Implants, and Motiva Implants are now sold in over 60 countries. We currently sell our products either via exclusive distributors or, in certain countries, our direct sales force.
We received approval of an investigational device exemption, or IDE, from the FDA in March 2018 to initiate our Motiva Implants clinical trial in the United States and the first patient in the study was enrolled in April 2018. In March 2019, we filed our first annual report with the FDA, and our IDE study-defined enrollment targets for the aesthetic cohorts, which include primary augmentation and revision, have been reached with a total of 450 and 100 subjects, respectively. We are continuing to enroll subjects in the remaining cohorts and believe we are on track to meet all of the remaining enrollment targets in Q2 2019. We plan to enroll 800 patients in the study across 40 sites in the United States, Germany, Sweden and the United Kingdom. The results of the study are expected to support a pre-market approval, or PMA, submission to the FDA.
We have assembled a broad portfolio of intellectual property related to our medical device and aesthetics products. We believe this intellectual property, combined with proprietary manufacturing processes and the regulatory approvals we have successfully obtained outside of the
United States
, provides us with a strong market position.
As of December 31, 2018, we own or have rights to five issued and 19 pending patents in the United States related to various aspects of our Motiva implants (such as implant barrier layers, surface texture technology, minimally invasive implant delivery systems, and our QInside Safety Technology radio frequency identification devices). In addition, we own or have rights to two issued and 38 pending foreign applications and one pending Patent Cooperation Treaty, or PCT, application.
We intend to continue to expand our intellectual property portfolio and, combined with our Motiva Implants’ favorable safety profile, obtain FDA approval and drive Motiva’s adoption in the United States, which represents the largest breast augmentation market.
Our revenue for
the
year
ended
December 31, 2018
and
2017
was
$61.2 million
and
$34.7 million
, respectively, an increase of
$26.5 million
, or
76.5%
. Net losses decreased to
$21.1 million
for the
year
ended
December 31, 2018
from
$34.9 million
for the
year
ended
December 31, 2017
.
As of
December 31, 2018
, we had an accumulated deficit of
$89.0 million
.
2
Our Market
Breast augmentation surgery remains the leading aesthetic surgical procedure by number of procedures globally. Approximately 1.68 million breast augmentations were performed worldwide in 2017, according to International Society of Aesthetic Plastic Surgery, or ISAPS. In addition, according to Markets and Markets’
Medical Aesthetics Market - Forecast to 2021
report of November 2016, the global breast implant market was estimated at approximately $1.15 billion in 2016 and is expected to grow at a compound annual growth rate of approximately 8.5% through 2021. The following table lists the top markets by country for total breast augmentations in 2017 according to ISAPS.
|
Total Breast Augmentation Procedures
|
|||
|
Rank *
|
Country
|
Procedures
|
Percentage of World-Wide Total
|
|
1
|
United States
|
345,236
|
20.6%
|
|
2
|
Brazil
|
235,950
|
14.1%
|
|
3
|
Mexico
|
67,478
|
4.0%
|
|
4
|
Italy
|
54,045
|
3.2%
|
|
5
|
Germany
|
46,165
|
2.8%
|
|
6
|
Colombia
|
45,570
|
2.7%
|
|
7
|
Thailand
|
14,614
|
0.9%
|
|
8
|
Japan
|
7,751
|
0.5%
|
|
* Rankings are based solely on those countries from which a sufficient survey response was received and data were considered to be representative.
|
|||
Traditional Breast Implants and Their Limitations
Despite the global demand for breast augmentation procedures, there has been relatively little innovation since the 1990s. In 1992, due to emerging safety concerns, the FDA placed a moratorium on sales of silicone breast implants in the United States that was lifted in 2006. This, combined with the ongoing FDA requirement for a PMA on all new breast implants, has discouraged breast implant innovation over the past 30 years. Current products have relatively high adverse event rates, and we believe many do not mimic natural breast tissue. The table below contains selected adverse event information from published data from the PMA clinical trials conducted by the only three companies currently approved to market silicone breast implants in the United States.
|
Sientra
5-Year |
Allergan
6-Year |
Mentor
6-Year |
||||
|
Number of Patients
|
N=1,788 Patients
|
N=455 Patients
(1)
|
N=1,008 Patients
|
|||
|
Ruptures
(2)
|
1.8%
|
5.5%
|
3.7%
|
|||
|
Capsular Contracture
|
9.0%
|
14.8%
|
13.4%
|
|||
|
Reoperations
|
23.8%
|
28.0%
|
26.1%
|
|||
|
Each of these prospective studies was conducted at multiple sites in the United States and submitted by each of these companies as their core study supporting approval, as that term is defined in the FDA Guidance on Breast Implants. Sientra, Inc., Mentor Worldwide LLC (a division of Johnson & Johnson), and Allergan plc studies commenced in 2002, 2000, and 1998, respectively, and the results described above were released in 2012, 2009, and 2007, respectively. Five-year and six-year data was chosen to increase comparability to our six-year data.
|
||||||
|
Kaplan-Meier risk rates were the primary method of analysis for the above data.
|
||||||
|
(1) Adverse events in the study were derived from the primary augmentation cohort. The overall patient population in the study was 715 patients.
|
||||||
|
(2) The total for Sientra is based on the total patient population in the study, and the totals for Allergan and Mentor are based on a substudy cohort of patients who underwent an MRI, which is lower than the overall number of patients participating in the study.
|
||||||
S
ubsequent to each of their PMAs in the U.S., our competitors have released results from their individual 10-year prospective clinical trials. The table below contains published data from these clinical trials relating to primary
3
augmentations, which is the first time a patient receives a breast implant operation to aesthetically augment the size and form of the breast.
Results from primary augmentations
|
Sientra
10-Year |
Allergan
10-Year |
Mentor
10-Year |
||||
|
Number of Patients
|
N=1,116 Patients
|
N=455 Patients
|
N=552 Patients
|
|||
|
Ruptures
(1)
|
8.5%
|
9.3%
|
24.2%
|
|||
|
Capsular Contracture
|
12.9%
|
18.9%
|
12.1%
|
|||
|
Reoperations
|
24.0%
|
36.1%
|
25.5%
|
|||
|
Kaplan-Meier risk rates were the primary method of analysis for the above data. This table represents the final data from the primary cohort of the same study referenced in the above five- and six-year PMA studies conducted by our competitors. This 10-year data for Sientra, Allergan and Mentor were released in 2018, 2018, and 2015, respectively.
|
||||||
|
(1) The rupture rates represent the MRI cohort only for each respective study, which consisted of 571 patients for Sientra, 158 patients for Allergan and 202 patients for Mentor.
|
||||||
We believe that the improved appearance, feel and patient safety profile of our Motiva Implants provides a strong competitive advantage that will help us to both capture market share and achieve higher patient conversion rates by addressing the key concerns described by patients who choose not to pursue breast augmentation surgery.
Our Competitive Strengths
|
▪
|
Patient-centric innovative implant technologies.
We have developed our Motiva Implants by enhancing and creating novel product components for our implants, and then combining these components into products that deliver improved aesthetic outcomes, increased patient satisfaction and favorable safety profiles.
|
|
▪
|
Extensive suite of complementary products and services.
Our MotivaImagine product portfolio includes innovative products such as Divina 3D surgical simulation systems, Puregraft autologous fat grafting systems, and other surgical tools. We believe our branded surgical procedures, such as MotivaHybrid, Motiva MinimalScar and Motiva MINT, will address key unmet needs for both the physician and the patient.
|
|
▪
|
Proprietary internal manufacturing processes and capabilities.
We manufacture our silicone products in state-of-the-art manufacturing facilities in Costa Rica rather than relying on third-party manufacturers. In these facilities, we utilize our novel 3D imprinted molding method to create proprietary surface features that, in combination with other proprietary materials and methods, differentiate our products from those of our competitors. Our two manufacturing sites have gone through full site inspections and audits under the Medical Device Single Audit Program, or MDSAP, which were carried out by the British Standards Institute, or BSI, an agency which the FDA accepts as a substitute for routine agency inspections. We believe our modern facilities, focus on product quality and deep technological know-how have helped us establish and maintain a brand of consistency, quality and safety.
|
|
▪
|
Dynamic worldwide sales platform.
We sell our products both through exclusive arrangements with leading local distributors who have strong local surgeon relationships and our direct sales force in key markets such as Brazil and certain countries in Europe. Using this market specific approach, we have built an effective and efficient worldwide sales platform.
|
|
▪
|
Proven management team with expansive industry experience.
We have a highly experienced management team that is comprised of leaders from the medical aesthetic market.
|
4
Our Growth Strategy
Our goal is to be the global leader in aesthetic surgical implant technology, including breast implants, while improving patient safety through product innovation. The key elements of our strategy include:
|
▪
|
Expand revenues in existing markets.
We believe we can continue to grow market share in our existing markets due to the favorable safety profile and improved aesthetic outcomes of our Motiva Implants.
|
|
▪
|
Launch Motiva Implants in additional markets outside the United States.
We expect that continued geographic expansion will be a key driver of growth in the near term. In recent years, we started sales through distributors in Australia, Israel, Peru, Russia, Saudi Arabia and South Korea, as well as starting direct sales in Brazil, the second largest market for breast augmentations. Expansion into new countries in the Asia-Pacific region (China, India, Taiwan and Thailand) is expected in the next several years.
|
|
▪
|
Obtain FDA approval and enter the U.S. market.
We are conducting our IDE clinical trial in the United States, with the goal of obtaining approval from the FDA for a premarket application, or PMA, and commercializing our Motiva Implants in the United States. The first patient in the study was enrolled in April 2018, and we anticipate completing enrollment in Q2 2019.
|
|
▪
|
Optimize patient conversion through sales and marketing programs.
Our MotivaImagine Centers enable us to engage with and educate patients on the Motiva brand and the benefits of our products, as well as increase clinical efficiency for our physician collaborators. In the future, we expect our MotivaImagine Centers to have important strategic synergies with our branded surgeries, which are promoted globally. We employ a multi-faceted marketing strategy that includes social media engagement, conferences, advertisements and education.
|
|
▪
|
Seek out and pursue strategic acquisitions.
We intend to seek out other innovative products, services and branded procedures that meet unmet needs in the aesthetics space and complement our existing product portfolio, and we believe this can be additive to future revenue growth. We have purchased distributor networks in strategic markets and may acquire other third party sales organizations in the future. While we have no specific acquisitions or planned licensing agreements currently ongoing, we may engage in these, or other strategic transactions, with the goal of augmenting our existing product portfolio and global footprint.
|
|
▪
|
Continue a high level of engagement with key opinion leaders.
We promote Motiva Implants, in part, via an extensive and robust calendar of physician education events led by key opinion leaders in the field of aesthetic surgery. In 2018, we conducted
51
events through our MotivaEDGE educational platform. We also collaborate actively with respected and influential key opinion leader surgeons to identify and develop new clinical applications for our existing products, as well as new product and strategic opportunities.
|
5
Our Products and Technologies
The key characteristics of our primary products are described in the table below:
|
Product
|
Motiva Implants
|
Divina
|
Puregraft
|
|
|
|
|
|
Description
|
Soft silicone-gel filled breast implants with improved appearance, feel and safety
|
3D simulation device and proprietary tissue modeling software
|
Autologous graft of healthy, viable adipose (fat) cells for filling and contouring
|
|
Product Catalog
|
Available in more than 1,000 product variations, including four projection heights
|
For use with breast surgeries
|
Available in three graft volumes: 50cc, 250cc, and 850cc
|
|
Key Features
|
▪
SilkSurface/SmoothSilk shell surface
▪
ProgressiveGel PLUS, ProgressiveGel Ultima, Silicone filling gels
▪
Ergonomix design
▪
TrueMonobloc construction
▪
QInside Safety Technology RFID microtransponder
▪
BluSeal shell barrier layer
|
▪
Pre-operative 3D planning that enables patients and physicians to visualize post-surgical result and measure pre-existing breast volume to optimize implant selection
▪
May increase clinical consultation efficiency
▪
MotivaHybrid: fat grafting can be used in conjunction with Motiva Implants by measuring pre-existing volume of the breast and calculating the appropriate ratio between silicone implant and fat graft
|
▪
Purifies adipose tissue through selective filtration technology
▪
Self-contained purification process preserves sterility
▪
MotivaHybrid: can be used in conjunction with Motiva Implants
▪
We are the exclusive distributor outside of the United States and Canada
|
|
Sales Territories
|
Over 60 countries outside the United States
|
||
Motiva Implants
We launched Motiva Implants commercially in October 2010, and to date we have sold over
650,000
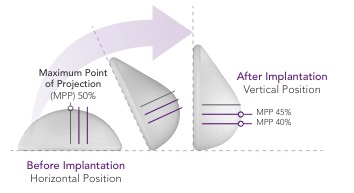
units in various countries outside the United States. Motiva Implants incorporate a number of proprietary features that we believe contribute to Motiva Implants’ favorable safety profile as well as a natural appearance and feel. Our latest generation of Motiva Implants utilize our proprietary Ergonomix design, a round base implant that responds to gravity by shifting its maximum point of projection, offering the projection of a shaped implant without the malpositioning and rotation issues frequently associated with shaped implants. Furthermore, our ProgressiveGel family of
silicone gel rheologies consists of four highly purified biocompatible gels with specific visco-elastic properties that we believe enables Motiva Implants to respond to the patient’s motion in ways that more closely mimic the appearance, feel and movement of natural breast tissue
. Our catalog includes over 1,000 product variations, with round, oval and anatomical shapes, two different surfaces and volumes ranging from 105cc to 1,050cc, making it a wider range of options than those offered by our major competitors.
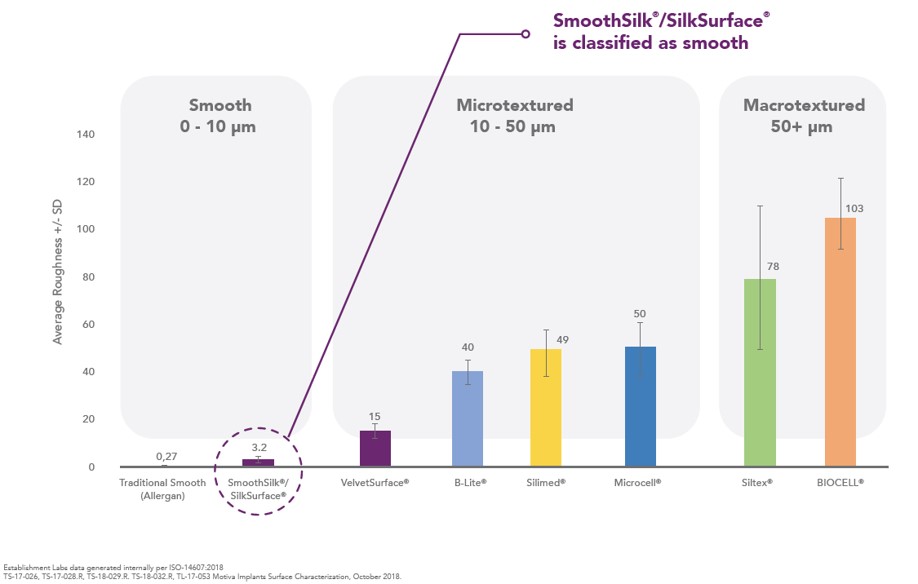
SilkSurface/SmoothSilk
The International Standard Organization, through the new April 2018 standard (ISO 14607:2018), created a classification of implant surface textures according to roughness. This standard includes an objective way of defining the difference between smooth, micro and macro surfaces based on roughness average. The topology of
6
SilkSurface/SmoothSilk is characterized under the smooth category, having a low roughness value of 3.2 microns with thousands of contact features per square centimeter.
Our retrospective implant data shows that Motiva Implants have a lower rate of capsular contracture and seromas when compared to available published data from competitors. We believe that these results are due in large part to the proprietary surface texturing of our Motiva Implants. Our proprietary shell surfaces are smoother and have more regular surface features than those of our primary competitors based on several studies using methods such as scanning electron microscopy, profilometry testing and statistical parameters comparisons.
A study performed in mice at the Langer Lab, by Professor Robert Langer, Institute Professor at the Massachusetts Institute of Technology, or MIT, Department of Chemical Engineering indicated that our SmoothSilk/SilkSurface attracts fewer macrophages than a traditional smooth surface. A larger percentage of macrophages in the cell mix indicates an inflammatory response, which is an early step in capsule formation. We believe the more moderate inflammatory response observed on SmoothSilk/SilkSurface is responsible for improved biocompatibility and lower complication rates.
In addition, an abstract presented in 2017 by researchers at Montana State University showed less accumulation of both bacteria and biofilm on SmoothSilk/SilkSurface in vitro when compared to smoother and textured surfaces. Biofilm formed on implant surfaces increases the risk of bacteria accumulation and capsule formation.
In December 2018, we commissioned a report from the French reference laboratory Laboratoire National de Metrologie et d’Essais, or LNE, on the mechanical characteristics of our Motiva implants. Based upon its testing, LNE concluded that the SmoothSilk/SilkSurface shell surface in the Motiva implants is considered a smooth surface as defined by ISO 14607:2018 categorization.
The graph below shows how the size of our surface features compares with those of our competitors.
ProgressiveGel Family
The proprietary silicone chemistries that comprise our ProgressiveGel family allow for a high degree of cohesiveness and strength, but add characteristics such as softness and high ductility that enable movement dynamics more like that of natural breast tissue. We believe that the cohesive properties reduce the likelihood of silicone gel leakage in the event of a rupture in the shell. The strength of the gel is believed to contribute to a
7
reduced frequency of gel fracture, a condition which leads to deformed implant shape and stress on the implant’s shell. While other manufacturers have claimed a “high strength” gel, ours combines a notably high elasticity (the ability to stretch without permanent deformation) with low viscosity, both of which reduce the susceptibility of the implants to rupture while improving their tactile feel and movement dynamics. Additionally, the improved adhesion of the gel to the shell structure avoids the appearance of separation spots, an aesthetic defect commonly seen in competitor products.
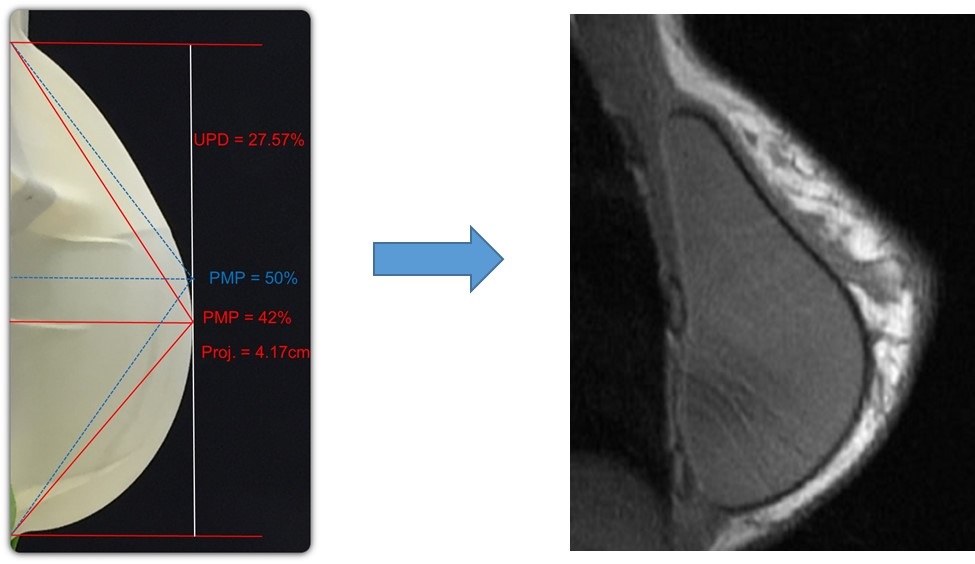
In addition to the safety advantages, our ProgressiveGel family provides for movement characteristics that resemble natural breast tissue. Our later generation Ergonomix products further mimic natural tissue, with a maximum point of projection that shifts downward to create a natural human breast shape when a patient is standing. This allows our Motiva Implants to provide the more natural aesthetics of “shaped” or “teardrop” implants without the risk of associated drawbacks such as breast deformation form rotation and unnaturally hard tactile feel. The images below illustrate the implants’ ability to change shape depending on the patient’s positioning.
|
|
TrueMonobloc
Our TrueMonobloc technology, which is incorporated into all generations of Motiva Implants currently sold, combines proprietary chemistry with our proprietary manufacturing techniques to create a shell, gel and other components that are tightly bound to one another. This results in an implant that is more homogeneously elastic and resistant to separation of the gel from the shell, addressing one type of implant failure that can lead to shell ruptures and silicone leaks. This also enables Motiva Implants to be stretched and squeezed to a more significant degree, which we believe currently enables breast augmentation through incision sizes smaller than one inch, compared with the published industry norm of approximately two inches. A branded surgery that we are developing, which we call Motiva Minimally Invasive Natural Technique, or Motiva MINT, would utilize a next-generation implant to take advantage of these physical properties to enable a less-invasive procedure for the patient. The implants associated with Motiva MINT have been developed, and were submitted for the CE marking process in 2018. Instruments and special devices for the Motiva MINT procedure are currently being prototyped and tested and will require regulatory approval prior to commercialization.
The following image shows that TrueMonobloc enables significant manipulation of a Motiva Implant without separation of gel from shell.

8
QInside Safety Technology RFID Technology
We offer the QInside Safety Technology as an optional feature in our Motiva Implants. QInside Safety Technology provides a Radio-Frequency Identification Device, or RFID, microtransponder, specially manufactured and encapsulated for implantation in the human body, that is embedded in the gel of a Motiva Implant.
The microtransponder contains only a unique 15 digit code that identifies the product, and does not contain any patient information
. This microtransponder can be read with a simple pass from our non-invasive and inexpensive reading device, the QInside Safety Technology Reader, and the serial number corresponds with related information in our MotivaImagine database such as implant type, size and other characteristics. Patients can create a secure account, register the products and include applicable patient information either through the MotivaImagine application or our website, to access their implant information. Surgeons can access that implant-related information through our Motiva Implants website, but they can only view patient-specific information of patients that have been linked to them after the patient or the surgeon creates a secure account, registers the products and provides patient information. The MotivaImagine application and Motiva Implants website also allow the patient to access the implant warranty information. This traceability is intended to give patients comfort that any future recalls can be positively identified as applying, or not applying, to that patient’s particular implant. This addresses a key concern that often discourages women who are otherwise interested in implants from making the choice to move forward with the surgery. Motiva Implants are currently the only breast implants on the international market with QInside Safety Technology; however, we believe there is an opportunity to sell these microtransponders to our competitors in the space.
Each implant’s unique electronic serial number is encoded into the RFID circuitry as part of a three point authentication system: the microtransponder, the reader and the database. This authentication system prevents unauthorized access to any personal information of the patient and is compliant with FDA regulations.
We also believe that additional functionality can be added to this microtransponder platform. Future potential applications currently under development include temperature sensing as a means of infection detection or pressure sensing as a means of detection of shell rupture.

9
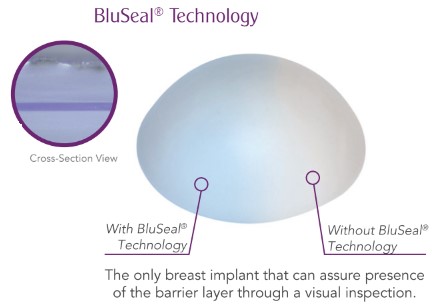
BluSeal
Our BluSeal technology embeds a visually distinct layer of blue silicone into the SilkSurface shell. This patented manufacturing innovation is intended to highlight any imperfections in the barrier layer coverage with a distinct color. This provides the plastic surgeon with the ability to verify whether the barrier layer has coverage defects or other imperfections before implantation that might lead to post-implantation shell rupture or gel bleed. We believe this is another safety innovation that contributes to our substantially lower reported implant rupture rates as compared to reports for our primary competitors.
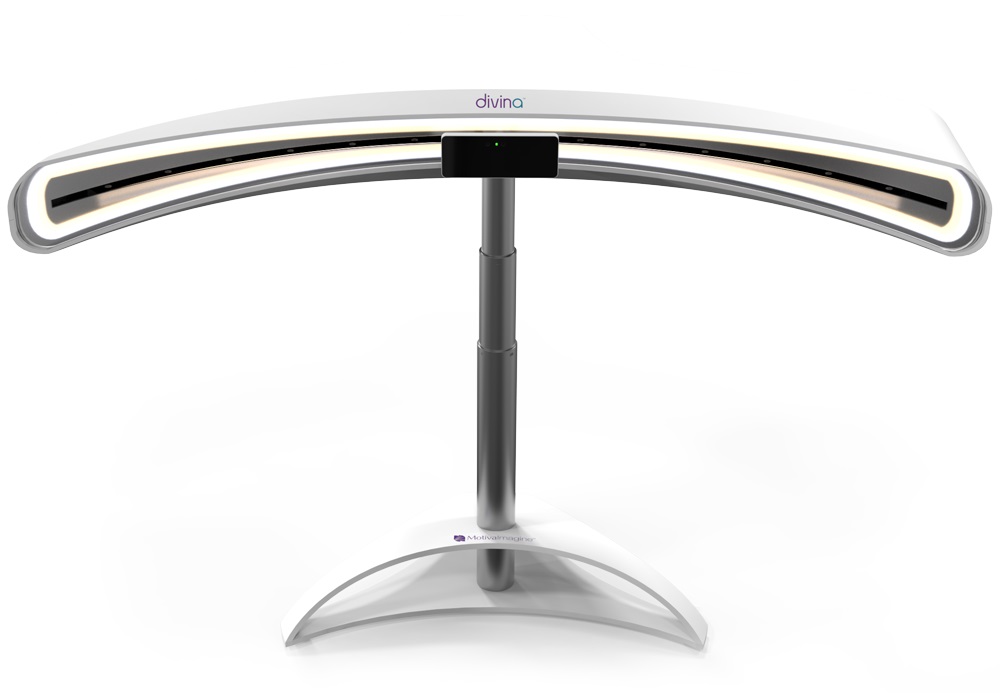
Divina 3D Simulation System
We sell our Divina 3D surgical simulation systems to distributors and plastic surgeons for use in pre-surgical patient consultations and planning. Divina utilizes a combination of 3D imaging hardware and proprietary Tissue Behavior Simulation software to give physicians and patients the ability to visualize the potential aesthetic result of a procedure and to explore various implant sizes in real time.
Current methodologies for choosing the base size and projection of an implant are highly subjective. The same size implant will yield very different aesthetic results depending on the patient’s existing breast mass, breast shape, and torso geometry. Divina improves this process in two key ways: for the physician, the simulation engine and software allows a rapid and precise way to narrow down the patient’s choices to a handful of Motiva Implant sizes that will yield the patient’s desired look, and for the patient, the ability to see a rendered simulation of her own body increases the level of confidence that a surgery will achieve her aesthetic goals.
We believe that the addition of a Divina system to a clinic can facilitate an increase in the number of patients who proceed from a consultation to a surgical procedure. We intend to make the sale of Divina systems a key component of our sales and marketing strategy going forward.
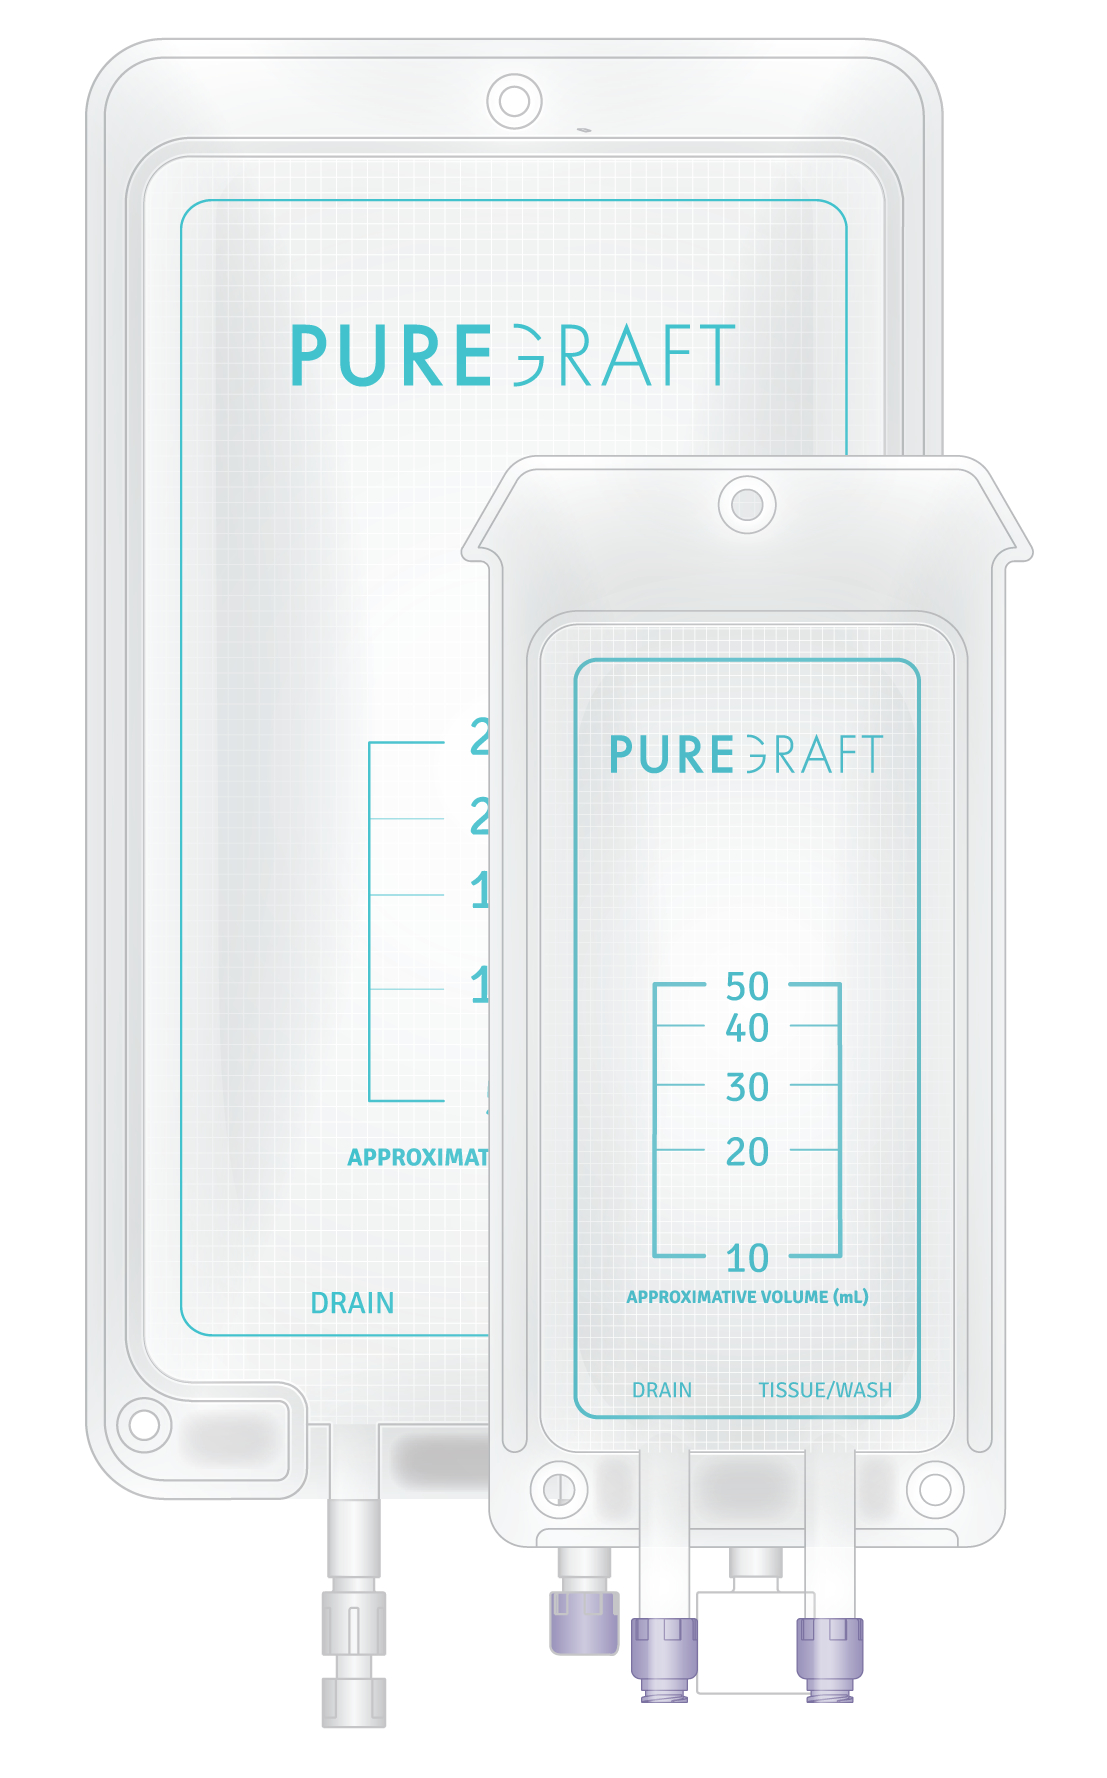
Puregraft and Tulip - Autologous Fat Augmentation
Adipose (fat) tissue removed from one area of a patient’s body can be re-injected under the skin of the face, breasts, or in other areas where augmentation and shaping are desired. In the breast augmentation context, there is an unmet need for predictable contouring around the edges of the breast, both with and without volume augmentation via silicone implants. Puregraft LLC’s line of products provides surgeons with a tool for additional contouring around breast implants, which we call MotivaHybrid when used in combination with Motiva Implants and a 3D pre-surgical scan using our Divina system or another 3D scanning system.
In an independent study by Gerth et al. reported in the peer-reviewed
Aesthetic Surgery Journal
in 2014 conducted between November 2010 and November 2012, 26 patients that had received autologous adipose tissue grafts for facial contouring processed via Puregraft had significantly higher long-term retention of volume when compared to 33 patients that had received grafts processed using conventional means, with statistical significance being determined by a p-value of 0.03. In another independent study conducted by Sforza et al. at Dolan Park Hospital published in the
Aesthetic Surgery Journal
in 2016, in the breast augmentation setting, a clinical study of 26 patients, whose implant procedures were subsequently enhanced with Puregraft-enabled grafts between April 2013 and October 2014, resulted in approximately 73% of fat volume being retained by patients at one year, and 96% of patients reported satisfaction with the outcome. We believe these results illustrate the benefits of Puregraft versus other conventional means of extracting and purifying adipose tissue.
10
In September 2016, we became the exclusive distributors, outside the
United States
and Canada, of the Puregraft line of products for autologous adipose tissue harvesting and redistribution. Puregraft LLC currently sells its products in the
United States
and Canada itself. These devices are CE Marked for sale outside the
United States
and Canada, and hold a 510(k) clearance for sale in the
United States.
The initial term of our distribution agreement with Puregraft ends in September 2019, but we have the ability to renew the agreement at the end of the initial term if we wish to do so and meet certain minimum purchase requirements.
These procedures require a cannula for tissue extraction and reinsertion, and we also sell a special cannula for this purpose made by Tulip Medical Products. This cannula is differentiated by its proprietary rounded shape and low-friction coating, which are aimed at reducing trauma to the patient or implant during the procedure.
MotivaImagine Centers
We utilize our MotivaImagine Center initiative, which are collaborations with plastic surgery clinics whereby we provide them with access to our technologies and the ability to brand themselves as a MotivaImagine Center. In exchange for these services and use of the Motiva branding, each MotivaImagine Center commits to use Motiva Implants and other products in the MotivaImagine product platform. Before certifying a MotivaImagine Center, we ensure that the center offers:
|
▪
|
either our Divina or AX3 3D simulator, or a third party cloud-based visualization software that we sell in partnership with Crisalix systems;
|
|
▪
|
access to the full suite of MotivaImagine products that complement Motiva Implants;
|
|
▪
|
surgical staff trained by Establishment Labs in the optimal use of MotivaImagine products; and
|
|
▪
|
branding and design elements, according to company guidelines, that are intended to create a more luxurious and reassuring experience for patients.
|
Since 2016, we have partnered with a number of independent clinics outside the United States that elected to become MotivaImagine Centers, and we are pursuing enrollment of additional centers as a key component of our sales and marketing strategy. We intend to utilize the network of MotivaImagine Centers as a channel for other future aesthetic surgical products on our MotivaImagine platform.
Branded Surgeries
Our suite of products and technologies enables surgical techniques that we intend to develop and promote as “branded surgeries.” Our first such branded surgery, MotivaHybrid, combines 3D pre-surgical assessment of existing breast tissue volume using either our Divina system or another 3D scanning system, together with Motiva Implants and Puregraft autologous adipose tissue grafts. The MotivaHybrid method is designed to enable surgeons to optimize silicone volume using Motiva Implants and balance the ratio of silicone to tissue with additional contouring using Puregraft for more natural balanced results and improved patient satisfaction. Our second branded surgery, Motiva MinimalScar, allows surgeons to significantly reduce the size of the surgical incision. We are also developing Motiva Minimally Invasive Natural Technique, or Motiva MINT — a family of branded surgeries that we anticipate will allow breast augmentation through small incisions. We intend for Motiva MINT to allow breast augmentation procedures to be performed under local anesthesia rather than general anesthesia, with faster recovery times and a resulting reduction of surgical complications. The implants associated with Motiva MINT have been developed, and were submitted for the CE marking process in 2018. Instruments and special devices for the Motiva MINT procedure are currently being prototyped and tested and will require regulatory approval prior to commercialization. We believe Motiva MINT will be able to attract new customers and expand the market for breast aesthetic procedures.
Our Clinical Data
8-Year Safety Postmarket Surveillance Data
Dating from the commercial launch of Motiva Implants in October 2010 through December 2018, we have sold over
650,000
breast implants in various countries outside the
United States
and Canada. We maintain a Quality Management System database to log all complaints received from patients or physicians. Since 2010, a total of
516
complaints have been reported, investigated and processed, representing less than
0.1%
of the total patients who have received Motiva Implants through December 2018. There were no reported cases of late seroma, double capsule formation or anaplastic large-cell lymphoma, or ALCL, in this data set, and there were
six
cases of seroma. The table below shows the rates of rupture, capsular contracture and reoperation for adverse events of our Motiva Implants from the data gathered through December 2018. In contrast to the above competitor data, our data is self-reported rather than collected at mandatory follow-ups and was generated solely for our post-market
11
surveillance instead of in connection with the FDA PMA study. All of these patients were located outside the
United States.
|
Motiva Implants
|
||
|
Number of Implants
|
N=650,078 Implants
(1)
|
|
|
Rupture
|
< 0.1%
|
|
|
Capsular Contracture
|
< 0.1%
|
|
|
Reoperation for Adverse Events
|
< 0.1%
|
|
|
Reoperation (All Causes)
|
N/A
(2)
|
|
|
(1) Data is internally tracked on an individual implant basis rather than by patient.
|
||
|
(2) Complaint database does not capture reoperations for reasons not related to safety.
|
||
Independent Clinical Experience
An independent study by Sforza et al., published in the peer-reviewed
Aesthetic Surgery Journal
in 2017, conducted at a single center, the Hospital Group Ltd.’s Dolan Park Clinic, or Dolan Park, in Bromsgrove, England, between April 2013 and April 2016, reported 5,813 consecutive cases of breast augmentation with Motiva Implants. This independent study was commissioned by Dolan Park’s medical director, Dr. Sforza, who is also a member of our medical advisory board and receives compensation from us in such capacity. The study, conducted by a group of 16 plastic surgeons at Dolan Park, reported overall rates of complication and reoperation of 0.76% over an interval of three years. We have also entered into a long-term supply agreement for our products with Dolan Park. There were no serious adverse events and no cases of implant rupture for device failure, capsular contracture (Baker III/IV) in primary cases, double capsules, or late seromas. The authors presented consistent real-world data and believe that their free, three year aftercare system is a strong method for patient retention and follow-up by eliminating any financial limitations for patients to return for follow-up consultations if any issues occur. Anecdotally, the same group of surgeons utilizing the same aftercare system for the last seven years reported substantially different results utilizing other types of silicone breast implants (i.e., non-Motiva Implants). The overall revision rate for this group from 2010 to 2013 utilizing a different, macro-textured, FDA approved implant (N > 10,000) was 8.43%, which is more than 10 times higher than the rate for Motiva Implants reported in this analysis.
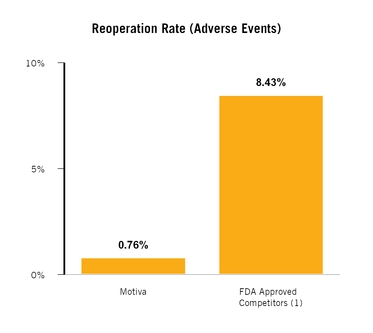
(1) Names of FDA approved competitors have not been published.
12
Study To Support a PMA
We have started conducting a prospective IDE clinical trial in the
United States
. Our IDE request was approved by the FDA on March 20, 2018 to perform a single open-label, multi-center trial, with follow-up visits available at the time of filing. We will continue to monitor patients for ten years post-implantation. The primary endpoints of the trial will be safety, effectiveness and patient satisfaction. In general, our trial design and patient enrollment are consistent with prior PMA studies conducted by Allergan, Mentor, and Sientra. Our first patient was enrolled in the clinical trial on April 6, 2018, and we anticipate completing enrollment in Q2 2019. We plan to enroll 800 patients in the study across 40 sites in the United States, Germany, Sweden and the United Kingdom.
Sales and Marketing
We primarily derive revenue from sales of our Motiva implants from two types of customers: (1) medical distributors and (2) direct sales to physicians, hospitals, and clinics. We currently sell our products in over 60 countries through exclusive distributors, except in Brazil and several European countries where we sell through our direct sales force. As of
December 31, 2018
, our sales organization included
67
employees and contractors. All of these sales personnel are supported through a suite of tools, including marketing and training materials, mobile smartphone applications, and access to a robust schedule of physician education events. We also apply significant attention to helping our distributors maintain positive relationships with surgeons and clinics in their respective regions, and to positioning our product in the marketplace as a premium product with consequent premium pricing.
We demonstrate our confidence in Motiva Implants with the Motiva Always Confident Warranty, which offers patients a free replacement for any Motiva Implant that ruptures, for the life of the product. We also replace any implant which is replaced due to capsular contracture of Baker Grade III or IV severity at any time in the first 10 years post-implantation. We also offer an extra-cost extended warranty, which provides financial assistance of up to $2,500 to cover surgical costs resulting from rupture or capsular contracture.
We employ a multi-faceted marketing strategy that includes social media engagement, conferences, advertisements and education.
Intellectual Property
Our success depends at least in part upon our ability to protect our core technology and intellectual property. To accomplish this, we rely on a combination of intellectual property rights, including patents, trade secrets and trademarks, as well as customary contractual protections.
We have assembled a broad portfolio of intellectual property related to our medical device and aesthetics products. We believe this intellectual property, combined with proprietary manufacturing processes and the regulatory approvals we have successfully obtained outside of the
United States
, provides us with a strong market position.
As of December 31, 2018, we own or have rights to five issued and 19 pending patents in the United States related to various aspects of our Motiva implants (such as implant barrier layers, surface texture technology, minimally invasive implant delivery systems, and our QInside Safety Technology radio frequency identification devices). In addition, we own or have rights to two issued and 38 pending foreign applications and one pending Patent Cooperation Treaty, or PCT, application.
Our owned and licensed patents are expected to expire at various times between March 2026 and September 2034. Our owned and licensed pending applications, if granted, likely would expire between April 2027 and October 2037.
In addition to pursuing patents on our products, we have taken steps to protect our intellectual property and proprietary technology by entering into confidentiality agreements and intellectual property assignment agreements with our employees, consultants, corporate partners, and, when needed, our advisors. Such agreements may not be enforceable or may not provide meaningful protection for our trade secrets or other proprietary information in the event of unauthorized use or disclosure or other breaches of the agreements, and we may not be able to prevent such unauthorized disclosure. Monitoring unauthorized disclosure is difficult, and we do not know whether the steps we have taken to prevent such disclosure are, or will be, adequate. In addition, we intend to expand our international operations, and effective patent, copyright, trademark and trade secret protection may not be available or may be limited in foreign countries.
In general, the medical device industry is characterized by the existence of a large number of patents and frequent allegations and related litigation regarding patent and other intellectual property rights. Third parties, including our competitor companies, may assert patent, copyright, trademark and other intellectual property rights against us, our partners or our customers. Our standard license and other agreements may obligate us to
13
indemnify our partners and customers against such claims. We could incur substantial costs and divert the attention of our management and technical personnel in defending against any such claims. Successful claims of infringement by a third party could prevent us from selling or distributing certain products or performing certain services, require us to expend time and resources to develop non-infringing products, or force us to pay substantial damages, including treble damages if we are found to have willfully infringed patents-royalties or other fees. We cannot assure you that we do not currently infringe, or that we will not in the future infringe, upon any third-party patents or other proprietary rights.
Research and Development
Our goal is to continue to improve the existing products on our MotivaImagine platform, as well as develop new products and new branded surgical techniques. We have a highly experienced team and deep customer and key opinion leader relationships. We also have sophisticated internal prototyping and testing equipment. These allow us to invent, develop, test, and commercialize products with in-house resources. As a result, we have introduced four distinct generations of Motiva Implant product since October 2010, with innovative features added to each successive generation. Further, our efforts included work on both a tissue expander for reconstruction and our next generation implant for minimally invasive procedures, which we submitted for CE Mark registration in 2018.
We have and will continue to work with several institutions in our effort to advance implant technology, and generate additional scientific data to support the improved safety outcomes associated with our products, including:
|
▪
|
Massachusetts Institute of Technology
|
|
▪
|
Medical University of Innsbruck
|
|
▪
|
Plastic and Reconstructive Research Center at the University of Manchester
|
|
▪
|
Center for Biofilm Engineering of Montana State University
|
|
▪
|
The Chair of Plastic Surgery at the School of Medicine and Psychology of Sapienza University of Rome
|
|
▪
|
Microscopic Structure Research Center of the University of Costa Rica
|
We have incurred, and expect to continue to incur, significant research and development expenses. Our research and development expenses increased
$5.8 million
, or
84.8%
, to
$12.7 million
for the year ended
December 31, 2018
, compared to
$6.9 million
for the year ended
December 31, 2017
. Our research and development expenses consist of costs associated with our clinical and post-approval studies, regulatory activity and product development, including the development of Motiva Implants and other current and future aesthetic and reconstruction surgical devices on the MotivaImagine platform.
Implantable RFID Microtransponder Platform
The RFID technology platform that we use in the QInside feature of our Motiva Implants is independently cleared as a system via the FDA’s 510(k) pathway. We are developing more sophisticated functionality using this technology platform. We believe our RFID technology will be an attractive platform for a variety of other applications, including unique device identification for other types of implantable medical devices, functional implantable biosensors, and diagnostic monitoring. Future specific indications include detection of device life cycles (e.g. flexion/contraction cycles for artificial hip and knee joints) and monitoring of analytes such as circulating tumor cells and blood chemistry components. Some of these applications we may choose to develop and commercialize internally, while others may be more appropriately commercialized via partnerships with other medical device companies.
We control all the activities of the development and manufacturing of our QInside Safety Technology RFID transponders. This allows us for adapting to specific needs or new developments in our field.
Manufacturing and Suppliers
Facilities
We manufacture our products in ISO-13485-certified manufacturing facilities located in the Coyol Free Zone office park in Costa Rica, a park populated by a number of international medical device companies and granted tax-advantaged status by the government of Costa Rica. Our newest and largest manufacturing facility opened at the end of 2016 and we began shipping manufactured product from this facility in March 2017. This facility has more than 13,000 square feet of office space and production areas which are capable of producing over 400,000 implants a year, with state-of-the-art support systems for sustaining production, including an ice-bank system for cooling the controlled air in the clean room and support areas, water-lubricated air compressors for eliminating the
14
presence of oil particulates, heat recovery systems for energy saving, and an energy micro-grid comprised of solar panels and energy-storage batteries. These energy efficient systems generate up to 80% of the total energy consumption of the building, which received LEED Gold Certification by the U.S. Green Building Council in August 2017. Our initial facility was established in 2009 and has about 3,000 square feet of production areas, capable of producing over 100,000 implants a year.
In July 2017, both facilities received the MDSAP regulatory certification. MDSAP was established by a coalition of international medical device regulatory authorities including Australia’s TGA, Brazil’s ANVISA, Health Canada, Japan’s MHLW and PMDA and the U.S. FDA. The goal of MDSAP is to allow a single regulatory audit of a medical device manufacturer’s Quality Management System to satisfy the needs of the participating regulatory jurisdictions. This program enables manufacturers to contract with an authorized third-party auditing organization, in our case the British Standards Institute, to conduct a single audit to satisfy the relevant regulatory requirements of the participating regulatory authorities including the FDA, which recognizes MDSAP audit reports as a substitute for FDA Establishment Inspection Reports.
We are also subject to periodic inspections and audits by various international regulatory and notified bodies, and we believe our past performance in these audits reflects the strength of our quality system and manufacturing controls. We consider this to be a key element of our risk management and business continuity strategies and a competitive advantage as we have full control of the product life-cycle. Our in-house manufacturing team includes over
300
employees, all of whom undergo well defined training programs throughout their period of employment. We believe our manufacturing experience, know-how, and process-related trade secrets are also a competitive advantage.
Process
We produce our shell surfaces using a novel 3D negative imprinting molding technique that allows much more precise control over feature size, a uniform distribution of features on the surface, no particles creation, and less unit-to-unit variation. Our primary competitors utilize the “salt-loss” technique or “polyurethane foam imprint” technique. The “salt-loss” technique blows crystals of salt or sugar onto the uncured silicone shell in order to produce surface texture and the “polyurethane foam imprint” technique uses a foreign material to press against the last uncured silicone layer to produce surface features. We believe our 3D negative imprinting technique is more efficient and consistent than the techniques used by our competitors because the application of our surface texture is integrated with the molding process, rather than requiring a separate, subsequent process.
Suppliers
We source manufacturing inputs from a number of outside suppliers. In particular, we obtain NuSil brand medical-grade silicone from Avantor (previously NuSil Technology LLC), which is a sole-source supplier of such product to the entire silicone breast implant industry. In 2016, we entered into a new supply agreement with NuSil-Avantor, which provides for specified prices per unit of each relevant component through 2021, with potential extensions beyond that date.
Other critical materials are the silicone patches and other silicone components used for the assembly of our breast implants. All these components are also made with NuSil medical-grade silicone, and manufactured by specialized silicone contract manufacturing suppliers. All component suppliers undergo strict quality inspections to ensure these can meet our quality standard. Other important components are the primary packaging polycarbonate trays, the Tyvek sealing lids and packaging. All these components are also critical to maintain integrity of the product throughout its shelf-life and all these suppliers must be qualified and materials must be validated prior to being approved for manufacturing activities. Most suppliers are evaluated annually and we carry second source supplier activities to ensure business continuity and quality and costs improvement.
Competition
The market for silicone breast implants is relatively concentrated, with Allergan plc and Mentor Worldwide LLC, a division of Johnson & Johnson. In the
United States
, Sientra, Inc. is the only other company with an approved silicone implant product. Internationally, the market is more fragmented, with GC Aesthetics plc, Silimed, Inc., Groupe Sebbin SAS, Hans Biomed Crop., Polytech Health & Aesthetics, and Arion Laboratories.
Our major competitors in the silicone marketplace are either publicly-traded companies or divisions or subsidiaries of publicly-traded companies with significantly more market share and resources than we have. These companies have greater financial resources for sales, marketing and product development, broader established relationships with health care providers and third-party payors, and larger and more established distribution networks. In some
15
instances, our competitors also offer products that include features that we do not currently offer in all geographies
.
Our competitors also have regulatory approval to market and sell their products in countries where we currently do not, notably the
United States
. In addition, our competitors may offer pricing programs with discounts across their non-breast aesthetic product portfolios.
We also face potential future competition from a number of companies, medical researchers and existing medical device companies that may be pursuing new implant technologies. These include non-implant breast augmentation through injections of autologous adipose tissue, new material technologies such as synthetic fillers, and new methods of enhancing and reconstructing the breast.
We believe the primary competitive factors in our current and future markets include:
|
▪
|
safety and outcomes data generated in clinical studies;
|
|
▪
|
regulatory approvals;
|
|
▪
|
technological characteristics of products;
|
|
▪
|
complementary platforms of non-implant products, such as facial fillers and fat grafting technologies;
|
|
▪
|
product price;
|
|
▪
|
customer service; and
|
|
▪
|
support by key opinion leaders.
|
Federal Food, Drug, and Cosmetic Act
Breast implants are regulated as Class III medical devices in the
United States
, and are subject to the Federal Food, Drug, and Cosmetic Act as implemented and enforced by the FDA. The FDA administers requirements covering the design, development, testing, safety, effectiveness, manufacturing, labeling, promotion, advertising, distribution, and postmarket surveillance of medical devices. Medical devices are classified as Class I (lowest risk), II (moderate risk), or III (highest risk). Unless an exemption applies or the product is a Class I device, each medical device that we market must first receive either premarket notification clearance (by filing a 510(k) submission) or premarket approval (by filing a PMA) from the FDA. Breast implants are currently classified as Class III devices requiring an approved PMA for commercial distribution. In addition, certain modifications made to marketed devices also may require 510(k) clearance or approval of a PMA supplement.
The process of obtaining FDA clearance or approval of a medical device can be lengthy and costly. The FDA’s 510(k) clearance process usually takes from three to twelve months, but it can take longer. The process of obtaining PMA approval is much more costly, lengthy, and uncertain, and is generally preceded by the conduct of pre-clinical testing and a well-controlled clinical study. The FDA’s guidance document “Saline, Silicone Gel, and Alternative Breast Implants” currently recommends that a core study, which can be a single, open label, multi-center study, be conducted with ten years or more of prospective patient follow-up. To date, PMAs for silicone breast implants have been submitted for approval to the FDA with a minimum of three years of premarket core study data. Additionally, the FDA will not approve the PMA until it conducts a pre-approval inspection of our manufacturing facility and determines that it is in compliance with good manufacturing practices, as set forth in the FDA’s Quality System Regulation or QSR. The PMA review and approval process generally takes from one to three years, but may take longer. The FDA’s guidance document “Saline, Silicone Gel, and Alternative Breast Implants” also states that manufacturers seeking approval of breast implants will be subject to post-approval requirements, which may include, but are not limited to, long-term follow-up of the core clinical study patients, conduct of separate post-approval studies, participation in a patient registry or other studies, and training programs for physicians and surgeons, and periodic reporting requirements.
In addition to regulations governing 510(k) and PMA submissions, we are subject to regulations governing the conduct of clinical investigations, including regulations related to informed consent, Institutional Review Board review and approval, Good Clinical Practices, or GCPs, and labeling of investigational devices. Our clinical study sites are subject to possible inspection by the FDA. We received an IDE approval from the FDA in March 2018, to initiate a clinical trial and our first patient was enrolled in April 2018.
When we initiate commercial distribution of our devices in the
United States
, we will be subject to FDA device listing and establishment registration, good manufacturing practice requirements as set forth in the QSR, labeling requirements, reporting of adverse events and device malfunctions, post-approval restrictions or conditions, post-market surveillance requirements, and reporting requirements for product recalls, or corrections or removals in the field. Our manufacturing facilities, as well as those of certain of our suppliers, will be subject to periodic and for-cause inspections by the FDA to verify compliance with the QSR and other regulatory requirements.
16
HIPAA and Other Privacy Laws
The Health Insurance Portability and Accountability Act of 1996, or HIPAA, established for the first time comprehensive protection for the privacy and security of protected health information. HIPAA standards apply to three types of organizations, or “Covered Entities”: certain health plans, health care clearing houses, and health care providers which conduct certain health care transactions electronically. Covered Entities and their “Business Associates”: entities that perform services on behalf of a Covered Entity that involves the creation, use, maintenance or disclosure of protected health information, must have in place administrative, physical, and technical standards to guard against the misuse of protected health information. Some of the institutions and physicians from which we obtain biological specimens that we use in our research and validation work are Covered Entities and must obtain proper authorization from their patients for the subsequent use of those samples and associated clinical information. We may perform future activities that may implicate HIPAA, such as providing clinical laboratory testing services or entering into specific kinds of relationships with a Covered Entity or a Business Associate of a Covered Entity.
Additionally, the Health Information Technology for Economic and Clinical Health Act, enacted as part of the American Recovery and Reinvestment Act of 2009 amended HIPAA by increasing the civil and criminal penalties that may be imposed against Covered Entities, their Business Associates and possibly other persons, and gave state attorneys general new authority to file civil actions for damages or injunctions in federal courts to enforce the federal HIPAA laws and seek attorney’s fees and costs associated with pursuing federal civil actions.
Our activities must also comply with other applicable privacy laws. For example, there are also international privacy laws that impose restrictions on the access, use, and disclosure of health information. All of these laws may impact our business. If we fail to comply with these privacy laws, or if significant changes in the laws restrict our ability to obtain tissue samples and associated patient information, this could significantly impact our business and our future business plans.
Federal and State Billing and Fraud and Abuse Laws
Antifraud Laws/Overpayments
As participants in national and state health care programs, we may be subject to numerous national and state antifraud and abuse laws in various countries. Many of these antifraud laws are broad in scope, and neither the courts nor government agencies have extensively interpreted these laws. Prohibitions under some of these laws include:
|
▪
|
the submission of false claims or false information to government programs;
|
|
▪
|
deceptive or fraudulent conduct;
|
|
▪
|
excessive or unnecessary services or services at excessive prices; and
|
|
▪
|
prohibitions in defrauding private sector health insurers.
|
One of these statutes, the federal False Claims Act, is a key enforcement tool used by the government to combat health care fraud. The federal False Claims Act imposes liability on any person who, among other things, knowingly presents, or causes to be presented, a false or fraudulent claim for payment by a federal health care program. In addition, violations of the federal physician self-referral laws, such as the Stark laws discussed below, may also violate false claims laws.
Numerous federal and state agencies enforce the antifraud and abuse laws. In addition, private insurers may also bring private actions. In some circumstances, private whistleblowers are authorized to bring fraud suits on behalf of the government against providers and are entitled to receive a portion of any final recovery.
Federal and State “Self-Referral” and “Anti-kickback” Restrictions
Self-Referral Law
We will be subject to a federal “self-referral” law, commonly referred to as the “Stark” law, which provides that physicians who, personally or through a family member, have ownership interests in or compensation arrangements with a laboratory are prohibited from making a referral to that laboratory for laboratory tests reimbursable by Medicare, and also prohibits laboratories from submitting a claim for Medicare payments for laboratory tests referred by physicians who, personally or through a family member, have ownership interests in or compensation arrangements with the testing laboratory. The Stark law contains a number of specific exceptions which, if met, permit physicians who have ownership or compensation arrangements with a testing laboratory to make referrals to that laboratory and permit the laboratory to submit claims for Medicare payments for laboratory
17
tests performed pursuant to such referrals. The Stark law contains similar prohibitions and exceptions with respect to referrals by physicians for other designated health services to entities in which the referring physician has a financial interest.
We will be subject to comparable state laws, some of which apply to all payors regardless of source of payment, and do not contain identical exceptions to the Stark law.
Anti-Kickback Statute
The federal Anti-Kickback Statute prohibits persons from knowingly and willfully soliciting, receiving, offering or paying remuneration, directly or indirectly, to induce either the referral of an individual, or the furnishing, recommending, or arranging for a good or service, for which payment may be made under a federal health care program, such as the Medicare and Medicaid programs. The term “remuneration” is not defined in the federal Anti-Kickback Statute and has been broadly interpreted to include anything of value, including for example, gifts, discounts, the furnishing of supplies or equipment, credit arrangements, payments of cash, waivers of payment, ownership interests and providing anything at less than its fair market value. The reach of the federal Anti-Kickback Statute was also broadened by the Patient Protection and Affordable Care Act of 2010, as amended by the Health Care and Education Reconciliation Act, or PPACA, which, among other things, amended the intent requirement of the federal Anti-Kickback Statute and certain criminal health care fraud statutes . Pursuant to the statutory amendment, a person or entity does not need to have actual knowledge of this statute or specific intent to violate it in order to have committed a violation. In addition, PPACA provides that a claim including items or services resulting from a violation of the federal Anti-Kickback Statute constitutes a false or fraudulent claim for purposes of the federal False Claims Act or the civil monetary penalties statute, which imposes penalties against any person who is determined to have presented or caused to be presented a claim to a federal health program that the person knows or should know is for an item or service that was not provided as claimed or is false or fraudulent.
The OIG has criticized a number of the business practices in the clinical laboratory industry as potentially implicating the federal Anti-Kickback Statute, including compensation arrangements intended to induce referrals between laboratories and entities from which they receive, or to which they make, referrals. In addition, the OIG has indicated that “dual charge” billing practices that are intended to induce the referral of patients reimbursed by federal health care programs may violate the federal Anti-Kickback Statute.
Many states have also adopted laws similar to the federal Anti-Kickback Statute, some of which apply to the referral of patients for health care items or services reimbursed by any source, not only the Medicare and Medicaid programs, and do not contain identical safe harbors. For example, North Carolina has an anti-kickback statute that prohibits health care providers from paying any financial compensation for recommending or securing patient referrals. Penalties for violations of this statute include license suspension or revocation or other disciplinary action. Other states have similar anti-kickback prohibitions.
Both the federal Anti-Kickback Statute and the North Carolina anti-kickback law are broad in scope. The anti-kickback laws clearly prohibit payments for patient referrals. Under a broad interpretation, these laws could also prohibit a broad array of practices involving remuneration where one party is a potential source of referrals for the other.
Federal and State Transparency Laws
Beginning in August 2013, the Physician Payment Sunshine Act, enacted as part of PPACA, and its implementing regulations requires certain medical device manufacturers to track certain financial arrangements with physicians and teaching hospitals, including any “transfer of value” made or distributed to such entities, as well as any investment interests held by physicians and their immediate family members. Manufacturers are required to report this information to the U.S. Department of Health and Human Services, or HHS, on an annual basis. Various states have also implemented regulations prohibiting certain financial interactions with health care professionals or mandating public disclosure of such financial interactions. We may incur significant costs to comply with such laws and regulations now or in the future.
If we or our operations are found to be in violation of any of the laws described above or any other governmental regulations that apply to us, we may be subject to penalties, including civil, criminal and administrative penalties, damages, fines, exclusion from participation in U.S. federal or state health care programs, additional reporting and government oversight, and the curtailment or restructuring of our operations. To the extent that any product we make is sold in a foreign country in the future, we may be subject to similar foreign laws and regulations, which may include, for instance, applicable post-marketing requirements, including safety surveillance, anti-fraud
18
and abuse laws, and implementation of corporate compliance programs and reporting of payments or transfers of value to health care professionals. To reduce the risks associated with these various laws and governmental regulations, we have implemented a compliance plan. Although compliance programs can mitigate the risk of investigation and prosecution for violations of these laws, the risks cannot be entirely eliminated. Any action against us for violation of these laws, even if we successfully defend against it, could cause us to incur significant legal expenses and divert our management’s attention from the operation of our business. Moreover, achieving and sustaining compliance with applicable federal and state privacy, security and fraud laws may prove costly.
International Medical Device Regulations
International marketing of medical devices is subject to foreign government regulations, which vary substantially from country to country. The European Commission is the legislative body responsible for directives, including Directive 93/42/EEC which, once implemented in each member state, must be complied with by manufacturers selling medical products in the EU and the European Economic Area, or EEA. The EU includes most of the major countries in Europe, while other countries, such as Norway and Switzerland, are part of the EEA and European Free Trade Area, or EFTA, respectively, and have voluntarily adopted laws and regulations that mirror those of the EU with respect to medical devices. The EU directives address regulation of the design, manufacture, labeling, clinical studies and post-market vigilance for medical devices. Devices that comply with the requirements of a relevant directive will be entitled to bear the CE conformity marking, indicating that the device conforms to the essential requirements of the applicable directives and, accordingly, can be marketed throughout the EU and EEA.
Outside of the EU, regulatory pathways for the marketing of medical devices vary greatly from country to country. In many countries, local regulatory agencies conduct an independent review of medical devices prior to granting marketing approval. For example, in China, approval by the SFDA must be obtained prior to marketing an medical device. In Brazil, the inspections and approvals of products and facilities carried out by the ANVISA and InMetro agencies are required prior to marketing a Class 3a medical device like our Motiva Implants. We received regulatory clearance in Brazil in March 2017 and launched our Motiva Implants commercially in July 2017. The process in such countries may be lengthy and require the expenditure of significant resources, including the conduct of clinical trials. In other countries, the regulatory pathway may be shorter or less costly. The timeline for the introduction of new medical devices is heavily impacted by these various regulations on a country-by-country basis, which may become longer and more costly over time.
U.S. Health Care Reform
In March 2010, the PPACA was enacted, which includes measures that have or will significantly change the way health care is financed by both governmental and private insurers. The PPACA contains a number of provisions, including those governing enrollment in federal health care programs, reimbursement changes and fraud and abuse measures, all of which will impact existing government health care programs and will result in the development of new programs. The PPACA, among other things, could result in the imposition of injunctions and imposes a tax of 2.3% on the retail sales price of medical devices sold after December 31, 2012. This tax may apply to Motiva Implants and some or all of our products which are in development. The excise tax has been temporarily suspended through the end of 2019, but will be reinstated in 2020 without additional Congressional action.
Some provisions of the PPACA have yet to be implemented, and there have been judicial and Congressional challenges to certain aspects of the PPACA, as well as recent efforts to repeal or replace certain aspects of the PPACA. While Congress has not passed comprehensive repeal legislation, we expect there will be additional challenges and amendments to the PPACA in the future.
In addition, other legislative changes have been proposed and adopted since the PPACA was enacted. For example, the Budget Control Act of 2011, among other things, created the Joint Select Committee on Deficit Reduction to recommend proposals for spending reductions to Congress. The Joint Select Committee did not achieve a targeted deficit reduction of at least $1.2 trillion for the years 2013 through 2021, which triggered the legislation’s automatic reduction to several government programs, including aggregate reductions to Medicare payments to providers of up to 2% per fiscal year, starting in 2013, which , due to subsequent legislative amendments to the statute, including the Bipartisan Budget Act of 2018, will remain in effect through 2027 unless additional Congressional action is taken. In January 2013, former President Obama signed into law the American Taxpayer Relief Act of 2012, or the ATRA, which delayed for another two months the budget cuts mandated by the sequestration provisions of the Budget Control Act of 2011. The ATRA, among other things, also reduced Medicare payments to several providers, including hospitals, and increased the statute of limitations period for the
19
government to recover overpayments to providers from three to five years. In March 2013, former President Obama signed an executive order implementing sequestration, and in April 2013, the 2% Medicare reductions went into effect. We cannot predict whether any additional legislative changes will affect our business.
The Foreign Corrupt Practices Act
The Foreign Corrupt Practices Act of 1977, as amended, or the FCPA, prohibits any U.S. individual or business from paying, offering or authorizing payment or offering of anything of value, directly or indirectly, to any foreign official, political party or candidate for the purpose of influencing any act or decision of the foreign entity in order to assist the individual or business in obtaining or retaining business. The FCPA also obligates companies whose securities are listed in the
United States
to comply with accounting provisions requiring us to maintain books and records that accurately and fairly reflect all transactions of the corporation, including international subsidiaries, and to devise and maintain an adequate system of internal accounting controls for international operations.
Environment
Our manufacturing processes currently require the controlled use of potentially harmful chemicals, including highly flammable solvents and we are subject to inspections and other regulatory requirements, including Costa Rican regulations regarding environmental protection and hazardous and controlled substance controls, among others. Environmental laws and regulations are complex, change frequently and have tended to become more stringent over time. We have incurred, and may continue to incur, significant expenditures to ensure we are in compliance with these laws and regulations. We would be subject to significant penalties for failure to comply with these laws and regulations. For more information, please refer to Section 1A “Risk Factors”.
Employees
As of
December 31, 2018
, we had
505
employees. None of our employees are represented by a labor union or covered by collective bargaining agreements except for employees in Brazil.
ITEM 1A. RISK FACTORS
Investing in our common shares involves a high degree of risk. The following risk factors describe circumstances or events that could have a negative effect on our business, financial condition or operating results. You should consider the following risks carefully, together with all the other information in this Annual Report on Form 10-K, including our consolidated financial statements and notes thereto, before you invest in our common shares. If any of the following risks occur, our business, financial condition, or operating results, could be adversely affected. As a result, the trading price of our common shares could decline and you could lose part or all of your investment. Additional risks and uncertainties not currently known to us or that we currently believe are not material could also impair our business, financial condition or operating results.
Risks Related to the Development and Commercialization of Our Products
We expect to incur losses for the foreseeable future, and our ability to achieve and maintain profitability depends on the commercial success of our Motiva Implants, which accounted for approximately
92%
and
80%
of our revenues for the years ended December 31, 2018 and 2017, respectively, and we expect our revenues to continue to be driven primarily by sales of these products.
We have incurred losses to date and expect to continue to incur losses for the foreseeable future. Sales of our Motiva Implants accounted for approximately
92%
and
80%
of our revenues for the years ended December 31, 2018 and 2017, respectively, and we expect our revenues to continue to be driven primarily by sales of these products. In order to achieve and sustain profitability, our revenues from these products will need to grow beyond the levels we have achieved in the past. If physicians and/or patients do not perceive our products to be competitive in features and safety when compared to other products in the market, or if demand for our Motiva Implants or for breast implants in general decreases, we may fail to achieve sales levels that provide for future profitability.
Our ability to successfully market Motiva Implants and our other current and future offerings depends on numerous factors, including but not limited to:
|
•
|
the outcomes of current and future clinical studies of Motiva Implants, including our ongoing PMA clinical trial, to demonstrate our products’ value in improving safety outcomes and/or patient satisfaction;
|
|
•
|
acceptance of Motiva Implants as safe and effective by patients, caregivers and the medical community;
|
20
|
•
|
an acceptable safety profile of Motiva Implants in the global market;
|
|
•
|
whether key thought leaders in the medical community accept that such clinical studies are sufficiently meaningful to influence their or their patients’ choices of product;
|
|
•
|
maintenance of our existing regulatory approvals and expansion of the geographies in which we have regulatory approvals;
|
|
•
|
commercially viable processes at a scale sufficient to meet anticipated demand at an adequate cost of manufacturing, and that are compliant with ISO 13485 Quality Management System requirements and/or good manufacturing practice, or GMP, requirements, as set forth in the FDA’s Quality System Regulation, Brazilian and other international regulations;
|
|
•
|
our success in educating physicians and patients about the benefits, administration and use of Motiva Implants, Motiva branded surgeries and value proposition of our MotivaImagine Centers;
|
|
•
|
the successful implementation of our MotivaImagine Centers with plastic surgery clinics;
|
|
•
|
the availability, perceived advantages, relative cost, relative safety and relative efficacy of alternative and competing treatments;
|
|
•
|
the willingness of patients to pay out-of-pocket for breast augmentation and reconstruction procedures in the absence of coverage and reimbursement for such procedures;
|
|
•
|
the success of our internal sales and marketing organization and the sales forces of our distributors; and
|
|
•
|
continued demand for breast augmentation and reconstruction procedures using silicone implants, which may be adversely affected by events involving either our products or those of our competitors, including FDA warnings to patients regarding Breast Implant-Associated Anaplasic Large Cell Lymphoma, or BIA-ALCL.
|
Some of these factors are beyond our control. If we are unable to continue to commercialize Motiva Implants and our other products, or unable to obtain a partner to commercialize them, we may not be able to produce any incremental revenues related to Motiva Implants and our other products. This would result in an adverse effect on our business, financial condition, results of operations and growth prospects.
We have a limited operating history and may face difficulties encountered by companies early in their commercialization in competitive and rapidly evolving markets.
Our Motiva Implants have been marketed in countries outside of the United States since October 2010, and as such, we have a limited operating history upon which to evaluate our business and forecast our future net sales and operating results. In assessing our business prospects, you should consider the various risks and difficulties frequently encountered by companies early in their commercialization in competitive markets, particularly companies that develop and sell medical devices. These risks include our ability to:
|
•
|
implement and execute our business strategy;
|
|
•
|
expand and improve the productivity of our direct sales force, distributors and marketing programs to grow sales of our existing and proposed products;
|
|
•
|
increase awareness of our brands and build loyalty among plastic surgeons and patients;
|
|
•
|
manage expanding operations;
|
|
•
|
respond effectively to competitive pressures and developments;
|
|
•
|
enhance our existing products and develop new products;
|
|
•
|
obtain regulatory clearance or approval to enhance our existing products and commercialize new products;
|
|
•
|
respond to changing regulations associated with medical devices across all geographies;
|
|
•
|
perform clinical trials with respect to our existing products and any new products;
|
|
•
|
attract, retain and motivate qualified personnel in various areas of our business; and
|
|
•
|
obtain and maintain coverage and adequate levels of reimbursement for our products.
|
21
Due to our limited operating history, we may not have the institutional knowledge or experience to be able to effectively address these and other risks that we may face. In addition, we may not be able to develop insights into trends that could emerge and negatively affect our business and may fail to respond effectively to those trends. As a result of these or other risks, we may not be able to execute key components of our business strategy, and our business, financial condition and operating results may suffer.
Our business depends on maintaining our brand and ongoing customer demand for our products and services, and a significant reduction in sentiment or demand could affect our results of operations.
Our success depends on the reputation of our brands, which depends on factors such as the safety and quality of our products, our communication activities, including marketing and education efforts, and our management of our customer experience. Maintaining, promoting and positioning our brands is important to expanding our customer base. This will depend largely on the success of our education and marketing efforts and our ability to provide a consistent, high-quality customer experience.
We may need to make substantial investments in the areas of education and marketing in order to maintain and enhance our brands. Ineffective marketing, negative publicity, significant discounts by our competitors, product defects and related liability litigation, failure to obtain regulatory clearance for our products, counterfeit products, unfair labor practices and failure to protect the intellectual property rights in our brands are some of the potential threats to the strength of our business. To protect our brands’ status, we may need to make substantial expenditures to mitigate the impact of such threats.
We believe that maintaining and enhancing our brands in the countries in which we currently sell our products and in new countries where we have limited brand recognition is important to expanding our customer base. If we are unable to maintain or enhance the strength of our brands in the countries in which we currently sell our products and in new countries, then our growth strategy could be adversely affected.
Our success depends, in part, on our ability to continue to enhance our existing products and services and develop or commercialize new products and services that respond to customer needs and preferences, which we expect will require us to incur significant expenses.
In recent years, we have incurred significant costs in connection with the development of Motiva Implants, the MotivaImagine platform, including the Divina 3D simulation system, and other products and services. We expect our research and development expenses to increase significantly in 2019 and beyond, as we continue with our IDE clinical trial in the United States. We will also incur significant expenses to expand our sales and marketing organization to support sales of Motiva Implants, including but not limited to a direct sales force in Brazil and several European countries, as well as Puregraft and MotivaImagine products outside the United States and Canada. We intend to utilize a portion of the net proceeds from our IPO to cover these additional expenses.
We may not be able to compete effectively with our competitors, and ultimately satisfy the needs and preferences of our customers, unless we can continue to enhance existing products and develop or acquire new innovative products and services. Product development requires the investment of significant financial, technological and other resources. Product improvements and new product introductions also require significant planning, design, development and testing at the product and manufacturing process levels. We may not be able to timely or effectively develop product improvements or new products and services. Likewise, we may not be able to acquire new products on terms that are acceptable to us, or at all. Furthermore, in most countries, we need to obtain regulatory approval in order to market and sell our products, which may limit our ability to act quickly in scaling commercialization in those countries, including the United States. Our competitors’ new products may beat our products to market, be more effective or safer or have new features, obtain better market acceptance or render our products and services obsolete. Any new or modified products and services that we develop may not receive regulatory clearance or approval, or achieve market acceptance or otherwise generate any meaningful sales or profits for us.
Pricing pressure from customers and our competitors may impact our ability to sell our products at prices necessary to support our current business strategies and future expansion.
The industry environment for silicone implants and complementary products in certain international markets is price-sensitive. In these markets, or in the United States if we are successful in obtaining the required regulatory approval to sell in the U.S. market, our competitors may adopt aggressive pricing strategies to intensify the competitive pricing pressure for breast implants. If we are not successful in educating customers or third-party
22
payors of the differentiation of our Motiva Implants as compared to our competitors’ products, customers may choose our competitors’ products. Additionally, as more competitors introduce products that compete with ours, we may face additional pricing pressure that would adversely impact our future results.
A substantial proportion of our sales are through exclusive distributors, and we do not have direct control over the efforts these distributors may use to sell our products. If our relationships with these third-party distributors deteriorate, or if these third-party distributors fail to sell our products or engage in activities that harm our reputation, or fail to adhere to medical device regulations, our financial results may be negatively affected.
Historically, our sales model has been to sell primarily through distributors rather than through our own sales force, with the notable exception of Brazil and several European countries where we are selling directly, but, in the future, may utilize a hybrid sales model that includes both distributors and a direct sales effort. We believe that our reliance on distributors improves the economics of our business, as we do not carry the high fixed costs of a direct sales force in many of the countries in which our Motiva Implants are sold. If we are unable to maintain or enter into such distribution arrangements on acceptable terms, or at all, we may not be able to successfully commercialize our products in certain countries. Furthermore, distributors can choose the level of effort that they apply to selling our products relative to others in their portfolio. The selection, training, and compensation of a distributors’ sales personnel are within their control rather than our own and may vary significantly in quality from distributor to distributor.
In addition, although our contract terms require our distributors to comply with all applicable laws regarding the sale of our products, including anti-competition, anti-money laundering, and sanctions laws, we may not be able to ensure proper compliance. If our distributors fail to effectively market and sell our products in full compliance with applicable laws, our results of operations and business may suffer.
In certain large markets, we engage in direct sales efforts. We may fail to maintain and develop our direct sales force, and our revenues and financial outcomes could suffer as a result. Furthermore, our direct sales personnel may not effectively sell our products.
We have established a direct sales force for our business in Brazil, and we have implemented a direct sales strategy in several European countries. We have hired and will need to retain and motivate a significant number of sales and marketing personnel in order to support our anticipated growth in these countries. There is significant competition for quality personnel experienced in such activities, including from companies with greater financial resources than ours. If we are not successful in our efforts to continue recruiting, retaining, and motivating such personnel, we may not be able to increase our revenues, or we may increase our expenses in greater measure than our revenues, negatively impacting our operating results.
We are also working on creating a direct sales structure and strategy in certain markets. We are working to put in place the correct legal and business structure to comply with taxation and operational requirements. These structures may not ultimately be implemented or, if implemented, be successful or effective and may not be able to increase our revenues or improve our gross margins. In addition, our expenses or tax related costs may increase in greater measure than our revenues, negatively impacting our operating results.
Furthermore, our sales force may operate independently with limited day-to-day oversight from management. They may engage in sales practices that increase certain risks to our business, including the risk of scrutiny from regulatory authorities and the risk that we violate anti-corruption regulations in one or more countries. These and other independent actions may result in unexpected costs, news that might impair our reputation or revenues, litigation in various jurisdictions, and/or sanctions. Any of these could impair the trading price of our shares and adversely impact our results.
If we are unable to train plastic surgeons on the safe and appropriate use of our products and branded surgeries, we may be unable to achieve our expected growth.
An important part of our sales process includes educating plastic surgeons about the benefits and advantages of our Motiva Implants and MotivaImagine products, and training them on the safe and appropriate use of our products. As part of our effort to educate and train plastic surgeons through our MotivaEDGE educational platform, we completed
51
and
50
medical training sessions worldwide during 2018 and 2017, respectively. If we are unable to train potential new plastic surgeon customers at these medical training sessions, we may be unable to achieve our expected growth.
23
It is critical to the success of our commercialization efforts to train a sufficient number of plastic surgeons and provide them with adequate instruction in the appropriate use of our products and branded surgeries. This training process may take longer than expected and may therefore affect our ability to grow our business. Following completion of training, we rely on the trained plastic surgeons to advocate for our products and branded surgeries in the marketplace. Convincing plastic surgeons to dedicate the time and focus necessary for adequate training is challenging, and we cannot provide any assurances we will be successful in these efforts. If plastic surgeons are not properly trained, they may misuse or ineffectively use our products or branded surgeries. This may also result in, among other things, unsatisfactory patient outcomes, patient injury, negative publicity or lawsuits against us, any of which could have an adverse effect on our business and reputation.
In addition, we need to ensure that plastic surgeons are sufficiently educated regarding our implants. For example, many metal implants, such as screws or artificial joints, produce an artifact when magnetic resonance imaging, or MRI, is used to image the area in which the object resides. Our QInside Safety Technology microtransponder embedded in certain Motiva Implants contains metal and causes an artifact that can affect breast cancer screening using MRI, and this artifact is not present in other imaging modalities such as breast ultrasound and film or digital mammography. It is important that we educate physicians and patients of the risks associated with MRI artifacts and how to mitigate them if they choose to utilize Motiva Implants that contain a QInside microtransponder. If we fail to educate physicians and patients about any of these factors, they may make decisions regarding Motiva Implants without full knowledge of the risks and benefits or may view our Motiva Implants negatively.
There is no guarantee that the FDA or non-U.S. regulatory agencies will grant approval for our current or future products, and failure to obtain regulatory approvals in the United States and other international jurisdictions, or revocation of approvals in those jurisdictions, will prevent us from marketing our products.
We intend to seek additional distribution and marketing partners for Motiva Implants and may market specific products only in international markets. We have obtained a CE Mark for Motiva Implants and are therefore authorized to sell in the EU; however, in order to market in regions such as the Asia Pacific region and many other jurisdictions, we must obtain separate regulatory approvals. The approval procedures vary among countries and can involve additional clinical testing, and the time required to obtain approval may differ from that required to obtain the CE Mark or FDA approval. Moreover, clinical studies or manufacturing processes conducted in one country may not be accepted by regulatory authorities in other countries. Approval by the FDA does not ensure approval by regulatory authorities in other countries, and approval by one or more international regulatory authorities does not ensure approval by regulatory authorities in other countries or by the FDA. However, a failure or delay in obtaining regulatory approval in one country may have a negative effect on the regulatory process in others. An international regulatory approval process may include all of the risks associated with obtaining FDA approval. We may not obtain international regulatory approvals on a timely basis, if at all. We may not be able to file for regulatory approvals and even if we file we may not receive necessary approvals to commercialize our products in any market.
Before obtaining regulatory approval for the sale of a planned product, we may be required to conduct extensive preclinical and clinical studies to demonstrate the safety and efficacy of our planned products in human patients. Clinical studies can be expensive, difficult to design and implement, can take many years to complete, and are uncertain as to outcome. A failure of one or more of our clinical studies could occur at any stage of testing. In connection with the initiation of a clinical study in the United States, we filed an IDE application in 2017, which was approved in March 2018 and our first patient was enrolled in April 2018. Our ongoing U.S. IDE trial may take longer to enroll than anticipated, may be stopped for unforeseen safety issues or may not be successful in meeting its endpoints, in which case our U.S. regulatory pathway would require subsequent additional clinical trials.
Numerous unforeseen events during, or as a result of, preclinical and clinical studies could occur, which would delay or prevent our ability to receive regulatory approval or commercialize Motiva Implants or any of our planned products, including the following:
|
•
|
clinical studies may produce negative or inconclusive results, and we may decide, or regulators may require us, to conduct additional clinical studies or abandon product development programs;
|
24
|
•
|
the number of patients required for clinical studies may be larger than we anticipate, enrollment in these clinical studies may be insufficient or slower than we anticipate, or patients may drop out of these clinical studies at a higher rate than we anticipate;
|
|
•
|
the cost of clinical studies may be greater than we anticipate;
|
|
•
|
third-party contractors may fail to comply with regulatory requirements or meet their contractual obligations to us in a timely manner, or at all;
|
|
•
|
we might suspend or terminate clinical studies of our planned products for various reasons, including a finding that our planned products have unanticipated serious side effects or other unexpected characteristics, or that the study subjects are being exposed to unacceptable health risks;
|
|
•
|
regulators may not approve our proposed clinical development plans;
|
|
•
|
regulators or independent institutional review boards, or IRBs, may not authorize us or our investigators to commence a clinical study or conduct a clinical study at a prospective study site;
|
|
•
|
regulators or IRBs may require that we, or our investigators, suspend or terminate clinical studies for various reasons, including noncompliance with regulatory requirements;
|
|
•
|
regulators in countries where Motiva Implants are currently marketed may require that we suspend commercial distribution if there is noncompliance with regulatory requirements or safety concerns;
|
|
•
|
regulators in countries where Motiva Implants are currently marketed may suspend commercial distribution of silicone breast implants due to safety or other concerns generally applicable to the product category;
|
|
•
|
the supply or quality of our planned products or other materials necessary to conduct clinical studies of our planned products may be insufficient or inadequate; and/or
|
|
•
|
the enactment of new regulatory requirements in Europe under the new Medical Device Regulation may make approval times longer and standards more difficult to pass.
|
If we or any future collaboration partner are required to conduct additional clinical trials or other testing of Motiva Implants or any planned products beyond those that we contemplate, those clinical studies or other testing may not be successfully completed, if the results of these studies or tests are not positive or are only modestly positive or if they raise safety concerns, we may:
|
•
|
be delayed in obtaining marketing approvals for Motiva Implants or our planned products;
|
|
•
|
not obtain marketing approval at all;
|
|
•
|
obtain approval for indications that are not as broad as intended;
|
|
•
|
have a product removed from the market after obtaining marketing approval;
|
|
•
|
be subject to additional post-marketing testing requirements; and/or
|
|
•
|
be subject to restrictions on how the product is distributed or used.
|
Even if we obtain regulatory approvals or clearances in a jurisdiction, our products may be removed from the market due to a variety of factors, including adverse events, recalls, suspension of regulatory clearance to sell, or other factors. For example, during the summer of 2016 while we were transitioning from one notified body to another, our CE Mark for Motiva Implants was temporarily not in force. We expect that the initial U.S. approval will be subject to a lengthy and expensive follow-up period, during which we must monitor patients enrolled in clinical studies and collect data on their safety outcomes. Even if FDA approval is obtained, FDA has authority to impose postmarket approval conditions, which can include (i) restrictions on device’s sale, distribution, or use, (ii) continuing evaluation of the device’s safety and efficacy, (iii) additional warning/hazard labeling requirements, (iv) significant record management, (v) periodic reporting requirements, and (vi) any other requirements the FDA determines necessary to provide reasonable assurance of the device’s safety and effectiveness. Completion of this follow-up study, in a manner which results in data sufficient to maintain FDA approval, is subject to multiple risks, many of which are outside of our control. These include, but are not limited to, our ability to fund the ongoing study from our operations or via additional fundraising; study participants’ willingness and ability to return for follow-up study visits; and maintenance of a suitable study database over a long period of time. Even if completed
25
and appropriately evaluated, the study follow-up may reveal safety or other issues that impact the approved labeling, or may result in withdrawal of Motiva Implants from the marketplace in the United States or elsewhere.
Although we launched Motiva Implants commercially in October 2010 and have sold over
650,000
units to date in various countries outside the United States, we do not have as much post-market surveillance data as our competitors and may not have clearly identified all possible or actual risks of our products. Furthermore, if our clinical trials do not produce patient data that compares favorably with breast implants that are already on the market, physicians and patients may opt not to use our products, and our business would suffer.
Our product development costs will also increase if we experience delays to our clinical trials or approvals. We do not know whether any clinical studies will begin as planned, will need to be restructured, or will be completed on schedule, or at all.
Significant clinical study delays could allow our competitors to bring products to market before we do, which would impair our ability to commercialize our planned products and harm our business and results of operations.
Motiva Implants are not currently approved for commercial sale in the United States. Obtaining such approval is costly and time consuming, and we may not obtain the regulatory approval required to sell our products in the United States.
Neither we, nor any future collaboration partner, can commercialize Motiva Implants in the United States without first obtaining regulatory approval for the product from the FDA. In the EU and other countries, we previously obtained a CE Mark, before making Motiva Implants available for commercial sale. FDA guidance on silicone breast implants mandates approval via the PMA process. Extensive preclinical and clinical testing will be required to support the PMA. At least one well-controlled clinical trial is required for approval, such as the one we began in April 2018, which will require us to commit significant financial and personnel resources. Additionally, we will be required to commit to significant and costly post-approval requirements, which will include follow-up of our clinical trial patients for up to ten years, creation of a patient registry, and/or other studies, and implementation of training programs for physicians. We may be unable to fund, enroll, or complete such trials in a timely fashion, or at all, and we may have an insufficient number of enrolled patients follow up as instructed. The results of clinical studies may not be favorable enough to support marketing approval in the United States, or may raise other questions (pertaining, for example, to product safety or effectiveness) that jeopardizes our current approvals for sale in other territories. The FDA approval process will take at least several years to complete, and FDA approval may never be obtained. We must also demonstrate that our manufacturing facilities, processes and controls are adequate to support FDA approval and that our clinical investigators complied with good clinical practices in the conduct of our Motiva Implants clinical trial.
Furthermore, FDA regulatory approval is not a guarantee, and the filing and approval process itself is expensive and may take several years. The FDA also has substantial discretion in the approval process. Despite the time and expense exerted, failure may occur at any stage, and we could encounter problems that cause us to abandon or repeat clinical studies, including our ongoing PMA clinical trial that commenced in April 2018. The FDA can delay, limit, or deny approval of a product candidate for many reasons, including, but not limited, to:
|
•
|
a product candidate may not be deemed to be safe and effective;
|
|
•
|
FDA officials may not find the data from clinical and preclinical studies sufficient;
|
|
•
|
the FDA may not approve our or our suppliers’ processes or facilities; or
|
|
•
|
the FDA may change its approval policies or adopt new regulations.
|
If Motiva Implants, or our future products, fail to demonstrate safety and efficacy in further clinical studies that may be required for U.S. approval, or do not gain regulatory approval, our business and results of operations will be harmed.
Moreover, obtaining regulatory approval for marketing of our products in one country does not ensure we will be able to obtain regulatory approval in other countries, while a failure or delay in obtaining regulatory approval in one country may have a negative effect on the regulatory process in other countries.
26
Even if clinical trials demonstrate acceptable safety and efficacy for Motiva Implants in some patient populations, the FDA or similar regulatory authorities outside the United States may not approve the marketing of Motiva Implants or may approve it with restrictions on the label, which could have a material adverse effect on our business, financial condition, results of operations and growth prospects.
It is possible the FDA or similar regulatory authorities may not consider the results of our clinical trials to be sufficient for approval of Motiva Implants for our desired indications for use. Guidance issued by the FDA in 2006 suggests that a single well-controlled study is required for approval of a new silicone breast implant. The FDA may nonetheless require that we conduct additional clinical studies, possibly using a different clinical study design.
Moreover, even if the FDA or other regulatory authorities approve the marketing of Motiva Implants, the approval may include additional restrictions on the label that could make Motiva Implants less attractive to physicians and patients compared to other products that may be approved for broader indications, which could limit potential sales of Motiva Implants.
If we fail to obtain FDA or other regulatory approval of Motiva Implants, or if the approval is narrower than what we seek, it could impair our ability to realize value from Motiva Implants, and therefore may have a material adverse effect on our business, financial condition, results of operations and growth prospects.
Commercial success of Motiva Implants in the United States or elsewhere depends on our ability to accurately forecast customer demand and manufacture sufficient quantities of product in the implant sizes that patients and physicians request, and to manage inventory effectively and the failure to do so could have a material adverse effect on our business, financial condition, results of operations and growth prospects.
Manufacturing of silicone breast implants requires costly capital equipment and a highly-skilled workforce. There is a significant lead time to build and certify a new manufacturing facility. Until 2017, we had one manufacturing facility in Costa Rica, and we experienced inventory shortages from time-to-time that impaired our ability to meet market demand. In March 2017, our second manufacturing facility, also located in Costa Rica, became operational, and we received certification under the multi-country MDSAP protocol and began shipping saleable product. Although we believe our new, larger manufacturing facility, in combination with our first facility, will give us adequate manufacturing capacity to meet demand for at least the next two years, we have, in the past, been unable to fill all incoming orders to meet growing demand. In addition, if we obtain FDA approval, we will likely need to obtain additional manufacturing capacity prior to any commercialization of our Motiva Implants in the United States. If demand increases faster than we expect, or if we are unable to produce the quantity of goods that we expect with our current facilities, we may not be able to grow revenue at an optimal rate. There may be other negative effects from supply shortages, including loss of our reputation in the marketplace and a negative impact on our relationships with our distributors.
On the other hand, if demand for our products declines, or if market supply surpasses demand, we may not be able to reduce manufacturing expenses or overhead costs proportionately. We have invested significantly in our manufacturing capacity in order to vertically integrate our business. If an increase in supply outpaces the increase in market demand, or if demand decreases, the resulting oversupply could adversely impact our sales and result in the underutilization of our manufacturing capacity, higher inventory carrying costs and associated working capital, changes in revenue mix, and/or price erosion, any of which would lower our margins and adversely impact our financial results.
If we fail to compete effectively against our competitors, many of whom have greater resources than we have, our revenues and results of operations may be negatively affected.
Alternatives exist for Motiva Implants and for our other products, and we will likely face competition with respect to any planned products that we may seek to develop or commercialize in the future from major pharmaceutical companies, specialty pharmaceutical companies, medical device companies and biotechnology companies worldwide. There are several large pharmaceutical and biotechnology companies that currently market silicone breast implants. We also face competition from manufacturers of saline-filled breast implants, and we see emerging competition from non-implant breast augmentation techniques such as hyaluronic acid injection and novel fat grafting methodologies. Any of these may present competitive barriers to Motiva Implants.
Our leading competitors are large, multi-national companies with significant resources and capabilities. Three of these companies, Sientra, Inc., Mentor Worldwide LLC (a division of Johnson & Johnson), and Allergan plc, have
27
conducted large prospective clinical studies that started in the United States in 2002, 2000 and 1998, respectively, the data from which they use extensively to promote their products. While we plan to use a portion of the net proceeds from our IPO to conduct such a study, to date we have not conducted a study designed in such a way as to support a PMA application in the United States. This can put us at a disadvantage when promoting our products to physicians and patients, even outside the United States. In addition, the significant financial and staff resources and brand recognition that our competitors possess mean they may be able to compete with us regardless of the differentiating features of our products. If we are not successful in capturing market share, even outside the United States, or if physicians or patients do not perceive our products to be safer or more favorable, our revenues and/or our operating margins may be significantly impaired.
In addition, manufacturers of competitive products may reduce prices for their competing products in an effort to gain or retain market share, and undermine the value proposition that Motiva Implants might otherwise be able to offer to customers. Potential competitors also include academic institutions, government agencies and other public and private research organizations that conduct research, seek patent protection and establish collaborative arrangements for research, development, manufacturing and commercialization. These competitors may develop new technologies that are superior to our products or replace silicone.
Smaller or early stage companies may also prove to be significant competitors, particularly through collaborative arrangements with large and established companies. These third parties may compete with us in recruiting and retaining qualified technical and management personnel, establishing clinical study sites and patient registration for clinical studies, as well as in acquiring technologies complementary to, or necessary for, our programs.
We may be subject to substantial warranty or product liability claims or other litigation in the ordinary course of business that may adversely affect our business, financial condition and operating results.
We face an inherent risk of product liability exposure related to the sale of Motiva Implants and any planned products in clinical studies. The marketing, sale and use of Motiva Implants and our planned products could lead to the filing of product liability claims against us if someone alleges that our products failed to perform as designed or caused significant adverse events in patients. We may also be subject to liability for a misunderstanding of, or inappropriate reliance upon, the information we provide. If we cannot successfully defend ourselves against claims that Motiva Implants or our planned products caused injuries, we may incur substantial liabilities. Regardless of merit or eventual outcome, liability claims may result in:
|
•
|
decreased demand for any planned products we may develop;
|
|
•
|
injury to our reputation and significant negative media attention;
|
|
•
|
withdrawal of patients from clinical studies or cancellation of studies;
|
|
•
|
significant costs to defend the related litigation and distraction to our management team;
|
|
•
|
substantial monetary awards to plaintiffs;
|
|
•
|
loss of revenue; and
|
|
•
|
the inability to commercialize any products that we may develop.
|
We currently hold
$25 million
in product liability insurance coverage, which may not be adequate to cover all liabilities we may incur. Insurance coverage is increasingly expensive. We may not be able to maintain insurance coverage at a reasonable cost or in an amount adequate to satisfy any liability that may arise.
Negative publicity, product defects and any resulting litigation concerning our products or our competitors’ products could harm our reputation and reduce demand for silicone breast implants, either of which could negatively impact our financial results.
The responses of potential patients, physicians, the news media, legislative and regulatory bodies and others to information about complications or alleged complications of our products, or products liability litigation against us or our competitors, could result in negative publicity and could materially reduce market acceptance of our products. These responses or any investigations and potential resulting negative publicity may have a material adverse effect on our business and reputation and negatively impact our financial condition, results of operations or the market price of our common shares. In addition, significant negative publicity could result in an increased number of product liability claims against us.
28
Counterfeit products may be represented as ours, which could compete with our genuine products and may also expose us to risks associated with adverse events and product liability.
We routinely see counterfeit versions in the of our major competitor’s branded products in the marketplace, and we have recently become aware of potential counterfeiting of our Motiva Implants. This is particularly common in emerging markets, where sensitivity to price is higher and regulatory enforcement is under-resourced. While we are not aware of any counterfeit Motiva Implants in the market, such products may appear as our market share and average selling price grow. These counterfeit products are typically manufactured with significantly lower quality than the products they are claimed to be, and in some cases may be manufactured with silicones that are not medical-grade. They may expose patients to significant adverse event risks, and there is a risk that certain adverse events with counterfeit products may be attributed to our genuine products. This could reduce demand for our products, result in negative publicity, or otherwise impact our business and the price of our shares.
The loss of key members of our executive management team could adversely affect our business.
Our success in implementing our business strategy depends largely on the skills, experience and performance of key members of our executive management team and others in key management positions, including Juan José Chacón Quirós, our Chief Executive Officer, Salvador Dada, our Chief Operating Officer, Roberto de Mezerville, our Chief Technology Officer, and Renee Gaeta, our Chief Financial Officer. The collective efforts of each of these persons, and others working with them as a team, are critical as we continue to develop our tests and technologies and pursue our research and development and sales programs. As a result of the difficulty in locating qualified new management, the loss or incapacity of existing members of our executive management team could adversely affect our operations. If we were to lose one or more of these key employees, we could experience difficulties in finding qualified successors, competing effectively, developing our technologies and implementing our business strategy. We do not have “key person” life insurance on our senior executives, and the loss of any of the key members of our team would have a negative impact to our business and financial results.
In addition, we rely on collaborators, consultants and advisors, including scientific and clinical advisors, to assist us in formulating our research and development and commercialization strategy. Our collaborators, consultants and advisors are generally employed by employers other than us and may have commitments under agreements with other entities that may limit their availability to us.
The loss of a key employee, the failure of a key employee to perform in his or her current position or our inability to attract and retain skilled employees could result in our inability to continue to grow our business or to implement our business strategy.
Various factors outside our direct control may adversely affect manufacturing and supply of our breast implants, tissue expanders and other products.
We currently manufacture Motiva Implants at our facilities in the Coyol Free Zone, Alajuela, Costa Rica, under the multi-country MDSAP protocol. Our Divina scanners are manufactured from components sourced globally, with final assembly in Alajuela, Costa Rica. Our QInside Safety Technology microtransponders are manufactured by contract manufacturers with final testing and packaging at a manufacturing supplier facility in Regensburg, Germany; additional inspection of the units happens in our facilities in Coyol, Costa Rica, prior to approval for inclusion in Motiva Implants. We believe that we currently have adequate manufacturing capacity for all of our products sufficient to meet our demand forecasts for at least the next two years. If demand for our current products and our planned products increases more rapidly than we anticipate, or if we secure regulatory approval to commercialize our products in additional geographies, we will need to either expand our manufacturing capabilities or outsource to other manufacturers. We currently rely upon third-party contract manufacturing organizations to manufacture and supply components for our Divina scanners and QInside Safety Technology microtransponders. The manufacture of these products in compliance with ISO standards and the FDA’s regulations requires significant expertise and capital investment, including the development of advanced manufacturing techniques and process controls. Manufacturers of medical device products often encounter difficulties in production, including difficulties with production costs and yields, quality control, quality assurance testing, shortages of qualified personnel, as well as compliance with strictly enforced FDA requirements, other federal and state regulatory requirements, and foreign regulations.
We currently purchase components for the Divina scanners and QInside Safety Technology microtransponders under purchase orders and do not have long-term contracts with most of the suppliers of these materials. In addition, we rely on NuSil Technology, LLC, or NuSil, as the sole supplier of medical-grade silicone used in our
29
Motiva Implants as well as other products that we manufacture under contract to other customers. See the risk factor below titled “We rely on a single-source, third-party supplier for medical-grade silicone, which is the primary raw material used in these products. If this supplier were to increase prices for these raw materials over time or experience interruptions in their ability to supply us with this raw material, our business, financial condition and results of operations could be adversely affected.” If suppliers were to delay or stop producing our components, or if the prices they charge us were to increase significantly, or if they elected not to sell to us, we would need to identify other suppliers. We could experience delays in manufacturing our products while finding another acceptable supplier, which could impact our results of operations. The changes could also result in increased costs associated with qualifying the new materials and in increased operating costs. Further, any prolonged disruption in a supplier’s operations could have a significant negative impact on our ability to manufacture and deliver products in a timely manner.
The manufacturing, sterilization and distribution of our Motiva Implants and other products are technically challenging. Changes that our suppliers may make, or additional requirements from regulatory agencies, outside of our direct control can have an impact on our processes, on quality and on the successful delivery of products to our customers. Mistakes and mishandling are not uncommon and can affect supply and delivery. Some of these risks include:
|
•
|
failure to complete sterilization on time or in compliance with the required regulatory standards;
|
|
•
|
transportation and import and export risk, particularly given the global nature of our supply and distribution chains;
|
|
•
|
delays in analytical results or failure of analytical techniques that we depend on for quality control and release of products;
|
|
•
|
natural or other disasters, labor disputes, financial distress, lack of raw material supply, issues with facilities and equipment or other forms of disruption to business operations affecting our manufacturer or its suppliers;
|
|
•
|
latent defects that may become apparent after products have been released and that may result in a recall of such products;
|
|
•
|
contamination of our raw materials or manufactured products; and
|
|
•
|
inclusion of vendors of raw materials not in compliance with ISO-13485 requirements.
|
Some of the components used in our Motiva Implants are currently sole-sourced, and substitutes for these components might not be obtained easily or may require substantial design or manufacturing modifications. Any significant problem experienced by one of our sole source suppliers may result in a delay or interruption in the supply of components to us because the number of third-party manufacturers with the necessary manufacturing and regulatory expertise and facilities is limited and certification of a new supplier may be complex and time consuming. Any delay or interruption would likely lead to a delay or interruption in our manufacturing operations. The inclusion of substitute components must meet our product specifications and could require us to qualify the new supplier with the appropriate regulatory authorities. The added time and cost to arrange for alternative suppliers could have a material adverse effect on our business. New manufacturers of any planned product would be required to qualify under applicable regulatory requirements and would need to have sufficient rights under applicable intellectual property laws to the method of manufacturing the planned product. Obtaining the necessary FDA or international approvals or other qualifications under applicable regulatory requirements and ensuring non-infringement of third-party intellectual property rights could result in a significant interruption of supply and could require the new manufacturer to bear significant additional costs that may be passed on to us.
Any disruption at our existing facilities could adversely affect our business and operating results.
Our headquarters are located in Costa Rica, and all of our main manufacturing activities are conducted in two ISO-13485 and GMP compliant manufacturing facilities in Costa Rica through Establishment Labs, S.A. Despite our efforts to maintain and safeguard our manufacturing facilities, including acquiring insurance and adopting maintenance and health and safety protocols, vandalism, terrorism or a natural or other disaster, such as earthquake, volcanic activity, fire or flood, could damage or destroy our inventory of finished goods, cause substantial delays in our operations and manufacturing, result in the loss of key information and cause us to incur additional expenses. Our insurance may not cover our losses in any particular case. In addition, regardless of the
30
level of insurance coverage, damage to our facilities may have an adverse effect on our business, financial condition and results of operations.
We have made multiple acquisitions in the past, and in the future we may acquire other businesses or form joint ventures or make investments in other companies or technologies. If we are not successful in integrating these businesses, as well as identifying and controlling risks associated with the past operations of these businesses, we may incur significant costs, receive penalties or other sanctions from various regulatory agencies, and/or incur significant diversions of management time and attention.
We believe our business growth will be enhanced if we continually seek opportunities to enhance and broaden our product offerings. As part of our business strategy, we may pursue acquisitions or licenses of assets, or acquisitions of businesses. We also may pursue strategic alliances and joint ventures that leverage our core technology and industry experience to expand our product offerings or sales and distribution resources. We have acquired companies and/or assets and licensed assets in a variety of countries, including Brazil and several European countries.
We may do more of these types of transactions in the future and may also form strategic alliances and joint ventures. We may not be able to find suitable partners or acquisition candidates, and we may not be able to complete such transactions on favorable terms, if at all. If we make any acquisitions, we may not be able to integrate these acquisitions successfully into our existing business, and we could assume unknown or contingent liabilities. Any future acquisitions also could result in significant write-offs or the incurrence of debt and contingent liabilities, any of which could have an adverse effect on our financial condition, results of operations and cash flows. Integration of an acquired company may also disrupt ongoing operations and require management resources that would otherwise focus on developing our existing business. We may experience losses related to investments in other companies, which could have a negative effect on our results of operations. We may not identify or complete these transactions in a timely manner, on a cost-effective basis, or at all, and we may not realize the anticipated benefits of any acquisition, license, strategic alliance or joint venture. To finance such a transaction, we may choose to issue common shares as consideration, which would dilute the ownership of our shareholders. If the price of our common shares is low or volatile, we may not be able to acquire other companies or fund a joint venture project using our shares as consideration. Alternatively, it may be necessary for us to raise additional funds for acquisitions through public or private financings. Additional funds may not be available on terms that are favorable to us, or at all.
We do not know whether we will be able to successfully integrate any acquired business, product or technology. The success of any given acquisition may depend on our ability to retain any key employees related thereto, and we may not be successful at retaining or integrating such key personnel. Integrating any business, product or technology we acquire could be expensive and time-consuming, disrupt our ongoing business, impact our liquidity, and/or distract our management. If we are unable to integrate any acquired businesses, products or technologies effectively, our business may suffer. Whether as a result of unsuccessful integration, unanticipated costs, including those associated with assumed liabilities and indemnification obligations, negative accounting impact, or other factors, we may not realize the economic benefits we anticipate from acquisitions. In addition, any amortization or charges resulting from the costs of acquisitions could increase our expenses.
If changes in the economy and/or consumer spending, consumer preference and other trends reduce consumer demand for our products, our sales and profitability would suffer.
We are subject to the risks arising from adverse changes in general economic and market conditions. Certain elective procedures, including breast augmentation, are typically not covered by insurance. Adverse changes in the economy may cause consumers to reassess their spending choices, which could have an adverse effect on consumer spending, reduce the demand for these surgeries, and therefore have an adverse effect on our revenues. Furthermore, consumer preferences and trends may shift due to a variety of factors, including changes in demographic and social trends, public health initiatives and product innovations, which may reduce consumer demand for our products.
Fluctuations in insurance costs and availability, and future insurance requirements could adversely affect our profitability or our risk management profile.
We hold a number of insurance policies, including product liability insurance, directors’ and officers’ liability insurance, general liability insurance, property insurance and workers’ compensation insurance. If the costs of maintaining adequate insurance coverage increase significantly in the future, our operating results could be
31
adversely affected. Likewise, if any of our current insurance coverage should become unavailable to us or become economically impractical, we would be required to operate our business without indemnity from commercial insurance providers. If we operate our business without insurance, we could be responsible for paying claims or judgments against us that would have otherwise been covered by insurance, which would adversely affect our results of operations or financial condition.
Continued international expansion of our business will expose us to business, regulatory, political, operational, financial and economic risks associated with doing business internationally.
Our products are currently sold in over 60 countries, and we operate subsidiaries in the United States, Costa Rica, Brazil, and several European countries. Our business strategy contemplates continued international expansion, including partnering with medical device distributors, and introducing Motiva Implants and other planned products outside the United States. The sale and shipment of our products internationally, as well as the purchase of components from international sources, subjects us to potential trade, import and export, and customs regulations and laws.
Compliance with these regulations and laws is costly and exposes us to penalties for non-compliance. Any failure to comply with applicable legal and regulatory obligations could impact us in a variety of ways that include, but are not limited to, significant criminal, civil and administrative penalties, including imprisonment of individuals, fines and penalties, denial of export or import privileges, seizure of shipments, restrictions on certain business activities and exclusion or debarment from government contracting. Also, the failure to comply with applicable legal and regulatory obligations could result in the disruption of our shipping and sales activities.
In addition, several of the countries in which we sell our products or conduct our operations are, to some degree, subject to political, economic or social instability. Doing business in Costa Rica and other countries outside the United States involves a number of other risks, including:
|
•
|
compliance with the free zone regime regulations under which the manufacturing sites operate;
|
|
•
|
different regulatory requirements for device approvals in international markets;
|
|
•
|
multiple, conflicting and changing laws and regulations such as tariffs and tax laws, export and import restrictions, employment laws, regulatory requirements and other governmental approvals, permits and licenses;
|
|
•
|
potential failure by us or our distributors to obtain and/or maintain regulatory approvals for the sale or use of our products in various countries;
|
|
•
|
difficulties in managing global operations;
|
|
•
|
logistics and regulations associated with shipping products, including infrastructure conditions and transportation delays;
|
|
•
|
limits on our ability to penetrate international markets if our distributors do not execute successfully;
|
|
•
|
governmental price controls, differing reimbursement regimes and other market regulations;
|
|
•
|
financial risks, such as longer payment cycles, difficulty enforcing contracts and collecting accounts receivable, and exposure to currency exchange rate fluctuations;
|
|
•
|
reduced protection for intellectual property rights, or lack of them in certain jurisdictions, forcing more reliance on our trade secrets, if available;
|
|
•
|
economic weakness, political and economic instability, including wars, terrorism and political unrest, outbreak of disease, boycotts, curtailment of trade and other business restrictions;
|
|
•
|
the March 2017 Article 50 notice of withdrawal that formally began the process of a British exit from the EU, including with respect to its effect on the value of the British pound relative to other currencies;
|
|
•
|
failure to comply with the Foreign Corrupt Practices Act, including its books and records provisions and its anti-bribery provisions, by maintaining accurate information and control over sales activities and distributors’ activities;
|
|
•
|
unexpected changes in tariffs, trade barriers and regulatory requirements;
|
|
•
|
compliance with tax, employment, immigration and labor laws;
|
32
|
•
|
taxes, including withholding of payroll taxes;
|
|
•
|
currency fluctuations, which could result in increased operating expenses and reduced revenue, and other obligations incident to doing business in another country;
|
|
•
|
workforce uncertainty in countries where labor unrest is more common than in the United States;
|
|
•
|
production shortages resulting from any events affecting raw material supply or manufacturing capabilities abroad; and
|
|
•
|
business and shipping interruptions resulting from natural or other disasters including earthquakes, volcanic activity, hurricanes, floods and fires.
|
Any of these risks, if encountered, could harm our future international expansion and operations and, consequently, have an adverse effect on our financial condition, results of operations and cash flows.
Our failure to adequately protect personal information in compliance with evolving legal requirements could harm our business.
In the ordinary course of our business, we collect and store sensitive data, including legally protected patient health information, credit card information and personally identifiable information. We collect this kind of information on our customers for purposes of servicing potential warranty claims and for post-marketing safety vigilance. These data protection and privacy-related laws and regulations are evolving and may result in ever-increasing regulatory and public scrutiny and escalating levels of enforcement and sanctions.
There are a number of state, federal and international laws protecting the privacy and security of health information and personal data. As part of the American Recovery and Reinvestment Act 2009, or ARRA, Congress amended the privacy and security provisions of the Health Insurance Portability and Accountability Act, or HIPAA. HIPAA imposes limitations on the use and disclosure of an individual’s protected health information by certain health care providers, health care clearinghouses, and health insurance plans, collectively referred to as covered entities, that involve the creation, use, maintenance or disclosure of protected health information. The HIPAA amendments also impose compliance obligations and corresponding penalties for non-compliance on individuals and entities that provide services to health care providers and other covered entities, collectively referred to as business associates. ARRA also made significant increases in the penalties for improper use or disclosure of an individual’s protected health information under HIPAA and extended enforcement authority to state attorneys general. The amendments also create notification requirements for individuals whose protected health information has been inappropriately accessed or disclosed, notification requirements to federal regulators and in some cases, notification to local and national media. Notification is not required under HIPAA if the health information that is improperly used or disclosed is deemed secured in accordance with encryption or other standards developed by the U.S. Department of Health and Human Services, or HHS. Most states have laws requiring notification of affected individuals and state regulators in the event of a breach of personal information, which is a broader class of information than the protected health information protected by HIPAA. Many state laws impose significant data security requirements, such as encryption or mandatory contractual terms to ensure ongoing protection of personal information.
In addition, even when HIPAA does not apply, according to the FTC, failing to take appropriate steps to keep consumers’ personal information secure constitutes unfair acts or practices in or affecting commerce in violation of Section 5(a) of the FTCA, 15 U.S.C § 45(a). The FTC expects a company’s data security measures to be reasonable and appropriate in light of the sensitivity and volume of consumer information it holds, the size and complexity of its business, and the cost of available tools to improve security and reduce vulnerabilities. Medical data is considered sensitive data that merits stronger safeguards. The FTC’s guidance for appropriately securing consumers’ personal information is similar to what is required by the HIPAA Security Rule.
Many foreign countries and governmental bodies, including the EU, Canada, Australia and other relevant jurisdictions, have laws and regulations concerning the collection and use of personal or sensitive data obtained from their residents or by businesses operating within their jurisdiction. For example, the European Commission recently adopted the General Data Protection Regulation, or the GDPR, effective on May 25, 2018, that supersedes current EU data protection legislation, imposes more stringent EU data protection requirements and provides for greater penalties for noncompliance. The GDPR applies to any company established in the EU as well as to those outside the EU if they collect and use personal data in connection with the offering goods or services to individuals in the EU or the monitoring of their behavior. The GDPR enhances data protection
33
obligations for processors and controllers of personal data, including, for example, expanded disclosures about how personal information is to be used, limitations on retention of information, mandatory data breach notification requirements and onerous new obligations on services providers. Non-compliance with the GDPR can trigger steep fines of up to €20 million or 4% of total worldwide annual revenues, whichever is higher. Given the breadth and depth of changes in data protection obligations, meeting the GDPR’s requirements requires time, resources and a review of the technology and systems currently in use against the GDPR’s requirements.
We may be at risk of enforcement actions taken by certain EU data protection authorities while we continue to build our business practices to ensure that all transfers of personal data to us from the European Economic Area are conducted in compliance with all applicable regulatory obligations, the guidance of data protection authorities and evolving best practices. We may find it necessary to establish systems to maintain personal data originating from the EU in the European Economic Area, which may involve substantial expense and may cause us to need to divert resources from other aspects of our business, all of which may adversely affect our business.
Our failure to comply with applicable laws and regulations, or to protect such data, could result in enforcement actions against us, including fines, imprisonment of company officials and public censure, claims for damages by end-customers and other affected individuals, damage to our reputation and loss of goodwill, any of which could harm on our operations, financial performance, and business. Evolving and changing definitions of personal data and personal information, within the European Union, the United States, and elsewhere, may limit or inhibit our ability to operate or expand our business, including limiting strategic partnerships that may involve the sharing of data. Moreover, if the relevant laws and regulations change, or are interpreted and applied in a manner that is inconsistent with our data practices or the operation of our products, we may need to expend resources in order to change our business operations, data practices, or the manner in which our products operate. Even the perception of privacy concerns, whether or not valid, may harm our reputation and inhibit adoption of our products.
If we are not able to satisfy data protection, security, privacy, and other government- and industry-specific requirements, our business could be harmed.
There are a number of data protection, security, privacy and other government- and industry-specific requirements, including those that require companies to notify individuals of data security incidents involving certain types of personal data. Security compromises experienced by other companies, by our customers or by us may lead to public disclosures, which could harm our reputation, erode customer confidence in the effectiveness of our security measures, negatively impact our other products and our ability to attract new customers. As we expand into new regions, we will need to comply with new requirements. If we cannot comply or if we incur a violation in one or more of these requirements, our growth could be adversely impacted, and we could incur significant liability.
Risks Related to the Operation of Our Business
We expect to significantly increase the size of our organization; as a result, we may encounter difficulties in managing our growth, which could disrupt our operations and/or increase our net losses.
As of
December 31, 2018
, we had
505
employees. Over the next several years, we expect to experience significant growth in the number of our employees and the scope of our operations, particularly in the areas of manufacturing, regulatory affairs, clinical and sales and marketing. We also intend to continue to improve our operational, financial and management controls, reporting systems and procedures, which may require additional personnel. Such growth could place a strain on our administrative and operational infrastructure, and/or our managerial abilities, and we may not be able to make improvements to our management information and control systems in an efficient or timely manner. We may discover deficiencies in existing systems and controls.
Many of these employees will be in countries outside of our corporate headquarters, which adds additional complexity. To manage our anticipated future growth, we must continue to implement and improve our managerial, operational and financial systems, expand our facilities and continue to recruit and train additional qualified personnel. We may not be able to effectively manage these activities. The physical expansion of our operations may lead to significant costs and may divert our management and business development resources. Future growth would impose significant added responsibilities on members of management, including:
|
•
|
managing our clinical trials effectively, which we anticipate being conducted at numerous clinical sites;
|
34
|
•
|
identifying, recruiting, maintaining, motivating and integrating additional employees with the expertise and experience we will require, in multiple countries;
|
|
•
|
managing our internal development efforts effectively while complying with our contractual obligations to licensors, licensees, contractors and other third parties;
|
|
•
|
managing additional relationships with various distributors, suppliers, and other third parties;
|
|
•
|
improving our managerial, development, operational and finance reporting systems and procedures; and
|
|
•
|
expanding our facilities.
|
Our failure to accomplish any of these tasks could prevent us from growing successfully. Any inability to manage growth could delay the execution of our business plans or disrupt our operations. We may also be exposed or subject to additional unforeseen or undisclosed liabilities as well as increased levels of indebtedness.
Any future distribution or commercialization agreements we may enter into with respect to our current or planned products may place the development of these products outside our control, or may otherwise be on terms unfavorable to us.
We may enter into additional distribution or commercialization agreements with third parties with respect to our current or planned products, for commercialization in or outside the United States. Our likely collaborators for any distribution, marketing, licensing or other collaboration arrangements include large and mid-size medical device and diagnostic companies, regional and national medical device and diagnostic companies, and distribution or group purchasing organizations. We will have limited control over the amount and timing of resources that our collaborators dedicate to the development or commercialization of our planned products. Our ability to generate revenue from these arrangements will depend in part on our collaborators’ abilities to successfully perform the functions assigned to them in these arrangements.
Collaborations may be terminated and, if terminated, may result in a need for additional capital to pursue further development or commercialization of the applicable planned products. Collaborators may own or co-own intellectual property covering our products that results from our collaboration with them. In such cases, we would not have the exclusive right to commercialize such intellectual property.
Any termination or disruption of collaborations could result in delays in the development of planned products, increases in our costs to develop the planned products or the termination of development of a planned product.
We rely on third parties to conduct certain components of our clinical studies, and those third parties may not perform satisfactorily, including failing to meet deadlines for the completion of such studies, which could interfere with or delay our ability to get regulatory approval or commercialize our products.
We rely on third parties, such as contract research organizations, or CROs, clinical data management organizations, medical institutions and clinical investigators, to perform various functions for our clinical trials. Our reliance on these third parties for clinical development activities reduces our control over these activities but does not relieve us of our responsibilities. We remain responsible for ensuring that each of our clinical studies is conducted in accordance with the general investigational plan and protocols for the study. Moreover, the International Council for Harmonization,or ICH, and the FDA require us to comply with standards, commonly referred to as good clinical practices, for conducting, recording and reporting the results of clinical studies to ensure that data and reported results are credible and accurate and that the rights, integrity and confidentiality of patients in clinical studies are protected. Furthermore, these third parties may also have relationships with other entities, some of which may be our competitors. If these third parties do not successfully carry out their contractual duties, meet expected deadlines or conduct our clinical studies in accordance with regulatory requirements or our stated protocols, we will not be able to obtain, or may be delayed in obtaining, regulatory approvals for our planned products and will not be able to, or may be delayed in our efforts to, successfully commercialize our planned products.
Various factors outside our direct control, including the reliance on single-source suppliers, may adversely affect manufacturing and supply of our Motiva Implants, tissue expanders, and other products.
We currently manufacture Motiva Implants at our facilities in the Coyol Free Zone, Alajuela, Costa Rica, under the multi-country MDSAP protocol. Our Divina scanners are manufactured from components sourced globally, with final assembly in Alajuela, Costa Rica. Our QInside Safety Technology microtransponders are manufactured by
35
contract manufacturers with final testing and packaging at a manufacturing supplier facility in Regensburg, Germany, with additional inspection of the units at our facilities in Coyol, Costa Rica, prior to approval for inclusion in Motiva Implants. If demand for our current products and our planned products increases more rapidly than we anticipate, or if we secure regulatory approval to commercialize our products in additional geographies, we will need to either expand our manufacturing capabilities or outsource to other manufacturers. We currently rely upon third-party contract manufacturing organizations to manufacture and supply components for our Divina scanners and QInside Safety Technology microtransponders. The manufacture of these products in compliance with ISO standards and the FDA’s regulations requires significant expertise and capital investment, including the development of advanced manufacturing techniques and process controls. Manufacturers of medical device products often encounter difficulties in production, including difficulties with production costs and yields, quality control, quality assurance testing, shortages of qualified personnel, as well as compliance with strictly enforced FDA requirements, other federal and state regulatory requirements, and foreign regulations.
We currently purchase components for the Divina scanners and QInside Safety Technology microtransponders under purchase orders and do not have long-term contracts with most of the suppliers of the materials included in these products. We rely on NuSil Technology, LLC, or NuSil, as the sole supplier of medical-grade silicone used in our Motiva Implants as well as other products that we manufacture under contract to other customers. See the risk factor below titled “We rely on a single-source, third-party supplier for medical-grade silicone, which is the primary raw material used in these products. If this supplier were to increase prices for these raw materials over time or experience interruptions in their ability to supply us with this raw material, our business, financial condition and results of operations could be adversely affected.” In addition, our supplier of Puregraft products and the suppliers of certain packaging components and the surgical tools that we sell with Motiva Implants, including the cannulas, retractors, and insertion sleeves, are all purchased by us from single-source suppliers.
If our single-source and other suppliers were to delay or stop producing our components, or if the prices they charge us were to increase significantly, or if they elected not to sell to us at all or on commercially reasonable terms, we would need to identify and initiate relationships with alternative suppliers, if possible. We could experience delays in manufacturing our products or the interruption of the availability of Motiva Implants or our other products for sale, while finding another acceptable supplier, which would impact our business, financial condition and results of operations. Even if such alternative suppliers are available on commercially reasonable terms, the changes could also result in increased costs associated with qualifying the new materials and in increased operating costs. Further, any prolonged disruption in a supplier’s operations could have a significant negative impact on our ability to manufacture and deliver products in a timely manner and as a result, our business, financial condition and results of operations could be adversely affected. For example, we have been notified by the supplier of the insertion sleeve that we have begun to sell with Motiva Implants that it will not fulfill its contractual obligations to sell insertion sleeves to us and we have commenced litigation with this supplier asserting breach of contract. If we are unable to bundle our Motiva Implants with an insertion sleeve, either from our current supplier or from an alternative source, and the market shifts to a preference for purchasing breast implants that are bundled with a full suite of surgical tools, our ability to fully commercialize Motiva Implants could all be adversely affected.
The manufacturing, sterilization and distribution of our Motiva Implants and other products are technically challenging. Changes that our suppliers may make, or additional requirements from regulatory agencies, are outside of our direct control and can have an impact on our processes, on quality, and on the successful delivery of products to our customers. Mistakes and mishandling are not uncommon and can affect supply and delivery. Some of these risks include:
|
•
|
failure to complete sterilization on time or in compliance with the required regulatory standards;
|
|
•
|
transportation and import and export risk, particularly given the global nature of our supply and distribution chains;
|
|
•
|
delays in analytical results or failure of analytical techniques that we depend on for quality control and release of products;
|
|
•
|
natural or other disasters, labor disputes, financial distress, lack of raw material supply, issues with facilities and equipment or other forms of disruption to business operations affecting our manufacturer or its suppliers;
|
|
•
|
latent defects that may become apparent after products have been released and that may result in a recall of such products;
|
36
|
•
|
contamination of our raw materials or manufactured products; and
|
|
•
|
inclusion of vendors of raw materials not in compliance with ISO-13485 requirements.
|
As referenced above in this risk factor, some of the components used in our Motiva Implants and our other products are currently single-sourced, and substitutes for these components might not be obtained easily or may require substantial redesign or manufacturing modifications related to our specifications or due to regulatory requirements. Any significant problem experienced by one of our single-source suppliers may result in a delay or interruption in the supply of components or products to us because the number of third-party manufacturers with the necessary manufacturing and regulatory expertise and facilities is limited and certification of a new supplier may be complex and time consuming. Any delay or interruption would likely lead to a delay or interruption in our manufacturing or distribution operations and/or adversely affect our ability to sell Motiva Implants. The inclusion of substitute components or products must meet our specifications and could require us to qualify the new supplier with the appropriate regulatory authorities. The added time and cost to arrange for alternative suppliers could have a material adverse effect on our business. New manufacturers of any current or planned product would be required to qualify under applicable regulatory requirements and would need to have sufficient rights under applicable intellectual property laws to the design and method of manufacturing the planned product. Obtaining the necessary FDA or international approvals or other qualifications under applicable regulatory requirements and ensuring non-infringement of third-party intellectual property rights could result in a significant interruption of supply and could require the new manufacturer to bear significant additional costs that may be passed on to us.
Our results of operations could be affected by fluctuations in currency rates.
We present our results of operations in U.S. dollars, which is our reporting currency. However, as of
December 31, 2018
, the majority of our revenues are denominated in currencies other than the U.S. dollar - primarily the British pound, the euro, and the Brazilian real. As of
December 31, 2018
, the majority of our expenses are denominated in U.S. dollars or in Costa Rican colones, which are linked to the U.S. dollar. In the future, we expect to have significant revenues and expenses denominated in these non-U.S. currencies. As such, unfavorable fluctuations in currency exchange rates could have an adverse effect on our results of operations.
Because our consolidated financial statements are presented in U.S. dollars, we must translate revenues, expenses and income, as well as assets and liabilities, into U.S. dollars at exchange rates in effect during or at the end of each reporting period. Therefore, changes in the value of the U.S. dollar in relation to the British pound, the euro, and the Brazilian real will affect our revenues, operating income and the value of balance sheet items originally denominated in other currencies. These changes would cause our growth in consolidated earnings stated in U.S. dollars to be higher or lower than our growth in local currency when compared against other periods. We do not currently engage in currency hedging arrangements to protect us from fluctuations in the exchange rates of the euro and other currencies in relation to the U.S. dollar (and/or from inflation of such currencies), and we may be exposed to material adverse effects from such movements. We cannot predict any future trends in rates of inflation or exchange rates of other currencies against the U.S. dollar, and there can be no assurance that any contractual provisions will offset their impact, or that any future currency hedging activities will be successful.
We have significant exposure to the economic and political situations in emerging market countries, and developments in these countries could materially impact our financial results, or our business more generally.
Many of the countries in which our products are sold are emerging markets. Our global growth strategy contemplates the expansion of our existing sales activities in Latin America, Europe, the Middle East, Africa and Asia-Pacific region as well as North America. Our exposure to emerging markets has increased in recent years, as have the number and importance of our distributor arrangements. Economic and political developments in Brazil and other emerging markets, including economic crises, currency inflation, or political instability, have had in the past, and may have in the future, a material adverse effect on our financial condition and results of operations. Moreover, as these markets continue to grow, competitors may seek to enter these markets and existing market participants will likely try to aggressively protect or increase their market shares. Increased competition may result in price reductions, reduced margins and our inability to gain or hold market share, which could have an adverse effect on our financial condition and results of operations.
37
The political situation in the United States can affect the ability of our company to conduct business in certain areas or countries if new trade conditions are imposed or enforced by the U.S. government.
There could be negative consequences to our company’s revenue if the U.S. government unexpectedly changes its trade policies towards determined geographies or countries. These policy changes can include such things as trade barriers, which serve to limit or prevent international trade. The U.S. government may request additional funds or tariffs in exchange for the right to export items into the country. Tariffs or quotas may be used to protect domestic producers from foreign competition. Changes may include the modification or withdrawal of free trade agreements already in place. This also can have a large effect on the profits of our company because it either cuts revenues as a result of a tax on imports/exports or restricts the amount of revenues that can be earned.
Our operations involve hazardous materials and we and third parties with whom we contract must comply with environmental laws and regulations, which can be expensive and restrict how we do business, and could expose us to liability if our use of such hazardous materials causes injury.
Our manufacturing processes currently require the controlled use of potentially harmful chemicals, including highly flammable solvents. We cannot eliminate the risk of accidental contamination or injury to employees or third parties from the use, storage, handling or disposal of these materials. In the event of contamination or injury, we could be held liable for any resulting damages, and any liability could exceed our resources or any applicable insurance coverage we may have. Additionally, we are subject to, on an ongoing basis, federal, state and local laws and regulations governing the use, storage, handling and disposal of these materials and specified waste products. These are particularly stringent in California, where NuSil, one of our key suppliers, is located. The cost of compliance with these laws and regulations may become significant and could have an adverse effect on our financial condition, results of operations and cash flows. In the event of an accident or if we otherwise fail to comply with applicable regulations, we could lose our permits or approvals or be held liable for damages or penalized with fines.
The results of the Referendum of the United Kingdom’s Membership of the European Union may adversely affect our business and profitability.
There have also been periods of increased market volatility and currency exchange rate fluctuations, both globally and most specifically within the United Kingdom, or U.K., and Europe, as a result of the U.K. referendum in which voters approved an exit from the European Union, or E.U., commonly referred to as “Brexit,” scheduled to become effective on March 29, 2019. The proposed withdrawal has created significant uncertainty about the future relationship between the U.K. and the E.U. These developments, or the perception that any of them could occur, may adversely affect European and worldwide economic and market conditions, significantly reduce global market liquidity and restrict the ability of key market participants to operate in certain financial markets and could contribute to instability in global financial and foreign exchange markets, including increased volatility in interest rates and foreign exchange rates. The potential impacts of the impending Brexit decision could adversely impact other global economies, and in particular, the European economy, a region which accounted for less than 5% of our total revenues for the year ended December 31, 2018. In the first quarter of 2019, we completed the migration of our CE Mark certificates, originally issued by BSI UK Notified Body, to BSI Group The Netherlands B.V., which is a European Notified Body designated in The Netherlands. We continue to actively monitor the ongoing potential impacts of Brexit and will seek to minimize its impact on our business through review of our existing regulatory requirements, contractual arrangements and obligations, particularly in the European region. Any of these effects of Brexit, among others, could adversely affect our business, business opportunities, results of operations, financial condition and cash flows.
Risks Related to Our Financial Condition and Capital Requirements
We have incurred net operating losses in the past and expect to incur net operating losses for the foreseeable future.
We have incurred net operating losses since our inception, and we continue to incur significant research and development and general and administrative expenses related to our operations. We do not expect to be profitable in 2019, and in future years we expect to incur significant research and development expenses related to, among other things, the PMA clinical study of Motiva Implants in the United States Investment in medical device product development, particularly clinical studies, is highly speculative. It entails substantial upfront capital expenditures and significant risk that any potential planned product will fail to demonstrate adequate accuracy or
38
clinical utility. We may not be profitable for some time. As of
December 31, 2018
, we had an accumulated deficit of
$89.0 million
.
We expect that our future financial results will depend primarily on our success in launching, selling and supporting Motiva Implants and other products that are part of our MotivaImagine platform. This will require us to be successful in a range of activities, including manufacturing, marketing, and selling Motiva Implants. We may not succeed in these activities and may never generate revenue that is sufficient to be profitable in the future. Even if we are profitable, we may not be able to sustain or increase profitability on a quarterly or annual basis. Our failure to achieve sustained profitability would depress the value of our company and could impair our ability to raise capital, expand our business, diversify our planned products, market our current and planned products, or continue our operations.
We may need additional funds to support our operations, and such funding may not be available to us on acceptable terms, or at all, which would force us to delay, reduce or suspend our planned development and commercialization efforts. Raising additional capital may subject us to unfavorable terms, cause dilution to our existing shareholders, restrict our operations, or require us to relinquish rights to our products and technologies.
Our operations have consumed substantial amounts of cash since our inception, and we expect to incur significant expenses in connection with our planned research, development and product commercialization efforts. We believe that our available cash, cash from operations, and the net proceeds from our IPO will be sufficient to satisfy our liquidity requirements for at least the next 12 months. If our available cash resources, net proceeds from our IPO and anticipated cash flow from operations are insufficient to satisfy our liquidity requirements, we may seek to sell equity or convertible debt securities, enter into a credit facility or another form of third-party funding, or seek other debt financing. Any failure to raise the funds necessary to support our operations may force us to delay, reduce or suspend our planned clinical trials, research and development programs, or other commercialization efforts.
To the extent that we raise additional capital through the sale of equity or convertible debt securities, your ownership may be diluted, and the terms of these securities may include liquidation or other preferences that adversely affect your rights as a shareholder. Debt financing, if available, may involve agreements that include covenants limiting or restricting our ability to take certain actions, such as incurring additional debt, making capital expenditures or declaring dividends.
If we raise additional funds through collaborations, strategic collaborations or partnership, or marketing, distribution or licensing arrangements with third parties, we may be required to do so at an earlier stage than would otherwise be ideal and/or may have to limit valuable rights to our intellectual property, technologies, products, or future revenue streams, or grant licenses or other rights on terms that are not favorable to us. Furthermore, any additional fundraising efforts may divert our management from their day-to-day activities, which may adversely affect our ability to develop and commercialize our products.
Risks Related to Our Business and Our Industry
We rely on a single-source, third-party supplier for medical-grade long-term implantable silicone, which is the primary raw material used in our Motiva Implants. If this supplier were to increase prices for this raw material over time or experience interruptions in its ability to supply us with this raw material, our business, financial condition and results of operations could be adversely affected.
We rely on NuSil, as the sole supplier of medical-grade silicone used in our Motiva Implants as well as other products that we manufacture under contract to other customers. To our knowledge, NuSil is the only supplier of such raw materials with the appropriate filings with the FDA and other regulatory bodies to enable manufacture of products with our requirements. NuSil supplies our major competitors with raw material as well, and at least two of these are larger-volume customers of NuSil than we are.
If NuSil becomes unable or unwilling to supply sufficient quantities of medical-grade silicone of the specifications required for our products, we may not be able to replace this supply source quickly, or at all. Similarly, they may become unable or unwilling to manufacture our needed raw materials in compliance with regulatory requirements, or their manufacturing facilities may not be able to maintain compliance with regulatory requirements. Any replacement supplier would have to be qualified with the relevant regulatory authorities, which is an expensive and time-consuming process during which we may experience an interruption in our manufacturing operations.
39
We may also be unsuccessful in negotiating favorable terms with such a supplier. Any of these contingencies would likely affect the financial results of our operations and may have a negative impact on our share price. In particular, if we are not able to establish a replacement vendor for our medical-grade silicone, we would be unable to manufacture our Motiva Implants as well as other products that we manufacture under contract to other customers until such time as a replacement vendor is identified, which would likely significantly affect the financial results of our operations and have significantly negative impact on our share price.
Our current supply agreement with NuSil expires in December 2021. There can be no assurance that NuSil will agree to continue to supply us with medical-grade silicone following the expiration of our contract on terms that are acceptable to us, or at all. This would have a material adverse effect on our business, financial condition, and results of operations for the reasons set forth above.
In addition, our relationship with NuSil involves other risks, including but not limited to the following:
|
•
|
it may not be able, or willing, to manufacture silicone raw materials with our agreed-upon specifications;
|
|
•
|
it may not be able, or willing, to manufacture our needed raw materials in compliance with regulatory requirements, or our its manufacturing facilities may not be able to maintain compliance with regulatory requirements;
|
|
•
|
it may not be able to supply sufficient quantities of each raw material quickly enough for us to respond to rapid increases in demand;
|
|
•
|
it may unintentionally convey information to our competitors that is helpful in understanding our proprietary compositions and other trade secrets of our manufacturing processes;
|
|
•
|
we may be subject to price fluctuations if we fail to meet certain minimum order requirements, or if our existing contract expires or is renegotiated;
|
|
•
|
it may lose access to critical services and components, resulting in interruption in manufacture or shipment of medical-grade silicone;
|
|
•
|
its facilities may be affected by earthquakes, wild fires, mud slides or other natural disasters, which could delay or impede production of our raw materials;
|
|
•
|
we may be required to obtain regulatory approvals related to any change in our supply chain;
|
|
•
|
NuSil may wish to discontinue supply of products to us due to its existing relationships with our competitors;
|
|
•
|
NuSil may claim ownership of the intellectual property associated with our ProgressiveGel family of silicone gel rheologies; and
|
|
•
|
NuSil or its parent entity may encounter financial or other hardships unrelated to our demand for products, which could negatively impact their ability to fulfill our orders and support our regulatory approvals.
|
Negative publicity concerning our products or our competitors’ products could harm our reputation and reduce demand for silicone breast implants, either of which could impact our financial results and/or share price.
The silicone breast implant industry has been the focus of significant regulatory and media scrutiny. Silicone breast implants were removed from the U.S. marketplace for a period in the 1990s and 2000s related to safety concerns. Certain patient advocacy groups exist to publicize real and perceived health risks associated with silicone breast implants and plastic surgery generally. The activities of legislative bodies, regulatory agencies, physician organizations, and other groups may lead to publicity around the real and perceived risks to patients from silicone implants. Any of these could reduce patient demand for our products, or could, even in the absence of a change in demand, negatively impact our share price. In addition, activity of this type could result in an increase in the number or size of product liability claims, which would adversely affect our business, financial results, and/or the price of our shares.
40
Recent studies have called into question the long-term safety of breast implants and there have also been reports of anaplastic large cell lymphoma linked to our competitors’ products. These events may lead to a reduction in the demand for silicone breast implants and could adversely affect our business.
Silicone breast implants have been associated with higher rates of anaplastic large cell lymphoma, or ALCL, a rare type of cancer affecting cells of the immune system. In January 2011, the FDA indicated that there was a possible association between saline and silicone gel-filled breast implants and higher rates of ALCL, with the causal links not yet understood. In March 2015, France’s National Cancer Institute, or NCI, noted that there is a clearly established link between ALCL and breast implants, which is referred to as breast implant-associated ALCL, or BIA-ALCL. The NCI noted in that report that most of the reported cases occurred in women with textured implants. In response, the
Agence Nationale de Securite du Medicament et des Produits de Sante,
or ANSM, the regulatory authority in France, has required manufacturers marketing breast implants in France, including us, to submit biocompatibility data for review, and this review is ongoing. While France by itself is a small market for us, we anticipate that the results of this regulatory inquiry will influence other regulatory agencies in a variety of countries. In the fourth quarter of 2018, following the non-renewal of its textured breast implant CE Mark licenses in Europe, Allergan plc suspended sales of textured breast implants in Europe and withdrew its remaining textured breast implants then on the market in Europe. It is possible that as the BIA-ALCL risk factor becomes highly publicized, this could negatively, and significantly, impact demand for breast implants globally.
In August 2017, the FDA updated its recommendations on BIA-ALCL and subsequently requested all breast implant manufacturers to revise their physician and patient labeling with the most up-to-date information. The August 2017 update described BIA-ALCL as “rare” and stated “we have strengthened our understanding of this condition and concur with the World Health Organization designation of breast implant-associated anaplastic large cell lymphoma (BIA-ALCL) as a rare T-cell lymphoma that can develop following breast implants. The exact number of cases remains difficult to determine due to significant limitations in world-wide reporting and lack of global implant sales data. At this time, most data suggest that BIA-ALCL occurs more frequently following implantation of breast implants with textured surfaces rather than those with smooth surfaces.” The FDA noted it does not recommend prophylactic breast implant removal in a patient without symptoms or other abnormalities.
In March 2018, the FDA further updated its reporting on BIA-ALCL stating “we are reporting that we are aware of 414 total cases of BIA-ALCL. Additionally, studies reported in medical literature estimate that the lifetime risk of developing BIA-ALCL for patients with textured breast implants ranges from 1 in 3,817 to 1 in 30,000.” The FDA noted that the update did not change the agency’s recommendation and that choosing to obtain a breast implant is a very personal decision that patients and providers should make with the most complete information available.
On February 6, 2019, the FDA further reported that as of September 2018, the agency had received a total of 660 total medical device reports regarding BIA-ALCL cases since 2010. Of the 660 reports, the FDA’s analysis suggested that there are 457 unique cases of BIA-ALCL, including nine patient deaths and noted that BIA-ALCL will be one important topic of discussion at the agency’s upcoming public meeting of the General and Plastic Surgery Devices Panel at the FDA’s headquarters March 25-26, 2019. Additionally, on February 12, 2019, Health Canada confirmed that as of January 1, 2019, it had received reports of 22 confirmed and 22 suspected Canadian cases of BIA-ALCL and that it would be updating its safety review of BIA-ALCL in Spring 2019.
We do not produce the type of more rough textured implants that were involved in most of these reports, and, to date, no cases of BIA-ALCL have been reported in women with Motiva Implants. Future clinical studies or clinical experience may indicate that breast implants expose patients to greater risks of BIA-ALCL, which may reduce demand for silicone implants generally, expose us to product liability claims, as well as to class actions and other lawsuits. These impacts may occur in the absence of any specific linkage with our products. Moreover, if cases of BIA-ALCL or other complications are discovered in the future and/or are reported in patients with Motiva Implants, we could be subject to mandatory product recalls, suspension or withdrawal of our regulatory licensure for sale in one or more countries, and significant legal liability. Any of these may have an adverse effect on our business or operating results, or a negative impact on our share price.
41
Risks Related to Intellectual Property
The medical device industry is characterized by patent litigation and we could become subject to litigation that could be costly, result in the diversion of management's time and efforts, require us to pay damages or prevent us from marketing our existing or future products.
Patent litigation is prevalent in the medical device and diagnostic sectors. Our commercial success depends in part upon our ability and that of our distributors, contract manufacturers, and suppliers to manufacture, market, to sell our planned products, and to use our proprietary technologies without infringing, misappropriating or otherwise violating the proprietary rights or intellectual property of third parties. We may become party to, or be threatened with, future adversarial proceedings or litigation regarding intellectual property rights with respect to our products and technology. Third parties may assert infringement claims against us based on existing or future intellectual property rights. If we are found to infringe a third-party’s intellectual property rights, we could be required to obtain a license from such third-party to continue developing and marketing our products and technology. We may also elect to enter into such a license in order to settle pending or threatened litigation. However, we may not be able to obtain any required license on commercially reasonable terms, or at all. Even if we were able to obtain a license, it could be non-exclusive, thereby giving our competitors access to the same technologies licensed to us, and could require us to pay significant royalties and other fees. We could be forced, including by court order, to cease commercializing the infringing technology or product. In addition, we could be found liable for monetary damages. A finding of infringement could prevent us from commercializing our planned products in commercially important territories, or force us to cease some of our business operations, which could harm our business. Many of our employees were previously employed at, and many of our current advisors and consultants are employed by, universities or other biotechnology, medical device or pharmaceutical companies, including our competitors or potential competitors. Although we try to ensure that our employees, advisors and consultants do not use the proprietary information or know-how of others in their work for us, we may be subject to claims that we, or these employees, have used or disclosed intellectual property, including trade secrets or other proprietary information, of any such employee’s former employer. These and other claims that we have misappropriated the confidential information or trade secrets of third parties can have a similar negative impact on our business to the infringement claims discussed above.
Even if we are successful in defending against intellectual property claims, litigation or other legal proceedings relating to such claims may cause us to incur significant expenses, and could distract our technical and management personnel from their normal responsibilities. In addition, there could be public announcements of the results of hearings, motions or other interim proceedings or developments and if securities analysts or investors perceive these results to be negative, it could have a substantial adverse effect on the price of our common shares. Such litigation or proceedings could substantially increase our operating losses and reduce our resources available for development activities. We may not have sufficient financial or other resources to adequately conduct such litigation or proceedings. Some of our competitors may be able to sustain the costs of such litigation or proceedings more effectively than we can because of their substantially greater financial resources. Uncertainties resulting from the initiation and continuation of litigation or other intellectual property related proceedings could have a material adverse effect on our ability to compete in the marketplace.
If we fail to comply with our obligations in our intellectual property agreements, we could lose intellectual property rights that are important to our business.
We are a party, and expect to become party in the future, to certain intellectual property agreements that impose various diligence, milestone payment, royalty, insurance and other obligations on us. If we fail to comply with these obligations, any licensor may have the right to terminate such agreements, in which event we may not be able to develop and market any product that is covered by such agreements. Termination of such agreements, or reduction or elimination of our rights under such agreements, may result in our having to negotiate new or reinstated arrangements on less favorable terms, or our not having sufficient intellectual property rights to operate our business. The occurrence of such events could harm our business and financial condition.
The risks described elsewhere in this Annual Report on Form 10-K pertaining to our intellectual property rights also apply to any intellectual property rights that we may license, and any failure by us or any future licensor to obtain, maintain, defend and enforce these rights could have a material adverse effect on our business.
42
If we are not able to obtain and maintain intellectual property protection for our products and technologies, or if the scope of our patents is not sufficiently broad, we may not be able to effectively maintain our market leading technology position.
Our success depends in large part on our ability to obtain and maintain patent and other intellectual property protection in the United States and in other countries with respect to our proprietary technology and products.
The patent position of medical device and diagnostic companies generally is highly uncertain and involves complex legal and factual questions for which legal principles remain unresolved. In recent years, patent rights have been the subject of significant litigation. As a result, the issuance, scope, validity, enforceability and commercial value of the patent rights we rely on are highly uncertain. Pending and future patent applications may not result in patents being issued which protect our technology or products or which effectively prevent others from commercializing competitive technologies and products. Changes in either the patent laws or interpretation of the patent laws in the United States and other countries may diminish the value of the patents we rely on or narrow the scope of our patent protection. The laws of other countries may not protect our rights to the same extent as the laws of the U.S. Publications of discoveries in the scientific literature often lag behind the actual discoveries, and patent applications in the United States and other jurisdictions are typically not published until 18 months after filing, or in some cases not at all. Therefore, we cannot be certain that we were the first to make the inventions claimed in our patents or pending patent applications, or that we or were the first to file for patent protection of such inventions.
Even if the patent applications we rely on issue as patents, they may not issue in a form that will provide us with any meaningful protection, prevent competitors from competing with us or otherwise provide us with any competitive advantage. Our competitors may be able to circumvent our patents by developing similar or alternative technologies or products in a non-infringing manner. The issuance of a patent is not conclusive as to its scope, validity or enforceability, and the patents we rely on may be challenged in the courts or patent offices in the United States and abroad. Such challenges may result in patent claims being narrowed, invalidated or held unenforceable, which could limit our ability to stop or prevent us from stopping others from using or commercializing similar or identical technology and products, or limit the duration of the patent protection of our technology and products. Given the amount of time required for the development, testing and regulatory review of new planned products, patents protecting such products might expire before or shortly after such products are commercialized. As a result, our patent portfolio may not provide us with sufficient rights to exclude others from commercializing products similar or identical to ours or otherwise provide us with a competitive advantage.
We may become involved in legal proceedings to protect or enforce our intellectual property rights, which could be expensive, time consuming, or unsuccessful.
Competitors may infringe or otherwise violate the patents we rely on, or our other intellectual property rights. To counter infringement or unauthorized use, we may be required to file infringement claims, which can be expensive and time-consuming. Any claims that we assert against perceived infringers could also provoke these parties to assert counterclaims against us alleging that we infringe their intellectual property rights. In addition, in an infringement proceeding, a court may decide that a patent we are asserting is invalid or unenforceable, or may refuse to stop the other party from using the technology at issue on the grounds that the patents we are asserting do not cover the technology in question. An adverse result in any litigation proceeding could put one or more patents at risk of being invalidated or interpreted narrowly. Furthermore, because of the substantial amount of discovery required in connection with intellectual property litigation, there is a risk that some of our confidential information could be compromised by disclosure during this type of litigation.
Interference or derivation proceedings provoked by third parties or brought by the U.S. Patent and Trademark Office, or USPTO, or any other patent authority may be necessary to determine the priority of inventions or other matters of inventorship with respect to patents and patent applications. We may become involved in proceedings, including oppositions, interferences, derivation proceedings inter partes reviews, patent nullification proceedings, or re-examinations, challenging our patent rights or the patent rights of others, and the outcome of any such proceedings are highly uncertain. An adverse determination in any such proceeding could reduce the scope of, or invalidate, important patent rights, allow third parties to commercialize our technology or products and compete directly with us, without payment to us, or result in our inability to manufacture or commercialize products without infringing third-party patent rights. Our business also could be harmed if a prevailing party does not offer us a license on commercially reasonable terms, if any license is offered at all. Litigation or other proceedings may fail and, even if successful, may result in substantial costs and distract our management and other employees. We
43
may also become involved in disputes with others regarding the ownership of intellectual property rights. If we are unable to resolve these disputes, we could lose valuable intellectual property rights.
Even if resolved in our favor, litigation or other legal proceedings relating to intellectual property claims may cause us to incur significant expenses, and could distract our technical or management personnel from their normal responsibilities. In addition, there could be public announcements of the results of hearings, motions or other interim proceedings or developments and if securities analysts or investors perceive these results to be negative, it could have a substantial adverse effect on the market price of our common shares. Such litigation or proceedings could substantially increase our operating losses and reduce the resources available for development activities or any future sales, marketing or distribution activities. Uncertainties resulting from the initiation and continuation of intellectual property litigation or other proceedings could have an adverse effect on our ability to compete in the marketplace.
If we are unable to protect the confidentiality of our trade secrets, the value of our technology could be materially adversely affected, harming our business and competitive position.
In addition to our patented technology and products, we rely upon confidential proprietary information, including trade secrets, unpatented know-how, technology and other proprietary information, to develop and maintain our competitive position. Any disclosure to or misappropriation by third parties of our confidential proprietary information could enable competitors to quickly duplicate or surpass our technological achievements, thus eroding our competitive position in the market. We seek to protect our confidential proprietary information, in part, by confidentiality agreements with our employees and our collaborators and consultants. We also have agreements with our employees and selected consultants that obligate them to assign their inventions to us. These agreements are designed to protect our proprietary information, however, we cannot be certain that our trade secrets and other confidential information will not be disclosed or that competitors will not otherwise gain access to our trade secrets, or that technology relevant to our business will not be independently developed by a person that is not a party to such an agreement. Furthermore, if the employees, consultants or collaborators that are parties to these agreements breach or violate the terms of these agreements, we may not have adequate remedies for any such breach or violation, and we could lose our trade secrets through such breaches or violations. Further, our trade secrets could be disclosed, misappropriated or otherwise become known or be independently discovered by our competitors. In addition, intellectual property laws in foreign countries may not protect trade secrets and confidential information to the same extent as the laws of the United States. If we are unable to prevent disclosure of the intellectual property related to our technologies to third parties, we may not be able to establish or maintain a competitive advantage in our market, which would harm our ability to protect our rights and have an adverse effect on our business.
We may not be able to protect or enforce our intellectual property rights throughout the world.
Filing, prosecuting and defending patents on all of our planned products throughout the world may be prohibitively expensive to us. Competitors may use our technologies in jurisdictions where we have not obtained patent protection to develop their own products and, further, may export otherwise infringing products to territories where we have patent protection but where enforcement is not as strong as in the United States. These products may compete with our products in jurisdictions where we do not have any issued patents and our patent claims or other intellectual property rights may not be effective or sufficient to prevent them from so competing. Many companies have encountered significant problems in protecting and defending intellectual property rights in international jurisdictions. The legal systems of certain countries, particularly certain developing countries, do not favor the enforcement of patents and other intellectual property protection, which could make it difficult for us to stop the infringement of our patents or marketing of competing products in violation of our proprietary rights generally. Proceedings to enforce our patent rights in foreign jurisdictions could result in substantial cost and divert our efforts and attention from other aspects of our business.
Obtaining and maintaining patent protection depends on compliance with various procedural, document submission, fee payment and other requirements imposed by governmental patent agencies, and our patent protection could be reduced or eliminated for non-compliance with these requirements.
Periodic maintenance fees, renewal fees, annuity fees and various other governmental fees on patents or applications will be due to be paid by us to the USPTO and various governmental patent agencies outside of the United States in several stages over the lifetime of the patents or applications. The USPTO and various non-U.S. governmental patent agencies require compliance with a number of procedural, documentary, fee payment and
44
other similar provisions during the patent application process. In many cases, an inadvertent lapse can be cured by payment of a late fee or by other means in accordance with the applicable rules. However, there are situations in which noncompliance can result in abandonment or lapse of the patent or patent application, resulting in partial or complete loss of patent rights in the relevant jurisdiction. In such an event, our competitors might be able to use our technologies and this circumstance would have a material adverse effect on our business.
Our internal computer systems, or those used by third parties which we rely on, may fail or suffer security breaches.
Despite the implementation of security measures, our internal computer systems, or those used by third parties which we rely on, are vulnerable to damage from computer viruses and unauthorized access, malware, natural disasters, fire, terrorism, war and telecommunication, electrical failures, cyber-attacks or cyber-intrusions over the Internet, attachments to emails, persons inside our organization, or persons with access to systems inside our organization. The risk of a security breach or disruption, particularly through cyber-attacks or cyber intrusion, including by computer hackers, foreign governments, and cyber terrorists, has generally increased as the number, intensity and sophistication of attempted attacks and intrusions from around the world have increased. While we have not experienced any such material system failure or security breach to our knowledge to date, if such an event were to occur and cause interruptions in our operations, it could result in a material disruption of our development programs and our business operations. For example, the loss of data from completed, ongoing or future studies could result in delays in our regulatory approval efforts and significantly increase our costs to recover or reproduce the data. To the extent that any disruption or security breach were to result in a loss of, or damage to, our data or applications, or inappropriate disclosure of confidential or proprietary information, we could incur liability and the further development and commercialization of our current and future products could be delayed.
Risks Related to Government Regulation
The regulatory approval process is expensive, time consuming and uncertain, and may prevent us from obtaining approvals for the commercialization of Motiva Implants or our planned products.
The research, testing, manufacturing, labeling, approval, selling, import, export, marketing and distribution of medical devices are subject to extensive regulation by the FDA and other regulatory authorities in the United States and other countries, where regulations differ from country to country. Our products are registered to be sold in over 60 countries, but we are not permitted to market our planned products in the United States until we receive the requisite approval or clearance from the FDA. We have not submitted an application or received marketing approval for Motiva Implants or any planned products in the United States. Obtaining PMA approval for sale for a medical device from the FDA can be a lengthy, expensive and uncertain process. In addition, failure to comply with FDA and other applicable U.S. and foreign regulatory requirements may subject us to administrative or judicially imposed sanctions, including the following:
|
•
|
warning letters;
|
|
•
|
civil or criminal penalties and fines;
|
|
•
|
injunctions;
|
|
•
|
suspension or withdrawal of regulatory approval;
|
|
•
|
suspension of any ongoing clinical studies;
|
|
•
|
voluntary or mandatory product recalls and publicity requirements;
|
|
•
|
refusal to accept or approve applications for marketing approval of new devices or supplements to approved applications filed by us;
|
|
•
|
restrictions on operations, including costly new manufacturing requirements; or
|
|
•
|
seizure or detention of our products or import bans.
|
Prior to receiving approval to commercialize any of our planned products in the United States or abroad, we may be required to demonstrate with substantial evidence from preclinical and well-controlled clinical studies, and to the satisfaction of the FDA or other regulatory authorities abroad, that such planned products are safe and effective for their intended uses. Results from preclinical studies and clinical studies can be interpreted in different
45
ways. Even if we believe the preclinical or clinical data for our planned products are promising, such data may not be sufficient to support approval by the FDA and other regulatory authorities. Administering any of our planned products to humans may produce undesirable side effects, which could interrupt, delay or cause suspension of clinical studies of our planned products and result in the FDA or other regulatory authorities denying approval of our planned products for any or all targeted indications.
Regulatory approval from the FDA is not guaranteed, and the approval process is expensive and may take several years. The FDA also has substantial discretion in the approval process. Despite the time and expense exerted, failure can occur at any stage, and we could encounter problems that cause us to abandon or repeat clinical studies, or perform additional preclinical studies and clinical studies. The number of preclinical studies and clinical studies that will be required for FDA approval varies depending on the planned product, the indication that the planned product is designed to address and the regulations applicable to any particular planned product. The FDA can delay, limit or deny approval of a planned product for many reasons, including, but not limited to, the following:
▪
a planned product or one or more of its features may not be deemed safe or effective;
▪
FDA officials may not find the data from preclinical studies and clinical studies sufficient;
▪
the FDA might not approve our manufacturing or our third-party supplier’s processes or facilities; or
▪
the FDA may change its approval policies or adopt new regulations.
If Motiva Implants or any planned products fail to demonstrate safety and efficacy in preclinical and clinical studies or do not gain regulatory approval, our business and results of operations will be harmed.
Even if we receive regulatory approval for a planned product, we will be subject to ongoing regulatory obligations and continued regulatory review, which may result in significant additional expense and subject us to penalties if we fail to comply with applicable regulatory requirements.
When a regulatory approval is obtained, the approved product and its manufacturer are subject to continual review by the FDA or non-U.S. regulatory authorities. Our regulatory approval for Motiva Implants, as well as any regulatory approval that we receive for Motiva Implants or for any planned products may be subject to limitations on the indicated uses for which the product may be marketed. Future approvals may contain requirements for potentially costly post-marketing follow-up studies to monitor the safety and efficacy of the approved product. In addition, we are subject to extensive and ongoing regulatory requirements by the FDA and other regulatory authorities with regard to the labeling, packaging, adverse event reporting, storage, advertising, promotion and recordkeeping for our products. In addition, we are required to comply with regulations regarding the manufacture of Motiva Implants, which include requirements related to quality control and quality assurance as well as the corresponding maintenance of records and documentation. Further, regulatory authorities must inspect these manufacturing facilities and determine they are in compliance with FDA good manufacturing practice requirements as set forth in the Quality System Regulation, or QSR, before the products can be approved. These facilities are subject to continual review and periodic inspections by the FDA and other regulatory authorities for compliance with QSR regulations. If we or a third party discover previously unknown problems with a product, such as adverse events of unanticipated severity or frequency, or problems with the facility where the product is manufactured, a regulatory authority may impose restrictions on that product, the manufacturer or us, including requiring withdrawal of the product from the market or suspension of manufacturing.
Health care reform measures could hinder or prevent our planned products’ commercial success.
In the United States, there have been, and we expect there will continue to be, a number of legislative and regulatory changes to the health care system in ways that could affect our future revenue and future profitability and the future revenue and future profitability of our potential customers. Federal and state lawmakers regularly propose and, at times, enact legislation that could result in significant changes to the health care system, some of which are intended to contain or reduce the costs of medical products and services. For example, one of the most significant health care reform measures in decades, the Patient Protection and Affordable Care Act, as amended by the Health Care and Education Reconciliation Act, or PPACA, was enacted in 2010. The PPACA contains a number of provisions, including those governing enrollment in federal health care programs, reimbursement changes and fraud and abuse measures, all of which will impact existing government health care programs and will result in the development of new programs. The PPACA, among other things, could result in the imposition of injunctions and imposes a tax of 2.3% on the retail sales price of medical devices sold after December 31, 2012.
46
This tax may apply to Motiva Implants and some or all of our products which are in development. The excise tax has been temporarily suspended through the end of 2019, but will be reinstated in 2020 without additional Congressional action.
Some provisions of the PPACA have yet to be implemented, and there have been judicial and Congressional challenges to certain aspects of the PPACA, as well as recent efforts by the Trump administration to repeal or replace certain aspects of the PPACA. While Congress has not passed comprehensive repeal legislation, we expect there will be additional challenges and amendments to the PPACA in the future as new administrations and politicians are elected. Since January 2017, two executive orders have been signed and other directives designed to delay, circumvent, or loosen certain requirements mandated by the PPACA. Concurrently, Congress has considered legislation that would repeal and replace all or part of the PPACA. While Congress has previously been successful at passing comprehensive repeal legislation through both Chambers of Congress, it had then been vetoed by former President Obama; however full repeal legislation is unlikely in the current political climate. Furthermore, the Tax Cuts and Jobs Act passed in December of 2017 included a provision that would repeal one of the primary pillars of the law, the PPACA’s individual mandate penalty that essentially assessed a monetary penalty or fine on certain individuals who fail to maintain qualifying health coverage for all or part of a year. Congress may consider other legislation to repeal or replace elements of the PPACA on a provision-by-provision basis. We cannot assure you that the PPACA, as currently enacted or as amended in the future, will not adversely affect our business and financial results and we cannot predict how future federal or state legislative or administrative changes relating to health care reform will affect our business. Furthermore, legislators continue efforts to repeal and replace other elements of the PPACA. While the result of these efforts is not yet known, any changes that result in price controls reduce access to and reimbursement for care or add additional regulations may have an adverse effect on our financial condition and results of operations.
In addition, other legislative changes have been proposed and adopted since the PPACA was enacted. For example, the Budget Control Act of 2011, among other things, created the Joint Select Committee on Deficit Reduction to recommend proposals for spending reductions to Congress. The Joint Select Committee did not achieve a targeted deficit reduction of at least $1.2 trillion for the years 2013 through 2021, which triggered the legislation’s automatic reduction to several government programs, including aggregate reductions to Medicare payments to providers of up to 2% per fiscal year, starting in 2013, which, due to subsequent legislative amendments to the statute, including the Bipartisan Budget Act of 2018, will remain in effect through 2027 unless additional Congressional action is taken. We cannot predict whether any additional legislative changes will affect our business.
There likely will continue to be legislative and regulatory proposals at the federal and state levels directed at containing or lowering the cost of health care. We cannot predict the initiatives that may be adopted in the future or their full impact. The continuing efforts of the government, insurance companies, managed care organizations and other payors of health care services to contain or reduce costs of health care may adversely affect:
▪
our ability to set a price that we believe is fair for our products;
▪
our ability to generate revenue and achieve or maintain profitability; and
▪
the availability of capital.
If we fail to comply with health care regulations, we could face substantial penalties and our business, operations and financial condition could be adversely affected.
Certain federal and state health care laws and regulations pertaining to fraud and abuse and patients’ rights are and will be applicable to our business. If we are approved by the FDA to market our products in the United States, we could be subject to health care fraud and abuse and patient privacy regulation by both the federal government and the states in which we conduct our business. The regulations that may affect our ability to operate include, without limitation:
|
•
|
the federal Anti-Kickback Statute, which prohibits, among other things, any person from knowingly and willfully offering, soliciting, receiving or providing remuneration, directly or indirectly, in exchange for or to induce either the referral of an individual for, or the purchase, order or recommendation of, any good or service for which payment may be made under federal health care programs, such as the Medicare and Medicaid programs;
|
47
|
•
|
the federal physician self-referral law, commonly known as the Stark Law, which prohibits, among other things, physicians who have a financial relationship, including an investment, ownership or compensation relationship with an entity, from referring Medicare and Medicaid patients to that entity for designated health services, unless an exception applies. Similarly, entities may not bill Medicare, Medicaid or any other party for services furnished pursuant to a prohibited referral. Unlike the federal Anti-Kickback Statute, the Stark Law is a strict liability statute, meaning that all of the requirements of a Stark Law exception must be met in order to be compliant with the law;
|
|
•
|
the federal civil and criminal false claims and civil monetary penalties laws, including the federal False Claims Act, which prohibits, among other things, individuals or entities from knowingly presenting, or causing to be presented, false claims, or knowingly using false statements, to obtain payment from the federal government;
|
|
•
|
HIPAA, which prohibits, executing a scheme to defraud any health care benefit program or making false statements relating to health care matters;
|
|
•
|
the federal transparency requirements under the PPACA which requires certain manufacturers of drugs, devices, biologics and medical supplies to annual report to the HHS information related to physician payments and other transfers of value made to physicians and teaching hospitals, as well as ownership and investment interests held by physicians and their immediate family members;
|
|
•
|
HIPAA, as amended by the Health Information Technology for Economic and Clinical Health Act, which governs the conduct of certain electronic health care transactions and protects the security and privacy of protected health information;
|
|
•
|
state law equivalents of each of the above federal laws, such as anti-kickback, transparency and false claims laws which may apply to items or services reimbursed by any third-party payor, including commercial insurers, as well as state post-marketing compliance laws; and
|
|
•
|
state laws governing the privacy and security of health information in certain circumstances, many of which differ from each other in significant ways and often are not preempted by HIPAA, thus complicating compliance efforts.
|
The PPACA, among other things, amended the intent requirement of the federal Anti-Kickback Statute and criminal health care fraud statutes. A person or entity no longer needs to have actual knowledge of this statute or specific intent to violate it. In addition, the PPACA provides that the government may assert that a claim including items or services resulting from a violation of the federal Anti-Kickback Statute constitutes a false or fraudulent claim for purposes of the federal False Claims Act.
Similar regulations would also apply to our business in countries where we have started direct sales operations, like Brazil and several others within the European Union, where they have different regulations at European and national levels. There is a high degree of complication in complying with the different levels of regulation and the singular differences in the different countries and markets.
If our operations are found to be in violation of any of the laws described above or any other governmental regulations that apply to us, we may be subject to penalties, including civil, criminal and administrative penalties, damages, fines, disgorgement, individual imprisonment, exclusion from participation in Medicare, Medicaid and other federal healthcare programs, individual imprisonment, additional reporting and government oversight, if we become subject to a corporate integrity agreement or similar agreement to resolve allegations of non-compliance with these laws and the curtailment or restructuring of our operations. Any such penalties or curtailment or restructuring of our operations could adversely affect our ability to operate our business and our financial results. Any action against us for violation of these laws, even if we successfully defend against it, could cause us to incur significant legal expenses and divert our management’s attention from the operation of our business. Moreover, achieving and sustaining compliance with applicable federal, state or international privacy, security and fraud laws may prove costly.
We have obtained the authorization to distribute our products in regions/countries such as Europe and Brazil through the certification of our Quality System by the corresponding regulatory entities. Failing to demonstrate that our Quality System is in place, that consistently and systematically ensures compliance with regulations from such regions/countries might imply losing the certifications and as such, the rights to freely distribute the products which would adversely impact the company’s revenue and reputation.
48
French regulatory authorities at the ANSM are evaluating the biocompatibility of textured breast implants.
In February 2016, the ANSM set up a temporary scientific committee to assess the biocompatibility of implantable breast prostheses. Its objective is “to give an opinion on the documented demonstration of the biocompatibility of implantable breast implants from manufacturers.”
Accordingly, all manufacturers of breast implants marketed in France, including us, received correspondence from ANSM authorities during the first half of 2015, requesting certain biocompatibility compliance data on breast implants. A period of twelve months was set for all manufacturers to complete the demonstration of conformity with the enhanced biocompatibility requirements. During September 2016, we met with the ANSM to discuss conducting a testing plan to be completed during 2017, and have submitted information and responses to follow up requests to ANSM on multiple occasions from July 2017 to November 2017. The ANSM authorities have stated that they may suspend marketing of implants that do not demonstrate conformity within the timeframe given. While France by itself is a very small market for us, we anticipate that the results of this regulatory inquiry will influence other regulatory agencies in a variety of countries. It is possible that the ALCL risk factor will become highly publicized as a result, and this could negatively, and significantly, impact demand for breast implants globally. Any suspension of sale of our implants in France would adversely affect our business and sales in France and could negatively influence our sales in other countries.
The Dutch Health Care Inspectorate, together with the RIVM, are evaluating silicone breast implants through a market surveillance study.
In 2015, the Netherlands National Institute for Public Health and the Environment, or RIVM, commissioned by the Dutch Health Care Inspectorate, initiated an assessment of the ten manufacturers that commercialize breast implants on the Dutch market, including us. The purpose was to investigate the quality of the silicone breast implants addressing a revision of the technical files, a physical-chemical characterization of the silicone materials, biocompatibility and identifying any concern related to the patient safety.
For this investigation, important parts of the technical files of each manufacturer of silicone breast implants were evaluated. In parallel, laboratory analyses were performed on the chemical composition and potentially harmful properties of the implants. Each manufacturer was evaluated based on the assessment of the technical files, and the information was published initially without identifying the results to the manufacturer.
Subsequently, each manufacturer presented an update of the findings and observations of this evaluation. In February 2018, the results of the updated assessment were published for the market surveillance study. In this reassessment, we corrected a typographical error in the name of our silicone gel. Laboratory analyses of the actual implants showed no deviations that could cause health damage. The Dutch Health Care Inspectorate has not revealed if they will continue with the assessments on a periodic basis or what other aspects they may evaluate. Any deficiencies of our implants in the Netherlands could adversely affect our business and sales in Europe and throughout the world.
Risks Related to Ownership of Our Securities
Our share price may be volatile, and purchasers of our securities could incur substantial losses.
Our common shares have only recently become publicly traded, and we expect that the price of our common shares will likely be volatile. The securities markets in general, and the market for biotechnology and medical device companies in particular, have experienced extreme volatility that has often been unrelated to the operating performance of particular companies. Additionally, the lack of an active market may impair the value of our common shares, or your ability to sell your shares at the time you wish to sell them or at a price that you consider reasonable. Although our common shares are listed on the Nasdaq Capital Market, if we fail to satisfy the continued listing standards, we could be de-listed, which would negatively impact the price of our common shares. The market price for our shares may be influenced by many factors, including the following:
|
•
|
our ability to successfully commercialize, and realize revenues from sales of, Motiva Implants, MotivaImagine Centers and Motiva branded surgeries;
|
|
▪
|
the success of competitive products or technologies;
|
|
▪
|
results of clinical studies of Motiva Implants or planned products or those of our competitors;
|
49
|
•
|
regulatory or legal developments in the United States and other countries, especially changes in laws or regulations applicable to our products;
|
|
•
|
introductions and announcements of new products by us, our commercialization partners, or our competitors, and the timing of these introductions or announcements;
|
|
•
|
actions taken by regulatory agencies with respect to our products, clinical studies, manufacturing processes or sales and marketing terms;
|
|
•
|
variations in our financial results or those of companies that are perceived to be similar to us;
|
|
•
|
the success of our efforts to acquire or in-license additional products or planned products;
|
|
•
|
developments concerning our collaborations, including but not limited to those with our sources of manufacturing supply and our commercialization partners;
|
|
•
|
developments concerning our ability to bring our manufacturing processes to scale in a cost-effective manner;
|
|
•
|
announcements by us or our competitors of significant acquisitions, strategic partnerships, joint ventures or capital commitments;
|
|
•
|
developments or disputes concerning patents or other proprietary rights, including patents, litigation matters and our ability to obtain patent protection for our products;
|
|
•
|
our ability or inability to raise additional capital and the terms on which we raise it;
|
|
•
|
the recruitment or departure of key personnel;
|
|
•
|
changes in the structure of health care payment systems;
|
|
•
|
negative shifts in the economy effecting the number of aesthetic breast procedures;
|
|
•
|
market conditions in the pharmaceutical and biotechnology sectors;
|
|
•
|
actual or anticipated changes in earnings estimates or changes in securities analyst recommendations regarding our common shares, other comparable companies or our industry generally;
|
|
•
|
trading volume of our common shares;
|
|
•
|
sales of our common shares by us or our shareholders;
|
|
•
|
general economic, industry and market conditions; and
|
|
•
|
the other risks described in this “Risk Factors” section.
|
These broad market and industry factors may harm the market price of our common shares, regardless of our operating performance. In the past, following periods of volatility in the market, securities class-action litigation has often been instituted against companies. Such litigation, if instituted against us, could result in substantial costs and diversion of management’s attention and resources, which could adversely affect our business, financial condition, results of operations and growth prospects.
CPH TU, LP, an entity affiliated with one of our directors, owns a significant percentage of our common shares and will exercise significant influence over matters requiring shareholder approval.
CPH TU, LP, or CPH, an entity affiliated with one of our directors, Nicholas Lewin, beneficially owned
36.5%
of our outstanding common shares as of December 31, 2018. Nicholas Lewin and CPH will therefore have significant influence over management and significant control over matters requiring shareholder approval, including the annual election of directors and significant corporate transactions, such as a merger or other sale of our company or its assets, for the foreseeable future. This concentrated control may limit shareholders’ ability to influence corporate matters and, as a result, we may take actions that our shareholders do not view as beneficial. As a result, the market price of our common shares could be adversely affected.
Future sales of our common shares, or the perception that future sales may occur, may cause the market price of our common shares to decline, regardless of our operating performance.
Sales of substantial amounts of our common shares in the public market after IPO, or the perception that these sales may occur, could materially and adversely affect the price of our common shares and could impair our ability
50
to raise capital through the sale of additional equity securities. All of the common shares sold in the IPO are freely tradable, without restriction, in the public market, except for any shares sold to our affiliates.
In connection with the IPO, we, our officers, directors, certain of our option holders, and holders of substantially all of our outstanding share capital agreed, subject to specified exceptions, not to directly or indirectly sell or transfer any common shares for 180 days after August 18, 2018 without the consent of Jefferies LLC, or Jefferies, and Cowen and Company, LLC, or Cowen. These lock-up restrictions have now elapsed.
We have filed a registration statement on Form S-8 under the Securities Act covering all of the common shares subject to options and restricted stock grants outstanding and reserved for issuance under our stock plans. This registration statement became effective immediately upon filing, and shares covered by this registration statement are eligible for sale in the public markets, subject to Rule 144 limitations applicable to affiliates and any lock-up agreements described above. In addition, the holders of an aggregate of 14,158,113 of our outstanding common shares have rights, subject to some conditions, to require us to file registration statements covering their shares or to include their shares in registration statements that we may file for ourselves or our shareholders.
Sales of substantial amounts of our common shares in the public market, or the perception that such sales could occur, could adversely affect the market price of our common shares and could materially impair our ability to raise capital through offerings of our common shares. We cannot predict what effect, if any, market sales of shares held by any shareholder or the availability of shares for future sale will have on the market price of our common shares.
We are an “emerging growth company,” and a “smaller reporting company,” and we cannot be certain if the reduced reporting requirements applicable to emerging growth companies or smaller reporting companies will make our common shares less attractive to investors.
We are an “emerging growth company,” as defined in the Jumpstart Our Business Startups Act, or the JOBS Act, which was enacted in April 2012 and a “smaller reporting company” under the Securities Exchange Act of 1934, or the Exchange Act. For as long as we continue to be an emerging growth company, we may take advantage of exemptions from various reporting requirements that are applicable to other public companies that are not emerging growth companies, including not being required to comply with the auditor attestation requirements of Section 404 of the Sarbanes-Oxley Act of 2002, or the Sarbanes-Oxley Act, reduced disclosure obligations regarding executive compensation in our periodic reports and proxy statements and exemptions from the requirements of holding a nonbinding advisory vote on executive compensation and shareholder approval of any golden parachute payments not previously approved. We could be an emerging growth company for up to five years, although circumstances could cause us to lose that status earlier. We will remain an emerging growth company until the earlier of (1) the last day of the fiscal year following the fifth anniversary of the completion of our IPO, (2) the last day of the fiscal year in which we have total annual gross revenue of at least $1.07 billion, (3) the date on which we are deemed to be a large accelerated filer, which means the market value of our common shares that is held by non-affiliates exceeds $700 million as of the prior June 30th, and (4) the date on which we have issued more than $1.0 billion in non-convertible debt securities during the prior three-year period. We will remain a smaller reporting company until we have a public float, or value attributable to stock held by non-affiliates, of at least $250 million, as measured on or prior to June 30th. After we are no longer an emerging growth company and for as long as we remain a smaller reporting company, we will remain eligible for certain exemptions, including not being required to comply with the auditor attestation requirements of Section 404 of the Sarbanes-Oxley Act and reduced disclosure obligations regarding executive compensation, but we will be required to hold a nonbinding advisory vote on executive compensation and obtain stockholder approval of golden parachute payments. We cannot predict if investors will find our common shares less attractive because we may rely on these exemptions. If some investors find our common shares less attractive as a result, there may be a less active trading market for our common shares and our share price may suffer or be more volatile.
Under the JOBS Act, emerging growth companies can delay adopting new or revised accounting standards issued subsequent to the enactment of the JOBS Act until such time as those standards apply to private companies. We have elected to take advantage of the extension of time to comply with new or revised financial accounting standards available under Section 102(b) of the JOBS Act.
We could be subject to securities class action litigation.
In the past, securities class action litigation has often been instituted against companies whose securities have experienced periods of volatility in market price. Securities litigation brought against us following volatility in the
51
price of our ordinary shares, regardless of the merit or ultimate results of such litigation, could result in substantial costs, which would hurt our financial condition and results of operations and divert management’s attention and resources from our business.
Our directors and principal shareholders continue to maintain the ability to control or significantly influence all matters submitted to shareholders for approval.
As of December 31, 2018, our executive officers, directors and shareholders who own more than 5% of our outstanding common shares, in the aggregate, assuming the exercise of all options held by such persons, beneficially owned shares representing approximately
51.9%
of our common shares. As a result, if these shareholders were to choose to act together, they would be able to control or significantly influence all matters submitted to our shareholders for approval, as well as our management and affairs. For example, these shareholders, if they choose to act together, will control or significantly influence the election of directors and approval of any merger, consolidation or sale of all or substantially all of our assets. This concentration of voting power could delay or prevent an acquisition of our company on terms that other shareholders may desire.
We will incur significant increased costs as a result of operating as a public company, and our management will be required to devote substantial time to new compliance initiatives.
As a public company, we will incur significant legal, accounting and other expenses that we did not incur as a private company. We will be subject to the reporting requirements of the Exchange Act, the other rules and regulations of the Securities and Exchange Commission, or SEC, and the rules and regulations of Nasdaq. The expenses that will be required in order to adequately prepare for being a public company will be material, and compliance with the various reporting and other requirements applicable to public companies will require considerable time and attention of management. For example, the Sarbanes-Oxley Act and the rules of the SEC and national securities exchanges have imposed various requirements on public companies, including requiring establishment and maintenance of effective disclosure and financial controls. Our management and other personnel will need to devote a substantial amount of time to these compliance initiatives. These rules and regulations will continue to increase our legal and financial compliance costs and will make some activities more time-consuming and costly. For example, we expect these rules and regulations to make it more difficult and more expensive for us to obtain director and officer liability insurance, and we may be required to accept reduced policy limits on coverage or incur substantial costs to maintain the same or similar coverage. The impact of these events could also make it more difficult for us to attract and retain qualified personnel to serve on our Board of Directors, our board committees, or as executive officers.
The Sarbanes-Oxley Act requires, among other things, that we maintain effective internal control over financial reporting and disclosure controls and procedures. In particular, we must perform system and process evaluation and testing of our internal control over financial reporting to allow management to report on the effectiveness of our internal control over financial reporting, as required by Section 404 of the Sarbanes-Oxley Act, beginning with our second annual report on Form 10-K. In addition, we will be required to have our independent registered public accounting firm attest to the effectiveness of our internal control over financial reporting beginning with our annual report on Form 10-K following the date on which we are no longer an emerging growth company or a smaller reporting company. Our compliance with Section 404 of the Sarbanes-Oxley Act will require that we incur substantial accounting expense and expend significant management efforts. We currently do not have an internal audit group, and we will need to hire additional accounting and financial staff with appropriate public company experience and technical accounting knowledge. If we are not able to comply with the requirements of Section 404 in a timely manner, or if we or our independent registered public accounting firm identify deficiencies in our internal control over financial reporting that are deemed to be material weaknesses, the market price of our shares could decline and we could be subject to sanctions or investigations by Nasdaq, the SEC or other regulatory authorities, which would require additional financial and management resources.
Our ability to successfully implement our business plan and comply with Section 404 requires us to be able to prepare timely and accurate financial statements. We expect that we will need to continue to improve existing, and implement new operational and financial systems, procedures and controls to manage our business effectively. Any delay in the implementation of, or disruption in the transition to, new or enhanced systems, procedures or controls, may cause our operations to suffer and we may be unable to conclude that our internal control over financial reporting is effective and to obtain an unqualified report on internal controls from our auditors as required under Section 404 of the Sarbanes-Oxley Act. This, in turn, could have an adverse impact on trading prices for our common shares, and could adversely affect our ability to access the capital markets.
52
We have identified a material weakness in our internal control over financial reporting as of December 31, 2018 and may identify additional material weaknesses in the future that may cause us to fail to meet our reporting obligations or result in material misstatements of our consolidated financial statements. If we fail to remedy our material weaknesses, or if we fail to establish and maintain effective control over financial reporting, our ability to accurately and timely report our financial results could be adversely affected.
Our management is responsible for establishing and maintaining adequate internal control over financial reporting. Internal control over financial reporting is a process designed to provide reasonable assurance regarding the reliability of financial reporting and the preparation of financial statements in accordance with U.S. generally accepted accounting principles. A material weakness is a deficiency, or a combination of deficiencies, in internal control over financial reporting such that there is a reasonable possibility that a material misstatement of annual or interim financial statements will not be prevented or detected on a timely basis. Prior to the completion of our IPO, we were a private company with limited accounting and compliance personnel and other resources to address our internal control over financial reporting.
In connection with the preparation and audit of our 2017 financial statements, we had the following material weaknesses. We did not perform adequate reviews of the accounting for each tranche of the debt outstanding under the Madryn Credit Agreement and the standard-to-actual inventory costing. Further, at our Brazilian subsidiary, we did not employ an adequate number of accounting and finance professionals with the requisite expertise in order to timely and accurately capture, record and review the high volume of transactions.
Management determined that these material weaknesses were remediated as of December 31, 2018.
In connection with the preparation and audit of our 2018 financial statements, we had one material weakness. We did not perform an adequate review over the manual consolidation process, resulting in audit adjustments.
If our remedial measures are insufficient to address the material weakness, or if additional material weaknesses or significant deficiencies in our internal control are discovered or occur in the future, it may materially adversely affect our ability to report our financial condition and results of operations in a timely and accurate manner and impact investor confidence in our Company.
The actions we have taken are subject to continued review, supported by confirmation and testing by management as well as audit committee oversight. While we have implemented a plan to remediate these material weaknesses we cannot assure you that we will be able to remediate them, which could impair our ability to accurately and timely report our consolidated financial position, results of operations, or cash flows. Our failure to remediate the material weaknesses identified above or the identification and remediation of additional material weaknesses in the future, could adversely affect our ability to report financial information, including our filing of quarterly or annual reports with the SEC on a timely and accurate basis. Moreover, our failure to remediate the material weakness identified above or the identification of additional material weaknesses, could prohibit us from producing timely and accurate consolidated financial statements, which may adversely affect our share price and we may be unable to maintain compliance with Nasdaq listing requirements.
Our ability to use net operating losses to offset future taxable income and certain other tax attributes may be subject to certain limitations.
Federal and California laws impose restrictions on the utilization of net operating loss carryforwards and research and development credit carryforwards in the event of a change in ownership of the company, which constitutes an “ownership change” as defined by Internal Revenue Code Sections 382 and 383. Generally, an ownership change occurs if the percentage of the value of the shares that are owned by one or more direct or indirect “five percent shareholders” increases by more than 50% over their lowest ownership percentage at any time during the applicable testing period. If we have experienced an “ownership change” at any time since our formation, we may already be subject to limitations on our ability to utilize our existing net operating losses and other tax attributes. We have not experienced an ownership change in the past that would materially impact the availability of its net operating losses and tax credits. Nevertheless, future changes in our share ownership, which may be outside of our control, may trigger an “ownership change” and, consequently, Section 382 and 383 limitations. We have not completed a Section 382 and 383 analysis to determine if an ownership change has occurred. Until such analysis is completed, we cannot be sure that the full amount of the existing net operating loss carryforwards will be available to us, even if we do generate taxable income before their expiration. In addition, under the newly
53
enacted U.S. federal income tax law, federal net operating losses incurred in 2018 and in future years may be carried forward indefinitely, but the deductibility of such federal net operating losses is limited.
The recently passed comprehensive U.S. tax reform bill could adversely affect our business and financial condition.
On December 22, 2017, new legislation was passed that significantly revises the Internal Revenue Code of 1986, as amended. The newly enacted U.S. federal income tax law, among other things, contains significant changes to corporate taxation, including reduction of the corporate tax rate from a top marginal rate of 35% to a flat rate of 21%, limitation of the tax deduction for interest expense to 30% of adjusted earnings (except for certain small businesses), limitation of the deduction for net operating losses to 80% of current year taxable income and elimination of net operating loss carrybacks, one time taxation of offshore earnings at reduced rates regardless of whether they are repatriated, elimination of U.S. tax on foreign earnings (subject to certain important exceptions), immediate deductions for certain new investments instead of deductions for depreciation expense over time, and modifying or repealing many business deductions and credits. Notwithstanding the reduction in the corporate income tax rate, the overall impact of the new federal tax law is uncertain and our business and financial condition could be adversely affected. In addition, it is uncertain if and to what extent various states will conform to the newly enacted federal tax law. The impact of this tax reform on holders of our common shares is also uncertain and could be adverse. We urge our stockholders to consult with their legal and tax advisors with respect to this legislation and the potential tax consequences of investing in or holding our common shares.
Tax authorities may disagree with our positions and conclusions regarding certain tax positions, resulting in unanticipated costs, taxes or non-realization of expected benefits.
A tax authority may disagree with tax positions that we have taken, which could result in increased tax liabilities. For example, the U.S. Internal Revenue Service or another tax authority could challenge the amounts paid between our affiliated companies pursuant to our intercompany arrangements and transfer pricing policies. A tax authority may take the position that material income tax liabilities, interest and penalties are payable by us, in which case, we expect that we might contest such assessment. Contesting such an assessment may be lengthy and costly and if we were unsuccessful in disputing the assessment, the implications could increase our anticipated effective tax rate, where applicable. In addition, we may be subject to additional tax liabilities, which could materially and adversely affect our business, financial condition and results of operations. The application, interpretation and enforcement value-added tax, or VAT, and other taxes and related regulations applicable to medical device companies is complex and evolving.
We are a multinational organization faced with increasingly complex tax issues in many jurisdictions, and changes in tax laws or their application to the operation of our business could adversely impact our operating results and our business.
We conduct operations in multiple jurisdictions, and we are subject to certain taxes, including income, sales and use, employment, value added and other taxes, in the United States and other jurisdictions in which we do business. A change in the tax laws in the jurisdictions in which we do business, including an increase in tax rates or an adverse change in the treatment of an item of income or expense, possibly with retroactive effect, could result in a material increase in the amount of taxes we incur.
Our determination of our tax liability is subject to review by applicable U.S. and foreign tax authorities. Any adverse outcome of such a review could harm our operating results and financial condition. The determination of our worldwide provision for income taxes and other tax liabilities requires significant judgment and, in the ordinary course of business, there are many transactions and calculations where the ultimate tax determination is complex and uncertain. Moreover, as a multinational business, we have subsidiaries that engage in many intercompany transactions in a variety of tax jurisdictions where the ultimate tax determination is complex and uncertain. The taxing authorities of the jurisdictions in which we operate may challenge our methodologies, which could impact our financial position and operating results. Historically, we have allocated some of our employees’ and contractors’ time across multiple business entities in the international jurisdictions in which we operate. If it were determined that we had misclassified our employees’ or contractors’ employment status or certain of our expenditures under local laws, we may be subjected to penalties or be required to pay withholding taxes for, extend employee benefits to, provide compensation for unpaid overtime to, or otherwise incur substantially greater expenses with respect to such employees and contractors. Any of the foregoing circumstances could have a material adverse impact on our operating results and financial condition.
54
We are periodically reviewed and audited by tax authorities with respect to income and non-income taxes. Tax authorities may disagree with certain positions we have taken, and we may have exposure to additional income and non-income tax liabilities which could have an adverse effect on our operating results and financial condition. Such authorities could impose additional taxes, interest and penalties, claim that various withholding requirements apply to us or our subsidiaries or assert that benefits of tax treaties are not available to us or our subsidiaries. In addition, our future effective tax rates could be favorably or unfavorably affected by changes in tax rates, changes in the valuation of our deferred tax assets or liabilities, the effectiveness of our tax planning strategies, or changes in tax laws or their interpretation. Such changes could have an adverse impact on our financial condition.
As a result of these and other factors, the ultimate amount of tax obligations owed may differ from the amounts recorded in our financial statements and any such difference may harm our operating results in future periods in which we change our estimates of our tax obligations or in which the ultimate tax outcome is determined.
Discontinuation of preferential tax treatments we currently enjoy or other unfavorable changes in tax law could result in additional compliance obligations and costs.
Discontinuation of preferential tax treatments we currently enjoy or other unfavorable changes in tax law could result in additional compliance obligations and costs. We are currently the beneficiary of a tax holiday in Costa Rica pursuant to which we are subject to a tax at a 0% rate. However, there can be no assurance that we will continue to qualify for or receive such favorable tax treatment. If we fail to maintain such favorable tax treatment we may be subject to tax in Costa Rica at a significantly higher rate.
If a United States person is treated as owning at least 10% of our common shares, such holder may be subject to adverse U.S. federal income tax consequences.
If a United States person is treated as owning (directly, indirectly, or constructively) at least 10% of the value or voting power of our ordinary shares, such person may be treated as a “United States shareholder” with respect to each “controlled foreign corporation” in our group (if any). Following the IPO, we may be a controlled foreign corporation. In addition, because our group includes one or more U.S. subsidiaries, certain of our non-U.S. subsidiaries could be treated as controlled foreign corporations (regardless of whether or not we are treated as a controlled foreign corporation). A U.S. shareholder of a controlled foreign corporation may be required to report annually and include in its U.S. taxable income its pro rata share of “Subpart F income,” “global intangible low-taxed income,” and investments in U.S. property by controlled foreign corporations, regardless of whether we make any distributions. An individual that is a U.S. shareholder with respect to a controlled foreign corporation generally would not be allowed certain tax deductions or foreign tax credits that would be allowed to a U.S. shareholder that is a U.S. corporation. Failure to comply with these reporting obligations may subject a U.S. shareholder to significant monetary penalties and may prevent the statute of limitations with respect to such shareholder’s U.S. federal income tax return for the year for which reporting was due from starting. We cannot provide any assurances that we will assist investors in determining whether we or any of our non-U.S. subsidiaries is treated as a controlled foreign corporation or whether any investor is treated as a U.S. shareholder with respect to any such controlled foreign corporation or furnish to any U.S. shareholders information that may be necessary to comply with the aforementioned reporting and tax paying obligations. A U.S. investor should consult its advisors regarding the potential application of these rules to an investment in our common shares.
U.S. holders of our common shares may suffer adverse tax consequences if we are characterized as a passive foreign investment company.
A non-U.S. corporation will be classified as a passive foreign investment company, or PFIC, for U.S. federal income tax purposes, in any taxable year in which either (1) at least 75% of its gross income is passive income; or (2) at least 50% of the average quarterly value of its total gross assets is attributable to assets that produce “passive income” or are held for the production of passive income. Based on the project composition of our income and valuation of our assets, we do not believe we were a PFIC in 2017, and we do not expect to be a PFIC for our current taxable year or to become one in the future. However, because our PFIC status is subject to a number of uncertainties, neither we nor our tax advisors can provide any assurances regarding our PFIC status. If we are a PFIC for any taxable year during which a U.S. holder holds our common shares, the U.S. holder may be subject to adverse tax consequences. U.S. investors should consult their advisors regarding the application of these rules and the availability of any potential elections. See “Material British Virgin Island and U.S. Federal Income Tax Considerations.”
55
If securities or industry analysts do not publish research, or publish inaccurate or unfavorable research, about our business, our common share price and trading volume could decline.
The trading market for our common shares will depend, in part, on the research and reports that securities or industry analysts publish about us or our business. Securities and industry analysts do not currently, and may never, publish research on our company. If no securities or industry analysts commence coverage of our company, the trading price for our common shares would likely be negatively impacted. In the event securities or industry analysts initiate coverage, if one or more of the analysts who cover us downgrade our common shares or publish inaccurate or unfavorable research about our business, our share price would likely decline. In addition, if our operating results fail to meet the forecast of analysts, our share price would likely decline. If one or more of these analysts cease coverage of our company or fail to publish reports on us regularly, demand for our common shares could decrease, which might cause our share price and trading volume to decline.
Provisions in our amended and restated memorandum and articles of association and under British Virgin Islands law could make an acquisition of us more difficult and may prevent attempts by our shareholders to replace or remove our current management.
Provisions in our amended and restated memorandum and articles of association may discourage, delay or prevent a merger, acquisition or other change in control of us that shareholders may consider favorable, including transactions in which shareholders might otherwise receive a premium for their shares. These provisions could also limit the price that investors might be willing to pay in the future for our common shares, thereby depressing the market price of our common shares. In addition, these provisions may frustrate or prevent any attempts by our shareholders to replace or remove our current management by making it more difficult for shareholders to replace members of our Board of Directors. Because our Board of Directors is responsible for appointing the members of our management team, these provisions could in turn affect any attempt by our shareholders to replace current members of our management team. Among others, these provisions include the following:
|
•
|
our Board of Directors is divided into three classes with staggered three-year terms which may delay or prevent a change of our management or a change in control;
|
|
•
|
our Board of Directors has the right to elect directors to fill a vacancy created by the expansion of our Board of Directors or the resignation, death or removal of a director, which will prevent shareholders from being able to fill vacancies on our Board of Directors;
|
|
•
|
our shareholders are not be able to act by written consent, as a result, a holder, or holders, controlling a majority of our shares are not be able to take certain actions other than at annual shareholders’ meetings or special shareholders’ meetings;
|
|
•
|
our amended and restated memorandum and articles of association do not allow cumulative voting in the election of directors, which limits the ability of minority shareholders to elect director candidates;
|
|
•
|
amendments of our amended and restated memorandum and articles of association will require the approval of shareholders holding 66 2/3% of our outstanding voting shares (unless amended by the Board of Directors);
|
|
•
|
our shareholders are required to provide advance notice and additional disclosures in order to nominate individuals for election to our Board of Directors or to propose matters that can be acted upon at a shareholders’ meeting, which may discourage or deter a potential acquiror from conducting a solicitation of proxies to elect the acquiror’s own slate of directors or otherwise attempting to obtain control of our company; and
|
|
•
|
our Board of Directors is able to issue, without shareholder approval, preferred shares with voting or other rights or preferences that could impede the success of any attempt to acquire us.
|
Moreover, because we are incorporated in the British Virgin Islands, we are governed by the provisions of BVI Business Companies Act, 2004, as amended, or the BVI Act, which provide for different shareholder rights than a Delaware corporation. See, for example, the risk factor titled “Rights of shareholders under British Virgin Islands law differ from those under U.S. law, and, accordingly, you may have fewer protections as a shareholder.”
56
Our employment agreements with our executive officers may require us to pay severance benefits to any of those persons who are terminated in connection with a change in control of us, which could harm our financial condition or results.
Certain of our executive officers are parties to employment agreements that contain change in control and severance provisions providing for aggregate cash payments of up to approximately $1.0 million for severance and other benefits and acceleration of vesting of share options in the event of a termination of employment in connection with a change in control of our company. The accelerated vesting of options could result in dilution to our existing shareholders and harm the market price of our common shares. The payment of these severance benefits could harm our financial condition and results. In addition, these potential severance payments may discourage or prevent third parties from seeking a business combination with our company.
Because we do not anticipate paying any cash dividends on our common shares in the foreseeable future, capital appreciation, if any, will be our shareholders’ sole source of gain.
We currently intend to retain all of our future earnings, if any, to finance the growth and development of our business. In addition, the terms of existing or any future debt agreements may preclude us from paying dividends. For example, our credit agreement and guaranty with Madryn restricts our ability to pay dividends. As a result, capital appreciation, if any, of our common shares will be our shareholders’ sole source of gain for the foreseeable future.
Risks Related to Being a British Virgin Islands Company
Rights of shareholders under British Virgin Islands law differ from those under U.S. law, and, accordingly, you may have fewer protections as a shareholder.
Our corporate affairs are governed by our amended and restated memorandum and articles of association, the BVI Act, and the common law of the British Virgin Islands. The rights of shareholders to take legal action against our directors, actions by minority shareholders and the fiduciary responsibilities of our directors under British Virgin Islands law are to a large extent governed by the common law of the British Virgin Islands and by the BVI Act. The common law of the British Virgin Islands is derived in part from comparatively limited judicial precedent in the British Virgin Islands as well as from English common law, which has persuasive, but not binding, authority on a court in the British Virgin Islands. The rights of our shareholders and the fiduciary responsibilities of our directors under British Virgin Islands law are not as clearly established as they would be under statutes or judicial precedents in some jurisdictions in the United States. In particular, the British Virgin Islands has a less developed body of securities laws as compared to the
United States
, and some states (such as Delaware) have more fully developed and judicially interpreted bodies of corporate law. As a result of the foregoing, holders of our ordinary shares may have more difficulty in protecting their interests through actions against our management, directors or major shareholders than they would as shareholders of a U.S. company.
The laws of the British Virgin Islands provide limited protection for minority shareholders, so minority shareholders will have limited or no recourse if they are dissatisfied with the conduct of our affairs.
Under the laws of the British Virgin Islands, there is limited statutory law for the protection of minority shareholders other than the provisions of the BVI Act dealing with shareholder remedies, as summarized under “Description of Share Capital-Shareholders’ Rights Under British Virgin Islands Law Generally.” One protection under statutory law is that shareholders may bring an action to enforce the constituent documents of a British Virgin Islands company and are entitled to have the affairs of the company conducted in accordance with the BVI Act and the amended and restated memorandum and articles of association of the company. As such, if those who control the company have disregarded the requirements of the BVI Act or the provisions of our amended and restated memorandum and articles of association, then the courts will likely grant relief. Generally, the areas in which the courts will intervene are the following: (i) an act complained of which is illegal; (ii) acts that constitute oppression, unfair discrimination or unfair prejudice against the minority where the wrongdoers control the company; (iii) acts that infringe on the personal rights of the shareholders, such as the right to vote; and (iv) acts where we have not complied with provisions requiring approval of a special or extraordinary majority of shareholders, which are more limited than the rights afforded to minority shareholders under the laws of many states in the United States.
57
British Virgin Islands law differs from the laws in effect in the United States, and U.S. investors may have difficulty enforcing civil liabilities against us, our directors or members of senior management.
Under our amended and restated memorandum and articles of association, we may indemnify and hold our directors harmless against all claims and suits brought against them, subject to limited exceptions. Furthermore, to the extent allowed by law, the rights and obligations among or between us, any of our current or former directors, officers and employees and any current or former shareholder will be governed exclusively by the laws of the British Virgin Islands and subject to the jurisdiction of the British Virgin Islands courts, unless those rights or obligations do not relate to or arise out of their capacities as such. Although there is doubt as to whether U.S. courts would enforce these provisions in an action brought in the United States, under U.S. securities laws, these provisions could make judgments obtained outside of the British Virgin Islands more difficult to enforce against our assets in the British Virgin Islands or jurisdictions that would apply British Virgin Islands law.
British Virgin Islands companies may not be able to initiate shareholder derivative actions, thereby depriving shareholders of one avenue to protect their interests.
British Virgin Islands companies may not have standing to initiate a shareholder derivative action in a federal court of the
United States
. The circumstances in which any such action may be brought, and the procedures and defenses that may be available in respect of any such action, may result in the rights of shareholders of a British Virgin Islands company being more limited than those of shareholders of a company organized in the United States. Accordingly, shareholders may have fewer alternatives available to them if they believe that corporate wrongdoing has occurred. The British Virgin Islands courts are also unlikely to recognize or enforce judgments of courts in the United States based on certain liability provisions of U.S. securities law, or to impose liabilities based on certain liability provisions of the U.S. securities laws that are penal in nature, in original actions brought in the British Virgin Islands. There is no statutory recognition in the British Virgin Islands of judgments obtained in the United States, although the courts of the British Virgin Islands will generally recognize and enforce the non-penal judgment of a non-U.S. court of competent jurisdiction without retrial on the merits. This means that even if shareholders were to sue us successfully, they may not be able to recover anything to make up for the losses suffered.
ITEM 1B. UNRESOLVED STAFF COMMENTS
None.
ITEM 2. PROPERTIES
Our principal executive offices are located in Alajuela, Costa Rica, where we occupy 34,750 square feet of office, laboratory and manufacturing space under two leases which expire in 2023 and 2026. In order to increase our manufacturing capacity, we have constructed a new manufacturing facility of approximately 27,000 square feet, which began shipping manufactured product in March 2017. We have an option to purchase this manufacturing facility, and on May 11, 2016 we provided notice of our intent to exercise our purchase right. We anticipate completing the transaction by the end of Q2 2019. We also have office and warehouse space in Wommelgem, Belgium, Sao Paulo, Brazil, Stockholm, Sweden and Paris, France pursuant to leases that expire in May 2027, August 2020, December 2021 and December 2026, respectively.
ITEM 3. LEGAL PROCEEDINGS
On August 30, 2018, the Company filed a complaint against Keller Medical, Inc., or Keller, Allergan Sales, LLC, and Allergan, PLC, or collectively Allergan. The complaint asserts breach of contract and tort claims against Keller and Allergan (which acquired Keller in June of 2017) for failing to honor the terms of (and/or interfering with) a Distribution Agreement entered into between the Company and Keller in October 2016, or the Distribution Agreement. The case, captioned Establishment Labs Holdings, Inc. v. Keller Medical, Inc. et al, Case No. 8:18-cv-01554, was filed in the United States District Court for the Central District of California. On October 26, 2018, Keller and Allergan answered the complaint and denied the allegations against them. On that same date, Keller also filed a counterclaim against Establishment Labs for alleged non-payment of products shipped to the Company under the Distribution Agreement. The Company formally responded to Keller’s counterclaim in November 2018 and strongly believes that it lacks merit.
58
The parties submitted this matter to a mediator in December 2018 in an effort to reach an early business resolution and avoid the expenses associated with protracted litigation; however, a settlement agreement has not been reached as of today’s date. Accordingly, the Company will continue to pursue this litigation in an effort to vindicate its rights through discovery and trial, if necessary.
The Company maintains that its claims against Keller and Allergan are meritorious and that Keller’s counterclaim against the Company is not. However, the Company makes no predictions on the likelihood of success of prevailing on its action against Keller and Allergan or on the likelihood of defeating Keller’s claim against the Company.
ITEM 4. MINE SAFETY DISCLOSURES
Not applicable.
PART II
ITEM 5. MARKET FOR REGISTRANT’S COMMON EQUITY, RELATED STOCKHOLDER MATTERS AND ISSUER PURCHASES OF EQUITY SECURITIES
Our common shares have been traded on the Nasdaq Capital Market under the symbol “ESTA” since our initial public offering on July 23, 2018. Prior to this time, there was no public market for our common shares.
Holders
There were
98
shareholders of record of our common shares as of at
March 19, 2019
. Certain shares are held in “street” name and, accordingly, the number of beneficial owners of such shares is not known or included in the foregoing number
.
Sales of Unregistered Securities
We have issued and sold to third parties the securities listed below without registering the securities under the Securities Act. None of these transactions involved any public offering. All our securities were sold through private placement either (i) outside the United States or (ii) in the United States to a limited number of investors in transactions not involving any public offering. As discussed below, we believe that each issuance of these securities was exempt from, or not subject to, registration under the Securities Act, relying on Section 4(a)(2) (or Regulation D promulgated thereunder), Regulation S or Rule 701 of the Securities Act.
|
•
|
Between February 2018 and June 2018, we issued an aggregate of $6.2 million of Class G ordinary shares at a purchase price of $16.00 per share to several investors;
|
|
•
|
In May 2018, we issued an aggregate $10.0 million Class G-1 ordinary shares at a purchase price of $16.00 per share to entities affiliated with RTW Investments;
|
|
•
|
In October 2018, we issued 5,000 common shares to Belle Health LTD as partial consideration in an asset acquisition; and
|
|
•
|
In December 2018, we issued 33,333 common shares to Femiline AB as contingent consideration for a milestone achieved related to our acquisition of certain assets from Femiline AB.
|
In addition, between March and July 2018, the Board of Directors granted 90,301 of Class A restricted share awards under the 2015 Equity Incentive Plan and share options to purchase 329,928 Class A ordinary shares at an exercise price of $10.19 per share. In June 2018, the Board also approved share options to purchase 303,000 common shares to certain of our directors and consultants pursuant to the 2018 Equity Incentive Plan, with an exercise price equal of $18.00 per share. We believe that the issuance of these securities was exempt from registration under the Securities Act in reliance upon Regulation S or Rule 701 of the Securities Act as transactions pursuant to written compensatory plans or pursuant to a written contract relating to compensation.
No underwriters were employed in connection with the foregoing option grants and restricted share awards.
Dividends
We have not paid any cash dividends on our common shares since inception and do not anticipate paying cash dividends in the foreseeable future.
59
Securities Authorized for Issuance under Equity Compensation Plans
Information about our equity compensation plans is incorporated herein by reference to Item 12 of Part III of this Annual Report on Form 10‑K.
Use of Proceeds from Public Offering of Common Shares
On July 23, 2018, the Company completed its initial public offering, or IPO, whereby it sold a total of 4,272,568 shares of common stock at $18.00 per share including 557,291 shares sold to underwriters for the exercise of their option to purchase additional shares. The Company received net proceeds from the IPO of approximately $70.1 million, after deducting underwriting discounts and commissions of $5.4 million and deferred offering costs of $1.5 million. The IPO was effected through a registration statement on Form S-1 (Registration Nos. 333-225791 and 333-226235), which was declared effective on July 18, 2018. No payments for such expenses were made directly or indirectly to any of our officers or directors, to persons owning 10% or more of any class of our equity securities, or to any of our affiliates.
Jeffries LLC, Cowen and Company LLC, and BTIG, LLC acted as the underwriters for the IPO. There has been no material change in the planned use of proceeds from our initial public offering as described in our final prospectus filed with the SEC on July 20, 2018 pursuant to Rule 424(b) of the Securities Act.
Purchases of Equity Securities by the Issuer or Affiliated Purchasers
There were no repurchases of shares of common shares made during the three months ended December 31, 2018.
ITEM 6. SELECTED FINANCIAL DATA
As a "smaller reporting company" as defined by Item 10 of Regulation S-K, the Company is not required to provide this information.
ITEM 7. MANAGEMENT’S DISCUSSION AND ANALYSIS OF FINANCIAL CONDITION AND RESULTS OF OPERATIONS
You should read the following discussion and analysis of our financial condition and results of operations together with the
consolidated
financial statements and related notes that are included elsewhere in this Annual Report on Form 10-K). This discussion contains forward-looking statements based upon current expectations that involve risks and uncertainties. Our actual results may differ materially from those anticipated in these forward-looking statements as a result of various factors, including those set forth under the sections contained in this
Form 10-K entitled Item 1A. “Risk Factors”; Item 7. “Management’s Discussion and Analysis of Financial Condition and Results of Operations”; and Item 7A. “Quantitative and Qualitative Disclosure about Market Risk”
. See “Special Note Regarding Forward-Looking Statements” below.
Forward-Looking Statements
The information in this discussion contains forward-looking statements and information within the meaning of Section 27A of the Securities Act and Section 21E of the Exchange Act, which are subject to the “safe harbor” created by those sections. These forward-looking statements include, but are not limited to, statements concerning our strategy, future operations, future financial position, future revenues, projected costs, prospects and plans and objectives of management. The words “anticipates,” “believes,” “estimates,” “expects,” “intends,” “may,” “plans,” “projects,” “will,” “would” and similar expressions are intended to identify forward-looking statements, although not all forward-looking statements contain these identifying words. We may not actually achieve the plans, intentions or expectations disclosed in our forward-looking statements and you should not place undue reliance on our forward-looking statements.
Actual results or events could differ materially from the plans, intentions and expectations disclosed in the forward-looking statements that we make. These forward-looking statements involve risks and uncertainties that could cause our actual results to differ materially from those in the forward-looking statements, including, without limitation, the risks set forth under the sections contained in this
Form 10-K entitled Item 1A. “Risk Factors”; Item 7. “Management’s Discussion and Analysis of Financial Condition and Results of Operations”; and Item 7A. “Quantitative and Qualitative Disclosure about Market Risk”
and in our other filings with the SEC. The forward-looking statements are applicable only as of the date on which they are made, and we do not assume any obligation to update any forward-looking statements.
60
Overview
We are a medical technology company focused on improving patient safety and aesthetic outcomes, initially in the breast aesthetics and reconstruction market. Our line of silicone gel-filled breast implants, branded as Motiva Implants, is the centerpiece of our MotivaImagine medical technology platform. Post-market surveillance data, which was not generated in connection with the U.S. Food and Drug Administration, or FDA, PMA approval study and was self-collected rather than collected at mandatory follow-ups, and published third-party data indicates that Motiva Implants show low rates of adverse events (including rupture, capsular contracture, and safety related reoperations) that we believe compare favorably with those of our competitors. We believe the proprietary technologies that differentiate our Motiva Implants enable improved safety and aesthetic outcomes and have helped drive our revenue growth. Our MotivaImagine platform enables surgical techniques that we promote as Motiva branded surgeries. We have developed other complementary products and services on our MotivaImagine platform, which are aimed at further enhancing patient outcomes.
We have devoted a majority of our resources since inception to developing our Motiva Implants, which we began selling in October 2010. We have incurred net losses in each year since inception, and we have financed our operations primarily through equity financings and debt financings.
Our revenue for
the
year
ended
December 31, 2018
and
2017
was
$61.2 million
and
$34.7 million
, respectively, an increase of
$26.5 million
, or
76.5%
. Net losses decreased to
$21.1 million
for the year ended
December 31, 2018
from
$34.9 million
for the year ended
December 31, 2017
.
As of
December 31, 2018
, we had an accumulated deficit of
$89.0 million
.
Our cash balance as of
December 31, 2018
was
$52.6 million
.
On July 23, 2018, the Company completed its initial public offering, or IPO, whereby it sold a total of
4,272,568
common shares at
$18.00
per share including
557,291
shares sold to underwriters for the exercise of their option to purchase additional shares. The Company received net proceeds from the IPO of approximately
$70.1 million
, after deducting underwriting discounts and commissions of
$5.4 million
and deferred offering costs of
$1.5 million
.
We have made and continue to make significant investments in additional manufacturing capacity, marketing, customer service, and a direct sales force in certain territories like Brazil and several countries in Europe in order to drive and support further adoption of our Motiva Implants. We expect that we will continue to incur losses at least in the near term as we expand our organization to support planned sales growth, while also continuing to invest in research and development of our products, clinical trials to enable regulatory approval in the United States, and in other commercialization efforts. We also expect to incur significant additional expenditures as a public company.
As a result of these and other factors, we expect to continue to incur net losses in the intermediate term and may need to raise additional capital through equity and debt financings in order to fund our operations. Our operating results may fluctuate on a quarterly or annual basis in the future, and our growth or operating results may not be consistent with predictions made by securities analysts, if any. If we are unable to achieve our revenue growth objectives, we may not be able to achieve profitability.
Components of Results of Operations
Revenue
We commenced sales of our Motiva Implants in October 2010 and these products have historically accounted for the majority of our revenues. Sales of our Motiva breast implants accounted for over
90%
of our revenues for the year ended
December 31, 2018
, and we expect our revenues to continue to be driven primarily by sales of these products. We primarily derive revenue from sales of our Motiva Implants to two types of customers: (1) medical distributors and (2) direct sales to physicians, hospitals, and clinics.
We recognize revenue related to the sales of products at the time of shipment, except for a portion of our direct sales revenue that is generated from the sale of consigned inventory maintained at physician, hospital, and clinic locations. For consignment sales, revenue is recognized at the time we are notified by the consignee that the product has been implanted. Our contracts with distributors do not typically contain right of return or price protection and have no post-delivery obligations.
We expect our revenue to increase as we enter new markets, expand awareness of our products in existing markets, and grow our distributor network and direct sales force. We also expect our revenue to fluctuate from quarter to quarter due to a variety of factors, including seasonal fluctuations in demand for Motiva Implants. We
61
are also affected by foreign currency fluctuations, however, to date, the net impact of foreign currency translation has been insignificant.
Cost of Revenue and Gross Margin
Our implants are manufactured at our two facilities in Costa Rica, one of which opened in 2017. Cost of revenue is primarily the cost of silicone but also includes other raw materials, packaging, components, quality assurance, labor costs, as well as manufacturing and overhead expenses. Cost of revenue also includes depreciation expense for production equipment, and amortization of certain intangible assets.
We calculate gross margin as revenue less cost of revenue for a given period divided by revenue. Our gross margin may fluctuate from period to period depending, in part, on the efficiency and utilization of our manufacturing facilities, targeted pricing programs, and sales volume based on geography, customer and product type.
Operating Expenses
Sales, General and Administrative
Sales, general and administrative, or SG&A, expenses primarily consist of compensation, including salary, share-based compensation and employee benefits for our sales and marketing personnel, and for administrative personnel that support our general operations such as information technology, executive management, financial accounting, customer service, and human resources personnel. SG&A expenses also includes costs attributable to marketing, sales support, travel, legal services, financial audit fees, insurance costs, and consulting services. We expect to incur additional SG&A expenses in connection with our becoming a public company, which may increase further when we are no longer able to rely on the “emerging growth company” exemption we are afforded under the Jumpstart Our Business Startups Act of 2012, or JOBS Act.
We expect our SG&A expenses to continue to increase in absolute dollars for the foreseeable future as our business grows and we continue to invest in our sales, marketing, medical education, training and general administration resources to build our corporate infrastructure. However, we expect our SG&A expenses to decrease as a percentage of our revenue over the long term, although our SG&A expenses may fluctuate from period to period due to the timing of expenses related to our sales and marketing campaigns.
Research and Development
Our research and development, or R&D, activities primarily consist of engineering and research programs associated with our products under development, as well as R&D activities associated with our clinical development activities. Our R&D expenses primarily consist of compensation, including salary, share-based compensation and employee benefits for our R&D and clinical personnel. We also incur significant expenses for supplies, development prototypes, design and testing, clinical study costs and product regulatory and consulting expenses.
We expect our R&D expenses to continue to increase in absolute dollars and as a percentage of revenue for the foreseeable future as we continue to advance our products under development, as well as initiate and prepare for additional clinical studies. We received an approval of an investigational device exemption, or IDE, from the FDA in March 2018 to initiate a clinical trial and enrolled the first patient during the first half of 2018. We estimate that total costs for this PMA clinical trial will be between $30.0 million and $40.0 million over ten years. We also have other products under development for which we may be required to conduct clinical trials in future periods in order to receive regulatory approval to market these products.
Interest Expense
Interest expense consists primarily of cash and non-cash interest related to outstanding debt and amortization of debt discounts. As of
December 31, 2018
, we had
$40.0 million
in outstanding principal and accrued interest.
Change in Fair Value of Derivative Instruments
Change in fair value of derivative instruments consists of changes in the fair value of our share warrants and put and call option liabilities associated with outstanding debt instruments.
Other Income (Expense), Net
Other income (expense), net primarily consists of foreign currency gains/losses, interest income and change in fair value of contingent consideration.
62
Income Tax Expense
Income tax expense consists primarily of income taxes in foreign jurisdictions in which we conduct business. Due to our history of losses, we maintain a full valuation allowance for deferred tax assets including net operating loss carry-forwards, R&D tax credits, capitalized R&D and other book versus tax differences.
Consolidated Results of Operations
The following table set forth our results of operations for the years presented, in dollars:
|
2018
|
2017
|
||||||
|
(in thousands)
|
|||||||
|
Revenue
|
$
|
61,208
|
|
$
|
34,681
|
|
|
|
Cost of revenue
|
25,090
|
|
16,979
|
|
|||
|
Gross profit
|
36,118
|
|
17,702
|
|
|||
|
Operating expenses:
|
|||||||
|
Sales, general and administrative
|
47,295
|
|
30,821
|
|
|||
|
Research and development
|
12,687
|
|
6,864
|
|
|||
|
Total operating expenses
|
59,982
|
|
37,685
|
|
|||
|
Loss from operations
|
(23,864
|
)
|
(19,983
|
)
|
|||
|
Interest expense
|
(8,814
|
)
|
(10,420
|
)
|
|||
|
Change in fair value of derivative instruments
|
15,894
|
|
(2,428
|
)
|
|||
|
Other income (expense), net
|
(4,099
|
)
|
(1,961
|
)
|
|||
|
Loss before income taxes
|
(20,883
|
)
|
(34,792
|
)
|
|||
|
Provision for income taxes
|
(215
|
)
|
(105
|
)
|
|||
|
Net loss
|
$
|
(21,098
|
)
|
$
|
(34,897
|
)
|
|
63
Comparison of the Year
December 31, 2018
and
2017
|
2018
|
2017
|
||||||
|
(in thousands)
|
|||||||
|
Revenue
|
$
|
61,208
|
|
$
|
34,681
|
|
|
|
Cost of revenue
|
25,090
|
|
16,979
|
|
|||
|
Gross profit
|
$
|
36,118
|
|
$
|
17,702
|
|
|
|
Gross margin
|
59.0
|
%
|
51.0
|
%
|
|||
Revenue
Revenue increased
$26.5 million
, or
76.5%
, to
$61.2 million
for the year ended
December 31, 2018
as compared to
$34.7 million
for the year ended
December 31, 2017
. The increase was primarily due to increased sales of Motiva Implants, with the increase driven by greater market penetration in existing geographies, commencement of sales in new geographies, and the addition of direct markets including Brazil where we started generating revenue during the third quarter of fiscal 2017 and Germany and Spain where we went direct during the fourth quarter of fiscal 2018. As of
December 31, 2018
, our sales organization included
67
employees and contractors as compared to
46
individuals at December 31, 2017.
Cost of Revenue and Gross Margin
Cost of revenue increased
$8.1 million
, or
47.8%
, to
$25.1 million
for the year ended
December 31, 2018
compared to
$17.0 million
for the year ended
December 31, 2017
. The increase was due to higher sales volume of Motiva Implants.
The gross margin increased to
59.0%
for the year ended
December 31, 2018
compared to
51.0%
for the year ended
December 31, 2017
primarily due to an increase in production volume that spread our fixed manufacturing costs over a larger number of units and the addition of direct market revenues with generally higher average selling prices.
Operating Expenses
|
2018
|
2017
|
||||||
|
(in thousands)
|
|||||||
|
Operating expenses:
|
|||||||
|
Sales, general and administrative
|
$
|
47,295
|
|
$
|
30,821
|
|
|
|
Research and development
|
12,687
|
|
6,864
|
|
|||
|
Total operating expenses
|
$
|
59,982
|
|
$
|
37,685
|
|
|
Sales, General and Administrative Expense
SG&A expense increased
$16.5 million
, or
53.5%
, to
$47.3 million
for the year ended
December 31, 2018
, compared to
$30.8 million
for the year ended
December 31, 2017
. The increase in SG&A was primarily due to
$7.1 million
increase in personnel costs as a result of the hiring of additional sales and administrative employees,
$5.8 million
increase in consulting and audit fees,
$1.4 million
increase in sales commissions and
$0.8 million
increase in insurance costs partially offset by
$1.7 million
decrease in marketing expense.
Research and Development Expense
R&D expense increased
$5.8 million
, or
84.8%
, to
$12.7 million
for the year ended
December 31, 2018
, compared to
$6.9 million
for the year ended
December 31, 2017
. The increase in R&D expenses was primarily due to
$1.8 million
increase in stock compensation expense and
$2.0 million
increase in expenditures related to the initiation of our PMA clinical study in the United States, primarily consisting of
$1.1 million
increase in laboratory-related expenditures and
$1.1 million
increase in fees to third parties to set-up and manage the clinical trial.
64
Interest Expense
Interest expense decreased
$1.6 million
, or
15.4%
, to
$8.8 million
for the year ended
December 31, 2018
as compared to
$10.4 million
for the year ended
December 31, 2017
. The decrease in interest expense is primarily due to the extinguishment of outstanding debt with Perceptive and conversion of debt with CPH in August 2017, and to interest related to outstanding debt and amortization of debt discounts on our Madryn Credit Agreement, which we entered into in August 2017.
Change in Fair Value of Derivative Instruments
Change in fair value of derivative instruments for the year ended
December 31, 2018
resulted in a gain of
$15.9 million
as compared to a loss of
$2.4 million
for the year ended
December 31, 2017
. The change in fair value of derivative instruments in fiscal 2018 was primarily due to changes in the fair value of Madryn derivatives embedded in the Madryn Credit Agreement we entered into in August 2017. The change in fair value of derivative instruments in fiscal 2017 primarily related to changes in our share warrant liability for warrants issued to CPH and to Perceptive in connection with the respective debt arrangements.
Liquidity and Capital Resources
As of
December 31, 2018
, we had an accumulated deficit of
$89.0 million
. Since our inception, we have generated losses and expect to continue to generate losses in the intermediate term. We have financed our operations through a combination of equity financings and debt financings, and from cash generated from operations, primarily from the collection of accounts receivable resulting from sales. Our historical cash outflows have primarily been associated with cash used for operating activities such as expansion of our sales and marketing and distributor infrastructure, investing in inventory, R&D activities, asset acquisitions, capital improvements and other working capital needs. As of
December 31, 2018
and
2017
, we had cash of
$52.6 million
and
$10.9 million
, respectively.
In 2017, we raised capital through a series of equity financing rounds with total gross aggregate proceeds of $27.8 million. Through debt funding we received $38.5 million through the Madryn Credit Agreement, in which we used $15.0 million to pay off the Perceptive debt. During the year ended
December 31, 2018
, the Company received
$16.9 million
from the issuance of ordinary shares and exercise of stock options and warrants. Also, we received proceeds in the IPO of approximately
$70.1 million
, net of
$5.4 million
related to underwriting discounts and commissions and deferred offering costs of
$1.5 million
.
We believe that our available cash, cash from operations, and the net proceeds from the initial public offering will be sufficient to satisfy our liquidity requirements for at least the next twelve months from the date of the issuance of the financial statements. Our liquidity assumptions may prove to be incorrect, and we could utilize our available financial resources sooner than we currently expect. Our future capital requirements will depend on many factors, including:
|
▪
|
the degree and rate of market adoption of our products;
|
|
▪
|
the cost and timing of our regulatory activities, especially the PMA clinical trial to obtain regulatory approval for our Motiva Implants in the United States;
|
|
▪
|
the emergence of new competing technologies and products;
|
|
▪
|
the costs of R&D activities we undertake to develop and expand our products;
|
|
▪
|
the costs of commercialization activities, including sales, marketing and manufacturing;
|
|
▪
|
the level of working capital required to support our growth; and
|
|
▪
|
our need for additional personnel, information technology or other operating infrastructure to support our growth and operations as a public company.
|
We may need to raise additional capital to execute our business plan. If we are unable to raise additional capital when desired, or on terms acceptable to us, our business, results of operations, and financial condition would be adversely affected.
65
Cash Flows
The following table sets forth the primary sources and uses of cash for each of the years presented below:
|
2018
|
2017
|
||||||
|
Net cash provided by (used in):
|
|||||||
|
Operating activities
|
$
|
(33,885
|
)
|
$
|
(31,970
|
)
|
|
|
Investing activities
|
(5,731
|
)
|
(845
|
)
|
|||
|
Financing activities
|
81,527
|
|
42,993
|
|
|||
|
Effect of exchange rate changes on cash
|
(136
|
)
|
207
|
|
|||
|
Net increase in cash
|
$
|
41,775
|
|
$
|
10,385
|
|
|
Net Cash Used in Operating Activities
Net cash used in operating activities of
$33.9 million
for the year ended
December 31, 2018
was comprised of a net loss of
$21.1 million
and
$15.9 million
change in fair value of financial instruments, partially offset by
$2.8 million
of non-cash depreciation expense,
$7.3 million
of share-based compensation expense, and
$3.3 million
of non-cash interest expense due to accretion of debt discounts, as well as changes in operating assets and liabilities of
$14.0 million
.
Net cash used in operating activities of
$32.0 million
for the year ended
December 31, 2017
was comprised of net loss of
$34.9 million
, partially offset by
$1.9 million
of non-cash depreciation expense,
$2.4 million
change in fair value of financial instruments,
$3.3 million
of share-based compensation expense, and
$7.1 million
of non-cash interest expense due to accretion of debt discounts, as well as changes in operating assets and liabilities of
$14.3 million
.
Net Cash Used in Investing Activities
Net cash used in investing activities of
$5.7 million
for the year ended
December 31, 2018
primarily consisted of
$4.0 million
in cash used in asset acquisitions and
$1.7 million
in purchases of property and equipment.
Net cash used in investing activities of
$0.8 million
for the year ended
December 31, 2017
primarily consisted of
$0.9 million
in purchases of property and equipment partially offset by changes in restricted cash of
$0.1 million
.
Net Cash Provided by Financing Activities
Net cash provided by financing activities of
$81.5 million
for the year ended
December 31, 2018
primarily reflected
$71.5 million
in proceeds received from the issuance of common shares in the IPO, net of underwriters’ discount,
$16.1 million
in proceeds received from the issuance of ordinary shares prior to the IPO,
$0.6 million
in proceeds received for stock option exercises and
$0.1 million
in proceeds received for warrant exercises, which was partially offset by
$5.1 million
repayment of related party notes payable,
$1.5 million
deferred equity issuance costs and
$0.3 million
in repayment on capital leases.
Net cash provided by financing activities of
$43.0 million
for the year ended
December 31, 2017
primarily reflected
$38.5 million
in borrowing, net of debt issuance costs, under the Madryn Credit Agreement and
$27.8 million
in proceeds received for issuance of ordinary shares partially offset by
$15.0 million
in repayment of Perceptive debt,
$2.4 million
in payment for repurchase of share warrants,
$4.5 million
used to repurchase shares and
$0.9 million
in payments of deferred offering costs.
Indebtedness
Notes Payable Related Party
In August 2015, we entered into agreements with all of the Class Z redeemable convertible preferred shareholders to exchange their outstanding shares and accumulated dividends for notes payable with a principal balance of $4.3 million. The notes bore interest at a simple rate of 7% per annum with a maturity date of March 31, 2020. The notes became due and payable on July 23, 2018 when the Company successfully completed the
66
IPO. We repaid the balance due of
$5.1 million
, including accrued interest of
$0.9 million
, in August 2018.
Madryn Debt
On August 24, 2017, we entered into a credit agreement, or the Madryn Credit Agreement, with Madryn Health Partners, LP, or Madryn, as administrative agent, and a syndicate of lenders, or the Lenders. The Madryn Credit Agreement provides for up to
$55.0 million
credit facility,
$30.0 million
(Term A) of which became available upon signing. The Madryn Credit Agreement matures on June 30, 2023.
Terms B and C under the Madryn Credit Agreement become available to us for an additional $25.0 million, subject to us achieving certain revenue milestones. We met these milestones and borrowed an additional
$5.0 million
(Term B-1) on October 31, 2017 and
$5.0 million
(Term B-2) on December 15, 2017 bringing up the total outstanding principal balance to
$40.0 million
as of December 31, 2017. As of June 15, 2018, we became eligible to, but have not to date, draw down an additional $5.0 million (Term B-3) under the amended Credit Agreement, and an additional
$10.0 million
(Term C) may become available on June 30, 2020 if a written notice is submitted to the Lenders. The availability of each tranche is also conditioned on the Company having advanced the maximum loan amount under each prior tranche.
Borrowings under the Madryn Credit Agreement bear interest at a rate equal to 3-month LIBOR plus
11.0%
per annum provided that no default has occurred. Interest payments are made quarterly. In an event of a default, the interest would increase by an additional 4% per annum. No principal payments are due until 2021. Eight quarterly payments of
12.5%
of the principal amounts borrowed under each tranche are due beginning September 30, 2021 through June 30, 2023.
The Madryn Credit Agreement contains put options related to liquidity events or an event of default and a call option related to voluntary repayment option. We valued these put options and the call option and allocated a fair value of
$15.1 million
for these identified embedded derivatives as a debt discount on the original commitment date in August 2017. An additional $5.0 million debt discount was recorded on respective borrowing dates when we met the required milestones and borrowed an additional $10.0 million in the fourth quarter of fiscal 2017. We revalue the options as of each reporting period and record the change in the fair value in the consolidated statement of operations as other income or expense. We also incurred legal expenses of
$1.3 million
, which were recorded as a debt discount and are being amortized over the term of the Madryn Credit Agreement.
The Madryn Credit Agreement contains customary affirmative and negative covenants, including, but not limited to, restrictions on the ability to incur additional indebtedness, create liens, make certain investments, make restricted payments, enter into or undertake certain liquidations, mergers, consolidations or acquisitions and dispose of assets or subsidiaries. In addition, the Madryn Credit Agreement requires us to maintain minimum revenues and liquidity.
We defaulted on the Madryn Credit Agreement on February 28, 2018 when our investment in our Brazilian subsidiary exceeded the allowable $5.0 million threshold permitted under the Madryn Credit Agreement. Accordingly, we recorded the Madryn debt as a current liability on the consolidated balance sheet as of December 31, 2017 (see Note 6). Effective June 15, 2018, Madryn Credit Agreement was amended to remove the restrictive covenants that resulted in the technical defaults which allowed the Company to reclassify the arrangement as long-term as of December 31, 2018.
Off-Balance Sheet Arrangements
As of
December 31, 2018
, we did not have any off-balance sheet arrangements.
JOBS Act Accounting Election
The JOBS Act permits an “emerging growth company” such as us to take advantage of an extended transition period to comply with new or revised accounting standards applicable to public companies.
We intend to take advantage of certain exemptions from various public company reporting requirements including following private company effective dates for new or revised accounting standards.
Critical Accounting Policies, Significant Judgments and Use of Estimates
This discussion and analysis of our financial condition and results of operations is based on our consolidated financial statements, which have been prepared in accordance with U.S. GAAP. The preparation of these consolidated financial statements requires us to make estimates and judgments that affect the reported amounts
67
of assets and liabilities, revenue and expenses, and the disclosure of contingent assets and liabilities. Our estimates are based on our historical experience and on various other assumptions that we believe to be reasonable under the circumstances, the results of which form the basis for making judgments about the carrying value of assets and liabilities. Actual results may differ from these estimates. We believe that the critical accounting policies discussed below are essential to understanding our historical and future performance, as these policies relate to the more significant areas involving management’s estimates and judgments.
Revenue Recognition
We recognize revenue related to sales of products to distributors or directly to customers in markets where we have regulatory approval, net of trade discounts and allowances. We recognize revenue when all of the following criteria are met:
▪
persuasive evidence of an arrangement exists;
▪
the sales price is fixed or determinable;
▪
collection of the relevant receivable is probable at the time of sale; and
▪
delivery has occurred or services have been rendered.
We recognize revenue related to the sales of products to distributors at the time of shipment of the product, which represents the point in time when the customer has taken ownership and assumed the risk of loss and the required revenue recognition criteria are satisfied. Our distributors are obligated to pay within specified terms regardless of when or if they sell the products. Our contracts with distributors do not typically contain rights of return or price protection and have no post-delivery obligations.
Appropriate reserves are established for anticipated sales returns based on historical experience, recent gross sales and any notification of pending returns. The Company recognizes revenue when title to the product and risk of loss transfer to customers, provided there are no remaining performance obligations required of the Company or any written matters requiring customer acceptance. The Company allows for the return of product from direct customers in certain regions within fifteen days after the original sale and records estimated sales returns as a reduction of sales in the same period revenue is recognized. Sales return provisions are calculated based upon historical experience with actual returns. Actual sales returns in any future period are inherently uncertain and thus may differ from the estimates. If actual sales returns differ significantly from the estimates, an adjustment to revenue in the current or subsequent period is recorded. As of
December 31, 2018
, an allowance of
$52,000
was recorded for product returns. Prior to 2018, returns of products have been de minimis and accordingly no allowance for returns was recorded as of
December 31, 2017
.
A portion of our revenue is generated from the sale of consigned inventory maintained at physician, hospital, and clinic locations. For these products, revenue is recognized at the time we are notified by the customer that the product has been implanted, not when the consigned products are delivered to the customer’s warehouse.
We have a limited warranty to distributors for the shelf life of the product, which is five years from the time of manufacture. Estimated warranty obligations are recorded at the time of sale. We also offer a warranty to patients in the event of rupture and a replacement program for capsular contracture events provided certain registration requirements are met. Revenue for extended warranties are recognized ratably over the term of the agreement. To date, these warranty and program costs have been de minimis. We will continue to evaluate the warranty reserve policies for adequacy considering claims history.
Deferred revenue primarily consists of payments received in advance of meeting revenue recognition criteria. We have received payments from distributors to provide distribution exclusivity within a geographic area, and recognize deferred revenue on a ratable basis over the term of such contractual distribution relationship. Additionally, we have received payments from customers in direct markets prior to surgical implantation, and recognizes deferred revenue at the time we are notified by the customer that the product has been implanted. For all arrangements, any revenue that has been deferred and is expected to be recognized beyond one year is classified as long-term deferred revenue in the consolidated balance sheets.
Property and Equipment
Property and equipment are stated at cost less accumulated depreciation and amortization.
Depreciation of property and equipment is computed using the straight-line method over the assets’ estimated useful lives of five to ten years. Leasehold improvements are amortized on a straight-line basis over the shorter of the estimated useful life of the asset or the remaining lease term after factoring expected renewal periods.
68
Upon retirement or disposal of assets, the costs and related accumulated depreciation are eliminated from the accounts and any gain or loss is recognized in operations. Maintenance and repairs are expensed as incurred. Substantially all of our manufacturing operations and related property and equipment is located in Costa Rica.
Accounts Receivable and Allowance for Doubtful Accounts
Accounts receivable is stated at invoice value less estimated allowances for returns and doubtful accounts. The Company continually monitors customer payments and maintains an allowance for estimated losses resulting from customers’ inability to make required payments. In evaluating the Company’s ability to collect outstanding receivable balances, the Company considers various factors including the age of the balance, the creditworthiness of the customer, which is assessed based on ongoing credit evaluations and payment history, and the customer’s current financial condition. In cases where there are circumstances that may impair a specific customer’s ability to meet its financial obligations, an allowance is recorded against amounts due, which reduces the net recognized receivable to the amount reasonably believed to be collectible. As of
December 31, 2018
, an allowance of
$52,000
was recorded for product returns. Prior to 2018, returns of products have been de minimis and accordingly no allowance for returns was recorded as of
December 31, 2017
.
Inventory and Cost of Revenue
Inventory is stated at the lower of cost to purchase or manufacture the inventory or the net realizable value of such inventory. Cost is determined using the standard cost method which approximates actual costs using the first-in, first-out basis. The Company regularly reviews inventory quantities considering actual losses, projected future demand, and remaining shelf life to record a provision for excess and slow-moving inventory. As of
December 31, 2018
, an allowance of
$0.2 million
was recorded for inventory obsolescence. No inventory allowance has been recorded as of
December 31, 2017
.
We recognize the cost of inventory transferred to the customer in cost of revenue when revenue is recognized.
Goodwill and Intangible Assets
We record the excess of the acquisition purchase price over the net fair value of the tangible and identifiable intangible assets acquired and liabilities assumed as goodwill. In accordance with Accounting Standards Codification, or ASC, 350,
Intangibles - Goodwill and Other,
we test goodwill for impairment annually during the fourth quarter of each year and whenever events or changes in circumstances indicate that the carrying value of the asset may not be recoverable. In connection with the annual impairment test for goodwill, we elected the option to perform a qualitative assessment to determine whether it is more likely than not that the fair value of the reporting unit is less than its carrying amount. If we determine that it was more likely than not that the fair value of the reporting unit is less than its carrying amount, then the impairment test is performed. Consistent with our assessment that it has only one reporting segment, we have determined that it has only one reporting unit and tests goodwill for impairment at the entity level using the two-step process required by ASC 350. In the first step, we compare the carrying amount of the reporting unit to the fair value of the enterprise. If the fair value of the enterprise exceeds the carrying value, goodwill is not considered impaired and no further testing is required. If the carrying value of the enterprise exceeds the fair value, goodwill is potentially impaired and the second step of the impairment test must be performed. In the second step, we compare the implied fair value of the goodwill, as defined by ASC 350, to its carrying amount to determine the impairment loss, if any.
We record purchased intangible assets at their respective estimated fair values at the date of acquisition. Purchased finite-lived intangible assets are being amortized using the straight-line method over their remaining estimated useful lives, which range from two to fifteen years. We evaluate the remaining useful lives of intangible assets on a periodic basis to determine whether events or circumstances warrant a revision to the remaining estimated amortization period. We test indefinite-lived intangible assets for impairment on at least an annual basis and whenever circumstances suggest the assets may be impaired. If indicators of impairment are present, we evaluate the carrying value of the intangible assets in relation to estimates of future undiscounted cash flows. We also evaluate the remaining useful life of an indefinite-lived intangible asset to determine whether events
and circumstances continue to support an indefinite useful life.
During the years ended
December 31, 2018
and
2017
, there has been
no
impairment of goodwill or intangible assets based on the qualitative assessments performed by the Company.
Long-Lived Assets
The Company reviews long-lived assets for impairment whenever events or changes in circumstances indicate that the carrying amount of an asset might not be recoverable. When such an event occurs, management
69
determines whether there has been impairment by comparing the anticipated undiscounted future net cash flows to the related asset group’s carrying value. If an asset is considered impaired, the asset is written down to fair value, which is determined based either on discounted cash flows or appraised value, depending on the nature of the asset. There were
no
impairment charges, or changes in estimated useful lives recorded d
uring the years ended
December 31, 2018
and
2017
.
Debt and Embedded Derivatives
We apply the accounting standards for derivatives and hedging and for distinguishing liabilities from equity when accounting for hybrid contracts. We account for convertible debt instruments when we have determined that the embedded conversion options should not be bifurcated from their host instruments in accordance with ASC 470-20
Debt with Conversion and Other Options.
We record, when necessary, discounts to notes payable for the intrinsic value of conversion and other options embedded in debt instruments as a beneficial conversion option based upon the differences between the fair value of the underlying shares at the commitment date of the note transaction and the effective conversion price embedded in the note.
We use option pricing valuation models to determine the fair value of embedded derivatives and records any change in fair value as a component of other income or expense in the consolidated statements of operations.
Debt Issuance Costs and Debt Discounts
Costs incurred in connection with the issuance of new debt are capitalized. Capitalizable debt issuance costs paid to third parties and debt discounts paid to creditors, net of amortization, are recorded as a reduction to the long-term debt balance on the consolidated balance sheets. Amortization expense on capitalized debt issuance costs and debt discounts related to loans are calculated using the effective interest method over the term of the loan commitment, and is recorded as interest expense in the consolidated statements of operations.
Income Taxes
We record income taxes using the asset and liability method, which requires the recognition of deferred tax assets and liabilities for the expected future tax consequences of events that have been recognized in our consolidated financial statements or income tax returns. In estimating future tax consequences, expected future events, enactments or changes in the tax law or rates are considered. Valuation allowances are provided when necessary to reduce deferred tax assets to the amount expected to be realized.
We operate in various tax jurisdictions and are subject to audit by various tax authorities.
We record uncertain tax positions based on a two-step process whereby (1) a determination is made as to whether it is more likely than not that the tax positions will be sustained based on the technical merits of the position and (2) for those tax positions that meet the more-likely-than-not recognition threshold we recognize the largest amount of tax benefit that is greater than 50% likely to be realized upon ultimate settlement with the related tax authority.
Our policy is to recognize interest and penalties accrued on any unrecognized tax benefits as a component of income tax expense. Significant judgment is required in the identification of uncertain tax positions and in the estimation of penalties and interest on uncertain tax positions.
There were no material uncertain tax positions as of
December 31, 2018
and
2017
.
Foreign Currency
The financial statements of our foreign subsidiaries whose functional currencies are the local currencies are translated into U.S. dollars for consolidation as follows: assets and liabilities at the exchange rate as of the balance sheet date, stockholders’ equity at the historical rates of exchange, and income and expense amounts at the average exchange rate for the period. Translation adjustments resulting from the translation of the subsidiaries’ accounts are included in “Accumulated other comprehensive income (loss)” as equity in the
consolidated
balance sheet. Transactions denominated in currencies other than the applicable functional currency are converted to the functional currency at the exchange rate on the transaction date. At period end, monetary assets and liabilities are remeasured to the functional currency using exchange rates in effect at the balance sheet date. Non-monetary assets and liabilities are remeasured at historical exchange rates. Gains and losses resulting from foreign currency transactions are included within “Other income (expense), net” in the
consolidated
statements of operations. For the year ended
December 31, 2018
, foreign currency transaction loss amounted to
$2.4 million
as compared to a foreign currency transaction gain of
$0.4 million
for the year ended
December 31, 2017
.
70
Comprehensive Income (Loss)
Our comprehensive loss consists of net loss and foreign currency translation adjustments arising from the consolidation of the Company’s foreign subsidiaries.
Deferred Offering Costs
Deferred offering costs, consisting of legal, accounting and other fees and costs relating to our IPO, are capitalized within “Other non-current assets” on the consolidated balance sheet. Due to a delayed IPO process beyond 90 days, we expensed the previously deferred offering costs of
$1.6 million
during the year ended December 31, 2017. In 2018, we resumed the IPO activities and capitalized
$1.5 million
of deferred offering costs which, upon completion of the IPO, were reclassified to equity to offset the IPO proceeds.
Share-Based Compensation
We measure and recognize compensation expense for all share-based awards in accordance with the provisions of ASC 718,
Stock Compensation
. Share-based awards granted include stock options and restricted stock awards, or RSAs. Share-based compensation expense for stock options and RSAs granted to employees is measured at the grant date based on the fair value of the awards and is recognized as an expense ratably on a straight-line basis over the requisite service period. The fair value of options to purchase ordinary shares granted to employees is estimated on the grant date using the Black-Scholes option valuation model.
We account for stock options and RSAs issued to non-employees under ASC 505-50
Equity: Equity-Based Payments to Non-Employees
, using the Black-Scholes option valuation model to value stock options. The fair value of such non-employee awards is remeasured at each quarter-end over the vesting period.
The calculation of share-based compensation expense requires that we make assumptions and judgments about the variables used in the Black-Scholes model, including the expected term, expected volatility of the underlying common shares, risk-free interest rate and dividends.
We have adopted ASU 2016-09,
Improvements to Employee Share-Based Payment Accounting
, under which we will recognize forfeitures as they occur rather than applying a prospective forfeiture rate in advance
The assumptions used in our option-pricing model represent management’s best estimates. These estimates are complex, involve a number of variables, uncertainties and assumptions and the application of management’s judgment. If factors change and different assumptions are used, our share-based compensation expense could be materially different in the future. The assumptions and estimates that we use in the Black-Scholes model are as follows:
|
▪
|
Fair Value of Common Shares
. As the ordinary shares are not publicly traded, we must estimate its fair value, as discussed under Common Share Valuations below. The fair value of ordinary shares was determined on a periodic basis by our board of directors, with the assistance of an independent third-party valuation firm. The board of directors intended all options granted to be exercisable at a price per share not less than the estimated per share fair value of the shares underlying those options on the date of grant.
|
|
▪
|
Risk-Free Interest Rate
. We base the risk-free interest rate used in the Black-Scholes valuation model on the implied yield available on U.S. Treasury zero-coupon issues with a term equivalent to that of the expected term of the options for each option group.
|
|
▪
|
Expected Term
. The expected term represents the period that our share-based awards are expected to be outstanding. Because of the limitations on the sale or transfer of our shares as a privately held company, we do not believe our historical exercise pattern is indicative of the pattern it will experience as a publicly traded company. We have consequently used the Staff Accounting Bulletin 110, or SAB 110, simplified method to calculate the expected term, which is the average of the contractual term and vesting period. We plan to continue to use the SAB 110 simplified method until it has sufficient trading history as a publicly traded company.
|
|
▪
|
Volatility
. We determine the price volatility based on the historical volatilities of industry peers as it has no trading history for its stock. Industry peers consist of several public companies in the medical device industry with comparable characteristics, including revenue growth, operating model and working capital requirements. We intend to continue to consistently apply this process using the same or a similar peer group of public companies until a sufficient amount of historical information regarding the volatility of our shares becomes available, or unless circumstances change such that the identified peer companies are
|
71
no longer similar, in which case other suitable peer companies whose common share prices are publicly available would be utilized in the calculation.
|
▪
|
Dividend Yield
. The expected dividend assumption is based on our current expectations about its anticipated dividend policy. We have no expectation t
hat we will declare dividends on its ordinary shares, and therefore have used an expected dividend yield of zero.
|
We will continue to use judgment in evaluating the assumptions related to our share-based compensation on a prospective basis. As we continue to accumulate additional data, we may have refinements to our estimates, which could materially impact our future share-based compensation expense.
Recent Accounting Pronouncements
Please refer to Note 2 - “Summary of Significant Accounting Policies” in the notes to the consolidated financial statements included in this Form 10-K for information on recent accounting pronouncements and the expected impact on our unaudited condensed consolidated financial statements.
ITEM 7A. QUANTITATIVE AND QUALITATIVE DISCLOSURES ABOUT MARKET RISK
As a "smaller reporting company" as defined by Item 10 of Regulation S-K, the Company is not required to provide this information.
ITEM 8. FINANCIAL STATEMENTS AND SUPPLEMENTARY DATA
The financial statements required to be filed pursuant to this Item 8 are appended to this report beginning on page F‑1. An index of those financial statements is included in Part IV, Item 15 below.
ITEM 9. CHANGES IN AND DISAGREEMENTS WITH ACCOUNTANTS ON ACCOUNTING AND FINANCIAL DISCLOSURE
None.
ITEM 9A. CONROLS AND PROCEDURES
Evaluation of disclosure controls and procedures
As of December 31, 2018, the end of the period covered by this Annual Report on Form 10-K, our management, with the participation of our Chief Executive Officer and Chief Financial Officer, have evaluated the effectiveness of our disclosure controls and procedures as of the end of the period covered by this annual report. Disclosure controls and procedures (as defined in Rules 13a-15(e) and 15d-15(e) under the Securities Exchange Act of 1934, as amended) are designed to ensure that information required to be disclosed by a company in the reports that it files or submits under the Exchange Act is (i) recorded, processed, summarized and reported within the time periods specified in the SEC’s rules and forms and (ii) accumulated and communicated to the company’s management, including its principal executive officer and principal financial officer, as appropriate to allow timely decisions regarding required disclosure. Based on the evaluation of our disclosure controls and procedures, our Chief Executive Officer and Chief Financial Officer concluded that our disclosure controls and procedures were not effective as of the end of the period covered by this annual report at the reasonable assurance level.
Material Weaknesses in Internal Control over Financial Reporting
The material weakness related to lack of adequate review over the manual consolidation process, resulting in audit adjustments.
Changes in Internal Control over Financial Reporting
Other than with respect to the remediation efforts discussed below, there was no change in our internal control over financial reporting that occurred during the fourth quarter that has materially affected, or is reasonably likely to materially affect, our internal control over financial reporting.
Remediation of Previous Material Weaknesses
We have implemented and are continuing to implement a number of measures to address the material weaknesses identified as of December 31, 2017. We improved policies and procedures and designed and
72
documented more effective controls that addressed the relevant risks in order to remediate the previously identified material weaknesses in addition to hiring additional personnel in our accounting department and engaging consultants with technical expertise to assist in accounting for complex transactions. As a result, management determined that the material weakness identified as of December 31, 2017 has been remediated as of December 31, 2018. We will continue to implement additional measures to address the material weakness identified as of December 31, 2018.
Limitations on Effectiveness of Controls and Procedures
Our disclosure controls and procedures and internal control over financial reporting are designed to provide reasonable assurance of achieving the desired control objectives. Our management recognizes that any control system, no matter how well designed and operated, is based upon certain judgments and assumptions and cannot provide absolute assurance that its objectives will be met. In addition, the design of disclosure controls and procedures must reflect the fact that there are resource constraints and that management is required to apply judgment in evaluating the benefits of possible controls and procedures relative to their costs. Similarly, an evaluation of controls cannot provide absolute assurance that misstatements due to error or fraud will not occur or that all control issues and instances of fraud, if any, have been detected.
ITEM 9B. OTHER INFORMATION
Compensation for Named Executive Officers
On March 18, 2019, the Compensation Committee of the Board, or the Committee, approved a compensation arrangement for one of the Company’s named executive officers. Pursuant to the Company’s 2018 Equity Incentive Plan, the Committee granted Eddie de Oliveira an option to purchase 9,000 of the Company’s Common Shares, or the Options, at an exercise price of $27.46 per share, which was the closing price of the Common Shares on March 18, 2019. The Options will become eligible to vest upon the achievement of designated revenue metrics that will be measured at the end of 2019.
PART III
ITEM 10. DIRECTORS, EXECUTIVE OFFICERS AND CORPORATE GOVERNANCE
Incorporated by reference from the information in our Proxy Statement for our 2019 Annual Meeting of Stockholders, which we will file with the SEC within 120 days of the end of the fiscal year to which this Annual Report on Form 10-K relates.
ITEM 11. EXECUTIVE COMPENSATION
Incorporated by reference from the information in our Proxy Statement for our 2019 Annual Meeting of Stockholders, which we will file with the SEC within 120 days of the end of the fiscal year to which this Annual Report on Form 10-K relates.
ITEM 12. SECURITY OWNERSHIP OF CERTAIN BENEFICIAL OWNERS AND MANAGEMENT AND RELATED STOCKHOLDER MATTERS
Incorporated by reference from the information in our Proxy Statement for our 2019 Annual Meeting of Stockholders, which we will file with the SEC within 120 days of the end of the fiscal year to which this Annual Report on Form 10-K relates.
ITEM 13. CERTAIN RELATIONSHIPS AND RELATED TRANSACTIONS, AND DIRECTOR INDEPENDENCE
Incorporated by reference from the information in our Proxy Statement for our 2019 Annual Meeting of Stockholders, which we will file with the SEC within 120 days of the end of the fiscal year to which this Annual Report on Form 10-K relates.
73
ITEM 14. PRINCIPAL ACCOUNTING FEES AND SERVICES
Incorporated by reference from the information in our Proxy Statement for our 2019 Annual Meeting of Stockholders, which we will file with the SEC within 120 days of the end of the fiscal year to which this Annual Report on Form 10-K relates.
PART IV
ITEM 15. EXHIBITS, FINANCIAL STATEMENT SCHEDULES
The following statements are filed as part of this Annual Report on Form 10-K:
1. Financial Statements
.
A listing of the Consolidated Financial Statements, related notes and Report of Independent Registered Public Accounting is set forth on page F-1 in this Annual Report on Form 10-K.
2. Financial Statement Schedules
.
All schedules have been omitted since the required information is not present or is not present in amounts sufficient to require submission of a schedule, or because the information required is included in the financial statements or related notes.
3. Index to Exhibits
.
|
Exhibit Number
|
Description of Exhibit
|
Incorporation by Reference
|
||
|
1.1
|
Incorporated by reference from Registrant’s Form S-1/A filed July 13, 2018.
|
|||
|
3.1
|
Incorporated by reference from Registrant’s Form S-1 filed June 21, 2018.
|
|||
|
3.2
|
Incorporated by reference from Registrant’s Form S-1/A filed July 9, 2018.
|
|||
|
3.3
|
Incorporated by reference from Registrant’s Form S-1 filed June 21, 2018.
|
|||
|
4.1
|
Incorporated by reference from Registrant’s Form S-1/A filed July 13, 2018.
|
|||
|
4.2
|
Incorporated by reference from Registrant’s Form S-1 filed June 21, 2018.
|
|||
|
4.3
|
Incorporated by reference from Registrant’s Form S-1 filed June 21, 2018.
|
|||
|
4.4
|
Incorporated by reference from Registrant’s Form S-1 filed June 21, 2018.
|
|||
|
4.5
|
Incorporated by reference from Registrant’s Form S-1 filed June 21, 2018.
|
|||
|
4.6
|
Incorporated by reference from Registrant’s Form S-1 filed June 21, 2018.
|
|||
|
4.7
|
Incorporated by reference from Registrant’s Form S-1 filed June 21, 2018.
|
|||
|
10.1
|
Incorporated by reference from Registrant’s Form S-1 filed June 21, 2018.
|
|||
74
|
Exhibit Number
|
Description of Exhibit
|
Incorporation by Reference
|
||
|
10.2+
|
Incorporated by reference from Registrant’s Form S-1 filed June 21, 2018.
|
|||
|
10.3+
|
Incorporated by reference from Registrant’s Form S-1/A filed July 9, 2018.
|
|||
|
10.4+
|
Incorporated by reference from Registrant’s Form S-1/A filed July 9, 2018.
|
|||
|
10.5+
|
Incorporated by reference from Registrant’s Form S-1 filed June 21, 2018.
|
|||
|
10.6+
|
Incorporated by reference from Registrant’s Form S-1/A filed July 13, 2018.
|
|||
|
10.7+
|
Incorporated by reference from Registrant’s Form S-1/A filed July 13, 2018.
|
|||
|
10.8+
|
Incorporated by reference from Registrant’s Form S-1 filed June 21, 2018.
|
|||
|
10.9
|
Incorporated by reference from Registrant’s Form S-1 filed June 21, 2018.
|
|||
|
10.10
‡
|
Incorporated by reference from Registrant’s Form S-1/A filed July 13, 2018.
|
|||
|
10.11
|
Incorporated by reference from Registrant’s Form S-1 filed June 21, 2018.
|
|||
|
10.12‡
|
Incorporated by reference from Registrant’s Form S-1/A filed July 13, 2018.
|
|||
|
10.13
‡
|
Incorporated by reference from Registrant’s Form S-1/A filed July 13, 2018.
|
|||
|
10.14
|
Incorporated by reference from Registrant’s Form S-1/A filed July 13, 2018.
|
|||
|
10.15
|
Incorporated by reference from Registrant’s Form S-1/A filed July 13, 2018.
|
|||
|
10.16
|
Incorporated by reference from Registrant’s Form S-1/A filed July 13, 2018.
|
|||
|
10.17
|
Incorporated by reference from Registrant’s Form S-1 filed June 21, 2018.
|
|||
|
10.18
|
Incorporated by reference from Registrant’s Form S-1 filed June 21, 2018.
|
|||
|
10.19
‡
|
Incorporated by reference from Registrant’s Form S-1/A filed July 13, 2018.
|
|||
|
10.20
‡
|
Incorporated by reference from Registrant’s Form S-1 filed July 13, 2018.
|
|||
|
10.21+
|
Incorporated by reference from Registrant’s Quarterly Report on Form 10-Q for the quarterly period ended June 30, 2018.
|
|||
|
10.22
|
Incorporated by reference from Registrant’s Current Report on Form 8-K filed October 10, 2018.
|
|||
|
Exhibit Number
|
Description of Exhibit
|
Incorporation by Reference
|
||
|
10.23
|
Incorporated by reference from Registrant’s Current Report on Form 8-K filed October 10, 2018.
|
|||
|
10.24
|
Incorporated by reference from Registrant’s Current Report on Form 8-K filed October 10, 2018.
|
|||
|
10.25+
|
Incorporated by reference from Registrant’s Current Report on Form 8-K filed December 28, 2018.
|
|||
|
10.26+
|
Incorporated by reference from Registrant’s Current Report on Form 8-K filed December 28, 2018.
|
|||
|
10.27+
|
Incorporated by reference from Registrant’s Current Report on Form 8-K filed December 28, 2018.
|
|||
|
10.28+
|
Incorporated by reference from Registrant’s Current Report on Form 8-K filed December 28, 2018.
|
|||
|
21.1
|
Filed herewith.
|
|||
|
23.1
|
Filed herewith.
|
|||
|
31.1*
|
Filed herewith.
|
|||
|
31.2*
|
Filed herewith.
|
|||
|
32.1*
|
Filed herewith.
|
|||
|
101.INS
|
XBRL Instance Document
|
|||
|
101.SCH
|
XBRL Taxonomy Extension Schema Document
|
|||
|
101.CAL
|
XBRL Taxonomy Extension Calculation Linkbase Document
|
|||
|
101.DEF
|
XBRL Taxonomy Extension Definition Linkbase Document
|
|||
|
101.LAB
|
XBRL Taxonomy Extension Label Linkbase Document
|
|||
|
101.PRE
|
XBRL Taxonomy Extension Presentation Linkbase Document
|
|||
|
+
|
Indicates management contract or compensatory plan or arrangement.
|
|
‡
|
Portions omitted, or to be omitted, pursuant to a request for confidential treatment.
|
* The certifications furnished in Exhibit 32.1 and 32.2 hereto are deemed to accompany this Annual Report on Form 10-K and will not be deemed “filed” for purposes of Section 18 of the Securities Exchange Act of 1934, as amended, except to the extent that the registrant specifically incorporates it by reference.
ESTABLISHMENT LABS HOLDINGS INC.
Index to Consolidated Financial Statements
For the Years Ended December 31, 2018 and 2017
|
PAGE
|
|
|
Consolidated Financial Statements
|
|
|
Consolidated Statements of Shareholders’ Equity (Deficit)
|
|
77
REPORT OF INDEPENDENT REGISTERED PUBLIC ACCOUNTING FIRM
To the Board of Directors and Shareholders
of Establishment Labs Holdings Inc.
Opinion on the Financial Statements
We have audited the accompanying consolidated balance sheets of Establishment Labs Holdings Inc. (the “Company”) as of December 31, 2018 and 2017, and the related consolidated statements of operations, comprehensive loss, shareholders’ equity (deficit) and cash flows for each of the two years in the period ended December 31, 2018, and the related notes (collectively referred to as the “financial statements”). In our opinion, the financial statements present fairly, in all material respects, the financial position of the Company as of December 31, 2018 and 2017, and the results of its operations and its cash flows for each of the two years in the period ended December 31, 2018, in conformity with accounting principles generally accepted in the United States of America.
Basis for Opinion
These financial statements are the responsibility of the Company's management. Our responsibility is to express an opinion on the Company's financial statements based on our audits. We are a public accounting firm registered with the Public Company Accounting Oversight Board (United States) ("PCAOB") and are required to be independent with respect to the Company in accordance with the U.S. federal securities laws and the applicable rules and regulations of the Securities and Exchange Commission and the PCAOB.
We conducted our audits in accordance with the standards of the PCAOB. Those standards require that we plan and perform the audits to obtain reasonable assurance about whether the financial statements are free of material misstatement, whether due to error or fraud. The Company is not required to have, nor were we engaged to perform, an audit of its internal control over financial reporting. As part of our audits, we are required to obtain an understanding of internal control over financial reporting but not for the purpose of expressing an opinion on the effectiveness of the Company's internal control over financial reporting. Accordingly, we express no such opinion.
Our audits included performing procedures to assess the risks of material misstatement of the financial statements, whether due to error or fraud, and performing procedures that respond to those risks. Such procedures included examining, on a test basis, evidence regarding the amounts and disclosures in the financial statements. Our audits also included evaluating the accounting principles used and significant estimates made by management, as well as evaluating the overall presentation of the financial statements. We believe that our audits provide a reasonable basis for our opinion.
/s/ Marcum LLP
Marcum LLP
Costa Mesa, CA
We have served as the Company’s auditor since 2016.
March 20, 2019
F-1
ESTABLISHMENT LABS HOLDINGS INC.
Consolidated Balance Sheets
(In thousands, except share data)
|
December 31,
|
|||||||
|
2018
|
2017
|
||||||
|
Assets
|
|||||||
|
Current assets:
|
|||||||
|
Cash
|
$
|
52,639
|
|
$
|
10,864
|
|
|
|
Accounts receivable, net of allowance for doubtful accounts of $926 and $1,512
|
17,648
|
|
13,108
|
|
|||
|
Inventory, net
|
24,845
|
|
13,173
|
|
|||
|
Prepaid expenses and other current assets
|
4,303
|
|
2,237
|
|
|||
|
Total current assets
|
99,435
|
|
39,382
|
|
|||
|
Long-term assets:
|
|||||||
|
Property and equipment, net of accumulated depreciation of $5,230 and $3,179
|
12,913
|
|
13,500
|
|
|||
|
Goodwill
|
465
|
|
465
|
|
|||
|
Intangible assets, net of accumulated amortization of $1,213 and $573
|
3,445
|
|
3,401
|
|
|||
|
Restricted cash
|
—
|
|
75
|
|
|||
|
Other non-current assets
|
315
|
|
272
|
|
|||
|
Total assets
|
$
|
116,573
|
|
$
|
57,095
|
|
|
|
Liabilities and shareholders’ equity (deficit)
|
|||||||
|
Current liabilities:
|
|||||||
|
Accounts payable
|
$
|
6,239
|
|
$
|
9,131
|
|
|
|
Accrued liabilities
|
6,125
|
|
2,326
|
|
|||
|
Notes payable related party, including accrued interest
|
—
|
|
4,921
|
|
|||
|
Note payable, Madryn, net of debt discount and issuance costs
|
—
|
|
19,167
|
|
|||
|
Madryn put option
|
—
|
|
20,302
|
|
|||
|
Madryn call option
|
—
|
|
360
|
|
|||
|
Other liabilities, short term
|
4,083
|
|
1,228
|
|
|||
|
Total current liabilities
|
16,447
|
|
57,435
|
|
|||
|
Long-term liabilities:
|
|||||||
|
Note payable, Madryn, net of debt discount and issuance costs
|
22,322
|
|
—
|
|
|||
|
Madryn put option
|
4,768
|
|
—
|
|
|||
|
Other liabilities, long term
|
3,551
|
|
4,673
|
|
|||
|
Total liabilities
|
47,088
|
|
62,108
|
|
|||
|
Commitments and contingencies (Note 7)
|
|
|
|||||
|
Shareholders’ equity (deficit):
|
|||||||
|
Ordinary shares - $1.00 par value (class A and B), zero and 21,206,630 shares authorized at December 31, 2018 and 2017, respectively; zero and 13,427,536 shares issued at December 31, 2018 and 2017, respectively; zero and 12,206,326 shares outstanding at December 31, 2018 and 2017, respectively
|
—
|
|
13,427
|
|
|||
|
Ordinary shares - no par value (class C, D, E, F, G and G-1), zero and 2,316,169 shares authorized at December 31, 2018 and 2017, respectively; zero and 2,316,169 shares issued and outstanding at December 31, 2018 and 2017, respectively
|
—
|
|
27,840
|
|
|||
|
Common shares - zero and $1.00 par value as of December 31, 2018 and 2017, respectively, unlimited amount and 84,050,000 shares authorized at December 31, 2018 and 2017, respectively; 20,672,025 and zero shares issued at December 31, 2018 and 2017, respectively; 20,263,955 and zero shares outstanding at December 31, 2018 and 2017, respectively
|
145,709
|
|
—
|
|
|||
|
Additional paid-in-capital
|
15,156
|
|
27,986
|
|
|||
|
Treasury shares, at cost, 408,070 and 1,221,210 shares held at December 31, 2018 and 2017, respectively
|
(2,854
|
)
|
(6,465
|
)
|
|||
|
Accumulated deficit
|
(88,975
|
)
|
(67,877
|
)
|
|||
|
Accumulated other comprehensive income
|
449
|
|
76
|
|
|||
|
Total shareholders’ equity (deficit)
|
69,485
|
|
(5,013
|
)
|
|||
|
Total liabilities and shareholders’ equity (deficit)
|
$
|
116,573
|
|
$
|
57,095
|
|
|
The accompanying notes are an integral part of these consolidated financial statements.
F-2
ESTABLISHMENT LABS HOLDINGS INC.
Consolidated Statements of Operations
(In thousands, except share and per share data)
|
Year Ended December 31,
|
||||||||
|
2018
|
2017
|
|||||||
|
Revenue
|
$
|
61,208
|
|
$
|
34,681
|
|
||
|
Cost of revenue
|
25,090
|
|
16,979
|
|
||||
|
Gross profit
|
36,118
|
|
17,702
|
|
||||
|
Operating expenses:
|
||||||||
|
Sales, general and administrative
|
47,295
|
|
30,821
|
|
||||
|
Research and development
|
12,687
|
|
6,864
|
|
||||
|
Total operating expenses
|
59,982
|
|
37,685
|
|
||||
|
Loss from operations
|
(23,864
|
)
|
(19,983
|
)
|
||||
|
Interest income
|
16
|
|
19
|
|
||||
|
Interest expense
|
(8,814
|
)
|
(10,420
|
)
|
||||
|
Change in fair value of derivative instruments
|
15,894
|
|
(2,428
|
)
|
||||
|
Change in fair value of contingent consideration
|
(1,727
|
)
|
—
|
|
||||
|
Initial public offering expenses
|
—
|
|
(1,585
|
)
|
||||
|
Other income (expense), net
|
(2,388
|
)
|
(395
|
)
|
||||
|
Loss before income taxes
|
(20,883
|
)
|
(34,792
|
)
|
||||
|
Benefit (provision) for income taxes
|
(215
|
)
|
(105
|
)
|
||||
|
Net loss
|
$
|
(21,098
|
)
|
$
|
(34,897
|
)
|
||
|
Basic and diluted loss per share
|
$
|
(1.22
|
)
|
$
|
(3.41
|
)
|
||
|
Weighted average outstanding shares used for basic and diluted net loss per share
|
17,350,705
|
|
10,230,586
|
|
||||
The accompanying notes are an integral part of these consolidated financial statements.
F-3
ESTABLISHMENT LABS HOLDINGS INC.
Consolidated Statements of Comprehensive Loss
(In thousands)
|
Year Ended December 31,
|
|||||||
|
2018
|
2017
|
||||||
|
Net loss
|
$
|
(21,098
|
)
|
$
|
(34,897
|
)
|
|
|
Other comprehensive income:
|
|||||||
|
Foreign currency translation gain
|
373
|
|
76
|
|
|||
|
Other comprehensive gain
|
373
|
|
76
|
|
|||
|
Comprehensive loss
|
$
|
(20,725
|
)
|
$
|
(34,821
|
)
|
|
The accompanying notes are an integral part of these consolidated financial statements.
F-4
ESTABLISHMENT LABS HOLDINGS INC.
Consolidated Statements of Shareholders’ Equity (Deficit)
(In thousands, except share data)
|
Common Shares
|
Ordinary Shares
|
Treasury Shares
|
Additional
Paid-In Capital |
Accumulated
Deficit |
Accumulated Other Comprehensive Income
|
Total
|
|||||||||||||||||||||||||||||||||||||||||
|
Shares
|
Amount
|
Shares
|
Amount
|
Shares
|
Amount
|
||||||||||||||||||||||||||||||||||||||||||
|
Balance at January 1, 2017
|
—
|
|
$
|
—
|
|
7,118,753
|
|
$
|
7,118
|
|
(813,140
|
)
|
$
|
(3,611
|
)
|
$
|
3,038
|
|
$
|
(32,980
|
)
|
$
|
—
|
|
$
|
(26,435
|
)
|
||||||||||||||||||||
|
Issuance of ordinary shares
|
—
|
|
—
|
|
2,316,169
|
|
27,840
|
|
—
|
|
—
|
|
—
|
|
—
|
|
—
|
|
$
|
27,840
|
|
||||||||||||||||||||||||||
|
Cumulative change in accounting principle (adoption of ASU 2017-11)
|
—
|
|
—
|
|
—
|
|
—
|
|
—
|
|
—
|
|
958
|
|
—
|
|
—
|
|
$
|
958
|
|
||||||||||||||||||||||||||
|
Extinguishment of warrant with related party
|
—
|
|
—
|
|
207,716
|
|
208
|
|
—
|
|
—
|
|
2,192
|
|
—
|
|
—
|
|
$
|
2,400
|
|
||||||||||||||||||||||||||
|
Conversion of related party convertible notes payable
|
—
|
|
—
|
|
5,869,417
|
|
5,869
|
|
—
|
|
—
|
|
18,383
|
|
—
|
|
—
|
|
$
|
24,252
|
|
||||||||||||||||||||||||||
|
Issuance of shares in a business combination
|
—
|
|
—
|
|
35,714
|
|
36
|
|
—
|
|
—
|
|
308
|
|
—
|
|
—
|
|
$
|
344
|
|
||||||||||||||||||||||||||
|
Repurchase of ordinary shares
|
—
|
|
—
|
|
—
|
|
—
|
|
(408,070
|
)
|
(2,854
|
)
|
—
|
|
—
|
|
—
|
|
$
|
(2,854
|
)
|
||||||||||||||||||||||||||
|
Share-based compensation
|
—
|
|
—
|
|
195,936
|
|
196
|
|
—
|
|
—
|
|
3,107
|
|
—
|
|
—
|
|
$
|
3,303
|
|
||||||||||||||||||||||||||
|
Foreign currency translation gain
|
—
|
|
—
|
|
—
|
|
—
|
|
—
|
|
—
|
|
—
|
|
—
|
|
76
|
|
$
|
76
|
|
||||||||||||||||||||||||||
|
Net loss
|
—
|
|
—
|
|
—
|
|
—
|
|
—
|
|
—
|
|
—
|
|
(34,897
|
)
|
—
|
|
$
|
(34,897
|
)
|
||||||||||||||||||||||||||
|
Balance at December 31, 2017
|
—
|
|
$
|
—
|
|
15,743,705
|
|
$
|
41,267
|
|
(1,221,210
|
)
|
$
|
(6,465
|
)
|
$
|
27,986
|
|
$
|
(67,877
|
)
|
$
|
76
|
|
$
|
(5,013
|
)
|
||||||||||||||||||||
|
Issuance of ordinary shares
|
—
|
|
—
|
|
—
|
|
—
|
|
1,011,174
|
|
—
|
|
16,180
|
|
—
|
|
—
|
|
—
|
|
—
|
|
—
|
|
(78
|
)
|
—
|
|
—
|
|
—
|
|
—
|
|
—
|
|
16,102
|
|
|||||||||
|
Issuance of common shares, IPO
|
4,272,568
|
|
70,055
|
|
—
|
|
—
|
|
—
|
|
—
|
|
—
|
|
—
|
|
—
|
|
70,055
|
|
|||||||||||||||||||||||||||
|
Issuance of common shares in a business combination
|
33,333
|
|
862
|
|
—
|
|
—
|
|
—
|
|
—
|
|
—
|
|
—
|
|
—
|
|
862
|
|
|||||||||||||||||||||||||||
|
Conversion of ordinary shares to common shares
|
16,215,710
|
|
74,256
|
|
(16,215,710
|
)
|
(56,908
|
)
|
—
|
|
—
|
|
(17,348
|
)
|
—
|
|
—
|
|
—
|
|
|||||||||||||||||||||||||||
|
Issuance of shares in an asset acquisition
|
5,000
|
|
120
|
|
—
|
|
—
|
|
—
|
|
—
|
|
—
|
|
—
|
|
—
|
|
120
|
|
|||||||||||||||||||||||||||
|
Warrant exercises
|
38,785
|
|
128
|
|
—
|
|
—
|
|
—
|
|
—
|
|
(7
|
)
|
—
|
|
—
|
|
121
|
|
|||||||||||||||||||||||||||
|
Stock option exercises
|
25,843
|
|
207
|
|
106,248
|
|
106
|
|
—
|
|
—
|
|
330
|
|
—
|
|
—
|
|
643
|
|
|||||||||||||||||||||||||||
|
Share-based compensation
|
80,786
|
|
81
|
|
167,723
|
|
168
|
|
—
|
|
—
|
|
7,071
|
|
—
|
|
—
|
|
7,320
|
|
|||||||||||||||||||||||||||
|
Retirement of treasury shares
|
—
|
|
—
|
|
(813,140
|
)
|
(813
|
)
|
813,140
|
|
3,611
|
|
(2,798
|
)
|
—
|
|
—
|
|
—
|
|
|||||||||||||||||||||||||||
|
Foreign currency translation gain (loss)
|
—
|
|
—
|
|
—
|
|
—
|
|
—
|
|
—
|
|
—
|
|
—
|
|
373
|
|
373
|
|
|||||||||||||||||||||||||||
|
Net loss
|
—
|
|
—
|
|
—
|
|
—
|
|
—
|
|
—
|
|
—
|
|
(21,098
|
)
|
—
|
|
(21,098
|
)
|
|||||||||||||||||||||||||||
|
Balance at December 31, 2018
|
20,672,025
|
|
$
|
145,709
|
|
—
|
|
$
|
—
|
|
$
|
(408,070
|
)
|
$
|
(2,854
|
)
|
$
|
15,156
|
|
$
|
(88,975
|
)
|
$
|
449
|
|
$
|
69,485
|
|
|||||||||||||||||||
The accompanying notes are an integral part of these consolidated financial statements.
F-5
ESTABLISHMENT LABS HOLDINGS INC.
Consolidated Statements of Cash Flows
(In thousands)
|
Year Ended December 31,
|
||||||||
|
2018
|
2017
|
|||||||
|
Cash flows from operating activities:
|
||||||||
|
Net loss
|
$
|
(21,098
|
)
|
$
|
(34,897
|
)
|
||
|
Adjustments to reconcile net loss to net cash used in operating activities:
|
||||||||
|
Depreciation and amortization
|
2,810
|
|
1,939
|
|
||||
|
(Bad debt recovery) provision for doubtful accounts
|
(547
|
)
|
943
|
|
||||
|
Provision for inventory obsolescence
|
204
|
|
—
|
|
||||
|
Share-based compensation
|
7,320
|
|
3,303
|
|
||||
|
Loss from disposal of property and equipment
|
79
|
|
—
|
|
||||
|
Write off of deferred offering costs
|
—
|
|
1,585
|
|
||||
|
Unrealized foreign currency (gain) loss, net
|
2,217
|
|
—
|
|
||||
|
Change in fair value of derivative instruments
|
(15,894
|
)
|
2,428
|
|
||||
|
Change in fair value of contingent consideration
|
1,727
|
|
—
|
|
||||
|
Conversion of accrued interest into principal and amortization of debt discount
|
3,317
|
|
7,054
|
|
||||
|
Changes in operating assets and liabilities:
|
||||||||
|
Accounts receivable
|
(4,667
|
)
|
(6,911
|
)
|
||||
|
Inventory
|
(6,984
|
)
|
(6,437
|
)
|
||||
|
Prepaid expenses and other current assets
|
(2,192
|
)
|
(1,681
|
)
|
||||
|
Other assets
|
(45
|
)
|
(570
|
)
|
||||
|
Accounts payable
|
(3,905
|
)
|
(878
|
)
|
||||
|
Accrued liabilities
|
3,801
|
|
1,103
|
|
||||
|
Other liabilities
|
(28
|
)
|
1,049
|
|
||||
|
Net cash used in operating activities
|
(33,885
|
)
|
(31,970
|
)
|
||||
|
Cash flows from investing activities:
|
||||||||
|
Purchases of property and equipment
|
(1,731
|
)
|
(901
|
)
|
||||
|
Cash used in asset acquisitions
|
(3,959
|
)
|
—
|
|
||||
|
Cost incurred for intangible assets
|
(41
|
)
|
(40
|
)
|
||||
|
Increase (decrease) in restricted cash
|
—
|
|
96
|
|
||||
|
Net cash used in investing activities
|
(5,731
|
)
|
(845
|
)
|
||||
|
Cash flows from financing activities:
|
||||||||
|
Borrowings on short-term notes payable
|
—
|
|
1,000
|
|
||||
|
Borrowings under Madryn credit agreement, net of issuance costs
|
—
|
|
38,465
|
|
||||
|
Repayments on short term notes payable
|
—
|
|
(1,200
|
)
|
||||
|
Repayments on related-party notes payable
|
(5,083
|
)
|
—
|
|
||||
|
Repayments under Perceptive credit agreement
|
—
|
|
(15,000
|
)
|
||||
|
Payments of deferred offering costs
|
—
|
|
(914
|
)
|
||||
|
Repayments on capital leases
|
(311
|
)
|
(291
|
)
|
||||
|
Proceeds from issuance of ordinary shares, net of issuance costs
|
16,102
|
|
27,840
|
|
||||
|
Proceeds from issuance of common shares, net of underwriters’ discount
|
71,523
|
|
—
|
|
||||
|
Deferred equity issuance costs, IPO
|
(1,468
|
)
|
—
|
|
||||
|
Cash used to repurchase warrants
|
—
|
|
(2,400
|
)
|
||||
|
Proceeds from stock option exercises
|
643
|
|
—
|
|
||||
|
Proceeds from warrant exercises
|
121
|
|
—
|
|
||||
|
Shares repurchased
|
—
|
|
(4,507
|
)
|
||||
|
Net cash provided by financing activities
|
81,527
|
|
42,993
|
|
||||
|
Effect of exchange rate changes on cash
|
(136
|
)
|
207
|
|
||||
|
Net increase in cash
|
41,775
|
|
10,385
|
|
||||
|
Cash at beginning of period
|
10,864
|
|
479
|
|
||||
|
Cash at end of period
|
$
|
52,639
|
|
$
|
10,864
|
|
||
The accompanying notes are an integral part of these consolidated financial statements.
F-6
ESTABLISHMENT LABS HOLDINGS INC.
Consolidated Statements of Cash Flows
(In thousands)
|
Year Ended December 31,
|
||||||||
|
2018
|
2017
|
|||||||
|
Supplemental disclosures:
|
||||||||
|
Cash paid for interest
|
$
|
5,379
|
|
$
|
2,862
|
|
||
|
Cash paid for income taxes
|
$
|
136
|
|
$
|
147
|
|
||
|
Supplemental disclosures of non-cash investing and financing activities:
|
||||||||
|
Unpaid balance for property and equipment
|
$
|
717
|
|
$
|
783
|
|
||
|
Assets acquired under capital leases
|
$
|
94
|
|
$
|
209
|
|
||
|
Extinguishment of warrants with related party
|
$
|
—
|
|
$
|
958
|
|
||
|
Equity consideration in an asset acquisition
|
$
|
120
|
|
$
|
—
|
|
||
|
Consideration payable related to asset acquisitions
|
$
|
1,276
|
|
$
|
—
|
|
||
|
Conversion of related party convertible notes payable into ordinary shares
|
$
|
—
|
|
$
|
24,252
|
|
||
|
Liability to issues shares in business acquisition
|
$
|
—
|
|
$
|
964
|
|
||
|
Consideration payable related to business acquisition
|
$
|
—
|
|
$
|
1,704
|
|
||
|
Goodwill recorded in business combination
|
$
|
—
|
|
$
|
210
|
|
||
|
Property, equipment and prepaids acquired in business acquisition
|
$
|
—
|
|
$
|
1,498
|
|
||
|
Intangible assets acquired in business acquisition
|
$
|
—
|
|
$
|
1,304
|
|
||
|
Issuance of common shares in partial settlement of contingent consideration
|
$
|
863
|
|
$
|
—
|
|
||
|
Transfer from restricted cash to prepaid expenses and other current assets
|
$
|
75
|
|
$
|
—
|
|
||
The accompanying notes are an integral part of these consolidated financial statements.
F-7
ESTABLISHMENT LABS HOLDINGS, INC.
Notes to Consolidated Financial Statements
For the Years Ended December 31, 2018 and 2017
1.
Formation and Business of the Company
Formation and Business of the Company
Establishment Labs Holdings Inc. and its wholly owned subsidiaries (collectively “the Company”, “we”, “us”, or “our”) is a global company that manufactures and markets innovative medical devices for aesthetic plastic surgery and reconstructive plastic surgery. The Company was established in the British Virgin Islands on October 9, 2013, at which time Establishment Labs, S.A., the Costa Rican manufacturing company, was reincorporated as a wholly-owned subsidiary. As of December 31, 2018, the Company also has wholly-owned subsidiaries in the United States (JAMM Technologies, Inc. and Motiva USA LLC), Belgium (European Distribution Center Motiva BVBA), Brazil (Establishment Labs Produtos para Saude Ltda), France (Motiva Implants France SAS), Sweden (Motiva Nordica AB), Switzerland (JEN-Vault AG), the United Kingdom (Motiva Implants UK Limited) and Italy (Motiva Italy S.R.L). In January 2019, the Company established a wholly-owned subsidiary in Spain (Motiva Implants Spain, S.L.). Substantially all of the Company’s revenues are derived from the sale of silicone breast implants under the brand of Motiva Implants.
The main manufacturing activities are conducted at
two
manufacturing facilities in Costa Rica. Beginning in 2010, the Company began operating under the Costa Rica free zone regime (Régimen de Zona Franca), which provides for reduced income tax and other tax obligations pursuant to an agreement with the Costa Rican authorities.
The Company’s products are approved for sale in Europe, the Middle East, Latin America, and Asia. The Company sells its products internationally through a combination of distributors and direct sales to customers.
The Company is pursuing regulatory approval to commercialize its products in the United States. We received approval of an investigational device exemption, or IDE, from the FDA in March 2018 to initiate our Motiva Implants clinical trial in the United States and the first patient in the study was enrolled in April 2018.
The Company has been expanding its global operations through a series of acquisitions and establishing wholly-owned subsidiaries. In November 2015, the Company purchased certain assets from Magna Equities I, LLC and established its wholly-owned subsidiary, JAMM Technologies, Inc., in the United States. In January 2016, the Company purchased a distribution company in Brazil to support the application to sell its products in Brazil. In March 2016, the Company purchased a storage and distribution company in Belgium to support its continued growth in Europe. In September 2016, the Company purchased a distribution company in France and established a wholly-owned subsidiary in Switzerland. In November 2017, the Company acquired certain assets from Femiline AB and established its wholly-owned subsidiary in Sweden, Motiva Nordica AB. During 2018, the Company has established wholly-owned subsidiaries in the United Kingdom and Italy and purchased certain assets from Menke Med GmbH, Motiva Matrix Spain SL and Belle Health Ltd. In January 2019, the Company established a wholly-owned subsidiary in Spain.
Initial Public Offering
On July 23, 2018, the Company completed its initial public offering, or IPO, whereby it sold a total of
4,272,568
common shares at
$18.00
per share including
557,291
shares sold to underwriters for the exercise of their option to purchase additional shares. The Company received net proceeds from the IPO of approximately
$70.1 million
, after deducting underwriting discounts and commissions of
$5.4 million
and deferred offering costs of
$1.5 million
.
Concurrent with the closing of the IPO, the following transactions were completed in accordance with the related agreements:
|
•
|
the Company amended and restated its Memorandum of Association and Articles of Association, or the Articles, to automatically convert all outstanding classes of the Company’s stock into common shares of a single class of no par value. An unlimited number of common shares was authorized.
|
|
•
|
The Board of Directors determined no further awards would be issued from the 2015 Equity Plan and approved the 2018 Equity Incentive Plan, or the 2018 Plan, with an initial reserve of
1,500,000
of the Company’s common shares for issuance;
|
|
•
|
The Board of Directors adopted the 2018 Employee Share Purchase Plan, or the ESPP, with an initial reserve of
100,000
of the Company’s common shares for issuance.
|
F-8
ESTABLISHMENT LABS HOLDINGS, INC.
Notes to Consolidated Financial Statements
For the Years Ended December 31, 2018 and 2017
2.
Summary of Significant Accounting Policies
Basis of Presentation and Consolidation
The accompanying
consolidated
financial statements have been prepared in accordance with accounting principles generally accepted in the United States of America, or GAAP, and the applicable rules and regulations of the Securities and Exchange Commission, or SEC.
The
consolidated
financial statements include the Company’s accounts and those of its wholly owned subsidiaries as of
December 31, 2018
as follows:
|
Subsidiary
|
Incorporation/Acquisition Date
|
|
Establishment Labs, S.A. (Costa Rica)
|
January 18, 2004
|
|
Motiva USA, LLC (USA)
|
February 20, 2014
|
|
JAMM Technologies, Inc. (USA)
|
October 27, 2015
|
|
Establishment Labs Produtos par Saude Ltda (Brazil)
|
January 4, 2016
|
|
European Distribution Center Motiva BVBA (Belgium)
|
March 4, 2016
|
|
Motiva Implants France SAS (France)
|
September 12, 2016
|
|
JEN-Vault AG (Switzerland)
|
November 22, 2016
|
|
Motiva Nordica AB (Sweden)
|
November 2, 2017
|
|
Motiva Implants UK Limited
|
July 31, 2018
|
|
Motiva Italy S.R.L
|
July 31, 2018
|
All intercompany accounts and transactions have been eliminated in consolidation.
Segments
The chief operating decision maker for the Company is the Chief Executive Officer. The Chief Executive Officer reviews financial information presented on a consolidated basis, accompanied by information about revenue by geographic region, for purposes of allocating resources and evaluating financial performance. The Company has one business activity and there are no segment managers who are held accountable for operations, operating results or plans for levels or components below the consolidated unit level. Accordingly, the Company has determined that it has a single reportable and operating segment structure. The Company and its Chief Executive Officer evaluate performance based primarily on revenue in the geographic regions in which the Company operates.
Geographic Concentrations
The Company derives all of its revenues from sales to customers in Europe, the Middle East, Latin America, and Asia, and has not yet received approval to sell its products in the United States.
For the year ended
December 31, 2018
, Brazil accounted for
15.7%
of consolidated revenue and no other individual country exceeded 10% of consolidated revenue, on a ship-to destination basis. For the year ended
December 31, 2017
, no individual country exceeded 10% of consolidated revenue, on a ship-to destination basis.
The Company’s long-lived assets located in Costa Rica represented the majority of the total long-lived assets as of
December 31, 2018
and
2017
.
Use of Estimates
The preparation of financial statements in accordance with GAAP requires management to make estimates and assumptions that affect the amounts reported in the
consolidated
financial statements and accompanying notes. Significant accounting
estimates and management judgments reflected in the
consolidated
financial statements include items such as accounts receivable valuation and allowances, inventory valuation and allowances,
F-9
ESTABLISHMENT LABS HOLDINGS, INC.
Notes to Consolidated Financial Statements
For the Years Ended December 31, 2018 and 2017
valuation of acquired intangible assets, valuation of contingent consideration, valuation of derivatives, estimation of assets’ useful lives and valuation allowances of deferred income tax assets. Estimates are based
on historical experience, where applicable, and other assumptions believed to be reasonable by management. Actual results may differ from those estimates under different assumptions or conditions.
Concentration of Credit Risk and Other Risks and Uncertainties
Financial instruments that potentially subject the Company to a concentration of credit risk consist principally of cash, restricted cash and accounts receivable. The majority of the Company’s cash is held at one financial institution in the United States. The Company has not experienced any losses on its deposits of cash.
All of the Company’s revenue has been derived from sales of its products in international markets, principally Europe, Middle East, Latin America, and Asia. In the international markets in which the Company participates, the Company uses a combination of distributors and makes direct sales to customers. The Company performs ongoing credit evaluations of its distributors and customers, does not require collateral, and maintains allowances for potential credit losses on customer accounts when deemed necessary.
During the
year
ended
December 31, 2018
and
2017
, no customers accounted for more than 10% of the Company’s revenue. No customers accounted for more than 10% of the Company’s accounts receivable balance as of
December 31, 2018
and
2017
. Substantially all of the Company’s revenues are derived from the sale of Motiva Implants.
The Company relies on NuSil Technology, LLC, or NuSil, as the sole supplier of medical-grade silicone used in Motiva Implants as well as other products that are manufactured under contract to other customers. During the
year
ended
December 31, 2018
and
2017
, the Company had purchases of
$14.8 million
, or
63.4%
of total purchases, and
$10.2 million
, or
40.6%
of total purchases, respectively, from Nusil. As of
December 31, 2018
and
2017
, we had an outstanding balance owed to this vendor of
$0.8 million
and
$0.7 million
, respectively.
The Company’s future results of operations involve a number of risks and uncertainties. Factors that could affect the Company’s future operating results and cause actual results to vary materially from expectations include, but are not limited to, uncertainty of regulatory approval of the Company’s current and potential future products, uncertainty of market acceptance of the Company’s products, competition from substitute products and larger companies, securing and protecting proprietary technology, strategic relationships and dependence on key individuals and sole source suppliers.
Products developed by the Company require clearances from the FDA or other international regulatory agencies prior to commercial sales. There can be no assurance that the products will receive the necessary clearances. If the Company was denied clearance, clearance was delayed, or the Company was unable to maintain its existing clearances, these developments could have a material adverse impact on the Company.
Cash
The Company’s cash consists of cash maintained in checking and interest-bearing accounts. The Company accounts for financial instruments with original maturities of three months or less at the date of purchase as cash equivalents. The Company held
no
cash equivalents as of
December 31, 2018
and
2017
.
Restricted Cash
As of December 31, 2017, the restricted cash balance represented a certificate of deposit collateralizing payment of charges related to the Company's corporate credit card. As of December 31, 2018, the funds were included in “Prepaid expenses and other current assets” as the Company anticipates the restriction to be lifted in 2019.
Accounts Receivable and Allowance for Doubtful Accounts
Accounts receivable is stated at invoice value less estimated allowances for returns and doubtful accounts. The Company continually monitors customer payments and maintains an allowance for estimated losses resulting from customers’ inability to make required payments. In evaluating the Company’s ability to collect outstanding receivable balances, the Company considers various factors including the age of the balance, the creditworthiness of the customer, which is assessed based on ongoing credit evaluations and payment history, and the customer’s current financial condition. In cases where there are circumstances that may impair a specific customer’s ability to meet its financial obligations, an allowance is recorded against amounts due, which reduces
F-10
ESTABLISHMENT LABS HOLDINGS, INC.
Notes to Consolidated Financial Statements
For the Years Ended December 31, 2018 and 2017
the net recognized receivable to the amount reasonably believed to be collectible.
Inventory and Cost of Revenue
Inventory is stated at the lower of cost to purchase or manufacture the inventory or the net realizable value of such inventory. Cost is determined using the standard cost method which approximates actual costs using the first-in, first-out basis. The Company regularly reviews inventory quantities considering actual losses, projected future demand, and remaining shelf life to record a provision for excess and slow-moving inventory. As of
December 31, 2018
, an allowance of
$0.2 million
was recorded for inventory obsolescence.
No
inventory allowance has been recorded as of
December 31, 2017
.
The Company recognizes the cost of inventory transferred to the customer in cost of revenue when revenue is recognized.
Shipping and Handling Costs
Shipping and handling costs are expensed as incurred and are included in selling, general and administrative, or SG&A, expenses. For the
year
ended
December 31, 2018
and
2017
, shipping and handling costs were
$2.0 million
and
$1.3 million
, respectively.
Revenue Recognition
The Company recognizes revenue related to sales of products to distributors or directly to customers in markets where it has regulatory approval, net of trade discounts and allowances. The Company recognizes revenue in accordance with Accounting Standards Codification, or ASC, 605
Revenue Recognition
when all of the following criteria are met:
▪
persuasive evidence of an arrangement exists;
▪
the sales price is fixed or determinable;
▪
collection of the relevant receivable is probable at the time of sale; and
▪
delivery has occurred or services have been rendered.
The Company recognizes revenue related to the sales of products to distributors at the time of shipment of the product, which represents the point in time when the customer has taken ownership and assumed the risk of loss and the required revenue recognition criteria are satisfied. The Company’s distributors are obligated to pay within specified terms regardless of when, or if, they sell the products. The Company’s contracts with distributors typically do not contain right of return or price protection and have no post-delivery obligations.
Appropriate reserves are established for anticipated sales returns based on historical experience, recent gross sales and any notification of pending returns. The Company recognizes revenue when title to the product and risk of loss transfer to customers, provided there are no remaining performance obligations required of the Company or any written matters requiring customer acceptance. The Company allows for the return of product from direct customers in certain regions within fifteen days after the original sale and records estimated sales returns as a reduction of sales in the same period revenue is recognized. Sales return provisions are calculated based upon historical experience with actual returns. Actual sales returns in any future period are inherently uncertain and thus may differ from the estimates. If actual sales returns differ significantly from the estimates, an adjustment to revenue in the current or subsequent period is recorded. As of
December 31, 2018
, an allowance of
$52,000
was recorded for product returns. Prior to 2018, returns of products have been de minimis and accordingly
no
allowance for returns was recorded as of
December 31, 2017
.
A portion of the Company’s revenue is generated from the sale of consigned inventory maintained at physician, hospital, and clinic locations. For these products, revenue is recognized at the time the Company is notified by the consignee that the product has been implanted, not when the consigned products are delivered to the consignee’s warehouse.
The Company has a limited warranty to distributors for the shelf life of the product, which is
five
years from the time of manufacture. Estimated warranty obligations are recorded at the time of sale. The Company also offers a warranty to patients in the event of rupture and a replacement program for capsular contracture events provided certain registration requirements are met. Revenue for extended warranties are recognized ratably over the term
F-11
ESTABLISHMENT LABS HOLDINGS, INC.
Notes to Consolidated Financial Statements
For the Years Ended December 31, 2018 and 2017
of the agreement. To date, these warranty and program costs have been de minimis. The Company will continue to evaluate the warranty reserve policies for adequacy considering claims history.
Deferred revenue primarily consists of payments received in advance of meeting revenue recognition criteria. The Company has received payments from distributors to provide distribution exclusivity within a geographic area and recognizes deferred revenue on a ratable basis over the term of such contractual distribution relationship. Additionally, the Company has received payments from customers in direct markets prior to surgical implantation, and recognizes deferred revenue at the time the Company is notified by the customer that the product has been implanted. For all arrangements, any revenue that has been deferred and is expected to be recognized beyond one year is classified as long-term deferred revenue and included in “Other liabilities, long term” on the consolidated balance sheets.
Research and Development
Costs related to research and development, or R&D, activities are expensed as incurred. R&D costs primarily include personnel costs, materials, clinical expenses, regulatory expenses, product development, consulting services, outside research activities, all of which are directly related to research and development activities.
The Company estimates FDA clinical trial expenses based on the services performed, pursuant to contracts with research institutions and clinical research organizations that conduct and manage clinical trials on its behalf. In accruing service fees, the Company estimates the time period over which services will be performed and the level of patient enrollment and activity expended in each period. If the actual timing of the performance of services or the level of effort varies from the estimate, the Company will adjust the accrual accordingly.
Selling, General and Administrative Expenses
SG&A expenses include sales and marketing costs, payroll and related benefit costs, insurance expenses, shipping and handling costs, legal and professional fees and administrative overhead.
Property and Equipment
Property and equipment are stated at cost less accumulated depreciation and amortization.
Depreciation of property and equipment is computed using the straight-line method over the assets’ estimated useful lives of
five
to
ten
years. Leasehold improvements are amortized on a straight-line basis over the shorter of the estimated useful life of the asset or the remaining lease term after factoring expected renewal periods. Upon retirement or disposal of assets, the costs and related accumulated depreciation are eliminated from the accounts and any gain or loss is recognized in operations. Maintenance and repairs are expensed as incurred. Substantially all of the Company’s manufacturing operations and related property and equipment is located in Costa Rica.
Goodwill and Intangible Assets
The Company records the excess of the acquisition purchase price over the net fair value of the tangible and identifiable intangible assets acquired and liabilities assumed as goodwill. In accordance with ASC 350,
Intangibles - Goodwill and Other,
the Company tests goodwill for impairment annually during the fourth quarter of each year and whenever events or changes in circumstances indicate that the carrying value of the asset may not be recoverable. In connection with the annual impairment test for goodwill, the Company elected the option to perform a qualitative assessment to determine whether it is more likely than not that the fair value of the reporting unit is less than its carrying amount. If the Company determines that it was more likely than not that the fair value of the reporting unit is less than its carrying amount, then the quantitative impairment test is performed.
Consistent with the Company's assessment that it has only
one
reporting segment, the Company has determined that it has only one reporting unit and, if a quantitative assessment is needed, tests goodwill for impairment at the entity level using the two-step process required by ASC 350. In the first step, the Company compares the carrying amount of the reporting unit to the fair value of the enterprise. If the fair value of the enterprise exceeds the carrying value, goodwill is not considered impaired and no further testing is required. If the carrying value of the enterprise exceeds the fair value, goodwill is potentially impaired, and the second step of the impairment test must be performed. In the second step, the Company compares the implied fair value of the goodwill, as defined by ASC 350, to its carrying amount to determine the impairment loss, if any.
F-12
ESTABLISHMENT LABS HOLDINGS, INC.
Notes to Consolidated Financial Statements
For the Years Ended December 31, 2018 and 2017
The Company capitalizes certain costs related to intangible assets, such as patents and trademarks and records purchased intangible assets at their respective estimated fair values at the date of acquisition. Purchased finite-lived intangible assets are being amortized using the straight-line method over their remaining estimated useful lives, which range from
two
to
fifteen
years. The Company evaluates the remaining useful lives of intangible assets on a periodic basis to determine whether events or circumstances warrant a revision to the remaining estimated amortization period. The Company tests indefinite-lived intangible assets for impairment on at least an annual basis and whenever circumstances suggest the assets may be impaired. If indicators of impairment are present, the Company evaluates the carrying value of the intangible assets in relation to estimates of future undiscounted cash flows. The Company also evaluates the remaining useful life of an indefinite-lived intangible asset to determine whether events and circumstances continue to support an indefinite useful life.
During the years ended
December 31, 2018
and
2017
, there has been
no
impairment of goodwill or intangible assets based on the qualitative assessments performed by the Company.
Long-Lived Assets
The Company reviews long-lived assets for impairment whenever events or changes in circumstances indicate that the carrying amount of an asset might not be recoverable. When such an event occurs, management determines whether there has been impairment by comparing the anticipated undiscounted future net cash flows to the related asset group’s carrying value. If an asset is considered impaired, the asset is written down to fair value, which is determined based either on discounted cash flows or appraised value, depending on the nature of the asset. There were
no
impairment charges, or changes in estimated useful lives recorded d
uring the years ended
December 31, 2018
and
2017
.
Debt and Embedded Derivatives
The Company applies the accounting standards for derivatives and hedging and for distinguishing liabilities from equity when accounting for hybrid contracts. The Company accounts for convertible debt instruments when the Company has determined that the embedded conversion options should not be bifurcated from their host instruments in accordance with ASC 470-20
Debt with Conversion and Other Options.
The Company records, when necessary, discounts to notes payable for the intrinsic value of conversion and other options embedded in debt instruments as a beneficial conversion option based upon the differences between the fair value of the underlying shares at the commitment date of the note transaction and the effective conversion price embedded in the note
(see Note 6).
The Company uses option pricing valuation models to determine the fair value of embedded derivatives and records any change in fair value as a component of other income or expense in the consolidated statements of operations
(see Note 5).
Debt Issuance Costs and Debt Discounts
Costs incurred in connection with the issuance of new debt are capitalized. Capitalizable debt issuance costs paid to third parties and debt discounts, net of amortization, are recorded as a reduction to the long-term debt balance on the consolidated balance sheets. Amortization expense on capitalized debt issuance costs and debt discounts related to loans are calculated using the effective interest method over the term of the loan commitment and is recorded as interest expense in the condensed consolidated statements of operations.
Income Taxes
The Company records income taxes using the asset and liability method, which requires the recognition of deferred tax assets and liabilities for the expected future tax consequences of events that have been recognized in the Company’s
consolidated
financial statements or income tax returns. In estimating future tax consequences, expected future events, enactments or changes in the tax law or rates are considered. Valuation allowances are provided when necessary to reduce deferred tax assets to the amount expected to be realized.
The Company operates in various tax jurisdictions and is subject to audit by various tax authorities.
The Company records uncertain tax positions based on a two-step process whereby (1) a determination is made as to whether it is more likely than not that the tax positions will be sustained based on the technical merits of the position and (2) for those tax positions that meet the more-likely-than-not recognition threshold the Company
F-13
ESTABLISHMENT LABS HOLDINGS, INC.
Notes to Consolidated Financial Statements
For the Years Ended December 31, 2018 and 2017
recognizes the largest amount of tax benefit that is greater than 50% likely to be realized upon ultimate settlement with the related tax authority.
The Company’s policy is to recognize interest and penalties accrued on any unrecognized tax benefits as a component of income tax expense. Significant judgment is required in the identification of uncertain tax positions and in the estimation of penalties and interest on uncertain tax positions.
There were no material uncertain tax positions as of
December 31, 2018
and
2017
.
Foreign Currency
The financial statements of the Company’s foreign subsidiaries whose functional currencies are the local currencies are translated into U.S. dollars for consolidation as follows: assets and liabilities at the exchange rate as of the balance sheet date, stockholders’ equity at the historical rates of exchange, and income and expense amounts at the average exchange rate for the period. Translation adjustments resulting from the translation of the subsidiaries’ accounts are included in “Accumulated other comprehensive income (loss)” as equity in the
consolidated
balance sheet. Transactions denominated in currencies other than the applicable functional currency are converted to the functional currency at the exchange rate on the transaction date. At period end, monetary assets and liabilities are remeasured to the functional currency using exchange rates in effect at the balance sheet date. Non-monetary assets and liabilities are remeasured at historical exchange rates. Gains and losses resulting from foreign currency transactions are included within “Other income (expense), net” in the
consolidated
statements of operations. For the year ended
December 31, 2018
, foreign currency transaction loss amounted to
$2.4 million
as compared to a foreign currency transaction gain of
$0.4 million
for the year ended
December 31, 2017
.
Deferred Offering Costs
Deferred offering costs, consisting of legal, accounting and other fees and costs relating to the Company’s IPO, are capitalized within “Other non-current assets” on the consolidated balance sheet. Due to a delayed IPO process beyond 90 days, the Company expensed the previously deferred offering costs of
$1.6 million
during the year ended December 31, 2017. In 2018, the Company resumed the IPO activities and capitalized
$1.5 million
of deferred offering costs which, upon completion of the IPO, were reclassified to equity to offset the IPO proceeds.
Comprehensive Income (Loss)
The Company’s comprehensive loss consists of net loss and foreign currency translation adjustments arising from the consolidation of the Company’s foreign subsidiaries.
Share-Based Compensation
The Company measures and recognizes compensation expense for all stock-based awards in accordance with the provisions of ASC 718,
Stock Compensation
. Stock-based awards granted include stock options, restricted stock units, or RSUs, and restricted stock awards, or RSAs. Share-based compensation expense for stock options granted to employees and RSAs is measured at the grant date based on the fair value of the awards and is recognized as an expense ratably on a straight-line basis over the requisite service period. The fair value of options to purchase shares granted to employees is estimated on the grant date using the Black-Scholes option valuation model.
The Company accounts for stock options issued to non-employees under ASC 505-50
Equity: Equity-Based Payments to Non-Employees
, using the Black-Scholes option valuation model to value stock options. The fair value of such non-employee awards is remeasured at each quarter-end over the vesting period.
The calculation of share-based compensation expense requires that the Company make assumptions and judgments about the variables used in the Black-Scholes model, including the expected term, expected volatility of the underlying common shares, risk-free interest rate and dividends.
The Company adopted ASU 2016-09,
Improvements to Employee Share-Based Payment Accounting
, under which it recognizes forfeitures as they occur rather than applying a prospective forfeiture rate in advance (see Note 10).
Net Income (Loss) Per Share
Basic net income (loss) per share is calculated by dividing the net income (loss) attributable to shareholders by
F-14
ESTABLISHMENT LABS HOLDINGS, INC.
Notes to Consolidated Financial Statements
For the Years Ended December 31, 2018 and 2017
the weighted-average number of shares outstanding during the period, without consideration for potentially dilutive securities. Diluted net income (loss) per share is computed by dividing the net income (loss) by the weighted-average number of shares and potentially
dilutive
securities outstanding for the period. For purposes of the diluted net loss per share calculation, any shares issuable upon exercise of share warrants, share options and non-vested restricted stock outstanding under the Company’s equity plan are potentially dilutive securities. Diluted net loss per share is the same as basic net loss per share for periods where the Company reported a net loss because including the dilutive securities would be anti-dilutive.
Recent Accounting Standards
Periodically, new accounting pronouncements are issued by the Financial Accounting Standards Board, or FASB, or other standard setting bodies and adopted by the Company as of the specified effective date. Unless otherwise discussed, the impact of recently issued standards that are not yet effective will not have a material impact on the Company’s consolidated financial statements upon adoption. Under the Jumpstart Our Business Startups Act of 2012, or JOBS Act, the Company meets the definition of an emerging growth company, and has elected the extended transition period for complying with new or revised accounting standards pursuant to Section 107(b) of the JOBS Act. The Company will remain an emerging growth company until the earliest of (1) the last day of its first fiscal year (a) following the fifth anniversary of the completion of our initial public offering, (b) in which we have total annual gross revenue of at least
$1.07 billion
, or (c) in which we are deemed to be a large accelerated filer, which means the market value of our common shares that are held by non-affiliates exceeds
$700.0 million
of the prior June 30th and (2) the date on which we have issued more than
$1.0 billion
in non-convertible debt securities during the prior three-year period.
The following recent accounting pronouncements issued by the FASB, could have a material effect on our financial statements:
Recently Adopted Accounting Standards
In May 2014, the FASB issued ASU No. 2014-09,
Revenue from Contracts with Customers (Topic 606)
, which supersedes the revenue recognition requirements in ASC 605,
Revenue Recognition
. This ASU is based on the principle that revenue is recognized to depict the transfer of goods or services to customers in an amount that reflects the consideration to which the entity expects to be entitled in exchange for those goods or services. The ASU also requires additional disclosure about the nature, amount, timing and uncertainty of revenue and cash flows arising from customer contracts, including significant judgments and changes in judgments and assets recognized from costs incurred to obtain or fulfill a contract. ASU 2014-09 provides two methods of retrospective application. The first method would require the Company to apply ASU 2014-09 to each prior reporting period presented. The second method would require the Company to retrospectively apply ASU 2014-09 with the cumulative effect recognized at the date of initial application. ASU 2014-09 is effective for non-public business entities beginning in fiscal 2019 as a result of ASU 2015-14,
“Revenue from Contracts with Customers (Topic 606): Deferral of the Effective Date,
” which was issued by the FASB in August 2015 and extended the original effective date by one year. In 2016, the FASB issued additional updates to the new revenue standard relating to reporting revenue on a gross versus net basis, identifying performance obligations and licensing arrangements, and narrow-scope improvements and practical expedients, respectively. The effective date of this additional update is the same as that of ASU 2014-09. Although the Company is an emerging growth Company, as described above, effective the first quarter of 2019, the Company adopted ASC 606,
Revenue from Contracts with Customers
, and all the related amendments and applied it to all contracts that were not completed as of January 1, 2019 using the modified retrospective method. The impact of adoption on the Company’s consolidated balance sheet and consolidated statement of operations was assessed as not material.
In January 2017, the FASB issued ASU No. 2017-01,
Business Combinations (Topic 805): Clarifying the Definition of a Business
, which provides additional guidance on evaluating whether transactions should be accounted for as acquisitions of assets or businesses. The guidance requires an entity to evaluate if substantially all of the fair value of the assets acquired is concentrated in a single identifiable asset or a group of similar identifiable assets. If this threshold is met, the new guidance would define this as an asset acquisition; otherwise, the entity then evaluates whether the asset meets the requirement that a business include, at a minimum, an input and substantive process that together significantly contribute to the ability to create outputs. The Company early
F-15
ESTABLISHMENT LABS HOLDINGS, INC.
Notes to Consolidated Financial Statements
For the Years Ended December 31, 2018 and 2017
adopted this ASU on a prospective basis on July 1, 2018. The adoption of this ASU did not have a material impact on the consolidated financial statements.
In May 2017, the FASB issued ASU 2017-09,
Compensation - Stock Compensation (Topic 718): Scope of Modification Accounting
. This ASU provides amendments to the current guidance on determining which changes to the terms and conditions of share-based payment awards require the application of modification accounting. The effects of a modification should be accounted for unless there are no changes between the fair value, vesting conditions, and classification of the modified award and the original award immediately before the original award is modified. ASU 2017-09 became effective for non-public business entities for annual periods, including interim periods within those annual periods, beginning after December 15, 2017. The adoption of this ASU did not have a material impact on the financial statements.
Recently Issued Accounting Standards
In August 2018, the FASB issued ASU 2018-13,
Fair Value Measurement: Disclosure Framework - Changes to the Disclosure Requirements for Fair Value Measurement
. This ASU modifies the disclosure requirements for fair value measurements. The modifications removed the following disclosure requirements: (i) the amount of, and reasons for, transfers between Level 1 and Level 2 of the fair value hierarchy; (ii) the policy for timing of transfers between levels; and (iii) the valuation processes for Level 3 fair value measurements. This ASU added the following disclosure requirements: (i) the changes in unrealized gains and losses for the period included in other comprehensive income ("OCI") for recurring Level 3 fair value measurements held at the end of the reporting period; and (ii) the range and weighted average of significant observable inputs used to develop Level 3 fair value measurements. This update is effective for non-public entities for annual and interim periods beginning after December 15, 2020, with early adoption permitted. As the requirements of this literature are disclosure only, ASU 2018-13 will not impact our financial condition or results of operations.
In June 2018, the FASB issued ASU 2018-07,
Compensation – Stock Compensation (Topic 718), Improvements to Nonemployee Share-Based Payment Accounting
. This ASU is intended to simplify aspects of share-based compensation issued to non-employees by making the guidance consistent with accounting for employee share-based compensation. This guidance is effective for non-public entities for fiscal years beginning after December 15, 2019, including interim periods within that fiscal year. Early adoption is permitted. The Company is currently in the process of evaluating the impact of this guidance on our consolidated financial statements.
In February 2016, the FASB issued ASU 2016-02,
Leases (Topic 842)
, which sets out the principles for the recognition, measurement, presentation and disclosure of leases for both parties to a contract (i.e. lessees and lessors). The new standard requires lessees to apply a dual approach, classifying leases as either finance or operating leases based on the principle of whether the lease is effectively a financed purchase by the lessee. This classification will determine whether lease expense is recognized based on an effective interest method or on a straight-line basis over the term of the lease, respectively. A lessee is also required to record a right-of-use asset and a lease liability for all leases with a term of greater than twelve months regardless of their classification. Leases with a term of twelve months or less will be accounted for similar to existing guidance for operating leases today. ASC 842 supersedes the previous leases standard, ASC 840
Leases
. The standard is effective for non-public business entities for fiscal years beginning after December 15, 2019 and interim periods within fiscal years beginning after December 15, 2020. Early adoption is permitted. The Company is currently evaluating the effects, if any, that the adoption of this guidance will have on its consolidated financial statements.
F-16
ESTABLISHMENT LABS HOLDINGS, INC.
Notes to Consolidated Financial Statements
For the Years Ended December 31, 2018 and 2017
3.
Balance Sheet Accounts
Inventory
|
December 31,
|
||||||||
|
2018
|
2017
|
|||||||
|
(in thousands)
|
||||||||
|
Raw materials
|
$
|
3,349
|
|
$
|
1,978
|
|
||
|
Work in process
|
1,244
|
|
1,132
|
|
||||
|
Finished goods
|
20,252
|
|
10,063
|
|
||||
|
$
|
24,845
|
|
$
|
13,173
|
|
|||
Property and Equipment, Net
|
December 31,
|
||||||||
|
2018
|
2017
|
|||||||
|
(in thousands)
|
||||||||
|
Machinery and equipment
|
$
|
7,145
|
|
$
|
5,473
|
|
||
|
Vehicles
|
400
|
|
353
|
|
||||
|
Furniture and fixtures
|
2,536
|
|
2,110
|
|
||||
|
Leasehold improvements
|
8,062
|
|
8,743
|
|
||||
|
Total
|
18,143
|
|
16,679
|
|
||||
|
Less: Accumulated depreciation and amortization
|
(5,230
|
)
|
(3,179
|
)
|
||||
|
$
|
12,913
|
|
$
|
13,500
|
|
|||
For the years ended
December 31, 2018
and
2017
, depreciation and amortization expense related to property and equipment was
$2.2 million
and
$1.6 million
, respectively.
The Company entered into capital leases relating to equipment and vehicles and recorded the fair value of the lease payments on the initial contract date, and is amortizing the assets over the term of the leases. As of
December 31, 2018
and
2017
, the gross asset value for capital lease assets was
$1.4 million
and
$1.3 million
, respectively. Depreciation expense for assets under capital leases was
$89,900
for the year ended December 31, 2018. Depreciation expense for assets under capital leases was de minimus for the year ended December 31, 2017.
In August 2015, the Company entered into a contract with the Zona Franca Coyol, S.A. to have them build a new manufacturing facility in Costa Rica. The construction of the new
27,900
square foot facility began in November 2015 and was finished during the first quarter of fiscal 2017. The construction costs were paid for by the Company. The Company has an option to purchase the title to the building for approximately
$3.5 million
and
on May 11, 2016 the Company provided notice of the intent to exercise the purchase right and anticipates completing the transaction by the end of Q2 2019
. Currently, the Company leases the building from Zona Franca Coyol, S.A. for approximately
$28,000
per month.
F-17
ESTABLISHMENT LABS HOLDINGS, INC.
Notes to Consolidated Financial Statements
For the Years Ended December 31, 2018 and 2017
Accrued Liabilities
Accrued liabilities consisted of the following:
|
December 31,
|
||||||||
|
2018
|
2017
|
|||||||
|
(in thousands)
|
||||||||
|
Bonus
|
$
|
3,058
|
|
$
|
748
|
|
||
|
Payroll and related expenses
|
1,300
|
|
798
|
|
||||
|
Commissions
|
487
|
|
210
|
|
||||
|
Other
|
1,280
|
|
570
|
|
||||
|
$
|
6,125
|
|
$
|
2,326
|
|
|||
Other Liabilities, Short Term
Other liabilities, short-term consisted of the following:
|
December 31,
|
||||||||
|
2018
|
2017
|
|||||||
|
(in thousands)
|
||||||||
|
Repurchase of warrants
|
$
|
2,261
|
|
$
|
—
|
|
||
|
Contingent equity consideration (see Note 11)
|
914
|
|
321
|
|
||||
|
Deferred revenue
|
908
|
|
907
|
|
||||
|
$
|
4,083
|
|
$
|
1,228
|
|
|||
In August 2017, the Company repurchased warrants for
$4.7 million
of which
$2.3 million
was still outstanding as of December 31, 2018 and 2017. The outstanding amount is due to be paid on August 1, 2019.
Other Liabilities, Long Term
Other liabilities, long-term consisted of the following:
|
December 31,
|
||||||||
|
2018
|
2017
|
|||||||
|
(in thousands)
|
||||||||
|
Repurchase of warrants
|
$
|
—
|
|
$
|
2,261
|
|
||
|
Contingent equity consideration (see Note 11)
|
914
|
|
643
|
|
||||
|
Deferred revenue
|
1,186
|
|
927
|
|
||||
|
Cash payable for asset acquisitions (see Note 11)
|
883
|
|
—
|
|
||||
|
Other
|
568
|
|
842
|
|
||||
|
$
|
3,551
|
|
$
|
4,673
|
|
|||
F-18
ESTABLISHMENT LABS HOLDINGS, INC.
Notes to Consolidated Financial Statements
For the Years Ended December 31, 2018 and 2017
4.
Goodwill and Other Intangible Assets
Goodwill represents the excess of the purchase price over the fair value of the net tangible and identifiable intangible assets acquired in a business combination. Intangible assets resulting from the acquisitions of entities accounted for using the acquisition method of accounting are recorded at the estimated fair value of the assets acquired. Purchased intangibles include certain patents and license rights, 510(k) authorization by the FDA to sell a medical device and other intangible assets.
The Company’s goodwill and most intangibles at
December 31, 2018
are the result of various business combinations and business acquisitions the Company completed since 2015. Finite-lived intangibles are amortized over their estimated useful lives based on expected future benefit.
In addition to the intangibles acquired, the Company capitalized certain patent and license rights as identified intangibles based on patent and license rights agreements entered into over the past several years. Additionally, the Company capitalized certain software development costs associated with its development of a manufacturing software module, which the Company began amortizing in fiscal 2017 upon implementation of the software.
There were no changes in the carrying amount of goodwill during the year ended
December 31, 2018
:
|
Balance as of January 1, 2018
|
Additions
|
Accumulated Impairment Losses
|
Balance as of December 31, 2018
|
||||||||||||
|
(in thousands)
|
|||||||||||||||
|
Goodwill
|
$
|
465
|
|
$
|
—
|
|
$
|
—
|
|
$
|
465
|
|
|||
Only goodwill related to the 2017 acquisition is deductible for tax purposes (see Note 11).
The carrying amounts of these intangible assets as of
December 31, 2018
were as follows:
|
Gross Carrying Amount
|
Accumulated Amortization
|
Net Carrying Amount
|
Estimated Useful Lives
|
||||||||||
|
(in thousands)
|
(in years)
|
||||||||||||
|
Patents and license rights
|
$
|
1,669
|
|
$
|
(564
|
)
|
$
|
1,105
|
|
7-12
|
|||
|
Customer relationships
|
1,896
|
|
(381
|
)
|
1,515
|
|
4-10
|
||||||
|
510(k) authorization
|
567
|
|
(118
|
)
|
449
|
|
15
|
||||||
|
Developed technology
|
62
|
|
(34
|
)
|
28
|
|
10
|
||||||
|
Capitalized software development costs
|
98
|
|
(98
|
)
|
—
|
|
2
|
||||||
|
Other
|
75
|
|
(18
|
)
|
57
|
|
2-5
|
||||||
|
Capitalized patents and license rights not yet amortized
|
291
|
|
—
|
|
291
|
|
|||||||
|
$
|
4,658
|
|
$
|
(1,213
|
)
|
$
|
3,445
|
|
|||||
F-19
ESTABLISHMENT LABS HOLDINGS, INC.
Notes to Consolidated Financial Statements
For the Years Ended December 31, 2018 and 2017
The carrying amounts of intangible assets as of
December 31, 2017
were as follows:
|
Gross Carrying Amount
|
Accumulated Amortization
|
Net Carrying Amount
|
Estimated Useful Lives
|
||||||||||
|
(in thousands)
|
(in years)
|
||||||||||||
|
Patents and license rights
|
$
|
1,635
|
|
$
|
(361
|
)
|
$
|
1,274
|
|
7-12
|
|||
|
Customer relationships
|
1,304
|
|
(40
|
)
|
1,264
|
|
10
|
||||||
|
510(k) authorization
|
567
|
|
(80
|
)
|
487
|
|
15
|
||||||
|
Developed technology
|
62
|
|
(28
|
)
|
34
|
|
10
|
||||||
|
Capitalized software development costs
|
98
|
|
(49
|
)
|
49
|
|
2
|
||||||
|
Other
|
17
|
|
(15
|
)
|
2
|
|
2-3
|
||||||
|
Capitalized patents and license rights not yet amortized
|
291
|
|
—
|
|
291
|
|
|||||||
|
$
|
3,974
|
|
$
|
(573
|
)
|
$
|
3,401
|
|
|||||
The amortization expense associated with intangible assets was
$0.6 million
and
$0.3 million
for the
year
ended
December 31, 2018
and
2017
, respectively. In fiscal 2018, non-product related amortization was recorded in SG&A while product related amortization was recorded in cost of revenue. In fiscal 2017, all amortization expense was recorded in cost of revenue as non-product related amortization was de minimus.
As of
December 31, 2018
, the amortization expense related to identifiable intangible assets, with definite useful lives, in future periods is expected to be as follows:
|
Year Ending December 31,
|
(in thousands)
|
|||
|
2019
|
$
|
729
|
|
|
|
2020
|
714
|
|
||
|
2021
|
674
|
|
||
|
2022
|
345
|
|
||
|
2023
|
109
|
|
||
|
Thereafter
|
583
|
|
||
|
Total
|
$
|
3,154
|
|
|
The Company evaluates the recoverability of goodwill and indefinite-lived intangible assets annually and whenever events or changes in circumstances indicate that the carrying amount may not be recoverable. As of
December 31, 2018
, no triggering events have occurred which would indicate that the acquired intangible asset values may not be recoverable.
5.
Fair Value Measurements
The carrying value of the Company’s cash, restricted cash, accounts receivable, accounts payable and short-term notes payable approximate fair value due to the short-term nature of these items. Based on the borrowing rates available to the Company for debt with similar terms and consideration of default and credit risk, the carrying value of the related-party notes payable approximates its fair value. Contingent equity consideration, warrants and put and call options that qualify for liability treatment are carried at fair value and re-measured at each reporting period.
F-20
ESTABLISHMENT LABS HOLDINGS, INC.
Notes to Consolidated Financial Statements
For the Years Ended December 31, 2018 and 2017
Fair value is defined as the exchange price that would be received for an asset or an exit price paid to transfer a liability in the principal or most advantageous market for the asset or liability in an orderly transaction between market participants on the measurement date. Valuation techniques used to measure fair value must maximize the use of observable inputs and minimize the use of unobservable inputs.
The fair value hierarchy defines a three-level valuation hierarchy for disclosure of fair value measurements as follows:
|
▪
|
Level I Unadjusted quoted prices in active markets for identical assets or liabilities;
|
|
▪
|
Level II Inputs other than quoted prices included within Level I that are observable, unadjusted quoted prices in markets that are not active, or other inputs that are observable or can be corroborated by observable market data for substantially the full term of the related assets or liabilities; and
|
|
▪
|
Level III Uno
bservable inputs that are supported by little or no market activity for the related assets or liabilities.
|
The categorization of a financial instrument within the valuation hierarchy is based upon the lowest level of input that is significant to the fair value measurement.
The following table sets forth the Company’s financial instruments that were measured at fair value on a recurring basis by level within the fair value hierarchy at period end:
|
|
Fair Value Measurements at December 31, 2018
|
||||||||||||||
|
|
Total
|
Level 1
|
Level 2
|
Level 3
|
|||||||||||
|
(in thousands)
|
|||||||||||||||
|
Liabilities
|
|||||||||||||||
|
Madryn put option liability
|
$
|
4,768
|
|
$
|
—
|
|
$
|
—
|
|
$
|
4,768
|
|
|||
|
Acquisition-related contingent consideration
|
1,828
|
|
—
|
|
—
|
|
1,828
|
|
|||||||
|
$
|
6,596
|
|
$
|
—
|
|
$
|
—
|
|
$
|
6,596
|
|
||||
|
|
Fair Value Measurements at December 31, 2017
|
||||||||||||||
|
|
Total
|
Level 1
|
Level 2
|
Level 3
|
|||||||||||
|
(in thousands)
|
|||||||||||||||
|
Liabilities
|
|||||||||||||||
|
Madryn put option liability
|
$
|
20,302
|
|
$
|
—
|
|
$
|
—
|
|
$
|
20,302
|
|
|||
|
Madryn call option liability
|
360
|
|
—
|
|
—
|
|
360
|
|
|||||||
|
Acquisition-related contingent consideration
|
964
|
|
—
|
|
—
|
|
964
|
|
|||||||
|
$
|
21,626
|
|
$
|
—
|
|
$
|
—
|
|
$
|
21,626
|
|
||||
The fair value measurement of derivatives and acquisition-related contingent consideration are based on significant inputs not observed in the market and thus represents a Level 3 measurement.
In August 2017 the Company entered into a credit agreement, or the Madryn Credit Agreement, with Madryn Health Partners, LP, or Madryn, as administrative agent, and a syndicate of lenders (see Note 6). The Company determined that the Madryn Credit Agreement contained put options related to early redemption mandatory prepayment terms in case of change in control or an event of default and a call option related to voluntary repayment option. The Company valued these put options and the call option and allocated a fair value of
$15.1 million
for these identified embedded derivatives as a debt discount on the original commitment date. An
F-21
ESTABLISHMENT LABS HOLDINGS, INC.
Notes to Consolidated Financial Statements
For the Years Ended December 31, 2018 and 2017
additional
$5.0 million
debt discount was recorded on respective borrowing dates when the Company met the required milestones and borrowed an additional
$10.0 million
in the fourth quarter of fiscal 2017. The Company revalued the options as of each reporting period and recorded the change in the fair value in the consolidated statement of operations as other income or expense.
Valuation of the embedded derivatives is complex and requires interest rate simulation, estimating the resultant bond valuation and the resultant pay-off to the option holder. The Company estimated the fair value of the embedded redemption options using the probability-weighted Binomial Lattice Model which is based on generalized binomial option pricing formula. The Binomial Lattice Model allows for the possibility of exercise before the end of the option’s life and considers future interest rates, volatility and other data with regards to the Company’s credit rating and credit spread. The probability of a change in control occurring was determined to be
50%
at
December 31, 2018
and
90%
at
December 31, 2017
.
The Company used the following assumptions to value Madryn derivatives:
Put Option Liability (Madryn)
|
December 31, 2018
|
December 31,
2017
|
||
|
Interest rate volatility
|
17.4%
|
21.0%
|
|
|
Market yield rate
|
13.0%
|
12.5%
|
|
|
Term (in years)
|
4.5
|
5.5
|
|
|
Dividend yield
|
—%
|
—%
|
|
Call Option Liability (Madryn)
|
December 31, 2018
|
December 31,
2017
|
||
|
Interest rate volatility
|
--
|
21.0%
|
|
|
Market yield rate
|
--
|
12.5%
|
|
|
Term (in years)
|
--
|
5.5
|
|
|
Dividend yield
|
--
|
—%
|
|
On November 17, 2017, the Company and Femiline AB and Johan Anderson, or the Seller, entered into an agreement to purchase certain assets from the Seller. The assets purchased included all existing inventory previously sold by the Company to the Seller, all customer relationships and a covenant not to compete. The aggregate purchase price for the assets purchased was
100,000
Class A Ordinary shares of the Company, contingently issuable upon achievement of specific milestones. Based on the valuation of the Company’s shares performed by a valuation specialist, the contingently issuable shares had an aggregate value of
$1.0 million
calculated as a product of contingently issuable shares and estimated fair value per share (see Note 11) on the date of the agreement. In December 2018, the Company issued
33,333
shares to the Seller when the milestones for fiscal 2018 were met. As of
December 31, 2018
, the fair value of the contingently issuable shares was determined using the closing price of the Company’s publicly traded shares.
As of
December 31, 2018
and 2017, the short term and long term portions of contingent consideration liability were included in “Other liabilities, short term” and “Other liabilities, long term”, respectively.
F-22
ESTABLISHMENT LABS HOLDINGS, INC.
Notes to Consolidated Financial Statements
For the Years Ended December 31, 2018 and 2017
The estimates are based, in part, on subjective assumptions and could differ materially in the future.
During the periods presented, the Company has not changed the manner in which it values liabilities that are measured at fair value using Level 3 inputs. The Company recognizes transfers between levels of the fair value hierarchy as of the end of the reporting period. There were no transfers within the hierarchy during the
year
ended
December 31, 2018
and 2017.
The fair value of the debt conversion feature liability includes the estimated volatility and risk-free rate. The higher/lower the estimated volatility, the higher/lower the value of the debt conversion feature liability. The higher/lower the risk-free interest rate, the higher/lower the value of the debt conversion feature liability.
The following table sets forth a summary of the changes in the fair value of the Company’s Level 3 financial instruments as follows:
|
Warrant
Liability |
Acquisition-related Contingent Consideration
|
Put Option Liability (Madryn)
|
Call Option Liability (Madryn)
|
||||||||||||
|
Balance at December 31, 2016
|
$
|
3,983
|
|
$
|
—
|
|
$
|
—
|
|
$
|
—
|
|
|||
|
Issuance of financial instruments
|
—
|
|
964
|
|
20,044
|
|
83
|
|
|||||||
|
Change in fair value
|
4,035
|
|
—
|
|
258
|
|
277
|
|
|||||||
|
Repurchase of warrants
|
(7,060
|
)
|
—
|
|
—
|
|
—
|
|
|||||||
|
De-recognition during period
|
(958
|
)
|
—
|
|
—
|
|
—
|
|
|||||||
|
Balance at December 31, 2017
|
$
|
—
|
|
$
|
964
|
|
$
|
20,302
|
|
$
|
360
|
|
|||
|
Change in fair value
|
—
|
|
1,727
|
|
(15,534
|
)
|
(360
|
)
|
|||||||
|
De-recognition during period
|
—
|
|
(863
|
)
|
—
|
|
—
|
|
|||||||
|
Balance at December 31, 2018
|
$
|
—
|
|
$
|
1,828
|
|
$
|
4,768
|
|
$
|
—
|
|
|||
F-23
ESTABLISHMENT LABS HOLDINGS, INC.
Notes to Consolidated Financial Statements
For the Years Ended December 31, 2018 and 2017
6.
Debt
Notes Payable Related Party
In August 2015, the Company entered into agreements with all of the Class Z redeemable convertible preferred shareholders to exchange their outstanding shares and accumulated dividends for notes payable with a principal balance of
$4.2 million
. Per the original agreement, the notes bore interest at a simple rate of
7%
per annum with the interest payments due annually starting March 30, 2017 and a note maturity date of March 31, 2020. Per agreement, as amended, the notes became due and payable on July 23, 2018 when the Company successfully completed the IPO. During the
year
ended
December 31, 2018
and
2017
, the Company recorded annual interest expense of
$0.2 million
, to accrue for interest due on the notes. The Company repaid the balance due of
$5.1 million
, including accrued interest of
$0.9 million
, in August 2018.
The Company recorded the notes on the balance sheets as follows:
|
December 31,
2018 |
December 31,
2017 |
|||||||
|
(in thousands)
|
||||||||
|
Principal
|
$
|
—
|
|
$
|
4,218
|
|
||
|
Accrued interest
|
—
|
|
703
|
|
||||
|
Total principal and accrued interest at end of period
|
$
|
—
|
|
$
|
4,921
|
|
||
Related Party Convertible Notes Payable
In August 2015, the Company entered into a Note and Warrant Purchase Agreement, or the Note Agreement or the Notes, with CPH TU, LP, or CPH, a primary shareholder, to borrow up to
$15.0 million
. The Notes issued pursuant to the agreement bore interest at a simple rate of
10%
per annum.
In January and July 2016, the Company amended the Note Agreement to increase the aggregate borrowing limit to
$18.0 million
and
$19.8 million
, respectively. In September 2016, the Company entered into an amended agreement with CPH to terminate the warrants originally issued in connection with the Notes, fix the conversion rate, and extend the maturity date.
In connection with the Notes, the Company issued warrants for the purchase of ordinary shares to CPH and to Rockport Ventures, the placement agent. The estimated fair value of the warrants issued in August 2015 was determined to be
$1.1 million
, which was recorded as a debt discount and was being amortized using the effective interest rate method over the term of the Notes (see Note 9).
The Company determined that the Note Agreement contained several put options related to liquidity events or an event of default. The Company valued these put options and allocated the fair value of
$0.1 million
for these identified embedded derivatives as a debt discount on the original commitment date in August 2015. The Company revalued the put options as of each reporting period and recorded the change in the fair value in the consolidated statement of operations as other income or expense (see Note 5).
August 2017 Conversion
On August 24, 2017, CPH elected to convert the principal and the accrued interest outstanding under the Notes into
5,869,417
shares of the Company’s Class B ordinary shares. The related beneficial conversion feature liability was amortized into non-cash interest expense while the CPH put option liability expired upon the conversion of the notes.
There was
no
outstanding balance under the Notes as of
December 31, 2018
or
December 31, 2017
.
F-24
ESTABLISHMENT LABS HOLDINGS, INC.
Notes to Consolidated Financial Statements
For the Years Ended December 31, 2018 and 2017
Madryn Debt
On August 24, 2017 the Company entered into a credit agreement, or the Madryn Credit Agreement, with Madryn Health Partners, LP, or Madryn, as administrative agent, and a syndicate of lenders. The Madryn Credit Agreement provides for a credit facility for a maximum principal amount of
$55.0 million
,
$30.0 million
(Term A) of which became available upon signing. The final maturity date under the Madryn Credit Agreement is June 30, 2023.
The availability of the additional Term B and Term C commitments under the Madryn Credit Agreement, which are for an aggregate principal amount of up to
$25 million
, are subject to the Company achieving certain revenue milestones. The Company met some of these milestones and borrowed an additional
$5.0 million
(Term B-1) on October 31, 2017 and
$5.0 million
(Term B-2) on December 15, 2017 bringing up the total outstanding principal balance to
$40.0 million
as of December 31, 2017. We did not borrow additional funds in 2018. As of June 15, 2018, we were eligible to draw down an additional
$5.0 million
(Term B-3) under the amended Credit Agreement, and an additional
$10.0 million
(Term C) may become available on or before June 30, 2020 if a written notice is submitted to the Lenders. The availability of each tranche is also conditioned on the Company having advanced the maximum loan amount under each prior tranche.
In connection with the Madryn Credit Agreement, the Company and certain of its subsidiaries, granted a security interest in substantially all of the property of the Company and certain of its subsidiaries, including, without limitation, intellectual property, and pledges of certain shares of the Brazilian subsidiary and the Belgian subsidiary, subject to certain excluded collateral exceptions.
Borrowings under the Madryn Credit Agreement bear interest at a rate equal to 3-month LIBOR plus
11.0%
per annum provided that no default has occurred. Interest payments are made quarterly. In an event of a default, the interest would increase by an additional
4.0%
per annum. The weighted average interest rate under the credit agreement was approximately
13.4%
at
December 31, 2018
. The Company incurred
$5.4 million
and
$1.4 million
in interest expense in connection with Madryn Credit Agreement during the
year
ended
December 31, 2018
and 2017, respectively. No principal payments are due until 2021.
Eight
quarterly payments of
12.5%
of the principal amounts borrowed under each tranche are due beginning September 30, 2021 and each quarter end through and including June 30, 2023.
The Company also determined that the Madryn Credit Agreement contained put options which are mandatory repayment provisions related to liquidity events or an event of default and a call option related to voluntary repayment option. The Company valued these put options and the call option and allocated a fair value of
$15.1 million
for these identified embedded derivatives as a debt discount on the original commitment date in August 2017. An additional
$5.0 million
debt discount was recorded when the Company met the required milestones and borrowed an additional
$10.0 million
in the fourth quarter of fiscal 2017. The Company revalues the options as of each reporting period and records the change in the fair value in the consolidated statement of operations as other income or expense (see Note 5). The Company also incurred legal expenses of
$1.3 million
in the third quarter of fiscal 2017, which were recorded as a debt discount and are being amortized over the term of the Madryn Credit Agreement.
The Madryn Credit Agreement contains customary affirmative and negative covenants, including, but not limited to, restrictions on the ability to incur additional indebtedness, create liens, make certain investments, make restricted payments, enter into or undertake certain liquidations, mergers, consolidations or acquisitions and dispose of assets or subsidiaries. In addition, the Madryn Credit Agreement requires the Company to maintain minimum revenues and liquidity.
In January 2018, management made an assessment that the Company would potentially technically default on the Madryn Credit Agreement due to its investment in our Brazilian subsidiary approaching the
$5.0 million
limit. The Company informed Madryn and the syndicate of lenders, or the Lenders, of the potential technical default event and started the process to obtain a forbearance agreement. The Company initially defaulted on the Madryn Credit Agreement on January 19, 2018 when it failed to put a Qualifying Control Agreement in place for certain bank deposit accounts and subsequently on February 28, 2018 when its investment in its Brazilian subsidiary exceeded the allowable
$5.0 million
threshold permitted under the Madryn Credit Agreement. Accordingly, the Company recorded the Madryn debt as a current liability on the consolidated balance sheet as of December 31,
F-25
ESTABLISHMENT LABS HOLDINGS, INC.
Notes to Consolidated Financial Statements
For the Years Ended December 31, 2018 and 2017
2017. Effective June 15, 2018, Madryn Credit Agreement was amended to remove the restrictive covenants that resulted in the technical defaults which allowed the Company to reclassify the arrangement as long-term as of
December 31, 2018
.
The Company recorded Madryn debt on the balance sheets as follows:
|
2018
|
2017
|
||||||
|
(in thousands)
|
|||||||
|
Principal
|
$
|
40,000
|
|
$
|
40,000
|
|
|
|
Net unamortized debt discount and issuance costs
|
(17,678
|
)
|
(20,833
|
)
|
|||
|
Net carrying value of Madryn debt
|
$
|
22,322
|
|
$
|
19,167
|
|
|
The Company granted Madryn the right to purchase up to
$2.0 million
of shares issued by the Company in the next succeeding eligible equity investment in the Company. Under this agreement, to the extent the Company redeems or repurchases any shares from any holder, the Company shall offer to resell one half of the repurchased shares to Madryn at the same price paid by the Company to purchase or retire the shares. The Company has completed qualified financings during the first half of 2018 and also completed its IPO in July 2018; Madryn chose not to exercise their right to purchase shares in those financings.
As of
December 31, 2018
, the Company is in compliance with all financial debt covenants.
7.
Commitments and Contingencies
Operating Leases
We lease certain facilities under various operating leases. Most of the lease agreements provide us with the option of renewing our leases at the end of the initial lease term, at fair market rates. In most cases, we expect that in the normal course of business, facility leases will be renewed or replaced by other leases.
For the
year
ended
December 31, 2018
and
2017
, rent expense was
$1.0 million
and
$0.8 million
, respectively.
On May 18, 2018, the Company’s wholly-owned subsidiary in Belgium entered into a lease agreement for an office rental for an approximate annual base lease amount of approximately
$0.2 million
per year for a duration of
nine
years.
Future minimum lease payments under the operating leases as of
December 31, 2018
were as follows:
|
Years Ending December 31,
|
Operating
Leases
|
|||
|
(in thousands)
|
||||
|
2019
|
$
|
888
|
|
|
|
2020
|
824
|
|
||
|
2021
|
765
|
|
||
|
2022
|
764
|
|
||
|
2023
|
792
|
|
||
|
Thereafter
|
3,137
|
|
||
|
$
|
7,170
|
|
||
F-26
ESTABLISHMENT LABS HOLDINGS, INC.
Notes to Consolidated Financial Statements
For the Years Ended December 31, 2018 and 2017
Capital Lease
The Company entered into capital lease arrangements relating to software, equipment and vehicles. The lease periods are from
one
to
seven
years. The repayments are made monthly with an interest rates ranging from
4%
to
7%
per year.
Future minimum lease payments under these capital leases as of
December 31, 2018
were as follows:
|
Years Ending December 31,
|
Capital
Leases
|
|||
|
(in thousands)
|
||||
|
2019
|
$
|
355
|
|
|
|
2020
|
263
|
|
||
|
2021
|
154
|
|
||
|
2022
|
25
|
|
||
|
797
|
|
|||
|
Interest included in the above payments
|
(81
|
)
|
||
|
Amount payable without interest
|
716
|
|
||
|
Short-term minimum capital lease payments (included in accrued liabilities)
|
336
|
|
||
|
Long-term minimum capital lease payments
|
$
|
380
|
|
|
Contingencies
Periodically, the Company may have certain contingent liabilities that arise in the ordinary course of business activities. The Company accrues a liability for such matters when it is probable that future expenditures will be made and such expenditures can be reasonably estimated. There have been no contingent liabilities requiring accrual or disclosure at
December 31, 2018
and December 31, 2017.
Indemnification
The Company enters into standard indemnification arrangements in the ordinary course of business. Pursuant to these arrangements, the Company indemnifies, holds harmless, and agrees to reimburse the indemnified parties for losses suffered or incurred by the indemnified party, in connection with any trade secret, copyright, patent or other intellectual property infringement claim by any third-party with respect to the Company’s technology. The term of these indemnification agreements is generally perpetual. The maximum potential amount of future payments the Company could be required to make under these agreements is not determinable because it involves claims that may be made against the Company in the future, but have not yet been made.
The Company has entered into indemnification agreements with its directors and officers that may require the Company to indemnify its directors and officers against liabilities that may arise by reason of their status or service as directors or officers, other than liabilities arising from willful misconduct of the individual.
The Company has not incurred costs to defend lawsuits or settle claims related to these indemnification agreements. No liability associated with such indemnifications has been recorded to date.
8.
Shareholders’ Equity (Deficit)
General
Under the Memorandum of Association and Articles of Association, or Articles, in effect as of December 31, 2017, the Company had authorized
84,050,000
common shares with a par value of
$1.00
per share,
13,482,782
Class A ordinary shares with a par value of
$1.00
per share,
7,723,848
Class B ordinary shares with a par value of
$1.00
per share,
96,301
Class C ordinary shares with no par value,
1,539,359
Class D ordinary shares with no par value,
323,366
Class E ordinary shares with no par value and
357,143
Class F ordinary shares with no par value.
F-27
ESTABLISHMENT LABS HOLDINGS, INC.
Notes to Consolidated Financial Statements
For the Years Ended December 31, 2018 and 2017
During the first half of 2018, the Company amended its Articles to authorize
1,250,000
Class G and
625,000
Class G-1 ordinary shares with no par value.
On July 23, 2018, the Company completed its initial public offering, or IPO, whereby it sold a total of
4,272,568
common shares at
$18.00
per share including
557,291
shares sold to underwriters for the exercise of their option to purchase additional shares. The Company received net proceeds from the IPO of approximately
$70.1 million
, after deducting underwriting discounts and commissions of
$5.4 million
and deferred offering costs of
$1.5 million
.
All outstanding shares of ordinary stock were converted on a 1-to-1 basis into common shares of a single class of no par value. An unlimited number of common shares was authorized.
Common Shares
As of
December 31, 2018
and 2017,
20,672,025
and
zero
shares, respectively, of common shares were issued and
20,263,955
and
zero
shares, respectively, were outstanding.
During the year ended
December 31, 2018
, the Company issued restricted stock and option awards to employees and contractors. The Company records the awards as outstanding equity as they vest (see Note 10).
Ordinary Shares
As of
December 31, 2018
and 2017,
zero
and
15,743,705
shares, respectively, of ordinary shares were issued and
zero
and
14,522,495
shares, respectively, were outstanding.
Class A and B Ordinary Shares
As of
December 31, 2018
and 2017,
zero
and
13,427,536
shares, respectively, of ordinary Class A and Class B shares were issued and
zero
and
12,206,326
shares, respectively, were outstanding. Class A and Class B ordinary shares had a par value of
$1.00
per share.
Class C, D, E, F, G and G-1 Ordinary Shares
As of
December 31, 2018
and
2017,
zero
and
2,316,169
shares, respectively, of ordinary Class C, D, E, F, G and G-1 shares were issued and outstanding. Class C, D, E, F, G and G-1 shares had no par value.
In multiple closings during the year ended
December 31, 2018
, the Company issued an aggregate of
$6.2 million
of Class G ordinary shares at a purchase price of
$16.00
per share to several investors. In connection with the issuance of these shares, the Company amended and restated its Articles to increase the authorized shares of the Company to a total of
109,447,799
shares and to authorize
1,250,000
Class G and
625,000
Class G-1 shares.
In May 2018, the Company issued an aggregate of
$10.0 million
of Class G-1 ordinary shares at a purchase price of
$16.00
per share to entities affiliated with RTW Investments.
The Company had reserved common shares for future issuances at December 31:
|
2018
|
2017
|
|||||
|
Warrants to purchase common shares
|
104,826
|
|
145,000
|
|
||
|
Options to purchase shares
|
1,486,363
|
|
863,932
|
|
||
|
Remaining shares available under the 2015 Equity Incentive Plan
|
—
|
|
91,181
|
|
||
|
Remaining shares available under the 2018 Equity Incentive Plan
|
1,015,148
|
|
—
|
|
||
|
Shares issuable on vesting of restricted stock awards
|
314,123
|
|
585,056
|
|
||
|
Remaining shares available under the 2018 ESPP
|
100,000
|
|
—
|
|
||
|
Total
|
3,020,460
|
|
1,685,169
|
|
||
F-28
ESTABLISHMENT LABS HOLDINGS, INC.
Notes to Consolidated Financial Statements
For the Years Ended December 31, 2018 and 2017
9.
Warrants
In connection with the Notes issued to CPH in August 2015, the Company agreed to issue warrants to purchase ordinary shares to CPH and to Rockport Ventures, the placement agent for the Notes.
In March 2017, the Rockport Warrants were canceled and new warrants for the purchase of
145,000
Class B ordinary shares were issued to parties related to Rockport Ventures, with a fixed exercise price of
$3.80
per share.
During the first half of 2017, the Company classified the fair value of these warrants as liabilities on the balance sheet due to the existence of certain cash settlement features that are not within the sole control of the Company and variable settlement provision that cause them to not be indexed to the Company’s own shares.
The value of the CPH warrants was estimated using the Black-Scholes valuation model which approximates a Lattice valuation model, and at issuance, the Company initially recorded the fair value of the warrants as a debt discount against the related loan balance in its consolidated balance sheet. The recorded value of the warrants is being amortized to interest expense over the estimated repayment term of the related loans. The value of the Rockport Ventures warrants was estimated using the Black Sholes valuation model which approximates a Lattice valuation model, and at issuance, the Company initially recorded the fair value of the warrants as a debt offering cost against the related loan balance in its balance sheet. The recorded value of the warrants is being amortized to interest expense using the straight-line method over the term of the related loans.
During the year ended December 31, 2018, warrants to purchase
40,174
shares were net exercised to obtain
38,785
shares. As of
December 31, 2018
and 2017,
104,826
and
145,000
warrants to purchase the Company’s common shares, respectively, were outstanding and exercisable:
|
Warrant Holder
|
Issue Date
|
In Connection With
|
Warrant to
Purchase |
Shares
|
Exercise
Price |
Expiration Date
|
|||||||||
|
Rockport
|
3/3/2017
|
Loan agreement
|
Common
|
104,826
|
|
$
|
3.80
|
|
8/28/2022
|
||||||
10.
Share-Based Compensation
In December 2015, the Board of Directors approved and adopted the 2015 Equity Incentive Plan, or 2015 Plan. Under the 2015 Plan, the Company may grant share options, equity appreciation rights, and restricted shares and restricted share units. Pursuant to the 2015 Plan, the Company has granted RSAs and stock options to Board of Directors, employees and consultants.
The 2015 Plan, as amended, reserves
2,650,000
Class A shares for issuance. If an award granted under the 2015 Plan expires, terminates, is unexercised, or is forfeited, or if any shares are surrendered in connection with an incentive award, the shares subject to such award and the surrendered shares become available for further awards under the 2015 Plan.
Concurrent with the closing of the IPO, the Board of Directors terminated the 2015 Plan and approved the 2018 Equity Incentive Plan, or the 2018 Plan, with an initial reserve of
1,500,000
shares of the Company’s common shares for issuance under the 2018 Plan.
Pursuant to the “evergreen” provision contained in the 2018 Plan, the number of common shares reserved for issuance under the 2018 Plan automatically increases on first day of each fiscal year, commencing on January 1, 2019, in an amount equal to the least of (1)
750,000
shares, (2)
4%
of the total number of the Company’s common shares outstanding on the last day of the preceding fiscal year, or (3) a number of common shares as may be determined by the Company’s Board of Directors prior to any such increase date. On January 1, 2019, the number of common shares authorized for issuance increased automatically by
750,000
shares in accordance with the evergreen provision of the 2018 Plan.
During the periods presented, the Company recorded the following share-based compensation expense for stock
F-29
ESTABLISHMENT LABS HOLDINGS, INC.
Notes to Consolidated Financial Statements
For the Years Ended December 31, 2018 and 2017
options and restricted stock awards:
|
2018
|
2017
|
|||||||
|
(in thousands)
|
||||||||
|
Sales, general and administrative
|
$
|
3,400
|
|
$
|
1,221
|
|
||
|
Research and development
|
3,920
|
|
2,082
|
|
||||
|
Total
|
$
|
7,320
|
|
$
|
3,303
|
|
||
Stock Options
|
|
Number of Options Outstanding
|
|
Weighted-Average Exercise Price
|
|
Weighted-Average Remaining Contractual Term (in years)
|
|
Aggregate Intrinsic Value (in thousands)
|
||||||
|
Balances at December 31, 2017
|
863,932
|
|
$
|
5.36
|
|
7.6
|
$
|
4,199
|
|
||||
|
Granted (weighted-average fair value of $10.43 per share)
|
810,628
|
|
16.52
|
|
|||||||||
|
Exercised
|
(132,091
|
)
|
4.87
|
|
|||||||||
|
Forfeited/canceled
|
(56,106
|
)
|
7.54
|
|
|||||||||
|
Balances at December 31, 2018
|
1,486,363
|
|
$
|
11.43
|
|
8.74
|
$
|
23,778
|
|
||||
As of
December 31, 2018
,
473,009
options were vested and exercisable with weighted-average exercise price of
$5.03
per share and a total aggregate intrinsic value of
$10.6 million
.
During the
year
ended
December 31, 2018
,
132,091
options were exercised at a price of
$4.87
per share. The intrinsic value of the options exercised during the
year
ended
December 31, 2018
and
2017
was
$3.0
million and
zero
, respectively. Upon the exercise of stock options, the Company issued new shares from its authorized shares. There were
no
exercises of stock options during the year ended December 31, 2017.
At
December 31, 2018
, unrecognized compensation expense was
$3.7 million
related to stock options granted to employees and Board of Directors and
$6.4 million
related to stock options granted to consultants. The weighted-average period over which such compensation expense will be recognized is
3.1
years.
Stock Options Granted to Employees
Share-based compensation expense for employees is based on the grant date fair value. The Company recognizes compensation expense for all share-based awards ratably on a straight-line basis over the requisite service period of the awards, which is generally the vesting term of
four
years. During the
year
ended
December 31, 2018
and
2017
, the Company recognized
$0.9 million
and
$0.1 million
, respectively, of stock-based compensation expense for stock options granted to employees.
The Company uses the Black-Scholes option valuation model to value options granted to employees and consultants, which requires the use of highly subjective assumptions to determine the fair value of share-based awards. The assumptions used in the Company’s option-pricing model represent management’s best estimates. These estimates are complex, involve a number of variables, uncertainties and assumptions and the application of management’s judgment. If factors change and different assumptions are used, the Company’s share-based compensation expense could be materially different in the future. The assumptions and estimates that the Company uses in the Black-Scholes model are as follows:
|
▪
|
Fair Value of Common Shares.
Following the IPO, the closing price of the Company’s publicly-traded common shares on the date of grant and at quarter-end is used as the fair value of the shares. Prior to
|
F-30
ESTABLISHMENT LABS HOLDINGS, INC.
Notes to Consolidated Financial Statements
For the Years Ended December 31, 2018 and 2017
the IPO, the fair value of ordinary shares was estimated on a periodic basis by the Company’s Board of Directors, with the assistance of an independent third-party valuation firm. The Board of Directors intended all options granted to be exercisable at a price per share not less than the estimated per share fair value of the shares underlying those options on the date of grant.
|
▪
|
Risk-Free Interest Rate.
The Company bases the risk-free interest rate used in the Black-Scholes valuation model on the implied yield available on U.S. Treasury zero-coupon issues with a term equivalent to that of the term of the options for each option group on the measurement date.
|
|
▪
|
Term.
For employee stock options, the expected term represents the period that the Company’s share-based awards are expected to be outstanding. Because of the limitations on the sale or transfer of the Company’s shares as a privately held company, the Company does not believe its historical exercise pattern is indicative of the pattern it will experience as a publicly traded company. The Company has consequently used the Staff Accounting Bulletin 110, or SAB 110, simplified method to calculate the expected term of employee stock options, which is the average of the contractual term and vesting period. The Company plans to continue to use the SAB 110 simplified method until it has sufficient trading history as a publicly traded company. For consultant stock options, the term used is equal to the remaining contractual term on the measurement date.
|
|
▪
|
Volatility.
The Company determines the price volatility based on the historical volatilities of industry peers as it does not have sufficient trading history for its shares. Industry peers consist of several public companies in the medical device industry with comparable characteristics, including revenue growth, operating model and working capital requirements. The Company intends to continue to consistently apply this process using the same or a similar peer group of public companies until a sufficient amount of historical information regarding the volatility of its own shares becomes available, or unless circumstances change such that the identified peer companies are no longer similar, in which case other suitable peer companies whose common share prices are publicly available would be utilized in the calculation. The volatility is calculated based on the term on the measurement date.
|
|
▪
|
Dividend Yield.
The expected dividend assumption is based on the Company’s current expectations about its anticipated dividend policy. The Company has no expectation that it will declare dividends on its common shares, and therefore has used an expected dividend yield of zero.
|
The fair value of stock options granted to employees in 2018 was estimated using the following assumptions:
|
2018
|
||
|
Volatility
|
56.0% - 57.0%
|
|
|
Risk-free interest rate
|
2.7% - 3.1%
|
|
|
Term (in years)
|
6.25
|
|
|
Dividend yield
|
0%
|
|
The Company did not grant any stock options to employees during 2017.
Stock Options Granted to Non-Employees
Stock-based compensation expense related to stock options granted to non-employees is recognized as the stock options are earned using an accelerated attribution method. The Company believes that the estimated fair value of the stock options is more readily measurable than the fair value of the services rendered. For the
year
s ended
December 31, 2018
and
2017
, the Company recognized expense of
$4.3 million
and
$1.3 million
for stock options granted to consultants.
F-31
ESTABLISHMENT LABS HOLDINGS, INC.
Notes to Consolidated Financial Statements
For the Years Ended December 31, 2018 and 2017
The fair value of stock options granted to consultants was estimated using the following assumptions during the following periods presented:
|
2018
|
2017
|
|||
|
Volatility
|
58.0% - 59.0%
|
59.0%
|
||
|
Risk-free interest rate
|
2.8% - 3.1%
|
2.4%
|
||
|
Term (in years)
|
10.0
|
10.0
|
||
|
Dividend yield
|
0.0%
|
0.0%
|
||
Restricted Stock
Each vested RSA and RSU entitles the holder to be issued one common share. These awards vest according to a vesting schedule determined by the Compensation Committee of the Company’s Board of Directors, generally over a
one
to
four
year period.
The following table represents RSA activity for fiscal 2018:
|
|
Restricted Stock Awards
|
|
Weighted-
Average
Grant Date
Fair Value
|
||||
|
Outstanding unvested at December 31, 2017
|
585,056
|
|
|
$
|
7.57
|
|
|
|
Granted
|
90,301
|
|
13.27
|
|
|||
|
Vested
|
(245,066
|
)
|
7.42
|
|
|||
|
Forfeited/canceled
|
(116,168
|
)
|
9.60
|
|
|||
|
Outstanding unvested at December 31, 2018
|
314,123
|
|
$
|
8.57
|
|
||
The following table represents RSU activity for fiscal 2018:
|
|
Restricted Stock Units
|
|
Weighted-
Average
Grant Date
Fair Value
|
||||
|
Outstanding unvested at December 31, 2017
|
—
|
|
|
$
|
—
|
|
|
|
Granted
|
3,852
|
|
25.35
|
|
|||
|
Vested
|
(3,852
|
)
|
25.35
|
|
|||
|
Forfeited/canceled
|
—
|
|
—
|
|
|||
|
Outstanding unvested at December 31, 2018
|
—
|
|
$
|
—
|
|
||
The fair value of restricted stock is the grant date market value of common shares. The Company recognizes share-based compensation expense related to restricted stock ratably on a straight-line basis over the vesting term of the awards. The fair value of RSAs and RSUs that vested during the
year
ended
December 31, 2018
and
2017
, was
$2.1 million
and
$1.9 million
, which was calculated based on the market value of the Company’s common shares on the applicable date of vesting.
F-32
ESTABLISHMENT LABS HOLDINGS, INC.
Notes to Consolidated Financial Statements
For the Years Ended December 31, 2018 and 2017
As of
December 31, 2018
, we had unrecognized share-based compensation cost of approximately
$3.8 million
associated with unvested restricted stock awards. This cost is expected to be recognized over a weighted-average period of approximately
1.9
years.
11.
Business Combinations and Asset Acquisitions
Business Combinations
On November 17, 2017, the Company and Femiline AB and Johan Anderson, or the Seller, entered into an agreement to purchase certain assets from the Seller. The assets purchased included all existing inventory previously sold by the Company to the Seller, all customer relationships and a covenant not to compete. The aggregate purchase price for the assets purchased was
100,000
Class A Ordinary shares of the Company, contingently issuable upon achievement of specific milestones. Based on the valuation of the Company’s shares performed by a valuation specialist, the contingently issuable shares had an aggregate value of
$1.0 million
. The book value of the inventory at the time of the acquisition was approximately
$0.7 million
, which was revalued on the transaction date to be the estimated selling price less the cost to sell, which increased the fair value of the inventory to approximately
$1.5 million
.
Concurrently, the Company entered into a Separation Agreement with Novaform Ltd, or Novaform, and Pantelis Ioannou. In April 2015, Novaform had become a distributor for Establishment Labs S.A., a wholly-owned subsidiary of the Company and subsequently sublicensed its distribution rights to Femiline AB. Under the Separation Agreement, Novaform agreed to relinquish the distribution rights back to the Company for
$1.0 million
in cash and
35,714
Class A ordinary shares. Based on the valuation of the Company’s shares performed by a valuation specialist, the fair value of the shares issued was
$0.3 million
.
This transaction enabled the Company to realign its existing distribution network in Sweden, Denmark and Norway and initiate direct sales to customers in the region.
The purchase price and allocation of purchase price were as follows:
|
Purchase Price:
|
(in thousands)
|
|||
|
Cash consideration
|
$
|
1,000
|
|
|
|
Fair market value of Class A ordinary shares issued
|
344
|
|
||
|
Contingent consideration
|
964
|
|
||
|
Cash paid for inventory
|
704
|
|
||
|
Total purchase price
|
$
|
3,012
|
|
|
|
Allocation of Purchase Price:
|
(in thousands)
|
|||
|
Inventory
|
$
|
1,498
|
|
|
|
Customer relationships
|
1,280
|
|
||
|
Covenant not to compete
|
24
|
|
||
|
Goodwill
|
210
|
|
||
|
Total purchase price allocated
|
$
|
3,012
|
|
|
As of December 31, 2017, the consideration of
$1.0 million
to Novaform and
$0.7 million
to Femiline AB had not been paid and was included in “Accounts payable”. As of
December 31, 2018
, the consideration of
$0.4 million
to Novaform was still outstanding.
The goodwill resulting from this acquisition is deductible for tax purposes.
F-33
ESTABLISHMENT LABS HOLDINGS, INC.
Notes to Consolidated Financial Statements
For the Years Ended December 31, 2018 and 2017
Asset Acquisitions
Germany
On October 3, 2018, EDC entered into an asset purchase agreement, effective November 26, 2018, with Menke Med GmbH, or the Germany Seller, to purchase certain assets from the Germany Seller. The assets purchased included all existing inventory previously sold by the Company to the Germany Seller and
all customer relationships and contracts. The aggregate purchase price for the assets purchased was the
aggregate sum of book value of the inventory at the time of the transaction plus a cash payment of up to a
maximum of
€1.9 million
, or approximately
$2.2 million
, to be paid out in installments upon the achievement of certain milestones as set forth in the agreement.
The purchase price and allocation of purchase price were as follows:
|
Purchase Price:
|
(in thousands)
|
|||
|
Cash consideration
|
$
|
544
|
|
|
|
Minimum guaranteed milestone payments
|
1,161
|
|
||
|
Cash paid for inventory
|
917
|
|
||
|
Total purchase price
|
$
|
2,622
|
|
|
|
Allocation of Purchase Price:
|
(in thousands)
|
|||
|
Inventory
|
$
|
2,137
|
|
|
|
Customer relationships
|
428
|
|
||
|
Covenant not to compete
|
57
|
|
||
|
Total purchase price allocated
|
$
|
2,622
|
|
|
Per the asset purchase agreement entered into with the German seller, the German Seller is entitled to
three
milestone payments in the next three fiscal years following the year ended December 31, 2018. The German Seller will receive annual payments of
€360,000
(approximately
$459,000
),
€420,000
(approximately
$536,000
) or
€480,000
(approximately
$612,000
) if the German Seller meets none, one, or both of the required milestones, respectively. Only the present value of the guaranteed minimum milestone payments of
€360,000
per year for the next three years were included in the purchase price. Contingent consideration will be recognized when the contingency is deemed probable and reasonably estimable.
As of December 31, 2018, the Company has fully paid for the German asset acquisition excluding the milestone payments of
$1,161
.
Spain
On October 1, 2018, European Distribution Center Motiva BVBA, or EDC, entered into an asset purchase agreement effective October 29, 2018, with Motiva Matrix Spain SL, or the Spain Seller, to purchase certain assets from the Spain Seller. The assets purchased included all existing inventory previously sold by the Company to the Spain Seller and all customer relationships and contracts. The aggregate purchase price for the assets purchased was the aggregate sum of the book value of the inventory at the time of the transaction (subject to certain adjustments as set forth in the agreement) plus a cash payment of
€1.6 million
, or approximately
$1.8 million
, to be paid to the Spain Seller no later than December 1, 2018 following repayment by the Spain Seller to the Company of an outstanding balance in the amount of
€2.0 million
, or approximately
$2.3 million
.
F-34
ESTABLISHMENT LABS HOLDINGS, INC.
Notes to Consolidated Financial Statements
For the Years Ended December 31, 2018 and 2017
The purchase price and allocation of purchase price were as follows:
|
Purchase Price:
|
(in thousands)
|
|||
|
Cash consideration
|
$
|
1,838
|
|
|
|
Cash paid for inventory
|
1,774
|
|
||
|
Total purchase price
|
$
|
3,612
|
|
|
|
Allocation of Purchase Price:
|
(in thousands)
|
|||
|
Inventory
|
$
|
3,560
|
|
|
|
Customer relationships
|
52
|
|
||
|
Total purchase price allocated
|
$
|
3,612
|
|
|
As of December 31, 2018, the Company has fully paid for the Spain asset acquisition.
The United Kingdom
On September 3, 2018, Motiva Implants UK Limited. entered into an asset purchase agreement, effective October 1, 2018, with Belle Health LTD, or the U.K. Seller, to purchase certain assets from the U.K. Seller. The assets purchased included all existing inventory previously sold by the Company to the U.K Seller and
all customer relationships and contracts. The aggregate purchase price for the assets purchased was the
aggregate sum of book value of the inventory at the time of the transaction, a future cash payment of
$100,000
to be paid 18 months after the effective date and
5,000
of the Company’s common shares.
The purchase price and allocation of purchase price were as follows:
|
Purchase Price:
|
(in thousands)
|
|||
|
Cash consideration
|
$
|
100
|
|
|
|
Fair market value of common shares issued on effective date
|
120
|
|
||
|
Cash paid for inventory
|
123
|
|
||
|
Total purchase price
|
$
|
343
|
|
|
|
Allocation of Purchase Price:
|
(in thousands)
|
|||
|
Inventory
|
$
|
235
|
|
|
|
Customer relationships
|
108
|
|
||
|
Total purchase price allocated
|
$
|
343
|
|
|
F-35
ESTABLISHMENT LABS HOLDINGS, INC.
Notes to Consolidated Financial Statements
For the Years Ended December 31, 2018 and 2017
12.
Income Taxes
For the years ended December 31, 2018 and 2017, loss before income tax provision (benefit) consisted of the following:
|
2018
|
2017
|
||||||
|
(in thousands)
|
|||||||
|
Costa Rica Operations
|
$
|
3,422
|
|
$
|
(6,887
|
)
|
|
|
Non-Costa Rica Operations
|
(24,305
|
)
|
(27,905
|
)
|
|||
|
$
|
(20,883
|
)
|
$
|
(34,792
|
)
|
||
As of December 31, the income tax provision consisted of the following:
|
2018
|
2017
|
||||||
|
(in thousands)
|
|||||||
|
Current
|
|||||||
|
Costa Rica
|
$
|
105
|
|
$
|
—
|
|
|
|
Non-Costa Rica
|
110
|
|
105
|
|
|||
|
Total Current
|
215
|
|
105
|
|
|||
|
Deferred
|
|||||||
|
Costa Rica
|
—
|
|
—
|
|
|||
|
Non-Costa Rica
|
—
|
|
—
|
|
|||
|
Total deferred
|
—
|
|
—
|
|
|||
|
Total provision
|
$
|
215
|
|
$
|
105
|
|
|
F-36
ESTABLISHMENT LABS HOLDINGS, INC.
Notes to Consolidated Financial Statements
For the Years Ended December 31, 2018 and 2017
The items accounting for the difference between income taxes computed at the Costa Rica statutory income tax rate and the income tax provision consisted of the following at December 31:
|
2018
|
2017
|
||||||||||||
|
(in thousands)
|
|||||||||||||
|
Tax benefit at Costa Rica statutory rate
|
$
|
(6,265
|
)
|
30
|
%
|
$
|
(10,438
|
)
|
30
|
%
|
|||
|
Foreign tax rate differential
|
4,335
|
|
(21
|
)
|
5,665
|
|
(15
|
)
|
|||||
|
Tax rate changes
|
42
|
|
—
|
|
562
|
|
(2
|
)
|
|||||
|
Return to provision adjustment
|
553
|
|
(3
|
)
|
679
|
|
(1
|
)
|
|||||
|
Tax credits
|
(75
|
)
|
—
|
|
(26
|
)
|
—
|
|
|||||
|
Change in valuation allowance
|
2,439
|
|
(12
|
)
|
1,768
|
|
(4
|
)
|
|||||
|
Net operating loss expiration
|
—
|
|
—
|
|
—
|
|
—
|
|
|||||
|
Tax holiday benefit
|
(912
|
)
|
4
|
|
1,653
|
|
(8
|
)
|
|||||
|
Other
|
98
|
|
1
|
|
242
|
|
—
|
|
|||||
|
$
|
215
|
|
(1
|
)%
|
$
|
105
|
|
—
|
%
|
||||
The Company's tax holiday benefit was related to the Company’s subsidiary in Costa Rica which enjoyed a
0%
tax rate for the year ended December 31, 2018 and
6%
rate for the year ended December 31, 2017. Effective August 10, 2018, the Company was granted a
0%
corporate income tax rate by the Costa Rica tax authorities. Income generated between January 1, 2018 and August 10, 2018 is still subject to the
6%
holiday tax rate. The
0%
tax holiday is granted for a period of
8
years through the year 2026.
As of December 31, the components of the Company's deferred tax assets and liabilities are as follows:
|
2018
|
2017
|
||||||
|
(in thousands)
|
|||||||
|
Accruals and reserves
|
$
|
62
|
|
$
|
91
|
|
|
|
Deferred revenue
|
—
|
|
33
|
|
|||
|
Intangibles
|
73
|
|
69
|
|
|||
|
Stock compensation
|
131
|
|
5
|
|
|||
|
Net operating loss
|
5,738
|
|
3,384
|
|
|||
|
R&D credits
|
97
|
|
28
|
|
|||
|
Other
|
(46
|
)
|
6
|
|
|||
|
Valuation allowance
|
(6,055
|
)
|
(3,616
|
)
|
|||
|
Total net deferred tax liabilities
|
$
|
—
|
|
$
|
—
|
|
|
Effective December 1, 2017, the Company adopted, on a prospective basis, ASU 2015-17,
Balance Sheet Classification of Deferred Taxes
, which simplifies the presentation of deferred income taxes by requiring deferred tax assets and liabilities be classified as non-current on the balance sheet. The adoption of ASU 2015-17 did not have a material impact on the consolidated financial statements.
F-37
ESTABLISHMENT LABS HOLDINGS, INC.
Notes to Consolidated Financial Statements
For the Years Ended December 31, 2018 and 2017
As of December 31, 2018, the Company assessed that it is more-likely-than-not that it will not realize its deferred tax assets based on the absence of sufficient positive objective evidence that it would generate sufficient taxable income in its Costa Rica and U.S. tax jurisdictions to realize the deferred tax assets. The Company intends to continue maintaining a full valuation allowance on its deferred tax assets until there is sufficient evidence to support the reversal of all or some portion of these allowances.
As of December 31, 2018, the Company had U.S. and California tax credit carryforwards of approximately
$0.1 million
. The federal R&D credits begin to expire in 2037. However, the California R&D credits can be carried forward indefinitely.
As of December 31, 2018, the Company had U.S. federal, state and Brazil net operating losses of approximately
$10.8 million
,
$2.8 million
,
$8.7 million
, respectively. The U.S. federal net operating losses of
$4.5 million
generated prior to 2018 will begin to expire December 31, 2035 and state net operating losses will begin to expire December 31, 2030. The U.S. federal net operating losses of
$6.3 million
generated in 2018 will be carried forward indefinitely. Brazil net operating losses can be carried forward indefinitely. Federal and California laws impose restrictions on the utilization of net operating loss carryforwards and R&D credit carryforwards in the event of a change in ownership of the Company, which constitutes an “ownership change” as defined by U.S. Internal Revenue Code Sections 382 and 383. The Company has not performed a detailed analysis to determine whether an ownership change under Section 382 and 383 of the Code has previously occurred. As a result, the Company’s ability to utilize existing carryforwards could be substantially restricted.
The Company is incorporated as an international business company with limited liability under International Business Companies Act, 1984 of the British Virgin Islands. As of December 31, 2018, the Company also conducted business in Costa Rica, Belgium, France, Brazil, the United Kingdom, Sweden and the United States and is subject to tax in these jurisdictions. As a result, the Company's worldwide income will be subject to the tax rates in which its income is generated and as such its effective tax rate may fluctuate based on the geographic distribution of its earned income or losses and the applicable tax laws in which those earnings or losses were generated.
Management’s intention is to indefinitely reinvest any undistributed earnings from its subsidiaries. Accordingly, no provision for withholding taxes has been provided nor is it practical to determine the amount of this liability. Upon distribution of those earnings in the form of dividends or otherwise, the Company will be subject to potential withholding taxes in the above-mentioned jurisdictions.
Accounting for Uncertainty in Income Taxes
The Company has adopted ASC 740-10
Accounting for Uncertainty in Income Taxes
(formerly FIN 48). ASC 740-10 prescribes a recognition threshold and measurement attribute for the financial statement recognition and measurement of uncertain tax positions taken or expected to be taken in the Company's income tax return, and provides guidance on derecognition, classification, interest and penalties, accounting in interim periods, disclosure, and transition. For the years ended December 31, 2018 and 2017 the Company has no material uncertain tax positions. The Company does not expect any significant increases or decreases to its unrecognized tax benefits within the next 12 months. The Company’s policy is to recognize interest and penalties accrued on any unrecognized tax benefits as a component of income tax expense.
As of December 31, 2018, the Company is subject to taxation in Belgium, France, Brazil, the United Kingdom, Sweden and the United States. The Company’s fiscal tax years 2014 through 2018 are subject to examination by the tax authorities.
2017 Tax Reform
On December 22, 2017, the Tax Cuts and Jobs Act, or Tax Reform, was signed into legislation. The Tax Reform makes significant changes to the U.S. corporate income tax law including, but not limited to, (1) reducing the U.S. federal corporate tax rate from 35% to 21% and (2) requiring a one-time mandatory transition tax on previously deferred foreign earnings of U.S. subsidiaries. Under ASC 740,
Income Taxes,
the effects of changes in tax rates and laws are recognized in the period in which the new legislation is enacted. In the case of U.S. federal income taxes, the enactment date is the date the bill becomes law. With respect to this legislation, we expect no financial statement impact due to the Company's valuation allowance. In 2017, the Company performed a re-measurement of deferred tax assets and liabilities as a result of the decrease in the corporate Federal income tax rate from
35%
F-38
ESTABLISHMENT LABS HOLDINGS, INC.
Notes to Consolidated Financial Statements
For the Years Ended December 31, 2018 and 2017
to
21%
of
$0.6 million
with a corresponding decrease to its U.S. valuation allowance of
$0.6 million
. In addition to the reduction of U.S. federal corporate tax rate, the Company has also considered the impact of the foreign transition tax for which it has estimated that it would not need to accrue any tax provision.
In December 2017, the Securities and Exchange Commission staff issued Staff Accounting Bulletin No.118, or SAB 118, to provide guidance on the application of the Tax Reform when a company does not have necessary information available, prepared, or analyzed in reasonable detail to reflect the effects of the Tax Reform. SAB 118 provides guidance for companies under the three scenarios (1) measurement of certain income tax effects is complete, (2) measurement of certain income tax effect can be reasonably estimated, and (3) measurement of certain income tax effects cannot be reasonably estimated. Companies are to complete the accounting under ASC 740 in regards to the Tax Reform within a measurement period that does not extend one year from the date of enactment. In accordance with SAB 118, companies must reflect the tax effects of the Tax Reform for which the accounting under 740 is complete. If certain income tax effects can be reasonably estimated, then the companies must report provisional amounts in the reporting period in which the companies can determine the reasonable estimate during the measurement period. In the case that certain income tax effects cannot be reasonably estimated, companies do not have to report effects of the Tax Reform. However, they should continue to apply ASC 740 based on the rules before the enactment of the Tax Reform and report any income tax effects in the first reporting period in which reasonable estimates become available.
The final impact of the Tax Reform may differ from the above estimate, possibly materially, due to, among other things, changes in interpretations of the tax guidance, any legislative action to address questions that arise because of the Tax Reform, any changes in accounting standards for income taxes or related interpretations in response to the Tax Reform, or any updates or changes to estimates the company has utilized to calculate the transition impact, including impact from changes to current year earnings estimates and foreign exchange rates of foreign subsidiaries. In accordance with SAB 118, the Company is allowed a measurement period of up to one year after the enactment date of the Tax Act to finalize the recording of the related tax impacts.
In December 2018, the Company completed its analysis of the impact of Tax Reform and did not have any material adjustments.
13.
Net Income (Loss) Per Share
The following table summarizes the computation of basic and diluted net loss per share for the periods presented:
|
Year Ended December 31,
|
||||||||
|
2018
|
2017
|
|||||||
|
(in thousands, except share and per share data)
|
||||||||
|
Numerator:
|
||||||||
|
Net loss
|
$
|
(21,098
|
)
|
$
|
(34,897
|
)
|
||
|
Denominator:
|
||||||||
|
Weighted average common shares used for basic and diluted earnings per share
|
17,350,705
|
|
10,230,586
|
|
||||
|
Loss per share:
|
||||||||
|
Basic and diluted
|
$
|
(1.22
|
)
|
$
|
(3.41
|
)
|
||
Basic net loss per share is computed by dividing the net loss by the weighted-average number of shares outstanding for the period. Diluted net loss per share is computed by dividing the net loss by the weighted-average number of shares and dilutive share equivalents outstanding for the period, determined using the treasury-share method and the as-if converted method, for convertible securities, if inclusion of these is dilutive
.
If the Company reports a net loss
, diluted net loss per share is the same as basic net loss per share for those
F-39
ESTABLISHMENT LABS HOLDINGS, INC.
Notes to Consolidated Financial Statements
For the Years Ended December 31, 2018 and 2017
periods because including the dilutive securities would be anti-dilutive.
The following potentially dilutive securities outstanding at the end of the periods presented have been excluded from the computation of diluted shares at December 31:
|
2018
|
2017
|
|||||
|
Options to purchase shares
|
1,486,363
|
|
863,932
|
|
||
|
Shares issuable on vesting of restricted stock awards
|
314,123
|
|
585,056
|
|
||
|
Warrants to purchase common shares
|
104,826
|
|
145,000
|
|
||
|
Total
|
1,905,312
|
|
1,593,988
|
|
||
14.
Related Party Transactions
In August 2015, the Company entered into a Note and Warrant purchase agreement with CPH (see Note 6). On August 24, 2017, CPH elected to convert the principal and the accrued interest outstanding under the Notes into
5,869,417
shares of the Company’s Class B ordinary shares. There was
no
outstanding balance under the Note and Warrant purchase agreement as of December 31, 2017. CPH owns approximately
37.1%
of the common shares of the Company as of
December 31, 2018
.
In January 2017, the Company issued secured promissory notes to Mr. Chacón Quirós, the Company’s Chief Executive Officer and director, and to Crown Predator Holdings, LLC, a related party, in an aggregate principal amount of
$1.2 million
under existing note purchase, security and pledge agreements. These promissory notes were repaid by the Company in January 2017 and April 2017.
In August 2017, the Company entered into a credit agreement with Madryn and a syndicate of lenders to borrow up to
$55.0 million
(see Note 6). As of
December 31, 2018
, Madryn owns approximately
3.6%
of the common shares of the Company.
In August 2015, the Company entered into a Note Agreement with the former Class Z preferred shareholders to exchange the outstanding shares for notes payable in the aggregate principal amount of
$4.3 million
. The notes became due and payable on July 23, 2018 when the Company successfully completed the IPO. The Company repaid the balance due, including accrued interest, in August 2018 (see Note 6). The Class Z preferred shareholders were primarily the original founders of the Company.
During the
year
ended
December 31, 2018
and
2017
, the Company recorded revenue of
$0.9 million
and
$0.6 million
, respectively, for product sales to Herramientas Medicas, S.A., a distribution company owned by a family member of the Chief Executive Officer of the Company. Accounts receivable owed to the Company from this distribution company amounted to approximately
$0.2 million
and
$0.1 million
as of
December 31, 2018
and 2017, respectively.
In December 2016, the Company entered into a note agreement to borrow
$0.2 million
from an executive officer of the Company. This note was repaid in 2017.
In September 2016, the Company entered into a share repurchase agreement with Global Silicone SRL for the repurchase of
813,140
ordinary shares of the Company owned by Global Silicone SRL in exchange for
$3.7 million
. These treasury shares were retired in 2018. In October 2016, the Company paid
$2.0 million
to Global Silicone SRL to repurchase
440,040
shares and the remaining
$1.7 million
was paid in April 2017. In July 2017, the Company paid
$2.8 million
to repurchase additional
406,570
Class A ordinary shares from Global Silicone SRL.
In May 2016, the Company entered into a scientific board advisory agreement with Dr. Manuel Enrique Chacón Quirós pursuant to which Dr. Chacón Quirós joined the Company’s Scientific Advisory Board, provides general scientific advice, and serves as a clinical investigator, among other services. In exchange for these services, Dr. Chacón Quirós was granted options to purchase
20,580
shares, vesting over
four
years in equal annual
F-40
ESTABLISHMENT LABS HOLDINGS, INC.
Notes to Consolidated Financial Statements
For the Years Ended December 31, 2018 and 2017
installments, provided that he continues to provide these services at such times. In September 2016, the Company entered into a separate agreement whereby Dr. Chacón Quirós will maintain his clinic in Costa Rica as a MotivaImagine Excellence Center and will host and train physicians in the use of the Company products in relevant procedures, among other services, in exchange for cash reimbursement of up to
$4,500
per day that such services are rendered. Dr. Chacón Quirós is the brother of our Chief Executive Officer, Juan José Chacón Quirós. During the
year
ended
December 31, 2018
and
2017
, the Company paid Dr. Chacón Quirós approximately
$90,000
and
$120,000
, respectively, for services rendered.
During the
year
ended
December 31, 2018
and
2017
, the Company recorded revenue of approximately
$40,000
and
$0.3 million
for product sales to Motiva Netherlands BV, a distribution company owned by Erick Vogelanzeng, our Vice President of Sales, Europe. There were
no
accounts payable due to this distribution company at
December 31, 2018
and
December 31, 2017
.
15.
Employee Benefits
Short-term employee benefits, including vacation (paid absences) and year-end bonuses (also known as 13th month salary), are current liabilities included in accrued liabilities on the consolidated balance sheet and are calculated at the non-discounted amount that the Company expects to pay as a result of uncharged employee salaries or retentions.
Regarding employee termination benefits, Costa Rica labor laws establish the payment of benefits in case of death, retirement or termination without cause. This compensation is calculated according to time served in the company and the corresponding salary in the last six months of employment, and is equal to between 19.5 and 22 days salary for each year served, up to a maximum of 8 years.
Company policy recognizes termination benefits as expenses of the period during which the termination occurs, when the legal obligation is assumed due to the aforementioned events.
None of the Company’s employees are represented by a labor union except for
two
employees in Brazil. The Company has not experienced any work stoppages, and it considers employee relations to be good.
16. Subsequent Events
On January 16, 2019, the Company established a wholly-owned subsidiary in Spain - Motiva Implants Spain, S.L.
On January 31, 2019, European Distribution Center Motiva BVBA, or EDC, entered into an asset purchase agreement, or the Austria Asset Purchase Agreement, with AFS Medical GMBH, or the Austria Seller, to purchase certain assets from the Austria Seller. The assets purchased included all existing inventory previously sold by the Company to the Austria Seller and all customer relationships and contracts. The aggregate purchase price for the assets purchased was the aggregate sum of book value of the inventory at the time of the transaction (subject to certain adjustments as set forth in the Austria Asset Purchase Agreement), a cash payment of
€0.3 million
, or approximately
$0.3 million
, paid to the Austria Seller on the effective date and
12,404
common shares of the Company valued at
€0.3 million
, or approximately
$0.3 million
.
Between January 1, 2019 and
March 20, 2019
, the Board of Directors approved grants of
56,000
shares of stock options under the 2018 Plan, inclusive of a performance-based grant of
9,000
shares of stock options to Eddie De Oliveira, Vice President of Sales - Brazil, contingent upon achievement of certain sales milestones.
F-41
SIGNATURES
Pursuant to the requirements of the Securities Act of 1934, the registrant has duly caused this report to be signed on its behalf by the undersigned, thereunto duly authorized.
|
ESTABLISHMENT LABS HOLDINGS INC.
|
|||
|
Dated:
|
March 20, 2019
|
By:
|
/s/ Juan Jose Chacon Quiros
|
|
Name:
|
Juan Jose Chacon Quiros
|
||
|
Title:
|
Chief Executive Officer and Director
|
||
Pursuant to the requirements of the Securities Exchange Act of 1934, as amended, this report has been signed below by the following persons on behalf of the Registrant and in the capacities and on the dates indicated.
|
Signature
|
Title
|
Date
|
||
|
/s/ Juan Jose Chacon Quiros
|
President, Chief Executive Officer and Director
(Principal Executive Officer)
|
March 20, 2019
|
||
|
Juan Jose Chacon Quiros
|
||||
|
/s/ Renee M. Gaeta
|
Chief Financial Officer
(Principal Financial and Accounting Officer)
(Authorized Representative in the United States)
|
March 20, 2019
|
||
|
Renee M. Gaeta
|
||||
|
/s/ Nicholas Lewin
|
Chairman of the Board of Directors
|
March 20, 2019
|
||
|
Nicholas Lewin
|
||||
|
/s/ Dennis Condon
|
Director
|
March 20, 2019
|
||
|
Dennis Condon
|
||||
|
/s/ Lisa N. Colleran
|
Director
|
March 20, 2019
|
||
|
Lisa N. Colleran
|
||||
|
/s/ Edward Schutter
|
Director
|
March 20, 2019
|
||
|
Edward Schutter
|
||||
|
/s/ David Hung, M.D.
|
Director
|
March 20, 2019
|
||
|
David Hung, M.D.
|
||||
|
Director
|
||||
|
Allan Weinstein
|
||||
F-42
TABLE OF CONTENTS
Part IItem 1. BusinessItem 1A. Risk FactorsItem 1B. Unresolved Staff CommentsItem 2. PropertiesItem 3. Legal ProceedingsItem 4. Mine Safety DisclosuresPart IIItem 5. Market For Registrant S Common Equity, Related Stockholder Matters and Issuer Purchases Of Equity SecuritiesItem 6. Selected Financial DataItem 7. Management S Discussion and Analysis Of Financial Condition and Results Of OperationsItem 7A. Quantitative and Qualitative Disclosures About Market RiskItem 8. Financial Statements and Supplementary DataItem 9. Changes in and Disagreements with Accountants on Accounting and Financial DisclosureItem 9A. Conrols and ProceduresItem 9B. Other InformationPart IIIItem 10. Directors, Executive Officers and Corporate GovernanceItem 11. Executive CompensationItem 12. Security Ownership Of Certain Beneficial Owners and Management and Related Stockholder MattersItem 13. Certain Relationships and Related Transactions, and Director IndependenceItem 14. Principal Accounting Fees and ServicesPart IVItem 15. Exhibits, Financial Statement Schedules