ENERGY TRANSFER LP
10-Ks and 10-Qs
UNITED STATES
SECURITIES AND EXCHANGE COMMISSION
Washington, D.C. 20549
FORM 10-K
|
ý
|
ANNUAL REPORT PURSUANT TO SECTION 13 OR 15(d) OF THE SECURITIES EXCHANGE ACT OF 1934
|
|
For the fiscal year ended December 31, 2011
|
|
|
¨
|
TRANSITION REPORT PURSUANT TO SECTION 13 OR 15(d) OF THE SECURITIES EXCHANGE ACT OF 1934
|
Commission file number 1-32740
ENERGY TRANSFER EQUITY, L.P.
(Exact name of registrant as specified in its charter)
|
Delaware
|
|
30-0108820
|
|
(State or other jurisdiction of incorporation or organization)
|
|
(I.R.S. Employer Identification No.)
|
3738 Oak Lawn Avenue, Dallas, Texas 75219
(Address of principal executive offices) (zip code)
Registrant’s telephone number, including area code:
(214) 981-0700
Securities registered pursuant to Section 12(b) of the Act:
|
Title of each class
|
|
Name of each exchange on which registered
|
|
Common Units
|
|
New York Stock Exchange
|
Securities registered pursuant to section 12(g) of the Act: None
Indicate by check mark if the registrant is a well-known seasoned issuer, as defined in Rule 405 of the Securities Act.
Yes
ý
No
¨
Indicate by check mark if the registrant is not required to file reports pursuant to Section 13 or Section 15(d) of the Act.
Yes
¨
No
ý
Indicate by check mark whether the registrant (1) has filed all reports required to be filed by Section 13 or 15(d) of the Securities Exchange Act of 1934 during the preceding 12 months (or for such shorter period that the registrant was required to file such reports) and (2) has been subject to such filing requirements for the past 90 days.
Yes
ý
No
¨
Indicate by check mark whether the registrant has submitted electronically and posted on its corporate Website, if any, every Interactive Data File required to be submitted and posted pursuant to Rule 405 of Regulation S-T during the preceding 12 months (or for such shorter period that the registrant was required to submit and post such files).
Yes
ý
No
¨
Indicate by check mark if disclosure of delinquent filers pursuant to Item 405 of Regulation S-K is not contained herein, and will not be contained, to the best of the registrant’s knowledge, in definitive proxy or information statements incorporated by reference in Part III of this Form 10-K or any amendment to this Form 10-K.
¨
Indicate by check mark whether the registrant is a large accelerated filer, an accelerated filer, a non-accelerated filer, or a smaller reporting company. See the definitions of “large accelerated filer,” “accelerated filer” and “smaller reporting company” in Rule 12b-2 of the Exchange Act.
Large accelerated filer
ý
Accelerated filer
¨
Non-accelerated filer
¨
Smaller reporting company
¨
Indicate by check mark whether the registrant is a shell company (as defined in Rule 12b-2 of the Exchange Act).
Yes
¨
No
ý
The aggregate market value as of June 30, 2011, of the registrant’s Common Units held by non-affiliates of the registrant, based on the reported closing price of such Common Units on the New York Stock Exchange on such date, was $5.60 billion. Common Units held by each executive officer and director and by each person who owns 5% or more of the outstanding Common Units have been excluded in that such persons may be deemed to be affiliates. This determination of affiliate status is not necessarily a conclusive determination for other purposes.
At
February 15, 2012
, the registrant h
ad 222,973,448 C
ommon Units outstanding.
DOCUMENTS INCORPORATED BY REFERENCE
None
TABLE OF CONTENTS
|
|
|
PAGE
|
|
ITEM 1.
|
||
|
ITEM 1A.
|
||
|
ITEM 1B.
|
||
|
ITEM 2.
|
||
|
ITEM 3.
|
||
|
ITEM 4.
|
||
|
ITEM 5.
|
||
|
ITEM 6.
|
||
|
ITEM 7.
|
||
|
ITEM 7A.
|
||
|
ITEM 8.
|
||
|
ITEM 9.
|
||
|
ITEM 9A.
|
||
|
ITEM 9B.
|
||
|
ITEM 10.
|
||
|
ITEM 11.
|
||
|
ITEM 12.
|
||
|
ITEM 13.
|
||
|
ITEM 14.
|
||
|
ITEM 15.
|
||
ii
Forward-Looking Statements
Certain matters discussed in this report, excluding historical information, as well as some statements by Energy Transfer Equity, L.P. (“Energy Transfer Equity,” the “Partnership” or “ETE”) in periodic press releases and some oral statements of the Partnership’s officials during presentations about the Partnership, include forward-looking statements. These “forward-looking” statements are identified as any statement that does not relate strictly to historical or current facts. Statements using words such as “anticipate,” “project,” “expect,” “plan,” “goal,” “forecast,” “estimate,” “intend,” “continue,” “could,” “believe,” “may,” “will” or similar expressions help identify forward-looking statements. Although the Partnership and its General Partner believe such forward-looking statements are based on reasonable assumptions and current expectations and projections about future events, no assurance can be given that such assumptions, expectations or projections will prove to be correct. Forward-looking statements are subject to a variety of risks, uncertainties and assumptions. If one or more of these risks or uncertainties materialize, or if underlying assumptions prove incorrect, the Partnership’s actual results may vary materially from those anticipated, estimated, projected or expected in forward-looking statements since many of the factors that determine these results are subject to uncertainties and risks that are difficult to predict and beyond management’s control. For additional discussion of risks, uncertainties and assumptions, see “Item 1.A Risk Factors” included in this annual report.
Definitions
The following is a list of certain acronyms and terms generally used in the energy industry and throughout this document:
|
/d
|
|
per day
|
|
|
Bbls
|
|
barrels
|
|
|
Btu
|
|
British thermal unit, an energy measurement used by gas companies to convert the volume of gas used to its heat equivalent, and thus calculate the actual energy content
|
|
|
Capacity
|
|
capacity of a pipeline, processing plant or storage facility refers to the maximum capacity under normal operating conditions and, with respect to pipeline transportation capacity, is subject to multiple factors (including natural gas injections and withdrawals at various delivery points along the pipeline and the utilization of compression) which may reduce the throughput capacity from specified capacity levels
|
|
|
Mcf
|
|
thousand cubic feet
|
|
|
MMBtu
|
|
million British thermal units
|
|
|
MMcf
|
|
million cubic feet
|
|
|
Bcf
|
|
billion cubic feet
|
|
|
NGL
|
|
natural gas liquid, such as propane, butane and natural gasoline
|
|
|
Tcf
|
|
trillion cubic feet
|
|
|
LIBOR
|
|
London Interbank Offered Rate
|
|
|
NYMEX
|
|
New York Mercantile Exchange
|
|
|
Reservoir
|
|
a porous and permeable underground formation containing a natural accumulation of producible natural gas and/or oil that is confined by impermeable rock or water barriers
|
|
|
WTI
|
|
West Texas Intermediate Crude
|
|
1
Overview
We were formed in September 2002 and completed our initial public offering in February 2006. We are a Delaware limited partnership with common units publicly traded on the New York Stock Exchange (“NYSE”) under the ticker symbol “ETE.”
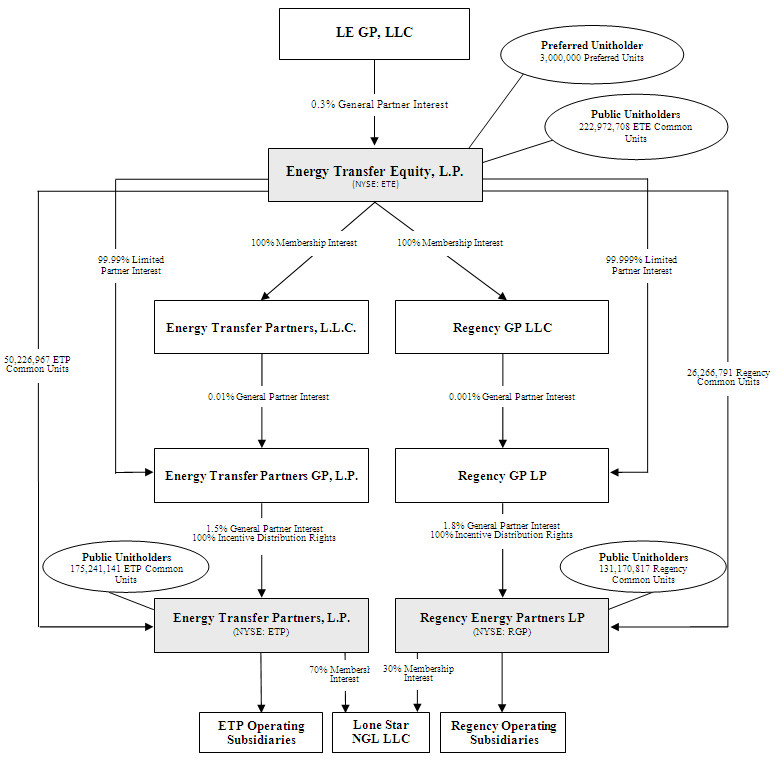
Unless the context requires otherwise, references to “we,” “us,” “our,” “the Partnership” and “ETE” shall mean Energy Transfer Equity, L.P. and its consolidated subsidiaries, which include Energy Transfer Partners, L.P. (“ETP”); Energy Transfer Partners GP, L.P. (“ETP GP”), the general partner of ETP; Energy Transfer Partners, L.L.C. (“ETP LLC”), ETP GP’s general partner; Regency Energy Partners LP (“Regency”); Regency GP LP (“Regency GP”), the general partner of Regency; and Regency GP LLC (“Regency LLC”), Regency GP’s general partner. References to the “Parent Company” shall mean ETE on a stand-alone basis.
Currently, the Parent Company’s only cash generating assets are its direct and indirect investments in limited partner and general partner interests in ETP and Regency, both of which are publicly traded master limited partnerships engaged in diversified energy-related services.
At
December 31, 2011
, our interests in ETP and Regency consisted of:
|
General Partner
Interest (as a %
of total
partnership
interest)
|
Incentive
Distribution
Rights
(“IDRs”)
|
Limited
Partner Units
|
||||||
|
ETP
|
1.5
|
%
|
100
|
%
|
50,226,967
|
|
||
|
Regency
|
1.8
|
%
|
100
|
%
|
26,266,791
|
|
||
We acquired our equity interests in Regency in a series of transactions, which we refer to as the “Regency Transactions,” that were completed on May 26, 2010. In the Regency Transactions, the Parent Company:
|
•
|
acquired the general partner interest and IDRs in Regency in exchange for 3,000,000 Series A Convertible preferred units (“the Preferred Units”) having an aggregate liquidation preference of $300 million;
|
|
•
|
acquired from ETP an indirect 49.9% interest in Midcontinent Express Pipeline LLC (“MEP”), ETP’s joint venture with Kinder Morgan Energy Partners, L.P. (“KMP”) to operate the Midcontinent Express Pipeline, and an option to acquire an additional 0.1% interest in MEP in exchange for the redemption by ETP of approximately 12.3 million ETP Common Units we previously owned; and,
|
|
•
|
acquired 26.3 million Regency Common Units in exchange for our contribution to Regency of all interests in MEP acquired by the Parent Company from ETP, including the option to acquire an additional 0.1% interest.
|
The Parent Company’s primary cash requirements are for distributions to its partners and holders of the Preferred Units, general and administrative expenses, debt service requirements and at ETE’s election, capital contributions to ETP and Regency in respect of ETE’s general partner interests in ETP and Regency. The Parent Company-only assets and liabilities are not available to satisfy the debts and other obligations of ETP, Regency or their respective subsidiaries.
The following is a brief description of ETP’s and Regency’s operations:
|
•
|
ETP is a publicly traded partnership owning and operating a diversified portfolio of energy assets. ETP has pipeline operations in Arizona, Arkansas, Colorado, Louisiana, New Mexico, Utah and West Virginia and owns the largest intrastate pipeline system in Texas. ETP currently has natural gas operations that include more than 17, 500 miles of gathering and transportation pipelines, treating and processing assets, and three storage facilities located in Texas. ETP also holds a 70% membership interest in Lone Star NGL LLC (“Lone Star”), a joint venture that owns and operates NGL storage, fractionation and transportation assets in Texas, Louisiana and Mississippi.
|
|
•
|
Regency is a publicly traded partnership engaged in the gathering and processing, contract compression, treating and transportation of natural gas and the transportation, fractionation and storage of NGLs. Regency focuses on providing midstream services in some of the most prolific natural gas producing regions in the United States, including the Eagle Ford, Haynesville, Barnett, Fayetteville, Marcellus, Bone Spring and Avalon Shales, as well as the Permian Delaware basin. Its assets are primarily located in Texas, Louisiana, Arkansas, Pennsylvania, California, Mississippi, Alabama, West Virginia and the mid-continent region of the United States, which includes Kansas, Colorado and Oklahoma. Regency also holds a 30% membership interest in Lone Star.
|
2
In order to fully understand the financial condition and results of operations of the Parent Company on a stand-alone basis, we have included herein discussions of Parent Company matters apart from those of our consolidated group.
Organizational Structure
The following chart summarizes our organizational structure as of
December 31, 2011
:
Recent Developments
Pending Acquisition
On July 19, 2011, we entered into a transaction to acquire Southern Union Company (“SUG”), a Delaware corporation. This transaction, which we refer to as the SUG Merger, will provide us with direct ownership of assets that are complementary to the assets owned and operated by ETP and Regency. To execute the SUG Merger, we entered into a Second Amended and Restated Plan of Merger (the “SUG Merger Agreement”) with Sigma Acquisition Corporation, a Delaware corporation and our wholly-
3
owned subsidiary (“Merger Sub”), and SUG. The Second Amended Merger Agreement modifies certain terms of the Amended and Restated Agreement and Plan of Merger entered into by us, Merger Sub and SUG on July 4, 2011. Under the terms of the SUG Merger Agreement, Merger Sub will merge with and into SUG, with SUG continuing as the surviving entity and becoming our wholly-owned subsidiary subject to certain conditions to close. Pursuant to the SUG Merger Agreement, we would acquire all of the outstanding shares of SUG in a transaction valued at
$9.4 billion
, including
$5.7 billion
in cash and ETE Common Units and
$3.7 billion
of existing SUG indebtedness. Stockholders of SUG may elect to exchange each share of SUG stock for either
$44.25
in cash or
1.00
ETE Common Unit. The maximum cash component is
60%
of the aggregate consideration and the common unit component can fluctuate between
40%
and
50%
. Elections in excess of either the cash or common unit limits will be subject to proration.
We have secured
$3.7 billion
in committed financing from a group of lenders led by Credit Suisse Securities (USA) LLC to fund a portion of the cash consideration related to the SUG Merger. On December 9, 2011, the special meeting of the SUG stockholders was held and the SUG stockholders voted to approve the SUG Merger. ETE and SUG have made filings with the Missouri Public Service Commission and expect to receive its approval of the SUG Merger in the first quarter of 2012. Closing of this business combination is contingent upon several conditions, including regulatory approvals and we expect the transaction to close in the first quarter of 2012.
On July 19, 2011, ETP entered into an Amended Citrus Merger Agreement pursuant to which it is anticipated that SUG will cause the contribution to ETP of SUG’s
50%
interest in Citrus Corp., which owns
100%
of the Florida Gas Transmission (“FGT”) pipeline system, in exchange for approximately
$1.895 billion
in cash and
$105 million
of ETP Common Units, contemporaneous with the completion of the merger between SUG and us pursuant to the Second Amended SUG Merger Agreement. Citrus Corp is currently jointly owned by SUG and El Paso Corporation. The FGT pipeline system has a capacity of
3.0 billion
cubic feet per day. FGT’s primary customers are utilities with strong investment grade credit ratings; FGT’s long-term contracts with these high credit quality customers are expected to increase ETP’s fee-based revenue stream.
Propane Operations
On January 12, 2012, ETP contributed its propane operations, consisting of Heritage Operating, L.P. (“HOLP”) and Titan Energy Partners, L.P. (“Titan”) (collectively, the “Propane Business”), to AmeriGas Partners, L.P. (“AmeriGas”). ETP received $1.46 billion in cash and approximately 29.6 million AmeriGas common units in consideration for the contribution of the Propane Business, plus the assumption by AmeriGas of approximately $71 million of existing HOLP debt. This transaction improved ETP's liquidity and allows ETP to focus on its core business in the natural gas and NGL markets. As a result of this transaction, we have not included a discussion of ETP's propane assets or operations in Item 1.
Growth Projects
ETP, Regency and Lone Star's aggregate growth capital expenditures for 2011 were $1.8 billion. In 2012, ETP, Regency and Lone Star expect their aggregate capital expenditures to be between $2.6 billion and $2.9 billion, which includes additional NGL assets including construction of a NGL fractionator at Mont Belvieu, assets in the Eagle Ford Shale, assets in the Woodford and Barnett Shales, in addition to various other growth projects. In addition to these capital expenditures, ETP expects to complete its acquisition of a 50% interest in Citrus in conjunction with our acquisition of SUG, as described above. Along with the inherent benefits of greater scale and cash flow diversification that we experience from growth and acquisitions that occur at ETP and Regency, we also expect to directly benefit through increases in the distributions that we receive through our limited partner, general partner and IDR interests in ETP and Regency.
Ranch Joint Venture
On December 2, 2011, Ranch Westex JV LLC (“Ranch JV”) was formed by Regency, Anadarko Pecos Midstream LLC and Chesapeake West Texas Processing, L.L.C., each owning 33.33% of the joint venture. Ranch JV, upon completion of construction in 2012, will process natural gas delivered from the NGL-rich Bone Spring and Avalon shale formations in West Texas. The project consists of two plants, a 25 MMcf/d refrigeration plant and a 100 MMcf/d cryogenic processing plant. The initial start-up of the refrigeration unit is expected to be in service by the second quarter of 2012, with full facilities available by the fourth quarter of 2012.
Business Strategy
Our current primary business objective is to increase cash available for distributions by actively assisting ETP and Regency in executing their business strategies by assisting in identifying, evaluating and pursuing strategic acquisitions and growth opportunities. In general, we expect that we will allow ETP or Regency the first opportunity to pursue any acquisition or internal growth project that may be presented to us which may be within the scope of ETP and Regency’s operations or business strategies. In the future, we may also support the growth of ETP and Regency through the use of our capital resources which could involve
4
loans, capital contributions or other forms of credit support to ETP and Regency. This funding could be used for the acquisition by ETP or Regency of a business or asset or for an internal growth project. In addition, the availability of this capital could assist ETP or Regency in arranging financing for a project, reducing its financing costs or otherwise supporting a merger or acquisition transaction.
Segment Overview
Our reportable segments consist of our investment in ETP and our investment in Regency. The businesses within these two segments are described below. See Note
14
to our consolidated financial statements for additional financial information about our reportable segments.
Investment in ETP
ETP’s operations include the following:
Intrastate Transportation and Storage Operations
Through ETP’s intrastate transportation and storage operations, it owns and operates approximately 8,300 miles of natural gas transportation pipelines and three natural gas storage facilities located in the state of Texas.
Through Energy Transfer Company (“ETC OLP”), ETP owns the largest intrastate pipeline system in the United States with interconnects to Texas markets and to major consumption areas throughout the United States. ETP’s intrastate transportation and storage operations focuses on the transportation of natural gas to major markets from various prolific natural gas producing areas through connections with other pipeline systems as well as through ETP’s Oasis pipeline, its East Texas pipeline, its natural gas pipeline and storage assets that ETP refers to as the ET Fuel System, and its HPL System, which are described below.
ETP’s intrastate transportation and storage operations are determined primarily by the amount of capacity its customers reserve as well as the actual volume of natural gas that flows through the transportation pipelines. Under transportation contracts, ETP’s customers are charged (i) a demand fee, which is a fixed fee for the reservation of an agreed amount of capacity on the transportation pipeline for a specified period of time and which obligates the customer to pay even if the customer does not transport natural gas on the respective pipeline, (ii) a transportation fee, which is based on the actual throughput of natural gas by the customer, (iii) fuel retention based on a percentage of gas transported on the pipeline, or (iv) a combination of the three, generally payable monthly.
ETP also generates revenues and margin from the sale of natural gas to electric utilities, independent power plants, local distribution companies, industrial end-users and other marketing companies on its HPL System. Generally, ETP purchases natural gas from either the market (including purchases from ETP’s midstream marketing operations) or from producers at the wellhead. To the extent the natural gas comes from producers, it is primarily purchased at a discount to a specified market price and typically resold to customers based on an index price. In addition, ETP’s intrastate transportation and storage operations generate revenues from fees charged for storing customers’ working natural gas in its storage facilities and from margin from managing natural gas for ETP’s own account. The major customers on ETP's intrastate pipelines include Natural Gas Exchange, Inc., EDF Trading North America, Inc., XTO Energy, Inc. and ConocoPhillips.
Interstate Transportation Operations
Through ETP’s interstate transportation operations, it owns and operates approximately 2,880 miles of interstate natural gas pipeline and has a 50% interest in the joint venture that owns the 185-mile Fayetteville Express pipeline.
The results from its interstate transportation operations are primarily derived from the fees ETP earns from natural gas transportation services and, for the Transwestern pipeline, from operational gas sales. The major customers on ETP's interstate pipelines include
Chesapeake Energy Marketing, Inc., EnCana Marketing (USA), Inc. (“EnCana”), Shell Energy North America (US), L.P. and Pacific Summit Energy LLC.
Midstream Operations
Through ETP’s midstream operations, it owns and operates approximately 7,400 miles of in-service natural gas gathering pipelines, two natural gas processing plants, 15 natural gas treating facilities and 11 natural gas conditioning facilities. ETP’s midstream operations focuses on the gathering, compression, treating, blending, processing and marketing of natural gas, and its operations are currently concentrated in major producing basins and shales, including the Austin Chalk trend and Eagle Ford Shale in South and Southeast Texas, the Permian Basin in West Texas and New Mexico, the Barnett Shale in North Texas, the Bossier Sands in East Texas, and the Uinta and Piceance Basins in Utah and Colorado, the Marcellus Shale in West Virginia, and the Haynesville Shale in East Texas and Louisiana. Many of ETP’s midstream assets are integrated with its intrastate transportation and storage assets.
5
ETP’s midstream operations results are derived primarily from margins ETP earns for natural gas volumes that are gathered, transported, purchased and sold through its pipeline systems and the natural gas and NGL volumes processed at its processing and treating facilities. ETP also markets natural gas on its pipeline systems in addition to other pipeline systems to realize incremental revenue on gas purchased, increase pipeline utilization and provide other services that are valued by its customers. The major customers on ETP's midstream pipelines include Enterprise Products Partners L.P. ("Enterprise") and Chevron Phillips Chemical Company LP.
NGL Transportation and Services Operations
Through ETP's NGL transportation and services operations, it owns and operates an approximately 45-mile NGL pipeline and have a 50% interest in the Liberty pipeline, an approximately 85-mile NGL pipeline. ETP also has a 70% interest in the Lone Star joint venture that owns approximately 1,400 miles of NGL pipelines, three processing plants, one fractionation facility and NGL storage facilities with aggregate working storage capacity of 47 million Bbls. ETP's NGL transportation and services operations, which was created through the acquisition of LDH in May 2011.
NGL transportation revenue is principally generated from fees charged to customers under dedicated contracts or take-or-pay contracts. Under a dedicated contract, the customer agrees to deliver the total output from particular processing plants that are connected to the NGL pipeline. Take-or-pay contracts have minimum throughput commitments requiring the customer to pay regardless of whether a fixed volume is transported. Transportation fees are market-based, negotiated with customers and competitive with regional regulated pipelines.
NGL storage revenues are derived from base storage fees and throughput fees. Base storage fees are based on the volume of capacity reserved, regardless of the capacity actually used. Throughput fees are charged for providing ancillary services, including receipt and delivery, custody transfer, rail/truck loading and unloading fees. Storage contracts may be for dedicated storage or fungible storage. Dedicated storage enables a customer to reserve an entire storage cavern, which allows the customer to inject and withdraw proprietary and often unique products. Fungible storage allows a customer to store specified quantities of NGL products that are commingled in a storage cavern with other customers’ products of the same type and grade. NGL storage contracts may be entered into on a firm or interruptible basis. Under a firm basis contract, the customer obtains the right to store products in the storage caverns throughout the term of the contract; whereas, under an interruptible basis contract, the customer receives only limited assurance regarding the availability of capacity in the storage caverns.
These operations also include revenues earned from processing and fractionating refinery off-gas. Under these contracts ETP receives an Olefins-grade ("O-grade") stream from cryogenic processing plants located at refineries and fractionate the products into their pure components. ETP delivers purity products to customers through pipelines and across a truck rack located at the fractionation complex. In addition to revenues for fractionating the O-grade stream, ETP has percent-of-proceeds and income sharing contracts, which are subject to market pricing of olefins and NGLs. For percent-of-proceeds contracts, ETP retains a portion of the purity NGLs and olefins processed, or a portion of the proceeds from the sales of those commodities, as a fee. When NGLs and olefin prices increase, the value of the portion ETP retains as a fee increases. Conversely, when NGLs and olefin prices decrease, so does the value of the portion ETP retains as a fee. Under ETP's income sharing contracts, it pays the producer the equivalent energy value for their liquids, similar to a traditional keep-whole processing agreement, and then share in the residual income created by the difference between NGLs and olefin prices as compared to natural gas prices. As NGLs and olefins prices increase in relation to natural gas prices, the value of the percent ETP retains as a fee increases. Conversely, when NGLs and olefins prices decrease as compared to natural gas prices, so does the value of the percent it retains as a fee. The major customers on our NGL pipelines include Targa Resources Partners LP, The Williams Companies, Inc. and Louis Dreyfus Highbridge Energy LLC.
Retail Propane Operations
As discussed above, in January 2012 ETP contributed its propane operations to AmeriGas. See further discussion of this transaction in “Recent Developments” above.
All Other
ETP’s other operations include wholesale propane and natural gas compression services.
6
Investment in Regency
Regency’s operations include the following:
Gathering, Treating and Processing Operations
Regency provides “wellhead-to-market” services to producers of natural gas, which include transporting raw natural gas from the wellhead through gathering systems, processing raw natural gas to separate NGLs and selling or delivering the pipeline-quality natural gas and NGLs to various markets and pipeline systems.
Joint Ventures Operations
Regency owns four investments in joint ventures. See a description of its investments in joint ventures under “Asset Overview – Investment in Regency – Joint Ventures Operations.”
Contract Compression Operations
Regency owns and operates a fleet of compressors used to provide turn-key natural gas compression services for customer specific systems.
Contract Treating Operations
Regency owns and operates a fleet of equipment used to provide treating services, such as carbon dioxide and hydrogen sulfide removal, natural gas cooling, dehydration and BTU management, to natural gas producers and midstream pipeline companies.
Other Operations
Regency also owns a small regulated pipeline.
Asset Overview
Investment in ETP
The following details the assets in ETP’s operations:
Intrastate Transportation and Storage Operations
The following details ETP’s pipelines and storage facilities in its intrastate transportation and storage operations.
ET Fuel System
|
•
|
Capacity of 5.2 Bcf/d
|
|
•
|
Approximately 2,950 miles of natural gas pipeline
|
|
•
|
Two storage facilities with 12.4 Bcf of total working gas capacity
|
|
•
|
Bi-directional capabilities
|
The ET Fuel System serves some of the most active drilling areas in the United States and is comprised of intrastate natural gas pipeline and related natural gas storage facilities. With approximately 560 receipt and/or delivery points, including interconnects with pipelines providing direct access to power plants and interconnects with other intrastate and interstate pipelines, the ET Fuel System is strategically located near high-growth production areas and provides access to the Waha Hub near Midland, Texas, the Katy Hub near Houston, Texas and the Carthage Hub in East Texas, the three major natural gas trading centers in Texas. The major shippers on its pipelines include EOG Resources, Inc., Chesapeake Energy Marketing, Inc., XTO Energy, Inc. (“XTO”), Luminant Energy Company LLC and Encana.
The ET Fuel System also includes ETP’s Bethel natural gas storage facility, with a working capacity of 6.4 Bcf, an average withdrawal capacity of 300 MMcf/d and an injection capacity of 75 MMcf/d, and its Bryson natural gas storage facility, with a working capacity of 6.0 Bcf, an average withdrawal capacity of 120 MMcf/d and an average injection capacity of 96 MMcf/d. All of ETP’s storage capacity on the ET Fuel System is contracted to third parties under fee-based arrangements that expire in 2012 and 2013.
In addition, the ET Fuel System is integrated with ETP’s Godley processing plant which gives ETP the ability to bypass the plant when processing margins are unfavorable by blending the untreated natural gas from the North Texas System with natural gas on the ET Fuel System while continuing to meet pipeline quality specifications.
7
Oasis Pipeline
|
•
|
Capacity of 1.2 Bcf/d
|
|
•
|
Approximately 600 miles of natural gas pipeline
|
|
•
|
Connects Waha to Katy market hubs
|
The Oasis pipeline is primarily a 36-inch natural gas pipeline. It has bi-directional capability with approximately 1.2 Bcf/d of throughput capacity moving west-to-east and greater than 750 MMcf/d of throughput capacity moving east-to-west. The Oasis pipeline has many interconnections with other pipelines, power plants, processing facilities, municipalities and producers.
The Oasis pipeline is integrated with ETP’s Southeast Texas System and is an important component to maximizing its Southeast Texas System’s profitability. The Oasis pipeline enhances the Southeast Texas System by (i) providing access for natural gas on the Southeast Texas System to other third party supply and market points and interconnecting pipelines and (ii) allowing ETP to bypass its processing plants and treating facilities on the Southeast Texas System when processing margins are unfavorable by blending untreated natural gas from the Southeast Texas System with gas on the Oasis pipeline while continuing to meet pipeline quality specifications.
HPL System
|
•
|
Capacity of 5.5 Bcf/d
|
|
•
|
Approximately 4,350 miles of natural gas pipeline
|
|
•
|
Bammel storage facility with 62 Bcf of total working gas capacity
|
The HPL System is an extensive network of intrastate natural gas pipelines, an underground Bammel storage reservoir and related transportation assets. The system has access to multiple sources of historically significant natural gas supply reserves from South Texas, the Gulf Coast of Texas, East Texas and the western Gulf of Mexico, and is directly connected to major gas distribution, electric and industrial load centers in Houston, Corpus Christi, Texas City and other cities located along the Gulf Coast of Texas. The HPL System is well situated to gather and transport gas in many of the major gas producing areas in Texas including the strong presence in the key Houston Ship Channel and Katy Hub markets, allowing ETP to play an important role in the Texas natural gas markets. The HPL System also offers its shippers off-system opportunities due to its numerous interconnections with other pipeline systems, its direct access to multiple market hubs at Katy, the Houston Ship Channel and Agua Dulce, and its Bammel storage facility.
The Bammel storage facility has a total working gas capacity of approximately 62 Bcf, a peak withdrawal rate of 1.3 Bcf/d and a peak injection rate of 0.6 Bcf/d. The Bammel storage facility is located near the Houston Ship Channel market area and the Katy Hub and is ideally suited to provide a physical backup for on-system and off-system customers. As of
December 31, 2011
, ETP had approximately 13.7 Bcf committed under fee-based arrangements with third parties and approximately 48.6 Bcf stored in the facility for its own account.
East Texas Pipeline
|
•
|
Capacity of 2.4 Bcf/d
|
|
•
|
Approximately 370 miles of natural gas pipeline
|
The East Texas pipeline connects three treating facilities, one of which ETP owns, with its Southeast Texas System. The East Texas pipeline was the first phase of a multi-phased project that increased service to producers in East and North Central Texas and provided access to the Katy Hub. The East Texas pipeline expansions include the 36-inch East Texas extension to connect its Reed compressor station in Freestone County to its Grimes County compressor station, the 36-inch Katy expansion connecting Grimes to the Katy Hub, and the 42-inch Southeast Bossier pipeline connecting its Cleburne to Carthage pipeline to the HPL System. Key shippers on the East Texas pipeline include XTO and EnCana with an average of 540,000 MMBtu/d and 200,000 MMBtu/d, respectively.
Interstate Transportation Operations
The following details ETP’s pipelines in its interstate transportation operations.
Transwestern Pipeline
|
•
|
Capacity of 2.1 Bcf/d
|
|
•
|
Approximately 2,690 miles of interstate natural gas pipeline
|
|
•
|
Bi-directional capabilities
|
The Transwestern pipeline is an open-access interstate natural gas pipeline extending from the gas producing regions of West
8
Texas, eastern and northwestern New Mexico, and southern Colorado primarily to pipeline interconnects off the east end of its system and to pipeline interconnects at the California border. The Transwestern pipeline has access to three significant gas basins: the Permian Basin in West Texas and eastern New Mexico; the San Juan Basin in northwestern New Mexico and southern Colorado; and the Anadarko Basin in the Texas and Oklahoma panhandle. Natural gas sources from the San Juan Basin and surrounding producing areas can be delivered eastward to Texas intrastate and mid-continent connecting pipelines and natural gas market hubs as well as westward to markets in Arizona, Nevada and California. Transwestern’s Phoenix lateral pipeline, with a throughput capacity of 500 MMcf/d, connects the Phoenix area to the Transwestern mainline.
Transwestern’s customers include local distribution companies, producers, marketers, electric power generators and industrial end-users. Transwestern transports natural gas in interstate commerce.
Tiger Pipeline
|
•
|
Capacity of 2.4 Bcf/d
|
|
•
|
Approximately 195 miles of interstate natural gas pipeline
|
|
•
|
Bi-directional capabilities
|
The Tiger pipeline is an approximately 195-mile interstate natural gas pipeline that connects to our dual 42-inch pipeline system near Carthage, Texas, extends though the heart of the Haynesville Shale and ends near Delhi, Louisiana, with interconnects to at least seven interstate pipelines at various points in Louisiana. The pipeline has a capacity of 2.4 Bcf/d, all of which is sold under long-term contracts ranging from 10 to 15 years.
Fayetteville Express Pipeline
|
•
|
Capacity of 2.0 Bcf/d
|
|
•
|
Approximately 185 miles of interstate natural gas pipeline
|
|
•
|
50/50 joint venture with Kinder Morgan Energy Partners, L.P. (“KMP”)
|
The Fayetteville Express pipeline is an approximately 185-mile interstate natural gas pipeline that originates near Conway County, Arkansas, continues eastward through White County, Arkansas and terminates at an interconnect with Trunkline Gas Company in Panola County, Mississippi. The pipeline has long-term contracts for 1.85 Bcf/d ranging from 10 to 12 years. The Fayetteville Express pipeline is a 50/50 joint venture with KMP.
Midstream Operations
The following details ETP’s assets in its midstream operations.
Southeast Texas System
|
•
|
Approximately 5,540 miles of natural gas pipeline
|
|
•
|
One natural gas processing plant (the La Grange plant) with aggregate capacity of 210 MMcf/d
|
|
•
|
12 natural gas treating facilities with aggregate capacity of 1.6 Bcf/d
|
|
•
|
Four natural gas conditioning facilities with aggregate capacity of 650 MMcf/d
|
The Southeast Texas System is an integrated system that gathers, compresses, treats, processes and transports natural gas from the Austin Chalk trend. The La Grange processing plant also processes rich gas from the Eagle Ford Shale. The Southeast Texas System is a large natural gas gathering system covering thirteen counties between Austin and Houston. This system is connected to the Katy Hub through the East Texas pipeline and is connected to the Oasis pipeline, as well as two power plants. This allows ETP to bypass its processing plants and treating facilities when processing margins are unfavorable by blending untreated natural gas from the Southeast Texas System with natural gas on the Oasis pipeline while continuing to meet pipeline quality specifications.
The La Grange processing plant is a cryogenic natural gas processing plant that processes the rich natural gas that flows through ETP’s system to produce residue gas and NGLs.
ETP’s treating facilities remove carbon dioxide and hydrogen sulfide from natural gas gathered into its system before the natural gas is introduced to transportation pipelines to ensure that the gas meets pipeline quality specifications. In addition, ETP’s conditioning facilities remove heavy hydrocarbons from the gas gathered into ETP’s systems so the gas can be redelivered and meet downstream pipeline hydrocarbon dew point specifications.
9
North Texas System
|
•
|
Approximately 160 miles of natural gas pipeline
|
|
•
|
One natural gas processing plant (the Godley plant) with aggregate capacity of 480 MMcf/d
|
|
•
|
One natural gas conditioning facility with capacity of 100 MMcf/d
|
The North Texas System is an integrated system located in four counties in North Texas that gathers, compresses, treats, processes and transports natural gas from the Barnett Shale trend. The system includes ETP’s Godley processing plant, which processes rich natural gas produced from the Barnett Shale and is integrated with the North Texas System and the ET Fuel System. The facility consists of a cryogenic processing plant and a conditioning facility.
Canyon Gathering System
|
•
|
Approximately 1,390 miles of natural gas pipeline
|
|
•
|
Five natural gas conditioning facilities with aggregate capacity of 96 MMcf/d
|
The Canyon Gathering System consists of gathering pipeline ranging in diameters from two inches to 24 inches in the Piceance and Uinta Basins of Colorado and Utah and conditioning plants.
Northern Louisiana
|
•
|
Approximately 240 miles of natural gas pipeline
|
|
•
|
Three natural gas treating facilities with aggregate capacity of 385 MMcf/d
|
ETP’s Northern Louisiana assets comprise several gathering systems in the Haynesville Shale with access to multiple markets through interconnects with several pipelines, including ETP’s Tiger pipeline. ETP’s Northern Louisiana assets include the Bistineau, Creedence, and Tristate Systems.
Other Midstream Assets
ETP’s midstream operations also includes its interests in various midstream assets located in Texas, New Mexico and Louisiana, with gathering pipelines aggregating a combined capacity of approximately 115 MMcf/d, as well as one conditioning facility. ETP also owns gathering pipelines serving the Marcellus Shale in West Virginia with aggregate capacity of approximately 250 MMcf/d.
Marketing Operations
ETP conducts marketing operations in which it markets the natural gas that flows through its gathering and intrastate transportation assets, referred to as on-system gas. ETP also attracts other customers by marketing volumes of natural gas that do not move through its assets, referred to as off-system gas. For both on-system and off-system gas, ETP purchases natural gas from natural gas producers and other suppliers and sell that natural gas to utilities, industrial consumers, other marketers and pipeline companies, thereby generating gross margins based upon the difference between the purchase and resale prices of natural gas, less the costs of transportation.
For the off-system gas, ETP purchases gas or acts as an agent for small independent producers that may not have marketing operations. ETP develops relationships with natural gas producers to facilitate the purchase of their production on a long-term basis. ETP believes that this business provides it with strategic insight and market intelligence, which may positively impact its expansion and acquisition strategy.
NGL Transportation and Services
The following details ETP's assets in its NGL transportation and services operations. All assets described below are owned by Lone Star, in which ETP has a 70% interest.
West Texas System
|
•
|
Capacity of 137,000 Bbls
|
|
•
|
Approximately 1,170 miles of NGL transmission pipelines
|
The West Texas System is an intrastate NGL pipeline consisting of 3-inch to 16-inch long-haul, mixed NGLs transportation pipeline that delivers 137,000 Bbls of capacity from the Regency Waha Processing Plant in the Permian Basin and our Godley Processing Plant in the Barnett Shale to the Mont Belvieu NGL storage facility.
10
Mont Belvieu Storage Facility
|
•
|
Working storage capacity of approximately 43 million Bbls
|
|
•
|
Approximately 140 miles of NGL transmission pipelines
|
The Mont Belvieu storage facility is an integrated liquids storage facility with over 43 million Bbls of salt dome capacity and 23 million Bbls of brine pond capacity, providing 100% fee-based cash flows. The Mont Belvieu storage facility has access to multiple NGL and refined product pipelines, the Houston Ship Channel trading hub, and numerous chemical plants, refineries and fractionators.
Hattiesburg Storage Facility
|
•
|
Working storage capacity of four million Bbls
|
The Hattiesburg storage facility is an integrated liquids storage facility with approximately four million Bbls of salt dome capacity, providing 100% fee-based cash flows.
Sea Robin Processing Plant
|
•
|
One cryogenic processing plant (the Chalmette Plant) with 850 MMcf/d residue capacity and 26,000 Bbls/d NGL capacity
|
|
•
|
20% non-operating interest held by Lone Star
|
Sea Robin is a cryogenic rich gas processing plant located on the Sea Robin Pipeline in southern Louisiana. The plant, which is connected to nine interstate and four intrastate residue pipelines as well as various deep-water production fields, has a residue capacity of 850MMcf/d and an NGL capacity of 26,000 Bbls/d.
Refinery Services
|
•
|
One cryogenic processing plant (the Chalmette Plant) with 54 MMcf/d capacity
|
|
•
|
One cryogenic processing plant (the Sorrento Plant) with 28 MMcf/d capacity
|
|
•
|
One NGL fractionator with 25,000 Bbls/d capacity
|
|
•
|
Approximately 100 miles of NGL pipelines
|
Refinery Services consists of a refinery off-gas processing and "O-grade" NGL fractionation complex located along the Mississippi River refinery corridor in southern Louisiana that cryogenically processes refinery off-gas and fractionates the Ograde NGL stream into its higher value components. The O-grade fractionator located in Geismar, Louisiana is connected by approximately 100 miles of pipeline to the Sorrento and Chalmette cryogenic processing plants.
Investment in Regency
The following details the assets in Regency’s natural gas operations:
Gathering, Treating and Processing Operations
Regency operates gathering and processing assets in four geographic regions of the United States: North Louisiana, the mid-continent region of the United States, South Texas and West Texas. Regency contracts with producers to gather raw natural gas from individual wells or central receipt points, which may have multiple wells behind them, located near its processing plants, treating facilities and/or gathering systems. Following the execution of a contract, Regency connects wells and central delivery points to its gathering lines through which the raw natural gas flows to a processing plant, treating facility or directly to interstate or intrastate gas transportation pipelines. At its processing plants and treating facilities, Regency removes impurities from the raw natural gas stream and extracts the NGLs. Regency also performs a producer service function, whereby it purchases natural gas from producers at gathering systems and plants and sells this gas at downstream outlets.
All raw natural gas flowing through Regency’s gathering and processing facilities is supplied under gathering and processing contracts having terms ranging from month-to-month to the life of the oil and gas lease.
The pipeline-quality natural gas remaining after separation of NGLs through processing is either returned to the producer or sold, for Regency’s own account or for the account of the producer, at the tailgates of Regency’s processing plants for delivery to interstate or intrastate gas transportation pipelines.
11
North Louisiana Region
|
•
|
Approximately 442 miles of natural gas pipeline
|
|
•
|
Two cryogenic natural gas processing facilities, a refrigeration plant, a conditioning plant and two amine treating plants
|
Regency’s North Louisiana assets gather, compress, treat and dehydrate natural gas in five Parishes (Claiborne, Union, DeSoto, Lincoln and Ouachita) of North Louisiana and Shelby County, Texas.
Through the gathering and processing systems described above and their interconnections with HPC’s pipeline system in North Louisiana, Regency offers producers wellhead-to-market services, including natural gas gathering, compression, processing, treating and transportation.
South Texas Region
|
•
|
Approximately 565 miles of natural gas pipeline
|
|
•
|
Two treating plants
|
Regency’s South Texas assets gather, compress, treat and dehydrate natural gas in LaSalle, Webb, Karnes, Atascosa, McMullen, Frio and Dimmitt counties. Some of the natural gas produced in this region can have significant quantities of hydrogen sulfide and carbon dioxide that require treating to remove these impurities. The pipeline systems that gather this gas are connected to third-party processing plants and Regency’s treating facilities that include an acid gas reinjection well located in McMullen County, Texas.
The natural gas supply for Regency’s South Texas gathering systems is derived from a combination of natural gas wells located in a mature basin that generally have long lives and predictable gas flow rates and the NGL-rich Eagle Ford Shale formation, which lies directly under Regency’s existing South Texas gathering system infrastructure.
One of Regency’s treating plants consists of inlet gas compression, a 60 MMcf/d amine treating unit, a 55 MMcf/d amine treating unit and a 40 ton (per day) liquid sulfur recovery unit. This plant removes hydrogen sulfide from the natural gas stream, recovers condensate, delivers pipeline quality gas at the plant outlet and reinjects acid gas. In January 2012, Regency completed an expansion of the treating plant, adding an incremental 20 MMcf/d of treating capacity to the facility.
In June 2011, Regency entered into agreements to provide gas and condensate gathering services for a producer in the Eagle Ford Shale and to construct facilities to perform these services, including a wellhead gathering system, at an expected cost of approximately $450 million. The expansion will be owned and operated by Regency and will connect with its existing gathering system. The expansion is scheduled to be completed in phases by 2014. Upon its completion, Regency's entire South Texas system will be capable of gathering, compressing, treating and transporting up to 1 Bcf/d of natural gas and 26,500 Bbls/d of condensate to downstream outlets.
Regency owns a 60% interest in an entity that includes a treating plant in Atascosa County with a 500 gallons per minute amine treater, pipeline interconnect facilities and approximately 13 miles of 10-inch pipeline. Tailsman Energy USA Inc. and Statoil Texas Onshore Properties LP own the remaining 40% interest. Regency operates this plant and the pipeline for the joint venture while its joint venture partner operates a lean gas gathering system in the Edwards Lime natural gas trend that delivers to this system.
West Texas Region
|
•
|
Approximately 806 miles of natural gas pipeline
|
|
•
|
One cryogenic natural gas processing plant
|
Regency’s West Texas gathering system assets offer wellhead-to-market services to producers in Ward, Winkler, Reeves, and Pecos counties, which surround the Waha Hub, one of Texas’ major NGL-rich natural gas market areas. As a result of the proximity of Regency’s system to the Waha Hub, the Waha gathering system has a variety of market outlets for the natural gas that Regency gathers and processes, including several major interstate pipelines serving California, the mid-continent region of the United States and Texas natural gas markets. The NGL market outlets include Lone Star's West Texas NGL pipeline.
Regency offers producers four different levels of natural gas compression on the Waha gathering system, as compared to the two levels typically offered in the industry. By offering multiple levels of compression, Regency’s gathering system is often more cost-effective for its producers, since the producer is typically not required to pay for a level of compression that is higher than the level they require.
12
The Waha cryogenic natural gas processing plant processes raw natural gas gathered in the Waha gathering system. The Waha processing plant also includes an amine treating facility, which removes carbon dioxide and hydrogen sulfide from raw natural gas gathered before moving the natural gas to the processing plant. The acid gas is injected underground.
Mid-Continent Region
|
•
|
Approximately 3,470 miles of natural gas pipeline
|
|
•
|
One processing plant
|
Regency’s mid-continent assets include natural gas gathering systems located primarily in Kansas and Oklahoma. Regency’s mid-continent gathering assets are extensive systems that gather, compress and dehydrate low-pressure gas from approximately 1,500 wells. These systems are geographically concentrated, with each central facility located within 90 miles of the others. Regency operates its mid-continent gathering systems at low pressures to maximize the total throughput volumes from the connected wells. Wellhead pressures are therefore adequate to allow for flow of natural gas into the gathering lines without the cost of wellhead compression.
Regency also owns the Hugoton gathering system that has approximately 1,875 miles of pipeline extending over nine counties in Kansas and Oklahoma. This system is operated by a third party.
Regency’s mid-continent systems are located in two of the largest and most prolific natural gas producing regions in the United States, the Hugoton Basin in Southwest Kansas and the Anadarko Basin in western Oklahoma. These mature basins have continued to provide generally long-lived, predictable production volume.
Joint Ventures Operations
Regency owns four investments in joint ventures:
|
•
|
A 49.99% general partner interest in its RIGS Haynesville Partnership Co. joint venture (“HPC”), which owns Regency Intrastate Gas System (“RIGS”), a 450 mile intrastate pipeline that delivers natural gas from Northwest Louisiana to downstream pipelines and markets;
|
|
•
|
a 50% membership interest in Midcontinent Express Pipeline LLC (“MEP”), which owns an interstate natural gas pipeline with approximately 500 miles stretching from Southeast Oklahoma through Northeast Texas, northern Louisiana and Central Mississippi to an interconnect with the Transcontinental Gas Pipe Line system in Butler, Alabama;
|
|
•
|
a 30% membership interest in Lone Star, an entity owning a diverse set of midstream energy assets including NGL pipelines, storage, fractionation and processing facilities located in Texas, Mississippi and Louisiana; and
|
|
•
|
a 33.33% interest in Ranch JV, which, upon completion of construction in the fourth quarter of 2012, will process natural gas delivered from the NGL-rich Bone Spring and Avalon Shale formations in West Texas.
|
Contract Compression Operations
The natural gas contract compression operations include designing, sourcing, owning, installing, operating, servicing, repairing and maintaining compressors and related equipment for which Regency guarantees its customers 98% mechanical availability for land installations and 96% mechanical availability for over-water installations. Regency focuses on meeting the complex requirements of field-wide compression applications, as opposed to targeting the compression needs of individual wells within a field. These field-wide applications include compression for natural gas gathering and natural gas processing. Regency believes that it improves the stability of its cash flow by focusing on field-wide compression applications because such applications generally involve long-term installations of multiple large horsepower compression units. Regency’s contract compression operations are primarily located in Texas, Louisiana, Arkansas, Pennsylvania and California.
Contract Treating Operations
Regency owns and operates a fleet of equipment used to provide treating services, such as carbon dioxide and hydrogen sulfide removal, natural gas cooling, dehydration and Btu management, to natural gas producers and midstream pipeline companies. Regency’s contract treating operations are primarily located in Texas, Louisiana and Arkansas.
Other Operations
Regency’s other operations comprise of a small regulated pipeline. The regulated pipeline owns and operates an interstate pipeline that consists of 10 miles of pipeline that extends from Harrison County, Texas to Caddo Parish, Louisiana.
13
Industry Overview
The following is a discussion of the different industries in which our subsidiaries operate. ETP and Regency both have natural gas operations.
The midstream natural gas industry is the link between the exploration and production of natural gas and the delivery of its components to end-use markets. The midstream industry consists of natural gas gathering, compression, treating, processing and transportation and NGL fractionation and transportation, and is generally characterized by regional competition based on the proximity of gathering systems and processing plants to natural gas producing wells.
Natural gas has widely varying quality and composition, depending on the field, the formation or the reservoir from which it is produced. The principal constituents of natural gas are methane and ethane, though most natural gas also contains varying amounts of heavier components, such as propane, butane and natural gasoline that may be removed by a number of processing methods. Most raw materials produced at the wellhead are not suitable for long-haul pipeline transportation or commercial use and must be compressed, transported via pipeline to a central processing facility, and then processed to remove the heavier hydrocarbon components and other contaminants that would interfere with pipeline transportation or the end use of the gas.
Natural gas and crude oil produced at the wellhead contain varying amounts of mixed NGLs. After extraction by a processing plant the mixed NGLs are transported to a facility for fractionation into NGL products such as ethane, propane, butane, and natural gasoline. The NGL products are then delivered to end-users through pipelines, trucks, rail car and barges. End-users of NGL products include petrochemical, refining companies, and end-use propane customers.
Demand for natural gas.
Natural gas continues to be a critical component of energy consumption in the United States. According to data released in December 2010 by the Energy Information Administration, total domestic consumption of natural gas is expected to rise to 26.5 Tcf in 2035, compared to 2010 consumption of 24.1 Tcf. The industrial and electricity generation sectors currently account for more than half of natural gas usage in the United States.
Natural gas gathering.
The natural gas gathering process begins with the drilling of wells into gas-bearing rock formations. Once a well has been completed, the well is connected to a gathering system. Gathering systems generally consist of a network of small diameter pipelines and, if necessary, compression systems that collect natural gas from points near producing wells and transport it to larger pipelines for further transportation.
Natural gas compression.
Gathering systems are operated at design pressures that will maximize the total throughput from all connected wells. Specifically, lower pressure gathering systems allow wells, which produce at progressively lower field pressures as they age, to remain connected to gathering systems and to continue to produce for longer periods of time. As the pressure of a well declines, it becomes increasingly difficult to deliver the remaining production in the ground against a higher pressure that exists in the connecting gathering system. Field compression is typically used to lower the pressure of a gathering system. If field compression is not installed, then the remaining production in the ground will not be produced because it cannot overcome the higher gathering system pressure. In contrast, if field compression is installed, then a well can continue delivering production that otherwise might not be produced.
Natural gas treating.
Natural gas has a varied composition depending on the field, the formation and the reservoir from which it is produced. Natural gas from certain formations is higher in carbon dioxide, hydrogen sulfide or certain other contaminants. Treating plants remove carbon dioxide and hydrogen sulfide from natural gas to ensure that it meets pipeline quality specifications.
Natural gas processing.
Some natural gas produced by a well does not meet the pipeline quality specifications established by downstream pipelines or is not suitable for commercial use and must be processed to remove the mixed NGL stream. In addition, some natural gas produced by a well, while not required to be processed, can be processed to take advantage of favorable processing margins. Natural gas processing involves the separation of natural gas into pipeline quality natural gas, or residue gas, and a mixed NGL stream.
Natural gas transportation
. Natural gas transportation pipelines receive natural gas from other mainline transportation pipelines and gathering systems and deliver the natural gas to industrial end-users, utilities and other pipelines.
NGL transportation.
NGL transportation pipelines transport mixed NGLs and other hydrocarbons from natural gas processing facilities to fractionation plants and storage facilities.
NGL storage.
NGL storage facilities are used for the storage of mixed NGLs, NGL products and petrochemical products owned by third-parties in storage tanks and underground wells, which allow for the injection and withdrawal of such products at various times of the year to meet demand cycles.
14
NGL Fractionation and Processing.
NGL fractionators separate mixed NGL streams into purity products, such as ethane, propane, normal butane, isobutane and natural gasoline.
Competition
The business of providing natural gas gathering, compression, treating, transporting, storing and marketing services is highly competitive. Since pipelines are generally the only practical mode of transportation for natural gas over land, the most significant competitors of ETP’s and Regency’s transportation and storage operations are other pipelines. ETP and Regency also compete with each other. Pipelines typically compete with each other based on location, capacity, price and reliability.
ETP and Regency face competition with respect to retaining and obtaining significant natural gas supplies under terms favorable to them for the gathering, treating and marketing portions of their businesses. ETP’s and Regency’s competitors include major integrated oil companies, interstate and intrastate pipelines and companies that gather, compress, treat, process, transport and market natural gas. Many of ETP’s and Regency’s competitors, such as major oil and gas and pipeline companies, have substantially greater capital resources and control of supplies of natural gas.
In markets served by ETP's and Regency's NGL pipelines, they face competition with other pipeline companies and barge, rail and truck fleet operations. ETP and Regency face competition with other storage facilities based on fees charged and their ability to receive and distribute their customer's products.
In marketing natural gas, ETP and Regency have numerous competitors, including marketing affiliates of interstate pipelines, major integrated oil companies, and local and national natural gas gatherers, brokers and marketers of widely varying sizes, financial resources and experience. Local utilities and distributors of natural gas are, in some cases, engaged directly, and through affiliates, in marketing activities that compete with ETP’s and Regency’s marketing operations.
Credit Risk and Customers
ETP and Regency maintain credit policies with regard to their counterparties that they believe significantly reduce overall credit risk. These policies include an evaluation of potential counterparties’ financial condition (including credit ratings), collateral requirements under certain circumstances and the use of standardized agreements which allow for netting of positive and negative exposure associated with a single counterparty.
ETP’s and Regency’s counterparties consist primarily of petrochemical companies and other industrials, small to major oil and gas producers, midstream and power generation companies. This concentration of counterparties may impact ETP’s and Regency’s overall exposure to credit risk, either positively or negatively in that the counterparties may be similarly affected by changes in economic, regulatory or other conditions. Currently, the management of ETP and the management of Regency do not anticipate a material adverse effect on financial position or results of operations as a result of counterparty performance. ETP and Regency are diligent in attempting to ensure that they issue credit to credit-worthy customers. However, ETP’s and Regency’s purchase and resale of gas exposes them to significant credit risk, as the margin on any sale is generally a very small percentage of the total sale price. Therefore, a credit loss could be significant to ETP’s or Regency’s overall profitability.
During the year ended
December 31, 2011
, no individual customer accounted for more than 10% of ETE’s revenues.
Regulation
Regulation of Interstate Natural Gas Pipelines.
FERC has broad regulatory authority over the business and operations of interstate natural gas pipelines. Under the Natural Gas Act (“NGA”), FERC generally regulates the transportation of natural gas in interstate commerce. For FERC regulatory purposes, “transportation” includes natural gas pipeline transmission (forwardhauls and backhauls), storage, and other services. The Transwestern, Tiger and Gulf States pipelines transport natural gas in interstate commerce and thus qualify as a “natural gas companies” under the NGA subject to FERC’s regulatory jurisdiction. ETP also holds a joint venture interest in the Fayetteville Express pipeline and Regency owns an indirect 50% interest in the entity that owns and operates the Midcontinent Express pipeline. Both of these are NGA-jurisdictional interstate transportation systems subject to the FERC’s broad regulatory oversight.
The FERC’s NGA authority includes, among other things, the power to regulate:
|
•
|
the certification and construction of new facilities;
|
|
•
|
the review and approval of transportation rates;
|
|
•
|
the types of services that ETP’s and Regency’s regulated assets are permitted to perform;
|
|
•
|
the terms and conditions associated with these services;
|
15
|
•
|
the extension or abandonment of services and facilities;
|
|
•
|
the maintenance of accounts and records;
|
|
•
|
the acquisition and disposition of facilities; and
|
|
•
|
the initiation and discontinuation of services.
|
Under the NGA, interstate natural gas companies must charge rates that are just and reasonable. In addition, the NGA prohibits natural gas companies from unduly preferring or unreasonably discriminating against any person with respect to pipeline rates or terms and conditions of service.
Under the terms of a prior settlement, Transwestern was required to file a new NGA Section 4 general rate case no later than October 1, 2011. However, on September 2, 2011, the FERC granted Transwestern's request for an extension of the filing date until December 1, 2011. On September 21, 2011, in lieu of filing a new rate case, Transwestern filed a proposed settlement with the FERC, which was approved by the FERC on October 31, 2011. In general, the settlement provides for the continued use of Transwestern's currently effective transportation and fuel tariff rates, with the exception of certain San Juan Lateral fuel rates which will be reduced over a three year period beginning in April 2012. The settlement also resolves certain non-rate matters, and approves Transwestern's use of certain previously approved accounting methodologies. Under the settlement, Transwestern is required to file a new NGA Section 4 rate case on or before October 1, 2014.
In December 2009, the FERC issued an order granting Fayetteville Express Pipeline LLC (“FEP”) authorization to construct and operate the Fayetteville Express pipeline, subject to certain conditions, and FEP accepted the FERC’s certificate. Interim service began on the Fayetteville Express pipeline in the fourth quarter of 2010 and commenced service to all of its firm shippers on December 1, 2010, with the primary term of each firm shipper’s contract commencing by January 1, 2011. The rates charged for services on the Fayetteville Express pipeline are largely governed by long-term negotiated rate agreements. In the certificate order, the FERC also approved cost-based recourse rates available to prospective shippers as an alternative to negotiated rates.
In April 2010, the application for authority to construct the Tiger pipeline was approved by the FERC and field construction began on the pipeline in June 2010. The Tiger pipeline was placed in service on December 1, 2010. The rates charged for services on the Tiger pipeline are largely governed by long-term negotiated rate agreements. In June 2010, ETP filed an application for authority to construct and operate a 0.4 Bcf/d expansion of the Tiger pipeline with the FERC and in February 2011 ETP accepted the FERC’s certificate order authorizing the construction and operation of this expansion and the rate-related arrangements for the services to be provided on this expansion. The expansion was placed in service on August 1, 2011.
The maximum rates to be charged by NGA-jurisdictional natural gas companies and their terms and conditions for service are generally required to be on file with the FERC in FERC-approved tariffs. Most natural gas companies are authorized to offer discounts from their FERC-approved maximum just and reasonable rates when competition warrants such discounts. Natural gas companies are also generally permitted to offer negotiated rates different from rates established in their tariff if, among other requirements, such companies’ tariffs offer a cost-based recourse rate available to a prospective shipper as an alternative to the negotiated rate. Natural gas companies must make offers of rate discounts and negotiated rates on a basis that is not unduly discriminatory. Existing tariff rates may be challenged by complaint, and if found unjust and unreasonable, may be altered on a prospective basis by the FERC. ETP and Regency cannot guarantee that the FERC will continue to pursue its approach of pro-competitive policies as it considers matters such as pipeline rates and rules and policies that may affect rights of access to natural gas transportation capacity, transportation and storage facilities.
Pursuant to the FERC’s rules promulgated under the Energy Policy Act of 2005, it is unlawful for any entity, directly or indirectly, in connection with the purchase or sale of electric energy or natural gas or the purchase or sale of transmission or transportation services subject to FERC jurisdiction: (1) to defraud using any device, scheme or artifice; (2) to make any untrue statement of material fact or omit a material fact; or (3) to engage in any act, practice or course of business that operates or would operate as a fraud or deceit. The Commodity Futures Trading Commission (“CFTC”) also holds authority to monitor certain segments of the physical and futures energy commodities market pursuant to the Commodity Exchange Act (“CEA”). With regard to ETP’s and Regency’s physical purchases and sales of natural gas, NGLs or other energy commodities; their gathering or transportation of these energy commodities; and any related hedging activities that they undertake, ETP and Regency are required to observe these anti-market manipulation laws and related regulations enforced by FERC and/or the CFTC. These agencies hold substantial enforcement authority, including the ability to assess civil penalties of up to $1 million per day per violation, to order disgorgement of profits and to recommend criminal penalties. Should ETP or Regency violate the anti-market manipulation laws and regulations, they could also be subject to related third-party damage claims by, among others, sellers, royalty owners and taxing authorities.
Failure to comply with the NGA, the Energy Policy Act of 2005 and the other federal laws and regulations governing ETP’s and Regency’s operations and business activities can result in the imposition of administrative, civil and criminal remedies.
16
Regulation of Intrastate Natural Gas and NGL Pipelines.
Intrastate transportation of natural gas and NGLs is largely regulated by the state in which such transportation takes place. To the extent that ETP’s or Regency’s intrastate natural gas transportation systems transport natural gas in interstate commerce, the rates, terms and conditions of such services are subject to FERC jurisdiction under Section 311 of the Natural Gas Policy Act (“NGPA”). The NGPA regulates, among other things, the provision of transportation services by an intrastate natural gas pipeline on behalf of a local distribution company or an interstate natural gas pipeline. The rates, terms and conditions of some transportation and storage services provided on the Oasis pipeline, HPL System, East Texas pipeline and ET Fuel System are subject to FERC regulation pursuant to Section 311 of the NGPA. Under Section 311, rates charged for intrastate transportation must be fair and equitable, and amounts collected in excess of fair and equitable rates are subject to refund with interest. The terms and conditions of service set forth in the intrastate facility’s statement of operating conditions are also subject to FERC review and approval. Should the FERC determine not to authorize rates equal to or greater than ETP’s or Regency’s currently approved Section 311 rates, ETP’s or Regency’s business may be adversely affected. Failure to observe the service limitations applicable to transportation and storage services under Section 311, failure to comply with the rates approved by the FERC for Section 311 service, and failure to comply with the terms and conditions of service established in the pipeline’s FERC approved statement of operating conditions could result in an alteration of jurisdictional status, and/or the imposition of administrative, civil and criminal remedies.
The FERC has adopted market-monitoring and annual reporting regulations, which regulations are applicable to many intrastate pipelines as well as other entities that are otherwise not subject to the FERC’s NGA jurisdiction such as natural gas marketers. These regulations are intended to increase the transparency of wholesale energy markets, to protect the integrity of such markets, and to improve FERC’s ability to assess market forces and detect market manipulation. The FERC has also issued regulations requiring interstate pipelines and certain major non-interstate pipelines to post, on a daily basis, capacity, scheduled flow information and actual flow information. As these posting requirements for major non-interstate pipelines have been vacated on appeal by the U.S. 5
th
Circuit Court of Appeals, it is not known with certainty whether and to what extent the FERC will continue to attempt to impose such posting requirements. Should the FERC succeed in reimposing these or similar regulations we could be subject to further costs and administrative burdens, none of which are expected to have a material impact on its operations.
Intrastate natural gas operations in Texas are also subject to regulation by various agencies in Texas, principally the Texas Railroad Commission (“TRRC”). ETP’s intrastate pipeline and storage operations in Texas are also subject to the Texas Utilities Code, as implemented by the TRRC. Generally, the TRRC is vested with authority to ensure that rates, operations and services of gas utilities, including intrastate pipelines, are just and reasonable and are not discriminatory. The rates charged for transportation services are deemed just and reasonable under Texas law unless challenged in a customer or TRRC complaint. We cannot predict whether such a complaint will be filed against our subsidiaries or whether the TRRC will change its regulation of these rates. Failure to comply with the Texas Utilities Code can result in the imposition of administrative, civil and criminal remedies.
Regency’s RIGS system is subject to regulation by various agencies of the State of Louisiana. Louisiana’s Pipeline Operations Section of the Department of Natural Resources’ Office of Conservation is generally responsible for regulating intrastate pipelines and gathering facilities in Louisiana and has authority to review and authorize natural gas transportation transactions and the construction, acquisition, abandonment and interconnection of physical facilities. Historically, apart from pipeline safety, it has not acted to exercise this jurisdiction respecting gathering facilities. Louisiana also has agencies that regulate transportation rates, service terms and conditions and contract pricing to ensure their reasonableness and to ensure that the intrastate pipeline companies that they regulate do not discriminate among similarly situated customers.
Regulation of Sales of Natural Gas and NGLs.
The price at which ETP and Regency buy and sell natural gas currently is not subject to federal regulation and, for the most part, is not subject to state regulation. The price at which ETP and Regency sell NGLs is not subject to federal or state regulation.
To the extent that ETP and Regency enter into transportation contracts with natural gas pipelines that are subject to FERC regulation, they are subject to FERC requirements related to use of such capacity. Any failure on ETP’s or Regency’s part to comply with the FERC’s regulations and policies, or with an interstate pipeline’s tariff, could result in the imposition of civil and criminal penalties.
ETP’s and Regency’s sales of natural gas are affected by the availability, terms and cost of pipeline transportation. As noted above, the price and terms of access to pipeline transportation are subject to extensive federal and state regulation. FERC is continually proposing and implementing new rules and regulations affecting those segments of the natural gas industry. These initiatives also may affect the intrastate transportation of natural gas under certain circumstances. The stated purpose of many of these regulatory changes is to promote competition among the various sectors of the natural gas industry and these initiatives generally reflect more light-handed regulation. ETP and Regency cannot predict the ultimate impact of these regulatory changes to its natural gas marketing operations, and we note that some of the FERC’s regulatory changes may adversely affect the availability and reliability of interruptible transportation service on interstate pipelines. ETP and Regency do not believe that they will be affected by any such FERC action in a manner that is materially different from other natural gas marketers with whom they compete.
17
Regulation of Gathering Pipeline.
Section 1(b) of the NGA exempts natural gas gathering facilities from the jurisdiction of the FERC under the NGA. ETP owns a number of natural gas pipelines in Texas, Louisiana, Colorado, West Virginia and Utah that it believes meet the traditional tests the FERC has used to establish a pipeline’s status as a gatherer not subject to FERC jurisdiction. However, the distinction between FERC-regulated transmission services and federally unregulated gathering services has been the subject of substantial litigation and varying interpretations, so the classification and regulation of ETP’s gathering facilities could be subject to change based on future determinations by the FERC and the courts. State regulation of gathering facilities generally includes various safety, environmental and, in some circumstances, nondiscriminatory take requirements and complaint-based rate regulation.
In Texas, ETP’s and Regency’s gathering facilities are subject to regulation by the TRRC under the Texas Utilities Code in the same manner as described above for their intrastate pipeline facilities. Louisiana’s Pipeline Operations Section of the Department of Natural Resources’ Office of Conservation is generally responsible for regulating intrastate pipelines and gathering facilities in Louisiana and has authority to review and authorize natural gas transportation transactions and the construction, acquisition, abandonment and interconnection of physical facilities.
Historically, apart from pipeline safety, Louisiana has not acted to exercise this jurisdiction respecting gathering facilities. In Louisiana, ETP’s Chalkley System is regulated as an intrastate transporter, and the Louisiana Office of Conservation has determined that its Whiskey Bay System is a gathering system.
ETP and Regency are subject to state ratable take and common purchaser statutes in all of the states in which they operate. The ratable take statutes generally require gatherers to take, without undue discrimination, natural gas production that may be tendered to the gatherer for handling. Similarly, common purchaser statutes generally require gatherers to purchase without undue discrimination as to source of supply or producer. These statutes are designed to prohibit discrimination in favor of one producer over another producer or one source of supply over another source of supply. These statutes have the effect of restricting the right of an owner of gathering facilities to decide with whom it contracts to purchase or transport natural gas.
Natural gas gathering may receive greater regulatory scrutiny at both the state and federal levels. For example, the TRRC has approved changes to its regulations governing transportation and gathering services performed by intrastate pipelines and gatherers, which prohibit such entities from unduly discriminating in favor of their affiliates. Many of the producing states have adopted some form of complaint-based regulation that generally allows natural gas producers and shippers to file complaints with state regulators in an effort to resolve grievances relating to natural gas gathering access and rate discrimination allegations. ETP’s and Regency’s gathering operations could be adversely affected should they be subject in the future to the application of additional or different state or federal regulation of rates and services. ETP’s and Regency’s gathering operations also may be or become subject to safety and operational regulations relating to the design, installation, testing, construction, operation, replacement and management of gathering facilities. Additional rules and legislation pertaining to these matters are considered or adopted from time to time. ETP and Regency cannot predict what effect, if any, such changes might have on their operations, but the industry could be required to incur additional capital expenditures and increased costs depending on future legislative and regulatory changes.
Regulation of Pipeline Safety.
ETP’s and Regency’s pipeline operations are subject to regulation by the U.S. Department of Transportation (“DOT”), under the PHMSA, pursuant to which the PHMSA has established requirements relating to the design, installation, testing, construction, operation, replacement and management of pipeline facilities. In addition, the states in which ETP and Regency conduct operations administer federal pipeline safety standards under the Natural Gas Pipeline Safety Act of 1968, as amended (“NGPSA”), which requires compliance with safety standards during construction and operation of certain the pipelines and subjects the pipelines to regular inspections. Failure to comply with the safety laws and regulations may result in the imposition of administrative, civil and criminal remedies. The “rural gathering exemption” under the NGPSA presently exempts substantial portions of ETP’s and Regency’s gathering facilities from jurisdiction under the NGPSA, but does not apply to intrastate natural gas pipelines. The portions of ETP’s and Regency’s facilities that are exempt include those portions located outside of cities, towns or any area designated as residential or commercial, such as a subdivision or shopping center. Changes to federal pipeline safety laws and regulations are being considered by Congress and the DOT including changes to the “rural gathering exemption,” which may be restricted in the future. Other safety regulations may be made more stringent and penalties could be increased. Such legislative and regulatory changes could have a material effect on ETP's and Regency's operations and costs of transportation service.
In addition to existing pipeline safety regulations, on January 3, 2012, President Obama signed into law the Pipeline Safety, Regulatory Certainty, and Job Creation Act of 2011, that increases pipeline safety regulation. Among other things, the legislation doubles the maximum administrative fines for safety violations from $100,000 to $200,000 for a single violation and from $1 million to $2 million for a related series of violations, and provides that these maximum penalty caps do not apply to civil enforcement actions; permits the DOT Secretary to mandate automatic or remote controlled shut off valves on new or entirely replaced pipelines; requires the DOT Secretary to evaluate whether integrity management system requirements should be expanded
18
beyond high-consequence areas (“HCAs”), within 18 months of enactment; and provides for regulation of carbon dioxide transported by pipeline in a gaseous state and requires the DOT Secretary to prescribe minimum safety regulations for such transportation.
Environmental Matters
The operation of pipelines, plants and other facilities for gathering, compressing, treating, processing, or transporting natural gas, NGLs and other products is subject to stringent and complex federal, state, and local environmental and safety laws and regulations governing the discharge of materials into the environment or otherwise relating to the protection of the environment. These laws and regulations can impair ETP’s and Regency’s business activities that affect the environment in many ways, such as:
|
•
|
restricting how ETP and Regency can release materials or waste products into the air, water, or soils;
|
|
•
|
limiting or prohibiting construction activities in sensitive areas such as wetlands or areas of endangered species habitat, or otherwise constraining how or when construction is conducted;
|
|
•
|
requiring remedial action to mitigate pollution from former operations, or requiring plans and activities to prevent pollution from ongoing operations; and
|
|
•
|
imposing substantial liabilities on ETP and Regency for pollution resulting from its operations, including, for example, potentially enjoining the operations of facilities if it were determined that they did not comply with permit terms.
|
Costs of planning, designing, constructing and operating pipelines, plants and other facilities must incorporate compliance with environmental laws and regulations and safety standards. Failure to comply with these laws and regulations may result in the assessment of administrative, civil and criminal penalties, the imposition of remedial obligations, the issuance of injunctions and the filing of federally authorized citizen suits. ETP and Regency have implemented environmental programs and policies designed to reduce potential liability and costs under applicable environmental laws and regulations.
The clear trend in environmental regulation is to place more restrictions and limitations on activities that may affect the environment. Changes in environmental laws and regulations that result in more stringent waste handling, storage, transport, disposal, or remediation requirements will increase ETP’s and Regency’s costs for performing those activities, and if those increases are sufficiently large, they could have a material adverse effect on its operations and financial position. Moreover, risks of process upsets, accidental releases or spills are associated with ETP’s and Regency’s operations, and ETP and Regency cannot guarantee that they will they not incur significant costs and liabilities if such upsets, releases, or spills were to occur. In the event of future increases in costs, ETP and Regency may be unable to pass on those increases to their customers. While ETP and Regency believe they are in substantial compliance with existing environmental laws and regulations and that continued compliance with current requirements will not have a material adverse effect on ETP or Regency, there is no assurance that this trend will continue in the future.
The Comprehensive Environmental Response, Compensation and Liability Act, as amended (“CERCLA” or “Superfund,”) and comparable state laws, impose liability without regard to fault or the legality of the original conduct on certain classes of persons who are considered to be responsible for the release of a hazardous substance into the environment. One class of “responsible persons” is the current owners or operators of contaminated property, even if the contamination arose as a result of historical operations conducted by previous, unaffiliated occupants of the property. Under CERCLA, “responsible persons” may be subject to joint and several, strict liability for the costs of cleaning up the hazardous substances that have been released into the environment, for damages to natural resources, and for the costs of certain health studies. It also is not uncommon for neighboring landowners and other third parties to file claims for personal injury and property damage allegedly caused by the release of hazardous substances into the environment. Although “petroleum” is excluded from the definition of hazardous substance under CERCLA, ETP will generate materials in the course of its operations that may be regulated as hazardous substances under CERCLA. ETP and Regency also may incur liability under the Resource Conservation and Recovery Act (“RCRA”) which imposes requirements related to the management and disposal of solid and hazardous wastes. While there exists an exclusion from the definition of hazardous wastes for “drilling fluids, produced waters, and other wastes associated with the exploration, development, or production of crude oil, natural gas or geothermal energy,” in the course of ETP’s and Regency’s operations, ETP and Regency may generate certain types of non-excluded petroleum product wastes as well as ordinary industrial wastes such as paint wastes, waste solvents, and waste compressor oils that may be regulated as hazardous or solid wastes.
ETP and Regency currently own or lease, and have in the past owned or leased, numerous properties that for many years have been used for the measurement, gathering, field compression and processing of natural gas and NGLs. Although ETP and Regency used operating and disposal practices that were standard in the industry at the time, petroleum hydrocarbons or wastes may have been disposed of or released on or under the properties owned or leased by ETP or Regency, or on or under other locations where such wastes were taken for disposal. In addition, some of these properties have been operated by third parties whose treatment and disposal or release of petroleum hydrocarbons and wastes was not under ETP’s or Regency’s control. These properties and
19
the materials disposed or released on them may be subject to CERCLA, RCRA and analogous state laws. Under such laws, ETP and Regency could be required to remove or remediate previously disposed wastes or property contamination, or to perform remedial activities to prevent future contamination. A predecessor company acquired by ETP in July 2001 had previously received and responded to a request for information from the United States Environmental Protection Agency (the “EPA”) regarding its potential contribution to widespread groundwater contamination in San Bernardino, California, known as the Newmark Groundwater Contamination Superfund site. ETP has not received any follow-up correspondence from the EPA on the matter since its acquisition of the predecessor company in 2001. In addition, through ETP’s acquisitions of ongoing businesses, ETP is currently involved in several remediation projects that have cleanup costs and related liabilities. As of
December 31, 2011
and
2010
, accruals of
$13.7 million
and
$13.8 million
, respectively, and were recorded in our consolidated balance sheets as accrued and other current liabilities and other non-current liabilities to cover estimated material environmental liabilities including certain matters assumed in connection with ETP’s acquisition of the HPL System, the Transwestern acquisition, potential environmental liabilities for three sites that were formerly owned by Titan Energy Partners, L.P. (“Titan”) or its predecessors and the predecessor owner’s share of certain environmental liabilities of ETC OLP.
Transwestern conducts soil and groundwater remediation at a number of its facilities. Some of the cleanup activities include remediation of several compressor sites on the Transwestern system for contamination by polychlorinated biphenyls (“PCBs”) and the costs of this work are not eligible for recovery in rates. The total accrued future estimated cost of remediation activities expected to continue through 2025 is approximately
$5.7 million
, which is included in the total environmental accruals mentioned above. Transwestern received approval from the FERC for the continuation of rate recovery of projected soil and groundwater remediation costs not related to PCBs for the term of its rate case settlement.
Transwestern, as part of ongoing arrangements with customers, continues to incur costs associated with containing and removing potential PCB contamination. Future costs cannot be reasonably estimated because remediation activities are undertaken as potential claims are made by customers and former customers. However, such future costs are not expected to have a material impact on ETP’s financial position, results of operations or cash flows.
The Federal Water Pollution Control Act of 1972, as amended, also known as the Clean Water Act, and analogous state laws impose restrictions and strict controls regarding the discharge of pollutants into state and federal waters. The discharge of pollutants into regulated waters is prohibited, except in accord with the terms of a permit issued by EPA or the state. Any unpermitted release of pollutants, including NGLs or condensates, from our systems or facilities into regulated waters could result in fines or penalties, as well as significant remedial obligations. ETP and Regency believe that they are in substantial compliance with the Clean Water Act. The regulations were recently modified for the EPA’s Spill Prevention, Control and Countermeasures (“SPCC”) program. ETP and Regency are currently reviewing the impact to our operations and expect to expend resources on tank integrity testing and any associated corrective actions as well as potential upgrades to containment structures. Costs associated with tank integrity testing and resulting corrective actions cannot be reasonably estimated at this time, but we believe such costs will not have a material adverse effect on our financial position, results of operations or cash flows.
The Federal Clean Air Act, as amended, and comparable state laws restrict the emission of air pollutants from many sources, including processing plants and compressor stations. These laws and any implementing regulations may require us to obtain preapproval for the construction or modification of certain projects or facilities expected to produce air emissions, impose stringent air permit requirements or utilize specific equipment or technologies to control emissions. Failure to comply with these laws and regulations could expose us to civil and criminal enforcement actions. We have established agency-approved baseline monitoring of NOx emissions from our Katy Compressor Station in Harris County, Texas, which is in a non-attainment area for ozone. The NOx baseline has been established and we have a sufficient amount of NOx emission allowances that would allow the facility to continue at its current level of operation in the non-attainment area. On March 30, 2010, the Texas Commission on Environmental Quality (“TCEQ”) adopted two revisions to the state implementation plan responding to the EPA’s re-designation of the Houston area to a severe ozone non-attainment area. These revisions will require reductions in current emissions. By March 2013, TCEQ is required to develop a plan to address the recent change in the ozone standard from 0.08 parts per million (“ppm”) to 0.075 ppm. We expect these efforts will result in the adoption of new regulations that may require additional NOx emissions reductions at large emission sources in the Houston-Galveston ozone non-attainment area.
20
In December 2009, the EPA determined that emissions of carbon dioxide, methane and other “greenhouse gases” present an endangerment to public health and the environment because emissions of such gases are, according to the EPA, contributing to warming of the earth’s atmosphere and other climatic changes. Based on these findings, the EPA has begun adopting and implementing regulations to restrict emissions of greenhouse gases under existing provisions of the federal Clean Air Act. The EPA recently adopted two sets of rules regulating greenhouse gas emissions under the Clean Air Act, one of which requires a reduction in emissions of greenhouse gases from motor vehicles and the other of which regulates emissions of greenhouse gases from certain large stationary sources, effective January 2, 2011. The EPA’s rules relating to emissions of greenhouse gases from large stationary sources of emissions are currently subject to a number of legal challenges, but the federal courts have thus far declined to issue any injunctions to prevent the EPA from implementing, or requiring state environmental agencies to implement, the rules.
In addition, the United States Congress has from time to time considered adopting legislation to reduce emissions of greenhouse gases and almost one-half of the states have already taken legal measures to reduce emissions of greenhouse gases primarily through the planned development of greenhouse gas emission inventories and/or regional greenhouse gas cap and trade programs. Most of these cap and trade programs work by requiring major sources of emissions, such as electric power plants, or major producers of fuels, such as refineries and gas processing plants, to acquire and surrender emission allowances. The number of allowances available for purchase is reduced each year in an effort to achieve the overall greenhouse gas emission reduction goal.
The adoption of legislation or regulatory programs to reduce emissions of greenhouse gases could require us to incur increased operating costs, such as costs to purchase and operate emissions control systems, to acquire emissions allowances or comply with new regulatory or reporting requirements. Any such legislation or regulatory programs could also increase the cost of consuming, and thereby reduce demand for, natural gas or NGLs. Consequently, legislation and regulatory programs to reduce emissions of greenhouse gases could have an adverse effect on our business, financial condition and results of operations.
In addition, on October 30, 2009, the EPA published a final rule requiring the reporting of greenhouse gas emissions from specified large greenhouse gas sources in the United States on an annual basis, beginning in 2011 for emissions occurring after January 1, 2010. On November 8, 2010, the EPA adopted an expansion of its greenhouse gas reporting rule to include onshore oil and natural gas production, processing, transmission, storage, and distribution facilities. Under the new rule reporting of greenhouse gas emissions from such facilities, including many of our facilities, is now required on an annual basis, with reporting beginning in 2012 for emissions occurring in 2011.
Some have suggested that one consequence of climate change could be increased severity of extreme weather, such as increased hurricanes and floods. If such effects were to occur, our operations could be adversely affected in various ways, including damages to our facilities from powerful winds or rising waters, or increased costs for insurance. Another possible consequence of climate change is increased volatility in seasonal temperatures. The market for our propane and natural gas is generally improved by periods of colder weather and impaired by periods of warmer weather, so any changes in climate could affect the market for the fuels that we produce. Despite the use of the term “global warming” as a shorthand for climate change, some studies indicate that climate change could cause some areas to experience substantially colder temperatures than their historical averages. As a result, it is difficult to predict how the market for our fuels would be affected by increased temperature volatility, although if there is an overall trend of warmer temperatures, it would be expected to have an adverse effect on our business.
ETP’s pipeline operations are subject to regulation by the DOT under the Pipeline Hazardous Materials Safety Administration (“PHMSA”), pursuant to which the PHMSA has established requirements relating to the design, installation, testing, construction, operation, replacement and management of pipeline facilities. Moreover, the PHMSA, through the Office of Pipeline Safety, has promulgated a rule requiring pipeline operators to develop integrity management programs to comprehensively evaluate their pipelines, and take measures to protect pipeline segments located in what the rule refers to as “high consequence areas.” Activities under these integrity management programs involve the performance of internal pipeline inspections, pressure testing or other effective means to assess the integrity of these regulated pipeline segments, and the regulations require prompt action to address integrity issues raised by the assessment and analysis. ETP expects that it will incur pipeline integrity costs of
$3.4 million
in capital costs and
$17.9 million
in operating and maintenance costs over the next year. Regency estimates that it will incur pipeline integrity costs of
$0.8 million
over the next year. Integrity testing and assessment of all of these assets will continue, and the potential exists that results of such testing and assessment could cause ETP to incur even greater capital and operating expenditures for repairs or upgrades deemed necessary to ensure the continued safe and reliable operation of its pipelines.
ETP and Regency are subject to the requirements of the federal Occupational Safety and Health Act (“OSHA”) and comparable state laws that regulate the protection of the health and safety of employees. In addition, OSHA’s hazardous communication standard requires that information be maintained about hazardous materials used or produced in ETP’s and Regency’s operations and that this information be provided to employees, state and local government authorities and citizens. ETP and Regency believe that their operations are in compliance with the OSHA requirements, including general industry standards, record keeping requirements, and monitoring of occupational exposure to regulated substances.
21
National Fire Protection Association Pamphlets No. 54 and No. 58, which establish rules and procedures governing the safe handling of propane, or comparable regulations, have been adopted as the industry standard in all of the states in which we operate. In some states, these laws are administered by state agencies, and in others, they are administered on a municipal level. With respect to the transportation of propane by truck, we are subject to regulations governing the transportation of hazardous materials under the Federal Motor Carrier Safety Act, administered by the U.S. Department of Transportation (“DOT”). We conduct ongoing training programs to help ensure that our operations are in compliance with applicable regulations. We believe that the procedures currently in effect at all of our facilities for the handling, storage and distribution of propane are consistent with industry standards and are in substantial compliance with applicable laws and regulations.
Employees
As of January 31, 2012, ETE and its consolidated subsidiaries employed an aggregate of 2,477 employees, none of which are represented by labor unions. We and our subsidiaries believe that our relations with our employees are satisfactory. ETP's retail propane operations were contributed to AmeriGas on January 12, 2012; therefore, our employee headcount as of January 31, 2012 excluded employees of the retail propane operations.
SEC Reporting
We file or furnish annual reports on Form 10-K, quarterly reports on Form 10-Q, current reports on Form 8-K and any related amendments and supplements thereto with the Securities and Exchange Commission (“SEC”). From time to time, we may also file registration and related statements pertaining to equity or debt offerings. You may read and copy any materials we file or furnish with the SEC at the SEC’s Public Reference Room at 100 F Street, N.E., Washington, D.C. 20549. You may obtain information regarding the Public Reference Room by calling the SEC at 1-800-732-0330. In addition, the SEC maintains an internet website at http://www.sec.gov that contains reports, proxy and information statements and other information regarding issuers that file electronically with the SEC.
We provide electronic access, free of charge, to our periodic and current reports on our internet website located at http://www.energytransfer.com. These reports are available on our website as soon as reasonably practicable after we electronically file such materials with the SEC. Information contained on our website is not part of this report.
In addition to risks and uncertainties in the ordinary course of business that are common to all businesses, important factors that are specific to our structure as a limited partnership, our industry and our company could materially impact our future performance and results of operations. We have provided below a list of these risk factors that should be reviewed when considering an investment in our securities. These are not all the risks we face and other factors currently considered immaterial or unknown to us may impact our future operations.
Risks Inherent in an Investment in Us
Our only significant assets are our partnership interests, including the incentive distribution rights, in ETP and Regency and, therefore, our cash flow is dependent upon the ability of ETP and Regency to make distributions in respect of those partnership interests.
We do not have any significant assets other than our partnership interests in ETP and Regency. As a result, our cash flow depends on the performance of ETP, Regency and their respective subsidiaries and ETP’s and Regency’s ability to make cash distributions to us, which is dependent on the results of operations, cash flows and financial condition of ETP and Regency.
The amount of cash that ETP and Regency can distribute to their partners, including us, each quarter depends upon the amount of cash they generate from their operations, which will fluctuate from quarter to quarter and will depend on, among other things:
|
•
|
the amount of natural gas transported through ETP’s and Regency’s transportation pipelines and gathering systems;
|
|
•
|
the level of throughput in its processing and treating operations;
|
|
•
|
the fees they charged and the margins realized by ETP and Regency for their gathering, treating, processing, storage and transportation services;
|
|
•
|
the price of natural gas and NGLs;
|
|
•
|
the relationship between natural gas and NGL prices;
|
|
•
|
the amount of cash distributions ETP receives with respect to its ownership of AmeriGas common units;
|
22
|
•
|
the weather in their respective operating areas;
|
|
•
|
the level of competition from other midstream companies, interstate pipeline companies and other energy providers;
|
|
•
|
the level of their respective operating costs;
|
|
•
|
prevailing economic conditions; and
|
|
•
|
the level of their respective derivative activities.
|
In addition, the actual amount of cash that ETP and Regency will have available for distribution will also depend on other factors, such as:
|
•
|
the level of capital expenditures they make;
|
|
•
|
the level of costs related to litigation and regulatory compliance matters;
|
|
•
|
the cost of acquisitions, if any;
|
|
•
|
the levels of any margin calls that result from changes in commodity prices;
|
|
•
|
debt service requirements;
|
|
•
|
fluctuations in working capital needs;
|
|
•
|
their ability to borrow under their respective credit facilities;
|
|
•
|
their ability to access capital markets;
|
|
•
|
restrictions on distributions contained in their respective debt agreements; and
|
|
•
|
the amount, if any, of cash reserves established by the board of directors and their respective general partners in their discretion for the proper conduct of their respective businesses.
|
ETE does not have any control over many of these factors, including the level of cash reserves established by the board of directors and ETP’s and Regency’s respective General Partners. Accordingly, we cannot guarantee that ETP or Regency will have sufficient available cash to pay a specific level of cash distributions to its partners.
Furthermore, Unitholders should be aware that the amount of cash that ETP and Regency have available for distribution depends primarily upon cash flow and is not solely a function of profitability, which is affected by non-cash items. As a result, ETP and Regency may declare and/or pay cash distributions during periods when they record net losses. Please read “Risks Related to the Businesses of Energy Transfer Partners and Regency Energy Partners” included in this Item 1A for a discussion of further risks affecting ETP’s and Regency’s ability to generate distributable cash flow.
We may not have sufficient cash to pay distributions at our current quarterly distribution level or to increase distributions.
The source of our earnings and cash flow is cash distributions from ETP and Regency. Therefore, the amount of distributions we are currently able to make to our Unitholders may fluctuate based on the level of distributions ETP and Regency makes to their partners. ETP or Regency may not be able to continue to make quarterly distributions at their current level or increase their quarterly distributions in the future. In addition, while we would expect to increase or decrease distributions to our Unitholders if ETP or Regency increases or decreases distributions to us, the timing and amount of such increased or decreased distributions, if any, will not necessarily be comparable to the timing and amount of the increase or decrease in distributions made by ETP or Regency to us.
Our ability to distribute cash received from ETP and Regency to our Unitholders is limited by a number of factors, including:
|
•
|
interest expense and principal payments on our indebtedness;
|
|
•
|
restrictions on distributions contained in any current or future debt agreements;
|
|
•
|
our general and administrative expenses;
|
|
•
|
expenses of our subsidiaries other than ETP or Regency, including tax liabilities of our corporate subsidiaries, if any;
|
|
•
|
capital contributions we may make to maintain our General Partner interests in ETP or Regency upon the issuance of additional partnership securities by ETP or Regency, as applicable; and
|
|
•
|
reserves our General Partner believes prudent for us to maintain for the proper conduct of our business or to provide for future distributions.
|
23
We cannot guarantee that in the future we will be able to pay distributions or that any distributions we do make will be at or above our current quarterly distribution. The actual amount of cash that is available for distribution to our Unitholders will depend on numerous factors, many of which are beyond our control or the control of our General Partner.
The General Partner is not elected by the Unitholders and cannot be removed without its consent.
Unlike the holders of common stock in a corporation, our Unitholders have only limited voting rights on matters affecting our business and, therefore, limited ability to influence management’s decisions regarding our business. Our Unitholders do not have the ability to elect our General Partner or the officers or directors of our General Partner.
Furthermore, if our Unitholders are dissatisfied with the performance of our General Partner, they have little ability to remove our General Partner. Our General Partner may not be removed except upon the vote of the holders of at least 66
2
/
3
% of our outstanding units. Our directors and executive officers directly or indirectly own 69,841,213 Common Units, representing approximately 31% of our outstanding Common Units, it will be particularly difficult for our General Partner to be removed without the consent of our directors and executive officers. As a result, the price at which our Common Units will trade may be lower because of the absence or reduction of a takeover premium in the trading price.
A reduction in ETP’s or Regency’s distributions will disproportionately affect the amount of cash distributions to which we are entitled.
Our indirect ownership of 100% of the incentive distribution rights in ETP, through our ownership of equity interests in ETP GP, the holder of the incentive distribution rights, entitles us to receive our pro rata share of specified percentages of total cash distributions made by ETP as it reaches established target cash distribution levels. We currently receive our pro rata share of cash distributions from ETP based on the highest incremental percentage, 48%, to which ETP GP is entitled pursuant to its incentive distribution rights in ETP. A decrease in the amount of distributions by ETP to less than $0.4125 per Common Unit per quarter would reduce ETP GP’s percentage of the incremental cash distributions above $0.3175 per Common Unit per quarter from 48% to 23%. As a result, any such reduction in quarterly cash distributions from ETP would have the effect of disproportionately reducing the amount of all distributions that we receive from ETP based on our ownership interest in the incentive distribution rights in ETP as compared to cash distributions we receive from ETP on our General Partner interest in ETP and our ETP Common Units.
Similarly, we receive a pro rata share of incremental cash distributions from Regency at the 23% level pursuant to Regency GP's incentive distribution rights in Regency. A decrease in the amount of distributions by Regency to less than $0.4375 per Common Unit per quarter would have reduced Regency GP’s percentage of the incremental cash distributions above $0.4025 per Common Unit per quarter from 23% to 13%. As a result, any such reduction in quarterly cash distributions from Regency would have the effect of disproportionately reducing the amount of all distributions that we receive from Regency based on our ownership interest in the incentive distribution rights of Regency as compared to cash distributions we receive from Regency on our General Partner interest in Regency and our Regency Common Units.
The consolidated debt level and debt agreements of ETP and Regency and those of their subsidiaries may limit the distributions we receive from ETP and Regency, as well as our future financial and operating flexibility.
As of
December 31, 2011
, ETP had approximately $7.81 billion of consolidated debt outstanding and Regency had approximately $1.69 billion of consolidated debt outstanding, excluding the credit facilities of their joint ventures. ETP’s and Regency’s levels of indebtedness affect their operations in several ways, including, among other things:
|
•
|
a significant portion of ETP’s and Regency’s cash flows from operations will be dedicated to the payment of principal and interest on outstanding debt and will not be available for other purposes, including payment of distributions to us;
|
|
•
|
covenants contained in ETP’s and Regency’s existing debt agreements require ETP and Regency to meet financial tests that may adversely affect their flexibility in planning for and reacting to changes in their respective businesses;
|
|
•
|
ETP’s and Regency’s ability to obtain additional financing for working capital, capital expenditures, acquisitions and general partnership purposes may be limited;
|
|
•
|
ETP and Regency may be at a competitive disadvantage relative to similar companies that have less debt;
|
|
•
|
ETP and Regency may be more vulnerable to adverse economic and industry conditions as a result of their significant debt levels; and
|
|
•
|
failure to comply with the various restrictive covenants of the debt agreements could negatively impact ETP’s and Regency’s ability to incur additional debt, including their ability to utilize the available capacity under their revolving credit facilities, and to pay distributions.
|
24
We may not be able to generate sufficient cash to service all of our indebtedness and may be forced to take other actions to satisfy our obligations under our indebtedness, which may not be successful.
Our ability to make scheduled payments on or to refinance our debt obligations depends on our financial and operating performance, which is subject to prevailing economic and competitive conditions and to certain financial, business and other factors beyond our control. We cannot assure Unitholders that we will maintain a level of cash flows from operating activities sufficient to permit us to pay the principal, premium, if any, and interest on our indebtedness.
If our cash flows and capital resources are insufficient to fund our debt service obligations, we may be forced to reduce or delay capital expenditures, sell assets or operations, seek additional capital or restructure or refinance our indebtedness. We cannot assure Unitholders that we would be able to take any of these actions, that these actions would be successful and permit us to meet our scheduled debt service obligations or that these actions would be permitted under the terms of our existing or future debt agreements. In the absence of such cash flows and capital resources, we could face substantial liquidity problems and might be required to dispose of material assets or operations to meet our debt service and other obligations. Our credit facilities restrict our ability to dispose of assets and use the proceeds from the disposition. We may not be able to consummate those dispositions or to obtain the proceeds that we could realize from them, and any proceeds may not be adequate to meet any debt service obligations then due.
ETP and Regency are not prohibited from competing with us.
Neither our partnership agreement nor the partnership agreements of ETP or Regency prohibit ETP or Regency from owning assets or engaging in businesses that compete directly or indirectly with us. Additionally, ETP’s partnership agreement prohibits us from engaging in the retail propane business in the United States. In addition, ETP and/or Regency may acquire, construct or dispose of any assets in the future without any obligation to offer us the opportunity to purchase or construct any of those assets.
Construction of new expansion projects will require significant amounts of debt and equity financing which may not be available to ETP or Regency on acceptable terms, or at all.
ETP and Regency plan to fund their growth capital expenditures, including any new future pipeline construction projects ETP or Regency may undertake, with proceeds from sales of ETP’s or Regency’s debt and equity securities and borrowings under their respective revolving credit facilities; however, ETP or Regency cannot be certain that they will be able to issue debt and equity securities on terms satisfactory to them, or at all. In addition, ETP or Regency may be unable to obtain adequate funding under their current revolving credit facility because ETP’s or Regency’s lending counterparties may be unwilling or unable to meet their funding obligations. If ETP or Regency are unable to finance their expansion projects as expected, ETP or Regency could be required to seek alternative financing, the terms of which may not be attractive to ETP or Regency, or to revise or cancel its expansion plans.
A significant increase in ETP’s or Regency’s indebtedness that is proportionately greater than ETP’s or Regency’s respective issuances of equity could negatively impact ETP’s or Regency’s respective credit ratings or their ability to remain in compliance with the financial covenants under their respective revolving credit agreements, which could have a material adverse effect on ETP’s or Regency’s financial condition, results of operations and cash flows.
Increases in interest rates could materially adversely affect our business, results of operations, cash flows and financial condition.
In addition to our exposure to commodity prices, we have significant exposure to changes in interest rates. As of
December 31, 2011
, we had approximately
$717.9 million
of consolidated variable rate debt outstanding, which consisted of borrowings under our revolving credit facility of
$71.5 million
and borrowings under ETP’s and Regency’s revolving credit facilities of
$314.4 million
and
$332.0 million
, respectively and excludes borrowings of ETP’s and Regency’s joint ventures. To the extent that we have debt with floating interest rates, our results of operations, cash flows and financial condition could be materially adversely affected by increases in interest rates. We manage a portion of our interest rate exposures by utilizing interest rate swaps.
As of December 31, 2011, ETP had a total of $1.15 billion of notional amount of forward-starting interest rate swaps outstanding to hedge the anticipated issuance of senior notes in 2012 and 2013. In addition, ETP had a total of $500 million of notional amount of interest rate swaps that swap a portion of our fixed rate debt to floating. Regency also had $250 million of notional amount of interest rate swaps that swap a portion of its floating rate debt to a fixed rate.
An increase in interest rates may also cause a corresponding decline in demand for equity investments, in general, and in particular for yield-based equity investments such as our Common Units. Any such reduction in demand for our Common Units resulting from other more attractive investment opportunities may cause the trading price of our Common Units to decline.
25
The credit and risk profile of our General Partner and its owners could adversely affect our credit ratings and profile.
The credit and business risk profiles of our General Partner or indirect owners of our General Partner may be factors in credit evaluations of us as a publicly traded limited partnership due to the significant influence of our General Partner and indirect owners over our business activities, including our cash distributions, acquisition strategy and business risk profile. Another factor that may be considered is the financial condition of our General Partner and its owners, including the degree of their financial leverage and their dependence on cash flow from us to service their indebtedness.
We may issue an unlimited number of limited partner interests without the consent of our Unitholders, which will dilute Unitholders’ ownership interest in us and may increase the risk that we will not have sufficient available cash to maintain or increase our per unit distribution level.
Our partnership agreement allows us to issue an unlimited number of additional limited partner interests, including securities senior to the Common Units, without the approval of our Unitholders. The issuance of additional Common Units or other equity securities by us will have the following effects:
|
•
|
our Unitholders’ current proportionate ownership interest in us will decrease;
|
|
•
|
the amount of cash available for distribution on each Common Unit or partnership security may decrease;
|
|
•
|
the ratio of taxable income to distributions may increase;
|
|
•
|
the relative voting strength of each previously outstanding Common Unit may be diminished; and
|
|
•
|
the market price of our Common Units may decline.
|
In addition, ETP and Regency may sell an unlimited number of limited partner interests without the consent of the respective Unitholders, which will dilute existing interests of the respective Unitholders, including us. The issuance of additional Common Units or other equity securities by ETP will have essentially the same effects as detailed above.
The market price of our Common Units could be adversely affected by sales of substantial amounts of our units in the public markets, including sales by our existing Unitholders.
Sales by any of our existing Unitholders of a substantial number of our units in the public markets, or the perception that such sales might occur, could have a material adverse effect on the price of our units or could impair our ability to obtain capital through an offering of equity securities. We do not know whether any such sales would be made in the public market or in private placements, nor do we know what impact such potential or actual sales would have on our unit price in the future.
Control of our General Partner may be transferred to a third party without Unitholder consent.
Our General Partner may transfer its general partner interest in us to a third party without the consent of our Unitholders. Furthermore, the members of our General Partner may transfer all or part of their ownership interest in our General Partner to a third party without the consent of the Unitholders. The new owner or owners of our General Partner or the general partner of the General Partner would then be in a position to replace the directors and officers of our General Partner and control the decisions made and actions taken by the board of directors and officers.
Our General Partner has only one executive officer, and we are dependent on third parties, including key personnel of ETP under a shared services agreement, to provide the financial, accounting, administrative and legal services necessary to operate our business.
John W. McReynolds, the President and Chief Financial Officer of our General Partner, is the only executive officer charged with managing our business other than through our shared services agreement with ETP. We do not currently have a plan for identifying a successor to Mr. McReynolds in the event that he retires, dies or becomes disabled. If Mr. McReynolds ceases to serve as the President and Chief Financial Officer of our General Partner for any reason, we would be without executive management other than through our shared services agreement with ETP until one or more new executive officers are selected by the board of directors of our General Partner. As a consequence, the loss of Mr. McReynolds’ services could have a material negative impact on the management of our business.
Moreover, we rely on the services of key personnel of ETP, including the ongoing involvement and continued leadership of Kelcy L. Warren, one of the founders of ETP’s midstream business, as well as other key members of ETP’s management team such as Marshall S. (Mackie) McCrea, III, President and Chief Operating Officer. Mr. Warren has been integral to the success of ETP’s midstream and intrastate transportation and storage businesses because of his ability to identify and develop strategic business opportunities. Losing his leadership could make it difficult for ETP to identify internal growth projects and accretive acquisitions, which could have a material adverse effect on ETP’s ability to increase the cash distributions paid on its partnership interests.
26
ETP’s executive officers that provide services to us pursuant to a shared services agreement allocate their time between us and ETP. To the extent that these officers face conflicts regarding the allocation of their time, we may not receive the level of attention from them that the management of our business requires. If ETP is unable to provide us with a sufficient number of personnel with the appropriate level of technical accounting and financial expertise, our internal accounting controls could be adversely impacted.
An increase in interest rates may cause the market price of our units to decline.
Like all equity investments, an investment in our units is subject to certain risks. In exchange for accepting these risks, investors may expect to receive a higher rate of return than would otherwise be obtainable from lower-risk investments. Accordingly, as interest rates rise, the ability of investors to obtain higher risk-adjusted rates of return by purchasing government-backed debt securities may cause a corresponding decline in demand for riskier investments generally, including yield-based equity investments such as publicly traded limited partnership interests. Reduced demand for our units resulting from investors seeking other more favorable investment opportunities may cause the trading price of our units to decline.
Limited partner’s liability may not be limited, and our Unitholders may have to repay distributions or make additional contributions to us under limited circumstances.
As a limited partner in a partnership organized under Delaware law, a limited partner could be held liable for our obligations to the same extent as a general partner if it participates in the “control” of our business. Our general partner generally has unlimited liability for the obligations of the partnership, except for those contractual obligations of the partnership that are expressly made without recourse to our General Partner. Additionally, the limitations on the liability of holders of limited partner interests for the obligations of a limited partnership have not been clearly established in many jurisdictions in which we do business. In some of the jurisdictions in which we do business, the applicable statutes do not define control, but do permit limited partners to engage in certain activities, including, among other actions, taking any action with respect to the dissolution of the partnership, the sale, exchange, lease or mortgage of any asset of the partnership, the admission or removal of the general partner and the amendment of the partnership agreement. A limited partner could, however, be liable for any and all of our obligations as if it was a general partner if:
|
•
|
a court or government agency determined that we were conducting business in a state but had not complied with that particular state’s partnership statute; or
|
|
•
|
a limited partner’s right to act with other Unitholders to take other actions under our partnership agreement is found to constitute “control” of our business.
|
Under limited circumstances, our Unitholders may have to repay amounts wrongfully distributed to them. Under Section 17-607 of the Delaware Revised Uniform Limited Partnership Act, neither Energy Transfer Equity, ETP nor Regency may make a distribution to its Unitholders if the distribution would cause Energy Transfer Equity’s, ETP’s or Regency’s respective liabilities to exceed the fair value of their respective assets. Delaware law provides that for a period of three years from the date of the impermissible distribution, partners who received the distribution and knew at the time of the distribution that it violated Delaware law will be liable to the partnership for the distribution amount. Liabilities to partners on account of their partnership interest and liabilities that are non-recourse to the partnership are not counted for purposes of determining whether a distribution is permitted.
If we cease to manage and control ETP or Regency in the future, we may be deemed to be an investment company under the Investment Company Act of 1940.
If we cease to manage and control ETP or Regency and are deemed to be an investment company under the Investment Company Act of 1940 (the “Investment Company Act”) we would either have to register as an investment company under the Investment Company Act, obtain exemptive relief from the Securities and Exchange Commission or modify our organizational structure or our contract rights to fall outside the definition of an investment company. Registering as an investment company could, among other things, materially limit our ability to engage in transactions with affiliates, including the purchase and sale of certain securities or other property to or from our affiliates, restrict our ability to borrow funds or engage in other transactions involving leverage and require us to add additional directors who are independent of us or our affiliates.
27
Moreover, treatment of us as an investment company would prevent our qualification as a partnership for federal income tax purposes, in which case we would be treated as a corporation for federal income tax purposes. For further discussion of the importance of our treatment as a partnership for federal income tax purposes and the implications that would result from our treatment as a corporation in any taxable year, please read the risk factor below entitled “Our tax treatment depends on our continuing status as a partnership for federal income tax purposes, as well as our not being subject to a material amount of entity-level taxation by individual states. If the IRS were to treat us, ETP or Regency as a corporation for federal income tax purposes or if we, ETP or Regency become subject to a material amount of additional entity-level taxation for state tax purposes, it would substantially reduce the amount of cash available for distribution to Unitholders.
If ETP GP or Regency GP withdraws or is removed as ETP’s or Regency’s General Partner, as applicable, then we would lose control over the management and affairs of ETP or Regency, the risk that we would be deemed an investment company under the Investment Company Act of 1940 would be exacerbated and our indirect ownership of the General Partner interests and 100% of the incentive distribution rights in ETP or Regency could be cashed out or converted into ETP or Regency Common Units, as applicable, at an unattractive valuation.
Under the terms of ETP’s or Regency’s respective partnership agreements, ETP GP or Regency GP, as applicable, will be deemed to have withdrawn as General Partner if, among other things, it:
|
•
|
voluntarily withdraws from the partnership by giving notice to the other partners;
|
|
•
|
transfers all, but not less than all, of its partnership interests to another entity in accordance with the terms of ETP’s or Regency’s partnership agreement, as applicable;
|
|
•
|
makes a general assignment for the benefit of creditors, files a voluntary bankruptcy petition, seeks to liquidate, acquiesces in the appointment of a trustee, receiver or liquidator, or becomes subject to an involuntary bankruptcy petition; or
|
|
•
|
dissolves itself under Delaware law without reinstatement within the requisite period.
|
In addition, ETP GP and Regency GP can be removed as ETP’s or Regency's General Partner if that removal is approved by Unitholders holding at least 66 2/3% of ETP’s or Regency’s respective outstanding Common Units (including units held by ETP GP or Regency GP and their respective affiliates). Currently, ETP GP and its affiliates own approximately
22%
of ETP’s outstanding Common Units, and Regency GP and its affiliates own approximately
17%
of Regency’s outstanding Common Units.
If ETP GP or Regency GP withdraws from being ETP’s or Regency’s respective General Partner in compliance with ETP’s or Regency’s partnership agreement, as applicable, or is removed from being ETP’s or Regency’s respective General Partner under circumstances not involving a final adjudication of actual fraud, gross negligence or willful and wanton misconduct, it may require the successor General Partner to purchase its General Partner interests, incentive distribution rights and limited partner interests in ETP or Regency, as applicable, for fair market value. If ETP GP or Regency GP withdraws from being ETP’s or Regency’s respective General Partner in violation of ETP’s or Regency’s partnership agreement, as applicable, or is removed from being ETP’s or Regency’s General Partner in circumstances where a court enters a judgment that cannot be appealed finding it liable for actual fraud, gross negligence or willful or wanton misconduct in its capacity as ETP’s or Regency’s General Partner, and the successor General Partner does not exercise its option to purchase the General Partner interests, incentive distribution rights and limited partner interests in ETP or Regency, as applicable, for fair market value, then the General Partner interests and incentive distribution rights in ETP or Regency, as applicable, could be converted into limited partner interests pursuant to a valuation performed by an investment banking firm or other independent expert. Under any of the foregoing scenarios, ETP GP or Regency GP would lose control over the management and affairs of ETP or Regency, as applicable, thereby increasing the risk that we would be deemed an investment company subject to regulation under the Investment Company Act of 1940. In addition, our indirect ownership of the General Partner interests and 100% of the incentive distribution rights in ETP and Regency, to which a significant portion of the value of our Common Units is currently attributable, could be cashed out or converted into ETP or Regency Common Units, as applicable, at an unattractive valuation.
Our Partnership Agreement restricts the rights of Unitholders owning 20% or more of our units.
Our Unitholders’ voting rights are restricted by the provision in our partnership agreement generally providing that any units held by a person that owns 20% or more of any class of units then outstanding, other than our General Partner and its affiliates, cannot be voted on any matter. In addition, our partnership agreement contains provisions limiting the ability of our Unitholders to call meetings or to acquire information about our operations, as well as other provisions limiting our Unitholders’ ability to influence the manner or direction of our management. As a result, the price at which our Common Units will trade may be lower because of the absence or reduction of a takeover premium in the trading price.
28
Future sales of the ETP or Regency Common Units we own or other limited partner interests in the public market could reduce the market price of our Unitholders’ limited partner interests.
As of
December 31, 2011
, we owned approximately
50.2 million
Common Units of ETP and approximately
26.3 million
Common Units of Regency, and SUG, as a subsidiary of ETE, is expected to receive $105 million of additional ETP Common Units upon ETP's consummation of its acquisition of Citrus Corp. (the "Citrus Acquisition"). If we were to sell and/or distribute our ETP or Regency Common Units to the holders of our equity interests in the future, those holders may dispose of some or all of these units. The sale or disposition of a substantial portion of these units in the public markets could reduce the market price of ETP’s or Regency’s outstanding Common Units and our receipt of cash distributions.
Cost reimbursements due to our General Partner may be substantial and may reduce our ability to pay the distributions to our Unitholders.
Prior to making any distributions to our Unitholders, we will reimburse our General Partner for all expenses it has incurred on our behalf. In addition, our General Partner and its affiliates may provide us with services for which we will be charged reasonable fees as determined by our General Partner. The reimbursement of these expenses and the payment of these fees could adversely affect our ability to make distributions to our Unitholders. Our General Partner has sole discretion to determine the amount of these expenses and fees.
In addition, under Delaware partnership law, our General Partner has unlimited liability for our obligations, such as our debts and environmental liabilities, except for our contractual obligations that are expressly made without recourse to our General Partner. To the extent our General Partner incurs obligations on our behalf, we are obligated to reimburse or indemnify it. If we are unable or unwilling to reimburse or indemnify our General Partner, our General Partner may take actions to cause us to make payments of these obligations and liabilities. Any such payments could reduce the amount of cash available for distribution to our Unitholders and cause the value of our Common Units to decline.
An impairment of goodwill and intangible assets could reduce our earnings.
As of
December 31, 2011
, our consolidated balance sheets reflected
$2.04 billion
of goodwill and
$1.07 billion
of intangible assets. Goodwill is recorded when the purchase price of a business exceeds the fair value of the tangible and separately measurable intangible net assets. Accounting principles generally accepted in the United States require us to test goodwill for impairment on an annual basis or when events or circumstances occur, indicating that goodwill might be impaired. Long-lived assets such as intangible assets with finite useful lives are reviewed for impairment whenever events or changes in circumstances indicate that the carrying amount may not be recoverable. If we determine that any of our goodwill or intangible assets were impaired, we would be required to take an immediate charge to earnings with a correlative effect on partners’ capital and balance sheet leverage as measured by debt to total capitalization.
ETP or Regency may issue additional Common Units, which may increase the risk that ETP or Regency will not have sufficient available cash to maintain or increase its per unit distribution level.
The partnership agreements of each ETP and Regency allow ETP and Regency, respectively, to issue an unlimited number of additional limited partner interests. The issuance of additional common units or other equity securities by ETP or Regency will have the following effects:
|
•
|
Unitholders’ current proportionate ownership interest in ETP or Regency, as applicable, will decrease;
|
|
•
|
the amount of cash available for distribution on each common unit or partnership security may decrease;
|
|
•
|
the ratio of taxable income to distributions may increase;
|
|
•
|
the relative voting strength of each previously outstanding common unit may be diminished; and
|
|
•
|
the market price of ETP’s or Regency’s Common Units, as applicable, may decline.
|
The payment of distributions on any additional units issued by ETP or Regency may increase the risk that ETP or Regency, as applicable, may not have sufficient cash available to maintain or increase its per unit distribution level, which in turn may impact the available cash that we have to meet our obligations.
29
Risks Related to Conflicts of Interest
Although we control ETP and Regency through our ownership of their respective General Partners, ETP’s General Partner owes fiduciary duties to ETP and ETP’s Unitholders, and Regency’s General Partner owes fiduciary duties to Regency and Regency’s Unitholders, which may conflict with our interests.
Conflicts of interest exist and may arise in the future as a result of the relationships between us and our affiliates, on the one hand, and ETP, Regency and their respective limited partners, on the other hand. The directors and officers of ETP’s and Regency’s General Partners have fiduciary duties to manage ETP and Regency, respectively, in a manner beneficial to us. At the same time, the General Partners have fiduciary duties to manage ETP and Regency, respectively, in a manner beneficial to ETP, Regency and their respective limited partners. The board of directors of ETP’s General Partner or Regency’s general partner will resolve any such conflict and have broad latitude to consider the interests of all parties to the conflict. The resolution of these conflicts may not always be in our best interest.
For example, conflicts of interest with ETP or Regency may arise in the following situations:
|
•
|
the allocation of shared overhead expenses to ETP, Regency and us;
|
|
•
|
the interpretation and enforcement of contractual obligations between us and our affiliates, on the one hand, and ETP or Regency, on the other hand;
|
|
•
|
the determination of the amount of cash to be distributed to ETP’s or Regency’s partners and the amount of cash to be reserved for the future conduct of ETP’s or Regency’s business;
|
|
•
|
the determination whether to make borrowings under ETP’s or Regency’s respective revolving credit facility to pay distributions to ETP’s or Regency’s partners, as applicable; and
|
|
•
|
any decision we make in the future to engage in business activities independent of ETP or Regency.
|
The fiduciary duties of our General Partner’s officers and directors may conflict with those of ETP’s or Regency’s respective General Partners.
Conflicts of interest may arise because of the relationships among ETP, Regency, their General Partners and us. Our General Partner’s directors and officers have fiduciary duties to manage our business in a manner beneficial to us and our Unitholders. Some of our General Partner’s directors are also directors and officers of ETP’s General Partner or Regency’s General Partner, and have fiduciary duties to manage the respective businesses of ETP and Regency in a manner beneficial to ETP, Regency and their respective Unitholders. The resolution of these conflicts may not always be in our best interest or that of our Unitholders.
Affiliates of our General Partner are not prohibited from competing with us.
Our partnership agreement provides that our General Partner will be restricted from engaging in any business activities other than acting as our General Partner and those activities incidental to its ownership of interests in us. Except as provided in our partnership agreement, affiliates of our General Partner are not prohibited from engaging in other businesses or activities, including those that might be in direct competition with us.
Potential conflicts of interest may arise among our General Partner, its affiliates and us. Our General Partner and its affiliates have limited fiduciary duties to us, which may permit them to favor their own interests to the detriment of us.
Conflicts of interest may arise among our General Partner and its affiliates, on the one hand, and us, on the other hand. As a result of these conflicts, our General Partner may favor its own interests and the interests of its affiliates over our interests. These conflicts include, among others, the following:
|
•
|
Our General Partner is allowed to take into account the interests of parties other than us, including ETP, Regency and their respective affiliates and any General Partners and limited partnerships acquired in the future, in resolving conflicts of interest, which has the effect of limiting its fiduciary duties to us.
|
|
•
|
Our General Partner has limited its liability and reduced its fiduciary duties under the terms of our partnership agreement, while also restricting the remedies available for actions that, without these limitations, might constitute breaches of fiduciary duty. As a result of purchasing our units, Unitholders consent to various actions and conflicts of interest that might otherwise constitute a breach of fiduciary or other duties under applicable state law.
|
|
•
|
Our General Partner determines the amount and timing of our investment transactions, borrowings, issuances of additional partnership securities and reserves, each of which can affect the amount of cash that is available for distribution.
|
|
•
|
Our General Partner determines which costs it and its affiliates have incurred are reimbursable by us.
|
30
|
•
|
Our partnership agreement does not restrict our General Partner from causing us to pay it or its affiliates for any services rendered, or from entering into additional contractual arrangements with any of these entities on our behalf, so long as the terms of any such payments or additional contractual arrangements are fair and reasonable to us.
|
|
•
|
Our General Partner controls the enforcement of obligations owed to us by it and its affiliates.
|
|
•
|
Our General Partner decides whether to retain separate counsel, accountants or others to perform services for us.
|
Our partnership agreement limits our General Partner’s fiduciary duties to us and restricts the remedies available for actions taken by our General Partner that might otherwise constitute breaches of fiduciary duty.
Our partnership agreement contains provisions that reduce the standards to which our General Partner would otherwise be held by state fiduciary duty law. For example, our Partnership Agreement:
|
•
|
permits our General Partner to make a number of decisions in its individual capacity, as opposed to in its capacity as our General Partner. This entitles our General Partner to consider only the interests and factors that it desires, and it has no duty or obligation to give any consideration to any interest of, or factors affecting, us, our affiliates or any limited partner;
|
|
•
|
provides that our General Partner is entitled to make other decisions in “good faith” if it reasonably believes that the decisions are in our best interests;
|
|
•
|
generally provides that affiliated transactions and resolutions of conflicts of interest not approved by the Audit and Conflicts Committee of the board of directors of our General Partner and not involving a vote of Unitholders must be on terms no less favorable to us than those generally being provided to or available from unrelated third parties or be “fair and reasonable” to us and that, in determining whether a transaction or resolution is “fair and reasonable,” our General Partner may consider the totality of the relationships among the parties involved, including other transactions that may be particularly advantageous or beneficial to us; and
|
|
•
|
provides that our General Partner and its officers and directors will not be liable for monetary damages to us, our limited partners or assignees for any acts or omissions unless there has been a final and non-appealable judgment entered by a court of competent jurisdiction determining that the General Partner or those other persons acted in bad faith or engaged in fraud, willful misconduct or gross negligence.
|
Our General Partner has a limited call right that may require Unitholders to sell their units at an undesirable time or price.
If at any time our General Partner and its affiliates own more than 90% of our outstanding units, our General Partner will have the right, but not the obligation, which it may assign to any of its affiliates or to us, to acquire all, but not less than all, of the units held by unaffiliated persons at a price not less than their then-current market price. As a result, Unitholders may be required to sell their units at an undesirable time or price and may not receive any return on their investment. Unitholders may also incur a tax liability upon a sale of their units. As of
December 31, 2011
, the directors and executive officers of our General Partner owned approximately 31% of our Common Units.
ETP and Regency own interstate pipelines that are subject to rate regulation by the Federal Energy Regulatory Commission and, in the event that 15% or more of our outstanding Common Units, in the aggregate, are held by persons who are not eligible holders, Common Units held by persons who are not eligible holders will be subject to the possibility of redemption at the then-current market price.
ETP and Regency own interstate pipelines that are subject to rate regulation of the Federal Energy Regulatory Commission, FERC, and as a result our General Partner has the right under our partnership agreement to institute procedures, by giving notice to each of our Unitholders, that would require transferees of Common Units and, upon the request of our General Partner, existing holders of our Common Units to certify that they are Eligible Holders. The purpose of these certification procedures would be to enable us to utilize a federal income tax expense as a component of the pipeline’s rate base upon which tariffs may be established under FERC rate-making policies applicable to entities that pass-through their taxable income to their owners. Eligible Holders are individuals or entities subject to United States federal income taxation on the income generated by us or entities not subject to United States federal income taxation on the income generated by us, so long as all of the entity’s owners are subject to such taxation. If these tax certification procedures are implemented and 15% or more of our outstanding Common Units are held by persons who are not Eligible Holders, we will have the right to redeem the units held by persons who are not Eligible Holders at the then-current market price. The redemption price would be paid in cash or by delivery of a promissory note, as determined by our General Partner.
31
Risks Related to the Businesses of ETP and Regency
Since our cash flows consist exclusively of distributions from ETP and Regency, risks to the businesses of ETP and Regency are also risks to us. We have set forth below risks to the businesses of ETP and Regency, the occurrence of which could have a negative impact on their respective financial performance and decrease the amount of cash they are able to distribute to us.
ETP and Regency are exposed to the credit risk of their respective customers, and an increase in the nonpayment and nonperformance by their respective customers could reduce their respective ability to make distributions to their Unitholders, including to us.
The risks of nonpayment and nonperformance by ETP’s and Regency’s respective customers are a major concern in their respective businesses. Participants in the energy industry have been subjected to heightened scrutiny from the financial markets in light of past collapses and failures of other energy companies. ETP and Regency are subject to risks of loss resulting from nonpayment or nonperformance by their respective customers. The current tightening of credit in the financial markets may make it more difficult for customers to obtain financing and, depending on the degree to which this occurs, there may be a material increase in the nonpayment and nonperformance by ETP’s and Regency’s customers. Any substantial increase in the nonpayment and nonperformance by ETP’s or Regency’s customers could have a material adverse effect on ETP’s or Regency’s respective results of operations and operating cash flows.
The profitability of certain activities in midstream and intrastate transportation and storage operations are largely dependent upon natural gas commodity prices, price spreads between two or more physical locations and market demand for natural gas and NGLs, which are factors beyond ETP’s or Regency’s control and have been volatile.
Income from midstream and intrastate transportation and storage operations is exposed to risks due to fluctuations in commodity prices. In the past, the prices of natural gas and NGLs have been extremely volatile, and ETP and Regency expect this volatility to continue. For example, during the year ended
December 31, 2011
, the NYMEX settlement price for the prompt month contract ranged from a high of $4.38 per MMBtu to a low of $3.36 per MMBtu. Additionally, a composite of the Mt. Belvieu average NGLs price based upon ETP’s average NGLs composition during the year ended
December 31, 2011
ranged from a high of approximately $1.36 per gallon to a low of approximately $1.15 per gallon.
The markets and prices for natural gas and NGLs depend upon factors beyond ETP’s and Regency’s control. These factors include demand for oil, natural gas and NGLs, which fluctuate with changes in market and economic conditions, and other factors, including:
|
•
|
the impact of weather on the demand for oil and natural gas;
|
|
•
|
the level of domestic oil and natural gas production;
|
|
•
|
the availability of imported oil and natural gas;
|
|
•
|
actions taken by foreign oil and gas producing nations;
|
|
•
|
the availability of local, intrastate and interstate transportation systems;
|
|
•
|
the price, availability and marketing of competitive fuels;
|
|
•
|
the demand for electricity;
|
|
•
|
the impact of energy conservation efforts; and
|
|
•
|
the extent of governmental regulation and taxation.
|
The use of derivative financial instruments could result in material financial losses by ETP and Regency.
From time to time, ETP and Regency have sought to limit a portion of the adverse effects resulting from changes in natural gas and other commodity prices and interest rates by using derivative financial instruments and other risk management mechanisms and by their trading, marketing and/or system optimization activities. To the extent that either ETP or Regency hedges its commodity price and interest rate exposures, it foregoes the benefits it would otherwise experience if commodity prices or interest rates were to change favorably. In addition, even though monitored by management, ETP’s and Regency’s derivatives activities can result in losses. Such losses could occur under various circumstances, including if a counterparty does not perform its obligations under the derivative arrangement, the hedge is imperfect, commodity prices move unfavorably related to ETP’s or Regency’s physical or financial positions, or internal hedging policies and procedures are not followed.
32
ETP’s and Regency’s success depends upon their ability to continually contract for new sources of natural gas supply and natural gas transportation services.
In order to maintain or increase throughput levels on ETP’s and Regency’s gathering and transportation pipeline systems and asset utilization rates at their treating and processing plants, ETP and Regency must continually contract for new natural gas supplies and natural gas transportation services. ETP and Regency may not be able to obtain additional contracts for natural gas supplies for their natural gas gathering systems, and they may be unable to maintain or increase the levels of natural gas throughput on their transportation pipelines. The primary factors affecting ETP’s and Regency’s ability to connect new supplies of natural gas to their gathering systems include its success in contracting for existing natural gas supplies that are not committed to other systems and the level of drilling activity and production of natural gas near ETP’s and Regency’s gathering systems or in areas that provide access to its transportation pipelines or markets to which their systems connect. The primary factors affecting ETP’s and Regency’s ability to attract customers to their transportation pipelines consist of their access to other natural gas pipelines, natural gas markets, natural gasfired power plants and other industrial end-users and the level of drilling and production of natural gas in areas connected to these pipelines and systems.
Fluctuations in energy prices can greatly affect production rates and investments by third parties in the development of new oil and natural gas reserves. Drilling activity and production generally decrease as oil and natural gas prices decrease. ETP and Regency have no control over the level of drilling activity in their areas of operation, the amount of reserves underlying the wells and the rate at which production from a well will decline, sometimes referred to as the “decline rate.” In addition, ETP and Regency have no control over producers or their production decisions, which are affected by, among other things, prevailing and projected energy prices, demand for hydrocarbons, the level of reserves, geological considerations, governmental regulation and the availability and cost of capital.
A substantial portion of ETP’s and Regency’s assets, including their gathering systems and their processing and treating plants, are connected to natural gas reserves and wells for which the production will naturally decline over time. Accordingly, ETP’s and Regency’s cash flows will also decline unless they are able to access new supplies of natural gas by connecting additional production to these systems.
ETP’s and Regency’s transportation pipelines are also dependent upon natural gas production in areas served by their pipelines or in areas served by other gathering systems or transportation pipelines that connect with their transportation pipelines. A material decrease in natural gas production in ETP’s and Regency’s areas of operation or in other areas that are connected to ETP’s or Regency’s areas of operation by third party gathering systems or pipelines, as a result of depressed commodity prices or otherwise, would result in a decline in the volume of natural gas ETP and Regency handle, which would reduce their respective revenues and operating income. In addition, ETP’s and Regency’s future growth will depend, in part, upon whether they can contract for additional supplies at a greater rate than the natural decline rate in their currently connected supplies.
ETP and Regency may not be able to fully execute their growth strategies if they encounter increased competition for qualified assets.
ETP and Regency each have strategies that contemplate growth through the development and acquisition of a wide range of midstream and other energy infrastructure assets while maintaining strong balance sheets. These strategies include constructing and acquiring additional assets and businesses to enhance their ability to compete effectively and diversify their respective asset portfolios, thereby providing more stable cash flow. ETP and Regency regularly consider and enter into discussions regarding, and are currently contemplating, the acquisition of additional assets and businesses, stand alone development projects or other transactions that ETP and Regency believe will present opportunities to realize synergies and increase cash flow.
Consistent with their acquisition strategies, managements of ETP and Regency is continuously engaged in discussions with potential sellers regarding the possible acquisition of additional assets or businesses. Such acquisition efforts may involve ETP or Regency management’s participation in processes that involve a number of potential buyers, commonly referred to as “auction” processes, as well as situations in which ETP or Regency believes it is the only party or one of a very limited number of potential buyers in negotiations with the potential seller. We cannot assure that ETP’s or Regency’s current or future acquisition efforts will be successful or that any such acquisition will be completed on favorable terms.
In addition, ETP and Regency each are experiencing increased competition for the assets they purchase or contemplate purchasing. Increased competition for a limited pool of assets could result in ETP or Regency losing to other bidders more often or acquiring assets at higher prices, both of which would limit ETP’s or Regency’s ability to fully execute their respective growth strategies. Inability to execute their respective growth strategies may materially adversely impact ETP’s or Regency’s results of operations.
33
If ETP and Regency do not make acquisitions on economically acceptable terms, their future growth could be limited.
ETP’s and Regency’s results of operations and their ability to grow and to increase distributions to Unitholders will depend in part on their ability to make acquisitions that are accretive to their respective distributable cash flow.
ETP and Regency may be unable to make accretive acquisitions for any of the following reasons, among others:
|
•
|
inability to identify attractive acquisition candidates or negotiate acceptable purchase contracts with them;
|
|
•
|
inability to raise financing for such acquisitions on economically acceptable terms; or
|
|
•
|
inability to outbid by competitors, some of which are substantially larger than ETP or Regency and may have greater financial resources and lower costs of capital.
|
Furthermore, even if ETP or Regency consummates acquisitions that it believes will be accretive, those acquisitions may in fact adversely affect its results of operations or result in a decrease in distributable cash flow per unit. Any acquisition involves potential risks, including the risk that ETP or Regency may:
|
•
|
fail to realize anticipated benefits, such as new customer relationships, cost-savings or cash flow enhancements;
|
|
•
|
decrease its liquidity by using a significant portion of its available cash or borrowing capacity to finance acquisitions;
|
|
•
|
significantly increase its interest expense or financial leverage if the acquisition is financed with additional debt;
|
|
•
|
encounter difficulties operating in new geographic areas or new lines of business;
|
|
•
|
incur or assume unanticipated liabilities, losses or costs associated with the business or assets acquired for which there is no indemnity or the indemnity is inadequate;
|
|
•
|
be unable to hire, train or retrain qualified personnel to manage and operate its growing business and assets;
|
|
•
|
less effectively manage its historical assets, due to the diversion of management’s attention from other business concerns; or
|
|
•
|
incur other significant charges, such as impairment of goodwill or other intangible assets, asset devaluation or restructuring charges.
|
If ETP and Regency consummate future acquisitions, their respective capitalization and results of operations may change significantly. As ETP and Regency determine the application of their funds and other resources, Unitholders will not have an opportunity to evaluate the economics, financial and other relevant information that ETP and Regency will consider.
If ETP and Regency do not continue to construct new pipelines, their future growth could be limited.
During the past several years, ETP and Regency have constructed several new pipelines, and ETP and Regency are currently involved in constructing additional pipelines. ETP’s and Regency’s results of operations and their ability to grow and to increase distributable cash flow per unit will depend, in part, on their ability to construct pipelines that are accretive to their respective distributable cash flow. ETP or Regency may be unable to construct pipelines that are accretive to distributable cash flow for any of the following reasons, among others:
|
•
|
inability to identify pipeline construction opportunities with favorable projected financial returns;
|
|
•
|
inability to raise financing for its identified pipeline construction opportunities; or
|
|
•
|
inability to secure sufficient natural gas transportation commitments from potential customers due to competition from other pipeline construction projects or for other reasons.
|
Furthermore, even if ETP or Regency constructs a pipeline that it believes will be accretive, the pipeline may in fact adversely affect its results of operations or fail to achieve results projected prior to commencement of construction.
Expanding ETP’s and Regency’s business by constructing new pipelines and treating and processing facilities subjects ETP and Regency to risks.
One of the ways that ETP and Regency have grown their respective businesses is through the construction of additions to existing gathering, compression, treating, processing and transportation systems. The construction of a new pipeline or the expansion of an existing pipeline, by adding additional compression capabilities or by adding a second pipeline along an existing pipeline, and the construction of new processing or treating facilities, involve numerous regulatory, environmental, political and legal uncertainties beyond ETP’s and Regency’s control and require the expenditure of significant amounts of capital to be financed through borrowings, the issuance of additional equity or from operating cash flow. If ETP or Regency undertakes these projects,
34
they may not be completed on schedule or at all or at the budgeted cost. A variety of factors outside ETP’s or Regency’s control, such as weather, natural disasters and difficulties in obtaining permits and rights-of-way or other regulatory approvals, as well as the performance by third-party contractors may result in increased costs or delays in construction. Cost overruns or delays in completing a project could have a material adverse effect on ETP’s or Regency’s results of operations and cash flows. Moreover, revenues may not increase immediately following the completion of a particular project. For instance, if ETP or Regency builds a new pipeline, the construction will occur over an extended period of time, but ETP or Regency, as applicable, may not materially increase its revenues until long after the project’s completion. In addition, the success of a pipeline construction project will likely depend upon the level of natural gas exploration and development drilling activity and the demand for pipeline transportation in the areas proposed to be serviced by the project as well as ETP’s and Regency’s abilities to obtain commitments from producers in these areas to utilize the newly constructed pipelines. In this regard, ETP and Regency may construct facilities to capture anticipated future growth in natural gas production in a region in which such growth does not materialize. As a result, new facilities may be unable to attract enough throughput or contracted capacity reservation commitments to achieve ETP’s or Regency’s expected investment return, which could adversely affect its results of operations and financial condition.
ETP and Regency depend on certain key producers for a significant portion of their supplies of natural gas. The loss of, or reduction in, any of these key producers could adversely affect ETP’s or Regency’s respective business and operating results.
ETP and Regency rely on a limited number of producers for a significant portion of their natural gas supplies. These contracts have terms that range from month-to-month to life of lease. As these contracts expire, ETP and Regency will have to negotiate extensions or renewals or replace the contracts with those of other suppliers. ETP and Regency may be unable to obtain new or renewed contracts on favorable terms, if at all. The loss of all or even a portion of the volumes of natural gas supplied by these producers and other customers, as a result of competition or otherwise, could have a material adverse effect on ETP’s and Regency’s business, results of operations, and financial condition.
ETP and Regency depend on key customers to transport natural gas through their pipelines.
ETP and Regency rely on a limited number of major shippers to transport certain minimum volumes of natural gas on their respective pipelines, and Regency maintains contracts for compression services with a limited number of key customers. The failure of the major shippers on ETP’s or Regency’s pipelines or of other key customers to fulfill their contractual obligations under these contracts could have a material adverse effect on the cash flow and results of operations of us, ETP or Regency if ETP or Regency, as applicable, was not able to replace these customers under arrangements that provide similar economic benefits as these existing contracts.
Federal, state or local regulatory measures could adversely affect the business and operations of ETP’s or Regency’s midstream and intrastate assets.
Midstream and intrastate transportation and storage operations are generally exempt from FERC regulation under the NGA, but FERC regulation still significantly affects ETP’s and Regency’s businesses and the market for their products. The rates, terms and conditions of some of the transportation and storage services ETP provides on the HPL System, the East Texas pipeline, the Oasis pipeline and the ET Fuel System are subject to FERC regulation under Section 311 of the Natural Gas Policy Act (“NGPA”) similarly, FERC regulates the rates, terms and conditions of services with regard to Section 311 service provided by RIGS. Under Section 311, rates charged for transportation and storage must be fair and equitable. Amounts collected in excess of fair and equitable rates are subject to refund with interest, and the terms and conditions of service, set forth in the pipeline’s statement of operating conditions, are subject to FERC review and approval. Should the FERC determine not to authorize rates equal to or greater than its currently approved rates, ETP or Regency may suffer a loss of revenue. Failure to observe the service limitations applicable to storage and transportation service under Section 311, failure to comply with the rates approved by FERC for Section 311 service, and failure to comply with the terms and conditions of service established in the pipeline’s FERC-approved statement of operating conditions could result in an alteration of jurisdictional status and/or the imposition of administrative, civil and criminal penalties.
FERC has adopted market-monitoring and annual and quarterly reporting regulations, which regulations are applicable to many intrastate pipelines as well as other entities that are otherwise not subject to FERC’s NGA jurisdiction, such as natural gas marketers. These regulations are intended to increase the transparency of wholesale energy markets, to protect the integrity of such markets, and to improve FERC’s ability to assess market forces and detect market manipulation. These regulations may result in administrative burdens and additional compliance costs for ETP and Regency.
ETP and Regency hold transportation contracts with interstate pipelines that are subject to FERC regulation. As shippers on an interstate pipeline, ETP and Regency are subject to FERC requirements related to use of the interstate capacity. Any failure on ETP’s or Regency’s part to comply with the FERC’s regulations or orders could result in the imposition of administrative, civil and criminal penalties.
35
ETP’s intrastate transportation and storage operations are subject to state regulation in Texas, Louisiana, Utah and Colorado, the states in which ETP conducts this type of operation. Regency’s intrastate transportation operations are subject to regulation in Louisiana, the state in which Regency conducts this type of operation. ETP’s intrastate transportation operations located in Texas are subject to regulation as common purchasers and as gas utilities by the TRRC. The TRRC’s jurisdiction extends to both rates and pipeline safety. The rates ETP charges for transportation and storage services are deemed just and reasonable under Texas law unless challenged in a complaint. Should a complaint be filed or should regulation become more active, ETP’s or Regency’s business may be adversely affected.
ETP’s and Regency’s midstream and intrastate transportation operations are also subject to ratable take and common purchaser statutes in the states in which they conduct those types of operations. Ratable take statutes generally require gatherers to take, without undue discrimination, natural gas production that may be tendered to the gatherer for handling. Similarly, common purchaser statutes generally require gatherers to purchase without undue discrimination as to source of supply or producer. These statutes have the effect of restricting ETP’s or Regency’s rights as an owner of gathering facilities to decide with whom it contracts to purchase or transport natural gas. Federal law leaves any economic regulation of natural gas gathering to the states, and some of the states in which ETP and Regency operate have adopted complaint-based or other limited economic regulation of natural gas gathering activities. States in which ETP and Regency operate that have adopted some form of complaint-based regulation, like Texas, generally allow natural gas producers and shippers to file complaints with state regulators in an effort to resolve grievances relating to natural gas gathering rates and access. Other state and local regulations also affect ETP’s or Regency’s business.
ETP’s storage facilities are also subject to the jurisdiction of the TRRC. Generally, the TRRC has jurisdiction over all underground storage of natural gas in Texas, unless the facility is part of or connected to an interstate gas pipeline system. Because the natural gas storage facilities of the ET Fuel System and HPL System are only connected to intrastate gas pipelines, they fall within the TRRC’s jurisdiction and must be operated pursuant to TRRC permit. Certain changes in ownership or operation of TRRC-jurisdictional storage facilities, such as facility expansions and increases in the maximum operating pressure, must be approved by the TRRC through an amendment to the facility’s existing permit. In addition, the TRRC must approve transfers of the permits. Texas laws and regulations also require all natural gas storage facilities to be operated to prevent waste, the uncontrolled escape of gas, pollution and danger to life or property. Accordingly, the TRRC requires natural gas storage facilities to implement certain safety, monitoring, reporting and record-keeping measures.
Violations of the terms and provisions of a TRRC permit or a TRRC order or regulation can result in the modification, cancellation or suspension of an operating permit and/or civil penalties, injunctive relief, or both.
The states in which ETP and Regency conduct operations administer federal pipeline safety standards under the Pipeline Safety Act of 1968 (“Pipeline Safety Act”) which requires certain pipeline companies to comply with safety standards in constructing and operating the pipelines, and subjects pipelines to regular inspections. Some of ETP’s gathering facilities are exempt from the requirements of the Pipeline Safety Act. In respect to recent pipeline accidents in other parts of the country, Congress and the DOT are considering heightened pipeline safety requirements.
Failure to comply with applicable laws and regulations could result in the imposition of administrative, civil and criminal remedies.
ETP’s and Regency’s interstate pipelines are subject to laws, regulations and policies governing the rates they are allowed to charge for their services.
Laws, regulations and policies governing interstate natural gas pipeline rates could affect the ability of ETP’s and Regency’s interstate pipelines to establish rates, to charge rates that would cover future increases in its costs, or to continue to collect rates that cover current costs. NGA-jurisdictional natural gas companies must charge rates that are deemed just and reasonable by FERC. The rates charged by natural gas companies are generally required to be on file with FERC in FERC-approved tariffs. Pursuant to the NGA, existing tariff rates may be challenged by complaint and rate increases proposed by the natural gas company may be challenged by protest. ETP and Regency also may be limited by the terms of negotiated rate agreements from seeking future rate increases, or constrained by competitive factors from charging its FERC-approved maximum just and reasonable rates. Further, the FERC has the ability, on a prospective basis, order refunds of amounts collected under rates that have been found by FERC to be in excess of a just and reasonable level.
On September 21, 2011, in lieu of filing a new general rate case filing under Section 4 of the NGA, Transwestern filed a proposed settlement with the FERC, which was approved by the FERC on October 31, 2011. Transwestern is required to file a new general rate case on October 1, 2014. However, shippers which were not parties to the settlement have the right to challenge the lawfulness of tariff rates that have become final and effective. FERC may also investigate such rates on its own initiative.
Some of the shippers on ETP and Regency's interstate pipelines pay rates established pursuant to long-term, negotiated rate transportation agreements. Prospective shippers on interstate pipelines that elect not to pay a negotiated rate for service may
36
instead choose to pay a cost-based recourse rate. Negotiated rate agreements generally provide a degree of certainty to the pipeline and shipper as to a fixed rate during the term of the relevant transportation agreement, but such agreements can limit the pipeline’s future ability to collect costs associated with construction and operation of the pipeline that might be higher than anticipated at the time the negotiated rate agreement was entered.
Any successful challenge to the rates of ETP’s or Regency’s interstate natural gas companies, whether the result of complaint, protest or investigation, could reduce its revenues associated with providing transportation services on a prospective basis. We, ETP and Regency cannot assure Unitholders that ETP’s or Regency’s interstate pipelines will be able to recover all of their costs through existing or future rates.
The ability of interstate pipelines held in tax-pass-through entities, like ETP and Regency, to include an allowance for income taxes in their regulated rates has been subject to extensive litigation before FERC and the courts, and the FERC’s current policy is subject to future refinement or change.
The ability of interstate pipelines held in tax-pass-through entities, like ETP and Regency, to include an allowance for income taxes as a cost-of-service element in their regulated rates has been subject to extensive litigation before FERC and the courts for a number of years. It is currently FERC’s policy to permit pipelines to include in cost-of-service a tax allowance to reflect actual or potential income tax liability on their public utility income attributable to all partnership or limited liability company interests, if the ultimate owner of the interest has an actual or potential income tax liability on such income. Whether a pipeline’s owners have such actual or potential income tax liability will be reviewed by FERC on a case-by-case basis. Under the FERC’s policy, ETP and Regency thus remain eligible to include an income tax allowance in the tariff rates their interstate pipelines charge for interstate natural gas transportation. The application of that policy remains subject to future refinement or change by FERC. With regard to rates charged and collected by Transwestern, the allowance for income taxes as a cost-of-service element in ETP’s tariff rates is generally not subject to challenge prior to the end of the term of its 2011 rate case settlement.
The interstate pipelines are subject to laws, regulations and policies governing terms and conditions of service, which could adversely affect their business and operations.
In addition to rate oversight, the FERC’s regulatory authority extends to many other aspects of the business and operations of ETP’s and Regency’s interstate pipelines, including:
|
•
|
operating terms and conditions of service;
|
|
•
|
the types of services interstate pipelines may offer their customers;
|
|
•
|
construction of new facilities;
|
|
•
|
acquisition, extension or abandonment of services or facilities;
|
|
•
|
reporting and information posting requirements;
|
|
•
|
accounts and records; and
|
|
•
|
relationships with affiliated companies involved in all aspects of the natural gas and energy businesses.
|
Compliance with these requirements can be costly and burdensome. Future changes to laws, regulations and policies in these areas may impair the ability of ETP’s and Regency’s interstate pipelines to compete for business, may impair their ability to recover costs or may increase the cost and burden of operation.
ETP and Regency must on occasion rely upon rulings by the FERC or other governmental authorities to carry out certain of their business plans. For example, in order to carry out its plan to construct the Fayetteville Express and Tiger pipelines ETP was required to, among other things, file and support before the FERC NGA Section 7(c) applications for certificates of public convenience and necessity to build, own and operate such facilities. ETP and Regency cannot guarantee that FERC will authorize construction and operation of any future interstate natural gas transportation project it might propose. ETP and Regency are required to attain approval from the FERC for expansions of their pipeline facilities. ETP cannot guarantee that the FERC will authorize any future interstate natural gas transportation project ETP might propose. Moreover, there is no guarantee that certificate authority for interstate projects will be granted in a timely manner or without being subject to potentially burdensome conditions.
Similarly, MEP was required to obtain from FERC a certificate of public convenience and necessity to build, own and operate the Midcontinent Express pipeline. Although the FERC has granted such certificate authority, the FERC’s certificate order is currently pending judicial review before the United States Court of Appeals for the District of Columbia Circuit. ETP and Regency cannot give any assurance that the court will affirm, in all material respects, the FERC’s July 25, 2008 Midcontinent Express certificate order, or that the FERC will not materially alter the certificate order on any remand that might be ordered by the court. There are also pending requests for rehearing related to certain of the FERC’s post-certification orders related to the Midcontinent Express
37
project. ETP and Regency cannot guarantee that these post-certification orders will not be altered on rehearing or that these orders will not be subject to judicial review.
Failure to comply with all applicable FERC-administered statutes, rules, regulations and orders, could bring substantial penalties and fines. Under the Energy Policy Act of 2005, FERC has civil penalty authority under the NGA to impose penalties for current violations of up to $1.0 million per day for each violation. FERC possesses similar authority under the NGPA.
Finally, we, ETP and Regency cannot give any assurance regarding the likely future regulations under which ETP or Regency will operate its interstate pipelines or the effect such regulation could have on its business, financial condition, and results of operations.
A change in the characterization of some of ETP’s or Regency’s assets by federal, state or local regulatory agencies or a change in policy by those agencies may result in increased regulation and cost.
The distinction between FERC-regulated transmission service and intrastate transportation or gathering services is the subject of regular litigation at FERC and in the courts and of policy discussions at FERC. The classification and regulation of some of the ETP or Regency gathering facilities or intrastate transportation pipelines may be subject to change based on future determinations by FERC, the courts, or Congress. Such a change could result in increased regulation by FERC, which may cause revenues to decline and operating expenses to increase.
ETP’s and Regency’s businesses involve hazardous substances and may be adversely affected by environmental regulation.
ETP’s and Regency’s natural gas and NGL operations are subject to stringent federal, state and local laws and regulations that seek to protect human health and the environment, including those governing the emission or discharge of materials into the environment. These laws and regulations may require the acquisition of permits for ETP’s and Regency’s operations, result in capital expenditures to manage, limit, or prevent emissions, discharges or releases of various materials from ETP’s and Regency’s pipelines, plants and facilities and impose substantial liabilities for pollution resulting from ETP’s and Regency’s operations. Several governmental authorities, such as the EPA have the power to enforce compliance with these laws and regulations and the permits issued under them and frequently mandate difficult and costly remediation measures and other actions. Failure to comply with these laws, regulations and permits may result in the assessment of significant administrative, civil and criminal penalties, the imposition of remedial obligations and the issuance of injunctive relief.
ETP and Regency may incur substantial environmental costs and liabilities because of the underlying risk inherent to its operations. Certain environmental laws and regulations can provide for joint and several strict liability for cleanup to address discharges or releases of petroleum hydrocarbons or other materials or wastes at sites to which ETP or Regency may have sent wastes or on, under, or from ETP’s and Regency’s properties and facilities, many of which have been used for industrial activities for a number of years, even if such discharges were caused by ETP’s and Regency’s respective predecessors. Private parties, including the owners of properties through which ETP’s and Regency’s gathering systems pass or facilities where their petroleum hydrocarbons or wastes are taken for reclamation or disposal, may also have the right to pursue legal actions to enforce compliance as well as to seek damages for non-compliance with environmental laws and regulations or for personal injury or property damage. For example, the total accrued future estimated cost of remediation activities relating to ETP’s Transwestern pipeline operations was approximately
$5.7 million
as of
December 31, 2011
, which is included in the aggregate environmental accruals, and such activities are expected to continue through 2025.
Changes in environmental laws and regulations occur frequently, and changes that result in significantly more stringent and costly waste handling, emission standards, or storage, transport, disposal or remediation requirements could have a material adverse effect on ETP’s and Regency’s operations or financial position. For example, the EPA in 2008 lowered the federal ozone standard from 0.08 ppm to 0.075 ppm, requiring the environmental agencies in states with areas that do not currently meet this standard to adopt new rules to further reduce NOx and other ozone precursor emissions. ETP and Regency have previously been able to satisfy the more stringent NOx emission reduction requirements that affect its compressor units in ozone non-attainment areas at reasonable cost, but there is no guarantee that the changes ETP or Regency may have to make in the future to meet the new ozone standard or other evolving standards will not require it to incur costs that could be material to its operations.
Recently proposed rules regulating air emissions from oil and natural gas operations could cause us to incur increased capital expenditures and operating costs, which may be significant.
On July 28, 2011, the U.S. Environmental Protection Agency ("EPA") proposed rules that would establish new air emission controls for oil and natural gas production and natural gas processing operations. Specifically, EPA's proposed rule package includes New Source Performance Standards ("NSPS") to address emissions of sulfur dioxide and volatile organic compounds ("VOCs"), and a separate set of emission standards to address hazardous air pollutants frequently associated with oil and natural gas production and processing activities. The EPA's proposal would require the reduction of VOC emissions from oil and natural gas production facilities by mandating the use of "green completions" for hydraulic fracturing, which requires the operator to recover rather than
38
vent the gas and natural gas liquids that come to the surface during completion of the fracturing process. The proposed rules also would establish specific requirements regarding emissions from compressors, dehydrators, storage tanks and other production equipment. In addition, the rules would establish new leak detection requirements for natural gas processing plants. The EPA must take final action on the proposed rules by February 28, 2012. If finalized, these rules could require a number of modifications to ETP's or Regency's operations including the installation of new equipment. Compliance with such rules will be required within three years of publication of the final rules, and it could result in significant costs, including increased capital expenditures and operating costs, which may adversely impact ETP's or Regency's businesses.
Climate change legislation or regulations restricting emissions of “greenhouse gases” could result in increased operating costs and reduced demand for the natural gas and other hydrocarbon products that ETP and Regency transport, store or otherwise handle in connection with their transportation, storage, and midstream services.
In December 2009, the EPA determined that emissions of carbon dioxide, methane and other “greenhouse gases” present an endangerment to public health and the environment because emissions of such gases are, according to the EPA, contributing to warming of the Earth’s atmosphere and other climatic changes. Based on these findings, the EPA has begun adopting and implementing regulations to restrict emissions of greenhouse gases under existing provisions of the federal Clean Air Act. The EPA recently adopted two sets of rules regulating greenhouse gas emissions under the Clean Air Act, one of which requires a reduction in emissions of greenhouse gases from motor vehicles and the other of which regulates emissions of greenhouse gases from certain large stationary sources, effective January 2, 2011. The EPA’s rules relating to emissions of greenhouse gases from large stationary sources of emissions are currently subject to a number of legal challenges, but the federal courts have thus far declined to issue any injunctions to prevent EPA from implementing, or requiring state environmental agencies to implement, the rules.
In addition, the United States Congress has from time to time considered adopting legislation to reduce emissions of greenhouse gases and almost one-half of the states have already taken legal measures to reduce emissions of greenhouse gases primarily through the planned development of greenhouse gas emission inventories and/or regional greenhouse gas cap and trade programs. Most of these cap and trade programs work by requiring major sources of emissions, such as electric power plants, or major producers of fuels, such as refineries and gas processing plants, to acquire and surrender emission allowances. The number of allowances available for purchase is reduced each year in an effort to achieve the overall greenhouse gas emission reduction goal.
The adoption of legislation or regulatory programs to reduce emissions of greenhouse gases could require ETP or Regency to incur increased operating costs, such as costs to purchase and operate emissions control systems, to acquire emissions allowances or comply with new regulatory or reporting requirements. Any such legislation or regulatory programs could also increase the cost of consuming, and thereby reduce demand for, natural gas or NGLs. Consequently, legislation and regulatory programs to reduce emissions of greenhouse gases could have an adverse effect on ETP’s or Regency’s businesses, financial conditions and results of operations.
Some have suggested that one consequence of climate change could be increased severity of extreme weather, such as increased hurricanes and floods. If such effects were to occur, the operations of ETP and Regency could be adversely affected in various ways, including damages to their facilities from powerful winds or rising waters, or increased costs for insurance. Another possible consequence of climate change is increased volatility in seasonal temperatures. The market for ETP’s and Regency’s natural gas is generally improved by periods of colder weather and impaired by periods of warmer weather, so any changes in climate could affect the market for the fuels that ETP and Regency produce. Despite the use of the term “global warming” as a shorthand for climate change, some studies indicate that climate change could cause some areas to experience temperatures substantially colder than their historical averages. As a result, it is difficult to predict how the market for ETP’s and Regency’s fuels could be affected by increased temperature volatility, although if there is an overall trend of warmer temperatures, it would be expected to have an adverse effect on the business of ETP and Regency.
Federal and state legislative and regulatory initiatives relating to hydraulic fracturing could slow ETP’s and Regency’s customers’ development of shale gas supplies.
Congress is considering legislation to amend the federal Safe Drinking Water Act to require the disclosure of chemicals used by the oil and natural gas industry in the hydraulic fracturing process. Hydraulic fracturing is an important and commonly used process in the completion of unconventional natural gas wells in shale formations. This process involves the injection of water, sand and chemicals under pressure into rock formations to stimulate natural gas production. Sponsors of these bills, which are pending in the Energy and Commerce Committee and the Environmental and Public Works Committee of the House of Representatives and Senate, respectively, have asserted that chemicals used in the fracturing process could adversely affect drinking water supplies. The proposed legislation would require the reporting and public disclosure of chemicals used in the fracturing process, which could make it easier for third parties opposing the hydraulic fracturing process to initiate legal proceedings based on allegations that chemicals used in the fracturing process had adversely affected groundwater. If adopted, these bills also would
39
establish additional federal permitting and regulatory requirements that could lead to operational delays or increased operating costs. In addition, the EPA recently announced that it was beginning a comprehensive research study on the potential impacts that hydraulic fracturing may have on water quality and public health. Consequently, even if the introduced bills are not enacted, EPA’s study could spur further action at a later date toward additional federal legislation and regulation of hydraulic fracturing activities. Legislative and regulatory initiatives have also arisen in several states, including New York and Pennsylvania. By slowing the pace of natural gas development, the imposition of additional regulatory requirements on hydraulic fracturing could affect the financial performance of ETP’s and Regency’s existing and planned pipeline systems, particularly those serving the Barnett and Haynesville production areas or other shale gas plays.
Any reduction in the capacity of, or the allocations to, ETP’s and Regency’s shippers in interconnecting, third-party pipelines could cause a reduction of volumes transported in ETP’s and Regency’s pipelines, which would adversely affect revenues and cash flow.
Users of ETP’s and Regency’s pipelines are dependent upon connections to and from third-party pipelines to receive and deliver natural gas and NGLs. Any reduction in the capacities of these interconnecting pipelines due to testing, line repair, reduced operating pressures, or other causes could result in reduced volumes being transported in ETP’s and Regency’s pipelines. Similarly, if additional shippers begin transporting volumes of natural gas and NGLs over interconnecting pipelines, the allocations to existing shippers in these pipelines would be reduced, which could also reduce volumes transported in ETP’s and Regency’s pipelines. Any reduction in volumes transported in ETP’s and Regency’s pipelines would adversely affect their revenues and cash flow.
ETP and Regency encounter competition from other midstream and transportation and storage companies.
ETP and Regency compete with similar enterprises in each of their areas of operations. Some of their competitors are large oil, natural gas, gathering and processing and natural gas pipeline companies that have greater financial resources and access to supplies of natural gas. In addition, ETP’s and Regency’s customers who are significant producers or consumers of NGLs may develop their own processing facilities in lieu of using those of ETP or Regency. Similarly, competitors may establish new connections with pipeline systems that would create additional competition for services that ETP and Regency provide to their customers. ETP’s and Regency’s ability to renew or replace existing contracts with their customers at rates sufficient to maintain current revenues and cash flows could be adversely affected by the activities of their competitors.
The Transwestern, Midcontinent Express, Fayetteville Express, Tiger and Gulf States pipelines compete with other interstate and intrastate pipeline companies in the transportation and storage of natural gas. The principal elements of competition among pipelines are rates, terms of service and the flexibility and reliability of service. Natural gas competes with other forms of energy available to ETP’s and Regency’s customers and end-users, including electricity, coal and fuel oils. The primary competitive factor is price. Changes in the availability or price of natural gas and other forms of energy, the level of business activity, conservation, legislation and governmental regulations, the capability to convert to alternate fuels and other factors, including weather and natural gas storage levels, affect the levels of natural gas transportation volumes in the areas served by ETP’s and Regency’s pipelines.
The natural gas contract compression business is highly competitive, and there are low barriers to entry for individual projects. In addition, some of Regency’s competitors are large national and multinational companies that have greater financial and other resources. Regency’s ability to renew or replace existing contracts with its customers at rates sufficient to maintain current revenue and cash flows could be adversely affected by the activities of its competitors and its customers. If Regency’s competitors substantially increase the resources they devote to the development and marketing of competitive services or substantially decrease the prices at which they offer their services, Regency may be unable to compete effectively. Some of these competitors may expand or construct newer or more powerful compressor fleets that would create additional competition for Regency. In addition, Regency’s customers that are significant producers of natural gas and crude oil may purchase and operate their own compressor fleets in lieu of using Regency’s natural gas contract compression services. All of these competitive pressures could have a material adverse effect on Regency’s business, results of operations, and financial condition.
The inability to continue to access tribal lands could adversely affect Transwestern’s ability to operate its pipeline system and the inability to recover the cost of right-of-way grants on tribal lands could adversely affect its financial results.
Transwestern’s ability to operate its pipeline system on certain lands held in trust by the United States for the benefit of a Native American tribe, which we refer to as tribal lands, will depend on its success in maintaining existing rights-of-way and obtaining new rights-of-way on those tribal lands. Securing extensions of existing and any additional rights-of-way is also critical to Transwestern’s ability to pursue expansion projects. We cannot provide any assurance that Transwestern will be able to acquire new rights-of-way on tribal lands or maintain access to existing rights-of-way upon the expiration of the current grants. ETP’s financial position could be adversely affected if the costs of new or extended right-of-way grants cannot be recovered in rates. Transwestern’s existing right-of-way agreements with the Navajo Nation, Southern Ute, Pueblo of Laguna and Fort Mojave tribes extend through November 2029, September 2020, December 2022 and April 2019, respectively.
40
ETP and Regency may be unable to bypass the processing plants, which could expose them to the risk of unfavorable processing margins.
ETP and Regency can generally elect to bypass their respective processing plants when processing margins are unfavorable and instead deliver pipeline-quality gas by blending rich gas from the gathering systems with lean gas transported on the their other gathering pipelines and systems. In some circumstances, such as when ETP and Regency do not have a sufficient amount of lean gas to blend with the volume of rich gas that they receive at the processing plant, ETP and Regency may have to process the rich gas. If ETP or Regency has to process gas when processing margins are unfavorable, its results of operations will be adversely affected.
ETP and Regency may be unable to retain existing customers or secure new customers, which would reduce their revenues and limit its future profitability.
The renewal or replacement of existing contracts with ETP’s and Regency’s customers at rates sufficient to maintain current revenues and cash flows depends on a number of factors beyond its control, including competition from other pipelines, and the price of, and demand for, natural gas in the markets ETP and Regency serve.
As a consequence of the increase in competition in the industry and volatility of natural gas prices, end-users and utilities are increasingly reluctant to enter into long-term purchase contracts. Many end-users purchase natural gas from more than one natural gas company and have the ability to change providers at any time. Some of these end-users also have the ability to switch between gas and alternate fuels in response to relative price fluctuations in the market. Because there are many companies of greatly varying size and financial capacity that compete with ETP and Regency in the marketing of natural gas, ETP and Regency often compete in the end-user and utilities markets primarily on the basis of price. The inability of ETP’s or Regency’s management to renew or replace its current contracts as they expire and to respond appropriately to changing market conditions could have a negative effect on ETP’s or Regency’s profitability.
ETP’s natural gas storage business may depend on neighboring pipelines to transport natural gas.
To obtain natural gas, ETP’s natural gas storage business depends on the pipelines to which they have access. Many of these pipelines are owned by parties not affiliated with ETP or Regency. Any interruption of service on those pipelines or adverse change in their terms and conditions of service could have a material adverse effect on ETP’s or Regency’s ability, and the ability of its customers, to transport natural gas to and from its facilities and a corresponding material adverse effect on ETP’s storage revenues. In addition, the rates charged by those interconnected pipelines for transportation to and from ETP’s facilities affect the utilization and value of its storage services. Significant changes in the rates charged by those pipelines or the rates charged by other pipelines with which the interconnected pipelines compete could also have a material adverse effect on ETP’s storage revenues.
ETP’s and Regency’s pipeline integrity programs may cause them to incur significant costs and liabilities.
ETP’s and Regency’s pipeline operations are subject to regulation by the DOT, under the Pipeline Hazardous Materials Safety Administration (“PHMSA”) pursuant to which the PHMSA has established regulations relating to the design, installation, testing, construction, operation, replacement and management of pipeline facilities. Moreover, the PHMSA, through the Office of Pipeline Safety, has promulgated a rule requiring pipeline operators to develop integrity management programs to comprehensively evaluate their pipelines, and take measures to protect pipeline segments located in what the rule refers to as “high consequence areas.” Activities under these integrity management programs involve the performance of internal pipeline inspections, pressure testing or other effective means to assess the integrity of these regulated pipeline segments, and the regulations require prompt action to address integrity issues raised by the assessment and analysis. Based on the results of ETP’s current pipeline integrity testing programs, ETP estimates that compliance with these federal regulations and analogous state pipeline integrity requirements will result in capital costs of
$3.4 million
and operating and maintenance costs of
$17.9 million
over the course of the next year, while Regency estimates that compliance with these federal regulations and analogous state pipeline integrity requirements will results in
$0.8 million
. For the years ended
December 31, 2011
,
2010
and
2009
,
$18.3 million
,
$13.3 million
and
$31.4 million
, respectively, of capital costs and
$14.7 million
,
$15.4 million
and
$18.5 million
, respectively, of operating and maintenance costs have been incurred for pipeline integrity testing by ETP. Integrity testing and assessment of all of these assets will continue, and the potential exists that results of such testing and assessment could cause ETP or Regency to incur material capital and operating expenditures for repairs or upgrades deemed necessary to ensure the continued safe and reliable operation of their pipelines.
Changes in other forms of health and safety regulations are also being considered. New pipeline safety legislation requiring more stringent spill reporting and disclosure obligations has been introduced in the U.S. Congress and was passed by the U.S. House of Representatives in 2010, but was not voted on in the U.S. Senate. Similar legislation is likely to be considered in the current session of Congress. The DOT has also recently proposed legislation providing for more stringent oversight of pipelines and increased penalties for violations of safety rules, which is in addition to the PHMSA’s announced intention to strengthen its rules.
41
Such Legislative and regulatory changes could have a material effect on ETP’s or Regency’s operations through more stringent and comprehensive safety regulations and higher penalties for the violation of those regulations.
A natural disaster, catastrophe or other event could result in severe personal injury, property damage and environmental damage, which could curtail ETP’s and Regency’s operations and otherwise materially adversely affect their cash flow.
Some of ETP’s and Regency’s operations involve risks of personal injury, property damage and environmental damage, which could curtail its operations and otherwise materially adversely affect its cash flow. For example, natural gas facilities operate at high pressures, sometimes in excess of 1,100 pounds per square inch. Virtually all of ETP’s and Regency’s operations are exposed to potential natural disasters, including hurricanes, tornadoes, storms, floods and/or earthquakes.
If one or more facilities that are owned by ETP or Regency or that deliver natural gas or other products to ETP or Regency are damaged by severe weather or any other disaster, accident, catastrophe or event, ETP’s or Regency’s operations could be significantly interrupted. Similar interruptions could result from damage to production or other facilities that supply ETP’s or Regency’s facilities or other stoppages arising from factors beyond its control. These interruptions might involve significant damage to people, property or the environment, and repairs might take from a week or less for a minor incident to six months or more for a major interruption. Any event that interrupts the revenues generated by ETP’s or Regency’s operations, or which causes it to make significant expenditures not covered by insurance, could reduce ETP’s or Regency’s cash available for paying distributions to its Unitholders, including us.
As a result of market conditions, premiums and deductibles for certain insurance policies can increase substantially, and in some instances, certain insurance may become unavailable or available only for reduced amounts of coverage. As a result, ETP and Regency may not be able to renew existing insurance policies or procure other desirable insurance on commercially reasonable terms, if at all. If ETP or Regency were to incur a significant liability for which it was not fully insured, it could have a material adverse effect on ETP’s or Regency’s financial position and results of operations, as applicable. In addition, the proceeds of any such insurance may not be paid in a timely manner and may be insufficient if such an event were to occur.
Terrorist attacks aimed at ETP’s or Regency’s facilities could adversely affect its business, results of operations, cash flows and financial condition.
Since the September 11, 2001 terrorist attacks on the United States, the United States government has issued warnings that energy assets, including the nation’s pipeline infrastructure, may be the future target of terrorist organizations. Any terrorist attack on ETP’s or Regency’s facilities or pipelines or those of its customers could have a material adverse effect on ETP’s or Regency’s business, as applicable.
ETP has a significant equity investment in AmeriGas and the value of this investment, and the cash distributions ETP expects to receive from this investment, are subject to the risks encountered by AmeriGas with respect to its business.
In January 2012, ETP consummated the contribution of its Propane Business to AmeriGas in exchange for consideration of approximately $1.46 billion in cash and approximately 29.6 million AmeriGas common units, plus the assumption of approximately $71 million of existing HOLP debt. The value of ETP's investment in AmeriGas common units and the cash distributions it expects to receive on a quarterly basis with respect to these common units, are subject to the risks encountered by AmeriGas with respect to its business, including the following:
|
•
|
adverse weather condition resulting in reduced demand;
|
|
•
|
cost volatility and availability of propane, and the capacity to transport propane to its customers;
|
|
•
|
the availability of, and its ability to consummate, acquisition or combination opportunities;
|
|
•
|
successful integration and future performance of acquired assets or businesses;
|
|
•
|
changes in laws and regulations, including safety, tax, consumer protection and accounting matters;
|
|
•
|
competitive pressures from the same and alternative energy sources;
|
|
•
|
failure to acquire new customers and retain current customers thereby reducing or limiting any increase in revenues;
|
|
•
|
liability for environmental claims;
|
|
•
|
increased customer conservation measures due to high energy prices and improvements in energy efficiency and technology resulting in reduced demand;
|
|
•
|
adverse labor relations;
|
|
•
|
large customer, counter-party or supplier defaults;
|
42
|
•
|
liability in excess of insurance coverage for personal injury and property damage arising from explosions and other catastrophic events, including acts of terrorism, resulting from operating hazards and risks incidental to transporting, storing and distributing propane, butane and ammonia;
|
|
•
|
political, regulatory and economic conditions in the United States and foreign countries;
|
|
•
|
capital market conditions, including reduced access to capital markets and interest rate fluctuations;
|
|
•
|
changes in commodity market prices resulting in significantly higher cash collateral requirements;
|
|
•
|
the impact of pending and future legal proceedings;
|
|
•
|
the timing and success of its acquisitions and investments to grow its business; and
|
|
•
|
its ability to successfully integrate acquired businesses and achieve anticipated synergies.
|
Regency’s contract compression operations depend on particular suppliers and is vulnerable to parts and equipment shortages and price increases, which could have a negative impact on its results of operations.
The principal manufacturers of components for Regency’s natural gas compression equipment include Caterpillar, Inc. for engines, Air-X-Changers for coolers, and Ariel Corporation for compressors and frames. Regency’s reliance on these suppliers involves several risks, including price increases and a potential inability to obtain an adequate supply of required components in a timely manner. Regency also relies primarily on two vendors, Spitzer Industries Corp. and Standard Equipment Corp., to package and assemble its compression units. Regency does not have long-term contracts with these suppliers or packagers, and a partial or complete loss of certain of these sources could have a negative impact on Regency’s results of operations and could damage its customer relationships. In addition, since Regency expects any increase in component prices for compression equipment or packaging costs will be passed on to Regency, a significant increase in their pricing could have a negative impact on Regency’s results of operations.
The recent adoption of financial reform legislation by the United States Congress could have an adverse effect on our ability to use derivative instruments to reduce the effect of commodity price, interest rate and other risks associated with our business.
The United States Congress adopted the Dodd-Frank Wall Street Reform and Consumer Protection Act (HR 4173) in 2010, which, among other provisions, establishes federal oversight and regulation of the over-the-counter derivatives market and entities that participate in that market. This legislation requires the Commodities Futures Trading Commission (the “CFTC”), the SEC and other regulators to promulgate rules and regulations implementing the new legislation within 360 days from the date of enactment. In December 2011, the CFTC extended temporary exemptive relief from certain swap regulation provisions of the legislation until July 16, 2012. The CFTC has issued final regulations to set position limits for certain futures and option contracts in the major energy markets and for swaps that are their economic equivalents. It is not possible at this time to predict when the CFTC make these regulations effective. The legislation may also require us to comply with margin requirements and with certain clearing and trade-execution requirements in connection with our derivative activities, although the application of those provisions to us is uncertain at this time. The financial reform legislation may also require the counterparties to our derivative instruments to spin off some of their derivatives activities to a separate entity, which may not be as creditworthy as the current counterparty. The new legislation and any new regulations could significantly increase the cost of derivative contracts (including through requirements to post collateral, which could adversely affect our available liquidity), materially alter the terms of derivative contracts, reduce the availability of derivatives to protect against risks we encounter, reduce our ability to monetize or restructure its existing derivative contracts, and increase our exposure to less creditworthy counterparties. If we reduce our use of derivatives as a result of the legislation and regulations, our results of operations may become more volatile and our cash flows may be less predictable.
ETP and Regency do not control, and therefore may not be able to cause or prevent certain actions by, certain of their joint ventures.
Certain of ETP’s and Regency’s joint ventures have their own governing boards, and ETP or Regency may not control all of the decisions of those boards. Consequently, it may be difficult or impossible for ETP or Regency to cause the joint venture entity to take actions that ETP or Regency believe would be in their or the joint venture’s best interests. Likewise, ETP or Regency may be unable to prevent actions of the joint venture.
The profitability of certain activities in ETP’s or Regency’s NGL and refined products storage business, NGL transportation business and off-gas processing and fractionating business are largely dependent upon market demand for NGLs and refined products, which has been volatile, and competition in the market place, both of which are factors that are beyond our control.
ETP’s and Regency’s NGL and refined products storage revenues are primarily derived from fixed capacity arrangements between ETP or Regency and their customers. However, a portion of ETP’s and Regency’s revenue is derived from fungible storage and throughput arrangements, under which revenue is more dependent upon demand for storage from customers. Demand for these
43
services may fluctuate as a result of changes in commodity prices. ETP’s and Regency’s NGL and refined products storage assets are primarily located in the Mont Belvieu area, which is a significant storage distribution and trading complex with multiple industry participants, any one of which could compete for the business of ETP’s and Regency’s existing and potential customers. Any loss of business from existing customers or ETP’s or Regency’s inability to attract new customers could have an adverse effect on our results of operations.
Revenue from ETP’s and Regency’s NGL transportation systems is exposed to risks due to fluctuations in demand for transportation as a result of unfavorable commodity prices and competition from nearby pipelines. ETP and Regency receive substantially all of their transportation revenues through dedicated contracts under which the customer agrees to deliver the total output from particular processing plants that are connected only to ETP’s or Regency’s transportation system. ETP or Regency may not be able to renew these contracts or execute new customer contracts on favorable terms if NGL prices decline and demand for ETP’s or Regency’s transportation services decreases. Any loss of existing customers due to decreased demand for ETP’s or Regency’s services or competition from other transportation service providers could have a negative impact on our revenues and have an adverse effect on our results of operations.
Revenue from ETP’s and Regency’s off-gas processing and fractionating system in south Louisiana is exposed to risks due to the low concentration of suppliers near the facilities and the possibility that connected refineries may not provide ETP or Regency with sufficient off-gas for processing at their facilities. The connected refineries may also experience outages due to maintenance issues and severe weather, such as hurricanes. ETP and Regency receive revenues primarily through customer agreements that are a combination of keep-whole and percent-of-proceeds arrangements, as well as from transportation and fractionation fees. Consequently, a large portion of ETP’s and Regency’s off-gas processing and fractionation revenue is exposed to risks due to fluctuations in commodity prices. In addition, a decline in NGL prices could cause a decrease in demand for ETP’s or Regency’s off-gas processing and fractionation services and could have an adverse effect on our results of operations.
The markets and prices for natural gas and NGLs depend upon factors beyond our control. These factors include demand for oil, natural gas and NGLs, which fluctuate with changes in market and economic conditions, and other factors, including:
|
•
|
the impact of weather on the demand for oil, natural gas and NGLs;
|
|
•
|
the level of domestic oil and natural gas production;
|
|
•
|
the availability of imported oil, natural gas and NGLs;
|
|
•
|
actions taken by foreign oil and gas producing nations;
|
|
•
|
the availability of local transportation systems;
|
|
•
|
the price, availability and marketing of competitive fuels;
|
|
•
|
the demand for electricity;
|
|
•
|
the impact of energy conservation efforts; and
|
|
•
|
the extent of governmental regulation and taxation.
|
ETP's and Regency's pipelines may be subject to more stringent safety regulation.
On January 3, 2012, the Pipeline Safety, Regulatory Certainty, and Job Creation Act of 2011, became effective. The new law requires more stringent oversight of pipelines and increased civil penalties for violations of pipeline safety rules. The law requires numerous studies and/or the development of rules over the next two years covering the expansion of integrity management, use of automatic and remote-controlled shut-off valves, leak detection systems, sufficiency of existing regulation of gathering pipelines, use of excess flow valves, verification of maximum allowable operating pressure, incident notification, and other pipeline-safety related rules. The DOT has already proposed rules that address many areas of the newly adopted legislation. Any regulatory changes could have a material effect on ETP's or Regency's operations through more stringent and comprehensive safety regulations and higher penalties for the violation of those regulations.
Certain of ETP’s and Regency’s assets may become subject to regulation.
Intrastate transportation of NGLs is largely regulated by the state in which such transportation takes place. The West Texas pipeline, which ETP and Regency acquired as part the LDH acquisition, transports NGLs within the state of Texas and is subject to regulation by the Texas Railroad Commission (“TRRC”). This NGL transportation system offers services pursuant to an intrastate transportation tariff on file with the TRRC. Such services must be provided in a manner that is just, reasonable and non-discriminatory. ETP and Regency believe that this NGL system does not currently provide interstate service and that it is thus not subject to FERC jurisdiction under the Interstate Commerce Act (the "ICA") and the Energy Policy Act of 1992. We cannot guarantee that the jurisdictional status of this NGL pipeline system will remain unchanged. If the West Texas pipeline became
44
subject to regulation by the FERC, pursuant to the ICA, the FERC’s rate-making methodologies may, among other things, delay the use of rates that reflect increased costs and subject ETP or Regency to potentially burdensome and expensive operational, reporting and other requirements. Any of the foregoing could adversely affect revenues and cash flow related to these assets.
Tax Risks to Common Unitholders
Our tax treatment depends on our continuing status as a partnership for federal income tax purposes, as well as our not being subject to a material amount of additional entity-level taxation by individual states. If the IRS were to treat us, ETP or Regency as a corporation for federal income tax purposes or if we, ETP or Regency become subject to a material amount of entity-level taxation for state tax purposes, it would substantially reduce the amount of cash available for distribution to Unitholders.
The anticipated after-tax economic benefit of an investment in our Common Units depends largely on our being treated as a partnership for federal income tax purposes. We have not requested, and do not plan to request, a ruling from the IRS on this matter. The value of our investments in ETP and Regency depends largely on ETP and Regency being treated as partnerships for federal income tax purposes.
Despite the fact that we, ETP and Regency are each a limited partnership under Delaware law, it is possible in certain circumstances for a partnership such as ours to be treated as a corporation for federal income tax purposes. If we are so treated, we would pay federal income tax on our taxable income at the corporate tax rate, which is currently a maximum of 35%, and we would likely pay additional state income taxes as well. If ETP or Regency were treated as a corporation for federal income tax purposes for any taxable year for which the statute of limitations remains open or for any future taxable year, it would pay federal income tax on its taxable income at the corporate tax rate. Distributions to us would generally be taxed again as corporate distributions, and no income, gains, losses, deductions or credits would flow through to us. As a result, there would be a material reduction in the anticipated cash flow. In either case, our available cash would be substantially reduced.
The present tax treatment of publicly traded partnerships, including us, or an investment in our Common Units, may be modified by administrative, legislative or judicial interpretation at any time, causing us or our subsidiaries to be treated as a corporation for federal income tax purposes or otherwise subjecting us or our subsidiaries to entity-level taxation. For example, recently, members of the U.S. Congress considered substantive changes to the U.S. federal income tax laws that would have affected the tax treatment of certain publicly traded partnerships. Several states currently impose entity-level taxes on partnerships, including us. Further, because of widespread state budget deficits and other reasons, several additional states are evaluating ways to subject partnerships to entity level taxation through the imposition of state income, franchise and other forms of taxation. If any additional states were to impose a tax upon us or our subsidiaries as an entity, our cash available for distribution would be reduced. Any modification to the U.S. federal income or state tax laws, or interpretations thereof, may or may not be applied retroactively. Although we are unable to predict whether any of these changes or any other proposals will be reintroduced or will ultimately be enacted, any such changes could negatively impact the value of an investment in our Common Units or the Common Units of ETP or Regency.
Our partnership agreement provides that if a law is enacted or existing law is modified or interpreted in a manner that subjects us to taxation as a corporation or to additional taxation as an entity for federal, state or local income tax purposes, the minimum quarterly distribution amount and the target distribution amounts may be adjusted to reflect the impact of that law on us.
The tax treatment of our structure is subject to potential legislative, judicial or administrative changes and differing interpretations, possibly on a retroactive basis.
The U.S. federal income tax treatment of Unitholders depends in some instances on determinations of fact and interpretations of complex provisions of U.S. federal income tax law. The U.S. federal income tax rules are constantly under review by persons involved in the legislative process, the IRS, and the U.S. Treasury Department, frequently resulting in revised interpretations of established concepts, statutory changes, revisions to Treasury Regulations and other modifications and interpretations. The present U.S. federal income tax treatment of an investment in our Common Units may be modified by administrative, legislative or judicial interpretation at any time. Any modification to the U.S. federal income tax laws and interpretations thereof may or may not be applied retroactively and could make it more difficult or impossible to meet the exception for us to be treated as a partnership for U.S. federal income tax purposes that is not taxable as a corporation (referred to as the “Qualifying Income Exception”), affect or cause us to change our business activities, affect the tax considerations of an investment in us, change the character or treatment of portions of our income and adversely affect an investment in our Common Units. For example, in response to certain recent developments, members of Congress are considering substantive changes to the definition of qualifying income under Internal Revenue Code section 7704(d). It is possible that these efforts could result in changes to the existing U.S. federal tax laws that affect publicly traded partnerships, including us. We are unable to predict whether any of these changes or other proposals will ultimately be enacted. Any such changes could negatively impact the value of an investment in our Common Units as well as the value of an investment in ETP and Regency Common Units.
45
If the IRS contests the federal income tax positions we or our subsidiaries take, the market for our Common Units, ETP Common Units or Regency Common Units may be adversely affected and the costs of any such contest will reduce cash available for distributions to our Unitholders.
Neither we nor our subsidiaries have requested a ruling from IRS with respect to our treatment as partnerships for federal income tax purposes. The IRS may adopt positions that differ from the positions we or our subsidiaries take. It may be necessary to resort to administrative or court proceedings to sustain some or all of the positions we or our subsidiaries take. A court may not agree with some or all of the positions we or our subsidiaries take. Any contest with the IRS may materially and adversely impact the market for our Common Units, ETP’s Common Units or Regency’s Common Units and the prices at which they trade. In addition, the costs of any contest with the IRS will be borne by us or our subsidiaries, and therefore indirectly by us, as a Unitholder and as the owner of the general partner of interests in ETP and Regency, reducing the cash available for distribution to our Unitholders.
Unitholders may be required to pay taxes on their share of our income even if they do not receive any cash distributions from us.
Because our Unitholders will be treated as partners to whom we will allocate taxable income which could be different in amount than the cash we distribute, Unitholders will be required to pay any federal income taxes and, in some cases, state and local income taxes on their share of our taxable income even if they receive no cash distributions from us. Unitholders may not receive cash distributions from us equal to their share of our taxable income or even equal to the actual tax liability that results from the taxation of their share of our taxable income.
Tax gain or loss on disposition of our Common Units could be more or less than expected.
If Unitholders sell their Common Units, they will recognize a gain or loss equal to the difference between the amount realized and the tax basis in those Common Units. Because distributions in excess of the Unitholder’s allocable share of our net taxable income decrease the Unitholder’s tax basis in their Common Units, the amount, if any, of such prior excess distributions with respect to the units sold will, in effect, become taxable income to the Unitholder if they sell such units at a price greater than their adjusted tax basis in those units, even if the price received is less than their original cost. Furthermore, a substantial portion of the amount realized, whether or not representing gain, may be taxed as ordinary income due to potential recapture items, including depreciation recapture. In addition, because the amount realized includes a Unitholder’s share of our nonrecourse liabilities, if a Unitholder sells units, the Unitholders may incur a tax liability in excess of the amount of cash received from the sale.
Tax-exempt entities and non-U.S. persons face unique tax issues from owning Common Units that may result in adverse tax consequences to them.
Investment in Common Units by tax-exempt entities, including employee benefit plans and individual retirement accounts (known as IRAs) and non-U.S. persons raises tax issues unique to them. For example, virtually all of our income allocated to Unitholders who are organizations exempt from federal income tax, may be taxable to them as “unrelated business taxable income.” Distributions to non-U.S. persons will be reduced by withholding taxes, generally at the highest applicable effective tax rate, and non-U.S. persons will be required to file United States federal and state income tax returns and generally pay United States federal and state income tax on their share of our taxable income and on gains realized on the sale of our units.
We treat each purchaser of Common Units as having the same tax benefits without regard to the actual Common Units purchased. The IRS may challenge this treatment, which could result in a Unitholder owing more tax and may adversely affect the value of the Common Units.
The IRS may challenge the manner in which we calculate our Unitholder’s basis adjustment under Section 743(b) of the Internal Revenue Code. If so, because neither we nor a Unitholder can identify the units to which this issue relates once the initial holder has traded them, the IRS may assert adjustments to all Unitholders selling units within the period under audit as if all Unitholders owned such units.
Any position we take that is inconsistent with applicable Treasury Regulations may have to be disclosed on our federal income tax return. This disclosure increases the likelihood that the IRS will challenge our positions and propose adjustments to some or all of our Unitholders.
A successful IRS challenge to this position or other positions we may take could adversely affect the amount of taxable income or loss allocated to our Unitholders. It also could affect the gain from a Unitholder’s sale of Common Units and could have a negative impact on the value of the Common Units or result in audit adjustments to our Unitholders’ tax returns without the benefit of additional deductions. Moreover, because one of our subsidiaries that is organized as a C corporation for federal income tax purposes owns units in ETP, a successful IRS challenge could result in this subsidiary having a greater tax liability than we anticipate and, therefore, reduce the cash available for distribution to our partnership and, in turn, to our Unitholders.
46
We prorate our items of income, gain, loss and deduction between transferors and transferees of our units each month based upon the ownership of our units on the first day of each month, instead of on the basis of the date a particular unit is transferred. The IRS may challenge this treatment, which could change the allocation of items of income, gain, loss and deduction among our Unitholders.
We prorate our items of income, gain, loss and deduction between transferors and transferees of our units each month based upon the ownership of our units on the first day of each month, instead of on the basis of the date a particular unit is transferred. The use of this proration method may not be permitted under existing Treasury Regulations. Recently, however, the Department of the Treasury and the IRS issued proposed Treasury Regulations that provide a safe harbor pursuant to which a publicly traded partnership may use a similar monthly simplifying convention to allocate tax items among transferor and transferee unitholders. Nonetheless, the proposed regulations do not specifically authorize the use of the proration method we have adopted. If the IRS were to challenge our proration method or new Treasury Regulations were issued, we may be required to change the allocation of items of income, gain, loss and deduction among our unitholders.
A Unitholder whose units are loaned to a “short seller” to cover a short sale of units may be considered as having disposed of those units. If so, the Unitholder would no longer be treated for tax purposes as a partner with respect to those units during the period of the loan and may recognize gain or loss from the disposition.
Because a Unitholder whose units are loaned to a “short seller” to cover a short sale of units may be considered as having disposed of the loaned units, the Unitholder may no longer be treated for tax purposes as a partner with respect to those units during the period of the loan to the short seller and the Unitholder may recognize gain or loss from such disposition. Moreover, during the period of the loan to the short seller, any of our income, gain, loss or deduction with respect to those units may not be reportable by the Unitholder and any cash distributions received by the Unitholder as to those units could be fully taxable as ordinary income. Unitholders desiring to assure their status as partners and avoid the risk of gain recognition from a loan to a short seller are urged to modify any applicable brokerage account agreements to prohibit their brokers from borrowing their units.
ETP and Regency have adopted certain valuation methodologies that may result in a shift of income, gain, loss and deduction between us and the public Unitholders of ETP and Regency. The IRS may challenge this treatment, which could adversely affect the value of ETP’s or Regency’s Common Units and our Common Units.
When we, ETP or Regency issue additional units or engage in certain other transactions, we, ETP or Regency determine the fair market value of the assets and allocate any unrealized gain or loss attributable to such assets to the capital accounts of ETP’s and Regency’s Unitholders and us. Although ETP and Regency may from time to time consult with professional appraisers regarding valuation matters, including the valuation of its assets, ETP and Regency make many of the fair market value estimates of their assets themselves using a methodology based on the market value of their Common Units as a means to measure the fair market value of their assets. ETP’s or Regency’s methodology may be viewed as understating the value of ETP’s or Regency’s assets. In that case, there may be a shift of income, gain, loss and deduction between certain ETP or Regency Unitholders and us, which may be unfavorable to such ETP or Regency Unitholders. Moreover, under our current valuation methods, subsequent purchasers of our Common Units may have a greater portion of their Internal Revenue Code Section 743(b) adjustment allocated to ETP’s or Regency’s tangible assets and a lesser portion allocated to ETP’s or Regency’s intangible assets. The IRS may challenge ETP’s or Regency’s valuation methods, or our, ETP’s or Regency’s allocation of Section 743(b) adjustment attributable to ETP’s or Regency’s tangible and intangible assets, and allocations of income, gain, loss and deduction between us and certain of ETP’s or Regency’s Unitholders.
A successful IRS challenge to these methods or allocations could adversely affect the amount of taxable income or loss being allocated to our Unitholders, the ETP Unitholders or the Regency Unitholders. It also could affect the amount of gain on the sale of Common Units by our Unitholders, ETP’s Unitholders or Regency’s Unitholders and could have a negative impact on the value of our Common Units or those of ETP or Regency or result in audit adjustments to the tax returns of our, ETP’s or Regency’s Unitholders without the benefit of additional deductions.
The sale or exchange of 50% or more of our capital and profits interests during any twelve month period will result in the termination of our partnership for federal income tax purposes.
We will be considered technically terminated for federal income tax purposes if there is a sale or exchange of 50% or more of the total interests in our capital and profits within a twelve-month period. For purposes of determining whether the 50% threshold has been met, multiple sales of the same unit during the applicable twelve-month period will be counted only once. Our technical termination would, among other things, result in the closing of our taxable year for all Unitholders which would require us to file two federal partnership tax returns for one fiscal year, and could result in a deferral of depreciation deductions allowable in computing our taxable income. In the case of a Unitholder reporting on a taxable year other than a calendar year, the closing of our taxable year may also result in more than twelve months of our taxable income or loss being includable in such Unitholder’s taxable income for the year of termination. A technical termination currently would not affect our classification as a partnership
47
for federal income tax purposes. We would be treated as a new partnership for tax purposes on the technical termination date, and would be required to make new tax elections and could be subject to penalties if we were unable to determine in a timely manner that a termination occurred.
Unitholders will likely be subject to state and local taxes and return filing requirements in states where they do not live as a result of investing in our Common Units.
In addition to federal income taxes, the Unitholders may be subject to other taxes, including state and local taxes, unincorporated business taxes and estate, inheritance or intangible taxes that are imposed by the various jurisdictions in which we, ETP or Regency conduct business or own property now or in the future, even if they do not live in any of those jurisdictions. We currently own property or conduct business in more than 40 states, either directly or indirectly as a result of ETP's investment in AmeriGas. Most of these states impose an income tax on individuals, corporations and other entities. As we make acquisitions or expand our business, we may control assets or conduct business in additional states that impose a personal or corporate income tax. Unitholders may be required to file state and local income tax returns and pay state and local income taxes in some or all of the jurisdictions. Further, Unitholders may be subject to penalties for failure to comply with those requirements. It is the responsibility of each Unitholder to file all federal, state and local tax returns.
Risks Related to ETE’s Acquisition of Southern Union Company (“SUG Merger”)
The failure to successfully combine the businesses of ETE and Southern Union Company (“Southern Union”) in the expected time frame may adversely affect ETE’s future results.
The success of the SUG Merger will depend, in part, on the ability of ETE to realize the anticipated benefits from combining the businesses of ETE and Southern Union. To realize these anticipated benefits, ETE’s and Southern Union’s businesses must be successfully combined. If the combined company is not able to achieve these objectives, the anticipated benefits of the SUG Merger may not be realized fully or at all or may take longer to realize than expected. In addition, the actual integration may result in additional and unforeseen expenses, which could reduce the anticipated benefits of the SUG Merger.
ETE and Southern Union, including their respective subsidiaries, have operated and, until the completion of the SUG Merger, will continue to operate independently. It is possible that the integration process could result in the loss of key employees, as well as the disruption of each company’s ongoing businesses or inconsistencies in their standards, controls, procedures and policies. Any or all of those occurrences could adversely affect ETE’s ability to maintain relationships with customers and employees after the SUG Merger or to achieve the anticipated benefits of the SUG Merger. Integration efforts between the two companies will also divert management attention and resources. These integration matters could have an adverse effect on each of ETE and Southern Union.
The completion of the SUG Merger is subject to the satisfaction of certain conditions to closing, and the date that the SUG Merger would be consummated is uncertain.
The completion of the SUG Merger is subject to the absence of a material adverse change to the business or results of operation of ETE and SUG, the receipt of necessary regulatory approvals and the satisfaction or waiver of other conditions specified in the merger agreement related to the SUG transaction. In the event those conditions to closing are not satisfied or waived, we would not complete the SUG Merger.
While we expect to complete the SUG Merger in the first quarter of 2012, the completion date of the SUG Merger might be later than expected due to delays in obtaining required regulatory approvals or other unforeseen events.
The pendency of the SUG Merger could materially adversely affect the future business and operations of ETE or Southern Union or result in a loss of Southern Union employees.
In connection with the pending SUG Merger, it is possible that some customers, suppliers and other persons with whom ETE, ETE’s subsidiaries or Southern Union have a business relationship may delay or defer certain business decisions or might decide to seek to terminate, change or renegotiate their relationship with Southern Union as a result of the SUG Merger, which could negatively impact revenues, earnings and cash flows of ETE or Southern Union, as well as the market prices of ETE common units or shares of Southern Union common stock, regardless of whether the SUG Merger is completed. Similarly, current and prospective employees of Southern Union may experience uncertainty about their future roles with ETE and Southern Union following completion of the SUG Merger, which may materially adversely affect the ability of ETE and Southern Union to attract and retain key employees.
48
Failure to complete the SUG Merger could negatively impact the unit price of ETE and its respective future businesses and financial results.
If the SUG Merger is not completed, the ongoing business of ETE may be adversely affected and ETE will be subject to several risks and consequences, including the following:
|
•
|
ETE will be required to pay certain costs relating to the SUG Merger, whether or not the SUG Merger is completed, such as legal, accounting, financial advisor and printing fees;
|
|
•
|
ETE would not realize the expected benefits of the SUG Merger;
|
|
•
|
under the merger agreement, ETE is subject to certain restrictions on the conduct of its business prior to completing the SUG Merger which may adversely affect its ability to execute certain of its business strategies; and
|
|
•
|
matters relating to the SUG Merger may require substantial commitments of time and resources by ETE management, which could otherwise have been devoted to other opportunities that may have been beneficial to ETE.
|
In addition, if the SUG Merger is not completed, ETE may experience negative reactions from the financial markets and from their respective customers and employees. ETE also could be subject to litigation related to any failure to complete the SUG Merger or to enforcement proceedings commenced against ETE to attempt to force it to perform its obligations under the merger agreement.
The completion of the SUG Merger will require ETE to enter into a new financing arrangement. If ETE’s financing for the SUG Merger becomes unavailable, the SUG Merger may not be completed.
ETE intends to finance a portion of the cash component of the SUG Merger consideration with debt financing. In October 2011, ETE entered into a credit agreement with a group of lenders (the "Bridge Lenders") pursuant to which, subject to the conditions set forth therein, the Bridge Lenders have committed to provide a 364-day a bridge term loan facility (the "Bridge Term Loan Facility") in an aggregate principal amount of $3.7 billion (or such lesser amount as is equal to the lesser of (i) the amount that is sufficient to fund the total amount of cash consideration paid in the SUG Merger and (ii) the amount that ETE may elect to borrow). The commitment to provide the Bridge Term Facility is subject to various conditions, including the absence of a material adverse effect on Southern Union having occurred subsequent to December 31, 2010 and other customary closing conditions.
In the event that the financing contemplated by the Bridge Term Facility is not available to ETE, other financing may not be available to ETE on acceptable terms, in a timely manner, or at all. If other financing becomes necessary and ETE is unable to secure such additional financing, the SUG Merger may not be completed. ETE does not have a right to terminate the merger agreement in the event it does not have adequate funds to complete the transaction at closing. In the merger agreement, ETE represented to Southern Union that it would have available, at the closing of the SUG Merger, all funds required to consummate the transactions contemplated by the merger agreement. Southern Union would have a right to terminate the merger agreement if ETE breached this representation in a manner such that ETE would not be able to satisfy this representation on or before June 30, 2012, or in the event some regulatory approvals have not been achieved, December 31, 2012.
Pending litigation against ETE and Southern Union could result in the payment of damages in the event the SUG Merger is completed and/or may adversely affect the combined company’s business, financial condition or results of operations following the SUG Merger.
In connection with the SUG Merger, purported stockholders of Southern Union have filed several stockholder class action lawsuits against ETE, Southern Union, and the Southern Union Board in the District Courts of Harris County, Texas and in the Delaware Courts of Chancery. Among other remedies, the plaintiffs seek monetary damages. If a final settlement is not reached, or if a dismissal is not obtained, these lawsuits could result in substantial costs to ETE and Southern Union, including any costs associated with the indemnification of directors. Additional lawsuits may be filed against ETE and/or Southern Union related to the SUG Merger. The defense or settlement of any lawsuit or claim that remains unresolved at the time the SUG Merger is completed may adversely affect the combined company’s business, financial condition or results of operations.
If the merger agreement is terminated, Southern Union may be obligated to reimburse ETE for costs incurred related to the SUG Merger and, under certain circumstances, pay a breakup fee to ETE. Southern Union may be unable to reimburse these costs or pay any potential breakup fee to ETE.
In certain circumstances, upon termination of the merger agreement, Southern Union would be responsible for reimbursing ETE for up to $54.0 million in expenses related to the transaction and may be obligated to pay a breakup fee to ETE of $181.3 million. If the merger agreement is terminated, the expense reimbursements and the breakup fee required to be paid by Southern Union under the merger agreement may require Southern Union to seek loans or borrow amounts to enable it to pay these amounts to ETE. In either case, Southern Union may not be able to fulfill such obligations.
49
Southern Union will be a corporate subsidiary of ETE after the SUG Merger and will remain subject to corporate-level income taxes.
After the SUG Merger, ETE will own and operate certain aspects of Southern Union’s business through Southern Union as a wholly owned corporate subsidiary of ETE. Accordingly, Southern Union will continue to be subject to corporate-level tax, which may reduce the cash available for distribution to ETE and, in turn, to ETE unitholders. If the IRS were to successfully assert that Southern Union has more tax liability than ETE anticipated or legislation were enacted that increased the corporate tax rate, the cash available for distribution by ETE could be further reduced.
None.
A description of our properties is included in “Item 1. Business.” We share an office building for our executive office in Dallas, Texas with ETP. In addition, ETP owns office buildings in Houston and San Antonio, Texas and Regency leases two floors in an office building in Dallas, Texas. While we may require additional office space as our business expands, we believe that our existing facilities are adequate to meet our needs for the immediate future, and that additional facilities will be available on commercially reasonable terms as needed.
We believe that we have satisfactory title to or valid rights to use all of our material properties. Although some of our properties are subject to liabilities and leases, liens for taxes not yet due and payable, encumbrances securing payment obligations under non-competition agreements and immaterial encumbrances, easements and restrictions, we do not believe that any such burdens will materially interfere with our continued use of such properties in our business, taken as a whole. In addition, we believe that we have, or are in the process of obtaining, all required material approvals, authorizations, orders, licenses, permits, franchises and consents of, and have obtained or made all required material registrations, qualifications and filings with, the various state and local government and regulatory authorities which relate to ownership of our properties or the operations of our business.
Substantially all of ETP’s and Regency’s pipelines, are constructed on rights-of-way granted by the apparent record owners of the property. Lands over which pipeline rights-of-way have been obtained may be subject to prior liens that have not been subordinated to the right-of-way grants. ETP and Regency have obtained, where necessary, easement agreements from public authorities and railroad companies to cross over or under, or to lay facilities in or along, watercourses, county roads, municipal streets, railroad properties and state highways, as applicable. In some cases, properties on which our pipelines were built were purchased in fee. ETP also owns and operates multiple natural gas and NGL storage facilities and owns or leases processing, treating and conditioning facilities in connection with its midstream operations.
We are not aware of any material legal or governmental proceedings against ETE or our Operating Companies, or contemplated to be brought against ETE or our Operating Companies, under the various environmental protection statutes to which we and they are subject.
For a description of legal proceedings, see Note
10
to our consolidated financial statements.
Not applicable.
50
Parent Company
Market Price of and Distributions on Common Units and Related Unitholder Matters
The Parent Company’s common units are listed on the NYSE under the symbol “ETE.” The following table sets forth, for the periods indicated, the high and low sales prices per ETE Common Unit, as reported on the NYSE Composite Transaction Tape, and the amount of cash distributions paid per ETE Common Unit for the periods indicated.
|
|
Price Range
|
Cash
Distribution
(1)
|
|||||||||
|
|
High
|
Low
|
|||||||||
|
Fiscal Year 2011:
|
|
|
|
||||||||
|
Fourth Quarter
(2)
|
$
|
42.00
|
|
$
|
30.78
|
|
$
|
0.625
|
|
||
|
Third Quarter
(2)
|
45.42
|
|
33.21
|
|
0.625
|
|
|||||
|
Second Quarter
(2)
|
47.34
|
|
38.77
|
|
0.625
|
|
|||||
|
First Quarter
(2)
|
45.47
|
|
37.27
|
|
0.560
|
|
|||||
|
Fiscal Year 2010:
|
|
|
|
||||||||
|
Fourth Quarter
(2)
|
$
|
40.46
|
|
$
|
36.90
|
|
$
|
0.540
|
|
||
|
Third Quarter
(2)
|
37.97
|
|
32.61
|
|
0.540
|
|
|||||
|
Second Quarter
(2)
|
35.51
|
|
27.25
|
|
0.540
|
|
|||||
|
First Quarter
|
34.80
|
|
30.09
|
|
0.540
|
|
|||||
|
(1)
|
Distributions are shown in the quarter with respect to which they relate. For each of the indicated quarters for which distributions have been made, an identical per unit cash distribution was paid on any units subordinated to our Common Units outstanding at such time. Please see “– Cash Distribution Policy” below for a discussion of our policy regarding the payment of distributions.
|
|
(2)
|
Excludes the Series A Convertible Preferred Units issued in connection with the Regency Transactions in May 2010. See Note
7
to our consolidated financial statements.
|
Description of Units
As of February 1, 2012, there were approx
imately 86,914 individual c
ommon unitholders, which includes common units held in street name. Common units represent limited partner interest in us that entitle the holders to the rights and privileges specified in the Parent Company’s Third Amended and Restated Agreement of Limited Partnership, as amended to date (the “Partnership Agreement”).
As of
December 31, 2011
, common units represent an aggregate 99.69% limited partner interest in us. Our General Partner owns an aggregate 0.31% General Partner interest in us. Our common units are registered under the Securities Exchange Act of 1934, as amended (the “Exchange Act”), and are listed for trading on the NYSE. Each holder of a common unit is entitled to one vote per unit on all matters presented to the limited partners for a vote. In addition, if at any time any person or group (other than our General Partner and its affiliates) owns beneficially 20% or more of all common units, any Common Units owned by that person or group may not be voted on any matter and are not considered to be outstanding when sending notices of a meeting of unitholders (unless otherwise required by law), calculating required votes, determining the presence of a quorum or for other similar purposes under our Partnership Agreement. The common units are entitled to distributions of Available Cash as described below under “– Cash Distribution Policy”.
Cash Distribution Policy
General.
The Parent Company will distribute all of its “Available Cash” to its unitholders and its General Partner within 50 days following the end of each fiscal quarter.
Definition of Available Cash.
Available Cash is defined in the Parent Company’s Partnership Agreement and generally means, with respect to any calendar quarter, all cash on hand at the end of such quarter less the amount of cash reserves that are necessary
51
or appropriate in the reasonable discretion of the General Partner to:
|
•
|
provide for the proper conduct of its business;
|
|
•
|
comply with applicable law and/or debt instrument or other agreement; and
|
|
•
|
provide funds for distributions to unitholders and its General Partner in respect of any one or more of the next four quarters.
|
The total amount of distributions declared is reflected in Note
8
to our consolidated financial statements.
Recent Sales of Unregistered Securities
None.
Issuer Purchases of Equity Securities
None.
Currently, the Parent Company has no separate operating activities apart from those conducted by the operating subsidiaries of our consolidated investees, ETP and Regency. On May 26, 2010, we completed the Regency Transactions as described in “Item 1. Business – Overview.” We have accounted for the Regency Transactions using the purchase method of accounting. As a result, we commenced consolidating the results of Regency and its consolidated subsidiaries on May 26, 2010.
In November 2007, we changed our fiscal year end from August 31 to December 31 and, in connection with such change, we have reported financial results for a four-month transition period ended December 31, 2007.
The selected historical financial data should be read in conjunction with “Item 7. Management’s Discussion and Analysis of Financial Condition and Results of Operations” and the historical consolidated financial statements and accompanying notes thereto included elsewhere in this report. The amounts in the table below, except per unit data, are in thousands.
|
|
Years Ended December 31,
|
Four Months Ended
December 31, 2007
|
Year Ended
August 31, 2007
|
||||||||||||||||||||
|
Statement of Operations Data:
|
2011
|
2010
|
2009
|
2008
|
|||||||||||||||||||
|
Total revenues
|
$
|
8,240,703
|
|
$
|
6,598,132
|
|
$
|
5,417,295
|
|
$
|
9,293,367
|
|
$
|
2,349,342
|
|
$
|
6,792,037
|
|
|||||
|
Operating income
|
1,234,819
|
|
1,036,729
|
|
1,110,398
|
|
1,098,903
|
|
316,651
|
|
809,336
|
|
|||||||||||
|
Income from continuing operations
|
528,247
|
|
337,824
|
|
697,871
|
|
679,754
|
|
182,809
|
|
551,968
|
|
|||||||||||
|
Basic net income per limited partner unit
|
1.39
|
|
0.86
|
|
1.98
|
|
1.68
|
|
0.41
|
|
1.56
|
|
|||||||||||
|
Diluted net income per limited partner unit
|
1.38
|
|
0.86
|
|
1.98
|
|
1.68
|
|
0.41
|
|
1.55
|
|
|||||||||||
|
Cash distribution per unit
|
2.44
|
|
2.16
|
|
2.14
|
|
1.91
|
|
0.55
|
|
1.46
|
|
|||||||||||
|
Balance Sheet Data (at period end):
|
|||||||||||||||||||||||
|
Total assets
|
20,896,793
|
|
17,378,730
|
|
12,160,509
|
|
11,069,902
|
|
9,462,094
|
|
8,183,089
|
|
|||||||||||
|
Long-term debt, less current maturities
|
10,946,864
|
|
9,346,067
|
|
7,750,998
|
|
7,190,357
|
|
5,870,106
|
|
5,198,676
|
|
|||||||||||
|
Total equity
|
7,388,945
|
|
6,247,732
|
|
3,220,251
|
|
2,339,316
|
|
2,091,156
|
|
1,835,300
|
|
|||||||||||
52
AND RESULTS OF OPERATIONS
Energy Transfer Equity, L.P. is a Delaware limited partnership whose common units are publicly traded on the NYSE under the ticker symbol “ETE.” ETE was formed in September 2002 and completed its initial public offering in February 2006.
The following is a discussion of our historical consolidated financial condition and results of operations, and should be read in conjunction with our historical consolidated financial statements and accompanying notes thereto included in “Item 8. Financial Statements and Supplementary Data” of this report. This discussion includes forward-looking statements that are subject to risk and uncertainties. Actual results may differ substantially from the statements we make in this section due to a number of factors that are discussed in “Item 1A. Risk Factors” of this report.
Unless the context requires otherwise, references to “we,” “us,” “our,” and “ETE” shall mean Energy Transfer Equity, L.P. and its consolidated subsidiaries, which include Energy Transfer Partners, L.P. (“ETP”), Energy Transfer Partners G.P., L.P. (“ETP GP”), the General Partner of ETP, ETP GP’s General Partner, Energy Transfer Partners, L.L.C. (“ETP LLC”), Regency Energy Partners LP (“Regency”), Regency GP LP (“Regency GP”), the general partner of Regency, and Regency GP’s General Partner, Regency GP LLC (“Regency LLC”). References to “the Parent Company” shall mean Energy Transfer Equity, L.P. on a stand-alone basis.
OVERVIEW
Energy Transfer Equity, L.P. directly and indirectly owns equity interests in ETP and Regency, both publicly traded master limited partnerships engaged in diversified energy-related services.
At
December 31, 2011
, our equity interests consisted of:
|
General Partner
Interest (as a %
of total
partnership
interest)
|
Incentive
Distribution
Rights
(“IDRs”)
|
Limited
Partner Units
|
||||||
|
ETP
|
1.5
|
%
|
100
|
%
|
50,226,967
|
|
||
|
Regency
|
1.8
|
%
|
100
|
%
|
26,266,791
|
|
||
The principal sources of the Parent Company's cash flow are distributions it receives from its direct and indirect investments in limited and general partner interests in ETP and Regency. The Parent Company’s primary cash requirements are for distributions to its partners and holders of the Series A Convertible Preferred Units (the “Preferred Units”), general and administrative expenses, debt service requirements and at ETE's election, capital contributions to ETP and Regency in respect of ETE's general partner interest in ETP and Regency. The Parent Company-only assets and liabilities are not available to satisfy the debts and other obligations of ETE's subsidiaries.
We acquired our equity interests in Regency in a series of transactions, which we refer to as the “Regency Transactions,” that were completed on May 26, 2010. In the Regency Transactions, we:
|
•
|
acquired the general partner interest and IDRs in Regency in exchange for 3,000,000 Preferred Units having an aggregate liquidation preference of $300 million;
|
|
•
|
acquired from ETP an indirect 49.9% interest in Midcontinent Express Pipeline LLC (“MEP”), ETP’s joint venture with Kinder Morgan Energy Partners, L.P. (“KMP”) to operate the Midcontinent Express Pipeline, and an option to acquire an additional 0.1% interest in MEP in exchange for the redemption by ETP of approximately 12.3 million ETP Common Units we previously owned; and
|
|
•
|
acquired 26.3 million Regency Common Units in exchange for our contribution of all of our interests in MEP, including the option to acquire an additional 0.1% interest, to Regency.
|
In order to fully understand the financial condition and results of operations of the Parent Company on a stand-alone basis, we have included discussions of Parent Company matters apart from those of our consolidated group.
General
Our primary objective is to increase the level of our distributable cash flow to our unitholders over time by pursuing a business strategy that is currently focused on growing our subsidiaries’ natural gas and NGL businesses through, among other things,
53
pursuing certain construction and expansion opportunities relating to our subsidiaries’ existing infrastructure and acquiring certain strategic operations and businesses or assets. The actual amounts of cash that we will have available for distribution will primarily depend on the amount of cash our subsidiaries generate from their operations.
Our principal operations include the following reportable segments:
|
•
|
Investment in ETP
– ETP is a publicly traded partnership owning and operating a diversified portfolio of energy assets. ETP has pipeline operations in Arizona, Arkansas, Colorado, Louisiana, New Mexico, Utah and West Virginia and owns the largest intrastate pipeline system in Texas. ETP currently has natural gas operations that include more than 17,500 miles of gathering and transportation pipelines, treating and processing assets, and three storage facilities located in Texas. ETP also holds a 70% membership interest in Lone Star NGL LLC (“Lone Star”), a joint venture that owns and operates NGL storage, fractionation and transportation assets in Texas, Louisiana and Mississippi.
|
|
•
|
Investment in Regency
– Regency is a publicly traded partnership engaged in the gathering and processing, contract compression, treating and transportation of natural gas and the transportation, fractionation and storage of NGLs. Regency focuses on providing midstream services in some of the most prolific natural gas producing regions in the United States, including the Eagle Ford, Haynesville, Barnett, Fayetteville, Marcellus, Bone Spring and Avalon shales, as well as the Permian Delaware basin. Its assets are primarily located in Texas, Louisiana, Arkansas, Pennsylvania, California, Mississippi, Alabama, West Virginia and the mid-continent region of the United States, which includes Kansas, Colorado and Oklahoma. Regency also holds a 30% membership interest in Lone Star.
|
Each of the respective general partners of ETP and Regency have separate operating management and boards of directors. We control ETP and Regency through our ownership of their respective general partners. See further discussion of ETP and Regency’s operations in Note
1
to our consolidated financial statements.
Recent Developments
Pending Acquisition
On July 19, 2011, we entered into a transaction to acquire Southern Union Company, a Delaware corporation (“SUG”). This transaction, which we refer to as the SUG Merger, will provide us with direct ownership of assets that are complementary to the assets owned and operated by ETP and Regency. To execute the SUG Merger, we entered into a Second Amended and Restated Plan of Merger (the “SUG Merger Agreement”) with Sigma Acquisition Corporation, a Delaware corporation and our wholly-owned subsidiary (“Merger Sub”), and SUG. The Second Amended Merger Agreement modifies certain terms of the Amended and Restated Agreement and Plan of Merger entered into by us, Merger Sub and SUG on July 4, 2011. Under the terms of the SUG Merger Agreement, Merger Sub will merge with and into SUG, with SUG continuing as the surviving entity and becoming our wholly-owned subsidiary subject to certain conditions to close. Pursuant to the SUG Merger Agreement, we will acquire all of the outstanding shares of SUG in a transaction valued at
$9.4 billion
, including
$5.7 billion
in cash and ETE Common Units and
$3.7 billion
of existing SUG indebtedness. Stockholders of SUG may elect to exchange each share of SUG stock for either
$44.25
in cash or
1.00
ETE Common Unit. The maximum cash component is
60%
of the aggregate consideration and the common unit component can fluctuate between
40%
and
50%
. Elections in excess of either the cash or common unit limits will be subject to proration.
As described in more detail below under the caption “Liquidity and Capital Resources — Overview — Parent Company Only,” we have secured
$3.7 billion
in committed financing from the Bridge Loan Lenders to fund a portion of the cash consideration related to the SUG Merger, which is expected to be replaced by permanent financing with the syndication of a new senior secured credit facility of up to $2.3 billion, and completion of the Citrus Acquisition. On December 9, 2011, the special meeting of the SUG stockholders was held and the SUG stockholders voted to approve the SUG Merger. We and SUG have made filings with the Missouri Public Service Commission and expect to receive its approval of the SUG Merger in the first quarter of 2012. Closing of this business combination is contingent upon several conditions, including regulatory approvals, and we expect the transaction to close in the first quarter of 2012.
On July 19, 2011, ETP entered into an Amended Citrus Merger Agreement pursuant to which it is anticipated that SUG will cause the contribution to ETP of SUG’s
50%
interest in Citrus Corp., which owns
100%
of the Florida Gas Transmission (“FGT”) pipeline system, in exchange for approximately
$1.895 billion
in cash and
$105 million
of ETP Common Units, contemporaneous with the completion of the merger between SUG and us pursuant to the SUG Merger Agreement as described in Note
3
to our consolidated financial statements.
We expect to incur additional general and administrative costs in connection with consummation of this merger.
54
Propane Operations
On January 12, 2012, ETP contributed its propane operations, consisting of Heritage Operating, L.P. (“HOLP”) and Titan Energy Partners, L.P. (“Titan”) (collectively, the “Propane Business”), to AmeriGas Partners, L.P. (“AmeriGas”). ETP received $1.46 billion in cash and approximately 29.6 million AmeriGas common units in consideration for the contribution of the Propane Business. AmeriGas also assumed of approximately $71 million of existing HOLP debt.
ETP's 2012 Financing Transactions
In January 2012, ETP issued $2.0 billion principal amount of Senior Notes, the proceeds from which it anticipates using to fund the cash potion of the Citrus Acquisition and for general partnership purposes. In January and February 2012, ETP also completed the repurchase of approximately $750 million of its Senior Notes.
Ranch Joint Venture
On December 2, 2011, Ranch Westex JV LLC (“Ranch JV”) was formed by Regency, Anadarko Pecos Midstream LLC and Chesapeake West Texas Processing, L.L.C., each owning 33.33% of the joint venture. Ranch JV, upon completion of construction in 2012, will process natural gas delivered from the NGL-rich Bone Springs and Avalon shale formations in West Texas. The project consists of two plants, a 25 MMcf/d refrigeration plant and a 100 MMcf/d cryogenic processing plant. The initial start-up of the refrigeration unit is expected to be in service by the second quarter of 2012, with full facilities available by the fourth quarter of 2012.
Trends and Outlook
We expect to close the SUG Merger in the near term, and we expect that the merger will:
|
•
|
provide accretion to cash flow, both immediately and over the long-term;
|
|
•
|
provide a commercial and operational fit with the existing natural gas and NGL operations that we control through ETP and Regency;
|
|
•
|
create a larger interstate and midstream platform with enhanced and expanded geographic diversity;
|
|
•
|
add significant demand-side, market-centric pipelines to the asset portfolio that we control and provide additional organic growth opportunities in strategic geographical locations as well as potential affiliate joint ventures;
|
|
•
|
increase our fee-based revenues from long-term contracts with strong credit quality customers;
|
|
•
|
allow us and our subsidiaries to take advantage of immediate operational and commercial synergies;
|
|
•
|
diversify our cash flow, as the combined entities will derive a larger portion of cash flow from large scale, regulated and investment-grade operations; and,
|
|
•
|
provide the potential for asset drop-downs to ETP and Regency or asset sales over time.
|
In addition, we expect to benefit from continued organic growth and acquisitions among our existing consolidated subsidiaries. ETP, Regency and Lone Star's aggregate growth capital expenditures for 2011 were $1.8 billion. In 2012, ETP, Regency and Lone Star expect their aggregate capital expenditures to be between $2.6 billion and $2.9 billion, which includes additional NGL assets including construction of a NGL fractionator at Mont Belvieu, assets in in the Eagle Ford Shale, assets in the Woodford and Barnett Shales, in addition to various other growth projects. In addition to these capital expenditures, ETP expects to complete its acquisition of a 50% interest in Citrus Corp. in conjunction with our acquisition of SUG, as described above. Along with the inherent benefits of greater scale and cash flow diversification that we experience from growth and acquisitions that occur at ETP and Regency, we also expect to directly benefit through increases in the distributions that we receive through our limited partner, general partner and IDR interests in ETP and Regency.
55
Results of Operations
Year Ended
December 31, 2011
Compared to the Year Ended
December 31, 2010
(tabular dollar amounts are expressed in thousands)
Consolidated Results
|
|
Years Ended December 31,
|
Change
|
|||||||||
|
|
2011
|
2010
|
|||||||||
|
Revenues
|
$
|
8,240,703
|
|
$
|
6,598,132
|
|
$
|
1,642,571
|
|
||
|
Cost of products sold
|
5,182,999
|
|
4,111,337
|
|
1,071,662
|
|
|||||
|
Gross margin
|
3,057,704
|
|
2,486,795
|
|
570,909
|
|
|||||
|
Operating expenses
|
918,918
|
|
784,546
|
|
134,372
|
|
|||||
|
Depreciation and amortization
|
611,809
|
|
431,199
|
|
180,610
|
|
|||||
|
Selling, general and administrative
|
292,158
|
|
234,321
|
|
57,837
|
|
|||||
|
Operating income
|
1,234,819
|
|
1,036,729
|
|
198,090
|
|
|||||
|
Interest expense, net of interest capitalized
|
(739,811
|
)
|
(624,887
|
)
|
(114,924
|
)
|
|||||
|
Equity in earnings of affiliates
|
117,188
|
|
65,220
|
|
51,968
|
|
|||||
|
Losses on disposal of assets
|
(816
|
)
|
(5,255
|
)
|
4,439
|
|
|||||
|
Losses on non-hedged interest rate derivatives
|
(77,806
|
)
|
(52,357
|
)
|
(25,449
|
)
|
|||||
|
Allowance for equity funds used during construction
|
957
|
|
28,942
|
|
(27,985
|
)
|
|||||
|
Impairment of investments in affiliates
|
(5,355
|
)
|
(52,620
|
)
|
47,265
|
|
|||||
|
Other, net
|
15,954
|
|
(44,210
|
)
|
60,164
|
|
|||||
|
Income tax expense
|
(16,883
|
)
|
(13,738
|
)
|
(3,145
|
)
|
|||||
|
Loss from discontinued operations
|
—
|
|
(1,244
|
)
|
1,244
|
|
|||||
|
Net income
|
$
|
528,247
|
|
$
|
336,580
|
|
$
|
191,667
|
|
||
The discussion under “Parent Company Results” below analyzes the results of operations of the Parent Company on a stand alone basis for the periods presented, and the discussion under “Segment Operating Results” below analyzes the results of operations related to our reportable segments.
Parent Company Results
The Parent Company currently has no separate operating activities apart from those conducted by the operating subsidiaries of ETP and Regency and its principal sources of cash flow are from its direct and indirect investments in the limited and general partner interests of ETP and Regency.
The following table presents the results of the stand-alone results of operations of the Parent Company for the periods indicated:
|
|
Years Ended December 31,
|
Change
|
|||||||||
|
|
2011
|
2010
|
|||||||||
|
Selling, general and administrative expenses
|
$
|
(29,641
|
)
|
$
|
(21,829
|
)
|
$
|
(7,812
|
)
|
||
|
Interest expense
|
(163,612
|
)
|
(167,658
|
)
|
4,046
|
|
|||||
|
Equity in earnings of affiliates
|
509,361
|
|
455,901
|
|
53,460
|
|
|||||
|
Losses on non-hedged interest rate derivatives
|
—
|
|
(53,388
|
)
|
53,388
|
|
|||||
|
Other, net
|
(5,796
|
)
|
(19,721
|
)
|
13,925
|
|
|||||
Selling, General and Administrative Expenses.
Selling, general and administrative expenses increased principally due to an increase in acquisition-related costs associated with the SUG Merger. Acquisition-related costs of $21.4 million were incurred in 2011 in relation to the SUG Merger compared to $12.8 million of acquisition-related costs associated with the Regency Transaction in 2010.
56
Interest Expense.
Interest expense decreased primarily due to the recognition of $66.4 million of realized losses on hedged interest rate swaps in September 2010 in connection with the refinancing of indebtedness that would have come due in 2011 and 2012. These realized losses were offset by an increase in interest expense that primarily resulted from the Parent Company's issuance of $1.8 billion of aggregate principal amount of 7.5% senior notes in September 2010.
In addition, interest expense for the periods presented reflected distributions on the Preferred Units issued by ETE in connection with the acquisition of a controlling interest in Regency in May 2010. Distributions on Preferred Units were $24 million and $14.4 million for the years ended December 31, 2011 and 2010, respectively.
Equity in Earnings of Affiliates.
Equity in earnings of affiliates represents earnings of the Parent Company related to its investments in ETP and Regency. The Parent Company recorded equity in earnings of ETP of $490.3 million and $455.3 million for the years ended December 31, 2011 and 2010, respectively. An analysis of ETP's operating results is included in “Segment Operating Results” below. The Parent Company recorded equity in earnings of Regency of $19.1 million and $0.6 million for the years ended December 31, 2011 and 2010, respectively. Equity in earnings of Regency for 2010 represents only the period subsequent to the Parent Company's acquisition of a controlling interest in Regency in May 2010.
Losses on Non-Hedged Interest Rate Derivatives
. In September 2010, the Parent Company terminated its interest swaps that were not accounted for as hedges in connection with its issuance of $1.8 billion of senior notes. Prior to that settlement, changes in the fair value of and cash payments related to these swaps were recorded directly in earnings.
Other, net.
Other expenses decreased primarily due to a decrease between periods related to non-cash charges recorded to increase the carrying value of the ETE Preferred Units that were issued by the Parent Company in connection with the acquisition of a controlling interest in Regency in May 2010. The year ended December 31, 2010 included a non-cash charge of $12.7 million and the year ended December 31, 2011 included a non-cash charge of $5.3 million to increase the carrying value of the ETE Preferred Units.
Segment Operating Results
We have two reportable segments, which conduct their business exclusively in the United States of America, as follows:
|
•
|
Investment in ETP — Reflects the consolidated operations of ETP.
|
|
•
|
Investment in Regency — Reflects the consolidated operations of Regency.
|
We evaluate the performance of our operating segments based on net income. The following tables present the financial information by segment. The amounts reflected as “Corporate and Other” include the Parent Company activity and the goodwill and property, plant and equipment fair value adjustments recorded as a result of the 2004 reverse acquisition of Heritage Propane Partners, L.P.
For additional information regarding our business segments, see “Item 1. Business” of this report and Notes
1
and
14
to our consolidated financial statements.
Net income by segment is as follows:
|
|
Years Ended December 31,
|
|
|||||||||
|
|
2011
|
2010
|
Change
|
||||||||
|
Investment in ETP
|
$
|
697,162
|
|
$
|
617,222
|
|
$
|
79,940
|
|
||
|
Investment in Regency
|
73,619
|
|
(5,972
|
)
|
79,591
|
|
|||||
|
Corporate and Other
|
(214,346
|
)
|
(274,670
|
)
|
60,324
|
|
|||||
|
Adjustments and Eliminations
|
(28,188
|
)
|
—
|
|
(28,188
|
)
|
|||||
|
Net income
|
$
|
528,247
|
|
$
|
336,580
|
|
$
|
191,667
|
|
||
57
Investment in ETP
|
|
Years Ended December 31,
|
Change
|
|||||||||
|
|
2011
|
2010
|
|||||||||
|
Revenues
|
$
|
6,850,440
|
|
$
|
5,884,827
|
|
$
|
965,613
|
|
||
|
Cost of products sold
|
4,189,353
|
|
3,599,941
|
|
589,412
|
|
|||||
|
Gross margin
|
2,661,087
|
|
2,284,886
|
|
376,201
|
|
|||||
|
Operating expenses
|
773,767
|
|
707,271
|
|
66,496
|
|
|||||
|
Depreciation and amortization
|
430,904
|
|
343,011
|
|
87,893
|
|
|||||
|
Selling, general and administrative
|
211,609
|
|
176,433
|
|
35,176
|
|
|||||
|
Operating income
|
1,244,807
|
|
1,058,171
|
|
186,636
|
|
|||||
|
Interest expense, net of interest capitalized
|
(474,113
|
)
|
(412,553
|
)
|
(61,560
|
)
|
|||||
|
Equity in earnings of affiliates
|
25,836
|
|
11,727
|
|
14,109
|
|
|||||
|
Losses on disposal of assets
|
(3,188
|
)
|
(5,043
|
)
|
1,855
|
|
|||||
|
Gains (losses) on non-hedged interest rate derivatives
|
(77,409
|
)
|
4,616
|
|
(82,025
|
)
|
|||||
|
Allowance for equity funds used during construction
|
957
|
|
28,942
|
|
(27,985
|
)
|
|||||
|
Impairment of investments in affiliates
|
(5,355
|
)
|
(52,620
|
)
|
47,265
|
|
|||||
|
Other, net
|
4,442
|
|
(482
|
)
|
4,924
|
|
|||||
|
Income tax expense
|
(18,815
|
)
|
(15,536
|
)
|
(3,279
|
)
|
|||||
|
Net income
|
$
|
697,162
|
|
$
|
617,222
|
|
$
|
79,940
|
|
||
Gross Margin.
For the year ended December 31, 2011 compared to the year ended December 31, 2010, ETP’s gross margin increased primarily due to the net impacts of the following:
|
•
|
Revenue generated by ETP's interstate transportation operations increased $154.3 million primarily as a result of incremental revenues from the Tiger pipeline being placed into service in December 2010 and a related expansion placed into service in August 2011. Increased revenue from the Tiger pipeline was partially offset by decreased revenue from the Transwestern pipeline as a result of lower volumes.
|
|
•
|
Gross margin from ETP's midstream operations increased $97.2 million, $44.7 million of which was a result from increases in gathering and processing fee-based revenues primarily due to increased volumes in production in the Eagle Ford Shale along with increased volumes in ETP's assets in West Virginia and North Texas. Gross margin for non fee-based contracts and processing increased $48.7 million primarily due to more favorable NGL prices.
|
|
•
|
Gross margin from ETP's NGL transportation and services operations was $178.8 million during 2011, which represented 100% of the results from Lone Star since LDH Energy Asset Holdings LLC ("LDH") was acquired in May 2011. Accordingly, no comparative amounts were reflected in ETP's results prior to May 2, 2011.
|
|
•
|
Gross margin from ETP's retail propane and other retail propane related operations decreased $37.1 million primarily as a result of decreased volumes which were affected by unfavorable weather patterns and continued customer conservatism.
|
Operating Expenses.
Operating expenses increased during 2011 compared to 2010 primarily due to operating expenses of $39.4 million for Lone Star, which acquired LDH in May 2011 and was not reflected in prior period. In addition, operating expenses for ETP's midstream operations increased $17.7 million as a result of increased maintenance and operating expenses and employee expenses due to higher volumes and assets on its systems and processing/treating facilities. The completion of the Tiger pipeline and its related expansion also attributed to increases in operating expenses.
Depreciation and Amortization.
Depreciation and amortization increased due to acquisitions and assets placed in service since 2010. Depreciation and amortization increased by $28.3 million for ETP’s interstate transportation operations primarily due to the Tiger pipeline which was placed in service in December 2010. Depreciation and amortization increased by $25.3 million for ETP’s midstream operations primarily due to incremental depreciation from the continued expansion of its Northern Louisiana and Southeast Texas assets. Depreciation and amortization for ETP’s NGL transportation and services operations was $32.5 million from its inception in May 2011 through December 31, 2011.
58
Selling, General and Administrative Expense.
Selling, general and administrative expenses increased partially due to selling, general and administrative expenses of $13.3 million for Lone Star, which was acquired in May 2011 and not reflected in the prior period. In addition, selling, general and administrative expenses for ETP's interstate operations increased $13.9 million primarily due to increased allocated and employee-related expenses, including incremental amounts related to the Tiger pipeline.
Interest Expense.
Interest expense increased primarily due to ETP's issuance of $1.5 billion of senior notes in May 2011, the proceeds from which were used to repay borrowings on its revolving credit facility, to fund growth projects and for general partnership purposes.
Gains (Losses) on Non-Hedged Interest Rate Derivatives.
The year ended December 31, 2011 reflected losses on non-hedged interest rate swaps for which ETP had total notional amounts outstanding of $1.65 billion as of December 31, 2011, which included $1.15 billion of forward-starting floating-to-fixed swaps used to hedge interest rates associated with anticipated note issuances and $500 million of fixed-to-floating swaps used to swap a portion of ETP's fixed rate debt to floating. During the second half of 2011, forward rates decreased significantly due to global economic uncertainty which resulted in unrealized non-cash losses on ETP's forward-starting floating-to-fixed swaps.
Allowance for Equity Funds Used During Construction.
Allowance for equity funds used during construction for 2011 reflected amounts recorded in connection with the expansion of the Tiger pipeline which was completed in August 2011, whereas 2010 reflected amounts recorded in connection with the original construction of the Tiger pipeline.
Impairment of Investments in Affiliates.
For 2011, ETP's results reflected a non-cash charge to write off all of its investment in a joint venture for which projects are no longer being pursued. During 2010, in conjunction with the transfer of its interest in Midcontinent Express Pipeline LLC ("MEP") in May 2010, ETP recorded a non-cash charge of approximately $52.6 million to reduce the carrying value of its interest in MEP to its estimated fair value.
Income Tax Expense.
The increase in income tax expense between the periods was primarily due to increases in taxable income within ETP's subsidiaries that are taxable corporations, in addition to an increase in amounts recorded for the Texas margins tax resulting from increased operating income.
Investment in Regency
|
|
Years Ended December 31,
|
|
|||||||||
|
|
2011
|
2010
|
Change
|
||||||||
|
Revenues
|
$
|
1,433,898
|
|
$
|
716,613
|
|
$
|
717,285
|
|
||
|
Cost of products sold
|
1,012,826
|
|
504,327
|
|
508,499
|
|
|||||
|
Gross margin
|
421,072
|
|
212,286
|
|
208,786
|
|
|||||
|
Operating expenses
|
147,643
|
|
77,808
|
|
69,835
|
|
|||||
|
Depreciation and amortization
|
168,684
|
|
75,967
|
|
92,717
|
|
|||||
|
Selling, general and administrative
|
67,408
|
|
43,739
|
|
23,669
|
|
|||||
|
Gains (losses) on disposal of assets
|
(2,372
|
)
|
213
|
|
(2,585
|
)
|
|||||
|
Operating income
|
39,709
|
|
14,559
|
|
25,150
|
|
|||||
|
Interest expense, net of interest capitalized
|
(102,474
|
)
|
(48,251
|
)
|
(54,223
|
)
|
|||||
|
Equity in earnings of affiliates
|
119,540
|
|
53,493
|
|
66,047
|
|
|||||
|
Other, net
|
17,309
|
|
(23,977
|
)
|
41,286
|
|
|||||
|
Income tax expense
|
(465
|
)
|
(552
|
)
|
87
|
|
|||||
|
Loss from discontinued operations
|
—
|
|
(1,244
|
)
|
1,244
|
|
|||||
|
Net income
|
$
|
73,619
|
|
$
|
(5,972
|
)
|
$
|
79,591
|
|
||
ETE obtained control of Regency on May 26, 2010. Changes between the year ended December 31, 2011 and the period from May 26, 2010 to December 31, 2010 were primarily due to the consolidation of Regency beginning May 26, 2010.
59
Year Ended December 31, 2010 Compared to the Year Ended December 31, 2009 (tabular dollar amounts are expressed in thousands)
Consolidated Results
|
|
Years Ended December 31,
|
Change
|
|||||||||
|
|
2010
|
2009
|
|||||||||
|
Revenues
|
$
|
6,598,132
|
|
$
|
5,417,295
|
|
$
|
1,180,837
|
|
||
|
Cost of products sold
|
4,111,337
|
|
3,122,056
|
|
989,281
|
|
|||||
|
Gross margin
|
2,486,795
|
|
2,295,239
|
|
191,556
|
|
|||||
|
Operating expenses
|
784,546
|
|
680,893
|
|
103,653
|
|
|||||
|
Depreciation and amortization
|
431,199
|
|
325,024
|
|
106,175
|
|
|||||
|
Selling, general and administrative
|
234,321
|
|
178,924
|
|
55,397
|
|
|||||
|
Operating income
|
1,036,729
|
|
1,110,398
|
|
(73,669
|
)
|
|||||
|
Interest expense, net of interest capitalized
|
(624,887
|
)
|
(468,420
|
)
|
(156,467
|
)
|
|||||
|
Equity in earnings of affiliates
|
65,220
|
|
20,597
|
|
44,623
|
|
|||||
|
Losses on disposal of assets
|
(5,255
|
)
|
(1,564
|
)
|
(3,691
|
)
|
|||||
|
Gains (losses) on non-hedged interest rate derivatives
|
(52,357
|
)
|
33,619
|
|
(85,976
|
)
|
|||||
|
Allowance for equity funds used during construction
|
28,942
|
|
10,557
|
|
18,385
|
|
|||||
|
Impairment of investment in affiliate
|
(52,620
|
)
|
—
|
|
(52,620
|
)
|
|||||
|
Other, net
|
(44,210
|
)
|
1,913
|
|
(46,123
|
)
|
|||||
|
Income tax expense
|
(13,738
|
)
|
(9,229
|
)
|
(4,509
|
)
|
|||||
|
Loss from discontinued operations
|
(1,244
|
)
|
—
|
|
(1,244
|
)
|
|||||
|
Net income
|
$
|
336,580
|
|
$
|
697,871
|
|
$
|
(361,291
|
)
|
||
Parent Company Results
The following table presents the results of the stand-alone results of operations of the Parent Company for the periods indicated:
|
|
Years Ended December 31,
|
Change
|
|||||||||
|
|
2010
|
2009
|
|||||||||
|
Selling, general and administrative expenses
|
$
|
(21,829
|
)
|
$
|
(4,970
|
)
|
$
|
(16,859
|
)
|
||
|
Interest expense
|
(167,658
|
)
|
(74,049
|
)
|
(93,609
|
)
|
|||||
|
Equity in earnings of affiliates
|
455,901
|
|
526,383
|
|
(70,482
|
)
|
|||||
|
Losses on non-hedged interest rate derivatives
|
(53,388
|
)
|
(5,620
|
)
|
(47,768
|
)
|
|||||
|
Other, net
|
(19,721
|
)
|
79
|
|
(19,800
|
)
|
|||||
Selling, General and Administrative Expenses.
Selling, general and administrative expenses increased principally due to $12.8 million in acquisition-related costs associated with the Regency Transactions.
Interest Expense.
Interest expense was primarily impacted by the recognition of $66.4 million of realized losses on hedged interest rate swaps that were terminated with the proceeds from the Parent Company’s September 2010 senior notes offering. In addition to the $66.4 million of realized losses on hedged interest rate swaps, the Parent Company also paid $102.2 million to terminate non-hedged interest rate swaps. The $102.2 million of realized losses on non-hedged interest rate swaps had previously been recognized in net income and therefore the termination of the non-hedged swaps did not impact earnings. The total cash paid to terminate interest rate swaps was $168.6 million, including realized losses on hedged and non-hedged swaps.
Prior to termination of the swaps, the unrealized loss had been reflected in accumulated other comprehensive income. In addition to the realized loss from swap terminations, interest expense is also higher due to distributions on the Preferred Units issued in May 2010. For the year ended December 31, 2010, interest expense includes distributions on the ETE Preferred Units of $14.4 million.
60
The remainder of the increase in Parent Company interest expense was primarily due to the issuance of senior notes in September 2010, which senior notes bore interest at a higher rate than the previous revolving credit facility and term loan facility.
Equity in Earnings of Affiliates.
Equity in earnings of affiliates decreased from 2009 to 2010 primarily due to a decrease in ETP’s net income, as discussed below under “Segment Operating Results — Investment in ETP.”
Losses on Non-Hedged Interest Rate Derivatives
. The Parent Company terminated its interest swaps that were not accounted for as hedges in September 2010 in connection with our issuance of $1.8 billion of senior notes. Prior to that settlement, changes in the fair value of and cash payments related to these swaps were recorded directly in earnings. The variable portion of these swaps was based on the three month LIBOR and its corresponding forward curve. Increases in losses on non-hedged interest rate derivatives were due to changes in these rates. The Parent Company recorded unrealized losses on its interest rate swaps as a result of decreases in the relevant floating index rates during the periods presented.
Other, net.
Other expenses increased primarily due to the non-cash charge of $12.7 million recorded to increase the carrying value of the Series A Convertible Preferred Units.
Segment Operating Results
Net income by segment was as follows:
|
|
Years Ended December 31,
|
|
|||||||||
|
|
2010
|
2009
|
Change
|
||||||||
|
Investment in ETP
|
$
|
617,222
|
|
$
|
791,542
|
|
$
|
(174,320
|
)
|
||
|
Investment in Regency
|
(5,972
|
)
|
—
|
|
(5,972
|
)
|
|||||
|
Corporate and Other
|
(274,670
|
)
|
(93,671
|
)
|
(180,999
|
)
|
|||||
|
Net income
|
$
|
336,580
|
|
$
|
697,871
|
|
$
|
(361,291
|
)
|
||
61
Investment in ETP
|
|
Years Ended December 31,
|
Change
|
|||||||||
|
|
2010
|
2009
|
|||||||||
|
Revenues
|
$
|
5,884,827
|
|
$
|
5,417,295
|
|
$
|
467,532
|
|
||
|
Cost of products sold
|
3,599,941
|
|
3,122,056
|
|
477,885
|
|
|||||
|
Gross margin
|
2,284,886
|
|
2,295,239
|
|
(10,353
|
)
|
|||||
|
Operating expenses
|
707,271
|
|
680,893
|
|
26,378
|
|
|||||
|
Depreciation and amortization
|
343,011
|
|
312,803
|
|
30,208
|
|
|||||
|
Selling, general and administrative
|
176,433
|
|
173,936
|
|
2,497
|
|
|||||
|
Operating income
|
1,058,171
|
|
1,127,607
|
|
(69,436
|
)
|
|||||
|
Interest expense, net of interest capitalized
|
(412,553
|
)
|
(394,274
|
)
|
(18,279
|
)
|
|||||
|
Equity in earnings of affiliates
|
11,727
|
|
20,597
|
|
(8,870
|
)
|
|||||
|
Losses on disposal of assets
|
(5,043
|
)
|
(1,564
|
)
|
(3,479
|
)
|
|||||
|
Gains on non-hedged interest rate derivatives
|
4,616
|
|
39,239
|
|
(34,623
|
)
|
|||||
|
Allowance for equity funds used during construction
|
28,942
|
|
10,557
|
|
18,385
|
|
|||||
|
Impairment of investment in affiliate
|
(52,620
|
)
|
—
|
|
(52,620
|
)
|
|||||
|
Other, net
|
(482
|
)
|
2,157
|
|
(2,639
|
)
|
|||||
|
Income tax expense
|
(15,536
|
)
|
(12,777
|
)
|
(2,759
|
)
|
|||||
|
Net income
|
$
|
617,222
|
|
$
|
791,542
|
|
$
|
(174,320
|
)
|
||
Gross Margin.
ETP’s gross margin decreased primarily due to the net impacts of the following:
|
•
|
Gross margin related to ETP’s intrastate transportation and storage operations decreased $88.7 million due to (i) a decrease of $44.6 million in transportation fees primarily cause by a decrease in the average spot price differential between West and East Texas market hubs and (ii) a decrease of $68.0 million in storage margin caused by the spread between spot prices and forward prices of natural gas being less favorable in 2010 as compared to 2009. These decreases were partially offset by an increase of $18.1 million in margin from natural gas sales and other activity primarily due to more favorable margins on gas sales and favorable impacts from system optimization activities.
|
|
•
|
Revenues from ETP’s interstate transportation operations increased by $22.2 million primarily due to increased gas prices for operational gas sales related for the Transwestern pipeline. In addition, transportation revenues increased approximately $1.9 million due to incremental revenues of $10.2 million for the Tiger pipeline since being placed into service in December 2010.
|
|
•
|
Gross margin related to ETP’s midstream operations increased $85.3 million primarily due to (i) an increase of $24.1 million in fee-based gathering and processing revenues on ETP’s North Texas system, (ii) an increase of $27.9 million in gathering and processing revenues related to increased volumes resulting from ETP’s recent acquisitions and other growth capital expenditures located in Louisiana and West Virginia, and (iii) an increase of $63.0 million in non-fee based margin primarily due to higher processing margins and more favorable NGL prices. These increases in gross margin from ETP’s midstream operations were partially offset by a decrease of $34.2 million due to losses from marketing activities as a result of less favorable market conditions.
|
|
•
|
Gross margin related to ETP’s retail propane and other retail propane related operations decreased due to (i) a decrease of $48.7 million attributable to mark-to-market adjustments for financial instruments used in commodity risk management activities, and (ii) a decrease of approximately $13.5 million due to lower sales volumes as a result of the timing and geographic distribution of temperature patterns. These unfavorable impacts to ETP’s retail propane gross margin were partially offset by an increase in the average margin per gallon sold which resulted in a favorable impact of $8.6 million between periods.
|
Operating Expenses.
ETP’s operating expenses increased primarily due to an increase of approximately $13.3 million in maintenance expense and an increase of approximately $12.4 million in ad valorem and other taxes resulting from increased property values and additions.
Depreciation and Amortization.
ETP’s depreciation and amortization expense increased due to acquisitions and continued expansion of existing assets.
62
Selling, General and Administrative Expense.
ETP’s selling, general and administrative expenses increased primarily due to increased employee-related costs which were significantly offset by a decrease of approximately $31.3 million in professional fees.
Interest Expense.
Interest expense increased principally due to ETP’s issuance of $1.0 billion of senior notes in April 2009 and Transwestern’s issuance of $350.0 million of senior notes in December 2009, a portion of the proceeds of which were used to repay borrowings that had been accruing interest at a lower rate.
Equity in Earnings of Affiliates
. Equity in earnings of affiliates decreased primarily due to ETP’s transfer of substantially all of our interest in MEP to ETE on May 26, 2010. The impact of the MEP transfer was offset by increased earnings from MEP during the period prior to May 26, 2010 as a result of placing the Midcontinent Express pipeline into service in 2009.
Losses on Disposal of Assets
. The increase in losses from the disposal of assets in 2010 primarily resulted from the retirement of pad gas from ETP’s Bammel Storage Facility.
Gains on Non-Hedged Interest Rate Derivatives.
The gains on non-hedged interest rate swaps in 2009 resulted from an increase in the index rate during the periods presented prior to settlement. The gains on non-hedged interest rate derivatives in 2010 reflect the gains recognized on swaps entered into during the period.
Allowance for Equity Funds Used During Construction.
Allowance for equity funds used during construction (“AFUDC”) increased during 2010 primarily due to construction on the Tiger pipeline which was placed in service in December 2010.
Impairment of Investment in Affiliate
. In conjunction with the transfer of ETP’s interest in MEP as discussed above, ETP recorded a non-cash charge of approximately $52.6 million in May 2010 to reduce the carrying value of its interest in MEP to its estimated fair value.
Investment in Regency
|
|
Years Ended December 31,
|
|
|||||||||
|
|
2010
|
2009
|
Change
|
||||||||
|
Revenues
|
$
|
716,613
|
|
$
|
—
|
|
$
|
716,613
|
|
||
|
Cost of products sold
|
504,327
|
|
—
|
|
504,327
|
|
|||||
|
Gross margin
|
212,286
|
|
—
|
|
212,286
|
|
|||||
|
Operating expenses
|
77,808
|
|
—
|
|
77,808
|
|
|||||
|
Depreciation and amortization
|
75,967
|
|
—
|
|
75,967
|
|
|||||
|
Selling, general and administrative
|
43,739
|
|
—
|
|
43,739
|
|
|||||
|
Loss on disposal of assets
|
213
|
|
—
|
|
213
|
|
|||||
|
Operating income
|
14,559
|
|
—
|
|
14,559
|
|
|||||
|
Interest expense, net of interest capitalized
|
(48,251
|
)
|
—
|
|
(48,251
|
)
|
|||||
|
Equity in earnings of affiliates
|
53,493
|
|
—
|
|
53,493
|
|
|||||
|
Other, net
|
(23,977
|
)
|
—
|
|
(23,977
|
)
|
|||||
|
Income tax expense
|
(552
|
)
|
—
|
|
(552
|
)
|
|||||
|
Loss from discontinued operations
|
(1,244
|
)
|
—
|
|
(1,244
|
)
|
|||||
|
Net income
|
$
|
(5,972
|
)
|
$
|
—
|
|
$
|
(5,972
|
)
|
||
Amounts reflected above for the year ended December 31, 2010 represent the results of operations for Regency from May 26, 2010, the date ETE obtained control of Regency, through December 31, 2010. Changes between periods are due to the consolidation of Regency beginning May 26, 2010.
Regency adjusted its assets and liabilities to fair value as of May 26, 2010; therefore, the depreciation and amortization reflected above was based on the new basis of Regency’s assets.
Regency’s results included its equity in earnings related to its 49.9% interest in MEP from May 26, 2010 through December 31, 2010.
Regency’s results for the period from May 26, 2010 through December 31, 2010 reflected a net loss on debt refinancing of approximately $15.7 million, included in other expenses above, related to its redemption of $357.5 million 8.375% senior notes
63
in October 2010. Regency issued $600 million of 6.875% senior notes and used the proceeds to redeem all of its $357.5 million 8.375% senior notes as well as to repay a portion of the outstanding borrowings on its revolving credit facility. The net impact of these borrowings and repayments also resulted in a slight increase in interest expense recognized within the period.
LIQUIDITY AND CAPITAL RESOURCES
Overview
Parent Company Only
The principal sources of the Parent Company's cash flow are distributions it receives from its direct and indirect investments in limited and general partner interests in ETP and Regency. The amount of cash that ETP and Regency distribute to their respective partners, including the Parent Company, each quarter is based on earnings from their respective business activities and the amount of available cash, as discussed below.
The Parent Company’s primary cash requirements are for general and administrative expenses, debt service requirements, distributions to its partners and holders of the Preferred Units and at ETE’s election, capital contributions to ETP and Regency in respect of ETE’s general partner interests in ETP and Regency. The Parent Company currently expects to fund its short-term needs for such items with its distributions from ETP and Regency. The Parent Company distributes its available cash remaining after satisfaction of the aforementioned cash requirements to its Unitholders on a quarterly basis.
On July 19, 2011, ETE entered into the SUG Merger Agreement. Under the terms of the SUG Merger Agreement, ETE will acquire all of the outstanding shares of SUG in a transaction valued at $9.4 billion at the time of the execution of the SUG Merger Agreement, including $5.7 billion in cash and ETE Common Units and $3.7 billion of existing SUG indebtedness. Pursuant to the SUG Merger Agreement, stockholders of SUG may elect to exchange each share of SUG stock for either $44.25 in cash or 1.00 ETE Common Unit. The maximum cash component is 60% of the aggregate consideration and the common unit component can fluctuate between 40% and 50%. Elections in excess of either the cash or common unit limits will be subject to proration.
ETE intends to finance a portion of the cash component of the SUG Merger consideration with debt financing. In connection with entering into the merger agreement, ETE has entered into a senior bridge term loan credit agreement (the "Bridge Loan Agreement") with the Bridge Lenders, pursuant to which, subject to the conditions set forth therein, the Bridge Lenders have agreed to provide a 364-day Bridge Term Loan Facility in an aggregate principal amount of $3.7 billion. ETE's ability to borrow under the Bridge Loan Agreement is subject to the satisfaction of certain conditions precedent, including the absence of a material adverse affect on SUG having occurred subsequent to December 31, 2010 and the delivery of certain documents requested by the administrative agent (such as financial statements, favorable opinions of counsel and customary corporate authorization documents) and the payment of relevant fees and expenses. ETE may use the proceeds of the loans under the Bridge Loan Agreement to finance the SUG Merger, to repay its remaining indebtedness under the Parent Company Credit Agreement (to the extent repaid on the date of initial borrowing under the Bridge Loan Agreement) and to pay transaction costs related to the consummation of the SUG Merger and the Bridge Loan Agreement.
We intend to pursue other financing sources, including a senior note offering or term loan; however, there is no assurance that such financing will be obtained or at terms more favorable than the Bridger Loan Agreement.
In February 2012, we launched the syndication of a new senior secured credit facility of up to $2.3 billion. We intend to use the net proceeds from the senior secured credit facility, along with proceeds received from ETP in the Citrus Acquisition, to fund the cash portion of the SUG Merger and pay related fees and expenses, including existing borrowings under ETE's revolving credit facility and for general partnership purposes. Upon closing, the new senior secured credit facility, combined with proceeds from the Citrus Acquisition, is expected to replace the previously announced $3.7 billion Bridge Term Facility.
We expect ETP and Regency to utilize their resources, along with cash from their operations, to fund their announced growth capital expenditures and working capital needs; however, the Parent Company may issue debt or equity securities from time to time, as we deem prudent to provide liquidity for new capital projects of our subsidiaries or for other partnership purposes.
64
ETP
ETP’s ability to satisfy its obligations and pay distributions to its Unitholders will depend on its future performance, which will be subject to prevailing economic, financial, business and weather conditions, and other factors, many of which are beyond the control of ETP’s management.
ETP currently believes that its business has the following future capital requirements:
|
•
|
growth capital expenditures for its midstream and intrastate transportation and storage operations, primarily for construction of new pipelines and compression facilities, for which ETP expects to spend between $800 million and $900 million in 2012;
|
|
•
|
growth capital expenditures for its NGL transportation and services operations of between $1.3 billion and $1.5 billion in 2012, for which ETP expects to receive capital contributions from Regency related to their 30% interest in Lone Star of between $350 million and $400 million; and
|
|
•
|
maintenance capital expenditures of between $130 million and $140 million in 2012, which include (i) capital expenditures for its intrastate operations for pipeline integrity and for connecting additional wells to its intrastate natural gas systems in order to maintain or increase throughput on existing assets; (ii) capital expenditures for its interstate operations, primarily for pipeline integrity; and (iii) capital expenditures related to NGL transportation and services, which includes amounts ETP expects to be funded by Regency related to its 30% interest in Lone Star.
|
ETP does not expect to make any growth capital expenditures in 2012 related to its interstate transportation operations.
The assets used in ETP's natural gas operations, including pipelines, gathering systems and related facilities, are generally long-lived assets and do not require significant maintenance capital expenditures. Accordingly, ETP does not have any significant financial commitments for maintenance capital expenditures in its businesses. From time to time it experiences increases in pipe costs due to a number of reasons, including but not limited to, replacing pipe caused by delays from mills, limited selection of mills capable of producing large diameter pipe timely, higher steel prices and other factors beyond ETP's control. However, ETP includes these factors into its anticipated growth capital expenditures for each year.
As discussed in Note
3
to our consolidated financial statements, ETP entered into the Amended Citrus Merger Agreement on July 19, 2011. In January 2012, ETP issued senior notes to fund substantially all of the cash portion of the purchase price. ETP also intends to issue sufficient additional equity to maintain its investment grade credit rating and to use the proceeds from such equity issuances to repay other indebtedness and fund capital expenditures. In addition, ETP may enter into other acquisitions, including the potential acquisition of new pipeline systems.
ETP generally funds its capital requirements with cash flows from operating activities and, to the extent that they exceed cash flows from operating activities, with proceeds of borrowings under existing credit facilities, long-term debt, the issuance of additional common units or a combination thereof.
ETP Recently amended its revolving credit facility to, among other things, increase the capacity from $2.0 billion to $2.5 billion and extend the maturity date to 2016. As of
December 31, 2011
, in addition to approximately
$106.8 million
of cash on hand, ETP had available capacity under the ETP revolving credit facility (“ETP Credit Facility”) of approximately
$2.16 billion
. Based on current estimates, ETP expects to utilize capacity under the ETP Credit Facility, along with cash from ETP’s operations, to fund its announced growth capital expenditures and working capital needs through the end of 2012; however, ETP may issue debt or equity securities prior to that time as it deems prudent to provide liquidity for new capital projects, to maintain investment grade credit metrics or other partnership purposes.
65
Regency
Regency expects to funds its capital requirements with cash flows from its operating activities and, to the extent that they exceed cash flows from operating activities, with proceeds of borrowings under its existing credit facility (the "Regency Credit Facility"), operating lease facilities, asset sales, debt offerings and the issuance of additional common units or a combination thereof. As of
December 31, 2011
, in addition to approximately $1.0 million of cash on hand, Regency had available capacity under the Regency Credit Facility of approximately
$549.0 million
.
Regency currently expects its capital expenditures to be as follows:
|
•
|
growth capital expenditures of $245 million in 2012 for its gathering and processing operations;
|
|
•
|
growth capital expenditures of $70 million in 2012 for its contract compression operations;
|
|
•
|
growth capital expenditures of $15 million in 2012 for its contract treating operations;
|
|
•
|
capital contributions in relation to its respective ownership interest in joint ventures of between $385million and $435 million in 2012 for its joint venture operations, which includes between $350 million and $400 million to Lone Star and $35 million to Ranch JV;
|
|
•
|
capital expenditures of $5 million in 2012 for its corporate and others operations; and
|
|
•
|
maintenance capital expenditures, including Regency's proportionate share related to joint ventures, of $28 million in 2012.
|
Regency may revise the timing of these expenditures as necessary to adapt to economic conditions. Regency expects to fund its growth capital expenditures with borrowings under its revolving credit facility and a combination of debt and equity issuances.
Cash Flows
Our cash flows may change in the future due to a number of factors, some of which we cannot control. These factors include regulatory changes, the price for ETP’s and Regency’s products and services, the demand for such products and services, margin requirements resulting from significant changes in commodity prices, operational risks, the successful integration of our acquisitions, and other factors.
For the discussion that follows, certain amounts in prior periods have been reclassified to conform to the 2011 presentation.
Operating Activities
Changes in cash flows from operating activities between periods primarily result from changes in earnings (as discussed in “Results of Operations” above), excluding the impacts of non-cash items and changes in operating assets and liabilities. Non-cash items include recurring non-cash expenses, such as depreciation and amortization expense and non-cash compensation expense. The increase in depreciation and amortization expense during the periods presented primarily resulted from construction and acquisition of assets, while changes in non-cash unit-based compensation expense result from changes in the number of units granted and changes in the grant date fair value estimated for such grants. Cash flows from operating activities also differ from earnings as a result of non-cash charges that may not be recurring, such as impairment charges and allowance for equity funds used during construction. The allowance for equity funds used during construction increases in periods when ETP has a significant amount of interstate pipeline construction in progress. Changes in operating assets and liabilities between periods result from factors such as the changes in the value of price risk management assets and liabilities, timing of accounts receivable collection, payments on accounts payable, the timing of purchases and sales of inventories, and the timing of advances and deposits received from customers.
Following is a summary of operating activities by period:
Year Ended December 31, 2011
Cash provided by operating activities in 2011 was
$1.38 billion
and net income was
$528.2 million
. The difference between net income and cash provided by operating activities in 2011 consisted of non-cash items totaling
$687.2 million
and changes in operating assets and liabilities of
$158.1 million
. The difference between net income and the net cash provided by operating activities also included distributions received from affiliates that exceeded equity in earnings by
$3.1 million
. The non-cash activity consisted primarily of depreciation and amortization of
$611.8 million
and non-cash compensation expense of
$42.2 million
.
66
Year Ended December 31, 2010
Cash provided by operating activities in 2010 was $1.09 billion and net income was $336.6 million. The difference between net income and cash provided by operating activities in 2010 consisted of non-cash items totaling $552.8 million and changes in operating assets and liabilities of $259.5 million. The difference between net income and the net cash provided by operating activities also included ETP interest rate swap termination proceeds of $26.5 million, ETE payments to terminate interest rate swaps of $168.6 million and distributions received from our affiliates that exceeded our equity in earnings by $80.0 million. The non-cash activity consisted primarily of depreciation and amortization of $431.2 million and an impairment in ETP’s investment of an affiliate of $52.6 million. In addition, non-cash compensation expense was $31.2 million. These amounts are partially offset by the allowance for equity funds used during construction of $28.9 million.
Year Ended December 31, 2009
Cash provided by operating activities in 2009 was $723.5 million and net income was $697.9 million. The difference between net income and cash provided by operating activities in 2009 consisted of non-cash items totaling $371.0 million (principally depreciation and amortization expense of $325.0 million and non-cash compensation of $25.8 million, partially offset by the allowance for equity funds used during construction of $10.6 million), offset by changes in operating assets and liabilities of $348.6 million.
Investing Activities
Cash flows from investing activities primarily consist of cash amounts paid for acquisitions, capital expenditures, and cash contributions to ETP’s and Regency’s joint ventures. Changes in capital expenditures between periods primarily result from increases or decreases in ETP’s or Regency’s growth capital expenditures to fund their respective construction and expansion projects.
Following is a summary of investing activities by period:
Year Ended December 31, 2011
Cash used in investing activities in 2011 of
$3.87 billion
was comprised primarily of capital expenditures of
$1.81 billion
(excluding the allowance for equity funds used during construction), including changes in accruals of $97.8 million. ETP invested $1.42 billion for growth capital expenditures and $134.2 million for maintenance capital expenditures during 2011. Regency invested $354 million for growth capital expenditures and $22 million for maintenance capital during 2011. In addition, our subsidiaries paid cash for acquisitions of
$1.97 billion
, which primarily consisted of the acquisition of Lone Star and made net advances to joint ventures of
$149.7 million
.
Year Ended December 31, 2010
Cash used in investing activities in 2010 of $1.83 billion was comprised primarily of total capital expenditures of $1.51 billion (excluding the allowance for equity funds used during construction), including changes in accruals of $44.1 million. ETP invested $1.29 billion for growth capital expenditures in 2010 (primarily related to the Tiger pipeline) and $99.3 million for maintenance capital expenditures. Regency invested $152.3 million for growth capital expenditures and $6.9 million for maintenance capital expenditures between May 26, 2010 and December 31, 2010. In addition, Regency paid cash for acquisitions of $191.3 million, ETP paid cash for acquisitions of $177.9 million, and we received $24.0 million in cash from the acquisition of Regency. Regency received $70.2 million in cash for the sale of its East Texas assets. Our subsidiaries made advances to joint ventures of $92.6 million.
Year Ended December 31, 2009
Cash used in investing activities in 2009 of $1.35 billion was comprised primarily of $530.3 million invested for growth capital expenditures (excluding the allowance for equity funds used during construction), including changes in accruals of $115.7 million. Total growth capital expenditures consist of $412.0 million for ETP’s midstream and intrastate transportation and storage operations, $78.9 million for ETP’s interstate operations, and $39.5 million for ETP’s propane operations. We also incurred $102.7 million in maintenance expenditures needed to sustain operations of which $65.0 million related to ETP’s midstream and intrastate operations, $13.2 million related to ETP’s interstate operations, and $24.4 million related to ETP’s propane operations. In addition, ETP made advances to MEP of $664.5 million and received a reimbursement from FEP of all of its contributions, including $9.0 million that it contributed in 2008. As a result of ETP’s acquisition of a natural gas compression equipment business in exchange for ETP Common Units, cash acquired in connection with acquisitions in 2009 exceeded the cash paid by $30.4 million.
67
Financing Activities
Changes in cash flows from financing activities between periods primarily result from changes in the levels of borrowings and equity issuances, which are primarily used to fund ETP’s and Regency’s acquisitions and growth capital expenditures. Distributions increase between the periods based on increases in the number of common units outstanding or increases in the distribution rate.
Following is a summary of financing activities by period:
Year Ended December 31, 2011
Cash provided by financing activities was
$2.54 billion
in 2011. ETP received
$1.47 billion
in net proceeds from offerings of ETP Common Units, including
$96.3 million
under its equity distribution program (see Note
8
to our consolidated financial statements). In addition, Regency received $435.7 million in net proceeds from offerings of Regency Common Units. We had a consolidated net
increase
in our debt level of
$2.00 billion
and paid distributions of
$525.6 million
to our common unitholders and $24.0 million to the holders of our Preferred Units. In addition, ETP paid distributions of $561.5 million on limited partner interests other than those held by the Parent Company and Regency paid $217.0 million on limited partner interests other than those held by the Parent Company. These distributions are reflected as distributions to noncontrolling interests on our consolidated statements of cash flows.
Year Ended December 31, 2010
Cash provided by financing activities was $761.0 million in 2010. ETP received $1.15 billion in net proceeds from offerings of ETP Common Units, including $239.3 million under ETP’s equity distribution program. In addition, Regency received $399.6 million in net proceeds from offerings of Regency Common Units. We had a consolidated net increase in our debt level of $310.4 million and paid distributions of $483.0 million to our common unitholders and $14.4 million to our preferred unitholders. In addition, ETP paid distributions of $475.7 million on limited partner interests other than those held by the Parent Company, and Regency paid $91.9 million on limited partner interests other than those held by the Parent Company. These distributions are reflected as distributions to noncontrolling interests on our consolidated statements of cash flows.
Financing activities in 2010 also include the Parent Company’s completion of $1.8 billion of senior notes in September 2010, the proceeds of which were used to repay outstanding indebtedness under existing credit facilities.
Year Ended December 31, 2009
Cash provided by financing activities was $598.6 million in 2009. ETP received $936.3 million in net proceeds from equity offerings of ETP, including $81.5 million under ETP’s equity distribution program. Net proceeds from ETP’s equity offerings were used to repay borrowings under the ETP Credit Facility, to fund capital expenditures and capital contributions to joint ventures, as well as for general partnership purposes. In 2009, we had a net increase in our consolidated debt level of $522.0 million primarily due to borrowings to fund capital expenditures and to fund capital contributions to joint ventures, partially offset by the use of proceeds from ETP’s Common Unit offerings. ETP also received net proceeds of approximately $993.6 million from the issuance of senior notes which were used to repay outstanding borrowings under the ETP Credit Facility and for general partnership purposes. In addition, Transwestern issued $350.0 million of senior notes, the proceeds from which were used to repay a portion of outstanding amounts under Transwestern’s intercompany loan agreement. ETP in turn, used the proceeds from Transwestern’s intercompany loan repayment to outstanding borrowings under the ETP Credit Facility. In 2009, we paid distributions of $470.7 million to our partners. In addition, ETP paid distributions of $381.5 million on limited partner interests other than those held by the Parent Company. These distributions are reflected as distributions to noncontrolling interests on our consolidated statements of cash flows.
68
Our outstanding consolidated indebtedness was as follows (in thousands):
|
Pro Forma December 31, 2011
(1)
|
Actual at December 31,
|
|||||||||||
|
2011
|
2010
|
|||||||||||
|
Parent Company Indebtedness:
|
||||||||||||
|
ETE Senior Notes
|
$
|
1,800,000
|
|
$
|
1,800,000
|
|
$
|
1,800,000
|
|
|||
|
ETE senior secured revolving credit facilities
|
71,500
|
|
71,500
|
|
—
|
|
||||||
|
Subsidiary Indebtedness:
|
||||||||||||
|
ETP Senior Notes
|
7,800,000
|
|
6,550,000
|
|
—
|
|
5,050,000
|
|
||||
|
Regency Senior Notes
|
1,350,000
|
|
1,350,000
|
|
850,000
|
|
||||||
|
Transwestern Senior Unsecured Notes
|
870,000
|
|
870,000
|
|
870,000
|
|
||||||
|
HOLP Senior Secured Notes
|
—
|
|
71,314
|
|
103,127
|
|
||||||
|
ETP Revolving Credit Facility
|
314,438
|
|
314,438
|
|
402,327
|
|
||||||
|
Regency Revolving Credit Facility
|
332,000
|
|
332,000
|
|
285,000
|
|
||||||
|
Other long-term debt
|
89
|
|
10,434
|
|
9,671
|
|
||||||
|
Unamortized discounts, net
|
(16,259
|
)
|
(10,309
|
)
|
(6,013
|
)
|
||||||
|
Fair value adjustments related to interest rate swaps
|
11,647
|
|
11,647
|
|
17,260
|
|
||||||
|
Total debt
|
12,533,415
|
|
11,371,024
|
|
9,381,372
|
|
||||||
|
Less: current maturities
|
108,043
|
|
424,160
|
|
35,305
|
|
||||||
|
Long-term debt, less current maturities
|
$
|
12,425,372
|
|
$
|
10,946,864
|
|
$
|
9,346,067
|
|
|||
|
(1)
|
Pro forma amounts reflect December 31, 2011 actual amounts, as adjusted for (i) the closing of the Propane Transaction in January 2012 and assumption by AmeriGas of the debt related to the Propane Business, (ii) the January 2012 senior notes offering described below, and (iii) the 2012 tender offer as described below under “ETP Indebtedness — ETP Senior Notes.”
|
The terms of our consolidated indebtedness and our subsidiaries are described in more detail below and in Note
6
to our consolidated financial statements.
Parent Company Indebtedness
Under the Parent Company Credit Agreement, the obligations of ETE are secured by all tangible and intangible assets of ETE and certain of its subsidiaries, including (i) its ownership of 50,226,967 ETP Common Units; (ii) ETE’s 100% equity interest in ETP LLC and ETP GP, through which ETE holds the IDRs in ETP; (iii) the 26,266,791 common units of Regency; and (iv) ETE’s 100% equity interest in Regency GP LLC and Regency GP LP, through which ETE holds the IDRs in Regency.
Borrowings bear interest, at ETE’s option, at either the Eurodollar rate plus an applicable margin or the alternative base rate. The alternative base rate used to calculate interest on base rate loans will be calculated using the greater of a prime rate, a federal funds effective rate plus 0.50%, and an adjusted one-month LIBOR rate plus 1.00%. The applicable margins are based upon ETE’s leverage ratio and range from 2.75% to 3.75% for Eurodollar loans and from 1.75% to 2.75% for base rate loans. The commitment fee payable on the unused portion of the Parent Company Credit Agreement is based on ETE’s leverage ratio and ranges from 0.50% to 0.75%.
In connection with the Parent Company Credit Agreement, ETE and certain of its subsidiaries entered into a Pledge and Security Agreement (the “Security Agreement”) with Credit Suisse AG, Cayman Islands Branch, as collateral agent (the “Collateral Agent”). The Security Agreement secures all of ETE’s obligations under the Parent Company Credit Agreement and grants to the Collateral Agent a continuing first priority lien on, and security interest in, all of ETE’s and the other grantors’ tangible and intangible assets.
As of
December 31, 2011
, we had a balance of
$71.5 million
outstanding under the Parent Company Credit Agreement and the amount available for future borrowings was
$128.5 million
. The weighted average interest rate on the total amount outstanding as of
December 31, 2011
was
3.46%
.
In February 2012, ETE launched the syndication of a new senior secured credit facility of up to $2.3 billion. ETE intends to use the net proceeds from the senior secured credit facility, along with proceeds received from ETP in the Citrus Acquisition, to fund
69
the cash portion of the SUG Merger and pay related fees and expenses, including existing borrowings under ETE's revolving credit facility and for general partnership purposes. See additional discussion of the SUG Merger at Note 3 to our consolidated financial statements.
ETP’s Indebtedness
ETP Senior Notes
The ETP Senior Notes are unsecured obligations of ETP and the obligation of ETP to repay the ETP Senior Notes is not guaranteed by us or any of ETP’s subsidiaries. The ETP Senior Notes effectively rank junior to all indebtedness and other liabilities of ETP’s existing and future subsidiaries.
January 2012 Senior Notes Offering
In January 2012, ETP completed a public offering of $1.0 billion aggregate principal amount of 5.2% Senior Notes due February 1, 2022 and $1.0 billion aggregate principal amount of 6.5% Senior Notes due February 1, 2042. ETP expects to use the net proceeds of approximately $1.979 billion from this offering to fund the cash portion of the purchase price, or $1.895 billion, of the Citrus Acquisition and for general partnership purposes. If ETP does not consummate the Citrus Acquisition on or before April 17, 2012, or if the Citrus Merger Agreement is terminated at any time on or before such date, ETP must redeem the notes at a redemption price equal to 101% of the aggregate principal amount of the notes, plus accrued and unpaid interest, if any, to, but excluding, the redemption date.
2012 Tender Offer
In January 2012, ETP announced a cash tender offer for up to $750 million aggregate principal amount of specified series of the ETP Senior Notes. The tender offer consisted of two separate offers: an Any and All Offer and a Maximum Tender Offer. The senior notes described below were repurchased under the Any and All Offer and Maximum Tender Offer for a total cost of $885.9 million.
In the Any and All Offer, ETP offered to purchase, under certain conditions, any and all of its 5.65% Senior Notes due August 1, 2012, at a fixed price. Pursuant to the Any and All Offer, ETP purchased $292 million in aggregate principal amount on January 19, 2012.
In the Maximum Tender Offer, ETP offered to purchase, under certain conditions, certain series of outstanding ETP Senior Notes at a fixed spread over the index rate. Pursuant to this tender offer, on February 7, 2012, ETP purchased $200 million aggregate principal amount of its 9.7% Senior Notes due March 15, 2019, $200 million aggregate principal amount of its 9.0% Senior Notes due April 15, 2019 and $58.1 million aggregate principal amount of its 8.5% Senior Notes due April 15, 2014.
Put Option
The holders of ETP's 9.7% Senior Notes due March 15, 2019 have the right to require ETP to repurchase all or a portion of such notes on March 15, 2012 at a purchase price equal to 100% of the principal amount (par value) of the notes tendered. Subsequent to the settlement of the Maximum Tender Offer on February 7, 2012, as discussed above, $400 million aggregate principal amount of such notes remain outstanding. The current market value of these remaining outstanding notes is significantly higher than the principal amount, making a repurchase at par value uneconomic by the holder. However, if such a repurchase were to occur, ETP would intend to refinance any amounts paid on a long-term basis.
ETP Credit Facility
On October 27, 2011, ETP amended and restated the ETP Credit Facility to, among other things, (i) allow for borrowings of up to $2.5 billion; (ii) extend the maturity date from July 20, 2012 to October 27, 2016 (which may be extended by one year with lender approval); (iii) allow for an increase in the size of the credit facility to $3.75 billion (subject to obtaining lender commitments for the additional borrowing capacity); and (iv) to adjust the interest rates and commitment fees to current market terms. Following this amendment and based on ETP's current ratings, the interest margin for LIBOR rate loans is 1.50% and the commitment fee for unused borrowing capacity is 0.25%.
ETP uses the ETP Credit Facility to provide temporary financing for its growth projects, as well as for general partnership purposes. ETP typically repays amounts outstanding under the ETP Credit Facility with proceeds from common unit offerings or long-term notes offerings. The timing of borrowings depends on ETP’s activities and the cash available to fund those activities. The repayments of amounts outstanding under the ETP Credit Facility depend on multiple factors, including market conditions and expectations of future working capital needs, and ultimately are a financing decision made by management. Therefore, the balance outstanding under the ETP Credit Facility may vary significantly between periods. ETP does not believe that such fluctuations indicate a
70
significant change in its liquidity position, because it expects to continue to be able to repay amounts outstanding under the ETP Credit Facility with proceeds from common unit offerings or long-term note offerings.
As of December 31, 2011, ETP had a balance of
$314.4 million
outstanding under the ETP Credit Facility and, taking into account letters of credit of approximately
$25.6 million
,
$2.16 billion
available for future borrowings. The weighted average interest rate on the total amount outstanding as of December 31, 2011 was
1.78%
.
Regency’s Indebtedness
Regency Senior Notes
Regency Senior Notes due 2016
. Regency has $250 million of senior notes that mature on June 1, 2016. The Regency Senior Notes due 2016 bear interest at 9.375%.
At any time before June 1, 2012, up to 35% of the Regency Senior Notes due 2016 can be redeemed at a price of 109.375% plus accrued interest. Beginning June 1, 2013, Regency may redeem all or part of these notes for the principal amount plus a declining premium until June 1, 2015, and thereafter at par, plus accrued and unpaid interest. At any time prior to June 1, 2013, Regency may also redeem all or part of the Regency Senior Notes due 2016 at a price equal to 100% of the principal amount of notes redeemed plus accrued interest and the applicable premium, which equals the greater of (1) 1% of the principal amount of the note; or (2) the excess of the present value at such redemption date of (i) the redemption price of the note at June 1, 2013 plus (ii) all required interest payments due on the note through June 1, 2013, computed using a discount rate equal to the treasury rate (as defined in the indenture governing the senior notes) as of such redemption date plus 0.50% over the principal amount of the note.
Regency Senior Notes due 2018.
Regency has $600 million of senior notes that mature on December 1, 2018. The Regency Senior Notes due 2018 bear interest at 6.875%.
At any time before December 1, 2013, up to 35% of the Regency Senior Notes due 2018 can be redeemed at a price of 106.875% plus accrued interest. Beginning December 1, 2014, Regency may redeem all or part of the Regency Senior Notes due 2018 for the principal amount plus a declining premium until December 31, 2016, and thereafter at par, plus accrued and unpaid interest. At any time prior to December 1, 2014, Regency may also redeem all or part of the Regency Senior Notes due 2018 at a price equal to 100% of the principal amount redeemed plus accrued interest and the applicable premium, which equals to the greater of (1) 1% of the principal amount of the note; or (2) the excess of the present value at such redemption date of (i) the redemption price of the note at December 1, 2014 plus (ii) all required interest payments due on the note through December 1, 2014, computed using a discount rate equal to the treasury rate (as defined) as of such redemption date plus 0.50% over the principal amount of the note.
Regency Senior Notes due 2021
. In May 2011, Regency issued $500 million in senior notes that mature on July 15, 2021. The senior notes bear interest at 6.50% payable semi-annually in arrears on January 15 and July 15, commencing January 15, 2012. Regency used the proceeds, net of commissions, of approximately $491.3 million to repay borrowings outstanding under the Regency Credit Facility. Regency capitalized $9.8 million in debt issuance costs that will be amortized to interest expense, net over the term of the notes.
At any time prior to July 15, 2016, Regency may redeem some or all of the Regency 2021 Notes at a redemption price equal to
100%
of the principal amount plus a “make-whole” premium, plus accrued and unpaid interest to the redemption date. At any time before July 15, 2014, Regency may redeem up to
35%
of the aggregate principal amount of the Regency 2021 Notes then outstanding at a redemption price equal to
106.5%
of the principal amount of the notes to be redeemed, plus accrued and unpaid interest to the redemption date.
Upon a change of control, each of Regency’s senior notes may, at such Unitholder’s option, require Regency to purchase all or a portion of its notes at a purchase price of 101% plus accrued interest and liquidated damages, if any.
Regency Revolving Credit Facility
The Regency Credit Facility has aggregate revolving commitments of $900 million, with $200 million of availability for letters of credit. Regency also has the option to request an additional $250 million in revolving commitments with ten business days written notice provided that no event of default has occurred or would result due to such increase, and all other additional conditions for the increase of the commitments set forth in the credit facility have been met. The maturity date of the Regency Credit Facility is June 15, 2014.
The outstanding balance of revolving loans under the Regency Credit Facility bears interest at LIBOR plus a margin or an alternate base rate. The alternate base rate used to calculate interest on base rate loans will be calculated using the greater of a base rate, a
71
federal funds effective rate plus
0.50%
and an adjusted one-month LIBOR rate plus
1.0%
. The applicable margin ranges from
1.50%
to
2.25%
for base rate loans and
2.50%
to
3.25%
for Eurodollar loans.
Regency pays (i) a commitment fee ranging between
0.375%
and
0.50%
per annum for the unused portion of the revolving loan commitments; (ii) a participation fee for each revolving lender participating in letters of credit ranging between
2.50%
and
3.25%
per annum of the average daily amount of such lender’s letter of credit exposure and; (iii) a fronting fee to the issuing bank of letters of credit equal to
0.125%
per annum of the average daily amount of its letter of credit exposure. In December 2011, Regency amended its credit facility to allow for additional investments in its joint ventures.
As of
December 31, 2011
, Regency had a balance outstanding of
$332.0 million
under the Regency Credit Facility in revolving credit loans and approximately
$19.0 million
in letters of credit. The total amount available under the Regency Credit Facility, as of
December 31, 2011
, which is reduced by any letters of credit, was approximately
$549.0 million
. The weighted average interest rate on the total amount outstanding as of
December 31, 2011
was
3.18%
.
Covenants Related to Our Credit Agreements
Covenants Related to the Parent Company
The Parent Company Credit Agreement contains customary representations, warranties and covenants, including financial covenants regarding a maximum leverage ratio, a maximum consolidated leverage ratio, a minimum fixed charge coverage ratio and a minimum loan to value ratio. In addition, the Parent Company Credit Agreement contains customary events of default, including, but not limited to, (i) default for failure to pay the principal on any loan or any reimbursement obligation with respect to any letter of credit when due and payable, (ii) failure to duly observe, perform or comply with certain specified covenants, (iii) a representation or warranty made in connection with any loan document proves to have been false or incorrect in any material respect on any date on or as of which made, and (iv) the occurrence of a change of control.
Covenants Related to ETP
ETP Senior Notes
The agreements relating to ETP’s senior notes contain restrictive covenants customary for an issuer with an investment-grade rating from the rating agencies, which covenants include limitations on liens and a restriction on sale-leaseback transactions.
ETP Credit Facility
The credit agreement relating to the ETP Credit Facility contains covenants that limit (subject to certain exceptions) ETP’s and certain of ETP’s subsidiaries’ ability to, among other things:
|
•
|
incur indebtedness;
|
|
•
|
grant liens;
|
|
•
|
enter into mergers;
|
|
•
|
dispose of assets;
|
|
•
|
make certain investments;
|
|
•
|
make Distributions (as defined in such credit agreement) during certain Defaults (as defined in such credit agreement) and during any Event of Default (as defined in such credit agreement);
|
|
•
|
engage in business substantially different in nature than the business currently conducted by ETP and its subsidiaries;
|
|
•
|
engage in transactions with affiliates; and
|
|
•
|
enter into restrictive agreements.
|
The credit agreement relating to the ETP Credit Facility also contains a financial covenant that provides that the Leverage Ratio, as defined in the ETP Credit Facility, shall not exceed 5.0 to 1 as of the end of each quarter, with a permitted increase to 5.5 to 1 during a Specified Acquisition Period, as defined in the ETP Credit Facility.
The agreements relating to the Transwestern senior notes contain certain restrictions that, among other things, limit the incurrence of additional debt, the sale of all or substantially all assets and the payment of dividends and specify a maximum debt to capitalization ratio.
72
Failure to comply with the various restrictive and affirmative covenants of debt could require ETP to pay debt balances prior to scheduled maturity and could negatively impact its Operating Companies’ ability to incur additional debt and/or ETP’s ability to pay distributions.
Covenants Related to Regency
Regency Senior Notes
The Regency senior notes contain various covenants that limit, among other things, Regency’s ability, and the ability of certain of its subsidiaries, to:
|
•
|
incur additional indebtedness;
|
|
•
|
pay distributions on, or repurchase or redeem equity interests;
|
|
•
|
make certain investments;
|
|
•
|
incur liens;
|
|
•
|
enter into certain types of transactions with affiliates; and
|
|
•
|
sell assets, consolidate or merge with or into other companies.
|
If the Regency senior notes achieve investment grade ratings by both Moody’s and S&P and no default or event of default has occurred and is continuing, Regency will no longer be subject to many of the foregoing covenants.
Regency Credit Facility
The credit agreement relating to the Regency Credit Facility also contains a financial covenant that provides that Regency maintain a secured leverage ratio not to exceed 3.0 to 1 and requires Regency Gas Services ("RGS," a wholly-owned subsidiary of Regency) and its subsidiaries to maintain a debt to consolidated EBITDA (as defined in its credit agreement) ratio less than 5.25.
The Regency Credit Facility also contains various covenants that limit, among other things, the ability of Regency and RGS to:
|
•
|
incur indebtedness;
|
|
•
|
grant liens;
|
|
•
|
enter into sale and leaseback transactions;
|
|
•
|
make certain investments, loans and advances;
|
|
•
|
dissolve or enter into a merger or consolidation;
|
|
•
|
enter into asset sales or make acquisitions;
|
|
•
|
enter into transactions with affiliates;
|
|
•
|
prepay other indebtedness or amend organizational documents or transaction documents (as defined in the credit agreement governing the Regency Credit Facility);
|
|
•
|
issue capital stock or create subsidiaries; and
|
|
•
|
engage in any business other than those businesses in which it was engaged at the time of the effectiveness of the Regency Credit Facility or reasonable extensions thereof.
|
Compliance with our Covenants
We are required to assess compliance quarterly and were in compliance with all requirements, limitations, and covenants relating to ETE’s and its subsidiaries’ debt agreements as of
December 31, 2011
. We expect ETP and Regency to fund their working capital needs and growth capital expenditures with cash on hand, cash flow from operations and borrowings under the ETP Credit Facility and Regency Credit Facility, respectively. However, we, ETP or Regency may issue debt or equity securities prior to that time as we deem prudent to provide liquidity for new capital projects or other partnership purposes. While we expect that financing for future expansion projects will result in an increase in our level of indebtedness in future quarters, we also expect that the incremental cash flow from the expansion projects will allow ETP and Regency to satisfy their respective financial covenants related to their existing debt in 2012.
Each of the agreements referred to above are incorporated herein by reference to our, ETP’s and Regency’s reports previously filed with the SEC under the Exchange Act. See “Item 1. Business – SEC Reporting.”
73
Contractual Obligations
The following table summarizes our long-term debt and other contractual obligations as of
December 31, 2011
, excluding amounts related to ETP's Propane Business, which was contributed to AmeriGas in January 2012 (in thousands):
|
|
Payments Due by Period
|
||||||||||||||||||
|
Contractual Obligations
|
Total
|
Less Than 1
Year
|
1-3 Years
|
3-5 Years
|
Thereafter
|
||||||||||||||
|
Long-term debt
|
$
|
11,288,027
|
|
$
|
400,043
|
|
$
|
1,120,046
|
|
$
|
1,510,938
|
|
$
|
8,257,000
|
|
||||
|
Interest on long-term debt
(a)
|
7,495,746
|
|
755,236
|
|
1,422,817
|
|
1,243,443
|
|
4,074,250
|
|
|||||||||
|
Payments on derivatives
|
119,339
|
|
76,633
|
|
42,706
|
|
—
|
|
—
|
|
|||||||||
|
Purchase commitments
(b)
|
66,781
|
|
66,781
|
|
—
|
|
—
|
|
—
|
|
|||||||||
|
Lease obligations
|
247,663
|
|
22,480
|
|
38,135
|
|
34,575
|
|
152,473
|
|
|||||||||
|
Distributions and Redemption of Preferred Units
(c)
|
299,369
|
|
31,781
|
|
49,097
|
|
15,563
|
|
202,928
|
|
|||||||||
|
Totals
(d)
|
$
|
19,516,925
|
|
$
|
1,352,954
|
|
$
|
2,672,801
|
|
$
|
2,804,519
|
|
$
|
12,686,651
|
|
||||
|
(a)
|
Interest payments on long-term debt are based on the principal amount of debt obligations as of
December 31, 2011
. With respect to variable rate debt, the interest payments were estimated using the interest rate as of
December 31, 2011
. To the extent interest rates change, our contractual obligation for interest payments will change. See “Item 7A. Quantitative and Qualitative Disclosures About Market Risk” for further discussion.
|
|
(b)
|
We define a purchase commitment as an agreement to purchase goods or services that is enforceable and legally binding (unconditional) on us that specifies all significant terms, including: fixed or minimum quantities to be purchased; fixed, minimum or variable price provisions; and the approximate timing of the transactions. We have long and short-term product purchase obligations for propane and energy commodities with third-party suppliers. These purchase obligations are entered into at either variable or fixed prices. The purchase prices that we are obligated to pay under variable price contracts approximate market prices at the time we take delivery of the volumes. Our estimated future variable price contract payment obligations are based on the
December 31, 2011
market price of the applicable commodity applied to future volume commitments. Actual future payment obligations may vary depending on market prices at the time of delivery. The purchase prices that we are obligated to pay under fixed price contracts are established at the inception of the contract. Our estimated future fixed price contract payment obligations are based on the contracted fixed price under each commodity contract. Obligations shown in the table represent estimated payment obligations under these contracts for the periods indicated.
|
|
(c)
|
Assumes the Preferred Units are converted to ETE Common Units on May 26, 2014 and assumes the Regency Preferred Units are redeemed for cash on September 2, 2029.
|
|
(d)
|
Excludes net non-current deferred tax liabilities of
$217.2 million
due to uncertainty of the timing of future cash flows for such liabilities.
|
74
Cash Distributions
Cash Distributions Paid by the Parent Company
Under the Parent Company Partnership Agreement, the Parent Company will distribute all of its Available Cash, as defined, within 50 days following the end of each fiscal quarter. Available cash generally means, with respect to any quarter, all cash on hand at the end of such quarter less the amount of cash reserves that are necessary or appropriate in the reasonable discretion of the General Partner that is necessary or appropriate to provide for future cash requirements.
Distributions declared are as follows:
|
Quarter Ended
|
|
Record Date
|
|
Payment Date
|
|
Distribution per
ETE Common Unit
|
||
|
September 30, 2011
|
|
November 4, 2011
|
November 18, 2011
|
$
|
0.6250
|
|
||
|
June 30, 2011
|
|
August 5, 2011
|
August 19, 2011
|
0.6250
|
|
|||
|
March 31, 2011
|
|
May 6, 2011
|
May 19, 2011
|
0.5600
|
|
|||
|
December 31, 2010
|
|
February 7, 2011
|
February 18, 2011
|
0.5400
|
|
|||
|
September 30, 2010
|
|
November 8, 2010
|
November 19, 2010
|
$
|
0.5400
|
|
||
|
June 30, 2010
|
|
August 9, 2010
|
August 19, 2010
|
0.5400
|
|
|||
|
March 31, 2010
|
|
May 7, 2010
|
May 19, 2010
|
0.5400
|
|
|||
|
December 31, 2009
|
|
February 8, 2010
|
February 19, 2010
|
0.5400
|
|
|||
|
September 30, 2009
|
|
November 9, 2009
|
November 19, 2009
|
$
|
0.5350
|
|
||
|
June 30, 2009
|
|
August 7, 2009
|
August 19, 2009
|
0.5350
|
|
|||
|
March 31, 2009
|
|
May 8, 2009
|
May 19, 2009
|
0.5250
|
|
|||
|
December 31, 2008
|
|
February 6, 2009
|
February 19, 2009
|
0.5100
|
|
|||
On
January 25, 2012
, the Parent Company declared a cash distribution for the three months ended
December 31, 2011
of
$0.625
per Common Unit, or
$2.50
annualized. We paid this distribution on
February 17, 2012
to Unitholders of record at the close of business on
February 7, 2012
.
The total amounts of distributions declared during the periods presented (all from Available Cash from the Parent Company’s operating surplus and are shown in the period to which they relate) are as follows (in thousands):
|
|
Years Ended December 31,
|
||||||||||
|
|
2011
|
2010
|
2009
|
||||||||
|
Limited Partners
|
$
|
542,939
|
|
$
|
481,554
|
|
$
|
475,911
|
|
||
|
General Partner interest
|
1,685
|
|
1,495
|
|
1,478
|
|
|||||
|
Total Parent Company distributions
|
$
|
544,624
|
|
$
|
483,049
|
|
$
|
477,389
|
|
||
75
Cash Distributions Received by the Parent Company
We currently have no independent operations outside of our direct and indirect interests in ETP and Regency. The Parent Company’s only cash-generating assets currently consist of distributions from ETP and Regency related to the following limited and general partner interests, including IDRs:
|
•
|
ETE’s ownership of the general partner interest in ETP, which it holds through its ownership interests in ETP GP.
|
|
•
|
50,226,967 ETP Common Units, which ETE holds directly, representing approximately
22%
of the total outstanding ETP Common Units as of
December 31, 2011
.
|
|
•
|
100% of the IDRs in ETP, which we hold through our ownership interest in ETP GP and which entitle us to receive specified percentages of the cash distributed by ETP as ETP’s per unit distribution increases. The IDRs held by ETP GP entitles it to receive an increasing share of ETP’s cash distributions when pre-defined distribution targets are achieved. The IDRs in ETP entitle us to receive 48% of ETP’s cash distributions in excess of $0.4125 per unit.
|
|
•
|
ETE’s ownership of the general partner interest in Regency, which it holds through it ownership interest in Regency GP.
|
|
•
|
26,266,791 Regency Common Units, which ETE holds directly, representing approximately
17%
of the total outstanding Regency Common Units as of
December 31, 2011
.
|
|
•
|
100% of the IDRs in Regency, which we hold through our ownership interest in Regency GP and which entitle us to receive the specified percentages of the cash distributed by Regency as Regency’s per unit distribution increases. The IDRs held by Regency GP entitles it to receive an increasing share of cash distributions when pre-defined distribution targets are achieved. Regency’s partnership agreement, which IDRs entitle the Parent Company to receive 13% of Regency’s cash distributions after each unitholder receives a total of $0.4025 per unit and until $0.4375 per unit, 23% of Regency’s cash distributions after each Regency Unitholder receives a total of $0.4375 per unit and until $0.525 per unit and 48% of Regency’s cash distributions in excess of $0.525 per unit.
|
The total amount of distributions the Parent Company received from ETP and Regency relating to its limited partner interests, general partner interest and IDRs (shown in the period to which they relate) for the periods ended as noted below is as follows:
|
|
Years Ended December 31,
|
||||||||||
|
|
2011
|
2010
|
2009
|
||||||||
|
Distributions from ETP:
|
|||||||||||
|
Limited Partners
|
$
|
179,561
|
|
$
|
190,531
|
|
$
|
223,440
|
|
||
|
General Partner Interest
|
19,603
|
|
19,524
|
|
19,505
|
|
|||||
|
Incentive Distribution Rights
|
421,888
|
|
375,979
|
|
350,486
|
|
|||||
|
Total distributions from ETP
|
621,052
|
|
586,034
|
|
593,431
|
|
|||||
|
Distributions from Regency:
|
|||||||||||
|
Limited Partners
|
47,543
|
|
35,066
|
|
—
|
|
|||||
|
General Partner Interest
|
5,185
|
|
3,640
|
|
—
|
|
|||||
|
Incentive Distribution Rights
|
6,057
|
|
3,016
|
|
—
|
|
|||||
|
Total distributions from Regency
|
58,785
|
|
41,722
|
|
—
|
|
|||||
|
Total distributions from subsidiaries
|
$
|
679,837
|
|
$
|
627,756
|
|
$
|
593,431
|
|
||
76
Cash Distributions Paid by ETP
ETP expects to use substantially all of its cash provided by operating and financing activities from its operating companies to provide distributions to its Unitholders. Under ETP’s partnership agreement, ETP will distribute to its partners within 45 days after the end of each calendar quarter, an amount equal to all of its Available Cash (as defined in ETP’s partnership agreement) for such quarter. Available Cash generally means, with respect to any quarter of ETP, all cash on hand at the end of such quarter less the amount of cash reserves established by ETP’s General Partner in its reasonable discretion that is necessary or appropriate to provide for future cash requirements. ETP’s commitment to its Unitholders is to distribute the increase in its cash flow while maintaining prudent reserves for its operations.
Distributions declared by ETP are summarized as follows:
|
Quarter Ended
|
|
Record Date
|
|
Payment Date
|
|
Distribution per
ETP Common Unit
|
||
|
September 30, 2011
|
|
November 4, 2011
|
November 14, 2011
|
$
|
0.89375
|
|
||
|
June 30, 2011
|
|
August 5, 2011
|
August 15, 2011
|
0.89375
|
|
|||
|
March 31, 2011
|
|
May 6, 2011
|
May 16, 2011
|
0.89375
|
|
|||
|
December 31, 2010
|
|
February 7, 2011
|
February 14, 2011
|
0.89375
|
|
|||
|
September 30, 2010
|
|
November 8, 2010
|
November 15, 2010
|
$
|
0.89375
|
|
||
|
June 30, 2010
|
|
August 9, 2010
|
August 16, 2010
|
0.89375
|
|
|||
|
March 31, 2010
|
|
May 7, 2010
|
May 17, 2010
|
0.89375
|
|
|||
|
December 31, 2009
|
|
February 8, 2010
|
February 15, 2010
|
0.89375
|
|
|||
|
September 30, 2009
|
|
November 9, 2009
|
November 16, 2009
|
$
|
0.89375
|
|
||
|
June 30, 2009
|
|
August 7, 2009
|
August 14, 2009
|
0.89375
|
|
|||
|
March 31, 2009
|
|
May 8, 2009
|
May 15, 2009
|
0.89375
|
|
|||
|
December 31, 2008
|
|
February 6, 2009
|
February 13, 2009
|
0.89375
|
|
|||
On
January 25, 2012
, ETP declared a cash distribution for the three months ended
December 31, 2011
of
$0.89375
per ETP Common Unit, or
$3.575
annualized. ETP paid this distribution on
February 14, 2012
to ETP Unitholders of record at the close of business on
February 7, 2012
.
The total amounts of distributions declared during the periods presented (all from Available Cash from ETP’s operating surplus and are shown in the period to which they relate) are as follows (in thousands):
|
|
Years Ended December 31,
|
||||||||||
|
|
2011
|
2010
|
2009
|
||||||||
|
Limited Partners:
|
|||||||||||
|
Common Units
|
$
|
762,350
|
|
$
|
676,798
|
|
$
|
629,263
|
|
||
|
Class E Units
|
12,484
|
|
12,484
|
|
12,484
|
|
|||||
|
General Partner interest
|
19,603
|
|
19,524
|
|
19,505
|
|
|||||
|
Incentive Distribution Rights
|
421,888
|
|
375,979
|
|
350,486
|
|
|||||
|
Total ETP distributions
|
$
|
1,216,325
|
|
$
|
1,084,785
|
|
$
|
1,011,738
|
|
||
77
Cash Distributions Paid by Regency
Regency’s partnership agreement requires that Regency distribute all of its Available Cash to its Unitholders and its General Partner within 45 days after the end of each quarter to unitholders of record on the applicable record date, as determined by the general partner. The term Available Cash generally consists of all cash and cash equivalents on hand at the end of that quarter less the amount of cash reserves established by the general partner to: (i) provide for the proper conduct of the Partnership’s business; (ii) comply with applicable law, any debt instruments or other agreements; or (iii) provide funds for distributions to the unitholders and to the General Partner for any one or more of the next four quarters and plus, all cash on hand on that date of determination of available cash for the quarter resulting from working capital borrowings made after the end of the quarter for which the determination is being made.
Distributions paid by Regency since the date of acquisition are summarized as follows:
|
Quarter Ended
|
|
Record Date
|
|
Payment Date
|
|
Distribution per
Regency Common
Unit
|
||
|
September 30, 2011
|
November 7, 2011
|
November 14, 2011
|
$
|
0.455
|
|
|||
|
June 30, 2011
|
August 5, 2011
|
August 12, 2011
|
0.450
|
|
||||
|
March 31, 2011
|
May 6, 2011
|
May 13, 2011
|
0.445
|
|
||||
|
December 31, 2010
|
February 7, 2011
|
February 14, 2011
|
0.445
|
|
||||
|
September 30, 2010
|
November 5, 2010
|
|
November 12, 2010
|
|
$
|
0.445
|
|
|
|
June 30, 2010
|
August 6, 2010
|
|
August 13, 2010
|
|
0.445
|
|
||
On
January 26, 2012
, Regency declared a cash distribution for the three months ended
December 31, 2011
of
$0.46
per Regency Common Unit, or
$1.84
annualized. Regency paid this distribution on
February 13, 2012
to Regency Unitholders of record at the close of business on
February 6, 2012
.
The total amounts of Regency distributions declared since the date of acquisition (all from Regency’s operating surplus and are shown in the period with respect to which they relate) are as follows (in thousands):
|
|
Years Ended December 31,
|
||||||
|
2011
|
2010
|
||||||
|
Limited Partners
|
$
|
274,538
|
|
$
|
175,360
|
|
|
|
General Partner Interest
|
5,185
|
|
3,640
|
|
|||
|
Incentive Distribution Rights
|
6,057
|
|
3,016
|
|
|||
|
Total Regency distributions
|
$
|
285,780
|
|
$
|
182,016
|
|
|
New Accounting Standards
In September 2011, the Financial Accounting Standards Board (“FASB”) issued Accounting Standards Update No. 2011-08,
Intangibles - Goodwill and Other (Topic 350): Testing Goodwill for Impairment
(“ASU 2011-08”), which simplified how entities test goodwill for impairment. ASU 2011-08 gives entities the option, under certain circumstances, to first assess qualitative factors to determine whether it is more likely than not that the fair value of a reporting unit is less than its carrying amount as a basis for determining whether further impairment testing is necessary. ASU 2011-08 is effective for fiscal years beginning after December 15, 2011, and early adoption is permitted. We adopted and applied this standard to our annual impairment tests performed for certain reporting units during the year ended December 31, 2011. There was no impact to our financial position or results of operations.
78
Estimates and Critical Accounting Policies
The selection and application of accounting policies is an important process that has developed as our business activities have evolved and as the accounting rules have developed. Accounting rules generally do not involve a selection among alternatives, but involve an implementation and interpretation of existing rules, and the use of judgment applied to the specific set of circumstances existing in our business. We make every effort to properly comply with all applicable rules on or before their adoption (when early adoption is permitted), and we believe the proper implementation and consistent application of the accounting rules are critical. Our critical accounting policies are discussed below. For further details on our accounting policies, see Note
2
to our consolidated financial statements.
Use of Estimates
. The preparation of financial statements in conformity with GAAP requires management to make estimates and assumptions that affect the reported amounts of assets and liabilities and the accrual for and disclosure of contingent assets and liabilities at the date of the financial statements and the reported amounts of revenues and expenses during the reporting period. The natural gas industry conducts its business by processing actual transactions at the end of the month following the month of delivery. Consequently, the most current month’s financial results for midstream, NGL and intrastate transportation and storage operations are estimated using volume estimates and market prices. Any differences between estimated results and actual results are recognized in the following month’s financial statements. Management believes that the operating results estimated for the year ended
December 31, 2011
represent the actual results in all material respects.
Some of the other significant estimates made by management include, but are not limited to, the timing of certain forecasted transactions that are hedged, the fair value of derivative instruments, useful lives for depreciation and amortization, purchase accounting allocations and subsequent realizability of intangible assets, fair value measurements used in the goodwill impairment test, market value of inventory, assets and liabilities resulting from the regulated ratemaking process, contingency reserves and environmental reserves. Actual results could differ from those estimates.
Revenue Recognition
.
Revenues for sales of natural gas and NGLs are recognized at the later of the time of delivery of the product to the customer or the time of sale. Revenues from service labor, transportation, treating, compression and gas processing, are recognized upon completion of the service. Transportation capacity payments are recognized when earned in the period the capacity is made available.
ETP’s intrastate transportation and storage and interstate transportation operations’ results are determined primarily by the amount of capacity its customers reserve, as well as the actual volume of natural gas that flows through the transportation pipelines. Under transportation contracts, ETP’s customers are charged (i) a demand fee, which is a fixed fee for the reservation of an agreed amount of capacity on the transportation pipeline for a specified period of time and which obligates the customer to pay even if the customer does not transport natural gas on the respective pipeline, (ii) a transportation fee, which is based on the actual throughput of natural gas by the customer, (iii) fuel retention based on a percentage of gas transported on the pipeline, or (iv) a combination of the three, generally payable monthly. Fuel retained for a fee is typically valued at market prices.
ETP’s intrastate transportation and storage operations also generate revenues and margin from the sale of natural gas to electric utilities, independent power plants, local distribution companies, industrial end-users and other marketing companies on the HPL System. Generally, ETP purchases natural gas from the market, including purchases from midstream marketing operations, and from producers at the wellhead.
In addition, ETP’s intrastate transportation and storage operations generate revenues and margin from fees charged for storing customers’ working natural gas in its storage facilities. ETP also engages in natural gas storage transactions in which it seeks to find and profit from pricing differences that occur over time utilizing the Bammel storage reservoir. ETP purchases physical natural gas and then sell financial contracts at a price sufficient to cover its carrying costs and provide for a gross profit margin. ETP expects margins from natural gas storage transactions to be higher during the periods from November to March of each year and lower during the period from April through October of each year due to the increased demand for natural gas during colder weather. However, ETP cannot assure that its management’s expectations will be fully realized in the future and in what time period, due to various factors including weather, availability of natural gas in regions in which it operates, competitive factors in the energy industry, and other issues.
Results from ETP’s midstream operations are determined primarily by the volumes of natural gas gathered, compressed, treated, processed, purchased and sold through our pipeline and gathering systems and the level of natural gas and NGL prices. ETP generates midstream revenues and gross margins principally under fee-based or other arrangements in which it receives a fee for natural gas gathering, compressing, treating or processing services. The revenue earned from these arrangements is directly related to the volume of natural gas that flows through ETP’s systems and is not directly dependent on commodity prices.
79
ETP also utilizes other types of arrangements in its midstream operations, including (i) discount-to-index price arrangements, which involve purchases of natural gas at either (1) a percentage discount to a specified index price, (2) a specified index price less a fixed amount or (3) a percentage discount to a specified index price less an additional fixed amount, (ii) percent-of-proceeds arrangements under which ETP gathers and processes natural gas on behalf of producers, sells the resulting residue gas and NGL volumes at market prices and remits to producers an agreed upon percentage of the proceeds based on an index price, and (iii) keep-whole arrangements where ETP gathers natural gas from the producer, processes the natural gas and sells the resulting NGLs to third parties at market prices. In many cases, ETP provides services under contracts that contain a combination of more than one of the arrangements described above. The terms of ETP’s contracts vary based on gas quality conditions, the competitive environment at the time the contracts are signed and customer requirements. ETP’s contract mix may change as a result of changes in producer preferences, expansion in regions where some types of contracts are more common and other market factors.
ETP conducts marketing activities in which it markets the natural gas that flows through its assets, referred to as on-system gas. ETP also attracts other customers by marketing volumes of natural gas that do not move through its assets, referred to as off-system gas. For both on-system and off-system gas, ETP purchases natural gas from natural gas producers and other supply points and sell that natural gas to utilities, industrial consumers, other marketers and pipeline companies, thereby generating gross margins based upon the difference between the purchase and resale prices.
ETP injects and holds natural gas in its Bammel storage facility to take advantage of contango markets (i.e., when the price of natural gas is higher in the future than the current spot price. ETP uses financial derivatives to hedge the natural gas held in connection with these arbitrage opportunities.). At the inception of the hedge, ETP will lock in a margin by purchasing gas in the spot market or off peak season and entering into a financial contract to lock in the sale price. If ETP designates the related financial contract as a fair value hedge for accounting purposes, ETP will value the hedged natural gas inventory at current spot market prices along with the financial derivative it uses to hedge it. Changes in the spread between the forward natural gas prices designated as fair value hedges and the physical inventory spot prices result in unrealized gains or losses until the underlying physical gas is withdrawn and the related designated derivatives are settled. Once the gas is withdrawn and the designated derivatives are settled, the previously unrealized gains or losses associated with these positions are realized. Unrealized margins represent the unrealized gains or losses from ETP’s derivative instruments using mark-to-market accounting, with changes in the fair value of its derivatives being recorded directly in earnings. These margins fluctuate based upon changes in the spreads between the physical spot prices and forward natural gas prices. If the spread narrows between the physical and financial prices, ETP will record unrealized gains or lower unrealized losses. If the spread widens, ETP will record unrealized losses or lower unrealized gains. Typically, as ETP enters the winter months, the spread converges so that it recognizes in earnings the original locked-in spread through either mark-to-market adjustments or the physical withdrawal of natural gas.
NGL storage and pipeline transportation revenues are recognized when services are performed or products are delivered, respectively. Fractionation and processing revenues are recognized when product is either loaded into a truck or injected into a third party pipeline, which is when title and risk of loss pass to the customer.
Regency earns revenue from (i) domestic sales of natural gas, NGLs and condensate, (ii) natural gas gathering, processing and transportation, (iii) contract compression services and (iv) contract treating services. Revenue associated with sales of natural gas, NGLs and condensate are recognized when title passes to the customer, which is when the risk of ownership passes to the purchaser and physical delivery occurs. Revenue associated with transportation and processing fees are recognized when the service is provided. For contract compression services, revenue is recognized when the service is performed. For gathering and processing services, Regency receives either fees or commodities from natural gas producers depending on the type of contract. Commodities received are in turn sold and recognized as revenue in accordance with the criteria outlined above. Under the percent-of-proceeds contract type, Regency is paid for its services by keeping a percentage of the NGLs produced and a percentage of the residue gas resulting from processing the natural gas. Under the percentage-of-index contract type, Regency earns revenue by purchasing wellhead natural gas at a percentage of the index price and selling processed natural gas at a price approximating the index price and NGLs to third parties. Regency generally reports revenue gross when it acts as the principal, takes title to the product, and incurs the risks and rewards of ownership. Revenue for fee-based arrangements is presented net because Regency takes the role of an agent for the producers. Allowance for doubtful accounts is determined based on historical write-off experience and specific identification.
Regulatory Assets and Liabilities.
Certain of our subsidiaries are subject to regulation by certain state and federal authorities and has accounting policies that conform to FASB Accounting Standards Codification (“ASC”) Topic 980,
Regulated Operations
, which is in accordance with the accounting requirements and ratemaking practices of the regulatory authorities. The application of these accounting policies allows us to defer expenses and revenues on the balance sheet as regulatory assets and liabilities when it is probable that those expenses and revenues will be allowed in the ratemaking process in a period different from the period in which they would have been reflected in the consolidated statement of operations by an unregulated company. These deferred assets and liabilities will be reported in results of operations in the period in which the same amounts are included in rates and recovered from or refunded to customers. Management’s assessment of the probability of recovery or pass through of regulatory
80
assets and liabilities will require judgment and interpretation of laws and regulatory commission orders. If, for any reason, we cease to meet the criteria for application of regulatory accounting treatment for all or part of our operations, the regulatory assets and liabilities related to those portions ceasing to meet such criteria would be eliminated from the consolidated balance sheets for the period in which the discontinuance of regulatory accounting treatment occurs.
Accounting for Derivative Instruments and Hedging Activities.
ETP and Regency utilize various exchange-traded and over-the-counter commodity financial instrument contracts to limit their exposure to margin fluctuations in natural gas, NGL and propane prices. These contracts consist primarily of commodity futures and swaps.
If ETP or Regency designate a derivative financial instrument as a cash flow hedge and it qualifies for hedge accounting, the change in the fair value is deferred in accumulated other comprehensive income (“AOCI”) until the underlying hedged transaction occurs. Any ineffective portion of a cash flow hedge’s change in fair value is recognized each period in earnings. Gains and losses deferred in AOCI related to cash flow hedges remain in AOCI until the underlying physical transaction occurs, unless it is probable that the forecasted transaction will not occur by the end of the originally specified time period or within an additional two-month period of time thereafter. For financial derivative instruments that do not qualify for hedge accounting, the change in fair value is recorded in cost of products sold in the consolidated statements of operations.
If ETP or Regency designate a hedging relationship as a fair value hedge, they record the changes in fair value of the hedged asset or liability in cost of products sold in the consolidated statement of operations. This amount is offset by the changes in fair value of the related hedging instrument. Any ineffective portion or amount excluded from the assessment of hedge ineffectiveness is also included in the cost of products sold in the consolidated statement of operations.
ETP and Regency utilize published settlement prices for exchange-traded contracts, quotes provided by brokers, and estimates of market prices based on daily contract activity to estimate the fair value of these contracts. Changes in the methods used to determine the fair value of these contracts could have a material effect on our results of operations. We do not anticipate future changes in the methods used to determine the fair value of these derivative contracts. See “Item 7A. Quantitative and Qualitative Disclosures about Market Risk,” for further discussion regarding our derivative activities.
Fair Value of Financial Instruments
.
We have marketable securities, commodity derivatives, interest rate derivatives, the Preferred Units and embedded derivatives in the Regency Preferred Units that are accounted for as assets and liabilities at fair value in our consolidated balance sheets. We determine the fair value of our assets and liabilities subject to fair value measurement by using the highest possible “level” of inputs. Level 1 inputs are observable quotes in an active market for identical assets and liabilities. We consider the valuation of marketable securities and commodity derivatives transacted through a clearing broker with a published price from the appropriate exchange as a Level 1 valuation. Level 2 inputs are inputs observable for similar assets and liabilities. We consider over-the-counter commodity derivatives entered into directly with third parties as a Level 2 valuation since the values of these derivatives are quoted on an exchange for similar transactions. Additionally, we consider our options transacted through our clearing broker as having Level 2 inputs due to the level of activity of these contracts on the exchange in which they trade. We consider the valuation of our interest rate derivatives as Level 2 as the primary input, the LIBOR curve, is based on quotes from an active exchange of Eurodollar futures for the same period as the future interest swap settlements. Level 3 utilizes significant unobservable inputs. Level 3 inputs are unobservable. Derivatives related to the Regency Preferred Units are valued using a binomial lattice model. The market inputs utilized in the model include credit spread, probabilities of the occurrence of certain events, common unit price, dividend yield, and expected volatility, and are considered Level 3. The fair value of the Preferred Units was based predominantly on an income approach model and is also considered Level 3. See further information on our fair value assets and liabilities in Note
2
of our consolidated financial statements.
Impairment of Long-Lived Assets and Goodwill.
Long-lived assets are required to be tested for recoverability whenever events or changes in circumstances indicate that the carrying amount of the asset may not be recoverable. Goodwill and intangibles with indefinite lives must be tested for impairment annually or more frequently if events or changes in circumstances indicate that the related asset might be impaired. An impairment loss should be recognized only if the carrying amount of the asset/goodwill is not recoverable and exceeds its fair value. We adopted ASU 2011-08 during the year ended December 31, 2011. This standard allows us to first assess qualitative factors to determine whether it is more likely than not that the fair value of a reporting unit is less than its carrying amount as a basis for determining whether further impairment testing is necessary.
In order to test for recoverability when performing a quantitative impairment test, we must make estimates of projected cash flows related to the asset, which include, but are not limited to, assumptions about the use or disposition of the asset, estimated remaining life of the asset, and future expenditures necessary to maintain the asset’s existing service potential. In order to determine fair value, we make certain estimates and assumptions, including, among other things, changes in general economic conditions in regions in which our markets are located, the availability and prices of natural gas and propane supply, our ability to negotiate favorable sales agreements, the risks that natural gas exploration and production activities will not occur or be successful, our dependence on certain significant customers and producers of natural gas, and competition from other midstream companies,
81
including major energy producers. While we believe we have made reasonable assumptions to calculate the fair value, if future results are not consistent with our estimates, we could be exposed to future impairment losses that could be material to our results of operations.
Property, Plant and Equipment.
Expenditures for maintenance and repairs that do not add capacity to or extend the useful life are expensed as incurred. Expenditures to refurbish assets that either extend the useful lives of the asset or prevent environmental contamination are capitalized and depreciated over the remaining useful life of the asset. Additionally, ETP capitalizes certain costs directly related to the construction of assets including internal labor costs, interest and engineering costs. Upon disposition or retirement of pipeline components or natural gas plant components, any gain or loss is recorded to accumulated depreciation. When entire pipeline systems, gas plants or other property and equipment are retired or sold, any gain or loss is included in the consolidated statement of operations. Depreciation of property, plant and equipment is provided using the straight-line method based on their estimated useful lives ranging from 3 to 83 years. Changes in the estimated useful lives of the assets could have a material effect on our results of operation. We do not anticipate future changes in the estimated useful lives of our property, plant and equipment.
Asset Retirement Obligation
.
ETP and Regency have determined that they are obligated by contractual or regulatory requirements to remove facilities or perform other remediation upon retirement of certain assets. Determination of the amounts to be recognized is based upon numerous estimates and assumptions, including expected settlement dates, future retirement costs, future inflation rates and the credit-adjusted risk-free interest rates. However, ETP’s and Regency’s management were not able to reasonably measure the fair value of the asset retirement obligations as of
December 31, 2011
or
2010
. ETP and Regency will record an asset retirement obligation in the periods in which their management can reasonably determine the settlement dates.
Legal Matters.
We are subject to litigation and regulatory proceedings as a result of our business operations and transactions. We utilize both internal and external counsel in evaluating our potential exposure to adverse outcomes from claims, orders, judgments or settlements. To the extent that actual outcomes differ from our estimates, or additional facts and circumstances cause us to revise our estimates, our earnings will be affected. We expense legal costs as incurred, and all recorded legal liabilities are revised as required as better information becomes available to us. The factors we consider when recording an accrual for contingencies include, among others: (i) the opinions and views of our legal counsel; (ii) our previous experience; and (iii) the decision of our management as to how we intend to respond to the complaints.
For more information on our litigation and contingencies, see Note
10
to our consolidated financial statements included in Item 8 of this report.
Forward-Looking Statements
This annual report contains various forward-looking statements and information that are based on our beliefs and those of our General Partner, as well as assumptions made by and information currently available to us. These forward-looking statements are identified as any statement that does not relate strictly to historical or current facts. When used in this annual report, words such as “anticipate,” “project,” “expect,” “plan,” “goal,” “forecast,” “estimate,” “intend,” “could,” “believe,” “may,” “will” and similar expressions and statements regarding our plans and objectives for future operations, are intended to identify forward-looking statements. Although we and our General Partner believe that the expectations on which such forward-looking statements are reasonable, neither we nor our General Partner can give assurances that such expectations will prove to be correct. Forward-looking statements are subject to a variety of risks, uncertainties and assumptions. If one or more of these risks or uncertainties materialize, or if underlying assumptions prove incorrect, our actual results may vary materially from those anticipated, estimated, projected or expected. Among the key risk factors that may have a direct bearing on our results of operations and financial condition are:
|
•
|
the volumes transported on our subsidiaries' pipelines and gathering systems;
|
|
•
|
the level of throughput in our subsidiaries' processing and treating facilities;
|
|
•
|
the fees our subsidiaries charge and the margins they realize for their gathering, treating, processing, storage and transportation services;
|
|
•
|
the prices and market demand for, and the relationship between, natural gas and NGLs;
|
|
•
|
energy prices generally;
|
|
•
|
the prices of natural gas and NGLs compared to the price of alternative and competing fuels;
|
|
•
|
the general level of petroleum product demand and the availability and price of NGL supplies;
|
|
•
|
the level of domestic oil, natural gas and NGL production;
|
|
•
|
the availability of imported oil, natural gas and NGLs;
|
82
|
•
|
actions taken by foreign oil and gas producing nations;
|
|
•
|
the political and economic stability of petroleum producing nations;
|
|
•
|
the effect of weather conditions on demand for oil, natural gas and NGLs;
|
|
•
|
availability of local, intrastate and interstate transportation systems;
|
|
•
|
the continued ability to find and contract for new sources of natural gas supply;
|
|
•
|
availability and marketing of competitive fuels;
|
|
•
|
the impact of energy conservation efforts;
|
|
•
|
energy efficiencies and technological trends;
|
|
•
|
governmental regulation and taxation;
|
|
•
|
changes to, and the application of, regulation of tariff rates and operational requirements related to our subsidiaries' interstate and intrastate pipelines;
|
|
•
|
hazards or operating risks incidental to the gathering, treating, processing and transporting of natural gas and NGLs;
|
|
•
|
competition from other midstream companies and interstate pipeline companies;
|
|
•
|
loss of key personnel;
|
|
•
|
loss of key natural gas producers or the providers of fractionation services;
|
|
•
|
reductions in the capacity or allocations of third-party pipelines that connect with our subsidiaries pipelines and facilities;
|
|
•
|
the effectiveness of risk-management policies and procedures and the ability of our subsidiaries liquids marketing counterparties to satisfy their financial commitments;
|
|
•
|
the nonpayment or nonperformance by our subsidiaries' customers;
|
|
•
|
regulatory, environmental, political and legal uncertainties that may affect the timing and cost of our subsidiaries' internal growth projects, such as our subsidiaries' construction of additional pipeline systems;
|
|
•
|
risks associated with the construction of new pipelines and treating and processing facilities or additions to our subsidiaries' existing pipelines and facilities, including difficulties in obtaining permits and rights-of-way or other regulatory approvals and the performance by third-party contractors;
|
|
•
|
the availability and cost of capital and our subsidiaries' ability to access certain capital sources;
|
|
•
|
a deterioration of the credit and capital markets;
|
|
•
|
risks associated with the assets and operations of entities in which our subsidiaries own less than a controlling interests, including risks related to management actions at such entities that our subsidiaries may not be able to control or exert influence;
|
|
•
|
the ability to successfully identify and consummate strategic acquisitions at purchase prices that are accretive to our financial results and to successfully integrate acquired businesses;
|
|
•
|
changes in laws and regulations to which we are subject, including tax, environmental, transportation and employment regulations or new interpretations by regulatory agencies concerning such laws and regulations; and
|
|
•
|
the costs and effects of legal and administrative proceedings.
|
You should not put undue reliance on any forward-looking statements. When considering forward-looking statements, please review the risks described under “Item 1A. Risk Factors” in this annual report. Any forward-looking statement made by us in this Annual Report on Form 10-K is based only on information currently available to us and speaks only as of the date on which it is made. We undertake no obligation to publicly update any forward-looking statement, whether written or oral, that may be made from time to time, whether as a result of new information, future developments or otherwise.
83
We are exposed to market risks related to the volatility of natural gas and NGL prices. To manage the impact of volatility from these prices, our subsidiaries utilize various exchange-traded and OTC commodity financial instrument contracts. These contracts consist primarily of futures, swaps and options and are recorded at fair value in our consolidated balance sheets.
The United States Congress adopted the Dodd-Frank Wall Street Reform and Consumer Protection Act (HR 4173) in 2010, which, among other provisions, establishes federal oversight and regulation of the over-the-counter derivatives market and entities that participate in that market. This legislation requires the Commodities Futures Trading Commission (the “CFTC”), the SEC and other regulators to promulgate rules and regulations implementing the new legislation within 360 days from the date of enactment. In December 2011, the CFTC extended temporary exemptive relief from certain swap regulation provisions of the legislation until July 16, 2012. The CFTC has issued final regulations to set position limits for certain futures and option contracts in the major energy markets and for swaps that are their economic equivalents. It is not possible at this time to predict when the CFTC will make these regulations effective. The legislation may also require us to comply with margin requirements and with certain clearing and trade-execution requirements in connection with our derivative activities, although the application of those provisions to us is uncertain at this time. The financial reform legislation may also require the counterparties to our derivative instruments to spin off some of their derivatives activities to a separate entity, which may not be as creditworthy as the current counterparty. The new legislation and any new regulations could significantly increase the cost of derivative contracts (including through requirements to post collateral, which could adversely affect our available liquidity), materially alter the terms of derivative contracts, reduce the availability of derivatives to protect against risks we encounter, reduce our ability to monetize or restructure our existing derivative contracts, and increase our exposure to less creditworthy counterparties. If we reduce our use of derivatives as a result of legislation and regulations, our results of operations may become more volatile and our cash flows may be less predictable.
Commodity Price Risk
The tables below summarize by segment commodity-related financial derivative instruments, fair values and the effect of an assumed hypothetical 10% change in the underlying price of the commodity as of
December 31, 2011
and
2010
.
The fair values of the commodity-related financial positions have been determined using independent third party prices, readily available market information and appropriate valuation techniques. Non-trading positions offset physical exposures to the cash market; none of these offsetting physical exposures are included in the above tables. Price-risk sensitivities were calculated by assuming a theoretical 10% change (increase or decrease) in price regardless of term or historical relationships between the contractual price of the instruments and the underlying commodity price. Results are presented in absolute terms and represent a potential gain or loss in net income or in other comprehensive income. In the event of an actual 10% change in prompt month natural gas prices, the fair value of ETP’s and Regency’s total derivative portfolios may not change by 10% due to factors such as when the financial instrument settles and the location to which the financial instrument is tied (i.e., basis swaps) and the relationship between prompt month and forward months.
Investment in ETP
ETP injects and holds natural gas in its Bammel storage facility to take advantage of contango markets (i.e., when the price of natural gas is higher in the future than the current spot price) and uses financial derivatives to hedge the natural gas held in connection with these arbitrage opportunities. At the inception of the hedge, ETP will lock in a margin by purchasing gas in the spot market or off peak season and entering into a financial contract to lock in the sale price. If ETP designates the related financial contract as a fair value hedge for accounting purposes, ETP will value the hedged natural gas inventory at current spot market prices along with the financial derivative it uses to hedge it. Changes in the spread between the forward natural gas prices designated as fair value hedges and the physical inventory spot price result in unrealized gains or losses until the underlying physical gas is withdrawn and the related designated derivatives are settled. Once the gas is withdrawn and the designated derivatives are settled, the previously unrealized gains or losses associated with these positions are realized. Unrealized margins represent the unrealized gains or losses from ETP’s derivative instruments using mark-to-market accounting, with changes in the fair value of its derivatives being recorded directly in earnings. These margins fluctuate based upon changes in the spreads between the physical spot price and forward natural gas prices. If the spread narrows between the physical and financial prices, ETP will record unrealized gains or lower unrealized losses. If the spread widens, ETP will record unrealized losses or lower unrealized gains. Typically, as ETP enters the winter months, the spread converges so that it recognizes in earnings the original locked-in spread through either mark-to-market adjustments or the physical withdrawal of natural gas.
84
ETP is also exposed to market risk on natural gas it retains for fees in its intrastate transportation and storage operations and operational gas sales in its interstate transportation operations. ETP uses financial derivatives to hedge the sales price of this gas, including futures, swaps and options. Certain contracts that qualify for hedge accounting are designated as cash flow hedges of the forecasted sale of natural gas. The change in value, to the extent the contracts are effective, remains in AOCI until the forecasted transaction occurs. When the forecasted transaction occurs, any gain or loss associated with the derivative is recorded in cost of products sold in our consolidated statements of operations.
Derivatives are utilized in ETP’s midstream operations in order to mitigate price volatility and manage fixed price exposure incurred from contractual obligations. ETP attempts to maintain balanced positions in its marketing activities to protect against volatility in the energy commodities markets; however, net unbalanced positions can exist. Long-term physical contracts are tied to index prices. System gas, which is also tied to index prices, is expected to provide most of the gas required by its long-term physical contracts. When third-party gas is required to supply long-term contracts, a hedge is put in place to protect the margin on the contract. To the extent that financial contracts are not tied to physical delivery volumes, ETP may engage in offsetting financial contracts to balance its positions. To the extent open commodity positions exist, fluctuating commodity prices can impact its financial position and results of operations, either favorably or unfavorably.
ETP’s propane operations permitted customers to guarantee the propane delivery price for the next heating season. As ETP executed fixed sales price contracts with its customers, it entered into propane futures contracts to fix the purchase price related to these sales contracts, thereby locking in a gross profit margin. Additionally, ETP used propane futures contracts to secure the purchase price of its propane inventory for a percentage of its anticipated propane sales.
During the fourth quarter of 2011, ETP used derivatives for trading purposes. ETP has a risk management policy that allows its trading operations to assume certain market price risk. These activities are monitored independently by its risk management function and must take place within predefined limits and authorizations. As a result of ETP’s use of derivative financial instruments, the degree of earnings volatility that can occur may be significant, favorably or unfavorably, from period to period. ETP attempts to manage this volatility through the use of daily position and profit and loss reports provided to its risk management oversight committee, which includes members of senior management and predefined limits and authorizations set forth in its risk management policy.
85
Notional volumes are presented in MMBtu for natural gas and gallons for propane. Dollar amounts are presented in thousands.
|
|
December 31, 2011
|
December 31, 2010
|
|||||||||||||||||||
|
|
Notional
Volume
|
Fair Value
Asset
(Liability)
|
Effect of
Hypothetical
10%
Change
|
Notional
Volume
|
Fair Value
Asset
(Liability)
|
Effect of
Hypothetical
10%
Change
|
|||||||||||||||
|
Mark-to-Market Derivatives
|
|||||||||||||||||||||
|
Natural Gas:
|
|||||||||||||||||||||
|
Basis Swaps
IFERC/NYMEX - Trading
(1)
|
(151,260,000
|
)
|
$
|
(22,582
|
)
|
$
|
2,593
|
|
—
|
|
$
|
—
|
|
$
|
—
|
|
|||||
|
Basis Swaps
IFERC/NYMEX - Non-trading
|
(61,420,000
|
)
|
4,024
|
|
266
|
|
(38,897,500
|
)
|
(2,334
|
)
|
304
|
|
|||||||||
|
Swing Swaps IFERC
|
92,370,000
|
|
(1,072
|
)
|
138
|
|
(19,720,000
|
)
|
(2,086
|
)
|
2,228
|
|
|||||||||
|
Fixed Swaps/Futures
|
797,500
|
|
(4,301
|
)
|
145
|
|
(2,570,000
|
)
|
(11,488
|
)
|
1,176
|
|
|||||||||
|
Forward Physical Contracts (MMbtu)
|
(10,672,028
|
)
|
(13
|
)
|
1,118
|
|
—
|
|
—
|
|
—
|
|
|||||||||
|
Options — Calls
|
—
|
|
—
|
|
—
|
|
(3,000,000
|
)
|
62
|
|
7
|
|
|||||||||
|
Propane:
|
|||||||||||||||||||||
|
Forwards/Swaps
|
38,766,000
|
|
(4,122
|
)
|
5,290
|
|
1,974,000
|
|
275
|
|
258
|
|
|||||||||
|
Fair Value Hedging Derivatives
|
|||||||||||||||||||||
|
Natural Gas:
|
|||||||||||||||||||||
|
Basis Swaps
IFERC/NYMEX - Non-trading
|
(28,752,500
|
)
|
(808
|
)
|
181
|
|
(28,050,000
|
)
|
722
|
|
322
|
|
|||||||||
|
Fixed Swaps/Futures
|
(45,822,500
|
)
|
70,761
|
|
14,048
|
|
(39,105,000
|
)
|
8,599
|
|
16,837
|
|
|||||||||
|
Cash Flow Hedging Derivatives
|
|||||||||||||||||||||
|
Natural Gas:
|
|||||||||||||||||||||
|
Fixed Swaps/Futures
|
—
|
|
—
|
|
—
|
|
(210,000
|
)
|
232
|
|
93
|
|
|||||||||
|
Options — Puts
|
3,600,000
|
|
6,435
|
|
933
|
|
26,760,000
|
|
10,545
|
|
7,125
|
|
|||||||||
|
Options — Calls
|
(3,600,000
|
)
|
(12
|
)
|
13
|
|
(26,760,000
|
)
|
4,812
|
|
1,565
|
|
|||||||||
|
Propane:
|
|||||||||||||||||||||
|
Forwards/Swaps
|
—
|
|
—
|
|
—
|
|
32,466,000
|
|
6,589
|
|
4,196
|
|
|||||||||
(1)
Includes aggregate amounts for open positions related to Houston Ship Channel, Waha Hub, NGPL TexOk, West Louisiana Zone and Henry Hub locations.
86
Investment in Regency
Regency is a net seller of NGLs, condensate and natural gas as a result of its gathering and processing operations. The prices of these commodities are impacted by changes in the supply and demand, as well as market forces. Regency’s profitability and cash flow are affected by the inherent volatility of these commodities, which could adversely affect its ability to make distributions to its unitholders. Regency manages this commodity price exposure through an integrated strategy that includes management of its contract portfolio, matching sales prices of commodities with purchases, optimization of its portfolio by monitoring basis and other price differentials in operating areas, and the use of derivative contracts. In some cases, Regency may not be able to match pricing terms or to cover its risk to price exposure with financial hedges, and it may be exposed to commodity price risk. Speculative positions are prohibited under Regency’s policy.
Regency is exposed to market risks associated with commodity prices, counterparty credit, and interest rates. Regency’s management and the board of directors of Regency GP have established comprehensive risk management policies and procedures to monitor and manage these market risks. Regency GP is responsible for delegation of transaction authority levels, and the Risk Management Committee of Regency GP is responsible for the overall management of credit risk and commodity price risk, including monitoring exposure limits. Regency GP’s Risk Management Committee receives regular briefings on positions and exposures, credit exposures, and overall risk management in the context of market activities.
Notional volumes are presented in MMBtu for natural gas, gallons for propane and barrels for natural gas liquids and WTI crude oil. Dollar amounts are presented in thousands.
|
|
December 31, 2011
|
December 31, 2010
|
|||||||||||||||||||
|
|
Notional
Volume
|
Fair Value
Asset
(Liability)
|
Effect of
Hypothetical
10%
Change
|
Notional
Volume
|
Fair Value
Asset
(Liability)
|
Effect of
Hypothetical
10%
Change
|
|||||||||||||||
|
Cash Flow Hedging Derivatives
|
|||||||||||||||||||||
|
Natural Gas:
|
|||||||||||||||||||||
|
Fixed Swaps/Futures
|
2,198,000
|
|
$
|
3,907
|
|
$
|
717
|
|
3,830,000
|
|
$
|
2,053
|
|
$
|
1,684
|
|
|||||
|
Propane:
|
|||||||||||||||||||||
|
Forwards/Swaps
|
11,802,000
|
|
(2,488
|
)
|
1,588
|
|
18,648,000
|
|
(4,203
|
)
|
2,277
|
|
|||||||||
|
NGLs:
|
|||||||||||||||||||||
|
Forwards/Swaps
|
533,000
|
|
(5,979
|
)
|
2,956
|
|
1,212,110
|
|
(6,288
|
)
|
4,910
|
|
|||||||||
|
Options - Puts
|
110,000
|
|
309
|
|
113
|
|
—
|
|
—
|
|
—
|
|
|||||||||
|
WTI Crude:
|
|||||||||||||||||||||
|
Forwards/Swaps
|
350,000
|
|
(1,029
|
)
|
3,429
|
|
373,655
|
|
(3,581
|
)
|
3,501
|
|
|||||||||
87
Interest Rate Risk
As of
December 31, 2011
, ETP had
$314.4 million
of floating rate debt outstanding under its revolving credit facilities, Regency had
$332.0 million
of floating rate debt outstanding under its revolving credit facilities and ETE had
$71.5 million
of floating rate debt outstanding under its revolving credit facilities as of
December 31, 2011
. A hypothetical change of 100 basis points would result in a change to interest expense of
$7.2 million
annually. We manage a portion of our interest rate exposure by utilizing interest rate swaps. To the extent that we have debt with floating interest rates that are not hedged, our results of operations, cash flows and financial condition could be adversely affected by increases in interest rates.
The following interest rate swaps were outstanding as of
December 31, 2011
and
2010
(dollars in thousands), none of which are designated as hedges for accounting purposes:
|
|
|
|
Notional Amount
Outstanding |
|||||||||
|
Entity
|
Term
|
Type(1)
|
December 31, 2011
|
December 31, 2010
|
||||||||
|
ETP
|
May 2012
(2)
|
Forward starting to pay a fixed rate of 2.59% and receive a floating rate
|
$
|
350,000
|
|
$
|
—
|
|
||||
|
ETP
|
August 2012
(2)
|
Forward starting to pay a fixed rate of 3.51% and receive a floating rate
|
500,000
|
|
400,000
|
|
||||||
|
ETP
|
July 2013
(2)
|
Forward starting to pay a fixed rate of 4.02% and receive a floating rate
|
300,000
|
|
—
|
|
||||||
|
ETP
|
July 2018
|
Pay a floating rate plus a spread of 4.01% and receive a fixed rate of 6.70%
|
500,000
|
|
500,000
|
|
||||||
|
Regency
|
April 2012
|
Pay a fixed rate of 1.325% and receive a floating rate
|
250,000
|
|
250,000
|
|
||||||
|
(1)
|
Floating rates are based on LIBOR.
|
|
(2)
|
Represents the effective date. These forward starting swaps have a term of 10 years with a mandatory termination date the same as the effective date.
|
A hypothetical change of 100 basis points in interest rates for these interest rate swaps would result in a net change in the fair value of interest rate derivatives and earnings of approximately $83.3 million (recognized in gains and losses on non-hedged interest rate derivatives) as of December 31, 2011. For ETP’s $500 million of interest rate swaps whereby it pays a floating rate and receives a fixed rate, a hypothetical change of 100 basis points in interest rates would result in a net change in annual cash flow (swap settlements) of $5 million annually. For ETP’s forward-starting interest rate swaps, a hypothetical change of 100 basis points in interest rates would not affect cash flows until the swaps are settled.
Credit Risk
We maintain credit policies with regard to our counterparties that we believe minimize our overall credit risk. These policies include an evaluation of potential counterparties’ financial condition (including credit ratings), collateral requirements under certain circumstances and the use of standardized agreements, which allow for netting of positive and negative exposure associated with a single or multiple counterparties.
ETP’s counterparties consist primarily of petrochemical companies and other industrial, small to major oil and gas producers, midstream and power generation companies. This concentration of counterparties may impact its overall exposure to credit risk, either positively or negatively in that the counterparties may be similarly affected by changes in economic, regulatory or other conditions. Currently, management does not anticipate a material adverse effect on financial position or results of operations as a result of counterparty nonperformance.
Regency is exposed to credit risk from its derivative counterparties. Although Regency does not require collateral from these counterparties, Regency deals primarily with financial institutions when entering into financial derivatives, and utilizes master netting agreements that allow for netting of swap contract receivables and payables in the event of default by either party.
For financial instruments, failure of a counterparty to perform on a contract could result in our inability to realize amounts that have been recorded on our consolidated balance sheet and recognized in net income or other comprehensive income.
The financial statements starting on page F-1 of this report are incorporated by reference.
88
AND FINANCIAL DISCLOSURE
None.
Evaluation of Disclosure Controls and Procedures
An evaluation was performed under the supervision and with the participation of our management, including the President and Chief Financial Officer of our General Partner, of the effectiveness of the design and operation of our disclosure controls and procedures (as such terms are defined in Rule 13a–15(e) and 15d–15(e) of the Exchange Act) as of the end of the period covered by this report. Based upon that evaluation, management, including the President and Chief Financial Officer of our General Partner, concluded that our disclosure controls and procedures were adequate and effective as of
December 31, 2011
.
Management’s Report on Internal Control over Financial Reporting
The management of Energy Transfer Equity, L.P. and subsidiaries is responsible for establishing and maintaining adequate internal control over financial reporting, as such term is defined in Exchange Act Rule 13a-15(f). Under the supervision and with the participation of our management, including the President and Chief Financial Officer of our General Partner, we conducted an evaluation of the effectiveness of our internal control over financial reporting based on the framework in
Internal Control
–
Integrated Framework
issued by the Committee of Sponsoring Organizations of the Treadway Commission (“COSO framework”).
On May 2, 2011, ETP-Regency Midstream Holdings, LLC (“ETP-Regency LLC”), a joint venture owned 70% by ETP and 30% by Regency Energy Partners LP (“Regency”), acquired all of the membership interest in LDH Energy Asset Holdings LLC (“LDH”), from Louis Dreyfus Highbridge Energy LLC (“Louis Dreyfus”). Subsequent to closing, ETP-Regency LLC was renamed Lone Star NGL LLC and LDH was renamed Lone Star NGL Asset Holdings LLC (“Lone Star Holdings”). Management has acknowledged that it is responsible for establishing and maintaining a system of internal controls over financial reporting for Lone Star Holdings. We are in the process of integrating Lone Star Holdings, and we therefore excluded Lone Star Holdings from our December 31, 2011 assessment of the effectiveness of internal control over financial reporting. Lone Star Holdings had total assets of $2.21 billion and third party revenue of $361.5 million from May 2, 2011 to December 31, 2011 included in our consolidated financial statements as of and for the year ended December 31, 2011. The impact of the acquisition of LDH has not materially affected and is not expected to materially affect our internal control over financial reporting. As a result of these integration activities, certain controls will be evaluated and may be changed. We believe, however, that we will be able to maintain sufficient controls over the substantive results of our financial reporting throughout this integration process.
Based on our evaluation under the COSO framework, our management concluded that our internal control over financial reporting was effective as of
December 31, 2011
.
Grant Thornton LLP, an independent registered public accounting firm, has audited the effectiveness of our internal control over financial reporting as of
December 31, 2011
, as stated in their report, which is included herein.
89
REPORT OF INDEPENDENT REGISTERED PUBLIC ACCOUNTING FIRM
Partners
Energy Transfer Equity, L.P.
We have audited Energy Transfer Equity, L.P.'s (a Delaware limited partnership) internal control over financial reporting as of December 31, 2011, based on criteria established in
Internal Control-Integrated Framework
issued by the Committee of Sponsoring Organizations of the Treadway Commission (COSO). Energy Transfer Equity, L.P.'s management is responsible for maintaining effective internal control over financial reporting and for its assessment of the effectiveness of internal control over financial reporting, included in the accompanying Management's Report on Internal Control over Financial Reporting (Management's Report). Our responsibility is to express an opinion on Energy Transfer Equity, L.P.'s internal control over financial reporting based on our audit. Our audit of, and opinion on, Energy Transfer Equity, L.P.'s internal control over financial reporting does not include internal control over financial reporting of Lone Star NGL Asset Holdings LLC (formerly LDH Energy Asset Holdings LLC), a consolidated subsidiary, whose financial statements reflect total assets and revenues constituting 11 and 4 percent, respectively, of the related consolidated financial statement amounts as of and for the year ended December 31, 2011. As indicated in Management's Report, LDH Energy Asset Holdings LLC was acquired during 2011 and therefore, management's assertion on the effectiveness of Energy Transfer Equity, L.P.'s internal control over financial reporting excluded internal control over financial reporting of Lone Star NGL Asset Holdings LLC (formerly LDH Energy Asset Holdings LLC).
We conducted our audit in accordance with the standards of the Public Company Accounting Oversight Board (United States). Those standards require that we plan and perform the audit to obtain reasonable assurance about whether effective internal control over financial reporting was maintained in all material respects. Our audit included obtaining an understanding of internal control over financial reporting, assessing the risk that a material weakness exists, testing and evaluating the design and operating effectiveness of internal control based on the assessed risk, and performing such other procedures as we considered necessary in the circumstances. We believe that our audit provides a reasonable basis for our opinion.
A company's internal control over financial reporting is a process designed to provide reasonable assurance regarding the reliability of financial reporting and the preparation of financial statements for external purposes in accordance with generally accepted accounting principles. A company's internal control over financial reporting includes those policies and procedures that (1) pertain to the maintenance of records that, in reasonable detail, accurately and fairly reflect the transactions and dispositions of the assets of the company; (2) provide reasonable assurance that transactions are recorded as necessary to permit preparation of financial statements in accordance with generally accepted accounting principles, and that receipts and expenditures of the company are being made only in accordance with authorizations of management and directors of the company; and (3) provide reasonable assurance regarding prevention or timely detection of unauthorized acquisition, use, or disposition of the company's assets that could have a material effect on the financial statements.
Because of its inherent limitations, internal control over financial reporting may not prevent or detect misstatements. Also, projections of any evaluation of effectiveness to future periods are subject to the risk that controls may become inadequate because of changes in conditions, or that the degree of compliance with the policies or procedures may deteriorate.
In our opinion, Energy Transfer Equity, L.P. maintained, in all material respects, effective internal control over financial reporting as of December 31, 2011, based on criteria established in
Internal Control-Integrated Framework
issued by COSO.
We also have audited, in accordance with the standards of the Public Company Accounting Oversight Board (United States), the consolidated balance sheets of Energy Transfer Equity, L.P. and subsidiaries as of December 31, 2011 and 2010, and the related consolidated statements of operations, comprehensive income, equity, and cash flows for each of the three years in the period ended December 31, 2011 and our report dated February 22, 2012 expressed an unqualified opinion thereon.
/s/ GRANT THORNTON LLP
Dallas, Texas
February 22, 2012
90
Changes in Internal Controls over Financial Reporting
There has been no change in our internal controls over financial reporting (as defined in Rules 13a–15(f) or Rule 15d–15(f)) that occurred in the three months ended
December 31, 2011
that has materially affected, or is reasonably likely to materially affect, our internal controls over financial reporting.
None.
Board of Directors
Our General Partner, LE GP, LLC, manages and directs all of our activities. The officers and directors of ETE are officers and directors of LE GP, LLC. The members of our General Partner elect our General Partner’s Board of Directors. The board of directors of our General Partner has the authority to appoint our executive officers, subject to provisions in the limited liability company agreement of our General Partner. Pursuant to other authority, the board of directors of our General Partner may appoint additional management personnel to assist in the management of our operations and, in the event of the death, resignation or removal of our chief executive officer, to appoint a replacement.
As of December 31, 2011, our Board of Directors was comprised of seven persons, three of whom qualify as “independent” under the NYSE’s corporate governance standards. We have determined that Messrs. Albin, Harkey, and Turner are all “independent” under the NYSE’s corporate governance standards. Prior to the resignations of Mr. Bill W. Byrne and Mr. Paul E. Glaske effective June 30, 2011, both of whom qualified as “independent” under the NYSE's corporate governance standards, our Board of Directors consisted of nine persons.
As a limited partnership, we are not required by the rules of the NYSE to seek unitholder approval for the election of any of our directors. We believe that the members of our General Partner have appointed as directors individuals with experience, skills and qualifications relevant to the business of the Parent Company, such as experience in energy or related industries or with financial markets, expertise in natural gas operations or finance, and a history of service in senior leadership positions. We do not have a formal process for identifying director nominees, nor do we have a formal policy regarding consideration of diversity in identifying director nominees, but we believe that the members of our General Partner have endeavored to assemble a group of individuals with the qualities and attributes required to provide effective oversight of the Parent Company.
Risk Oversight.
Our Board of Directors generally administers its risk oversight function through the board as a whole. Our President, who reports to the Board of Directors, has day-to-day risk management responsibilities. Our President attends the meetings of our Board of Directors, where the Board of Directors routinely receives reports on our financial results, the status of our operations, and other aspects of implementation of our business strategy, with ample opportunity for specific inquiries of management. In addition, at each regular meeting of the Board, management provides a report of the Parent Company’s financial and operational performance, which often prompts questions or feedback from the Board of Directors. The Audit Committee provides additional risk oversight through its quarterly meetings, where it receives a report from the Parent Company’s internal auditor, who reports directly to the Audit Committee, and reviews the Parent Company’s contingencies with management and our independent auditors.
Corporate Governance
The Board of Directors has adopted both a Code of Business Conduct and Ethics applicable to our directors, officers and employees, and Corporate Governance Guidelines for directors and the Board. Current copies of our Code of Business Conduct and Ethics, Corporate Governance Guidelines and charters of the Audit and Compensation Committees of our Board of Directors are available on our website at www.energytransfer.com and will be provided in print form to any Unitholder requesting such information.
Please note that the preceding Internet address is for information purposes only and is not intended to be a hyperlink. Accordingly, no information found and/or provided at such Internet addresses or at our website in general is intended or deemed to be incorporated by reference herein.
91
Annual Certification
The Parent Company has filed the required certifications under Section 302 of the Sarbanes-Oxley Act of 2002 as Exhibits 31.1 to this annual report. In
2011
, our President and CFO provided to the NYSE the annual CEO certification regarding our compliance with the NYSE’s corporate governance listing standards.
Conflicts Committee
Our Partnership Agreement provides that the Board of Directors may, from time to time, appoint members of the Board to serve on the Conflicts Committee with the authority to review specific matters for which the Board of Directors believes there may be a conflict of interest in order to determine if the resolution of such conflict proposed by the General Partner is fair and reasonable to the Parent Company and our Unitholders. As a policy matter, the Conflicts Committee generally reviews any proposed related-party transaction that may be material to the Parent Company to determine if the transaction presents a conflict of interest and whether the transaction is fair and reasonable to the Parent Company. Any matters approved by the Conflicts Committee will be conclusively deemed to be fair and reasonable to the Parent Company, approved by all partners of the Parent Company and not a breach by the General Partner or its Board of Directors of any duties they may owe the Parent Company or the Unitholders.
Audit Committee
The Board of Directors has established an Audit Committee in accordance with Section 3(a)(58)(A) of the Exchange Act. The Board of Directors appoints persons who are independent under the NYSE’s standards for audit committee members to serve on its Audit Committee. In addition, the Board determines that at least one member of the Audit Committee has such accounting or related financial management expertise sufficient to qualify such person as the audit committee financial expert in accordance with Item 407(d)(5) of Regulation S-K. The Board has determined that based on relevant experience, Audit Committee member John D. Harkey, Jr. qualified as an audit committee financial expert during 2011. A description of the qualifications of Mr. Harkey may be found elsewhere in this Item 10 under “Directors and Executive Officers of the General Partner.”
The Audit Committee meets on a regularly scheduled basis with our independent accountants at least four times each year and is available to meet at their request. The Audit Committee has the authority and responsibility to review our external financial reporting, review our procedures for internal auditing and the adequacy of our internal accounting controls, consider the qualifications and independence of our independent accountants, engage and direct our independent accountants, including the letter of engagement and statement of fees relating to the scope of the annual audit work and special audit work which may be recommended or required by the independent accountants, and to engage the services of any other advisors and accountants as the Audit Committee deems advisable. The Audit Committee reviews and discusses the audited financial statements with management, discusses with our independent auditors matters required to be discussed by auditing standards
,
and makes recommendations to the Board of Directors relating to our audited financial statements. The Audit Committee periodically recommends to the Board of Directors any changes or modifications to its charter that may be required. The Audit Committee has received written disclosures and the letter from Grant Thorton required by applicable requirements of the Audit Committee concerning independence and has discussed with Grant Thorton that firm's independence. The Audit Committee recommended to the Board that the audited financial statements of ETE be included in ETE's Annual Report on Form 10-K for the year ended
December 31, 2011
.
The Board of Directors adopts the charter for the Audit Committee. David R. Albin, K. Rick Turner and John D. Harkey, Jr. serve as elected members of the Audit Committee. Messrs. Albnin and Turner began service on the Audit Committee subsequent to the resignation of previous Audit Committee members, Paul E. Glaske and Bill W. Byrne, effective June 30, 2011. Mr. Harkey currently serves as the Chair of the Committee. Mr. Harkey currently serves as a member or chairman of the audit committee of three other publicly traded companies, including the general partner of Regency, in addition to his service as a member of the Audit Committee of our General Partner. As required by Rule 303A.07 of the NYSE Listed Company Manual, the Board of Directors of our General Partner has determined that such simultaneous service does not impair Mr. Harkey’s ability to effectively serve on our Audit Committee.
Compensation and Nominating/Corporate Governance Committees
Although we are not required under NYSE rules to appoint a Compensation Committee or a Nominating/Corporate Governance Committee because we are a limited partnership, the Board of Directors of LE GP, LLC has previously established a Compensation Committee to establish standards and make recommendations concerning the compensation of our officers and directors. In addition, the Compensation Committee determines and establishes the standards for any awards to our employees and officers under the equity compensation plans, including the performance standards or other restrictions pertaining to the vesting of any such awards. Pursuant to the Charter of the Compensation Committee, a director serving as a member of the Compensation Committee may not be an officer of or employed by our General Partner, the Parent Company, ETP or its subsidiaries, or Regency or its subsidiaries. Subsequent to the resignations of Paul E. Glaske and Bill W. Byrne from the board of directors of our General
92
Partner effective June 30, 2011, we do not currently have a compensation committee; therefore, the members of the board of directors of our General Partner who would be eligible to be members of the Compensation Committee currently serve in that capacity.
Matters relating to the nomination of directors or corporate governance matters are addressed to and determined by the full Board of Directors.
In the discussion and analysis that follows, we have used the term, “ETE Compensation Committee,” to refer to either or both of (i) our compensation committee, which existed through June 30, 2011 and (ii) the eligible members of the board of directors of our General Partner, functioning in the capacity of our compensation committee subsequent to June 30, 2011.
The responsibilities of the ETE Compensation Committee include, among other duties, the following:
|
•
|
annually review and approve goals and objectives relevant to compensation of our President and CFO, if applicable;
|
|
•
|
annually evaluate the President and CFO’s performance in light of these goals and objectives, and make recommendations to the board of directors of our General Partner with respect to the President and CFO’s compensation levels, if applicable, based on this evaluation;
|
|
•
|
make determinations with respect to the grant of equity-based awards to executive officers under ETE’s equity incentive plans;
|
|
•
|
periodically evaluate the terms and administration of ETE’s long-term incentive plans to assure that they are structured and administered in a manner consistent with ETE’s goals and objectives;
|
|
•
|
periodically evaluate incentive compensation and equity-related plans and consider amendments if appropriate;
|
|
•
|
periodically evaluate the compensation of the directors;
|
|
•
|
retain and terminate any compensation consultant to be used to assist in the evaluation of director, President and CFO or executive officer compensation; and
|
|
•
|
perform other duties as deemed appropriate by the board of directors of our General Partner.
|
The responsibilities of the ETP Compensation Committee include, among other duties, the following:
|
•
|
annually review and approve goals and objectives relevant to compensation of the Chief Executive Officer, or the CEO, if applicable; annually evaluate the CEO’s performance in light of these goals and objectives, and make recommendations to the board of directors of ETP’s general partner with respect to the CEO’s compensation levels based on this evaluation, if applicable;
|
|
•
|
based on input from, and discussion with, the CEO, make recommendations to the board of directors of ETP’s general partner with respect to non-CEO executive officer compensation, including incentive compensation and compensation under equity based plans;
|
|
•
|
make determinations with respect to the grant of equity-based awards to executive officers under ETP’s equity incentive plans;
|
|
•
|
periodically evaluate the terms and administration of ETP’s short-term and long-term incentive plans to assure that they are structured and administered in a manner consistent with ETP’s goals and objectives;
|
|
•
|
periodically evaluate incentive compensation and equity-related plans and consider amendments if appropriate;
|
|
•
|
periodically evaluate the compensation of the directors;
|
|
•
|
retain and terminate any compensation consultant to be used to assist in the evaluation of director, CEO or executive officer compensation; and
|
|
•
|
perform other duties as deemed appropriate by the board of directors of ETP’s general partner.
|
Code of Business Conduct and Ethics
The Board of Directors has adopted a Code of Business Conduct and Ethics applicable to our officers, directors and employees. Specific provisions are applicable to the principal executive officer, principal financial officer, principal accounting officer and controller, or those persons performing similar functions, of our General Partner. Amendments to, or waivers from, the Code of Business Conduct and Ethics will be available on our website and reported as may be required under SEC rules. Any technical, administrative or other non-substantive amendments to the Code of Business Conduct and Ethics may not be posted.
93
Meetings of Non-management Directors and Communications with Directors
Our non-management directors meet in regularly scheduled sessions. Our non-management directors alternate as the presiding director of such meetings.
We have established a procedure by which Unitholders or interested parties may communicate directly with the Board of Directors, any committee of the Board, any of the independent directors, or any one director serving on the Board of Directors by sending written correspondence addressed to the desired person, committee or group to the attention of Sonia Aubé at Energy Transfer Equity, L.P., 3738 Oak Lawn Avenue, Dallas, Texas, 75219. Communications are distributed to the Board of Directors, or to any individual director or directors as appropriate, depending on the facts and circumstances outlined in the communication.
Directors and Executive Officers of the General Partner
The following table sets forth certain information with respect to the executive officers and members of the Board of Directors of our General Partner as of February 22, 2012. Executive officers and directors are elected for indefinite terms.
|
Name
|
Age
|
Position with Our General Partner
|
||
|
John W. McReynolds
|
61
|
Director, President and Chief Financial Officer
|
||
|
Kelcy L. Warren
|
56
|
Director and Chairman of the Board
|
||
|
David R. Albin
|
52
|
Director
|
||
|
Ray C. Davis
|
70
|
Director
|
||
|
John D. Harkey, Jr.
|
51
|
Director
|
||
|
Marshall S. (Mackie) McCrea, III
|
52
|
Director
|
||
|
K. Rick Turner
|
53
|
Director
|
||
Messrs. Warren and McCrea also serve as directors of ETP’s General Partner. Messrs. McReynolds and Harkey also serve as directors of Regency’s General Partner.
In order to continue to serve on the special committee of the ETE Board of Directors, on and effective June 30, 2011, Messrs. Davis, Turner and Albin resigned from the ETP Board of Directors.
Set forth below is biographical information regarding the foregoing officers and directors of our General Partner:
John W. McReynolds
. Mr. McReynolds has served as our President since March 2005 and served as a Director and Chief Financial Officer since August 2005. He has previously served as a director of Energy Transfer Partners from August 2001 through May 2010. Mr. McReynolds has also served as a director of Regency since May 2010. Prior to becoming President of Energy Transfer Equity, Mr. McReynolds was a partner with an international law firm for over 20 years. As a lawyer, Mr. McReynolds specialized in energy-related finance, securities, partnerships, mergers and acquisitions, syndication and litigation matters, and served as an expert in special projects for Boards of Directors for public companies. The members of our General Partner selected Mr. McReynolds to serve as a director because of his legal background and his extensive experience in energy-related corporate finance. Mr. McReynolds has relationships with executives and senior management at several companies in the energy sector, as well as with investment bankers who cover the industry.
Kelcy L. Warren
. Mr. Warren was appointed Co-Chairman of the Board of Directors of our General Partner, LE GP, LLC, effective upon the closing of our IPO. On August 15, 2007, Mr. Warren became the sole Chairman of the Board of our General Partner and the Chief Executive Officer and Chairman of the Board of the General Partner of ETP. Prior to that, Mr. Warren had served as Co-Chief Executive Officer and Co-Chairman of the Board of the General Partner of ETP since the combination of the midstream and intrastate transportation storage operations of Energy Transfer Company (“ETC OLP”) and the retail propane operations of Heritage in January 2004. Mr. Warren also serves as Chief Executive Officer of the General Partner of ETC OLP. Prior to the combination of the operations of ETP and Heritage Propane, Mr. Warren served as President of the General Partner of ET Company I, Ltd. the entity that operated ETP’s midstream assets before it acquired Aquila, Inc.’s midstream assets, having served in that capacity since 1996. From 1996 to 2000, he also served as a Director of Crosstex Energy, Inc. From 1993 to 1996, he served as President, Chief Operating Officer and a Director of Cornerstone Natural Gas, Inc. Mr. Warren has more than 25 years of business experience in the energy industry. The members of our General Partner selected Mr. Warren to serve as a director and as Chairman because he is ETP’s Chief Executive Officer and has more than 25 years in the natural gas industry. Mr. Warren also has relationships with chief executives and other senior management at natural gas transportation companies throughout the United States, and brings a unique and valuable perspective to the Board of Directors.
94
David R. Albin.
Mr. Albin is a managing partner of the Natural Gas Partners private equity funds, and has served in that capacity or similar capacities since 1988. Prior to his participation as a founding member of Natural Gas Partners, L.P. in 1988, he was a partner in the $600 million Bass Investment Limited Partnership. Prior to joining Bass Investment Limited Partnership, he was a member of the oil and gas group in the investment banking division of Goldman, Sachs & Co. He currently serves as a director of NGP Capital Resources Company. Mr. Albin has served as a Director of our General Partner since October 2002 and as a member of the Audit Committee since October 2011. The members of our General Partner selected Mr. Albin to serve as a director in connection with the investment made by Natural Gas Partners in ETP in 2004. Mr. Albin brings significant industry knowledge, accumulated over the past 20 years by investing in the natural gas sector, to the Board of Directors.
Ray C. Davis
. Mr. Davis served as Co-Chairman of the Board of Directors of our General Partner, LE GP, LLC, effective upon the closing of our initial public offering until his retirement effective August 15, 2007. Mr. Davis also served as Co-Chief Executive Officer and Co-Chairman of the Board of Directors of the General Partner of ETP since the combination of the midstream and transportation operations of ETC OLP and the retail propane operations of Heritage in January 2004 until his retirement from these positions effective August 15, 2007. Mr. Davis also served as Co-Chief Executive Officer of the general partner of ETC OLP, and as Co-Chief Executive Officer of ETP and Co-Chairman of the Board of the general partner of ETE, positions he held since their formation in 2002. Mr. Davis now serves as a director of our General Partner. Prior to the combination of the operations of ETP and Heritage Propane, Mr. Davis served as Vice President of the General Partner of ET Company I, Ltd., the entity that operated ETC OLP’s midstream assets before it acquired Aquila, Inc.’s midstream assets, having served in that capacity since 1996. From 1996 to 2000, he served as a Director of Crosstex Energy, Inc. From 1993 to 1996, he served as Chairman of the Board of Directors and Chief Executive Officer of Cornerstone Natural Gas, Inc. Mr. Davis has more than 32 years of business experience in the energy industry. Mr. Davis became a venture partner of Natural Gas Partners, L.L.C. in September 2007. The members of our General Partner selected Mr. Davis to serve as a director based on his more than 32 years of business experience in the energy industry and his expertise in the Partnership’s asset portfolio.
John D. Harkey, Jr.
Mr. Harkey has served as Chief Executive Officer and Chairman of Consolidated Restaurant Companies, Inc., since 1998. Mr. Harkey currently serves on the Board of Directors of Leap Wireless International, Inc., Loral Space & Communications, Inc., Emisphere Technologies, Inc., and the Board of Directors for the Baylor Health Care System Foundation. He currently serves on the Audit Committees of Loral and Emisphere. He also serves on the President’s Development Council of Howard Payne University and on the Executive Board of Circle Ten Council of the Boy Scouts of America. In May 2010, Mr. Harkey was elected Chairman of the Board of Directors of Regency’s General Partner and member of the Audit Committee. In May 2006, Mr. Harkey was elected as a director of our General Partner and member of the Audit Committee. He currently serves as the Chairman of the Audit Committee of our General Partner. The members of our General Partner selected Mr. Harkey to serve as a director because of his background in corporate finance, as well as his experience as a director on the boards and audit committees of several other public companies.
Marshall S. (Mackie) McCrea, III
. Mr. McCrea was appointed as a director on December 23, 2009. He is the President and Chief Operating Officer of ETP GP and has served in that capacity since June 2008. Prior to that, he served as President – Midstream from March 2007 to June 2008. Previously he served as the Senior Vice President – Commercial Development since the combination of the operations of ETC OLP and HOLP in January 2004. In March 2005, Mr. McCrea was named president of ETC OLP. Prior to the combination of the operations of ETC OLP and HOLP, Mr. McCrea served as the Senior Vice President – Business Development and Producer Services of the general partner of ETC OLP and ET Company I, Ltd., having served in that capacity since 1997. Mr. McCrea also currently serves on the Board of Directors of the general partner of ETP. The members of our General Partner selected Mr. McCrea to serve as a director because he brings extensive project development and operations experience to the Board. He has held various positions in the natural gas business over the past 25 years and is able to assist the Board of Directors in creating and executing the Partnership’s strategic plan.
K. Rick Turner.
Mr. Turner has recently retired from the Stephens’ family entities that he worked for since 1983. He first became a private equity principal in 1990 after serving as the Assistant to the Chairman, Jackson T. Stephens. His areas of focus have been oil and gas exploration, natural gas gathering, processing industries, and power technology. Prior to joining Stephens, he was employed by Peat, Marwick, Mitchell and Company. Mr. Turner currently serves as a director of North American Energy Partners Inc., PMI, LLC. Mr. Turner has served as a director of our General Partner since October 2002. Mr. Turner earned his B.S.B.A. from the University of Arkansas and is a non-practicing Certified Public Accountant. The members of our General Partners selected Mr. Turner based on his industry knowledge, his background in corporate finance and accounting, and his experience as a director on the boards of several other companies.
95
Compensation of the General Partner
Our General Partner does not receive any management fee or other compensation in connection with its management of the Parent Company.
Section 16(a) Beneficial Ownership Reporting Compliance
Section 16(a) of the Exchange Act requires our officers and directors, and persons who own more than 10% of a registered class of our equity securities, to file reports of beneficial ownership and changes in beneficial ownership with the SEC. Officers, directors and greater than 10% Unitholders are required by SEC regulations to furnish the General Partner with copies of all Section 16(a) forms.
Based solely on our review of the copies of such forms received by us, or written representations from certain reporting persons that no Forms 5 were required for those persons, we believe that for our year ended
December 31, 2011
, all filing requirements applicable to its officers, directors, and greater than 10% beneficial owners were met in a timely manner, with the exception of a late filing of a Form 5 for one transaction by Mr. Davis.
Overview
Since we are a limited partnership, we are managed by our General Partner. Our General Partner is owned by Mr. Kelcy Warren (81.2%) and Mr. Ray Davis (18.8%). Our limited partner interests are owned approximately 31% by affiliates and approximately 69% by the public.
We own 100% of Energy Transfer Partners GP, L.P. (“ETP GP”) and its general partner, Energy Transfer Partners, L.L.C. (“ETP LLC”). We refer to ETP GP and ETP LLC together as the “ETP GP Entities.” ETP GP is the general partner of Energy Transfer Partners, L.P. (“ETP”). All of ETP’s employees receive employee benefits from the operating companies of ETP.
We own 100% of Regency GP LP (“Regency GP”) and its general partner, Regency GP LLC (“Regency LLC”). We refer to Regency GP LP and Regency GP LLC together as the “Regency GP Entities.” Regency GP is the general partner of Regency Energy Partners LP (“Regency”). All of Regency’s employees receive employee benefits from the operating companies of Regency.
Compensation Discussion and Analysis
Named Executive Officers
We do not have officers or directors. Instead, we are managed by the board of directors of our General Partner, and the President of our General Partner performs all of our management functions. The compensation of our President is administered by our General Partner. This Compensation Discussion and Analysis is, therefore, focused on the total compensation of the President of our General Partner. In addition, to provide comprehensive disclosure of our executive compensation, we are also providing information as to the executive compensation of the ETP GP Entities, since the shared service agreement with ETP may place ETP’s executives in a position to perform policy making functions for ETE from time to time, even though none of these persons is an executive officer of the Parent Company. Accordingly, the persons we refer to in this discussion as our “named executive officers” are the following:
ETE Executive Officer
|
•
|
John W. McReynolds, President and Chief Financial Officer of our General Partner.
|
ETP GP Entities Executive Officers
|
•
|
Kelcy L. Warren, Chief Executive Officer;
|
|
•
|
Marshall S. (Mackie) McCrea, III, President and Chief Operating Officer;
|
|
•
|
Martin Salinas, Jr., Chief Financial Officer;
|
|
•
|
Thomas P. Mason, Vice President, General Counsel and Secretary; and
|
|
•
|
Robert P. (Paul) Grady, President of Propane Operations.
|
Mr. Grady was President of Propane Operations as of December 31, 2011. On January 12, 2012, ETP completed the contribution of its propane business to AmeriGas and, in connection with this transaction, Mr. Grady became an officer of AmeriGas and is therefore no longer an executive officer of ETP's general partner.
96
Our Philosophy for Compensation of Executives
Our General Partner.
In general, our General Partner’s philosophy for executive compensation is based on the premise that a significant portion of each executive’s compensation should be incentive-based and that executives' base salary levels should be competitive in the marketplace for executive talent and abilities. Our General Partner also believes the incentives should be competitive in the marketplace and balanced between short and long-term performance. Our General Partner believes this balance is achieved by the payment of annual discretionary cash bonuses and grants of restricted unit awards. Our General Partner believes the performance of our operating subsidiaries and the contribution of our management toward the achievement of the financial targets and other goals of those subsidiaries should be considered in determining annual discretionary cash bonuses.
ETP GP Entities.
The ETP GP Entities also believe that a significant portion of each executives’ compensation should be incentive-based and that executives' base salary levels should be competitive in the marketplace for executive talents and abilities. ETP GP also believes the incentives should be competitive in the marketplace and balanced between short and long-term performance. ETP GP believes this balance is achieved by (i) the payment of annual discretionary cash bonuses that consider the achievement of ETP's financial performance objectives for a fiscal year set at the beginning of such fiscal year and the individual contributions of its named executive officers to the success of ETP and (ii) the annual grant of restricted unit awards under ETP's equity incentive plans, which are intended to provide a longer term incentive to its key employees to focus their efforts on increasing the market price of its publicly traded units and to increase the cash distribution ETP pays to its Unitholders. Since 2008, ETP’s equity awards have been primarily in the form of restricted unit awards that vest over a specified time period, with substantially all of these types of unit awards vesting over a five-year period at 20% per year based on continued employment through each specified vesting date. The ETP GP Entities believe that these equity-based incentive arrangements are important in attracting and retaining executive officers and key employees as well as motivating these individuals to achieve ETP’s business objectives. The equity-based compensation reflects the importance ETP GP places on aligning the interests of its named executive officers with those of ETP’s Unitholders.
While ETE is responsible for the direct payment of the compensation of our named executive officer as an employee of ETE, ETE does not participate or have any input in any decisions as to the compensation levels or policies of our General Partner, the ETP GP Entities or the Regency GP Entities. As discussed below, our compensation committee or the eligible members of board of directors of our General Partner at times when we have not had a compensation committee, is responsible for the compensation policies and compensation level of the executive officer of our General Partner. In this discussion, we refer to either or both of our compensation committee or such members of our board of directors as the "ETE Compensation Committee."
ETP also does not participate or have any input in any decisions as to the compensation policies of the ETP GP Entities or the compensation levels of the executive officers of the ETP GP Entities. The compensation committee of the board of directors of the ETP GP Entities (the “ETP Compensation Committee”) is responsible for the approval of the compensation policies and the compensation levels of the executive officers of the ETP GP Entities.
ETE and ETP directly pay their respective executive officers in lieu of receiving an allocation of overhead related to executive compensation from their respective general partner. For the year ended
December 31, 2011
, ETE and ETP paid 100% of the compensation of the executive officers of their respective general partner as each entity represents the only business currently managed by such general partner.
For a more detailed description of the compensation to ETE's and ETP GP's named executive officers, please see “– Compensation Tables” below.
Distributions to Our General Partner
Our General Partner is partially-owned by certain of our current and prior named executive officers. We pay quarterly distributions to our General Partner in accordance with our partnership agreement with respect to its ownership of its general partner interest as specified in our partnership agreement. The amount of each quarterly distribution that we must pay to our General Partner is based solely on the provisions of our partnership agreement, which agreement specifies the amount of cash we distribute to our General Partner based on the amount of cash that we distribute to our limited partners each quarter. Accordingly, the cash distributions we make to our General Partner bear no relationship to the level or components of compensation of our General Partner’s executive officer. Distributions to our General Partner are described in detail in Note
8
to our consolidated financial statements. Our named executive officer also owns directly and indirectly certain of our limited partner interests and, accordingly, receives quarterly distributions. Such per unit distributions equal the per unit distributions made to all our limited partners and bear no relationship to the level of compensation of the named executive officer.
For a more detailed description of the compensation of our named executive officers, please see “Compensation Tables” below.
97
Compensation Philosophy
Each of ETE’s and ETP’s compensation programs are structured to provide the following benefits:
|
•
|
attract, retain and reward talented executive officers and key management employees by providing total compensation competitive with that of other executive officers and key management employees employed by publicly traded limited partnerships of similar size and in similar lines of business;
|
|
•
|
motivate executive officers and key employees to achieve strong financial and operational performance;
|
|
•
|
emphasize performance-based compensation; and
|
|
•
|
reward individual performance.
|
Components of Executive Compensation
For the year ended
December 31, 2011
, the compensation paid to ETE’s named executive officer consisted of the following components:
|
•
|
annual base salary;
|
|
•
|
non-equity incentive plan compensation consisting solely of discretionary cash bonuses; and
|
|
•
|
equity incentive plan compensation.
|
Mr. Warren, ETP’s CEO, has voluntarily elected not to accept any salary, bonus or equity incentive compensation (other than a salary of $1.00 per year plus an amount sufficient to cover his allocated payroll deductions for health and welfare benefits). The compensation paid to the named executive officers of the ETP GP Entities, other than ETP’s CEO, consisted of the following components:
|
•
|
annual base salary;
|
|
•
|
non-equity incentive plan compensation consisting solely of cash bonuses;
|
|
•
|
vesting of previously issued equity-based awards issued pursuant to ETP’s equity incentive plans;
|
|
•
|
compensation resulting from the vesting of equity awards made by an affiliate; and
|
|
•
|
401(k) plan contributions.
|
Methodology
Presently, the compensation committees of ETE and ETP consider relevant data available to them to assess the competitive position with respect to base salary, annual short-term incentives and long-term incentive compensation for our executive officer. The boards of directors and compensation committees of ETE and ETP also consider individual performance, levels of responsibility, skills and experience.
Periodically, the ETP Compensation Committee engages a third-party consultant to provide master information for compensation levels at peer companies in order to assist the ETP Compensation Committee in its determination of compensation levels for ETP’s executive officers. Most recently, the ETP Compensation Committee engaged Mercer Consulting Services (“Mercer”) during the year ended December 31, 2010 to assist in the determination of ETP’s compensation levels for its senior management. The results of this study were utilized to determine long-term incentive awards and bonuses during 2011 and 2010. The consultant provided an analysis of compensation for senior executives of the following 15 companies in the energy industry, comprised primarily of midstream and exploration and production companies:
|
Ÿ
Enterprise Products Partners L.P.
|
|
Ÿ
Sunoco Logistics Partners L.P.
|
|
Ÿ
Plains All American Pipeline, L.P.
|
|
Ÿ
Atmos Energy Corporation
|
|
Ÿ
CenterPoint Energy, Inc.
|
|
Ÿ
El Paso Corporation
|
|
Ÿ
The Williams Companies, Inc.
|
|
Ÿ
Spectra Energy Partners, LP
|
|
Ÿ
Sempra Energy
|
|
Ÿ
Targa Resources Partners LP
|
|
Ÿ
Kinder Morgan Energy Partners, L.P.
|
|
Ÿ
NuStar Energy L.P.
|
|
Ÿ
ONEOK Partners, L.P.
|
|
Ÿ
Southern Union Company
|
|
Ÿ
Enbridge Energy Partners, L.P.
|
|
|
98
The compensation analysis provided by Mercer covered annual salary, annual cash bonus and long-term incentive arrangements for the senior executives of these companies. The ETP Compensation Committee utilized the information provided by Mercer to compare the levels of base salary, annual bonus and long-term equity incentives at these other companies with those of ETP’s named executive officers to ensure that compensation of ETP’s named executive officers is competitive with the compensation for executive officers of these other companies. The ETP Compensation Committee did not attempt to benchmark the base salary, annual bonus or long-term equity incentives to any percentage of, or numerical average of, the compensation levels at these other companies. Mercer did not provide any non-executive compensation services for ETP during 2011 or 2010.
The ETE Compensation Committee has not engaged a compensation consultant during the periods presented herein.
Base Salary.
For the year ended
December 31, 2011
, the base salary level, equity incentive compensation and the non-equity incentive compensation of Mr. McReynolds, the President and Chief Financial Officer of ETE’s General Partner, was determined by the board of directors of our General Partner based on recommendations from the ETE Compensation Committee after taking into account the compensation for senior executives at comparable companies with respect to annual salary, annual cash bonus and long-term incentive arrangements, and the total compensation for similarly situated senior executives at ETP. The ETE Compensation Committee did not increase Mr. McReynolds' base salary for 2011.
The base salaries of ETP’s named executive officers are determined by ETP’s board of directors based on recommendations from the ETP Compensation Committee, which take into account the recommendations of Mr. Warren. For 2011, the ETP Compensation Committee approved an increase of 5% to Mr. McCrea’s annual base salary. The ETP Compensation Committee determined that such an increase was warranted based on the factors described below under “– Annual Bonus.” The ETP Compensation Committee did not increase the salaries of Messrs. Salinas and Mason for 2011. The ETP Compensation Committee approved an increase of 6.7% in Mr. Grady's annual base salary upon his promotion to President of Propane Operations effective July 1, 2011. In 2010, the Compensation Committee approved increases in the annual base salaries of Messrs. McCrea, Salinas and Mason of 3% each, from their prior annual base salaries. The Compensation Committee determined that such increases in annual base salary were warranted in light of their individual performance and levels of responsibility related to the management of the Partnership.
Annual Bonus
. In January 2012, the ETE Compensation Committee approved a cash bonus relating to the 2011 calendar year to Mr. McReynolds in the amount of $550,000. In approving this cash bonus, the ETE Compensation Committee took into account the significant role that Mr. McReynolds played in negotiating and coordinating the pending acquisition of Southern Union Company, along with the related financing transactions. The ETE Compensation Committee also took into account the individual performance of Mr. McReynolds with respect to promoting ETE's financial, strategic and operating objectives for 2011.
In February 2011, the ETE Compensation Committee approved a cash bonus relating to the 2010 calendar year to Mr. McReynolds in the amount of $550,000. In approving this cash bonus, the ETE Compensation Committee took into account the achievements of ETE with respect to acquiring the general partner of Regency in connection with the Regency Transactions and restructuring ETE’s credit facilities through the issuance of $1.8 billion of 10-year notes. The ETE Compensation Committee also took into account the individual performance of Mr. McReynolds with respect to promoting ETE’s financial, strategic and operating objectives for 2010.
The ETE Compensation Committee determined not to award any cash bonus to Mr. McReynolds for the year ended December 31, 2009 due to the failure of ETP to achieve 100% of its internal EBITDA budget for 2009, as well as the desire of management of ETE, including Mr. McReynolds, to improve the financial performance of ETE by avoiding the compensation expense otherwise associated with annual bonuses.
In addition to base salary, the ETP Compensation Committee makes a determination whether to award named executive officers of the ETP GP Entities, other than ETP’s CEO (who has voluntarily elected to forego any annual bonuses), discretionary annual cash bonuses following the end of the year. These discretionary bonuses, if awarded, are intended to reward the named executive officers of the ETP GP Entities for the achievement of financial performance objectives during the year for which the bonuses are awarded in light of the contribution of each individual to ETP’s profitability and success during such year. In this regard, the ETP Compensation Committee takes into account whether ETP achieved or exceeded its internal EBITDA budget for the year, which is approved by the board of directors of our General Partner as discussed below, as an important element in making its determinations with respect to annual bonuses. The ETP Compensation Committee also considers the recommendation of ETP’s CEO in determining the specific cash bonus amounts for each of the other named executive officers of the ETP GP Entities. The ETP Compensation Committee does not establish its own financial performance objectives in advance for purposes of determining whether to approve any annual bonuses, and the ETP Compensation Committee does not utilize any formulaic approach to determining annual bonuses.
ETP’s internal financial budgets are generally developed for each of its operations, and then aggregated with appropriate corporate level adjustments to reflect an overall performance objective that is reasonable in light of market conditions and opportunities based on a high level of effort and dedication across all operations of ETP’s business. The evaluation of ETP’s performance versus
99
its internal financial budget is based on the Partnership's EBITDA for a calendar year. In general, the ETP Compensation Committee believes that ETP’s performance at or above the internal EBITDA budget would support bonuses to named executive officers of the ETP GP Entities ranging from 100% to 120% of their annual salary. The individual bonus amounts for each named executive officer of the ETP GP Entities, other than ETP’s CEO, also reflect the ETP Compensation Committee’s view of the impact of such individual’s efforts and contributions towards achievement of ETP’s success in exceeding its internal financial budget and developing new projects as well as towards the overall management of ETP’s business.
In February 2012, the ETP Compensation Committee approved cash bonuses relating to the 2011 calendar year to Messrs. McCrea, Salinas, and Mason of $750,000, $400,000, and $750,000, respectively. In approving the cash bonuses for Messrs. McCrea, Salinas, and Mason, the ETP Compensation Committee took into account the achievement by the Partnership of approximately 95% of its internal EBITDA budget of $1.838 billion for 2011 as well as the individual performances of these individuals with respect to promoting the Partnership's financial, strategic and operating objectives for 2011. With respect to Mr. McCrea, the ETP Compensation Committee noted the extraordinary individual performance of Mr. McCrea with respect to the successful development of several significant internal growth projects, including (i) natural gas gathering, processing and transportation projects related to the Eagle Ford Shale play in South Texas with estimated capital expenditures in excess of $1.4 billion, (ii) a major gathering and processing project related to the Woodford Shale play with estimated capital expenditures of approximately $360 million, (iii) several NGL pipeline projects with estimated capital expenditures of approximately $350 million and (iv) additional NGL pipeline and fractionation projects through our Lone Star NGL joint venture with Regency with estimated capital expenditures of approximately $1.6 billion. With respect to Mr. Salinas, the ETP Compensation Committee took note of his key roles during 2011 in (i) managing the financial analysis related to the significant projects and transactions discussed above and below, (ii) coordinating the successful offering of ETP common units that collectively raised approximately $1.47 billion in net proceeds during 2011, (iii) orchestrating the successful arrangement of a $3.7 billion bridge credit facility as financing for the cash portion of the Southern Union merger, and (iv) effectively managing the financial reporting function for ETE and ETP. With respect to Mr. Mason, the ETP Compensation Committee took note of his key roles in (i) negotiating the formation of the Lone Star joint venture with Regency and the related negotiation of the acquisition by the Lone Star joint venture of the NGL transportation and storage business of Louis Dreyfus for approximately $1.98 billion, (ii) the negotiation of the acquisition by ETE of Southern Union in a transaction valued at approximately $9.4 billion at the time of its announcement, (iii) the negotiation of the contribution of ETP's retail propane business to AmeriGas in a transaction valued at approximately $2.9 billion at the time of its announcement and (iv) the effective managing of the legal functions for ETE and ETP. In November 2011, the ETP Compensation Committee approved a cash bonus for Mr. Grady of $275,000 with respect to the fiscal year of our propane operations. With respect to Mr. Grady, the ETP Compensation Committee took note of his effective management of the retail propane segment, which accounted for approximately
13%
of our total Adjusted EBITDA for 2011, despite challenges faced relating to unusual weather patterns and customer conservation measures.
ETE Equity Awards.
The Energy Transfer Equity Long-Term Incentive Plan authorizes the ETE Compensation Committee, in its discretion, to grant awards of restricted units, unit options and other awards related to ETE units at such times and upon such terms and conditions as it may determine in accordance with each such plan. The ETE Compensation Committee determined and/or approved the terms of the unit grants awarded to the named executive officer of ETE, including the number of ETE Common Units subject to the unit award and the vesting structure of those unit awards. All of the awards granted to the named executive officer under this equity incentive plan have consisted of restricted unit awards, which are subject to vesting over a specified time period. ETE Common Units are issued upon grant of the award, subject to forfeiture of unvested units upon termination of employment during the vesting period.
The ETE Compensation Committee has not yet determined what equity awards will be made to Mr. McReynolds for 2011. In February 2011, 25,000 restricted units were granted to Mr. McReynolds for 2010. These grants were approved by the ETE Compensation Committee and provided for vesting over a five-year period at 20% per year, subject to continued employment through each specified vesting date. In approving the grant, the ETE Compensation Committee took into account the long-term objective of retaining Mr. McReynolds as a key driver of ETE’s future success and his previous equity unit awards subject to vesting.
The issuance of ETE Common Units pursuant to ETE’s equity incentive plan is intended to serve as a means of incentive compensation; therefore, no consideration will be payable by the plan participants upon vesting and issuance of the ETE Common Units.
100
ETP Equity Awards.
Each of ETP’s 2004 Unit Plan and 2008 Incentive Plan authorizes the ETP Compensation Committee, in its discretion, to grant awards of restricted units, unit options and other awards related to ETP units at such times and upon such terms and conditions as it may determine in accordance with each such plan. The ETP Compensation Committee determined and/or approved the terms of the unit grants awarded to the named executive officers of the ETP GP Entities, including the number of Common Units subject to the unit award and the vesting structure of those unit awards. All of the awards granted to ETP’s named executive officers under these equity incentive plans have consisted of restricted unit awards, which have required the achievement of certain performance objectives in order for the awards to become vested or restricted unit awards that are subject to vesting over a specified time period. Upon vesting of any unit award, ETP Common Units are issued.
Commencing in 2008, all of the new ETP unit awards granted have provided for vesting over a specified time period, with vesting based on continued employment as of each applicable vesting date, rather than vesting based on the satisfaction of any performance objectives. This change resulted from the Compensation Committee’s determination that vesting based on continued employment, rather than the satisfaction of performance objectives, was more generally prevalent with companies in the energy industry. In December 2011, the ETP Compensation Committee approved grants of unit awards to Messrs. McCrea, Salinas and Mason of 50,000 units, 25,000 units and 40,000 units, respectively. In May 2011, the ETP Compensation Committee approved a grant to Mr. McCrea of 136,000 units. All of these unit awards provide for vesting over a five-year period at 20% per year, subject to continued employment through each specified vesting date. These unit awards entitle the recipients of the unit awards to receive, with respect to each ETP Common Unit subject to such award that has not either vested or been forfeited, a cash payment equal to each cash distribution per ETP Common Unit made by ETP on ETP Common Units promptly following each such distribution by ETP to its Unitholders.
In approving the grant of such unit awards, the ETP Compensation Committee took into account the same factors as discussed above under the caption “Annual Bonus,” the long-term objective of retaining such individuals as key drivers of ETP’s future success, the existing level of equity ownership of such individuals and the previous awards to such individuals of equity unit awards subject to vesting. In the case of the unit award to Mr. McCrea, the ETP Compensation Committee took into account the significant achievements of Mr. McCrea discussed under the caption “– Annual Bonus,” and the fees expected to be realized from those projects. The magnitude of the unit award to Mr. McCrea, along with the five-year vesting of this unit award, was also intended by the ETP Compensation Committee to provide a significant incentive to Mr. McCrea to remain with ETP and continue to develop successful commercial projects.
In April 2011, upon Mr. Grady’s appointment as President of Propane Operations, the ETP Compensation Committee approved a grant of unit awards to Mr. Grady of 5,000 units. These unit awards to Mr. Grady were forfeited in January 2012, in connection with the contribution of ETP’s propane operations to AmeriGas.
The issuance of ETP Common Units pursuant to ETP’s equity incentive plans is intended to serve as a means of incentive compensation; therefore, no consideration will be payable by the plan participants upon vesting and issuance of the ETP Common Units.
The unit awards under ETP’s equity incentive plans generally require the continued employment of the recipient during the vesting period. The ETP Compensation Committee has in the past and may in the future, but is not required to, accelerate the vesting of unvested unit awards in the event of the termination or retirement of an executive officer. The ETP Compensation Committee did not accelerate the vesting of unit awards in 2011.
Affiliate Equity Awards
. McReynolds Energy Partners, L.P., the general partner of which is owned and controlled by the President of our General Partner, has voluntarily elected to award to certain officers of ETP certain rights related to units of ETE previously issued by ETE to such partnership. These rights include the economic benefits of ownership of these ETE units based on a five-year vesting schedule whereby the officer will vest in the ETE units at a rate of 20% per year. As these ETE units are conveyed to the recipients of these awards upon vesting from a partnership that is not owned or managed by ETE or ETP, none of the costs related to such awards are paid by ETE or ETP unless this partnership defaults under its obligations under these unit awards once they are granted. We are recognizing non-cash compensation expense over the vesting period based on the grant date fair value of the ETE units awarded the ETP employees assuming no forfeitures.
Messrs. McCrea, Salinas and Mason vested in rights related to ETE units of 42,000, 48,000, and 55,000, respectively, during 2011. Messrs. McCrea and Salinas had unvested rights related to ETE units of 84,000 and 96,000, respectively, as of December 31, 2011. All ETE units previously awarded to Mr. Mason vested had as of December 31, 2011.
Qualified Retirement Plan Benefits
. We have established a defined contribution 401(k) plan, which covers substantially all employees of ETE and ETP, including named executive officers. Employees may elect to their up to 100% of defined eligible compensation after applicable taxes, as limited under the Internal Revenue Code. We make a matching contribution that is not less than the aggregate amount of matching contributions that would be credited to a participant’s account based on a rate of match equal to 100% of each participant’s elective deferrals up to 5% of covered compensation. The entire amount credited to the
101
participant’s account is fully vested and non-forfeitable at all times. We provide this benefit as a means to incentivize employees and provide them with an opportunity to save for their retirement. Prior to 2009, our 401(k) plan matching contributions were discretionary, based on a percentage of compensation, and participants vested in matching contributions upon completion of one year of service. Prior to 2009, our 401(k) plan also required the attainment of age 21 for all employees.
Health and Welfare Benefits
. All full-time employees, including our and ETP’s named executive officers, may participate in our health and welfare benefit programs including medical, dental, vision, flexible spending, life insurance and disability insurance.
Termination Benefits.
ETE’s and ETP’s named executive officers do not have any employment agreements that call for payments of termination or severance benefits or that provide for any payments in the event of a change in control of our General Partner. Each of ETE’s and ETP’s long-term incentive plans provides for immediate vesting of all unvested unit awards in the event of a change of control, as defined in the respective plan. Please refer to "– Compensation Tables – Potential Payments Upon a Termination or Change of Control" for additional information.
Deferred Compensation Plan
. ETE does not have a deferred compensation plan. Effective January 1, 2010, ETP adopted a deferred compensation plan (“DC Plan”). The DC Plan permits eligible highly compensated ETP employees to defer a portion of their salary and/or bonus until retirement or termination of employment or other designated distribution.
Under the DC Plan, each year eligible ETP employees are permitted to make an irrevocable election to defer up to 50% of their annual base salary, 50% of their quarterly non-vested unit distribution income, and/or 50% of their discretionary performance bonus compensation to be earned for services performed during the following year. Pursuant to the DC Plan, ETP may make annual discretionary matching contributions to participants’ accounts; however, ETP has not made any discretionary contributions to participants’ accounts and currently has no plans to make any discretionary contributions to participants’ accounts. All amounts credited under the DC Plan (other than discretionary credits) are immediately 100% vested. Participant accounts are credited with deemed earnings (or losses) based on hypothetical investment fund choices made by the participants among available funds.
Participants may also elect to have their accounts distributed in one lump sum payment or in annual installments over a period of 3 or 5 years upon retirement, and in a lump sum upon other termination. Upon a change in control (as defined in the DC Plan) of ETP, all DC Plan accounts are immediately vested in full. However, distributions are not accelerated and, instead, are made in accordance with the DC Plan’s normal distribution provisions unless a participant has elected to receive a change of control distributions pursuant to his deferral agreement.
Risk Assessment Related to our Compensation Structure
. We believe that the compensation plans and programs for named executive officers of ETE and ETP, as well as our other employees, are appropriately structured and are not reasonably likely to result in material risk to ETE or ETP. We believe these compensation plans and programs are structured in a manner that does not promote excessive risk-taking that could harm the value of ETE or ETP or reward poor judgment. We also believe ETE and ETP have allocated compensation among base salary and short and long-term compensation in such a way as to not encourage excessive risk-taking. In particular, ETE and ETP generally do not adjust base annual salaries for executive officers and other employees significantly from year to year, and therefore the annual base salary of our employees is not generally impacted by our overall financial performance or the financial performance of a portion of our operations. ETE and ETP generally determine whether, and to what extent, their respective named executive officers receive a cash bonus based on achievement of specified financial performance objectives as well as the individual contributions of our named executive officers to the Partnership's success. ETE and ETP use restricted units rather than unit options for equity awards because restricted units retain value even in a depressed market so that employees are less likely to take unreasonable risks to get, or keep, options “in-the-money.” Finally, the time-based vesting over five years for ETE’s and ETP’s long-term incentive awards ensures that the interests of employees align with those of the respective unitholders of ETE and ETP for the long-term performance of ETE and ETP.
Tax and Accounting Implications of Equity-Based Compensation Arrangements
Deductibility of Executive Compensation
We are a limited partnership and not a corporation for U.S. federal income tax purposes. Therefore, we believe that the compensation paid to the named executive officer is not subject to the deduction limitations under Section 162(m) of the Internal Revenue Code and therefore is generally fully deductible for federal income tax purposes.
Accounting for Unit-Based Compensation
For unit-based compensation arrangements, including equity-based awards issued to certain of ETP’s named executive officers by Mr. McReynolds (as discussed above), we record compensation expense over the vesting period of the awards, as discussed further in Note
9
to our consolidated financial statements.
102
Compensation Committee Interlocks and Insider Participation
Messrs. Glaske and Byrne served on the ETE Compensation Committee through June 30, 2011. During that time, neither of Messrs. Glaske or Byrne was an officer or employee of ETE or any of its subsidiaries or served as an officer of any company with respect to which any of ETE's executive officers served on such company's board of directors. In addition, neither Messrs. Gaske nor Byrne are former employees of ETE or any of its subsidiaries.
Subsequent to June 30, 2011, matters concerning Mr. McReynolds' compensation were deliberated by the members of the board of directors of our General Partner who would be eligible to serve on the ETE Compensation Committee, which consisted of Messrs. Albin, Davis, Harkey and Turner. During that time, none of Messrs. Albin, Davis, Harkey or Turner was an officer or employee of ETE or any of its subsidiaries or served as an officer of any company with respect to which any of ETE's executive officers served on such company's board of directors. Mr. Davis formerly served as Co-Chief Executive Officer and Co-Chairman of the board of directors of the General Partner of ETP until 2007.
Report of Compensation Committee
The board of directors of our General Partner has reviewed and discussed the section entitled “Compensation Discussion and Analysis” with the management of ETE. Based on this review and discussion, we have recommended that the Compensation Discussion and Analysis be included in this annual report on Form 10-K.
Board of Directors of LE GP, LLC,
general partner of Energy Transfer Equity, L.P.
(eligible members)
David R. Albin
Ray C. Davis
John D. Harkey, Jr.
K. Rick Turner
The foregoing report shall not be deemed to be incorporated by reference by any general statement or reference to this annual report on Form 10-K into any filing under the Securities Act of 1933, as amended, or the Securities Exchange Act of 1934, as amended, except to the extent that we specifically incorporate this information by reference, and shall not otherwise be deemed filed under those Acts.
103
Compensation Tables
Summary Compensation Table
|
Name and Principal Position
|
Year
|
Salary ($)
|
Bonus
($) (1)
|
Equity
Awards
($) (2)
|
Option
Awards
($)
|
Non-Equity
Incentive Plan
Compensation
($)
|
Change in
Pension
Value and
Nonqualified
Deferred
Compensation
Earnings
($)
|
All Other
Compensation
($) (3)
|
Total
($)
|
|||||||||||||||||||||||||
|
ETE Officer:
|
||||||||||||||||||||||||||||||||||
|
John W. McReynolds
|
2011
|
$
|
550,000
|
|
$
|
550,000
|
|
$
|
—
|
|
$
|
—
|
|
$
|
—
|
|
$
|
—
|
|
$
|
12,795
|
|
$
|
1,112,795
|
|
|||||||||
|
President and Chief Financial Officer
|
2010
|
550,000
|
|
550,000
|
|
995,500
|
|
—
|
|
—
|
|
—
|
|
8,462
|
|
2,103,962
|
|
|||||||||||||||||
|
2009
|
500,000
|
|
—
|
|
922,800
|
|
—
|
|
—
|
|
—
|
|
12,250
|
|
1,435,050
|
|
||||||||||||||||||
|
ETP Officers:
|
||||||||||||||||||||||||||||||||||
|
Kelcy L. Warren
(4)
|
2011
|
$
|
3,240
|
|
$
|
—
|
|
$
|
—
|
|
$
|
—
|
|
$
|
—
|
|
$
|
—
|
|
$
|
—
|
|
$
|
3,240
|
|
|||||||||
|
Chief Executive Officer
|
2010
|
2,766
|
|
—
|
|
—
|
|
—
|
|
—
|
|
—
|
|
—
|
|
2,766
|
|
|||||||||||||||||
|
2009
|
2,289
|
|
—
|
|
—
|
|
—
|
|
—
|
|
—
|
|
—
|
|
2,289
|
|
||||||||||||||||||
|
Martin Salinas, Jr.
|
2011
|
360,532
|
|
400,000
|
|
1,128,500
|
|
—
|
|
—
|
|
(6,462
|
)
|
25,020
|
|
1,907,590
|
|
|||||||||||||||||
|
Chief Financial Officer
|
2010
|
356,058
|
|
480,000
|
|
999,600
|
|
—
|
|
—
|
|
7,648
|
|
27,250
|
|
1,870,556
|
|
|||||||||||||||||
|
2009
|
350,000
|
|
—
|
|
847,062
|
|
—
|
|
—
|
|
—
|
|
31,293
|
|
1,228,355
|
|
||||||||||||||||||
|
Marshall S. (Mackie) McCrea, III
|
2011
|
615,049
|
|
750,000
|
|
9,542,520
|
|
—
|
|
—
|
|
—
|
|
12,972
|
|
10,920,541
|
|
|||||||||||||||||
|
President and Chief Operating Officer
|
2010
|
538,077
|
|
729,500
|
|
13,455,000
|
|
—
|
|
—
|
|
—
|
|
12,250
|
|
14,734,827
|
|
|||||||||||||||||
|
2009
|
500,000
|
|
—
|
|
883,000
|
|
—
|
|
—
|
|
—
|
|
12,250
|
|
1,395,250
|
|
||||||||||||||||||
|
Thomas P. Mason
|
2011
|
432,901
|
|
750,000
|
|
1,805,600
|
|
—
|
|
—
|
|
—
|
|
32,590
|
|
3,021,091
|
|
|||||||||||||||||
|
Vice President, General Counsel and Secretary
|
2010
|
427,513
|
|
482,530
|
|
999,600
|
|
—
|
|
—
|
|
—
|
|
34,990
|
|
1,944,633
|
|
|||||||||||||||||
|
2009
|
420,240
|
|
—
|
|
802,912
|
|
—
|
|
—
|
|
—
|
|
41,005
|
|
1,264,157
|
|
||||||||||||||||||
|
Robert P. (Paul) Grady
(5)
|
2011
|
387,500
|
|
275,000
|
|
266,900
|
|
—
|
|
—
|
|
745
|
|
13,540
|
|
943,685
|
|
|||||||||||||||||
|
President of Propane Operations
|
|
|
||||||||||||||||||||||||||||||||
|
|
|
|||||||||||||||||||||||||||||||||
|
(1)
|
The discretionary cash bonus amounts for named executive officers for 2011 reflect cash bonuses approved by the ETE and ETP Compensation Committees in February 2012 that are expected to be paid in March 2012.
|
|
(2)
|
Equity award amounts reflect the aggregate grant date fair value of unit awards granted for the periods presented, computed in accordance with FASB ASC Topic 718. See Note 9 to our consolidated financial statements for additional assumptions underlying the value of the equity awards. Equity awards for 2011 have not yet been made by the ETE Compensation Committee.
|
|
(3)
|
The amounts reflected for 2011 in this column include (i) contributions to the 401(k) plan made by ETP on behalf of the named executive officers of $9,567 for Mr. Salinas and $12,250 each for Messrs. McCrea, Mason and Grady, (ii) expenses paid by us for housing for Messrs. Salinas and Mason near our executive office in Dallas and (iii) the dollar value of life insurance premiums paid for the benefit of the named executive officers. Vesting in 401(k) contributions occurs immediately.
|
|
(4)
|
Mr. Warren voluntarily determined that his salary would be reduced to $1.00 per year (plus an amount sufficient to cover his allocated payroll deductions for health and welfare benefits). He does not accept a cash bonus or any equity awards under the equity incentive plans.
|
|
(5)
|
Mr. Grady was promoted to President of Propane Operations in July 2011. The 2011 amounts reflect his compensation for the entire year.
|
104
Grants of Plan-Based Awards Table
|
|
Grant
Date
|
Estimated Future Payouts Under
Equity Incentive Plan Awards
|
All Other
Unit Awards:
Number of Units
(#)
|
All Other Option Awards:
Number of Securities Underlying Options
(#)
|
Exercise or Base Price of Option Awards ($ / Sh)
|
Grant Date
Fair Value of
Unit Awards
(1)
|
|||||||||||||||||||
|
Name
|
Threshold
(#)
|
Target
(#)
|
Maximum
(#)
|
||||||||||||||||||||||
|
ETE Officer:
|
|||||||||||||||||||||||||
|
John W. McReynolds
|
—
|
—
|
|
—
|
|
—
|
|
—
|
|
—
|
|
$
|
—
|
|
$
|
—
|
|
||||||||
|
ETP Officers:
|
|||||||||||||||||||||||||
|
Kelcy L. Warren
|
N/A
|
—
|
|
—
|
|
—
|
|
—
|
|
—
|
|
$
|
—
|
|
$
|
—
|
|
||||||||
|
Martin Salinas, Jr.
|
12/20/2011
|
—
|
|
—
|
|
—
|
|
25,000
|
|
—
|
|
—
|
|
1,128,500
|
|
||||||||||
|
Marshall S. (Mackie) McCrea, III
|
5/2/2011
12/20/2011
|
—
|
|
—
|
|
—
|
|
136,000
50,000
|
|
—
|
|
—
|
|
7,285,520
2,257,000
|
|
||||||||||
|
Thomas P. Mason
|
12/20/2011
|
—
|
|
—
|
|
—
|
|
40,000
|
|
—
|
|
—
|
|
1,805,600
|
|
||||||||||
|
Robert P. (Paul) Grady
|
4/20/2011
|
—
|
|
—
|
|
—
|
|
5,000
|
|
—
|
|
—
|
|
266,900
|
|
||||||||||
|
(1)
|
We have computed the grant date fair value of unit awards in accordance with FASB ASC Topic 718, as further described above and in Note
9
to our consolidated financial statements.
|
We do not have any non-equity incentive plans.
Narrative Disclosure to Summary Compensation Table and Grants of the Plan-Based Awards Table
A description of material factors necessary to understand the information disclosed in the tables above with respect to salaries, bonuses, equity awards, nonqualified deferred compensation earnings, and 401(k) plan contributions can be found in the compensation discussion and analysis that precedes these tables.
105
Outstanding Equity Awards at Year-End Table
|
|
Grant Date
(1)
|
Unit Awards
|
|||||||
|
Name
|
Equity Incentive Plan
Awards: Number of
Units That Have Not
Vested
(#) (1)
|
Equity Incentive Plan
Awards: Market or
Payout Value of Units
That Have Not Vested
($) (2)
|
|||||||
|
ETE Officer:
|
|||||||||
|
John W. McReynolds
|
2/24/2011
|
25,000
|
|
$
|
1,014,500
|
|
|||
|
12/29/2009
|
18,000
|
|
730,440
|
|
|||||
|
12/19/2008
|
20,000
|
|
811,600
|
|
|||||
|
ETP Officers:
|
|||||||||
|
Kelcy L. Warren
|
N/A
|
—
|
|
$
|
—
|
|
|||
|
Martin Salinas, Jr.
|
12/20/2011
|
25,000
|
|
1,146,250
|
|
||||
|
12/15/2010
|
16,000
|
|
733,600
|
|
|||||
|
12/15/2009
|
11,512
|
|
527,825
|
|
|||||
|
12/22/2008
|
8,000
|
|
366,800
|
|
|||||
|
12/5/2007
|
1,200
|
|
55,020
|
|
|||||
|
Marshall S. (Mackie) McCrea, III
|
12/20/2011
|
50,000
|
|
2,292,500
|
|
||||
|
5/2/2011
|
108,800
|
|
4,988,480
|
|
|||||
|
1/14/2011
|
200,000
|
|
9,170,000
|
|
|||||
|
12/15/2009
|
12,000
|
|
550,200
|
|
|||||
|
12/22/2008
|
8,000
|
|
366,800
|
|
|||||
|
12/5/2007
|
4,400
|
|
201,740
|
|
|||||
|
Thomas P. Mason
|
12/20/2011
|
40,000
|
|
1,834,000
|
|
||||
|
12/15/2010
|
16,000
|
|
733,600
|
|
|||||
|
12/15/2009
|
10,912
|
|
500,315
|
|
|||||
|
12/22/2008
|
8,000
|
|
366,800
|
|
|||||
|
10/17/2008
|
20,000
|
|
917,000
|
|
|||||
|
12/5/2007
|
3,600
|
|
165,060
|
|
|||||
|
Robert P. (Paul) Grady
|
4/20/2011
|
4,000
|
|
183,400
|
|
||||
|
12/15/2010
|
4,320
|
|
198,072
|
|
|||||
|
12/15/2009
|
3,274
|
|
150,113
|
|
|||||
|
12/22/2008
|
2,400
|
|
110,040
|
|
|||||
|
2/28/2008
|
8,000
|
|
366,800
|
|
|||||
|
12/5/2007
|
1,200
|
|
55,020
|
|
|||||
|
(1)
|
With the exception of Mr. Mason's unit awards granted October 17, 2008, which vest ratably on each anniversary of the grant date through 2013, the unit awards outstanding as of
December 31, 2011
reflected in the table above ratably vest in December of each year through 2016 for awards granted in 2011, through 2015 for awards granted in 2010, through 2014 for awards granted in 2009, through 2013 for awards granted in 2008 and through 2012 for awards granted in 2007. All of Mr. Grady's outstanding unit awards were forfeited in January 2012, in connection with the contribution of ETP's propane operations to AmeriGas.
|
|
(2)
|
Market value was computed as the number of unvested awards as of
December 31, 2011
multiplied by the closing price of ETP’s Common Units for ETP officers and ETE’s Common Units for the ETE officer on
December 31, 2011
.
|
The amounts above do not include the equity awards granted to certain of ETP’s named executive officers in equity of ETE held by a partnership controlled by Mr. McReynolds. These awards are not issued pursuant to any of ETE's or ETP's equity incentive plans, and such awards are voluntarily made in the sole discretion of Mr. McReynolds.
106
Option Exercises and Units Vested Table
|
|
Unit Awards
|
||||||
|
Name
|
Number of Units
Acquired on Vesting
(#) (1)
|
Value Realized on
Vesting
($) (1)
|
|||||
|
ETE Officer:
|
|||||||
|
John W. McReynolds
|
16,000
|
|
$
|
648,000
|
|
||
|
ETP Officers:
|
|||||||
|
Kelcy L. Warren
|
—
|
|
$
|
—
|
|
||
|
Martin Salinas, Jr.
|
13,037
|
|
572,129
|
|
|||
|
Marshall S. (Mackie) McCrea, III
|
89,600
|
|
3,932,096
|
|
|||
|
Thomas P. Mason
|
25,237
|
|
1,079,956
|
|
|||
|
Robert P. (Paul) Grady
|
9,571
|
|
460,563
|
|
|||
|
(1)
|
Amounts presented represent the number of unit awards vested during
2011
and the value realized upon vesting of these awards, which is calculated as the number of units vested multiplied by the applicable closing market price per unit upon the vesting date.
|
We have not issued option awards.
Nonqualified Deferred Compensation Table
|
Name
|
Executive Contributions in Last FY
($)
|
Registrant
Contributions
in Last FY
($)
|
Aggregate
Earnings in
Last FY
($)
|
Aggregate
Withdrawals/
Distributions
($)
|
Aggregate Balance
At December 31, 2011
($)
|
|||||||||||||||
|
ETE Officer:
|
||||||||||||||||||||
|
John W. McReynolds
|
$
|
—
|
|
$
|
—
|
|
$
|
—
|
|
$
|
—
|
|
$
|
—
|
|
|||||
|
ETP Officers:
|
||||||||||||||||||||
|
Kelcy L. Warren
|
$
|
—
|
|
$
|
—
|
|
$
|
—
|
|
$
|
—
|
|
$
|
—
|
|
|||||
|
Martin Salinas, Jr.
|
67,151
|
|
—
|
|
(6,462
|
)
|
—
|
|
117,204
|
|
||||||||||
|
Marshall S. (Mackie) McCrea, III
|
—
|
|
—
|
|
—
|
|
—
|
|
—
|
|
||||||||||
|
Thomas P. Mason
|
—
|
|
—
|
|
—
|
|
—
|
|
—
|
|
||||||||||
|
Robert P. (Paul) Grady
|
116,250
|
|
—
|
|
745
|
|
—
|
|
430,304
|
|
||||||||||
The aggregate earnings reflected above for Mr. Salinas are included in his total compensation in the “Summary Compensation Table.” The aggregate balance reflected above for Mr. Salinas also includes earnings of $7,648 which were reported in his total compensation for 2010.
A description of the key provisions of the Partnership's deferred compensation plan can be found in the compensation discussion and analysis above.
Potential Payments Upon a Termination or Change of Control
Equity Awards.
As discussed in our Compensation Discussion and Analysis above, any unvested equity awards granted pursuant to ETP's 2004 Unit Plan will automatically become vested upon a change of control. Assuming that a change of control occurred on December 31, 2011, the fair value of the unvested awards granted pursuant to ETP's 2004 Unit Plan as of December 31, 2011 were $421,820 for Mr. Salinas, $568,540 for Mr. McCrea, $2,182,460 for Mr. Mason and $421,820 for Mr. Grady, respectively. In addition, Messrs. Salinas and McCrea hold unvested rights to receive ETE units granted by McReynolds Energy Partners, L.P. that would become immediately vested in connection with a change in control. Assuming that a change of control occurred on December 31, 2011, the fair value of these awards would have been $3,895,680 for Mr. Salinas and $3,408,720 for Mr. McCrea. Although any unvested equity awards granted under the 2008 Incentive Plan may also become vested upon a change of control at the discretion of the Compensation Committee, this discussion assumes a scenario in which the Compensation Committee does not exercise such discretion.
While any individual award agreement may contain a modified definition, a change of control is generally defined under the 2004 Unit Plan as the occurrence of any of the following events: (i) ETP GP ceases to be our general partner; (ii) ETE ceases to own, directly or indirectly through wholly-owned subsidiaries, in the aggregate at least 51% of the capital stock or equity interests of ETP GP; (iii) the sale of all or substantially all of ETP's assets (other than to any affiliate of ETE); or (iv) a liquidation or dissolution
107
of ETP. For purposes of the rights with respect to ETE units granted by McReynolds Energy Partners, L.P., a change in control means a “change in control” as defined in the 2004 Unit Plan, but a change in control will also be considered to have occurred if any single party, other than Kelcy Warren, acquires either: (a) more than 90% of the then-outstanding limited partner units of ETE; or (b) more than 51% of the ownership of LE GP, LLC. Under the 2008 Incentive Plan, a “change of control” is generally defined as the occurrence of one or more of the following events: (1) any person or group becomes the beneficial owner of 50 percent or more of our voting power or voting securities; (2) the complete liquidation of either ETP LLC, ETP GP, or us; (3) the sale of all or substantially all of ETP GP's or our assets to anyone other than us, ETP GP or one of our affiliates; or (4) a person other than ETP LLC, ETP GP or one of their affiliates becomes our general partner.
Deferred Compensation Plan
. As discussed in our Compensation Discussion and Analysis above, all amounts under the DC Plan (other than discretionary credits) are immediately 100% vested. Upon a change of control (as defined in the DC Plan), distributions from the DC Plan would be made in accordance with the DC Plan's normal distribution provisions. A change of control is generally defined in the DC Plan as any change of control event meaning of Treasury Regulation Section 1.409A-3(i)(5).
Director Compensation
Directors of LE GP, LLC who are employees of LE GP, LLC, ETP GP or any of their subsidiaries are not eligible for director compensation. The compensation arrangements for outside directors include a $30,000 annual retainer for services on the board and an annual retainer ($7,500 or $10,000 in the case of the chairman) and meeting attendance fees ($1,200) for services on the Audit Committee. In connection with the Citrus Transaction, the Board of LE GP, LLC appointed a conflicts committee consisting of Messrs. Albin, Davis and Turner (the "ETE Conflicts Committee"). The ETE Conflicts Committee met twice in 2011 to address potential conflicts of interest in the transaction. For their service, the ETE Conflicts Committee members received additional compensation of $1,200 per Conflicts Committee meeting.
The outside directors of LE GP, LLC are also entitled to an annual award under the Energy Transfer Equity, L.P. Long-Term Incentive Plan equal to $15,000 divided by (a) the closing price of the Common Units of ETE on the New York Stock Exchange on such grant-date or (b) the Fair Market Value of a common unit as otherwise determined by the Board of Directors. Each award is subject to a restricted period of three (3) years and vests 1/3 per year beginning on the first anniversary date of the award, provided that all unvested awards fully vest upon the occurrence of a change of control. The compensation expense recorded is based on the grant-date market value of the ETE Common Units and is recognized over the vesting period. Distributions are paid during the vesting period.
The ETP Compensation Committee periodically reviews and makes recommendations regarding the compensation of the directors of ETP’s General Partner. In 2010, non-employee directors of ETP’s General Partner received an annual fee of $40,000 plus $1,200 for each committee meeting attended. Additionally, the Chairman of ETP’s audit committee receives an annual fee of $15,000 and the members of ETP’s Audit Committee receive an annual fee of $10,000. The Chairman of the ETP Compensation Committee receives an annual fee of $7,500 and the members of the ETP Compensation Committee receive an annual fee of $5,000. In connection with the Citrus Transaction, the ETP Conflicts Committee met 11 times to address potential conflicts of interest in the transaction. For their service the, ETP Conflicts Committee members received additional compensation of $5,000 per Conflicts Committee meeting for the Chairman of the Conflicts Committee and $2,500 per Conflicts Committee meeting for the members of the Conflicts Committee. ETP’s employee directors, including Messrs. Warren and McCrea, do not receive any fees for service as directors. In addition, the non-employee directors participate in ETP’s 2004 Unit Plan and 2008 Incentive Plan. Each director of ETP’s General Partner who is not also (i) a shareholder or a direct or indirect employee of any parent, or (ii) a direct or indirect employee of ETP LLC, ETP, or a subsidiary, who is elected or appointed to the board of ETP’s General Partner for the first time shall automatically receive, on the date of his or her election or appointment, an award of 2,500 ETP Common Units. Under ETP’s 2004 Unit Plan and 2008 Incentive Plan, the non-employee directors of ETP’s General Partner each receive annual grants of unvested ETP Common Units equal to an aggregate of approximately $50,000 divided by the fair market value of ETP’s Common Units. These ETP Common Units vest over three years at one-third per year.
108
The following table reflects compensation paid during
2011
to the non-employee directors of our General Partner, as well as any compensation paid during the period to those individuals as directors of our subsidiaries, ETP and Regency.
Director Compensation Table
|
Name
|
Fees Paid in
Cash ($) (1)
|
Unit Awards
($) (2)
|
All Other
Compensation
($)
|
Total
($)
|
||||||||||||
|
David R. Albin
|
||||||||||||||||
|
As ETE Director
|
$
|
14,375
|
|
$
|
—
|
|
$
|
—
|
|
$
|
14,375
|
|
||||
|
As ETP Director
|
165,889
|
|
—
|
|
—
|
|
165,889
|
|
||||||||
|
Bill W. Byrne
(3)
|
||||||||||||||||
|
As ETE Director
|
45,900
|
|
14,988
|
|
—
|
|
60,888
|
|
||||||||
|
As ETP Director
|
94,500
|
|
45,659
|
|
—
|
|
140,159
|
|
||||||||
|
Ray C. Davis
|
||||||||||||||||
|
As ETE Director
|
12,500
|
|
—
|
|
—
|
|
12,500
|
|
||||||||
|
As ETP Director
|
38,575
|
|
22,283
|
|
—
|
|
60,858
|
|
||||||||
|
Paul E. Glaske
(3)
|
||||||||||||||||
|
As ETE Director
|
45,900
|
|
14,988
|
|
—
|
|
60,888
|
|
||||||||
|
As ETP Director
|
123,300
|
|
45,659
|
|
—
|
|
168,959
|
|
||||||||
|
John D. Harkey, Jr.
|
||||||||||||||||
|
As ETE Director
|
65,800
|
|
14,988
|
|
—
|
|
80,788
|
|
||||||||
|
As Regency Director
|
49,000
|
|
414,400
|
|
—
|
|
463,400
|
|
||||||||
|
K. Rick Turner
|
||||||||||||||||
|
As ETE Director
|
45,575
|
|
14,988
|
|
—
|
|
60,563
|
|
||||||||
|
As ETP Director
|
33,222
|
|
22,283
|
|
—
|
|
55,505
|
|
||||||||
|
(1)
|
Fees paid in cash for ETE Directors are based on amounts earned during the period. Fees paid to Mr. Albin during 2012 include amounts owed from prior years.
|
|
(2)
|
Unit award amounts reflect the aggregate grant date fair value of awards granted based on the market price as of the grant date. For ETP unit awards, the grant date market price is reduced by the expected distributions during the vesting period to determine the grant date fair value. As of
December 31, 2011
, Messrs. Harkey and Turner each had 978 unvested ETE restricted units outstanding. As of December 31, 2011, Mr. Harkey had 15,101 unvested Regency restricted units outstanding.
|
|
(3)
|
Messrs. Byrne and Glaske resigned from ETE's board of directors effective June 30, 2011. All outstanding awards to these individuals were vested upon resignation.
|
Equity Compensation Plan Information
At the time of our initial public offering, we adopted the Energy Transfer Equity, L.P. Long-Term Incentive Plan for the employees, directors and consultants of our General Partner and its affiliates who perform services for us. The long-term incentive plan provides for the following five types of awards: restricted units, phantom units, unit options, unit appreciation rights and distribution equivalent rights. The long-term incentive plan limits the number of units that may be delivered pursuant to awards to three million units. Units withheld to satisfy exercise prices or tax withholding obligations are available for delivery pursuant to other awards. The plan is administered by the compensation committee of the board of directors of our General Partner.
109
The following table sets forth in tabular format, a summary of our equity plan information as of
December 31, 2011
:
|
Plan Category
|
Number of securities to
be issued upon exercise
of outstanding options,
warrants and rights
(a)
|
Weighted-average
exercise price of
outstanding options,
warrants and rights
(b)
|
Number of securities
remaining available for
future issuance under
equity compensation plans
(excluding securities
reflected in column (a))
(c)
|
|||||||
|
Equity compensation plans approved by security holders
|
—
|
|
$
|
—
|
|
—
|
|
|||
|
Equity compensation plans not approved by security holders
|
—
|
|
—
|
|
2,853,676
|
|
||||
|
Total
|
—
|
|
$
|
—
|
|
2,853,676
|
|
|||
Energy Transfer Equity, L.P. Units
The following table sets forth certain information as of February 1, 2012, regarding the beneficial ownership of our securities by certain beneficial owners, each director and named executive officer of our General Partner and all directors and executive officers of our General Partner as a group. The General Partner knows of no other person not disclosed herein who beneficially owns more than 5% of our Common Units.
|
Title of Class
|
Name and Address of
Beneficial Owner
(1)
|
Beneficially
Owned
(2)
|
Percent of Class
|
|||||
|
Common Units
|
Kelcy L. Warren
(7)
|
44,752,580
|
|
20.1
|
%
|
|||
|
John W. McReynolds
(6)
|
6,635,644
|
|
3.0
|
%
|
||||
|
David R. Albin
(3)
|
501,226
|
|
*
|
|
||||
|
Ray C. Davis
(4)
|
16,802,475
|
|
7.5
|
%
|
||||
|
John D. Harkey, Jr.
(5)
|
42,951
|
|
*
|
|
||||
|
Marshall S. (Mackie) McCrea, III
|
1,022,937
|
|
*
|
|
||||
|
K. Rick Turner
|
83,400
|
|
*
|
|
||||
|
All Directors and Executive Officers as a group (7 persons)
|
69,841,213
|
|
31.2
|
%
|
||||
|
Kayne Anderson Capital Advisors, L.P.
|
20,138,793
|
|
9.0
|
%
|
||||
|
*
|
Less than 1%
|
|
(1)
|
The address for Messrs. Warren, McReynolds, Albin, Davis, Harkey, McCrea and Turner is 3738 Oak Lawn Avenue, Dallas, Texas 75219. The address for Kayne Anderson Capital Advisors, L.P. is 1800 Avenue of the Stars, 2nd Floor, Los Angeles, California 90067.
|
|
(2)
|
Beneficial ownership for the purposes of the foregoing table is defined by Rule 13d-3 under the Exchange Act. Under that rule, a person is generally considered to be the beneficial owner of a security if he has or shares the power to vote or direct the voting thereof or to dispose or direct the disposition thereof or has the right to acquire either of those powers within sixty days. Nature of beneficial ownership is direct with sole investment and disposition power unless otherwise noted.
|
|
(3)
|
Includes 487,717 units held by Spectra Holdings, L.P., an entity owned by Mr. Albin. Mr. Albin disclaims beneficial ownership of the units held by Spectra Holdings, L.P. other than to the extent of his pecuniary interest therein.
|
|
(4)
|
Includes 741,654 units held by Avatar Investments, L.P., 50 units held by Avatar Holdings, LLC, 3,223,005 units held by Mr. Davis as Trustee of a trust for the benefit of his spouse and 7,881,953 units held by ETC Holdings, L.P. (over which Mr. Davis exercises shared voting and dispositive power with Mr. Warren). ET GP LLC is the sole general partner of ETC Holdings, L.P. and therefore may be deemed to be beneficially own units held by ETC Holdings, L.P. Excludes an additional 17,964,706 units held by ETC Holdings L.P. in which Mr. Davis has no ownership interest (see note 7 below).
|
|
(5)
|
Includes 15,000 units held by the Katemcy Trust.
|
|
(6)
|
Includes 4,008,274 units held by McReynolds Energy Partners L.P. and 2,521,570 units held by McReynolds Equity
|
110
Partners L.P., the general partners of which are owned by Mr. McReynolds. Mr. McReynolds disclaims beneficial ownership of units owned by such limited partnerships other than to the extent of his interest in such entity.
|
(7)
|
Includes 19,175,550 units held by Kelcy Warren Partners, L.P. and 1,500,000 units held by Kelcy Warren Partners II, L.P., the general partners of which are owned by Mr. Warren. Also includes 17,964,706 units held by ETC Holdings L.P. (over which Mr. Warren exercises shared voting and dispositive power with Mr. Davis). ET GP LLC is the sole general partner of ETC Holdings, L.P. and therefore may be deemed to be beneficially own units held by ETC Holdings, L.P. Excludes an additional 7,881,953 units held by ETC Holdings L.P. in which Mr. Warren has no ownership interest (see note 4 above). Also includes 150,269 units held by LE GP, LLC. Mr. Warren may be deemed to own units held by LE GP, LLC due to his ownership of 81.2% of its member interests. The voting and disposition of these units is directly controlled by the board of directors of LE GP, LLC. Mr. Warren disclaims beneficial ownership of units owned by LE GP, LLC other than to the extent of his interest in such entity.
|
The Parent Company’s cash flows currently consist of distributions from Energy Transfer Parters, L.P. (“ETP”) and (“Regency”) related to the following partnership interests, including IDRs in ETP and Regency:
|
•
|
our ownership of the general partner interest in ETP, which we hold through our ownership interests in Energy Transfer Parters GP, L.P. (“ETP GP”);
|
|
•
|
50.2 million
ETP Common Units, representing approximately
22%
of the total outstanding ETP Common Units, which we hold directly;
|
|
•
|
100%
of the IDRs in ETP, which we likewise hold through our ownership interests in ETP GP and which entitle us to receive specified percentages of the cash distributed by ETP as ETP’s per unit distribution increases;
|
|
•
|
our ownership of the general partner interest in Regency, which we hold through our ownership interests in Regency GP LP(“Regency GP”);
|
|
•
|
26.3 million
Regency Common Units, representing approximately
17%
of the total outstanding Regency Common Units; and
|
|
•
|
100%
of the IDRs in Regency, which we likewise hold through our ownership interests in Regency GP and which entitle us to receive specified percentages of the cash distributed by Regency as Regency’s per unit distribution increases.
|
ETP and Regency are required by their respective partnership agreements to distribute all cash on hand at the end of each quarter, less appropriate reserves determined by the board of directors of their respective general partners.
Mr. McCrea, a current director of LE GP, LLC, our General Partner, is also a director of the ETP GP. In addition, Mr. Warren, the Chairman of our Board of Directors, is also an executive officer of the ETP GP.
As a policy matter, our Conflicts Committee generally reviews any proposed related party transaction that may be material to the Partnership to determine whether the transaction is fair and reasonable to the Partnership. The Partnership’s board of directors makes the determinations as to whether there exists a related party transaction in the normal course of reviewing transactions for approval as the Partnership’s board of directors is advised by its management of the parties involved in each material transaction as to which the board of directors’ approval is sought by the Partnership’s management. In addition, the Partnership’s board of directors makes inquiries to independently ascertain whether related parties may have an interest in the proposed transaction. While there are no written policies or procedures for the board of directors to follow in making these determinations, the Partnership’s board makes those determinations in light of its fiduciary duties to the Unitholders. The partnership agreement of ETE provides that any matter approved by the Conflicts Committee will be conclusively deemed to be fair and reasonable to ETE, approved by all the partners of ETE and not a breach by the General Partner or its Board of Directors of any duties they may owe ETE or the Unitholders.
On September 1, 2011, Regency exercised its option to acquire ETP's remaining 0.1% of interest in MEP for approximately $1.2 million in cash.
The Parent Company has agreements with subsidiaries to provide or receive various general and administrative services. For the years ended
December 31, 2011
and
2010
the Parent Company received
$16.6 million
and
$5.8 million
, respectively, from Regency related to these services. For the years ended
December 31, 2011
,
2010
and
2009
, the Parent Company paid
$17.1 million
,
$6.3 million
and
$0.5 million
, respectively, to ETP related to these services. The increase in payments to ETP was the result of increased service fees related to the provision of various general and administrative services for Regency. The management fees received from Regency for the year ended
December 31, 2011
reflect the reimbursement of various general and administrative services of
$6.6 million
for expenses incurred by ETP on behalf of Regency.
111
ETP has an operating lease agreement with Messrs. Davis and Warren, the former owners of Energy Transfer Group, L.L.C. (“ETG”), which ETP acquired in 2009. Prior to the consummation of the transaction, the committee made the determination that both the sale of ETG to ETP and the terms of the operating lease between ETP and Messrs. Davis and Warren were fair and reasonable to ETP. See discussion in Note
13
to our consolidated financial statements.
Enterprise GP Holdings, L.P. (“EPE”) became a related party in May 2007 when it acquired approximately 17.6% of our outstanding common units and a 40.6% interest in LE GP, LLC, our General Partner. Enterprise Products Partners L.P. (“Enterprise”) acquired these common units in connection with its merger with EPE in November 2010. Following the merger, Mr. Warren acquired from Enterprise the 40.6% interest in LE GP, LLC that had been owned by EPE prior to the merger.
Prior to EPE becoming a related party, the conflicts committees of ETE and ETP reviewed the transaction and made the determination that it was fair and reasonable to both ETE and ETP. In addition, the conflicts committees of ETP and ETE adopted a statement of policy relating to the relationship with EPE in order to address potential conflicts of interest following the acquisition. Under this policy, any material transaction between any Enterprise Entity (as defined in the policy) and any Energy Transfer Entity (as defined in the policy) requires the prior approval by the ETP Conflicts Committee if such transaction relates to ETP or the ETE Conflicts Committee if such transaction relates to ETE. The policy also provides that Energy Transfer Entities will take precautions to ensure that commercially sensitive information is not shared with personnel of Enterprise Entities.
In the ordinary course of business ETP’s natural gas operations purchase and sell natural gas and natural gas liquids from and to Enterprise Entities. An ETP operating unit has a monthly natural gas storage contract with TEPPCO Partners, L.P., an Enterprise Entity. ETP’s natural gas operations and the Enterprise Entities transport natural gas on each other’s pipelines and share operating expenses on jointly-owned pipelines. All commercial agreements with Enterprise were negotiated at arm’s-length and the terms of each agreement were, in the opinion of the relevant conflicts committee, fair and reasonable to the Partnership. ETP’s propane operations routinely purchase and sale propane from and to Enterprise Entities, including purchases under a long-term contract of Titan Energy Partners, L.P., a subsidiary of ETP, to purchase substantially all of its propane requirements through certain of the Enterprise Entities. This agreement was in effect prior to ETP’s acquisition of Titan in 2006. See discussion of our transactions with Enterprise and its subsidiaries in Note
13
to our consolidated financial statements.
The following sets forth fees billed by Grant Thornton LLP for the audit of our annual financial statements and other services rendered:
|
|
Years Ended December 31,
|
||||||
|
|
2011
|
2010
|
|||||
|
Audit fees
(1)
|
$
|
3,138,500
|
|
$
|
2,616,045
|
|
|
|
Audit related fees
(2)
|
372,000
|
|
—
|
|
|||
|
Tax fees
(3)
|
9,553
|
|
—
|
|
|||
|
All other fees
|
—
|
|
—
|
|
|||
|
Total
|
$
|
3,520,053
|
|
$
|
2,616,045
|
|
|
|
(1)
|
Includes fees for audits of annual financial statements of our companies, reviews of the related quarterly financial statements, and services that are normally provided by the independent accountants in connection with statutory and regulatory filings or engagements, including reviews of documents filed with the SEC and services related to the audit of our internal controls over financial reporting.
|
|
(2)
|
Includes fees in 2011 for attestation engagements of subsidiary entities in connection with the contribution of the Partnership's retail propane operations to AmeriGas Partners, L.P. in January 2012.
|
|
(3)
|
Includes fees in 2011 related to state and local tax consultation and training.
|
Pursuant to the charter of the Audit Committee, the Audit Committee is responsible for the oversight of our accounting, reporting and financial practices. The Audit Committee has the responsibility to select, appoint, engage, oversee, retain, evaluate and terminate our external auditors; pre-approve all audit and non-audit services to be provided, consistent with all applicable laws, to us by our external auditors; and establish the fees and other compensation to be paid to our external auditors. The Audit Committee also oversees and directs our internal auditing program and reviews our internal controls.
The Audit Committee has adopted a policy for the pre-approval of audit and permitted non-audit services provided by our principal independent accountants. The policy requires that all services provided by Grant Thornton LLP including audit services, audit-related services, tax services and other services, must be pre-approved by the Audit Committee.
112
The Audit Committee reviews the external auditors’ proposed scope and approach as well as the performance of the external auditors. It also has direct responsibility for and sole authority to resolve any disagreements between our management and our external auditors regarding financial reporting, regularly reviews with the external auditors any problems or difficulties the auditors encountered in the course of their audit work, and, at least annually, uses its reasonable efforts to obtain and review a report from the external auditors addressing the following (among other items):
|
•
|
the auditors’ internal quality-control procedures;
|
|
•
|
any material issues raised by the most recent internal quality-control review, or peer review, of the external auditors;
|
|
•
|
the independence of the external auditors;
|
|
•
|
the aggregate fees billed by our external auditors for each of the previous two years; and
|
|
•
|
the rotation of the lead partner.
|
The following documents are filed as a part of this Report
:
|
(1)
|
Financial Statements - see Index to Financial Statements appearing on page F-1.
|
|
(2)
|
Financial Statement Schedules - None.
|
|
(3)
|
Exhibits - see Index to Exhibits set forth on page E-1.
|
113
SIGNATURES
Pursuant to the requirements of Section 13 or 15(d) of the Securities Exchange Act of 1934, the registrant has duly caused this report to be signed on its behalf by the undersigned, thereunto duly authorized.
|
ENERGY TRANSFER EQUITY, L.P.
|
||||
|
By:
|
|
LE GP, LLC,
|
||
|
|
its general partner
|
|||
|
Date:
|
February 22, 2012
|
By:
|
|
/s/ John W. McReynolds
|
|
|
John W. McReynolds
|
|||
|
|
President and Chief Financial Officer (duly authorized to sign on behalf of the registrant)
|
|||
Pursuant to the requirements of the Securities Exchange Act of 1934, this report has been signed by the following persons in the capacities and on the dates indicated:
|
Signature
|
|
Title
|
|
Date
|
|
/s/ John W. McReynolds
|
|
President and Chief Financial Officer
|
|
February 22, 2012
|
|
John W. McReynolds
|
(Principal Executive, Financial and
Accounting Officer)
|
|||
|
/s/ Kelcy L. Warren
|
|
Director and Chairman of the Board
|
|
February 22, 2012
|
|
Kelcy L. Warren
|
||||
|
/s/ David R. Albin
|
|
Director
|
|
February 22, 2012
|
|
David R. Albin
|
||||
|
/s/ Ray C. Davis
|
|
Director
|
|
February 22, 2012
|
|
Ray C. Davis
|
||||
|
/s/ John D. Harkey
|
|
Director
|
|
February 22, 2012
|
|
John D. Harkey
|
||||
|
/s/ Marshall S. McCrea, III
|
|
Director
|
|
February 22, 2012
|
|
Marshall S. McCrea, III
|
||||
|
/s/ K. Rick Turner
|
|
Director
|
|
February 22, 2012
|
|
K. Rick Turner
|
||||
114
INDEX TO EXHIBITS
The exhibits listed on the following Exhibit Index are filed as part of this report. Exhibits required by Item 601 of Regulation S-K, but which are not listed below, are not applicable.
|
Exhibit
Number
|
Previously Filed *
|
|
||||
|
With File
Number
(Form) (Period Ended or Date)
|
As
Exhibit
|
|||||
|
2.1
|
1-32740
(8-K/A) (5/13/10)
|
2.1
|
General Partner Purchase Agreement, dated May 10, 2010, by and among Regency GP Acquirer, L.P., Energy Transfer Equity, L.P. and ETE GP Acquirer LLC.
|
|||
|
2.2
|
1-32740
(8-K/A) (5/13/10)
|
2.2
|
Redemption and Exchange Agreement, dated May 10, 2010, by and among Energy Transfer Partners, L.P. and Energy Transfer Equity, L.P.
|
|||
|
2.3
|
1-32740
(8-K/A) (5/13/10)
|
2.3
|
Contribution Agreement, dated May 10, 2010, by and among Energy Transfer Equity, L.P., Regency Energy Partners LP and Regency Midcontinent Express LLC.
|
|||
|
2.4
|
1-32740
(8-K) (6/20/11)
|
2.1
|
Agreement and Plan of Merger, by and among, Energy Transfer Equity, L.P., Sigma Acquisition Corporation, and Southern Union Company, dated as of June 15, 2011.
|
|||
|
2.5
|
1-32740
(8-K)(7/5/11) |
2.1
|
Agreement and Plan of Merger, by and among, Energy Transfer Equity, L.P., Sigma Acquisition Corporation, and Southern Union Company, dated as of June 15, 2011, as Amended and Restated as of July 4, 2011.
|
|||
|
2.5.1
|
1-32740
(8-K)(7/5/11) |
10.1
|
Support Agreement dated June 15, 2011 by and among Energy Transfer Equity, L.P., Sigma Acquisition Corporation, and certain stockholders of Southern Union Company.
|
|||
|
2.6
|
1-32740
(8-K)(7/20/11) |
2.2
|
Amended and Restated Agreement and Plan of Merger, by and among, Energy Transfer Partners, L.P., Citrus ETP Acquisition L.L.C., Energy Transfer Equity, L.P., Southern Union Company, and CrossCountry Energy, LLC, dated as of July 19, 2011.
|
|||
|
2.7
|
1-32740
(8-K)(9/15/11) |
2.1
|
Amendment No. 1, dated as of September 14, 2011, to Second Amended and Restated Agreement and Plan of Merger, dated as of July 19, 2011, by and among Energy Transfer Equity, L.P., Sigma Acquisition Corporation and Southern Union Company.
|
|||
|
2.8
|
1-32740
(8-K)(9/15/11) |
2.2
|
Amendment No. 1, dated as of September 14, 2011, to Amended and Restated Agreement and Plan of Merger, dated as of July 19, 2011, by and between Energy Transfer Partners, L.P. and Energy Transfer Equity, L.P.
|
|||
|
3.1
|
333-128097
(S-1) (9/2/05)
|
3.1
|
Certificate of Conversion of Energy Transfer Company, L.P.
|
|||
|
3.2
|
333-128097
(S-1) (9/2/05)
|
3.2
|
Certificate of Limited Partnership of Energy Transfer Equity, L.P.
|
|||
|
3.3
|
1-32740
(8-K) (2/14/06)
|
3.1
|
Third Amended Restated Agreement of Limited Partnership of Energy Transfer Equity, L.P.
|
|||
|
3.3.1
|
1-32740
(10-K) (8/31/06)
|
3.3.1
|
Amendment No. 1 to Third Amended and Restated Agreement of Limited Partnership of Energy Transfer Equity, L.P.
|
|||
|
3.3.2
|
1-32740
(8-K) (11/13/07)
|
3.3.2
|
Amendment No. 2 to Third Amended and Restated Agreement of Limited Partnership of Energy Transfer Equity, L.P.
|
|||
|
3.3.3
|
1-32740
(8-K) (6/2/10)
|
3.1
|
Amendment No. 3 to Third Amended and Restated Agreement of Limited Partnership of Energy Transfer Equity, L.P.
|
|||
|
3.4
|
333-128097
(S-1) (9/2/05)
|
3.4
|
Certificate of Conversion of LE GP, LLC.
|
|||
|
3.5
|
333-128097
(S-1) (9/2/05)
|
3.5
|
Certificate of Formation of LE GP, LLC.
|
|||
E-
1
|
Exhibit
Number
|
Previously Filed *
|
|
||||
|
With File
Number
(Form) (Period Ended or Date)
|
As
Exhibit
|
|||||
|
3.6
|
1-32740
(8-K) (5/8/07)
|
3.6.1
|
Amended and Restated Limited Liability Company Agreement of LE GP, LLC.
|
|||
|
3.6.1
|
1-32740
(8-K) (12/23/09)
|
3.1
|
Amendment No. 1 to Amended and Restated Limited Liability Company Agreement of LE GP, LLC.
|
|||
|
3.7
|
1-11727
(8-K) (7/28/09)
|
3.1
|
Second Amended and Restated Agreement of Limited Partnership of Energy Transfer Partners, L.P. (formerly named Heritage Propane Partners, L.P.)
|
|||
|
3.8
|
1-11727
(10-Q) (2/29/04)
|
3.3
|
Amended Certificate of Limited Partnership of Energy Transfer Partners, L.P.
|
|||
|
3.9
|
1-11727
(10-Q) (5/31/07)
|
3.5
|
Third Amended and Restated Agreement of Limited Partnership of Energy Transfer Partners GP, L.P.
|
|||
|
3.10
|
1-11727
(10-Q) (5/31/07)
|
3.6
|
Third Amended and Restated Limited Liability Company Agreement of Energy Transfer Partners, L.L.C.
|
|||
|
3.10.1
|
1-11727
(8-K) (8/10/10)
|
3.6
|
Fourth Amended and Restated Limited Liability Company Agreement of Energy Transfer Partners, L.L.C.
|
|||
|
3.11
|
333-128097
(S-1/A) (12/20/05)
|
3.13
|
Certificate of Formation of Energy Transfer Partners, L.L.C.
|
|||
|
3.11.1
|
333-128097
(S-1/A) (12/20/05)
|
3.13.1
|
Certificate of Amendment of Energy Transfer Partners, L.L.C.
|
|||
|
3.12
|
333-128097
(S-1/A) (12/20/05)
|
3.14
|
Restated Certificate of Limited Partnership of Energy Transfer Partners GP, L.P.
|
|||
|
3.13
|
1-32740
(8-K) (8/10/10)
|
3.2
|
Second Amendment to Amended and Restated Limited Liability Company Agreement of Regency GP, L.L.C.
|
|||
|
4.1
|
1-11727
(8-K) (1/19/05)
|
4.1
|
Indenture dated January 18, 2005 among Energy Transfer Partners, L.P., the subsidiary guarantors named therein and Wachovia Bank, National Association, as trustee.
|
|||
|
4.2
|
1-11727
(8-K) (1/19/05)
|
4.2
|
First Supplemental Indenture dated January 18, 2005, among Energy Transfer Partners, L.P., the subsidiary guarantors named therein and Wachovia Bank, National Association, as trustee.
|
|||
|
4.3
|
1-11727
(10-Q) (2/28/05)
|
10.45
|
Second Supplemental Indenture dated as of February 24, 2005 to Indenture dated as of January 18, 2005.
|
|||
|
4.4
|
1-11727
(10-Q) (2/28/05)
|
10.46
|
Notation of Guaranty.
|
|||
|
4.5
|
1-11727
(8-K) (1/19/05)
|
4.3
|
Registration Rights Agreement dated January 18, 2005, among Energy Transfer Partners, L.P., the subsidiary guarantors named therein and the initial purchasers party thereto.
|
|||
|
4.6
|
1-11727
(10-Q) (2/28/05)
|
10.39.1
|
Joinder to Registration Rights Agreement dated February 24, 2005, among Energy Transfer Partners, L.P., the Subsidiary Guarantors and Wachovia Bank, National Association, as trustee.
|
|||
E-
2
|
Exhibit
Number
|
Previously Filed *
|
|
||||
|
With File
Number
(Form) (Period Ended or Date)
|
As
Exhibit
|
|||||
|
4.7
|
1-11727
(8-K) (8/2/05)
|
4.1
|
Third Supplemental Indenture dated July 29, 2005, to Indenture dated January 18, 2005, among Energy Transfer Partners, L.P., the subsidiary guarantors named therein, and Wachovia Bank, National Association, as trustee.
|
|||
|
4.8
|
1-11727
(8-K) (8/2/05)
|
4.2
|
Registration Rights Agreement dated July 29, 2005, among Energy Transfer Partners, L.P., the subsidiary guarantors named therein, and the initial purchasers party thereto.
|
|||
|
4.9
|
1-11727
(10-K/A) (8/31/05)
|
4.9
|
Form of Senior Indenture of Energy Transfer Partners, L.P.
|
|||
|
4.10
|
1-11727
(10-K/A) (8/31/05)
|
4.10
|
Form of Subordinated Indenture of Energy Transfer Partners, L.P.
|
|||
|
4.11
|
1-11727
(10-K) (8/31/06)
|
4.13
|
Fourth Supplemental Indenture dated as of June 29, 2006 to Indenture dated January 18, 2005, among Energy Transfer Partners, L.P., the subsidiary guarantors named therein and Wachovia Bank, National Association, as trustee.
|
|||
|
4.12
|
1-11727
(8-K) (10/25/06)
|
4.1
|
Fifth Supplemental Indenture dated as of October 23, 2006 to Indenture dated January 18, 2005, among Energy Transfer Partners, L.P., the subsidiary guarantors named therein and Wachovia Bank, National Association, as trustee.
|
|||
|
4.13
|
1-11727
(8-K) (3/28/08)
|
4.2
|
Sixth Supplemental Indenture dated March 28, 2008, by and between Energy Transfer Partners, L.P., as issuer, and U.S. Bank National Association (as successor to Wachovia Bank, National Association), as trustee.
|
|||
|
4.14
|
1-11727
(8-K) (12/23/08)
|
4.2
|
Seventh Supplemental Indenture dated December 23, 2008, by and between Energy Transfer Partners, L.P., as issuer, and U.S. Bank National Association (as successor to Wachovia Bank, National Association), as trustee.
|
|||
|
4.15
|
1-11727
(8-K) (4/7/09)
|
4.2
|
Eighth Supplemental Indenture dated April 7, 2009, by and between Energy Transfer Partners, L.P., as issuer, and U.S. Bank National Association (as successor to Wachovia Bank, National Association), as trustee.
|
|||
|
4.16
|
1-11727
(DEF 14A) (11/21/08)
|
A
|
Energy Transfer Partners, L.P. 2008 Long-Term Incentive Plan.
|
|||
|
4.17
|
1-32740
(8-K) (6/2/10)
|
4.14
|
Registration Rights Agreement by and among Energy Transfer Equity, L.P. and Regency GP Acquirer, L.P., dated as of May 26, 2010.
|
|||
|
4.18
|
1-32740
(8-K) (9/20/10)
|
4.14
|
Indenture dated September 20, 2010 between Energy Transfer Equity, L.P. and U.S. Bank National Association, as trustee.
|
|||
|
4.19
|
1-32740
(8-K) (9/20/10)
|
4.15
|
First Supplemental Indenture dated September 20, 2010 between Energy Transfer Equity, L.P. and U.S. Bank National Association, as trustee (including form of the Notes).
|
|||
E-
3
|
Exhibit
Number
|
Previously Filed *
|
|
||||
|
With File
Number
(Form) (Period Ended or Date)
|
As
Exhibit
|
|||||
|
10.1
|
1-11727
(8-K) (2/1/05)
|
10.1
|
Purchase and Sale Agreement dated January 26, 2005, among HPL Storage, LP and AEP Energy Services Gas Holding Company II, L.L.C., as Sellers, and LaGrange Acquisition, L.P., as Buyer.
|
|||
|
10.2
|
1-11727
(8-K) (2/1/05)
|
10.2
|
Cushion Gas Litigation Agreement dated January 26, 2005, among AEP Energy Services Gas Holding Company II, L.L.C. and HPL Storage LP, as Sellers, and LaGrange Acquisition, L.P., as Buyer, and AEP Asset Holdings LP, AEP Leaseco LP, Houston Pipe Line Company, LP and HPL Resources Company LP, as Companies.
|
|||
|
10.3
|
1-11727
(10-K) (8/31/06)
|
10.45
|
Energy Transfer Partners, L.P. Summary of Director Compensation.
|
|||
|
10.4.1**
|
1-11727
(10-Q) (2/28/02)
|
10.6.3
|
Heritage Propane Partners, L.P. (now known as Energy Transfer Partners, L.P.) Second Amended and Restated Restricted Unit Plan dated as of February 4, 2002.
|
|||
|
10.4.2**
|
1-11727
(10-Q) (6/30/08)
|
10.6.6
|
Energy Transfer Partners, L.P. Amended and Restated 2004 Unit Plan.
|
|||
|
10.4.3**
|
1-11727
(8-K) (11/1/04)
|
10.1
|
Form of Grant Agreement.
|
|||
|
10.4.4**
|
1-11727
(8-K) (3/3/2008)
|
10.1
|
Energy Transfer Partners, L.P. Midstream Bonus Plan.
|
|||
|
10.5
|
1-11727
(8-K) (2/4/02)
|
4.1
|
Registration Rights Agreement for Limited Partner Interests of Heritage Propane Partners, L.P.
|
|||
|
10.6
|
1-11727
(10-Q) (2/29/04)
|
4.2
|
Unitholder Rights Agreement dated January 20, 2004, among Heritage Propane Partners, L.P., Heritage Holdings, Inc., TAAP LP and LaGrange Energy, L.P.
|
|||
|
10.7
|
333-128097
(S-1) (333-128097)
|
10.47
|
Registration Rights Agreement for Limited Partnership Units of LaGrange Energy, L.P.
|
|||
|
10.8**
|
333-128097
(S-1) (333-128097)
|
10.25
|
Energy Transfer Equity Long-Term Incentive Plan.
|
|||
|
10.9**
|
333-128097
(S-1) (333-128097)
|
10.26
|
Form of Director and Officer Indemnification Agreement.
|
|||
E-
4
|
Exhibit
Number
|
Previously Filed *
|
|
||||
|
With File
Number
(Form) (Period Ended or Date)
|
As
Exhibit
|
|||||
|
10.10
|
1-11727
(8-K) (11/2/11)
|
10.1
|
Second Amended and Restated Credit Agreement, dated October 27, 2011, among Energy Transfer Partners, L.P., the borrower, and Wachovia Bank, National Association, as administrative agent, LC issuer and swingline lender, Bank of America, N.A., as syndication agent, BNP Paribas, JPMorgan Chase Bank, N.A. and the Royal Bank of Scotland PLC, as co-documentation agents, and Citibank, N.A., Credit Suisse, Cayman Islands Branch, Deutsche Bank Securities, Inc., Morgan Stanley Bank, Suntrust Bank and UBS Securities, LLC, as senior managing agents, and other lenders party hereto.
|
|||
|
10.11
|
1-32740
(8-K) (7/19/06)
|
10.2
|
Amended and Restated Credit Agreement dated July 13, 2006, between Energy Transfer Equity, L.P. and Wachovia Bank, National Association, as administrative agent, LC issuer and swingline lender, Bank of America, N.A. and Citicorp North America, Inc., as co-syndication agents, BNP Paribas and The Royal Bank of Scotland plc, as co-documentation agents, Credit Suisse Cayman Islands Branch, Deutsche Bank AG New York Branch and UBS Securities LLC, as senior managing agents, and Fortis Capital Corp, Suntrust Bank and Wells Fargo Bank, N.A., as managing agents.
|
|||
|
10.12
|
1-32740
(10-K) (8/31/06)
|
10.34
|
First Amendment to Amended and Restated Credit Agreement, dated November 1, 2006, among Energy Transfer Equity, L.P., as the borrower, Wachovia Bank, National Association as administrative agent, UBS Loan Finance LLC, as syndication agent, BNP Paribas, Citicorp North America, Inc. and JPMorgan Chase Bank, N.A. as co-documentation agents, and UBS Securities LLC and Wachovia Capital Markets, LLC, as joint lead arrangers and joint book managers.
|
|||
|
10.12.1
|
1-32740
(8-K) (6/2/10)
|
10.1
|
Second Amended and Restated Credit Agreement, dated as of May 19, 2010, among Energy Transfer Equity, L.P. as the borrower, Wells Fargo Bank, National Association, as administrative agent, Bank of America, N.A. and Citicorp North America, Inc., as co-syndication agents, BNP PARIBAS and the Royal Bank of Scotland plc, as co-documentation agents, Credit Suisse, Cayman Islands Branch, Deutsche Bank AG New York Branch, and UBS Securities LLC, as senior managing agents, Fortis Capital Corp, and Sun Trust Banks, as managing agents, and other lenders party thereto.
|
|||
|
10.13
|
1-32740
(10-K) (8/31/06)
|
10.35
|
Contribution and Conveyance Agreement, dated November 1, 2006, between Energy Transfer Equity, L.P., and Energy Transfer Partners, L.P.
|
|||
|
10.14
|
1-32740
(10-K) (8/31/06)
|
10.36
|
Contribution, Assumption and Conveyance Agreement, dated November 1, 2006, between Energy Transfer Equity, L.P., and Energy Transfer Investments, L.P.
|
|||
E-
5
|
Exhibit
Number
|
Previously Filed *
|
|
||||
|
With File
Number
(Form) (Period Ended or Date)
|
As
Exhibit
|
|||||
|
10.15
|
1-11727
(8-K) (11/3/06)
|
3.1.10
|
Registration Rights Agreement, dated November 1, 2006, between Energy Transfer Partners, L.P. and Energy Transfer Equity, L.P.
|
|||
|
10.16
|
1-32740
(10-K) (8/31/06)
|
10.38
|
Registration Rights Agreement, dated November 1, 2006, between Energy Transfer Equity, L.P. and Energy Transfer Investments, L.P.
|
|||
|
10.17
|
1-11727
(8-K) (9/18/06)
|
10.1
|
Purchase and Sale Agreement, dated as of September 14, 2006, among Energy Transfer Partners, L.P. and EFS-PA, LLC (a/k/a GE Energy Financial Services), CDPQ Investments (U.S.) Inc., Lake Bluff, Inc., Merrill Lynch Ventures, L.P. and Kings Road Holding I LLC.
|
|||
|
10.18
|
1-11727
(8-K) (9/18/06)
|
10.2
|
Redemption Agreement, dated September 14, 2006, between Energy Transfer Partners, L.P. and CCE Holdings, LLC.
|
|||
|
10.19
|
1-11727
(8-K) (9/18/06)
|
10.3
|
Letter Agreement, dated September 14, 2006, between Energy Transfer Partners, L.P. and Southern Union Company.
|
|||
|
10.20
|
1-32740
(8-K)(11/30/06)
|
99.1
|
Registration Rights Agreement, dated November 27, 2006, by and among Energy Transfer Equity, L.P. and certain investors named therein.
|
|||
|
10.21**
|
1-32740
(8-K)(12/26/06)
|
99.1
|
LE GP, LLC Outside Director Compensation Policy.
|
|||
|
10.22
|
1-32740
(8-K)(3/5/07)
|
99.1
|
Registration Rights Agreement, dated March 2, 2007, by and among Energy Transfer Equity, L.P. and certain investors named therein.
|
|||
|
10.23
|
1-32740
(8-K)(5/7/07)
|
10.45
|
Unitholder Rights and Restrictions Agreement, dated as of May 7, 2007, by and among Energy Transfer Equity, L.P., Ray C. Davis, Natural Gas Partners VI, L.P. and Enterprise GP Holdings, L.P.
|
|||
|
10.24
|
1-11727
(10-Q) (5/31/07)
|
10.55
|
Note Purchase Agreement, dated as of November 17, 2004, by and among Transwestern Pipeline Company, LLC and the Purchasers parties thereto.
|
|||
|
10.24.1
|
1-11727
(10-Q) (5/31/07)
|
10.55.1
|
Amendment No. 1 to the Note Purchase Agreement, dated as of April 18, 2007, by and among Transwestern Pipeline Company, LLC and the Purchasers parties thereto.
|
|||
|
10.25
|
1-11727
(10-Q) (5/31/07)
|
10.56
|
Note Purchase Agreement, dated as of May 24, 2007, by and among Transwestern Pipeline Company, LLC and the Purchasers parties thereto.
|
|||
|
10.26
|
1-32740
(8-K) (9/20/10)
|
10.10
|
Credit Agreement, dated September 20, 2010 among Energy Transfer Equity, L.P., as the borrower, Credit Suisse AG, as administrative agent and collateral agent, and the other lenders party thereto, and Credit Suisse Securities (USA) LLC, as sole lead arranger and sole book runner.
|
|||
E-
6
|
Exhibit
Number
|
Previously Filed *
|
|
||||
|
With File
Number
(Form) (Period Ended or Date)
|
As
Exhibit
|
|||||
|
10.27
|
1-32740
(8-K) (9/20/10)
|
10.2
|
Pledge and Security Agreement, dated September 20, 2010, by and among Energy Transfer Equity, L.P., Energy Transfer Partners, L.L.C., ETE GP Acquirer LLC, ETE Services Company, LLC, Regency GP LLC, as the grantors, and Credit Suisse AG, Cayman Islands Branch, as collateral agent for the lenders under the Credit Agreement dated September 20, 2010.
|
|||
|
10.28
|
1-32740
(8-K)(7/5/11) |
10.5
|
Amended and Restated Support Agreement dated July 4, 2011 by and among Energy Transfer Equity, L.P., Sigma Acquisition Corporation and certain stockholders of Southern Union Company
|
|||
|
10.29
|
1-32740
(8-K)(7/20/11) |
10.1
|
Second Amended and Restated Support Agreement, dated as of July 19, 2011, by and among, Energy Transfer Equity, L.P., Sigma Acquisition Corporation and certain stockholders of Southern Union Company.
|
|||
|
10.30
|
1-32740
(10-Q)(8/8/11) |
10.1.1
|
First Amendment to Credit Agreement, dated September 20, 2010 among Energy Transfer Equity, L.P., as the borrower, Credit Suisse AG, as administrative agent and collateral agent, and the other lenders party thereto, and Credit Suisse Securities (USA) LLC, as sole lead arranger and sole book runner.
|
|||
|
10.31
|
1-32740
(8-K)(7/5/11) |
10.1
|
Support Agreement dated June 15, 2011 by and among Energy Transfer Equity, L.P., Sigma Acquisition Corporation, and certain stockholders of Southern Union Company.
|
|||
|
10.3
|
1-32740
(8-K)(10/21/11) |
10.1
|
Senior Bridge Term Loan Credot Agreement, dated as of October 17, 2011 among Energy Transfer Equity, L.P., as the borrower, Credit Suisse AG, as administrative agent, and the other lenders party thereto, and Credit Suisse Securities (USA) LLC, as sole arranger and sole bookrunner.
|
|||
|
12.1
|
Computation of Ratio of Earnings to Fixed Charges.
|
|||||
|
21.1
|
List of Subsidiaries.
|
|||||
|
23.1
|
Consent of Grant Thornton LLP.
|
|||||
|
23.2
|
Consent of KPMG LLP.
|
|||||
|
23.3
|
Consent of PricewaterhouseCoopers LLP.
|
|||||
|
31.1
|
Certification of President and Chief Financial Officer pursuant to Section 302 of the Sarbanes-Oxley Act of 2002.
|
|||||
|
32.1
|
Certification of President and Chief Financial Officer pursuant to 18 U.S.C. Section 1350, as adopted pursuant to Section 906 of the Sarbanes-Oxley Act of 2002.
|
|||||
|
99.1
|
Report of Independent Registered Public Accounting Firm — KPMG LLP opinion on consolidated financial statements of Regency Energy Partners LP.
|
|||||
|
99.2
|
Report of Independent Registered Public Accounting Firm — PricewaterhouseCoopers LLP opinion on financial statements of Midcontinent Express Pipeline LLC.
|
|||||
|
101
|
Interactive data files pursuant to Rule 405 of Regulation S-T: (i) our Consolidated Balance Sheets as of December 31, 2011 and December 31, 2010; (ii) our Consolidated Statements of Operations for the years ended December 31, 2011, 2010 and 2009; (iii) our Consolidated Statements of Comprehensive Income for years ended December 31, 2011, 2010 and 2009; (iv) our Consolidated Statement of Equity for the years ended December 31, 2011, 2010 and 2009; and (v) our Consolidated Statements of Cash Flows for the years ended December 31, 2011, 2010 and 2009.
|
|||||
|
*
|
Incorporated herein by reference.
|
|
**
|
Denotes a management contract or compensatory plan or arrangement.
|
E-
7
INDEX TO FINANCIAL STATEMENTS
Energy Transfer Equity, L.P. and Subsidiaries
|
|
Page
|
F - 1
REPORT OF INDEPENDENT REGISTERED PUBLIC ACCOUNTING FIRM
Partners
Energy Transfer Equity, L.P.
We have audited the accompanying consolidated balance sheets of Energy Transfer Equity, L.P. (a Delaware limited partnership) and subsidiaries (the “Partnership”) as of December 31, 2011 and 2010, and the related consolidated statements of operations, comprehensive income, equity, and cash flows for each of the three years in the period ended December 31, 2011. These financial statements are the responsibility of the Partnership's management. Our responsibility is to express an opinion on these financial statements based on our audits. We did not audit the consolidated financial statements of Regency Energy Partners LP (a consolidated subsidiary following the Partnership's acquisition of the general partner interests in Regency Energy Partners LP on May 26, 2010) as of December 31, 2010 and for the period from May 26, 2010 to December 31, 2010, which statements reflect 27 percent of total consolidated assets as of December 31, 2010 and 11 percent of total consolidated revenues for the year then ended. Those statements were audited by other auditors, whose report thereon has been furnished to us, and our opinion, insofar as it relates to the amounts included for Regency Energy Partners LP as of December 31, 2010 and for the period from May 26, 2010 to December 31, 2010, is based solely on the report of the other auditors.
We conducted our audits in accordance with the standards of the Public Company Accounting Oversight Board (United States). Those standards require that we plan and perform the audit to obtain reasonable assurance about whether the financial statements are free of material misstatement. An audit includes examining, on a test basis, evidence supporting the amounts and disclosures in the financial statements. An audit also includes assessing the accounting principles used and significant estimates made by management, as well as evaluating the overall financial statement presentation. We believe that our audits and the report of the other auditors provide a reasonable basis for our opinion.
In our opinion, based on our audits and the report of the other auditors, the consolidated financial statements referred to above present fairly, in all material respects, the financial position of Energy Transfer Equity, L.P. and subsidiaries as of December 31, 2011 and 2010, and the results of their operations and their cash flows for each of the three years in the period ended December 31, 2011 in conformity with accounting principles generally accepted in the United States of America.
We also have audited, in accordance with the standards of the Public Company Accounting Oversight Board (United States), the Partnership's internal control over financial reporting as of December 31, 2011, based on criteria established in
Internal Control-Integrated Framework
issued by the Committee of Sponsoring Organizations of the Treadway Commission (COSO) and our report dated February 22, 2012 expressed an unqualified opinion thereon.
/s/ GRANT THORNTON LLP
Dallas, Texas
February 22, 2012
F - 2
ENERGY TRANSFER EQUITY, L.P. AND SUBSIDIARIES
(Dollars in thousands)
|
|
December 31,
|
||||||
|
|
2011
|
2010
|
|||||
|
ASSETS
|
|||||||
|
CURRENT ASSETS:
|
|||||||
|
Cash and cash equivalents
|
$
|
126,342
|
|
$
|
86,264
|
|
|
|
Marketable securities
|
1,229
|
|
2,032
|
|
|||
|
Accounts receivable, net of allowance for doubtful accounts of $8,841 and $6,706 as of December 31, 2011 and 2010, respectively
|
680,491
|
|
612,357
|
|
|||
|
Accounts receivable from related companies
|
100,406
|
|
76,331
|
|
|||
|
Inventories
|
327,963
|
|
366,384
|
|
|||
|
Exchanges receivable
|
21,307
|
|
21,926
|
|
|||
|
Price risk management assets
|
15,802
|
|
16,357
|
|
|||
|
Other current assets
|
181,904
|
|
109,359
|
|
|||
|
Total current assets
|
1,455,444
|
|
1,291,010
|
|
|||
|
PROPERTY, PLANT AND EQUIPMENT
|
16,529,339
|
|
13,284,430
|
|
|||
|
ACCUMULATED DEPRECIATION
|
(1,970,777
|
)
|
(1,431,698
|
)
|
|||
|
14,558,562
|
|
11,852,732
|
|
||||
|
ADVANCES TO AND INVESTMENTS IN AFFILIATES
|
1,496,600
|
|
1,359,979
|
|
|||
|
LONG-TERM PRICE RISK MANAGEMENT ASSETS
|
26,011
|
|
13,971
|
|
|||
|
GOODWILL
|
2,038,975
|
|
1,600,611
|
|
|||
|
INTANGIBLE ASSETS, net
|
1,072,291
|
|
1,034,846
|
|
|||
|
OTHER NON-CURRENT ASSETS, net
|
248,910
|
|
225,581
|
|
|||
|
Total assets
|
$
|
20,896,793
|
|
$
|
17,378,730
|
|
|
The accompanying notes are an integral part of these consolidated financial statements.
F - 3
ENERGY TRANSFER EQUITY, L.P. AND SUBSIDIARIES
CONSOLIDATED BALANCE SHEETS
(Dollars in thousands)
|
|
December 31,
|
||||||
|
|
2011
|
2010
|
|||||
|
LIABILITIES AND EQUITY
|
|||||||
|
CURRENT LIABILITIES:
|
|||||||
|
Accounts payable
|
$
|
512,023
|
|
$
|
421,556
|
|
|
|
Accounts payable to related companies
|
33,208
|
|
27,351
|
|
|||
|
Exchanges payable
|
17,957
|
|
16,003
|
|
|||
|
Price risk management liabilities
|
90,053
|
|
13,172
|
|
|||
|
Accrued and other current liabilities
|
763,912
|
|
567,688
|
|
|||
|
Current maturities of long-term debt
|
424,160
|
|
35,305
|
|
|||
|
Total current liabilities
|
1,841,313
|
|
1,081,075
|
|
|||
|
LONG-TERM DEBT, less current maturities
|
10,946,864
|
|
9,346,067
|
|
|||
|
LONG-TERM PRICE RISK MANAGEMENT LIABILITIES
|
81,415
|
|
79,465
|
|
|||
|
SERIES A CONVERTIBLE PREFERRED UNITS (Note 7)
|
322,910
|
|
317,600
|
|
|||
|
OTHER NON-CURRENT LIABILITIES
|
244,202
|
|
235,848
|
|
|||
|
COMMITMENTS AND CONTINGENCIES (Note 10)
|
|
|
|||||
|
PREFERRED UNITS OF SUBSIDIARY (Note 7)
|
71,144
|
|
70,943
|
|
|||
|
EQUITY:
|
|||||||
|
General Partner
|
321
|
|
520
|
|
|||
|
Limited Partners:
|
|||||||
|
Common Unitholders (222,972,708 and 222,941,172 units authorized, issued and outstanding as of December 31, 2011 and 2010, respectively)
|
52,485
|
|
115,350
|
|
|||
|
Accumulated other comprehensive income
|
678
|
|
4,798
|
|
|||
|
Total partners’ capital
|
53,484
|
|
120,668
|
|
|||
|
Noncontrolling interest
|
7,335,461
|
|
6,127,064
|
|
|||
|
Total equity
|
7,388,945
|
|
6,247,732
|
|
|||
|
Total liabilities and equity
|
$
|
20,896,793
|
|
$
|
17,378,730
|
|
|
The accompanying notes are an integral part of these consolidated financial statements.
F - 4
ENERGY TRANSFER EQUITY, L.P. AND SUBSIDIARIES
(Dollars in thousands, except per unit data)
|
|
Years Ended December 31,
|
||||||||||
|
|
2011
|
2010
|
2009
|
||||||||
|
REVENUES:
|
|||||||||||
|
Natural gas sales
|
$
|
2,985,471
|
|
$
|
2,732,153
|
|
$
|
2,417,741
|
|
||
|
NGL sales
|
1,735,242
|
|
836,610
|
|
472,874
|
|
|||||
|
Gathering, transportation and other fees
|
1,845,267
|
|
1,388,034
|
|
1,187,969
|
|
|||||
|
Retail propane sales
|
1,360,653
|
|
1,314,973
|
|
1,190,524
|
|
|||||
|
Other
|
314,070
|
|
326,362
|
|
148,187
|
|
|||||
|
Total revenues
|
8,240,703
|
|
6,598,132
|
|
5,417,295
|
|
|||||
|
COSTS AND EXPENSES:
|
|||||||||||
|
Cost of products sold
|
5,182,999
|
|
4,111,337
|
|
3,122,056
|
|
|||||
|
Operating expenses
|
918,918
|
|
784,546
|
|
680,893
|
|
|||||
|
Depreciation and amortization
|
611,809
|
|
431,199
|
|
325,024
|
|
|||||
|
Selling, general and administrative
|
292,158
|
|
234,321
|
|
178,924
|
|
|||||
|
Total costs and expenses
|
7,005,884
|
|
5,561,403
|
|
4,306,897
|
|
|||||
|
OPERATING INCOME
|
1,234,819
|
|
1,036,729
|
|
1,110,398
|
|
|||||
|
OTHER INCOME (EXPENSE):
|
|||||||||||
|
Interest expense, net of interest capitalized
|
(739,811
|
)
|
(624,887
|
)
|
(468,420
|
)
|
|||||
|
Equity in earnings of affiliates
|
117,188
|
|
65,220
|
|
20,597
|
|
|||||
|
Losses on disposal of assets
|
(816
|
)
|
(5,255
|
)
|
(1,564
|
)
|
|||||
|
Gains (losses) on non-hedged interest rate derivatives
|
(77,806
|
)
|
(52,357
|
)
|
33,619
|
|
|||||
|
Allowance for equity funds used during construction
|
957
|
|
28,942
|
|
10,557
|
|
|||||
|
Impairment of investments in affiliates
|
(5,355
|
)
|
(52,620
|
)
|
—
|
|
|||||
|
Other, net
|
15,954
|
|
(44,210
|
)
|
1,913
|
|
|||||
|
INCOME FROM CONTINUING OPERATIONS BEFORE INCOME TAX EXPENSE
|
545,130
|
|
351,562
|
|
707,100
|
|
|||||
|
Income tax expense
|
16,883
|
|
13,738
|
|
9,229
|
|
|||||
|
INCOME FROM CONTINUING OPERATIONS
|
528,247
|
|
337,824
|
|
697,871
|
|
|||||
|
Loss from discontinued operations
|
—
|
|
(1,244
|
)
|
—
|
|
|||||
|
NET INCOME
|
528,247
|
|
336,580
|
|
697,871
|
|
|||||
|
LESS: NET INCOME ATTRIBUTABLE TO NONCONTROLLING INTEREST
|
218,436
|
|
143,822
|
|
255,398
|
|
|||||
|
NET INCOME ATTRIBUTABLE TO PARTNERS
|
309,811
|
|
192,758
|
|
442,473
|
|
|||||
|
GENERAL PARTNER’S INTEREST IN NET INCOME
|
959
|
|
597
|
|
1,370
|
|
|||||
|
LIMITED PARTNERS’ INTEREST IN NET INCOME
|
$
|
308,852
|
|
$
|
192,161
|
|
$
|
441,103
|
|
||
|
BASIC NET INCOME PER LIMITED PARTNER UNIT
|
$
|
1.39
|
|
$
|
0.86
|
|
$
|
1.98
|
|
||
|
BASIC AVERAGE NUMBER OF UNITS OUTSTANDING
|
222,968,261
|
|
222,941,156
|
|
222,898,203
|
|
|||||
|
DILUTED NET INCOME PER LIMITED PARTNER UNIT
|
$
|
1.38
|
|
$
|
0.86
|
|
$
|
1.98
|
|
||
|
DILUTED AVERAGE NUMBER OF UNITS OUTSTANDING
|
222,968,261
|
|
222,941,156
|
|
222,898,203
|
|
|||||
The accompanying notes are an integral part of these consolidated financial statements.
F - 5
ENERGY TRANSFER EQUITY, L.P. AND SUBSIDIARIES
CONSOLIDATED STATEMENTS OF COMPREHENSIVE INCOME
(Dollars in thousands)
|
|
Years Ended December 31,
|
||||||||||
|
|
2011
|
2010
|
2009
|
||||||||
|
Net income
|
$
|
528,247
|
|
$
|
336,580
|
|
$
|
697,871
|
|
||
|
Other comprehensive income, net of tax:
|
|||||||||||
|
Reclassification to earnings of gains and losses on derivative instruments accounted for as cash flow hedges
|
(18,952
|
)
|
49,353
|
|
16,958
|
|
|||||
|
Change in value of derivative instruments accounted for as cash flow hedges
|
6,502
|
|
19,012
|
|
(11,017
|
)
|
|||||
|
Change in value of available-for-sale securities
|
(804
|
)
|
(4,023
|
)
|
10,924
|
|
|||||
|
(13,254
|
)
|
64,342
|
|
16,865
|
|
||||||
|
Comprehensive income
|
514,993
|
|
400,922
|
|
714,736
|
|
|||||
|
Less: Comprehensive income attributable to noncontrolling interest
|
209,302
|
|
149,738
|
|
258,066
|
|
|||||
|
Comprehensive income attributable to partners
|
$
|
305,691
|
|
$
|
251,184
|
|
$
|
456,670
|
|
||
The accompanying notes are an integral part of these consolidated financial statements.
F - 6
ENERGY TRANSFER EQUITY, L.P. AND SUBSIDIARIES
CONSOLIDATED STATEMENTS OF EQUITY
(Dollars in thousands)
|
General
Partner
|
Common
Unitholders
|
Accumulated
Other
Comprehensive
Income (Loss)
|
Noncontrolling
Interest
|
Total
|
|||||||||||||||
|
Balance, December 31, 2008
|
$
|
155
|
|
$
|
(15,762
|
)
|
$
|
(67,825
|
)
|
$
|
2,422,748
|
|
$
|
2,339,316
|
|
||||
|
Distributions to partners
|
(1,457
|
)
|
(469,201
|
)
|
—
|
|
—
|
|
(470,658
|
)
|
|||||||||
|
Distributions to noncontrolling interest
|
—
|
|
—
|
|
—
|
|
(381,471
|
)
|
(381,471
|
)
|
|||||||||
|
Subsidiary units issued for cash
|
300
|
|
96,696
|
|
—
|
|
902,680
|
|
999,676
|
|
|||||||||
|
Non-cash compensation expense, net of units tendered by employees for tax withholdings
|
—
|
|
576
|
|
—
|
|
21,838
|
|
22,414
|
|
|||||||||
|
Other, net
|
—
|
|
—
|
|
—
|
|
(3,762
|
)
|
(3,762
|
)
|
|||||||||
|
Other comprehensive income, net of tax
|
—
|
|
—
|
|
14,197
|
|
2,668
|
|
16,865
|
|
|||||||||
|
Net income
|
1,370
|
|
441,103
|
|
—
|
|
255,398
|
|
697,871
|
|
|||||||||
|
Balance, December 31, 2009
|
368
|
|
53,412
|
|
(53,628
|
)
|
3,220,099
|
|
3,220,251
|
|
|||||||||
|
Regency Transactions (See Notes 1 and 3)
|
648
|
|
209,065
|
|
—
|
|
1,895,268
|
|
2,104,981
|
|
|||||||||
|
Distributions to partners
|
(1,495
|
)
|
(481,553
|
)
|
—
|
|
—
|
|
(483,048
|
)
|
|||||||||
|
Distributions to noncontrolling interest
|
—
|
|
—
|
|
—
|
|
(567,593
|
)
|
(567,593
|
)
|
|||||||||
|
Subsidiary units issued for cash
|
441
|
|
142,154
|
|
—
|
|
1,409,215
|
|
1,551,810
|
|
|||||||||
|
Non-cash compensation expense, net of units tendered by employees for tax withholdings
|
—
|
|
936
|
|
—
|
|
24,995
|
|
25,931
|
|
|||||||||
|
Other, net
|
(39
|
)
|
(825
|
)
|
—
|
|
(4,658
|
)
|
(5,522
|
)
|
|||||||||
|
Other comprehensive income, net of tax
|
—
|
|
—
|
|
58,426
|
|
5,916
|
|
64,342
|
|
|||||||||
|
Net income
|
597
|
|
192,161
|
|
—
|
|
143,822
|
|
336,580
|
|
|||||||||
|
Balance, December 31, 2010
|
520
|
|
115,350
|
|
4,798
|
|
6,127,064
|
|
6,247,732
|
|
|||||||||
|
Distributions to partners
|
(1,626
|
)
|
(523,970
|
)
|
—
|
|
—
|
|
(525,596
|
)
|
|||||||||
|
Distributions to noncontrolling interest
|
—
|
|
—
|
|
—
|
|
(778,557
|
)
|
(778,557
|
)
|
|||||||||
|
Subsidiary units issued for cash
|
474
|
|
152,565
|
|
—
|
|
1,749,603
|
|
1,902,642
|
|
|||||||||
|
Subsidiary units issued in acquisition
|
—
|
|
—
|
|
—
|
|
3,000
|
|
3,000
|
|
|||||||||
|
Non-cash compensation expense, net of units tendered by employees for tax withholdings
|
—
|
|
1,139
|
|
—
|
|
32,851
|
|
33,990
|
|
|||||||||
|
Other, net
|
(6
|
)
|
(1,451
|
)
|
—
|
|
(7,802
|
)
|
(9,259
|
)
|
|||||||||
|
Other comprehensive loss, net of tax
|
—
|
|
—
|
|
(4,120
|
)
|
(9,134
|
)
|
(13,254
|
)
|
|||||||||
|
Net income
|
959
|
|
308,852
|
|
—
|
|
218,436
|
|
528,247
|
|
|||||||||
|
Balance, December 31, 2011
|
$
|
321
|
|
$
|
52,485
|
|
$
|
678
|
|
$
|
7,335,461
|
|
$
|
7,388,945
|
|
||||
The accompanying notes are an integral part of these consolidated financial statements.
F - 7
ENERGY TRANSFER EQUITY, L.P. AND SUBSIDIARIES
(Dollars in thousands)
|
|
Years Ended December 31,
|
||||||||||
|
|
2011
|
2010
|
2009
|
||||||||
|
CASH FLOWS FROM OPERATING ACTIVITIES:
|
|||||||||||
|
Net income
|
$
|
528,247
|
|
$
|
336,580
|
|
$
|
697,871
|
|
||
|
Reconciliation of net income to net cash provided by operating activities:
|
|||||||||||
|
Impairment of investments in affiliates
|
5,355
|
|
52,620
|
|
—
|
|
|||||
|
Payment for termination of Parent Company interest rate derivatives (See Note 11)
|
—
|
|
(168,550
|
)
|
—
|
|
|||||
|
Proceeds from termination of ETP interest rate derivatives
|
—
|
|
26,495
|
|
—
|
|
|||||
|
Depreciation and amortization
|
611,809
|
|
431,199
|
|
325,024
|
|
|||||
|
Amortization of finance costs charged to interest
|
19,779
|
|
18,111
|
|
14,954
|
|
|||||
|
Non-cash compensation expense
|
42,181
|
|
31,168
|
|
25,833
|
|
|||||
|
Losses on disposal of assets
|
816
|
|
5,255
|
|
1,564
|
|
|||||
|
Distribution in excess of earnings of affiliates, net
|
3,075
|
|
79,975
|
|
3,224
|
|
|||||
|
Other non-cash
|
7,281
|
|
14,483
|
|
3,627
|
|
|||||
|
Changes in operating assets and liabilities, net of effects of acquisitions (see Note 2)
|
158,148
|
|
259,543
|
|
(348,636
|
)
|
|||||
|
Net cash provided by operating activities
|
1,376,691
|
|
1,086,879
|
|
723,461
|
|
|||||
|
CASH FLOWS FROM INVESTING ACTIVITIES:
|
|||||||||||
|
Cash paid for acquisitions, net of cash received
|
(1,971,581
|
)
|
(345,237
|
)
|
30,367
|
|
|||||
|
Capital expenditures (excluding allowance for equity funds used during construction)
|
(1,810,230
|
)
|
(1,509,977
|
)
|
(748,621
|
)
|
|||||
|
Contributions in aid of construction costs
|
25,371
|
|
13,720
|
|
6,453
|
|
|||||
|
Advances to affiliates, net
|
(149,717
|
)
|
(92,603
|
)
|
(655,500
|
)
|
|||||
|
Proceeds from the sale of assets
|
33,275
|
|
104,118
|
|
21,545
|
|
|||||
|
Net cash used in investing activities
|
(3,872,882
|
)
|
(1,829,979
|
)
|
(1,345,756
|
)
|
|||||
|
CASH FLOWS FROM FINANCING ACTIVITIES:
|
|||||||||||
|
Proceeds from borrowings
|
8,261,905
|
|
4,388,531
|
|
3,542,612
|
|
|||||
|
Principal payments on debt
|
(6,263,802
|
)
|
(4,078,171
|
)
|
(3,020,587
|
)
|
|||||
|
Subsidiary equity offerings, net of issue costs
|
1,902,642
|
|
1,551,810
|
|
936,337
|
|
|||||
|
Distributions to partners
|
(525,596
|
)
|
(483,048
|
)
|
(470,658
|
)
|
|||||
|
Distributions to noncontrolling interests
|
(778,557
|
)
|
(567,593
|
)
|
(381,471
|
)
|
|||||
|
Debt issuance costs
|
(53,298
|
)
|
(48,613
|
)
|
(7,646
|
)
|
|||||
|
Other, net
|
(7,025
|
)
|
(1,867
|
)
|
—
|
|
|||||
|
Net cash provided by financing activities
|
2,536,269
|
|
761,049
|
|
598,587
|
|
|||||
|
INCREASE (DECREASE) IN CASH AND CASH EQUIVALENTS
|
40,078
|
|
17,949
|
|
(23,708
|
)
|
|||||
|
CASH AND CASH EQUIVALENTS, beginning of period
|
86,264
|
|
68,315
|
|
92,023
|
|
|||||
|
CASH AND CASH EQUIVALENTS, end of period
|
$
|
126,342
|
|
$
|
86,264
|
|
$
|
68,315
|
|
||
The accompanying notes are an integral part of these consolidated financial statements.
F - 8
ENERGY TRANSFER EQUITY, L.P. AND SUBSIDIARIES
NOTES TO CONSOLIDATED FINANCIAL STATEMENTS
(Tabular dollar amounts, except per unit data, are in thousands)
1.
OPERATIONS AND ORGANIZATION
:
Financial Statement Presentation
The consolidated financial statements of Energy Transfer Equity, L.P. (the “Partnership,” “we” or “ETE”) presented herein for the years ended
December 31, 2011, 2010 and 2009
, have been prepared in accordance with accounting principles generally accepted in the United States of America (“GAAP”) and pursuant to the rules and regulations of the Securities and Exchange Commission (“SEC”). We consolidate all majority-owned subsidiaries and limited partnerships, which we control as the general partner or owner of the general partner. All significant intercompany transactions and accounts are eliminated in consolidation. Management has evaluated subsequent events through the date the financial statements were issued.
At
December 31, 2011
, our equity interests consisted of:
|
General Partner
Interest (as a %
of total
partnership
interest)
|
Incentive
Distribution
Rights
(“IDRs”)
|
Limited
Partner Units
|
||||||
|
ETP
|
1.5
|
%
|
100
|
%
|
50,226,967
|
|
||
|
Regency
|
1.8
|
%
|
100
|
%
|
26,266,791
|
|
||
The consolidated financial statements of ETE presented herein include the results of operations of:
•
the Parent Company;
|
•
|
our controlled subsidiaries, Energy Transfer Partners, L.P. (“ETP”) and Regency Energy Partners LP (“Regency”) (see description of their respective operations below under “Business Operations”);
|
|
•
|
ETP’s and Regency’s wholly-owned subsidiaries; and
|
|
•
|
our wholly-owned subsidiaries that own the general partner and IDR interest in ETP and Regency.
|
We obtained control of Regency on May 26, 2010 as a result of the “Regency Transactions” (see Note 3), and as such, the year ended December 31, 2010 includes the results of operations of Regency for the period from the acquisition date through the end of the period.
Our subsidiaries also own varying undivided interests in certain pipelines. Ownership of these pipelines has been structured as an ownership of an undivided interest in assets, not as an ownership interest in a partnership, limited liability company, joint venture or other forms of entities. Each owner controls marketing and invoices separately, and each owner is responsible for any loss, damage or injury that may occur to their own customers. As a result, we apply proportionate consolidation for our interests in these entities.
Certain prior period amounts have been reclassified to conform to the
2011
presentation. These reclassifications had
no
impact on net income or total equity.
Unless the context requires otherwise, references to “we,” “us,” “our,” and “ETE” mean Energy Transfer Equity, L.P. and its consolidated subsidiaries, which include ETP, Energy Transfer Partners GP, L.P. (“ETP GP”), the General Partner of ETP, ETP GP’s General Partner, Energy Transfer Partners, L.L.C. (“ETP LLC”), Regency, Regency GP LP (“Regency GP”), the General Partner of Regency, and Regency GP’s General Partner, Regency GP LLC (“Regency LLC”). References to the “Parent Company” mean Energy Transfer Equity, L.P. on a stand-alone basis.
F - 9
Business Operations
The Parent Company’s principal sources of cash flow are distributions related to its direct and indirect investments in the limited partner and general partner interests in ETP and Regency. The Parent Company’s primary cash requirements are for general and administrative expenses, debt service requirements, distributions to its partners and holders of the Series A Convertible Preferred Units (the “Preferred Units”) and at ETE’s election, capital contributions to ETP and Regency in respect of ETE’s general partner interests in ETP and Regency. Parent Company-only assets are not available to satisfy the debts and other obligations of ETE’s subsidiaries. In order to fully understand the financial condition of the Parent Company on a stand-alone basis, see Note
16
for stand-alone financial information apart from that of the consolidated partnership information included herein.
The following is a brief description of ETP’s and Regency’s operations:
|
•
|
ETP is a publicly traded partnership owning and operating a diversified portfolio of energy assets. ETP has pipeline operations in Arizona, Arkansas, Colorado, Louisiana, New Mexico, Utah and West Virginia and owns the largest intrastate pipeline system in Texas. ETP currently has natural gas operations that include gathering and transportation pipelines, treating and processing assets, and storage facilities located in Texas. ETP also holds a
70%
membership interest in Lone Star NGL LLC (“Lone Star”), a joint venture that owns and operates NGL storage, fractionation and transportation assets in Texas, Louisiana and Mississippi.
|
|
•
|
Regency is a publicly traded partnership engaged in the gathering and processing, contract compression, treating and transportation of natural gas and the transportation, fractionation and storage of NGLs. Regency focuses on providing midstream services in some of the most prolific natural gas producing regions in the United States, including the Eagle Ford, Haynesville, Barnett, Fayetteville, Marcellus, Bone Spring and Avalon shales, as well as the Permian Delaware basin. Its assets are primarily located in Texas, Louisiana, Arkansas, Pennsylvania, California, Mississippi, Alabama, West Virginia and the mid-continent region of the United States, which includes Kansas, Colorado and Oklahoma. Regency also holds a
30%
membership interest in Lone Star.
|
2.
ESTIMATES, SIGNIFICANT ACCOUNTING POLICIES AND BALANCE SHEET DETAIL
:
Use of Estimates
The preparation of financial statements in conformity with GAAP requires management to make estimates and assumptions that affect the reported amounts of assets and liabilities and the accrual for and disclosure of contingent assets and liabilities at the date of the financial statements and the reported amounts of revenues and expenses during the reporting period.
The natural gas industry conducts its business by processing actual transactions at the end of the month following the month of delivery. Consequently, the most current month’s financial results for natural gas and NGL related operations are estimated using volume estimates and market prices. Any differences between estimated results and actual results are recognized in the following month’s financial statements. Management believes that the estimated operating results represent the actual results in all material respects.
Some of the other significant estimates made by management include, but are not limited to, the timing of certain forecasted transactions that are hedged, the fair value of derivative instruments, useful lives for depreciation and amortization, purchase accounting allocations and subsequent realizability of intangible assets, fair value measurements used in the goodwill impairment test, market value of inventory, assets and liabilities resulting from the regulated ratemaking process, contingency reserves and environmental reserves. Actual results could differ from those estimates.
Revenue Recognition
Our segments are engaged in multiple revenue-generating activities. To the extent that those activities are similar among our segments, revenue recognition policies are similar. Below is a description of revenue recognition policies for significant revenue-generating activities within our segments.
Investment in ETP
Revenues for ETP’s sales of natural gas, NGLs including propane, and propane appliances, parts, and fittings are recognized at the later of the time of delivery of the product to the customer or the time of sale or installation. Revenues from service labor, transportation, treating, compression and gas processing, are recognized upon completion of the service. Transportation capacity payments are recognized when earned in the period the capacity is made available. Tank rent is recognized ratably over the period it is earned.
F - 10
ETP’s intrastate transportation and storage and interstate transportation operations’ results are determined primarily by the amount of capacity its customers reserve as well as the actual volume of natural gas that flows through the transportation pipelines. Under transportation contracts, ETP’s customers are charged (i) a demand fee, which is a fixed fee for the reservation of an agreed amount of capacity on the transportation pipeline for a specified period of time and which obligates the customer to pay even if the customer does not transport natural gas on the respective pipeline, (ii) a transportation fee, which is based on the actual throughput of natural gas by the customer, (iii) fuel retention based on a percentage of gas transported on the pipeline, or (iv) a combination of the three, generally payable monthly. Fuel retained for a fee is typically valued at market prices.
ETP’s intrastate transportation and storage operations also generate revenues and margin from the sale of natural gas to electric utilities, independent power plants, local distribution companies, industrial end-users and other marketing companies on the HPL System. Generally, ETP purchases natural gas from the market, including purchases from ETP’s midstream marketing operations, and from producers at the wellhead.
In addition, ETP’s intrastate transportation and storage operations generate revenues and margin from fees charged for storing customers’ working natural gas in its storage facilities. ETP also engages in natural gas storage transactions in which it seeks to find and profit from pricing differences that occur over time utilizing the Bammel storage reservoir. ETP purchases physical natural gas and then sells financial contracts at a price sufficient to cover its carrying costs and provide for a gross profit margin. ETP expects margins from natural gas storage transactions to be higher during the periods from November to March of each year and lower during the period from April through October of each year due to the increased demand for natural gas during colder weather. However, ETP cannot assure that management’s expectations will be fully realized in the future and in what time period, due to various factors including weather, availability of natural gas in regions in which it operates, competitive factors in the energy industry, and other issues.
Results from ETP’s midstream operations are determined primarily by the volumes of natural gas gathered, compressed, treated, processed, purchased and sold through its pipeline and gathering systems and the level of natural gas and NGL prices. ETP generates midstream revenues and gross margins principally under fee-based or other arrangements in which it receives a fee for natural gas gathering, compressing, treating or processing services. The revenue earned from these arrangements is directly related to the volume of natural gas that flows through ETP’s systems and is not directly dependent on commodity prices.
ETP also utilizes other types of arrangements in its midstream operations, including (i) discount-to-index price arrangements, which involve purchases of natural gas at either (1) a percentage discount to a specified index price, (2) a specified index price less a fixed amount or (3) a percentage discount to a specified index price less an additional fixed amount, (ii) percentage-of-proceeds arrangements under which ETP gathers and processes natural gas on behalf of producers, sells the resulting residue gas and NGL volumes at market prices and remits to producers an agreed upon percentage of the proceeds based on an index price, and (iii) keep-whole arrangements where ETP gathers natural gas from the producer, processes the natural gas and sells the resulting NGLs to third parties at market prices. In many cases, ETP provides services under contracts that contain a combination of more than one of the arrangements described above. The terms of ETP’s contracts vary based on gas quality conditions, the competitive environment at the time the contracts are signed and customer requirements. ETP’s contract mix may change as a result of changes in producer preferences, expansion in regions where some types of contracts are more common and other market factors.
NGL storage and pipeline transportation revenues are recognized when services are performed or products are delivered, respectively. Fractionation and processing revenues are recognized when product is either loaded into a truck or injected into a third party pipeline, which is when title and risk of loss pass to the customer.
ETP conducts marketing activities in which it markets the natural gas that flows through its assets, referred to as on-system gas. ETP also attracts other customers by marketing volumes of natural gas that do not move through its assets, referred to as off-system gas. For both on-system and off-system gas, ETP purchases natural gas from natural gas producers and other supply points and sells that natural gas to utilities, industrial consumers, other marketers and pipeline companies, thereby generating gross margins based upon the difference between the purchase and resale prices.
ETP’s retail propane operations sell propane and propane-related products and services. The Heritage Operating, L.P. (“HOLP”) and Titan Energy Partners, L.P. (“Titan”) customer base includes residential, commercial, industrial and agricultural customers.
In ETP’s natural gas compression business, revenue is recognized for compressor packages and technical service jobs using the completed contract method which recognizes revenue upon completion of the job. Costs incurred on a job are deducted at the time revenue is recognized.
F - 11
Investment in Regency
Regency earns revenue from (i) domestic sales of natural gas, NGLs and condensate, (ii) natural gas gathering, processing and transportation, (iii) contract compression services and (iv) contract treating services. Revenue associated with sales of natural gas, NGLs and condensate are recognized when title passes to the customer, which is when the risk of ownership passes to the purchaser and physical delivery occurs. Revenue associated with transportation and processing fees are recognized when the service is provided. For contract compression services, revenue is recognized when the service is performed. For gathering and processing services, Regency receives either fees or commodities from natural gas producers depending on the type of contract. Commodities received are in turn sold and recognized as revenue in accordance with the criteria outlined above. Under the percentage-of-proceeds contract type, Regency is paid for its services by keeping a percentage of the NGLs produced and a percentage of the residue gas resulting from processing the natural gas. Under the percentage-of-index contract type, Regency earns revenue by purchasing wellhead natural gas at a percentage of the index price and selling processed natural gas at a price approximating the index price and NGLs to third parties. Regency generally reports revenue gross when it acts as the principal, takes title to the product, and incurs the risks and rewards of ownership. Revenue for fee-based arrangements is presented net, because Regency takes the role of an agent for the producers.
Regulatory Accounting - Regulatory Assets and Liabilities
Certain of our subsidiaries are subject to regulation by certain state and federal authorities and have accounting policies that conform to the accounting requirements and ratemaking practices of the regulatory authorities. The application of these accounting policies allows us to defer expenses and revenues on the balance sheet as regulatory assets and liabilities when it is probable that those expenses and revenues will be allowed in the ratemaking process in a period different from the period in which they would have been reflected in the consolidated statement of operations by an unregulated company. These deferred assets and liabilities will be reported in results of operations in the period in which the same amounts are included in rates and recovered from or refunded to customers. Management’s assessment of the probability of recovery or pass through of regulatory assets and liabilities will require judgment and interpretation of laws and regulatory commission orders. If, for any reason, we cease to meet the criteria for application of regulatory accounting treatment for all or part of our operations, the regulatory assets and liabilities related to those portions ceasing to meet such criteria would be eliminated from the consolidated balance sheets for the period in which the discontinuance of regulatory accounting treatment occurs.
Cash, Cash Equivalents and Supplemental Cash Flow Information
Cash and cash equivalents include all cash on hand, demand deposits, and investments with original maturities of three months or less. We consider cash equivalents to include short-term, highly liquid investments that are readily convertible to known amounts of cash and which are subject to an insignificant risk of changes in value.
We place our cash deposits and temporary cash investments with high credit quality financial institutions. At times, our cash and cash equivalents may be uninsured or in deposit accounts that exceed the Federal Deposit Insurance Corporation insurance limit.
As a result of ETP’s acquisition of a natural gas compression equipment business in exchange for ETP Common Units, cash acquired in connection with acquisitions during 2009 exceeded the cash we paid during the period.
F - 12
The net change in operating assets and liabilities (net of effects of acquisitions) included in cash flows from operating activities was comprised as follows:
|
|
Years Ended December 31,
|
||||||||||
|
|
2011
|
2010
|
2009
|
||||||||
|
Accounts receivable
|
$
|
6,073
|
|
$
|
92,085
|
|
$
|
28,431
|
|
||
|
Accounts receivable from related companies
|
(23,816
|
)
|
(26,265
|
)
|
(26,321
|
)
|
|||||
|
Inventories
|
50,991
|
|
14,750
|
|
(101,592
|
)
|
|||||
|
Exchanges receivable
|
620
|
|
1,064
|
|
22,074
|
|
|||||
|
Other current assets
|
(51,398
|
)
|
33,233
|
|
8,195
|
|
|||||
|
Other non-current assets
|
7,077
|
|
5,843
|
|
(1,467
|
)
|
|||||
|
Accounts payable
|
21,452
|
|
(66,936
|
)
|
(16,024
|
)
|
|||||
|
Accounts payable to related companies
|
5,857
|
|
(9,939
|
)
|
4,184
|
|
|||||
|
Exchanges payable
|
1,954
|
|
(3,841
|
)
|
(35,433
|
)
|
|||||
|
Accrued and other current liabilities
|
84,704
|
|
72,669
|
|
(101,927
|
)
|
|||||
|
Other non-current liabilities
|
(118
|
)
|
442
|
|
1,401
|
|
|||||
|
Price risk management assets and liabilities, net
|
54,752
|
|
146,438
|
|
(130,157
|
)
|
|||||
|
Net change in operating assets and liabilities, net of effects of acquisitions
|
$
|
158,148
|
|
$
|
259,543
|
|
$
|
(348,636
|
)
|
||
Non-cash investing and financing activities and supplemental cash flow information were as follows:
|
|
Years Ended December 31,
|
||||||||||
|
|
2011
|
2010
|
2009
|
||||||||
|
NON-CASH INVESTING ACTIVITIES:
|
|||||||||||
|
Accrued capital expenditures
|
$
|
225,827
|
|
$
|
108,076
|
|
$
|
46,134
|
|
||
|
Gain from subsidiary common unit transactions
|
$
|
153,039
|
|
$
|
352,307
|
|
$
|
96,996
|
|
||
|
NON-CASH FINANCING ACTIVITIES:
|
|||||||||||
|
Long-term debt assumed and non-compete agreement notes payable issued from acquisitions
|
$
|
4,166
|
|
$
|
1,242,604
|
|
$
|
26,237
|
|
||
|
Subsidiary issuance of Common Units in connection with certain acquisitions
|
$
|
3,000
|
|
$
|
584,436
|
|
$
|
63,339
|
|
||
|
SUPPLEMENTAL CASH FLOW INFORMATION:
|
|||||||||||
|
Cash paid for interest, net of interest capitalized
|
$
|
728,112
|
|
$
|
547,286
|
|
$
|
440,492
|
|
||
|
Cash paid for income taxes
|
$
|
26,603
|
|
$
|
9,188
|
|
$
|
15,447
|
|
||
Marketable Securities
Marketable securities are classified as available-for-sale securities and are reflected as current assets on the consolidated balance sheets at fair value.
Accounts Receivable
Our subsidiaries assess the credit risk of their customers. Certain of our subsidiaries deal with counterparties that are typically either investment grade or are otherwise secured with a letter of credit or other form of security (corporate guarantee prepayment, master setoff agreement or collateral). Management reviews accounts receivable and an allowance for doubtful accounts is determined based on the overall creditworthiness of customers, historical write-off experience, general and specific economic trends, and specific identification.
F - 13
Inventories
Inventories consist principally of natural gas held in storage valued at the lower of cost or market utilizing the weighted-average cost method. Propane inventories are also valued at the lower of cost or market utilizing the weighted-average cost of propane delivered to the customer service locations, including storage fees and inbound freight costs. The cost of appliances, parts and fittings is determined by the first-in, first-out method.
Inventories consisted of the following:
|
|
December 31,
|
||||||
|
|
2011
|
2010
|
|||||
|
Natural gas and NGLs, excluding propane
|
$
|
146,132
|
|
$
|
170,179
|
|
|
|
Propane
|
86,958
|
|
76,341
|
|
|||
|
Appliances, parts and fittings and other
|
94,873
|
|
119,864
|
|
|||
|
Total inventories
|
$
|
327,963
|
|
$
|
366,384
|
|
|
ETP utilizes commodity derivatives to manage price volatility associated with its natural gas inventory and designates certain of these derivatives as fair value hedges for accounting purposes. Changes in fair value of the designated hedged inventory have been recorded in inventory on our consolidated balance sheets and in cost of products sold in our consolidated statements of operations.
During 2009, ETP recorded lower of cost or market adjustments of
$54.0 million
and fair value adjustments related to its application of fair value hedging of
$66.1 million
. No lower of cost or market adjustments were recorded in 2011 or 2010.
Exchanges
Exchanges consist of natural gas and NGL delivery imbalances (over and under deliveries) with others. These amounts, which are valued at market prices or weighted average market prices pursuant to contractual imbalance agreements, turn over monthly and are recorded as exchanges receivable or exchanges payable on our consolidated balance sheets. These imbalances are generally settled by deliveries of natural gas or NGLs, but may be settled in cash, depending on contractual terms.
Other Current Assets
Other current assets consisted of the following:
|
|
December 31,
|
||||||
|
|
2011
|
2010
|
|||||
|
Deposits paid to vendors
|
$
|
66,231
|
|
$
|
52,192
|
|
|
|
Prepaid and other
|
115,673
|
|
57,167
|
|
|||
|
Total other current assets
|
$
|
181,904
|
|
$
|
109,359
|
|
|
Property, Plant and Equipment
Property, plant and equipment are stated at cost less accumulated depreciation. Depreciation is computed using the straight-line method over the estimated useful or Federal Energy Regulatory Commission (“FERC”) mandated lives of the assets. Expenditures for maintenance and repairs that do not add capacity or extend the useful life are expensed as incurred. Expenditures to refurbish assets that either extend the useful lives of the asset or prevent environmental contamination are capitalized and depreciated over the remaining useful life of the asset. Natural gas and NGLs used to maintain pipeline minimum pressures is capitalized and classified as property, plant and equipment. Additionally, our subsidiaries capitalize certain costs directly related to the construction of assets including internal labor costs, interest and engineering costs. Upon disposition or retirement of pipeline components or natural gas plant components, any gain or loss is recorded to accumulated depreciation. When entire pipeline systems, gas plants or other property and equipment are retired or sold, any gain or loss is included in our consolidated statements of operations.
We and our subsidiaries review property, plant and equipment for impairment whenever events or changes in circumstances indicate that the carrying amount of such assets may not be recoverable. If such a review should indicate that the carrying
F - 14
amount of long-lived assets is not recoverable, we reduce the carrying amount of such assets to fair value.
No
impairment of long-lived assets was required during the periods presented.
Capitalized interest is included for pipeline construction projects, except for interstate projects for which an allowance for funds used during construction (“AFUDC”) is accrued. Interest is capitalized based on the current borrowing rate of ETP’s revolving credit facility when the related costs are incurred. AFUDC is calculated under guidelines prescribed by the FERC and capitalized as part of the cost of utility plant for interstate projects. It represents the cost of servicing the capital invested in construction work-in-process. AFUDC is segregated into two component parts - borrowed funds and equity funds.
Components and useful lives of property, plant and equipment were as follows:
|
|
December 31,
|
||||||
|
|
2011
|
2010
|
|||||
|
Land and improvements
|
$
|
137,352
|
|
$
|
103,325
|
|
|
|
Buildings and improvements (10 to 83 years)
|
278,829
|
|
383,274
|
|
|||
|
Pipelines and equipment (10 to 83 years)
|
11,358,550
|
|
9,709,568
|
|
|||
|
Natural gas and NGL storage facilities (40 years)
(1)
|
789,612
|
|
100,909
|
|
|||
|
Bulk storage, equipment and facilities (5 to 83 years)
|
976,882
|
|
736,520
|
|
|||
|
Tanks and other equipment (10 to 30 years)
|
643,527
|
|
623,126
|
|
|||
|
Vehicles (3 to 33 years)
|
230,609
|
|
200,702
|
|
|||
|
Right of way (20 to 83 years)
|
793,232
|
|
637,930
|
|
|||
|
Furniture and fixtures (3 to 33 years)
|
48,466
|
|
41,205
|
|
|||
|
Linepack
|
58,982
|
|
55,744
|
|
|||
|
Pad gas
|
57,907
|
|
57,907
|
|
|||
|
Other (5 to 33 years)
|
234,440
|
|
189,103
|
|
|||
|
Construction work-in-process
|
920,951
|
|
445,117
|
|
|||
|
16,529,339
|
|
13,284,430
|
|
||||
|
Less - Accumulated depreciation
|
(1,970,777
|
)
|
(1,431,698
|
)
|
|||
|
Property, plant and equipment, net
|
$
|
14,558,562
|
|
$
|
11,852,732
|
|
|
(1)
Includes
$682.4 million
of natural gas liquids storage facilities acquired in connection with the LDH Acquisition described in Note 3.
We recognized the following amounts of depreciation expense and capitalized interest expense for the periods presented:
|
|
Years Ended December 31,
|
||||||||||
|
|
2011
|
2010
|
2009
|
||||||||
|
Depreciation expense
|
$
|
556,569
|
|
$
|
394,698
|
|
$
|
304,129
|
|
||
|
Capitalized interest, excluding AFUDC
|
$
|
12,630
|
|
$
|
4,071
|
|
$
|
11,791
|
|
||
Advances to and Investments in Affiliates
Certain of our subsidiaries own interests in a number of related businesses that are accounted for by the equity method. In general, we use the equity method of accounting for an investment in which we have a
20%
to
50%
ownership and exercise significant influence over, but do not control the investee’s operating and financial policies.
See Note
4
for a discussion of these joint ventures.
F - 15
Goodwill
In September 2011, the Financial Accounting Standards Board (“FASB”) issued Accounting Standards Update No. 2011-08,
Intangibles - Goodwill and Other (Topic 350): Testing Goodwill for Impairment
(“ASU 2011-08”), which simplified how entities test goodwill for impairment. ASU 2011-08 gives entities the option, under certain circumstances, to first assess qualitative factors to determine whether it is more likely than not that the fair value of a reporting unit is less than its carrying amount as a basis for determining whether further impairment testing is necessary. ASU 2011-08 was effective for fiscal years beginning after December 15, 2011, and early adoption was permitted. We adopted and applied this standard to our annual impairment tests performed for certain reporting units during the year ended December 31, 2011. There was no material impact to our financial position or results of operations as a result of the adoption of this standard.
Goodwill is tested for impairment annually or more frequently if circumstances indicate that goodwill might be impaired. Our annual impairment test is performed as of December 31 for reporting units within ETP's interstate transportation and NGL transportation and services operations and for all of Regency's reporting units. Our annual impairment test is performed as of August 31 for all other reporting units.
No
goodwill impairments were recorded for the periods presented in these consolidated financial statements.
Changes in the carrying amount of goodwill were as follows:
|
Investment in
ETP
|
Investment in
Regency
|
Corporate
and Other
|
Total
|
||||||||||||
|
Balance, December 31, 2009
|
$
|
745,505
|
|
$
|
—
|
|
$
|
29,589
|
|
$
|
775,094
|
|
|||
|
Goodwill acquired
|
36,460
|
|
789,789
|
|
—
|
|
826,249
|
|
|||||||
|
Other
|
(732
|
)
|
—
|
|
—
|
|
(732
|
)
|
|||||||
|
Balance, December 31, 2010
|
781,233
|
|
789,789
|
|
29,589
|
|
1,600,611
|
|
|||||||
|
Goodwill acquired
|
438,364
|
|
—
|
|
—
|
|
438,364
|
|
|||||||
|
Balance, December 31, 2011
|
$
|
1,219,597
|
|
$
|
789,789
|
|
$
|
29,589
|
|
$
|
2,038,975
|
|
|||
Goodwill is recorded at the acquisition date based on a preliminary purchase price allocation and generally may be adjusted when the purchase price allocation is finalized. A net increase in goodwill of
$825.5 million
was recorded during the year ended December 31, 2010, primarily due to
$789.8 million
from the Regency Transactions, in addition to
$27.3 million
of goodwill ETP recorded from its acquisition of the natural gas gathering company. A net increase in goodwill of
$438.4 million
was recorded during the year ended December 31, 2011, primarily due to
$432.0 million
of goodwill recorded by ETP in connection with Lone Star's acquisition of LDH. See further discussion in Note
3
.
F - 16
Intangible Assets
Intangible assets are stated at cost, net of amortization computed on the straight-line method. We eliminate from our consolidated balance sheets the gross carrying amount and the related accumulated amortization for any fully amortized intangibles in the year they are fully amortized. Components and useful lives of intangible assets were as follows:
|
|
December 31, 2011
|
December 31, 2010
|
|||||||||||||
|
|
Gross Carrying
Amount
|
Accumulated
Amortization
|
Gross Carrying
Amount
|
Accumulated
Amortization
|
|||||||||||
|
Amortizable intangible assets:
|
|||||||||||||||
|
Customer relationships, contracts and agreements (3 to 46 years)
|
$
|
1,058,662
|
|
$
|
(134,909
|
)
|
$
|
971,657
|
|
$
|
(88,583
|
)
|
|||
|
Trade names (20 years)
|
65,500
|
|
(5,185
|
)
|
65,500
|
|
(1,910
|
)
|
|||||||
|
Noncompete agreements (3 to 15 years)
|
15,431
|
|
(7,835
|
)
|
21,165
|
|
(11,888
|
)
|
|||||||
|
Patents (9 years)
|
750
|
|
(201
|
)
|
750
|
|
(118
|
)
|
|||||||
|
Other (10 to 15 years)
|
1,320
|
|
(581
|
)
|
1,320
|
|
(492
|
)
|
|||||||
|
Total amortizable intangible assets
|
1,141,663
|
|
(148,711
|
)
|
1,060,392
|
|
(102,991
|
)
|
|||||||
|
Non-amortizable intangible assets:
|
|||||||||||||||
|
Trademarks
|
79,339
|
|
—
|
|
77,445
|
|
—
|
|
|||||||
|
Total intangible assets
|
$
|
1,221,002
|
|
$
|
(148,711
|
)
|
$
|
1,137,837
|
|
$
|
(102,991
|
)
|
|||
We recorded the following intangible assets in conjunction with the Regency Transactions:
|
Amortizable intangible assets:
|
|||
|
Customer relationships, contracts and agreements (30 years)
|
$
|
600,860
|
|
|
Trade names (20 years)
|
65,500
|
|
|
|
Total intangible and other assets acquired
|
$
|
666,360
|
|
During 2011, in connection with the LDH Acquisition, ETP recorded customer contracts of
$81.0 million
with useful lives ranging from
3
to
15
years. See discussions of amounts recorded in the Regency Transactions and the LDH Acquisition at Note
3
.
Aggregate amortization expense of intangibles assets was as follows:
|
|
Years Ended December 31,
|
||||||||||
|
|
2011
|
2010
|
2009
|
||||||||
|
Reported in depreciation and amortization
|
$
|
54,655
|
|
$
|
35,602
|
|
$
|
20,895
|
|
||
Estimated aggregate amortization expense of intangible assets for the next five years was as follows:
|
Years Ending December 31:
|
|
||
|
2012
|
$
|
44,793
|
|
|
2013
|
40,871
|
|
|
|
2014
|
39,746
|
|
|
|
2015
|
39,746
|
|
|
|
2016
|
39,746
|
|
|
Amortizable intangible assets with a gross carrying amount of approximately
$127.7 million
as of December 31, 2011 were deconsolidated in January 2012 in connection with the contribution of ETP's propane operations as described in Note 3. Amounts reflected above do not include any future amortization related to these deconsolidated assets.
F - 17
We review amortizable intangible assets for impairment whenever events or changes in circumstances indicate that the carrying amount of such assets may not be recoverable. If such a review should indicate that the carrying amount of amortizable intangible assets is not recoverable, we reduce the carrying amount of such assets to fair value. We review non-amortizable intangible assets for impairment annually, or more frequently if circumstances dictate. Our annual impairment test is performed as of August 31 for reporting units within ETP and as of December 31 for Regency’s reporting units.
No
impairment of intangible assets was required during the periods presented in these consolidated financial statements.
Other Non-Current Assets, net
Other non-current assets, net are stated at cost less accumulated amortization. Other non-current assets, net consisted of the following:
|
December 31,
|
|||||||
|
2011
|
2010
|
||||||
|
Unamortized financing costs (3 to 30 years)
|
$
|
132,375
|
|
$
|
98,067
|
|
|
|
Regulatory assets
|
88,993
|
|
92,939
|
|
|||
|
Other
|
27,542
|
|
34,575
|
|
|||
|
Total other non-current assets, net
|
$
|
248,910
|
|
$
|
225,581
|
|
|
Asset Retirement Obligation
Our subsidiaries have determined that they are obligated by contractual or regulatory requirements to remove facilities or perform other remediation upon retirement of certain assets. Determination of the amounts to be recognized is based upon numerous estimates and assumptions, including expected settlement dates, future retirement costs, future inflation rates and the credit-adjusted risk-free interest rates. However, ETP’s and Regency’s management were not able to reasonably measure the fair value of the asset retirement obligations as of
December 31, 2011
or
2010
because the settlement dates were indeterminable. ETP and Regency will record an asset retirement obligation in the periods in which management can reasonably determine the settlement dates.
Accrued and Other Current Liabilities
Accrued and other current liabilities consisted of the following:
|
|
December 31,
|
||||||
|
|
2011
|
2010
|
|||||
|
Interest payable
|
$
|
204,182
|
|
$
|
191,466
|
|
|
|
Customer advances and deposits
|
100,525
|
|
111,448
|
|
|||
|
Accrued capital expenditures
|
228,877
|
|
87,260
|
|
|||
|
Accrued wages and benefits
|
80,205
|
|
76,592
|
|
|||
|
Taxes payable other than income taxes
|
79,331
|
|
36,204
|
|
|||
|
Income taxes payable
|
14,781
|
|
8,344
|
|
|||
|
Other
|
56,011
|
|
56,374
|
|
|||
|
Total accrued and other current liabilities
|
$
|
763,912
|
|
$
|
567,688
|
|
|
Deposits or advances are received from ETP and Regency’s customers as prepayments for natural gas deliveries in the following month and from ETP’s propane customers as security or prepayments for future propane deliveries. Prepayments and security deposits may also be required when customers exceed their credit limits or do not qualify for open credit.
F - 18
Fair Value of Financial Instruments
The carrying amounts of cash and cash equivalents, accounts receivable and accounts payable approximate their fair value. Price risk management assets and liabilities are recorded at fair value.
Based on the estimated borrowing rates currently available to us and our subsidiaries for loans with similar terms and average maturities, the aggregate fair value and carrying amount of our consolidated debt obligations as of
December 31, 2011
was
$12.21 billion
and
$11.37 billion
, respectively. As of
December 31, 2010
, the aggregate fair value and carrying amount of our consolidated debt obligations was
$10.23 billion
and
$9.38 billion
, respectively.
We have marketable securities, commodity derivatives, interest rate derivatives, the Preferred Units and embedded derivatives in the Preferred Units of a Subsidiary (the “Regency Preferred Units”) that are accounted for as assets and liabilities at fair value in our consolidated balance sheets. We determine the fair value of our assets and liabilities subject to fair value measurement by using the highest possible “level” of inputs. Level 1 inputs are observable quotes in an active market for identical assets and liabilities. We consider the valuation of marketable securities and commodity derivatives transacted through a clearing broker with a published price from the appropriate exchange as a Level 1 valuation. Level 2 inputs are inputs observable for similar assets and liabilities. We consider over-the-counter (“OTC”) commodity derivatives entered into directly with third parties as a Level 2 valuation since the values of these derivatives are quoted on an exchange for similar transactions. Additionally, we consider our options transacted through our clearing broker as having Level 2 inputs due to the level of activity of these contracts on the exchange in which they trade. We consider the valuation of our interest rate derivatives as Level 2 as the primary input, the LIBOR curve, is based on quotes from an active exchange of Eurodollar futures for the same period as the future interest swap settlements. Level 3 inputs are unobservable. Derivatives related to the Regency Preferred Units are valued using a binomial lattice model. The market inputs utilized in the model include credit spread, probabilities of the occurrence of certain events, common unit price, dividend yield, and expected value, and are considered Level 3. The fair value of the Preferred Units was based predominantly on an income approach model and is also considered Level 3.
F - 19
The following tables summarize the fair value of our financial assets and liabilities measured and recorded at fair value on a recurring basis as of
December 31, 2011
and
2010
based on inputs used to derive their fair values:
|
|
Fair Value Measurements at
December 31, 2011 Using |
||||||||||||||
|
|
Fair Value
Total
|
Level 1
|
Level 2
|
Level 3
|
|||||||||||
|
Assets:
|
|||||||||||||||
|
Marketable securities
|
$
|
1,229
|
|
$
|
1,229
|
|
$
|
—
|
|
$
|
—
|
|
|||
|
Interest rate derivatives
|
36,301
|
|
—
|
|
36,301
|
|
—
|
|
|||||||
|
Commodity derivatives:
|
|||||||||||||||
|
Condensate — Forward Swaps
|
538
|
|
—
|
|
538
|
|
—
|
|
|||||||
|
Natural Gas:
|
|||||||||||||||
|
Basis Swaps IFERC/NYMEX
|
62,924
|
|
62,924
|
|
—
|
|
—
|
|
|||||||
|
Swing Swaps IFERC
|
15,002
|
|
1,687
|
|
13,315
|
|
—
|
|
|||||||
|
Fixed Swaps/Futures
|
218,479
|
|
214,572
|
|
3,907
|
|
—
|
|
|||||||
|
Options — Puts
|
6,435
|
|
—
|
|
6,435
|
|
—
|
|
|||||||
|
Forward Physical Swaps
|
699
|
|
—
|
|
699
|
|
—
|
|
|||||||
|
NGLs:
|
|||||||||||||||
|
Forward Swaps
|
94
|
|
—
|
|
94
|
|
—
|
|
|||||||
|
Options — Puts
|
309
|
|
—
|
|
309
|
|
—
|
|
|||||||
|
Propane — Forward Swaps
|
9
|
|
—
|
|
9
|
|
—
|
|
|||||||
|
Total commodity derivatives
|
304,489
|
|
279,183
|
|
25,306
|
|
—
|
|
|||||||
|
Total Assets
|
$
|
342,019
|
|
$
|
280,412
|
|
$
|
61,607
|
|
$
|
—
|
|
|||
|
Liabilities:
|
|||||||||||||||
|
Interest rate derivatives
|
$
|
(117,490
|
)
|
$
|
—
|
|
$
|
(117,490
|
)
|
$
|
—
|
|
|||
|
Series A Convertible Preferred Units
|
(322,910
|
)
|
—
|
|
—
|
|
(322,910
|
)
|
|||||||
|
Embedded derivatives in the Regency Preferred Units
|
(39,049
|
)
|
—
|
|
—
|
|
(39,049
|
)
|
|||||||
|
Commodity derivatives:
|
|||||||||||||||
|
Condensate — Forward Swaps
|
(1,567
|
)
|
—
|
|
(1,567
|
)
|
—
|
|
|||||||
|
Natural Gas:
|
|||||||||||||||
|
Basis Swaps IFERC/NYMEX
|
(82,290
|
)
|
(82,290
|
)
|
—
|
|
—
|
|
|||||||
|
Swing Swaps IFERC
|
(16,074
|
)
|
(3,061
|
)
|
(13,013
|
)
|
—
|
|
|||||||
|
Fixed Swaps/Futures
|
(148,111
|
)
|
(148,111
|
)
|
—
|
|
—
|
|
|||||||
|
Options — Calls
|
(12
|
)
|
—
|
|
(12
|
)
|
—
|
|
|||||||
|
Forward Physical Swaps
|
(712
|
)
|
—
|
|
(712
|
)
|
—
|
|
|||||||
|
NGLs — Forward Swaps
|
(8,561
|
)
|
—
|
|
(8,561
|
)
|
—
|
|
|||||||
|
Propane — Forward Swaps
|
(4,131
|
)
|
—
|
|
(4,131
|
)
|
—
|
|
|||||||
|
Total commodity derivatives
|
(261,458
|
)
|
(233,462
|
)
|
(27,996
|
)
|
—
|
|
|||||||
|
Total Liabilities
|
$
|
(740,907
|
)
|
$
|
(233,462
|
)
|
$
|
(145,486
|
)
|
$
|
(361,959
|
)
|
|||
F - 20
|
|
Fair Value Measurements at
December 31, 2010 Using |
||||||||||||||
|
|
Fair Value
Total
|
Level 1
|
Level 2
|
Level 3
|
|||||||||||
|
Assets:
|
|||||||||||||||
|
Marketable securities
|
$
|
2,032
|
|
$
|
2,032
|
|
$
|
—
|
|
$
|
—
|
|
|||
|
Interest rate derivatives
|
20,790
|
|
—
|
|
20,790
|
|
—
|
|
|||||||
|
Commodity derivatives:
|
|||||||||||||||
|
Natural Gas:
|
|||||||||||||||
|
Basis Swaps IFERC/NYMEX
|
15,756
|
|
15,756
|
|
—
|
|
—
|
|
|||||||
|
Swing Swaps IFERC
|
1,682
|
|
1,562
|
|
120
|
|
—
|
|
|||||||
|
Fixed Swaps/Futures
|
44,955
|
|
42,474
|
|
2,481
|
|
—
|
|
|||||||
|
Options — Calls
|
75
|
|
—
|
|
75
|
|
—
|
|
|||||||
|
Options — Puts
|
26,241
|
|
—
|
|
26,241
|
|
—
|
|
|||||||
|
NGLs — Forward Swaps
|
192
|
|
—
|
|
192
|
|
—
|
|
|||||||
|
Propane — Forward Swaps
|
6,864
|
|
—
|
|
6,864
|
|
—
|
|
|||||||
|
Total commodity derivatives
|
95,765
|
|
59,792
|
|
35,973
|
|
—
|
|
|||||||
|
Total Assets
|
$
|
118,587
|
|
$
|
61,824
|
|
$
|
56,763
|
|
$
|
—
|
|
|||
|
Liabilities:
|
|||||||||||||||
|
Interest rate derivatives
|
$
|
(20,922
|
)
|
$
|
—
|
|
$
|
(20,922
|
)
|
$
|
—
|
|
|||
|
Series A Convertible Preferred Units
|
(317,600
|
)
|
—
|
|
—
|
|
(317,600
|
)
|
|||||||
|
Embedded derivatives in the Regency Preferred Units
|
(57,023
|
)
|
—
|
|
—
|
|
(57,023
|
)
|
|||||||
|
Commodity derivatives:
|
|||||||||||||||
|
Natural Gas:
|
|||||||||||||||
|
Basis Swaps IFERC/NYMEX
|
(17,372
|
)
|
(17,372
|
)
|
—
|
|
—
|
|
|||||||
|
Swing Swaps IFERC
|
(3,768
|
)
|
(3,520
|
)
|
(248
|
)
|
—
|
|
|||||||
|
Fixed Swaps/Futures
|
(42,252
|
)
|
(41,825
|
)
|
(427
|
)
|
—
|
|
|||||||
|
Options — Calls
|
(2,643
|
)
|
—
|
|
(2,643
|
)
|
—
|
|
|||||||
|
Options — Puts
|
(7
|
)
|
—
|
|
(7
|
)
|
—
|
|
|||||||
|
NGLs — Forward Swaps
|
(10,684
|
)
|
—
|
|
(10,684
|
)
|
—
|
|
|||||||
|
WTI Crude Oil
|
(3,581
|
)
|
—
|
|
(3,581
|
)
|
—
|
|
|||||||
|
Total commodity derivatives
|
(80,307
|
)
|
(62,717
|
)
|
(17,590
|
)
|
—
|
|
|||||||
|
Total Liabilities
|
$
|
(475,852
|
)
|
$
|
(62,717
|
)
|
$
|
(38,512
|
)
|
$
|
(374,623
|
)
|
|||
The following table presents a reconciliation of the beginning and ending balances for our Level 3 financial instruments measured at fair value on a recurring basis using significant unobservable inputs for the year ended
December 31, 2011
. There were no transfers between the fair value hierarchy levels during the years ended
December 31, 2011
or
2010
.
|
Net liability balance, December 31, 2010
|
$
|
(374,623
|
)
|
|
Net unrealized gains included in other income (expense)
|
12,664
|
|
|
|
Net liability balance, December 31, 2011
|
$
|
(361,959
|
)
|
Prior to the Regency Transactions in 2010, ETP adjusted the investment in MEP to fair value based on the present value of expected future cash flows (Level 3), resulting in a nonrecurring fair value adjustment of
$52.6 million
. See Note
4
.
F - 21
Shipping and Handling Costs
Shipping and handling costs related to fuel sold are included in cost of products sold. ETP’s shipping and handling costs related to fuel consumed for compression and treating are included in operating expenses and totaled
$40.4 million
,
$43.3 million
and
$55.9 million
for the years ended
December 31, 2011
,
2010
and
2009
, respectively. ETP does not separately charge propane shipping and handling costs to customers.
Costs and Expenses
Costs of products sold include actual cost of fuel sold, adjusted for the effects of hedging and other commodity derivative activities, storage fees and inbound freight on propane, and the cost of appliances, parts and fittings. Operating expenses include all costs incurred to provide products to customers, including compensation for operations personnel, insurance costs, vehicle maintenance, advertising costs, shipping and handling costs related to propane, purchasing costs and plant operations. Selling, general and administrative expenses include all partnership related expenses and compensation for executive, partnership, and administrative personnel.
We record the collection of taxes to be remitted to governmental authorities on a net basis.
Issuances of Subsidiary Units
We record changes in our ownership interest of our subsidiaries as equity transactions, with no gain or loss recognized in consolidated net income or comprehensive income. For example, upon ETP’s or Regency’s issuance of respective ETP or Regency Common Units in a public offering, we record any difference between the amount of consideration received or paid and the amount by which the noncontrolling interest is adjusted as a change in partners’ capital.
Income Taxes
ETE is a limited partnership. As a result, our earnings or losses, to the extent not included in a taxable subsidiary, for federal and state income tax purposes are included in the tax returns of the individual partners. Net earnings for financial statement purposes may differ significantly from taxable income reportable to Unitholders as a result of differences between the tax basis and financial reporting basis of assets and liabilities, in addition to the allocation requirements related to taxable income under our Third Amended and Restated Agreement of Limited Partnership (the “Partnership Agreement”).
As a limited partnership, we are generally not subject to income tax. We are, however, subject to a statutory requirement that our non-qualifying income (including income such as derivative gains from trading activities, service income, tank rentals and others) cannot exceed
10%
of our total gross income, determined on a calendar year basis under the applicable income tax provisions. If the amount of our non-qualifying income exceeds this statutory limit, we would be taxed as a corporation. Accordingly, certain activities that generate non-qualifying income are conducted through taxable corporate subsidiaries (“C corporations”). These C corporations are subject to federal and state income tax and pay the income taxes related to the results of their operations. For the years ended
December 31, 2011
,
2010
and
2009
, our non-qualifying income did not exceed the statutory limit.
Those subsidiaries which are taxable corporations follow the asset and liability method of accounting for income taxes, under which deferred income taxes are recorded based upon differences between the financial reporting and tax basis of assets and liabilities and are measured using the enacted tax rates and laws that will be in effect when the underlying assets are received and liabilities settled.
The effective tax rate differs from the statutory rate due primarily to Partnership earnings that are generally not subject to federal and state income taxes at the Partnership level.
F - 22
The components of the federal and state income tax expense (benefit) of our taxable subsidiaries are summarized as follows:
|
|
Years Ended December 31,
|
||||||||||
|
|
2011
|
2010
|
2009
|
||||||||
|
Current expense (benefit):
|
|||||||||||
|
Federal
|
$
|
(842
|
)
|
$
|
1,602
|
|
$
|
(8,850
|
)
|
||
|
State
|
16,883
|
|
8,594
|
|
9,657
|
|
|||||
|
Total
|
16,041
|
|
10,196
|
|
807
|
|
|||||
|
Deferred expense (benefit):
|
|||||||||||
|
Federal
|
416
|
|
2,788
|
|
8,643
|
|
|||||
|
State
|
426
|
|
754
|
|
(221
|
)
|
|||||
|
Total
|
842
|
|
3,542
|
|
8,422
|
|
|||||
|
Total income tax expense
|
$
|
16,883
|
|
$
|
13,738
|
|
$
|
9,229
|
|
||
As of
December 31, 2011
and
2010
, we had net deferred income tax liabilities of
$217.2 million
and
$213.9 million
, respectively, recorded in other non-current liabilities in our consolidated balance sheets. Substantially all of our deferred tax liability relates to property, plant and equipment, including
$146.6 million
and
$143.9 million
as of
December 31, 2011
and
2010
, respectively, and basis differences associated with ETP’s Class E Units of
$72.2 million
and
$70.2 million
as of
December 31, 2011
and
2010
, respectively. As of
December 31, 2011
and
2010
, we had deferred income tax liabilities of
$0.1 million
and
$0.4 million
, respectively, recorded in accrued and other current liabilities in our consolidated balance sheets.
Accounting for Derivative Instruments and Hedging Activities
For qualifying hedges, we formally document, designate and assess the effectiveness of transactions that receive hedge accounting treatment and the gains and losses offset related results on the hedged item in the statement of operations. The market prices used to value our financial derivatives and related transactions have been determined using independent third party prices, readily available market information, broker quotes and appropriate valuation techniques.
At inception of a hedge, we formally document the relationship between the hedging instrument and the hedged item, the risk management objectives, and the methods used for assessing and testing effectiveness and how any ineffectiveness will be measured and recorded. We also assess, both at the inception of the hedge and on a quarterly basis, whether the derivatives that are used in our hedging transactions are highly effective in offsetting changes in cash flows. If we determine that a derivative is no longer highly effective as a hedge, we discontinue hedge accounting prospectively by including changes in the fair value of the derivative in net income for the period.
If we designate a hedging relationship as a fair value hedge, we record the changes in fair value of the hedged asset or liability in cost of products sold in the consolidated statement of operations. This amount is offset by the changes in fair value of the related hedging instrument. Any ineffective portion or amount excluded from the assessment of hedge ineffectiveness is also included in the cost of products sold in the consolidated statement of operations.
Cash flows from derivatives accounted for as cash flow hedges are reported as cash flows from operating activities, in the same category as the cash flows from the items being hedged.
If we designate a derivative financial instrument as a cash flow hedge and it qualifies for hedge accounting, a change in the fair value is deferred in Accumulated Other Comprehensive Income (“AOCI”) until the underlying hedged transaction occurs. Any ineffective portion of a cash flow hedge’s change in fair value is recognized each period in earnings. Gains and losses deferred in AOCI related to cash flow hedges remain in AOCI until the underlying physical transaction occurs, unless it is probable that the forecasted transaction will not occur by the end of the originally specified time period or within an additional two-month period of time thereafter. For financial derivative instruments that do not qualify for hedge accounting, the change in fair value is recorded in cost of products sold in the consolidated statements of operations.
F - 23
We previously have managed a portion of our interest rate exposures by utilizing interest rate swaps and similar instruments. Certain of our interest rate derivatives are accounted for as either cash flow hedges or fair value hedges. For interest rate derivatives accounted for as either cash flow or fair value hedges, we report realized gains and losses and ineffectiveness portions of those hedges in interest expense. For interest rate derivatives not designated as hedges for accounting purposes, we report realized and unrealized gains and losses on those derivatives in “Gains (losses) on non-hedged interest rate derivatives” in the consolidated statements of operations. See Note
11
for additional information related to interest rate derivatives.
Allocation of Income (Loss)
For purposes of maintaining partner capital accounts, our Partnership Agreement specifies that items of income and loss shall generally be allocated among the partners in accordance with their percentage interests (see Note
8
).
3.
ACQUISITIONS AND RELATED TRANSACTIONS
:
Pending Southern Union Acquisition
On July 19, 2011, we entered into a Second Amended and Restated Plan of Merger (the “SUG Merger Agreement”) with Sigma Acquisition Corporation, a Delaware corporation and our wholly-owned subsidiary (“Merger Sub”), and Southern Union Company, a Delaware corporation (“SUG”). The SUG Merger Agreement modifies certain terms of the Amended and Restated Agreement and Plan of Merger entered into by us, Merger Sub and SUG on July 4, 2011 (the "First Amended Merger Agreement"). Under the terms of the SUG Merger Agreement, Merger Sub will merge with and into SUG, with SUG continuing as the surviving entity and becoming our wholly-owned subsidiary (the “SUG Merger”) subject to certain conditions to close. Pursuant to the SUG Merger Agreement, ETE will acquire all of the outstanding shares of SUG in a transaction valued at
$9.4 billion
at the time of the execution of the SUG Merger Agreement, including
$5.7 billion
in cash and ETE Common Units and
$3.7 billion
of existing SUG indebtedness. Stockholders of SUG may elect to exchange each share of SUG stock for either
$44.25
in cash or
1.00
ETE Common Unit. The maximum cash component is
60%
of the aggregate consideration and the common unit component can fluctuate between
40%
and
50%
. Elections in excess of either the cash or common unit limits will be subject to proration.
Consummation of the SUG Merger is subject to customary conditions, including, without limitation: (i) the adoption of the SUG Merger Agreement by the stockholders of SUG, (ii) the receipt of required approvals from the Federal Energy Regulatory Commission (“FERC”), the Missouri Public Service Commission and, if required, the Massachusetts Department of Public Utilities, (iii) the effectiveness of a registration statement on Form S-4 relating to the ETE Common Units to be issued in the SUG Merger, and (iv) the absence of any law, injunction, judgment or ruling prohibiting or restraining the SUG Merger or making the consummation of the SUG Merger illegal. On July 28, 2011, the waiting period applicable to the SUG Merger under the Hart-Scott-Rodino Antitrust Improvements Act of 1976, as amended (the "HSR Act") expired. On September 23, 2011, the FERC issued a letter order authorizing the transfer of FERC-jurisdictional facilities resulting from the SUG Merger. On October 27, 2011, the registration statement on Form S-4 was declared effective by the SEC. On December 9, 2011, the special meeting of the SUG stockholders was held and the SUG stockholders voted to approve the SUG Merger. We and SUG have made filings with the Missouri Public Service Commission and expect to receive its approval of the SUG Merger in the first quarter of 2012.
Citrus Transaction
On July 19, 2011, ETP entered into an Amended and Restated Agreement and Plan of Merger with us (the “Citrus Merger Agreement”). The Citrus Merger Agreement modifies certain terms of the Agreement and Plan of Merger entered into by ETP and us on July 4, 2011. Pursuant to the terms of the SUG Merger Agreement, immediately prior to the effective time of the SUG Merger, we will assign and SUG will assume the benefits and obligations of us under the Amended Citrus Merger Agreement. If ETP does not consummate the Citrus Acquisition on or before April 17, 2012, or the Citrus Merger Agreement is terminated at any time on or before such time, ETP must redeem the notes at a redemption price equal to 101% of the aggregate principal amount of the notes, plus accrued and unpaid interest, if any, to, but excluding, the redemption date.
Under the Amended Citrus Merger Agreement, it is anticipated that SUG will cause the contribution to ETP of a
50%
interest in Citrus Corp., which owns
100%
of the Florida Gas Transmission pipeline system and is currently jointly owned by SUG and El Paso Corporation (“El Paso”) (the “Citrus Acquisition”). The Citrus Acquisition will be effected through the merger of Citrus ETP Acquisition, L.L.C., a Delaware limited liability company and wholly-owned subsidiary of ETP, with and into CrossCountry Energy, LLC, a Delaware limited liability company and wholly-owned subsidiary of SUG that indirectly owns a
50%
interest in Citrus Corp. (“CrossCountry”). In exchange for the interest in Citrus Corp., SUG will receive approximately
$2.0 billion
, consisting of approximately
$1.895 billion
in cash and
$105 million
of ETP Common Units,
F - 24
with the value of the ETP Common Units based on the volume-weighted average trading price for the 10 consecutive trading days ending immediately prior to the date that is three trading days prior to the closing date of the Citrus Acquisition. In order to increase the expected accretion to be derived from the Citrus Acquisition, we have agreed to relinquish our rights to approximately
$220 million
of incentive distributions from ETP that we would otherwise be entitled to receive over
16
consecutive quarters following the closing of the transaction.
The Citrus Merger Agreement includes customer representations, warranties and covenants of ETP and us (including representations, warranties and covenants relating to SUG, CrossCountry and certain of CrossCountry’s affiliates). Consummation of the Citrus Acquisition is subject to customary conditions, including, without limitation: (i) satisfaction or waiver of the closing conditions set forth in the SUG Merger Agreement, (ii) the receipt by ETP of any necessary waivers or amendments to its credit agreement, (iii) the amendment of ETP’s partnership agreement to reflect the agreed upon relinquishment by us of incentive distributions from ETP discussed above, and (iv) the absence of any order, decree, injunction or law prohibiting or making the consummation of the transactions contemplated by the Citrus Merger Agreement illegal. The Citrus Merger Agreement contains certain termination rights for both us and ETP, including among others, the right to terminate if the Citrus Acquisition is not completed by December 31, 2012 or if the Merger SUG Agreement is terminated.
Pursuant to the Amended Citrus Merger Agreement, we have granted ETP a right of first offer with respect to any disposition by us or SUG of Southern Union Gas Services, a subsidiary of SUG that owns and operates a natural gas gathering and processing system serving the Permian Basin in West Texas and New Mexico.
On November 17, 2011, CrossCountry filed a petition in the Court of Chancery in the State of Delaware seeking a declaratory judgment against El Paso that El Paso’s right of first refusal under a Capital Stock Agreement (“CSA”) governing the Citrus Corp. joint venture between CrossCountry and El Paso would not be triggered by the Citrus Acquisition. This petition was filed by CrossCountry following an exchange of letters between El Paso and SUG in which El Paso stated that it believed the Citrus Acquisition violated the provisions of the CSA related to transfers of equity interests with respect to Citrus Corp. On December 27, 2011, El Paso filed its answer to CrossCountry’s petition and, in addition, El Paso brought third-party claims against ETP, ETE and SUG. El Paso’s third-party complaint against ETE and ETP seek declaratory relief regarding El Paso’s rights under the CSA. Specifically, El Paso claims that the Citrus Acquisition violates its right of first refusal and seeks rescission of the Citrus Acquisition or, alternatively, damages. The parties are currently engaged in discovery and the case is scheduled to go to trial on April 26, 2012. ETE and ETP believe that El Paso’s assertions related to the Citrus Acquisition under the CSA are without merit.
SUG Merger Financing
We intend to finance a portion of the cash component of the SUG Merger consideration with debt financing. In connection with entering into the merger agreement, we entered into a senior bridge term loan credit agreement (the "Bridge Loan Agreement") with the Bridge Lenders, pursuant to which, subject to the conditions set forth therein, the Bridge Lenders have agreed to provide a 364-day Bridge Term Loan Facility in an aggregate principal amount of
$3.7 billion
. Our ability to borrow under the Bridge Loan Agreement is subject to the satisfaction of certain conditions precedent, including the absence of a material adverse affect on SUG having occurred subsequent to December 31, 2010 and the delivery of certain documents requested by the administrative agent (such as financial statements, favorable opinions of counsel and customary corporate authorization documents) and the payment of relevant fees and expenses. We may use the proceeds of the loans under the Bridge Loan Agreement to finance the SUG Merger, to repay its remaining indebtedness under the Parent Company Credit Agreement (to the extent repaid on the date of initial borrowing under the Bridge Loan Agreement) and to pay transaction costs related to the consummation of the SUG Merger and the Bridge Loan Agreement.
In February 2012, we launched the syndication of a new senior secured credit facility of up to
$2.3 billion
. We intend to use the net proceeds from the senior secured credit facility, along with proceeds received from ETP in the Citrus Acquisition, to fund the cash portion of the SUG Merger and pay related fees and expenses, including existing borrowings under ETE's revolving credit facility and for general partnership purposes. Upon closing, the new senior secured credit facility, combined with proceeds from the Citrus Acquisition, is expected to replace the previously announced
$3.7 billion
Bridge Term Facility.
F - 25
2012 Transaction
Propane Operations
On January 12, 2012, ETP contributed its propane operations, consisting of HOLP and Titan (collectively, the “Propane Business”), to AmeriGas Partners, L.P. (“AmeriGas”). ETP received approximately
$1.46 billion
in cash and approximately
29.6 million
AmeriGas common units. AmeriGas assumed approximately
$71.0 million
of existing HOLP debt. In connection with the closing of this transaction, ETP entered into a support agreement with AmeriGas pursuant to which ETP is obligated to provide contingent, residual support of
$1.5 billion
of intercompany indebtedness owed by AmeriGas to a finance subsidiary that in turn supports the repayment of
$1.5 billion
of senior notes issued by this AmeriGas finance subsidiary to finance the cash portion of the purchase price. Under a unitholder agreement with AmeriGas, ETP is obligated to hold the approximately
29.6 million
AmeriGas common units that it received in this transaction until January 2013.
We have not reflected the Propane operations as discontinued operations as ETP will have a continuing involvement in this business as a result of the investment in AmeriGas that was transferred to ETP as consideration for the transaction.
2011 Transactions
LDH Acquisition
On May 2, 2011, ETP-Regency Midstream Holdings, LLC (“ETP-Regency LLC”), a joint venture owned
70%
by ETP and
30%
by Regency, acquired all of the membership interest in LDH Energy Asset Holdings LLC (“LDH”), from Louis Dreyfus Highbridge Energy LLC (“Louis Dreyfus”) for approximately
$1.98 billion
in cash (the “LDH Acquisition”), including working capital adjustments. ETP contributed approximately
$1.38 billion
to ETP-Regency LLC to fund its
70%
share of the purchase price, while Regency contributed approximately
$592.7 million
to fund its
30%
share of the purchase price. Subsequent to closing, ETP-Regency LLC was renamed Lone Star.
Lone Star owns and operates a natural gas liquids storage, fractionation and transportation business. Lone Star’s storage assets are primarily located in Mont Belvieu, Texas and its West Texas Pipeline transports NGLs through an intrastate pipeline system that originates in the Permian Basin in West Texas, passes through the Barnett Shale production area in North Texas and terminates at the Mont Belvieu storage and fractionation complex. Lone Star also owns and operates fractionation and processing assets located in Louisiana. The acquisition of LDH by Lone Star expands ETP and Regency’s asset portfolios by adding a NGL platform with storage, transportation and fractionation capabilities.
ETP accounted for the LDH Acquisition using the acquisition method of accounting. Lone Star’s results of operations are consolidated into our ETP reporting segment, while Lone Star’s results are recorded as an equity method investment in our Regency reporting segment. Regency’s equity method investment in Lone Star is reflected by ETP as noncontrolling interest attributable to Lone Star. These amounts have been eliminated in our consolidated financial statements.
F - 26
The following table summarizes the assets acquired and liabilities assumed recognized as of the acquisition date:
|
Total current assets
|
$
|
118,177
|
|
|
Property, plant and equipment
(1)
|
1,419,591
|
|
|
|
Goodwill
|
432,026
|
|
|
|
Intangible assets
|
81,000
|
|
|
|
Other assets
|
157
|
|
|
|
2,050,951
|
|
||
|
Total current liabilities
|
74,964
|
|
|
|
Other long-term liabilities
|
438
|
|
|
|
75,402
|
|
||
|
Total consideration
|
1,975,549
|
|
|
|
Cash received
|
31,231
|
|
|
|
Total consideration, net of cash received
|
$
|
1,944,318
|
|
|
(1)
|
Property, plant and equipment (and estimated useful lives) acquired in the LDH Acquisition consisted of the following:
|
|
Land and improvements
|
$
|
30,759
|
|
|
Buildings and improvements (10 to 40 years)
|
3,123
|
|
|
|
Pipelines and equipment (20 to 65 years)
|
662,881
|
|
|
|
Natural gas liquids storage (40 years)
|
682,419
|
|
|
|
Linepack
|
704
|
|
|
|
Vehicles (3 to 20 years)
|
242
|
|
|
|
Furniture and fixtures (3 to 10 years)
|
49
|
|
|
|
Other (5 to 10 years)
|
8,526
|
|
|
|
Construction work-in-process
|
30,888
|
|
|
|
Property, plant and equipment
|
$
|
1,419,591
|
|
Pro Forma Results of Operations
The following unaudited pro forma consolidated results of operations for the years ended
December 31, 2011
and
2010
are presented as if the acquisitions of LDH and Regency had been completed on January 1, 2010:
|
|
Years Ended December 31,
|
||||||
|
|
2011
|
2010
|
|||||
|
Revenues
|
$
|
8,349,292
|
|
$
|
7,406,943
|
|
|
|
Net income
|
520,034
|
|
347,572
|
|
|||
|
Net income attributable to partners
|
307,809
|
|
228,206
|
|
|||
|
Basic net income per Limited Partner unit
|
$
|
1.38
|
|
$
|
1.02
|
|
|
|
Diluted net income per Limited Partner unit
|
$
|
1.38
|
|
$
|
1.02
|
|
|
The pro forma consolidated results of operations include adjustments to:
|
•
|
include the results of LDH and Regency for all periods presented;
|
|
•
|
include the incremental expenses associated with the fair value adjustments recorded as a result of applying the acquisition method of accounting;
|
|
•
|
include incremental interest expense related to financing the purchase price;
|
F - 27
|
•
|
adjust for one-time expenses; and
|
|
•
|
adjust for relative changes in ownership resulting from both transactions.
|
The pro forma information is not necessarily indicative of the results of operations that would have occurred had the transactions been made at the beginning of the periods presented or the future results of the combined operations.
2010 Transactions
Regency Transactions
On May 26, 2010, we acquired our equity interests in Regency in a series of transactions, which we refer to as the Regency Transactions. In the Regency Transactions, we:
|
•
|
acquired the general partner interest and IDRs in Regency in exchange for
3,000,000
Preferred Units having an aggregate liquidation preference of
$300 million
;
|
|
•
|
acquired from ETP an indirect
49.9%
interest in Midcontinent Express Pipeline LLC (“MEP”), ETP’s joint venture with Kinder Morgan Energy Partners, L.P. (“KMP”) to operate the Midcontinent Express Pipeline, and an option to acquire an additional
0.1%
interest in MEP in exchange for the redemption by ETP of approximately
12.3 million
ETP Common Units we previously owned; and
|
|
•
|
acquired
26.3 million
Regency Common Units in exchange for our contribution of all of our interests in MEP, including the option to acquire an additional
0.1%
interest, to Regency.
|
We accounted for the Regency Transactions using the purchase method of accounting. The purchase price was
$305 million
, which was the fair value of the
3,000,000
Preferred Units exchanged in connection with the Regency Transactions.
The following summarizes the assets acquired and liabilities assumed in the Regency Transactions, as well as the fair value of the noncontrolling interest in Regency:
|
Total current assets
|
$
|
189,502
|
|
|
Property, plant and equipment
|
1,548,384
|
|
|
|
Advances to and investments in affiliates
|
739,164
|
|
|
|
Goodwill
|
789,789
|
|
|
|
Intangible assets
|
666,360
|
|
|
|
Other assets
|
37,693
|
|
|
|
3,970,892
|
|
||
|
Total current liabilities
|
192,788
|
|
|
|
Long-term debt
|
1,239,863
|
|
|
|
Other long-term liabilities
|
57,517
|
|
|
|
Regency convertible preferred units
|
70,793
|
|
|
|
Noncontrolling interest
|
2,104,981
|
|
|
|
3,665,942
|
|
||
|
Total consideration
|
304,950
|
|
|
|
Cash received
|
23,995
|
|
|
|
Total consideration, net of cash received
|
$
|
280,955
|
|
Other Acquisitions
In March 2010, ETP purchased a natural gas gathering company, which provides dehydration, treating, redelivery and compression services on a
120
-mile pipeline system in the Haynesville Shale for approximately
$150 million
in cash, excluding certain adjustments as defined in the purchase agreement. In connection with this transaction, ETP recorded customer contracts of
$68.2 million
and goodwill of
$27.3 million
.
F - 28
In September 2010, Regency completed its acquisition of Zephyr, a Texas based field services company for approximately
$193.3 million
in cash. In connection with this transaction, Regency recorded intangible assets of
$119.4 million
and
no
goodwill.
Dispositions
In July 2010, Regency sold its East Texas gathering and processing assets to an affiliate of Tristream Energy LLC for approximately
$70.2 million
in cash. The net loss from these assets is classified as discontinued operations in the consolidated statements of operations from the date of the Regency Transactions to the date of the sale.
2009 Transactions
In November 2009, ETP acquired all of the outstanding equity interests of a natural gas compression equipment business with operations in Arkansas, California, Colorado, Louisiana, New Mexico, Oklahoma, Pennsylvania and Texas, in exchange for the issuance of
1,450,076
ETP Common Units having an aggregate market value of approximately
$63.3 million
on the closing date. In connection with this transaction, ETP received cash of
$41.1 million
, assumed total liabilities of
$30.5 million
, which includes
$8.4 million
in notes payable and recorded goodwill of
$8.7 million
.
In August 2009, ETP acquired Energy Transfer Group, L.L.C. (“ETG”), as described in Note
13
. In connection with this transaction, ETP assumed liabilities of
$33.5 million
and recorded goodwill of
$1.7 million
.
4.
INVESTMENTS IN AFFILIATES
:
Midcontinent Express Pipeline LLC
In conjunction with the Regency Transactions, the Parent Company acquired from ETP a
49.9%
interest in MEP, which it immediately contributed to Regency. ETP recorded a non-cash charge of approximately
$52.6 million
during the year ended December 31, 2010 to reduce the carrying value of its interest in MEP to its estimated fair value. In addition to the
49.9%
interest in MEP, the Parent Company also acquired an option to purchase ETP’s remaining
0.1%
interest in MEP in May 2011, which the Parent Company also transferred to Regency. In September 2011, Regency exercised its option to acquire the remaining
0.1%
interest in MEP from ETP for approximately
$1.2 million
in cash.
MEP owns approximately
500
miles of natural gas pipelines that extend from Southeast Oklahoma, across Northeast Texas, Northern Louisiana and Central Mississippi to an interconnect with the Transcontinental natural gas pipeline system in Butler, Alabama.
RIGS Haynesville Partnership Co.
Regency owns a
49.99%
interest in the RIGS Haynesville Partnership Co. joint venture (“HPC”), which, through its ownership of the Regency Intrastate Gas System (“RIGS”), delivers natural gas from Northwest Louisiana to downstream pipelines and markets through a
450
mile intrastate pipeline system.
Fayetteville Express Pipeline LLC
ETP owns a
50%
interest in the Fayetteville Express Pipeline LLC (“FEP”), which owns an approximately
185
mile natural gas pipeline that originates in Conway County, Arkansas, continues eastward through White County, Arkansas and terminates at an interconnect with Trunkline Gas Company in Panola County, Mississippi.
Ranch Joint Venture
On December 2, 2011, Ranch Westex JV LLC (“Ranch JV”) was formed by Regency, Anadarko Pecos Midstream LLC and Chesapeake West Texas Processing, L.L.C., each owning
33.33%
of the joint venture. Ranch JV, upon completion of construction in 2012, will process natural gas delivered from the NGL-rich Bone Spring and Avalon shale formations in West Texas. The project consists of two plants, a
25
MMcf/d refrigeration plant and a
100
MMcf/d cryogenic processing plant. The initial start-up of the refrigeration unit is expected to be in service by the second quarter of 2012, with full facilities available by the fourth quarter of 2012.
F - 29
Summarized Financial Information
The following tables present aggregated selected balance sheet and income statement data for our unconsolidated affiliates, MEP, HPC and FEP (on a 100% basis for all periods presented).
|
|
December 31,
|
||||||
|
|
2011
|
2010
|
|||||
|
Current assets
|
$
|
88,583
|
|
$
|
83,735
|
|
|
|
Property, plant and equipment, net
|
3,987,460
|
|
4,052,396
|
|
|||
|
Other assets
|
152,904
|
|
160,655
|
|
|||
|
Total assets
|
$
|
4,228,947
|
|
$
|
4,296,786
|
|
|
|
Current liabilities
|
$
|
83,989
|
|
$
|
91,860
|
|
|
|
Non-current liabilities
|
1,478,499
|
|
1,772,686
|
|
|||
|
Equity
|
2,666,459
|
|
2,432,240
|
|
|||
|
Total liabilities and equity
|
$
|
4,228,947
|
|
$
|
4,296,786
|
|
|
|
|
Years Ended December 31,
|
||||||||||
|
|
2011
|
2010
|
2009
|
||||||||
|
Revenue
|
$
|
569,116
|
|
$
|
406,346
|
|
$
|
142,076
|
|
||
|
Operating income
|
324,686
|
|
221,623
|
|
66,333
|
|
|||||
|
Net income
|
242,316
|
|
166,910
|
|
56,247
|
|
|||||
F - 30
5.
NET INCOME PER LIMITED PARTNER UNIT
:
Basic net income per limited partner unit is computed by dividing net income, after considering the General Partner’s interest, by the weighted average number of limited partner interests outstanding. Diluted net income per limited partner unit is computed by dividing net income (as adjusted as discussed herein), after considering the General Partner’s interest, by the weighted average number of limited partner interests outstanding and the assumed conversion of our Preferred Units, see Note
7
. For the diluted earnings per share computation, income allocable to the limited partners is reduced, where applicable, for the decrease in earnings from ETE’s limited partner unit ownership in ETP or Regency that would have resulted assuming the incremental units related to ETP’s or Regency’s equity incentive plans, as applicable, had been issued during the respective periods. Such units have been determined based on the treasury stock method.
The calculation below for diluted net income per limited partner unit excludes the impact of any ETE Common Units that would be issued upon conversion of the Series A Convertible Preferred Units, because inclusion would have been antidilutive. The Series A Convertible Preferred Units have a liquidation preference of
$300.0 million
and are subject to mandatory conversion as discussed in Note
7
.
A reconciliation of net income and weighted average units used in computing basic and diluted net income per unit is as follows:
|
|
Years Ended December 31,
|
||||||||||
|
|
2011
|
2010
|
2009
|
||||||||
|
Basic Net Income per Limited Partner Unit:
|
|||||||||||
|
Limited Partners’ interest in net income
|
$
|
308,852
|
|
$
|
192,161
|
|
$
|
441,103
|
|
||
|
Weighted average limited partner units
|
222,968,261
|
|
222,941,156
|
|
222,898,203
|
|
|||||
|
Basic net income per limited partner unit
|
$
|
1.39
|
|
$
|
0.86
|
|
$
|
1.98
|
|
||
|
Diluted Net Income per Limited Partner Unit:
|
|||||||||||
|
Limited Partners’ interest in net income
|
$
|
308,852
|
|
$
|
192,161
|
|
$
|
441,103
|
|
||
|
Dilutive effect of Unit Grants
|
(620
|
)
|
(228
|
)
|
(410
|
)
|
|||||
|
Diluted net income available to limited partners
|
$
|
308,232
|
|
$
|
191,933
|
|
$
|
440,693
|
|
||
|
Weighted average limited partner units
|
222,968,261
|
|
222,941,156
|
|
222,898,203
|
|
|||||
|
Diluted net income per limited partner unit
|
$
|
1.38
|
|
$
|
0.86
|
|
$
|
1.98
|
|
||
Discontinued operations per unit has been omitted as the impact rounds to
$0.00
for all periods presented.
F - 31
6.
DEBT OBLIGATIONS:
Our debt obligations consist of the following:
|
|
December 31,
|
||||||
|
|
2011
|
2010
|
|||||
|
Parent Company Indebtedness:
|
|||||||
|
ETE Senior Notes, due October 15, 2020
|
$
|
1,800,000
|
|
$
|
1,800,000
|
|
|
|
ETE Senior Secured Revolving Credit Facility
|
71,500
|
|
—
|
|
|||
|
Subsidiary Indebtedness:
|
|||||||
|
ETP Senior Notes:
|
|||||||
|
5.65% Senior Notes due August 1, 2012
|
400,000
|
|
400,000
|
|
|||
|
6.0% Senior Notes due July 1, 2013
|
350,000
|
|
350,000
|
|
|||
|
8.5% Senior Notes due April 15, 2014
|
350,000
|
|
350,000
|
|
|||
|
5.95% Senior Notes due February 1, 2015
|
750,000
|
|
750,000
|
|
|||
|
6.125% Senior Notes due February 15, 2017
|
400,000
|
|
400,000
|
|
|||
|
6.7% Senior Notes due July 1, 2018
|
600,000
|
|
600,000
|
|
|||
|
9.7% Senior Notes due March 15, 2019
|
600,000
|
|
600,000
|
|
|||
|
9.0% Senior Notes due April 15, 2019
|
650,000
|
|
650,000
|
|
|||
|
4.65% Senior Notes due June 1, 2021
|
800,000
|
|
—
|
|
|||
|
6.625% Senior Notes due October 15, 2036
|
400,000
|
|
400,000
|
|
|||
|
7.5% Senior Notes due July 1, 2038
|
550,000
|
|
550,000
|
|
|||
|
6.05% Senior Notes due June 1, 2041
|
700,000
|
|
—
|
|
|||
|
Regency Senior Notes:
|
|||||||
|
9.375% Senior Notes due June 1, 2016
|
250,000
|
|
250,000
|
|
|||
|
6.875% Senior Notes due December 1, 2018
|
600,000
|
|
600,000
|
|
|||
|
6.5% Senior Notes due July 15, 2021
|
500,000
|
|
—
|
|
|||
|
Transwestern Senior Unsecured Notes:
|
|||||||
|
5.39% Senior Notes due November 17, 2014
|
88,000
|
|
88,000
|
|
|||
|
5.54% Senior Notes due November 17, 2016
|
125,000
|
|
125,000
|
|
|||
|
5.64% Senior Notes due May 24, 2017
|
82,000
|
|
82,000
|
|
|||
|
5.36% Senior Notes due December 9, 2020
|
175,000
|
|
175,000
|
|
|||
|
5.89% Senior Notes due May 24, 2022
|
150,000
|
|
150,000
|
|
|||
|
5.66% Senior Notes due December 9, 2024
|
175,000
|
|
175,000
|
|
|||
|
6.16% Senior Notes due May 24, 2037
|
75,000
|
|
75,000
|
|
|||
|
HOLP Senior Secured Notes:
|
|||||||
|
Senior Secured Notes with interest rates ranging from 7.26% to 8.87%
|
71,314
|
|
103,127
|
|
|||
|
Revolving Credit Facilities:
|
|||||||
|
ETP Revolving Credit Facility
|
314,438
|
|
402,327
|
|
|||
|
Regency Revolving Credit Facility
|
332,000
|
|
285,000
|
|
|||
|
Other Long-Term Debt
|
10,434
|
|
9,671
|
|
|||
|
Unamortized discounts, net
|
(10,309
|
)
|
(6,013
|
)
|
|||
|
Fair value adjustments related to interest rate swaps
|
11,647
|
|
17,260
|
|
|||
|
11,371,024
|
|
9,381,372
|
|
||||
|
Current maturities
|
(424,160
|
)
|
(35,305
|
)
|
|||
|
$
|
10,946,864
|
|
$
|
9,346,067
|
|
||
F - 32
The following table reflects future maturities of long-term debt for each of the next five years and thereafter. These amounts exclude (i) maturities of long-term debt related to ETP's Propane Business, which was contributed to AmeriGas in January 2012 (see Note 3), and (ii)
$1.3 million
in net unamortized discounts and fair value adjustments related to interest rate swaps:
|
2012
|
$
|
400,043
|
|
|
2013
|
350,046
|
|
|
|
2014
|
770,000
|
|
|
|
2015
|
821,500
|
|
|
|
2016
|
689,438
|
|
|
|
Thereafter
|
8,257,000
|
|
|
|
Total
|
$
|
11,288,027
|
|
Long-term debt reflected on our consolidated balance sheet includes fair value adjustments related to interest rate swaps, which represent fair value adjustments that had been recorded in connection with fair value hedge accounting prior to the
termination of the interest rate swap. As of
December 31, 2011
long-term debt includes
$11.6 million
of fair value adjustments to interest rate swaps, which will be amortized as a reduction of interest expense until 2015.
Senior Notes
ETE Senior Notes
In September 2010, the Parent Company completed a public offering of
$1.8 billion
aggregate principal amount of
7.5%
Senior Notes due
October 15, 2020
. We used net proceeds of approximately
$1.77 billion
to repay all of the outstanding indebtedness under our then existing revolving credit facility and term loan facility, to fund the cost to terminate the interest rate swap agreements related to those borrowings, and for general partnership purposes. We may redeem some or all of the notes at any time pursuant to the terms of the indenture subject to the payment of a “make-whole” premium. Interest is payable semi-annually.
The ETE Senior Notes are unsecured obligations of ETE and the obligation to repay the ETE Senior Notes is not guaranteed by any of ETE’s subsidiaries, including ETP, Regency, and their respective subsidiaries. The indebtedness of ETP and Regency and their respective subsidiaries effectively ranks senior to the ETE Senior Notes.
ETP Senior Notes
The ETP Senior Notes are unsecured obligations of ETP and the obligation of ETP to repay the ETP Senior Notes is not guaranteed by us or any of ETP’s subsidiaries. The ETP Senior Notes effectively rank junior to all indebtedness and other liabilities of ETP’s existing and future subsidiaries. The balance is payable upon maturity. Interest on the ETP Senior Notes is paid semi-annually.
The
9.7%
ETP Senior Notes contain a put option at par exercisable on
March 15, 2012
. The current market value of these notes is significantly in excess of the principal amount making a repurchase at par value uneconomic by the holder. However, if such repurchase were to occur, ETP would refinance any amounts paid on a long-term basis.
In May 2011, ETP completed a public offering of
$800 million
aggregate principal amount of
4.65%
Senior Notes due
June 1, 2021
and
$700 million
aggregate principal amount of
6.05%
Senior Notes due
June 1, 2041
. ETP used the proceeds, net of commissions, of
$1.48 billion
to repay all of the borrowings outstanding under its revolving credit facility (the “ETP Credit Facility”), to fund capital expenditures related to pipeline construction projects and for general partnership purposes. ETP may redeem some or all of the ETP Senior Notes at any time pursuant to the terms of the indenture and related indenture supplements subject to the payment of a “make-whole” premium. Interest is payable semi-annually.
F - 33
In January 2012, ETP completed a public offering of
$1 billion
aggregate principal amount of
5.20%
Senior Notes due February 1, 2022 and
$1 billion
aggregate principal amount of
6.50%
Senior Notes due February 1, 2042. ETP expects to use the net proceeds of
$1.98 billion
to fund the cash portion of the purchase price of the Citrus Transaction and for general partnership purposes. ETP may redeem some or all of the notes at any time and from time to time pursuant to the terms of the indenture subject to the payment of a “make-whole” premium. Interest will be paid semi-annually. If ETP does not consummate the Citrus Acquisition on or before April 17, 2012, or the Citrus Merger Agreement is terminated on or before such date, ETP must redeem the
$2.0 billion
of senior notes at a redemption price equal to
101%
of the aggregate principal amount of the notes, plus accrued and unpaid interest.
In January 2012, ETP announced a cash tender offer for up to
$750 million
aggregate principal amount of specified series of the ETP Senior Notes. The tender offer consisted of two separate offers: an Any and All Offer and a Maximum Tender Offer.
In the Any and All Offer, ETP offered to purchase, under certain conditions, any and all of its 5.65% Senior Notes due August 1, 2012, at a fixed price. Pursuant to the Any and All Offer, ETP purchased
$292.0 million
in aggregate principal amount on January 19, 2012.
In the Maximum Tender Offer, ETP offered to purchase, under certain conditions, certain series of outstanding ETP Senior Notes at a fixed spread over the index rate. Pursuant to this tender offer, on February 7, 2012, ETP purchased
$200.0 million
aggregate principal amount of its 9.7% Senior Notes due March 15, 2019,
$200.0 million
aggregate principal amount of its 9.0% Senior Notes due April 15, 2019 and
$58.1 million
aggregate principal amount of its 8.5% Senior Notes due April 15, 2014.
Transwestern Senior Notes
The Transwestern Pipeline Company, LLC (“Transwestern”) notes are payable at any time in whole or pro rata in part, subject to a premium or upon a change of control event or an event of default, as defined. The balance is payable upon maturity. Interest is payable semi-annually.
HOLP Senior Secured Notes
All receivables, contracts, equipment, inventory, general intangibles, cash concentration accounts, and the capital stock of HOLP and its subsidiaries secure the HOLP Senior Secured Notes. Interest is payable quarterly or semiannually and principal payments are made in annual installments through 2020 except for a one time payment of
$16.0 million
due in 2013. In connection with ETP's contribution of the Propane Business to AmeriGas, this debt was assumed by AmeriGas.
Regency Senior Notes
Regency Senior Notes due 2016
. Regency has
$250 million
of Regency Senior Notes due 2016 that mature on
June 1, 2016
. The senior notes bear interest at
9.375%
with interest payable semi-annually.
At any time before June 1, 2012, up to
35%
of the Regency Senior Notes due 2016 can be redeemed with the proceeds of an equity offering at a price of
109.375%
plus accrued interest. Beginning June 1, 2013, Regency may redeem all or part of these notes for the principal amount plus a declining premium until June 1, 2015, and thereafter at par, plus accrued and unpaid interest. At any time prior to June 1, 2013, Regency may also redeem all or part of the Regency Senior Notes due 2016 at a price equal to
100%
of the principal amount of notes redeemed plus accrued interest and the applicable premium, which equals the greater of (1)
1%
of the principal amount of the note; or (2) the excess of the present value at such redemption date of (i) the redemption price of the note at June 1, 2013 plus (ii) all required interest payments due on the note through June 1, 2013, computed using a discount rate equal to the treasury rate (as defined in the indenture governing the senior notes) as of such redemption date plus
0.50%
over the principal amount of the note.
Regency Senior Notes due 2018.
In October 2010, Regency completed a public offering of
$600.0 million
aggregate principal amount of
6.875%
senior notes due 2018. Interest will be paid semi-annually in arrears on June 1 and December 1, commencing June 1, 2011. Regency capitalized
$12.2 million
in debt issuance costs which will amortize over the term of the senior notes. The proceeds were used to redeem Regency’s senior notes due 2013 and to partially repay outstanding borrowings under the Regency Credit Facility.
At any time before December 1, 2013, up to
35%
of the Regency Senior Notes due 2018 can be redeemed at a price of
106.875%
plus accrued interest. Beginning December 1, 2014, Regency may redeem all or part of the Regency Senior Notes due 2018 for the principal amount plus a declining premium until December 31, 2016, and thereafter at par, plus accrued and unpaid interest. At any time prior to December 1, 2014, Regency may also redeem all or part of the Regency Senior Notes due 2018 at a price equal to
100%
of the principal amount redeemed plus accrued interest and the applicable
F - 34
premium, which equals to the greater of (1)
1%
of the principal amount of the note; or (2) the excess of the present value at such redemption date of (i) the redemption price of the note at December 1, 2014 plus (ii) all required interest payments due on the note through December 1, 2014, computed using a discount rate equal to the treasury rate (as defined) as of such redemption date plus
0.50%
over the principal amount of the note.
Regency Senior Notes due 2021.
In May 2011, Regency issued
$500 million
aggregate principal amount of
6.50%
Senior Notes due
July 15, 2021
(the “Regency 2021 Notes”). Regency used the proceeds, net of commissions, of approximately
$491.3 million
to repay borrowings outstanding under its revolving credit facility (the “Regency Credit Facility”). Regency capitalized
$9.8 million
in debt issuance costs that will be amortized to interest expense, net over the term of the Regency 2021 Notes. Interest will be paid semi-annually.
At any time prior to July 15, 2016, Regency may redeem some or all of the Regency 2021 Notes at a redemption price equal to
100%
of the principal amount plus a “make-whole” premium, plus accrued and unpaid interest to the redemption date. At any time before July 15, 2014, Regency may redeem up to
35%
of the aggregate principal amount of the Regency 2021 Notes then outstanding at a redemption price equal to
106.5%
of the principal amount of the notes to be redeemed, plus accrued and unpaid interest to the redemption date.
Upon a change of control followed by a rating decline within
90
days, each noteholder of Regency’s senior notes will be entitled to require Regency to purchase all or a portion of its notes at a purchase price of
101%
plus accrued interest and liquidated damages, if any. Subsequent to the Regency Transactions, no noteholder has exercised this option.
Revolving Credit Facilities
ETE Senior Secured Credit Facility
Concurrent with the closing of its senior notes offering in September 2010, the Parent Company terminated its
$500 million
senior secured revolving credit facility and entered into a
$200 million
five
-year senior secured revolving credit facility (the “Parent Company Credit Agreement”) available through September 20, 2015.
In February 2012, ETE launched the syndication of a new senior secured credit facility of up to
$2.3 billion
. ETE intends to use the net proceeds from the senior secured credit facility, along with proceeds received from ETP in the Citrus Acquisition, to fund the cash portion of the SUG Merger and pay related fees and expenses, including existing borrowings under ETE's revolving credit facility and for general partnership purposes. We have also secured
$3.7 billion
in committed financing from the Bridge Loan Lenders to fund a portion of the cash consideration related to the SUG Merger. See additional discussion of the SUG Merger at Note 3.
Under the Parent Company Credit Agreement, the obligations of ETE are secured by all tangible and intangible assets of ETE and certain of its subsidiaries, including (i) its ownership of ETP Common Units; (ii) ETE’s equity interest in ETP LLC and ETP GP, through which ETE holds the IDRs in ETP; (iii) the Common Units of Regency; and (iv) ETE’s equity interest in Regency GP LLC and Regency GP LP, through which ETE holds the IDRs in Regency.
Borrowings bear interest, at ETE’s option, at either the Eurodollar rate plus an applicable margin or the alternative base rate. The alternative base rate used to calculate interest on base rate loans will be calculated using the greater of a prime rate, a federal funds effective rate plus
0.50%
, and an adjusted one-month LIBOR rate plus
1.00%
. The applicable margins are based upon ETE’s leverage ratio and range from
2.75%
to
3.75%
for Eurodollar loans and from
1.75%
to
2.75%
for base rate loans. The commitment fee payable on the unused portion of the Parent Company Credit Agreement is based on ETE’s leverage ratio and ranges from
0.50%
to
0.75%
.
In connection with the Parent Company Credit Agreement, ETE and certain of its subsidiaries entered into a Pledge and Security Agreement (the “Security Agreement”) with Credit Suisse AG, Cayman Islands Branch, as collateral agent (the “Collateral Agent”). The Security Agreement secures all of ETE’s obligations under the Parent Company Credit Agreement and grants to the Collateral Agent a continuing first priority lien on, and security interest in, all of ETE’s and the other grantors’ tangible and intangible assets.
As of
December 31, 2011
, we had a balance of
$71.5 million
outstanding under the Parent Company Credit Agreement and the amount available for future borrowings was
$128.5 million
. The weighted average interest rate on the total amount outstanding as of
December 31, 2011
was
3.46%
.
F - 35
ETP Credit Facility
The indebtedness under the ETP Credit Facility is unsecured and not guaranteed by any of ETP’s subsidiaries and has equal rights to holders of our current and future unsecured debt. The indebtedness under the ETP Credit Facility has the same priority of payment as ETP’s other current and future unsecured debt.
On October 27, 2011, ETP amended and restated the ETP Credit Facility to, among other things, (i) allow for borrowings of up to
$2.5 billion
; (ii) extend the maturity date from July 20, 2012 to October 27, 2016 (which may be extended by one year with lender approval); (iii) allow for an increase in the size of the credit facility to
$3.75 billion
(subject to obtaining lender commitments for the additional borrowing capacity); and (iv) to adjust the interest rates and commitment fees to current market terms. Following this amendment and based on our current ratings, the interest margin for LIBOR rate loans is
1.50%
and the commitment fee for unused borrowing capacity is
0.25%
.
As of
December 31, 2011
, ETP had a balance of
$314.4 million
outstanding under the ETP Credit Facility and, taking into account letters of credit of approximately
$25.6 million
,
$2.16 billion
available for future borrowings. The weighted average interest rate on the total amount outstanding as of
December 31, 2011
was
1.78%
.
Regency Credit Facility
The Regency Credit Facility has aggregate revolving commitments of
$900 million
, with
$200 million
of availability for letters of credit. Regency also has the option to request an additional
$250 million
in revolving commitments with ten business days written notice provided that no event of default has occurred or would result due to such increase, and all other additional conditions for the increase of the commitments set forth in the credit facility have been met. The maturity date of the Regency Credit Facility is
June 15, 2014
.
The outstanding balance of revolving loans under the Regency Credit Facility bears interest at LIBOR plus a margin or an alternate base rate. The alternate base rate used to calculate interest on base rate loans will be calculated using the greater of a base rate, a federal funds effective rate plus
0.50%
and an adjusted one-month LIBOR rate plus
1.0%
. The applicable margin ranges from
1.50%
to
2.25%
for base rate loans and
2.50%
to
3.25%
for Eurodollar loans.
Regency pays (i) a commitment fee ranging between
0.375%
and
0.50%
per annum for the unused portion of the revolving loan commitments; (ii) a participation fee for each revolving lender participating in letters of credit ranging between
2.50%
and
3.25%
per annum of the average daily amount of such lender’s letter of credit exposure and; (iii) a fronting fee to the issuing bank of letters of credit equal to
0.125%
per annum of the average daily amount of its letter of credit exposure. In December 2011, Regency amended its credit facility to allow for additional investments in its joint ventures.
As of
December 31, 2011
, Regency had a balance of
$332.0 million
outstanding under the Regency Credit Facility in revolving credit loans and approximately
$19.0 million
in letters of credit. The total amount available under the Regency Credit Facility, as of
December 31, 2011
, which is reduced by any letters of credit, was approximately
$549.0 million
. The weighted average interest rate on the total amount outstanding as of
December 31, 2011
was
3.18%
.
Covenants Related to Our Credit Agreements
Covenants Related to the Parent Company
The Parent Company Credit Agreement contains customary representations, warranties and covenants, including financial covenants regarding a maximum leverage ratio, a maximum consolidated leverage ratio, a minimum fixed charge coverage ratio and a minimum loan to value ratio. In addition, the Parent Company Credit Agreement contains customary events of default, including, but not limited to, (i) default for failure to pay the principal on any loan or any reimbursement obligation with respect to any letter of credit when due and payable, (ii) failure to duly observe, perform or comply with certain specified covenants, (iii) a representation or warranty made in connection with any loan document proves to have been false or incorrect in any material respect on any date on or as of which made, and (iv) the occurrence of a change of control.
F - 36
The Parent Company Senior Secured Revolving Credit Facility contains financial covenants as follows:
|
•
|
Maximum Leverage Ratio – Consolidated Funded Debt of the Parent Company (as defined) to Consolidated EBITDA (as defined in the agreements) of the Parent Company of not more than
4.5
to
1
, with a permitted increase to
5
to
1
during a specified acquisition period extending for two fiscal quarters following the close of a specified acquisition;
|
|
•
|
Maximum Consolidated Leverage Ratio – Consolidated Funded Debt of the Parent Company, ETP and Regency to Consolidated EBITDA of ETP and Regency of not more than
5.5
to
1
;
|
|
•
|
Fixed Charge Coverage Ratio of not less than
3
to
1
; and
|
|
•
|
Value to Loan Ratio of not less than
2
to
1
.
|
Covenants Related to ETP
The agreements relating to the ETP Senior Notes contain restrictive covenants customary for an issuer with an investment-grade rating from the rating agencies, which covenants include limitations on liens and a restriction on sale-leaseback transactions.
The credit agreement relating to the ETP Credit Facility contains covenants that limit (subject to certain exceptions) the ETP’s and certain of the ETP’s subsidiaries’ ability to, among other things:
|
•
|
incur indebtedness;
|
|
•
|
grant liens;
|
|
•
|
enter into mergers;
|
|
•
|
dispose of assets;
|
|
•
|
make certain investments;
|
|
•
|
make Distributions (as defined in such credit agreement) during certain Defaults (as defined in such credit agreement) and during any Event of Default (as defined in such credit agreement);
|
|
•
|
engage in business substantially different in nature than the business currently conducted by ETP and its subsidiaries;
|
|
•
|
engage in transactions with affiliates; and
|
|
•
|
enter into restrictive agreements.
|
The credit agreement relating to the ETP Credit Facility also contains a financial covenant that provides that the Leverage Ratio, as defined in the ETP Credit Facility, shall not exceed
5
to
1
as of the end of each quarter, with a permitted increase to
5.5
to
1
during a Specified Acquisition Period, as defined in the ETP Credit Facility.
The agreements relating to the Transwestern senior notes contain certain restrictions that, among other things, limit the incurrence of additional debt, the sale of assets and the payment of dividends and specify a maximum debt to capitalization ratio.
Covenants Related to Regency
The Regency Senior Notes contain various covenants that limit, among other things, Regency’s ability, and the ability of certain of its subsidiaries, to:
|
•
|
incur additional indebtedness;
|
|
•
|
pay distributions on, or repurchase or redeem equity interests;
|
|
•
|
make certain investments;
|
|
•
|
incur liens;
|
|
•
|
enter into certain types of transactions with affiliates; and
|
|
•
|
sell assets, consolidate or merge with or into other companies.
|
F - 37
If the Regency Senior Notes achieve investment grade ratings by both Moody’s and S&P and no default or event of default has occurred and is continuing, Regency will no longer be subject to many of the foregoing covenants. The Regency Credit Facility contains the following financial covenants:
|
•
|
Regency’s consolidated EBITDA ratio for any preceding four fiscal quarter period, as defined in the credit agreement governing the Regency Credit Facility, must not exceed
5.25
to
1
.
|
|
•
|
Regency's consolidated EBITDA to consolidated interest expense, as defined in the credit agreement governing the Regency Credit Facility, must not exceed
2.75
to
1
.
|
|
•
|
Regency’s consolidated senior secured leverage ratio for any preceding four fiscal quarter period, as defined in the credit agreement governing the Regency Credit Facility, must not exceed
3
to
1
.
|
The Regency Credit Facility also contains various covenants that limit, among other things, the ability of Regency and Regency Gas Services ("RGS," a wholly-owned subsidiary of Regency) to:
|
•
|
incur indebtedness;
|
|
•
|
grant liens;
|
|
•
|
enter into sale and leaseback transactions;
|
|
•
|
make certain investments, loans and advances;
|
|
•
|
dissolve or enter into a merger or consolidation;
|
|
•
|
enter into asset sales or make acquisitions;
|
|
•
|
enter into transactions with affiliates;
|
|
•
|
prepay other indebtedness or amend organizational documents or transaction documents (as defined in the credit agreement governing the Regency Credit Facility);
|
|
•
|
issue capital stock or create subsidiaries; or
|
|
•
|
engage in any business other than those businesses in which it was engaged at the time of the effectiveness of the Regency Credit Facility or reasonable extensions thereof.
|
Compliance With Our Covenants
Failure to comply with the various restrictive and affirmative covenants of our revolving credit facilities and note agreements could require us or our subsidiaries to pay debt balances prior to scheduled maturity and could negatively impact the subsidiaries ability to incur additional debt and/or our ability to pay distributions.
We, ETP and Regency are required to assess compliance quarterly and were in compliance with all requirements, tests, limitations, and covenants related to our debt agreements as of
December 31, 2011
.
7.
REDEEMABLE PREFERRED UNITS:
ETE Preferred Units
In connection with the Regency Transactions as discussed in Note
3
, ETE issued
3,000,000
Preferred Units to an affiliate of GE Energy Financial Services, Inc. (“GE EFS”) having an aggregate liquidation preference of
$300 million
and are reflected as long-term liabilities in our consolidated balance sheets as of
December 31, 2011
and
2010
. The Preferred Units were issued in a private placement at a stated price of
$100
per unit and are entitled to a preferential quarterly cash distribution of
$2.00
per Preferred Unit. The Preferred Units will automatically convert on the fourth anniversary of the date of issuance into an amount of ETE Common Units equal in value to the issue price plus any accrued but unpaid distributions plus a specified premium equal to the lesser of
10%
of the issue price plus any accrued but unpaid distributions or a premium derived from
25%
of the accretion in the trading price of ETE Common Units subsequent to the date of issuance of the Preferred Units. ETE may choose, at its sole option, to pay
50%
of the conversion consideration based on the issue price plus any accrued but unpaid distributions in cash. ETE may elect to redeem all, but not less than all, of the Preferred Units beginning on the third anniversary of the date of issuance for ETE Common Units or cash equal to the issue price plus a premium paid out in common units, equal to the greater of
10%
of the issue price plus any accrued but unpaid distributions or a premium derived from
25%
of the accretion in the trading price of ETE Common Units subsequent to the date of issuance. GE EFS also has certain rights to force ETE to redeem or convert the outstanding Preferred Units for specified
F - 38
consideration upon the occurrence of certain extraordinary events involving ETE or ETP. Holders of the Preferred Units have no voting rights, except that approval of a majority of the Preferred Units is needed to approve any amendment to ETE’s Partnership Agreement that would result in (i) any increase in the size of the class of Preferred Units, (ii) any alteration or change to the rights, preferences, privileges, duties, or obligations of the Preferred Units or (iii) any other matter that would adversely affect the rights or preferences of the Preferred Units, including in relation to other classes of ETE partnership interests. During
2011
, we recorded non-cash charges of approximately
$5.3 million
to increase the carrying value of the Preferred Units to the estimated fair value of
$322.9 million
as of December 31, 2011. During 2010, we recorded non-cash charges of approximately
$12.7 million
to increase the carrying value of the Preferred Units to the estimated fair value of
$317.6 million
as of December 31, 2010.
Preferred Units of Subsidiary
Regency had
4,371,586
Regency Preferred Units outstanding at
December 31, 2011
, which were convertible into
4,632,389
Regency Common Units. If outstanding on
September 2, 2029
the Regency Preferred Units are mandatorily redeemable for
$80 million
plus all accrued but unpaid distributions thereon. Holders of the Regency Preferred Units receive fixed Regency quarterly cash distributions of
$0.445
per unit. Holders can elect to convert Regency Preferred Units to Regency Common Units at any time in accordance with Regency’s partnership agreement.
The following table provides a reconciliation of the beginning and ending balances of the Regency Preferred Units:
|
Regency
Preferred
Units
|
Amount
|
|||||
|
Balance at date of Acquisition
|
4,371,586
|
|
$
|
70,793
|
|
|
|
Accretion to redemption value
|
—
|
|
150
|
|
||
|
Balance, December 31, 2010
|
4,371,586
|
|
70,943
|
|
||
|
Accretion to redemption value
|
—
|
|
201
|
|
||
|
Balance, December 31, 2011
|
4,371,586
|
|
$
|
71,144
|
|
|
8.
EQUITY:
Limited Partner Units
Limited partner interests in the Partnership are represented by Common Units that entitle the holders thereof to the rights and privileges specified in the Partnership Agreement. The Partnership’s Common Units are registered under the Securities Exchange Act of 1934 (as amended) and are listed for trading on the New York Stock Exchange (“NYSE”). Each holder of a Common Unit is entitled to one vote per unit on all matters presented to the Limited Partners for a vote. In addition, if at any time any person or group (other than the Partnership’s General Partner and its affiliates) owns beneficially
20%
or more of all Common Units, any Common Units owned by that person or group may not be voted on any matter and are not considered to be outstanding when sending notices of a meeting of Unitholders (unless otherwise required by law), calculating required votes, determining the presence of a quorum or for other similar purposes under the Partnership Agreement. The Common Units are entitled to distributions of Available Cash as described below under “Parent Company Quarterly Distributions of Available Cash.”
As of
December 31, 2011
, there were issued and outstanding
222,972,708
Common Units representing an aggregate
99.69%
limited partner interest in the Partnership.
Our Partnership Agreement contains specific provisions for the allocation of net earnings and losses to the partners for purposes of maintaining the partner capital accounts. For any fiscal year that the Partnership has net profits, such net profits are first allocated to the General Partner until the aggregate amount of net profits for the current and all prior fiscal years equals the aggregate amount of net losses allocated to the General Partner for the current and all prior fiscal years. Second, such net profits shall be allocated to the Limited Partners pro rata in accordance with their respective sharing ratios. For any fiscal year in which the Partnership has net losses, such net losses shall be first allocated to the Limited Partners in proportion to their respective adjusted capital account balances, as defined by the Partnership Agreement, (before taking into account such net losses) until their adjusted capital account balances have been reduced to zero. Second, all remaining net losses shall be allocated to the General Partner. The General Partner may distribute to the Limited Partners funds of the Partnership that the General Partner reasonably determines are not needed for the payment of existing or foreseeable Partnership obligations and expenditures.
F - 39
Common Units
The change in ETE Common Units during the years ended
December 31, 2011
,
2010
and
2009
was as follows:
|
|
Years Ended December 31,
|
|||||||
|
|
2011
|
2010
|
2009
|
|||||
|
Number of Common Units, beginning of period
|
222,941,172
|
|
222,898,248
|
|
222,829,956
|
|
||
|
Issuance of restricted Common Units under long-term incentive plan
|
31,536
|
|
42,924
|
|
68,292
|
|
||
|
Number of Common Units, end of period
|
222,972,708
|
|
222,941,172
|
|
222,898,248
|
|
||
Sale of Common Units by Subsidiaries
The Parent Company accounts for the difference between the carrying amount of its investment in ETP and Regency and the underlying book value arising from issuance of units by ETP or Regency (excluding unit issuances to the Parent Company) as a capital transaction. If ETP or Regency issues units at a price less than the Parent Company’s carrying value per unit, the Parent Company assesses whether the investment has been impaired, in which case a provision would be reflected in our statement of operations. The Parent Company did not recognize any impairment related to the issuance of ETP or Regency Common Units during the periods presented.
As a result of ETP’s and Regency’s issuances and redemptions of Common Units, we have recognized increases in partner’s capital of
$153.0 million
,
$352.3 million
and
$97.0 million
for the years ended
December 31, 2011
,
2010
and
2009
, respectively.
Sale of Common Units by ETP
The following table summarizes ETP’s public offerings of ETP Common Units during the periods presented:
|
Date
|
Number of
ETP Common
Units
(1)
|
Price per ETP
Unit
|
Net Proceeds
|
Use of
Proceeds
|
|||||||||
|
January 2009
|
6,900,000
|
|
$
|
34.05
|
|
$
|
225,354
|
|
(2)
|
||||
|
April 2009
|
9,775,000
|
|
37.55
|
|
352,369
|
|
(3)
|
||||||
|
October 2009
|
6,900,000
|
|
41.27
|
|
275,979
|
|
(2)
|
||||||
|
January 2010
|
9,775,000
|
|
44.72
|
|
423,551
|
|
(2)(3)
|
||||||
|
August 2010
|
10,925,000
|
|
46.22
|
|
489,418
|
|
(2)(3)
|
||||||
|
April 2011
|
14,202,500
|
|
50.52
|
|
695,496
|
|
(3)
|
||||||
|
November 2011
|
15,237,500
|
|
44.67
|
|
660,241
|
|
(2)(3)
|
||||||
|
(1)
|
Number of Common Units includes the exercise of the overallotment options by the underwriters.
|
|
(2)
|
Proceeds were used to repay amounts outstanding under the ETP Credit Facility.
|
|
(3)
|
Proceeds were used to fund capital expenditures and capital contributions to joint ventures, as well as for general partnership purposes.
|
ETP’s Equity Distribution Program
In December 2010, ETP entered into an Equity Distribution Agreement with Credit Suisse Securities (USA) LLC (“Credit Suisse”). According to the provisions of this agreement, ETP may offer and sell from time to time through Credit Suisse, as its sales agent, ETP Common Units having an aggregate offering price of up to
$200 million
. Sales of the units are made by means of ordinary brokers’ transactions on the NYSE at market prices, in block transactions or as otherwise agreed between ETP and Credit Suisse. Under the terms of this agreement, ETP may also sell ETP Common Units to Credit Suisse as principal for its own account at a price agreed upon at the time of sale. Any sale of ETP Common Units to Credit Suisse as principal would be pursuant to the terms of a separate agreement between ETP and Credit Suisse.
Previously, ETP had an Equity Distribution Agreement with UBS Securities LLC ("UBS"), which was similar to its existing agreement with Credit Suisse as described above. During 2010, ETP received proceeds from units issued pursuant to this
F - 40
agreement of approximately
$214.3 million
, net of commissions, which proceeds were used to repay amounts outstanding under its revolving credit facility.
During
2011
, ETP received proceeds from units issued pursuant to this agreement of approximately
$96.3 million
, net of commissions, which proceeds were used for general partnership purposes. Approximately
$69.6 million
of ETP Common Units remain available to be issued under the agreement based on trades initiated through
December 31, 2011
.
ETP's Distribution Reinvestment Program
In April 2011, ETP filed a registration statement with the SEC covering its Distribution Reinvestment Plan (the “DRIP”). The DRIP provides ETP's Unitholders of record and beneficial owners of ETP Common Units a voluntary means by which they can increase the number of ETP Common Units they own by reinvesting the quarterly cash distributions they would otherwise receive in the purchase of additional Common Units. The registration statement covers the issuance of up to
5,750,000
Common Units under the DRIP.
During 2011, distributions of approximately
$15.0 million
were reinvested under the DRIP resulting in the issuance of
353,679
ETP Common Units.
Sale of Common Units by Regency
In October 2011, Regency issued
11,500,000
Regency Common Units through a public offering. The proceeds, net of commissions, of approximately
$231.9 million
were used to repay borrowings outstanding under the Regency Credit Facility.
In May 2011, Regency issued
8,500,001
Regency Common Units in a private placement. The net proceeds of
$203.9 million
were used to fund a portion of Regency’s
30%
ownership interest in Lone Star, as discussed in Note
3
.
In August 2010, Regency issued
17,537,500
Regency Common Units through a public offering. The proceeds of
$400.2 million
, net of commissions, from the offering were used primarily to repay borrowings under the Regency Credit Facility.
Contributions to Subsidiaries
The Parent Company indirectly owns the entire general partner interest in ETP through its ownership of ETP GP, the general partner of ETP. In order to maintain its general partner interest in ETP, ETP GP was previously required to make contributions to ETP each time ETP issued limited partner interests for cash or in connection with acquisitions. These contributions were generally paid by offsetting the required contributions against the funds ETP GP receives from ETP distributions on the general partner and limited partner interests owned by ETP GP. In July 2009, ETP amended and restated its partnership agreement, and as a result, ETP GP is no longer required to make corresponding contributions to maintain its general partner interest in ETP. ETP GP was required to contribute approximately
$12.3 million
for the years ended December 31, 2009. As of December 31, 2009, ETP GP had a contribution payable to ETP of
$8.9 million
, which was paid in full in 2010.
The Parent Company owns the entire general partner interest in Regency through its ownership of Regency GP. Regency GP has the right, but not the obligation, to contribute a proportionate amount of capital to Regency to maintain its current general partner interest. Regency GP’s interest in Regency’s distributions is reduced if Regency issues additional units and Regency GP does not contribute a proportionate amount of capital to Regency to maintain its General Partner interest.
F - 41
Parent Company Quarterly Distributions of Available Cash
Our distribution policy is consistent with the terms of our Partnership Agreement, which requires that we distribute all of our available cash quarterly. The Parent Company’s only cash-generating assets currently consist of distributions from ETP and Regency related to limited and general partner interests, including IDRs. We currently have no independent operations outside of our direct and indirect interests in ETP and Regency.
Our distributions declared during the years ended
December 31, 2011
,
2010
and
2009
are summarized as follows:
|
Quarter Ended
|
|
Record Date
|
|
Payment Date
|
|
Distribution per
ETE Common Unit
|
||
|
September 30, 2011
|
|
November 4, 2011
|
|
November 18, 2011
|
|
$
|
0.6250
|
|
|
June 30, 2011
|
|
August 5, 2011
|
|
August 19, 2011
|
|
0.6250
|
|
|
|
March 31, 2011
|
|
May 6, 2011
|
|
May 19, 2011
|
|
0.5600
|
|
|
|
December 31, 2010
|
|
February 7, 2011
|
|
February 18, 2011
|
|
0.5400
|
|
|
|
September 30, 2010
|
|
November 8, 2010
|
|
November 19, 2010
|
|
$
|
0.5400
|
|
|
June 30, 2010
|
|
August 9, 2010
|
|
August 19, 2010
|
|
0.5400
|
|
|
|
March 31, 2010
|
|
May 7, 2010
|
|
May 19, 2010
|
|
0.5400
|
|
|
|
December 31, 2009
|
|
February 8, 2010
|
|
February 19, 2010
|
|
0.5400
|
|
|
|
September 30, 2009
|
|
November 9, 2009
|
|
November 19, 2009
|
|
$
|
0.5350
|
|
|
June 30, 2009
|
|
August 7, 2009
|
|
August 19, 2009
|
|
0.5350
|
|
|
|
March 31, 2009
|
|
May 8, 2009
|
|
May 19, 2009
|
|
0.5250
|
|
|
|
December 31, 2008
|
|
February 6, 2009
|
|
February 19, 2009
|
|
0.5100
|
|
|
On
January 25, 2012
, the Parent Company declared a cash distribution for the three months ended
December 31, 2011
of
$0.625
per Common Unit, or
$2.50
annualized. We paid this distribution on
February 17, 2012
to Unitholders of record at the close of business on
February 7, 2012
.
The total amount of distributions we have declared is as follows (all from Available Cash from our operating surplus and are shown in the period to which they relate):
|
|
Years Ended December 31,
|
||||||||||
|
|
2011
|
2010
|
2009
|
||||||||
|
Limited Partners
|
$
|
542,939
|
|
$
|
481,554
|
|
$
|
475,911
|
|
||
|
General Partner interest
|
1,685
|
|
1,495
|
|
1,478
|
|
|||||
|
Total ETE distributions
|
$
|
544,624
|
|
$
|
483,049
|
|
$
|
477,389
|
|
||
F - 42
ETP’s Quarterly Distribution of Available Cash
ETP’s Partnership Agreement requires that ETP distribute all of its Available Cash to its Unitholders and its General Partner within
45
days following the end of each fiscal quarter, subject to the payment of incentive distributions to the holders of IDRs to the extent that certain target levels of cash distributions are achieved. The term Available Cash generally means, with respect to any fiscal quarter of ETP, all cash on hand at the end of such quarter, plus working capital borrowings after the end of the quarter, less reserves established by its General Partner in its sole discretion to provide for the proper conduct of ETP’s business, to comply with applicable laws or any debt instrument or other agreement, or to provide funds for future distributions to partners with respect to any one or more of the next four quarters. Available Cash is more fully defined in ETP’s Partnership Agreement.
ETP’s distributions declared during the periods presented below are summarized as follows:
|
Quarter Ended
|
|
Record Date
|
|
Payment Date
|
|
Distribution per
ETP Common Unit
|
||
|
September 30, 2011
|
|
November 4, 2011
|
November 14, 2011
|
$
|
0.89375
|
|
||
|
June 30, 2011
|
|
August 5, 2011
|
August 15, 2011
|
0.89375
|
|
|||
|
March 31, 2011
|
|
May 6, 2011
|
May 16, 2011
|
0.89375
|
|
|||
|
December 31, 2010
|
|
February 7, 2011
|
February 14, 2011
|
0.89375
|
|
|||
|
September 30, 2010
|
|
November 8, 2010
|
November 15, 2010
|
$
|
0.89375
|
|
||
|
June 30, 2010
|
|
August 9, 2010
|
August 16, 2010
|
0.89375
|
|
|||
|
March 31, 2010
|
|
May 7, 2010
|
May 17, 2010
|
0.89375
|
|
|||
|
December 31, 2009
|
|
February 8, 2010
|
February 15, 2010
|
0.89375
|
|
|||
|
September 30, 2009
|
|
November 9, 2009
|
November 16, 2009
|
$
|
0.89375
|
|
||
|
June 30, 2009
|
|
August 7, 2009
|
August 14, 2009
|
0.89375
|
|
|||
|
March 31, 2009
|
|
May 8, 2009
|
May 15, 2009
|
0.89375
|
|
|||
|
December 31, 2008
|
|
February 6, 2009
|
February 13, 2009
|
0.89375
|
|
|||
On
January 25, 2012
, ETP declared a cash distribution for the three months ended
December 31, 2011
of
$0.89375
per ETP Common Unit, or
$3.575
annualized. ETP paid this distribution on
February 14, 2012
to ETP Unitholders of record at the close of business on
February 7, 2012
.
The total amounts of ETP distributions declared during the periods presented in the consolidated financial statements are as follows (all from Available Cash from ETP’s operating surplus and are shown in the period to which they relate):
|
|
Years Ended December 31,
|
||||||||||
|
|
2011
|
2010
|
2009
|
||||||||
|
Limited Partners:
|
|||||||||||
|
Common Units
|
$
|
762,350
|
|
$
|
676,798
|
|
$
|
629,263
|
|
||
|
Class E Units
|
12,484
|
|
12,484
|
|
12,484
|
|
|||||
|
General Partner interest
|
19,603
|
|
19,524
|
|
19,505
|
|
|||||
|
Incentive Distribution Rights
|
421,888
|
|
375,979
|
|
350,486
|
|
|||||
|
Total ETP distributions
|
$
|
1,216,325
|
|
$
|
1,084,785
|
|
$
|
1,011,738
|
|
||
F - 43
Regency’s Quarterly Distribution of Available Cash
Regency’s Partnership Agreement requires that Regency distribute all of its Available Cash to its Unitholders and its General Partner within
45
days after the end of each quarter to unitholders of record on the applicable record date, as determined by the general partner. The term Available Cash generally consists of all cash and cash equivalents on hand at the end of that quarter less the amount of cash reserves established by the general partner to: (i) provide for the proper conduct of the Partnership’s business; (ii) comply with applicable law, any debt instruments or other agreements; or (iii) provide funds for distributions to the unitholders and to the General Partner for any one or more of the next four quarters and plus, all cash on hand on that date of determination of available cash for the quarter resulting from working capital borrowings made after the end of the quarter for which the determination is being made.
Distributions paid by Regency since the date of acquisition are summarized as follows:
|
Quarter Ended
|
|
Record Date
|
|
Payment Date
|
|
Distribution per
Regency Common
Unit
|
||
|
September 30, 2011
|
November 7, 2011
|
November 14, 2011
|
$
|
0.455
|
|
|||
|
June 30, 2011
|
August 5, 2011
|
August 12, 2011
|
0.450
|
|
||||
|
March 31, 2011
|
May 6, 2011
|
May 13, 2011
|
0.445
|
|
||||
|
December 31, 2010
|
February 7, 2011
|
February 14, 2011
|
0.445
|
|
||||
|
September 30, 2010
|
November 5, 2010
|
|
November 12, 2010
|
|
$
|
0.445
|
|
|
|
June 30, 2010
|
August 6, 2010
|
|
August 13, 2010
|
|
0.445
|
|
||
On
January 26, 2012
, Regency declared a cash distribution for the three months ended
December 31, 2011
of
$0.46
per Regency Common Unit, or
$1.84
annualized. Regency paid this distribution on
February 13, 2012
to Regency Unitholders of record at the close of business on
February 6, 2012
.
The total amounts of Regency distributions declared since the date of acquisition were as follows (all from Regency’s operating surplus and are shown in the period with respect to which they relate):
|
|
Years Ended December 31,
|
||||||
|
2011
|
2010
|
||||||
|
Limited Partners
|
$
|
274,538
|
|
$
|
175,360
|
|
|
|
General Partner interest
|
5,185
|
|
3,640
|
|
|||
|
Incentive Distribution Rights
|
6,057
|
|
3,016
|
|
|||
|
Total Regency distributions
|
$
|
285,780
|
|
$
|
182,016
|
|
|
Accumulated Other Comprehensive Income
The following table presents the components of AOCI, net of tax:
|
|
December 31,
|
||||||
|
|
2011
|
2010
|
|||||
|
Net gains on commodity related hedges
|
$
|
1,696
|
|
$
|
14,146
|
|
|
|
Unrealized gains on available-for-sale securities
|
114
|
|
918
|
|
|||
|
Subtotal
|
1,810
|
|
15,064
|
|
|||
|
Amounts attributable to noncontrolling interest
|
(1,132
|
)
|
(10,266
|
)
|
|||
|
Total AOCI included in partners' capital, net of tax
|
$
|
678
|
|
$
|
4,798
|
|
|
F - 44
9.
UNIT-BASED COMPENSATION PLANS:
We, ETP, and Regency have issued equity incentive plans for employees, officers and directors, which provide for various types of awards, including options to purchase Common Units, restricted units, phantom units, distribution equivalent rights (“DERs”), common unit appreciation rights, and other unit-based awards.
ETE Long-Term Incentive Plan
The Board of Directors or the Compensation Committee of the board of directors of the our General Partner (the “Compensation Committee”) may from time to time grant additional awards to employees, directors and consultants of ETE’s general partner and its affiliates who perform services for ETE. The plan provides for the following types of awards: restricted units, phantom units, unit options, unit appreciation rights and distribution equivalent rights. The number of additional units that may be delivered pursuant to these awards is limited to
3,000,000
units. As of
December 31, 2011
,
2,853,676
units remain available to be awarded under the plan.
During 2011, the Compensation Committee granted a total of
30,000
ETE units with grant date fair values of
$39.82
per unit to employees with vesting over a
five
-year period at
20%
per year. These awards include rights to distributions paid on unvested units.
During
2011
, a total of
24,897
ETE units vested, with a total fair value of
$1.0 million
as of the vesting date. As of
December 31, 2011
, a total of
82,557
restricted units granted to ETE employees and directors remain outstanding, for which we expect to recognize a total of
$1.2 million
in compensation over a weighted average period of
2.0
years.
ETP Unit-Based Compensation Plans
Unit Grants
ETP has granted restricted unit awards to employees that vest over a specified time period, typically a
five
-year period at
20%
per year, with vesting based on continued employment as of each applicable vesting date. Upon vesting, ETP Common Units are issued. These unit awards entitle the recipients of the unit awards to receive, with respect to each ETP Common Unit subject to such award that has not either vested or been forfeited, a cash payment equal to each cash distribution per ETP Common Unit made by ETP on its Common Units promptly following each such distribution by ETP to its Unitholders. We refer to these rights as “distribution equivalent rights.”
Under ETP’s equity incentive plans, its non-employee directors each receive grants that vest ratably over three years and do not entitle the holders to receive distributions during the vesting period.
Award Activity
The following table shows the activity of the ETP awards granted to employees and non-employee directors:
|
Number of
ETP Units
|
Weighted Average
Grant-Date Fair
Value Per ETP
Unit
|
|||||
|
Unvested awards as of December 31, 2010
|
1,936,578
|
|
$
|
43.95
|
|
|
|
Awards granted
|
1,386,251
|
|
48.35
|
|
||
|
Awards vested
|
(610,557
|
)
|
44.07
|
|
||
|
Awards forfeited
|
(148,563
|
)
|
42.74
|
|
||
|
Unvested awards as of December 31, 2011
|
2,563,709
|
|
46.37
|
|
||
During the years ended
December 31, 2011
,
2010
and
2009
, the weighted average grant-date fair value per unit award granted was
$48.35
,
$49.82
and
$43.56
, respectively. The total fair value of awards vested was
$26.9 million
,
$16.5 million
and
$14.7 million
, respectively based on the market price of ETP Common Units as of the vesting date. As of
December 31, 2011
, a total of
2,563,709
unit awards remain unvested, for which ETP expects to recognize a total of
$79.4 million
in compensation expense over a weighted average period of
1.9
years.
F - 45
Related Party Awards
McReynolds Energy Partners, L.P., the general partner of which is owned and controlled by an ETE officer, awarded to certain officers of ETP certain rights related to units of ETE previously issued by ETE to such ETE officer. These rights include the economic benefits of ownership of these ETE units based on a
five
-year vesting schedule whereby the officer will vest in the ETE units at a rate of
20%
per year. As these ETE units are conveyed to the recipients of these awards upon vesting from a partnership that is not owned or managed by ETE or ETP, none of the costs related to such awards are paid by ETP or ETE unless this partnership defaults under its obligations pursuant to these unit awards. As these units were outstanding prior to these awards, these awards do not represent an increase in the number of outstanding units of either ETP or ETE and are not dilutive to cash distributions per unit with respect to either ETP or ETE.
ETP is recognizing non-cash compensation expense over the vesting period based on the grant-date fair value of the ETE units awarded to the ETP employees assuming no forfeitures. For the years ended
December 31, 2011
,
2010
and
2009
, ETP recognized non-cash compensation expense, net of forfeitures, of
$2.0 million
,
$3.7 million
and
$6.4 million
, respectively, as a result of these awards. As of
December 31, 2011
, rights related to
180,000
ETE common units remain outstanding, for which ETP expects to recognize a total of
$1.0 million
in compensation expense over a weighted average period of
1.0
years
Regency Unit-Based Compensation Plans
Regency has the following awards outstanding as of
December 31, 2011
:
|
•
|
156,850
Regency Common Unit options, all of which are exercisable, with a weighted average exercise price of
$21.99
per unit option;
|
|
•
|
no
Regency restricted (non-vested) Common Units; and
|
|
•
|
1,086,393
Regency Phantom Units, with a weighted average grant date fair value of
$24.51
per Phantom Unit.
|
In conjunction with the Regency Transactions, certain of Regency’s then-outstanding Phantom Units converted to
252,630
Regency Common Units as a result of change-in-control provisions associated with the awards. Each of Regency’s outstanding Phantom Units as of
December 31, 2011
is the economic equivalent of one Regency Common Unit and is accompanied by a Distribution Equivalent Right, entitling the holder to an amount equal to any cash distributions paid on Regency Common Units. The outstanding Regency Phantom Units will vest one-third on each March 15th through 2013.
Regency expects to recognize
$20.7 million
of compensation expense related to the Regency Phantom Units over a weighted average period of
4.2
years.
10.
REGULATORY MATTERS, COMMITMENTS, CONTINGENCIES, AND ENVIRONMENTAL LIABILITIES:
Regulatory Matter
On September 21, 2011, in lieu of filing a new general rate case filing under Section 4 of the NGA, Transwestern filed a proposed settlement with the FERC, which was approved by the FERC on October 31, 2011. Transwestern is required to file a new general rate case on October 1, 2014. However, shippers which were not parties to the settlement have the right to challenge the lawfulness of tariff rates that have become final and effective. The FERC may also investigate such rates absent shipper complaint.
Guarantee — Fayetteville Express Pipeline LLC
Fayetteville Express Pipeline LLC (“FEP”), a joint venture entity in which ETP owns a
50%
interest, had a credit agreement that provided for a
$1.1 billion
senior revolving credit facility (the “FEP Facility”). ETP guaranteed
50%
of the obligations of FEP under the FEP Facility, with the remainder of FEP Facility obligations guaranteed by Kinder Morgan Energy Partners, L.P. (“KMP”). Amounts borrowed under the FEP Facility bore interest at a rate based on either a Eurodollar rate or Prime Rate.
In July 2011, the FEP Facility was repaid with capital contributions from ETP and KMP totaling
$390 million
along with proceeds from a
$600 million
term loan credit facility maturing in
July 2012
(which can be extended for one year at the option of FEP). Upon closing and funding of the term loan facility, the FEP Facility was terminated. FEP also entered into a
$50 million
revolving credit facility maturing in
July 2015
. FEP's indebtedness under its new credit facilities is not guaranteed by ETP or KMP.
F - 46
Contingent Residual Support Agreement - AmeriGas
In order to finance the cash portion of the purchase price of the Propane Transaction described in Note
3
, AmeriGas Finance LLC ("Finance Company"), a wholly owned subsidiary of AmeriGas, issued
$550 million
in aggregate principal amount of
6.75%
senior notes due 2020 and
$1.0 billion
in aggregate principal amount of
7.00%
senior notes due 2022. AmeriGas borrowed
$1.5 billion
of the proceeds of the Senior Notes issuance from Finance Company through an intercompany borrowing having maturity dates and repayment terms that mirror those of the Senior Notes (the "Supported Debt").
In connection with the closing of the Propane Transaction, ETP entered into and delivered a Contingent Residual Support Agreement ("CRSA") with AmeriGas, Finance Company, AmeriGas Finance Corp. and UGI Corp., pursuant to which ETP will provide contingent, residual support of the Supported Debt as defined in the CRSA.
NGL Pipeline Regulation
ETP and Regency have interests in NGL pipelines located in Texas. ETP and Regency believe that these pipelines do not provide interstate service and that they are thus not subject to the jurisdiction of the FERC under the Interstate Commerce Act (“ICA”) and the Energy Policy of 1992. Under the ICA, tariffs must be just and reasonable and not unduly discriminatory or confer any undue preference. We cannot guarantee that the jurisdictional status of ETP’s and Regency’s NGL facilities will remain unchanged; however, should they be found jurisdictional, the FERC’s rate-making methodologies may limit ETP’s and Regency’s ability to set rates based on their actual costs, may delay or limit the use of rates that reflect increased costs and may subject ETP and Regency to potentially burdensome and expensive operational, reporting and other requirements. Any of the foregoing could adversely affect our business, revenues and cash flow.
Commitments
In the normal course of business, ETP and Regency purchase, process and sell natural gas pursuant to long-term contracts and enter into long-term transportation and storage agreements. Such contracts contain terms that are customary in the industry. ETP has several propane purchase and supply commitments, which are typically
one
year agreements with varying terms as to quantities, prices and expiration dates. ETP believes that the terms of these agreements are commercially reasonable and will not have a material adverse effect on its financial position or results of operations.
We have certain non-cancelable leases for property and equipment, which require fixed monthly rental payments and expire at various dates through
2029
. Rental expense under these operating leases has been included in operating expenses in the accompanying statements of operations and totaled approximately
$29.3 million
,
$23.8 million
and
$19.8 million
for the years ended
December 31, 2011
,
2010
and
2009
, respectively.
Future minimum lease commitments for such leases are:
|
Years Ending December 31:
|
|
||
|
2012
|
$
|
22,480
|
|
|
2013
|
20,667
|
|
|
|
2014
|
17,467
|
|
|
|
2015
|
17,292
|
|
|
|
2016
|
17,283
|
|
|
|
Thereafter
|
152,473
|
|
|
Amounts reflected above do not include future minimum lease commitments for ETP's propane operations, which were deconsolidated in January 2012 in connection with the contribution of ETP's propane operations described in Note 3.
ETP and Regency’s joint venture agreements require that they fund their proportionate share of capital contributions to their unconsolidated affiliates. Such contributions will depend upon their unconsolidated affiliates’ capital requirements, such as for funding capital projects or repayment of long-term obligations.
Litigation and Contingencies
We may, from time to time, be involved in litigation and claims arising out of our operations in the normal course of business. Natural gas and propane are flammable, combustible gases. Serious personal injury and significant property damage can arise in connection with their transportation, storage or use. In the ordinary course of business, we are sometimes threatened with or named as a defendant in various lawsuits seeking actual and punitive damages for product liability, personal injury
F - 47
and property damage. We maintain liability insurance with insurers in amounts and with coverage and deductibles management believes are reasonable and prudent, and which are generally accepted in the industry. However, there can be no assurance that the levels of insurance protection currently in effect will continue to be available at reasonable prices or that such levels will remain adequate to protect us from material expenses related to product liability, personal injury or property damage in the future.
We or our subsidiaries are a party to various legal proceedings and/or regulatory proceedings incidental to our businesses. For each of these matters, we evaluate the merits of the case, our exposure to the matter, possible legal or settlement strategies, the likelihood of an unfavorable outcome and the availability of insurance coverage. If we determine that an unfavorable outcome of a particular matter is probable and can be estimated, we accrue the contingent obligation, as well as any expected insurance recoverable amounts related to the contingency. As of
December 31, 2011
and
2010
, accruals of approximately
$18.2 million
and
$10.2 million
, respectively, were reflected on our balance sheets related to these contingent obligations. As new information becomes available, our estimates may change. The impact of these changes may have a significant effect on our results of operations in a single period.
The outcome of these matters cannot be predicted with certainty, and there can be no assurance that the outcome of a particular matter will not result in the payment of amounts that have not been accrued for the matter. Furthermore, we may revise accrual amounts prior to the resolution of a particular contingency based on changes in facts and circumstances or in the expected outcome.
No
amounts have been recorded in our
December 31, 2011
or
2010
consolidated balance sheets for contingencies and current litigation, other than amounts disclosed herein.
Environmental Matters
Our operations are subject to extensive federal, state and local environmental and safety laws and regulations that require expenditures to ensure compliance, including related to air emissions and wastewater discharges, at operating facilities and for remediation at current and former facilities as well as waste disposal sites. Although we believe our operations are in substantial compliance with applicable environmental laws and regulations, risks of additional costs and liabilities are inherent in the business of transporting, storing, gathering, treating, compressing, blending and processing natural gas, natural gas liquids and other products. As a result, there can be no assurance that significant costs and liabilities will not be incurred. Costs of planning, designing, constructing and operating pipelines, plants and other facilities must incorporate compliance with environmental laws and regulations and safety standards. Failure to comply with these laws and regulations may result in the assessment of administrative, civil and criminal penalties, the imposition of remedial obligations, the issuance of injunctions and the filing of federally authorized citizen suits. Moreover, there can be no assurance that other developments, such as increasingly stringent environmental laws, regulations and enforcement policies thereunder, and claims for damages to property or persons resulting from the operations, will not result in substantial costs and liabilities. We are unable to estimate any losses or range of losses that could result from such developments. Furthermore, we may revise accrual amounts prior to resolution of a particular contingency based on changes in facts and circumstances or changes in the expected outcome.
Our operations are also subject to the requirements of the federal Occupational Safety and Health Act (“OSHA”) and comparable state laws that regulate the protection of the health and safety of employees. In addition, OSHA’s hazardous communication standard requires that information be maintained about hazardous materials used or produced in our operations and that this information be provided to employees, state and local government authorities and citizens. We believe that our operations are in substantial compliance with the OSHA requirements, including general industry standards, record keeping requirements, and monitoring of occupational exposure to regulated substances.
National Fire Protection Association Pamphlets No. 54 and No. 58, which establish rules and procedures governing the safe handling of propane, or comparable regulations, have been adopted as the industry standard in all of the states in which we operate. In some states, these laws are administered by state agencies, and in others, they are administered on a municipal level. With respect to the transportation of propane by truck, we are subject to regulations governing the transportation of hazardous materials under the Federal Motor Carrier Safety Act, administered by the U.S. Department of Transportation (“DOT”). We conduct ongoing training programs to help ensure that our operations are in compliance with applicable regulations. We believe that the procedures currently in effect at all of our facilities for the handling, storage and distribution of propane are consistent with industry standards and are in substantial compliance with applicable laws and regulations.
ETP Environmental Matters
ETP has adopted policies, practices and procedures in the areas of pollution control, product safety, occupational safety and health, and the handling, storage, use, and disposal of hazardous materials to prevent and minimize material environmental or other damage, and to limit the financial liability, which could result from such events. However, the risk of environmental
F - 48
or other damage is inherent in transporting, gathering, treating, compressing, blending and processing natural gas, natural gas liquids and other products, as it is with other entities engaged in similar businesses.
Environmental exposures and liabilities are difficult to assess and estimate due to unknown factors such as the magnitude of possible contamination, the timing and extent of remediation, the determination of ETP’s liability in proportion to other parties, improvements in cleanup technologies and the extent to which environmental laws and regulations may change in the future. Although environmental costs may have a significant impact on the results of operations for any single period, ETP believes that such costs will not have a material adverse effect on its financial position.
As of
December 31, 2011
and
2010
, accruals related to ETP on an undiscounted basis of
$13.7 million
and
$13.8 million
, respectively, were recorded in our consolidated balance sheets as accrued and other current liabilities and other non-current liabilities related to environmental matters.
Based on information available at this time and reviews undertaken to identify potential exposure, ETP believes the amount reserved for environmental matters is adequate to cover the potential exposure for cleanup costs.
Transwestern conducts soil and groundwater remediation at a number of its facilities. Some of the cleanup activities include remediation of several compressor sites on the Transwestern system for contamination by polychlorinated biphenyls (“PCBs”). The costs of this work are not eligible for recovery in rates. ETP’s total accrued future estimated cost of remediation activities expected to continue through
2025
is
$5.7 million
, which is included in the aggregate environmental accruals discussed above. Transwestern received approval from the FERC for the continuation of rate recovery of projected soil and groundwater remediation costs not related to PCBs for the term of its rate case settlement.
Transwestern, as part of ongoing arrangements with customers, continues to incur costs associated with containing and removing potential PCBs. Future costs cannot be reasonably estimated because remediation activities are undertaken as claims are made by customers and former customers. However, such future costs are not expected to have a material impact on our financial position, results of operations or cash flows.
The U.S. Environmental Protection Agency’s (the “EPA”) Spill Prevention, Control and Countermeasures program regulations were recently modified and impose additional requirements on many of ETP’s facilities. ETP expects to expend resources on tank integrity testing and any associated corrective actions as well as potential upgrades to containment structures to comply with the new rules. Costs associated with tank integrity testing and resulting corrective actions cannot be reasonably estimated at this time, but ETP believes such costs will not have a material adverse effect on its financial position, results of operations or cash flows.
Petroleum-based contamination or other environmental wastes are known to be located on or adjacent to
six
sites on which HOLP presently has, or formerly had, retail propane operations. These sites were evaluated at the time of their acquisition. In all cases, remediation operations have been or will be undertaken by others, and in all six cases, HOLP obtained indemnification rights for expenses associated with any remediation from the former owners or related entities. ETP has not been named as a potentially responsible party at any of these sites, and ETP believes that its operations have not contributed to the environmental issues at these sites. Accordingly, no amounts have been recorded in our
December 31, 2011
or
2010
consolidated balance sheets. Based on information currently available to us, the presence of contamination and remediation activities at these sites are not expected to have a material adverse effect on our financial condition or results of operations.
On August 20, 2010, the EPA published new regulations under the federal Clean Air Act ("CAA") to control emissions of hazardous air pollutants from existing stationary reciprocal internal combustion engines. The rule will require ETP to undertake certain expenditures and activities, likely including purchasing and installing emissions control equipment. In response to an industry group legal challenge to portions of the rule in the U.S. Court of Appeals for the D.C. Circuit and a Petition for Administrative Reconsideration to the EPA, on March 9, 2011, the EPA issued a new proposed rule and a direct final rule effective on May 9, 2011 to clarify compliance requirements related to operation and maintenance procedures for continuous parametric monitoring systems. If no further changes to the standard are made as a result of comments to the proposed rule, ETP would not expect that the cost to comply with the rule's requirements will have a material adverse effect on its financial condition or results of operations. Compliance with the final rule is required by October 2013.
On June 29, 2011, the EPA finalized a rule under the CAA that revised the new source performance standards for manufacturers, owners and operators of new, modified and reconstructed stationary internal combustion engines. The rule became effective on August 29, 2011. The rule modifications may require ETP to undertake significant expenditures, including expenditures for purchasing, installing, monitoring and maintaining emissions control equipment, if it replaces equipment or expands existing facilities in the future. At this point, ETP is not able to predict the cost to comply with the rule’s requirements, because the rule applies only to changes ETP might make in the future.
F - 49
ETP’s pipeline operations are subject to regulation by the DOT under the Pipeline Hazardous Materials Safety Administration (“PHMSA”), pursuant to which the PHMSA has established requirements relating to the design, installation, testing, construction, operation, replacement and management of pipeline facilities. Moreover, the PHMSA, through the Office of Pipeline Safety, has promulgated a rule requiring pipeline operators to develop integrity management programs to comprehensively evaluate their pipelines, and take measures to protect pipeline segments located in what the rule refers to as “high consequence areas.” Activities under these integrity management programs involve the performance of internal pipeline inspections, pressure testing or other effective means to assess the integrity of these regulated pipeline segments, and the regulations require prompt action to address integrity issues raised by the assessment and analysis. For the years ended
December 31, 2011
,
2010
and
2009
,
$18.3 million
,
$13.3 million
and
$31.4 million
, respectively, of capital costs and
$14.7 million
,
$15.4 million
and
$18.5 million
, respectively, of operating and maintenance costs have been incurred for pipeline integrity testing. Integrity testing and assessment of all of these assets will continue, and the potential exists that results of such testing and assessment could cause ETP to incur even greater capital and operating expenditures for repairs or upgrades deemed necessary to ensure the continued safe and reliable operation of its pipelines; however, no estimate can be made at this time of the likely range of such expenditures.
11.
PRICE RISK MANAGEMENT ASSETS AND LIABILITIES:
Commodity Price Risk
We are exposed to market risks related to the volatility of natural gas and NGL prices. To manage the impact of volatility from these prices, our subsidiaries utilize various exchange-traded and OTC commodity financial instrument contracts. These contracts consist primarily of futures, swaps and options and are recorded at fair value in our consolidated balance sheets. Following is a description of price risk management activities by segment.
Investment in ETP
ETP injects and holds natural gas in its Bammel storage facility to take advantage of contango markets (i.e., when the price of natural gas is higher in the future than the current spot price. ETP uses financial derivatives to hedge the natural gas held in connection with these arbitrage opportunities.). At the inception of the hedge, ETP will lock in a margin by purchasing gas in the spot market or off peak season and entering into a financial contract to lock in the sale price. If ETP designates the related financial contract as a fair value hedge for accounting purposes, ETP will value the hedged natural gas inventory at current spot market prices along with the financial derivative it uses to hedge it. Changes in the spread between the forward natural gas prices designated as fair value hedges and the physical inventory spot price result in unrealized gains or losses until the underlying physical gas is withdrawn and the related designated derivatives are settled. Once the gas is withdrawn and the designated derivatives are settled, the previously unrealized gains or losses associated with these positions are realized. Unrealized margins represent the unrealized gains or losses from ETP’s derivative instruments using mark-to-market accounting, with changes in the fair value of its derivatives being recorded directly in earnings. These margins fluctuate based upon changes in the spreads between the physical spot price and forward natural gas prices. If the spread narrows between the physical and financial prices, ETP will record unrealized gains or lower unrealized losses. If the spread widens, ETP will record unrealized losses or lower unrealized gains. Typically, as ETP enters the winter months, the spread converges so that it recognizes in earnings the original locked-in spread through either mark-to-market adjustments or the physical withdrawal of natural gas.
ETP is also exposed to market risk on natural gas it retains for fees in its intrastate transportation and storage operations and operational gas sales in its interstate transportation operations. ETP uses financial derivatives to hedge the sales price of this gas, including futures, swaps and options. Certain contracts that qualify for hedge accounting are designated as cash flow hedges of the forecasted sale of natural gas. The change in value, to the extent the contracts are effective, remains in AOCI until the forecasted transaction occurs. When the forecasted transaction occurs, any gain or loss associated with the derivative is recorded in cost of products sold in the consolidated statements of operations.
During the fourth quarter of 2011, ETP's trading activities included the use of financial commodity derivatives to take advantage of market opportunities. These trading activities are a complement to ETP's transportation and storage segment's operations and are accounted for in cost of products sold in our consolidated statement of operations. As a result of ETP's trading activities and the use of derivative financial instruments in ETP's transportation and storage operations, the degree of earnings volatility that can occur may be significant, favorably or unfavorably, from period to period. ETP attempts to manage this volatility through the use of daily position and profit and loss reports provided to its risk oversight committee, which includes members of senior management, and the limits and authorizations set forth in ETP's commodity risk management policy.
F - 50
Derivatives are utilized in ETP’s midstream operations in order to mitigate price volatility and manage fixed price exposure incurred from contractual obligations. ETP attempts to maintain balanced positions in its marketing activities to protect against volatility in the energy commodities markets; however, net unbalanced positions can exist. Long-term physical contracts are tied to index prices. System gas, which is also tied to index prices, is expected to provide most of the gas required by its long-term physical contracts. When third-party gas is required to supply long-term contracts, a hedge is put in place to protect the margin on the contract. To the extent that financial contracts are not tied to physical delivery, are expected to be offset with financial contracts to balance ETP’s positions. To the extent open commodity positions exist, fluctuating commodity prices can impact its financial position and results of operations, either favorably or unfavorably.
ETP’s propane operations permitted customers to guarantee the propane delivery price for the next heating season. As ETP executed fixed sales price contracts with its customers, it entered into propane futures contracts to fix the purchase price related to these sales contracts, thereby locking in a gross profit margin. Additionally, ETP used propane futures contracts to secure the purchase price of its propane inventory for a percentage of its anticipated propane sales.
The following table details ETP’s outstanding commodity-related derivatives:
|
|
December 31, 2011
|
December 31, 2010
|
|||||||
|
|
Notional
Volume
|
Maturity
|
Notional
Volume
|
Maturity
|
|||||
|
Mark-to-Market Derivatives
|
|||||||||
|
Natural Gas:
|
|||||||||
|
Basis Swaps IFERC/NYMEX (MMBtu) - trading
(1)
|
(151,260,000
|
)
|
2012-2013
|
—
|
|
—
|
|||
|
Basis Swaps IFERC/NYMEX (MMBtu) - non-trading
|
(61,420,000
|
)
|
2012-2013
|
(38,897,500
|
)
|
2011
|
|||
|
Swing Swaps IFERC (MMBtu)
|
92,370,000
|
|
2012-2013
|
(19,720,000
|
)
|
2011
|
|||
|
Fixed Swaps/Futures (MMBtu)
|
797,500
|
|
2012
|
(2,570,000
|
)
|
2011
|
|||
|
Forward Physical Contracts (MMBtu)
|
(10,672,028
|
)
|
2012
|
—
|
|
—
|
|||
|
Options — Calls (MMBtu)
|
—
|
|
—
|
(3,000,000
|
)
|
2011
|
|||
|
Propane:
|
|||||||||
|
Forwards/Swaps (Gallons)
|
38,766,000
|
|
2012-2013
|
1,974,000
|
|
2011
|
|||
|
Fair Value Hedging Derivatives
|
|||||||||
|
Natural Gas:
|
|||||||||
|
Basis Swaps IFERC/NYMEX (MMBtu)
|
(28,752,500
|
)
|
2012
|
(28,050,000
|
)
|
2011
|
|||
|
Fixed Swaps/Futures (MMBtu)
|
(45,822,500
|
)
|
2012
|
(39,105,000
|
)
|
2011
|
|||
|
Hedged Item — Inventory (MMBtu)
|
45,822,500
|
|
2012
|
39,105,000
|
|
2011
|
|||
|
Cash Flow Hedging Derivatives
|
|||||||||
|
Natural Gas:
|
|||||||||
|
Fixed Swaps/Futures (MMBtu)
|
—
|
|
—
|
(210,000
|
)
|
2011
|
|||
|
Options — Puts (MMBtu)
|
3,600,000
|
|
2012
|
26,760,000
|
|
2011-2012
|
|||
|
Options — Calls (MMBtu)
|
(3,600,000
|
)
|
2012
|
(26,760,000
|
)
|
2011-2012
|
|||
|
Propane:
|
|||||||||
|
Forwards/Swaps (Gallons)
|
—
|
|
—
|
32,466,000
|
|
2011
|
|||
(1)
Includes aggregate amounts for open positions related to Houston Ship Channel, Waha Hub, NGPL TexOk, West Louisiana and Henry Hub locations.
We expect
gains
of
$6.4 million
related to ETP’s commodity derivatives to be reclassified into earnings over the next 12 months related to amounts currently reported in AOCI. The amount ultimately realized, however, will differ as commodity prices change and the underlying physical transaction occurs.
F - 51
Investment in Regency
Regency is a net seller of NGLs, condensate and natural gas as a result of its gathering and processing operations. The prices of these commodities are impacted by changes in the supply and demand as well as market forces. Regency’s profitability and cash flow are affected by the inherent volatility of these commodities, which could adversely affect its ability to make distributions to its unitholders. Regency manages this commodity price exposure through an integrated strategy that includes management of its contract portfolio, matching sales prices of commodities with purchases, optimization of its portfolio by monitoring basis and other price differentials in operating areas, and the use of derivative contracts. In some cases, Regency may not be able to match pricing terms or to cover its risk to price exposure with financial hedges, and it may be exposed to commodity price risk. Speculative positions are prohibited under Regency’s policy.
Regency is exposed to market risks associated with commodity prices, counterparty credit, and interest rates. Regency’s management and the board of directors of Regency GP have established comprehensive risk management policies and procedures to monitor and manage these market risks. Regency GP is responsible for delegation of transaction authority levels, and the Risk Management Committee of Regency GP is responsible for the overall management of credit risk and commodity price risk, including monitoring exposure limits. Regency GP’s Risk Management Committee receives regular briefings on positions and exposures, credit exposures, and overall risk management in the context of market activities.
Regency’s Preferred Units (see Note
7
) contain embedded derivatives which are required to be bifurcated and accounted for separately, such as the holders’ conversion option and Regency’s call option. These embedded derivatives are accounted for using mark-to-market accounting. Regency does not expect the embedded derivatives to affect its cash flows.
The following table details Regency’s outstanding commodity-related derivatives:
|
|
December 31, 2011
|
December 31, 2010
|
|||||||
|
|
Notional
Volume
|
Maturity
|
Notional
Volume
|
Maturity
|
|||||
|
Cash Flow Hedging Derivatives
|
|||||||||
|
Natural Gas:
|
|||||||||
|
Fixed Swaps/Futures (MMBtu)
|
2,198,000
|
|
2012
|
3,830,000
|
|
2011
|
|||
|
Propane:
|
|||||||||
|
Forwards/Swaps (Gallons)
|
11,802,000
|
|
2012-2013
|
18,648,000
|
|
2011-2012
|
|||
|
Natural Gas Liquids:
|
|||||||||
|
Forwards/Swaps (Barrels)
|
533,000
|
|
2012-2013
|
1,212,110
|
|
2011-2012
|
|||
|
Options - Puts (Barrels)
|
110,000
|
|
2012
|
—
|
|
—
|
|||
|
WTI Crude Oil:
|
|||||||||
|
Forwards/Swaps (Barrels)
|
350,000
|
|
2012-2014
|
373,655
|
|
2011-2012
|
|||
As of December 31, 2011 all of the Regency's commodity swap contracts were accounted for as cash flow hedges, and the Regency's put options were accounted for on mark-to-market basis. On January 1, 2012, Regency, for accounting purposes, de-designated its swap contracts and will account for these contracts using the mark-to-market method of accounting. Upon the de-designation of these trades Regency has
$4.8 million
in net hedging losses in accumulated other comprehensive income which will be amortized to earnings over the next
2.25
years, of which
$5.2 million
will be reclassified into earnings over the next 12 months.
F - 52
Interest Rate Risk
We are exposed to market risk for changes in interest rates. In order to maintain a cost effective capital structure, we borrow funds using a mix of fixed rate debt and variable rate debt. We manage our current interest rate exposures by utilizing interest rate swaps to achieve a desired mix of fixed and variable rate debt. We also utilize forward starting interest rate swaps to lock in the rate on a portion of anticipated debt issuances. The following is a summary of interest rate swaps outstanding as of
December 31, 2011
, none of which are designated as hedges for accounting purposes:
|
|
|
|
Notional Amount
Outstanding
|
|||||||||
|
Entity
|
Term
|
Type
(1)
|
December 31, 2011
|
December 31, 2010
|
||||||||
|
ETP
|
May 2012
(2)
|
Forward starting to pay a fixed rate of 2.59% and receive a floating rate
|
$
|
350,000
|
|
$
|
—
|
|
||||
|
ETP
|
August 2012
(2)
|
Forward starting to pay a fixed rate of 3.51% and receive a floating rate
|
500,000
|
|
400,000
|
|
||||||
|
ETP
|
July 2013
(2)
|
Forward starting to pay a fixed rate of 4.02% and receive a floating rate
|
300,000
|
|
—
|
|
||||||
|
ETP
|
July 2018
|
Pay a floating rate plus a spread of 4.01% and receive a fixed rate of 6.70%
|
500,000
|
|
500,000
|
|
||||||
|
Regency
|
April 2012
|
Pay a fixed rate of 1.325% and receive a floating rate
|
250,000
|
|
250,000
|
|
||||||
|
(1)
|
Floating rates are based on LIBOR.
|
|
(2)
|
Represents the effective date. These forward starting swaps have a term of
10
years with a mandatory termination date the same as the effective date.
|
In connection with ETE’s offering of senior notes in September 2010, ETE terminated interest rate swaps with an aggregate notional amount of
$1.5 billion
and recognized in interest expense
$66.4 million
of realized losses on terminated interest rate swaps that had been accounted for as cash flow hedges. In addition to the
$66.4 million
of realized losses on hedged interest rate swaps, ETE also paid
$102.2 million
to terminate non-hedged interest rate swaps. The
$102.2 million
of realized losses on non-hedged interest rate swaps had previously been recognized in net income and therefore the termination of the non-hedged swaps did not impact earnings. The total cash paid to terminate interest rate swaps was
$168.6 million
, including realized losses on hedged and non-hedged swaps.
Credit Risk
We maintain credit policies with regard to our counterparties that we believe minimize our overall credit risk. These policies include an evaluation of potential counterparties’ financial condition (including credit ratings), collateral requirements under certain circumstances and the use of standardized agreements, which allow for netting of positive and negative exposures associated with a single or multiple counterparties.
Our counterparties consist primarily of petrochemical companies and other industrial, small to major oil and gas producers, midstream and power generation companies. This concentration of counterparties may impact our overall exposure to credit risk, either positively or negatively in that the counterparties may be similarly affected by changes in economic, regulatory or other conditions. Currently, management does not anticipate a material adverse effect on financial our position or results of operations as a result of counterparty nonperformance.
ETP utilizes master-netting agreements and have maintenance margin deposits with certain counterparties in the OTC market and with clearing brokers. Payments on margin deposits are required when the value of a derivative exceeds its pre-established credit limit with the counterparty. Margin deposits are returned to ETP on the settlement date for non-exchange traded derivatives. ETP exchanges margin calls on a daily basis for exchange traded transactions. Since the margin calls are made daily with the exchange brokers, the fair value of the financial derivative instruments are deemed current and netted in deposits paid to vendors within other current assets in the consolidated balance sheets. ETP had net deposits with counterparties of
$66.2 million
and
$52.2 million
as of
December 31, 2011
and
2010
, respectively.
F - 53
Regency is exposed to credit risk from its derivative counterparties. Although Regency does not require collateral from these counterparties, Regency deals primarily with financial institutions when entering into financial derivatives, and enters into Master International Swap Dealers Association (“ISDA”) Agreements that allow for netting of swap contract receivables and payables in the event of default by either party.
For financial instruments, failure of a counterparty to perform on a contract could result in our inability to realize amounts that have been recorded on our consolidated balance sheets and recognized in net income or other comprehensive income.
Derivative Summary
The following table provides a balance sheet overview of the Partnership’s derivative assets and liabilities as of
December 31, 2011
and
2010
:
|
|
Fair Value of Derivative Instruments
|
||||||||||||||
|
|
Asset Derivatives
|
Liability Derivatives
|
|||||||||||||
|
|
2011
|
2010
|
2011
|
2010
|
|||||||||||
|
Derivatives designated as hedging instruments:
|
|||||||||||||||
|
Commodity derivatives (margin deposits)
|
$
|
77,197
|
|
$
|
35,031
|
|
$
|
(819
|
)
|
$
|
(6,631
|
)
|
|||
|
Commodity derivatives
|
4,539
|
|
9,263
|
|
(10,128
|
)
|
(14,692
|
)
|
|||||||
|
81,736
|
|
44,294
|
|
(10,947
|
)
|
(21,323
|
)
|
||||||||
|
Derivatives not designated as hedging instruments:
|
|||||||||||||||
|
Commodity derivatives (margin deposits)
|
$
|
227,337
|
|
$
|
64,940
|
|
$
|
(251,268
|
)
|
$
|
(72,729
|
)
|
|||
|
Commodity derivatives
|
1,017
|
|
275
|
|
(4,844
|
)
|
—
|
|
|||||||
|
Interest rate derivatives
|
36,301
|
|
20,790
|
|
(117,490
|
)
|
(20,922
|
)
|
|||||||
|
Embedded derivatives in Regency Preferred Units
|
—
|
|
—
|
|
(39,049
|
)
|
(57,023
|
)
|
|||||||
|
264,655
|
|
86,005
|
|
(412,651
|
)
|
(150,674
|
)
|
||||||||
|
Total derivatives
|
$
|
346,391
|
|
$
|
130,299
|
|
$
|
(423,598
|
)
|
$
|
(171,997
|
)
|
|||
The commodity derivatives (margin deposits) are recorded in “Other current assets” on our consolidated balance sheets. The remainder of the derivatives are recorded in “Price risk management assets/liabilities.”
We disclose the non-exchange traded financial derivative instruments as price risk management assets and liabilities on our consolidated balance sheets at fair value with amounts classified as either current or long-term depending on the anticipated settlement date.
The following tables summarize the amounts recognized with respect to our derivative financial instruments for the periods presented:
|
|
Change in Value Recognized in OCI
on Derivatives (Effective Portion)
|
||||||||||
|
|
Years Ended December 31,
|
||||||||||
|
|
2011
|
2010
|
2009
|
||||||||
|
Derivatives in cash flow hedging relationships:
|
|||||||||||
|
Commodity derivatives
|
$
|
6,369
|
|
$
|
49,665
|
|
$
|
3,143
|
|
||
|
Interest rate derivatives
|
—
|
|
(29,980
|
)
|
(14,705
|
)
|
|||||
|
Total
|
$
|
6,369
|
|
$
|
19,685
|
|
$
|
(11,562
|
)
|
||
F - 54
|
|
Location of
Gain/(Loss) Reclassified
from AOCI into Income
(Effective Portion)
|
Amount of Gain/(Loss) Reclassified from
AOCI into Income (Effective Portion)
|
||||||||||||
|
|
Years Ended December 31,
|
|||||||||||||
|
|
2011
|
2010
|
2009
|
|||||||||||
|
Derivatives in cash flow hedging relationships:
|
||||||||||||||
|
Commodity derivatives
|
Cost of products sold
|
$
|
18,685
|
|
$
|
37,325
|
|
$
|
9,924
|
|
||||
|
Interest rate derivatives
|
Interest expense, net
|
—
|
|
(86,697
|
)
|
(26,882
|
)
|
|||||||
|
Total
|
$
|
18,685
|
|
$
|
(49,372
|
)
|
$
|
(16,958
|
)
|
|||||
|
|
Location of
Gain/(Loss) Reclassified
from AOCI into Income
(Ineffective Portion)
|
Amount of Gain/(Loss) Recognized
in Income on Ineffective Portion
|
||||||||||||
|
|
Years Ended December 31,
|
|||||||||||||
|
|
2011
|
2010
|
2009
|
|||||||||||
|
Derivatives in cash flow hedging relationships:
|
||||||||||||||
|
Commodity derivatives
|
Cost of products sold
|
$
|
286
|
|
$
|
(70
|
)
|
$
|
—
|
|
||||
|
Total
|
$
|
286
|
|
$
|
(70
|
)
|
$
|
—
|
|
|||||
|
|
Location of Gain/(Loss)
Recognized in
Income on Derivatives
|
Amount of Gain/(Loss) Recognized in Income
Representing Hedge Ineffectiveness and
Amount Excluded from the Assessment of
Effectiveness
|
||||||||||||
|
|
Years Ended December 31,
|
|||||||||||||
|
|
2011
|
2010
|
2009
|
|||||||||||
|
Derivatives in fair value hedging relationships (including hedged item):
|
||||||||||||||
|
Commodity derivatives
|
Cost of products sold
|
$
|
34,000
|
|
$
|
16,210
|
|
$
|
60,045
|
|
||||
|
Total
|
$
|
34,000
|
|
$
|
16,210
|
|
$
|
60,045
|
|
|||||
|
|
Location of Gain/
(Loss) Recognized in
Income on Derivatives
|
Amount of Gain/(Loss) Recognized
in Income on Derivatives
|
||||||||||||
|
|
Years Ended December 31,
|
|||||||||||||
|
|
2011
|
2010
|
2009
|
|||||||||||
|
Derivatives in cash flow hedging relationships:
|
||||||||||||||
|
Commodity derivatives – non-trading
|
Cost of products sold
|
$
|
9,199
|
|
$
|
3,806
|
|
$
|
99,807
|
|
||||
|
Commodity derivatives – trading
|
Cost of products sold
|
(29,777
|
)
|
—
|
|
—
|
|
|||||||
|
Interest rate derivatives
|
Gains (losses) on non-hedged interest rate derivatives
|
(77,804
|
)
|
(52,357
|
)
|
33,619
|
|
|||||||
|
Embedded derivatives
|
Other income (expense)
|
17,974
|
|
(8,390
|
)
|
—
|
|
|||||||
|
Total
|
$
|
(80,408
|
)
|
$
|
(56,941
|
)
|
$
|
133,426
|
|
|||||
We recognized
$20.8 million
,
$70.5 million
and
$18.6 million
of unrealized
losses
on commodity derivatives not in fair value hedging relationships (including the ineffective portion of commodity derivatives in cash flow hedging relationships and amounts classified as trading activity) for the years ended
December 31, 2011
,
2010
and
2009
, respectively. In addition, for the years ended
December 31, 2011
,
2010
and
2009
, we recognized unrealized
gains
of
$9.5 million
,
$17.4 million
and
$48.6 million
, respectively, on commodity derivatives and related hedged inventory accounted for as fair value hedges.
F - 55
12.
RETIREMENT BENEFITS:
We have a 401(k) savings plan which covers virtually all employees, including those of ETP and Regency. Employer matching contributions are calculated using a formula based on employee contributions. We have made matching contributions of
$14.0 million
,
$9.8 million
and
$9.8 million
to the 401(k) savings plan for the years ended
December 31, 2011
,
2010
and
2009
, respectively.
Regency previously sponsored its own 401(k) plan. Effective January 1, 2011, Regency’s 401(k) plan merged with and into that of ETP. As a result of the Regency Transactions, Regency’s matching contributions that had not yet fully vested became fully vested effective immediately. Regency made matching contributions of
$2.0 million
to its own 401(k) savings plan for period from May 26, 2010 to December 31, 2010.
13.
RELATED PARTY TRANSACTIONS:
The Parent Company has agreements with subsidiaries to provide or receive various general and administrative services. For the year ended
December 31, 2011
and from May 26, 2010 to December 31,
2010
the Parent Company received
$16.6 million
and
$5.8 million
, respectively, from Regency related to these services. For the years ended
December 31, 2011
,
2010
and
2009
, the Parent Company paid
$17.1 million
,
$6.3 million
and
$0.5 million
, respectively, to ETP related to these services. The increase in payments to ETP was the result of increased service fees related to the provision of various general and administrative services for Regency. The management fees received from Regency for the year ended
December 31, 2011
include the reimbursement of various general and administrative services of
$6.6 million
for expenses incurred by ETP on behalf of Regency. These amounts have been eliminated in our consolidated financial statements.
On January 18, 2012, Enterprise Products Partners L.P. ("Enterprise") sold a significant portion of its ownership in our limited partner interest. Subsequent to that transaction Enterprise owns less than
5%
of our outstanding common units. Prior to this transaction, Enterprise and its affiliates were considered related parties for financial reporting purposes.
ETP and Enterprise transport natural gas on each other’s pipelines, share operating expenses on jointly-owned pipelines and ETP sells natural gas and compression equipment to Enterprise. ETP’s propane operations routinely buy and sell product with Enterprise. Regency sells natural gas and NGLs to, and incurs NGL processing fees with Enterprise. ETP’s propane operations purchase a portion of its propane requirements from Enterprise pursuant to an agreement that expires in
March 2015
, and includes an option to extend the agreement for an additional year. The following table presents sales to and purchases from Enterprise, including Regency transactions subsequent to May 26, 2010:
|
|
Years Ended December 31,
|
||||||||||
|
|
2011
|
2010
|
2009
|
||||||||
|
ETP’s Natural Gas Operations:
|
|||||||||||
|
Sales
|
$
|
654,129
|
|
$
|
538,657
|
|
$
|
414,333
|
|
||
|
Purchases
|
26,992
|
|
23,592
|
|
48,528
|
|
|||||
|
Regency’s Natural Gas Operations:
|
|||||||||||
|
Sales
|
376,542
|
|
142,631
|
|
—
|
|
|||||
|
Purchases
|
9,427
|
|
4,606
|
|
—
|
|
|||||
|
ETP’s Propane Operations:
|
|||||||||||
|
Sales
|
10,613
|
|
15,527
|
|
19,961
|
|
|||||
|
Purchases
|
471,046
|
|
415,897
|
|
343,540
|
|
|||||
As of
December 31, 2011
and
2010
, Titan, had forward mark-to-market derivatives for approximately
38.8 million
and
1.7 million
gallons of propane at a fair value liability of
$4.1 million
and a fair value asset of
$0.2 million
, respectively, with Enterprise. In addition, as of December 31, 2010, Titan had forward derivatives accounted for as cash flow hedges of
32.5 million
gallons of propane at a fair value asset of
$6.6 million
with Enterprise. ETP’s propane operations discontinued cash flow hedge accounting in July 2011; therefore, all of their forward derivatives are currently accounted for using mark-to-market accounting.
F - 56
For the year ended
December 31, 2011
revenue of
$1.9 million
and cost of products sold of
$1.2 million
are included in our consolidated statements of operations related to transactions with FEP, ETP’s unconsolidated affiliate. For the year ended
December 31, 2010
revenue of
$26.0 million
and cost of products sold of
$20.5 million
are included in our consolidated statements of operations related to transactions with FEP, ETP’s unconsolidated affiliate.
Under a master services agreement with HPC, Regency operates and provides all employees and services for the operation and management of HPC. The related party general administrative expenses reimbursed to Regency were
$16.8 million
and
$9.8 million
, respectively, for year ended
December 31, 2011
and for the period from May 26, 2010 to December 31, 2010.
The following table summarizes the related party balances on our consolidated balance sheets:
|
|
As of December 31,
|
|||||||
|
|
2011
|
2010
|
||||||
|
Accounts receivable from related parties:
|
||||||||
|
Enterprise:
|
||||||||
|
ETP’s Natural Gas Operations
|
$
|
54,644
|
|
$
|
36,736
|
|
||
|
Regency’s Natural Gas Operations
|
41,781
|
|
25,539
|
|
||||
|
ETP’s Propane Operations
|
—
|
|
2,327
|
|
||||
|
Other
|
3,981
|
|
11,729
|
|
||||
|
Total accounts receivable from related parties
|
$
|
100,406
|
|
76,331,000
|
|
$
|
76,331
|
|
|
Accounts payable to related parties:
|
||||||||
|
Enterprise:
|
||||||||
|
ETP’s Natural Gas Operations
|
$
|
2,198
|
|
$
|
2,687
|
|
||
|
Regency’s Natural Gas Operations
|
1,469
|
|
1,323
|
|
||||
|
ETP’s Propane Operations
|
27,770
|
|
22,985
|
|
||||
|
Other
|
1,771
|
|
356
|
|
||||
|
Total accounts payable to related parties
|
$
|
33,208
|
|
$
|
27,351
|
|
||
|
ETP’s net imbalance receivable from (payable to) Enterprise
|
$
|
(780
|
)
|
$
|
1,360
|
|
||
|
Regency’s net imbalance receivable from Enterprise
|
$
|
2,008
|
|
$
|
753
|
|
||
Effective August 17, 2009, ETP acquired 100% of the membership interests of ETG, which owns all of the partnership interests of Energy Transfer Technologies, Ltd. (“ETT”). ETT provides compression services to customers engaged in the transportation of natural gas, including ETP. The membership interests of ETG were contributed to ETP by its Chief Executive Officer and by two entities, one of which is controlled by a director of the General Partner of ETP’s general partner and the other of which is controlled by a member of ETP’s management. In exchange, the former members acquired the right to receive (in cash or Common Units) future amounts to be determined based on the terms of the contribution arrangement. These contingent amounts are to be determined in 2014 and 2017, and the former members of ETG may receive payments contingent on the acquired operations performing at a level above the average return required by ETP for approval of its own growth projects during the period since acquisition. In addition, the former members may be required to make cash payments to ETP under certain circumstances. ETP has not accrued any contingent payments related to this agreement.
Subsequent to the acquisition of ETG, ETP is obligated to pay
$4.7 million
in operating lease payments per year to the former owners for the use of compressor equipment through 2017.
F - 57
14.
REPORTABLE SEGMENTS:
As a result of the Regency Transactions in May 2010, our reportable segments were re-evaluated and currently reflect two reportable segments, both of which conduct their business exclusively in the United States of America, as follows:
|
•
|
Investment in ETP - Reflects the consolidated operations of ETP.
|
|
•
|
Investment in Regency - Reflects the consolidated operations of Regency.
|
Each of the respective general partners of ETP and Regency have separate operating management and boards of directors. We control ETP and Regency through our ownership of their respective general partners. See further discussion of ETP and Regency’s operations in Note
1
.
We evaluate the performance of our operating segments based on net income. The following tables present financial information by segment. The amounts reflected as “Corporate and Other” include the Parent Company activity and the goodwill and property, plant and equipment fair value adjustments recorded as a result of the 2004 reverse acquisition of Heritage Propane Partners, L.P.
ETP and Regency related party transactions are generally based on transactions made at market-related rates. Consolidated revenues and expenses reflect the elimination of all material intercompany transactions.
The following tables present the financial information by segment for the following periods:
|
Investment
in ETP
|
Investment
in Regency
|
Corporate
and Other
|
Adjustments
and
Eliminations
|
Total
|
|||||||||||||||
|
Year Ended December 31, 2011
|
|||||||||||||||||||
|
Revenues from external customers
|
$
|
6,812,431
|
|
$
|
1,425,859
|
|
$
|
—
|
|
$
|
2,413
|
|
$
|
8,240,703
|
|
||||
|
Intersegment revenues
|
38,009
|
|
8,039
|
|
—
|
|
(46,048
|
)
|
—
|
|
|||||||||
|
Depreciation and amortization
|
430,904
|
|
168,684
|
|
12,221
|
|
—
|
|
611,809
|
|
|||||||||
|
Interest expense, net of interest capitalized
|
474,113
|
|
102,474
|
|
163,622
|
|
(398
|
)
|
739,811
|
|
|||||||||
|
Equity in earnings of affiliates
|
25,836
|
|
119,540
|
|
—
|
|
(28,188
|
)
|
117,188
|
|
|||||||||
|
Income tax expense (benefit)
|
18,815
|
|
465
|
|
(2,397
|
)
|
—
|
|
16,883
|
|
|||||||||
|
Net income (loss)
|
697,162
|
|
73,619
|
|
(214,346
|
)
|
(28,188
|
)
|
528,247
|
|
|||||||||
|
Year Ended December 31, 2010
|
|||||||||||||||||||
|
Revenues from external customers
|
$
|
5,884,786
|
|
$
|
715,324
|
|
$
|
—
|
|
$
|
(1,978
|
)
|
$
|
6,598,132
|
|
||||
|
Intersegment revenues
|
41
|
|
1,289
|
|
—
|
|
(1,330
|
)
|
—
|
|
|||||||||
|
Depreciation and amortization
|
343,011
|
|
75,967
|
|
12,221
|
|
—
|
|
431,199
|
|
|||||||||
|
Interest expense, net of interest capitalized
|
412,553
|
|
48,251
|
|
167,669
|
|
(3,586
|
)
|
624,887
|
|
|||||||||
|
Equity in earnings of affiliates
|
11,727
|
|
53,493
|
|
—
|
|
—
|
|
65,220
|
|
|||||||||
|
Income tax expense (benefit)
|
15,536
|
|
552
|
|
(2,350
|
)
|
—
|
|
13,738
|
|
|||||||||
|
Net income (loss)
|
617,222
|
|
(5,972
|
)
|
(274,670
|
)
|
—
|
|
336,580
|
|
|||||||||
|
Year Ended December 31, 2009
|
|||||||||||||||||||
|
Revenues from external customers
|
$
|
5,417,295
|
|
$
|
—
|
|
$
|
—
|
|
$
|
—
|
|
$
|
5,417,295
|
|
||||
|
Intersegment revenues
|
—
|
|
—
|
|
—
|
|
—
|
|
—
|
|
|||||||||
|
Depreciation and amortization
|
312,803
|
|
—
|
|
12,221
|
|
—
|
|
325,024
|
|
|||||||||
|
Interest expense, net of interest capitalized
|
394,274
|
|
—
|
|
74,146
|
|
—
|
|
468,420
|
|
|||||||||
|
Equity in earnings of affiliates
|
20,597
|
|
—
|
|
—
|
|
—
|
|
20,597
|
|
|||||||||
|
Income tax expense (benefit)
|
12,777
|
|
—
|
|
(3,548
|
)
|
—
|
|
9,229
|
|
|||||||||
|
Net income (loss)
|
791,542
|
|
—
|
|
(93,671
|
)
|
—
|
|
697,871
|
|
|||||||||
F - 58
|
|
As of December 31,
|
||||||||||
|
|
2011
|
2010
|
2009
|
||||||||
|
Total assets:
|
|||||||||||
|
Investment in ETP
|
$
|
15,518,616
|
|
$
|
12,149,992
|
|
$
|
11,734,972
|
|
||
|
Investment in Regency
|
5,567,856
|
|
4,770,204
|
|
—
|
|
|||||
|
Corporate and Other
|
470,086
|
|
469,221
|
|
431,109
|
|
|||||
|
Adjustments and Eliminations
|
(659,765
|
)
|
(10,687
|
)
|
(5,572
|
)
|
|||||
|
Total
|
$
|
20,896,793
|
|
$
|
17,378,730
|
|
$
|
12,160,509
|
|
||
|
|
Years Ended December 31,
|
||||||||||
|
|
2011
|
2010
|
2009
|
||||||||
|
Additions to property, plant and equipment including acquisitions, net of contributions in aid of construction costs (accrual basis):
|
|||||||||||
|
Investment in ETP
(1)
|
$
|
2,921,865
|
|
$
|
1,470,001
|
|
$
|
680,780
|
|
||
|
Investment in Regency
(2)
|
410,814
|
|
2,068,328
|
|
—
|
|
|||||
|
Total
|
$
|
3,332,679
|
|
$
|
3,538,329
|
|
$
|
680,780
|
|
||
(1)
The year ended December 31, 2011 includes
$1.42 billion
acquired in the LDH Acquisition.
(2)
The year ended December 31, 2010 includes
$1.55 billion
acquired in the Regency Transactions.
|
|
As of December 31,
|
||||||||||
|
|
2011
|
2010
|
2009
|
||||||||
|
Advances to and investments in affiliates:
|
|||||||||||
|
Investment in ETP
|
$
|
200,612
|
|
$
|
8,723
|
|
$
|
663,298
|
|
||
|
Investment in Regency
|
1,924,705
|
|
1,351,256
|
|
—
|
|
|||||
|
Adjustments and Eliminations
|
(628,717
|
)
|
—
|
|
—
|
|
|||||
|
Total
|
$
|
1,496,600
|
|
$
|
1,359,979
|
|
$
|
663,298
|
|
||
The following tables provide revenues, grouped by similar products and services, for both ETP and Regency. These amounts include transactions between ETP and Regency.
Investment in ETP
|
|
Years Ended December 31,
|
||||||||||
|
|
2011
|
2010
|
2009
|
||||||||
|
Intrastate Transportation and Storage
|
$
|
2,397,887
|
|
$
|
2,075,217
|
|
$
|
1,773,528
|
|
||
|
Interstate Transportation
|
446,743
|
|
292,419
|
|
270,213
|
|
|||||
|
Midstream
|
2,041,600
|
|
1,955,627
|
|
2,060,451
|
|
|||||
|
NGL Transportation and Services
|
362,701
|
|
—
|
|
—
|
|
|||||
|
Retail Propane and Other Retail Propane Related
|
1,468,082
|
|
1,419,646
|
|
1,292,583
|
|
|||||
|
All Other
|
133,427
|
|
141,918
|
|
20,520
|
|
|||||
|
Total revenues
|
$
|
6,850,440
|
|
$
|
5,884,827
|
|
$
|
5,417,295
|
|
||
F - 59
Investment in Regency
|
|
Years Ended December 31,
|
||||||||||
|
|
2011
|
2010
|
2009
|
||||||||
|
Gathering and Processing
|
$
|
1,226,260
|
|
$
|
606,944
|
|
$
|
—
|
|
||
|
Joint Ventures
|
—
|
|
—
|
|
—
|
|
|||||
|
Contract Compression
|
150,496
|
|
86,099
|
|
—
|
|
|||||
|
Contract Treating
|
39,604
|
|
13,662
|
|
—
|
|
|||||
|
Corporate and Others
|
17,538
|
|
9,908
|
|
—
|
|
|||||
|
Total revenues
|
$
|
1,433,898
|
|
$
|
716,613
|
|
$
|
—
|
|
||
15.
QUARTERLY FINANCIAL DATA (UNAUDITED):
Summarized unaudited quarterly financial data is presented below. Earnings per unit are computed on a stand-alone basis for each quarter and total year. ETP’s propane operations are seasonal due to weather conditions in their service areas. Propane sales to residential and commercial customers are affected by winter heating season requirements, which generally results in higher operating revenues and net income during the period from October through March of each year and lower operating revenues and either net losses or lower net income during the period from April through September of each year. Sales to commercial and industrial customers are less weather sensitive. ETP’s
Energy Transfer Company (“ETC OLP”)
business is also seasonal due to the operations of ET Fuel System and the HPL System. We expect margin related to the HPL System operations to be higher during the periods from November through March of each year and lower during the periods from April through October of each year due to the increased demand for natural gas during the cold weather. However, we cannot assure that management’s expectations will be fully realized in the future and in what time period due to various factors including weather, availability of natural gas in regions in which we operate, competitive factors in the energy industry, and other issues.
|
|
Quarter Ended
|
|
|||||||||||||||||
|
|
March 31
|
June 30
|
September 30
|
December 31
|
Total Year
|
||||||||||||||
|
2011:
|
|||||||||||||||||||
|
Revenues
|
$
|
1,989,120
|
|
$
|
1,974,906
|
|
$
|
2,097,866
|
|
$
|
2,178,811
|
|
$
|
8,240,703
|
|
||||
|
Gross margin
|
787,694
|
|
710,754
|
|
744,829
|
|
814,427
|
|
3,057,704
|
|
|||||||||
|
Operating income
|
364,243
|
|
260,561
|
|
270,008
|
|
340,007
|
|
1,234,819
|
|
|||||||||
|
Net income
|
199,092
|
|
106,652
|
|
60,699
|
|
161,804
|
|
528,247
|
|
|||||||||
|
Limited Partners’ interest in net income
|
88,366
|
|
66,080
|
|
68,869
|
|
85,537
|
|
308,852
|
|
|||||||||
|
Basic net income per limited partner unit
|
$
|
0.40
|
|
$
|
0.30
|
|
$
|
0.31
|
|
$
|
0.38
|
|
$
|
1.39
|
|
||||
|
Diluted net income per limited partner unit
|
$
|
0.40
|
|
$
|
0.30
|
|
$
|
0.31
|
|
$
|
0.38
|
|
$
|
1.38
|
|
||||
|
2010:
|
|||||||||||||||||||
|
Revenues
|
$
|
1,871,981
|
|
$
|
1,362,529
|
|
$
|
1,587,807
|
|
$
|
1,775,815
|
|
$
|
6,598,132
|
|
||||
|
Gross margin
|
647,116
|
|
522,075
|
|
592,702
|
|
724,902
|
|
2,486,795
|
|
|||||||||
|
Operating income
|
338,928
|
|
179,257
|
|
202,052
|
|
316,492
|
|
1,036,729
|
|
|||||||||
|
Net income (loss)
|
204,082
|
|
(20,479
|
)
|
(4,826
|
)
|
157,803
|
|
336,580
|
|
|||||||||
|
Limited Partners’ interest in net income (loss)
|
112,428
|
|
19,208
|
|
(15,289
|
)
|
75,814
|
|
192,161
|
|
|||||||||
|
Basic net income (loss) per limited partner unit
|
$
|
0.50
|
|
$
|
0.09
|
|
$
|
(0.07
|
)
|
$
|
0.34
|
|
$
|
0.86
|
|
||||
|
Diluted net income (loss) per limited partner unit
|
$
|
0.50
|
|
$
|
0.09
|
|
$
|
(0.07
|
)
|
$
|
0.34
|
|
$
|
0.86
|
|
||||
F - 60
16.
SUPPLEMENTAL FINANCIAL STATEMENT INFORMATION:
Following are the financial statements of the Parent Company, which are included to provide additional information with respect to the Parent Company’s financial position, results of operations and cash flows on a stand-alone basis:
BALANCE SHEETS
|
|
December 31,
|
||||||
|
|
2011
|
2010
|
|||||
|
ASSETS
|
|||||||
|
CURRENT ASSETS:
|
|||||||
|
Cash and cash equivalents
|
$
|
18,460
|
|
$
|
27,247
|
|
|
|
Accounts receivable from related companies
|
1,456
|
|
171
|
|
|||
|
Other current assets
|
714
|
|
864
|
|
|||
|
Total current assets
|
20,630
|
|
28,282
|
|
|||
|
ADVANCES TO AND INVESTMENTS IN AFFILIATES
|
2,225,572
|
|
2,231,722
|
|
|||
|
INTANGIBLES AND OTHER ASSETS, net
|
49,906
|
|
29,118
|
|
|||
|
Total assets
|
$
|
2,296,108
|
|
$
|
2,289,122
|
|
|
|
LIABILITIES AND PARTNERS’ CAPITAL
|
|||||||
|
CURRENT LIABILITIES:
|
|||||||
|
Accounts payable
|
$
|
174
|
|
$
|
—
|
|
|
|
Accounts payable to related companies
|
12,334
|
|
6,654
|
|
|||
|
Accrued and other current liabilities
|
35,706
|
|
44,200
|
|
|||
|
Total current liabilities
|
48,214
|
|
50,854
|
|
|||
|
LONG-TERM DEBT, less current maturities
|
1,871,500
|
|
1,800,000
|
|
|||
|
SERIES A CONVERTIBLE PREFERRED UNITS
|
322,910
|
|
317,600
|
|
|||
|
COMMITMENTS AND CONTINGENCIES
|
|
|
|||||
|
PARTNERS’ CAPITAL:
|
|||||||
|
General Partner
|
321
|
|
520
|
|
|||
|
Limited Partners – Common Unitholders (222,972,708 and 222,941,172 units authorized, issued and outstanding at December 31, 2011 and 2010, respectively)
|
52,485
|
|
115,350
|
|
|||
|
Accumulated other comprehensive income
|
678
|
|
4,798
|
|
|||
|
Total partners’ capital
|
53,484
|
|
120,668
|
|
|||
|
Total liabilities and partners’ capital
|
$
|
2,296,108
|
|
$
|
2,289,122
|
|
|
F - 61
STATEMENTS OF OPERATIONS
|
|
Years Ended December 31,
|
||||||||||
|
|
2011
|
2010
|
2009
|
||||||||
|
SELLING, GENERAL AND ADMINISTRATIVE EXPENSES
|
$
|
(29,641
|
)
|
$
|
(21,829
|
)
|
$
|
(4,970
|
)
|
||
|
OTHER INCOME (EXPENSE):
|
|||||||||||
|
Interest expense
|
(163,612
|
)
|
(167,658
|
)
|
(74,049
|
)
|
|||||
|
Equity in earnings of affiliates
|
509,361
|
|
455,901
|
|
526,383
|
|
|||||
|
Losses on non-hedged interest rate derivatives
|
—
|
|
(53,388
|
)
|
(5,620
|
)
|
|||||
|
Other, net
|
(5,796
|
)
|
(19,721
|
)
|
79
|
|
|||||
|
INCOME BEFORE INCOME TAXES
|
310,312
|
|
193,305
|
|
441,823
|
|
|||||
|
Income tax expense (benefit)
|
501
|
|
547
|
|
(650
|
)
|
|||||
|
NET INCOME
|
309,811
|
|
192,758
|
|
442,473
|
|
|||||
|
GENERAL PARTNER’S INTEREST IN NET INCOME
|
959
|
|
597
|
|
1,370
|
|
|||||
|
LIMITED PARTNERS’ INTEREST IN NET INCOME
|
$
|
308,852
|
|
$
|
192,161
|
|
$
|
441,103
|
|
||
F - 62
STATEMENTS OF CASH FLOWS
|
|
Years Ended December 31,
|
||||||||||
|
|
2011
|
2010
|
2009
|
||||||||
|
NET CASH FLOWS PROVIDED BY OPERATING ACTIVITIES
|
$
|
469,004
|
|
$
|
317,328
|
|
$
|
468,969
|
|
||
|
CASH FLOWS FROM INVESTING ACTIVITIES:
|
|||||||||||
|
MEP Transaction
|
—
|
|
3,258
|
|
—
|
|
|||||
|
Net cash provided by investing activities
|
—
|
|
3,258
|
|
—
|
|
|||||
|
CASH FLOWS FROM FINANCING ACTIVITIES:
|
|||||||||||
|
Proceeds from borrowings
|
91,500
|
|
1,858,245
|
|
67,505
|
|
|||||
|
Principal payments on debt
|
(20,000
|
)
|
(1,632,374
|
)
|
(65,816
|
)
|
|||||
|
Distributions to partners
|
(525,596
|
)
|
(483,048
|
)
|
(470,658
|
)
|
|||||
|
Debt issuance costs
|
(23,695
|
)
|
(36,224
|
)
|
—
|
|
|||||
|
Net cash used in financing activities
|
(477,791
|
)
|
(293,401
|
)
|
(468,969
|
)
|
|||||
|
INCREASE (DECREASE) IN CASH AND CASH EQUIVALENTS
|
(8,787
|
)
|
27,185
|
|
—
|
|
|||||
|
CASH AND CASH EQUIVALENTS, beginning of period
|
27,247
|
|
62
|
|
62
|
|
|||||
|
CASH AND CASH EQUIVALENTS, end of period
|
$
|
18,460
|
|
$
|
27,247
|
|
$
|
62
|
|
||
F - 63
TABLE OF CONTENTS
Part IItem 1. BusinessItem 1A. Risk FactorsItem 1B. Unresolved Staff CommentsItem 2. PropertiesItem 3. Legal ProceedingsItem 4. Mine Safety DisclosuresPart IIItem 5. Market For Registrant S Common Units, Related Unitholder Matters and Issuer Purchases Of Equity SecuritiesItem 6. Selected Financial DataItem 7. Management S Discussion and Analysis Of Financial ConditionItem 7A. Quantitative and Qualitative Disclosures About Market RiskItem 8. Financial Statements and Supplementary DataItem 9. Changes in and Disagreements with Accountants on AccountingItem 9A. Controls and ProceduresItem 9B. Other InformationPart IIIItem 10. Directors, Executive Officers and Corporate GovernanceItem 11. Executive CompensationItem 12. Security Ownership Of Certain Beneficial Owners and Management and Related Unitholder MattersItem 13. Certain Relationships and Related Transactions, and Director IndependenceItem 14. Principal Accounting Fees and ServicesPart IVItem 15. Exhibits and Financial Statement Schedules