ENERGY TRANSFER LP
10-Ks and 10-Qs
UNITED STATES
SECURITIES AND EXCHANGE COMMISSION
Washington, D.C. 20549
FORM 10-K
|
ý
|
ANNUAL REPORT PURSUANT TO SECTION 13 OR 15(d) OF THE SECURITIES EXCHANGE ACT OF 1934
|
|
For the fiscal year ended December 31, 2014
|
|
|
¨
|
TRANSITION REPORT PURSUANT TO SECTION 13 OR 15(d) OF THE SECURITIES EXCHANGE ACT OF 1934
|
Commission file number 1-32740
ENERGY TRANSFER EQUITY, L.P.
(Exact name of registrant as specified in its charter)
|
Delaware
|
|
30-0108820
|
|
(state or other jurisdiction of incorporation or organization)
|
(I.R.S. Employer Identification No.)
|
|
3738 Oak Lawn Avenue, Dallas, Texas 75219
(Address of principal executive offices) (zip code)
Registrant’s telephone number, including area code:
(214) 981-0700
Securities registered pursuant to Section 12(b) of the Act:
|
Title of each class
|
|
Name of each exchange on which registered
|
|
Common Units
|
|
New York Stock Exchange
|
Securities registered pursuant to section 12(g) of the Act:
None
Indicate by check mark if the registrant is a well-known seasoned issuer, as defined in Rule 405 of the Securities Act.
Yes
ý
No
¨
Indicate by check mark if the registrant is not required to file reports pursuant to Section 13 or Section 15(d) of the Act.
Yes
¨
No
ý
Indicate by check mark whether the registrant (1) has filed all reports required to be filed by Section 13 or 15(d) of the Securities Exchange Act of 1934 during the preceding 12 months (or for such shorter period that the registrant was required to file such reports) and (2) has been subject to such filing requirements for the past 90 days.
Yes
ý
No
¨
Indicate by check mark whether the registrant has submitted electronically and posted on its corporate Website, if any, every Interactive Data File required to be submitted and posted pursuant to Rule 405 of Regulation S-T during the preceding 12 months (or for such shorter period that the registrant was required to submit and post such files).
Yes
ý
No
¨
Indicate by check mark if disclosure of delinquent filers pursuant to Item 405 of Regulation S-K is not contained herein, and will not be contained, to the best of the registrant’s knowledge, in definitive proxy or information statements incorporated by reference in Part III of this Form 10-K or any amendment to this Form 10-K.
¨
Indicate by check mark whether the registrant is a large accelerated filer, an accelerated filer, a non-accelerated filer, or a smaller reporting company. See the definitions of “large accelerated filer,” “accelerated filer” and “smaller reporting company” in Rule 12b-2 of the Exchange Act.
Large accelerated filer
ý
Accelerated filer
¨
Non-accelerated filer
¨
Smaller reporting company
¨
Indicate by check mark whether the registrant is a shell company (as defined in Rule 12b-2 of the Exchange Act).
Yes
¨
No
ý
The aggregate market value as of
June 30, 2014
, of the registrant’s Common Units held by non-affiliates of the registrant, based on the reported closing price of such Common Units on the New York Stock Exchange on such date, was $22.91 billion. Common Units held by each executive officer and director and by each person who owns 5% or more of the outstanding Common Units have been excluded in that such persons may be deemed to be affiliates. This determination of affiliate status is not necessarily a conclusive determination for other purposes.
At
February 18, 2015
, the registrant had
538,772,023
Common Units outstanding.
DOCUMENTS INCORPORATED BY REFERENCE
None
TABLE OF CONTENTS
|
|
|
PAGE
|
|
ITEM 1.
|
||
|
ITEM 1A.
|
||
|
ITEM 1B.
|
||
|
ITEM 2.
|
||
|
ITEM 3.
|
||
|
ITEM 4.
|
||
|
ITEM 5.
|
||
|
ITEM 6.
|
||
|
ITEM 7.
|
||
|
ITEM 7A.
|
||
|
ITEM 8.
|
||
|
ITEM 9.
|
||
|
ITEM 9A.
|
||
|
ITEM 9B.
|
||
|
ITEM 10.
|
||
|
ITEM 11.
|
||
|
ITEM 12.
|
||
|
ITEM 13.
|
||
|
ITEM 14.
|
||
|
ITEM 15.
|
||
ii
Forward-Looking Statements
Certain matters discussed in this report, excluding historical information, as well as some statements by Energy Transfer Equity, L.P. (the “Partnership” or “ETE”) in periodic press releases and some oral statements of the Partnership’s officials during presentations about the Partnership, include forward-looking statements. These forward-looking statements are identified as any statement that does not relate strictly to historical or current facts. Statements using words such as “anticipate,” “project,” “expect,” “plan,” “goal,” “forecast,” “estimate,” “intend,” “continue,” “could,” “believe,” “may,” “will” or similar expressions help identify forward-looking statements. Although the Partnership and its General Partner believe such forward-looking statements are based on reasonable assumptions and current expectations and projections about future events, no assurance can be given that such assumptions, expectations or projections will prove to be correct. Forward-looking statements are subject to a variety of risks, uncertainties and assumptions. If one or more of these risks or uncertainties materialize, or if underlying assumptions prove incorrect, the Partnership’s actual results may vary materially from those anticipated, estimated, projected, forecasted, expressed or expected in forward-looking statements since many of the factors that determine these results are subject to uncertainties and risks that are difficult to predict and beyond management’s control. For additional discussion of risks, uncertainties and assumptions, see “Item 1.A Risk Factors” included in this annual report.
Definitions
The following is a list of certain acronyms and terms generally used in the energy industry and throughout this document:
|
/d
|
|
per day
|
|
AmeriGas
|
AmeriGas Partners, L.P.
|
|
|
AOCI
|
accumulated other comprehensive income (loss)
|
|
|
AROs
|
asset retirement obligations
|
|
|
Bbls
|
|
barrels
|
|
Bcf
|
billion cubic feet
|
|
|
Btu
|
|
British thermal unit, an energy measurement used by gas companies to convert the volume of gas used to its heat equivalent, and thus calculate the actual energy content
|
|
Canyon
|
ETC Canyon Pipeline, LLC
|
|
|
Capacity
|
|
capacity of a pipeline, processing plant or storage facility refers to the maximum capacity under normal operating conditions and, with respect to pipeline transportation capacity, is subject to multiple factors (including natural gas injections and withdrawals at various delivery points along the pipeline and the utilization of compression) which may reduce the throughput capacity from specified capacity levels
|
|
Citrus
|
Citrus, LLC which owns 100% of FGT
|
|
|
Coal Handling
|
Coal Handling Solutions LLC, Kingsport Handling LLC and Kingsport Services LLC, now known as Materials Handling Solutions LLC
|
|
|
CrossCountry
|
CrossCountry Energy, LLC
|
|
|
CFTC
|
Commodities Futures Trading Commission
|
|
|
DOE
|
U.S. Department of Energy
|
|
|
DOT
|
U.S. Department of Transportation
|
|
|
Eagle Rock
|
Eagle Rock Energy Partners, L.P.
|
|
|
Enterprise
|
Enterprise Products Partners L.P., together with its subsidiaries
|
|
|
EPA
|
U.S. Environmental Protection Agency
|
|
|
ETC Compression
|
ETC Compression, LLC
|
|
|
ETC FEP
|
ETC Fayetteville Express Pipeline, LLC
|
|
|
ETC OLP
|
La Grange Acquisition, L.P., which conducts business under the assumed name of Energy Transfer Company
|
|
|
ETC Tiger
|
ETC Tiger Pipeline, LLC
|
|
iii
|
ETG
|
Energy Transfer Group, L.L.C.
|
|
|
ET Interstate
|
Energy Transfer Interstate Holdings, LLC
|
|
|
ETP
|
Energy Transfer Partners, L.P.
|
|
|
ETP Credit Facility
|
ETP’s revolving credit facility
|
|
|
ETP GP
|
Energy Transfer Partners GP, L.P., the general partner of ETP
|
|
|
ETP Holdco
|
ETP Holdco Corporation
|
|
|
ETP LLC
|
Energy Transfer Partners, L.L.C., the general partner of ETP GP
|
|
|
Exchange Act
|
Securities Exchange Act of 1934
|
|
|
FDOT/FTE
|
Florida Department of Transportation, Florida’s Turnpike Enterprise
|
|
|
FEP
|
Fayetteville Express Pipeline LLC
|
|
|
FERC
|
Federal Energy Regulatory Commission
|
|
|
FGT
|
Florida Gas Transmission Company, LLC, which owns a natural gas pipeline system that originates in Texas and delivers natural gas to the Florida peninsula
|
|
|
GAAP
|
accounting principles generally accepted in the United States of America
|
|
|
General Partner
|
LE GP, LLC, the general partner of ETE
|
|
|
HPC
|
RIGS Haynesville Partnership Co.
|
|
|
HOLP
|
Heritage Operating, L.P.
|
|
|
Hoover Energy
|
Hoover Energy Partners, LP
|
|
|
IDRs
|
incentive distribution rights
|
|
|
Lake Charles LNG
|
Lake Charles LNG Company, LLC (previously named Trunkline LNG Company, LLC)
|
|
|
LCL
|
Lake Charles LNG Export Company, LLC, a subsidiary of ETP and ETE
|
|
|
LIBOR
|
London Interbank Offered Rate
|
|
|
LNG
|
Liquefied natural gas
|
|
|
LNG Holdings
|
Lake Charles LNG Holdings, LLC
|
|
|
LPG
|
liquefied petroleum gas
|
|
|
Lone Star
|
Lone Star NGL LLC
|
|
|
MACS
|
Mid-Atlantic Convenience Stores, LLC
|
|
|
MEP
|
Midcontinent Express Pipeline LLC
|
|
|
MGE
|
Missouri Gas Energy
|
|
|
MGP
|
manufactured gas plant
|
|
|
MMBtu
|
|
million British thermal units
|
|
MMcf
|
million cubic feet
|
|
|
NGA
|
Natural Gas Act of 1938
|
|
|
NGPA
|
Natural Gas Policy Act of 1978
|
|
|
NEG
|
New England Gas Company
|
|
|
NGL
|
|
natural gas liquid, such as propane, butane and natural gasoline
|
|
NMED
|
New Mexico Environmental Department
|
|
iv
|
NYMEX
|
|
New York Mercantile Exchange
|
|
NYSE
|
New York Stock Exchange
|
|
|
OSHA
|
Federal Occupational Safety and Health Act
|
|
|
Panhandle
|
Panhandle Eastern Pipe Line Company, LP and its subsidiaries
|
|
|
PCBs
|
polychlorinated biphenyls
|
|
|
PEPL
|
Panhandle Eastern Pipe Line Company, LP
|
|
|
PEPL Holdings
|
PEPL Holdings, LLC
|
|
|
PES
|
Philadelphia Energy Solutions
|
|
|
PHMSA
|
Pipeline Hazardous Materials Safety Administration
|
|
|
PVR
|
PVR Partners, L.P.
|
|
|
RIGS
|
Regency Intrastate Gas System
|
|
|
RGS
|
Regency Gas Services, a wholly-owned subsidiary of Regency
|
|
|
Preferred Units
|
ETE’s Series A Convertible Preferred Units
|
|
|
Ranch JV
|
Ranch Westex JV LLC
|
|
|
Regency
|
Regency Energy Partners LP
|
|
|
Regency GP
|
Regency GP LP, the general partner of Regency
|
|
|
Regency LLC
|
Regency GP LLC, the general partner of Regency GP
|
|
|
Regency Preferred Units
|
Regency’s Series A Convertible Preferred Units, the Preferred Units of a Subsidiary
|
|
|
Sea Robin
|
Sea Robin Pipeline Company, LLC
|
|
|
SEC
|
Securities and Exchange Commission
|
|
|
Southern Union
|
Southern Union Company
|
|
|
Southwest Gas
|
Pan Gas Storage, LLC
|
|
|
SUGS
|
Southern Union Gas Services
|
|
|
Sunoco Logistics
|
Sunoco Logistics Partners L.P.
|
|
|
Sunoco Partners
|
Sunoco Partners LLC, the general partner of Sunoco Logistics
|
|
|
Susser
|
Susser Holdings Corporation
|
|
|
TCEQ
|
Texas Commission on Environmental Quality
|
|
|
Titan
|
Titan Energy Partners, L.P.
|
|
|
Transwestern
|
Transwestern Pipeline Company, LLC
|
|
|
TRRC
|
Texas Railroad Commission
|
|
|
Trunkline
|
Trunkline Gas Company, LLC, a subsidiary of Panhandle
|
|
|
WTI
|
|
West Texas Intermediate Crude
|
Adjusted EBITDA is a term used throughout this document, which we define as earnings before interest, taxes, depreciation, depletion, amortization and other non-cash items, such as non-cash compensation expense, gains and losses on disposals of assets, the allowance for equity funds used during construction, unrealized gains and losses on commodity risk management activities, non-cash impairment charges, loss on extinguishment of debt, gain on deconsolidation and other non-operating income or expense items. Unrealized gains and losses on commodity risk management activities include unrealized gains and losses on commodity derivatives and inventory fair value adjustments (excluding lower of cost or market adjustments). Adjusted EBITDA reflects
v
amounts for less than wholly-owned subsidiaries based on 100% of the subsidiaries’ results of operations and for unconsolidated affiliates based on the Partnership’s proportionate ownership.
vi
Overview
We were formed in September 2002 and completed our initial public offering in February 2006. We are a Delaware limited partnership with common units publicly traded on the NYSE under the ticker symbol “ETE.”
Unless the context requires otherwise, references to “we,” “us,” “our,” the “Partnership” and “ETE” mean Energy Transfer Equity, L.P. and its consolidated subsidiaries, which include ETP, ETP GP, ETP LLC, Regency, Regency GP, Regency LLC, Panhandle (or Southern Union prior to its merger into Panhandle in January 2014), Sunoco, Inc., Sunoco Logistics, Sunoco LP, Susser and ETP Holdco. References to the “Parent Company” mean Energy Transfer Equity, L.P. on a stand-alone basis.
During 2014, our consolidated subsidiaries, Trunkline LNG Company, LLC, Trunkline LNG Export, LLC and Susser Petroleum Partners LP, changed their names to Lake Charles LNG Company, LLC, Lake Charles LNG Export, LLC and Sunoco LP, respectively. All references to these subsidiaries throughout this document reflect the new names of those subsidiaries, regardless of whether the disclosure relates to periods or events prior to the dates of the name changes.
In January 2014, the Partnership completed a two-for-one split of its outstanding common units. All references to units and per unit amounts in this document have been adjusted to reflect the effect of the unit split for all periods presented.
On March 26, 2012, we acquired all of the outstanding shares of Southern Union and contributed our ownership in Southern Union for a 60% interest in ETP Holdco at the time of ETP’s acquisition of Sunoco, Inc. on October 5, 2012. On April 30, 2013, ETP acquired ETE’s 60% interest in ETP Holdco.
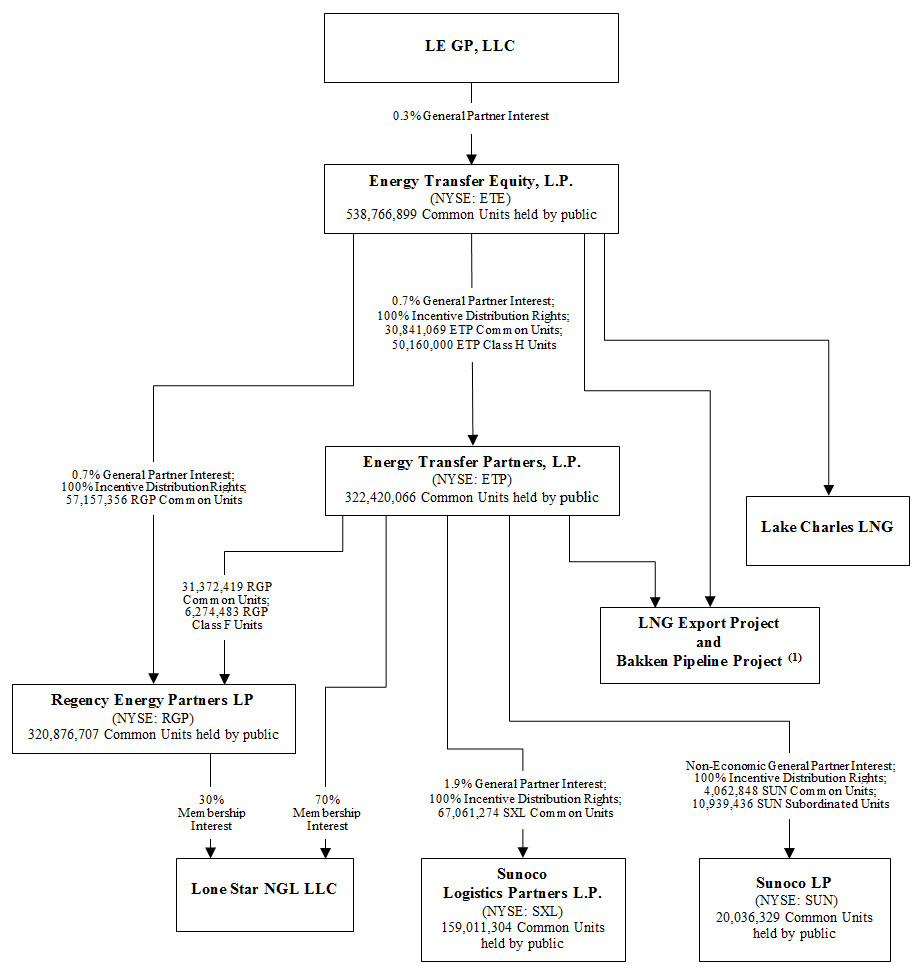
The Parent Company’s principal sources of cash flow are derived from its direct and indirect investments in the limited partner and general partner interests in ETP and Regency, both of which are publicly traded master limited partnerships engaged in diversified energy-related services, and the Partnership’s ownership of Lake Charles LNG.
At
December 31, 2014
, our interests in ETP and Regency consisted of
100%
of the respective general partner interests and IDRs, as well as the following:
|
ETP
|
Regency
|
||||
|
Units held by wholly-owned subsidiaries:
|
|||||
|
Common units
|
30,841,069
|
|
57,157,356
|
|
|
|
ETP Class H units
|
50,160,000
|
|
—
|
|
|
|
Units held by less than wholly-owned subsidiaries:
|
|||||
|
Common units
|
—
|
|
31,372,419
|
|
|
|
Regency Class F units
|
—
|
|
6,274,483
|
|
|
The Parent Company’s primary cash requirements are for distributions to its partners, general and administrative expenses, debt service requirements and at ETE’s election, capital contributions to ETP and Regency in respect of ETE’s general partner interests in ETP and Regency. The Parent Company-only assets and liabilities are not available to satisfy the debts and other obligations of subsidiaries.
1
Organizational Structure
The following chart summarizes our organizational structure as of
December 31, 2014
. For simplicity, certain immaterial entities and ownership interests have not been depicted.
|
(1)
|
Pursuant to an agreement between ETE and ETP entered into in December 2014, ETE has agreed to transfer its 45% equity interest in the Bakken Pipeline Project to ETP. This transaction is expected to close in March 2015.
|
2
Significant Achievements in
2014
and Beyond
Strategic Transactions
Our significant strategic transactions in
2014
and beyond included the following, as discussed in more detail herein:
|
•
|
In January 2015, ETP and Regency entered into a definitive merger agreement, as amended on February 18, 2015 (the “Merger Agreement”), pursuant to which Regency will merge with a wholly-owned subsidiary of ETP, with Regency continuing as the surviving entity and becoming a wholly-owned subsidiary of ETP (the “Regency Merger”). At the effective time of the Regency Merger (the “Effective Time”), each Regency common unit and Class F unit will be converted into the right to receive
0.4066
ETP Common Units, plus a number of additional ETP Common Units equal to
$0.32
per Regency common unit divided by the lesser of (i) the volume weighted average price of ETP Common Units for the five trading days ending on the third trading day immediately preceding the Effective Time and (ii) the closing price of ETP Common Units on the third trading day immediately preceding the Effective Time, rounded to the nearest ten thousandth of a unit. Each Regency series A preferred unit will be converted into the right to receive a preferred unit representing a limited partner interest in ETP, a new class of units in ETP to be established at the Effective Time. The transaction is subject to other customary closing conditions including approval by Regency’s unitholders. The transaction is expected to close in the second quarter of 2015.
|
|
•
|
In December 2014, ETP and ETE announced the final terms of a transaction, whereby ETE will transfer
30.8 million
ETP Common Units, ETE’s
45%
interest in the Dakota Access Pipeline and Energy Transfer Crude Oil Pipeline (collectively, the “Bakken pipeline project”), and
$879 million
in cash (less amounts funded prior to closing by ETE for capital expenditures for the Bakken pipeline project) in exchange for
30.8 million
newly issued ETP Class H Units that, when combined with the
50.2 million
previously issued ETP Class H Units, generally entitle ETE to receive
90.05%
of the cash distributions and other economic attributes of the general partner interest and IDRs of Sunoco Logistics. In addition, ETE and ETP agreed to reduce the IDR subsidies that ETE previously agreed to provide to ETP, with such reductions occurring in 2015 and 2016. This transaction is expected to close in March 2015.
|
|
•
|
In October 2014, Sunoco LP acquired MACS from a subsidiary of ETP in a transaction valued at approximately
$768 million
. The transaction included approximately
110
company-operated retail convenience stores and
200
dealer-operated and consignment sites from MACS.
|
|
•
|
In August 2014, ETP and Susser completed the merger of an indirect wholly-owned subsidiary of ETP, with and into Susser, with Susser surviving the merger as a subsidiary of ETP for total consideration valued at approximately
$1.8 billion
(the “Susser Merger”).
|
|
•
|
In July 2014, Regency acquired Eagle Rock’s midstream business for $1.3 billion, including the issuance of 8.2 million Regency common units to Eagle Rock and the assumption of $499 million of Eagle Rock’s 8.375% senior notes due 2019 (the “Eagle Rock Acquisition”). The remainder of the purchase price was funded by $400 million in common units issued to ETE and borrowing under Regency’s revolving credit facility. This acquisition complements Regency’s core gathering and processing business, and when combined with the PVR Acquisition, further diversifies Regency’s basin exposure in the Texas Panhandle, east Texas and south Texas.
|
|
•
|
In March 2014, Regency acquired PVR for a total purchase price of $5.7 billion, including $1.8 billion principal amount of assumed debt (the “PVR Acquisition”). PVR unitholders received (on a per unit basis) 1.02 Regency Common Units and a one-time cash payment of $36 million, which was funded through borrowings under Regency’s revolving credit facility. The PVR Acquisition enhanced Regency’s geographic diversity with a strategic presence in the Marcellus and Utica shales in the Appalachian Basin and the Granite Wash in the Mid-Continent region.
|
|
•
|
In February 2014, ETP completed the transfer to ETE of Lake Charles LNG, the entity that owns a LNG regasification facility in Lake Charles, Louisiana, in exchange for the redemption by ETP of
18.7 million
ETP Common Units held by ETE. This transaction was
effective as of January 1, 2014.
|
|
•
|
In
2014
, ETP sold
18.9 million
of the AmeriGas common units that ETP originally received in connection with the contribution of ETP’s Propane Business to AmeriGas in January 2012.
|
Business Strategy
Our primary business objective is to increase cash available for distributions to our unitholders by actively assisting our subsidiaries in executing their business strategies by assisting in identifying, evaluating and pursuing strategic acquisitions and growth opportunities. In general, we expect that we will allow our subsidiaries the first opportunity to pursue any acquisition or internal growth project that may be presented to us which may be within the scope of their operations or business strategies. In the future, we may also support the growth of our subsidiaries through the use of our capital resources which could involve loans, capital
3
contributions or other forms of credit support to our subsidiaries. This funding could be used for the acquisition by one of our subsidiaries of a business or asset or for an internal growth project. In addition, the availability of this capital could assist our subsidiaries in arranging financing for a project, reducing its financing costs or otherwise supporting a merger or acquisition transaction.
Segment Overview
As a result of the Lake Charles LNG Transaction in 2014, our reportable segments were re-evaluated and currently reflect the following reportable segments:
•
Investment in ETP, including the consolidated operations of ETP;
|
•
|
Investment in Regency, including the consolidated operations of Regency;
|
|
•
|
Investment in Lake Charles LNG, including the operations of Lake Charles LNG; and
|
|
•
|
Corporate and Other, including the activities of the Parent Company.
|
The businesses within these segments are described below. See Note
16
to our consolidated financial statements for additional financial information about our reportable segments.
Investment in ETP
ETP’s operations include the following:
Intrastate Transportation and Storage Operations
ETP’s natural gas transportation pipelines receive natural gas from other mainline transportation pipelines and gathering systems and deliver the natural gas to industrial end-users, utilities and other pipelines. Through its intrastate transportation and storage operations, ETP owns and operates approximately 7,700 miles of natural gas transportation pipelines with approximately 14.1 Bcf/d of transportation capacity and three natural gas storage facilities located in the state of Texas.
ETP also generates revenues and margin from the sale of natural gas to electric utilities, independent power plants, local distribution companies, industrial end-users and other marketing companies on the HPL System. In addition, ETP’s intrastate transportation and storage operations generate revenues from fees charged for storing customers’ working natural gas in ETP’s storage facilities and from margin from managing natural gas for its own account.
Interstate Transportation and Storage Operations
ETP’s natural gas transportation pipelines receive natural gas from other mainline transportation pipelines and gathering systems and deliver the natural gas to industrial end-users, utilities and other pipelines. Through its interstate transportation and storage operations, ETP directly owns and operates approximatel
y 12,800 miles of interstate natural gas pipeline with approximately 11.3
Bcf per day of transportation capacity and has a 50% interest in the joint venture that owns the
185
-mile Fayetteville Express pipeline. ETP also owns a 50% interest in Citrus which owns 100% of FGT, an approximately
5,400
mile pipeline system that extends from south Texas through the Gulf Coast to south Florida.
ETP’s interstate transportation and storage operations include Panhandle, which owns and operates a large natural gas open-access interstate pipeline network. The pipeline network, consisting of the PEPL, Trunkline and Sea Robin transmission systems, serves customers in the Midwest, Gulf Coast and Midcontinent United States with a comprehensive array of transportation and storage services. In connection with its natural gas pipeline transmission and storage systems, Panhandle has five natural gas storage fields located in Illinois, Kansas, Louisiana, Michigan and Oklahoma. Southwest Gas operates four of these fields and Trunkline operates one.
We are currently developing plans to convert a portion of the Trunkline gas pipeline to crude oil transportation.
The results from ETP’s interstate transportation and storage operations are primarily derived from the fees ETP earns from natural gas transportation and storage services.
Midstream Operations
The midstream natural gas industry is the link between the exploration and production of natural gas and the delivery of its components to end-use markets. The midstream industry consists of natural gas gathering, compression, treating, processing and transportation, and is generally characterized by regional competition based on the proximity of gathering systems and processing plants to natural gas producing wells.
4
Through ETP’s midstream operations, ETP owns and operates approximately 7,200 miles of in service natural gas and NGL gathering pipelines with approximately 5.7 Bcf/d of gathering capacity, 6 natural gas processing plants, 15 natural gas treating facilities and 3 natural gas conditioning facilities with an aggregate processing, treating and conditioning capacity of approximately 4.6 Bcf/d. ETP’s midstream operations focus on the gathering, compression, treating, blending, and processing, and its operations are currently concentrated in major producing basins and shales, including the Austin Chalk trend and Eagle Ford Shale in South and Southeast Texas, the Permian Basin in West Texas and New Mexico, the Barnett Shale and Woodford Shale in North Texas, the Bossier Sands in East Texas, the Marcellus Shale in West Virginia, and the Haynesville Shale in East Texas and Louisiana. Many of ETP’s midstream assets are integrated with its intrastate transportation and storage assets.
Liquids Transportation and Services Operations
NGL transportation pipelines transport mixed NGLs and other hydrocarbons from natural gas processing facilities to fractionation plants and storage facilities. NGL storage facilities are used for the storage of mixed NGLs, NGL products and petrochemical products owned by third-parties in storage tanks and underground wells, which allow for the injection and withdrawal of such products at various times of the year to meet demand cycles.
NGL fractionators separate mixed NGL streams into purity products, such as ethane, propane, normal butane, isobutane and natural gasoline.
Through ETP’s liquids transportation and services operations ETP has a 70% interest in Lone Star, which owns approximately 2,000 miles of NGL pipelines with an aggregate transportation capacity of approximately 388,000 Bbls/d, three NGL processing plants with an aggregate processing capacity of approximately 904 MMcf/d, four NGL and propane fractionation facilities with an aggregate capacity of 325,000 Bbls/d and NGL storage facilities with aggregate working storage capacity of approximately 53 million Bbls. Three NGL and propane fractionation facilities and the NGL storage facilities are located at Mont Belvieu, Texas, one NGL fractionation facility is located in Geismar, Louisiana, and the NGL pipelines primarily transport NGLs from the Permian and Delaware basins and the Barnett and Eagle Ford Shales to Mont Belvieu. ETP also owns and operates approximately
274
miles of NGL pipelines including a 50% interest in the joint venture that owns the Liberty pipeline, an approximately
87-mile
NGL pipeline and the recently converted 83-mile Rio Bravo crude oil pipeline.
ETP’s Investment in Sunoco Logistics
ETP’s interests in Sunoco Logistics consist of a
1.9%
general partner interest,
100%
of the IDRs and
67.1 million
Sunoco Logistics common units representing
29.7%
of the limited partner interests in Sunoco Logistics as of
December 31, 2014
. Because ETP controls Sunoco Logistics through its ownership of the general partner, the operations of Sunoco Logistics are consolidated into ETP.
Sunoco Logistics owns and operates a logistics business, consisting of a geographically diverse portfolio of complementary pipeline, terminalling, and acquisition and marketing assets which are used to facilitate the purchase and sale of crude oil and refined petroleum products pipelines primarily in the northeast, midwest and southwest regions of the United States. In 2013, Sunoco Logistics expanded its operations of pipeline transportation, acquisition, storage and marketing of NGLs. In addition, Sunoco Logistics has ownership interests in several product pipeline joint ventures.
Sunoco Logistics’ crude oil pipelines transport crude oil in the southwest and midwest United States, principally in Oklahoma and Texas. Sunoco Logistics’ crude oil pipelines consist of approximately
5,300
miles of crude oil trunk pipelines for high-volume, long-distance transportation and approximately
500
miles of crude oil gathering lines that supply the trunk pipelines.
Sunoco Logistics’ crude oil acquisition and marketing business gathers, purchases, markets and sells crude oil principally in the mid-continent United States, utilizing its proprietary fleet of approximately
335
crude oil transport trucks and approximately
135
crude oil truck unloading facilities as well as third-party assets.
Sunoco Logistics’ terminal facilities consist of crude oil, refined products and NGL terminals which receive products from pipelines, barges, railcars, and trucks and distribute them to third parties and certain affiliates, who in turn deliver them to end-users and retail outlets. Sunoco Logistics’ terminal facilities operate with an aggregate storage capacity of approximately
48 million
barrels, including the
25 million
barrel Nederland, Texas crude oil terminal; the
6 million
barrel Eagle Point, New Jersey refined products and crude oil terminal; the
3 million
barrel Marcus Hook, Pennsylvania refined products and NGL facility (the “Marcus Hook Industrial Complex”); approximately
39
active refined products marketing terminals located in the northeast, midwest and southwest United States; and refinery terminals located in the northeast United States.
Sunoco Logistics’ product pipelines transport refined products and NGLs including multiple grades of gasoline, middle distillates (such as heating oil, diesel and jet fuel) and LPGs (such as propane and butane) from refineries to markets. Sunoco Logistics’ products pipelines consist of approximately
2,400
miles of refined products and NGL pipelines and joint venture interests in four products pipelines in selected areas of the United States.
5
Retail Marketing Operations
ETP’s retail marketing business operations are conducted through various wholly-owned subsidiaries as well as through Sunoco LP, which ETP controls through its ownership of the general partner.
ETP’s retail marketing and wholesale distribution operations include the following activities conducted in 30 states, primarily on the east cost, midwest and south regions of the United States:
|
•
|
Sale of motor fuel (gasoline and diesel) and merchandise at company-operated retail locations and branded convenience stores.
|
|
•
|
Distribution of gasoline, diesel and other petroleum products to convenience stores, independent dealers, distributors and other commercial customers.
|
ETP’s Other Operations and Investments
ETP’s other operations and investments include the following:
|
•
|
ETP owns an investment in Regency consisting of the Regency common units and Class F units received by Southern Union (now Panhandle) in exchange for the contribution of its interest in Southern Union Gathering Company, LLC to Regency on April 30, 2013.
|
|
•
|
Sunoco, Inc. owns an approximate
33%
non-operating interest in PES, a refining joint venture with The Carlyle Group, L.P. (“The Carlyle Group”), which owns a refinery in Philadelphia. Sunoco, Inc. has a supply contract for gasoline and diesel produced at the refinery for its retail marketing business.
|
|
•
|
ETP conducts marketing operations in which it markets the natural gas that flows through its gathering and intrastate transportation assets, referred to as on-system gas. ETP also attracts other customers by marketing volumes of natural gas that do not move through its assets, referred to as off-system gas. For both on-system and off-system gas, ETP purchases natural gas from natural gas producers and other suppliers and sells that natural gas to utilities, industrial consumers, other marketers and pipeline companies, thereby generating gross margins based upon the difference between the purchase and resale prices of natural gas, less the costs of transportation. For the off-system gas, ETP purchases gas or acts as an agent for small independent producers that may not have marketing operations.
|
|
•
|
ETP owns all of the outstanding equity interests of a natural gas compression equipment business with operations in Arkansas, California, Colorado, Louisiana, New Mexico, Oklahoma, Pennsylvania and Texas.
|
|
•
|
ETP owns 100% of the membership interests of ETG, which owns all of the partnership interests of Energy Transfer Technologies, Ltd. (“ETT”). ETT provides compression services to customers engaged in the transportation of natural gas, including ETP’s other operations.
|
|
•
|
ETP owns a 40% interest in LCL, which is developing a LNG liquefaction project.
|
Investment in Regency
Regency’s operations include the following:
Gathering and Processing Operations
Regency provides “wellhead-to-market” services to producers of natural gas, which include transporting raw natural gas from the wellhead through gathering systems, processing raw natural gas to separate NGLs from the raw natural gas and selling or delivering the pipeline-quality natural gas and NGLs to various markets and pipeline systems, and the gathering of oil (crude and/or condensate, a lighter oil) received from producers, the gathering and disposing of salt water, and natural gas and NGL marketing and trading. These operations also include Regency’s 60% interest in Edwards Lime Gathering LLC, which operates natural gas gathering, oil pipeline, and oil stabilization facilities in south Texas, Regency’s 33.33% membership interest in Ranch Westex JV LLC, which processes natural gas delivered from the NGLs-rich shale formations in west Texas, Regency’s 50% interest in Sweeny Gathering LP, which operates a natural gas gathering facility in south Texas, Regency’s 51% membership interest in Aqua - PVR Water Services, LLC, which transports and supplies fresh water to natural gas producers in the Marcellus shale in Pennsylvania, Regency’s 75% membership interest in Ohio River System LLC, which will operate a natural gas gathering system in the Utica shale in Ohio, and Regency’s 50% interest in Mi Vida JV LLC, which will operate a cryogenic processing plant and related facilities in west Texas.
6
Natural Gas Transportation Operations
Regency owns a 49.99% general partner interest in HPC, which owns RIGS, a 450-mile intrastate pipeline that delivers natural gas from northwest Louisiana to downstream pipelines and markets, and a 50% membership interest in MEP, which owns a 500-mile interstate natural gas pipeline stretching from southeast Oklahoma through northeast Texas, northern Louisiana and central Mississippi to an interconnect with the Transcontinental Gas Pipe Line system in Butler, Alabama. These operations also include Gulf States, which owns a 10-mile interstate pipeline that extends from Harrison County, Texas to Caddo Parish, Louisiana.
NGL Services Operations
Regency owns a 30% membership interest in Lone Star with ETP owning the remaining 70% membership interest.
Contract Services Operations
Regency owns and operates a fleet of compressors used to provide turn-key natural gas compression services for customer specific systems. Regency also owns and operates a fleet of equipment used to provide treating services, such as carbon dioxide and hydrogen sulfide removal, natural gas cooling, dehydration and BTU management.
Natural Resources Operations
Regency is involved in the management of coal and natural resources properties and the related collection of royalties. Regency also earns revenues from other land management activities, such as selling standing timber, leasing coal-related infrastructure facilities, and collecting oil and gas royalties. These operations also included Regency’s 50% interesting in Coal Handling, which owns and operates end-user coal handling facilities. Regency purchased the remaining 50% interest in Coal Handling effective December 31, 2014.
Investment in Lake Charles LNG
Lake Charles LNG provides terminal services for shippers by receiving LNG at the facility for storage and delivering such LNG to shippers, either in liquid state or gaseous state after regasification. Lake Charles LNG derives all of its revenue from a series of long term contracts with a wholly-owned subsidiary of BG Group plc (“BG”).
Lake Charles LNG is currently developing a planned liquefaction facility with BG for the export of LNG.
Asset Overview
Investment in ETP
The following details the assets in ETP’s operations:
Intrastate Transportation and Storage
The following details pipelines and storage facilities in ETP’s intrastate transportation and storage operations:
ET Fuel System
|
•
|
Capacity
of 5.2 Bcf/d
|
|
•
|
Approximately 2,870 miles of natural gas pipeline
|
|
•
|
Two storage facilities with 12.4 B
cf of total working gas capacity
|
|
•
|
Bi-directional capabilities
|
The ET Fuel System serves some of the most prolific production areas in the United States and is comprised of intrastate natural gas pipeline and related natural gas storage facilities. The ET Fuel System has many interconnections with pipelines providing direct access to power plants, other intrastate and interstate pipelines and is strategically located near high-growth production areas and provides access to the Waha Hub near Midland, Texas, the Katy Hub near Houston, Texas and the Carthage Hub in East Texas, the three major natural gas trading centers in Texas.
The ET Fuel System also includes ETP’s Bethel natural gas storage facility, with a working capacity of 6.4 Bcf, an average withdrawal capacity of 300 MMcf/d and an injection capacity of 75 MMcf/d, and ETP’s Bryson natural gas storage facility, with a working capacity of 6.0 Bcf, an average withdrawal capacity of 120 MMcf/d and an average injection capacity of 96 MMcf/d. All of ETP’s storage capacity on the ET Fuel System is contracted to third parties under fee-based arrangements that extend through 2017.
7
In addition, the ET Fuel System is integrated with ETP’s Godley processing plant which gives ETP the ability to bypass the plant when processing margins are unfavorable by blending the untreated natural gas from the North Texas System with natural gas on the ET Fuel System while continuing to meet pipeline quality specifications.
Oasis Pipeline
|
•
|
Capacity of 1.2 Bcf/d
|
|
•
|
Approximately 600 miles of natural gas pipeline
|
|
•
|
Connects Waha to Katy market hubs
|
|
•
|
Bi-directional capabilities
|
The Oasis pipeline is primarily a 36-inch natural gas pipeline. It has bi-directional capability with approximately 1.2 Bcf/d of throughput capacity moving west-to-east and greater than 750 MMcf/d of throughput capacity moving east-to-west. The Oasis pipeline has many interconnections with other pipelines, power plants, processing facilities, municipalities and producers.
The Oasis pipeline is integrated with ETP’s Southeast Texas System and is an important component to maximizing ETP’s Southeast Texas System’s profitability. The Oasis pipeline enhances the Southeast Texas System by (i) providing access for natural gas on the Southeast Texas System to other third party supply and market points and interconnecting pipelines and (ii) allowing ETP to bypass ETP’s processing plants and treating facilities on the Southeast Texas System when processing margins are unfavorable by blending untreated natural gas from the Southeast Texas System with gas on the Oasis pipeline while continuing to meet pipeline quality specifications.
HPL System
|
•
|
Capacity o
f 5.3 Bcf/d
|
|
•
|
Approximately 3,800 miles of natural gas pipeline
|
|
•
|
Bammel storage facility with 52.5 Bc
f of total working gas capacity
|
The HPL System is an extensive network of intrastate natural gas pipelines, an underground Bammel storage reservoir and related transportation assets. The system has access to multiple sources of historically significant natural gas supply reserves from South Texas, the Gulf Coast of Texas, East Texas and the western Gulf of Mexico, and is directly connected to major gas distribution, electric and industrial load centers in Houston, Corpus Christi, Texas City and other cities located along the Gulf Coast of Texas. The HPL System is well situated to gather and transport gas in many of the major gas producing areas in Texas including a strong presence in the key Houston Ship Channel and Katy Hub markets, allowing ETP to play an important role in the Texas natural gas markets. The HPL System also offers its shippers off-system opportunities due to its numerous interconnections with other pipeline systems, its direct access to multiple market hubs at Katy, the Houston Ship Channel and Agua Dulce, and ETP’s Bammel storage facility.
The Bammel storage facility has a total working gas capacity of approximately 52.5 Bcf, a peak withdrawal rate of 1.3 Bcf/d and a peak injection rate of 0.6 Bcf/d. The Bammel storage facility is located near the Houston Ship Channel market area and the Katy Hub and is ideally suited to provide a physical backup for on-system and off-system customers. As of
December 31, 2014
, ETP had approximately 9.3 Bcf committed under fee-based arrangements with third parties and approximately 40.2 Bcf stored in the facility for ETP’s own account.
East Texas Pipeline
|
•
|
Capacity of 2.4 Bcf/d
|
|
•
|
Approximately 370 miles of natural gas pipeline
|
The East Texas pipeline connects three treating facilities, one of which ETP owns, with ETP’s Southeast Texas System. The East Texas pipeline serves producers in East and North Central Texas and provides access to the Katy Hub. The East Texas pipeline includes the 36-inch East Texas extension to connect ETP’s Reed compressor station in Freestone County to ETP’s Grimes County compressor station, the 36-inch Katy expansion connecting Grimes to the Katy Hub, and the 42-inch Southeast Bossier pipeline connecting ETP’s Cleburne to Carthage pipeline to the HPL System.
8
Interstate Transportation and Storage
The following details ETP’s pipelines in the interstate transportation and storage operations.
Florida Gas Transmission Pipeline
|
•
|
Capacity of 3.1 Bcf/d
|
|
•
|
Approximately
5,400
miles of interstate natural gas pipeline
|
|
•
|
FGT is owned by Citrus, a 50/50 joint venture with Kinder Morgan, Inc. (“KMI”)
|
The Florida Gas Transmission pipeline is an open-access interstate pipeline system with a mainline capacity of 3.1 Bcf/d and approximately
5,400
miles of pipelines extending from south Texas through the Gulf Coast region of the United States to south Florida. The Florida Gas Transmission pipeline system receives natural gas from various onshore and offshore natural gas producing basins. FGT is the principal transporter of natural gas to the Florida energy market, delivering over
65%
of the natural gas consumed in the state. In addition, Florida Gas Transmission’s pipeline system operates and maintains over
75
interconnects with major interstate and intrastate natural gas pipelines, which provide FGT’s customers access to diverse natural gas producing regions.
FGT’s customers include electric utilities, independent power producers, industrials and local distribution companies.
Transwestern Pipeline
|
•
|
Capacity of 2.1 Bcf/d
|
|
•
|
Approximately 2,600 miles of interstate natural gas pipeline
|
|
•
|
Bi-directional capabilities
|
The Transwestern pipeline is an open-access interstate natural gas pipeline extending from the gas producing regions of West Texas, eastern and northwestern New Mexico, and southern Colorado primarily to pipeline interconnects off the east end of its system and to pipeline interconnects at the California border. The Transwestern pipeline has access to three significant gas basins: the Permian Basin in West Texas and eastern New Mexico; the San Juan Basin in northwestern New Mexico and southern Colorado; and the Anadarko Basin in the Texas and Oklahoma panhandle. Natural gas sources from the San Juan Basin and surrounding producing areas can be delivered eastward to Texas intrastate and mid-continent connecting pipelines and natural gas market hubs as well as westward to markets in Arizona, Nevada and California. Transwestern’s Phoenix lateral pipeline, with a throughput capacity of 500 MMcf/d, connects the Phoenix area to the Transwestern mainline.
Transwestern’s customers include local distribution companies, producers, marketers, electric power generators and industrial end-users.
Panhandle Eastern Pipe Line
|
•
|
Capacity of 2.8 Bcf/d
|
|
•
|
Approximately 6,000 miles of interstate natural gas pipeline
|
|
•
|
Bi-directional capabilities
|
The Panhandle Eastern Pipe Line’s transmission system consists of four large diameter pipelines extending approximately 1,300 miles from producing areas in the Anadarko Basin of Texas, Oklahoma and Kansas through Missouri, Illinois, Indiana, Ohio and into Michigan. Panhandle Eastern Pipe Line is owned by a subsidiary of ETP Holdco.
Trunkline Gas Company
|
•
|
Capacity of 1.7 Bcf/d
|
|
•
|
Approximately 3,000 miles of interstate natural gas pipeline
|
|
•
|
Bi-directional capabilities
|
The Trunkline Gas pipeline’s transmission system consists of two large diameter pipelines extending approximately 1,400 miles from the Gulf Coast areas of Texas and Louisiana through Arkansas, Mississippi, Tennessee, Kentucky, Illinois, Indiana and to Michigan. Trunkline Gas pipeline is owned by a subsidiary of ETP Holdco.
ETP is currently developing plans to convert a portion of the Trunkline gas pipeline to crude oil transportation.
9
Tiger Pipeline
|
•
|
Capacity of 2.4 Bcf/d
|
|
•
|
Approximately 195 miles of interstate natural gas pipeline
|
|
•
|
Bi-directional capabilities
|
The Tiger pipeline is an approximately 195-mile interstate natural gas pipeline that connects to ETP’s dual 42-inch pipeline system near Carthage, Texas, extends through the heart of the Haynesville Shale and ends near Delhi, Louisiana, with interconnects to at least seven interstate pipelines at various points in Louisiana. The pipeline has a capacity of 2.4 Bcf/d, all of which is sold under long-term contracts ranging from 10 to 15 years.
Fayetteville Express Pipeline
|
•
|
Capacity of 2.0 Bcf/d
|
|
•
|
Approximately
185
miles of interstate natural gas pipeline
|
|
•
|
50/50 joint venture through ETC FEP with KMI
|
The Fayetteville Express pipeline is an approximately 185-mile interstate natural gas pipeline that originates near Conway County, Arkansas, continues eastward through White County, Arkansas and terminates at an interconnect with Trunkline Gas Company in Panola County, Mississippi. The pipeline has long-term contracts for 1.85 Bcf/d ranging from 10 to 12 years.
Sea Robin Pipeline
|
•
|
Capacity of 2.3 Bcf/d
|
|
•
|
Approximately 1,000 miles of interstate natural gas pipeline
|
The Sea Robin pipeline’s transmission system consists of two offshore Louisiana natural gas supply systems extending approximately 120 miles into the Gulf of Mexico.
Midstream
The following details the assets in ETP’s midstream operations:
Southeast Texas System
|
•
|
Approximately 6,400 miles of natural gas pipeline
|
|
•
|
One natural gas processing plant (La Grange) with aggregate capacity of 210 MMcf/d
|
|
•
|
11 natural gas treating facilities with aggregate capacity of 1.4 Bcf/d
|
|
•
|
One natural gas conditioning facility with aggregate capacity of 200 MMcf/d
|
The Southeast Texas System is an integrated system that gathers, compresses, treats, processes and transports natural gas from the Austin Chalk trend. The Southeast Texas System is a large natural gas gathering system covering thirteen counties between Austin and Houston. This system is connected to the Katy Hub through the East Texas pipeline and is connected to the Oasis pipeline, as well as two power plants. This allows ETP to bypass processing plants and treating facilities when processing margins are unfavorable by blending untreated natural gas from the Southeast Texas System with natural gas on the Oasis pipeline while continuing to meet pipeline quality specifications.
The La Grange processing plant is a natural gas processing plant that processes the rich natural gas that flows through ETP’s system to produce residue gas and NGLs. Residue gas is delivered into ETP’s intrastate pipelines and NGLs are delivered into ETP’s NGL pipelines and then to Lone Star.
ETP’s treating facilities remove carbon dioxide and hydrogen sulfide from natural gas gathered into ETP’s system before the natural gas is introduced to transportation pipelines to ensure that the gas meets pipeline quality specifications. In addition, ETP’s conditioning facilities remove heavy hydrocarbons from the gas gathered into ETP’s systems so the gas can be redelivered and meet downstream pipeline hydrocarbon dew point specifications.
North Texas System
|
•
|
Approximately 160 miles of natural gas pipeline
|
|
•
|
One natural gas processing plant (the Godley plant) with aggregate capacity of 700 MMcf/d
|
|
•
|
One natural gas conditioning facility with capacity of 100 MMcf/d
|
10
The North Texas System is an integrated system located in four counties in North Texas that gathers, compresses, treats, processes and transports natural gas from the Barnett and Woodford Shales. The system includes ETP’s Godley processing plant, which processes rich natural gas produced from the Barnett Shale and is integrated with the North Texas System and the ET Fuel System. The facility consists of a processing plant and a conditioning facility.
Northern Louisiana
|
•
|
Approximately 280 miles of natural gas pipeline
|
|
•
|
Three natural gas treating facilities with aggregate capacity of 385 MMcf/d
|
ETP’s Northern Louisiana assets comprise several gathering systems in the Haynesville Shale with access to multiple markets through interconnects with several pipelines, including ETP’s Tiger pipeline. The Northern Louisiana assets include the Bistineau, Creedence, and Tristate Systems.
Eagle Ford System
|
•
|
Approximately 245 miles of natural gas pipeline
|
|
•
|
Three processing plants (Chisholm, Kenedy and Jackson) with capacity of 1,160 MMcf/d
|
|
•
|
One natural gas treating facility with capacity of 300 MMcf/d
|
The Eagle Ford gathering system consists of 30-inch and 42-inch natural gas transportation pipelines delivering 1.4 Bcf/d of capacity originating in Dimmitt County, Texas and extending to ETP’s Chisholm pipeline for ultimate deliveries to ETP’s existing processing plants. The Chisholm, Kenedy and Jackson processing plants are connected to ETP’s intrastate transportation pipeline systems for deliveries of residue gas and are also connected with ETP’s NGL pipelines for delivery of NGLs to Lone Star.
Other Midstream Assets
The midstream operations also include ETP’s interests in various midstream assets located in Texas, New Mexico and Louisiana, with approximately 60 miles of gathering pipelines aggregating a combined capacity of approximately 115 MMcf/d, as well as one conditioning facility and the recently commissioned Rebel processing plant with capacity of 130 MMcf/d. ETP also owns approximately 50 miles of gathering pipelines serving the Marcellus Shale in West Virginia with aggregate capacity of approximately 250 MMcf/d.
Liquids Transportation and Services
The following details ETP’s assets in the liquids transportation and services operations. Certain assets, as discussed below, are owned by Lone Star, a joint venture with Regency in which ETP has a 70% interest.
West Texas System
|
•
|
Capacity of 137,000 Bbls/d
|
|
•
|
Approximately 1,170 miles of NGL transmission pipelines
|
The West Texas System, owned by Lone Star, is an intrastate NGL pipeline consisting of 3-inch to 16-inch long-haul, mixed NGLs transportation pipeline that delivers 137,000 Bbls/d of capacity from processing plants in the Permian Basin and Barnett Shale to the Mont Belvieu NGL storage facility.
West Texas Gateway Pipeline
|
•
|
Capacity of 209,000 Bbls/d
|
|
•
|
Approximately 570 miles of NGL transmission pipeline
|
The West Texas Gateway Pipeline, owned by Lone Star, began service in December 2012 and transports NGLs produced in the Permian and Delaware Basins and the Eagle Ford Shale to Mont Belvieu, Texas.
Other NGL Pipelines
|
•
|
Aggregate capacity of 490,000 Bbls/d
|
|
•
|
Approximately
274
miles of NGL transmission pipelines
|
Other NGL pipelines include the 127-mile Justice pipeline with capacity of 340,000 Bbls/d, the 87-mile Liberty pipeline with a capacity of 90,000 Bbls/d, the 45-mile Freedom pipeline with a capacity of 40,000 Bbls/d and the 15-mile Spirit pipeline with a capacity of 20,000 Bbls/d.
11
Rio Bravo Pipeline
|
•
|
Aggregate capacity of 100,000 Bbls/d
|
|
•
|
Approximately 83 miles of crude oil transmission pipeline
|
In 2014, ETP converted approximately 80 miles of natural gas pipeline from the HPL and Southeast Texas Systems to crude service and constructed approximately 3 miles of new crude oil pipeline.
Mont Belvieu Facilities
|
•
|
Working storage capacity of approximately 48 million Bbls
|
|
•
|
Approximately 185 miles of NGL transmission pipelines
|
|
•
|
300,000 Bbls/d NGL and propane fractionation facilities
|
The Mont Belvieu storage facility, owned by Lone Star, is an integrated liquids storage facility with over 48 million Bbls of salt dome capacity providing 100% fee-based cash flows. The Mont Belvieu storage facility has access to multiple NGL and refined product pipelines, the Houston Ship Channel trading hub, and numerous chemical plants, refineries and fractionators.
The Lone Star Fractionators I and II, completed in December 2012 and October 2013, respectively, handle NGLs delivered from several sources, including Lone Star’s West Texas Gateway pipeline and the Justice pipeline.
Hattiesburg Storage Facility
|
•
|
Working storage capacity of approximately 4.5 million Bbls
|
The Hattiesburg storage facility, owned by Lone Star, is an integrated liquids storage facility with approximately 4.5 million Bbls of salt dome capacity, providing 100% fee-based cash flows.
Sea Robin Processing Plant
|
•
|
One processing plant with 850 MMcf/d residue capacity and 26,000 Bbls/d NGL capacity
|
|
•
|
20% non-operating interest held by Lone Star
|
Sea Robin is a rich gas processing plant located on the Sea Robin Pipeline in southern Louisiana. The plant, which is connected to nine interstate and four intrastate residue pipelines as well as various deep-water production fields, has a residue capacity of 850 MMcf/d and an NGL capacity of 26,000 Bbls/d.
Refinery Services
|
•
|
Two processing plants (Chalmette and Sorrento) with capacity of 54 MMcf/d
|
|
•
|
One NGL fractionator with 25,000 Bbls/d capacity
|
|
•
|
Approximately 100 miles of NGL pipelines
|
Refinery Services, owned by Lone Star, consists of a refinery off-gas processing and O-grade NGL fractionation complex located along the Mississippi River refinery corridor in southern Louisiana that cryogenically processes refinery off-gas and fractionates the O-grade NGL stream into its higher value components. The O-grade fractionator located in Geismar, Louisiana is connected by approximately 100 miles of pipeline to the Chalmette processing plant.
Investment in Sunoco Logistics
The following details the assets in ETP’s investment in Sunoco Logistics:
Crude Oil Pipelines
Sunoco Logistics’ crude oil pipelines consist of approximately
5,300
miles of crude oil trunk pipelines for high-volume, long-distance transportation and approximately
500
miles of crude oil gathering pipelines in the southwest and midwest United States. These lines primarily deliver crude oil and other feedstocks to refineries in those regions. Following is a description of Sunoco Logistics’ crude pipelines:
|
•
|
Southwest United States:
The Southwest United States pipeline system includes approximately
3,150
miles of crude oil trunk pipelines and approximately
300
miles of crude oil gathering pipelines in Texas. The Texas system includes the West Texas Gulf Pipe Line Company’s common carrier crude oil pipelines, which originate from the West Texas oil fields at Colorado City, Texas and is connected to the Mid-Valley pipeline, other third-party pipelines and the Nederland Terminal. In December 2014, Sunoco Logistics acquired an additional
28.3%
ownership interest in the West Texas Gulf Pipe Line Company from
|
12
Chevron Pipe Line Company, increasing its controlling financial interest in the consolidated subsidiary to
88.6%
. The remaining
11.4%
was acquired from Southwest Pipeline Holding Company, LLC in January 2015.
The Southwest United States pipeline system also includes the Oklahoma crude oil pipeline and gathering system that consists of approximately
1,050
miles of crude oil trunk pipelines and approximately
200
miles of crude oil gathering pipelines. Sunoco Logistics has the ability to deliver substantially all of the crude oil gathered on the Oklahoma system to Cushing, Oklahoma and is one of the largest purchasers of crude oil from producers in the state.
|
•
|
Midwest United States:
The Midwest United States pipeline system includes Sunoco Logistics’ majority interest in the Mid-Valley Pipeline Company and consists of approximately
1,000
miles of a crude oil pipeline that originates in Longview, Texas and passes through Louisiana, Arkansas, Mississippi, Tennessee, Kentucky and Ohio, and terminates in Samaria, Michigan. This pipeline provides crude oil to a number of refineries, primarily in the midwest United States.
|
Sunoco Logistics also owns approximately
100
miles of crude oil pipeline that runs from Marysville, Michigan to Toledo, Ohio, and a truck injection point for local production at Marysville. This pipeline receives crude oil from the Enbridge pipeline system for delivery to refineries located in Toledo, Ohio and to Marathon’s Samaria, Michigan tank farm, which supplies its refinery in Detroit, Michigan.
Crude Oil Acquisition and Marketing
Sunoco Logistics’ crude oil acquisition and marketing activities include the gathering, purchasing, marketing and selling of crude oil primarily in the mid-continent United States. The operations are conducted using Sunoco Logistics’ assets, which include approximately
335
crude oil transport trucks and approximately
135
crude oil truck unloading facilities, as well as third-party truck, rail and marine assets. Specifically, the crude oil acquisition and marketing activities include:
|
•
|
purchasing crude oil at the wellhead from producers, and in bulk from aggregators at major pipeline interconnections and trading locations;
|
|
•
|
storing inventory during contango market conditions (when the price of crude oil for future delivery is higher than current prices);
|
|
•
|
buying and selling crude oil of different grades, at different locations in order to maximize value;
|
|
•
|
transporting crude oil on Sunoco Logistics’ pipelines and trucks or, when necessary or cost effective, pipelines or trucks owned and operated by third parties; and
|
|
•
|
marketing crude oil to major integrated oil companies, independent refiners and resellers through various types of sale and exchange transactions.
|
Terminal Facilities
Sunoco Logistics’
39
active refined products terminals receive refined products from pipelines, barges, railcars, and trucks and distribute them to third parties and certain affiliates, who in turn deliver them to end-users and retail outlets. Terminals are facilities where products are transferred to or from storage or transportation systems, such as a pipeline, to other transportation systems, such as trucks or other pipelines.
Terminals play a key role in moving product to the end-user markets by providing the following services: storage; distribution; blending to achieve specified grades of gasoline and middle distillates; and other ancillary services that include the injection of additives and the filtering of jet fuel. Typically, Sunoco Logistics’ refined products terminal facilities consist of multiple storage tanks and are equipped with automated truck loading equipment that is operational 24 hours a day. This automated system provides controls over allocations, credit, and carrier certification.
|
•
|
Nederland Terminal:
The Nederland Terminal, located on the Sabine-Neches waterway between Beaumont and Port Arthur, Texas, is a large marine terminal providing storage and distribution services for refiners and other large transporters of crude oil and NGLs. The terminal receives, stores, and distributes crude oil, NGLs, feedstocks, lubricants, petrochemicals, and bunker oils (used for fueling ships and other marine vessels), and also blends lubricants. The terminal currently has a total storage capacity of approximately
25 million
barrels in approximately
130
above ground storage tanks with individual capacities of up to
660,000
barrels.
|
The Nederland Terminal can receive crude oil at each of its five ship docks and three barge berths. The five ship docks are capable of receiving over 2 million Bbls/d of crude oil. In addition to Sunoco Logistics’ crude oil pipelines, the terminal can also receive crude oil through a number of other pipelines, including the DOE. The DOE pipelines connect the terminal to the United States Strategic Petroleum Reserve’s West Hackberry caverns at Hackberry, Louisiana and Big Hill near Winnie, Texas, which have an aggregate storage capacity of approximat
ely
400 million
barrels.
13
The Nederland Terminal can deliver crude oil and other petroleum products via pipeline, barge, ship, rail, or truck. In total, the terminal is capable of delivering over
2 million
Bbls/
d of crude oil to Sunoco Logistics’ crude oil pipelines or a number of third-party pipelines including DOE. The Nederland Terminal can also receive NGLs in connection with the Mariner South pipeline.
|
•
|
Fort Mifflin Terminal Complex:
The Fort Mifflin Terminal Complex is located on the Delaware River in Philadelphia, Pennsylvania and includes the Fort Mifflin Terminal, the Hog Island Wharf, the Darby Creek tank farm and connecting pipelines. Revenues are generated from the Fort Mifflin Terminal Complex by charging fees based on throughput. The Fort Mifflin Terminal contains two ship docks with freshwater drafts and a total storage capacity of approximately
570,000
barrels. Crude oil and some refined products enter the Fort Mifflin Terminal primarily from marine vessels on the Delaware River. One Fort Mifflin dock is designed to handle crude oil from very large crude carrier-class (“VLCC”) tankers and smaller crude oil vessels. The other dock can accommodate only smaller crude oil vessels.
|
The Hog Island Wharf is located next to the Fort Mifflin Terminal on the Delaware River and receives crude oil via two ship docks, one of which can accommodate crude oil tankers and smaller crude oil vessels, and the other of which can accommodate some smaller crude oil vessels.
The Darby Creek tank farm is a primary crude oil storage terminal for the Philadelphia refinery, which is operated by PES. This facility has a total storage capacity of approximately
3 million
barrels. Darby Creek receives crude oil from the Fort Mifflin Terminal and Hog Island Wharf via Sunoco Logistics pipelines. The tank farm then stores the crude oil and transports it to the PES refinery via Sunoco Logistics pipelines.
|
•
|
Marcus Hook Industrial Complex:
In 2013, Sunoco Logistics acquired Sunoco, Inc.’s Marcus Hook Industrial Complex. The acquisition included terminalling and storage assets with a capacity of approxim
ately
3 million
barrels located in Pennsylvania and Delaware, including approximately 2 million barrels of NGL storage c
apacity in underground caverns, and related commercial agreements. The facility can receive NGLs via marine vessel, pipeline, truck and rail, and can deliver via marine vessel, pipeline and truck. In addition to providing NGL storage and terminalling services to both affiliates and third-party customers, the Marcus Hook Industrial Complex also provides customers with the use of industrial space and equipment at the facility, as well as logistical, utility and infrastructure services.
|
|
•
|
Eagle Point Terminal:
The Eagle Point Terminal is located in Westville, New Jersey and consists of docks, truck loading facilities and a tank farm. The docks are located on the Delaware River and can accommodate three marine vessels (ships or barges) to receive and deliver crude oil, intermediate products and refined products to outbound ships and barges. The tank farm has a total active storage capacity of approximately
6 million
barrels and can receive crude oil and refined products via barge, pipeline and rail. The terminal can deliver via barge, truck, rail or pipeline, providing customers with access to various markets. The terminal generates revenue primarily by charging fees based on throughput, blending services and storage for clean products and dark oils.
|
|
•
|
Inkster Terminal:
The Inkster Terminal, located near Detroit, Michigan, consists of eight salt caverns with a total storage capacity of approximately
975,000
barrels. The Inkster Terminal’s storage is used in connection with the Toledo, Ohio to Sarnia, Canada pipeline system and for the storage of NGLs from local producers and a refinery in western Ohio. The terminal can receive and ship by pipeline in both directions and has a truck loading and offloading rack.
|
14
The following table outlines the number of Sunoco Logistics’ active terminals and storage capacity by state:
|
State
|
Number of Terminals
|
Storage Capacity (thousands of Bbls)
|
||||
|
Indiana
|
1
|
|
206
|
|
||
|
Louisiana
|
1
|
|
161
|
|
||
|
Maryland
|
1
|
|
710
|
|
||
|
Massachusetts
|
1
|
|
1,144
|
|
||
|
Michigan
|
3
|
|
760
|
|
||
|
New Jersey
|
3
|
|
650
|
|
||
|
New York
(1)
|
4
|
|
920
|
|
||
|
Ohio
|
7
|
|
957
|
|
||
|
Pennsylvania
|
13
|
|
1,743
|
|
||
|
Texas
|
4
|
|
548
|
|
||
|
Virginia
|
1
|
|
403
|
|
||
|
Total
|
39
|
|
8,202
|
|
||
|
(1)
|
Sunoco Logistics has a
45%
ownership interest in a terminal at Inwood, New York and a
50%
ownership interest in a terminal at Syracuse, New York. The storage capacities included in the table represent the proportionate share of capacity attributable to Sunoco Logistics’ ownership interests in these terminals.
|
Products Pipelines
Sunoco Logistics owns and operates approximately
2,400
miles of products pipelines in several regions of the United States. The products pipelines primarily transport refined products and NGLs from refineries in the northeast, midwest and southwest United States to markets in New York, New Jersey, Pennsylvania, Ohio, Michigan and Texas. These pipelines include approximately 350 miles of products pipelines owned by Sunoco Logistics’ consolidated joint venture, Inland Corporation (“Inland”).
The refined products transported in these pipelines include multiple grades of gasoline, middle distillates (such as heating oil, diesel and jet fuel), and LPGs (such as propane and butane). In addition, certain of these pipelines transport NGLs from processing and fractionation areas to marketing and distribution facilities. Rates for shipments on the products pipelines are regulated by the FERC and the Pennsylvania Public Utility Commission (“PA PUC”), among other state regulatory agencies.
|
•
|
Mariner East:
Mariner East 1 and Mariner East 2 are pipeline projects to deliver NGLs from the Marcellus and Utica Shale areas in western Pennsylvania, West Virginia and eastern Ohio to the Marcus Hook Industrial Complex on the Delaware River in Pennsylvania, where it will be processed, stored and distributed to various local, domestic and waterborne markets. Mariner East 2 is the second phase of the project, which will expand the total take-away capacity to 345,000 Bbls/d. Mariner East 1 commenced initial operations in the fourth quarter of 2014 and Mariner East 2 is expected to commence operations in the fourth quarter 2016.
|
|
•
|
Mariner Souther:
The Mariner South pipeline provides transportation of propane and butane products from the Mont Belvieu, Texas area to the Nederland Terminal, where such products can be sold by way of ship. Mariner South commenced initial operations in December 2014, with an initial capacity of
200,000
Bbls/d of NGLs and other products.
|
|
•
|
Inland:
Inland is Sunoco Logistics’
83.8%
owned joint venture consisting of approximately
350
miles of active products pipelines in Ohio. The pipeline connects three refineries in Ohio to terminals and major markets within the state. As Sunoco Logistics owns a controlling financial interest in Inland, the joint venture is reflected as a consolidated subsidiary in its consolidated financial statements.
|
15
Sunoco Logistics owns equity interests in several common carrier products pipelines, summarized in the following table:
|
Pipeline
|
Equity Ownership
|
Pipeline Mileage
|
||||
|
Explorer Pipeline Company
(1)
|
13.3
|
%
|
1,850
|
|
||
|
Yellowstone Pipe Line Company
(2)
|
14.0
|
%
|
700
|
|
||
|
West Shore Pipe Line Company
(3)
|
17.1
|
%
|
650
|
|
||
|
Wolverine Pipe Line Company
(4)
|
31.5
|
%
|
700
|
|
||
|
(1)
|
The system, which is operated by Explorer employees, originates from the refining centers of Beaumont, Port Arthur and Houston, Texas, and extends to Chicago, Illinois, with delivery points in the Houston, Dallas/Fort Worth, Tulsa, St. Louis, and Chicago areas. Explorer charges market-based rates for all its tariffs. An additional
3.9%
ownership interest was purchased in the first quarter of 2014.
|
|
(2)
|
The system, which is operated by Phillips 66, originates from the Billings, Montana refining center and extends to Moses Lake, Washington with delivery points along the way. Tariff rates are regulated by the FERC for interstate shipments and the Montana Public Service Commission for intrastate shipments in Montana.
|
|
(3)
|
The system, which is operated by Buckeye Partners, L.P., originates from the Chicago, Illinois refining center and extends to Madison and Green Bay, Wisconsin with delivery points along the way. West Shore charges market-based tariff rates in the Chicago area.
|
|
(4)
|
The system, which is operated by Wolverine employees, originates from Chicago, Illinois and extends to Detroit, Grand Haven, and Bay City, Michigan with delivery points along the way. Wolverine charges market-based rates for tariffs at the Detroit, Jackson, Niles, Hammond, and Lockport destinations.
|
Retail Marketing
ETP’s retail marketing and wholesale distribution operations consist of the retail sale of motor fuel and merchandise through company-operated locations, and the distribution of branded and unbranded motor fuel purchased primarily from refiners to company-operated retail sites, independently-operated retail sites, as well as other wholesale and commercial customers.
The business is operated through various wholly-owned subsidiaries as well as through Sunoco LP which ETP controls through its ownership of the general partner. ETP currently plans to contribute all of the retail operations and fuel distributions business to Sunoco LP in future periods. In October 2014, ETP completed the first of such transactions, when one of ETP’s subsidiaries contributed all of the ownership of MACS to Sunoco LP.
The retail marketing operations have a portfolio of outlets operating under three channels of trade: company-operated, dealer-operated and distributor-operated sites. The portfolio of sites in these channels differ in various ways including: site ownership and operation, product distribution to the outlets, and types/brands of products and services provided.
Company-operated sites, which are operated by one of our subsidiaries, and independent dealer-operated sites are sites at which fuel products are delivered directly to the site by company-operated trucks or by contract carriers. One of our subsidiaries may own or lease the property and collect rental income or an independent dealer owns or leases the property. Independent dealers are supplied under a contract with one of our subsidiaries. Most of the company-operated sites include a convenience store under the Aplus®, Stripes®, MACS, Tigermarket or Aloha Island Mart® brands. As of December 31, 2014, our subsidiaries were operating or supplying under a long-term contract a total of 75 Sunoco®-branded outlets on turnpikes and expressways in Pennsylvania, New Jersey, New York, Maryland, Ohio and Delaware.
Distributor outlets are primarily Sunoco®-branded sites in which the distributor takes delivery of fuel products at a terminal where branded products are available. ETP subsidiaries supply the distributor under a long-term contract, but do not own, lease or operate these distributor locations.
The highest concentration of retail outlets are located in Texas, Pennsylvania, New York, Florida and Ohio.
16
The following table sets forth ETP’s retail gasoline outlets at
December 31, 2014
(including sites operated through its subsidiaries):
|
Retail and Fuel Distribution Outlets:
|
Sunoco LP
|
Wholly-Owned Subsidiaries
|
Total
|
|||||
|
Company-Owned or Leased:
|
|
|||||||
|
Company-Operated
(1)
|
155
|
|
1,096
|
|
1,251
|
|
||
|
Dealer-Operated
|
138
|
|
425
|
|
563
|
|
||
|
Total
|
293
|
|
1,521
|
|
1,814
|
|
||
|
Dealer Owned
|
655
|
|
541
|
|
1,196
|
|
||
|
Distributor Outlets
|
—
|
|
3,640
|
|
3,640
|
|
||
|
Total
|
948
|
|
5,702
|
|
6,650
|
|
||
|
(1)
|
Gasoline and diesel throughput per company-operated site averaged
177,236
gallons per month during
2014
.
|
Brands
ETP manages a portfolio of strong proprietary fuel and convenience store brands through its retail and wholesale portfolio of outlets, including Sunoco®, Stripes®, Aplus®, and Aloha Island Mart®.
Of the total retail outlets that are company-operated or operating under a long-term contract by an independent third-party,
4,961
operate under the Sunoco® fuel brand as of
December 31, 2014
. The Sunoco® brand is positioned as a premium fuel brand. Brand improvements in recent years have focused on physical image, customer service and product offerings. In addition, Sunoco, Inc. believes its brands and high performance gasoline business have benefited from its sponsorship agreements with NASCAR®, INDYCAR® and the NHRA®. Under the sponsorship agreement with NASCAR®, which continues until 2022, Sunoco® is the Official Fuel of NASCAR® and APlus® is the Official Convenience Store of NASCAR®. Sunoco, Inc. has exclusive rights to use certain NASCAR® trademarks to advertise and promote Sunoco, Inc. products and is the exclusive fuel supplier for the three major NASCAR® racing series. The sponsorship agreements with INDYCAR® and NHRA® continue through 2018 and 2024, respectively.
In addition to operating premium proprietary brands, our subsidiaries operate as a significant distributor to multiple top-tier fuel brands, including Exxon®, Mobil®, Valero®, Shell® and Chevron®.
Convenience Store and Restaurant Operations
ETP subsidiaries operate
1,185
convenience stores primarily under our proprietary Stripes®, Aplus® and Aloha Island Mart® convenience store brands as of
December 31, 2014
. These stores complement sales of fuel products with a broad mix of merchandise, food service, and other services. As of
December 31, 2014
,
474
of these stores featured in-store restaurants allowing us to make fresh food on the premises daily. Laredo Taco Company® is ETP’s in-house proprietary restaurant operation featuring breakfast and lunch tacos, a wide variety of handmade authentic Mexican food and other hot food offerings targeted to local populations in the markets served. Some of these stores also offer other proprietary and third party food options, including Subway® sandwiches and Godfather® pizza.
The following table sets forth information concerning the company-operated convenience stores during 2014:
|
Number of stores at December 31, 2014
|
1,185
|
|
||
|
Merchandise sales (thousands of dollars/store/month)
|
$
|
127
|
|
|
|
Merchandise margin (% sales)
|
31.4
|
%
|
||
ETP’s retail marketing operations also include the distribution of gasoline, distillate and other petroleum products to wholesalers, unbranded retailers and other commercial customers.
17
Investment in Regency
The following details the assets in Regency’s natural gas operations:
Gathering and Processing Operations
Arklatex Region
|
•
|
Four cryogenic natural gas processing facilities, two refrigeration plants, a conditioning plant and two amine treating plants
|
|
•
|
Compression horsepower of 96,834
|
Regency’s Arklatex assets gather, compress, treat and dehydrate natural gas in several Parishes of north and west Louisiana and several counties in east Texas. Its assets also include cryogenic natural gas processing facilities, a refrigeration plant, a conditioning plant, amine treating plants, and an interstate NGL pipeline.
Through the gathering and processing systems described above and their interconnections with RIGS in north Louisiana, Regency offers producers wellhead-to-market services, including natural gas gathering, compression, processing, treating and transportation.
In May 2014, Regency announced the construction of a new 200 MMcf/d cryogenic processing plant and 47-mile, 40,000 bbls/d capacity NGL pipeline, for a combined total of $191 million, which is expected to be completed in mid-2015.
South Texas Region
|
•
|
Three treating plants
|
|
•
|
Compression horsepower of 187,723
|
Regency’s south Texas assets gather, compress, treat and dehydrate natural gas in Bee, LaSalle, Webb, Karnes, Atascosa, McMullen, Frio and Dimmitt counties. Some of the natural gas produced in this region can have significant quantities of hydrogen sulfide and carbon dioxide that require treating to remove these impurities. The pipeline systems that gather this gas are connected to third-party processing plants and Regency’s treating facilities that include an acid gas reinjection wells located in McMullen County, Texas. Regency also gathers oil for producers in the region and delivers it to tanks for further transportation by truck or pipeline.
The natural gas supply for Regency’s south Texas gathering systems is derived from a combination of natural gas wells located in a mature basin that generally have long lives and predictable gas flow rates, including the Frio, Vicksburg, Miocene, Canyon Sands and Wilcox formations, and the NGLs-rich and oil-rich Eagle Ford shale formation, which lies directly under Regency’s existing south Texas gathering system infrastructure.
Regency owns a 60% interest in Edwards Lime Gathering LLC with Talisman Energy USA Inc. and Statoil Texas Onshore Properties LP owning the remaining 40% interest. Regency operates a natural gas gathering oil pipeline and oil stabilization facilities for the joint venture while its joint venture partners operate a lean gas gathering system in the Edwards Lime natural gas trend that delivers to this system.
Permian Region
|
•
|
Six processing and treating plants, two processing plants and two treating plants
|
|
•
|
Compression horsepower of 387,932
|
Regency’s Permian Basin gathering system assets offer wellhead-to-market services to producers in the Texas counties of Ward, Winkler, Reeves, Pecos, Crocket, Upton, Crane, Ector, Culberson, Reagan and Andrews counties, as well as into Eddy and Lea counties in New Mexico which surround the Waha Hub, one of Texas’s developing NGLs-rich natural gas market areas. As a result of the proximity of Regency’s system to the Waha Hub, the Waha gathering system has a variety of market outlets for the natural gas that Regency gathers and processes, including several major interstate and intrastate pipelines serving California, the mid-continent region of the United States and Texas natural gas markets. The NGL market outlets include Lone Star’s NGL pipeline.
Regency’s Permian region assets consist of a network of natural gas and NGL pipelines, six processing and treating plants, two processing plants, and two treating plants. These assets offer a broad array of services to producers including field gathering and compression of natural gas; treating, dehydration, sulfur recovery and reinjection and other conditioning; and natural gas processing and marketing of natural gas and NGLs.
In October 2014, Regency entered into a joint venture with Anadarko Mi Vida LLC (“Anadarko”). Anadarko and Regency each own a 50% membership interest in the new joint venture, Mi Vida JV. Regency will construct and operate a 200 MMcf/d cryogenic processing plant and related facilities in west Texas, on behalf of Mi Vida JV.
18
Regency owns a 33.33% membership interest in Ranch JV which processes natural gas delivered from the NGLs-rich Bone Spring and Avalon shale formations in west Texas. The joint venture owns a 25 MMcf/d refrigeration plant and a 100 MMcf/d cryogenic processing plant.
Mid-Continent Region
|
•
|
14 processing facilities
|
|
•
|
Compression horsepower of 425,394
|
Regency’s mid-continent systems are located in two large natural gas producing regions in the United States, the Hugoton Basin in southwest Kansas, and the Anadarko Basin in western Oklahoma and the Texas Panhandle. These mature basins have continued to provide generally long-lived, predictable production volume. Regency’s mid-continent gathering assets are extensive systems that gather, compress and dehydrate low-pressure gas. Regency has 14 natural gas producing facilities and approximately 12,995 miles of gathering pipeline.
Regency operates its mid-continent gathering systems at low pressures to maximize the total throughput volumes from the connected wells. Wellhead pressures are therefore adequate to allow for flow of natural gas into the gathering lines without the cost of wellhead compression.
Regency also owns the Hugoton gathering system that has 1,900 miles of pipeline extending over nine counties in Kansas and Oklahoma. This system is operated by a third party.
Eastern Region
|
•
|
Compression horsepower of 112,282
|
Regency’s eastern region assets are located in Pennsylvania, Ohio, and West Virginia, and gather natural gas from the Marcellus and Utica basins. Regency’s eastern gathering assets include approximately 370 miles of natural gas gathering pipeline, natural gas trunkline pipelines, and fresh water pipelines, and the Lycoming, Wyoming, East Lycoming, Bradford, Green County, and Preston gathering and processing systems. Regency’s Eastern operations earn revenues primarily from fees charged to producers for natural gas gathering, transportation, compression and other related services.
Regency also own a 51% membership interest in Aqua - PVR Water Services, LLC, a joint venture that transports and supplies fresh water to natural gas producers drilling in the Marcellus Shale in Pennsylvania.
In August 2014, Regency entered into a joint venture with American Energy - Midstream, LLC (“AEM”). Regency and AEM own a 75% and 25% membership interest, respectively, in the new joint venture Ohio River System LLC (“ORS”). On behalf of ORS, Regency is constructing and will operate its Ohio Utica River System, (the “ORS System”) which consists of a 52-mile, 36-inch gathering trunkline that will be capable of delivering up to 2.1 bcf/d to Rockies Express Pipeline (“REX”) and Texas Eastern Transmission, and potentially others and the construction of 25,000 horsepower of compression at the REX interconnect. This project will also include the construction of a 12-mile, 30-inch lateral that will initially connect to the tailgate of the Cadiz processing plant and Harrison County wellhead production. The system is expected to be completed in the third quarter of 2015. Total costs for the ORS System are expected to be approximately $500 million; 75% contributed from Regency and 25% contributed from AEM. Additionally, Regency and American Energy - Utica, LLC (“AEU”), an affiliate of AEM, entered into a gathering agreement for gas produced from the Utica Shale in eastern Ohio by AEU.
Natural Gas Transportation Operations
RIGS has the capacity to transport up to 2.1 Bcf/d of natural gas. Results of RIGS’s operations are determined primarily by the volumes of natural gas transported and subscribed on its intrastate pipeline system and the level of fees charged to customers or the margins received from purchases and sales of natural gas. RIGS generates revenues and margins principally under fee-based transportation contracts. The fixed capacity reservation charges related to RIGS that are not directly dependent on throughput volumes or commodity prices represent 93% of HPC’s margin.
MEP pipeline system, operated by KMI, has the capability to transport up to 1.8 Bcf/d of natural gas, and the pipeline capacity is nearly fully subscribed, Zone 1 is 95% subscribed and Zone 2 is fully subscribed, with long-term binding commitments from creditworthy shippers. Results of MEP’s operations are determined primarily by the volumes of natural gas transported and subscribed on its interstate pipeline system and the level of fees charged to customers. MEP generates revenues and margins principally under fee-based transportation contracts. The margin MEP earns is primarily related to fixed capacity reservation charges that are not directly dependent on throughput volumes or commodity prices. If a sustained decline in commodity prices should result in a decline in volumes, MEP’s revenues would not be significantly impacted until expiration of the current contracts.
19
Gulf States is a small interstate pipeline that uses cost-based rates and terms and conditions of service for shippers wishing to secure capacity for interstate transportation service. Rates charged are largely governed by long-term negotiated rate agreements.
NGL Services Operations
Regency owns a 30% membership interest in Lone Star. ETP owns the remaining 70% membership interest. See “
Liquids Transportation and Services”
under ETP’s asset overview discussion for additional details.
Contract Services Operations
Regency’s contract services operations include contract compression services and contract treating services. The natural gas contract compression services include designing, sourcing, owning, installing, operating, servicing, repairing and maintaining compressors and related equipment for which Regency guarantees their customers 98% mechanical availability for land installations and 96% mechanical availability for over-water installations. Regency focuses on meeting the complex requirements of field-wide compression applications, as opposed to targeting the compression needs of individual wells within a field. These field-wide applications include compression for natural gas gathering and natural gas processing. Regency believes that it improves the stability of its cash flow by focusing on field-wide compression applications because such applications generally involve long-term installations of multiple large horsepower compression units. Regency’s contract compression operations are located in Texas, Oklahoma, Louisiana, Arkansas, Pennsylvania, New Mexico, Colorado and California.
Regency owns and operates a fleet of equipment used to provide treating services, such as carbon dioxide and hydrogen sulfide removal, natural gas cooling, dehydration and BTU management. Regency’s contract treating services are primarily located in Texas, Louisiana and Arkansas.
Natural Resources Operations
Regency’s Natural Resources operations primarily involve the management and leasing of coal properties and the subsequent collection of royalties. Regency also earn revenues from other land management activities, such as selling standing timber, leasing fee-based coalrelated infrastructure facilities to certain lessees and end-user industrial plants, collecting oil and gas royalties and from coal transportation, or wheelage fees. As of December 31, 2014, Regency owned or controlled approximately 821 million tons of proven and probable coal reserves in central and northern Appalachia, properties in eastern Kentucky, Tennessee, southwestern Virginia and southern West Virginia; and the Illinois Basin, properties in southern Illinois, Indiana, and western Kentucky and as the operator of end-user coal handling facilities. Since 2004, the Natural Resources segment held a 50% interest in a coal services company with Alpha Natural Resources. In December 2014, we acquired the remaining 50% membership interest. The company, now know as Materials Handling Solutions, LLC, owns and operates facilities for industrial customers on a fee basis. During 2014, our coal reserves located in the San Juan basin depleted and our associated coal royalties revenues ceased.
Coal reserves are coal tons that can be economically extracted or produced at the time of determination considering legal, economic and technical limitations. All of the estimates of Regency’s coal reserves are classified as proven and probable reserves. Proven and probable coal reserves are defined as follows:
Proven Coal Reserves
. Proven coal reserves are reserves for which: (i) quantity is computed from dimensions revealed in outcrops, trenches, workings or drill holes; (ii) grade and/or quality are computed from the results of detailed sampling; and (iii) the sites for inspection, sampling and measurement are spaced so closely, and the geologic character is so well defined, that the size, shape, depth and mineral content of reserves are well-established.
Probable Coal Reserves
. Probable coal reserves are reserves for which quantity and grade and/or quality are computed from information similar to that used for proven reserves, but the sites for inspection, sampling and measurement are more widely spaced or are otherwise less adequately spaced. The degree of assurance, although lower than that for proven coal reserves, is high enough to assume continuity between points of observation.
In areas where geologic conditions indicate potential inconsistencies related to coal reserves, Regency performs additional exploration to ensure the continuity and mineability of the coal reserves. Consequently, sampling in those areas involves drill holes or channel samples that are spaced closer together than those distances cited above.
Coal reserve estimates are adjusted annually for production, unmineable areas, acquisitions and sales of coal in place. The majority of Regency’s coal reserves are high in energy content, low in sulfur and suitable for either the steam or to a lesser extent the metallurgical market.
The amount of coal that a lessee can profitably mine at any given time is subject to several factors and may be substantially different from “proven and probable coal reserves.” Included among the factors that influence profitability are the existing market price, coal quality and operating costs.
20
Regency enters into long-term leases with experienced, third-party mine operators, providing them the right to mine coal reserves in exchange for royalty payments. Regency actively works with its lessees to develop efficient methods to exploit its reserves and to maximize production from its properties. Regency does not operate any mines. In 2014, Regency’s lessees produced 15.9 million tons of coal (11.3 million tons from March 21, 2014 (the date of acquisition) to December 31, 2014) from Regency’s properties and paid coal royalty revenues of $59 million ($44 million from March 21, 2014 (the date of acquisition) to December 31, 2014). Approximately 84% of Regency’s coal royalty revenues in 2014 were derived from coal mined on properties under leases containing royalty rates based on the higher of a fixed base price or a percentage of the gross sales price. The balance of Regency’s coal royalty revenues for the respective periods was derived from coal mined on properties under leases containing fixed royalty rates that escalate annually.
Regency’s lessees mine coal using both underground and surface methods. As of December 31, 2014, Regency’s lessees operated 24 surface mines and 24 underground mines. Approximately 57% of the coal produced from our properties in 2014 came from underground mines and 43% came from surface mines. Most of Regency’s lessees use the continuous mining method in their underground mines located on its properties. In continuous mining, main airways and transportation entries are developed and remote-controlled continuous miners extract coal from “entries,” leaving “pillars” to support the roof. Shuttle cars transport coal to a conveyor belt for transportation to the surface. In several underground mines, Regency’s lessees use two continuous miners running at the same time, also known as a supersection, to improve productivity and reduce unit costs.
The following tables set forth production data for the periods presented and reserve information with respect to each of Regency’s properties for the period presented (tons in millions):
|
Production for the Years Ended December 31,
|
|||||
|
Property
|
2014
|
2013
|
|||
|
Central Appalachia
|
9.0
|
|
10.2
|
|
|
|
Northern Appalachia
|
2.7
|
|
3.3
|
|
|
|
Illinois Basin
|
2.4
|
|
2.4
|
|
|
|
San Juan Basin
(1)
|
1.8
|
|
9.2
|
|
|
|
Total
|
15.9
|
|
25.1
|
|
|
(1)
Regency’s San Juan reserves were fully depleted in the first quarter of 2014.
The following table sets forth the coal reserves Regency owned and leased with respect to each of its coal properties as of December 31, 2014 (tons in millions):
|
Property
|
Owned
|
|
Leased
|
|
Total Controlled
|
|||
|
Central Appalachia
|
482.3
|
|
|
141.0
|
|
|
623.3
|
|
|
Northern Appalachia
|
16.6
|
|
|
—
|
|
|
16.6
|
|
|
Illinois Basin
|
150.5
|
|
|
30.7
|
|
|
181.2
|
|
|
Total
|
649.4
|
|
|
171.7
|
|
|
821.1
|
|
The following table sets forth Regency’s coal reserve activity for the periods presented and ended (tons in millions):
|
2014
|
2013
|
||||
|
Reserves - beginning of year
|
847.0
|
|
871.0
|
|
|
|
Purchase of coal reserves
|
—
|
|
2.3
|
|
|
|
Tons mined by lessees
|
(15.9
|
)
|
(25.1
|
)
|
|
|
Revisions of estimates and other
|
(10.0
|
)
|
(1.2
|
)
|
|
|
Reserves - end of year
|
821.1
|
|
847.0
|
|
|
Regency’s coal reserve estimates are prepared from geological data assembled and analyzed by our general partner’s or its affiliates’ geologists and engineers. These estimates are compiled using geological data taken from thousands of drill holes, geophysical logs, adjacent mine workings, outcrop prospect openings and other sources. These estimates also take into account legal, qualitative, technical and economic limitations that may keep coal from being mined. Coal reserve estimates will change from time to time due to mining activities, analysis of new engineering and geological data, acquisition or divestment of reserve holdings, modification of mining plans or mining methods and other factors.
21
Investment in Lake Charles LNG
Regasification Facility
Lake Charles LNG, a wholly-owned subsidiary of ETE, owns a LNG import terminal and regasification facility located on Louisiana’s Gulf Coast near Lake Charles, Louisiana. The import terminal has approximately
9.0
Bcf of above ground LNG storage capacity and the regasification facility has a run rate send out capacity of 1.8 bcf/day.
Liquefaction Project
LCL, an entity owned 60% by ETE and 40% by ETP, is in the process of developing the liquefaction project in conjunction with BG pursuant to a project development agreement entered into in September 2013. Pursuant to this agreement, each of LCL and BG are obligated to pay 50% of the development expenses for the liquefaction project, subject to reimbursement by the other party if such party withdraws from the project prior to both parties making an affirmative FID to become irrevocably obligated to fully develop the project, subject to certain exceptions. The liquefaction project is expected to consist of three LNG trains with a combined design nameplate outlet capacity of 16.2 metric tonnes per annum. Once completed, the liquefaction project will enable LCL to liquefy domestically produced natural gas and export it as LNG. By adding the new liquefaction facility and integrating with the existing LNG regasification/import facility, the enhanced facility will become a bi-directional facility capable of exporting and importing LNG. BG is the sole customer for the existing regasification facility and is obligated to pay reservation fees for 100% of the regasification capacity regardless of whether it actually utilizes such capacity pursuant to a regasification services agreement that terminates in 2030. The liquefaction project will be constructed on 400 acres of land, of which 200 acres are owned or leased by Lake Charles LNG and 200 acres are to be leased by LCL under a long-term lease from the Lake Charles Harbor and Terminal District or purchased by LCL pursuant to the exercise of an option agreement entered into in connection with the liquefaction project.
The construction of the liquefaction project is subject to each of LCL and BG making an affirmative FID to proceed with the project, which decision is in the sole discretion of each party. In the event an affirmative FID is made by both parties, LCL and BG will enter into several agreements related to the project, including a liquefaction services agreement pursuant to which BG will pay LCL for liquefaction services on a tolling basis for a minimum 25-year term with evergreen extension options for 20 years. In addition, a subsidiary of BG, a highly experienced owner and operator of LNG facilities, would oversee construction of the liquefaction facility and, upon completion of construction, manage the operations of the liquefaction facility on behalf of LCL. Subject to receipt of regulatory approvals, we anticipate that each of LCL and BG will make an affirmative FID in 2016 and then commence construction of the liquefaction project in order to place the first LNG train in service in late 2019 and the second and third trains in service during 2020.
The export of LNG produced by the liquefaction project from the U.S. will be undertaken under long-term export authorizations issued by the DOE to Lake Charles Exports, LLC (“LCE”), which is currently a jointly owned subsidiary of BG and ETP and following FID, will be 100% owned by BG. In July 2011, LCE obtained a DOE authorization to export LNG to countries with which the U.S. has or will have Free Trade Agreements (“FTA”) for trade in natural gas (the “FTA Authorization”). In August 2013, LCE obtained a conditional DOE authorization to export LNG to countries that do not have an FTA for trade in natural gas (the “Non-FTA Authorization”). The FTA Authorization and Non-FTA Authorization have 25- and 20-year terms, respectively. In January 2013, LCL filed for a secondary, non-cumulative FTA and Non-FTA Authorization to be held by LCL. FTA Authorization was granted in March 2013 and we expect the DOE to issue the Non-FTA Authorization to LCL in due course.
Prior to being authorized to export LNG, we must also receive (i) approvals from the FERC to construct and operate the facilities, (ii) wetlands permits from the U.S. Army Corps of Engineers (“USACE”) to perform wetlands mitigation work and to perform modification and dredging work for the temporary and permanent dock facilities at the Lake Charles LNG facilities, and (iii) air permits from the Louisiana Department of Environmental Quality (“LDEQ”) for emissions from the liquefaction project. We expect to receive the wetlands permit from the USACE and the air permit from the LDEQ in the third quarter of 2015.
In January 2015, LCL received from FERC its notice of schedule. The FERC notice of schedule provides an important timeline for the issuance of the Notice of Availability of Final Environmental Impact Statement (the “FEIS”). The issuance of the FEIS is scheduled for August 14, 2015, which then starts the 90-day period in which other federal agencies are to complete their review of the project and issue any required agency authorizations. The federal decision deadline date is November 12, 2015 and the FERC authorization for the project is anticipated during this 90-day period.
Competition
Natural Gas
22
The business of providing natural gas gathering, compression, treating, transporting, storing and marketing services is highly competitive. Since pipelines are generally the only practical mode of transportation for natural gas over land, the most significant competitors of our transportation and storage operations are other pipelines. Pipelines typically compete with each other based on location, capacity, price and reliability.
We face competition with respect to retaining and obtaining significant natural gas supplies under terms favorable to us for the gathering, treating and marketing portions of our business. Our competitors include major integrated oil companies, interstate and intrastate pipelines and companies that gather, compress, treat, process, transport and market natural gas. Many of our competitors, such as major oil and gas and pipeline companies, have capital resources and control supplies of natural gas substantially greater than ours.
In marketing natural gas, we have numerous competitors, including marketing affiliates of interstate pipelines, major integrated oil companies, and local and national natural gas gatherers, brokers and marketers of widely varying sizes, financial resources and experience. Local utilities and distributors of natural gas are, in some cases, engaged directly, and through affiliates, in marketing activities that compete with our marketing operations.
NGL
In markets served by our NGL pipelines, we face competition with other pipeline companies, including those affiliated with major oil, petrochemical and natural gas companies, and barge, rail and truck fleet operations. In general, our NGL pipelines compete with these entities in terms of transportation fees, reliability and quality of customer service. We face competition with other storage facilities based on fees charged and the ability to receive and distribute the customer’s products. We compete with a number of NGL fractionators in Texas and Louisiana. Competition for such services is primarily based on the fractionation fee charged.
Crude Oil and Products
In markets served by our products and crude oil pipelines, we face competition with other pipelines. Generally, pipelines are the lowest cost method for long-haul, overland movement of products and crud oil. Therefore, the most significant competitors for large volume shipments in the areas served by our pipelines are other pipelines. In addition, pipeline operations face competition from trucks that deliver products in a number of areas that our pipeline operations serve. While their costs may not be competitive for longer hauls or large volume shipments, trucks compete effectively for incremental and marginal volume in many areas served by our pipelines.
We also face competition among common carrier pipelines carrying crude oil. This competition is based primarily on transportation charges, access to crude oil supply and market demand. Similar to pipelines carrying products, the high capital costs deter competitors for the crude oil pipeline systems from building new pipelines. Competitive factors in crude oil purchasing and marketing include price and contract flexibility, quantity and quality of services, and accessibility to end markets.
Our refined product terminals compete with other independent terminals with respect to price, versatility and services provided. The competition primarily comes from integrated petroleum companies, refining and marketing companies, independent terminal companies and distribution companies with marketing and trading operations.
Retail Marketing
We face strong competition in the market for the sale of retail gasoline and merchandise. Our competitors include service stations of large integrated oil companies, independent gasoline service stations, convenience stores, fast food stores, and other similar retail outlets, some of which are well-recognized national or regional retail systems. The number of competitors varies depending on the geographical area. It also varies with gasoline and convenience store offerings. The principal competitive factors affecting our retail marketing operations include gasoline and diesel acquisition costs, site location, product price, selection and quality, site appearance and cleanliness, hours of operation, store safety, customer loyalty and brand recognition. We compete by pricing gasoline competitively, combining retail gasoline business with convenience stores that provide a wide variety of products, and using advertising and promotional campaigns. We believe that we are in a position to compete effectively as a marketer of refined products because of the location of our retail network, which is well integrated with the distribution system operated by Sunoco Logistics and Sunoco LP.
Credit Risk and Customers
Credit risk refers to the risk that a counterparty may default on its contractual obligations resulting in a loss to the Partnership. Credit policies have been approved and implemented to govern the Partnership’s portfolio of counterparties with the objective of mitigating credit losses. These policies establish guidelines, controls and limits to manage credit risk within approved tolerances by mandating an appropriate evaluation of the financial condition of existing and potential counterparties, monitoring agency
23
credit ratings, and by implementing credit practices that limit exposure according to the risk profiles of the counterparties. Furthermore, the Partnership may at times require collateral under certain circumstances to mitigate credit risk as necessary. We also implement the use of industry standard commercial agreements which allow for the netting of positive and negative exposures associated with transactions executed under a single commercial agreement. Additionally, we utilize master netting agreements to offset credit exposure across multiple commercial agreements with a single counterparty or affiliated group of counterparties.
The Partnership’s counterparties consist of a diverse portfolio of customers across the energy industry, including petrochemical companies, commercial and industrials, oil and gas producers, municipalities, gas and electric utilities and midstream companies. Our overall exposure may be affected positively or negatively by macroeconomic or regulatory changes that impact our counterparties to one extent or another. Currently, management does not anticipate a material adverse effect in our financial position or results of operations as a consequence of counterparty non-performance.
Natural gas transportation and midstream revenues are derived significantly from companies that engage in exploration and production activities. The discovery and development of new shale formations across the United States has created an abundance of natural gas and crude oil resulting in a negative impact on prices in recent years for natural gas and in recent months for crude oil. As a result, some of our exploration and production customers have been negatively impacted; however, we are monitoring these customers and mitigating credit risk as necessary.
During the year ended
December 31, 2014
, none of our customers individually accounted for more than 10% of our consolidated revenues.
Regulation of Interstate Natural Gas Pipelines.
The FERC has broad regulatory authority over the business and operations of interstate natural gas pipelines. Under the Natural Gas Act (“NGA”), the FERC generally regulates the transportation of natural gas in interstate commerce. For FERC regulatory purposes, “transportation” includes natural gas pipeline transmission (forwardhauls and backhauls), storage and other services. The Florida Gas Transmission, Transwestern, Panhandle Eastern, Trunkline Gas, Tiger, Fayetteville Express and Sea Robin pipelines transport natural gas in interstate commerce and thus each qualifies as a “natural-gas company” under the NGA subject to the FERC’s regulatory jurisdiction. We also hold certain storage facilities that are subject to the FERC’s regulatory oversight.
The FERC’s NGA authority includes the power to regulate:
|
•
|
the certification and construction of new facilities;
|
|
•
|
the review and approval of transportation rates;
|
|
•
|
the types of services that our regulated assets are permitted to perform;
|
|
•
|
the terms and conditions associated with these services;
|
|
•
|
the extension or abandonment of services and facilities;
|
|
•
|
the maintenance of accounts and records;
|
|
•
|
the acquisition and disposition of facilities; and
|
|
•
|
the initiation and discontinuation of services.
|
Under the NGA, interstate natural gas companies must charge rates that are just and reasonable. In addition, the NGA prohibits natural gas companies from unduly preferring or unreasonably discriminating against any person with respect to pipeline rates or terms and conditions of service.
The maximum rates to be charged by NGA-jurisdictional natural gas companies and their terms and conditions for service are generally required to be on file with the FERC in FERC-approved tariffs. Most natural gas companies are authorized to offer discounts from their FERC-approved maximum just and reasonable rates when competition warrants such discounts. Natural gas companies are also generally permitted to offer negotiated rates different from rates established in their tariff if, among other requirements, such companies’ tariffs offer a cost-based recourse rate available to a prospective shipper as an alternative to the negotiated rate. Natural gas companies must make offers of rate discounts and negotiated rates on a basis that is not unduly discriminatory. Existing tariff rates may be challenged by complaint, and if found unjust and unreasonable, may be altered on a prospective basis by the FERC. We cannot guarantee that the FERC will continue to pursue its approach of pro-competitive policies as it considers matters such as pipeline rates and rules and policies that may affect rights of access to natural gas transportation capacity, transportation and storage facilities.
In 2011, in lieu of filing a new NGA Section 4 general rate case, Transwestern filed a proposed settlement with the FERC, which was approved by the FERC on October 31, 2011. In general, the settlement provides for the continued use of Transwestern’s currently effective transportation and fuel tariff rates, with the exception of certain San Juan Lateral fuel rates, which we were
24
required to reduce over a three year period beginning in April 2012. The settlement also resolves certain non-rate matters, and approves Transwestern’s use of certain previously approved accounting methodologies. On October 1, 2014, Transwestern filed a general NGA Section 4 rate case pursuant to the 2011 settlement agreement with its shippers. On December 2, 2014, the FERC issued an order accepting and suspending the rates to be effective April 1, 2015, subject to refund, and setting a procedural schedule with a hearing scheduled in August 2015.
On October 31, 2014, FGT filed a general NGA Section 4 rate case pursuant to a 2010 settlement agreement with its shippers. On November 28, 2014, the FERC issued an order accepting and suspending the rates to be effective May 1, 2015, subject to refund, and setting a procedural schedule with a hearing scheduled in late 2015.
The rates charged for services on the Fayetteville Express pipeline are largely governed by long-term negotiated rate agreements. The FERC also approved cost-based recourse rates available to prospective shippers as an alternative to negotiated rates.
The rates charged for services on the Tiger pipeline are largely governed by long-term negotiated rate agreements.
Pursuant to the FERC’s rules promulgated under the Energy Policy Act of 2005, it is unlawful for any entity, directly or indirectly, in connection with the purchase or sale of electric energy or natural gas or the purchase or sale of transmission or transportation services subject to FERC jurisdiction: (i) to defraud using any device, scheme or artifice; (ii) to make any untrue statement of material fact or omit a material fact; or (iii) to engage in any act, practice or course of business that operates or would operate as a fraud or deceit. The Commodity Futures Trading Commission (“CFTC”) also holds authority to monitor certain segments of the physical and futures energy commodities market pursuant to the Commodity Exchange Act (“CEA”). With regard to our physical purchases and sales of natural gas, NGLs or other energy commodities; our gathering or transportation of these energy commodities; and any related hedging activities that we undertake, we are required to observe these anti-market manipulation laws and related regulations enforced by the FERC and/or the CFTC. These agencies hold substantial enforcement authority, including the ability to assess civil penalties of up to $1 million per day per violation, to order disgorgement of profits and to recommend criminal penalties. Should we violate the anti-market manipulation laws and regulations, we could also be subject to related third party damage claims by, among others, sellers, royalty owners and taxing authorities.
Failure to comply with the NGA, the Energy Policy Act of 2005 and the other federal laws and regulations governing our operations and business activities can result in the imposition of administrative, civil and criminal remedies.
Regulation of Intrastate Natural Gas and NGL Pipelines
.
Intrastate transportation of natural gas and NGLs is largely regulated by the state in which such transportation takes place. To the extent that our intrastate natural gas transportation systems transport natural gas in interstate commerce, the rates and terms and conditions of such services are subject to FERC jurisdiction under Section 311 of the Natural Gas Policy Act (“NGPA”). The NGPA regulates, among other things, the provision of transportation services by an intrastate natural gas pipeline on behalf of a local distribution company or an interstate natural gas pipeline. The rates and terms and conditions of some transportation and storage services provided on the Oasis pipeline, HPL System, East Texas pipeline and ET Fuel System are subject to FERC regulation pursuant to Section 311 of the NGPA. Under Section 311, rates charged for intrastate transportation must be fair and equitable, and amounts collected in excess of fair and equitable rates are subject to refund with interest. The terms and conditions of service set forth in the intrastate facility’s statement of operating conditions are also subject to FERC review and approval. Should the FERC determine not to authorize rates equal to or greater than our currently approved Section 311 rates, our business may be adversely affected. Failure to observe the service limitations applicable to transportation and storage services under Section 311, failure to comply with the rates approved by the FERC for Section 311 service, and failure to comply with the terms and conditions of service established in the pipeline’s FERC-approved statement of operating conditions could result in an alteration of jurisdictional status, and/or the imposition of administrative, civil and criminal remedies.
Our intrastate natural gas operations are also subject to regulation by various agencies in Texas, principally the TRRC. Our intrastate pipeline and storage operations in Texas are also subject to the Texas Utilities Code, as implemented by the TRRC. Generally, the TRRC is vested with authority to ensure that rates, operations and services of gas utilities, including intrastate pipelines, are just and reasonable and not discriminatory. The rates we charge for transportation services are deemed just and reasonable under Texas law unless challenged in a customer or TRRC complaint. We cannot predict whether such a complaint will be filed against us or whether the TRRC will change its regulation of these rates. Failure to comply with the Texas Utilities Code can result in the imposition of administrative, civil and criminal remedies.
Our NGL pipelines and operations may also be or become subject to state public utility or related jurisdiction which could impose additional safety and operational regulations relating to the design, siting, installation, testing, construction, operation, replacement and management of NGL gathering facilities.
25
Regulation of Sales of Natural Gas and NGLs.
The price at which we buy and sell natural gas currently is not subject to federal regulation and, for the most part, is not subject to state regulation. The price at which we sell NGLs is not subject to federal or state regulation.
To the extent that we enter into transportation contracts with natural gas pipelines that are subject to FERC regulation, we are subject to FERC requirements related to use of such capacity. Any failure on our part to comply with the FERC’s regulations and policies, or with an interstate pipeline’s tariff, could result in the imposition of civil and criminal penalties.
Our sales of natural gas are affected by the availability, terms and cost of pipeline transportation. As noted above, the price and terms of access to pipeline transportation are subject to extensive federal and state regulation. The FERC is continually proposing and implementing new rules and regulations affecting those operations of the natural gas industry. These initiatives also may affect the intrastate transportation of natural gas under certain circumstances. The stated purpose of many of these regulatory changes is to promote competition among the various sectors of the natural gas industry and these initiatives generally reflect more light-handed regulation. We cannot predict the ultimate impact of these regulatory changes to our natural gas marketing operations, and we note that some of the FERC’s regulatory changes may adversely affect the availability and reliability of interruptible transportation service on interstate pipelines. We do not believe that we will be affected by any such FERC action in a manner that is materially different from other natural gas marketers with whom we compete.
Regulation of Gathering Pipelines
.
Section 1(b) of the NGA exempts natural gas gathering facilities from the jurisdiction of the FERC under the NGA. We own a number of natural gas pipelines in Texas, Louisiana and West Virginia that we believe meet the traditional tests the FERC uses to establish a pipeline’s status as a gatherer not subject to FERC jurisdiction. However, the distinction between FERC-regulated transmission services and federally unregulated gathering services has been the subject of substantial litigation and varying interpretations, so the classification and regulation of our gathering facilities could be subject to change based on future determinations by the FERC, the courts and Congress. State regulation of gathering facilities generally includes various safety, environmental and, in some circumstances, nondiscriminatory take requirements and complaint-based rate regulation.
In Texas, our gathering facilities are subject to regulation by the TRRC under the Texas Utilities Code in the same manner as described above for our intrastate pipeline facilities. Louisiana’s Pipeline Operations Section of the Department of Natural Resources’ Office of Conservation is generally responsible for regulating intrastate pipelines and gathering facilities in Louisiana and has authority to review and authorize natural gas transportation transactions and the construction, acquisition, abandonment and interconnection of physical facilities.
Historically, apart from pipeline safety, Louisiana has not acted to exercise this jurisdiction respecting gathering facilities. In Louisiana, our Chalkley System is regulated as an intrastate transporter, and the Louisiana Office of Conservation has determined that our Whiskey Bay System is a gathering system.
We are subject to state ratable take and common purchaser statutes in all of the states in which we operate. The ratable take statutes generally require gatherers to take, without undue discrimination, natural gas production that may be tendered to the gatherer for handling. Similarly, common purchaser statutes generally require gatherers to purchase without undue discrimination as to source of supply or producer. These statutes are designed to prohibit discrimination in favor of one producer over another producer or one source of supply over another source of supply. These statutes have the effect of restricting the right of an owner of gathering facilities to decide with whom it contracts to purchase or transport natural gas.
Natural gas gathering may receive greater regulatory scrutiny at both the state and federal levels. For example, the TRRC has approved changes to its regulations governing transportation and gathering services performed by intrastate pipelines and gatherers, which prohibit such entities from unduly discriminating in favor of their affiliates. Many of the producing states have adopted some form of complaint-based regulation that generally allows natural gas producers and shippers to file complaints with state regulators in an effort to resolve grievances relating to natural gas gathering access and rate discrimination allegations. Our gathering operations could be adversely affected should they be subject in the future to the application of additional or different state or federal regulation of rates and services. Our gathering operations also may be or become subject to safety and operational regulations relating to the design, installation, testing, construction, operation, replacement and management of gathering facilities. Additional rules and legislation pertaining to these matters are considered or adopted from time to time. We cannot predict what effect, if any, such changes might have on our operations, but the industry could be required to incur additional capital expenditures and increased costs depending on future legislative and regulatory changes.
Regulation of Interstate Crude Oil and Products Pipelines.
Interstate common carrier pipeline operations are subject to rate regulation by the FERC under the Interstate Commerce Act (“ICA”), the Energy Policy Act of 1992, and related rules and orders. The ICA requires that tariff rates for petroleum pipelines be “just and reasonable” and not unduly discriminatory and that such rates and terms and conditions of service be filed with the FERC. This statute also permits interested persons to challenge proposed new or changed rates. The FERC is authorized to suspend the effectiveness of such rates for up to seven months, though rates are
26
typically not suspended for the maximum allowable period. If the FERC finds that the new or changed rate is unlawful, it may require the carrier to pay refunds for the period that the rate was in effect. The FERC also may investigate, upon complaint or on its own motion, rates that are already in effect and may order a carrier to change its rates prospectively. Upon an appropriate showing, a shipper may obtain reparations for damages sustained for a period of up to two years prior to the filing of a complaint.
The FERC generally has not investigated interstate rates on its own initiative when those rates, like those we charge, have not been the subject of a protest or a complaint by a shipper. However, the FERC could investigate our rates at the urging of a third party if the third party is either a current shipper or has a substantial economic interest in the tariff rate level. Although no assurance can be given that the tariffs charged by us ultimately will be upheld if challenged, management believes that the tariffs now in effect for our pipelines are within the maximum rates allowed under current FERC guidelines.
We have been approved by the FERC to charge market-based rates in most of the products locations served by our pipeline systems. In those locations where market-based rates have been approved, we are able to establish rates that are based upon competitive market conditions.
Regulation of Intrastate Crude Oil and Products Pipelines.
Some of our crude oil and products pipelines are subject to regulation by the TRRC, the PA PUC, and the Oklahoma Corporation Commission. The operations of our joint venture interests are also subject to regulation in the states in which they operate. The applicable state statutes require that pipeline rates be nondiscriminatory and provide no more than a fair return on the aggregate value of the pipeline property used to render services. State commissions generally have not initiated an investigation of rates or practices of petroleum pipelines in the absence of shipper complaints. Complaints to state agencies have been infrequent and are usually resolved informally. Although management cannot be certain that our intrastate rates ultimately would be upheld if challenged, we believe that, given this history, the tariffs now in effect are not likely to be challenged or, if challenged, are not likely to be ordered to be reduced.
Regulation of Pipeline Safety.
Our pipeline operations are subject to regulation by the DOT, under the PHMSA, pursuant to the Natural Gas Pipeline Safety Act of 1968, as amended (“NGPSA”), with respect to natural gas and the Hazardous Liquids Pipeline Safety Act of 1979, as amended (“HLPSA”), with respect to crude oil, NGLs and condensates. Both the NGPSA and the HLPSA were amended by the Pipeline Safety Improvement Act of 2002 (“PSI Act”) and the Pipeline Inspection, Protection, Enforcement, and Safety Act of 2006 (“PIPES Act”). The NGPSA and HLPSA, as amended, govern the design, installation, testing, construction, operation, replacement and management of natural gas as well as crude oil, NGL and condensate pipeline facilities. Pursuant to these acts, PHMSA has promulgated regulations governing pipeline wall thickness, design pressures, maximum operating pressures, pipeline patrols and leak surveys, minimum depth requirements, and emergency procedures, as well as other matters intended to ensure adequate protection for the public and to prevent accidents and failures. Additionally, PHMSA has established a series of rules requiring pipeline operators to develop and implement integrity management programs for certain gas and hazardous liquid pipelines that, in the event of a pipeline leak or rupture, could affect high consequence areas (“HCAs”), which are areas where a release could have the most significant adverse consequences, including high population areas, certain drinking water sources and unusually sensitive ecological areas. Failure to comply with the safety laws and regulations may result in the imposition of administrative, civil and criminal remedies. The “rural gathering exemption” under the NGPSA presently exempts substantial portions of our gathering facilities from jurisdiction under the NGPSA, but does not apply to our intrastate natural gas pipelines. The portions of our facilities that are exempt include those portions located outside of cities, towns or any area designated as residential or commercial, such as a subdivision or shopping center. Changes to federal pipeline safety laws and regulations are being considered by Congress or PHMSA including changes to the “rural gathering exemption,” which may be restricted in the future. Most recently, in an August 2014 U.S. Government Accountability Office (the “GAO”) report to Congress, the GAO acknowledged PHMSA’s continued assessment of the safety risks posed by these gathering lines as part of the rulemaking process, and recommended that PHMSA move forward with rulemaking to address larger-diameter, higher-pressure gathering lines, including subjecting such pipelines to emergency response planning requirements that currently do not apply. While we believe our pipeline operations are in substantial compliance with applicable pipeline safety laws, safety laws and regulations may be made more stringent and penalties could be increased. Such legislative and regulatory changes could have a material effect on our operations and costs of transportation service.
Most recently, the NGPSA and HLPSA were amended on January 3, 2012 when President Obama signed into law the Pipeline Safety, Regulatory Certainty, and Job Creation Act of 2011 (“2011 Pipeline Safety Act”) which increases pipeline safety regulation. Among other things, the legislation doubles the maximum administrative fines for safety violations from $100,000 to $200,000 for a single violation and from $1 million to $2 million for a related series of violations, and provides that these maximum penalty caps do not apply to civil enforcement actions; permits the DOT Secretary to mandate automatic or remote controlled shut off valves on new or entirely replaced pipelines; requires the DOT Secretary to evaluate whether integrity management system requirements should be expanded beyond HCAs, within 18 months of enactment; and provides for regulation of carbon dioxide transported by pipeline in a gaseous state and requires the DOT Secretary to prescribe minimum safety regulations for such transportation.
27
In addition, states have adopted regulations, similar to existing PHMSA regulations, for intrastate gathering and transmission lines. The states in which we conduct operations typically have developed regulatory programs that parallel the federal regulatory scheme and are applicable to intrastate pipelines transporting natural gas and NGLs. Under such state regulatory programs, states have the authority to conduct pipeline inspections, to investigate accidents and to oversee compliance and enforcement, safety programs and record maintenance and reporting. Congress, PHMSA and individual states may pass or implement additional safety requirements that could result in increased compliance costs for us and other companies in our industry. For instance, notwithstanding the applicability of the OSHA’s Process Safety Management (“PSM”) regulations and the EPA’s Risk Management Planning (“RMP”) requirements at regulated facilities, PHMSA and one or more state regulators, including the Texas Railroad Commission, have in the recent past, expanded the scope of their regulatory inspections to include certain in-plant equipment and pipelines found within NGL fractionation facilities and associated storage facilities, in order to assess compliance of such equipment and pipelines with hazardous liquid pipeline safety requirements. These recent actions by PHMSA are currently subject to judicial and administrative challenges by one or more midstream operators; however, to the extent that such legal challenges are unsuccessful, midstream operators of NGL fractionation facilities and associated storage facilities subject to such inspection may be required to make operational changes or modifications at their facilities to meet standards beyond current PSM and RMP requirements, which changes or modifications may result in additional capital costs, possible operational delays and increased costs of operation that, in some instances, may be significant.
Environmental Matters
General.
Our operation of processing plants, pipelines and associated facilities, including compression, in connection with the gathering, processing, storage and transmission of natural gas and the storage and transportation of NGLs, crude oil and refined products is subject to stringent federal, state and local laws and regulations, including those governing, among other things, air emissions, wastewater discharges, the use, management and disposal of hazardous and nonhazardous materials and wastes, and the cleanup of contamination. Noncompliance with such laws and regulations, or incidents resulting in environmental releases, could cause us to incur substantial costs, penalties, fines and criminal sanctions, third party claims for personal injury or property damage, capital expenditures to retrofit or upgrade our facilities and programs, or curtailment of operations. As with the industry generally, compliance with existing and anticipated environmental laws and regulations increases our overall cost of doing business, including our cost of planning, constructing and operating our plants, pipelines and other facilities. Included in our construction and operation costs are capital, operating and maintenance cost items necessary to maintain or upgrade our equipment and facilities to remain in compliance with environmental laws and regulations.
We have implemented procedures to ensure that all governmental environmental approvals for both existing operations and those under construction are updated as circumstances require. We believe that our operations and facilities are in substantial compliance with applicable environmental laws and regulations and that the cost of compliance with such laws and regulations will not have a material adverse effect on our business, results of operations and financial condition. We cannot be certain, however, that identification of presently unidentified conditions, more rigorous enforcement by regulatory agencies, enactment of more stringent environmental laws and regulations or other unanticipated events will not arise in the future and give rise to environmental liabilities that could have a material adverse effect on our business, financial condition or results of operations.
Hazardous Substances and Waste Materials.
To a large extent, the environmental laws and regulations affecting our operations relate to the release of hazardous substances and waste materials into soils, groundwater and surface water and include measures to prevent, minimize or remediate contamination of the environment. These laws and regulations generally regulate the generation, storage, treatment, transportation and disposal of hazardous substances and waste materials and may require investigatory and remedial actions at sites where such material has been released or disposed. For example, the Comprehensive Environmental Response, Compensation and Liability Act, as amended, (“CERCLA”), also known as the “Superfund” law, and comparable state laws, impose liability without regard to fault or the legality of the original conduct on certain classes of persons that contributed to a release of a “hazardous substance” into the environment. These persons include the owner and operator of the site where a release occurred and companies that disposed or arranged for the disposal of the hazardous substance that has been released into the environment. Under CERCLA, these persons may be subject to joint and several liability, without regard to fault, for, among other things, the costs of investigating and remediating the hazardous substances that have been released into the environment, for damages to natural resources and for the costs of certain health studies. CERCLA and comparable state law also authorize the federal EPA, its state counterparts, and, in some instances, third parties to take actions in response to threats to the public health or the environment and to seek to recover from the responsible classes of persons the costs they incur. It is not uncommon for neighboring landowners and other third parties to file claims for personal injury and property damage allegedly caused by hazardous substances or other pollutants released into the environment. Although “petroleum” as well as natural gas and NGLs are excluded from CERCLA’s definition of a “hazardous substance,” in the course of our ordinary operations we generate wastes that may fall within that definition or that may be subject to other waste disposal laws and regulations. We may be responsible under CERCLA or state laws for all or part of the costs required to clean up sites at which such substances or wastes have been disposed.
28
We also generate both hazardous and nonhazardous wastes that are subject to requirements of the federal Resource Conservation and Recovery Act, as amended, (“RCRA”), and comparable state statutes. We are not currently required to comply with a substantial portion of the RCRA requirements at many of our facilities because the minimal quantities of hazardous wastes generated there make us subject to less stringent management standards. From time to time, the EPA has considered the adoption of stricter handling, storage and disposal standards for nonhazardous wastes, including certain wastes associated with the exploration, development and production of crude oil and natural gas. It is possible that some wastes generated by us that are currently classified as nonhazardous may in the future be designated as “hazardous wastes,” resulting in the wastes being subject to more rigorous and costly disposal requirements, or that the full complement of RCRA standards could be applied to facilities that generate lesser amounts of hazardous waste. Changes such as these examples in applicable regulations may result in a material increase in our capital expenditures or plant operating and maintenance expense.
We currently own or lease sites that have been used over the years by prior owners and by us for various activities related to gathering, processing, storage and transmission of natural gas, NGLs, crude oil and products. Solid waste disposal practices within the oil and gas industry have improved over the years with the passage and implementation of various environmental laws and regulations. Nevertheless, some hydrocarbons and wastes have been disposed of or otherwise released on or under various sites during the operating history of those facilities that are now owned or leased by us. Notwithstanding the possibility that these releases may have occurred during the ownership of these assets by others, these sites may be subject to CERCLA, RCRA and comparable state laws. Under these laws, we could be required to remove or remediate previously disposed wastes (including wastes disposed of or released by prior owners or operators) or contamination (including soil and groundwater contamination) or to prevent the migration of contamination.
As of
December 31, 2014
and
2013
, accruals of
$401 million
and
$403 million
, respectively, were recorded in our consolidated balance sheets as accrued and other current liabilities and other non-current liabilities to cover estimated material environmental liabilities including, for example, certain matters assumed in connection with our acquisition of the HPL System, our acquisition of Transwestern, potential environmental liabilities for three sites that were formerly owned by Titan or its predecessors, and the predecessor owner’s share of certain environmental liabilities of ETC OLP.
The Partnership is subject to extensive and frequently changing federal, state and local laws and regulations, including those relating to the discharge of materials into the environment or that otherwise relate to the protection of the environment, waste management and the characteristics and composition of fuels. These laws and regulations require environmental assessment and remediation efforts at many of Sunoco, Inc.’s facilities and at formerly owned or third-party sites. Accruals for these environmental remediation activities amounted to
$363 million
and
$377 million
at
December 31, 2014
and
2013
, respectively, which is included in the total accruals above. These legacy sites that are subject to environmental assessments include formerly owned terminals and other logistics assets, retail sites that are no longer operated by Sunoco, Inc., closed and/or sold refineries and other formerly owned sites. In December 2013, a wholly-owned captive insurance company was established for these legacy sites. As of
December 31, 2014
the captive insurance company held
$267 million
of cash and investments.
The Partnership’s accrual for environmental remediation activities reflects anticipated work at identified sites where an assessment has indicated that cleanup costs are probable and reasonably estimable. The accrual for known claims is undiscounted and is based on currently available information, estimated timing of remedial actions and related inflation assumptions, existing technology and presently enacted laws and regulations. It is often extremely difficult to develop reasonable estimates of future site remediation costs due to changing regulations, changing technologies and their associated costs, and changes in the economic environment. Engineering studies, historical experience and other factors are used to identify and evaluate remediation alternatives and their related costs in determining the estimated accruals for environmental remediation activities.
We have established a wholly-owned captive insurance company to bear certain risks associated with environmental obligations related to certain sites that are no longer operating. The premiums paid to the captive insurance company include estimates for environmental claims that have been incurred but not reported, based on an actuarially determined fully developed claims expense estimate. In such cases, we accrue losses attributable to unasserted claims based on the discounted estimates that are used to develop the premiums paid to the captive insurance company.
Under various environmental laws, including the RCRA (which relates to non-hazardous and hazardous waste treatment, storage and disposal), the Partnership has initiated corrective remedial action at its facilities, formerly owned facilities and third-party sites. At the Partnership’s major manufacturing facilities, we have consistently assumed continued industrial use and a containment/remediation strategy focused on eliminating unacceptable risks to human health or the environment. The remediation accruals for these sites reflect that strategy. Accruals include amounts to prevent off-site migration and to contain the impact on the facility property, as well as to address known, discrete areas requiring remediation within the plants. Activities include closure of RCRA solid waste management units, recovery of hydrocarbons, handling of impacted soil, mitigation of surface water impacts and prevention of off-site migration. A change in this approach as a result of changing the intended use of a property or a sale to a third party could result in a higher cost remediation strategy in the future.
29
The Partnership currently owns or operates certain retail gasoline outlets where releases of petroleum products have occurred. Federal and state laws and regulations require that contamination caused by such releases at these sites and at formerly owned sites be assessed and remediated to meet the applicable standards. Our obligation to remediate this type of contamination varies, depending on the extent of the release and the applicable laws and regulations. A portion of the remediation costs may be recoverable from the reimbursement fund of the applicable state, after any deductible has been met.
In general, each remediation site or issue is evaluated individually based upon information available for the site or issue and no pooling or statistical analysis is used to evaluate an aggregate risk for a group of similar items (e.g., service station sites) in determining the amount of probable loss accrual to be recorded. The estimates of environmental remediation costs also frequently involve evaluation of a range of estimates. In many cases, it is difficult to determine that one point in the range of loss estimates is more likely than any other. In these situations, existing accounting guidance allows that the minimum of the range be accrued. Accordingly, the low end of the range often represents the amount of loss which has been recorded.
In addition to the probable and estimable losses which have been recorded, management believes it is reasonably possible (i.e., less than probable but greater than remote) that additional environmental remediation losses will be incurred. At
December 31, 2014
, the aggregate of the estimated maximum additional reasonably possible losses, which relate to numerous individual sites, totaled approximately
$6 million
. This estimate of reasonably possible losses comprises estimates for remediation activities at current logistics and retail assets, and in many cases, reflects the upper end of the loss ranges which are described above. Such estimates include potentially higher contractor costs for expected remediation activities, the potential need to use more costly or comprehensive remediation methods and longer operating and monitoring periods, among other things.
In summary, total future costs for environmental remediation activities will depend upon, among other things, the identification of any additional sites, the determination of the extent of the contamination at each site, the timing and nature of required remedial actions, the nature of operations at each site, the technology available and needed to meet the various existing legal requirements, the nature and terms of cost-sharing arrangements with other potentially responsible parties, the availability of insurance coverage, the nature and extent of future environmental laws and regulations, inflation rates, terms of consent agreements or remediation permits with regulatory agencies and the determination of the Partnership’s liability at the sites, if any, in light of the number, participation level and financial viability of the other parties. The recognition of additional losses, if and when they were to occur, would likely extend over many years. Management believes that the Partnership’s exposure to adverse developments with respect to any individual site is not expected to be material. However, if changes in environmental laws or regulations occur or the assumptions used to estimate losses at multiple sites are adjusted, such changes could impact multiple facilities, formerly owned facilities and third-party sites at the same time. As a result, from time to time, significant charges against income for environmental remediation may occur; however, management does not believe that any such charges would have a material adverse impact on the Partnership’s consolidated financial position.
Transwestern conducts soil and groundwater remediation at a number of its facilities. Some of the cleanup activities include remediation of several compressor sites on the Transwestern system for contamination by PCBs, and the costs of this work are not eligible for recovery in rates. The total accrued future estimated cost of remediation activities expected to continue through 2025 is
$7 million
, which is included in the total environmental accruals mentioned above. Transwestern received FERC approval for rate recovery of projected soil and groundwater remediation costs not related to PCBs effective April 1, 2007. Transwestern, as part of ongoing arrangements with customers, continues to incur costs associated with containing and removing potential PCB contamination. Future costs cannot be reasonably estimated because remediation activities are undertaken as potential claims are made by customers and former customers. However, such future costs are not expected to have a material impact on our financial position, results of operations or cash flows.
Air Emissions.
Our operations are subject to the federal Clean Air Act, as amended, and comparable state laws and regulations. These laws and regulations regulate emissions of air pollutants from various industrial sources, including our processing plants, and also impose various monitoring and reporting requirements. Such laws and regulations may require that we obtain pre-approval for the construction or modification of certain projects or facilities, such as our processing plants and compression facilities, expected to produce air emissions or to result in the increase of existing air emissions, that we obtain and strictly comply with air permits containing various emissions and operational limitations, or that we utilize specific emission control technologies to limit emissions. We will be required to incur capital expenditures in the future for air pollution control equipment in connection with obtaining and maintaining operating permits and approvals for air emissions. In addition, our processing plants, pipelines and compression facilities are subject to increasingly stringent regulations, including regulations that require the installation of control technology or the implementation of work practices to control hazardous air pollutants. Moreover, the Clean Air Act requires an operating permit for major sources of emissions and this requirement applies to some of our facilities. We believe that our operations are in substantial compliance with the federal Clean Air Act and comparable state laws. The EPA and state agencies are continually considering, proposing or finalizing new regulations that could impact our existing operations and the costs and timing of new infrastructure development. For example, in December 2014, the EPA published a proposed regulation that it expects to finalize by October 1, 2015, which rulemaking proposed to revise the National Ambient Air Quality Standard (“NAAQS”) for ozone
30
between 65 to 70 parts per billion (“ppb”) for both the 8-hour primary and secondary standards. The current primary and secondary ozone standards are set at 75 ppb. EPA also requested public comments on whether the standard should be set as low as 60 ppb or whether the existing 75 ppb standard should be retained. If EPA lowers the ozone standard, states could be required to implement new more stringent regulations, which could apply to our operations. Compliance with this or other new regulations could, among other things, require installation of new emission controls on some of our equipment, result in longer permitting timelines, and significantly increase our capital expenditures and operating costs, which could adversely impact our business.
Clean Water Act.
The Federal Water Pollution Control Act of 1972, as amended, also known as Clean Water Act and comparable state laws impose restrictions and strict controls regarding the discharge of pollutants, including hydrocarbon-bearing wastes, into state waters and waters of the United States. Pursuant to the Clean Water Act and similar state laws, a National Pollutant Discharge Elimination System, or state permit, or both, must be obtained to discharge pollutants into federal and state waters. In addition, the Clean Water Act and comparable state laws require that individual permits or coverage under general permits be obtained by subject facilities for discharges of storm water runoff. We believe that we are in substantial compliance with Clean Water Act permitting requirements as well as the conditions imposed thereunder, and that our continued compliance with such existing permit conditions will not have a material adverse effect on our business, financial condition or results of operations.
Spills.
Our operations can result in the discharge of regulated substances, including NGLs, crude oil or other products. The Clean Water Act, or amended by the federal Oil Pollution Act of 1990, as amended, (“OPA”) and comparable state laws impose restrictions and strict controls regarding the discharge of regulated substances into state waters or waters of the United States. The Clean Water Act and comparable state laws can impose substantial administrative, civil and criminal penalties for non-compliance including spills and other non-authorized discharges. The OPA subjects owners of covered facilities to strict joint and potentially unlimited liability for removal costs and other consequences of a release of oil, where the release is into navigable waters, along shorelines or in the exclusive economic zone of the United States. Spill prevention control and countermeasure requirements of the Clean Water Act and some state laws require that containment dikes and similar structures be installed to help prevent the impact on navigable waters in the event of a release. The PHMSA, the EPA, or various state regulatory agencies, has approved our oil spill emergency response plans, and our management believes we are in substantial compliance with these laws.
In addition, some states maintain groundwater protection programs that require permits for discharges or operations that may impact groundwater conditions. Our management believes that compliance with existing permits and compliance with foreseeable new permit requirements will not have a material adverse effect on our results of operations, financial position or expected cash flows.
Endangered Species Act.
The Endangered Species Act restricts activities that may affect endangered or threatened species or their habitat. Similar protection is offered to migratory birds under the Migratory Bird Treaty Act. We may operate in areas that are currently designated as a habitat for endangered or threatened species or where the discovery of previously unidentified endangered species, or the designation of additional species as endangered or threatened may occur in which event such one or more developments could cause us to incur additional costs, to develop habitat conservation plans, to become subject to expansion or operating restrictions, or bans in the affected areas.
Climate Change.
Based on findings made by the EPA that emissions of carbon dioxide, methane and other greenhouse gases present an endangerment to public health and the environment, the EPA has adopted regulations under existing provisions of the federal Clean Air Act that, among other things, establish Prevention of Significant Deterioration (“PSD”) and Title V permitting reviews for greenhouse gas emission from certain large stationary sources that already are potential major sources of certain principal, or criteria, pollutant emissions. Facilities required to obtain PSD permits for their greenhouse gas emissions will be required to also reduce those emissions according to “best available control technology” standards for greenhouse gases, which are typically developed by the states. Any regulatory or permitting obligation that limits emissions of greenhouse gases could require us to incur costs to reduce or sequester emissions of greenhouse gases associated with our operations and also could adversely affect demand for the natural gas and other hydrocarbon products that we transport, process, or otherwise handle in connection with our services.
In addition, the EPA adopted regulations requiring the annual reporting of greenhouse gas emissions from certain petroleum and natural gas sources in the United States, including onshore oil and natural gas production, processing, transmission, storage and distribution facilities. On December 9, 2014, the EPA published a proposed rule that would expand the petroleum and natural gas system sources for which annual greenhouse gas emissions reporting is currently required to include greenhouse gas emissions reporting beginning in the 2016 reporting year for certain onshore gathering and boosting systems consisting primarily of gathering pipelines, compressors and process equipment used to perform natural gas compression, dehydration and acid gas removal. We are monitoring greenhouse gas emissions from certain of our facilities in accordance with current greenhouse emissions reporting requirements in a manner that we believe is in substantial compliance with applicable reporting obligations and are currently assessing the potential impact that the December 9, 2014 proposed rule may have on our future reporting obligations, should the proposal be adopted.
31
Various pieces of legislation to reduce emissions of, or to create cap and trade programs for, greenhouse gases have been proposed by the U.S. Congress over the past several years, but no proposal has yet passed. Numerous states have already taken legal measures to reduce emissions of greenhouse gases, primarily through the planned development of greenhouse gas emission inventories and/or regional greenhouse gas cap and trade programs. The passage of legislation that limits emissions of greenhouse gases from our equipment and operations could require us to incur costs to reduce the greenhouse gas emissions from our own operations, and it could also adversely affect demand for our transportation, storage and processing services by reducing demand for oil, natural gas and NGLs. For example, in January 2015, the Obama Administration announced plans for the EPA to issue final standards in 2016 that would reduce methane emissions from new and modified oil and natural gas production and natural gas processing and transmission facilities by up to 45% from 2012 levels by 2025.
Some have suggested that one consequence of climate change could be increased severity of extreme weather, such as increased hurricanes and floods. If such effects were to occur, our operations could be adversely affected in various ways, including damages to our facilities from powerful winds or rising waters, or increased costs for insurance. Another possible consequence of climate change is increased volatility in seasonal temperatures. The market for our NGLs and natural gas is generally improved by periods of colder weather and impaired by periods of warmer weather, so any changes in climate could affect the market for the fuels that we produce. Despite the use of the term “global warming” as a shorthand for climate change, some studies indicate that climate change could cause some areas to experience temperatures substantially colder than their historical averages. As a result, it is difficult to predict how the market for our products could be affected by increased temperature volatility, although if there is an overall trend of warmer temperatures, it would be expected to have an adverse effect on our business.
Employee Health and Safety.
We are subject to the requirements of the federal OSHA and comparable state laws that regulate the protection of the health and safety of workers. In addition, the OSHA hazard communication standard requires that information be maintained about hazardous materials used or produced in operations and that this information be provided to employees, state and local government authorities and citizens. We believe that our operations are in substantial compliance with the OSHA requirements including general industry standards, recordkeeping requirements, and monitoring of occupational exposure to regulated substances.
Employees
As of January 30, 2015, ETE and its consolidated subsidiaries employed an aggregate of 27,605 employees, 1,609 of which are represented by labor unions. We and our subsidiaries believe that our relations with our employees are satisfactory.
SEC Reporting
We file or furnish annual reports on Form 10-K, quarterly reports on Form 10-Q, current reports on Form 8-K and any related amendments and supplements thereto with the SEC. From time to time, we may also file registration and related statements pertaining to equity or debt offerings. You may read and copy any materials we file or furnish with the SEC at the SEC’s Public Reference Room at 100 F Street, N.E., Washington, D.C. 20549. You may obtain information regarding the Public Reference Room by calling the SEC at 1-800-732-0330. In addition, the SEC maintains an internet website at http://www.sec.gov that contains reports, proxy and information statements and other information regarding issuers that file electronically with the SEC.
We provide electronic access, free of charge, to our periodic and current reports on our internet website located at http://www.energytransfer.com. These reports are available on our website as soon as reasonably practicable after we electronically file such materials with the SEC. Information contained on our website is not part of this report.
In addition to risks and uncertainties in the ordinary course of business that are common to all businesses, important factors that are specific to our structure as a limited partnership, our industry and our company could materially impact our future performance and results of operations. We have provided below a list of these risk factors that should be reviewed when considering an investment in our securities. ETP, Regency, Panhandle, Sunoco Logistics and Sunoco LP file Annual Reports on Form 10-K that include risk factors that can be reviewed for further information. The risk factors set forth below, and those included in ETP’s, Regency’s, Panhandle’s, Sunoco Logistics’ and Sunoco LP’s Annual Report, are not all the risks we face and other factors currently considered immaterial or unknown to us may impact our future operations.
Risks Inherent in an Investment in Us
Cash distributions are not guaranteed and may fluctuate with our performance or other external factors.
The source of our earnings and cash flow is cash distributions from ETP, Regency and Sunoco Logistics via the Class H Units. Therefore, the amount of distributions we are currently able to make to our Unitholders may fluctuate based on the level of distributions ETP, Regency or Sunoco Logistics makes to their partners. ETP, Regency or Sunoco Logistics may not be able to
32
continue to make quarterly distributions at their current level or increase their quarterly distributions in the future. In addition, while we would expect to increase or decrease distributions to our Unitholders if ETP, Regency or Sunoco Logistics increases or decreases distributions to us, the timing and amount of such increased or decreased distributions, if any, will not necessarily be comparable to the timing and amount of the increase or decrease in distributions made by ETP, Regency or Sunoco Logistics to us.
Our ability to distribute cash received from ETP and Regency to our Unitholders is limited by a number of factors, including:
|
•
|
interest expense and principal payments on our indebtedness;
|
|
•
|
restrictions on distributions contained in any current or future debt agreements;
|
|
•
|
our general and administrative expenses;
|
|
•
|
expenses of our subsidiaries other than ETP or Regency, including tax liabilities of our corporate subsidiaries, if any; and
|
|
•
|
reserves our General Partner believes prudent for us to maintain for the proper conduct of our business or to provide for future distributions.
|
We cannot guarantee that in the future we will be able to pay distributions or that any distributions we do make will be at or above our current quarterly distribution. The actual amount of cash that is available for distribution to our Unitholders will depend on numerous factors, many of which are beyond our control or the control of our General Partner.
Our only significant assets are our partnership interests, including the incentive distribution rights, in ETP and Regency and, therefore, our cash flow is dependent upon the ability of ETP and Regency to make distributions in respect of those partnership interests.
We do not have any significant assets other than our partnership interests in ETP and Regency. Our interest in ETP include Class H Units, for which distributions to us are based on a percentage of the general partner and incentive distribution right interests in Sunoco Logistics. As a result, our cash flow depends on the performance of ETP, Regency and Sunoco Logistics and their respective subsidiaries and ETP’s and Regency’s ability to make cash distributions to us, which is dependent on the results of operations, cash flows and financial condition of ETP, Regency and Sunoco Logistics.
The amount of cash that ETP, Regency and Sunoco Logistics can distribute to their partners, including us, each quarter depends upon the amount of cash they generate from their operations, which will fluctuate from quarter to quarter and will depend upon, among other things:
|
•
|
the amount of natural gas, crude oil and products transported through ETP’s, Regency’s and Sunoco Logistics’ transportation pipelines and gathering systems;
|
|
•
|
the level of throughput in processing and treating operations;
|
|
•
|
the fees charged and the margins realized by ETP, Regency and Sunoco Logistics for their services;
|
|
•
|
the price of natural gas, NGLs, crude oil and products;
|
|
•
|
the relationship between natural gas, NGL and crude oil prices;
|
|
•
|
the amount of cash distributions ETP receives with respect to the Regency and AmeriGas common units that ETP or their subsidiaries own;
|
|
•
|
the weather in their respective operating areas;
|
|
•
|
the level of competition from other midstream, transportation and storage and retail marketing companies and other energy providers;
|
|
•
|
the level of their respective operating costs;
|
|
•
|
prevailing economic conditions; and
|
|
•
|
the level and results of their respective derivative activities.
|
In addition, the actual amount of cash that ETP and Regency will have available for distribution will also depend on other factors, such as:
|
•
|
the level of capital expenditures they make;
|
|
•
|
the level of costs related to litigation and regulatory compliance matters;
|
33
|
•
|
the cost of acquisitions, if any;
|
|
•
|
the levels of any margin calls that result from changes in commodity prices;
|
|
•
|
debt service requirements;
|
|
•
|
fluctuations in working capital needs;
|
|
•
|
their ability to borrow under their respective revolving credit facilities;
|
|
•
|
their ability to access capital markets;
|
|
•
|
restrictions on distributions contained in their respective debt agreements; and
|
|
•
|
the amount, if any, of cash reserves established by the board of directors and their respective general partners in their discretion for the proper conduct of their respective businesses.
|
ETE does not have any control over many of these factors, including the level of cash reserves established by the board of directors and ETP’s and Regency’s respective General Partners. Accordingly, we cannot guarantee that ETP, Regency or Sunoco Logistics will have sufficient available cash to pay a specific level of cash distributions to its partners.
Furthermore, Unitholders should be aware that the amount of cash that ETP and Regency have available for distribution depends primarily upon cash flow and is not solely a function of profitability, which is affected by non-cash items. As a result, ETP and Regency may declare and/or pay cash distributions during periods when they record net losses. Please read “Risks Related to the Businesses of Energy Transfer Partners and Regency Energy Partners” included in this Item 1A for a discussion of further risks affecting ETP’s and Regency’s ability to generate distributable cash flow.
We may issue an unlimited number of limited partner interests without the consent of our Unitholders, which will dilute Unitholders’ ownership interest in us and may increase the risk that we will not have sufficient available cash to maintain or increase our per unit distribution level.
Our partnership agreement allows us to issue an unlimited number of additional limited partner interests, including securities senior to the Common Units, without the approval of our Unitholders. The issuance of additional Common Units or other equity securities by us will have the following effects:
|
•
|
our Unitholders’ current proportionate ownership interest in us will decrease;
|
|
•
|
the amount of cash available for distribution on each Common Unit or partnership security may decrease;
|
|
•
|
the ratio of taxable income to distributions may increase;
|
|
•
|
the relative voting strength of each previously outstanding Common Unit may be diminished; and
|
|
•
|
the market price of our Common Units may decline.
|
In addition, ETP and Regency may sell an unlimited number of limited partner interests without the consent of the respective Unitholders, which will dilute existing interests of the respective Unitholders, including us. The issuance of additional Common Units or other equity securities by ETP will have essentially the same effects as detailed above.
ETP or Regency may issue additional Common Units, which may increase the risk that ETP or Regency will not have sufficient available cash to maintain or increase its per unit distribution level.
The partnership agreements of each ETP and Regency allow ETP and Regency, respectively, to issue an unlimited number of additional limited partner interests. The issuance of additional common units or other equity securities by ETP or Regency will have the following effects:
|
•
|
Unitholders’ current proportionate ownership interest in ETP or Regency, as applicable, will decrease;
|
|
•
|
the amount of cash available for distribution on each common unit or partnership security may decrease;
|
|
•
|
the ratio of taxable income to distributions may increase;
|
|
•
|
the relative voting strength of each previously outstanding common unit may be diminished; and
|
|
•
|
the market price of ETP’s or Regency’s Common Units, as applicable, may decline.
|
The payment of distributions on any additional units issued by ETP or Regency may increase the risk that ETP or Regency, as applicable, may not have sufficient cash available to maintain or increase its per unit distribution level, which in turn may impact the available cash that we have to meet our obligations.
34
Sunoco Logistics and Sunoco LP may issue additional common units, which may increase the risk that Sunoco Logistics or Sunoco LP will not have sufficient available cash to maintain or increase their per unit distribution level.
Sunoco Logistics’ and Sunoco LP’s partnership agreements allow the issuance of an unlimited number of additional limited partner interests. The issuance of additional common units or other equity securities by Sunoco Logistics or Sunoco LP will have the following effects:
|
•
|
Unitholders’ current proportionate ownership interest in Sunoco Logistics and Sunoco LP, as applicable, will decrease;
|
|
•
|
the amount of cash available for distribution on each common unit or partnership security may decrease;
|
|
•
|
the ratio of taxable income to distributions may increase;
|
|
•
|
the relative voting strength of each previously outstanding common unit may be diminished; and
|
|
•
|
the market price of Sunoco Logistics’ and Sunoco LP’s common units may decline.
|
The payment of distributions on any additional units issued by Sunoco Logistics and Sunoco LP may increase the risk that Sunoco Logistics and Sunoco LP may not have sufficient cash available to maintain or increase their per unit distribution level, which in turn may impact the available cash that we have to meet our obligations.
Unitholders have limited voting rights and are not entitled to elect the General Partner or its directors. In addition, even if Unitholders are dissatisfied, they cannot easily remove the General Partner.
Unlike the holders of common stock in a corporation, Unitholders have only limited voting rights on matters affecting our business, and therefore limited ability to influence management’s decisions regarding our business. Unitholders did not elect our General Partner and will have no right to elect our General Partner or the officers or directors of our General Partner on an annual or other continuing basis.
Furthermore, if our Unitholders are dissatisfied with the performance of our General Partner, they may be unable to remove our General Partner. Our General Partner may not be removed except, among other things, upon the vote of the holders of at least 66
2
/
3
% of our outstanding units. As of December 31, 2014, our directors and executive officers directly or indirectly own approximately
20%
of our outstanding Common Units. It will be particularly difficult for our General Partner to be removed without the consent of our directors and executive officers. As a result, the price at which our Common Units will trade may be lower because of the absence or reduction of a takeover premium in the trading price.
Furthermore, Unitholders’ voting rights are further restricted by the partnership agreement provision providing that any units held by a person that owns 20% or more of any class of units then outstanding, other than the General Partner and its affiliates, cannot be voted on any matter. If the Regency Merger is completed and the Bakken Pipeline Transaction is completed, ETE’s aggregate ownership percentage of the outstanding ETP Common Units would decrease to approximately
5%
on a pro forma basis.
Our General Partner may, in its sole discretion, approve the issuance of partnership securities and specify the terms of such partnership securities.
Pursuant to our partnership agreement, our General Partner has the ability, in its sole discretion and without the approval of the Unitholders, to approve the issuance of securities by the Partnership at any time and to specify the terms and conditions of such securities. The securities authorized to be issued may be issued in one or more classes or series, with such designations, preferences, rights, powers and duties (which may be senior to existing classes and series of partnership securities), as shall be determined by our General Partner, including:
|
•
|
the right to share in the Partnership’s profits and losses;
|
|
•
|
the right to share in the Partnership’s distributions;
|
|
•
|
the rights upon dissolution and liquidation of the Partnership;
|
|
•
|
whether, and the terms upon which, the Partnership may redeem the securities;
|
|
•
|
whether the securities will be issued, evidenced by certificates and assigned or transferred; and
|
|
•
|
the right, if any, of the security to vote on matters relating to the Partnership, including matters relating to the relative rights, preferences and privileges of such security.
|
Please see “—We may issue an unlimited number of limited partner interests without the consent of our Unitholders, which will dilute Unitholders’ ownership interest in us and may increase the risk that we will not have sufficient available cash to maintain or increase our per unit distribution level.” above.
35
The control of our General Partner may be transferred to a third party without Unitholder consent.
The General Partner may transfer its general partner interest to a third party without the consent of the Unitholders. Furthermore, the members of our General Partner may transfer all or part of their ownership interest in our General Partner to a third party without the consent of the Unitholders. Any new owner or owners of our General Partner or the general partner of the General Partner would be in a position to replace the directors and officers of our General Partner with its own choices and to control the decisions made and actions taken by the board of directors and officers.
We are dependent on third parties, including key personnel of ETP under a shared services agreement, to provide the financial, accounting, administrative and legal services necessary to operate our business.
We rely on the services of key personnel of ETP, including the ongoing involvement and continued leadership of Kelcy L. Warren, one of the founders of ETP’s midstream business, as well as other key members of ETP’s management team such as Marshall S. (Mackie) McCrea, III, President and Chief Operating Officer. Mr. Warren and Mr. McCrea have been integral to the success of ETP’s midstream and intrastate transportation and storage businesses because of their ability to identify and develop strategic business opportunities. Losing the leadership of either Mr. Warren or Mr. McCrea could make it difficult for ETP to identify internal growth projects and accretive acquisitions, which could have a material adverse effect on ETP’s ability to increase the cash distributions paid on its partnership interests.
ETP’s executive officers that provide services to us pursuant to a shared services agreement allocate their time between us and ETP. To the extent that these officers face conflicts regarding the allocation of their time, we may not receive the level of attention from them that the management of our business requires. If ETP is unable to provide us with a sufficient number of personnel with the appropriate level of technical accounting and financial expertise, our internal accounting controls could be adversely impacted.
Cost reimbursements due to our General Partner may be substantial and may reduce our ability to pay the distributions to our Unitholders.
Prior to making any distributions to our Unitholders, we will reimburse our General Partner for all expenses it has incurred on our behalf. In addition, our General Partner and its affiliates may provide us with services for which we will be charged reasonable fees as determined by our General Partner. The reimbursement of these expenses and the payment of these fees could adversely affect our ability to make distributions to our Unitholders. Our General Partner has sole discretion to determine the amount of these expenses and fees.
In addition, under Delaware partnership law, our General Partner has unlimited liability for our obligations, such as our debts and environmental liabilities, except for our contractual obligations that are expressly made without recourse to our General Partner. To the extent our General Partner incurs obligations on our behalf, we are obligated to reimburse or indemnify it. If we are unable or unwilling to reimburse or indemnify our General Partner, our General Partner may take actions to cause us to make payments of these obligations and liabilities. Any such payments could reduce the amount of cash available for distribution to our Unitholders and cause the value of our Common Units to decline.
A reduction in ETP’s or Regency’s distributions will disproportionately affect the amount of cash distributions to which we are entitled.
Through our ownership of equity interests in ETP GP, the holder of the incentive distribution rights in ETP, we are entitled to receive our pro rata share of specified percentages of total cash distributions made by ETP as it reaches established target cash distribution levels as specified in the ETP partnership agreement. We currently receive our pro rata share of cash distributions from ETP based on the highest incremental percentage, 48%, to which ETP GP is entitled pursuant to its incentive distribution rights in ETP. A decrease in the amount of distributions by ETP to less than $0.4125 per Common Unit per quarter would reduce ETP GP’s percentage of the incremental cash distributions above $0.3175 per Common Unit per quarter from 48% to 23%. As a result, any such reduction in quarterly cash distributions from ETP would have the effect of disproportionately reducing the amount of all distributions that we receive from ETP based on our ownership interest in the incentive distribution rights in ETP as compared to cash distributions we receive from ETP on our General Partner interest in ETP and our ETP Common Units.
Similarly, we currently receive a pro rata share of incremental cash distributions from Regency at the 23% level pursuant to Regency GP’s incentive distribution rights in Regency as specified in the Regency partnership agreement. A decrease in the amount of distributions by Regency to less than $0.4375 per Common Unit per quarter would have reduced Regency GP’s percentage of the incremental cash distributions above $0.4025 per Common Unit per quarter from 23% to 13%. As a result, any such reduction in quarterly cash distributions from Regency would have the effect of disproportionately reducing the amount of all distributions that we receive from Regency based on our ownership interest in the incentive distribution rights of Regency as compared to cash distributions we receive from Regency on our General Partner interest in Regency and our Regency Common Units.
36
A reduction in Sunoco Logistics’ distributions will disproportionately affect the amount of cash distributions to which we are entitled.
Through our ownership of equity interests in Sunoco Partners, the holder of the incentive distribution rights in Sunoco Logistics, we are entitled to receive our pro rata share of specified percentages of total cash distributions made by Sunoco Logistics as it reaches established target cash distribution levels as specified in the Sunoco Logistics partnership agreement. We currently receive our pro rata share of cash distributions from Sunoco Logistics based on the highest incremental percentage, 48%, to which Sunoco Partners is entitled pursuant to its incentive distribution rights in Sunoco Logistics. A decrease in the amount of distributions by Sunoco Logistics to less than $0.2638 per common unit per quarter would reduce Sunoco Partners’ percentage of the incremental cash distributions above $0.0958 per common unit per quarter from 48% to 35%. As a result, any such reduction in quarterly cash distributions from Sunoco Logistics would have the effect of disproportionately reducing the amount of all distributions that we receive from Sunoco Logistics based on our ownership interest in the incentive distribution rights in Sunoco Logistics as compared to cash distributions we receive from Sunoco Logistics on our General Partner interest in Sunoco Logistics and our Sunoco Logistics common units.
The consolidated debt level and debt agreements of ETP and Regency and those of their subsidiaries may limit the distributions we receive from ETP and Regency, as well as our future financial and operating flexibility.
ETP’s and Regency’s levels of indebtedness affect their operations in several ways, including, among other things:
|
•
|
a significant portion of ETP’s, Regency’s and their subsidiaries’ cash flows from operations will be dedicated to the payment of principal and interest on outstanding debt and will not be available for other purposes, including payment of distributions to us;
|
|
•
|
covenants contained in ETP’s, Regency’s and their subsidiaries’ existing debt agreements require ETP, Regency and their subsidiaries, as applicable, to meet financial tests that may adversely affect their flexibility in planning for and reacting to changes in their respective businesses;
|
|
•
|
ETP’s, Regency’s and their subsidiaries’ ability to obtain additional financing for working capital, capital expenditures, acquisitions and general partnership, corporate or limited liability company purposes, as applicable, may be limited;
|
|
•
|
ETP and Regency may be at a competitive disadvantage relative to similar companies that have less debt;
|
|
•
|
ETP and Regency may be more vulnerable to adverse economic and industry conditions as a result of their significant debt levels; and
|
|
•
|
failure by ETP, Regency or their subsidiaries to comply with the various restrictive covenants of the respective debt agreements could negatively impact ETP’s and Regency’s ability to incur additional debt, including their ability to utilize the available capacity under their revolving credit facilities, and to pay distributions.
|
We do not have the same flexibility as other types of organizations to accumulate cash, which may limit cash available to service our debt or to repay debt at maturity.
Unlike a corporation, our partnership agreement requires us to distribute, on a quarterly basis, 100% of our Available Cash (as defined in our partnership agreement) to our Unitholders of record and our General Partner. Available Cash is generally all of our cash on hand as of the end of a quarter, adjusted for cash distributions and net changes to reserves. Our General Partner will determine the amount and timing of such distributions and has broad discretion to establish and make additions to our reserves or the reserves of our operating subsidiaries in amounts it determines in its reasonable discretion to be necessary or appropriate:
|
•
|
to provide for the proper conduct of our business and the businesses of our operating subsidiaries (including reserves for future capital expenditures and for our anticipated future credit needs);
|
|
•
|
to provide funds for distributions to our Unitholders and our General Partner for any one or more of the next four calendar quarters; or
|
|
•
|
to comply with applicable law or any of our loan or other agreements.
|
A downgrade of our credit rating could impact our liquidity, access to capital and our costs of doing business, and maintaining credit ratings is under the control of independent third parties.
A downgrade of our credit rating might increase our cost of borrowing and could require us to post collateral with third parties, negatively impacting our available liquidity. Our ability to access capital markets could also be limited by a downgrade of our credit rating and other disruptions. Such disruptions could include:
|
•
|
economic downturns;
|
37
|
•
|
deteriorating capital market conditions;
|
|
•
|
declining market prices for natural gas, NGLs and other commodities;
|
|
•
|
terrorist attacks or threatened attacks on our facilities or those of other energy companies; and
|
|
•
|
the overall health of the energy industry, including the bankruptcy or insolvency of other companies.
|
Credit rating agencies perform independent analysis when assigning credit ratings. The analysis includes a number of criteria including, but not limited to, business composition, market and operational risks, as well as various financial tests. Credit rating agencies continue to review the criteria for industry sectors and various debt ratings and may make changes to those criteria from time to time. Credit ratings are not recommendations to buy, sell or hold investments in the rated entity. Ratings are subject to revision or withdrawal at any time by the rating agencies, and we cannot assure you that we will maintain our current credit ratings.
Our subsidiaries are not prohibited from competing with us.
Neither our partnership agreement nor the partnership agreements of our subsidiaries, including ETP, Sunoco Logistics, Sunoco LP and Regency, prohibit our subsidiaries from owning assets or engaging in businesses that compete directly or indirectly with us. In addition, our subsidiaries may acquire, construct or dispose of any assets in the future without any obligation to offer us the opportunity to purchase or construct any of those assets.
Capital projects will require significant amounts of debt and equity financing which may not be available to ETP or Regency on acceptable terms, or at all.
ETP and Regency plan to fund their growth capital expenditures, including any new future pipeline construction projects and improvements or repairs to existing facilities that ETP or Regency may undertake, with proceeds from sales of ETP’s or Regency’s debt and equity securities and borrowings under their respective revolving credit facilities; however, ETP or Regency cannot be certain that they will be able to issue debt and equity securities on terms satisfactory to them, or at all. In addition, ETP or Regency may be unable to obtain adequate funding under their current revolving credit facility because ETP’s or Regency’s lending counterparties may be unwilling or unable to meet their funding obligations. If ETP or Regency are unable to finance their expansion projects as expected, ETP or Regency could be required to seek alternative financing, the terms of which may not be attractive to ETP or Regency, or to revise or cancel its expansion plans.
A significant increase in ETP’s or Regency’s indebtedness that is proportionately greater than ETP’s or Regency’s respective issuances of equity could negatively impact ETP’s or Regency’s respective credit ratings or their ability to remain in compliance with the financial covenants under their respective revolving credit agreements, which could have a material adverse effect on ETP’s or Regency’s financial condition, results of operations and cash flows.
Increases in interest rates could materially adversely affect our business, results of operations, cash flows and financial condition.
In addition to our exposure to commodity prices, we have significant exposure to changes in interest rates. Approximately
$5.89 billion
of our consolidated debt as of
December 31, 2014
bears interest at variable interest rates and the remainder bears interest at fixed rates. To the extent that we have debt with floating interest rates, our results of operations, cash flows and financial condition could be materially adversely affected by increases in interest rates. We manage a portion of our interest rate exposures by utilizing interest rate swaps.
An increase in interest rates may also cause a corresponding decline in demand for equity investments, in general, and in particular for yield-based equity investments such as our Common Units. Any such reduction in demand for our Common Units resulting from other more attractive investment opportunities may cause the trading price of our Common Units to decline.
The credit and risk profile of our General Partner and its owners could adversely affect our credit ratings and profile.
The credit and business risk profiles of our General Partner or indirect owners of our General Partner may be factors in credit evaluations of us as a publicly traded limited partnership due to the significant influence of our General Partner and indirect owners over our business activities, including our cash distributions, acquisition strategy and business risk profile. Another factor that may be considered is the financial condition of our General Partner and its owners, including the degree of their financial leverage and their dependence on cash flow from us to service their indebtedness.
ETE has significant indebtedness outstanding and is dependent principally on the cash distributions from its general and limited partner equity interests in us and in Regency to service such indebtedness. Any distributions by us to ETE will be made only after satisfying our then current obligations to our creditors. Although we have taken certain steps in our organizational structure, financial reporting and contractual relationships to reflect the separateness of us, ETP GP and ETP LLC from the entities that
38
control ETP GP (ETE and its general partner), our credit ratings and business risk profile could be adversely affected if the ratings and risk profiles of such entities were viewed as substantially lower or riskier than ours.
Unitholders may have liability to repay distributions.
Under certain circumstances, Unitholders may have to repay us amounts wrongfully distributed to them. Under Delaware law, we may not make a distribution to Unitholders if the distribution causes our liabilities to exceed the fair value of our assets. Liabilities to partners on account of their partnership interests and non-recourse liabilities are not counted for purposes of determining whether a distribution is permitted. Delaware law provides that a limited partner who receives such a distribution and knew at the time of the distribution that the distribution violated Delaware law, will be liable to the limited partnership for the distribution amount for three years from the distribution date. Under Delaware law, an assignee who becomes a substituted limited partner of a limited partnership is liable for the obligations of the assignor to make contributions to the partnership. However, such an assignee is not obligated for liabilities unknown to him at the time he or she became a limited partner if the liabilities could not be determined from the partnership agreement.
We have a holding company structure in which our subsidiaries conduct our operations and own our operating assets.
We are a holding company, and our subsidiaries conduct all of our operations and own all of our operating assets. We do not have significant assets other than the partnership interests and the equity in our subsidiaries. As a result, our ability to pay distributions to our Unitholders and to service our debt depends on the performance of our subsidiaries and their ability to distribute funds to us. The ability of our subsidiaries to make distributions to us may be restricted by, among other things, credit facilities and applicable state partnership laws and other laws and regulations. If we are unable to obtain funds from our subsidiaries we may not be able to pay distributions to our Unitholders or to pay interest or principal on our debt when due.
Unitholders may not have limited liability if a court finds that unitholder actions constitute control of our business.
Under Delaware law, a unitholder could be held liable for our obligations to the same extent as a general partner if a court determined that the right of unitholders to remove our general partner or to take other action under our partnership agreement constituted participation in the “control” of our business.
Our general partner generally has unlimited liability for our obligations, such as our debts and environmental liabilities, except for those contractual obligations that are expressly made without recourse to our general partner. Our partnership agreement allows the general partner to incur obligations on our behalf that are expressly non-recourse to the general partner. The general partner has entered into such limited recourse obligations in most instances involving payment liability and intends to do so in the future.
In addition, Section 17-607 of the Delaware Revised Uniform Limited Partnership Act provides that under some circumstances, a unitholder may be liable to us for the amount of a distribution for a period of three years from the date of the distribution.
Our debt level and debt agreements may limit our ability to make distributions to Unitholders and may limit our future financial and operating flexibility.
As of
December 31, 2014
, we had approximately
$30.66 billion
of consolidated debt, excluding the debt of our joint ventures. Our level of indebtedness affects our operations in several ways, including, among other things:
|
•
|
a significant portion of our and our subsidiaries’ cash flow from operations will be dedicated to the payment of principal and interest on outstanding debt and will not be available for other purposes, including payment of distributions;
|
|
•
|
covenants contained in our and our subsidiaries’ existing debt agreements require us and them, as applicable, to meet financial tests that may adversely affect our flexibility in planning for and reacting to changes in our business;
|
|
•
|
our and our subsidiaries’ ability to obtain additional financing for working capital, capital expenditures, acquisitions and general partnership, corporate or limited liability company purposes, as applicable, may be limited;
|
|
•
|
we may be at a competitive disadvantage relative to similar companies that have less debt;
|
|
•
|
we may be more vulnerable to adverse economic and industry conditions as a result of our significant debt level; and
|
|
•
|
failure by us or our subsidiaries to comply with the various restrictive covenants of our respective debt agreements could negatively impact our ability to incur additional debt, including our ability to utilize the available capacity under our revolving credit facility, and our ability to pay our distributions.
|
Unitholders may be required to sell their units to our general partner at an undesirable time or price.
If at any time less than 10% of the outstanding units of any class are held by persons other than the general partner and its affiliates, the general partner will have the right to acquire all, but not less than all, of those units at a price no less than their then-current
39
market price. As a consequence, a unitholder may be required to sell his Common Units at an undesirable time or price. The general partner may assign this purchase right to any of its affiliates or to us.
Risks Related to Conflicts of Interest
Although we control ETP and Regency through our ownership of their respective General Partners, ETP’s General Partner owes fiduciary duties to ETP and ETP’s Unitholders, and Regency’s General Partner owes fiduciary duties to Regency and Regency’s Unitholders, which may conflict with our interests.
Conflicts of interest exist and may arise in the future as a result of the relationships between us and our affiliates, on the one hand, and ETP, Regency and their respective limited partners, on the other hand. The directors and officers of ETP’s and Regency’s General Partners have fiduciary duties to manage ETP and Regency, respectively, in a manner beneficial to us. At the same time, the General Partners have fiduciary duties to manage ETP and Regency, respectively, in a manner beneficial to ETP, Regency and their respective limited partners. The board of directors of ETP’s General Partner or Regency’s general partner will resolve any such conflict and have broad latitude to consider the interests of all parties to the conflict. The resolution of these conflicts may not always be in our best interest.
For example, conflicts of interest with ETP or Regency may arise in the following situations:
|
•
|
the allocation of shared overhead expenses to ETP, Regency and us;
|
|
•
|
the interpretation and enforcement of contractual obligations between us and our affiliates, on the one hand, and ETP or Regency, on the other hand;
|
|
•
|
the determination of the amount of cash to be distributed to ETP’s or Regency’s partners and the amount of cash to be reserved for the future conduct of ETP’s or Regency’s business;
|
|
•
|
the determination whether to make borrowings under ETP’s or Regency’s respective revolving credit facility to pay distributions to ETP’s or Regency’s partners, as applicable;
|
|
•
|
the determination of whether a business opportunity (such as a commercial development opportunity or an acquisition) that we may become aware of independently of ETP or Regency is made available for either ETP or Regency, or both, to pursue; and
|
|
•
|
any decision we make in the future to engage in business activities independent of ETP or Regency.
|
The fiduciary duties of our General Partner’s officers and directors may conflict with those of ETP’s or Regency’s respective General Partners.
Conflicts of interest may arise because of the relationships among ETP, Regency, their General Partners and us. Our General Partner’s directors and officers have fiduciary duties to manage our business in a manner beneficial to us and our Unitholders. Some of our General Partner’s directors are also directors and officers of ETP’s General Partner or Regency’s General Partner, and have fiduciary duties to manage the respective businesses of ETP and Regency in a manner beneficial to ETP, Regency and their respective Unitholders. The resolution of these conflicts may not always be in our best interest or that of our Unitholders.
Potential conflicts of interest may arise among our General Partner, its affiliates and us. Our General Partner and its affiliates have limited fiduciary duties to us, which may permit them to favor their own interests to the detriment of us.
Conflicts of interest may arise among our General Partner and its affiliates, on the one hand, and us, on the other hand. As a result of these conflicts, our General Partner may favor its own interests and the interests of its affiliates over our interests. These conflicts include, among others, the following:
|
•
|
Our General Partner is allowed to take into account the interests of parties other than us, including ETP, Regency and their respective affiliates and any General Partners and limited partnerships acquired in the future, in resolving conflicts of interest, which has the effect of limiting its fiduciary duties to us.
|
|
•
|
Our General Partner has limited its liability and reduced its fiduciary duties under the terms of our partnership agreement, while also restricting the remedies available for actions that, without these limitations, might constitute breaches of fiduciary duty. As a result of purchasing our units, Unitholders consent to various actions and conflicts of interest that might otherwise constitute a breach of fiduciary or other duties under applicable state law.
|
|
•
|
Our General Partner determines the amount and timing of our investment transactions, borrowings, issuances of additional partnership securities and reserves, each of which can affect the amount of cash that is available for distribution.
|
|
•
|
Our General Partner determines which costs it and its affiliates have incurred are reimbursable by us.
|
40
|
•
|
Our partnership agreement does not restrict our General Partner from causing us to pay it or its affiliates for any services rendered, or from entering into additional contractual arrangements with any of these entities on our behalf, so long as the terms of any such payments or additional contractual arrangements are fair and reasonable to us.
|
|
•
|
Our General Partner controls the enforcement of obligations owed to us by it and its affiliates.
|
|
•
|
Our General Partner decides whether to retain separate counsel, accountants or others to perform services for us.
|
Our partnership agreement limits our General Partner’s fiduciary duties to us and restricts the remedies available for actions taken by our General Partner that might otherwise constitute breaches of fiduciary duty.
Our partnership agreement contains provisions that reduce the standards to which our General Partner would otherwise be held by state fiduciary duty law. For example, our partnership agreement:
|
•
|
permits our General Partner to make a number of decisions in its individual capacity, as opposed to in its capacity as our General Partner. This entitles our General Partner to consider only the interests and factors that it desires, and it has no duty or obligation to give any consideration to any interest of, or factors affecting, us, our affiliates or any limited partner;
|
|
•
|
provides that our General Partner is entitled to make other decisions in “good faith” if it reasonably believes that the decisions are in our best interests;
|
|
•
|
generally provides that affiliated transactions and resolutions of conflicts of interest not approved by the Audit and Conflicts Committee of the board of directors of our General Partner and not involving a vote of Unitholders must be on terms no less favorable to us than those generally being provided to or available from unrelated third parties or be “fair and reasonable” to us and that, in determining whether a transaction or resolution is “fair and reasonable,” our General Partner may consider the totality of the relationships among the parties involved, including other transactions that may be particularly advantageous or beneficial to us;
|
|
•
|
provides that unless our General Partner has acted in bad faith, the action taken by our General Partner shall not constitute a breach of its fiduciary duty;
|
|
•
|
provides that our General Partner may resolve any conflicts of interest involving us and our General Partner and its affiliates, and any resolution of a conflict of interest by our General Partner that is “fair and reasonable” to us will be deemed approved by all partners, including the Unitholders, and will not constitute a breach of the partnership agreement;
|
|
•
|
provides that our General Partner may, but is not required, in connection with its resolution of a conflict of interest, to seek “special approval” of such resolution by appointing a conflicts committee of the General Partner’s board of directors composed of two or more independent directors to consider such conflicts of interest and to recommend action to the board of directors, and any resolution of the conflict of interest by the conflicts committee shall be conclusively deemed “fair and reasonable” to us; and
|
|
•
|
provides that our General Partner and its officers and directors will not be liable for monetary damages to us, our limited partners or assignees for any acts or omissions unless there has been a final and non-appealable judgment entered by a court of competent jurisdiction determining that the General Partner or those other persons acted in bad faith or engaged in fraud, willful misconduct or gross negligence.
|
Our General Partner has a limited call right that may require Unitholders to sell their units at an undesirable time or price.
If at any time our General Partner and its affiliates own more than 90% of our outstanding units, our General Partner will have the right, but not the obligation, which it may assign to any of its affiliates or to us, to acquire all, but not less than all, of the units held by unaffiliated persons at a price not less than their then-current market price. As a result, Unitholders may be required to sell their units at an undesirable time or price and may not receive any return on their investment. Unitholders may also incur a tax liability upon a sale of their units. As of
December 31, 2014
, the directors and executive officers of our General Partner owned approximately
20%
of our Common Units.
The general partner’s absolute discretion in determining the level of cash reserves may adversely affect our ability to make cash distributions to our Unitholders.
Our partnership agreement requires the general partner to deduct from operating surplus cash reserves that in its reasonable discretion are necessary to fund our future operating expenditures. In addition, our partnership agreement permits the general partner to reduce available cash by establishing cash reserves for the proper conduct of our business, to comply with applicable law or agreements to which we are a party or to provide funds for future distributions to partners. These cash reserves will affect the amount of cash available for distribution to unitholders.
41
Risks Related to the Businesses of ETP and Regency
Since our cash flows consist exclusively of distributions from ETP and Regency, risks to the businesses of ETP and Regency are also risks to us. We have set forth below risks to the businesses of ETP and Regency, the occurrence of which could have a negative impact on their respective financial performance and decrease the amount of cash they are able to distribute to us.
ETP and Regency do not control, and therefore may not be able to cause or prevent certain actions by, certain of their joint ventures.
Certain of ETP’s and Regency’s joint ventures have their own governing boards, and ETP or Regency may not control all of the decisions of those boards. Consequently, it may be difficult or impossible for ETP or Regency to cause the joint venture entity to take actions that ETP or Regency believe would be in their or the joint venture’s best interests. Likewise, ETP or Regency may be unable to prevent actions of the joint venture.
ETP and Regency are exposed to the credit risk of their respective customers, and an increase in the nonpayment and nonperformance by their respective customers could reduce their respective ability to make distributions to their Unitholders, including to us.
The risks of nonpayment and nonperformance by ETP’s and Regency’s respective customers are a major concern in their respective businesses. Participants in the energy industry have been subjected to heightened scrutiny from the financial markets in light of past collapses and failures of other energy companies. ETP and Regency are subject to risks of loss resulting from nonpayment or nonperformance by their respective customers. The current tightening of credit in the financial markets may make it more difficult for customers to obtain financing and, depending on the degree to which this occurs, there may be a material increase in the nonpayment and nonperformance by ETP’s and Regency’s customers. Any substantial increase in the nonpayment and nonperformance by ETP’s or Regency’s customers could have a material adverse effect on ETP’s or Regency’s respective results of operations and operating cash flows.
Income from ETP’s midstream, transportation, terminalling and storage operations is exposed to risks due to fluctuations in the demand for and price of natural gas, NGLs and oil that are beyond our control.
The prices for natural gas, NGLs and oil (including refined petroleum products) reflect market demand that fluctuates with changes in global and U.S. economic conditions and other factors, including:
|
•
|
the level of domestic natural gas, NGL, and oil production;
|
|
•
|
the level of natural gas, NGL, and oil imports and exports, including liquefied natural gas;
|
|
•
|
actions taken by natural gas and oil producing nations;
|
|
•
|
instability or other events affecting natural gas and oil producing nations;
|
|
•
|
the impact of weather and other events of nature on the demand for natural gas, NGLs and oil;
|
|
•
|
the availability of storage, terminal and transportation systems, and refining, processing and treating facilities;
|
|
•
|
the price, availability and marketing of competitive fuels;
|
|
•
|
the demand for electricity;
|
|
•
|
the cost of capital needed to maintain or increase production levels and to construct and expand facilities
|
|
•
|
the impact of energy conservation and fuel efficiency efforts; and
|
|
•
|
the extent of governmental regulation, taxation, fees and duties.
|
In the past, the prices of natural gas, NGLs and oil have been extremely volatile, and we expect this volatility to continue.
Any loss of business from existing customers or our inability to attract new customers due to a decline in demand for natural gas, NGLs, or oil could have a material adverse effect on our revenues and results of operations. In addition, significant price fluctuations for natural gas, NGL and oil commodities could materially affect our profitability
A material decrease in demand or distribution of crude oil available for transport through Sunoco Logistics’ pipelines or terminal facilities could materially and adversely affect our results of operations, financial position, or cash flows.
The volume of crude oil transported through Sunoco Logistics’ crude oil pipelines and terminal facilities depends on the availability of attractively priced crude oil produced or received in the areas serviced by its assets. A period of sustained crude oil price declines could lead to a decline in drilling activity, production and import levels in these areas. Similarly, a period of sustained increases
42
in the price of crude oil supplied from any of these areas, as compared to alternative sources of crude oil available to Sunoco Logistics’ customers, could materially reduce demand for crude oil in these areas. In either case, the volumes of crude oil transported in Sunoco Logistics’ crude oil pipelines and terminal facilities could decline, and it could likely be difficult to secure alternative sources of attractively priced crude oil supply in a timely fashion or at all. If Sunoco Logistics is unable to replace any significant volume declines with additional volumes from other sources, our results of operations, financial position, or cash flows could be materially and adversely affected.
ETP and Regency are affected by competition from other midstream, transportation and storage and retail marketing companies.
We experience competition in all of our business segments. With respect to ETP’s midstream operations, ETP competes for both natural gas supplies and customers for its services. Competitors include major integrated oil companies, interstate and intrastate pipelines and companies that gather, compress, treat, process, transport, store and market natural gas.
ETP’s and Regency’s natural gas and NGL transportation pipelines and storage facilities compete with other interstate and intrastate pipeline companies and storage providers in the transportation and storage of natural gas and NGLs. The principal elements of competition among pipelines are rates, terms of service, access to sources of supply and the flexibility and reliability of service. Natural gas and NGLs also competes with other forms of energy, including electricity, coal, fuel oils and renewable or alternative energy. Competition among fuels and energy supplies is primarily based on price; however, non-price factors, including governmental regulation, environmental impacts, efficiency, ease of use and handling, and the availability of subsidies and tax benefits also affects competitive outcomes.
In markets served by our NGL pipelines, we compete with other pipeline companies and barge, rail and truck fleet operations. We also face competition with other storage and fractionation facilities based on fees charged and the ability to receive, distribute and/or fractionate the customer’s products.
ETP’s crude oil and refined products pipeline operations face significant competition from other pipelines for large volume shipments. These operations also face competition from trucks for incremental and marginal volumes in areas served by Sunoco Logistics’ pipelines. Further, our refined product terminals compete with terminals owned by integrated petroleum companies, refining and marketing companies, independent terminal companies and distribution companies with marketing and trading operations.
ETP also faces strong competition in the market for the sale of retail gasoline and merchandise. ETP’s competitors include service stations operated by fully integrated major oil companies and other well-recognized national or regional retail outlets, often selling gasoline or merchandise at aggressively competitive prices. The actions of retail marketing competitors, including the impact of foreign imports, could lead to lower prices or reduced margins for the products we sell, which could have an adverse effect on our business or results of operations.
ETP and Regency may be unable to retain or replace existing midstream, transportation, terminalling and storage
customers or volumes due to declining demand or increased competition in oil, natural gas and NGL markets, which would reduce revenues and limit future profitability.
The retention or replacement of existing customers and the volume of services that ETP and Regency provide at rates sufficient to maintain or increase current revenues and cash flows depends on a number of factors beyond our control, including the price of and demand for oil, natural gas, and NGLs in the markets we serve and competition from other service providers.
A significant portion of ETP and Regency’s sales of natural gas are to industrial customers and utilities. As a consequence of the volatility of natural gas prices and increased competition in the industry and other factors, industrial customers, utilities and other gas customers are increasingly reluctant to enter into long-term purchase contracts. Many customers purchase natural gas from more than one supplier and have the ability to change suppliers at any time. Some of these customers also have the ability to switch between gas and alternate fuels in response to relative price fluctuations in the market. Because there are many companies of greatly varying size and financial capacity that compete with us in the marketing of natural gas, we often compete in natural gas sales markets primarily on the basis of price.
ETP and Regency also receive a substantial portion of revenues by providing natural gas gathering, processing, treating, transportation and storage services. While a substantial portion of their services are sold under long-term contracts for reserved service, they also provide service on an unreserved or short-term basis. Demand for our services may be substantially reduced due to changing market prices. Declining prices may result in lower rates of natural gas production resulting in less use of services, while rising prices may diminish consumer demand and also limit the use of services. In addition, our competitors may attract our customers’ business. If demand declines or competition increases, we may not be able to sustain existing levels of unreserved service or renew or extend long-term contracts as they expire or we may reduce our rates to meet competitive pressures.
43
Revenue from ETP and Regency’s NGL transportation systems and refined products storage is also exposed to risks due to fluctuations in demand for transportation and storage service as a result of unfavorable commodity prices, competition from nearby pipelines, and other factors. ETP and Regency receive substantially all of their transportation revenues through dedicated contracts under which the customer agrees to deliver the total output from particular processing plants that are connected only to their transportation system. Reduction in demand for natural gas or NGLs due to unfavorable prices or other factors, however, may result lower rates of production under dedicated contracts and lower demand for our services. In addition, ETP’s refined products storage revenues are primarily derived from fixed capacity arrangements between us and our customers, a portion of its revenue is derived from fungible storage and throughput arrangements, under which ETP’s revenue is more dependent upon demand for storage from its customers.
The volume of crude oil and products transported through ETP’s oil pipelines and terminal facilities depends on the availability of attractively priced crude oil and refined products in the areas serviced by our assets. A period of sustained price reductions for crude oil or products could lead to a decline in drilling activity, production and refining of crude oil, or import levels in these areas. A period of sustained increases in the price of crude oil or products supplied from or delivered to any of these areas could materially reduce demand for crude oil or products in these areas. In either case, the volumes of crude oil or products transported in our oil pipelines and terminal facilities could decline.
The loss of existing customers by ETP and Regency’s midstream, transportation, terminalling and storage facilities or a reduction in the volume of the services customers purchase from them, or their inability to attract new customers and service volumes would negatively affect revenues, be detrimental to growth, and adversely affect results of operations.
ETP’s midstream facilities and transportation pipelines are attached to basins with naturally declining production, which it may not be able to replace with new sources of supply.
In order to maintain or increase throughput levels on ETP’s gathering systems and transportation pipeline systems and asset utilization rates at our treating and processing plants, ETP must continually contract for new natural gas supplies and natural gas transportation services.
A substantial portion of ETP’s assets, including its gathering systems and processing and treating plants, are connected to natural gas reserves and wells that experience declining production over time. ETP’s gas transportation pipelines are also dependent upon natural gas production in areas served by our gathering systems or in areas served by other gathering systems or transportation pipelines that connect with our transportation pipelines. ETP may not be able to obtain additional contracts for natural gas supplies for its natural gas gathering systems, and may be unable to maintain or increase the levels of natural gas throughput on its transportation pipelines. The primary factors affecting our ability to connect new supplies of natural gas to our gathering systems include our success in contracting for existing natural gas supplies that are not committed to other systems and the level of drilling activity and production of natural gas near our gathering systems or in areas that provide access to its transportation pipelines or markets to which ETP’s systems connect. ETP has no control over the level of drilling activity in its areas of operation, the amount of reserves underlying the wells and the rate at which production from a well will decline. In addition, ETP has no control over producers or their production and contracting decisions.
While a substantial portion of ETP’s services are provided under long-term contracts for reserved service, it also provides service on an unreserved basis. The reserves available through the supply basins connected to our gathering, processing, treating, transportation and storage facilities may decline and may not be replaced by other sources of supply. A decrease in development or production activity could cause a decrease in the volume of unreserved services ETP provides and a decrease in the number and volume of its contracts for reserved transportation service over the long run, which in each case would adversely affect revenues and results of operations.
If we are unable to replace any significant volume declines with additional volumes from other sources, our results of operations and cash flows could be materially and adversely affected.
ETP is entirely dependent upon third parties for the supply of refined products such as gasoline and diesel for its retail marketing business.
ETP is required to purchase refined products from third party sources, including the joint venture that acquired Sunoco, Inc.’s Philadelphia refinery. ETP may also need to contract for new ships, barges, pipelines or terminals which it has not historically used to transport these products to its markets. The inability to acquire refined products and any required transportation services at favorable prices may adversely affect ETP’s business and results of operations.
44
The profitability of certain activities in ETP’s and Regency’s natural gas gathering, processing, transportation and storage operations are largely dependent upon natural gas commodity prices, price spreads between two or more physical locations and market demand for natural gas and NGLs.
For a portion of the natural gas gathered on ETP’s and Regency’s systems, they purchase natural gas from producers at the wellhead and then gather and deliver the natural gas to pipelines where they typically resell the natural gas under various arrangements, including sales at index prices. Generally, the gross margins they realize under these arrangements decrease in periods of low natural gas prices.
ETP and Regency also enter into percent-of-proceeds arrangements, keep-whole arrangements, and processing fee agreements pursuant to which we agree to gather and process natural gas received from the producers.
Under percent-of-proceeds arrangements, ETP and Regency generally sell the residue gas and NGLs at market prices and remit to the producers an agreed upon percentage of the proceeds based on an index price. In other cases, instead of remitting cash payments to the producer, ETP and Regency deliver an agreed upon percentage of the residue gas and NGL volumes to the producer and sell the volumes ETP and Regency keep to third parties at market prices. Under these arrangements, revenues and gross margins decline when natural gas prices and NGL prices decrease. Accordingly, a decrease in the price of natural gas or NGLs could have an adverse effect on ETP’s and Regency’s revenues and results of operations.
Under keep-whole arrangements, ETP and Regency generally sell the NGLs produced from our gathering and processing operations at market prices. Because the extraction of the NGLs from the natural gas during processing reduces the Btu content of the natural gas, ETP and Regency must either purchase natural gas at market prices for return to producers or make a cash payment to producers equal to the value of this natural gas. Under these arrangements, gross margins generally decrease when the price of natural gas increases relative to the price of NGLs.
When ETP and Regency process the gas for a fee under processing fee agreements, they may guarantee recoveries to the producer. If recoveries are less than those guaranteed to the producer, ETP or Regency may suffer a loss by having to supply liquids or its cash equivalent to keep the producer whole.
ETP and Regency also receive fees and retain gas in kind from our natural gas transportation and storage customers. ETP and Regency’s fuel retention fees and the value of gas that they retain in kind are directly affected by changes in natural gas prices. Decreases in natural gas prices tend to decrease fuel retention fees and the value of retained gas.
In addition, ETP receives revenue from its off-gas processing and fractionating system in South Louisiana primarily through customer agreements that are a combination of keep-whole and percent-of-proceeds arrangements, as well as from transportation and fractionation fees. Consequently, a large portion of our off-gas processing and fractionation revenue is exposed to risks due to fluctuations in commodity prices. In addition, a decline in NGL prices could cause a decrease in demand for ETP’s off-gas processing and fractionation services and could have an adverse effect on ETP’s results of operations.
The use of derivative financial instruments could result in material financial losses by ETP and Regency.
From time to time, ETP and Regency have sought to reduce our exposure to fluctuations in commodity prices and interest rates by using derivative financial instruments and other risk management mechanisms and by their trading, marketing and/or system optimization activities. To the extent that either ETP or Regency hedges its commodity price and interest rate exposures, it foregoes the benefits it would otherwise experience if commodity prices or interest rates were to change favorably. In addition, even though monitored by management, ETP’s and Regency’s derivatives activities can result in losses. Such losses could occur under various circumstances, including if a counterparty does not perform its obligations under the derivative arrangement, the hedge is imperfect, commodity prices move unfavorably related to ETP’s or Regency’s physical or financial positions, or internal hedging policies and procedures are not followed.
The accounting standards regarding hedge accounting are very complex, and even when we engage in hedging transactions that are effective economically (whether to mitigate our exposure to fluctuations in commodity prices, or to balance our exposure to fixed and variable interest rates), these transactions may not be considered effective for accounting purposes. Accordingly, our consolidated financial statements may reflect some volatility due to these hedges, even when there is no underlying economic impact at that point. It is also not always possible for us to engage in a hedging transaction that completely mitigates our exposure to commodity prices. Our consolidated financial statements may reflect a gain or loss arising from an exposure to commodity prices for which we are unable to enter into a completely effective hedge.
In addition, even though monitored by management, our derivatives activities can result in losses. Such losses could occur under various circumstances, including if a counterparty does not perform its obligations under the derivative arrangement, the hedge
45
is imperfect, commodity prices move unfavorably related to our physical or financial positions or hedging policies and procedures are not followed.
ETP’s and Regency’s natural gas and NGL revenues depend on their customers’ ability to use ETP’s and Regency’s pipelines and third-party pipelines over which we have no control.
ETP’s and Regency’s natural gas transportation, storage and NGL businesses depend, in part, on their customers’ ability to obtain access to pipelines to deliver gas to and receive gas from ETP and Regency. Many of these pipelines are owned by parties not affiliated with us. Any interruption of service on our pipelines or third party pipelines due to testing, line repair, reduced operating pressures, or other causes or adverse change in terms and conditions of service could have a material adverse effect on ETP’s and Regency’s ability, and the ability of their customers, to transport natural gas to and from their pipelines and facilities and a corresponding material adverse effect on their transportation and storage revenues. In addition, the rates charged by interconnected pipelines for transportation to and from ETP’s and Regency’s facilities affect the utilization and value of their storage services. Significant changes in the rates charged by those pipelines or the rates charged by other pipelines with which the interconnected pipelines compete could also have a material adverse effect on storage revenues.
Shippers using ETP’s and Regency’s oil pipelines and terminals are also dependent upon their pipelines and connections to third-party pipelines to receive and deliver crude oil and products. Any interruptions or reduction in the capabilities of these pipelines due to testing, line repair, reduced operating pressures, or other causes could result in reduced volumes transported in ETP’s and Regency’s pipelines or through their terminals. Similarly, if additional shippers begin transporting volume over interconnecting oil pipelines, the allocations of pipeline capacity to ETP and Regency’s existing shippers on these interconnecting pipelines could be reduced, which also could reduce volumes transported in their pipelines or through their terminals. Allocation reductions of this nature are not infrequent and are beyond our control. Any such interruptions or allocation reductions that, individually or in the aggregate, are material or continue for a sustained period of time could have a material adverse effect on ETP and Regency’s results of operations, financial position, or cash flows.
The inability to continue to access lands owned by third parties, including tribal lands, could adversely affect our ability to operate and adversely affect our financial results.
Our ability to operate our pipeline systems and terminal facilities on certain lands owned by third parties, including lands held in trust by the United States for the benefit of a Native American tribe, will depend on our success in maintaining existing rights-of-way and obtaining new rights-of-way on those lands. Securing extensions of existing and any additional rights-of-way is also critical to our ability to pursue expansion projects. We cannot provide any assurance that we will be able to acquire new rights-of-way or maintain access to existing rights-of-way upon the expiration of the current grants or that all of the rights-of-way will be obtainable in a timely fashion. Transwestern’s existing right-of-way agreements with the Navajo Nation, Southern Ute, Pueblo of Laguna and Fort Mojave tribes extend through November 2029, September 2020, December 2022 and April 2019, respectively. Our financial position could be adversely affected if the costs of new or extended right-of-way grants cannot be recovered in rates.
Further, whether we have the power of eminent domain for our pipelines varies from state to state, depending upon the type of pipeline and the laws of the particular state. In either case, we must compensate landowners for the use of their property and, in eminent domain actions, such compensation may be determined by a court. The inability to exercise the power of eminent domain could negatively affect our business if we were to lose the right to use or occupy the property on which our pipelines are located.
In addition, we do not own all of the land on which our oil terminal facilities and our retail service stations are located. We have rental agreements for approximately
41.8%
of the company- or dealer-operated retail service stations where we currently control the real estate and we have rental agreements for certain logistics facilities. As such, we are subject to the possibility of increased costs under rental agreements with landowners, primarily through rental increases and renewals of expired agreements. We are also subject to the risk that such agreements may not be renewed. Additionally, certain facilities and equipment (or parts thereof) used by us are leased from third parties for specific periods. Our inability to renew leases or otherwise maintain the right to utilize such facilities and equipment on acceptable terms, or the increased costs to maintain such rights, could have a material adverse effect on our financial condition, results of operations and cash flows.
ETP and Regency may not be able to fully execute their growth strategies if they encounter increased competition for qualified assets.
ETP and Regency each have strategies that contemplate growth through the development and acquisition of a wide range of midstream and other energy infrastructure assets while maintaining strong balance sheets. These strategies include constructing and acquiring additional assets and businesses to enhance their ability to compete effectively and diversify their respective asset portfolios, thereby providing more stable cash flow. ETP and Regency regularly consider and enter into discussions regarding the acquisition of additional assets and businesses, stand-alone development projects or other transactions that ETP and Regency believe will present opportunities to realize synergies and increase cash flow.
46
Consistent with their strategies, managements of ETP and Regency may, from time to time, engage in discussions with potential sellers regarding the possible acquisition of additional assets or businesses. Such acquisition efforts may involve ETP or Regency management’s participation in processes that involve a number of potential buyers, commonly referred to as “auction” processes, as well as situations in which ETP or Regency believes it is the only party or one of a very limited number of potential buyers in negotiations with the potential seller. We cannot assure that ETP’s or Regency’s acquisition efforts will be successful or that any acquisition will be completed on favorable terms.
In addition, ETP and Regency each are experiencing increased competition for the assets they purchase or contemplate purchasing. Increased competition for a limited pool of assets could result in ETP or Regency losing to other bidders more often or acquiring assets at higher prices, both of which would limit ETP’s or Regency’s ability to fully execute their respective growth strategies. Inability to execute their respective growth strategies may materially adversely impact ETP’s or Regency’s results of operations.
An impairment of goodwill and intangible assets could reduce our earnings.
As of
December 31, 2014
, our consolidated balance sheets reflected
$7.87 billion
of goodwill and
$5.58 billion
of intangible assets. Goodwill is recorded when the purchase price of a business exceeds the fair value of the tangible and separately measurable intangible net assets. Accounting principles generally accepted in the United States require us to test goodwill for impairment on an annual basis or when events or circumstances occur, indicating that goodwill might be impaired. Long-lived assets such as intangible assets with finite useful lives are reviewed for impairment whenever events or changes in circumstances indicate that the carrying amount may not be recoverable. If we determine that any of our goodwill or intangible assets were impaired, we would be required to take an immediate charge to earnings with a correlative effect on partners’ capital and balance sheet leverage as measured by debt to total capitalization.
During the fourth quarter of 2013, we recorded a goodwill impairment charge of
$689 million
on our Lake Charles LNG reporting unit. During the fourth quarter of 2014, a
$370 million
goodwill impairment was recorded related to Regency’s Permian Basin gathering and processing operations. See
Note 2
to our consolidated financial statements for additional information.
If ETP and Regency do not make acquisitions on economically acceptable terms, their future growth could be limited.
ETP’s and Regency’s results of operations and their ability to grow and to increase distributions to Unitholders will depend in part on their ability to make acquisitions that are accretive to their respective distributable cash flow.
ETP and Regency may be unable to make accretive acquisitions for any of the following reasons, among others:
|
•
|
inability to identify attractive acquisition candidates or negotiate acceptable purchase contracts with them;
|
|
•
|
inability to raise financing for such acquisitions on economically acceptable terms; or
|
|
•
|
inability to outbid by competitors, some of which are substantially larger than ETP or Regency and may have greater financial resources and lower costs of capital.
|
Furthermore, even if ETP or Regency consummates acquisitions that it believes will be accretive, those acquisitions may in fact adversely affect its results of operations or result in a decrease in distributable cash flow per unit. Any acquisition involves potential risks, including the risk that ETP or Regency may:
|
•
|
fail to realize anticipated benefits, such as new customer relationships, cost-savings or cash flow enhancements;
|
|
•
|
decrease its liquidity by using a significant portion of its available cash or borrowing capacity to finance acquisitions;
|
|
•
|
significantly increase its interest expense or financial leverage if the acquisition is financed with additional debt;
|
|
•
|
encounter difficulties operating in new geographic areas or new lines of business;
|
|
•
|
incur or assume unanticipated liabilities, losses or costs associated with the business or assets acquired for which there is no indemnity or the indemnity is inadequate;
|
|
•
|
be unable to hire, train or retrain qualified personnel to manage and operate its growing business and assets;
|
|
•
|
less effectively manage its historical assets, due to the diversion of management’s attention from other business concerns; or
|
|
•
|
incur other significant charges, such as impairment of goodwill or other intangible assets, asset devaluation or restructuring charges.
|
If ETP and Regency consummate future acquisitions, their respective capitalization and results of operations may change significantly. As ETP and Regency determine the application of their funds and other resources, Unitholders will not have an opportunity to evaluate the economic, financial and other relevant information that ETP and Regency will consider.
47
If ETP and Regency do not continue to construct new pipelines, their future growth could be limited.
ETP’s and Regency’s results of operations and their ability to grow and to increase distributable cash flow per unit will depend, in part, on their ability to construct pipelines that are accretive to their respective distributable cash flow. ETP or Regency may be unable to construct pipelines that are accretive to distributable cash flow for any of the following reasons, among others:
|
•
|
inability to identify pipeline construction opportunities with favorable projected financial returns;
|
|
•
|
inability to raise financing for its identified pipeline construction opportunities; or
|
|
•
|
inability to secure sufficient transportation commitments from potential customers due to competition from other pipeline construction projects or for other reasons.
|
Furthermore, even if ETP or Regency constructs a pipeline that it believes will be accretive, the pipeline may in fact adversely affect its results of operations or fail to achieve results projected prior to commencement of construction.
Expanding ETP’s and Regency’s business by constructing new pipelines and related facilities subjects ETP and Regency to risks.
One of the ways that ETP and Regency have grown their respective businesses is through the construction of additions to existing gathering, compression, treating, processing and transportation systems. The construction of a new pipeline and related facilities (or the improvement and repair of existing facilities) involves numerous regulatory, environmental, political and legal uncertainties beyond ETP’s and Regency’s control and require the expenditure of significant amounts of capital to be financed through borrowings, the issuance of additional equity or from operating cash flow. If ETP or Regency undertakes these projects, they may not be completed on schedule or at all or at the budgeted cost. A variety of factors outside ETP’s or Regency’s control, such as weather, natural disasters and difficulties in obtaining permits and rights-of-way or other regulatory approvals, as well as the performance by third-party contractors may result in increased costs or delays in construction. Cost overruns or delays in completing a project could have a material adverse effect on ETP’s or Regency’s results of operations and cash flows. Moreover, revenues may not increase immediately following the completion of a particular project. For instance, if ETP or Regency builds a new pipeline, the construction will occur over an extended period of time, but ETP or Regency, as applicable, may not materially increase its revenues until long after the project’s completion. In addition, the success of a pipeline construction project will likely depend upon the level of oil and natural gas exploration and development drilling activity and the demand for pipeline transportation in the areas proposed to be serviced by the project as well as ETP’s and Regency’s abilities to obtain commitments from producers in the area to utilize the newly constructed pipelines. In this regard, ETP and Regency may construct facilities to capture anticipated future growth in oil or natural gas production in a region in which such growth does not materialize. As a result, new facilities may be unable to attract enough throughput or contracted capacity reservation commitments to achieve ETP’s or Regency’s expected investment return, which could adversely affect its results of operations and financial condition.
ETP and Regency depend on certain key producers for a significant portion of their supplies of natural gas. The loss of, or reduction in, any of these key producers could adversely affect ETP’s or Regency’s respective business and operating results.
ETP and Regency rely on a limited number of producers for a significant portion of their natural gas supplies. These contracts have terms that range from month-to-month to life of lease. As these contracts expire, ETP and Regency will have to negotiate extensions or renewals or replace the contracts with those of other suppliers. ETP and Regency may be unable to obtain new or renewed contracts on favorable terms, if at all. The loss of all or even a portion of the volumes of natural gas supplied by these producers and other customers, as a result of competition or otherwise, could have a material adverse effect on ETP’s and Regency’s business, results of operations, and financial condition.
ETP and Regency depend on key customers to transport natural gas through their pipelines.
ETP and Regency rely on a limited number of major shippers to transport certain minimum volumes of natural gas on their respective pipelines, and Regency maintains contracts for compression services with a limited number of key customers. The failure of the major shippers on ETP’s, Regency’s or their joint ventures’ pipelines or of other key customers to fulfill their contractual obligations under these contracts could have a material adverse effect on the cash flow and results of operations of us, ETP, Regency or their joint ventures, as applicable, were unable to replace these customers under arrangements that provide similar economic benefits as these existing contracts.
Mergers among Sunoco Logistics’ customers and competitors could result in lower volumes being shipped on its pipelines or products stored in or distributed through its terminals, or reduced crude oil marketing margins or volumes.
Mergers between existing customers could provide strong economic incentives for the combined entities to utilize their existing systems instead of Sunoco Logistics’ systems in those markets where the systems compete. As a result, Sunoco Logistics could
48
lose some or all of the volumes and associated revenues from these customers and could experience difficulty in replacing those lost volumes and revenues, which could materially and adversely affect our results of operations, financial position, or cash flows.
A portion of Sunoco Logistics’ general and administrative services have been outsourced to third-party service providers. Fraudulent activity or misuse of proprietary data involving its outsourcing partners could expose us to additional liability.
Sunoco Logistics utilizes both affiliate entities and third parties in the processing of its information and data. Breaches of its security measures or the accidental loss, inadvertent disclosure or unapproved dissemination of proprietary information or sensitive or confidential data about Sunoco Logistics or its customers, including the potential loss or disclosure of such information or data as a result of fraud or other forms of deception, could expose Sunoco Logistics to a risk of loss or misuse of this information, result in litigation and potential liability for Sunoco Logistics, lead to reputational damage, increase compliance costs, or otherwise harm its business.
ETP and Regency’s interstate pipelines are subject to laws, regulations and policies governing the rates they are allowed to charge for their services, which may prevent us from fully recovering our costs.
Laws, regulations and policies governing interstate natural gas pipeline rates could affect the ability of ETP’s and Regency’s interstate pipelines to establish rates, to charge rates that would cover future increases in its costs, or to continue to collect rates that cover current costs.
ETP and Regency are required to file tariff rates (also known as recourse rates) with the FERC that shippers may elect to pay for interstate natural gas transportation services. We may also agree to discount these rates on a not unduly discriminatory basis or negotiate rates with shippers who elect not to pay the recourse rates. ETP and Regency must also file with the FERC all negotiated rates that do not conform to our tariff rates and all changes to our tariff or negotiated rates. The FERC must approve or accept all rate filings for us to be allowed to charge such rates.
The FERC may review existing tariffs rates on its own initiative or upon receipt of a complaint filed by a third party. The FERC may, on a prospective basis, order refunds of amounts collected if it finds the rates to have been shown not to be just and reasonable or to have been unduly discriminatory. The FERC has recently exercised this authority with respect to several other pipeline companies. If the FERC were to initiate a proceeding against ETP or Regency and find that their rates were not just and reasonable or unduly discriminatory, the maximum rates customers could elect to pay ETP and Regency may be reduced and the reduction could have an adverse effect on their revenues and results of operations.
The costs of ETP’s and Regency’s interstate pipeline operations may increase and ETP or Regency may not be able to recover all of those costs due to FERC regulation of their rates. If ETP or Regency propose to change their tariff rates, their proposed rates may be challenged by the FERC or third parties, and the FERC may deny, modify or limit ETP’s or Regency’s proposed changes if they are unable to persuade the FERC that changes would result in just and reasonable rates that are not unduly discriminatory. ETP and Regency also may be limited by the terms of rate case settlement agreements or negotiated rate agreements with individual customers from seeking future rate increases, or ETP and Regency may be constrained by competitive factors from charging their tariff rates.
To the extent ETP’s and Regency’s costs increase in an amount greater than their revenues increase, or there is a lag between their cost increases and their ability to file for, and obtain rate increases, their operating results would be negatively affected. Even if a rate increase is permitted by the FERC to become effective, the rate increase may not be adequate. ETP and Regency cannot guarantee that their interstate pipelines will be able to recover all of their costs through existing or future rates.
The ability of interstate pipelines held in tax-pass-through entities, like us, to include an allowance for income taxes as a cost-of-service element in their regulated rates has been subject to extensive litigation before the FERC and the courts for a number of years. It is currently the FERC’s policy to permit pipelines to include in cost-of-service a tax allowance to reflect actual or potential income tax liability on their public utility income attributable to all partnership or limited liability company interests, if the ultimate owner of the interest has an actual or potential income tax liability on such income. Whether a pipeline’s owners have such actual or potential income tax liability will be reviewed by the FERC on a case-by-case basis. Under the FERC’s policy, we thus remain eligible to include an income tax allowance in the tariff rates we charge for interstate natural gas transportation. The effectiveness of the FERC’s policy and the application of that policy remains subject to future challenges, refinement or change by the FERC or the courts.
49
The interstate pipelines are subject to laws, regulations and policies governing terms and conditions of service, which could adversely affect their business and operations.
In addition to rate oversight, the FERC’s regulatory authority extends to many other aspects of the business and operations of ETP’s and Regency’s interstate pipelines, including:
|
•
|
operating terms and conditions of service;
|
|
•
|
the types of services interstate pipelines may or must offer their customers;
|
|
•
|
construction of new facilities;
|
|
•
|
acquisition, extension or abandonment of services or facilities;
|
|
•
|
reporting and information posting requirements;
|
|
•
|
accounts and records; and
|
|
•
|
relationships with affiliated companies involved in all aspects of the natural gas and energy businesses.
|
Compliance with these requirements can be costly and burdensome. In addition, we cannot guarantee that the FERC will authorize tariff changes and other activities we might propose to do so in a timely manner and free from potentially burdensome conditions. Future changes to laws, regulations, policies and interpretations thereof in these areas may impair the ability of ETP’s and Regency’s interstate pipelines to compete for business, may impair their ability to recover costs or may increase the cost and burden of operation.
Rate regulation or market conditions may not allow ETP to recover the full amount of increases in the costs of its crude oil and products pipeline operations.
Transportation provided on ETP’s common carrier interstate crude oil and products pipelines is subject to rate regulation by the FERC, which requires that tariff rates for transportation on these oil pipelines be just and reasonable and not unduly discriminatory. If ETP proposes new or changed rates, the FERC or interested persons may challenge those rates and the FERC is authorized to suspend the effectiveness of such rates for up to seven months and to investigate such rates. If, upon completion of an investigation, the FERC finds that the proposed rate is unjust or unreasonable, it is authorized to require the carrier to refund revenues in excess of the prior tariff during the term of the investigation. The FERC also may investigate, upon complaint or on its own motion, rates that are already in effect and may order a carrier to change its rates prospectively. Upon an appropriate showing, a shipper may obtain reparations for damages sustained for a period of up to two years prior to the filing of a complaint.
The primary ratemaking methodology used by the FERC to authorize increases in the tariff rates of petroleum pipelines is price indexing. The FERC’s ratemaking methodologies may limit our ability to set rates based on our costs or may delay the use of rates that reflect increased costs. In addition, if the FERC’s indexing methodology changes, the new methodology could materially and adversely affect our financial condition, results of operations or cash flows.
Under the Energy Policy Act adopted in 1992, certain interstate pipeline rates were deemed just and reasonable or “grandfathered.” Revenues are derived from such grandfathered rates on most of our FERC-regulated pipelines. A person challenging a grandfathered rate must, as a threshold matter, establish a substantial change since the date of enactment of the Energy Policy Act, in either the economic circumstances or the nature of the service that formed the basis for the rate. If the FERC were to find a substantial change in circumstances, then the existing rates could be subject to detailed review and there is a risk that some rates could be found to be in excess of levels justified by the pipeline’s costs. In such event, the FERC could order us to reduce pipeline rates prospectively and to pay refunds to shippers.
If the FERC’s petroleum pipeline ratemaking methodologies procedures changes, the new methodology or procedures could adversely affect our business and results of operations.
State regulatory measures could adversely affect the business and operations of ETP and Regency’s midstream and intrastate pipeline and storage assets.
ETP’s and Regency’s midstream and intrastate transportation and storage operations are generally exempt from FERC regulation under the NGA, but FERC regulation still significantly affects their business and the market for their products. The rates, terms and conditions of service for the interstate services they provide in their intrastate gas pipelines and gas storage are subject to FERC regulation under Section 311 of the NGPA. ETP’s HPL System, East Texas pipeline, Oasis pipeline and ET Fuel System provide such services. Under Section 311, rates charged for transportation and storage must be fair and equitable. Amounts collected in excess of fair and equitable rates are subject to refund with interest, and the terms and conditions of service, set forth
50
in the pipeline’s statement of operating conditions, are subject to FERC review and approval. Should the FERC determine not to authorize rates equal to or greater than ETP’s or Regency’s costs of service, their cash flow would be negatively affected.
ETP and Regency’s midstream and intrastate gas and oil transportation pipelines and their intrastate gas storage operations are subject to state regulation. All of the states in which they operate midstream assets, intrastate pipelines or intrastate storage facilities have adopted some form of complaint-based regulation, which allow producers and shippers to file complaints with state regulators in an effort to resolve grievances relating to the fairness of rates and terms of access. The states in which ETP and Regency operate have ratable take statutes, which generally require gatherers to take, without undue discrimination, production that may be tendered to the gatherer for handling. Similarly, common purchaser statutes generally require gatherers to purchase without undue discrimination as to source of supply or producer. These statutes have the effect of restricting our right as an owner of gathering facilities to decide with whom we contract to purchase or transport natural gas. Should a complaint be filed in any of these states or should regulation become more active, ETP’s or Regency’s businesses may be adversely affected.
ETP’s and Regency’s intrastate transportation operations located in Texas are also subject to regulation as gas utilities by the TRRC. Texas gas utilities must publish the rates they charge for transportation and storage services in tariffs filed with the TRRC, although such rates are deemed just and reasonable under Texas law unless challenged in a complaint.
ETP and Regency are subject to other forms of state regulation, including requirements to obtain operating permits, reporting requirements, and safety rules (see description of federal and state pipeline safety regulation below). Violations state laws, regulations, orders and permit conditions can result in the modification, cancellation or suspension of a permit, civil penalties and other relief.
Certain of ETP’s and Regency’s assets may become subject to regulation.
The distinction between federally unregulated gathering facilities and FERC-regulated transmission pipelines under the NGA has been the subject of extensive litigation and may be determined by the FERC on a case-by-case basis, although the FERC has made no determinations as to the status of our facilities. Consequently, the classification and regulation of our gathering facilities could change based on future determinations by the FERC, the courts or Congress. If our gas gathering operations become subject to FERC jurisdiction, the result may adversely affect the rates we are able to charge and the services we currently provide, and may include the potential for a termination of our gathering agreements with our customers.
Intrastate transportation of NGLs is largely regulated by the state in which such transportation takes place. Lone Star’s NGL Pipeline transports NGLs within the state of Texas and is subject to regulation by the TRRC. This NGLs transportation system offers services pursuant to an intrastate transportation tariff on file with the TRRC. Lone Star’s NGL pipeline also commenced the interstate transportation of NGLs in 2013, which is subject to FERC’s jurisdiction under the Interstate Commerce Act and the Energy Policy Act of 1992. Both intrastate and interstate NGL transportation services must be provided in a manner that is just, reasonable, and non-discriminatory. The tariff rates established for interstate services were based on a negotiated agreement; however, if FERC’s rate making methodologies were imposed, they may, among other things, delay the use of rates that reflect increased costs and subject us to potentially burdensome and expensive operational, reporting and other requirements. Any of the foregoing could adversely affect revenues and cash flow related to these assets.
ETP and Regency may incur significant costs and liabilities resulting from performance of pipeline integrity programs and related repairs.
Pursuant to authority under the NGPSA and HLPSA, as amended by the PSI Act, the PIPES Act and the 2011 Pipeline Safety Act, PHMSA has established a series of rules requiring pipeline operators to develop and implement integrity management programs for gas transmission and hazardous liquid pipelines that, in the event of a pipeline leak or rupture could affect “high consequence areas,” which are areas where a release could have the most significant adverse consequences, including high population areas, certain drinking water sources, and unusually sensitive ecological areas.
These regulations require operators of covered pipelines to:
|
•
|
perform ongoing assessments of pipeline integrity;
|
|
•
|
identify and characterize applicable threats to pipeline operations that could impact a high consequence area;
|
|
•
|
improve data collection, integration and analysis;
|
|
•
|
repair and remediate the pipeline as necessary; and
|
|
•
|
implement preventive and mitigating actions.
|
51
In addition, states have adopted regulations similar to existing PHMSA regulations for intrastate gathering and transmission lines. At this time, we cannot predict the ultimate cost of compliance with applicable pipeline integrity management regulations, as the cost will vary significantly depending on the number and extent of any repairs found to be necessary as a result of the pipeline integrity testing. We will continue our pipeline integrity testing programs to assess and maintain the integrity of our pipelines. The results of these tests could cause us to incur significant and unanticipated capital and operating expenditures for repairs or upgrades deemed necessary to ensure the continued safe and reliable operation of our pipelines. Any changes to pipeline safety laws by Congress and regulations by PHMSA that result in more stringent or costly safety standards could have a significant adverse effect on us and similarly situated midstream operators. For instance, changes to regulations governing the safety of gas transmission pipelines and gathering lines are being considered by PHMSA, including, for example, revising the definitions of “high consequence areas” and “gathering lines” and strengthening integrity management requirements as they apply to existing regulated operators and to currently exempt operators should certain exemptions be removed. Most recently, in an August 2014 GAO report to Congress, the agency acknowledged PHMSA’s continued assessment of the safety risks posed by these gathering lines as part of rulemaking process, and recommended that PHMSA move forward with rulemaking to address such lines.
Federal and state legislative and regulatory initiatives relating to pipeline safety that require the use of new or more stringent safety controls or result in more stringent enforcement of applicable legal requirements could subject us to increased capital costs, operational delays and costs of operation
.
The 2011 Pipeline Safety Act is the most recent federal legislation to amend the NGPSA and HLPSA pipeline safety laws, requiring increased safety measures for gas and hazardous liquids pipelines. Among other things, the 2011 Pipeline Safety Act directs the Secretary of Transportation to promulgate regulations relating to expanded integrity management requirements, automatic or remote-controlled valve use, excess flow valve use, leak detection system installation, material strength testing, and verification of the maximum allowable pressure of certain pipelines. The 2011 Pipeline Safety Act also increases the maximum penalty for violation of pipeline safety regulations from $100,000 to $200,000 per violation per day of violation and from $1.0 million to $2.0 million for a related series of violations. The safety enhancement requirements and other provisions of the 2011 Pipeline Safety Act as well as any implementation of PHMSA rules thereunder could require us to install new or modified safety controls, pursue additional capital projects, or conduct maintenance programs on an accelerated basis, any or all of which tasks could result in our incurring increased operating costs that could have a material adverse effect on our results of operations or financial position.
ETP’s and Regency’s businesses involve the generation, handling and disposal of hazardous substances, hydrocarbons and wastes and may be adversely affected by environmental and worker health and safety laws and regulations.
ETP’s and Regency’s operations are subject to stringent federal, state and local laws and regulations governing the discharge of materials into the environment, worker health and safety and protection of the environment. These laws and regulations may require the acquisition of permits for ETP’s and Regency’s operations, result in capital expenditures to manage, limit, or prevent emissions, discharges or releases of various materials from ETP’s and Regency’s pipelines, plants and facilities, impose specific health and safety standards addressing worker protection, and impose substantial liabilities for pollution resulting from ETP’s and Regency’s operations. Several governmental authorities, such as the EPA and state agencies have the power to enforce compliance with these laws and regulations and the permits issued under them and frequently mandate difficult and costly remediation measures and other actions. Failure to comply with these laws, regulations and permits may result in the assessment of significant administrative, civil and criminal penalties, the imposition of remedial obligations and the issuance of injunctive relief. Certain environmental laws impose strict, joint and several liability for costs required to clean up and restore sites where hazardous substances, hydrocarbons or wastes have been disposed or released, even under circumstances where the substances, hydrocarbons or wastes have been released by a predecessor operator. Moreover, it is not uncommon for neighboring landowners and other third parties to file claims for personal injury and property damage allegedly caused by noise, odor or the release of hazardous substances, hydrocarbons or wastes into the environment.
ETP and Regency may incur substantial environmental costs and liabilities because of the underlying risk inherent to its operations. Although we have established financial reserves for our estimated environmental remediation liabilities, additional contamination or conditions may be discovered, resulting in increased remediation costs, liabilities for natural resource damages that could substantially increase our costs for site remediation projects. Accordingly, we cannot assure you that our current reserves are adequate to cover all future liabilities, even for currently known contamination.
Changes in environmental laws and regulations occur frequently, and changes that result in significantly more stringent and costly waste handling, emission standards, or storage, transport, disposal or remediation requirements could have a material adverse effect on ETP’s and Regency’s operations or financial position. For example, in December 2014, the EPA published a proposed regulation that it expects to finalize by October 1, 2015, which rulemaking proposed to revise the NAAQS for ozone between 65 to 70 ppb for both the 8-hour primary and secondary standards. The current primary and secondary ozone standards are set at 75 ppb. EPA also requested public comments on whether the standard should be set as low as 60 ppb or whether the existing 75 ppb standard should be retained. If EPA lowers the ozone standard, states could be required to implement more stringent regulations,
52
which could apply to our operations. Compliance with this or other new regulations could, among other things, require installation of new emission controls on some of our equipment, result in longer permitting timelines, and significantly increase our capital expenditures and operating costs, which could adversely impact our business. ETP and Regency have previously been able to satisfy the more stringent NOx emission reduction requirements that affect its compressor units in ozone non-attainment areas at reasonable cost, but there is no assurance that ETP and Regency will not incur material costs in the future to meet any new, more stringent ozone standard.
Product liability claims and litigation could adversely affect our business and results of operations.
Product liability is a significant commercial risk. Substantial damage awards have been made in certain jurisdictions against manufacturers and resellers based upon claims for injuries caused by the use of or exposure to various products. There can be no assurance that product liability claims against us would not have a material adverse effect on our business or results of operations.
Along with other refiners, manufacturers and sellers of gasoline, Sunoco, Inc. is a defendant in numerous lawsuits that allege methyl tertiary butyl ether (“MTBE”) contamination in groundwater. Plaintiffs, who include water purveyors and municipalities responsible for supplying drinking water and private well owners, are seeking compensatory damages (and in some cases injunctive relief, punitive damages and attorneys’ fees) for claims relating to the alleged manufacture and distribution of a defective product (MTBE-containing gasoline) that contaminates groundwater, and general allegations of product liability, nuisance, trespass, negligence, violation of environmental laws and deceptive business practices. There has been insufficient information developed about the plaintiffs’ legal theories or the facts that would be relevant to an analysis of the ultimate liability to Sunoco, Inc. These allegations or other product liability claims against Sunoco, Inc. could have a material adverse effect on our business or results of operations.
The adoption of climate change legislation or regulations restricting emissions of greenhouse gases could result in increased operating costs and reduced demand for the services we provide.
The EPA has determined that emissions of carbon dioxide, methane and other greenhouse gases present an endangerment to public health and the environment because emissions of such gases are, according to the EPA, contributing to warming of the earth’s atmosphere and other climatic changes. Based on these findings, the EPA has adopted rules under the Clean Air Act that, among other things, establish PSD construction and Title V operating permit reviews for greenhouse gas emissions from certain large stationary sources that already are potential major sources of certain principal, or criteria, pollutant emissions, which reviews could require securing PSD permits at covered facilities emitting greenhouse gases and meeting “best available control technology” standards for those greenhouse gas emissions. In addition, the EPA has adopted rules requiring the monitoring and annual reporting of greenhouse gas emissions from specified onshore and offshore production facilities and onshore processing, transmission and storage facilities in the United States, which includes certain of our operations. More recently, on December 9, 2014, the EPA published a proposed rule that would expand the petroleum and natural gas system sources for which annual greenhouse gas emissions reporting is currently required to include greenhouse gas emissions reporting beginning in the 2016 reporting year for certain onshore gathering and boosting systems consisting primarily of gathering pipelines, compressors and process equipment used to perform natural gas compression, dehydration and acid gas removal. While Congress has from time to time considered adopting legislation to reduce emissions of greenhouse gases, there has not been significant activity in the form of adopted legislation. In the absence of such federal climate legislation, a number of state and regional efforts have emerged that are aimed at tracking and/or reducing greenhouse gas emissions by means of cap and trade programs. The adoption of any legislation or regulations that requires reporting of greenhouse gases or otherwise restricts emissions of greenhouse gases from our equipment and operations could require us to incur significant added costs to reduce emissions of greenhouse gases or could adversely affect demand for the natural gas and NGLs we gather and process or fractionate. For example, in January 2015, the Obama Administration announced plans for the EPA to issue final standards in 2016 that would reduce methane emissions from new and modified oil and natural gas production and natural gas processing and transmission facilities by up to 45 percent from 2012 levels by 2025.
The adoption of the Dodd-Frank Act could have an adverse effect on our ability to use derivative instruments to reduce the effect of commodity price, interest rate and other risks associated with our business, resulting in our operations becoming more volatile and our cash flows less predictable.
Congress has adopted the Dodd-Frank Wall Street Reform and Consumer Protection Act (the "Dodd-Frank Act"), a comprehensive financial reform legislation that establishes federal oversight and regulation of the over-the-counter derivatives market and entities, such as us, that participate in that market. This legislation was signed into law by President Obama on July 21, 2010 and requires the CFTC, the SEC and other regulators to promulgate rules and regulations implementing the new legislation. While certain regulations have been promulgated and are already in effect, the rulemaking and implementation process is still ongoing, and we cannot yet predict the ultimate effect of the rules and regulations on our business.
The Dodd-Frank Act expanded the types of entities that are required to register with the CFTC and the SEC as a result of their activities in the derivatives markets or otherwise become specifically qualified to enter into derivatives contracts. We will be
53
required to assess our activities in the derivatives markets, and to monitor such activities on an ongoing basis, to ascertain and to identify any potential change in our regulatory status.
Reporting and recordkeeping requirements also could significantly increase operating costs and expose us to penalties for non-compliance, and require additional compliance resources. Added public transparency as a result of the reporting rules may also have a negative effect on market liquidity which could also negatively impact commodity prices and our ability to hedge.
In October 2011, the CFTC has also issued regulations to set position limits for certain futures and option contracts in the major energy markets and for swaps that are their economic equivalents. However, in September 2012, the CFTC’s position limits rules were vacated by the U.S. District Court for the District of Columbia. In November 2013, the CFTC proposed new rules that would place limits on positions in certain core futures and equivalent swaps contracts for or linked to certain physical commodities, subject to exceptions for certain bona fide hedging transactions. As these new position limit rules are not yet final, the impact of those provisions on us is uncertain at this time.
The CFTC has designated certain interest rate swaps and credit default swaps for mandatory clearing and exchange trading. The associated rules require us, in connection with covered derivative activities, to comply with such requirements or take steps to qualify for an exemption to such requirements. We must obtain approval from the board of directors of our General Partner and make certain filings in order to rely on the end-user exception from the mandatory clearing requirements for swaps entered into to hedge our commercial risks. The application of mandatory clearing and trade execution requirements to other market participants, such as swap dealers, may change the cost and availability of the swaps that we use for hedging. The CFTC has not yet proposed rules designating any other classes of swaps, including physical commodity swaps, for mandatory clearing and exchange trading.
In addition, the Dodd-Frank Act requires that regulators establish margin rules for uncleared swaps. The application of such requirements to other market participants, such as swap dealers, may change the cost and availability of the swaps we use for hedging. If any of our swaps do not qualify for the commercial end-user exception, posting of collateral could impact our liquidity and reduce cash available to us for capital expenditures, reducing our ability to execute hedges to reduce risk and protect cash flow.
Rules promulgated under the Dodd-Frank Act further defined forwards as well as instances where forwards may become swaps. Because the CFTC rules, interpretations, no-action letters, and case law are still developing, it is possible that some arrangements that previously qualified as forwards or energy service contracts may fall in the regulatory category of swaps or options. In addition, the CFTC’s rules applicable to trade options may further impose burdens on our ability to conduct our traditional hedging operations and could become subject to CFTC investigations in the future.
The new legislation and any new regulations could significantly increase the cost of derivative contracts, materially alter the terms of derivative contracts, reduce the availability of derivatives to protect against risks we encounter, or reduce our ability to monetize or restructure existing derivative contracts. If we reduce our use of derivatives as a result of the legislation and regulations, our results of operations may become more volatile and our cash flows may be less predictable. Finally, if we fail to comply with applicable laws, rules or regulations, we may be subject to fines, cease-and-desist orders, civil and criminal penalties or other sanctions.
A natural disaster, catastrophe or other event could result in severe personal injury, property damage and environmental damage, which could curtail ETP’s and Regency’s operations and otherwise materially adversely affect their cash flow.
Some of ETP’s and Regency’s operations involve risks of personal injury, property damage and environmental damage, which could curtail its operations and otherwise materially adversely affect its cash flow. For example, natural gas facilities operate at high pressures, sometimes in excess of 1,100 pounds per square inch. Virtually all of ETP’s and Regency’s operations are exposed to potential natural disasters, including hurricanes, tornadoes, storms, floods and/or earthquakes.
If one or more facilities that are owned by ETP or Regency or that deliver natural gas or other products to ETP or Regency are damaged by severe weather or any other disaster, accident, catastrophe or event, ETP’s or Regency’s operations could be significantly interrupted. Similar interruptions could result from damage to production or other facilities that supply ETP’s or Regency’s facilities or other stoppages arising from factors beyond its control. These interruptions might involve significant damage to people, property or the environment, and repairs might take from a week or less for a minor incident to six months or more for a major interruption. Any event that interrupts the revenues generated by ETP’s or Regency’s operations, or which causes it to make significant expenditures not covered by insurance, could reduce ETP’s or Regency’s cash available for paying distributions to its Unitholders, including us.
As a result of market conditions, premiums and deductibles for certain insurance policies can increase substantially, and in some instances, certain insurance may become unavailable or available only for reduced amounts of coverage. As a result, ETP and Regency may not be able to renew existing insurance policies or procure other desirable insurance on commercially reasonable
54
terms, if at all. If ETP or Regency were to incur a significant liability for which it was not fully insured, it could have a material adverse effect on ETP’s or Regency’s financial position and results of operations, as applicable. In addition, the proceeds of any such insurance may not be paid in a timely manner and may be insufficient if such an event were to occur.
Terrorist attacks aimed at our facilities could adversely affect its business, results of operations, cash flows and financial condition.
The United States government has issued warnings that energy assets, including the nation’s pipeline infrastructure, may be the future target of terrorist organizations. Some of our facilities are subject to standards and procedures required by the Chemical Facility Anti-Terrorism Standards. We believe we are in compliance with all material requirements; however, such compliance may not prevent a terrorist attack from causing material damage to our facilities or pipelines. Any such terrorist attack on ETP’s or Regency’s facilities or pipelines, those of their customers, or in some cases, those of other pipelines could have a material adverse effect on ETP’s or Regency’s business, financial condition and results of operations.
Cybersecurity breaches and other disruptions could compromise our information and expose us to liability, which would cause our business and reputation to suffer.
In the ordinary course of our business, we collect and store sensitive data, including intellectual property, our proprietary business information and that of our customers, suppliers and business partners, and personal identification information of our employees, in our data centers and on our networks. The secure processing, maintenance and transmission of this information is critical to our operations and business strategy. Despite our security measures, our information technology and infrastructure may be vulnerable to attacks by hackers or breached due to employee error, malfeasance or other disruptions. Any such breach could compromise our networks and the information stored there could be accessed, publicly disclosed, lost or stolen. Any such access, disclosure or other loss of information could result in legal claims or proceedings, liability under laws that protect the privacy of personal information, regulatory penalties, disruption of our operations, damage to our reputation, and cause a loss of confidence in our products and services, which could adversely affect our business.
Additional deepwater drilling laws and regulations, delays in the processing and approval of drilling permits and exploration and oil spill-response plans, and other related restrictions arising after the Deepwater Horizon incident in the Gulf of Mexico may have a material adverse effect on our business, financial condition, or results of operations.
In response to the Deepwater Horizon incident and resulting oil spill in the United States Gulf of Mexico in 2010, the federal Bureau of Ocean Energy Management and the federal Bureau of Safety and Environmental Enforcement, each agencies of the U.S. Department of the Interior, have imposed new and more stringent permitting procedures and regulatory safety and performance requirements for new wells to be drilled in federal waters. These governmental agencies have implemented and enforced new rules, Notices to Lessees and Operators and temporary drilling moratoria that imposed safety and operational performance measures on exploration, development and production operators in the Gulf of Mexico or otherwise resulted in a temporary cessation of drilling activities. Compliance with these added and more stringent regulatory restrictions in addition to any uncertainties or inconsistencies in current decisions and rulings by governmental agencies and delays in the processing and approval of drilling permits and exploration, development and oil spill-response plans could adversely affect or delay new drilling and ongoing development efforts. Moreover, these governmental agencies are continuing to evaluate aspects of safety and operational performance in the Gulf of Mexico and, as a result, developing and implementing new, more restrictive requirements. One example is the 2013 amendments to the federal Workplace Safety Rule regarding the utilization of a more comprehensive SEMS, which amended rule is sometimes referred to as SEMS II. A second, and more recent, example is the August 2014 Advanced Notice of Proposed Rulemaking that ultimately seeks to bolster the offshore financial assurance and bonding program. Among other adverse impacts, these additional measures could delay or disrupt our and our customers’ operations, increase the risk of expired leases due to the time required to develop new technology, result in increased supplemental bonding requirements and incurrence of associated added costs, limit operational activities in certain areas, or cause us or out customers to incur penalties, fines, or shut-in production. If similar material spill incidents were to occur in the future, the United States could elect to again issue directives to temporarily cease drilling activities and, in any event, may from time to time issue further safety and environmental laws and regulations regarding offshore oil and natural gas exploration, development and production. We cannot predict with any certainty the full impact of any new laws or regulations on our customers’ drilling operations or on the cost or availability of insurance to cover some or all of the risks associated with such operations. The occurrence of any of these developments has the potential to adversely impact our business as well as our financial position, results of operation and liquidity.
55
Our business is subject to federal, state and local laws and regulations that govern the product quality specifications of the petroleum products that we store and transport.
The petroleum products that we store and transport through Sunoco Logistics’ operations are sold by our customers for consumption into the public market. Various federal, state and local agencies have the authority to prescribe specific product quality specifications to commodities sold into the public market. Changes in product quality specifications could reduce our throughput volume, require us to incur additional handling costs or require the expenditure of significant capital. In addition, different product specifications for different markets impact the fungibility of products transported and stored in our pipeline systems and terminal facilities and could require the construction of additional storage to segregate products with different specifications. We may be unable to recover these costs through increased revenues.
In addition, our butane blending services are reliant upon gasoline vapor pressure specifications. Significant changes in such specifications could reduce butane blending opportunities, which would affect our ability to market our butane blending service licenses and which would ultimately affect our ability to recover the costs incurred to acquire and integrate our butane blending assets.
Our business could be affected adversely by union disputes and strikes or work stoppages by Panhandle’s and Sunoco, Inc.’s unionized employees.
As of
December 31, 2014
, approximately
6%
of our workforce is covered by a number of collective bargaining agreements with various terms and dates of expiration. There can be no assurances that Panhandle or Sunoco, Inc. will not experience a work stoppage in the future as a result of labor disagreements. Any work stoppage could, depending on the affected operations and the length of the work stoppage, have a material adverse effect on our business, financial position, results of operations or cash flows.
Governmental regulations and policies, particularly in the areas of taxation, energy and the environment, have a significant impact on our retail marketing business.
Federally mandated standards for use of renewable biofuels, such as ethanol and biodiesel in the production of refined products, are transforming traditional gasoline and diesel markets in North America. These regulatory mandates present production and logistical challenges for both the petroleum refining and ethanol industries, and may require us to incur additional capital expenditures or expenses particularly in our retail marketing business. We may have to enter into arrangements with other parties to meet our obligations to use advanced biofuels, with potentially uncertain supplies of these new fuels. If we are unable to obtain or maintain sufficient quantities of ethanol to support our blending needs, our sale of ethanol blended gasoline could be interrupted or suspended which could result in lower profits. There also will be compliance costs related to these regulations. We may experience a decrease in demand for refined petroleum products due to new federal requirements for increased fleet mileage per gallon or due to replacement of refined petroleum products by renewable fuels. In addition, tax incentives and other subsidies making renewable fuels more competitive with refined petroleum products may reduce refined petroleum product margins and the ability of refined petroleum products to compete with renewable fuels. A structural expansion of production capacity for such renewable biofuels could lead to significant increases in the overall production, and available supply, of gasoline and diesel in markets that we supply. In addition, a significant shift by consumers to more fuel-efficient vehicles or alternative fuel vehicles (such as ethanol or wider adoption of gas/electric hybrid vehicles), or an increase in vehicle fuel economy, whether as a result of technological advances by manufacturers, legislation mandating or encouraging higher fuel economy or the use of alternative fuel, or otherwise, also could lead to a decrease in demand, and reduced margins, for the refined petroleum products that we market and sell.
It is possible that any, or a combination, of these occurrences could have a material adverse effect on Sunoco, Inc.’s business or results of operations.
We have outsourced various functions related to our retail marketing business to third-party service providers, which decreases our control over the performance of these functions. Disruptions or delays of our third-party outsourcing partners could result in increased costs, or may adversely affect service levels. Fraudulent activity or misuse of proprietary data involving our outsourcing partners could expose us to additional liability.
Sunoco, Inc. has previously outsourced various functions related to our retail marketing business to third parties and expects to continue this practice with other functions in the future.
While outsourcing arrangements may lower our cost of operations, they also reduce our direct control over the services rendered. It is uncertain what effect such diminished control will have on the quality or quantity of products delivered or services rendered, on our ability to quickly respond to changing market conditions, or on our ability to ensure compliance with all applicable domestic and foreign laws and regulations. We believe that we conduct appropriate due diligence before entering into agreements with our outsourcing partners. We rely on our outsourcing partners to provide services on a timely and effective basis. Although we continuously monitor the performance of these third parties and maintain contingency plans in case they are unable to perform as
56
agreed, we do not ultimately control the performance of our outsourcing partners. Much of our outsourcing takes place in developing countries and, as a result, may be subject to geopolitical uncertainty. The failure of one or more of our third-party outsourcing partners to provide the expected services on a timely basis at the prices we expect, or as required by contract, due to events such as regional economic, business, environmental or political events, information technology system failures, or military actions, could result in significant disruptions and costs to our operations, which could materially adversely affect our business, financial condition, operating results and cash flow.
Our failure to generate significant cost savings from these outsourcing initiatives could adversely affect our profitability and weaken Sunoco, Inc.’s competitive position. Additionally, if the implementation of our outsourcing initiatives is disruptive to our retail marketing business, we could experience transaction errors, processing inefficiencies, and the loss of sales and customers, which could cause our business and results of operations to suffer.
As a result of these outsourcing initiatives, more third parties are involved in processing our retail marketing information and data. Breaches of security measures or the accidental loss, inadvertent disclosure or unapproved dissemination of proprietary information or sensitive or confidential data about our retail marketing business or our clients, including the potential loss or disclosure of such information or data as a result of fraud or other forms of deception, could expose us to a risk of loss or misuse of this information, result in litigation and potential liability for us, lead to reputational damage to the Sunoco, Inc. brand, increase our compliance costs, or otherwise harm our business.
Our operations could be disrupted if our information systems fail, causing increased expenses and loss of sales.
Our business is highly dependent on financial, accounting and other data processing systems and other communications and information systems, including our enterprise resource planning tools. We process a large number of transactions on a daily basis and rely upon the proper functioning of computer systems. If a key system was to fail or experience unscheduled downtime for any reason, even if only for a short period, our operations and financial results could be affected adversely. Our systems could be damaged or interrupted by a security breach, fire, flood, power loss, telecommunications failure or similar event. We have a formal disaster recovery plan in place, but this plan may not entirely prevent delays or other complications that could arise from an information systems failure. Our business interruption insurance may not compensate us adequately for losses that may occur.
Security breaches and other disruptions could compromise our information and operations, and expose us to liability, which would cause our business and reputation to suffer.
In the ordinary course of our business, we collect and store sensitive data, including intellectual property, our proprietary business information and that of our customers, suppliers and business partners, and personally identifiable information of our employees, in our data centers and on our networks. The secure processing, maintenance and transmission of this information is critical to our operations and business strategy. Despite our security measures, our information technology and infrastructure may be vulnerable to attacks by hackers or breached due to employee error, malfeasance or other disruptions. Any such breach could compromise our networks and the information stored there could be accessed, publicly disclosed, lost or stolen. Any such access, disclosure or other loss of information could result in legal claims or proceedings, liability under laws that protect the privacy of personal information, regulatory penalties for divulging shipper information, disruption of our operations, damage to our reputation, and loss of confidence in our products and services, which could adversely affect our business.
Our information technology infrastructure is critical to the efficient operation of our business and essential to our ability to perform day-today operations. Breaches in our information technology infrastructure or physical facilities, or other disruptions, could result in damage to our assets, safety incidents, damage to the environment, potential liability or the loss of contracts, and have a material adverse effect on our operations, financial position and results of operations.
The costs of providing pension and other postretirement health care benefits and related funding requirements are subject to changes in pension fund values, changing demographics and fluctuating actuarial assumptions and may have a material adverse effect on our financial results. In addition, the passage of the Health Care Reform Act in 2010 could significantly increase the cost of providing health care benefits for employees.
Certain of our subsidiaries provide pension plan and other postretirement healthcare benefits to certain of their employees. The costs of providing pension and other postretirement health care benefits and related funding requirements are subject to changes in pension and other postretirement fund values, changing demographics and fluctuating actuarial assumptions that may have a material adverse effect on the Partnership’s future consolidated financial results. In addition, the passage of the Health Care Reform Act of 2010 could significantly increase the cost of health care benefits for our employees. While certain of the costs incurred in providing such pension and other postretirement healthcare benefits are recovered through the rates charged by the Partnership’s regulated businesses, the Partnership’s subsidiaries may not recover all of the costs and those rates are generally not immediately responsive to current market conditions or funding requirements. Additionally, if the current cost recovery mechanisms are changed or eliminated, the impact of these benefits on operating results could significantly increase.
57
Regency’s contract compression operations depend on particular suppliers and is vulnerable to parts and equipment shortages and price increases, which could have a negative impact on its results of operations.
The principal manufacturers of components for Regency’s natural gas compression equipment include Caterpillar, Inc. for engines, Air-X-Changers for coolers, and Ariel Corporation for compressors and frames. Regency’s reliance on these suppliers involves several risks, including price increases and a potential inability to obtain an adequate supply of required components in a timely manner. Regency also relies primarily on two vendors, Spitzer Industries Corp. and Standard Equipment Corp., to package and assemble its compression units. Regency does not have long-term contracts with these suppliers or packagers, and a partial or complete loss of certain of these sources could have a negative impact on Regency’s results of operations and could damage its customer relationships. In addition, since Regency expects any increase in component prices for compression equipment or packaging costs will be passed on to Regency, a significant increase in their pricing could have a negative impact on Regency’s results of operations.
Mergers among Sunoco Logistics’ customers and competitors could result in lower volumes being shipped on its pipelines or products stored in or distributed through its terminals, or reduced crude oil marketing margins or volumes.
Mergers between existing customers could provide strong economic incentives for the combined entities to utilize their existing systems instead of Sunoco Logistics’ systems in those markets where the systems compete. As a result, Sunoco Logistics could lose some or all of the volumes and associated revenues from these customers and could experience difficulty in replacing those lost volumes and revenues, which could materially and adversely affect our results of operations, financial position, or cash flows.
A portion of Sunoco Logistics’ general and administrative services have been outsourced to third-party service providers. Fraudulent activity or misuse of proprietary data involving its outsourcing partners could expose us to additional liability.
Sunoco Logistics utilizes both affiliate entities and third parties in the processing of its information and data. Breaches of its security measures or the accidental loss, inadvertent disclosure or unapproved dissemination of proprietary information or sensitive or confidential data about Sunoco Logistics or its customers, including the potential loss or disclosure of such information or data as a result of fraud or other forms of deception, could expose Sunoco Logistics to a risk of loss or misuse of this information, result in litigation and potential liability for Sunoco Logistics, lead to reputational damage, increase compliance costs, or otherwise harm its business.
A material decrease in demand or distribution of crude oil available for transport through Sunoco Logistics’ pipelines or terminal facilities could materially and adversely affect our results of operations, financial position, or cash flows.
The volume of crude oil transported through Sunoco Logistics’ crude oil pipelines and terminal facilities depends on the availability of attractively priced crude oil produced or received in the areas serviced by its assets. A period of sustained crude oil price declines could lead to a decline in drilling activity, production and import levels in these areas. Similarly, a period of sustained increases in the price of crude oil supplied from any of these areas, as compared to alternative sources of crude oil available to Sunoco Logistics’ customers, could materially reduce demand for crude oil in these areas. In either case, the volumes of crude oil transported in Sunoco Logistics’ crude oil pipelines and terminal facilities could decline, and it could likely be difficult to secure alternative sources of attractively priced crude oil supply in a timely fashion or at all. If Sunoco Logistics is unable to replace any significant volume declines with additional volumes from other sources, our results of operations, financial position, or cash flows could be materially and adversely affected.
LCL is dependent on project financing to fund the costs necessary to construct the liquefaction project. If project financing is unavailable to supply the funding necessary to complete the liquefaction project, LCL may not be able to secure alternative funding and FID may not be achieved.
LCL, an entity owned 60% by ETE and 40% by ETP, is in the process of developing a proposed liquefaction project in conjunction with BG Group plc (“BG”) pursuant to a project development agreement entered into in September 2013. Pursuant to this agreement, each of LCL and BG are obligated to pay 50% of the development expenses for the liquefaction project, subject to reimbursement by the other party if such party withdraws from the project prior to both parties making a final investment decision (“FID”) to become irrevocably obligated to fully develop the project, subject to certain exceptions. Through December 31, 2014, LCL had incurred
$75 million
of development costs associated with the liquefaction project that were funded by ETE and ETP, and ETE and ETP have indicated that they intend to provide the funding necessary for the remaining development costs, but they have no obligation to do so. If ETE and ETP are unwilling or unable to provide funding to LCL for its share of the remaining development costs, or if BG is unwilling or unable to provide funding for its share of the remaining development costs, the liquefaction project could be delayed or cancelled.
58
The liquefaction project is subject to the right of each of LCL and BG to withdraw from the project in its sole discretion at any time prior to an affirmative FID.
The project development agreement provides that either LCL or BG may withdraw from the liquefaction project at any time prior to each party making an affirmative FID. LCL’s determination of whether to reach an affirmative FID is expected to be based upon a number of factors, including the expected cost to construct the liquefaction facility, the expected revenue to be generated by LCL pursuant to the terms of the liquefaction services agreement anticipated to be entered into between LCL and BG in connection with both parties reaching an affirmative FID, and the terms and conditions of the financing for the construction of the liquefaction facility. BG’s determination of whether to reach an affirmative FID is expected be based on a number of factors, including the expected tolling charges it would be required to pay under the terms of the liquefaction services agreement, the costs anticipated to be incurred by BG to purchase natural gas for delivery to the liquefaction facility, the costs to transport natural gas to the liquefaction facility, the costs to operate the liquefaction facility and the costs to transport LNG from the liquefaction facility to customers in foreign markets (particularly Europe and Asia) over the expected 25-year term of the liquefaction services agreement. As the tolling charges payable to LCL under the liquefaction services agreement are anticipated to be based on a rate of return formula tied to the construction costs for the liquefaction facility, these costs are anticipated to also have a significant bearing with respect to BG’s determination whether to reach an affirmative FID. As these costs fluctuate based on a variety of factors, including supply and demand factors affecting the price of natural gas in the United States, supply and demand factors affecting the price of LNG in foreign markets, supply and demand factors affecting the costs for construction services for large infrastructure projects in the United States, and general economic conditions, there can be no assurance that both LCL and BG will reach an affirmative FID to construct the liquefaction facility.
The construction of the liquefaction project remains subject to further approvals and some approvals may be subject to further conditions, review and/or revocation.
The liquefaction project remains subject to (i) the receipt of approval by the FERC to construct and operate the facilities, (ii) approvals and permits from the U.S. Army Corps of Engineers (“USACE”) for wetlands mitigation and permanent and temporary marine dock modifications and dredging at the Lake Charles LNG facility and (iii) other governmental and regulatory approvals and permits, including air permits under the Clean Air Act. Furthermore, while a subsidiary of BG has received authorization from the DOE to export LNG to non-FTA countries, the non-FTA authorization is subject to review, and the DOE may impose additional approval and permit requirements in the future or revoke the non-FTA authorization should the DOE conclude that such export authorization is inconsistent with the public interest. Certain of the permits and approvals must be obtained before construction on the liquefaction project can begin and are still under review by state and federal authorities. We do not know whether or when any such approvals or permits can be obtained, or whether any existing or potential interventions or other actions by third parties will interfere with its ability to obtain and maintain such permits or approvals. The failure by LCL to timely receive and maintain the remaining approvals necessary to complete and operate the liquefaction project could have a material adverse effect on its operations and financial condition.
Tax Risks to Common Unitholders
Our tax treatment depends on our continuing status as a partnership for federal income tax purposes, as well as our not being subject to a material amount of additional entity-level taxation by individual states. If the IRS were to treat us, ETP or Regency as a corporation for federal income tax purposes or if we, ETP or Regency become subject to a material amount of entity-level taxation for state tax purposes, then our cash available for distribution would be substantially reduced.
The anticipated after-tax economic benefit of an investment in our Common Units depends largely on our being treated as a partnership for federal income tax purposes. We have not requested, and do not plan to request, a ruling from the IRS on this matter. The value of our investments in ETP and Regency depends largely on ETP and Regency being treated as partnerships for federal income tax purposes.
Despite the fact that we, ETP and Regency are each a limited partnership under Delaware law, we would each be treated as a corporation for federal income tax purposes unless we satisfy a “qualifying income” requirement. Based upon our current operations, we believe we, ETP and Regency satisfy the qualifying income requirement. Failing to meet the qualifying income requirement or a change in current law could cause us, ETP or Regency to be treated as a corporation for federal income tax purposes or otherwise subject us, ETP or Regency to taxation as an entity.
If we, ETP or Regency were treated as a corporation, we would pay federal income tax on our taxable income at the corporate tax rate, which is currently a maximum of 35%, and we would likely pay additional state income taxes at varying rates. Distributions to Unitholders would generally be taxed again as corporate distributions, and none of our income, gains, losses or deductions would flow through to Unitholders. Because a tax would then be imposed upon us as a corporation, our cash available for distribution to Unitholders would be substantially reduced. Therefore, treatment of us as a corporation would result in a material
59
reduction in the anticipated cash flow and after-tax return to the Unitholders, likely causing a substantial reduction in the value of our Common Units.
Our partnership agreement provides that if a law is enacted or existing law is modified or interpreted in a manner that subjects us to taxation as a corporation or to additional taxation as an entity for federal, state or local income tax purposes, the minimum quarterly distribution amount and the target distribution amounts may be adjusted to reflect the impact of that law on us. At the state level, several states have been evaluating ways to subject partnerships to entity-level taxation through the imposition of state income, franchise, or other forms of taxation. Imposition of a similar tax on us in the jurisdictions in which we operate or in other jurisdictions to which we may expand could substantially reduce our case available for distribution to our unitholders.
The tax treatment of publicly traded partnerships or an investment in ETP or Regency’s common units could be subject to potential legislative, judicial or administrative changes and differing interpretations, possibly on a retroactive basis.
The present federal income tax treatment of publicly traded partnerships, including us, or an investment in ETP or Regency’s common units may be modified by legislative, judicial or administrative changes and differing interpretations at any time. For example, the Obama administration’s budget proposal for fiscal year 2016 recommends that certain publicly traded partnerships earning income from activities related to fossil fuels be taxed as corporations beginning in 2021. From time to time, members of Congress propose and consider substantive changes to the existing federal income tax laws that affect publicly traded partnerships. If successful, the Obama administration’s proposal or other similar proposals could eliminate the qualifying income exception to the treatment of all publicly traded partnerships as corporations upon which we rely for our, ETP’s and Regency’s treatment as a partnership for U.S. federal income tax purposes. Any modification to the U.S. federal income tax laws may be applied retroactively and could make it more difficult or impossible for us to meet the exception for certain publicly traded partnerships to be treated as partnerships for U.S. federal income tax purposes. We are unable to predict whether any of these changes or other proposals will ultimately be enacted. Any such changes could negatively impact the value of an investment in our common units.
The tax treatment of Sunoco Logistics depends on its status as a partnership for federal income tax purposes, as well as its not being subject to a material amount of entity-level taxation by individual states. If the IRS were to treat Sunoco Logistics as a corporation for federal income tax purposes or if it were to become subject to a material amount of entity-level taxation for state tax purposes, it would substantially reduce the amount of cash available for distribution to its unitholders.
The anticipated after-tax economic benefit of our investment in the common units of Sunoco Logistics depends largely on Sunoco Logistics being treated as a partnership for federal income tax purposes. Sunoco Logistics has not requested, and does not plan to request, a ruling from the IRS on this matter. The IRS may adopt positions that differ from the ones Sunoco Logistics has taken. A successful IRS contest of the federal income tax positions Sunoco Logistics takes may impact adversely the market for its common units, and the costs of any IRS contest will reduce Sunoco Logistics’ cash available for distribution to its unitholders. If Sunoco Logistics were to be treated as a corporation for federal income tax purposes, it would pay federal income tax at the corporate tax rate, and likely would pay state income tax at varying rates. Distributions to its unitholders generally would be subject to tax again as corporate distributions. Treatment of Sunoco Logistics as a corporation would result in a material reduction in its anticipated cash flow and after-tax return to its unitholders. Current law may change so as to cause Sunoco Logistics to be treated as a corporation for federal income tax purposes or to otherwise subject it to a material amount of entity-level taxation. States are evaluating ways to subject partnerships to entity level taxation through the imposition of state income, franchise and other forms of taxation. If any states were to impose a tax on Sunoco Logistics, the cash available for distribution to its unitholders would be reduced.
As discussed above, the present federal income tax treatment of publicly traded partnerships, including Sunoco Logistics, or our investment in its common units, may be modified by administrative, legislative or judicial interpretation at any time. Any modification to the federal income tax laws and interpretations thereof may or may not be applied retroactively. Moreover, any such modification could make it more difficult or impossible for Sunoco Logistics to meet the exception which allows publicly traded partnerships that generate qualifying income to be treated as partnerships (rather than corporations) for U.S. federal income tax purposes, affect or cause Sunoco Logistics to change its business activities, or affect the tax consequences of our investment in Sunoco Logistics’ common units. Any such changes could negatively impact the value of our investment in Sunoco Logistics’ common units.
If the IRS contests the federal income tax positions we or our subsidiaries take, the market for our Common Units, ETP Common Units or Regency Common Units may be adversely affected and the costs of any such contest will reduce cash available for distributions to our Unitholders.
Neither we nor our subsidiaries have requested a ruling from IRS with respect to our treatment as partnerships for federal income tax purposes. The IRS may adopt positions that differ from the positions we or our subsidiaries take. It may be necessary to resort to administrative or court proceedings to sustain some or all of the positions we or our subsidiaries take. A court may not agree with some or all of the positions we or our subsidiaries take. Any contest with the IRS may materially and adversely impact the
60
market for our Common Units, ETP’s Common Units or Regency’s Common Units and the prices at which they trade. In addition, the costs of any contest with the IRS will be borne by us or our subsidiaries, and therefore indirectly by us, as a Unitholder and as the owner of the general partner of interests in ETP and Regency, reducing the cash available for distribution to our Unitholders.
Unitholders may be required to pay taxes on their share of our income even if they do not receive any cash distributions from us.
Unitholders will be required to pay any federal income taxes and, in some cases, state and local income taxes on their share of our taxable income even if they receive no cash distributions from us. Unitholders may not receive cash distributions from us equal to their share of our taxable income or even equal to the actual tax liability that results from the taxation of their share of our taxable income.
Tax gain or loss on disposition of our Common Units could be more or less than expected.
If Unitholders sell their Common Units, they will recognize a gain or loss equal to the difference between the amount realized and the tax basis in those Common Units. Because distributions in excess of the Unitholder’s allocable share of our net taxable income result in a decrease in the Unitholder’s tax basis in their Common Units, the amount, if any, of such prior excess distributions with respect to the units sold will, in effect, become taxable income to the Unitholder if they sell such units at a price greater than their adjusted tax basis in those units, even if the price received is less than their original cost. Furthermore, a substantial portion of the amount realized, whether or not representing gain, may be taxed as ordinary income due to potential recapture of depreciation deductions and certain other items. In addition, because the amount realized includes a Unitholder’s share of our nonrecourse liabilities, if a Unitholder sells units, the Unitholders may incur a tax liability in excess of the amount of cash received from the sale.
Tax-exempt entities and non-U.S. persons face unique tax issues from owning Common Units that may result in adverse tax consequences to them.
Investment in Common Units by tax-exempt entities, including employee benefit plans and individual retirement accounts (known as IRAs) and non-U.S. persons raises issues unique to them. For example, virtually all of our income allocated to Unitholders who are organizations exempt from federal income tax, including IRAs and other retirement plans, will be “unrelated business taxable income” and will be taxable to them. Allocations and/or distributions to non-U.S. persons will be reduced by withholding taxes, imposed at the highest effective tax rate applicable to non-U.S. persons, and each non-U.S. person will be required to file United States federal and state income tax returns and pay tax on their share of our taxable income. If you are a tax exempt entity or non-U.S. person, you should consult your tax advisor before investing in our common units.
We have subsidiaries that will be treated as corporations for federal income tax purposes and subject to corporate-level income taxes.
Even though we (as a partnership for U.S. federal income tax purposes) are not subject to U.S. federal income tax, some of our operations are conducted through subsidiaries that are organized as corporations for U.S. federal income tax purposes. The taxable income, if any, of subsidiaries that are treated as corporations for U.S. federal income tax purposes, is subject to corporate-level U.S. federal income taxes, which may reduce the cash available for distribution to us and, in turn, to our unitholders. If the IRS or other state or local jurisdictions were to successfully assert that these corporations have more tax liability than we anticipate or legislation was enacted that increased the corporate tax rate, the cash available for distribution could be further reduced. The income tax return filings positions taken by these corporate subsidiaries require significant judgment, use of estimates, and the interpretation and application of complex tax laws. Significant judgment is also required in assessing the timing and amounts of deductible and taxable items. Despite our belief that the income tax return positions taken by these subsidiaries are fully supportable, certain positions may be successfully challenged by the IRS, state or local jurisdictions.
We treat each purchaser of Common Units as having the same tax benefits without regard to the actual Common Units purchased. The IRS may challenge this treatment, which could result in a Unitholder owing more tax and may adversely affect the value of the Common Units.
Because we cannot match transferors and transferees of Common Units and because of other reasons, we will adopt depreciation, depletion and amortization positions that may not conform to all aspects of existing Treasury Regulations. A successful IRS challenge to those positions could adversely affect the amount of tax benefits available to our Unitholders. It also could affect the timing of these tax benefits or the amount of gain from the sale of Common Units and could have a negative impact on the value of our Common Units or result in audit adjustments to tax returns of our Unitholders. Moreover, because we have subsidiaries that are organized as C corporations for federal income tax purposes owns units in us, a successful IRS challenge could result in this subsidiary having a greater tax liability than we anticipate and, therefore, reduce the cash available for distribution to our partnership and, in turn, to our Unitholders.
61
We prorate our items of income, gain, loss and deduction between transferors and transferees of our units each month based upon the ownership of our units on the first day of each month, instead of on the basis of the date a particular unit is transferred. The IRS may challenge this treatment, which could change the allocation of items of income, gain, loss and deduction among our Unitholders.
We generally prorate our items of income, gain, loss and deduction between transferors and transferees of our units each month based upon the ownership of our units on the first day of each month, instead of on the basis of the date a particular unit is transferred. The use of this proration method may not be permitted under existing Treasury Regulations. Recently, however, the Department of the Treasury and the IRS issued proposed Treasury Regulations that provide a safe harbor pursuant to which a publicly traded partnership may use a similar monthly simplifying convention to allocate tax items among transferor and transferee unitholders. Nonetheless, the proposed regulations do not specifically authorize the use of the proration method we have adopted. If the IRS were to challenge our proration method or new Treasury Regulations were issued, we may be required to change the allocation of items of income, gain, loss and deduction among our unitholders.
A Unitholder whose units are the subject of a securities loan (e.g. a loan to a “short seller”) to cover a short sale of units may be considered as having disposed of those units. If so, the Unitholder would no longer be treated for tax purposes as a partner with respect to those units during the period of the loan and may recognize gain or loss from the disposition.
Because there are no specific rules governing the federal income tax consequences of loaning a partnership interest, a Unitholder whose units are the subject of a securities loan may be considered as having disposed of the loaned units. In that case, the Unitholder may no longer be treated for tax purposes as a partner with respect to those units during the period of the loan and may recognize gain or loss from such disposition. Moreover, during the period of the loan, any of our income, gain, loss or deduction with respect to those units may not be reportable by the Unitholder and any cash distributions received by the Unitholder as to those units could be fully taxable as ordinary income. Unitholders desiring to assure their status as partners and avoid the risk of gain recognition from a loan of their units are urged to modify any applicable brokerage account agreements to prohibit their brokers from borrowing their units.
ETP and Regency have adopted certain valuation methodologies in determining unitholder’s allocations of income, gain, loss and deduction. The IRS may challenge these methods or the resulting allocations, and such a challenge could adversely affect the value of ETP’s or Regency’s Common Units and our Common Units.
In determining the items of income, gain, loss and deduction allocable to our, ETP’s or Regency’s unitholders, we must routinely determine the fair market value of our respective assets. Although we may from time to time consult with professional appraisers regarding valuation matters, we make many fair market value estimates using a methodology based on the market value of our, ETP’s or Regency’s common units as a means to measure the fair market value of our respective assets. The IRS may challenge these valuation methods and the resulting allocations of income, gain, loss and deduction.
A successful IRS challenge to these methods or allocations could adversely affect the amount, character, and timing of taxable income or loss being allocated to our Unitholders, the ETP Unitholders or the Regency Unitholders. It also could affect the amount of gain on the sale of Common Units by our Unitholders, ETP’s Unitholders or Regency’s Unitholders and could have a negative impact on the value of our Common Units or those of ETP or Regency or result in audit adjustments to the tax returns of our, ETP’s or Regency’s Unitholders without the benefit of additional deductions.
The sale or exchange of 50% or more of our capital and profits interests during any twelve month period will result in the termination of our partnership for federal income tax purposes.
We will be considered to have technically terminated as a partnership for federal income tax purposes if there is a sale or exchange of 50% or more of the total interests in our capital and profits within a twelve-month period. For purposes of determining whether the 50% threshold has been met, multiple sales of the same unit during the applicable twelve-month period will be counted only once. Our technical termination would, among other things, result in the closing of our taxable year for all Unitholders which would require us to file two federal partnership tax returns (and our Unitholders could receive two Schedules K-1 if relief was not available, as described below) for one fiscal year, and could result in a deferral of depreciation deductions allowable in computing our taxable income. In the case of a Unitholder reporting on a taxable year other than a calendar year, the closing of our taxable year may also result in more than twelve months of our taxable income or loss being includable in such Unitholder’s taxable income for the year of termination. A technical termination currently would not affect our classification as a partnership for federal income tax purposes. We would be treated as a new partnership for tax purposes on the technical termination date, and would be required to make new tax elections and could be subject to penalties if we were unable to determine in a timely manner that a termination occurred. The IRS has recently announced a relief procedure whereby a publicly traded partnership that has technically terminated may be permitted to provide only a single Schedule K-1 to unitholders for the two tax years within the fiscal year in which the termination occurs.
62
Unitholders will likely be subject to state and local taxes and return filing requirements in states where they do not live as a result of investing in our Common Units.
In addition to federal income taxes, the Unitholders may be subject to other taxes, including state and local taxes, unincorporated business taxes and estate, inheritance or intangible taxes that are imposed by the various jurisdictions in which we, ETP or Regency conduct business or own property now or in the future, even if they do not live in any of those jurisdictions. We currently own property or conduct business in many states, most of which impose an income tax on individuals, corporations and other entities. As we make acquisitions or expand our business, we may control assets or conduct business in additional states that impose a personal or corporate income tax. Unitholders may be required to file state and local income tax returns and pay state and local income taxes in some or all of the jurisdictions. Further, Unitholders may be subject to penalties for failure to comply with those requirements. It is the responsibility of each Unitholder to file all federal, state and local tax returns.
Risks Related to ETP’s Pending Acquisition of Regency
The completion of the Regency Merger is subject to the satisfaction of certain conditions to closing, and the date that the Regency Merger would be consummated is uncertain.
The completion of the Regency Merger is subject to the absence of a material adverse change to the business or results of operation of ETP and Regency, the receipt of necessary regulatory approvals, the approval of the Regency Merger by a majority of the outstanding Regency common units and the satisfaction or waiver of other conditions specified in the merger agreement related to the Regency transaction. In the event those conditions to closing are not satisfied or waived, we would not complete the Regency Merger.
While ETP expects to complete the Regency Merger in the second quarter of 2015, the completion date of the Regency Merger might be later than expected due to delays in obtaining required regulatory approvals or other unforeseen events.
Failure to complete the merger, or significant delays in completing the merger, could negatively affect the trading price of our common units and our future business and financial results.
Completion of the merger is not assured and is subject to risks, including the risks that approval of the merger by Regency’s unitholders or governmental agencies is not obtained or that other closing conditions are not satisfied. If the merger is not completed, or if there are significant delays in completing the merger, it could negatively affect the trading price of ETP’s common units and ETP’s future business and financial results, and ETP will be subject to several risks, including the following:
|
•
|
liability for damages under the terms and conditions of the merger agreement;
|
|
•
|
negative reactions from the financial markets, including declines in the price of ETP’s common units due to the fact that current prices may reflect a market assumption that the merger will be completed; and
|
|
•
|
the attention of ETP’s management will have been diverted to the merger rather than its own operations and pursuit of other opportunities that could have been beneficial to ETP.
|
ETP may have difficulty attracting, motivating and retaining executives and other employees in light of the merger.
Uncertainty about the effect of the merger on ETP’s employees may have an adverse effect on us and the combined organization. This uncertainty may impair ETP’s ability to attract, retain and motivate personnel until the merger is completed. Employee retention may be particularly challenging during the pendency of the merger, as employees may feel uncertain about their future roles with the combined organization. In addition, ETP may have to provide additional compensation in order to retain employees. If ETP’s employees depart because of issues relating to the uncertainty and difficulty of integration or a desire not to become employees of the combined organization, the ability of ETP to realize the anticipated benefits of the merger could be reduced. Also, if ETP fails to complete the merger, it may be difficult and expensive to recruit and hire replacements for such employees.
Regency is subject to contractual restrictions while the merger is pending, which could materially and adversely affect each party’s business and operations, and, pending the completion of the transaction, our business and operations could be materially and adversely affected.
Under the terms of the Regency Merger agreement, Regency is subject to certain restrictions on the conduct of business prior to completing the transaction, which may adversely affect their ability to execute certain business strategies without first obtaining consent from ETP, including their ability in certain cases to enter into contracts, incur capital expenditures or grow its business. The merger agreement also restricts Regency’s ability to solicit, initiate or encourage alternative acquisition proposals with any third party and may deter a potential acquirer from proposing an alternative transaction or may limit our ability to pursue any such proposal. Such limitations could negatively affect our business and operations prior to the completion of the proposed transaction.
63
Furthermore, the process of planning to integrate two businesses and organizations for the post-merger period can divert management attention and resources and could ultimately have an adverse effect on us.
In connection with the pending merger, it is possible that some customers, suppliers and other persons with whom Regency has business relationships may delay or defer certain business decisions or might decide to seek to terminate, change or renegotiate their relationship as a result of the transaction, which could negatively affect our revenues, earnings and cash flows, as well as the market price of our common units, regardless of whether the transaction is completed.
Lawsuits have been filed against ETP, ETP GP, Regency, Regency GP LP, Regency GP LP’s board of directors, and ETE challenging the merger, and any injunctive relief or adverse judgment for monetary damages could prevent the merger from occurring or could have a material adverse effect on us following the merger.
ETP, ETP GP, Regency, Regency GP LP, the directors of the Regency GP LP, and ETE are named defendants in purported class actions and derivative petitions brought by purported Regency unitholders in Dallas County, Texas, generally alleging claims of breach of duties under the partnership agreement, breach of the implied covenant of good faith and fair dealing in connection with the merger transactions, and aiding and abetting arising out of the defendants’ pursuit of the merger by way of an allegedly conflicted and unfair process. Similar lawsuits have been filed in the United States District Court for the Northern District of Texas. The plaintiffs in these lawsuits seek to enjoin the defendants from proceeding with or consummating the merger and, to the extent that the merger is implemented before relief is granted, plaintiffs seek to have the merger rescinded. Plaintiffs also seek money damages and attorneys’ fees. One of the conditions to the completion of the merger is that no order, decree, or injunction of any court or agency of competent jurisdiction shall be in effect, and no law shall have been enacted or adopted, that enjoins, prohibits, or makes illegal consummation of any of the transactions contemplated by the merger agreement. A preliminary injunction could delay or jeopardize the completion of the merger, and an adverse judgment granting permanent injunctive relief could indefinitely enjoin completion of the merger. An adverse judgment for rescission or for monetary damages could have a material adverse effect on us following the merger.
ETP will incur substantial transaction-related costs in connection with the merger.
ETP expects to incur a number of non-recurring merger-related costs associated with completing the merger, combining the operations of the two companies, and achieving desired synergies. These fees and costs will be substantial. Non-recurring transaction costs include, but are not limited to, fees paid to legal, financial and accounting advisors, filing fees and printing costs. Additional unanticipated costs may be incurred in the integration of Regency and ETP’s businesses. There can be no assurance that the elimination of certain duplicative costs, as well as the realization of other efficiencies related to the integration of the two businesses, will offset the incremental transaction-related costs over time. Thus, any net benefit may not be achieved in the near term, the long term or at all.
None.
A description of our properties is included in “Item 1. Business.” In addition, we and our subsidiaries own an executive office building in Dallas, Texas and office buildings in Houston, Corpus Christi and San Antonio, Texas. While we may require additional office space as our business expands, we believe that our existing facilities are adequate to meet our needs for the immediate future, and that additional facilities will be available on commercially reasonable terms as needed.
We believe that we have satisfactory title to or valid rights to use all of our material properties. Although some of our properties are subject to liabilities and leases, liens for taxes not yet due and payable, encumbrances securing payment obligations under non-competition agreements and immaterial encumbrances, easements and restrictions, we do not believe that any such burdens will materially interfere with our continued use of such properties in our business, taken as a whole. In addition, we believe that we have, or are in the process of obtaining, all required material approvals, authorizations, orders, licenses, permits, franchises and consents of, and have obtained or made all required material registrations, qualifications and filings with, the various state and local government and regulatory authorities which relate to ownership of our properties or the operations of our business.
Substantially all of our subsidiaries’ pipelines, which are described in “Item 1. Business” are constructed on rights-of-way granted by the apparent record owners of the property. Lands over which pipeline rights-of-way have been obtained may be subject to prior liens that have not been subordinated to the right-of-way grants. Our subsidiaries have obtained, where necessary, easement agreements from public authorities and railroad companies to cross over or under, or to lay facilities in or along, watercourses, county roads, municipal streets, railroad properties and state highways, as applicable. In some cases, properties on which our
64
subsidiaries’ pipelines were built were purchased in fee. ETP also owns and operates multiple natural gas and NGL storage facilities and owns or leases other processing, treating and conditioning facilities in connection with its midstream operations.
Sunoco, Inc., along with other refiners, manufacturers and sellers of gasoline, is a defendant in lawsuits alleging MTBE contamination of groundwater. The plaintiffs typically include water purveyors and municipalities responsible for supplying drinking water and governmental authorities. The plaintiffs are asserting primarily product liability claims and additional claims including nuisance, trespass, negligence, violation of environmental laws and deceptive business practices. The plaintiffs in all of the cases are seeking to recover compensatory damages, and in some cases also seek natural resource damages, injunctive relief, punitive damages and attorneys’ fees.
As of
December 31, 2014
, Sunoco, Inc. is a defendant in
five
cases, including cases initiated by the States of New Jersey, Vermont, the Commonwealth of Pennsylvania, and two others by the Commonwealth of Puerto Rico with the more recent Puerto Rico action being a companion case alleging damages for additional sites beyond those at issue in the initial Puerto Rico action.
Four
of these cases are venued in a multidistrict litigation proceeding in a New York federal court. The New Jersey, Puerto Rico, Vermont, and Pennsylvania cases assert natural resource damage claims.
Fact discovery has concluded with respect to an initial set of
19
sites each that will be the subject of the first trial phase in the New Jersey case and the initial Puerto Rico case. Insufficient information has been developed about the plaintiffs’ legal theories or the facts with respect to statewide natural resource damage claims to provide an analysis of the ultimate potential liability of Sunoco, Inc. in these matters. It is reasonably possible that a loss may be realized; however, we are unable to estimate the possible loss or range of loss in excess of amounts accrued. Management believes that an adverse determination with respect to one or more of the MTBE cases could have a significant impact on results of operations during the period in which any said adverse determination occurs, but does not believe that any such adverse determination would have a material adverse effect on the Partnership’s consolidated financial position.
In January 2012, Sunoco Logistics experienced a release on its products pipeline in Wellington, Ohio. In connection with this release, the PHMSA issued a Corrective Action Order under which Sunoco Logistics is obligated to follow specific requirements in the investigation of the release and the repair and reactivation of the pipeline. Sunoco Logistics also entered into an Order on Consent with the EPA regarding the environmental remediation of the release site. All requirements of the Order of Consent with the EPA have been fulfilled and the Order has been satisfied and closed. Sunoco Logistics has also received a "No Further Action" approval from the Ohio EPA for all soil and groundwater remediation requirements. Sunoco Logistics has not received any proposed penalties associated with this release and continues to cooperate with both PHMSA and the EPA to complete the investigation of the incident and repair of the pipeline.
In 2012, the EPA issued a proposed consent agreement related to the releases that occurred at Sunoco Logistics’ pump station/tank farm in Barbers Hill, Texas and pump station/tank farm located in Cromwell, Oklahoma in 2010 and 2011, respectively. These matters were referred to the U.S. Department of Justice (“DOJ”) by the EPA. In November 2012, Sunoco Logistics received an initial assessment of $1.4 million associated with these releases. Sunoco Logistics is in discussions with the EPA and the DOJ on this matter and hopes to resolve the issue during 2015. The timing or outcome of this matter cannot be reasonably determined at this time; however, Sunoco Logistics does not expect there to be a material impact to its results of operations, cash flows or financial position.
In September 2013, the Pennsylvania Department of Environmental Protection (“PADEP”) issued a Notice of Violation and proposed penalties in excess of $0.1 million based on alleged violations of various safety regulations relating to the November 2008 products release by Sunoco Pipeline L.P., a subsidiary of Sunoco Logistics, in Murrysville, Pennsylvania. Sunoco Logistics is currently in discussions with the PADEP. The timing or outcome of this matter cannot be reasonably determined at this time. However, Sunoco Logistics does not expect there to be a material impact to its results of operations, cash flows or financial position.
In November 2014, the PADEP issued a Notice of Violation and proposed penalties potentially in excess of $100,000 relating to unpermitted wetlands and streams along the second phase of construction of the Canton Pipeline Project by Regency Marcellus Gas Gathering LLC (“Regency Marcellus”), a subsidiary of Regency. Regency Marcellus has submitted amended permit applications for this phase of construction and is working the PADEP to acquire amended permits for the proposed crossings of the wetland resources. Regency Marcellus is in discussions with the PADEP regarding the aforementioned Notice of Violation. The timing of outcome of this matter cannot reasonably be determined at this time, however we do not expect there to be a material impact on our business or results of operations.
In November 2013, the DOT issued a Notice of Violation and proposed penalties in excess of $0.1 million based on alleged violations of various safety regulations relating to the February 2012 products release by FGT in Baton Rouge, Louisiana. ETP received an initial assessment of $0.2 million associated with this release. ETP is in discussions with the DOT on this matter and
65
hopes to resolve this issue in 2015.
The timing or outcome of this matter cannot be reasonably determined at this time. However, we do not expect there to be a material impact to our results of operations, cash flows or financial position.
On or around December 24, 2014, PHMSA issued to ETP’s Panhandle a Notice of Proposed Safety Order (the “Notice”) regarding the ETP\PEPL pipeline system. The Notice stated that PHMSA had initiated an investigation of the safety of the ETP/PEPL pipeline system and specifically referenced two incidents: 1) a November 28, 2013, incident on ETP/PEPL’s 400 line approximately 4.7 miles downstream of the Houstonia compressor station near Hughesville, Missouri, and 2) an October 13, 2014, failure on the ETP/PEPL 100 line near Centerview, Missouri. The Notice further mentioned other incidents on the ETP/PEPL pipeline system that PHMSA claims to have addressed with ETP/PEPL. The Notice also stated that “[a]s a result of [PHMSA’s] investigation, it appears that conditions exist on the ETP/PEPL pipeline system that pose a pipeline integrity risk to public safety, property or the environment.” ETP/PEPL is fully cooperating with PHMSA and its investigation.
Additionally, we have received notices of violations and potential fines under various federal, state and local provisions relating to the discharge of materials into the environment or protection of the environment. While we believe that even if any one or more of the environmental proceedings listed above were decided against us, it would not be material to our financial position, results of operations or cash flows, we are required to report environmental proceedings if we reasonably believe that such proceedings will result in monetary sanctions in excess of $0.1 million.
For a description of legal proceedings, see Note
12
to our consolidated financial statements.
Not applicable.
Parent Company
Market Price of and Distributions on Common Units and Related Unitholder Matters
The Parent Company’s common units are listed on the NYSE under the symbol “ETE.” The following table sets forth, for the periods indicated, the high and low sales prices per ETE Common Unit, as reported on the NYSE Composite Tape, and the amount of cash distributions paid per ETE Common Unit for the periods indicated.
|
|
Price Range
(1)
|
Cash
Distribution
(2)
|
|||||||||
|
|
High
|
Low
|
|||||||||
|
Fiscal Year 2014:
|
|
|
|
||||||||
|
Fourth Quarter
|
$
|
66.21
|
|
$
|
45.88
|
|
$
|
0.4500
|
|
||
|
Third Quarter
|
63.53
|
|
53.17
|
|
0.4150
|
|
|||||
|
Second Quarter
|
60.58
|
|
46.04
|
|
0.3800
|
|
|||||
|
First Quarter
|
43.11
|
|
38.99
|
|
0.3588
|
|
|||||
|
Fiscal Year 2013:
|
|
|
|
||||||||
|
Fourth Quarter
|
$
|
42.58
|
|
$
|
32.01
|
|
$
|
0.3463
|
|
||
|
Third Quarter
|
34.20
|
|
29.47
|
|
0.3363
|
|
|||||
|
Second Quarter
|
31.25
|
|
26.56
|
|
0.3275
|
|
|||||
|
First Quarter
|
29.54
|
|
23.04
|
|
0.3225
|
|
|||||
|
(1)
|
Prices and distributions have been adjusted to reflect the effect of the two-for-one split of ETE Common Units completed on January 27, 2014. See Note
9
to our consolidated financial statements.
|
|
(2)
|
Distributions are shown in the quarter with respect to which they relate. For each of the indicated quarters for which distributions have been made, an identical per unit cash distribution was paid on any units subordinated to our Common Units outstanding at such time. Please see “Cash Distribution Policy” below for a discussion of our policy regarding the payment of distributions.
|
66
Description of Units
As of February 18, 2015, there were approximately 129,213 individual common unitholders, which includes common units held in street name. Common units represent limited partner interest in us that entitle the holders to the rights and privileges specified in the Parent Company’s Third Amended and Restated Agreement of Limited Partnership, as amended to date (the “Partnership Agreement”).
As of
December 31, 2014
, limited partners owns an aggregate 99.7% limited partner interest in us. Our General Partner owns an aggregate
0.3%
General Partner interest in us. Our common units are registered under the Securities Exchange Act of 1934, as amended (the “Exchange Act”), and are listed for trading on the NYSE. Each holder of a common unit is entitled to one vote per unit on all matters presented to the limited partners for a vote. In addition, if at any time any person or group (other than our General Partner and its affiliates) owns beneficially 20% or more of all common units, any Common Units owned by that person or group may not be voted on any matter and are not considered to be outstanding when sending notices of a meeting of unitholders (unless otherwise required by law), calculating required votes, determining the presence of a quorum or for other similar purposes under our Partnership Agreement. The common units are entitled to distributions of Available Cash as described below under “Cash Distribution Policy.”
Cash Distribution Policy
General.
The Parent Company will distribute all of its “Available Cash” to its unitholders and its General Partner within 50 days following the end of each fiscal quarter.
Definition of Available Cash.
Available Cash is defined in the Parent Company’s Partnership Agreement and generally means, with respect to any calendar quarter, all cash on hand at the end of such quarter less the amount of cash reserves that are necessary or appropriate in the reasonable discretion of the General Partner to:
|
•
|
provide for the proper conduct of its business;
|
|
•
|
comply with applicable law and/or debt instrument or other agreement; and
|
|
•
|
provide funds for distributions to unitholders and its General Partner in respect of any one or more of the next four quarters.
|
The total amount of distributions declared is reflected in Note
9
to our consolidated financial statements.
Recent Sales of Unregistered Securities
None.
Issuer Purchases of Equity Securities
No repurchases were made during the fourth quarter of 2014.
67
The selected historical financial data should be read in conjunction with “Item 7. Management’s Discussion and Analysis of Financial Condition and Results of Operations” and the historical consolidated financial statements and accompanying notes thereto included elsewhere in this report. The amounts in the table below, except per unit data, are in millions.
|
|
Years Ended December 31,
|
||||||||||||||||||
|
2014
|
2013
|
2012
|
2011
|
2010
|
|||||||||||||||
|
Statement of Operations Data:
|
|||||||||||||||||||
|
Total revenues
|
$
|
55,691
|
|
$
|
48,335
|
|
$
|
16,964
|
|
$
|
8,190
|
|
$
|
6,556
|
|
||||
|
Operating income
|
2,470
|
|
1,551
|
|
1,360
|
|
1,237
|
|
1,044
|
|
|||||||||
|
Income from continuing operations
|
1,060
|
|
282
|
|
1,383
|
|
531
|
|
345
|
|
|||||||||
|
Basic income from continuing operations per limited partner unit
|
1.15
|
|
0.33
|
|
0.59
|
|
0.69
|
|
0.44
|
|
|||||||||
|
Diluted income from continuing operations per limited partner unit
|
1.14
|
|
0.33
|
|
0.59
|
|
0.69
|
|
0.44
|
|
|||||||||
|
Cash distribution per unit
|
1.60
|
|
1.33
|
|
1.26
|
|
1.22
|
|
1.08
|
|
|||||||||
|
Balance Sheet Data (at period end):
|
|||||||||||||||||||
|
Total assets
|
64,469
|
|
50,330
|
|
48,904
|
|
20,897
|
|
17,379
|
|
|||||||||
|
Long-term debt, less current maturities
|
29,653
|
|
22,562
|
|
21,440
|
|
10,947
|
|
9,346
|
|
|||||||||
|
Total equity
|
22,314
|
|
16,279
|
|
16,350
|
|
7,388
|
|
6,248
|
|
|||||||||
AND RESULTS OF OPERATIONS
(Tabular dollar and unit amounts, except per unit data, are in millions)
Energy Transfer Equity, L.P. is a Delaware limited partnership whose common units are publicly traded on the NYSE under the ticker symbol “ETE.” ETE was formed in September 2002 and completed its initial public offering in February 2006.
The following is a discussion of our historical consolidated financial condition and results of operations, and should be read in conjunction with our historical consolidated financial statements and accompanying notes thereto included in “Item 8. Financial Statements and Supplementary Data” of this report. This discussion includes forward-looking statements that are subject to risk and uncertainties. Actual results may differ substantially from the statements we make in this section due to a number of factors that are discussed in “Item 1A. Risk Factors” of this report.
Unless the context requires otherwise, references to “we,” “us,” “our,” the “Partnership” and “ETE” mean Energy Transfer Equity, L.P. and its consolidated subsidiaries, which include ETP, ETP GP, ETP LLC, Regency, Regency GP, Regency LLC, Panhandle (or Southern Union prior to its merger into Panhandle in January 2014), Sunoco, Inc., Sunoco Logistics, Sunoco LP, Susser and ETP Holdco. References to the “Parent Company” mean Energy Transfer Equity, L.P. on a stand-alone basis.
In 2014, our consolidated subsidiaries, Trunkline LNG Company, LLC, Trunkline LNG Export, LLC and Susser Petroleum Partners LP, changed their names to Lake Charles LNG Company, LLC, Lake Charles LNG Export, LLC and Sunoco LP, respectively. All references to these subsidiaries throughout this document reflect the new names of those subsidiaries, regardless of whether the disclosure relates to periods or events prior to the dates of the name changes.
68
OVERVIEW
Energy Transfer Equity, L.P. directly and indirectly owns equity interests in ETP and Regency, both publicly traded master limited partnerships engaged in diversified energy-related services.
At
December 31, 2014
, our interests in ETP and Regency consisted of
100%
of the respective general partner interests and IDRs, as well as the following:
|
ETP
|
Regency
|
||
|
Units held by wholly-owned subsidiaries:
|
|||
|
Common units
|
30.8
|
57.2
|
|
|
ETP Class H units
|
50.2
|
—
|
|
|
Units held by less than wholly-owned subsidiaries:
|
|||
|
Common units
|
—
|
31.4
|
|
|
Regency Class F units
|
—
|
6.3
|
|
The Parent Company’s principal sources of cash flow are derived from its direct and indirect investments in the limited partner and general partner interests in ETP and Regency, both of which are publicly traded master limited partnerships engaged in diversified energy-related services, and the Partnership’s ownership of Lake Charles LNG. The Parent Company’s primary cash requirements are for distributions to its partners, general and administrative expenses, debt service requirements and at ETE’s election, capital contributions to ETP and Regency in respect of ETE’s general partner interests in ETP and Regency. The Parent Company-only assets and liabilities are not available to satisfy the debts and other obligations of subsidiaries.
In order to fully understand the financial condition and results of operations of the Parent Company on a stand-alone basis, we have included discussions of Parent Company matters apart from those of our consolidated group.
General
Our primary objective is to increase the level of our distributable cash flow to our unitholders over time by pursuing a business strategy that is currently focused on growing our subsidiaries’ natural gas and liquids businesses through, among other things, pursuing certain construction and expansion opportunities relating to our subsidiaries’ existing infrastructure and acquiring certain strategic operations and businesses or assets. The actual amounts of cash that we will have available for distribution will primarily depend on the amount of cash our subsidiaries generate from their operations.
As a result of the Lake Charles LNG Transaction in 2014, our reportable segments were re-evaluated and currently reflect the following reportable segments:
•
Investment in ETP, including the consolidated operations of ETP;
|
•
|
Investment in Regency, including the consolidated operations of Regency;
|
|
•
|
Investment in Lake Charles LNG, including the operations of Lake Charles LNG; and
|
|
•
|
Corporate and Other, including the following:
|
|
•
|
activities of the Parent Company; and
|
|
•
|
the goodwill and property, plant and equipment fair value adjustments recorded as a result of the 2004 reverse acquisition of Heritage Propane Partners, L.P.
|
Each of the respective general partners of ETP and Regency have separate operating management and boards of directors. We control ETP and Regency through our ownership of their respective general partners.
Recent Developments
Regency Merger
In January 2015, ETP and Regency entered into a definitive merger agreement, as amended on February 18, 2015 (the “Merger Agreement”), pursuant to which Regency will merge with a wholly-owned subsidiary of ETP, with Regency continuing as the surviving entity and becoming a wholly-owned subsidiary of ETP (the “Regency Merger”). At the effective time of the Regency Merger (the “Effective Time”), each Regency common unit and Class F unit will be converted into the right to receive
0.4066
ETP Common Units, plus a number of additional ETP Common Units equal to
$0.32
per Regency common unit divided by the lesser of (i) the volume weighted average price of ETP Common Units for the five trading days ending on the third trading day
69
immediately preceding the Effective Time and (ii) the closing price of ETP Common Units on the third trading day immediately preceding the Effective Time, rounded to the nearest ten thousandth of a unit. Each Regency series A preferred unit will be converted into the right to receive a preferred unit representing a limited partner interest in ETP, a new class of units in ETP to be established at the Effective Time. The transaction is subject to other customary closing conditions including approval by Regency’s unitholders.
In addition, ETE, which owns the general partner and
100%
of the incentive distribution rights of both Regency and ETP, has agreed to reduce the incentive distributions it receives from ETP by a total of
$320 million
over a five year period. The IDR subsidy will be
$80 million
in the first year post closing and
$60 million
per year for the following four years. The transaction is expected to close in the second quarter of 2015.
Bakken Pipeline Transaction
In December 2014, ETP and ETE announced the final terms of a transaction, whereby ETE will transfer
30.8 million
ETP Common Units, ETE’s
45%
interest in the Dakota Access Pipeline and Energy Transfer Crude Oil Pipeline (collectively, the “Bakken pipeline project”), and
$879 million
in cash (less amounts funded prior to closing by ETE for capital expenditures for the Bakken pipeline project) in exchange for
30.8 million
newly issued ETP Class H Units that, when combined with the
50.2 million
previously issued ETP Class H Units, generally entitle ETE to receive
90.05%
of the cash distributions and other economic attributes of the general partner interest and IDRs of Sunoco Logistics. In addition, ETE and ETP agreed to reduce the IDR subsidies that ETE previously agreed to provide to ETP, with such reductions occurring in 2015 and 2016. This transaction is expected to close in March 2015.
Acquisition of West Texas Gulf by Sunoco Logistics
In December 2014, Sunoco Logistics acquired an additional
28.3%
ownership interest in the West Texas Gulf Pipe Line Company from Chevron Pipe Line Company, increasing its controlling financial interest in the consolidated subsidiary to
88.6%
. The remaining
11.4%
was acquired from Southwest Pipeline Holding Company, LLC in January 2015.
Lone Star NGL Pipeline and Conversion Project
In November 2014, ETP and Regency announced that Lone Star will construct a
533
mile,
24-
and
30-inch
NGL pipeline from the Permian Basin to Mont Belvieu, Texas and convert Lone Star’s existing West Texas
12-inch
NGL pipeline into crude oil/condensate service. The new pipeline and conversion projects, estimated to cost between
$1.5 billion
and
$1.8 billion
, are expected to be operational by the third quarter of 2016 and the first quarter of 2017, respectively.
Gathering and Processing Construction Projects
In November 2014, ETP announced its plans to construct two new
200
million cubic feet per day cryogenic gas processing plants and associated gathering systems in the Eagle Ford and Eaglebine production areas. ETP expects to have the first plant online by June 2015 and the second plant by the fourth quarter of 2015.
Lone Star Fractionator
In November 2014, ETP and Regency announced that Lone Star will construct a third natural gas liquids fractionator at its facility in Mont Belvieu, Texas, which will bring Lone Star’s total fractionation capacity at Mont Belvieu to 300,000 Bbls/d. Lone Star’s third fractionator is scheduled to be operational by December 2015.
Phillips 66 Joint Ventures
In October 2014, ETE, ETP and Phillips 66 formed two joint ventures to develop the previously announced Dakota Access Pipeline (“DAPL”) and Energy Transfer Crude Oil Pipeline (“ETCOP”) projects. ETP and ETE hold an aggregate interest of
75%
in each joint venture and ETP operates both pipeline systems. Phillips 66 owns the remaining
25%
interests and funds its proportionate share of the construction costs. The DAPL and ETCOP projects are expected to begin commercial operations in the fourth quarter of 2016.
ET Rover
In June 2014, ETP announced a natural gas pipeline project (now called “Rover”) to connect Marcellus and Utica shale supplies to markets in the Midwest, Great Lakes, and Gulf Coast regions of the United States and Canada. ETP has secured multiple, long-term binding shipper agreements on Rover. As a result of these binding agreements, the pipeline is substantially subscribed with
15-
and
20-year
fee-based contracts to transport up to
3.25
Bcf/d of capacity. Also, ETP recently announced that AE–Midco Rover, LLC (“AE–Midco”), has exercised its option to increase its equity ownership interest in Rover. As a result, AE–Midco (and an affiliate of AE–Midco) will own
35%
of Rover and ETP will own
65%.
70
MACS to Sunoco LP
In October 2014, Sunoco LP acquired MACS from a subsidiary of ETP in a transaction valued at approximately
$768 million
(the “MACS Transaction”). The transaction included approximately
110
company-operated retail convenience stores and
200
dealer-operated and consignment sites from MACS, which had originally been acquired by ETP in October 2013. The consideration paid by Sunoco LP consisted of approximately
4 million
Sunoco LP common units issued to ETP and
$556 million
in cash, subject to customary closing adjustments. Sunoco LP initially financed the cash portion by utilizing availability under its revolving credit facility. In October 2014 and November 2014, Sunoco LP partially repaid borrowings on its revolving credit facility with aggregate net proceeds of
$405 million
from a public offering of
9.1 million
Sunoco LP common units.
ETE Unit Repurchase
From January through May 2014, ETE repurchased approximately $1 billion of ETE common units under its buyback program.
Lake Charles LNG Transaction
In February 2014, ETP completed the transfer to ETE of Lake Charles LNG, the entity that owns a LNG regasification facility in Lake Charles, Louisiana, in exchange for the redemption by ETP of
18.7 million
ETP Common Units held by ETE. This transaction was
effective as of January 1, 2014.
In connection with ETE’s acquisition of Lake Charles LNG, ETP agreed to continue to provide management services for ETE through 2015 in relation to both Lake Charles LNG’s regasification facility and the development of a liquefaction project at Lake Charles LNG’s facility, for which ETE has agreed to pay incremental management fees to ETP of
$75 million
per year for the years ending December 31, 2014 and 2015. ETE also agreed to provide additional subsidies to ETP through the relinquishment of future incentive distributions, as discussed further in Note 9 to our consolidated financial statements.
Results of Operations
Year Ended
December 31, 2014
Compared to the Year Ended
December 31, 2013
We define Segment Adjusted EBITDA as earnings before interest, taxes, depreciation, depletions, amortization and other non-cash items, such as non-cash compensation expense, gains and losses on disposals of assets, the allowance for equity funds used during construction, unrealized gains and losses on commodity risk management activities, non-cash impairment charges, loss on extinguishment of debt, gain on deconsolidation and other non-operating income or expense items. Unrealized gains and losses on commodity risk management activities includes unrealized gains and losses on commodity derivatives and inventory fair value adjustments (excluding lower of cost or market adjustments). Segment Adjusted EBITDA reflects amounts for unconsolidated affiliates based on the Partnership’s proportionate ownership and amounts for less than wholly owned subsidiaries based on 100% of the subsidiaries’ results of operations.
Based on the change in our reportable segments, we have adjusted the presentation of our segment results for the prior years to be consistent with the current year presentation.
Eliminations in the tables below include the following:
|
•
|
ETP’s Segment Adjusted EBITDA reflected 100% of Lone Star, which is a consolidated subsidiary of ETP. Regency’s Segment Adjusted EBITDA included its 30% investment in Lone Star. Therefore, 30% of the results of Lone Star were included in eliminations.
|
|
•
|
ETP’s Segment Adjusted EBITDA reflected the results of SUGS from March 26, 2012 to April 30, 2013. Since the SUGS Contribution was a transaction between entities under common control, Regency’s results have been recast to retrospectively consolidate SUGS beginning March 26, 2012. Therefore, the eliminations also included the results of SUGS from March 26, 2012 to April 30, 2013.
|
|
•
|
ETP’s Segment Adjusted EBITDA reflected the results of Lake Charles LNG prior to the Lake Charles LNG Transaction, which was effective January 1, 2014. The Investment in Lake Charles LNG segment reflected the results of operations of Lake Charles LNG for all periods presented. Consequently, the results of operations of Lake Charles LNG were reflected in two segments for the year ended December 31, 2013 and the period from March 26, 2012 to December 31, 2012. Therefore, the results of Lake Charles LNG were included in eliminations for 2013 and 2012.
|
71
Consolidated Results
|
|
Years Ended December 31,
|
||||||||||
|
|
2014
|
2013
|
Change
|
||||||||
|
Segment Adjusted EBITDA:
|
|||||||||||
|
Investment in ETP
|
$
|
4,829
|
|
$
|
3,953
|
|
$
|
876
|
|
||
|
Investment in Regency
|
1,172
|
|
608
|
|
564
|
|
|||||
|
Investment in Lake Charles LNG
|
195
|
|
187
|
|
8
|
|
|||||
|
Corporate and Other
|
(97
|
)
|
(43
|
)
|
(54
|
)
|
|||||
|
Adjustments and eliminations
|
(259
|
)
|
(338
|
)
|
79
|
|
|||||
|
Total
|
5,840
|
|
4,367
|
|
1,473
|
|
|||||
|
Depreciation, depletion and amortization
|
(1,724
|
)
|
(1,313
|
)
|
(411
|
)
|
|||||
|
Interest expense, net of interest capitalized
|
(1,369
|
)
|
(1,221
|
)
|
(148
|
)
|
|||||
|
Gain on sale of AmeriGas common units
|
177
|
|
87
|
|
90
|
|
|||||
|
Goodwill impairments
|
(370
|
)
|
(689
|
)
|
319
|
|
|||||
|
Gains (losses) on interest rate derivatives
|
(157
|
)
|
53
|
|
(210
|
)
|
|||||
|
Non-cash unit-based compensation expense
|
(82
|
)
|
(61
|
)
|
(21
|
)
|
|||||
|
Unrealized gains on commodity risk management activities
|
116
|
|
48
|
|
68
|
|
|||||
|
Inventory valuation adjustments
|
(473
|
)
|
3
|
|
(476
|
)
|
|||||
|
Losses on extinguishments of debt
|
(25
|
)
|
(162
|
)
|
137
|
|
|||||
|
Adjusted EBITDA related to discontinued operations
|
(27
|
)
|
(76
|
)
|
49
|
|
|||||
|
Adjusted EBITDA related to unconsolidated affiliates
|
(748
|
)
|
(727
|
)
|
(21
|
)
|
|||||
|
Equity in earnings of unconsolidated affiliates
|
332
|
|
236
|
|
96
|
|
|||||
|
Non-operating environmental remediation
|
—
|
|
(168
|
)
|
168
|
|
|||||
|
Other, net
|
(73
|
)
|
(2
|
)
|
(71
|
)
|
|||||
|
Income from continuing operations before income tax expense
|
1,417
|
|
375
|
|
1,042
|
|
|||||
|
Income tax expense
|
357
|
|
93
|
|
264
|
|
|||||
|
Income from continuing operations
|
1,060
|
|
282
|
|
778
|
|
|||||
|
Income from discontinued operations
|
64
|
|
33
|
|
31
|
|
|||||
|
Net income
|
$
|
1,124
|
|
$
|
315
|
|
$
|
809
|
|
||
See the detailed discussion of Segment Adjusted EBITDA in the Segment Operating Results section below.
Depreciation, Depletion and Amortization.
Depreciation, depletion and amortization increased primarily as a result of acquisitions and growth projects, including an increase of $254 million at Regency primarily due to depreciation, depletion and amortization related to the PVR, Eagle Rock and Hoover acquisitions, as well as additional depreciation, depletion and amortization recorded from assets placed in service in 2014 and 2013.
Interest Expense, Net of Interest Capitalized.
Interest expense increased primarily due to the following:
|
•
|
an increase of $140 million related to Regency primarily due to its issuance of $600 million of senior notes in April 2013, $400 million of senior notes in September 2013, $900 of million senior notes in February 2014 and $700 of million senior notes issued in July 2014, as well as the assumption of $1.2 billion of senior notes in the PVR Acquistion and the exchange of $499 million of senior notes in the Eagle Rock Acquisition; and
|
|
•
|
an increase of $11 million related to ETP primarily due to ETP’s issuance of $1.25 billion of senior notes in January 2013 and $1.5 billion of senior notes in September 2013; partially offset by
|
|
•
|
a reduction of $5 million for the Parent Company primarily related to a $1.1 billion principal paydown of the Parent Company’s $2 billion term loan in April 2013, net of interest related to incremental debt.
|
Gain on Sale of AmeriGas Common Units.
During the year ended
December 31, 2014
and
2013
, ETP sold
18.9 million
and
7.5 million
, respectively, of the AmeriGas common units that were originally received in connection with the contribution of its propane
72
business to AmeriGas in January 2012. ETP recorded a gain based on the sale proceeds in excess of the carrying amount of the units sold. As of
December 31, 2014
, ETP’s remaining interest in AmeriGas common units consisted of
3.1 million
units held by a wholly-owned captive insurance company.
Goodwill Impairments.
In 2013, Lake Charles LNG recorded a
$689 million
goodwill impairment. The decline in the estimated fair value was primarily due to changes related to (i) the structure and capitalization of the planned LNG export project at Lake Charles LNG’s Lake Charles facility, (ii) an analysis of current macroeconomic factors, including global natural gas prices and relative spreads, as of the date of our assessment (iii) judgments regarding the prospect of obtaining regulatory approval for a proposed LNG export project and the uncertainty associated with the timing of such approvals, and (iv) changes in assumptions related to potential future revenues from the import facility and the proposed export facility. An assessment of these factors in the fourth quarter of 2013 led to a conclusion that the estimated fair value of the Lake Charles LNG reporting unit was less than its carrying amount.
During the fourth quarter of 2014, a
$370 million
goodwill impairment was recorded related to Regency’s Permian Basin gathering and processing operations. The decline in estimated fair value of that reporting unit was primarily driven by the significant decline in commodity prices in the fourth quarter of 2014, and the resulting impact to future commodity prices as well as increases in future estimated operations and maintenance expenses. An assessment of these factors in the fourth quarter of 2014 led to a conclusion that the estimated fair value of Regency’s Permian reporting unit was less than its carrying amount.
Gains (Losses) on Interest Rate Derivatives.
Our interest rate derivatives are not designated as hedges for accounting purposes; therefore, changes in fair value are recorded in earnings each period. Losses on interest rate derivatives during the year ended
December 31, 2014
resulted from decreases in forward interest rates, which caused our forward-starting swaps to decrease in value. Conversely, increases in forward interest rates resulted in gains on interest rate derivatives during the year ended December 31, 2013.
Unrealized Gains on Commodity Risk Management Activities.
See discussion of the unrealized gains on commodity risk management activities included in the discussion of segment results below.
Inventory Valuation Adjustments.
Inventory valuation reserve adjustments were recorded for the inventory associated with Sunoco Logistics’ crude oil and products inventories and ETP’s retail marketing operations as a result of commodity price changes between periods.
Losses on Extinguishments of Debt.
For the year ended December 31, 2013, losses on extinguishment of debt were primarily related to ETE’s refinancing transactions completed in December 2013. In addition, the years ended
December 31, 2014
and 2013 also reflected losses of $25 million and $7 million, respectively, related to Regency’s repurchase of its senior notes during the respective periods.
Adjusted EBITDA Related to Discontinued Operations.
In 2014, amounts were related to a marketing business that was sold effective April 1, 2014. In 2013, amounts primarily related to Southern Union’s local distribution operations.
Adjusted EBITDA Related to Unconsolidated Affiliates and Equity in Earnings of Unconsolidated Affiliates.
Amounts reflected primarily include our proportionate share of such amounts related to our equity method investees. See additional discussion of results in “Segment Operating Results” below.
Non-Operating Environmental Remediation.
Non-operating environmental remediation was primarily due to Sunoco, Inc.’s recognition of environmental obligations related to closed sites.
Other, net.
Includes amortization of regulatory assets, certain acquisition related costs and other income and expense amounts.
Income Tax Expense from Continuing Operations.
Income tax expense is based on the earnings of our taxable subsidiaries. In addition, the year ended
December 31, 2014
included the impact of the Lake Charles LNG Transaction, which was treated as a sale for tax purposes, resulting in
$76 million
of incremental income tax expense.
73
Segment Operating Results
Investment in ETP
|
|
Years Ended December 31,
|
|
|||||||||
|
|
2014
|
2013
|
Change
|
||||||||
|
Revenues
|
$
|
51,158
|
|
$
|
46,339
|
|
$
|
4,819
|
|
||
|
Cost of products sold
|
45,540
|
|
41,204
|
|
4,336
|
|
|||||
|
Gross margin
|
5,618
|
|
5,135
|
|
483
|
|
|||||
|
Unrealized gains on commodity risk management activities
|
(23
|
)
|
(51
|
)
|
28
|
|
|||||
|
Operating expenses, excluding non-cash compensation expense
|
(1,640
|
)
|
(1,428
|
)
|
(212
|
)
|
|||||
|
Selling, general and administrative expenses, excluding non-cash compensation expense
|
(386
|
)
|
(396
|
)
|
10
|
|
|||||
|
Inventory valuation adjustments
|
473
|
|
(3
|
)
|
476
|
|
|||||
|
Adjusted EBITDA related to discontinued operations
|
27
|
|
76
|
|
(49
|
)
|
|||||
|
Adjusted EBITDA related to unconsolidated affiliates
|
674
|
|
629
|
|
45
|
|
|||||
|
Other, net
|
86
|
|
(9
|
)
|
95
|
|
|||||
|
Segment Adjusted EBITDA
|
$
|
4,829
|
|
$
|
3,953
|
|
$
|
876
|
|
||
Gross Margin.
For the year ended December 31, 2014 compared to the prior year, ETP’s gross margin increased primarily as a result of the following:
|
•
|
Gross margin included in ETP’s consolidated results related to ETP’s retail marketing operations increased
$471 million
between periods due to the acquisition of Susser and MACS as well as favorable fuel margins.
|
|
•
|
Gross margin related to ETP’s liquids transportation and services operations increased $
273 million
as a result of (i) increases in transportation margin as a result of higher volumes transported out of west Texas due to the completion expansion projects and (ii) higher processing and fractionation margin due to the completion of Lone Star’s fractionators in December 2013.
|
|
•
|
Gross margin from ETP’s midstream operations increased
$79 million
primarily due to an increase in fee-based revenues driven by increased production from assets recently placed in service in the Eagle Ford Shale.
|
These increases were partially offset by the following:
|
•
|
Revenue from ETP’s interstate transportation and storage operations decreased $237 million primarily as a result of the deconsolidated of Lake Charles LNG and the recognition in 2013 of $52 million received in connection with the buyout of a customer contract.
|
|
•
|
Gross margin related to ETP’s intrastate transportation and storage operations decreased $27 million primarily due to the cessation of long-term transportation contracts.
|
|
•
|
Sunoco Logistics’ gross margin decreased
$87 million
primarily related to lower crude oil margins.
|
Unrealized Gains on Commodity Risk Management Activities.
Unrealized gains on commodity risk management activities primarily reflected the net impact from unrealized gains and losses on natural gas storage and non-storage derivatives, as well as fair value adjustments to inventory. The decrease in unrealized gains on commodity risk management activities for 2014 compared to 2013 was primarily attributable to natural gas storage inventory and related derivatives.
Operating Expenses, Excluding Non-Cash Compensation Expense.
Operating expenses related to ETP’s retail marketing operations increased $254 million, primarily due to recent acquisitions. In addition, Sunoco Logistics’ operating expenses increased $44 million, primarily due to lower pipeline operating gains, increased pipeline maintenance costs and higher employee costs. Operating expenses also increased $19 million for ETP’s liquids transportation and services operations, primarily due to the start-up of Lone Star’s second fractionator in Mont Belvieu, Texas in October 2013. These increases were partially offset by decreases in ETP’s operating expenses due to its deconsolidation of certain operations during the periods, including Lake Charles LNG effective January 1, 2014 and SUGS in April 2013.
Selling, General and Administrative Expenses, Excluding Non-Cash Compensation Expense.
Selling, general and administrative expenses related to ETP’s retail marketing operations increased $29 million, primarily due to recent acquisitions. In addition,
74
Sunoco Logistics’ selling, general and administrative expenses increased $28 million. Selling, general and administrative expenses also increased for ETP’s liquids transportation and services operations due to higher employee-related costs. These increases were partially offset by decreases in ETP’s expenses due to its deconsolidation of certain operations during the periods, including Lake Charles LNG effective January 1, 2014 and SUGS in April 2013.
Adjusted EBITDA Related to Discontinued Operations.
In 2014, amounts were related to a marketing business that was sold effective April 1, 2014. In 2013, amounts primarily related to Southern Union’s distribution operations.
Adjusted EBITDA Related to Unconsolidated Affiliates.
ETP’s Adjusted EBITDA related to unconsolidated affiliates for the years ended December 31, 2014 and 2013 consisted of the following:
|
Years Ended December 31,
|
|||||||||||
|
2014
|
2013
|
Change
|
|||||||||
|
Citrus
|
$
|
305
|
|
$
|
296
|
|
$
|
9
|
|
||
|
FEP
|
75
|
|
75
|
|
—
|
|
|||||
|
Regency
|
100
|
|
66
|
|
34
|
|
|||||
|
PES
|
86
|
|
(30
|
)
|
116
|
|
|||||
|
AmeriGas
|
56
|
|
175
|
|
(119
|
)
|
|||||
|
Other
|
52
|
|
47
|
|
5
|
|
|||||
|
Total Adjusted EBITDA related to unconsolidated affiliates
|
$
|
674
|
|
$
|
629
|
|
$
|
45
|
|
||
These amounts represent ETP’s proportionate share of the Adjusted EBITDA of its unconsolidated affiliates and are based on ETP’s equity in earnings or losses of its unconsolidated affiliates adjusted for its proportionate share of the unconsolidated affiliates’ interest, depreciation, amortization, non-cash items and taxes.
Other.
Other, net in 2014 primarily includes amortization of regulatory assets and other income and expense amounts. Other, net in 2013 was primarily related to biodiesel tax credits recorded by Sunoco, Inc., amortization of regulatory assets and other income and expense amounts.
Investment in Regency
|
|
Years Ended December 31,
|
|
|||||||||
|
|
2014
|
2013
|
Change
|
||||||||
|
Revenues
|
$
|
4,951
|
|
$
|
2,521
|
|
$
|
2,430
|
|
||
|
Cost of products sold
|
3,452
|
|
1,793
|
|
1,659
|
|
|||||
|
Gross margin
|
1,499
|
|
728
|
|
771
|
|
|||||
|
Unrealized (gains) losses on commodity risk management activities
|
(89
|
)
|
9
|
|
(98
|
)
|
|||||
|
Operating expenses, excluding non-cash compensation expense
|
(448
|
)
|
(296
|
)
|
(152
|
)
|
|||||
|
Selling, general and administrative, excluding non-cash compensation expense
|
(148
|
)
|
(81
|
)
|
(67
|
)
|
|||||
|
Adjusted EBITDA related to unconsolidated affiliates
|
325
|
|
250
|
|
75
|
|
|||||
|
Other, net
|
33
|
|
(2
|
)
|
35
|
|
|||||
|
Segment Adjusted EBITDA
|
$
|
1,172
|
|
$
|
608
|
|
$
|
564
|
|
||
Gross Margin
. Regency’s gross margin increased for the year ended December 31, 2014 compared to the prior year primarily due to increased volumes in Regency’s south and west Texas and north Louisiana gathering and processing operations, as well as a $434 million increase from the PVR, Eagle Rock and Hoover acquisitions.
Operating Expenses, Excluding Non-Cash Compensation Expense.
Regency’s operating expenses reflected an increase of $76 million in pipeline and plant maintenance and materials expense primarily due to organic growth in south and west Texas, as well as recent acquisitions. In addition, Regency’s recent acquisitions also resulted in a $44 million increase in employee expenses and a $15 million increase in ad valorem taxes. The remainder of the increase was primarily due to higher insurance, professional fees and communications expense.
75
Selling, General and Administrative, Excluding Non-Cash Compensation Expense.
Regency’s selling, general and administrative expenses increased primarily due to acquisition costs of $33 million, as well as $30 million from increased employee headcount due to the PVR, Eagle rock and Hoover acquisitions.
Adjusted EBITDA Related to Unconsolidated Affiliates.
Regency’s adjusted EBITDA related to unconsolidated affiliates increased $75 million primarily due to the impact from Lone Star.
Other.
The change in Regency’s other income and deductions is primarily due to a non-cash mark-to-market adjustment of the embedded derivatives related to Regency’s Series A preferred units.
Investment in Lake Charles LNG
|
|
Years Ended December 31,
|
||||||||||
|
|
2014
|
2013
|
Change
|
||||||||
|
Revenues
|
$
|
216
|
|
$
|
216
|
|
$
|
—
|
|
||
|
Operating expenses, excluding non-cash compensation expense
|
(17
|
)
|
(20
|
)
|
3
|
|
|||||
|
Selling, general and administrative, excluding non-cash compensation expense
|
(4
|
)
|
(9
|
)
|
5
|
|
|||||
|
Segment Adjusted EBITDA
|
$
|
195
|
|
$
|
187
|
|
$
|
8
|
|
||
Amounts reflected above include comparative amounts for the year ended December 31, 2013, which preceded ETE’s direct investment in Lake Charles LNG effective January 1, 2014.
Lake Charles LNG derives all of its revenue from a contract with a non-affiliated gas marketer.
76
Year Ended December 31, 2013 Compared to the Year Ended December 31, 2012 (tabular dollar amounts are expressed in millions)
Consolidated Results
|
|
Years Ended December 31,
|
||||||||||
|
|
2013
|
2012
|
Change
|
||||||||
|
Segment Adjusted EBITDA:
|
|||||||||||
|
Investment in ETP
|
$
|
3,953
|
|
$
|
2,744
|
|
$
|
1,209
|
|
||
|
Investment in Regency
|
608
|
|
517
|
|
91
|
|
|||||
|
Investment in Lake Charles LNG
|
187
|
|
135
|
|
52
|
|
|||||
|
Corporate and Other
|
(43
|
)
|
(52
|
)
|
9
|
|
|||||
|
Adjustments and Eliminations
|
(338
|
)
|
(239
|
)
|
(99
|
)
|
|||||
|
Total
|
4,367
|
|
3,105
|
|
1,262
|
|
|||||
|
Depreciation, depletion and amortization
|
(1,313
|
)
|
(871
|
)
|
(442
|
)
|
|||||
|
Interest expense, net of interest capitalized
|
(1,221
|
)
|
(1,018
|
)
|
(203
|
)
|
|||||
|
Bridge loan related fees
|
—
|
|
(62
|
)
|
62
|
|
|||||
|
Gain on deconsolidation of Propane Business
|
—
|
|
1,057
|
|
(1,057
|
)
|
|||||
|
Gain on sale of AmeriGas common units
|
87
|
|
—
|
|
87
|
|
|||||
|
Goodwill impairment
|
(689
|
)
|
—
|
|
(689
|
)
|
|||||
|
Gains (losses) on non-hedged interest rate derivatives
|
53
|
|
(19
|
)
|
72
|
|
|||||
|
Non-cash unit-based compensation expense
|
(61
|
)
|
(47
|
)
|
(14
|
)
|
|||||
|
Unrealized gains on commodity risk management activities
|
48
|
|
10
|
|
38
|
|
|||||
|
Inventory valuation adjustments
|
3
|
|
(75
|
)
|
78
|
|
|||||
|
Losses on extinguishments of debt
|
(162
|
)
|
(123
|
)
|
(39
|
)
|
|||||
|
Adjusted EBITDA related to discontinued operations
|
(76
|
)
|
(99
|
)
|
23
|
|
|||||
|
Adjusted EBITDA related to unconsolidated affiliates
|
(727
|
)
|
(647
|
)
|
(80
|
)
|
|||||
|
Equity in earnings of unconsolidated affiliates
|
236
|
|
212
|
|
24
|
|
|||||
|
Non-operating environmental remediation
|
(168
|
)
|
—
|
|
(168
|
)
|
|||||
|
Other, net
|
(2
|
)
|
14
|
|
(16
|
)
|
|||||
|
Income from continuing operations before income tax expense
|
375
|
|
1,437
|
|
(1,062
|
)
|
|||||
|
Income tax expense
|
93
|
|
54
|
|
39
|
|
|||||
|
Income from continuing operations
|
282
|
|
1,383
|
|
(1,101
|
)
|
|||||
|
Income (loss) from discontinued operations
|
33
|
|
(109
|
)
|
142
|
|
|||||
|
Net income
|
$
|
315
|
|
$
|
1,274
|
|
$
|
(959
|
)
|
||
See the detailed discussion of Segment Adjusted EBITDA in the Segment Operating Results section below.
The year ended December 31, 2012 was impacted by multiple transactions. Additional information has been provided in “Supplemental Pro Forma Information” below, which provides pro forma information assuming the transactions had occurred at the beginning of the period.
Depreciation, Depletion and Amortization.
Depreciation, depletion and amortization increased primarily as a result of acquisitions and growth projects including:
|
•
|
depreciation and amortization related to Sunoco Logistics of $265 million in 2013 compared to $63 million from October 5, 2012 through December 31, 2012;
|
|
•
|
depreciation and amortization related to Sunoco, Inc. of $113 million in 2013 compared to $32 million from October 5, 2012 through December 31, 2012;
|
77
|
•
|
depreciation and amortization related to Southern Union of $189 million in 2013 compared to $179 million from March 26, 2012 through December 31, 2012; and
|
|
•
|
additional depreciation, depletion and amortization recorded from assets placed in service in 2013 and 2012.
|
Interest Expense, Net of Interest Capitalized.
Interest expense increased primarily due to the following:
|
•
|
interest expense related to Sunoco Logistics of $76 million in 2013 compared to $14 million from October 5, 2012 through December 31, 2012;
|
|
•
|
interest expense related to Sunoco, Inc. of $33 million in 2013 compared to $9 million from October 5, 2012 through December 31, 2012;
|
|
•
|
incremental interest expense due to ETP’s issuance of $1.25 billion of senior notes in January 2013 and $1.5 billion of senior notes in September 2013; and
|
|
•
|
an increase of $42 million related to Regency primarily due to its issuance of $700 million of senior notes in October 2012, $600 million of senior notes in April 2013 and $400 million of senior notes in September 2013; partially offset by
|
|
•
|
a reduction of $25 million for the Parent Company primarily related to a $1.1 billion principal paydown of the Parent Company’s $2 billion term loan in April 2013.
|
Bridge Loan Related Fees.
The bridge loan commitment fee recognized during the year ended December 31, 2012 was incurred in connection with the Southern Union Merger. The Parent Company obtained permanent financing for the transaction through a $2 billion senior secured term loan which was funded upon closing of the Southern Union Merger on March 26, 2012.
Gain on Deconsolidation of Propane Business.
ETP recognized a gain on deconsolidation related to the contribution of its Propane Business to AmeriGas in January 2012.
Gain on Sale of AmeriGas Common Units.
In July 2013, ETP sold 7.5 million of the AmeriGas common units that ETP originally received in connection with the contribution of its Propane Business to AmeriGas in January 2012. ETP recorded a gain based on the sale proceeds in excess of the carrying amount of the units sold.
Goodwill Impairment.
In 2013, Lake Charles LNG recorded a
$689 million
goodwill impairment. See additional discussion in the analysis of consolidated results for the year ended December 31, 2014 compared to the year ended December 31, 2013.
Gains (Losses) on Interest Rate Derivatives.
Gains on interest rate derivatives during the year ended December 31, 2013 resulted from increases in forward interest rates, which caused our forward-starting swaps to increase in value. These swaps are marked to fair value for accounting purposes with changes in value recorded in earnings each period. Conversely, decreases in forward interest rates resulted in losses on interest rate derivatives during the year ended December 31, 2012.
Unrealized Gains on Commodity Risk Management Activities.
See discussion of the unrealized gains on commodity risk management activities included in the discussion of segment results below.
Inventory Valuation Adjustments.
Inventory valuation reserve adjustments were recorded for the inventory associated with ETP’s retail marketing operations as a result of commodity price changes between periods.
Losses on Extinguishments of Debt.
For the year ended December 31, 2013, the loss on extinguishment of debt was primarily related to ETE’s refinancing transactions completed in December 2013. For the year ended December 31, 2012, ETP recognized a loss on extinguishment of debt in connection with its repurchase of approximately $750 million in aggregate principal amount of senior notes in January 2012. In addition, Regency recognized a $7 million loss on extinguishment of debt in connection with its repurchase of senior notes in June 2013 and an $8 million loss in connection with its repurchases of senior notes in May 2012.
Adjusted EBITDA Related to Discontinued Operations.
For the year ended December 31, 2013, amounts reflected Southern Union’s distribution operations through the date of sale. Southern Union completed the sales of the assets of MGE in September 2013 and the assets of NEG in December 2013. For the year ended December 31, 2012, amounts reflected the operations of Canyon, which was sold in October 2012, and, for the period from March 26, 2012 to December 31, 2012, Southern Union’s distribution operations. See additional discussion of results in “Segment Operating Results” below.
Adjusted EBITDA Related to Unconsolidated Affiliates and Equity in Earnings of Unconsolidated Affiliates.
Amounts reflected primarily include our proportionate share of such amounts related to AmeriGas, FEP, HPC and MEP, as well as Citrus beginning March 26, 2012. See additional discussion of results in “Segment Operating Results” below.
78
Non-Operating Environmental Remediation.
Non-operating environmental remediation was primarily related to Sunoco, Inc.’s recognition of environmental obligations related to closed sites.
Other, net.
Includes amortization of regulatory assets and other income and expense amounts.
Income Tax Expense from Continuing Operations.
Income tax expense increased primarily due to the acquisitions of Southern Union and Sunoco, Inc. in 2012, both of which are taxable corporations.
Segment Operating Results
Investment in ETP
|
|
Years Ended December 31,
|
|
|||||||||
|
|
2013
|
2012
|
Change
|
||||||||
|
Revenues
|
$
|
46,339
|
|
$
|
15,702
|
|
$
|
30,637
|
|
||
|
Cost of products sold
|
41,204
|
|
12,266
|
|
28,938
|
|
|||||
|
Gross margin
|
5,135
|
|
3,436
|
|
1,699
|
|
|||||
|
Unrealized (gains) losses on commodity risk management activities
|
(51
|
)
|
9
|
|
(60
|
)
|
|||||
|
Operating expenses, excluding non-cash compensation expense
|
(1,428
|
)
|
(947
|
)
|
(481
|
)
|
|||||
|
Selling, general and administrative, excluding non-cash compensation expense
|
(396
|
)
|
(408
|
)
|
12
|
|
|||||
|
Inventory valuation adjustments
|
(3
|
)
|
75
|
|
(78
|
)
|
|||||
|
Adjusted EBITDA related to discontinued operations
|
76
|
|
99
|
|
(23
|
)
|
|||||
|
Adjusted EBITDA related to unconsolidated affiliates
|
629
|
|
480
|
|
149
|
|
|||||
|
Other, net
|
(9
|
)
|
—
|
|
(9
|
)
|
|||||
|
Segment Adjusted EBITDA
|
$
|
3,953
|
|
$
|
2,744
|
|
$
|
1,209
|
|
||
Gross Margin.
For the year ended December 31, 2013 compared to the prior year, ETP’s gross margin increased primarily as a result of the net impact of the following:
|
•
|
The year ended December 31, 2013 reflected a full year of operations of Sunoco Logistics and ETP’s retail marketing operations which were acquired October 5, 2012. Gross margin included in our consolidated results related to Sunoco Logistics and ETP’s retail marketing operations increased $761 million and $693 million, respectively, between periods.
|
|
•
|
Revenues from ETP’s interstate transportation and storage operations increased $200 million primarily as a result of ETP’s consolidation of Southern Union’s transportation and storage operations beginning March 26, 2012 and the recognition of $52 million received in connection with the buyout of a Southern Union customer’s contract.
|
|
•
|
Gross margin related to ETP’s liquids transportation and services operations increased $183 million as a result of (i) increases in transportation margin as a result of higher volumes transported out of West Texas due to the completion expansion projects and (ii) higher processing and fractionation margin due to the completion of Lone Star’s fractionators in December 2012 and December 2013.
|
|
•
|
These increases were partially offset by a decrease of $82 million in gross margin related to ETP’s intrastate transportation and storage operations primarily due to the cessation of long-term transportation contracts.
|
|
•
|
These increases were further offset by a decrease of $10 million in gross margin related to ETP’s midstream operations primarily related to the deconsolidation of SUGS.
|
Unrealized (Gains) Losses on Commodity Risk Management Activities.
Unrealized (gains) losses on commodity risk management activities primarily reflected the net impact from unrealized gains and losses on natural gas storage and non-storage derivatives, as well as fair value adjustments to inventory. The increase in unrealized gains on commodity risk management activities for 2013 compared to 2012 was primarily attributable to natural gas storage inventory and related derivatives.
Operating Expenses, Excluding Non-Cash Compensation Expense.
For the year ended December 31, 2013 compared to the prior year, ETP’s operating expense increased primarily as a result of a full year of operations related to Sunoco Logistics and ETP’s retail marketing operations which were acquired on October 5, 2012. Operating expenses included in our consolidated results related to Sunoco Logistics and ETP’s retail marketing operations increased $90 million and $343 million, respectively, between
79
periods. In addition, ETP’s interstate transportation and storage’s operating expenses increased $76 million primarily as a result of ETP’s consolidation of Southern Union. Operating expenses for ETP’s liquids transportation and services operations increased approximately $46 million primarily due to additional expenses from assets being placed in service. These increases were partially offset by decreases in ETP’s operating expenses due to its deconsolidation of certain operations during the periods, including ETP’s retail propane operations in January 2012 and SUGS in April 2013.
Selling, General and Administrative, Excluding Non-Cash Compensation Expense.
For the year ended December 31, 2013 compared to the prior year, ETP’s selling, general and administrative expenses increased primarily as a result of a full year of operations related to Sunoco Logistics and ETP’s retail marketing operations which were acquired on October 5, 2012. Selling, general and administrative expenses included in our consolidated results related to Sunoco Logistics and ETP’s retail marketing operations increased $57 million and $57 million, respectively, between periods. These increases were partially offset by decreases in ETP’s interstate transportation and storage operations and midstream operations of $64 million and $42 million, respectively, primarily as a result of merger-related expenses recorded in 2012 and cost reduction initiatives in 2013.
Adjusted EBITDA Related to Discontinued Operations.
In 2013, amounts reflect Southern Union’s distribution operations through the date of sale. Southern Union completed the sales of the assets of MGE in September 2013 and the assets of NEG in December 2013. In 2012, amounts reflect the operations of Canyon, which was sold in October 2012, and, for the period from March 26, 2012 to December 31, 2012, Southern Union’s distribution operations.
Adjusted EBITDA Related to Unconsolidated Affiliates.
ETP’s Adjusted EBITDA related to unconsolidated affiliates for the years ended December 31, 2013 and 2012 consisted of the following:
|
Years Ended December 31,
|
|||||||||||
|
2013
|
2012
|
Change
|
|||||||||
|
AmeriGas
|
$
|
175
|
|
$
|
139
|
|
$
|
36
|
|
||
|
Citrus
|
296
|
|
228
|
|
68
|
|
|||||
|
FEP
|
75
|
|
77
|
|
(2
|
)
|
|||||
|
Regency
|
66
|
|
—
|
|
66
|
|
|||||
|
PES
|
(30
|
)
|
26
|
|
(56
|
)
|
|||||
|
Other
|
47
|
|
10
|
|
37
|
|
|||||
|
Total Adjusted EBITDA related to unconsolidated affiliates
|
$
|
629
|
|
$
|
480
|
|
$
|
149
|
|
||
Amounts reflected above include a partial period for Citrus and AmeriGas in 2012 and a partial period for Regency in 2013.
Other.
Other amounts in 2013 were primarily related to Sunoco, Inc.’s recognition of environmental obligations related to closed sites.
Investment in Regency
|
|
Years Ended December 31,
|
|
|||||||||
|
|
2013
|
2012
|
Change
|
||||||||
|
Revenues
|
$
|
2,521
|
|
$
|
2,000
|
|
$
|
521
|
|
||
|
Cost of products sold
|
1,793
|
|
1,387
|
|
406
|
|
|||||
|
Gross margin
|
728
|
|
613
|
|
115
|
|
|||||
|
Unrealized (gains) losses on commodity risk management activities
|
9
|
|
(5
|
)
|
14
|
|
|||||
|
Operating expenses, excluding non-cash compensation expense
|
(296
|
)
|
(228
|
)
|
(68
|
)
|
|||||
|
Selling, general and administrative, excluding non-cash compensation expense
|
(81
|
)
|
(95
|
)
|
14
|
|
|||||
|
Adjusted EBITDA related to unconsolidated affiliates
|
250
|
|
222
|
|
28
|
|
|||||
|
Other, net
|
(2
|
)
|
10
|
|
(12
|
)
|
|||||
|
Segment Adjusted EBITDA
|
$
|
608
|
|
$
|
517
|
|
$
|
91
|
|
||
Gross Margin
. Regency’s gross margin increased for the year ended December 31, 2013 compared to the prior year primarily due to increased volumes in Regency’s South and West Texas gathering and processing operations.
80
Operating Expenses, Excluding Non-Cash Compensation Expense.
Regency’s operating expenses increased primarily due to the consolidation of SUGS beginning March 26, 2012 and increased pipeline and plant operating activity from organic growth.
Selling, General and Administrative, Excluding Non-Cash Compensation Expense.
Regency’s selling, general and administrative expenses decreased due to the elimination of the amount allocated to SUGS assets by the previous parent and the decrease in management fees paid to ETE, partially offset by an increase in legal and consulting fees.
Adjusted EBITDA Related to Unconsolidated Affiliates.
Regency’s adjusted EBITDA related to unconsolidated affiliates increased $30 million primarily due to the impact from Lone Star.
Other.
Regency’s other decreased primarily as the result of recognition of a one-time producer payment received in March 2012 related to an assignment of certain contracts.
Investment in Lake Charles LNG
|
|
Years Ended December 31,
|
||||||||||
|
|
2013
|
2012
|
Change
|
||||||||
|
Revenues
|
$
|
216
|
|
$
|
166
|
|
$
|
50
|
|
||
|
Operating expenses, excluding non-cash compensation expense
|
(20
|
)
|
(12
|
)
|
(8
|
)
|
|||||
|
Selling, general and administrative, excluding non-cash compensation expense
|
(9
|
)
|
(19
|
)
|
10
|
|
|||||
|
Segment Adjusted EBITDA
|
$
|
187
|
|
$
|
135
|
|
$
|
52
|
|
||
Amounts reflected above include the results of Lake Charles LNG beginning March 26, 2012, the date which ETE obtained control of Trunkline LNG through the acquistion of Southern Union.
Lake Charles LNG derives all of its revenue from a contract with a non-affiliated gas marketer.
Operating Expenses, Excluding Non-Cash Compensation Expense.
For the year ended December 31, 2013 compared to the prior year, Lake Charles LNG’s operating expense increased primarily as a result of a full year of operations which were consolidated beginning on March 26, 2012.
Selling, General and Administrative, Excluding Non-Cash Compensation Expense.
The decrease in expenses compared to the prior year was primarily a result of $9 million of merger-related expenses recorded in 2012.
81
Supplemental Pro Forma Financial Information
The following unaudited pro forma consolidated financial information of ETP has been prepared in accordance with Article 11 of Regulation S-X and reflects the pro forma impacts of the Propane Transaction, Sunoco Merger and ETP Holdco Transaction for the years ended December 31, 2012, giving effect that each occurred on January 1, 2012. This unaudited pro forma financial information is provided to supplement the discussion and analysis of the historical financial information and should be read in conjunction with such historical financial information. This unaudited pro forma information is for illustrative purposes only and is not necessarily indicative of the financial results that would have occurred if the Sunoco Merger and ETP Holdco Transaction had been consummated on January 1, 2012.
The following table presents the pro forma financial information for the year ended December 31, 2012:
|
ETE Historical
|
Propane Transaction
(a)
|
Sunoco, Inc. Historical
(b)
|
Southern Union Historical
(c)
|
ETP Holdco Pro Forma Adjustments
(d)
|
Pro Forma
|
||||||||||||||||||
|
REVENUES
|
$
|
16,964
|
|
$
|
(93
|
)
|
$
|
35,258
|
|
$
|
443
|
|
$
|
(12,174
|
)
|
$
|
40,398
|
|
|||||
|
COSTS AND EXPENSES:
|
|||||||||||||||||||||||
|
Cost of products sold and operating expenses
|
14,204
|
|
(80
|
)
|
33,142
|
|
302
|
|
(11,193
|
)
|
36,375
|
|
|||||||||||
|
Depreciation, depletion and amortization
|
871
|
|
(4
|
)
|
168
|
|
49
|
|
76
|
|
1,160
|
|
|||||||||||
|
Selling, general and administrative
|
529
|
|
(1
|
)
|
459
|
|
11
|
|
(119
|
)
|
879
|
|
|||||||||||
|
Impairment charges
|
—
|
|
124
|
|
(22
|
)
|
102
|
|
|||||||||||||||
|
Total costs and expenses
|
15,604
|
|
(85
|
)
|
33,893
|
|
362
|
|
(11,258
|
)
|
38,516
|
|
|||||||||||
|
OPERATING INCOME
|
1,360
|
|
(8
|
)
|
1,365
|
|
81
|
|
(916
|
)
|
1,882
|
|
|||||||||||
|
OTHER INCOME (EXPENSE):
|
|||||||||||||||||||||||
|
Interest expense, net of interest capitalized
|
(1,080
|
)
|
(24
|
)
|
(123
|
)
|
(50
|
)
|
2
|
|
(1,275
|
)
|
|||||||||||
|
Equity in earnings of affiliates
|
212
|
|
19
|
|
41
|
|
16
|
|
5
|
|
293
|
|
|||||||||||
|
Gain on deconsolidation of Propane Business
|
1,057
|
|
(1,057
|
)
|
—
|
|
—
|
|
—
|
|
—
|
|
|||||||||||
|
Gain on formation of Philadelphia Energy Solutions
|
—
|
|
—
|
|
1,144
|
|
—
|
|
(1,144
|
)
|
—
|
|
|||||||||||
|
Loss on extinguishment of debt
|
(123
|
)
|
115
|
|
—
|
|
—
|
|
—
|
|
(8
|
)
|
|||||||||||
|
Losses on interest rate derivatives
|
(19
|
)
|
—
|
|
—
|
|
—
|
|
—
|
|
(19
|
)
|
|||||||||||
|
Other, net
|
30
|
|
2
|
|
118
|
|
(2
|
)
|
(2
|
)
|
146
|
|
|||||||||||
|
INCOME FROM CONTINUING OPERATIONS BEFORE INCOME TAX EXPENSE (BENEFIT)
|
1,437
|
|
(953
|
)
|
2,545
|
|
45
|
|
(2,055
|
)
|
1,019
|
|
|||||||||||
|
Income tax expense (benefit)
|
54
|
|
—
|
|
956
|
|
12
|
|
(871
|
)
|
151
|
|
|||||||||||
|
INCOME FROM CONTINUING OPERATIONS
|
$
|
1,383
|
|
$
|
(953
|
)
|
$
|
1,589
|
|
$
|
33
|
|
$
|
(1,184
|
)
|
$
|
868
|
|
|||||
(a) Propane Transaction adjustments reflect the following:
|
•
|
The adjustments reflect the deconsolidation of ETP’s propane operations in connection with the Propane Transaction.
|
|
•
|
The adjustments reflect the pro forma impacts from the consideration received in connection with the Propane Transaction, including ETP’s receipt of AmeriGas common units and ETP’s use of cash proceeds from the transaction to redeem long-term debt.
|
|
•
|
The 2012 adjustments include the elimination of (i) the gain recognized by ETP in connection with the deconsolidation of the Propane Business and (ii) ETP’s loss on extinguishment of debt recognized in connection with the use of proceeds to redeem of long-term debt.
|
(b) Sunoco, Inc. historical amounts in 2012 include only the period from January 1, 2012 through September 30, 2012.
(c) Southern Union historical amounts in 2012 include only the period from January 1, 2012 through March 25, 2012.
82
(d) Substantially all of the ETP Holdco pro forma adjustments relate to Sunoco, Inc.’s exit from its Northeast refining operations and formation of the PES joint venture, except for the following:
|
•
|
The adjustment to depreciation, depletion and amortization reflects incremental amounts for estimated fair values recorded in purchase accounting related to Sunoco and Southern Union.
|
|
•
|
The adjustment to selling, general and administrative expenses includes the elimination of merger-related costs incurred, because such costs would not have a continuing impact on results of operations.
|
|
•
|
The adjustment to interest expense includes incremental amortization of fair value adjustments to debt recorded in purchase accounting.
|
|
•
|
The adjustment to equity in earnings of affiliates reflects the reversal of amounts related to Citrus recorded in Southern Union’s historical income statements.
|
|
•
|
The adjustment to income tax expense includes the pro forma impact resulting from the pro forma adjustments to pre-tax income of Sunoco, Inc. and Southern Union.
|
LIQUIDITY AND CAPITAL RESOURCES
Overview
Parent Company Only
The Parent Company’s principal sources of cash flow are derived from its direct and indirect investments in the limited partner and general partner interests in ETP and Regency and cash flows from the operations of Lake Charles LNG. The amount of cash that ETP and Regency distribute to their respective partners, including the Parent Company, each quarter is based on earnings from their respective business activities and the amount of available cash, as discussed below. In connection with previous transactions, we have relinquished a portion of our incentive distributions to be received from ETP and Regency, see additional discussion under “Cash Distributions.”
The Parent Company’s primary cash requirements are for general and administrative expenses, debt service requirements and distributions to its partners. The Parent Company currently expects to fund its short-term needs for such items with cash flows from its direct and indirect investments in ETP, Regency and Lake Charles LNG. The Parent Company distributes its available cash remaining after satisfaction of the aforementioned cash requirements to its Unitholders on a quarterly basis.
We expect ETP, Regency and Lake Charles LNG and their respective subsidiaries to utilize their resources, along with cash from their operations, to fund their announced growth capital expenditures and working capital needs; however, the Parent Company may issue debt or equity securities from time to time, as we deem prudent to provide liquidity for new capital projects of our subsidiaries or for other partnership purposes.
83
ETP
ETP’s ability to satisfy its obligations and pay distributions to its Unitholders will depend on its future performance, which will be subject to prevailing economic, financial, business and weather conditions, and other factors, many of which are beyond the control of ETP’s management.
ETP currently expects capital expenditures in
2015
to be within the following ranges:
|
|
Growth
|
Maintenance
|
|||||||||||||
|
|
Low
|
High
|
Low
|
High
|
|||||||||||
|
Direct
(1)
:
|
|||||||||||||||
|
Intrastate transportation and storage
|
$
|
30
|
|
$
|
40
|
|
$
|
30
|
|
$
|
35
|
|
|||
|
Interstate transportation and storage
(2)
|
1,000
|
|
1,100
|
|
125
|
|
130
|
|
|||||||
|
Midstream
|
550
|
|
650
|
|
10
|
|
15
|
|
|||||||
|
Liquids transportation and services
(2)(3)
|
2,500
|
|
2,600
|
|
20
|
|
25
|
|
|||||||
|
Retail marketing
(4)
|
185
|
|
235
|
|
80
|
|
100
|
|
|||||||
|
All other (including eliminations)
|
20
|
|
25
|
|
10
|
|
20
|
|
|||||||
|
Total direct capital expenditures
|
4,285
|
|
4,650
|
|
275
|
|
325
|
|
|||||||
|
Indirect
(1)
:
|
|||||||||||||||
|
Investment in Sunoco Logistics
|
1,800
|
|
2,200
|
|
70
|
|
90
|
|
|||||||
|
Investment in Sunoco LP
(4)
|
165
|
|
215
|
|
15
|
|
25
|
|
|||||||
|
Total indirect capital expenditures
|
1,965
|
|
2,415
|
|
85
|
|
115
|
|
|||||||
|
Total projected capital expenditures
|
$
|
6,250
|
|
$
|
7,065
|
|
$
|
360
|
|
$
|
440
|
|
|||
|
(1)
|
Indirect capital expenditures comprise those funded by ETP’s publicly traded subsidiaries; all other capital expenditures are reflected as direct capital expenditures.
|
|
(2)
|
Includes capital expenditures related to our proportionate ownership of the Bakken and Rover pipeline projects.
|
|
(3)
|
Includes 100% of Lone Star’s capital exp
enditures. ETP expects to receive capital contributions from Regency related to its 30% share of Lone Star of between
$350 million
and
$400 million
.
|
|
(4)
|
ETP’s retail marketing operations include the investment in Sunoco LP, as well as ETP’s wholly-owned retail marketing operations. Capital expenditures by Sunoco LP are reflected as indirect because Sunoco LP is a publicly traded subsidiary.
|
The assets used in ETP’s natural gas and liquids operations, including pipelines, gathering systems and related facilities, are generally long-lived assets and do not require significant maintenance capital expenditures. Accordingly, ETP does not have any significant financial commitments for maintenance capital expenditures in its businesses. From time to time it experiences increases in pipe costs due to a number of reasons, including but not limited to, delays from steel mills, limited selection of mills capable of producing large diameter pipe in a timely manner, higher steel prices and other factors beyond ETP’s control. However, ETP includes these factors in its anticipated growth capital expenditures for each year.
ETP generally funds its maintenance capital expenditures and distributions with cash flows from operating activities. ETP generally funds growth capital expenditures with proceeds from borrowings under credit facilities, long-term debt, the issuance of additional Common Units or a combination thereof.
As of
December 31, 2014
, in addition to
$639 million
of cash on hand, ETP had available capacity under its revolving credit facilities of
$1.81 billion
. Based on ETP’s current estimates, it expects to utilize capacity under the ETP Credit Facility, along with cash from operations, to fund its announced growth capital expenditures and working capital needs through the end of 2015; however, ETP may issue debt or equity securities prior to that time as it deems prudent to provide liquidity for new capital projects, to maintain investment grade credit metrics or other partnership purposes.
Sunoco Logistics’ primary sources of liquidity consist of cash generated from operating activities and borrowings under its
$1.50 billion
credit facility. At
December 31, 2014
, Sunoco Logistics had available borrowing capacity of
$1.35 billion
under its revolving credit facility. Sunoco Logistics’ capital position reflects crude oil and refined products inventories based on historical costs under the last-in, first-out (“LIFO”) method of accounting. Sunoco Logistics periodically supplements its cash flows from operations with proceeds from debt and equity financing activities.
84
Sunoco LP’s primary sources of liquidity consist of cash generated from operating activities and borrowings under its
$1.25 billion
credit facility. At
December 31, 2014
, Sunoco LP had available borrowing capacity of
$567 million
under its revolving credit facility.
Regency
Regency expects its sources of liquidity to include: cash generated from operations and occasional asset sales; borrowings under the Regency Credit Facility; distributions received from unconsolidated affiliates; debt offerings; and issuance of additional partnership units.
In 2015, Regency expects to invest
$1.60 billion
in growth capital expenditures, of which $1.00 billion is expected to be invested in organic growth projects in the gathering and processing operations; $400 million is expected to be invested in Regency’s portion of growth capital expenditures in its NGL services operations; and $200 million is expected to be invested in growth capital expenditures in its contract services operations. In addition, Regency expects to invest $100 million in maintenance capital expenditures in 2015, including its proportionate share related to joint ventures.
Regency may revise the timing of these expenditures as necessary to adapt to economic conditions. Regency expects to fund its growth capital expenditures with borrowings under its revolving credit facility and a combination of debt and equity issuances.
Cash Flows
Our cash flows may change in the future due to a number of factors, some of which we cannot control. These factors include regulatory changes, the price of our subsidiaries’ products and services, the demand for such products and services, margin requirements resulting from significant changes in commodity prices, operational risks, the successful integration of our acquisitions, and other factors.
Operating Activities
Changes in cash flows from operating activities between periods primarily result from changes in earnings (as discussed in “Results of Operations” above), excluding the impacts of non-cash items and changes in operating assets and liabilities. Non-cash items include recurring non-cash expenses, such as depreciation, depletion and amortization expense and non-cash compensation expense. The increase in depreciation, depletion and amortization expense during the periods presented primarily resulted from construction and acquisition of assets, while changes in non-cash unit-based compensation expense resulted from changes in the number of units granted and changes in the grant date fair value estimated for such grants. Cash flows from operating activities also differ from earnings as a result of non-cash charges that may not be recurring, such as impairment charges and allowance for equity funds used during construction. The allowance for equity funds used during construction increases in periods when ETP has a significant amount of interstate pipeline construction in progress. Changes in operating assets and liabilities between periods result from factors such as the changes in the value of price risk management assets and liabilities, timing of accounts receivable collection, payments on accounts payable, the timing of purchases and sales of inventories, and the timing of advances and deposits received from customers.
Following is a summary of operating activities by period:
Year Ended December 31, 2014
Cash provided by operating activities in 2014 was
$3.18 billion
and net income was
$1.12 billion
. The difference between net income and cash provided by operating activities in 2014 consisted of net non-cash items totaling
$1.99 billion
and changes in operating assets and liabilities of
$231 million
. The non-cash activity in 2014 consisted primarily of depreciation, depletion and amortization of
$1.72 billion
, goodwill impairment of
$370 million
, inventory valuation adjustments of
$473 million
, losses on extinguishments of debt of
$25 million
and non-cash compensation expense of
$82 million
, partially offset by the gain on the sale of AmeriGas common units of
$177 million
and a deferred income tax benefit of
$50 million
.
Year Ended December 31, 2013
Cash provided by operating activities in 2013 was $2.42 billion and net income was $315 million. The difference between net income and cash provided by operating activities in 2013 consisted of net non-cash items totaling $1.94 billion and changes in operating assets and liabilities of $149 million. The non-cash activity consisted primarily of depreciation, depletion and amortization of $1.31 billion, goodwill impairment of $689 million, deferred income taxes of $43 million, losses on extinguishments of debt of $162 million and non-cash compensation expense of $61 million.
85
Year Ended December 31, 2012
Cash provided by operating activities in 2012 was $1.08 billion and net income was $1.27 billion. The difference between net income and cash provided by operating activities in 2012 consisted of net non-cash items totaling $85 million and changes in operating assets and liabilities of $551 million. The non-cash activity consisted primarily of a gain on the deconsolidation of ETP’s propane business of $1.06 billion, which was offset by depreciation, depletion and amortization of $871 million, losses on extinguishments of debt of $123 million and non-cash compensation expense of $47 million.
Investing Activities
Cash flows from investing activities primarily consist of cash amounts paid for acquisitions, capital expenditures, and cash contributions to ETP’s and Regency’s joint ventures. Changes in capital expenditures between periods primarily result from increases or decreases in ETP’s or Regency’s growth capital expenditures to fund their respective construction and expansion projects.
Following is a summary of investing activities by period:
Year Ended December 31, 2014
Cash used in investing activities in 2014 of
$6.80 billion
was comprised primarily of capital expenditures of $5.34 billion (excluding the allowance for equity funds used during construction and net of contributions in aid of construction costs). ETP invested
$4.14 billion
for growth capital expenditures and
$343 million
for maintenance capital expenditures during 2014. Regency invested $1.20 billion for growth capital expenditures and $98 million for maintenance capital expenditures during 2014. We paid cash for acquisitions of
$2.37 billion
and received
$814 million
in cash received from the sale of AmeriGas common units.
Year Ended December 31, 2013
Cash used in investing activities in 2013 of $2.35 billion was comprised primarily of capital expenditures of $3.45 billion (excluding the allowance for equity funds used during construction and net of contributions in aid of construction costs). ETP invested $2.11 billion for growth capital expenditures and $343 million for maintenance capital expenditures during 2013. Regency invested $948 million for growth capital expenditures and $48 million for maintenance capital expenditures during 2013. These expenditures were partially offset by $1.01 billion and $346 million of cash received from the sale of the MGE and NEG assets and the sale of AmeriGas common units, respectively. In addition, ETP paid net cash of $405 million for acquisitions.
Year Ended December 31, 2012
Cash used in investing activities in 2012 of $4.20 billion was comprised primarily of capital expenditures of $3.24 billion (excluding the allowance for equity funds used during construction and net of contributions in aid of construction costs). ETP invested $2.74 billion for growth capital expenditures and $313 million for maintenance capital expenditures during 2012. Regency invested $945 million for growth capital expenditures and $58 million for maintenance capital during 2012 (including amounts related to SUGS). Cash paid for the acquisition of Southern Union was $2.97 billion and ETP received $1.44 billion in proceeds from the contribution of propane.
Financing Activities
Changes in cash flows from financing activities between periods primarily result from changes in the levels of borrowings and equity issuances, which are primarily used to fund ETP’s and Regency’s acquisitions and growth capital expenditures. Distributions increase between the periods based on increases in the number of common units outstanding or increases in the distribution rate.
Following is a summary of financing activities by period:
Year Ended December 31, 2014
Cash provided by financing activities was
$3.88 billion
in 2014. We had a consolidated increase in our debt level of
$4.49 billion
, primarily due to Regency’s issuance of senior notes and assumption and debt, and Sunoco Logistics’ issuance of
$2.00 billion
in aggregate principal amount of senior notes in April 2014 and November 2014 (see
Note 6
to our consolidated financial statements) and an increase of the Parent Company’s debt of $1.88 billion. Our subsidiaries also received
$3.06 billion
in proceeds from common unit offerings, including
$1.38 billion
from the issuance of ETP Common Units, $428 million from the issuance of Regency Common Units and $1.25 billion from the issuance of other subsidiary common units. We paid distributions to partners of
$821 million
, and our subsidiaries paid
$1.91 billion
on limited partner interests other than those held by the Parent Company. We also paid
$1.00 billion
to repurchase common units during the year ended December 31, 2014.
86
Year Ended December 31, 2013
Cash provided by financing activities was $146 million in 2013. We had a consolidated increase in our debt level of $983 million, primarily due to ETP’s issuance of $1.25 billion and $1.50 billion in aggregate principal amount of senior notes in January 2013 and September 2013, respectively, and Sunoco Logistics’ issuance of $700 million in aggregate principal amount of senior notes in January 2013 (see
Note 6
to our consolidated financial statements). Our subsidiaries also received $1.76 billion in proceeds from common unit offerings, which consisted of $1.61 billion from the issuance of ETP Common Units and $149 million from the issuance of Regency Common Units. We paid distributions to partners of $733 million, and our subsidiaries paid $1.43 billion on limited partner interests other than those held by the Parent Company. We also paid $340 million to redeem our Preferred Units.
Year Ended December 31, 2012
Cash provided by financing activities was $3.36 billion in 2012. We had a consolidated increase in our debt level of $4.02 billion, which primarily consisted of borrowings to fund our acquisitions of Southern Union and Sunoco, Inc. Our subsidiaries also received $1.10 billion in proceeds from common unit offerings, which consisted of $791 million from the issuance of ETP Common Units and $312 million from the issuance of Regency Common Units. We paid distributions to partners of $666 million and $24 million to the holders of our Preferred Units. In addition, our subsidiaries paid $1.02 billion on limited partner interests other than those held by the Parent Company.
Description of Indebtedness
Our outstanding consolidated indebtedness was as follows:
|
December 31,
|
|||||||
|
2014
|
2013
|
||||||
|
Parent Company Indebtedness:
|
|||||||
|
ETE Senior Notes due October 15, 2020
|
$
|
1,187
|
|
$
|
1,187
|
|
|
|
ETE Senior Notes due January 15, 2024
|
1,150
|
|
450
|
|
|||
|
ETE Senior Secured Term Loan, due December 2, 2019
|
1,400
|
|
1,000
|
|
|||
|
ETE Senior Secured Revolving Credit Facility due December 2, 2018
|
940
|
|
171
|
|
|||
|
Subsidiary Indebtedness:
|
|||||||
|
ETP Senior Notes
|
10,890
|
|
11,182
|
|
|||
|
Panhandle Senior Notes
|
1,085
|
|
1,085
|
|
|||
|
PVR Senior Notes
|
790
|
|
—
|
|
|||
|
Regency Senior Notes
|
4,299
|
|
2,800
|
|
|||
|
Sunoco, Inc. Senior Notes
|
715
|
|
965
|
|
|||
|
Sunoco Logistics Senior Notes
|
3,975
|
|
2,150
|
|
|||
|
Transwestern Senior Notes
|
782
|
|
870
|
|
|||
|
Revolving Credit Facilities:
|
|||||||
|
ETP $2.5 billion Revolving Credit Facility due October 27, 2019
|
570
|
|
65
|
|
|||
|
Regency $1.5 billion Revolving Credit Facility due November 25, 2019
|
1,504
|
|
510
|
|
|||
|
Sunoco Logistics’ subsidiary $35 million Revolving Credit Facility due April 30, 2015
|
35
|
|
35
|
|
|||
|
Sunoco Logistics $1.50 billion Revolving Credit Facility due November 19, 2018
|
150
|
|
200
|
|
|||
|
Sunoco LP $1.25 billion Revolving Credit Facility due September 25, 2019
|
683
|
|
—
|
|
|||
|
Other Long-Term Debt
|
223
|
|
228
|
|
|||
|
Unamortized premiums and fair value adjustments, net
|
283
|
|
301
|
|
|||
|
Total debt
|
30,661
|
|
23,199
|
|
|||
|
Less: current maturities of long-term debt
|
1,008
|
|
637
|
|
|||
|
Long-term debt, less current maturities
|
$
|
29,653
|
|
$
|
22,562
|
|
|
The terms of our consolidated indebtedness and our subsidiaries are described in more detail below and in Note
6
to our consolidated financial statements.
87
ETE Term Loan Facility
The Parent Company has a Senior Secured Term Loan Agreement (the “ETE Term Credit Agreement”), which has a scheduled maturity date of December 2, 2019, with an option to extend the term subject to the terms and conditions set forth therein. Pursuant to the ETE Term Credit Agreement, the lenders have provided senior secured financing in an aggregate principal amount of
$1.0 billion
(the “ETE Term Loan Facility”). The Parent Company shall not be required to make any amortization payments with respect to the term loans under the Term Credit Agreement. Under certain circumstances, the Partnership is required to repay the term loan in connection with dispositions of (a) incentive distribution rights in ETP or Regency, (b) general partnership interests in Regency or (c) equity interests of any Person which owns, directly or indirectly, incentive distribution rights in ETP or Regency or general partnership interests in Regency, in each case, yielding net proceeds in excess of
$50 million
.
Under the Term Credit Agreement, the obligations of the Parent Company are secured by a lien on substantially all of the Parent Company’s and certain of its subsidiaries’ tangible and intangible assets, subject to certain exceptions and permitted liens. The ETE Term Loan Facility initially is not guaranteed by any of the Parent Company’s subsidiaries.
Interest accrues on advances at a LIBOR rate or a base rate plus an applicable margin based on the election of the Parent Company for each interest period. The applicable margin for LIBOR rate loans is 2.50% and the applicable margin for base rate loans is 1.50%.
In April 2014, the Parent Company amended the ETE Term Credit Agreement to increase the aggregate principal amount to $1.4 billion. The Parent Company used the proceeds from this $400 million increase to repay borrowings under its revolving credit facility and for general partnership purposes. No other significant changes were made to the terms of the ETE Term Credit Agreement, including maturity date and interest rate.
ETE Revolving Credit Facility
The Parent Company has a credit agreement (the “Revolving Credit Agreement”), which has a scheduled maturity date of December 2, 2018, with an option for the Partnership to extend the term subject to the terms and conditions set forth therein.
Pursuant to the Revolver Credit Agreement, the lenders have committed to provide advances up to an aggregate principal amount of $600 million at any one time outstanding (the “ETE Revolving Credit Facility”), and the Parent Company has the option to request increases in the aggregate commitments provided that the aggregate commitments never exceed
$1.0 billion
. In February 2014, the Partnership increased the capacity on the ETE Revolving Credit Facility to $800 million. In May 2014, the Parent Company amended its revolving credit facility to increase the capacity to $1.2 billion. In February 2015, the Parent Company amended its revolving credit facility to increase the capacity to $1.5 billion.
As part of the aggregate commitments under the facility, the Revolver Credit Agreement provides for letters of credit to be issued at the request of the Parent Company in an aggregate amount not to exceed a
$150 million
sublimit.
Under the Revolver Credit Agreement, the obligations of the Parent Company are secured by a lien on substantially all of the Parent Company’s and certain of its subsidiaries’ tangible and intangible assets. Borrowings under the Revolver Credit Agreement are not guaranteed by any of the Parent Company’s subsidiaries.
Interest accrues on advances at a LIBOR rate or a base rate plus an applicable margin based on the election of the Parent Company for each interest period. The issuing fees for all letters of credit are also based on an applicable margin. The applicable margin used in connection with interest rates and fees is based on the then applicable leverage ratio of the Parent Company. The applicable margin for LIBOR rate loans and letter of credit fees ranges from
1.75%
to
2.50%
and the applicable margin for base rate loans ranges from
0.75%
to
1.50%
. The Parent Company will also pay a fee based on its leverage ratio on the actual daily unused amount of the aggregate commitments.
Subsidiary Indebtedness
Sunoco Logistics Senior Notes Offerings
In April 2014, Sunoco Logistics issued
$300 million
aggregate principal amount of
4.25%
senior notes due April 2024 and
$700 million
aggregate principal amount of
5.30%
senior notes due April 2044. In November 2014, Sunoco Logistics issued an additional $200 million under the April 2024 senior notes and
$800 million
aggregate principal amount of
5.35%
senior notes due May 2045. Sunoco Logistics’ used the net proceeds from the offering to pay borrowings under the Sunoco Logistics Credit Facility and for general partnership purposes.
88
Credit Facilities
ETP Credit Facility
The ETP Credit Facility allows for borrowings of up to
$2.5 billion
and expires in October 2019. The indebtedness under the ETP Credit Facility is unsecured and not guaranteed by any of ETP’s subsidiaries and has equal rights to holders of ETP’s current and future unsecured debt. The indebtedness under the ETP Credit Facility has the same priority of payment as our other current and future unsecured debt. ETP uses the ETP Credit Facility to provide temporary financing for its growth projects, as well as for general partnership purposes. In February 2015, ETP amended its revolving credit facility to increase the capacity to
$3.75 billion
.
ETP uses the ETP Credit Facility to provide temporary financing for its growth projects, as well as for general partnership purposes. ETP typically repays amounts outstanding under the ETP Credit Facility with proceeds from common unit offerings or long-term notes offerings. The timing of borrowings depends on ETP’s activities and the cash available to fund those activities. The repayments of amounts outstanding under the ETP Credit Facility depend on multiple factors, including market conditions and expectations of future working capital needs, and ultimately are a financing decision made by management. Therefore, the balance outstanding under the ETP Credit Facility may vary significantly between periods. ETP does not believe that such fluctuations indicate a significant change in its liquidity position, because it expects to continue to be able to repay amounts outstanding under the ETP Credit Facility with proceeds from common unit offerings or long-term note offerings.
As of
December 31, 2014
, the ETP Credit Facility had
$570 million
outstanding, and the amount available for future borrowings was
$1.81 billion
taking into account letters of credit of
$121 million
. The weighted average interest rate on the total amount outstanding as of
December 31, 2014
was
1.66%
.
Regency Revolving Credit Facility
The Regency Credit Facility has aggregate revolving commitments of
$2.0 billion
, with a $500 million incremental facility. The maturity date of the Regency Credit Facility is November 25, 2019.
The outstanding balance of revolving loans under the Regency Credit Facility bears interest at LIBOR plus a margin or an alternate base rate. The alternate base rate used to calculate interest on base rate loans will be calculated using the greater of a base rate, a federal funds effective rate plus
0.50%
and an adjusted one-month LIBOR rate plus
1.00%
. The applicable margin ranges from
0.625%
to
1.50%
for base rate loans and
1.625%
to
2.50%
for Eurodollar loans.
Regency pays (i) a commitment fee ranging between
0.30%
and
0.45%
per annum for the unused portion of the revolving loan commitments; (ii) a participation fee for each revolving lender participating in letters of credit ranging between
1.625%
and
2.50%
per annum of the average daily amount of such lender’s letter of credit exposure and; (iii) a fronting fee to the issuing bank of letters of credit equal to
0.20%
per annum of the average daily amount of its letter of credit exposure. The Regency Credit Facility allows for investments in its joint ventures.
As of
December 31, 2014
, Regency had a balance outstanding of
$1.50 billion
under the Regency Credit Facility in revolving credit loans and approximately
$23 million
in letters of credit. The total amount available under the Regency Credit Facility, as of
December 31, 2014
, which is reduced by any letters of credit, was approximately
$473 million
. The weighted average interest rate on the total amount outstanding as of
December 31, 2014
was
2.17%
.
Sunoco Logistics Credit Facilities
Sunoco Logistics maintains a
$1.50 billion
unsecured credit facility (the “Sunoco Logistics Credit Facility”) which matures in November 2018. The Sunoco Logistics Credit Facility contains an accordion feature, under which the total aggregate commitment may be extended to
$2.25 billion
under certain conditions.
The Sunoco Logistics Credit Facility is available to fund Sunoco Logistics’ working capital requirements, to finance acquisitions and capital projects, to pay distributions and for general partnership purposes. The Sunoco Logistics Credit Facility bears interest at LIBOR or the Base Rate, each plus an applicable margin. The credit facility may be prepaid at any time. As of
December 31, 2014
, the Sunoco Logistics Credit Facility had
$150 million
of outstanding borrowings.
West Texas Gulf Pipe Line Company, a subsidiary of Sunoco Logistics, maintains a
$35 million
revolving credit facility which expires in April 2015. The facility is available to fund West Texas Gulf’s general corporate purposes including working capital and capital expenditures. At
December 31, 2014
, this credit facility had
$35 million
of outstanding borrowings.
89
Sunoco LP Credit Facility
In September 2014, Sunoco LP entered into a
$1.25 billion
revolving credit agreement (the “Sunoco LP Credit Facility”), which expires in September 2019. The Sunoco LP Credit Facility can be increased from time to time upon Sunoco LP’s written request, subject to certain conditions, up to an additional
$250 million
. As of
December 31, 2014
, the Sunoco LP Credit Facility had
$683 million
of outstanding borrowings.
Covenants Related to Our Credit Agreements
Covenants Related to the Parent Company
The ETE Term Loan Facility and ETE Revolving Credit Facility contain customary representations, warranties, covenants, and events of default, including a change of control event of default and limitations on incurrence of liens, new lines of business, merger, transactions with affiliates and restrictive agreements.
The ETE Term Loan Facility and ETE Revolving Credit Facility contain financial covenants as follows:
|
•
|
Maximum Leverage Ratio – Consolidated Funded Debt of the Parent Company (as defined) to EBITDA (as defined in the agreements) of the Parent Company of not more than
6.0
to
1
, with a permitted increase to
7
to
1
during a specified acquisition period following the close of a specified acquisition; and
|
|
•
|
EBITDA to interest expense of not less than
1.5
to
1
.
|
Covenants Related to ETP
The agreements relating to the ETP senior notes contain restrictive covenants customary for an issuer with an investment-grade rating from the rating agencies, which covenants include limitations on liens and a restriction on sale-leaseback transactions
The credit agreement relating to the ETP Credit Facility contains covenants that limit (subject to certain exceptions) ETP’s and certain of ETP’s subsidiaries’ ability to, among other things:
|
•
|
incur indebtedness;
|
|
•
|
grant liens;
|
|
•
|
enter into mergers;
|
|
•
|
dispose of assets;
|
|
•
|
make certain investments;
|
|
•
|
make Distributions (as defined in such credit agreement) during certain Defaults (as defined in such credit agreement) and during any Event of Default (as defined in such credit agreement);
|
|
•
|
engage in business substantially different in nature than the business currently conducted by ETP and its subsidiaries;
|
|
•
|
engage in transactions with affiliates; and
|
|
•
|
enter into restrictive agreements.
|
The credit agreement relating to the ETP Credit Facility also contains a financial covenant that provides that the Leverage Ratio, as defined in the ETP Credit Facility, shall not exceed
5.0
to
1
as of the end of each quarter, with a permitted increase to
5.5
to
1
during a Specified Acquisition Period, as defined in the ETP Credit Facility.
The agreements relating to the Transwestern senior notes contain certain restrictions that, among other things, limit the incurrence of additional debt, the sale of all or substantially all assets and the payment of dividends and specify a maximum debt to capitalization ratio.
Covenants Related to Regency
The Regency senior notes contain various covenants that limit, among other things, Regency’s ability, and the ability of certain of its subsidiaries, to:
•
incur additional indebtedness;
•
pay distributions on, or repurchase or redeem equity interests;
90
•
make certain investments;
•
incur liens;
•
enter into certain types of transactions with affiliates; and
•
sell assets, consolidate or merge with or into other companies.
If the Regency senior notes achieve investment grade ratings by both Moody’s and S&P and no default or event of default has occurred and is continuing, Regency will no longer be subject to these covenants except that the liens covenant will continue to be applicable. ETP has advised Regency that it intends to provide an ETP guarantee with respect to the outstanding Regency senior notes upon the closing of the Regency merger, and it is expected that this will result in the Regency senior notes being upgrade an investment grade rating by both Moody’s and S&P.
The Regency Credit Facility contains the following financial covenants:
|
•
|
Regency’s consolidated EBITDA ratio for any preceding four fiscal quarter period, as defined in the credit agreement governing the Regency Credit Facility, must not exceed
5.00
to
1
.
|
|
•
|
Regency’s consolidated EBITDA to consolidated interest expense, as defined in the credit agreement governing the Regency Credit Facility, must be greater than
2.50
to
1
.
|
|
•
|
Regency’s consolidated senior secured leverage ratio for any preceding four fiscal quarter period, as defined in the credit agreement governing the Regency Credit Facility, must not exceed
3.25
to
1
.
|
The Regency Credit Facility also contains various covenants that limit, among other things, the ability of Regency and RGS to:
•
incur indebtedness;
•
grant liens;
•
enter into sale and leaseback transactions;
•
make certain investments, loans and advances;
•
dissolve or enter into a merger or consolidation;
•
enter into asset sales or make acquisitions;
•
enter into transactions with affiliates;
|
•
|
prepay other indebtedness or amend organizational documents or transaction documents (as defined in the credit agreement governing the Regency Credit Facility);
|
•
issue capital stock or create subsidiaries; or
|
•
|
engage in any business other than those businesses in which it was engaged at the time of the effectiveness of the Regency Credit Facility or reasonable extensions thereof.
|
Covenants Related to Panhandle
Panhandle is not party to any lending agreement that would accelerate the maturity date of any obligation due to a failure to maintain any specific credit rating, nor would a reduction in any credit rating, by itself, cause an event of default under any of Panhandle’s lending agreements. Financial covenants exist in certain of Panhandle’s debt agreements that require Panhandle to maintain a certain level of net worth, to meet certain debt to total capitalization ratios and to meet certain ratios of earnings before depreciation, interest and taxes to cash interest expense. A failure by Panhandle to satisfy any such covenant would give rise to an event of default under the associated debt, which could become immediately due and payable if Panhandle did not cure such default within any permitted cure period or if Panhandle did not obtain amendments, consents or waivers from its lenders with respect to such covenants.
Panhandle’s restrictive covenants include restrictions on debt levels, restrictions on liens securing debt and guarantees, restrictions on mergers and on the sales of assets, capitalization requirements, dividend restrictions, cross default and cross-acceleration and prepayment of debt provisions. A breach of any of these covenants could result in acceleration of Panhandle’s debt and other financial obligations and that of its subsidiaries.
91
In addition, Panhandle and/or its subsidiaries are subject to certain additional restrictions and covenants. These restrictions and covenants include limitations on additional debt at some of its subsidiaries; limitations on the use of proceeds from borrowing at some of its subsidiaries; limitations, in some cases, on transactions with its affiliates; limitations on the incurrence of liens; potential limitations on the abilities of some of its subsidiaries to declare and pay dividends and potential limitations on some of its subsidiaries to participate in Panhandle’s cash management program; and limitations on Panhandle’s ability to prepay debt.
Covenants Related to Sunoco Logistics
Sunoco Logistics’
$1.50 billion
credit facility contains various covenants, including limitations on the creation of indebtedness and liens, and other covenants related to the operation and conduct of the business of Sunoco Logistics and its subsidiaries. The credit facility also limits Sunoco Logistics, on a rolling four-quarter basis, to a maximum total consolidated debt to consolidated Adjusted EBITDA ratio, as defined in the underlying credit agreement, of
5.0
to
1
, which can generally be increased to
5.5
to
1
during an acquisition period. Sunoco Logistics’ ratio of total consolidated debt, excluding net unamortized fair value adjustments, to consolidated Adjusted EBITDA was
3.7
to
1
at
December 31, 2014
, as calculated in accordance with the credit agreements.
The West Texas Gulf Pipeline Company’s
$35 million
credit facility limits West Texas Gulf, on a rolling four-quarter basis, to a minimum fixed charge coverage ratio of
1.00
to
1
. In addition, the credit facility limits West Texas Gulf to a maximum leverage ratio of
2.00
to
1
. West Texas Gulf’s fixed charge coverage ratio and leverage ratio were
1.67
to
1
and
0.85
to
1
, respectively, at
December 31, 2014
.
Covenants Related to Sunoco LP
The Sunoco LP Credit Facility requires Sunoco LP to maintain a leverage ratio of not more than
5.50
to
1
. The maximum leverage ratio is subject to upwards adjustment of not more than
6.00
to
1
for a period not to exceed three fiscal quarters in the event Sunoco LP engages in an acquisition of assets, equity interests, operating lines or divisions by Sunoco LP, a subsidiary, an unrestricted subsidiary or a joint venture for a purchase price of not less than
$50 million
. Indebtedness under the Sunoco LP Credit Facility is secured by a security interest in, among other things, all of the Sunoco LP’s present and future personal property and all of the present and future personal property of its guarantors, the capital stock of its material subsidiaries (or
66%
of the capital stock of material foreign subsidiaries), and any intercompany debt. Upon the first achievement by Sunoco LP of an investment grade credit rating, all security interests securing the Sunoco LP Credit Facility will be released.
Compliance with our Covenants
We are required to assess compliance quarterly and were in compliance with all requirements, limitations, and covenants relating to ETE’s and its subsidiaries’ debt agreements as of
December 31, 2014
.
Each of the agreements referred to above are incorporated herein by reference to our, ETP’s and Regency’s reports previously filed with the SEC under the Exchange Act. See “Item 1. Business – SEC Reporting.”
Off-Balance Sheet Arrangements
Contingent Residual Support Agreement – AmeriGas
In order to finance the cash portion of the purchase price of the Propane Business described in Note
6
to our consolidated financial statements, AmeriGas Finance LLC (“Finance Company”), a wholly-owned subsidiary of AmeriGas, issued $550 million in aggregate principal amount of 6.75% senior notes due 2020 and $1.0 billion in aggregate principal amount of 7.00% senior notes due 2022. AmeriGas borrowed $1.5 billion of the proceeds of the senior notes issuance from Finance Company through an intercompany borrowing having maturity dates and repayment terms that mirror those of the senior notes (the “Supported Debt”).
In connection with the closing of the contribution of the Propane Business, ETP entered into a Contingent Residual Support Agreement with AmeriGas, Finance Company, AmeriGas Finance Corp. and UGI Corp., pursuant to which ETP will provide contingent, residual support of the Supported Debt.
PEPL Holdings Guarantee of Collection
In connection with the SUGS Contribution, Regency issued
$600 million
of
4.50%
senior notes due 2023
(the “Regency Debt”), the proceeds of which were used by Regency to fund the cash portion of the consideration, as adjusted, and pay certain other expenses or disbursements directly related to the closing of the SUGS Contribution. In connection with the closing of the SUGS Contribution on April 30, 2013, Regency entered into an agreement with PEPL Holdings, a subsidiary of Southern Union, pursuant to which PEPL Holdings provided a guarantee of collection (on a nonrecourse basis to Southern Union) to Regency and Regency Energy Finance Corp. with respect to the payment of the principal amount of the Regency Debt through maturity in 2023. In connection with the completion of the Panhandle Merger, in which PEPL Holdings was merged with and into Panhandle, the guarantee of collection for the Regency Debt was assumed by Panhandle.
92
Contractual Obligations
The following table summarizes our long-term debt and other contractual obligations as of
December 31, 2014
:
|
|
Payments Due by Period
|
|||||||||||||||||||
|
Contractual Obligations
|
Total
|
Less Than 1
Year
|
1-3 Years
|
3-5 Years
|
More Than 5 Years
|
|||||||||||||||
|
Long-term debt
|
$
|
30,378
|
|
$
|
1,050
|
|
$
|
1,542
|
|
$
|
7,757
|
|
$
|
20,029
|
|
|||||
|
Interest on long-term debt
(1)
|
17,057
|
|
1,565
|
|
3,008
|
|
2,696
|
|
9,788
|
|
||||||||||
|
Payments on derivatives
|
159
|
|
20
|
|
83
|
|
50
|
|
6
|
|
||||||||||
|
Purchase commitments
(2)
|
14,177
|
|
8,362
|
|
3,168
|
|
1,188
|
|
1,459
|
|
||||||||||
|
Transportation, natural gas storage and fractionation contracts
|
89
|
|
26
|
|
43
|
|
20
|
|
—
|
|
||||||||||
|
Operating lease obligations
|
1,437
|
|
151
|
|
247
|
|
210
|
|
829
|
|
||||||||||
|
Distributions and redemption of preferred units of a subsidiary
(3)
|
96
|
|
3
|
|
7
|
|
7
|
|
79
|
|
||||||||||
|
Other
(4)
|
347
|
|
177
|
|
77
|
|
57
|
|
36
|
|
||||||||||
|
Total
(5)
|
$
|
63,740
|
|
$
|
11,354
|
|
$
|
8,175
|
|
$
|
11,985
|
|
$
|
32,226
|
|
|||||
|
(1)
|
Interest payments on long-term debt are based on the principal amount of debt obligations as of
December 31, 2014
. With respect to variable rate debt, the interest payments were estimated using the interest rate as of
December 31, 2014
. To the extent interest rates change, our contractual obligation for interest payments will change. See “Item 7A. Quantitative and Qualitative Disclosures About Market Risk” for further discussion.
|
|
(2)
|
We define a purchase commitment as an agreement to purchase goods or services that is enforceable and legally binding (unconditional) on us that specifies all significant terms, including: fixed or minimum quantities to be purchased; fixed, minimum or variable price provisions; and the approximate timing of the transactions. We have long and short-term product purchase obligations for refined product and energy commodities with third-party suppliers. These purchase obligations are entered into at either variable or fixed prices. The purchase prices that we are obligated to pay under variable price contracts approximate market prices at the time we take delivery of the volumes. Our estimated future variable price contract payment obligations are based on the
December 31, 2014
market price of the applicable commodity applied to future volume commitments. Actual future payment obligations may vary depending on market prices at the time of delivery. The purchase prices that we are obligated to pay under fixed price contracts are established at the inception of the contract. Our estimated future fixed price contract payment obligations are based on the contracted fixed price under each commodity contract. Obligations shown in the table represent estimated payment obligations under these contracts for the periods indicated. Approximately
$1.12 billion
of total purchase commitments relate to production from PES.
|
|
(3)
|
Assumes the outstanding Regency Preferred Units are redeemed for cash on September 2, 2029.
|
|
(4)
|
Expected contributions to fund our pension and postretirement benefit plans were included in “Other” above. Environmental liabilities, asset retirement obligations, unrecognized tax benefits, contingency accruals and deferred revenue, which were included in “Other non-current liabilities” our consolidated balance sheets were excluded from the table above as such amounts do not represent contractual obligations or, in some cases, the amount and/or timing of the cash payments is uncertain.
|
|
(5)
|
Excludes net non-current deferred tax liabilities of
$4.33 billion
due to uncertainty of the timing of future cash flows for such liabilities.
|
Cash Distributions
Cash Distributions Paid by the Parent Company
Under the Parent Company Partnership Agreement, the Parent Company will distribute all of its Available Cash, as defined, within 50 days following the end of each fiscal quarter. Available cash generally means, with respect to any quarter, all cash on hand at the end of such quarter less the amount of cash reserves that are necessary or appropriate in the reasonable discretion of the General Partner that is necessary or appropriate to provide for future cash requirements.
93
Distributions declared during the periods presented are as follows:
|
Quarter Ended
|
Record Date
|
|
Payment Date
|
|
Rate
|
|||
|
December 31, 2011
|
|
February 7, 2012
|
|
February 17, 2012
|
|
$
|
0.3125
|
|
|
March 31, 2012
|
May 4, 2012
|
|
May 18, 2012
|
|
0.3125
|
|
||
|
June 30, 2012
|
August 6, 2012
|
|
August 17, 2012
|
|
0.3125
|
|
||
|
September 30, 2012
|
November 6, 2012
|
|
November 16, 2012
|
|
0.3125
|
|
||
|
December 31, 2012
|
February 7, 2013
|
|
February 19, 2013
|
|
0.3175
|
|
||
|
March 31, 2013
|
May 6, 2013
|
|
May 17, 2013
|
|
0.3225
|
|
||
|
June 30, 2013
|
August 5, 2013
|
|
August 19, 2013
|
|
0.3275
|
|
||
|
September 30, 2013
|
November 4, 2013
|
|
November 19, 2013
|
|
0.3363
|
|
||
|
December 31, 2013
|
February 7, 2014
|
|
February 19, 2014
|
|
0.3463
|
|
||
|
March 31, 2014
|
May 5, 2014
|
|
May 19, 2014
|
|
0.3588
|
|
||
|
June 30, 2014
|
August 4, 2014
|
|
August 19, 2014
|
|
0.3800
|
|
||
|
September 30, 2014
|
November 3, 2014
|
|
November 19, 2014
|
|
0.4150
|
|
||
|
December 31, 2014
|
February 6, 2015
|
February 19, 2015
|
0.4500
|
|
||||
The total amounts of distributions declared during the periods presented (all from Available Cash from the Parent Company’s operating surplus and are shown in the period to which they relate) are as follows:
|
|
Years Ended December 31,
|
||||||||||
|
|
2014
|
2013
|
2012
|
||||||||
|
Limited Partners
|
$
|
866
|
|
$
|
748
|
|
$
|
703
|
|
||
|
General Partner interest
|
2
|
|
2
|
|
1
|
|
|||||
|
Class D units
|
2
|
|
—
|
|
—
|
|
|||||
|
Total Parent Company distributions
|
$
|
870
|
|
$
|
750
|
|
$
|
704
|
|
||
Cash Distributions Received by the Parent Company
The Parent Company’s cash available for distributions is primarily generated from its direct and indirect interests in ETP and Regency. Lake Charles LNG’s wholly-owned subsidiaries also contribute to the Parent Company’s cash available for distributions. Our interests in ETP and Regency consist of 100% of the respective general partner interests and IDRs, as well as the following:
|
ETP
|
Regency
|
||||
|
Units held by wholly-owned subsidiaries:
|
|||||
|
Common units
|
30.8
|
|
57.2
|
|
|
|
ETP Class H units
|
50.2
|
|
—
|
|
|
|
Units held by less than wholly-owned subsidiaries:
|
|||||
|
Common units
|
—
|
|
31.4
|
|
|
|
Regency Class F units
|
—
|
|
6.3
|
|
|
As the holder of ETP’s and Regency’s IDRs, the Parent Company is entitled to an increasing share of ETP’s and Regency’s total distributions above certain target levels. The following table summarizes the target levels (as a percentage of total distributions on common units, IDRs and the general partner interest). The percentage reflected in the table includes only the percentage related to the IDRs and excludes distributions to which the Parent Company would also be entitled through its direct or indirect ownership of (i) ETP’s general partner interest, Class H units and a portion of the outstanding ETP common units and (ii) Regency’s general partner interest and a portion of the outstanding Regency common units.
94
|
Percentage of Total Distributions to IDRs
|
Quarterly Distribution Rate Target Amounts
|
||||
|
ETP
|
Regency
|
||||
|
Minimum quarterly distribution
|
—%
|
$0.25
|
$0.35
|
||
|
First target distribution
|
—%
|
$0.25 to $0.275
|
$0.35 to $0.4025
|
||
|
Second target distribution
|
13%
|
$0.275 to $0.3175
|
$0.4025 to $0.4375
|
||
|
Third target distribution
|
23%
|
$0.3175 to $0.4125
|
$0.4375 to $0.5250
|
||
|
Fourth target distribution
|
48%
|
Above $0.4125
|
Above $0.5250
|
||
The total amount of distributions the Parent Company and its wholly-owned subsidiaries received from ETP and Regency relating to its limited partner interests, general partner interest and incentive distributions (shown in the period to which they relate) for the periods ended as noted below is as follows:
|
|
Years Ended December 31,
|
||||||||||
|
|
2014
|
2013
|
2012
|
||||||||
|
Distributions from ETP:
|
|||||||||||
|
Limited Partners
|
$
|
119
|
|
$
|
268
|
|
$
|
180
|
|
||
|
Class H Units held by ETE Holdings
|
219
|
|
105
|
|
—
|
|
|||||
|
General Partner interest
|
21
|
|
20
|
|
20
|
|
|||||
|
Incentive distributions
|
754
|
|
701
|
|
529
|
|
|||||
|
IDR relinquishments related to previous transactions
|
(250
|
)
|
(199
|
)
|
(90
|
)
|
|||||
|
Total distributions from ETP
|
863
|
|
895
|
|
639
|
|
|||||
|
Distributions from Regency:
|
|||||||||||
|
Limited Partners
|
99
|
|
48
|
|
48
|
|
|||||
|
General Partner interest
|
6
|
|
5
|
|
5
|
|
|||||
|
Incentive distributions
|
33
|
|
12
|
|
8
|
|
|||||
|
IDR relinquishments related to previous transaction
|
(3
|
)
|
(3
|
)
|
—
|
|
|||||
|
Total distributions from Regency
|
135
|
|
62
|
|
61
|
|
|||||
|
Total distributions received from subsidiaries
|
$
|
998
|
|
$
|
957
|
|
$
|
700
|
|
||
In connection with transactions between ETP and ETE, ETE has agreed to relinquish its right to certain incentive distributions in future periods. Following is a summary of the net reduction in total distributions that would potentially be made to ETE in future periods based on (i) the currently effective partnership agreement provisions, (ii) the assumed closing of the issuance of additional ETP Class H Units and ETP Class I Units, which is expected to occur in March 2015, and (iii) the assumed closing of the Regency Merger, which is expected to occur in the second quarter of 2015:
|
Years Ending December 31,
|
Currently Effective
|
Pro Forma for
ETP Class H and
Class I Units
(1)
|
Pro Forma for Regency Merger
(2)
|
|||||||||
|
2015
|
$
|
86
|
|
$
|
31
|
|
$
|
91
|
|
|||
|
2016
|
107
|
|
77
|
|
142
|
|
||||||
|
2017
|
85
|
|
85
|
|
145
|
|
||||||
|
2018
|
80
|
|
80
|
|
140
|
|
||||||
|
2019
|
70
|
|
70
|
|
130
|
|
||||||
|
2020
|
35
|
|
35
|
|
50
|
|
||||||
|
2021
|
35
|
|
35
|
|
35
|
|
||||||
|
2022
|
35
|
|
35
|
|
35
|
|
||||||
|
2023
|
35
|
|
35
|
|
35
|
|
||||||
|
2024
|
18
|
|
18
|
|
18
|
|
||||||
95
|
(1)
|
Pro forma amounts reflect the IDR subsidies, as adjusted for the pending issuance of additional ETP Class H Units and ETP Class I Units discussed above, as well as distributions on the ETP Class I Units. The issuance of additional ETP Class H Units and ETP Class I Units is expected to close in March 2015.
|
|
(2)
|
Pro forma amounts reflect the IDR subsidies, as adjusted for (i) the pending issuance of additional ETP Class H Units and ETP Class I Units (as described in Note (1) above) and (ii) the pending Regency Merger. Amounts reflected above assume that the Regency Merger is closed subsequent to the record date for the first quarter of 2015 distribution payment and prior to the record date for the second quarter 2015 distribution payment.
|
The amounts reflected above include the relinquishment of
$350 million
in the aggregate of incentive distributions that would potentially be made to ETE over the first forty fiscal quarters commencing immediately after the consummation of the Susser Merger. Such relinquishments would cease upon the agreement of an exchange of the Sunoco LP
general partner interest and the incentive distribution rights between ETE and ETP.
Cash Distributions Paid by ETP
ETP expects to use substantially all of its cash provided by operating and financing activities from its operating companies to provide distributions to its Unitholders. Under ETP’s partnership agreement, ETP will distribute to its partners within 45 days after the end of each calendar quarter, an amount equal to all of its Available Cash (as defined in ETP’s partnership agreement) for such quarter. Available Cash generally means, with respect to any quarter of ETP, all cash on hand at the end of such quarter less the amount of cash reserves established by ETP’s General Partner in its reasonable discretion that is necessary or appropriate to provide for future cash requirements. ETP’s commitment to its Unitholders is to distribute the increase in its cash flow while maintaining prudent reserves for its operations.
Distributions declared by ETP during the periods presented are as follows:
|
Record Date
|
|
Payment Date
|
|
Rate
|
||||
|
December 31, 2011
|
February 7, 2012
|
February 14, 2012
|
$
|
0.8938
|
|
|||
|
March 31, 2012
|
May 4, 2012
|
May 15, 2012
|
0.8938
|
|
||||
|
June 30, 2012
|
August 6, 2012
|
August 14, 2012
|
0.8938
|
|
||||
|
September 30, 2012
|
November 6, 2012
|
November 14, 2012
|
0.8938
|
|
||||
|
December 31, 2012
|
February 7, 2013
|
February 14, 2013
|
0.8938
|
|
||||
|
March 31, 2013
|
May 6, 2013
|
May 15, 2013
|
0.8938
|
|
||||
|
June 30, 2013
|
August 5, 2013
|
August 14, 2013
|
0.8938
|
|
||||
|
September 30, 2013
|
November 4, 2013
|
November 14, 2013
|
0.9050
|
|
||||
|
December 31, 2013
|
February 7, 2014
|
February 14, 2014
|
0.9200
|
|
||||
|
March 31, 2014
|
May 5, 2014
|
May 15, 2014
|
0.9350
|
|
||||
|
June 30, 2014
|
August 4, 2014
|
August 14, 2014
|
0.9550
|
|
||||
|
September 30, 2014
|
November 3, 2014
|
November 14, 2014
|
0.9750
|
|
||||
|
December 31, 2014
|
February 6, 2015
|
February 13, 2015
|
0.9950
|
|
||||
The total amounts of distributions declared during the periods presented (all from Available Cash from ETP’s operating surplus and are shown in the period to which they relate) are as follows (in millions):
|
|
Years Ended December 31,
|
||||||||||
|
|
2014
|
2013
|
2012
|
||||||||
|
Limited Partners:
|
|||||||||||
|
Common Units
|
$
|
1,298
|
|
$
|
1,265
|
|
$
|
955
|
|
||
|
Class H Units
|
219
|
|
105
|
|
—
|
|
|||||
|
General Partner interest
|
21
|
|
20
|
|
20
|
|
|||||
|
Incentive distributions
|
754
|
|
701
|
|
529
|
|
|||||
|
IDR relinquishments related to previous transactions
|
(250
|
)
|
(199
|
)
|
(90
|
)
|
|||||
|
Total ETP distributions
|
$
|
2,042
|
|
$
|
1,892
|
|
$
|
1,414
|
|
||
96
Cash Distributions Paid by Sunoco Logistics
Sunoco Logistics is required by its partnership agreement to distribute all cash on hand at the end of each quarter, less appropriate reserves determined by its general partner.
Distributions declared during the periods presented were as follows:
|
Quarter Ended
|
Record Date
|
Payment Date
|
Rate
|
|||||
|
December 31, 2012
|
February 8, 2013
|
February 14, 2013
|
$
|
0.2725
|
|
|||
|
March 31, 2013
|
May 9, 2013
|
May 15, 2013
|
0.2863
|
|
||||
|
June 30, 2013
|
August 8, 2013
|
August 14, 2013
|
0.3000
|
|
||||
|
September 30, 2013
|
November 8, 2013
|
November 14, 2013
|
0.3150
|
|
||||
|
December 31, 2013
|
February 10, 2014
|
February 14, 2014
|
0.3312
|
|
||||
|
March 31, 2014
|
May 9, 2014
|
May 15, 2014
|
0.3475
|
|
||||
|
June 30, 2014
|
August 8, 2014
|
August 14, 2014
|
0.3650
|
|
||||
|
September 30, 2014
|
November 7, 2014
|
November 14, 2014
|
0.3825
|
|
||||
|
December 31, 2014
|
February 9, 2015
|
February 13, 2015
|
0.4000
|
|
||||
Sunoco Logistics Unit Split
On May 5, 2014, Sunoco Logistics’ board of directors declared a two-for-one split of Sunoco Logistics common units. The unit split resulted in the issuance of one additional Sunoco Logistics common unit for every one unit owned as of the close of business on June 5, 2014. The unit split was effective June 12, 2014. All Sunoco Logistics unit and per unit information included in this report is presented on a post-split basis.
The total amounts of Sunoco Logistics distributions declared during the periods presented were as follows (all from Available Cash from Sunoco Logistics’ operating surplus and are shown in the period with respect to which they relate):
|
Years Ended December 31,
|
|||||||||||
|
2014
|
2013
|
2012
|
|||||||||
|
Limited Partners
|
|||||||||||
|
Common units held by public
|
$
|
225
|
|
$
|
173
|
|
$
|
39
|
|
||
|
Common units held by ETP
|
100
|
|
82
|
|
18
|
|
|||||
|
General Partner interest held by ETP
|
10
|
|
5
|
|
1
|
|
|||||
|
Incentive distributions held by ETP
|
175
|
|
117
|
|
22
|
|
|||||
|
Total distributions declared
|
$
|
510
|
|
$
|
377
|
|
$
|
80
|
|
||
Cash Distributions Paid by Sunoco LP
Sunoco LP is required by its partnership agreement to distribute all cash on hand at the end of each quarter, less appropriate reserves determined by its general partner.
Distributions declared by Sunoco LP subsequent to our acquisition on August 29, 2014 were as follows:
|
Quarter Ended
|
Record Date
|
Payment Date
|
Rate
|
|||||
|
September 30, 2014
|
November 18, 2014
|
November 28, 2014
|
$
|
0.5457
|
|
|||
|
December 31, 2014
|
February 17, 2015
|
February 27, 2015
|
0.6000
|
|
||||
97
The total amounts of Sunoco LP distributions declared during the periods presented were as follows (all from Available Cash from Sunoco Logistics’ operating surplus and are shown in the period with respect to which they relate):
|
Year Ended December 31, 2014
|
|||
|
Limited Partners:
|
|||
|
Common units held by public
|
$
|
22
|
|
|
Common units held by ETP
|
17
|
|
|
|
General Partner interest and incentive distributions held by ETP
|
1
|
|
|
|
Total distributions declared
|
$
|
40
|
|
Cash Distributions Paid by Regency
Regency’s partnership agreement requires that Regency distribute all of its Available Cash to its Unitholders and its General Partner within 45 days after the end of each quarter to unitholders of record on the applicable record date, as determined by the general partner. The term Available Cash generally consists of all cash and cash equivalents on hand at the end of that quarter less the amount of cash reserves established by the general partner to: (i) provide for the proper conduct of the Partnership’s business; (ii) comply with applicable law, any debt instruments or other agreements; or (iii) provide funds for distributions to the unitholders and to the General Partner for any one or more of the next four quarters and plus, all cash on hand on that date of determination of available cash for the quarter resulting from working capital borrowings made after the end of the quarter for which the determination is being made.
Distributions declared by Regency during the periods presented are as follows:
|
Quarter Ended
|
|
Record Date
|
|
Payment Date
|
|
Rate
|
||
|
December 31, 2011
|
February 6, 2012
|
|
February 13, 2012
|
$
|
0.4600
|
|
||
|
March 31, 2012
|
May 7, 2012
|
May 14, 2012
|
0.4600
|
|
||||
|
June 30, 2012
|
August 6, 2012
|
August 14, 2012
|
0.4600
|
|
||||
|
September 30, 2012
|
November 6, 2012
|
November 14, 2012
|
0.4600
|
|
||||
|
December 31, 2012
|
February 7, 2013
|
|
February 14, 2013
|
|
0.4600
|
|
||
|
March 31, 2013
|
May 6, 2013
|
May 13, 2013
|
0.4600
|
|
||||
|
June 30, 2013
|
August 5, 2013
|
August 14, 2013
|
0.4650
|
|
||||
|
September 30, 2013
|
November 4, 2013
|
November 14, 2013
|
0.4700
|
|
||||
|
December 31, 2013
|
February 7, 2014
|
|
February 14, 2014
|
|
0.4750
|
|
||
|
March 31, 2014
|
May 8, 2014
|
May 15, 2014
|
0.4800
|
|
||||
|
June 30, 2014
|
August 7, 2014
|
August 14, 2014
|
0.4900
|
|
||||
|
September 30, 2014
|
November 4, 2014
|
November 14, 2014
|
0.5025
|
|
||||
|
December 31, 2014
|
February 6, 2015
|
February 13, 2015
|
0.5025
|
|
||||
The total amounts of Regency distributions declared (all from Regency’s operating surplus and are shown in the period with respect to which they relate) are as follows:
|
|
Years Ended December 31,
|
||||||||||
|
2014
|
2013
|
2012
|
|||||||||
|
Limited Partners
|
$
|
775
|
|
$
|
390
|
|
$
|
314
|
|
||
|
General Partner Interest
|
6
|
|
5
|
|
5
|
|
|||||
|
Incentive distributions
|
33
|
|
12
|
|
8
|
|
|||||
|
IDR relinquishments related to previous transactions
|
(3
|
)
|
(3
|
)
|
—
|
|
|||||
|
Total Regency distributions
|
$
|
811
|
|
$
|
404
|
|
$
|
327
|
|
||
98
New Accounting Standards
In May 2014, the Financial Accounting Standards Board (“FASB”) issued Accounting Standards Update No. 2014-09,
Revenue from Contracts with Customers (Topic 606)
(“ASU 2014-09”), which clarifies the principles for recognizing revenue based on the core principle that an entity should recognize revenue to depict the transfer of promised goods or services to customers in an amount that reflects the consideration to which the entity expects to be entitled in exchange for those goods or services. ASU 2014-09 is effective for annual reporting periods beginning after December 15, 2016, including interim periods within that reporting period, with earlier adoption not permitted. ASU 2014-09 can be adopted either retrospectively to each prior reporting period presented or as a cumulative-effect adjustment as of the date of adoption. The Partnership is currently evaluating the impact, if any, that adopting this new accounting standard will have on our revenue recognition policies.
In April 2014, the FASB issued Accounting Standards Update No. 2014-08,
Presentation of Financial Statements (Topic 205) and Property, Plant, and Equipment (Topic 360): Reporting Discontinued Operations and Disclosures of Disposals of Components of an Entity
(“ASU 2014-08”), which changed the requirements for reporting discontinued operations. Under ASU 2014-08, a disposal of a component of an entity or a group of components of an entity is required to be reported in discontinued operations if the disposal represents a strategic shift that has or will have a major effect on an entity’s operations and financial results. ASU 2014-08 is effective for all disposals or classifications as held for sale of components of an entity that occur within fiscal years beginning after December 15, 2014, and early adoption is permitted. We expect to adopt this standard for the year ending December 31, 2015. ASU 2014-08 could have an impact on whether transactions will be reported in discontinued operations in the future, as well as the disclosures required when a component of an entity is disposed.
Estimates and Critical Accounting Policies
The selection and application of accounting policies is an important process that has developed as our business activities have evolved and as the accounting rules have developed. Accounting rules generally do not involve a selection among alternatives, but involve an implementation and interpretation of existing rules, and the use of judgment applied to the specific set of circumstances existing in our business. We make every effort to properly comply with all applicable rules, and we believe the proper implementation and consistent application of the accounting rules are critical. Our critical accounting policies are discussed below. For further details on our accounting policies, see Note
2
to our consolidated financial statements.
Use of Estimates
. The preparation of financial statements in conformity with GAAP requires management to make estimates and assumptions that affect the reported amounts of assets and liabilities and the accrual for and disclosure of contingent assets and liabilities at the date of the financial statements and the reported amounts of revenues and expenses during the reporting period. The natural gas industry conducts its business by processing actual transactions at the end of the month following the month of delivery. Consequently, the most current month’s financial results for the midstream, NGL and intrastate transportation and storage operations are estimated using volume estimates and market prices. Any differences between estimated results and actual results are recognized in the following month’s financial statements. Management believes that the operating results estimated for the year ended
December 31, 2014
represent the actual results in all material respects.
Some of the other significant estimates made by management include, but are not limited to, the timing of certain forecasted transactions that are hedged, the fair value of derivative instruments, useful lives for depreciation, depletion and amortization, purchase accounting allocations and subsequent realizability of intangible assets, fair value measurements used in the goodwill impairment test, market value of inventory, assets and liabilities resulting from the regulated ratemaking process, contingency reserves and environmental reserves. Actual results could differ from those estimates.
Revenue Recognition
.
Revenues for sales of natural gas and NGLs are recognized at the later of the time of delivery of the product to the customer or the time of sale. Revenues from service labor, transportation, treating, compression and gas processing, are recognized upon completion of the service. Transportation capacity payments are recognized when earned in the period the capacity is made available.
The results of ETP’s intrastate transportation and storage and interstate transportation operations are determined primarily by the amount of capacity ETP’s customers reserve as well as the actual volume of natural gas that flows through the transportation pipelines. Under transportation contracts, ETP customers are charged (i) a demand fee, which is a fixed fee for the reservation of an agreed amount of capacity on the transportation pipeline for a specified period of time and which obligates the customer to pay even if the customer does not transport natural gas on the respective pipeline, (ii) a transportation fee, which is based on the actual throughput of natural gas by the customer, (iii) fuel retention based on a percentage of gas transported on the pipeline, or (iv) a combination of the three, generally payable monthly. Excess fuel retained after consumption is typically valued at market prices.
ETP’s intrastate transportation and storage operations also generate revenues and margin from the sale of natural gas to electric utilities, independent power plants, local distribution companies, industrial end-users and other marketing companies on the HPL
99
System. Generally, ETP purchases natural gas from the market, including purchases from the midstream marketing operations, and from producers at the wellhead.
In addition, ETP’s intrastate transportation and storage operations generate revenues and margin from fees charged for storing customers’ working natural gas in our storage facilities. ETP also engages in natural gas storage transactions in which ETP seeks to find and profit from pricing differences that occur over time utilizing the Bammel storage reservoir. ETP purchases physical natural gas and then sells financial contracts at a price sufficient to cover ETP’s carrying costs and provide for a gross profit margin. ETP expects margins from natural gas storage transactions to be higher during the periods from November to March of each year and lower during the period from April through October of each year due to the increased demand for natural gas during colder weather. However, ETP cannot assure that management’s expectations will be fully realized in the future and in what time period, due to various factors including weather, availability of natural gas in regions in which we operate, competitive factors in the energy industry, and other issues.
Results from ETP’s midstream operations are determined primarily by the volumes of natural gas gathered, compressed, treated, processed, purchased and sold through ETP’s pipeline and gathering systems and the level of natural gas and NGL prices. ETP generates midstream revenues and gross margins principally under fee-based or other arrangements in which ETP receives a fee for natural gas gathering, compressing, treating or processing services. The revenue earned from these arrangements is directly related to the volume of natural gas that flows through ETP’s systems and is not directly dependent on commodity prices.
ETP also utilizes other types of arrangements in ETP’s midstream operations, including (i) discount-to-index price arrangements, which involve purchases of natural gas at either (1) a percentage discount to a specified index price, (2) a specified index price less a fixed amount or (3) a percentage discount to a specified index price less an additional fixed amount, (ii) percentage-of-proceeds arrangements under which we gather and process natural gas on behalf of producers, sell the resulting residue gas and NGL volumes at market prices and remit to producers an agreed upon percentage of the proceeds based on an index price, and (iii) keep-whole arrangements where ETP gathers natural gas from the producer, processes the natural gas and sells the resulting NGLs to third parties at market prices. In many cases, ETP provides services under contracts that contain a combination of more than one of the arrangements described above. The terms of ETP’s contracts vary based on gas quality conditions, the competitive environment at the time the contracts are signed and customer requirements. ETP’s contract mix may change as a result of changes in producer preferences, expansion in regions where some types of contracts are more common and other market factors.
ETP conducts marketing activities in which ETP markets the natural gas that flows through ETP’s assets, referred to as on-system gas. ETP also attracts other customers by marketing volumes of natural gas that do not move through ETP’s assets, referred to as off-system gas. For both on-system and off-system gas, ETP purchases natural gas from natural gas producers and other supply points and sells that natural gas to utilities, industrial consumers, other marketers and pipeline companies, thereby generating gross margins based upon the difference between the purchase and resale prices.
ETP has a risk management policy that provides for oversight over ETP’s marketing activities. These activities are monitored independently by ETP’s risk management function and must take place within predefined limits and authorizations. As a result of ETP’s use of derivative financial instruments that may not qualify for hedge accounting, the degree of earnings volatility that can occur may be significant, favorably or unfavorably, from period to period. ETP attempts to manage this volatility through the use of daily position and profit and loss reports provided to senior management and predefined limits and authorizations set forth in ETP’s risk management policy.
ETP injects and holds natural gas in our Bammel storage facility to take advantage of contango markets, when the price of natural gas is higher in the future than the current spot price. ETP uses financial derivatives to hedge the natural gas held in connection with these arbitrage opportunities. At the inception of the hedge, ETP locks in a margin by purchasing gas in the spot market or off peak season and entering a financial contract to lock in the sale price. If ETP designates the related financial contract as a fair value hedge for accounting purposes, ETP values the hedged natural gas inventory at current spot market prices along with the financial derivative ETP uses to hedge it. Changes in the spread between the forward natural gas prices designated as fair value hedges and the physical inventory spot prices result in unrealized gains or losses until the underlying physical gas is withdrawn and the related designated derivatives are settled. Once the gas is withdrawn and the designated derivatives are settled, the previously unrealized gains or losses associated with these positions are realized. Unrealized margins represent the unrealized gains or losses from our derivative instruments using mark-to-market accounting, with changes in the fair value of our derivatives being recorded directly in earnings. These margins fluctuate based upon changes in the spreads between the physical spot prices and forward natural gas prices. If the spread narrows between the physical and financial prices, ETP will record unrealized gains or lower unrealized losses. If the spread widens, ETP will record unrealized losses or lower unrealized gains. Typically, as ETP enters the winter months, the spread converges so that ETP recognizes in earnings the original locked in spread, either through mark-to-market or the physical withdrawal of natural gas.
100
ETP’s NGL storage and pipeline transportation revenues are recognized when services are performed or products are delivered, respectively. Fractionation and processing revenues are recognized when product is either loaded into a truck or injected into a third party pipeline, which is when title and risk of loss pass to the customer.
In ETP’s natural gas compression business, revenue is recognized for compressor packages and technical service jobs using the completed contract method which recognizes revenue upon completion of the job. Costs incurred on a job are deducted at the time revenue is recognized.
Terminalling and storage revenues are recognized at the time the services are provided. Pipeline revenues are recognized upon delivery of the barrels to the location designated by the shipper. Crude oil acquisition and marketing revenues, as well as refined product marketing revenues, are recognized when title to the product is transferred to the customer. Revenues are not recognized for crude oil exchange transactions, which are entered into primarily to acquire crude oil of a desired quality or to reduce transportation costs by taking delivery closer to end markets. Any net differential for exchange transactions is recorded as an adjustment of inventory costs in the purchases component of cost of products sold and operating expenses in the statements of operations.
ETP’s retail marketing operations sell gasoline and diesel in addition to a broad mix of merchandise such as groceries, fast foods and beverages at its convenience stores. A portion of our gasoline and diesel sales are to wholesale customers on a consignment basis, in which we retain title to inventory, control access to and sale of fuel inventory, and recognize revenue at the time the fuel is sold to the ultimate customer. We typically own the fuel dispensing equipment and underground storage tanks at consignment sites, and in some cases we own the entire site and have entered into an operating lease whit the wholesale customer operating the site. In addition, our retail outlets derive other income from lottery ticket sales, money orders, prepaid phone cards and wireless services, ATM transactions, car washes, movie rental and other ancillary product and service offerings. Some of Sunoco, Inc.’s retail outlets provide a variety of car care services. Revenues related to the sale of products are recognized when title passes, while service revenues are recorded on a net commission basis and are recognized when services are provided. Title passage generally occurs when products are shipped or delivered in accordance with the terms of the respective sales agreements. In addition, revenues are not recognized until sales prices are fixed or determinable and collectability is reasonably assured.
Regency earns revenue from (i) domestic sales of natural gas, NGLs and condensate, (ii) natural gas gathering, processing and transportation, (iii) contract compression services and (iv) contract treating services. Revenue associated with sales of natural gas, NGLs and condensate are recognized when title passes to the customer, which is when the risk of ownership passes to the purchaser and physical delivery occurs. Revenue associated with transportation and processing fees are recognized when the service is provided. For contract compression services, revenue is recognized when the service is performed. For gathering and processing services, Regency receives either fees or commodities from natural gas producers depending on the type of contract. Commodities received are in turn sold and recognized as revenue in accordance with the criteria outlined above. Under the percent-of-proceeds contract type, Regency is paid for its services by keeping a percentage of the NGLs produced and a percentage of the residue gas resulting from processing the natural gas. Under the percentage-of-index contract type, Regency earns revenue by purchasing wellhead natural gas at a percentage of the index price and selling processed natural gas at a price approximating the index price and NGLs to third parties. Regency generally reports revenue gross when it acts as the principal, takes title to the product, and incurs the risks and rewards of ownership. Revenue for fee-based arrangements is presented net because Regency takes the role of an agent for the producers. Allowance for doubtful accounts is determined based on historical write-off experience and specific identification.
Regulatory Assets and Liabilities.
Certain of our subsidiaries are subject to regulation by certain state and federal authorities and have accounting policies that conform to FASB Accounting Standards Codification (“ASC”) Topic 980,
Regulated Operations
, which is in accordance with the accounting requirements and ratemaking practices of the regulatory authorities. The application of these accounting policies allows certain of our regulated entities to defer expenses and revenues on the balance sheet as regulatory assets and liabilities when it is probable that those expenses and revenues will be allowed in the ratemaking process in a period different from the period in which they would have been reflected in the consolidated statement of operations by an unregulated company. These deferred assets and liabilities will be reported in results of operations in the period in which the same amounts are included in rates and recovered from or refunded to customers. Management’s assessment of the probability of recovery or pass through of regulatory assets and liabilities will require judgment and interpretation of laws and regulatory commission orders. If, for any reason, we cease to meet the criteria for application of regulatory accounting treatment for all or part of our operations, the regulatory assets and liabilities related to those portions ceasing to meet such criteria would be eliminated from the consolidated balance sheet for the period in which the discontinuance of regulatory accounting treatment occurs.
Accounting for Derivative Instruments and Hedging Activities.
ETP and Regency utilize various exchange-traded and over-the-counter commodity financial instrument contracts to limit their exposure to margin fluctuations in natural gas, NGL and refined products. These contracts consist primarily of commodity futures and swaps. In addition, prior to ETP’s contribution of its retail propane activities to AmeriGas, ETP used derivatives to limit its exposure to propane market prices.
101
If ETP or Regency designate a derivative financial instrument as a cash flow hedge and it qualifies for hedge accounting, the change in the fair value is deferred in AOCI until the underlying hedged transaction occurs. Any ineffective portion of a cash flow hedge’s change in fair value is recognized each period in earnings. Gains and losses deferred in AOCI related to cash flow hedges remain in AOCI until the underlying physical transaction occurs, unless it is probable that the forecasted transaction will not occur by the end of the originally specified time period or within an additional two-month period of time thereafter. For financial derivative instruments that do not qualify for hedge accounting, the change in fair value is recorded in cost of products sold in the consolidated statements of operations.
If ETP or Regency designate a hedging relationship as a fair value hedge, they record the changes in fair value of the hedged asset or liability in cost of products sold in the consolidated statement of operations. This amount is offset by the changes in fair value of the related hedging instrument. Any ineffective portion or amount excluded from the assessment of hedge ineffectiveness is also included in the cost of products sold in the consolidated statement of operations.
ETP and Regency utilize published settlement prices for exchange-traded contracts, quotes provided by brokers, and estimates of market prices based on daily contract activity to estimate the fair value of these contracts. Changes in the methods used to determine the fair value of these contracts could have a material effect on our results of operations. We do not anticipate future changes in the methods used to determine the fair value of these derivative contracts. See “Item 7A. Quantitative and Qualitative Disclosures about Market Risk,” for further discussion regarding our derivative activities.
Fair Value of Financial Instruments
.
We have marketable securities, commodity derivatives, interest rate derivatives, the Preferred Units and embedded derivatives in the Regency Preferred Units that are accounted for as assets and liabilities at fair value in our consolidated balance sheets. We determine the fair value of our assets and liabilities subject to fair value measurement by using the highest possible “level” of inputs. Level 1 inputs are observable quotes in an active market for identical assets and liabilities. We consider the valuation of marketable securities and commodity derivatives transacted through a clearing broker with a published price from the appropriate exchange as a Level 1 valuation. Level 2 inputs are inputs observable for similar assets and liabilities. We consider over-the-counter commodity derivatives entered into directly with third parties as a Level 2 valuation since the values of these derivatives are quoted on an exchange for similar transactions. Additionally, we consider our options transacted through our clearing broker as having Level 2 inputs due to the level of activity of these contracts on the exchange in which they trade. We consider the valuation of our interest rate derivatives as Level 2 as the primary input, the LIBOR curve, is based on quotes from an active exchange of Eurodollar futures for the same period as the future interest swap settlements. Level 3 utilizes significant unobservable inputs. Level 3 inputs are unobservable. Derivatives related to the Regency Preferred Units are valued using a binomial lattice model. The market inputs utilized in the model include credit spread, probabilities of the occurrence of certain events, common unit price, dividend yield, and expected volatility, and are considered Level 3. See further information on our fair value assets and liabilities in Note
2
of our consolidated financial statements.
Impairment of Long-Lived Assets and Goodwill.
Long-lived assets are required to be tested for recoverability whenever events or changes in circumstances indicate that the carrying amount of the asset may not be recoverable. Goodwill and intangibles with indefinite lives must be tested for impairment annually or more frequently if events or changes in circumstances indicate that the related asset might be impaired. An impairment loss should be recognized only if the carrying amount of the asset/goodwill is not recoverable and exceeds its fair value.
In order to test for recoverability when performing a quantitative impairment test, we must make estimates of projected cash flows related to the asset, which include, but are not limited to, assumptions about the use or disposition of the asset, estimated remaining life of the asset, and future expenditures necessary to maintain the asset’s existing service potential. In order to determine fair value, we make certain estimates and assumptions, including, among other things, changes in general economic conditions in regions in which our markets are located, the availability and prices of natural gas, our ability to negotiate favorable sales agreements, the risks that natural gas exploration and production activities will not occur or be successful, our dependence on certain significant customers and producers of natural gas, and competition from other companies, including major energy producers. While we believe we have made reasonable assumptions to calculate the fair value, if future results are not consistent with our estimates, we could be exposed to future impairment losses that could be material to our results of operations.
Property, Plant and Equipment.
Expenditures for maintenance and repairs that do not add capacity or extend the useful life are expensed as incurred. Expenditures to refurbish assets that either extend the useful lives of the asset or prevent environmental contamination are capitalized and depreciated over the remaining useful life of the asset. Additionally, ETP capitalizes certain costs directly related to the construction of assets including internal labor costs, interest and engineering costs. Upon disposition or retirement of pipeline components or natural gas plant components, any gain or loss is recorded to accumulated depreciation. When entire pipeline systems, gas plants or other property and equipment are retired or sold, any gain or loss is included in the consolidated statement of operations. Depreciation of property, plant and equipment is provided using the straight-line method based on their estimated useful lives ranging from 1 to 99 years. Changes in the estimated useful lives of the assets could have a
102
material effect on our results of operation. We do not anticipate future changes in the estimated useful lives of our property, plant and equipment.
Asset Retirement Obligations
.
We have determined that we are obligated by contractual or regulatory requirements to remove facilities or perform other remediation upon retirement of certain assets. The fair value of any ARO is determined based on estimates and assumptions related to retirement costs, which the Partnership bases on historical retirement costs, future inflation rates and credit-adjusted risk-free interest rates. These fair value assessments are considered to be level 3 measurements, as they are based on both observable and unobservable inputs. Changes in the liability are recorded for the passage of time (accretion) or for revisions to cash flows originally estimated to settle the ARO.
An ARO is required to be recorded when a legal obligation to retire an asset exists and such obligation can be reasonably estimated. We will record an asset retirement obligation in the periods in which management can reasonably estimate the settlement dates.
Except for certain amounts recorded by Panhandle, Sunoco Logistics and ETP’s retail marketing operations discussed below, management was not able to reasonably measure the fair value of asset retirement obligations as of
December 31, 2014
and
2013
, in most cases because the settlement dates were indeterminable. Although a number of other onshore assets in Panhandle’s system are subject to agreements or regulations that give rise to an ARO upon Panhandle’s discontinued use of these assets, AROs were not recorded because these assets have an indeterminate removal or abandonment date given the expected continued use of the assets with proper maintenance or replacement. Sunoco, Inc. has legal asset retirement obligations for several other assets at its refineries, pipelines and terminals, for which it is not possible to estimate when the obligations will be settled. Consequently, the retirement obligations for these assets cannot be measured at this time. At the end of the useful life of these underlying assets, Sunoco, Inc. is legally or contractually required to abandon in place or remove the asset. Sunoco Logistics believes it may have additional asset retirement obligations related to its pipeline assets and storage tanks, for which it is not possible to estimate whether or when the retirement obligations will be settled. Consequently, these retirement obligations cannot be measured at this time.
Individual component assets have been and will continue to be replaced, but the pipeline and the natural gas gathering and processing systems will continue in operation as long as supply and demand for natural gas exists. Based on the widespread use of natural gas in industrial and power generation activities, management expects supply and demand to exist for the foreseeable future. We have in place a rigorous repair and maintenance program that keeps the pipelines and the natural gas gathering and processing systems in good working order. Therefore, although some of the individual assets may be replaced, the pipelines and the natural gas gathering and processing systems themselves will remain intact indefinitely.
As of
December 31, 2014
, there were no legally restricted funds for the purpose of settling AROs.
Pensions and Other Postretirement Benefit Plans.
We are required to measure plan assets and benefit obligations as of its fiscal year-end balance sheet date. We recognize the changes in the funded status of our defined benefit postretirement plans through AOCI or are reflected as a regulatory asset or regulatory liability for regulated subsidiaries.
The calculation of the net periodic benefit cost and benefit obligation requires the use of a number of assumptions. Changes in these assumptions can have a significant effect on the amounts reported in the financial statements. The Partnership believes that the two most critical assumptions are the assumed discount rate and the expected rate of return on plan assets.
The discount rate is established by using a hypothetical portfolio of high-quality debt instruments that would provide the necessary cash flows to pay the benefits when due. Net periodic benefit cost and benefit obligation increases and equity correspondingly decreases as the discount rate is reduced.
The expected rate of return on plan assets is based on long-term expectations given current investment objectives and historical results. Net periodic benefit cost increases as the expected rate of return on plan assets is correspondingly reduced.
Legal Matters.
We are subject to litigation and regulatory proceedings as a result of our business operations and transactions. We utilize both internal and external counsel in evaluating our potential exposure to adverse outcomes from claims, orders, judgments or settlements. To the extent that actual outcomes differ from our estimates, or additional facts and circumstances cause us to revise our estimates, our earnings will be affected. We expense legal costs as incurred, and all recorded legal liabilities are revised as required as better information becomes available to us. The factors we consider when recording an accrual for contingencies include, among others: (i) the opinions and views of our legal counsel; (ii) our previous experience; and (iii) the decision of our management as to how we intend to respond to the complaints.
For more information on our litigation and contingencies, see Note
12
to our consolidated financial statements included in “Item 8. Financial Statements and Supplementary Data” in this report.
Environmental Remediation Activities.
The Partnership’s accrual for environmental remediation activities reflects anticipated work at identified sites where an assessment has indicated that cleanup costs are probable and reasonably estimable. The accrual
103
for known claims is undiscounted and is based on currently available information, estimated timing of remedial actions and related inflation assumptions, existing technology and presently enacted laws and regulations. It is often extremely difficult to develop reasonable estimates of future site remediation costs due to changing regulations, changing technologies and their associated costs, and changes in the economic environment. Engineering studies, historical experience and other factors are used to identify and evaluate remediation alternatives and their related costs in determining the estimated accruals for environmental remediation activities.
Losses attributable to unasserted claims are generally reflected in the accruals on an undiscounted basis, to the extent they are probable of occurrence and reasonably estimable. ETP has established a wholly-owned captive insurance company to bear certain risks associated with environmental obligations related to certain sites that are no longer operating. The premiums paid to the captive insurance company include estimates for environmental claims that have been incurred but not reported, based on an actuarially determined fully developed claims expense estimate. In such cases, ETP accrues losses attributable to unasserted claims based on the discounted estimates that are used to develop the premiums paid to the captive insurance company.
In general, each remediation site/issue is evaluated individually based upon information available for the site/issue and no pooling or statistical analysis is used to evaluate an aggregate risk for a group of similar items (e.g., service station sites) in determining the amount of probable loss accrual to be recorded. ETP’s estimates of environmental remediation costs also frequently involve evaluation of a range of estimates. In many cases, it is difficult to determine that one point in the range of loss estimates is more likely than any other. In these situations, existing accounting guidance requires that the minimum of the range be accrued. Accordingly, the low end of the range often represents the amount of loss which has been recorded.
In addition to the probable and estimable losses which have been recorded, management believes it is reasonably possible (i.e., less than probable but greater than remote) that additional environmental remediation losses will be incurred. At
December 31, 2014
, the aggregate of the estimated maximum additional reasonably possible losses, which relate to numerous individual sites, totaled approximately
$6 million
. This estimate of reasonably possible losses comprises estimates for remediation activities at current logistics and retail assets and, in many cases, reflects the upper end of the loss ranges which are described above. Such estimates include potentially higher contractor costs for expected remediation activities, the potential need to use more costly or comprehensive remediation methods and longer operating and monitoring periods, among other things.
Total future costs for environmental remediation activities will depend upon, among other things, the identification of any additional sites, the determination of the extent of the contamination at each site, the timing and nature of required remedial actions, the nature of operations at each site, the technology available and needed to meet the various existing legal requirements, the nature and terms of cost-sharing arrangements with other potentially responsible parties, the availability of insurance coverage, the nature and extent of future environmental laws and regulations, inflation rates, terms of consent agreements or remediation permits with regulatory agencies and the determination of the Partnership’s liability at the sites, if any, in light of the number, participation level and financial viability of the other parties. The recognition of additional losses, if and when they were to occur, would likely extend over many years. Management believes that the Partnership’s exposure to adverse developments with respect to any individual site is not expected to be material. However, if changes in environmental laws or regulations occur or the assumptions used to estimate losses at multiple sites are adjusted, such changes could impact multiple facilities, formerly owned facilities and third-party sites at the same time. As a result, from time to time, significant charges against income for environmental remediation may occur; however, management does not believe that any such charges would have a material adverse impact on the Partnership’s consolidated financial position.
Deferred Income Taxes.
ETE recognizes benefits in earnings and related deferred tax assets for net operating loss carryforwards (“NOLs”) and tax credit carryforwards. If necessary, a charge to earnings and a related valuation allowance are recorded to reduce deferred tax assets to an amount that is more likely than not to be realized by the Partnership in the future. Deferred income tax assets attributable to state and federal NOLs and federal tax alternative minimum tax credit carryforwards totaling
$116 million
have been included in ETE’s consolidated balance sheet as of
December 31, 2014
. All of the deferred income tax assets attributable to state and federal NOL benefits expire before
2033
as more fully described below. The state NOL carryforward benefits of
$111 million
(net of federal benefit) begin to expire in
2014
with a substantial portion expiring between 2029 and 2033. The federal NOLs of
$5 million
($1 million in benefits) will expire in 2032 and 2033. Less than $1 million of federal tax alternative minimum tax credit carryforwards remained at December 31, 2014. We have determined that a valuation allowance totaling
$84 million
(net of federal income tax effects) is required for the state NOLs at
December 31, 2014
primarily due to significant restrictions on their use in the Commonwealth of Pennsylvania. In making the assessment of the future realization of the deferred tax assets, we rely on future reversals of existing taxable temporary differences, tax planning strategies and forecasted taxable income based on historical and projected future operating results. The potential need for valuation allowances is regularly reviewed by management. If it is more likely than not that the recorded asset will not be realized, additional valuation allowances which increase income tax expense may be recognized in the period such determination is made. Likewise, if it is more likely than not that additional deferred tax assets will be realized, an adjustment to the deferred tax asset will increase income in the period such determination is made.
104
Forward-Looking Statements
This annual report contains various forward-looking statements and information that are based on our beliefs and those of our General Partner, as well as assumptions made by and information currently available to us. These forward-looking statements are identified as any statement that does not relate strictly to historical or current facts. When used in this annual report, words such as “anticipate,” “project,” “expect,” “plan,” “goal,” “forecast,” “estimate,” “intend,” “could,” “believe,” “may,” “will” and similar expressions and statements regarding our plans and objectives for future operations, are intended to identify forward-looking statements. Although we and our General Partner believe that the expectations on which such forward-looking statements are reasonable, neither we nor our General Partner can give assurances that such expectations will prove to be correct. Forward-looking statements are subject to a variety of risks, uncertainties and assumptions. If one or more of these risks or uncertainties materialize, or if underlying assumptions prove incorrect, our actual results may vary materially from those anticipated, estimated, projected or expected. Among the key risk factors that may have a direct bearing on our results of operations and financial condition are:
|
•
|
the volumes transported on our subsidiaries’ pipelines and gathering systems;
|
|
•
|
the level of throughput in our subsidiaries’ processing and treating facilities;
|
|
•
|
the fees our subsidiaries charge and the margins they realize for their gathering, treating, processing, storage and transportation services;
|
|
•
|
the prices and market demand for, and the relationship between, natural gas and NGLs;
|
|
•
|
energy prices generally;
|
|
•
|
the prices of natural gas and NGLs compared to the price of alternative and competing fuels;
|
|
•
|
the general level of petroleum product demand and the availability and price of NGL supplies;
|
|
•
|
the level of domestic oil, natural gas and NGL production;
|
|
•
|
the availability of imported oil, natural gas and NGLs;
|
|
•
|
actions taken by foreign oil and gas producing nations;
|
|
•
|
the political and economic stability of petroleum producing nations;
|
|
•
|
the effect of weather conditions on demand for oil, natural gas and NGLs;
|
|
•
|
availability of local, intrastate and interstate transportation systems;
|
|
•
|
the continued ability to find and contract for new sources of natural gas supply;
|
|
•
|
availability and marketing of competitive fuels;
|
|
•
|
the impact of energy conservation efforts;
|
|
•
|
energy efficiencies and technological trends;
|
|
•
|
governmental regulation and taxation;
|
|
•
|
changes to, and the application of, regulation of tariff rates and operational requirements related to our subsidiaries’ interstate and intrastate pipelines;
|
|
•
|
hazards or operating risks incidental to the gathering, treating, processing and transporting of natural gas and NGLs;
|
|
•
|
competition from other midstream companies and interstate pipeline companies;
|
|
•
|
loss of key personnel;
|
|
•
|
loss of key natural gas producers or the providers of fractionation services;
|
|
•
|
reductions in the capacity or allocations of third-party pipelines that connect with our subsidiaries pipelines and facilities;
|
|
•
|
the effectiveness of risk-management policies and procedures and the ability of our subsidiaries liquids marketing counterparties to satisfy their financial commitments;
|
|
•
|
the nonpayment or nonperformance by our subsidiaries’ customers;
|
|
•
|
regulatory, environmental, political and legal uncertainties that may affect the timing and cost of our subsidiaries’ internal growth projects, such as our subsidiaries’ construction of additional pipeline systems;
|
105
|
•
|
risks associated with the construction of new pipelines and treating and processing facilities or additions to our subsidiaries’ existing pipelines and facilities, including difficulties in obtaining permits and rights-of-way or other regulatory approvals and the performance by third-party contractors;
|
|
•
|
the availability and cost of capital and our subsidiaries’ ability to access certain capital sources;
|
|
•
|
a deterioration of the credit and capital markets;
|
|
•
|
risks associated with the assets and operations of entities in which our subsidiaries own less than a controlling interests, including risks related to management actions at such entities that our subsidiaries may not be able to control or exert influence;
|
|
•
|
the ability to successfully identify and consummate strategic acquisitions at purchase prices that are accretive to our financial results and to successfully integrate acquired businesses;
|
|
•
|
changes in laws and regulations to which we are subject, including tax, environmental, transportation and employment regulations or new interpretations by regulatory agencies concerning such laws and regulations; and
|
|
•
|
the costs and effects of legal and administrative proceedings.
|
You should not put undue reliance on any forward-looking statements. When considering forward-looking statements, please review the risks described under “Item 1A. Risk Factors” in this annual report. Any forward-looking statement made by us in this Annual Report on Form 10-K is based only on information currently available to us and speaks only as of the date on which it is made. We undertake no obligation to publicly update any forward-looking statement, whether written or oral, that may be made from time to time, whether as a result of new information, future developments or otherwise.
Inflation
Interest rates on existing and future credit facilities and future debt offerings could be significantly higher than current levels, causing our financing costs to increase accordingly. Although increased financing costs could limit our ability to raise funds in the capital markets, we expect to remain competitive with respect to acquisitions and capital projects since our competitors would face similar circumstances.
Inflation in the United States has been relatively low in recent years and has not had a material effect on our results of operations. It may in the future, however, increase the cost to acquire or replace property, plant and equipment and may increase the costs of labor and supplies. Our operating revenues and costs are influenced to a greater extent by commodity price changes. To the extent permitted by competition, regulation and our existing agreements, we have and will continue to pass along a portion of increased costs to our customers in the form of higher fees.
(Tabular dollar amounts are in millions)
Market risk includes the risk of loss arising from adverse changes in market rates and prices. We face market risk from commodity variations, risk and interest rate variations, and to a lesser extent, credit risks. From time to time, we may utilize derivative financial instruments as described below to manage our exposure to such risks.
Commodity Price Risk
The tables below summarize commodity-related financial derivative instruments, fair values and the effect of an assumed hypothetical 10% change in the underlying price of the commodity as of
December 31, 2014
and
2013
for ETP and Regency, including derivatives related to their respective subsidiaries. Notional volumes are presented in MMBtu for natural gas, thousand megawatt for power and barrels for natural gas liquids, crude and refined products. Dollar amounts are presented in millions.
The fair values of the commodity-related financial positions have been determined using independent third party prices, readily available market information and appropriate valuation techniques. Non-trading positions offset physical exposures to the cash market; none of these offsetting physical exposures are included in the below tables. Price-risk sensitivities were calculated by assuming a theoretical 10% change (increase or decrease) in price regardless of term or historical relationships between the contractual price of the instruments and the underlying commodity price. Results are presented in absolute terms and represent a potential gain or loss in net income or in other comprehensive income. In the event of an actual 10% change in prompt month natural gas prices, the fair value of our total derivative portfolios may not change by 10% due to factors such as when the financial instrument settles and the location to which the financial instrument is tied (i.e., basis swaps) and the relationship between prompt month and forward months.
106
Our consolidated balance sheets also reflect assets and liabilities related to commodity derivatives that have previously been de-designated as cash flow hedges or for which offsetting positions have been entered. Those amounts are not subject to change based on changes in prices.
Investment in ETP
For certain of ETP’s activities, it is exposed to market risks related to the volatility of commodity prices. To manage the impact of volatility from these prices, ETP utilizes various exchange-traded and over-the-counter commodity financial instrument contracts. These contracts consist primarily of futures and swaps and are recorded at fair value in the consolidated balance sheets. In general, ETP uses derivatives to reduce market exposure and price risk within its operations as follows:
|
•
|
ETP uses derivative financial instruments in connection with its natural gas inventory at the Bammel storage facility by purchasing physical natural gas and then selling forward financial contracts at a price sufficient to cover its carrying costs and provide a gross profit margin. ETP also uses derivatives in its intrastate transportation and storage operations to hedge the sales price of retention natural gas in excess of consumption, a portion of volumes purchased at the wellhead from producers, and location price differentials related to the transportation of natural gas. Additionally, ETP uses derivatives for trading purposes in these operations.
|
|
•
|
Derivatives are utilized in ETP’s midstream operations in order to mitigate price volatility in its marketing activities and manage fixed price exposure incurred from contractual obligations.
|
|
•
|
ETP also uses derivative swap contracts to mitigate risk from price fluctuations on NGLs it retains for fees in its midstream operations.
|
|
•
|
Sunoco Logistics uses derivative contracts as economic hedges against price changes related to its forecasted refined products and NGL purchase and sale activities.
|
|
•
|
In all other operations, ETP utilized derivatives for trading purposes.
|
The market prices used to value financial derivatives and related transactions have been determined using independent third party prices, readily available market information, broker quotes and appropriate valuation techniques.
If ETP designates a derivative financial instrument as a cash flow hedge and it qualifies for hedge accounting, the change in the fair value is deferred in AOCI until the underlying hedged transaction occurs. Any ineffective portion of a cash flow hedge’s change in fair value is recognized each period in earnings. Gains and losses deferred in AOCI related to cash flow hedges remain in AOCI until the underlying physical transaction occurs, unless it is probable that the forecasted transaction will not occur by the end of the originally specified time period or within an additional two-month period of time thereafter. For financial derivative instruments that do not qualify for hedge accounting, the change in fair value is recorded in cost of products sold in the consolidated statements of operations.
If ETP designates a hedging relationship as a fair value hedge, ETP records the changes in fair value of the hedged asset or liability in cost of products sold in our consolidated statement of operations. This amount is offset by the changes in fair value of the related hedging instrument. Any ineffective portion or amount excluded from the assessment of hedge ineffectiveness is also included in cost of products sold in our consolidated statements of operations.
ETP uses futures and basis swaps, designated as fair value hedges, to hedge its natural gas inventory stored in its Bammel storage facility. Changes in the spreads between the forward natural gas prices designated as fair value hedges and the physical Bammel inventory spot price result in unrealized gains or losses until the underlying physical gas is withdrawn and the related designated derivatives are settled. Once the gas is withdrawn and the designated derivatives are settled, the previously unrealized gains or losses associated with these positions are realized.
ETP attempts to maintain balanced positions to protect itself from the volatility in the energy commodities markets; however, net unbalanced positions can exist. Long-term physical contracts are tied to index prices. System gas, which is also tied to index prices, is expected to provide most of the gas required by our long-term physical contracts. When third-party gas is required to supply long-term contracts, a hedge is put in place to protect the margin on the contract. To the extent open commodity positions exist, fluctuating commodity prices can impact our financial position and results of operations, either favorably or unfavorably.
Sunoco Logistics manages exposures to crude oil, refined products and NGL commodity prices by monitoring inventory levels and expectations of future commodity prices when making decisions with respect to risk management and inventory carried. Sunoco Logistics’ policy is to purchase only commodity products for which it has a market and to structure its sales contracts so that price fluctuations for those products do not materially affect the margin Sunoco Logistics receives. Sunoco Logistics also seeks to maintain a position that is substantially balanced within its various commodity purchase and sale activities. Sunoco Logistics may experience net unbalanced positions for short periods of time as a result of production, transportation and delivery
107
variances, as well as logistical issues associated with inclement weather conditions. When unscheduled inventory builds or draws do occur, they are monitored and managed to a balanced position over a reasonable period of time.
|
|
December 31, 2014
|
December 31, 2013
|
|||||||||||||||||||
|
|
Notional Volume
|
Fair Value Asset (Liability)
|
Effect of Hypothetical 10% Change
|
Notional Volume
|
Fair Value Asset (Liability)
|
Effect of Hypothetical 10% Change
|
|||||||||||||||
|
Mark-to-Market Derivatives
|
|||||||||||||||||||||
|
(Trading)
|
|||||||||||||||||||||
|
Natural Gas (MMBtu):
|
|||||||||||||||||||||
|
Fixed Swaps/Futures
|
(232,500
|
)
|
$
|
(1
|
)
|
$
|
—
|
|
9,457,500
|
|
$
|
3
|
|
$
|
5
|
|
|||||
|
Basis Swaps IFERC/NYMEX
(1)
|
(13,907,500
|
)
|
—
|
|
—
|
|
(487,500
|
)
|
1
|
|
—
|
|
|||||||||
|
Swings Swaps IFERC
|
—
|
|
—
|
|
—
|
|
1,937,500
|
|
1
|
|
—
|
|
|||||||||
|
Options – Calls
|
5,000,000
|
|
—
|
|
—
|
|
—
|
|
—
|
|
—
|
|
|||||||||
|
Power (Megawatt):
|
|||||||||||||||||||||
|
Forwards
|
288,775
|
|
—
|
|
1
|
|
351,050
|
|
1
|
|
1
|
|
|||||||||
|
Futures
|
(156,000
|
)
|
2
|
|
—
|
|
(772,476
|
)
|
—
|
|
2
|
|
|||||||||
|
Options — Puts
|
(72,000
|
)
|
—
|
|
1
|
|
(52,800
|
)
|
—
|
|
—
|
|
|||||||||
|
Options — Calls
|
198,556
|
|
—
|
|
—
|
|
103,200
|
|
—
|
|
—
|
|
|||||||||
|
Crude (Bbls) — Futures
|
—
|
|
—
|
|
—
|
|
103,000
|
|
—
|
|
1
|
|
|||||||||
|
(Non-Trading)
|
|||||||||||||||||||||
|
Natural Gas (MMBtu):
|
|||||||||||||||||||||
|
Basis Swaps IFERC/NYMEX
|
57,500
|
|
(3
|
)
|
—
|
|
570,000
|
|
—
|
|
—
|
|
|||||||||
|
Swing Swaps IFERC
|
46,150,000
|
|
2
|
|
1
|
|
(9,690,000
|
)
|
1
|
|
—
|
|
|||||||||
|
Fixed Swaps/Futures
|
(8,779,000
|
)
|
4
|
|
2
|
|
(8,195,000
|
)
|
13
|
|
3
|
|
|||||||||
|
Forward Physical Contracts
|
(9,116,777
|
)
|
—
|
|
3
|
|
5,668,559
|
|
(1
|
)
|
2
|
|
|||||||||
|
Natural Gas Liquid (Bbls) — Forwards/Swaps
|
(2,179,400
|
)
|
13
|
|
9
|
|
(1,133,600
|
)
|
—
|
|
3
|
|
|||||||||
|
Refined Products (Bbls) — Futures
|
13,745,755
|
|
15
|
|
11
|
|
(280,000
|
)
|
—
|
|
17
|
|
|||||||||
|
Fair Value Hedging Derivatives
|
|||||||||||||||||||||
|
(Non-Trading)
|
|||||||||||||||||||||
|
Natural Gas (MMBtu):
|
|||||||||||||||||||||
|
Basis Swaps IFERC/NYMEX
|
(39,287,500
|
)
|
3
|
|
1
|
|
(7,352,500
|
)
|
—
|
|
—
|
|
|||||||||
|
Fixed Swaps/Futures
|
(39,287,500
|
)
|
48
|
|
12
|
|
(50,530,000
|
)
|
(11
|
)
|
23
|
|
|||||||||
|
Cash Flow Hedging Derivatives
|
|||||||||||||||||||||
|
(Non-Trading)
|
|||||||||||||||||||||
|
Natural Gas (MMBtu):
|
|||||||||||||||||||||
|
Basis Swaps IFERC/NYMEX
|
—
|
|
—
|
|
—
|
|
(1,825,000
|
)
|
—
|
|
—
|
|
|||||||||
|
Fixed Swaps/Futures
|
—
|
|
—
|
|
—
|
|
(12,775,000
|
)
|
(3
|
)
|
6
|
|
|||||||||
|
Natural Gas Liquid (Bbls) — Forwards/Swaps
|
—
|
|
—
|
|
—
|
|
(780,000
|
)
|
(1
|
)
|
4
|
|
|||||||||
|
Crude (Bbls) — Futures
|
—
|
|
—
|
|
—
|
|
(30,000
|
)
|
—
|
|
—
|
|
|||||||||
(1)
Includes aggregate amounts for open positions related to Houston Ship Channel, Waha Hub, NGPL TexOk, West Louisiana Zone and Henry Hub locations.
Investment in Regency
Regency is a net seller of NGLs, condensate and natural gas as a result of its gathering and processing operations. The prices of these commodities are impacted by changes in the supply and demand, as well as market forces. Regency’s profitability and cash flow are affected by the inherent volatility of these commodities, which could adversely affect its ability to make distributions to its unitholders. Regency manages this commodity price exposure through an integrated strategy that includes management of its
108
contract portfolio, matching sales prices of commodities with purchases, optimization of its portfolio by monitoring basis and other price differentials in operating areas, and the use of derivative contracts. In some cases, Regency may not be able to match pricing terms or to cover its risk to price exposure with financial hedges, and it may be exposed to commodity price risk. Speculative positions are prohibited under Regency’s policy.
Regency is exposed to market risks associated with commodity prices, counterparty credit, and interest rates. Regency’s management and the board of directors of Regency GP have established comprehensive risk management policies and procedures to monitor and manage these market risks. Regency GP is responsible for delegation of transaction authority levels, and the Audit and Risk Committee of Regency GP is responsible for the overall management of credit risk and commodity price risk, including monitoring exposure limits. Regency GP’s Audit and Risk Committee receives regular briefings on positions and exposures, credit exposures and overall risk management in the context of market activities.
Regency has swap contracts that settle against certain NGLs, condensate and natural gas market prices.
|
|
December 31, 2014
|
December 31, 2013
|
|||||||||||||||||||
|
|
Notional
Volume
|
Fair Value
Asset
(Liability)
|
Effect of
Hypothetical
10%
Change
|
Notional
Volume
|
Fair Value
Asset
(Liability)
|
Effect of
Hypothetical
10%
Change
|
|||||||||||||||
|
Mark-to-Market Derivatives
|
|||||||||||||||||||||
|
(Non-Trading)
|
|||||||||||||||||||||
|
Natural Gas (MMBtu) — Fixed Swaps/Futures
|
(25,525,000
|
)
|
$
|
26
|
|
$
|
8
|
|
(24,455,000
|
)
|
$
|
(2
|
)
|
$
|
10
|
|
|||||
|
Propane (Gallons) — Forwards/Swaps
|
(29,148,000
|
)
|
17
|
|
1
|
|
(52,122,000
|
)
|
(3
|
)
|
6
|
|
|||||||||
|
NGLs (Barrels) — Forwards/Swaps
|
(292,000
|
)
|
6
|
|
1
|
|
(438,000
|
)
|
1
|
|
2
|
|
|||||||||
|
WTI Crude Oil (Barrels) — Forwards/Swaps
|
(1,252,000
|
)
|
36
|
|
7
|
|
(521,000
|
)
|
(1
|
)
|
5
|
|
|||||||||
Interest Rate Risk
As of
December 31, 2014
, ETP had
$2.04 billion
of floating rate debt outstanding, Regency had
$1.50 billion
of floating rate debt outstanding under its revolving credit facilities and ETE had
$2.34 billion
of floating rate debt outstanding under its revolving credit facilities as of
December 31, 2014
. We manage a portion of our interest rate exposure by utilizing interest rate swaps. To the extent that we have debt with floating interest rates that are not hedged, our results of operations, cash flows and financial condition could be adversely affected by increases in interest rates.
109
The following table summarizes our interest rate swaps outstanding (dollars in millions), none of which are designated as hedges for accounting purposes:
|
|
|
|
Notional Amount Outstanding
|
|||||||||
|
Entity
|
Term
|
Type
(1)
|
December 31, 2014
|
December 31, 2013
|
||||||||
|
ETP
|
July 2014
(2)
|
Forward-starting to pay a fixed rate of 4.25% and receive a floating rate
|
$
|
—
|
|
$
|
400
|
|
||||
|
ETP
|
July 2015
(2)
|
Forward-starting to pay a fixed rate of 3.38% and receive a floating rate
|
200
|
|
—
|
|
||||||
|
ETP
|
July 2016
(3)
|
Forward-starting to pay a fixed rate of 3.80% and receive a floating rate
|
200
|
|
—
|
|
||||||
|
ETP
|
July 2017
(4)
|
Forward-starting to pay a fixed rate of 3.84% and receive a floating rate
|
300
|
|
—
|
|
||||||
|
ETP
|
July 2018
(4)
|
Forward-starting to pay a fixed rate of 4.00% and receive a floating rate
|
200
|
|
—
|
|
||||||
|
ETP
|
July 2019
(4)
|
Forward-starting to pay a fixed rate of 3.19% and receive a floating rate
|
300
|
|
—
|
|
||||||
|
ETP
|
July 2018
|
Pay a floating rate plus a spread of 4.17% and receive a fixed rate of 6.70%
|
—
|
|
600
|
|
||||||
|
ETP
|
June 2021
|
Pay a floating rate plus a spread of 2.17% and receive a fixed rate of 4.65%
|
—
|
|
400
|
|
||||||
|
ETP
|
February 2023
|
Pay a floating rate plus a spread of 1.73% and receive a fixed rate of 3.60%
|
200
|
|
400
|
|
||||||
|
Panhandle
|
November 2021
|
Pay a fixed rate of 3.82% and receive a floating rate
|
—
|
|
275
|
|
||||||
|
(1)
|
Floating rates are based on 3-month LIBOR.
|
|
(2)
|
Represents the effective date. These forward-starting swaps have a term of 10 years with a mandatory termination date the same as the effective date.
|
|
(3)
|
Represents the effective date. These forward-starting swaps have terms of 10 and 30 years with a mandatory termination date the same as the effective date.
|
|
(4)
|
Represents the effective date. These forward-starting swaps have a term of 30 years with a mandatory termination date the same as the effective date.
|
A hypothetical change of 100 basis points in interest rates for these interest rate swaps would result in a change in the fair value of the interest rate derivatives and earnings (recognized in gains (losses) on interest rate derivatives) of approximately
$214 million
as of
December 31, 2014
. For ETP’s
$200 million
of interest rate swaps whereby it pays a floating rate and receives a fixed rate, a hypothetical change of 100 basis points in interest rates would result in a net change in annual cash flow of
$2 million
. For the forward-starting interest rate swaps, a hypothetical change of 100 basis points in interest rates would not affect cash flows until the swaps are settled.
Credit Risk
Credit Risk refers to the risk that a counterparty may default on its contractual obligations resulting in a loss to the Partnership. Credit policies have been approved and implemented to govern the Partnership’s portfolio of counterparties with the objective of mitigating credit losses. These policies establish guidelines, controls and limits to manage credit risk within approved tolerances by mandating an appropriate evaluation of the financial condition of existing and potential counterparties, monitoring agency credit ratings, and by implementing credit practices that limit exposure according to the risk profiles of the counterparties. Furthermore, the Partnership may at times require collateral under certain circumstances to mitigate credit risk as necessary. We also implement the use of industry standard commercial agreements which allow for the netting of positive and negative exposures associated with transactions executed under a single commercial agreement. Additionally, we utilize master netting agreements to offset credit exposure across multiple commercial agreements with a single counterparty or affiliated group of counterparties.
The Partnership’s counterparties consist of a diverse portfolio of customers across the energy industry, including petrochemical companies, commercial and industrials, oil and gas producers, municipalities, gas and electric utilities and midstream companies. Our overall exposure may be affected positively or negatively by macroeconomic or regulatory changes that impact our
110
counterparties to one extent or another. Currently, management does not anticipate a material adverse effect in our financial position or results of operations as a consequence of counterparty non-performance.
Regency’s
business operations expose it to credit risk, as the margin on any sale is generally a very small percentage of the total sale price. Therefore, a credit loss can be very large relative to Regency’s overall profitability. Regency monitors credit exposure and attempts to ensure that it issues credit only to creditworthy counterparties and that in appropriate circumstances any such extension of credit is backed by adequate collateral such as a letter of credit or a parent company guarantee.
For financial instruments, failure of a counterparty to perform on a contract could result in our inability to realize amounts that have been recorded on our consolidated balance sheet and recognized in net income or other comprehensive income.
The financial statements starting on page
F-1
of this report are incorporated by reference.
AND FINANCIAL DISCLOSURE
None.
Evaluation of Disclosure Controls and Procedures
An evaluation was performed under the supervision and with the participation of our management, including the President and Group Chief Financial Officer and Head of Business Development of our General Partner, of the effectiveness of the design and operation of our disclosure controls and procedures (as such terms are defined in Rule 13a–15(e) and 15d–15(e) of the Exchange Act) as of the end of the period covered by this report. Based upon that evaluation, management, including the President and Group Chief Financial Officer and Head of Business Development of our General Partner, concluded that our disclosure controls and procedures were adequate and effective as of
December 31, 2014
.
Management’s Report on Internal Control over Financial Reporting
The management of Energy Transfer Equity, L.P. and subsidiaries is responsible for establishing and maintaining adequate internal control over financial reporting, as such term is defined in Exchange Act Rule 13a-15(f). Under the supervision and with the participation of our management, including the President and Group Chief Financial Officer and Head of Business Development of our General Partner, we conducted an evaluation of the effectiveness of our internal control over financial reporting based on the framework in the 2013
Internal Control
–
Integrated Framework
issued by the Committee of Sponsoring Organizations of the Treadway Commission (“COSO Framework”).
On August 29, 2014, ETP and Susser completed the previously announced merger of an indirect wholly-owned subsidiary of ETP, with and into Susser, with Susser surviving the merger as a subsidiary of ETP (the “Susser Merger”). Management has acknowledged that it is responsible for establishing and maintaining a system of internal controls over financial reporting for Susser. We are in the process of integrating Susser, and we therefore excluded Susser from our
December 31, 2014
assessment of the effectiveness of internal control over financial reporting. Susser had total assets of
$2.68 billion
at
December 31, 2014
and third party revenue of
$1.62 billion
from August 29, 2014 to
December 31, 2014
included in our consolidated financial statements as of and for the year ended
December 31, 2014
. The Susser Merger has not materially affected and is not expected to materially affect our internal control over financial reporting. As a result of these integration activities, certain controls will be evaluated and may be changed. We believe, however, that we will be able to maintain sufficient controls over the substantive results of our financial reporting throughout this integration process.
Our assessment of internal control over financial reporting did include an assessment of Sunoco LP, which ETP obtained control of in connection with the Susser Merger.
On July 1, 2014, our subsidiary Regency acquired Eagle Rock’s midstream business. Management has acknowledged that it is responsible for establishing and maintaining a system of internal controls over financial reporting for Eagle Rock. We are in the process of integrating Eagle Rock, and we therefore excluded Eagle Rock from our December 31, 2014 assessment of the effectiveness of internal control over financial reporting. Eagle Rock had total assets of $1.90 billion and third party revenue of
$903 million
from July 1, 2014 to December 31, 2014 included in our consolidated financial statements as of and for the year ended December 31, 2014. The impact of the acquisition of Eagle Rock has not materially affected and is not expected to materially affect our internal control over financial reporting. As a result of these integration activities, certain controls will be evaluated and
111
may be changed. We believe, however, that we will be able to maintain sufficient controls over the substantive results of our financial reporting throughout this integration process.
Based on our evaluation under the COSO framework, our management concluded that our internal control over financial reporting was effective as of
December 31, 2014
.
Grant Thornton LLP, an independent registered public accounting firm, has audited the effectiveness of our internal control over financial reporting as of
December 31, 2014
, as stated in their report, which is included herein.
112
REPORT OF INDEPENDENT REGISTERED PUBLIC ACCOUNTING FIRM
Partners
Energy Transfer Equity, L.P.
We have audited the internal control over financial reporting of Energy Transfer Equity, L.P. (a Delaware limited partnership) and subsidiaries (the “Partnership”) as of
December 31, 2014
, based on criteria established in the 2013
Internal Control-Integrated Framework
issued by the Committee of Sponsoring Organizations of the Treadway Commission (COSO). The Partnership’s management is responsible for maintaining effective internal control over financial reporting and for its assessment of the effectiveness of internal control over financial reporting, included in the accompanying Management’s Report on Internal Control over Financial Reporting. Our responsibility is to express an opinion on the Partnership’s internal control over financial reporting based on our audit. Our audit of, and opinion on, the Partnership’s internal control over financial reporting does not include the internal control over financial reporting of Susser Holdings Corporation, a consolidated subsidiary, whose financial statements reflect total assets and revenues constituting 4 and 3 percent, respectively, of the related consolidated financial statement amounts as of and for the year ended December 31, 2014. Our audit of, and opinion on, the Partnership’s internal control over financial reporting also does not include the internal control over financial reporting of Eagle Rock Energy Partners, L.P.’s midstream business, whose financial statements reflect total assets and revenues constituting 3 and 2 percent, respectively, of the related consolidated financial statement amounts as of and for the year ended December 31, 2014. As indicated in Management’s Report on Internal Control over Financial Reporting, Susser Holdings Corporation and Eagle Rock Energy Partners, L.P.’s midstream business were acquired during 2014. Management’s assertion on the effectiveness of the Partnership’s internal control over financial reporting excluded internal control over financial reporting of Susser Holdings Corporation and Eagle Rock Energy Partners, L.P.’s midstream business. We did not audit the internal control over financial reporting of Sunoco LP, a consolidated subsidiary, whose financial statements as of December 31, 2014 and for the period from September 1, 2014 to December 31, 2014 reflect total assets and revenues constituting 3 and 2 percent, respectively, of the related consolidated financial statement amounts as of and for the year ended December 31, 2014. Sunoco LP’s internal control over financial reporting was audited by other auditors whose report has been furnished to us, and our opinion, insofar as it relates to Sunoco LP’s internal control over financial reporting in relation to the Partnership taken as a whole, is based solely on the report of the other auditors.
We conducted our audit in accordance with the standards of the Public Company Accounting Oversight Board (United States). Those standards require that we plan and perform the audit to obtain reasonable assurance about whether effective internal control over financial reporting was maintained in all material respects. Our audit included obtaining an understanding of internal control over financial reporting, assessing the risk that a material weakness exists, testing and evaluating the design and operating effectiveness of internal control based on the assessed risk, and performing such other procedures as we considered necessary in the circumstances. We believe that our audit and the report of the other auditors provide a reasonable basis for our opinion.
A company’s internal control over financial reporting is a process designed to provide reasonable assurance regarding the reliability of financial reporting and the preparation of financial statements for external purposes in accordance with generally accepted accounting principles. A company’s internal control over financial reporting includes those policies and procedures that (1) pertain to the maintenance of records that, in reasonable detail, accurately and fairly reflect the transactions and dispositions of the assets of the company; (2) provide reasonable assurance that transactions are recorded as necessary to permit preparation of financial statements in accordance with generally accepted accounting principles, and that receipts and expenditures of the company are being made only in accordance with authorizations of management and directors of the company; and (3) provide reasonable assurance regarding prevention or timely detection of unauthorized acquisition, use, or disposition of the company’s assets that could have a material effect on the financial statements.
Because of its inherent limitations, internal control over financial reporting may not prevent or detect misstatements. Also, projections of any evaluation of effectiveness to future periods are subject to the risk that controls may become inadequate because of changes in conditions, or that the degree of compliance with the policies or procedures may deteriorate.
In our opinion, based on our audit and the report of the other auditors, the Partnership maintained, in all material respects, effective internal control over financial reporting as of
December 31, 2014
, based on criteria established in the 2013
Internal Control-Integrated Framework
issued by COSO.
We also have audited, in accordance with the standards of the Public Company Accounting Oversight Board (United States), the consolidated financial statements of the Partnership as of and for the year ended December 31, 2014, and our report dated
March 2, 2015
expressed an unqualified opinion on those financial statements.
/s/ GRANT THORNTON LLP
Dallas, Texas
March 2, 2015
113
Changes in Internal Controls over Financial Reporting
There has been no change in our internal controls over financial reporting (as defined in Rules 13a–15(f) or Rule 15d–15(f)) that occurred in the three months ended
December 31, 2014
that has materially affected, or is reasonably likely to materially affect, our internal controls over financial reporting.
None.
Board of Directors
Our General Partner, LE GP, LLC, manages and directs all of our activities. The officers and directors of ETE are officers and directors of LE GP, LLC. The members of our General Partner elect our General Partner’s Board of Directors. The board of directors of our General Partner has the authority to appoint our executive officers, subject to provisions in the limited liability company agreement of our General Partner. Pursuant to other authority, the board of directors of our General Partner may appoint additional management personnel to assist in the management of our operations and, in the event of the death, resignation or removal of our chief executive officer, to appoint a replacement.
As of
December 31, 2014
, our Board of Directors was comprised of seven persons, three of whom qualify as “independent” under the NYSE’s corporate governance standards. We have determined that Messrs. Williams, Ramsey and Turner are all “independent” under the NYSE’s corporate governance standards.
As a limited partnership, we are not required by the rules of the NYSE to seek unitholder approval for the election of any of our directors. We believe that the members of our General Partner have appointed as directors individuals with experience, skills and qualifications relevant to the business of the Parent Company, such as experience in energy or related industries or with financial markets, expertise in natural gas operations or finance, and a history of service in senior leadership positions. We do not have a formal process for identifying director nominees, nor do we have a formal policy regarding consideration of diversity in identifying director nominees, but we believe that the members of our General Partner have endeavored to assemble a group of individuals with the qualities and attributes required to provide effective oversight of the Parent Company.
Risk Oversight
Our Board of Directors generally administers its risk oversight function through the board as a whole. Our President, who reports to the Board of Directors, has day-to-day risk management responsibilities. Our President attends the meetings of our Board of Directors, where the Board of Directors routinely receives reports on our financial results, the status of our operations, and other aspects of implementation of our business strategy, with ample opportunity for specific inquiries of management. In addition, at each regular meeting of the Board, management provides a report of the Parent Company’s financial and operational performance, which often prompts questions or feedback from the Board of Directors. The Audit Committee provides additional risk oversight through its quarterly meetings, where it receives a report from the Parent Company’s internal auditor, who reports directly to the Audit Committee, and reviews the Parent Company’s contingencies with management and our independent auditors.
Corporate Governance
The Board of Directors has adopted both a Code of Business Conduct and Ethics applicable to our directors, officers and employees, and Corporate Governance Guidelines for directors and the Board. Current copies of our Code of Business Conduct and Ethics, Corporate Governance Guidelines and charters of the Audit and Compensation Committees of our Board of Directors are available on our website at www.energytransfer.com and will be provided in print form to any Unitholder requesting such information.
Please note that the preceding Internet address is for information purposes only and is not intended to be a hyperlink. Accordingly, no information found and/or provided at such Internet addresses or at our website in general is intended or deemed to be incorporated by reference herein.
Annual Certification
The Parent Company has filed the required certifications under Section 302 of the Sarbanes-Oxley Act of 2002 as Exhibits 31.1 to this annual report. In
2014
, our President and CFO provided to the NYSE the annual CEO certification regarding our compliance with the NYSE’s corporate governance listing standards.
114
Conflicts Committee
Our Partnership Agreement provides that the Board of Directors may, from time to time, appoint members of the Board to serve on the Conflicts Committee with the authority to review specific matters for which the Board of Directors believes there may be a conflict of interest in order to determine if the resolution of such conflict proposed by the General Partner is fair and reasonable to the Parent Company and our Unitholders. As a policy matter, the Conflicts Committee generally reviews any proposed related-party transaction that may be material to the Parent Company to determine if the transaction presents a conflict of interest and whether the transaction is fair and reasonable to the Parent Company. Pursuant to the terms of our partnership agreement, any matters approved by the Conflicts Committee will be conclusively deemed to be fair and reasonable to the Parent Company, approved by all partners of the Parent Company and not a breach by the General Partner or its Board of Directors of any duties they may owe the Parent Company or the Unitholders. These duties are limited by our Partnership Agreement (see “Risks Related to Conflicts of Interest” in Item 1A. Risk Factors in this annual report).
Audit Committee
The Board of Directors has established an Audit Committee in accordance with Section 3(a)(58)(A) of the Exchange Act. The Board of Directors appoints persons who are independent under the NYSE’s standards for audit committee members to serve on its Audit Committee. In addition, the Board determines that at least one member of the Audit Committee has such accounting or related financial management expertise sufficient to qualify such person as the audit committee financial expert in accordance with Item 407(d)(5) of Regulation S-K. The Board has determined that based on relevant experience, Audit Committee member Matt Ramsey qualified as an audit committee financial expert during 2014. A description of the qualifications of Mr. Ramsey may be found elsewhere in this Item 10 under “Directors and Executive Officers of the General Partner.”
The Audit Committee meets on a regularly scheduled basis with our independent accountants at least four times each year and is available to meet at their request. The Audit Committee has the authority and responsibility to review our external financial reporting, review our procedures for internal auditing and the adequacy of our internal accounting controls, consider the qualifications and independence of our independent accountants, engage and direct our independent accountants, including the letter of engagement and statement of fees relating to the scope of the annual audit work and special audit work which may be recommended or required by the independent accountants, and to engage the services of any other advisors and accountants as the Audit Committee deems advisable. The Audit Committee reviews and discusses the audited financial statements with management, discusses with our independent auditors matters required to be discussed by auditing standards
,
and makes recommendations to the Board of Directors relating to our audited financial statements. The Audit Committee periodically recommends to the Board of Directors any changes or modifications to its charter that may be required. The Audit Committee has received written disclosures and the letter from Grant Thornton required by applicable requirements of the Audit Committee concerning independence and has discussed with Grant Thornton that firm’s independence. The Audit Committee recommended to the Board that the audited financial statements of ETE be included in ETE’s Annual Report on Form 10-K for the year ended
December 31, 2014
.
The Board of Directors adopts the charter for the Audit Committee. Matthew S. Ramsey, K. Rick Turner and William P. Williams serve as elected members of the Audit Committee. Mr. Ramsey currently serves as the Chair of the Audit Committee. Mr. Ramsey currently serves as a member or chairman of the audit committee of three other publicly traded companies, including Sunoco LP, in addition to his service as a member of the Audit Committee of our General Partner. Mr. Turner also serves on the audit committee of three other publicly traded companies, including Sunoco LP. As required by Rule 303A.07 of the NYSE Listed Company Manual, the Board of Directors of our General Partner has determined that such simultaneous service does not impair Mr. Ramsey’s or Mr. Turner’s ability to effectively serve on our Audit Committee.
Compensation and Nominating/Corporate Governance Committees
Although we are not required under NYSE rules to appoint a Compensation Committee or a Nominating/Corporate Governance Committee because we are a limited partnership, the Board of Directors of LE GP, LLC has previously established a Compensation Committee to establish standards and make recommendations concerning the compensation of our officers and directors. In addition, the Compensation Committee determines and establishes the standards for any awards to our employees and officers under the equity compensation plans, including the performance standards or other restrictions pertaining to the vesting of any such awards. Pursuant to the Charter of the Compensation Committee, a director serving as a member of the Compensation Committee may not be an officer of or employed by our General Partner, the Parent Company, ETP or its subsidiaries, or Regency or its subsidiaries. Subsequent to the resignations of Paul E. Glaske and Bill W. Byrne from the board of directors of our General Partner effective June 30, 2011, ETE did not have a compensation committee; therefore, the members of the board of directors of our General Partner who would be eligible to be members of the Compensation Committee served in that capacity. In February 2013, Mr. Ramsey was appointed to the ETE Compensation Committee.
115
Matters relating to the nomination of directors or corporate governance matters were addressed to and determined by the full Board of Directors for the period ETE did not have a compensation committee.
In the discussion and analysis that follows, we have used the term, “ETE Compensation Committee,” to refer to either or both of (i) our compensation committee, which existed through June 2011 and from February 2013 to the present, and (ii) the eligible members of the board of directors of our General Partner, functioning in the capacity of our compensation committee subsequent from June 2011 to February 2013.
The responsibilities of the ETE Compensation Committee include, among other duties, the following:
|
•
|
annually review and approve goals and objectives relevant to compensation of our President and CFO, if applicable;
|
|
•
|
annually evaluate the President and CFO’s performance in light of these goals and objectives, and make recommendations to the Board of Directors with respect to the President and CFO’s compensation levels, if applicable, based on this evaluation;
|
|
•
|
make determinations with respect to the grant of equity-based awards to executive officers under ETE’s equity incentive plans;
|
|
•
|
periodically evaluate the terms and administration of ETE’s long-term incentive plans to assure that they are structured and administered in a manner consistent with ETE’s goals and objectives;
|
|
•
|
periodically evaluate incentive compensation and equity-related plans and consider amendments if appropriate;
|
|
•
|
periodically evaluate the compensation of the directors;
|
|
•
|
retain and terminate any compensation consultant to be used to assist in the evaluation of director, President and CFO or executive officer compensation; and
|
|
•
|
perform other duties as deemed appropriate by the Board of Directors.
|
The responsibilities of the ETP Compensation Committee include, among other duties, the following:
|
•
|
annually review and approve goals and objectives relevant to compensation of the Chief Executive Officer, or the CEO, if applicable; annually evaluate the CEO’s performance in light of these goals and objectives, and make recommendations to the Board of Directors of ETP with respect to the CEO’s compensation levels based on this evaluation, if applicable;
|
|
•
|
based on input from, and discussion with, the CEO, make recommendations to the Board of Directors of ETP with respect to non-CEO executive officer compensation, including incentive compensation and compensation under equity based plans;
|
|
•
|
make determinations with respect to the grant of equity-based awards to executive officers under ETP’s equity incentive plans;
|
|
•
|
periodically evaluate the terms and administration of ETP’s short-term and long-term incentive plans to assure that they are structured and administered in a manner consistent with ETP’s goals and objectives;
|
|
•
|
periodically evaluate incentive compensation and equity-related plans and consider amendments if appropriate;
|
|
•
|
periodically evaluate the compensation of the directors;
|
|
•
|
retain and terminate any compensation consultant to be used to assist in the evaluation of director, CEO or executive officer compensation; and
|
|
•
|
perform other duties as deemed appropriate by the Board of Directors of ETP.
|
Code of Business Conduct and Ethics
The Board of Directors has adopted a Code of Business Conduct and Ethics applicable to our officers, directors and employees. Specific provisions are applicable to the principal executive officer, principal financial officer, principal accounting officer and controller, or those persons performing similar functions, of our General Partner. Amendments to, or waivers from, the Code of Business Conduct and Ethics will be available on our website and reported as may be required under SEC rules. Any technical, administrative or other non-substantive amendments to the Code of Business Conduct and Ethics may not be posted.
Meetings of Non-management Directors and Communications with Directors
Our non-management directors meet in regularly scheduled sessions. Our non-management directors alternate as the presiding director of such meetings.
We have established a procedure by which Unitholders or interested parties may communicate directly with the Board of Directors, any committee of the Board, any of the independent directors, or any one director serving on the Board of Directors by sending
116
written correspondence addressed to the desired person, committee or group to the attention of Sonia Aubé at Energy Transfer Equity, L.P., 3738 Oak Lawn Avenue, Dallas, Texas, 75219. Communications are distributed to the Board of Directors, or to any individual director or directors as appropriate, depending on the facts and circumstances outlined in the communication.
Directors and Executive Officers of Our General Partner
The following table sets forth certain information with respect to the executive officers and members of the Board of Directors of our General Partner as of
March 2, 2015
. Executive officers and directors are elected for indefinite terms.
|
Name
|
Age
|
Position with Our General Partner
|
|||
|
John W. McReynolds
|
64
|
|
Director and President
|
||
|
Kelcy L. Warren
|
59
|
|
Director and Chairman of the Board
|
||
|
Jamie Welch
|
48
|
|
Director and Group Chief Financial Officer and Head of Business Development
|
||
|
Brad Whitehurst
|
40
|
|
Executive Vice President and Head of Tax
|
||
|
Marshall S. (Mackie) McCrea, III
|
55
|
|
Director
|
||
|
Matthew S. Ramsey
|
59
|
|
Director
|
||
|
K. Rick Turner
|
57
|
|
Director
|
||
|
William P. Williams
|
77
|
|
Director
|
||
Messrs. Warren, Welch and McCrea also serve as directors of ETP’s General Partner. Mr. McReynolds also serves as director of Regency’s General Partner.
Set forth below is biographical information regarding the foregoing officers and directors of our General Partner:
John W. McReynolds
. Mr. McReynolds has served as our President since March 2005 and as a Director since August 2005. He served as our Chief Financial Officer from August 2005 to June 2013 and has previously served as a director of Energy Transfer Partners from August 2001 through May 2010. Mr. McReynolds has also served as a director of Regency since May 2010. Prior to becoming President of Energy Transfer Equity, Mr. McReynolds was a partner with the international law firm of Hunton & Williams LLP for over 20 years. As a lawyer, Mr. McReynolds specialized in energy-related finance, securities, partnerships, mergers and acquisitions, syndication and litigation matters, and served as an expert in special projects for Boards of Directors for public companies. The members of our General Partner selected Mr. McReynolds to serve as a director because of his legal background and his extensive experience in energy-related corporate finance. Mr. McReynolds has relationships with executives and senior management at several companies in the energy sector, as well as with investment bankers who cover the industry.
Kelcy L. Warren
. Mr. Warren was appointed Co-Chairman of the Board of Directors of our General Partner, LE GP, LLC, effective upon the closing of our IPO. On August 15, 2007, Mr. Warren became the sole Chairman of the Board of our General Partner and the Chief Executive Officer and Chairman of the Board of the General Partner of ETP. Prior to that, Mr. Warren had served as Co-Chief Executive Officer and Co-Chairman of the Board of the General Partner of ETP since the combination of the midstream and intrastate transportation storage operations of ETC OLP and the retail propane operations of Heritage in January 2004. Mr. Warren also serves as Chief Executive Officer of the General Partner of ETC OLP. Prior to the combination of the operations of ETP and Heritage Propane, Mr. Warren served as President of the General Partner of ET Company I, Ltd. the entity that operated ETP’s midstream assets before it acquired Aquila, Inc.’s midstream assets, having served in that capacity since 1996. From 1996 to 2000, he also served as a Director of Crosstex Energy, Inc. From 1993 to 1996, he served as President, Chief Operating Officer and a Director of Cornerstone Natural Gas, Inc. Mr. Warren has more than 25 years of business experience in the energy industry. The members of our General Partner selected Mr. Warren to serve as a director and as Chairman because he is ETP’s Chief Executive Officer and has more than 25 years in the natural gas industry. Mr. Warren also has relationships with chief executives and other senior management at natural gas transportation companies throughout the United States, and brings a unique and valuable perspective to the Board of Directors.
Jamie Welch.
Mr. Welch has served as the Group Chief Financial Officer and Head of Business Developments for the Energy Transfer family since June 2013. Mr. Welch has also served on the Board of Directors of ETE, ETP, and Sunoco Logistics since June 2013. Before joining ETE, Mr. Welch was Head of the EMEA Investment Banking Department and Head of the Global Energy Group at Credit Suisse. He was also a member of the IBD Global Management Committee and the EMEA Operating Committee. Mr. Welch joined Credit Suisse First Boston in 1997 from Lehman Brothers Inc. in New York, where he was a Senior Vice President in the global utilities & project finance group. Prior to that he was an attorney with Milbank, Tweed, Hadley & McCloy (New York) and a barrister and solicitor with Minter Ellison in Melbourne Australia. The members of our General Partner selected Mr. Welch to serve on the Board of Directors because of his understanding of energy-related corporate finance gained through his experience in the investment banking and legal fields.
117
Brad Whitehurst.
Mr. Whitehurst has served as the Executive Vice President and Head of Tax of our General Partner since August 2014. Prior to joining ETE, Mr. Whitehurst was a partner in the Washington, DC office of Bingham McCutchen LLP and an attorney in the Washington, DC offices of both McKee Nelson LLP and Hogan & Hartson. Mr. Whitehurst has specialized in partnership taxation and has advised ETE and its subsidiaries in his role as outside counsel since 2006.
Marshall S. (Mackie) McCrea, III
. Mr. McCrea was appointed as a director on December 23, 2009. He is the President and Chief Operating Officer of ETP GP and has served in that capacity since June 2008. Prior to that, he served as President – Midstream from March 2007 to June 2008. Previously he served as the Senior Vice President – Commercial Development since the combination of the operations of ETC OLP and HOLP in January 2004. In March 2005, Mr. McCrea was named president of ETC OLP. Prior to the combination of the operations of ETC OLP and HOLP, Mr. McCrea served as the Senior Vice President – Business Development and Producer Services of the general partner of ETC OLP and ET Company I, Ltd., having served in that capacity since 1997. Mr. McCrea also currently serves on the Board of Directors of the general partner of ETE, of Sunoco Logistics and of Sunoco LP. The members of our General Partner selected Mr. McCrea to serve as a director because he brings extensive project development and operations experience to the Board. He has held various positions in the natural gas business over the past 25 years and is able to assist the Board of Directors in creating and executing the Partnership’s strategic plan.
Matthew S. Ramsey.
Mr. Ramsey was appointed as a director on July 17, 2012 and currently serves as chair of the Audit Committee and a member of the Compensation Committee. Mr. Ramsey is also a director of Sunoco LP, serving as chair of Sunoco LP’s audit committee and serving on Sunoco LP’s compensation committee. Mr. Ramsey is presently President of RPM Exploration, Ltd., a private oil and gas exploration partnership generating and drilling 3-D seismic prospects on the Gulf Coast of Texas. Mr. Ramsey is also President of Ramsey Energy Management, LLC, the General Partner of Ramsey Energy Partners, I, Ltd., a private oil and gas partnership, and as President of Dollarhide Management, LLC, the General Partner of Deerwood Investments, Ltd., a private oil and gas partnership. Additionally, Mr. Ramsey is President of Gateshead Oil, LLC, a private oil and gas partnership. He also serves as Manager of MSR Energy, LLC, the general partner of Shafter Lake Energy Partners, Ltd., a private oil and gas exploration limited partnership. In 2014, Mr. Ramsey joined the board of directors of RSP Permian, Inc. (NYSE: RSPP), where he serves as chairman of the compensation committee and as a member of the audit committee. Mr. Ramsey formerly served as President of DDD Energy, Inc. until its sale in 2002. From 1996 to 2000, Mr. Ramsey served as President and Chief Executive Officer of OEC Compression Corporation, Inc., a publicly traded oil field service company, providing gas compression services to a variety of energy clients. Previously, Mr. Ramsey served as Vice President of Nuevo Energy Company, an independent energy company. Additionally, he was employed by Torch Energy Advisors, Inc., a company providing management and operations services to energy companies including Nuevo Energy, last serving as Executive Vice President. Mr. Ramsey joined Torch Energy as Vice President of Land and was named Senior Vice President of Land in 1992. Prior to joining Torch Energy Advisors, Inc., Mr. Ramsey was self employed for eleven years. Mr. Ramsey holds a B.B.A. in Marketing from the University of Texas at Austin and a J.D. from South Texas College of Law. Mr. Ramsey is a graduate of Harvard Business School Advanced Management Program. Mr. Ramsey is licensed to practice law in the State of Texas. He is qualified to practice in the Western District of Texas and the United States Court of Appeals for the Fifth Circuit. Mr. Ramsey formerly served as a director of Southern Union Company. The members of our General Partner recognize Mr. Ramsey’s vast experience in the oil and gas space and believe that he provides valuable industry insight as a member of our Board of Directors.
K. Rick Turner.
Mr. Turner has served as a director of our General Partner since October 2002. Mr. Turner currently serves as chair of the Compensation Committee and a member of the Audit Committee. Mr. Turner is also a director of Sunoco LP, serving as chair of Sunoco LP’s compensation committee and serving on Sunoco LP’s audit committee. Mr. Turner is presently a managing director of Altos Energy Partners, LLC. Mr. Turner previously was a private equity executive with several groups after retiring from the Stephens’ family entities, which he had worked for since 1983. He first became a private equity principal in 1990 after serving as the Assistant to the Chairman, Jackson T. Stephens. His areas of focus have been oil and gas exploration, natural gas gathering, processing industries, and power technology. Prior to joining Stephens, he was employed by Peat, Marwick, Mitchell and Company. Mr. Turner currently serves as a director of North American Energy Partners Inc. and AmeriGas. Mr. Turner earned his B.S.B.A. from the University of Arkansas and is a non-practicing Certified Public Accountant. The members of our General Partner selected Mr. Turner based on his industry knowledge, his background in corporate finance and accounting, and his experience as a director and audit committee member on the boards of several other companies.
William P. Williams.
Mr. Williams was appointed as a director on March 24, 2012 and currently serves as a member of the Audit Committee. Mr. Williams began his career in the oil and gas industry in 1967 with Texas Power and Light Company as Manager of Pipeline Construction for Bi-Stone Fuel Company, a predecessor of Texas Utilities Fuel Company. In 1980, he was employed by Endevco as Vice President of Pipeline and Plant Construction, Engineering, and Operations. Prior to Endevco, he worked for Cornerstone Natural Gas followed by Vice President of Engineering and Operations at Energy Transfer Partners, L.P. ending his career as Vice President of Measurement on May 1, 2011. Mr. Williams also serves as a member of the Audit Committee.
118
Compensation of the General Partner
Our General Partner does not receive any management fee or other compensation in connection with its management of the Parent Company.
Section 16(a) Beneficial Ownership Reporting Compliance
Section 16(a) of the Exchange Act requires our officers and directors, and persons who own more than 10% of a registered class of our equity securities, to file reports of beneficial ownership and changes in beneficial ownership with the SEC. Officers, directors and greater than 10% Unitholders are required by SEC regulations to furnish the General Partner with copies of all Section 16(a) forms.
Based solely on our review of the copies of such forms received by us, or written representations from certain reporting persons, we believe that during the year ended
December 31, 2014
, all filing requirements applicable to our officers, directors, and greater than 10% beneficial owners were met in a timely manner, with the exception of a late filing of a Form 4 for Mr. Welch.
Overview
As a limited partnership, we are managed by our General Partner. Our General Partner is majority owned by Mr. Kelcy Warren. Our limited partner interests are owned approximately 27% by affiliates and approximately 73% by the public.
We own 100% of ETP GP and its general partner, ETP LLC. We refer to ETP GP and ETP LLC together as the “ETP GP Entities.” ETP GP is the general partner of ETP. All of ETP’s employees receive employee benefits from the operating companies of ETP.
We own 100% of Regency GP and its general partner, Regency LLC. We refer to Regency GP LP and Regency GP LLC together as the “Regency GP Entities.” Regency GP is the general partner of Regency. All of Regency’s employees receive employee benefits from the operating companies of Regency.
Compensation Discussion and Analysis
Named Executive Officers
We do not have officers or directors. Instead, we are managed by the board of directors of our General Partner, and the executive officers of our General Partner perform all of our management functions. As a result, the executive officers of our General Partner are essentially our executive officers, and their compensation is administered by our General Partner. This Compensation Discussion and Analysis is, therefore, focused on the total compensation of the executive officers of our General Partner as set forth below. In addition, to provide comprehensive disclosure of our executive compensation, we are also providing information as to the executive compensation of certain executive officers of our subsidiaries, even though none of these persons is an executive officer of the Parent Company. Accordingly, the persons we refer to in this discussion as our “named executive officers” are the following:
ETE Executive Officers
|
•
|
John W. McReynolds, President;
|
|
•
|
Jamie Welch, Group Chief Financial Officer and Head of Business Development; and
|
|
•
|
Bradford Whitehurst, Executive Vice President and Head of Tax
|
Certain Subsidiary Executive Officers
|
•
|
Marshall S. (Mackie) McCrea, III, ETP President and Chief Operating Officer; and
|
|
•
|
Michael J. Bradley, Regency’s President and Chief Executive Officer
|
During 2014, Messrs. McCrea and Bradley’s primary business responsibilities were undertaken for ETP and Regency, respectively. The compensation committees of the general partners of ETP and Regency, respectively, sets the components of Messrs. McCrea and Bradley’s compensation, including base salary, long-term incentive awards and annual bonus utilizing the same philosophy and methodology adopted by our General Partner.
119
Our Philosophy for Compensation of Executives
Our General Partner.
In general, our General Partner’s philosophy for executive compensation is based on the premise that a significant portion of each executive’s compensation should be incentive-based or “at-risk” compensation and that executives’ total compensation levels should be highly competitive in the marketplace for executive talent and abilities. Our General Partner seeks a total compensation program that provides for a slightly below the median market annual base compensation rate (i.e. approximately the 40
th
percentile of market) but incentive-based compensation composed of a combination of compensation vehicles to reward both short and long-term performance that are both targeted to pay-out at approximately the top-quartile of market. Our General Partner believes the incentive-based balance is achieved by the payment of annual discretionary cash bonuses and grants of restricted unit awards. Our General Partner believes the performance of our operating subsidiaries and the contribution of our management toward the achievement of the financial targets and other goals of those subsidiaries should be considered in determining annual discretionary cash bonuses.
ETP GP Entities.
The ETP GP Entities also believe that a significant portion of each executives’ compensation should be incentive-based or “at-risk” compensation and that executives’ total compensation levels should be very competitive in the marketplace for executive talents and abilities. ETP GP seeks a total compensation program that provides for a slightly below the median market annual base compensation rate (i.e. approximately the 40
th
percentile of market) but incentive-based compensation composed of a combination of compensation vehicles to reward both short and long-term performance that are both targeted to pay-out at approximately the top-quartile of market. ETP GP believes the incentive-based balance is achieved by (i) the payment of annual discretionary cash bonuses that consider the achievement of ETP’s financial performance objectives for a fiscal year set at the beginning of such fiscal year and the individual contributions of its named executive officers to the success of ETP and the achievement of the annual financial performance objectives and (ii) the annual grant of time-based restricted unit awards under ETP’s equity incentive plan(s), which awards are intended to provide a longer term incentive and retention value to its key employees to focus their efforts on increasing the market price of its publicly traded units and to increase the cash distribution ETP pays to its Unitholders.
Prior to December 2012, ETP’s equity awards were primarily in the form of restricted unit awards that vest over a specified time period, with substantially all of these types of unit awards vesting over a five-year period at 20% per year generally based on continued employment through each specified vesting date. Beginning in December 2012, we began granting restricted unit awards that vest, based generally upon continued employment, at a rate of 60% after the third year of service and the remaining 40% after the fifth year of service. The ETP GP Entities believe that these equity-based incentive arrangements are important in attracting and retaining executive officers and key employees as well as motivating these individuals to achieve ETP’s business objectives. The equity-based compensation reflects the importance ETP GP places on aligning the interests of its named executive officers with those of ETP’s Unitholders.
While ETE, through the ETP GP Entities and/or the Regency GP Entities, is responsible for the direct payment of the compensation of our named executive officers, ETE does not participate or have any input in any decisions as to the compensation levels or policies of our General Partner, the ETP GP Entities or the Regency GP Entities. As discussed below, our compensation committee, the eligible members of board of directors of our General Partner at times when we have not had a compensation committee or the ETP Compensation Committee, the Regency Compensation Committee and/or the compensation committee of the general partner of Sunoco Logistics, all in consultation with the General Partner, are responsible for the compensation policies and compensation level of the executive officers of our General Partner. In this discussion, we refer to either or both of our compensation committee or such members of our board of directors as the “ETE Compensation Committee.”
ETP also does not participate or have any input in any decisions as to the compensation policies of the ETP GP Entities or the compensation levels of the executive officers of the ETP GP Entities. The compensation committee of the board of directors of the ETP GP Entities (the “ETP Compensation Committee”) is responsible for the approval of the compensation policies and the compensation levels of the executive officers of the ETP GP Entities.
Regency also does not participate or have any input in any decisions as to the compensation policies of the Regency GP Entities or the compensation levels of the executive officers of the Regency GP Entities. The compensation committee of the board of directors of the Regency GP Entities (the “Regency Compensation Committee”) in consultation with the General Partner, as appropriate, is responsible for the approval of the compensation policies and the compensation levels of the executive officers of the Regency GP Entities.
ETE and ETP directly pay their respective executive officers in lieu of receiving an allocation of overhead related to executive compensation from their respective general partner. For the year ended
December 31, 2014
, ETE and ETP paid 100% of the compensation of the executive officers of their respective general partner as each entity represents the only business currently managed by such general partner.
120
For a more detailed description of the compensation to ETE’s and ETP GP’s named executive officers, please see “– Compensation Tables” below.
Distributions to Our General Partner
Our General Partner is partially-owned by certain of our current and prior named executive officers. We pay quarterly distributions to our General Partner in accordance with our partnership agreement with respect to its ownership of its general partner interest as specified in our partnership agreement. The amount of each quarterly distribution that we must pay to our General Partner is based solely on the provisions of our partnership agreement, which agreement specifies the amount of cash we distribute to our General Partner based on the amount of cash that we distribute to our limited partners each quarter. Accordingly, the cash distributions we make to our General Partner bear no relationship to the level or components of compensation of our General Partner’s executive officers. Distributions to our General Partner are described in detail in Note
9
to our consolidated financial statements. Our named executive officers also own directly and indirectly certain of our limited partner interests and, accordingly, receive quarterly distributions. Such per unit distributions equal the per unit distributions made to all our limited partners and bear no relationship to the level of compensation of the named executive officers.
For a more detailed description of the compensation of our named executive officers, please see “Compensation Tables” below.
Compensation Philosophy
Each of ETE’s and ETP’s compensation programs are structured to provide the following benefits:
|
•
|
reward executives with an industry-competitive total compensation package of competitive base salaries and significant incentive opportunities yielding a total compensation package approaching the top-quartile of the market;
|
|
•
|
attract, retain and reward talented executive officers and key management employees by providing total compensation competitive with that of other executive officers and key management employees employed by publicly traded limited partnerships of similar size and in similar lines of business;
|
|
•
|
motivate executive officers and key employees to achieve strong financial and operational performance;
|
|
•
|
emphasize performance-based or “at-risk” compensation; and
|
|
•
|
reward individual performance.
|
Components of Executive Compensation
For the year ended
December 31, 2014
, the compensation paid to ETE’s and ETP GP’s named executive officers consisted of the following components:
|
•
|
annual base salary;
|
|
•
|
non-equity incentive plan compensation consisting solely of discretionary cash bonuses;
|
|
•
|
time-vested restricted unit awards under the equity incentive plan(s);
|
|
•
|
payment of distribution equivalent rights (“DERs”) on unvested time-based restricted unit award under our equity incentive plan;
|
|
•
|
vesting of previously issued time-based awards issued pursuant to our equity incentive plans;
|
|
•
|
equity incentive plan compensation.
|
Mr. Warren, the Chairman of the Board of ETE and the CEO of ETP GP, has voluntarily elected not to accept any salary, bonus or equity incentive compensation (other than a salary of $1.00 per year plus an amount sufficient to cover his allocated employee premium contributions for health and welfare benefits).
Methodology
Presently, the compensation committees of ETE, ETP, Regency and their subsidiaries and affiliates, as applicable, consider relevant data available to them to assess the competitive position with respect to base salary, annual short-term incentives and long-term incentive compensation for our executive officers. The boards of directors and compensation committees of ETE, ETP, Regency and their subsidiaries, as applicable, also consider individual performance, levels of responsibility, skills and experience.
Periodically, the compensation committees of ETE, ETP and/or its affiliates engage a third-party consultant to provide market information for compensation levels at peer companies in order to assist the compensation committees in the determination of
121
compensation levels for executive officers. Most recently, the ETP Compensation Committee engaged Mercer (US) Inc. (“Mercer”) during the year ended December 31, 2013 to both (i) evaluate the market competitiveness of total compensation levels for certain members of senior management, including its named executive officers; (ii) assist in the determination of appropriate compensation levels for its senior management, including the named executive officers; and (iii) to confirm that our compensation programs were yielding compensation packages consistent with our overall compensation philosophy. This review by Mercer was deemed necessary given the series of transforming transactions ETE and its affiliates have completed over the past few years, which have significantly increased the size and scale of ETE and its affiliates from both a financial and asset perspective.
In conducting its review, Mercer worked with ETP to identify a “peer group” of 15 leading companies in the energy industry that most closely reflect ETE’s and ETP’s profile in terms of revenues, assets and market value as well as compete with ETE and ETP for talent at the senior management level. The identified companies were:
|
• Conoco Phillips
|
• Anadarko Petroleum
|
|
|
• Enterprise Products Partners, L.P.
|
• ONEOK Partners, L.P.
|
|
|
• Plains All American Pipeline, L.P.
|
• EOG Resources, Inc.
|
|
|
• Halliburton Company
|
• Kinder Morgan Energy Partners, L.P.
|
|
|
• National Oilwell Varco, Inc.
|
• The Williams Companies, Inc.
|
|
|
• Baker Hughes Incorporated
|
• Enbridge Energy Partners, L.P.
|
|
|
• Apache Corp.
|
• DCP Midstream Partners, L.P.
|
|
|
• Marathon Oil Corporation
|
||
The compensation analysis provided by Mercer covered all major components of total compensation, including annual base salary, annual short-term cash bonus and long-term incentive awards for the senior executives of these companies. The Compensation Committees of ETE and ETP utilized the information provided by Mercer to compare the levels of annual base salary, annual short-term cash bonus and long-term equity incentive awards at these other companies with those of its named executive officers to ensure that compensation of our named executive officers is both consistent with our compensation philosophy and competitive with the compensation for executive officers of these other companies. The Compensation Committee also considered and reviewed the results of the study performed by Mercer to ensure the results indicated that our compensation programs were yielding a competitive total compensation model prioritizing incentive-based compensation and rewarding achievement of short and long-term performance objectives. The Compensation Committee also specifically evaluated benchmarked results for the annual base salary, annual short-term cash bonus or long-term equity incentive awards of the named executive officers to compensation levels at the identified “peer group” companies. Mercer did not provide any non-executive compensation services for ETE or ETP during 2013. In addition to the information received as a result of a periodic engagement of a third party consultant, the Compensation Committee also utilizes information obtained from other sources, such as annual third-party surveys, for comparison purposes in its determination of compensation levels for our named executive officers.
Mercer did not provide any additional executive compensation services for the Compensation Committee during 2014. For 2014, the Compensation Committee continued to use the results of the 2013 Mercer compensation analysis, adjusted to account for general inflation and 2014 third-party survey results.
Base Salary.
Base salary is designed to provide for a competitive fixed level of pay that attracts and retains executive officers, and compensates them for their level of responsibility and sustained individual performance (including experience, scope of responsibility and results achieved). The salaries of the named executive officers are reviewed on an annual basis. As discussed above, the base salaries of our named executive officers are targeted to yield an annual base salary slightly below the median level of market (i.e. approximately the 40
th
percentile of market) and are determined by the ETE Compensation Committee after taking into account the recommendation of Mr. Warren. The ETE Compensation Committee did not increase the base salaries of Messrs. McReynolds or Welch for 2014. Mr. Whitehurst’s base salary of $475,000 was set by his employment offer letter from ETE dated June 26, 2014.
The base salaries of ETP’s and Regency’s named executive officers are determined by the respective compensation committees of ETP and Regency, which take into account the recommendations of the respective CEOs of ETP and Regency. For 2014, the ETP Compensation Committee did not increase Mr. McCrea’s annual base salary because of the base salary adjustment made in 2013 in accordance with the Mercer study, and the Regency Compensation Committee approved an increase of 3% for Mr. Bradley’s base salary. The Regency Compensation Committee determined that the increase in to Mr. Bradley’s base salary was warranted in light of the increased level of responsibility related to management of Regency after its 2014 acquisitions.
Annual Bonus
. For 2014, the ETE Compensation Committee approved short-term annual cash bonus targets for Messrs. McReynolds and Welch of 125% of their annual base salary, which targets were the same as their targets for 2013. Mr. Whitehurst’s
122
short-term annual cash bonus target was set at 120% in accordance with the terms of his employment offer letter from ETE dated June 26, 2014.
In February 2015, the ETE Compensation Committee approved a cash bonus relating to the 2014 calendar year to Messrs. McReynolds and Welch in the amounts of
$687,500
and
$687,500
, respectively. In approving this cash bonus, the ETE Compensation Committee took into account the significant role that Mr. McReynolds has as the senior management person for ETE with respect to managing the business of ETE, as well as his role in providing strategic advice related to multiple other transactions among ETE and its subsidiaries. The ETE Compensation Committee also took into account the individual performance of Messrs. McReynolds and Whitehurst with respect to promoting ETE’s financial, strategic and operating objectives for 2014. In the case of Mr. Welch for 2014, his bonus amount was based on factors consistent with those utilized for Mr. McReynolds as well as those utilized by the ETP Compensation Committee in considering an award to the Mr. McCrea and the Regency Compensation Committee in considering an award to Mr. Bradley. With respect to Mr. Whitehurst, his bonus amount was based on the term of his original offer letter of June 26, 2014, which provided for a bonus guarantee of
$570,000
for 2014. Moving forward, Mr. Whitehurst’s future bonus awards will be based on factors consistent with those utilized for Messrs. McReynolds and Welch as well as those utilized by the ETP Compensation Committee and Regency Compensation Committee in considering awards.
In addition to base salary, the respective compensation committees of ETP and Regency make determinations whether to award named executive officers discretionary annual cash bonuses following the end of the year. These discretionary bonuses, if awarded, are intended to reward the named executive officers for the achievement of financial performance objectives during the year for which the bonuses are awarded in light of the contribution of each individual to the entity’s profitability and success during such year. In previous years, the respective compensation committees of ETP and Regency have taken into account whether ETP or Regency, respectively, achieved or exceeded their targeted performance objectives for the year, which are approved by the board of directors of the respective general partner as discussed below, as an important element in making its determinations with respect to annual bonuses. The respective compensation committees of ETP and Regency also consider the recommendation of the respective CEOs of ETP and Regency as well as any input from the General Partner in determining the specific cash bonus amounts for each of the other named executive officers. The respective compensation committees of ETP and Regency do not establish their own financial performance objectives in advance for purposes of determining whether to approve any annual bonuses, and the respective compensation committees of ETP and Regency do not utilize any formulaic approach to determining annual bonuses.
In 2014, the board of directors of the general partners of ETP and Regency, upon recommendation of the respective compensation committees, approved the Energy Transfer Partners, L.L.C. Annual Bonus Plan and the Regency GP LLC Annual Bonus Plan (collectively the “New Bonus Plans”), which replaced the prior bonus plans (the “Prior Bonus Plans”). The New Bonus Plans, which became effective for calendar year 2014, are substantially similar to the Prior Bonus Plans, except that the New Bonus plan includes an additional performance criteria related to ETP and Regency’s internal department financial budget, respectively, in addition to the previous performance measure of an internal earnings target generally based on targeted EBITDA (the “Earnings Target”) budget. Under the New Bonus Plan, the Compensation Committee’s evaluation of performance and determination of an overall available bonus pool is based on the respective partnership’s Earnings Target and the performance of each department compared to the applicable departmental budget (with such performance measured based on the specific dollar amount of general and administrative expenses set for each department). The two performance criteria are weighted 75% on the Earnings Target budget criteria and 25% on internal department financial budget criteria.
In adopting the New Bonus Plan, the board of directors and the compensation committees of the ETP GP Entities and the Regency GP Entities have reaffirmed the internal Earnings Target as the primary performance factor in determining annual bonuses. The addition of the internal department financial budget criteria is designed to ensure that the partnerships are effectively managing general and administrative costs in a prudent manner.
ETP and Regency’s internal financial budgets are generally developed for each business segment, and then aggregated with appropriate corporate level adjustments to reflect an overall performance objective that is reasonable in light of market conditions and opportunities based on a high level of effort and dedication across all segments of ETP and Regency’s businesses. The evaluation of ETP and Regency’s performances versus their internal financial budget is based on the internal Earnings Target for a calendar year. In general, the respective compensation committees for ETP and Regency believe that performance at or above their internal Earnings Target would support bonuses to named executive officers ranging from
100%
to
125%
and 75% to 120% of their annual bonus target, respectively. For 2014, ETP’s Compensation Committee retained the same short-term annual cash bonus target for Mr. McCrea from 2013, 140% of his annual base salary and Regency’s Compensation Committee set a short-term annual cash bonus target for Mr. Bradley of 125% of his annual base salary. The increase in targets for Mr. Bradley reflected the desire to account for the increase in the size of the Regency organization during 2014 and normalization of his target with other similarly situated executives within ETE’s affiliated partnerships. The individual bonus amounts for each named executive officer, also reflect the respective compensation committees’ view of the impact of such individual’s efforts and contributions towards (i) achievement of the partnership’s success in exceeding its internal financial budget, (ii) the development of new projects that are
123
expected to result in increased cash flows from operations in future years, (iii) the completion of mergers, acquisitions or similar transactions that are expected to be accretive to the partnership and increase distributable cash flow, (iv) the overall management of the partnership’s business, and (v) the individual performances of these individuals with respect to promoting the partnership’s financial, strategic and operating objectives for 2014. The cash bonuses awarded to each of the executive officers for 2014 were consistent with the target. In respect of 2014 performance, in Febr
uary 2015, ETP’s Compensation Committee approved a cash bonus relating to the 2014 calendar year to Mr. McCrea of
$1,120,000
and the
Regency Compensation Committee approved a cash bonus relating to the 2014 calendar year to Mr. Bradley of
$773,921
.
ETE Equity Awards.
The Energy Transfer Equity Long-Term Incentive Plan (“ETE Plan”) authorizes the ETE Compensation Committee, in its discretion, to grant awards of restricted units, unit options and other awards related to ETE units at such times and upon such terms and conditions as it may determine in accordance with each such plan. The ETE Compensation Committee determined and/or approved the terms of the unit grants awarded to the named executive officers of ETE, including the number of ETE Common Units subject to the unit award and the vesting structure of those unit awards. All of the awards granted to the named executive officers under this equity incentive plan have consisted of restricted unit awards that are subject to vesting over a specified time period. ETE Common Units are issued upon grant of the award, subject to forfeiture of unvested units upon termination of employment during the vesting period. For 2014, no equity awards were issued under the Energy Transfer Equity Long-Term Incentive Plan. The named executive officers other than Mr. McReynolds who does not currently receive equity awards on an annual basis, each participated under long-term incentive plans of ETP, Regency and/or Sunoco Logistics, as applicable.
Messrs. Welch and Whitehurst are eligible on an annual basis to receive annual long-term incentive awards under the Second Amended and Restated Energy Transfer Partners, L.P 2008 Long-Term Incentive Plan (the “2008 Incentive Plan”) or the long-term incentive plans of ETE’s affiliates, including the Regency GP LLC Long-Term Incentive Plan date February 3, 2006 (the “Regency Plan”) and the Sunoco Partners LLC Long-Term Incentive Plan (the “Sunoco Logistics Plan”). For 2014, ETE’s Compensation Committee set Mr. Welch’s long-term incentive award target at 400% of his base salary and Mr. Whitehurst’s target at 400% of his base salary, which amount was an increase from the 300% originally provided for in his employment offer letter. This increase was driven by Mr. Whitehurst’s assumption of additional responsibilities beyond the group tax function for which he was hired. As described below in the section titled
Affiliate/Subsidiary Equity Awards
, for 2014, in discussions between the General Partner and the compensation committees of the general partners of ETP, Regency and Sunoco Logistics, it was determined that for 2014 the value of Messrs. Welch and Whitehurst’s awards would be comprised of restricted/phantom unit awards under the 2008 Incentive Plan, the Regency Plan and Sunoco Logistics in consideration of their roles and responsibilities for all of the partnerships under ETE’s umbrella and, for Mr. Welch, as a member of the Boards of Directors of the general partners of ETP and Sunoco Logistics. Each of the unit awards provide for vesting over a five-year period, with 60% at the end of the third year and the remaining 40% vesting at the end of the fifth year, subject generally to continued employment through each specified vesting date and entitle Mr. Welch to receive DERs on the unvested units. For Messrs. Welch and Whitehurst, their total 2014 long-term incentive awards were allocated 1/3 to the 2008 Incentive Plan, 1/3 to the Sunoco Logistics Plan and 1/3 to the Regency Plan. It is expected that the long-term equity awards of the named executive officers of ETE will recognize a similar aggregation of restricted units. The terms and conditions of the restricted unit awards to Messrs. Welch and Whitehurst under the 2008 Incentive Plan, the Sunoco Logistics Plan and the Regency Plan were the same and provided for vesting over a five-year period, with 60% vesting at the end of the third year and the remaining 40% vesting at the end of the fifth year, subject generally to continued employment through each specified vesting date. All of the awards would be accelerated in the event of their death, disability or upon a change in control. Additionally, as described below in the section titled
Affiliate/Subsidiary Equity Awards
, the awards to Mr. Whitehurst provided for an acceleration upon a termination without “cause”.
Mr. Whitehurst also received additional long-term incentive awards under each of the 2008 Incentive Plan, the Sunoco Logistic Plan and the Regency Plan in accordance with the terms of his employment offer letter dated June 26, 2014. The offer letter provided that Mr. Whitehurst, upon commencement of employment, would receive a one-time equity award having a total grant date value of $4,750,000 (the “Initial Award”), which value was intended to reflect (i) an amount equal to three (3) years of targeted long-term incentive award value and (ii) a grant value equal to 100% of his initial annual base salary. The Initial Award, as in the case of Mr. Whitehurst’s 2014 awards, was divided pro-rata between the 2008 Incentive Plan, the Sunoco Logistics Plan and the Regency Plan, resulting in an award of 28,203 units under the 2008 Incentive Plan related to ETP common units, 51,794 restricted phantom units under the Regency Plan related to Regency common units and 35,445 time-based restricted units under the Sunoco Logistics Plan related to Sunoco Logistics common units. The unit awards in accordance with the Initial Award provide for vesting over a five-year period, with 60% vesting at the end of the third year and the remaining 40% vesting at the end of the fifth year, subject generally to continued employment through each specified vesting date. The vesting of the Initial Award would be accelerated under each applicable equity award plan in the event of (i) Mr. Whitehurst’s death, (ii) Mr. Whitehurst’s disability; (iii) upon a change in control; or (iv) upon a termination of Mr. Whitehurts’s employment without “cause”. The Initial Award is described more fully below in the section titled
Affiliate
/
Subsidiary Equity Awards.
124
ETP Equity Awards.
Each of ETP’s 2004 Unit Plan and 2008 Incentive Plan authorizes the ETP Compensation Committee, in its discretion, to grant awards of restricted units, unit options and other awards related to ETP common units at such times and upon such terms and conditions as it may determine in accordance with each such plan. The ETP Compensation Committee determined and/or approved the terms of the unit grants awarded to the named executive officers of the ETP GP Entities, including the number of ETP common units subject to the unit award and the vesting structure of those unit awards. All of the awards granted to ETP’s named executive officers under these equity incentive plans have consisted of restricted unit awards that are subject to vesting over a specified time period. Upon vesting of any unit award, ETP common units are issued. For 2014, Mr. McCrea’s long-term incentive target increased from 700% of his annual base salary to 750% of his base salary.
In December 2014, the ETP Compensation Committee approved grants of unit awards to Mr. McCrea of
62,650
ETP common units under the 2008 Incentive Plan. These unit awards provide for vesting over a five-year period, with 60% vesting at the end of the third year and the remaining 40% vesting at the end of the fifth year, subject generally to continued employment through each specified vesting date. As described below in the section titled
Affiliate/Subsidiary Equity Awards
, for 2014, in discussions between the ETP Compensation Committee the compensation committee of the general partner of Sunoco Logistics, it was determined that approximately 33% of the total long-term incentive award target values for Mr. McCrea would be composed of restricted units awarded under the Sunoco Logistics Plan in consideration of his roles and responsibilities at Sunoco Logistics in addition to ETP. At Sunoco Logistics, Mr. McCrea serves as Chairman of the Board of Sunoco Logistics’ general partner. It is expected that the long-term equity awards of Mr. McCrea will recognize a similar aggregation of awards being awarded under the 2008 Incentive Plan and the Sunoco Logistics Plan in future years. The terms and conditions of the restricted unit awards to Mr. McCrea under the Sunoco Logistics Plan are identical to the terms and conditions of the restricted unit awards under ETP’s equity incentive plan to Mr. McCrea.
The restricted unit awards provide for vesting over a five-year period, with 60% vesting at the end of the third year and the remaining 40% vesting at the end of the fifth year, generally subject to continued employment through each specified vesting date. The unit awards entitle the recipients of the unit awards to receive, with respect to each ETP common unit subject to such award that has not either vested or been forfeited, DER cash payment promptly following each such distribution by ETP to its Unitholders. In approving the grant of such unit awards, the ETP Compensation Committee took into account the same factors as discussed above under the caption “Annual Bonus,” the long-term objective of retaining such individuals as key drivers of the Partner’s future success, the existing level of equity ownership of such individuals and the previous awards to such individuals of equity unit awards subject to vesting. Vesting of the 2014 awards would accelerate in the event of the death or disability of the named executive officer or in the event of a change in control of ETP as that term is defined under the 2008 Incentive Plan.
The issuance of ETP common units pursuant to ETP’s equity incentive plans is intended to serve as a means of incentive compensation; therefore, no consideration will be payable by the plan participants upon vesting and issuance of the ETP common units.
The restricted unit awards under the ETP equity incentive plans generally require the continued employment of the recipient during the vesting period, provided however, the unvested awards will be accelerated in the event of the death or disability of the award recipient prior to the applicable vesting period being satisfied. In addition, in the event of a change in control of the partnership, all unvested awards granted under the 2004 Unit Plan, as well as awards granted in 2014 under the 2008 Incentive Plan, would be accelerated. For awards previously granted under the 2008 Incentive Plan prior to December 2014, unvested awards may also become vested upon a change in control at the discretion of the Compensation Committee.
The ETP Compensation Committee has in the past and may in the future, but is not required to, accelerate the vesting of unvested restricted unit awards in the event of the termination or retirement of an executive officer. The ETP Compensation Committee did not accelerate the vesting of restricted unit awards to any named executive officers in 2014.
As discussed below under “Potential Payments Upon a Termination or Change of Control,” certain equity awards automatically accelerate upon a change in control event, which means vesting automatically accelerates upon a change of control irrespective of whether the officer is terminated. In addition, the 2014 awards to Mr. McCrea and Mr. Whitehurst included a provision in the applicable award agreement for acceleration of unvested restricted unit/restricted phantom unit awards upon a termination of employment by the general partner of the applicable partnership issuing the award without “cause”. For purposes of the awards the term “cause” shall mean: (i) a conviction (treating a nolo contendere plea as a conviction) of a felony (whether or not any right to appeal has been or may be exercised), (ii) willful refusal without proper cause to perform duties (other than any such refusal resulting from incapacity due to physical or mental impairment), (iii) misappropriation, embezzlement or reckless or willful destruction of property of the partnership or any of its affiliates, (iv) knowing breach of any statutory or common law duty of loyalty to the partnership or any of its or their affiliates, (v) improper conduct materially prejudicial to the business of the partnership or any of its or their affiliates by, (vi) material breach of the provisions of any agreement regarding confidential information entered into with the partnership or any of its or their affiliates or (vii) the continuing failure or refusal to satisfactorily perform essential duties to the partnership or any of its or their affiliate.
125
We believe that permitting the accelerated vesting of equity awards upon a change in control creates an important retention tool for us by enabling employees to realize value from these awards in the event that we undergo a change in control transaction. In addition, we believe permitting acceleration of vesting upon a change in control and the acceleration of vesting awards upon a termination without “cause” in the case of the 2014 unit awards to Mr. McCrea and Mr. Whitehurst creates a sense of stability in the course of transactions that could create uncertainty regarding their future employment and encourage these officers to remain focused on their job responsibilities.
Regency Equity Awards.
Each of the Regency GP LLC Long-Term Incentive Plan dated February 3, 2006 (the “Regency 2006 Plan”) and the Regency Energy Partners LP 2011 Long-Term Incentive Plan (the “Regency 2011 Plan”) authorizes the Regency Compensation Committee, in its discretion, to grant awards of phantom units, common units, restricted units, unit options and other unit-based awards to employees, directors and consultants of the Partnership and its affiliates and subsidiaries. The Regency Compensation Committee determined and/or approved the terms of the unit grants awarded to our named executive officers, including the number of phantom units subject to the unit award and the vesting structure of those unit awards. All of the awards granted to the named executive officers under these equity incentive plans have consisted of phantom unit awards that are subject to vesting over a specified time period. Upon vesting of any unit award, Regency Common Units are issued.
In December 2014, the Compensation Committee approved grants of time-based phantom unit awards under the 2011 Plan to Mr. Bradley of 83,800 Regency Common Units. These phantom unit awards provide for vesting in Regency Common Units of 60% at the end of the third year and vesting of the remaining 40% at the end of the fifth year, subject to continued employment through each specified vesting date. These phantom unit awards entitle the recipients of the unit awards to receive, with respect to each Regency Common Unit subject to such phantom unit award that has not either vested or been forfeited, a DER cash payment promptly following each such distribution by us to our unitholders. In approving the grant of such unit awards, the Regency Compensation Committee took into account the same factors as discussed above under the caption “Annual Cash Bonus,” the long-term objective of retaining such individuals as key drivers of the Partnership’s future success, the existing level of equity ownership of such individuals and the previous awards to such individuals of equity awards subject to vesting.
The issuance of phantom units pursuant to our equity incentive plans is intended to serve as a means of incentive compensation; therefore, no consideration will be payable by the plan participants upon vesting and issuance of the Regency Common Units.
The phantom unit awards under the Regency equity incentive plans generally require the continued employment of the recipient during the vesting period, provided however, the unvested awards will be accelerated in the event of the death or disability of the award recipient prior to the applicable vesting period being satisfied. In addition, in the event of a change in control of the partnership, all unvested awards granted under the Regency 2006 Plan, as well as awards granted in 2014 under the 2008 Incentive Plan, would be accelerated. For awards granted under the 2011 Regency Plan prior to December 2014, unvested awards may also become vested upon a change in control at the discretion of the Compensation Committee.
The Regency Compensation Committee has in the past and may in the future, but is not required to, accelerate the vesting of unvested restricted unit awards in the event of the termination or retirement of an executive officer. The Regency Compensation Committee did not accelerate the vesting of restricted unit awards to any named executive officers in 2014.
As discussed below under “Potential Payments Upon a Termination or Change of Control,” certain equity awards automatically accelerate upon a change in control event, which means vesting automatically accelerates upon a change of control irrespective of whether the officer is terminated. In addition, the 2014 award to Mr. Bradley included a provision in the applicable award agreement for acceleration of unvested restricted phantom unit awards upon a termination of employment by the general partner of the applicable partnership issuing the award without “cause”. For purposes of the awards the term “cause” shall mean: (i) a conviction (treating a nolo contendere plea as a conviction) of a felony (whether or not any right to appeal has been or may be exercised), (ii) willful refusal without proper cause to perform duties (other than any such refusal resulting from incapacity due to physical or mental impairment), (iii) misappropriation, embezzlement or reckless or willful destruction of property of the partnership or any of its affiliates, (iv) knowing breach of any statutory or common law duty of loyalty to the partnership or any of its or their affiliates, (v) improper conduct materially prejudicial to the business of the partnership or any of its or their affiliates by, (vi) material breach of the provisions of any agreement regarding confidential information entered into with the partnership or any of its or their affiliates or (vii) the continuing failure or refusal to satisfactorily perform essential duties to the partnership or any of its or their affiliate.
We believe that permitting the accelerated vesting of equity awards upon a change in control creates an important retention tool for us by enabling employees to realize value from these awards in the event that we undergo a change in control transaction. In addition, we believe permitting acceleration of vesting upon a change in control and the acceleration of vesting awards upon a termination without “cause” in the case of the 2014 unit award to Mr. Bradley creates a sense of stability in the course of transactions that could create uncertainty regarding their future employment and encourage these officers to remain focused on their job responsibilities.
126
ETE Unit Ownership Guidelines.
In December 2013, the Board of Directors of our General Partner adopted the ETE Executive Unit Ownership Guidelines (the “Guidelines”), which set forth minimum ownership guidelines applicable to certain executives of ETE with respect to ETE Common Units representing limited partnership interests in ETE. The applicable unit ownership guidelines are denominated as a multiple of base salary, and the amount of ETE Common Units required to be owned increases with the level of responsibility. Under these guidelines, Mr. McReynolds as ETE’s President is expected to own ETE Common Units having a minimum value of five times his base salary; Messrs. Welch and Whitehurst are expected to own ETE Common Units having a minimum value of four times their base salary. In addition to the named executive officers, the Guidelines also apply to other covered executives, which are expected to own either directly or indirectly in accordance with the terms of the Guidelines ETE Common Units having minimum values ranging from two to four times their respective base salaries.
The ETE Compensation Committee believes that the ownership of ETE Common Units, as reflected in these Guidelines, is an important means of tying the financial risks and rewards for its executives to ETE’s total unitholder return, aligning the interests of such executives with those of ETE’s Unitholders, and promoting ETE’s interest in good corporate governance.
Covered executives are generally required to achieve their ownership level within five years of becoming subject to the guidelines; however, certain covered executives, based on their tenure as an executive, are required to achieve compliance within two years of the December 2013 effective date of the Guidelines. Thus, compliance with the guidelines will be required for Mr. McReynolds beginning in December 2015, for Mr. Welch in December 2018 and for Mr. Whitehurst in August 2019.
Covered executives may satisfy the guidelines through direct ownership of ETE Common Units or indirect ownership by certain immediate family members. Direct or indirect ownership of ETE Common Units shall count on a one to one ratio for purposes of satisfying minimum ownership requirements; however, unvested unit awards may not be used to satisfy the minimum ownership requirements.
Executive officers who have not yet met their respective guideline must retain and hold all ETE Common Units (less ETE Common Units sold to cover the executive’s applicable taxes and withholding obligation) received in connection with long-term incentive awards. Once the required ownership level is achieved, ownership of the required ETE Common Units must be maintained for as long as the covered executive is subject to the guidelines. However, those individuals who have met or exceeded their applicable ownership guideline may dispose of the ETE Common Units in a manner consistent with applicable laws, rules and regulations, including regulations of the SEC and ETE’s internal policies, but only to the extent that such individual’s remaining ownership of ETE Common Units would continue to exceed the applicable ownership guideline.
The Board of Directors of ETP and Regency’s general partners approved and adopted policies substantially identical to the Guidelines described above. Under the ETP guidelines, Mr. McCrea, the President and Chief Operating Officer of ETP, is expected to own ETP common units having a minimum value of five times his base salary. Under the Regency guidelines, Mr. Bradley, as CEO of Regency, is expected to own Regency common units having a minimum value of five times his base salary.
Affiliate and Subsidiary Equity Awards.
In addition to their roles as officers of our General Partner, Messrs. Welch and Whitehurst in their roles have certain responsibilities for all of the partnerships under ETE’s umbrella, including with respect to Mr. Welch, as a member of the Boards of Directors of the general partners of ETP and Sunoco Logistics. In connection with those roles at ETP, the ETP Compensation Committee approved grants of unit awards to Messrs. Welch and Whitehurst of 11,500 and 9,900 units, respectively under the 2008 Incentive Plan related to ETP common units. The Regency Compensation Committee awarded Messrs. Welch and Whitehurst restricted phantom units in the amount of 24,500 and 21,000 respectively. The Sunoco Logistics’ Compensation Committee awarded Messrs. Welch and Whitehurst time-based restricted units of Sunoco Logistics in the amount of 15,117 units and 13,060 units, respectively. The terms and conditions of the restricted unit/phantom awards to Messrs. Welch and Whitehurst under the 2008 Incentive Plan, the Sunoco Logistics Plan the Regency Plan were the same and provided for vesting over a five-year period, with 60% vesting at the end of the third year and the remaining 40% vesting at the end of the fifth year, subject generally to continued employment through each specified vesting date. All of the awards would be accelerated in the event of their death, disability or upon a change in control. Additionally, the awards to Mr. Whitehurst included a provision in the applicable award agreement for acceleration of unvested restricted unit/restricted phantom unit awards upon a termination of employment by the general partner of the applicable partnership issuing the award without “cause”. For purposes of the awards the term “cause” shall mean: (i) a conviction (treating a nolo contendere plea as a conviction) of a felony (whether or not any right to appeal has been or may be exercised), (ii) willful refusal without proper cause to perform duties (other than any such refusal resulting from incapacity due to physical or mental impairment), (iii) misappropriation, embezzlement or reckless or willful destruction of property of the partnership or any of its affiliates, (iv) knowing breach of any statutory or common law duty of loyalty to the partnership or any of its or their affiliates, (v) improper conduct materially prejudicial to the business of the partnership or any of its or their affiliates by, (vi) material breach of the provisions of any agreement regarding confidential information entered into with the partnership or any of its or their affiliates or (vii) the continuing failure or refusal to satisfactorily perform essential duties to the partnership or any of its or their affiliate.
127
In connection with his role at Sunoco Logistics, in December 2014, Sunoco Logistics’ Compensation Committee awarded Mr. McCrea time-based restricted units of Sunoco Logistics in the amount of 41,136 time-based restricted units under the Sunoco Logistics Plan. The terms and conditions of the restricted unit awards to Mr. McCrea under the Sunoco Logistics are identical to the terms and conditions of the 2014 unit awards under the 2008 Incentive Plan.
Qualified Retirement Plan Benefits
. The Energy Transfer Partners GP, L.P. 401(k) Plan (the “ETP 401(k) Plan”) is a defined contribution 401(k) plan, which covers substantially all of our employees, including the named executive officers. Employees may elect to defer up to 100% of their eligible compensation after applicable taxes, as limited under the Internal Revenue Code. We make a matching contribution that is not less than the aggregate amount of matching contributions that would be credited to a participant’s account based on a rate of match equal to 100% of each participant’s elective deferrals up to 5% of covered compensation. The amounts deferred by the participant are fully vested at all times, and the amounts contributed by the Partnership become vested based on years of service. We provide this benefit as a means to incentivize employees and provide them with an opportunity to save for their retirement. This profit sharing contribution was previously included in the Sunoco sponsored 401(k) which was merged with the ETP 401(k) Plan effective January 1, 2014.
Beginning in January 2013, the Partnership provides a
3%
profit sharing contribution to employee 401(k) accounts for all employees with a base compensation below a specified threshold. The contribution is in addition to the 401(k) matching contribution and employees become vested based on years of service.
Health and Welfare Benefits
. All full-time employees, including our, ETP’s and Regency’s named executive officers, may participate in ETP GP’s health and welfare benefit programs including medical, dental, vision, flexible spending, life insurance and disability insurance.
Termination Benefits.
ETE’s, ETP’s and Regency’s named executive officers do not have any employment agreements that call for payments of termination or severance benefits or that provide for any payments in the event of a change in control of our General Partner. ETP’s 2004 Unit Plan and Regency’s 2006 Unit Plan provide for immediate vesting of all unvested restricted unit awards in the event of a change in control, as defined in the plans. In the case of the December 2014 long-term incentive awards to the named executive officers under ETP’s 2008 Incentive Plan, the Sunoco Logistics Plan and Regency Plan, the awards would immediately and fully vest all unvested restricted unit awards in the event of a change in control, as defined in the plan. In addition the December 2014 awards to Messrs. McCrea, Bradley and Whitehurst under the 2008 Incentive Plan, the Regency Plan and/or the Sunoco Logistics Plan provide for acceleration in the event of termination without cause. In addition, ETP’s 2008 Incentive Plan and Regency’s 2001 Plan provide the respective compensation committees with the discretion to provide for acceleration in the event of termination without cause.
Additionally, in connection with Mr. Welch joining ETE as Group Chief Financial Officer and Head of Business Development effective as of April 29, 2013, ETE agreed to award Mr. Welch 1,500,000 Common Units of ETE (after adjustment for the January 2014 two-for-one split), subject to a period of restriction, under the ETE Plan pursuant to a Unit Award Under Long-Term Incentive Plan and the Time-Vested Restricted Unit Award Agreement, each dated as of April 29, 2013 (the “Original Award Agreements”). On December 23, 2013, ETE and Mr. Welch entered into (i) a Rescission Agreement in order to rescind the original offer letter to the extent it relates to the award of 1,500,000 Common Units of ETE (after adjustment for the January 2014 two-for-one split) to Welch, the Original Award Agreements, and the receipt of cash amounts by Mr. Welch with respect to such awarded units and (ii) a new Class D Unit Agreement between ETE and Mr. Welch (the “Class D Unit Agreement”) providing for the issuance to Mr. Welch of an aggregate of 1,540,000 Class D Units of ETE (after unit split adjustment), which number of Class D Units includes an additional 40,000 Class D Units that were issued to Mr. Welch in connection with other changes to his original offer letter.
Under the terms of the Class D Unit Agreement, 30% of the Class D Units granted to Mr. Welch will convert to ETE Common Units on a one-for-one basis on March 31, 2015, and the remaining 70% will convert to ETE Common Units on a one-for-one basis on March 31, 2018, subject in each case to Mr. Welch being in Good Standing with ETE (as defined in the Class D Unit Agreement) and there being a sufficient amount of gain available to be allocated to the Class D Units being converted so as to cause the capital account of each such unit to equal the capital account of an ETE Common Unit on the conversion date. Upon a Change of Control (as defined in the Class D Unit Agreement), Termination without Cause or for Good Reason (as defined in the Class D Unit Agreement) or upon death or disability, all of the Class D Units issued to Mr. Welch will convert to ETE Common Units subject again to the availability of a sufficient amount of allocable gain and the requirement of Good Standing will cease to apply.
Please refer to “– Compensation Tables – Potential Payments Upon a Termination or Change of Control” for additional information.
In addition, ETP GP has also adopted the ETP GP Severance Plan and Summary Plan Description effective as of
June 12, 2013
, (the “Severance Plan”), which provides for payment of certain severance benefits in the event of Qualifying Termination (as that term is defined in the Severance Plan). In general, the Severance Plan provides payment of two weeks of annual base salary for each year or partial year of employment service up to a maximum of fifty-two weeks or one year of annual base salary (with a
128
minimum of four weeks of annual base salary) and up to three months of continued group health insurance coverage. The Severance Plan also provides that we, ETP or Regency may determine to pay benefits in addition to those provided under the Severance Plan based on special circumstances, which additional benefits shall be unique and non-precedent setting. The Severance Plan is available to all salaried employees on a nondiscriminatory basis; therefore, amounts that would be payable to ETE’s, ETP’s and/or Regency’s named executive officers upon a Qualified Termination have been excluded from “Compensation Tables – Potential Payments Upon a Termination or Change of Control” below.
Deferred Compensation Plan
. ETE does not have a deferred compensation plan. Our subsidiaries maintains a deferred compensation plan (“DC Plan”), which permits eligible highly compensated ETP and Regency employees to defer a portion of their salary and/or bonus until retirement or termination of employment or other designated distribution. Under the DC Plan, each year eligible ETP and Regency employees are permitted to make an irrevocable election to defer up to 50% of their annual base salary, 50% of their quarterly non-vested unit distribution income, and/or 50% of their discretionary performance bonus compensation to be earned for services performed during the following year. Pursuant to the DC Plan, ETP and Regency may make annual discretionary matching contributions to participants’ accounts; however, neither ETP nor Regency has not made any discretionary contributions to participants’ accounts, nor do they currently have plans to make any discretionary contributions to participants’ accounts. All amounts credited under the DC Plan (other than discretionary credits) are immediately 100% vested. Participant accounts are credited with deemed earnings (or losses) based on hypothetical investment fund choices made by the participants among available funds.
Participants may elect to have their accounts distributed in one lump sum payment or in annual installments over a period of three or five years upon retirement, and in a lump sum upon other termination. Participants may also elect to take lump-sum in-service withdrawals five years or longer in the future, and such scheduled in-service withdrawals may be further deferred prior to the withdrawal date. Upon a change in control (as defined in the DC Plan) DC Plan accounts are immediately vested in full. However, distributions are not accelerated and, instead, are made in accordance with the DC Plan’s normal distribution provisions unless a participant has elected to receive a change of control distributions pursuant to his deferral agreement.
Risk Assessment Related to our Compensation Structure
. We believe that the compensation plans and programs for named executive officers of ETE and ETP, as well as our other employees, are appropriately structured and are not reasonably likely to result in material risk to ETE or ETP. We believe these compensation plans and programs are structured in a manner that does not promote excessive risk-taking that could harm the value of ETE, ETP, or Regency or reward poor judgment. We also believe ETE, ETP and Regency have allocated compensation among base salary and short and long-term compensation in such a way as to not encourage excessive risk-taking. In particular, ETE, ETP and Regency generally do not adjust base annual salaries for executive officers and other employees significantly from year to year, and therefore the annual base salary of our employees is not generally impacted by our overall financial performance or the financial performance of a portion of our operations. ETE, ETP and Regency generally determine whether, and to what extent, their respective named executive officers receive a cash bonus based on achievement of specified financial performance objectives as well as the individual contributions of our named executive officers to the Partnership’s success. ETE, ETP and Regency use restricted units rather than unit options for equity awards because restricted units retain value even in a depressed market so that employees are less likely to take unreasonable risks to get, or keep, options “in-the-money.” Finally, the time-based vesting over five years for ETE’s, ETP’s and Regency’s long-term incentive awards ensures that the interests of employees align with those of the respective unitholders of ETE, ETP and Regency for the long-term performance of ETE, ETP and Regency.
Tax and Accounting Implications of Equity-Based Compensation Arrangements
Deductibility of Executive Compensation
We are a limited partnership and not a corporation for U.S. federal income tax purposes. Therefore, we believe that the compensation paid to the named executive officers is not subject to the deduction limitations under Section 162(m) of the Internal Revenue Code and therefore is generally fully deductible for U.S. federal income tax purposes.
Accounting for Unit-Based Compensation
For unit-based compensation arrangements we record compensation expense over the vesting period of the awards, as discussed further in Note
10
to our consolidated financial statements.
Compensation Committee Interlocks and Insider Participation
Messrs. Turner and Ramsey are the only members of the Compensation Committee. During 2014, no member of the Compensation Committee was an officer or employee of us or any of our subsidiaries or served as an officer of any company with respect to which any of our executive officers served on such company’s board of directors. In addition, neither Mr. Turner nor Mr. Ramsey is a former employee of ours or any of our subsidiaries.
129
Report of Compensation Committee
The board of directors of our General Partner has reviewed and discussed the section entitled “Compensation Discussion and Analysis” with the management of ETE. Based on this review and discussion, we have recommended that the Compensation Discussion and Analysis be included in this annual report on Form 10-K.
The Compensation Committee of the
Board of Directors of LE GP, LLC,
general partner of Energy Transfer Equity, L.P.
K. Rick Turner
Matthew S. Ramsey
The foregoing report shall not be deemed to be incorporated by reference by any general statement or reference to this annual report on Form 10-K into any filing under the Securities Act of 1933, as amended, or the Securities Exchange Act of 1934, as amended, except to the extent that we specifically incorporate this information by reference, and shall not otherwise be deemed filed under those Acts.
130
Compensation Tables
Summary Compensation Table
|
Name and Principal Position
|
Year
|
Salary
($)
|
Bonus
($) (1)
|
Equity
Awards
($) (2)
|
Option
Awards
($)
|
Non-Equity
Incentive Plan
Compensation
($)
|
Change in
Pension
Value and
Nonqualified
Deferred
Compensation
Earnings
($)
|
All Other
Compensation
($) (3)
|
Total
($)
|
|||||||||||||||||||||||||
|
ETE Officers:
|
||||||||||||||||||||||||||||||||||
|
John W. McReynolds
|
2014
|
$
|
550,000
|
|
$
|
687,500
|
|
$
|
—
|
|
$
|
—
|
|
$
|
—
|
|
$
|
—
|
|
$
|
9,565
|
|
$
|
1,247,065
|
|
|||||||||
|
President
|
2013
|
560,577
|
|
700,721
|
|
—
|
|
—
|
|
—
|
|
—
|
|
13,856
|
|
1,275,154
|
|
|||||||||||||||||
|
2012
|
550,000
|
|
522,500
|
|
—
|
|
—
|
|
—
|
|
—
|
|
13,834
|
|
1,086,334
|
|
||||||||||||||||||
|
Jamie Welch
|
2014
|
550,000
|
|
687,500
|
|
2,434,757
|
|
—
|
|
—
|
|
7,765
|
|
13,360
|
|
3,693,382
|
|
|||||||||||||||||
|
Group Chief Financial Officer and Head of Business Development
|
2013
|
272,885
|
|
550,000
|
|
44,427,760
|
|
—
|
|
—
|
|
—
|
|
180
|
|
45,250,825
|
|
|||||||||||||||||
|
Brad Whitehurst
|
2014
|
184,519
|
|
570,000
|
|
6,489,787
|
|
—
|
|
—
|
|
—
|
|
63,492
|
|
7,307,798
|
|
|||||||||||||||||
|
Executive Vice President and Head of Tax
|
||||||||||||||||||||||||||||||||||
|
Certain Subsidiary Executive Officers:
|
||||||||||||||||||||||||||||||||||
|
Marshall S. (Mackie) McCrea, III
|
2014
|
800,000
|
|
1,120,000
|
|
5,829,111
|
|
—
|
|
—
|
|
—
|
|
14,072
|
|
7,763,183
|
|
|||||||||||||||||
|
President and Chief Operating Officer of ETP
|
2013
|
772,115
|
|
1,080,961
|
|
6,715,336
|
|
—
|
|
—
|
|
—
|
|
13,323
|
|
8,581,735
|
|
|||||||||||||||||
|
2012
|
690,000
|
|
700,000
|
|
1,510,985
|
|
—
|
|
—
|
|
—
|
|
12,802
|
|
2,913,787
|
|
||||||||||||||||||
|
Michael J. Bradley
|
2014
|
619,137
|
|
773,921
|
|
1,969,300
|
|
—
|
|
—
|
|
—
|
|
14,584
|
|
3,376,942
|
|
|||||||||||||||||
|
President
|
2013
|
612,523
|
|
735,028
|
|
1,943,248
|
|
—
|
|
—
|
|
—
|
|
13,901
|
|
3,304,700
|
|
|||||||||||||||||
|
2012
|
592,250
|
|
600,000
|
|
1,054,000
|
|
—
|
|
—
|
|
—
|
|
41,322
|
|
2,287,572
|
|
||||||||||||||||||
|
(1)
|
The discretionary cash bonus amounts for named executive officers for
2014
reflect cash bonuses approved by the ETE and ETP Compensation Committees in February 2015 that are expected to be paid in March 2015.
|
|
(2)
|
Equity award amounts reflect the aggregate grant date fair value of unit awards granted for the periods presented, computed in accordance with FASB ASC Topic 718. See Note
10
to our consolidated financial statements for additional assumptions underlying the value of the equity awards.
|
|
(3)
|
The amounts reflected for
2014
in this column include (i) matching contributions to the 401(k) plan made by ETE on behalf of the named executive officers of $7,981, $13,000 and $9,135 for Messrs. McReynolds, Welch and Whitehurst, respectively, (ii) contributions to the 401(k) plan made by ETP on behalf of the named executive officer of
$13,000
for Mr. McCrea, (iii) contributions to the 401(k) plan made by Regency on behalf of the named executive officer of $13,000 for Mr. Bradley, (iv) the dollar value of life insurance premiums paid for the benefit of the named executive officers. Vesting in 401(k) contributions occurs immediately and (v) $54,255 in relocation costs for Mr. Whitehurst.
|
131
Grants of Plan-Based Awards Table
|
Name
|
Grant Date
|
All Other Unit Awards: Number of Units
(#) (1)
|
All Other Option Awards: Number of Securities Underlying Options
(#)
|
Exercise or Base Price of Option Awards
($ / Unit)
|
Grant Date Fair Value of Unit Awards
(2)
|
||||||||||
|
ETE Officers:
|
|||||||||||||||
|
ETP Unit Awards:
|
|||||||||||||||
|
Jamie Welch
|
12/16/2014
|
11,500
|
|
—
|
|
—
|
|
$
|
706,790
|
|
|||||
|
Brad Whitehurst
|
12/16/2014
|
9,900
|
|
—
|
|
—
|
|
608,454
|
|
||||||
|
8/1/2014
|
28,203
|
|
—
|
|
—
|
|
1,583,316
|
|
|||||||
|
Regency Unit Awards:
|
|||||||||||||||
|
Jamie Welch
|
12/16/2014
|
24,500
|
|
—
|
|
—
|
|
587,020
|
|
||||||
|
Brad Whitehurst
|
12/16/2014
|
21,000
|
|
—
|
|
—
|
|
503,160
|
|
||||||
|
8/1/2014
|
51,794
|
|
—
|
|
—
|
|
1,583,343
|
|
|||||||
|
Sunoco Logistics Unit Awards:
|
|||||||||||||||
|
Jamie Welch
|
12/5/2014
|
15,117
|
|
—
|
|
—
|
|
727,128
|
|
||||||
|
1/29/2014
|
10,900
|
|
—
|
|
—
|
|
413,819
|
|
|||||||
|
Brad Whitehurst
|
12/5/2014
|
13,060
|
|
—
|
|
—
|
|
628,186
|
|
||||||
|
8/1/2014
|
35,445
|
|
—
|
|
—
|
|
1,583,328
|
|
|||||||
|
Certain Subsidiary Executive Officers:
|
|||||||||||||||
|
ETP Unit Awards:
|
|||||||||||||||
|
Marshall S. (Mackie) McCrea, III
|
12/16/2014
|
62,650
|
|
—
|
|
—
|
|
3,850,469
|
|
||||||
|
Regency Unit Awards:
|
|||||||||||||||
|
Michael J. Bradley
|
12/19/2014
|
83,800
|
|
—
|
|
—
|
|
1,969,300
|
|
||||||
|
Sunoco Logistics Unit Awards:
|
|||||||||||||||
|
Marshall S. (Mackie) McCrea, III
|
12/5/2014
|
41,136
|
|
—
|
|
—
|
|
1,978,642
|
|
||||||
|
(1)
|
Sunoco Logistics Unit amounts reflect the two-for-one split of Sunoco Logistics Common Units in June 2014.
|
|
(2)
|
We have computed the grant date fair value of unit awards in accordance with FASB ASC Topic 718, as further described above and in Note
10
to our consolidated financial statements.
|
Narrative Disclosure to Summary Compensation Table and Grants of the Plan-Based Awards Table
A description of material factors necessary to understand the information disclosed in the tables above with respect to salaries, bonuses, equity awards, nonqualified deferred compensation earnings, and 401(k) plan contributions can be found in the compensation discussion and analysis that precedes these tables.
132
Outstanding Equity Awards at Year-End Table
|
Name
|
Grant Date
(1)
|
Unit Awards
|
|||||||
|
Equity Incentive Plan Awards: Number of Units That Have Not Vested/Converted
(#) (1) (2)
|
Equity Incentive Plan Awards: Market or Payout Value of Units That Have Not Vested/Converted
($) (3)
|
||||||||
|
ETE Officers:
|
|||||||||
|
ETE Unit Awards:
|
|||||||||
|
John W. McReynolds
|
2/24/2011
|
20,000
|
|
$
|
1,147,600
|
|
|||
|
Class D Units:
|
|||||||||
|
Jamie Welch
|
12/23/2013
|
1,540,000
|
|
88,365,200
|
|
||||
|
ETP Unit Awards:
|
|||||||||
|
Jamie Welch
|
12/16/2014
|
11,500
|
|
747,500
|
|
||||
|
12/30/2013
|
6,900
|
|
448,500
|
|
|||||
|
Brad Whitehurst
|
12/16/2014
|
9,900
|
|
643,500
|
|
||||
|
8/1/2014
|
28,203
|
|
1,833,195
|
|
|||||
|
Regency Unit Awards:
|
|||||||||
|
Jamie Welch
|
12/16/2014
|
24,500
|
|
588,000
|
|
||||
|
1/3/2014
|
15,000
|
|
360,000
|
|
|||||
|
Brad Whitehurst
|
12/16/2014
|
21,000
|
|
504,000
|
|
||||
|
8/1/2014
|
51,794
|
|
1,243,056
|
|
|||||
|
Sunoco Logistics Unit Awards:
|
|||||||||
|
Jamie Welch
|
12/5/2014
|
15,117
|
|
631,588
|
|
||||
|
1/29/2014
|
10,900
|
|
455,402
|
|
|||||
|
Brad Whitehurst
|
12/5/2014
|
13,060
|
|
545,647
|
|
||||
|
8/1/2014
|
35,445
|
|
1,480,892
|
|
|||||
|
Certain Subsidiary Executive Officers:
|
|||||||||
|
ETP Unit Awards:
|
|||||||||
|
Marshall S. (Mackie) McCrea, III
|
12/16/2014
|
62,650
|
|
4,072,250
|
|
||||
|
12/30/2013
|
69,375
|
|
4,509,375
|
|
|||||
|
1/10/2013
|
33,333
|
|
2,166,645
|
|
|||||
|
12/20/2011
|
20,000
|
|
1,300,000
|
|
|||||
|
5/2/2011
|
27,200
|
|
1,768,000
|
|
|||||
|
1/14/2011
|
50,000
|
|
3,250,000
|
|
|||||
|
Regency Unit Awards:
|
|||||||||
|
Michael J. Bradley
|
12/19/2014
|
83,800
|
|
2,011,200
|
|
||||
|
1/3/2014
|
74,971
|
|
1,799,304
|
|
|||||
|
12/17/2012
|
50,000
|
|
1,200,000
|
|
|||||
|
12/21/2011
|
20,000
|
|
480,000
|
|
|||||
|
12/17/2010
|
10,000
|
|
240,000
|
|
|||||
|
11/22/2010
|
10,000
|
|
240,000
|
|
|||||
|
Sunoco Logistics Unit Awards:
|
|||||||||
|
Marshall S. (Mackie) McCrea, III
|
12/5/2014
|
41,136
|
|
1,718,662
|
|
||||
|
12/5/2013
|
54,600
|
|
2,281,188
|
|
|||||
|
1/24/2013
|
19,998
|
|
835,516
|
|
|||||
|
(1)
|
ETE unit awards outstanding to Mr. McReynolds vest in December of each year through 2015 for awards granted in 2011. Class D Unit awards outstanding to Mr. Welch are eligible for conversion at a rate of 30% in March 2015 and 70% in March 2018, subject in each case to (i) Mr. Welch being in Good Standing with ETE (as defined in the Class D Unit Agreement) and (ii) there being a sufficient amount of gain available (based on the ETE partnership agreement) to be allocated to the Class D Units being converted so as to cause the capital account of each such unit to equal the capital account of an ETE Common Unit on the conversion date. ETP common unit awards outstanding to Messrs. Welch, Whitehurst and McCrea vest as follows:
|
|
•
|
at a rate of 60% in December 2017 and 40% in December 2019 for awards granted in December 2014;
|
133
|
•
|
at a rate of 60% in December 2016 and 40% in December 2018 for awards granted in December 2013; and
|
|
•
|
at a rate of 60% in December 2015 and 40% in December 2017 for awards granted in January 2013.
|
Regency common unit awards outstanding to Messrs. Welch, Whitehurst and Bradley vest at as follows:
|
•
|
at a rate of 60% in December 2016 and 40% in December 2018 for awards granted in January 2014;
|
|
•
|
at a rate of 60% in December 2017 and 40% in December 2019 for awards granted in December 2014;
|
|
•
|
at a rate of 60% in December 2015 and 405 in December 2017 for awards granted in December 2012;
|
|
•
|
ratably on each anniversary of the grant date through 2016 for awards granted in 2011; and
|
|
•
|
ratably on each anniversary of the grant date through 2015 for awards granted in 2010.
|
Sunoco Logistics common unit awards outstanding to Messrs. Welch, Whitehurst and McCrea vest as follows:
|
•
|
at a rate of 60% in December 2017 and 40% in December 2019 for awards granted in December 2014;
|
|
•
|
at a rate of 60% in December 2016 and 40% in December 2018 for awards granted in December 2013; and
|
|
•
|
ratably in December of each year through 2017 for awards granted in January 2013.
|
|
(2)
|
ETE Unit amounts reflect the two-for-one split of ETE Common Units in January 2014 and Sunoco Logistics unit amounts reflect a two-for-one split of Sunoco Logistics common units in June 2014.
|
|
(3)
|
Market value was computed as the number of unvested awards (or units not converted in the case of Class D Units) as of
December 31, 2014
multiplied by the closing price of ETP’s common units or Sunoco Logistics’ common units, accordingly, for ETP officers and ETE’s Common Units or Regency’s common units, accordingly, for ETE officers on
December 31, 2014
.
|
Option Exercises and Units Vested Table
|
Unit Awards
|
|||||||
|
Name
|
Number of Units
Acquired on Vesting
(#) (1)
|
Value Realized on Vesting
($) (1)
|
|||||
|
ETE Officers:
|
|||||||
|
ETE Unit Awards:
|
|||||||
|
John W. McReynolds
|
22,000
|
|
$
|
1,157,480
|
|
||
|
Class D Units:
|
|||||||
|
Jamie Welch
|
—
|
|
—
|
|
|||
|
Certain Subsidiary Executive Officers:
|
|||||||
|
ETP Unit Awards:
|
|||||||
|
Marshall S. (Mackie) McCrea, III
|
91,200
|
|
6,007,526
|
|
|||
|
Sunoco Logistics Unit Awards:
|
|||||||
|
Marshall S. (Mackie) McCrea, III
|
6,668
|
|
320,331
|
|
|||
|
Regency Unit Awards:
|
|||||||
|
Michael J. Bradley
|
30,000
|
|
838,600
|
|
|||
|
(1)
|
ETE Unit amounts reflect the two-for-one split of ETE Common Units in January 2014. Amounts presented represent the number of unit awards vested during
2014
and the value realized upon vesting of these awards, which is calculated as the number of units vested multiplied by the applicable closing market price of ETP common units, Sunoco Logistics common units, Regency Common Units or ETE Common Units, accordingly, upon the vesting date.
|
|
(2)
|
Sunoco Logistics unit amounts reflect the two-for-one split of Sunoco Logistics common units in June 2014.
|
We have not issued option awards.
134
Nonqualified Deferred Compensation Table
|
Name
|
Executive Contributions in Last FY
(1)
($)
|
Registrant Contributions in Last FY
($)
|
Aggregate Earnings in
Last FY
(1)
($)
|
Aggregate Withdrawals/Distributions
($)
|
Aggregate Balance at Last FYE
(1)
($)
|
|||||||||||||||
|
ETE Officers:
|
||||||||||||||||||||
|
John W. McReynolds
|
$
|
—
|
|
$
|
—
|
|
$
|
—
|
|
$
|
—
|
|
$
|
—
|
|
|||||
|
Jamie Welch
|
275,000
|
|
—
|
|
7,765
|
|
—
|
|
282,765
|
|
||||||||||
|
Brad Whitehurst
|
—
|
|
—
|
|
—
|
|
—
|
|
—
|
|
||||||||||
|
Certain Subsidiary Executive Officers:
|
||||||||||||||||||||
|
Marshall S. (Mackie) McCrea, III
|
—
|
|
—
|
|
—
|
|
—
|
|
—
|
|
||||||||||
|
Michael J. Bradley
|
—
|
|
—
|
|
—
|
|
—
|
|
—
|
|
||||||||||
|
(1)
|
The executive contributions and aggregate earnings reflected above for Mr. Welch are included in total compensation in the “Summary Compensation Table”; the remainder of the aggregate balance at last fiscal year end was reported as compensation in previous fiscal years.
|
A description of the key provisions of the Partnership’s deferred compensation plan can be found in the compensation discussion and analysis above.
Potential Payments Upon a Termination or Change of Control
Equity Awards.
As discussed in our Compensation Discussion and Analysis above, any unvested equity awards granted pursuant the ETE Plan will automatically become vested upon a change of control, which is generally defined as the occurrence of one or more of the following events: (i) any person or group becomes the beneficial owner of 50% or more of the voting power or voting securities of ETE or its general partner; (ii) LE GP, LLC or an affiliate of LE GP, LLC ceases to be the general partner of ETE; or (iii) the sale or other disposition, including by liquidation or dissolution, of all or substantially all of the assets of ETE in one or more transactions to anyone other than an affiliate of ETE.
In addition, as explained in
Equity Awards
section of our Compensation Discussion and Analysis above, the restricted unit awards under the equity incentive plans of ETE, ETP and Regency, generally require the continued employment of the recipient during the vesting period, provided however, the unvested awards will be accelerated in the event of the death or disability of the award recipient prior to the applicable vesting period being satisfied. In addition, in the event of a change in control of the partnership, all unvested awards granted under the 2004 Unit Plan and the Regency 2006 Plan, as well as awards granted in 2014 under the 2008 Incentive Plan, the Regency 2011 Plan and the Sunoco Logistics Plan would be accelerated. For awards granted under the 2008 Incentive Plan prior to December 2014, unvested awards may also become vested upon a change in control at the discretion of the applicable compensation committee. This discussion assumes a scenario in which the ETP Compensation Committee and/or the Regency Compensation Committee does not exercise their discretion to accelerate unvested awards in connection with a change in control.
The 2014 awards to Messrs. McCrea, Bradley and Whitehurst, whether awarded under the 2008 Incentive Plan, the 2011 Regency Plan or the Sunoco Logistic Plan included a provision in the applicable award agreement for acceleration of unvested restricted unit/restricted phantom unit awards upon a termination of employment by the general partner of the applicable partnership issuing the award without “cause”. For purposes of the awards the term “cause” shall mean: (i) a conviction (treating a nolo contendere plea as a conviction) of a felony (whether or not any right to appeal has been or may be exercised), (ii) willful refusal without proper cause to perform duties (other than any such refusal resulting from incapacity due to physical or mental impairment), (iii) misappropriation, embezzlement or reckless or willful destruction of property of the partnership or any of its affiliates, (iv) knowing breach of any statutory or common law duty of loyalty to the partnership or any of its or their affiliates, (v) improper conduct materially prejudicial to the business of the partnership or any of its or their affiliates by, (vi) material breach of the provisions of any agreement regarding confidential information entered into with the partnership or any of its or their affiliates or (vii) the continuing failure or refusal to satisfactorily perform essential duties to the partnership or any of its or their affiliate.
The Class D Unit Agreement between ETE and Mr. Welch contains change of control provisions that are similar to those in the ETE Plan. Thus, under the terms of the Class D Unit Agreement, the Class D Units will convert to ETE Common Units and the requirement of Good Standing will cease to exist upon the occurrence of one or more of the change of control events described above. In addition, the terms of the Class D Unite Agreement provide that the Class D units will convert in connection with any termination of Mr. Welch’s employment without “Cause” or his termination of employment with Good Reason. All awards would convert in the event of Mr. Welch’s termination as a result of his death or disability.
135
Deferred Compensation Plan
. As discussed in our Compensation Discussion and Analysis above, all amounts under the DC Plan (other than discretionary credits) are immediately 100% vested. Upon a change of control (as defined in the DC Plan), distributions from the DC Plan would be made in accordance with the DC Plan’s normal distribution provisions. A change of control is generally defined in the DC Plan as any change of control event within the meaning of Treasury Regulation Section 1.409A-3(i)(5).
Director Compensation
Directors of LE GP, LLC who are employees of the LE GP, LLC, ETP GP or any of their subsidiaries are not eligible for director compensation. In 2014, the compensation arrangements for outside directors include a $50,000 annual retainer for services on the board and an annual retainer ($10,000 or $15,000 in the case of the chairman) and meeting attendance fees ($1,200) for services on the Audit Committee. In 2014, members of the Conflicts Committee received cash payments on a to-be-determined basis for each Conflicts Committee assignment. For their service on the Conflicts Committee during 2014, Messrs. Harkey, Ramsey and Turner each received additional compensation of $15,000.
The outside directors of LE GP, LLC are also entitled to an annual award under the Energy Transfer Equity, L.P. Long-Term Incentive Plan equal to an aggregate of $100,000 divided by the closing price of ETE Common Units on the date of grant. These ETE Common Units will vest 60% after the third year and the remaining 40% after the fifth year after the grant date. The compensation expense recorded is based on the grant-date market value of the ETE Common Units and is recognized over the vesting period. Distributions are paid during the vesting period.
The ETP Compensation Committee periodically reviews and makes recommendations regarding the compensation of the directors of ETP’s General Partner. In 2014, non-employee directors received an annual fee of $50,000 in cash. Additionally, the Chairman of ETP’s audit committee receives an annual fee of $15,000 and the members of ETP’s Audit Committee receive an annual fee of $10,000. The Chairman of the ETP Compensation Committee receives an annual fee of $7,500 and the members of the ETP Compensation Committee receive an annual fee of $5,000. For their service on the Conflicts Committee during 2014, Mr. Glaske received additional compensation of $10,000, Mr. Collins received additional compensation of $15,000 and Messrs. Grimm and Skidmore each received additional compensation of $25,000. ETP’s employee directors, including Messrs. Warren, McCrea and Welch, do not receive any fees for service as directors. In addition, the non-employee directors participate in ETP’s 2008 Incentive Plan. Each director of ETP’s General Partner who is not also (i) a shareholder or a direct or indirect employee of any parent, or (ii) a direct or indirect employee of ETP LLC, ETP, or a subsidiary, who is elected or appointed to the board of ETP’s General Partner for the first time shall automatically receive, on the date of his or her election or appointment, an award of 2,500 unvested ETP common units. In 2014, non-employee ETP directors received annual grants of restricted ETP common units equal to an aggregate of $100,000 divided by the closing price of ETP’s common units on the date of grant. Beginning in 2013, the ETP common units granted to non-employee directors will vest 60% after the third year and the remaining 40% after the fifth year after the grant date. Previously, vesting was ratable over three years.
The compensation paid to the non-employee directors of our General Partner in
2014
is reflected in the following table:
|
Name
|
Fees Paid in Cash
($) (1)
|
Unit Awards
($) (2)
|
All Other Compensation
($)
|
Total
($)
|
||||||||||||
|
John D. Harkey, Jr.
(3)
|
|
|||||||||||||||
|
As ETE director
|
$
|
49,644
|
|
$
|
100,028
|
|
$
|
—
|
|
$
|
149,672
|
|
||||
|
As Regency director
|
19,325
|
|
140,000
|
|
—
|
|
159,325
|
|
||||||||
|
Matthew S. Ramsey
(4)
|
|
|
|
|||||||||||||
|
As ETE director
|
103,317
|
|
100,028
|
|
—
|
|
203,345
|
|
||||||||
|
As Regency director
|
52,350
|
|
72,950
|
|
—
|
|
125,300
|
|
||||||||
|
As Sunoco LP director
|
35,733
|
|
33,989
|
|
—
|
|
69,722
|
|
||||||||
|
K. Rick Turner
(5)
|
|
|
|
|
|
|||||||||||
|
As ETE director
|
99,358
|
|
100,028
|
|
—
|
|
199,386
|
|
||||||||
|
As Sunoco LP Director
|
34,900
|
|
33,989
|
|
—
|
|
68,889
|
|
||||||||
|
William P. Williams
(6)
|
|
|
—
|
|
||||||||||||
|
As ETE director
|
35,886
|
|
—
|
|
—
|
|
35,886
|
|
||||||||
|
As Sunoco LP Director
|
19,900
|
|
33,989
|
|
—
|
|
53,889
|
|
||||||||
|
(1)
|
Fees paid in cash are based on amounts paid during the period.
|
|
(2)
|
Unit award amounts reflect the aggregate grant date fair value of awards granted based on the market price of ETE Common Units, Regency Common Units or Sunoco LP Common Units, accordingly, as of the grant date.
|
136
|
(3)
|
Effective March 1, 2014, Mr. Harkey resigned from the Board of Directors of our General Partner and the Board of Directors of Regency GP LLC.
|
As of
December 31, 2014
, Mr. Turner had 5,293 unvested ETE restricted units outstanding and Mr. Ramsey had 5,047 unvested ETE restricted units outstanding. As of
December 31, 2014
, Mr. Ramsey had 2,500 unvested Regency restricted units outstanding. Messrs. Ramsey, Turner and Williams are currently non-employee directors of Sunoco LP and each had 747 unvested Sunoco LP restricted units outstanding as of December 31, 2014.
Equity Compensation Plan Information
At the time of our initial public offering, we adopted the Energy Transfer Equity, L.P. Long-Term Incentive Plan for the employees, directors and consultants of our General Partner and its affiliates who perform services for us. The long-term incentive plan provides for the following five types of awards: restricted units, phantom units, unit options, unit appreciation rights and distribution equivalent rights. The long-term incentive plan limits the number of units that may be delivered pursuant to awards to three million units. Units withheld to satisfy exercise prices or tax withholding obligations are available for delivery pursuant to other awards. The plan is administered by the compensation committee of the board of directors of our General Partner.
The following table sets forth in tabular format, a summary of our equity plan information as of
December 31, 2014
:
|
Plan Category
|
Number of securities to
be issued upon exercise
of outstanding options,
warrants and rights
(a)
|
Weighted-average
exercise price of
outstanding options,
warrants and rights
(b)
|
Number of securities
remaining available for
future issuance under
equity compensation plans
(excluding securities
reflected in column (a))
(c)
|
|||||||
|
Equity compensation plans approved by security holders
|
—
|
|
$
|
—
|
|
—
|
|
|||
|
Equity compensation plans not approved by security holders:
|
||||||||||
|
Energy Transfer Equity, L.P. Long-Term Incentive Plan
|
—
|
|
—
|
|
5,690,101
|
|
||||
|
Class D Unit Agreement
|
1,540,000
|
|
$
|
—
|
|
—
|
|
|||
|
Total
|
1,540,000
|
|
$
|
—
|
|
5,690,101
|
|
|||
137
Energy Transfer Equity, L.P. Units
The following table sets forth certain information as of February 18, 2015, regarding the beneficial ownership of our securities by certain beneficial owners, each director and named executive officer of our General Partner and all directors and executive officers of our General Partner as a group. The General Partner knows of no other person not disclosed herein who beneficially owns more than 5% of our Common Units.
|
Title of Class
|
Name and Address of
Beneficial Owner
(1)
|
Beneficially
Owned
(2)
|
Percent of Class
|
|||||
|
Common Units
|
Ray C. Davis
(3)
|
34,108,102
|
|
6.3
|
%
|
|||
|
John W. McReynolds
(4)
|
12,499,944
|
|
2.3
|
%
|
||||
|
Kelcy L. Warren
(5)
|
91,715,009
|
|
17.0
|
%
|
||||
|
Jamie Welch
(6)
|
1,540,000
|
|
*
|
|
||||
|
Marshall S. (Mackie) McCrea, III
|
1,416,100
|
|
*
|
|
||||
|
Matthew S. Ramsey
|
26,159
|
|
*
|
|
||||
|
K. Rick Turner
|
174,994
|
|
*
|
|
||||
|
William P. Williams
(7)
|
2,696,364
|
|
*
|
|
||||
|
All Directors and Executive Officers as a group (7 persons)
|
110,068,570
|
|
20.3
|
%
|
||||
|
*
|
Less than 1%
|
|
(1)
|
The address for Mr. Davis is 5950 Sherry Lane, Dallas, Texas 75225. Messrs. McReynolds, Warren, Welch, McCrea, Ramsey, Turner and Williams is 3738 Oak Lawn Avenue, Dallas, Texas 75219.
|
|
(2)
|
Beneficial ownership for the purposes of this table is defined by Rule 13d-3 under the Exchange Act. Under that rule, a person is generally considered to be the beneficial owner of a security if he has or shares the power to vote or direct the voting thereof or to dispose or direct the disposition thereof or has the right to acquire either of those powers within sixty days. Nature of beneficial ownership is direct with sole investment and disposition power unless otherwise noted.
|
|
(3)
|
Includes 278,718 units held by Avatar BW LLC, 20,846 units held by Avatar Holdings LLC, 11,371,340 units held by Avatar ETC Stock Holdings LLC, 1,434,474 units held by Avatar Investments LP, 48,834 units held by Avatar Stock Holdings LLC and 390,984 units held by RCD Stock Holdings LLC, all of which entities are owned or controlled by Mr. Davis. Also includes 9,520,182 units held by a remainder trust for Mr. Davis’ spouse and 4,351,688 units held by two trusts for the benefit of Mr. Davis’ grandchildren, for which Mr. Davis serves as trustee. Mr. Davis shares voting and dispositive power with his wife with respect to 9,538,266 units held directly. Also includes 132,403 units attributable to the interest of Mr. Davis in ET Company Ltd and Three Dawaco, Inc., over which Mr. Davis exercises shared voting and dispositive power with Mr. Warren. Excludes Mr. Davis’ interest in 308,538 units held by LE GP, LLC. Mr. Davis may be deemed to own units held by LE GP, LLC due to his ownership of 18.8% of its member interests. The voting and disposition of these units is directly controlled by the board of directors of LE GP, LLC. Mr. Davis disclaims beneficial ownership of units owned by LE GP LLC other than to the extent of his interest in such entity. Mr. Davis is a former executive officer of ETP and former director of our General Partner.
|
|
(4)
|
Includes 7,245,204 units held by McReynolds Energy Partners L.P. and 5,043,140 units held by McReynolds Equity Partners L.P., the general partners of which are owned by Mr. McReynolds. Mr. McReynolds disclaims beneficial ownership of units owned by such limited partnerships other than to the extent of his interest in such entities.
|
|
(5)
|
Includes 39,551,100 units held by Kelcy Warren Partners, L.P. and 3,879,950 units held by Kelcy Warren Partners II, L.P., the general partners of which are owned by Mr. Warren. Also includes 35,926,908 units held by Seven Bridges Holdings, LLC, of which Mr. Warren is a member. Also includes 132,403 units attributable to the interest of Mr. Warren in ET Company Ltd and Three Dawaco, Inc., over which Mr. Warren exercises shared voting and dispositive power with Ray Davis. Also includes 300,538 units held by LE GP, LLC. Mr. Warren may be deemed to own units held by LE GP, LLC due to his ownership of 81.2% of its member interests. The voting and disposition of these units is directly controlled by the board
of directors of LE GP, LLC. Mr. Warren disclaims beneficial ownership of units owned by LE GP, LLC other than to the extent of his interest in such entity. Also includes 42,000 units held by Mr. Warren’s spouse.
|
|
(6)
|
Represents Class D Units convertible into 1,540,000 Common Units. The Class D Units have voting and distribution rights equal to Common Units and are therefore included in this table.
|
138
|
(7)
|
Includes 1,669,342 units held by the Williams Family Partnership Ltd and 1,516,014 units held by the Bar W Barking Cat Ltd. Partnership. Mr. Williams disclaims beneficial ownership of units owned by such entities, except to the extent of his interest in such entities.
|
In connection with the Parent Company Credit Agreement, ETE and certain of its subsidiaries entered into a Pledge and Security Agreement (the “Security Agreement”) with Credit Suisse AG, Cayman Islands Branch, as collateral agent (the “Collateral Agent”). The Security Agreement secures all of ETE’s obligations under the Parent Company Credit Agreement and grants to the Collateral Agent a continuing first priority lien on, and security interest in, all of ETE’s and the other grantors’ tangible and intangible assets.
At
December 31, 2014
, our equity interests in ETP and Regency consisted of
100%
of the respective general partner interest and IDRs, as well as the following:
|
ETP
|
Regency
|
||||
|
Units held by wholly-owned subsidiaries:
|
|||||
|
Common units
|
30,841,069
|
|
57,157,356
|
|
|
|
ETP Class H units
|
50,160,000
|
|
—
|
|
|
|
Units held by less than wholly-owned subsidiaries:
|
|||||
|
Common units
|
—
|
|
31,372,419
|
|
|
|
Regency Class F units
|
—
|
|
6,274,483
|
|
|
The Parent Company’s principal sources of cash flow are derived from its direct and indirect investments in the limited partner and general partner interests in ETP and Regency, both of which are publicly traded master limited partnerships engaged in diversified energy-related services, and cash flows from the operations of Lake Charles LNG.
ETP and Regency are required by their respective partnership agreements to distribute all cash on hand at the end of each quarter, less appropriate reserves determined by the board of directors of their respective general partners.
Immediately following the closing of ETP’s acquisition of Sunoco, Inc., ETE contributed its interest in Southern Union into ETP Holdco, an ETP-controlled entity, in exchange for a
60%
equity interest in ETP Holdco. In conjunction with ETE’s contribution, ETP contributed its interest in Sunoco, Inc. to ETP Holdco and retained a
40%
equity interest in ETP Holdco. Prior to the contribution of Sunoco, Inc. to ETP Holdco, Sunoco, Inc. contributed
$2.0 billion
of cash and its interests in Sunoco Logistics to ETP in exchange for
90.7 million
ETP Class F Units representing limited partner interests in ETP. The ETP Class F Units were entitled to
35%
of the quarterly cash distribution generated by ETP and its subsidiaries other than ETP Holdco, subject to a maximum cash distribution of
$3.75
per ETP Class F Unit per year, which is the current level. In April 2013, all of the outstanding ETP Class F Units were exchanged for ETP Class G Units on a one-for-one basis. The ETP Class G Units have terms that are substantially the same as the ETP Class F Units, with the principal difference between the ETP Class G Units and the ETP Class F Units being that allocations of depreciation and amortization to the ETP Class G Units for tax purposes are based on a predetermined percentage and are not contingent on whether ETP has net income or loss.
On April 30, 2013, Southern Union completed its contribution to Regency of all of the issued and outstanding membership interest in Southern Union Gathering Company, LLC, and its subsidiaries, including SUGS (the “SUGS Contribution”). The general partner and IDRs of Regency are owned by ETE. The consideration paid by Regency in connection with this transaction consisted of (i) the issuance of approximately
31.4 million
Regency common units to Southern Union, (ii) the issuance of approximately
6.3 million
Regency Class F units to Southern Union, (iii) the distribution of
$463 million
in cash to Southern Union, net of closing adjustments, and (iv) the payment of
$30 million
in cash to a subsidiary of ETP. The Regency Class F units have the same rights, terms and conditions as the Regency common units, except that Southern Union will not receive distributions on the Regency Class F units for the first eight consecutive quarters following the closing, and the Regency Class F units will thereafter automatically convert into Regency common units on a one-for-one basis.
On April 30, 2013, ETP acquired ETE’s
60%
interest in ETP Holdco for approximately
49.5 million
of newly issued ETP Common Units and
$1.40 billion
in cash, less
$68 million
of closing adjustments (the “ETP Holdco Acquisition”). As a result, ETP now owns
100%
of ETP Holdco. ETE, which owns the general partner and IDRs of ETP, agreed to forego incentive distributions on the newly issued ETP units for each of the first eight consecutive quarters beginning with the quarter in which the closing of the transaction occurred and
50%
of incentive distributions on the newly issued ETP units for the following eight consecutive quarters. ETP controlled ETP Holdco prior to this acquisition; therefore, the transaction did not constitute a change of control.
139
Pursuant to an Exchange and Redemption Agreement previously entered into between ETP, ETE and ETE Holdings, ETP redeemed and cancelled
50.2
million of its ETP Common Units representing limited partner interests (the “Redeemed Units”) owned by ETE Holdings on October 31, 2013 in exchange for the issuance by ETP to ETE Holdings of a new class of limited partner interest in ETP (the “ETP Class H Units”), which are generally entitled to (i) allocations of profits, losses and other items from ETP corresponding to
50.05%
of the profits, losses, and other items allocated to ETP by Sunoco Partners with respect to the IDRs and general partner interest in Sunoco Logistics held by Sunoco Partners, (ii) distributions from available cash at ETP for each quarter equal to
50.05%
of the cash distributed to ETP by Sunoco Partners with respect to the IDRs and general partner interest in Sunoco Logistics held by Sunoco Partners for such quarter and, to the extent not previously distributed to holders of the ETP Class H Units, for any previous quarters.
In December 2014, ETP and ETE announced the final terms of a transaction, whereby ETE will transfer
30.8 million
ETP Common Units, ETE’s
45%
interest in the Bakken pipeline project, and
$879 million
in cash in exchange for
30.8 million
newly issued ETP Class H Units that, when combined with the
50.2 million
previously issued ETP Class H Units, generally entitle ETE to receive
90.05%
of the cash distributions and other economic attributes of the general partner interest and IDRs of Sunoco Logistics (the “Bakken Pipeline Transactions”). In connection with this transaction, ETP will also issue
100
ETP Class I Units. In addition, ETE and ETP agreed to reduce the IDR subsidies that ETE previously agreed to provide to ETP, with such reductions occurring in 2015 and 2016. This transaction is expected to close in March 2015.
On February 19, 2014, ETP completed the transfer to ETE of Lake Charles LNG, the entity that owns a LNG regasification facility in Lake Charles, Louisiana, from ETP in exchange for the redemption by ETP of
18.7 million
. The transaction was effective as of January 1, 2014.
In connection with ETE’s acquisition of Lake Charles LNG, ETP agreed to continue to provide management services for ETE through 2015 in relation to both Lake Charles LNG’s regasification facility and the development of a liquefaction project at Lake Charles LNG’s facility, for which ETE has agreed to pay incremental management fees to ETP of
$75 million
per year for the years ending December 31, 2014 and 2015. ETE also agreed to provide additional subsidies to ETP through the relinquishment of future incentive distributions, as discussed further in Note 9 to our consolidated financial statements.
Mr. McCrea, a current director of LE GP, LLC, our General Partner, is also a director and executive officer of ETP GP. In addition, Mr. Warren, the Chairman of our Board of Directors, is also a director and executive officer of ETP GP.
For a discussion of director independence, see Item 10. “Directors, Executive Officers and Corporate Governance.”
As a policy matter, our Conflicts Committee generally reviews any proposed related party transaction that may be material to the Partnership to determine whether the transaction is fair and reasonable to the Partnership. The Partnership’s board of directors makes the determinations as to whether there exists a related party transaction in the normal course of reviewing transactions for approval as the Partnership’s board of directors is advised by its management of the parties involved in each material transaction as to which the board of directors’ approval is sought by the Partnership’s management. In addition, the Partnership’s board of directors makes inquiries to independently ascertain whether related parties may have an interest in the proposed transaction. While there are no written policies or procedures for the board of directors to follow in making these determinations, the Partnership’s board makes those determinations in light of its contractually-limited fiduciary duties to the Unitholders. The partnership agreement of ETE provides that any matter approved by the Conflicts Committee will be conclusively deemed to be fair and reasonable to ETE, approved by all the partners of ETE and not a breach by the General Partner or its Board of Directors of any duties they may owe ETE or the Unitholders (see “Risks Related to Conflicts of Interest” in Item 1A. Risk Factors” in this annual report).
The Parent Company has agreements with subsidiaries to provide or receive various general and administrative services. The Parent Company pays ETP to provide services on its behalf and the behalf of other subsidiaries of the Parent Company. The Parent Company receives management fees from certain of its subsidiaries, which include the reimbursement of various general and administrative services for expenses incurred by ETP on behalf of those subsidiaries. All such amounts have been eliminated in our consolidated financial statements.
ETP has an operating lease agreement with the former owners of ETG, which ETP acquired in 2009. These former owners include Mr. Warren and Mr. Ray C. Davis, a former ETP board member. ETP pays these former owners
$5 million
in operating lease payments per year through
2017
. With respect to the related party transaction with ETG, the Conflicts Committee of ETP met numerous times prior to the consummation of the transaction to discuss the terms of the transaction. The committee made the determination that the sale of ETG to ETP was fair and reasonable to ETP and that the terms of the operating lease between ETP and the former owners of ETG are fair and reasonable to ETP.
140
The following sets forth fees billed by Grant Thornton LLP for the audit of our annual financial statements and other services rendered:
|
|
Years Ended December 31,
|
||||||
|
|
2014
|
2013
|
|||||
|
Audit fees
(1)
|
$
|
8,484,000
|
|
$
|
8,274,000
|
|
|
|
Audit-related fees
(2)
|
895,893
|
|
682,300
|
|
|||
|
Tax fees
(3)
|
79,000
|
|
—
|
|
|||
|
Total
|
$
|
9,458,893
|
|
$
|
8,956,300
|
|
|
|
(1)
|
Includes fees for audits of annual financial statements of our companies, reviews of the related quarterly financial statements, and services that are normally provided by the independent accountants in connection with statutory and regulatory filings or engagements, including reviews of documents filed with the SEC and services related to the audit of our internal controls over financial reporting.
|
|
(2)
|
Includes fees in 2014 and 2013 for financial statement audits and interim reviews of subsidiary entities in connection with contribution and sale transactions. Includes fees in 2013 for audits of Sunoco, Inc.’s benefit plans. Includes fees in 2014 and 2013 in connection with the service organization control report on Panhandle’s centralized data center.
|
|
(3)
|
Includes fees related to state and local tax consultation.
|
Pursuant to the charter of the Audit Committee, the Audit Committee is responsible for the oversight of our accounting, reporting and financial practices. The Audit Committee has the responsibility to select, appoint, engage, oversee, retain, evaluate and terminate our external auditors; pre-approve all audit and non-audit services to be provided, consistent with all applicable laws, to us by our external auditors; and establish the fees and other compensation to be paid to our external auditors. The Audit Committee also oversees and directs our internal auditing program and reviews our internal controls.
The Audit Committee has adopted a policy for the pre-approval of audit and permitted non-audit services provided by our principal independent accountants. The policy requires that all services provided by Grant Thornton LLP including audit services, audit-related services, tax services and other services, must be pre-approved by the Audit Committee.
The Audit Committee reviews the external auditors’ proposed scope and approach as well as the performance of the external auditors. It also has direct responsibility for and sole authority to resolve any disagreements between our management and our external auditors regarding financial reporting, regularly reviews with the external auditors any problems or difficulties the auditors encountered in the course of their audit work, and, at least annually, uses its reasonable efforts to obtain and review a report from the external auditors addressing the following (among other items):
|
•
|
the auditors’ internal quality-control procedures;
|
|
•
|
any material issues raised by the most recent internal quality-control review, or peer review, of the external auditors;
|
|
•
|
the independence of the external auditors;
|
|
•
|
the aggregate fees billed by our external auditors for each of the previous two years; and
|
|
•
|
the rotation of the lead partner.
|
141
(a) The following documents are filed as a part of this Report
:
|
(1)
|
Financial Statements - see
Index to Financial Statements
appearing on page
F-1
.
|
|
(2)
|
Financial Statement Schedules - None.
|
|
(3)
|
Exhibits - see
Index to Exhibits
set forth on page
E-1
.
|
(b) Exhibits - see
Index to Exhibits
set forth on page
E-1
.
(c) Financial statements of affiliates whose securities are pledged as collateral - See Index to Financial Statements on page S-1.
The Parent Company’s outstanding senior notes are collateralized by its interests in certain of its subsidiaries. SEC Rule 3-16 of Regulation S-X (“Rule 3-16”) requires a registrant to file financial statements for each of its affiliates whose securities constitute a substantial portion of the collateral for registered securities. The Parent Company’s limited partner interests in ETP and Regency constitute substantial portions of the collateral for the Parent Company’s outstanding senior notes; accordingly, financial statements of ETP and Regency are required under Rule 3-16 to be included in this Annual Report on Form 10-K and have been included herein.
The Parent Company’s interests in ETP GP, ETE Common Holdings, LLC, ETE GP Acquirer LLC, and Regency GP LP (collectively, the “Non-Reporting Entities”) also constitute substantial portions of the collateral for the Parent Company’s outstanding senior notes. Accordingly, the financial statements of the Non-Reporting Entities would be required under Rule 3-16 to be included in the Parent Company’s Annual Report on Form 10-K. None of the Non-Reporting Entities has substantive operations of its own; rather, each of the Non-Reporting Entities holds only direct or indirect interests in ETP, Regency and/or the consolidated subsidiaries of ETP and Regency.
As further discussed in Note
6
to the consolidated financial statements, as referenced in (a) above, the financial statements of the Non-Reporting Entities would substantially duplicate information that is available in the financial statements of ETP and Regency. Therefore, the financial statements of the Non-Reporting Entities have been excluded from this Annual Report on Form 10-K.
142
SIGNATURES
Pursuant to the requirements of Section 13 or 15(d) of the Securities Exchange Act of 1934, the registrant has duly caused this report to be signed on its behalf by the undersigned, thereunto duly authorized.
|
ENERGY TRANSFER EQUITY, L.P.
|
||||
|
By:
|
|
LE GP, LLC,
|
||
|
|
its general partner
|
|||
|
Date:
|
March 2, 2015
|
By:
|
|
/s/ Jamie Welch
|
|
|
Jamie Welch
|
|||
|
|
Group Chief Financial Officer (duly
authorized to sign on behalf of the registrant)
|
|||
Pursuant to the requirements of the Securities Exchange Act of 1934, this report has been signed by the following persons in the capacities and on the dates indicated:
|
Signature
|
|
Title
|
|
Date
|
|
/s/ John W. McReynolds
|
|
Director and President
|
|
March 2, 2015
|
|
John W. McReynolds
|
(Principal Executive Officer)
|
|||
|
/s/ Jamie Welch
|
Director and Group Chief Financial Officer and Head of Business Development (Principal Financial and Accounting Officer)
|
March 2, 2015
|
||
|
Jamie Welch
|
||||
|
/s/ Kelcy L. Warren
|
|
Director and Chairman of the Board
|
|
March 2, 2015
|
|
Kelcy L. Warren
|
||||
|
/s/ Marshall S. McCrea, III
|
|
Director
|
|
March 2, 2015
|
|
Marshall S. McCrea, III
|
||||
|
/s/ Matthew S. Ramsey
|
|
Director
|
|
March 2, 2015
|
|
Matthew S. Ramsey
|
||||
|
/s/ K. Rick Turner
|
|
Director
|
|
March 2, 2015
|
|
K. Rick Turner
|
||||
|
/s/ William P. Williams
|
Director
|
March 2, 2015
|
||
|
William P. Williams
|
||||
143
INDEX TO EXHIBITS
The exhibits listed on the following Exhibit Index are filed as part of this report. Exhibits required by Item 601 of Regulation S-K, but which are not listed below, are not applicable.
|
Exhibit
Number
|
||
|
2.1
|
General Partner Purchase Agreement, dated May 10, 2010, by and among Regency GP Acquirer, L.P., Energy Transfer Equity, L.P. and ETE GP Acquirer LLC (incorporated by reference to Exhibit 2.1 of Form 8-K/A, file No. 1-32740, filed May 13, 2010)
|
|
|
2.2
|
Contribution Agreement, dated May 10, 2010, by and among Energy Transfer Equity, L.P., Regency Energy Partners LP and Regency Midcontinent Express LLC (incorporated by reference to Exhibit 2.3 of Form 8-K/A, file No. 1-32740, filed May 13, 2010)
|
|
|
2.3
|
Agreement and Plan of Merger by and among Energy Transfer Equity, L.P., Sigma Acquisition Corporation and Southern Union Company, dated as of June 15, 2011, as Amended and Restated as of July 4, 2011 and July 19, 2011 (incorporated by reference to Exhibit 2.1 of Form 8-K, file No. 1-32740, filed July 5, 2011)
|
|
|
2.3.1
|
Amendment No. 1, dated as of September 14, 2011, to Second Amended and Restated Agreement and Plan of Merger, dated as of July 19, 2011, by and among Energy Transfer Equity, L.P., Sigma Acquisition Corporation and Southern Union Company (incorporated by reference to Exhibit 2.1 of Form 8-K, file No. 1-32740, filed September 15, 2011)
|
|
|
2.4
|
Support Agreement dated June 15, 2011 by and among Energy Transfer Equity, L.P., Sigma Acquisition Corporation, and certain stockholders of Southern Union Company (incorporated by reference to Exhibit 10.1 of Form 8-K, file No. 1-32740, filed July 5, 2011)
|
|
|
2.5
|
Amended and Restated Agreement and Plan of Merger by and among Energy Transfer Partners, L.P., Citrus ETP Acquisition, L.L.C., Energy Transfer Equity, L.P., Southern Union Company, and CrossCountry Energy, LLC, dated as of July 19, 2011 (incorporated by reference to Exhibit 2.2 of Form 8-K, file No. 1-32740, filed July 20, 2011)
|
|
|
2.5.1
|
Amendment No. 1, dated as of September 14, 2011, to Amended and Restated Agreement and Plan of Merger, dated as of July 19, 2011, by and between Energy Transfer Partners, L.P. and Energy Transfer Equity, L.P. (incorporated by reference to Exhibit 2.2 of Form 8-K, file No. 1-32740, filed September 15, 2011)
|
|
|
2.5.2
|
Amendment No. 2, dated as of March 23, 2012, to Amended and Restated Agreement and Plan of Merger by and among Energy Transfer Equity, L.P., Energy Transfer Partners, L.P., Citrus ETP Acquisition, L.L.C, Southern Union Company, and CrossCountry Energy, LLC, dated as of July 19, 2011 (incorporated by reference to Exhibit 2.1 of Form 8-K, file No. 1-32740, filed March 28, 2012)
|
|
|
2.6
|
Agreement and Plan of Merger, dated as of April 29, 2012 by and among Energy Transfer Partners, L.P., Sam Acquisition Corporation, Energy Transfer Partners GP, L.P., Sunoco, Inc. and, for certain limited purposes set forth therein, Energy Transfer Equity, L.P. (incorporated by reference to Exhibit 2.1 of Form 8-K, file No. 1-32740, filed May 1, 2012)
|
|
|
2.6.1
|
Amendment No. 1, dated as of June 15, 2012, to the Agreement and Plan of Merger, dated as of April 29, 2012, by and among Energy Transfer Partners, L.P., Sam Acquisition Corporation, Energy Transfer Partners GP, L.P., Sunoco, Inc., and, for certain limited purposes set forth therein, Energy Transfer Equity, L.P. (incorporated by reference to Exhibit 2.2 of Form 8-K, file No. 1-32740, filed June 20, 2012)
|
|
|
2.7
|
Transaction Agreement, dated as of June 15, 2012, by and among Energy Transfer Partners, L.P., Energy Transfer Partners GP, L.P., Heritage Holdings, Inc., Energy Transfer Equity, L.P., ETE Sigma Holdco, LLC and ETE Holdco Corporation (incorporated by reference to Exhibit 2.1 of Form 8-K, file No. 1-32740, filed June 20, 2012)
|
|
|
2.8
|
Redemption and Transfer Agreement by and between Energy Transfer Equity, L.P. and Energy Transfer Partners, L.P. dated November 19, 2013 (incorporated by reference to Exhibit 2.1 of Form 8-K, file No. 1-32740, filed November 21, 2013)
|
|
|
3.1
|
Certificate of Conversion of Energy Transfer Company, L.P. (incorporated by reference to Exhibit 3.1 of Form S-1, file No. 333-128097, filed September 2, 2005)
|
|
|
3.2
|
Certificate of Limited Partnership of Energy Transfer Equity, L.P. (incorporated by reference to Exhibit 3.2 of Form S-1, file No. 333-128097, filed September 2, 2005)
|
|
|
3.3
|
Third Amended Restated Agreement of Limited Partnership of Energy Transfer Equity, L.P. (incorporated by reference to Exhibit 3.1 of Form 8-K, file No. 1-32740, filed February 14, 2006)
|
|
|
3.3.1
|
Amendment No. 1 to Third Amended and Restated Agreement of Limited Partnership of Energy Transfer Equity, L.P. (incorporated by reference to Exhibit 3.3.1 of Form 10-K, file No. 1-32740, filed November 29, 2006)
|
|
|
3.3.2
|
Amendment No. 2 to Third Amended and Restated Agreement of Limited Partnership of Energy Transfer Equity, L.P. (incorporated by reference to Exhibit 3.3.2 of Form 8-K, file No. 1-32740, filed November 13, 2007)
|
|
|
3.3.3
|
Amendment No. 3 to Third Amended and Restated Agreement of Limited Partnership of Energy Transfer Equity, L.P. (incorporated by reference to Exhibit 3.1 of Form 8-K, file No. 1-32740, filed June 2, 2010)
|
|
E-
1
|
Exhibit
Number
|
||
|
3.4
|
Certificate of Conversion of LE GP, LLC (incorporated by reference to Exhibit 3.4 of Form S-1, file No. 333-128097, filed September 2, 2005)
|
|
|
3.5
|
Certificate of Formation of LE GP, LLC (incorporated by reference to Exhibit 3.5 of Form S-1, file No. 333-128097, filed September 2, 2005)
|
|
|
3.6
|
Amended and Restated Limited Liability Company Agreement of LE GP, LLC (incorporated by reference to Exhibit 3.6.1 of Form 8-K, file No. 1-32740, filed May 8, 2007)
|
|
|
3.6.1
|
Amendment No. 1 to Amended and Restated Limited Liability Company Agreement of LE GP, LLC (incorporated by reference to Exhibit 3.1 of Form 8-K, file No. 1-32740, filed December 23, 2009)
|
|
|
3.7
|
Second Amended and Restated Agreement of Limited Partnership of Energy Transfer Partners, L.P. (formerly named Heritage Propane Partners, L.P.) (incorporated by reference to Exhibit 3.1 of Form 8-K, file No. 1-11727, filed July 28, 2009)
|
|
|
3.8
|
Amended Certificate of Limited Partnership of Energy Transfer Partners, L.P. (incorporated by reference to Exhibit 3.3 of Form 10-Q, file No. 1-11727, filed April 14, 2004)
|
|
|
3.9
|
Third Amended and Restated Agreement of Limited Partnership of Energy Transfer Partners GP, L.P. (incorporated by reference to Exhibit 3.5 of Form 10-Q, file No. 1-11727, filed July 10, 2007)
|
|
|
3.10
|
Fourth Amended and Restated Limited Liability Company Agreement of Energy Transfer Partners, L.L.C. (incorporated by reference to Exhibit 3.6 of Form 8-K, file No. 1-11727, filed August 10, 2010)
|
|
|
3.11
|
Certificate of Formation of Energy Transfer Partners, L.L.C. (incorporated by reference to Exhibit 3.13 of Form S-1/A, file No. 333-128097, filed December 20, 2005)
|
|
|
3.11.1
|
Certificate of Amendment of Energy Transfer Partners, L.L.C. (incorporated by reference to Exhibit 3.13.1 of Form S-1/A, file No. 333-128097, filed December 20, 2005)
|
|
|
3.12
|
Restated Certificate of Limited Partnership of Energy Transfer Partners GP, L.P. (incorporated by reference to Exhibit 3.14 of Form S-1/A, file No. 333-128097, filed December 20, 2005)
|
|
|
3.13
|
Second Amendment to Amended and Restated Limited Liability Company Agreement of Regency GP, L.L.C. (incorporated by reference to Exhibit 3.2 of Form 8-K, file No. 1-32740, filed August 10, 2010)
|
|
|
3.7.1
|
Amendment No. 1, dated March 26, 2012, to the Second Amended and Restated Agreement of Limited Partnership of Energy Transfer Partners, L.P., dated July 28, 2009 (incorporated by reference to Exhibit 3.1 of Form 8-K, file No. 1-32740, filed March 28, 2012)
|
|
|
3.9.1
|
Amendment No. 2, dated March 26, 2012, to Third Amended and Restated Agreement of Limited Partnership of Energy Transfer Partners GP, L.P., dated April 17, 2007 (incorporated by reference to Exhibit 3.2 of Form 8-K, file No. 1-32740, filed March 28, 2012)
|
|
|
3.10.1
|
Amendment No. 1, dated March 26, 2012, to the Fourth Amended and Restated Agreement of Limited Liability Company Agreement of Energy Transfer Partners, L.L.C., dated August 10, 2010 (incorporated by reference to Exhibit 3.3 of Form 8-K, file No. 1-32740, filed March 28, 2012)
|
|
|
3.7.2
|
Amendment No. 4, dated April 30, 2013, to the Second Amended and Restated Agreement of Limited Partnership of Energy Transfer Partners, L.P., as amended (incorporated by reference to Exhibit 3.1 of Form 8-K, file No. 1-32740, filed May 1, 2013)
|
|
|
4.1
|
Indenture dated January 18, 2005 among Energy Transfer Partners, L.P., the subsidiary guarantors named therein and Wachovia Bank, National Association, as trustee (incorporated by reference to Exhibit 4.1 of Form 8-K, file No. 1-11727, filed January 19, 2005)
|
|
|
4.2
|
First Supplemental Indenture dated January 18, 2005, among Energy Transfer Partners, L.P., the subsidiary guarantors named therein and Wachovia Bank, National Association, as trustee (incorporated by reference to Exhibit 4.2 of Form 8-K, file No. 1-11727, filed January 19, 2005)
|
|
|
4.3
|
Second Supplemental Indenture dated as of February 24, 2005 to Indenture dated as of January 18, 2005 (incorporated by reference to Exhibit 10.45 of Form 10-Q, file No. 1-11727, filed April 11, 2005)
|
|
|
4.4
|
Notation of Guarantee (incorporated by reference to Exhibit 10.46 of Form 10-Q, file No. 1-11727, filed April 11, 2005)
|
|
|
4.5
|
Registration Rights Agreement dated January 18, 2005, among Energy Transfer Partners, L.P., the subsidiary guarantors named therein and the initial purchasers party thereto (incorporated by reference to Exhibit 4.3 of Form 8-K, file No. 1-11727, filed January 19, 2005)
|
|
|
4.6
|
Joinder to Registration Rights Agreement dated February 24, 2005, among Energy Transfer Partners, L.P., the Subsidiary Guarantors and Wachovia Bank, National Association, as trustee (incorporated by reference to Exhibit 10.39.1 of Form 10-Q, file No. 1-11727, filed April 11, 2005)
|
|
|
4.7
|
Third Supplemental Indenture dated July 29, 2005, to Indenture dated January 18, 2005, among Energy Transfer Partners, L.P., the subsidiary guarantors named therein, and Wachovia Bank, National Association, as trustee (incorporated by reference to Exhibit 4.1 of Form 8-K, file No. 1-11727, filed August 2, 2005)
|
|
E-
2
|
Exhibit
Number
|
||
|
4.8
|
Registration Rights Agreement dated July 29, 2005, among Energy Transfer Partners, L.P., the subsidiary guarantors named therein, and the initial purchasers party thereto (incorporated by reference to Exhibit 4.2 of Form 8-K, file No. 1-11727, filed August 2, 2005)
|
|
|
4.9
|
Form of Senior Indenture of Energy Transfer Partners, L.P. (incorporated by reference to Exhibit 4.9 of Form S-3, file No. 333-136429, filed August 9, 2006)
|
|
|
4.10
|
Form of Subordinated Indenture of Energy Transfer Partners, L.P. (incorporated by reference to Exhibit 4.10 of Form S-3, file No. 333-136429, filed August 9, 2006)
|
|
|
4.11
|
Fourth Supplemental Indenture dated as of June 29, 2006 to Indenture dated January 18, 2005, among Energy Transfer Partners, L.P., the subsidiary guarantors named therein and Wachovia Bank, National Association, as trustee (incorporated by reference to Exhibit 4.13 of Form 10-K, file No. 1-11727, filed November 13, 2006)
|
|
|
4.12
|
Fifth Supplemental Indenture dated as of October 23, 2006 to Indenture dated January 18, 2005, among Energy Transfer Partners, L.P., the subsidiary guarantors named therein and Wachovia Bank, National Association, as trustee (incorporated by reference to Exhibit 4.1 of Form 8-K, file No. 1-11727, filed October 25, 2006)
|
|
|
4.13
|
Sixth Supplemental Indenture dated March 28, 2008, by and between Energy Transfer Partners, L.P., as issuer, and U.S. Bank National Association (as successor to Wachovia Bank, National Association), as trustee (incorporated by reference to Exhibit 4.2 of Form 8-K, file No. 1-11727, filed March 28, 2008)
|
|
|
4.14
|
Seventh Supplemental Indenture dated December 23, 2008, by and between Energy Transfer Partners, L.P., as issuer, and U.S. Bank National Association (as successor to Wachovia Bank, National Association), as trustee (incorporated by reference to Exhibit 4.2 of Form 8-K, file No. 1-11727, filed December 23, 2008)
|
|
|
4.15
|
Eighth Supplemental Indenture dated April 7, 2009, by and between Energy Transfer Partners, L.P., as issuer, and U.S. Bank National Association (as successor to Wachovia Bank, National Association), as trustee (incorporated by reference to Exhibit 4.2 of Form 8-K, file No. 1-11727, filed April 7, 2009)
|
|
|
4.16
|
Energy Transfer Partners, L.P. 2008 Long-Term Incentive Plan (incorporated by reference to Exhibit A of Form DEF 14A, file No. 1-11727, filed November 21, 2008)
|
|
|
4.17
|
Registration Rights Agreement by and among Energy Transfer Equity, L.P. and Regency GP Acquirer, L.P., dated as of May 26, 2010 (incorporated by reference to Exhibit 4.14 of Form 8-K, file No. 1-32740, filed June 2, 2010)
|
|
|
4.18
|
Indenture dated September 20, 2010 between Energy Transfer Equity, L.P. and U.S. Bank National Association, as trustee (incorporated by reference to Exhibit 4.14 of Form 8-K, file No. 1-32740, filed September 20, 2010)
|
|
|
4.19
|
First Supplemental Indenture dated September 20, 2010 between Energy Transfer Equity, L.P. and U.S. Bank National Association, as trustee (including form of the Notes) (incorporated by reference to Exhibit 4.15 of Form 8-K, file No. 1-32740, filed September 20, 2010)
|
|
|
4.20
|
Second Supplemental Indenture dated as of February 16, 2012, between Energy Transfer Equity, L.P., and U.S. Bank National Association (incorporated by reference to Exhibit 4.1 of Form 8-K, file No. 1-32740, filed February 17, 2012)
|
|
|
4.21
|
Third Supplemental Indenture dated April 24, 2012 to Indenture dated September 20, 2010 between Energy Transfer Equity, L.P. and US Bank National Association, as trustee (incorporated by reference to Exhibit 4.2 of Form 10-Q, file No. 1-32740, filed August 8, 2012)
|
|
|
4.22
|
Registration Rights Agreement, dated April 30, 2013, by and between Energy Transfer Partners, L.P. and Energy Transfer Equity, L.P. (incorporated by reference to Exhibit 4.1 of Form 8-K, file No. 1-32740, filed May 1, 2013)
|
|
|
4.23
|
Fourth Supplemental Indenture dated December 2, 2013 between Energy Transfer Equity, L.P. and U.S. Bank National Association, as trustee (including form of the Notes) (incorporated by reference to Exhibit 4.2 of Form 8-K, file No. 1-32740, filed December 2, 2013)
|
|
|
4.24
|
Fifth Supplemental Indenture dated May 28, 2014 (incorporated by reference to Exhibit 4.2 of Form 8-K, file No. 1-32470, filed May 28, 2014)
|
|
|
4.25
|
Sixth Supplemental Indenture dated May 28, 2014 (incorporated by reference to Exhibit 4.3 of Form 8-K, file No. 1-32470, filed May 28, 2014)
|
|
|
10.1
|
Purchase and Sale Agreement dated January 26, 2005, among HPL Storage, LP and AEP Energy Services Gas Holding Company II, L.L.C., as Sellers, and LaGrange Acquisition, L.P., as Buyer (incorporated by reference to Exhibit 10.1 of Form 8-K, file No. 1-11727, filed February 1, 2005)
|
|
|
10.2
|
Cushion Gas Litigation Agreement dated January 26, 2005, among AEP Energy Services Gas Holding Company II, L.L.C. and HPL Storage LP, as Sellers, and LaGrange Acquisition, L.P., as Buyer, and AEP Asset Holdings LP, AEP Leaseco LP, Houston Pipe Line Company, LP and HPL Resources Company LP, as Companies (incorporated by reference to Exhibit 10.2 of Form 8-K, file No. 1-11727, filed February 1, 2005)
|
|
E-
3
|
Exhibit
Number
|
||
|
10.3.1
|
+
|
Energy Transfer Partners, L.P. Amended and Restated 2004 Unit Plan (incorporated by reference to Exhibit 10.6.6 of Form 10-Q, file No. 1-11727, filed August 11, 2008)
|
|
10.3.2
|
+
|
Energy Transfer Partners, L.P. Second Amended and Restated 2008 Long Term Incentive Plan (incorporated by reference to Exhibit 10.1 of Form 10-K, file No. 1-11727, filed February 26, 2015)
|
|
10.3.3
|
+
|
Energy Transfer Partners Deferred Compensation Plan (incorporated by reference to Exhibit 10.1 of Form 8-K, file No. 1-11727, filed March 31, 2010)
|
|
10.3.4
|
+
|
Form of Grant Agreement under the Energy Transfer Partners, L.P. Amended and Restated 2004 Unit Plan and the Energy Transfer Partners, L.P. 2008 Long-Term Incentive Plan (incorporated by reference to Exhibit 10.1 of Form 8-K, file No. 1-11727, filed November 1, 2004)
|
|
10.3.5
|
+
|
Energy Transfer Partners, L.P. Annual Bonus Plan (incorporated by reference to Exhibit 10.2 of Form 10-Q, file No. 1-11727, filed August 7, 2014)
|
|
10.4
|
Registration Rights Agreement for Limited Partner Interests of Heritage Propane Partners, L.P. (incorporated by reference to Exhibit 4.1 of Form 8-K, file No. 1-11727, filed February 13, 2002)
|
|
|
10.5
|
Unitholder Rights Agreement dated January 20, 2004, among Heritage Propane Partners, L.P., Heritage Holdings, Inc., TAAP LP and LaGrange Energy, L.P. (incorporated by reference to Exhibit 4.2 of Form 10-Q, file No. 1-11727, filed April 14, 2004)
|
|
|
10.6
|
Registration Rights Agreement for Limited Partnership Units of LaGrange Energy, L.P. (incorporated by reference to Exhibit 10.47 of Form S-1, file No. 333-128097, filed October 13, 2005)
|
|
|
10.7
|
+
|
Energy Transfer Equity, L.P. Long-Term Incentive Plan (incorporated by reference to Exhibit 10.25 of Form S-1, file No. 333-128097, filed December 20, 2005)
|
|
10.8
|
+
|
Form of Director and Officer Indemnification Agreement (incorporated by reference to Exhibit 10.26 of Form S-1, file No. 333-128097, filed December 20, 2005)
|
|
10.9
|
Second Amended and Restated Credit Agreement, dated October 27, 2011, among Energy Transfer Partners, L.P., the borrower, and Wachovia Bank, National Association, as administrative agent, LC issuer and swingline lender, Bank of America, N.A., as syndication agent, BNP Paribas, JPMorgan Chase Bank, N.A. and the Royal Bank of Scotland PLC, as co-documentation agents, and Citibank, N.A., Credit Suisse, Cayman Islands Branch, Deutsche Bank Securities, Inc., Morgan Stanley Bank, Suntrust Bank and UBS Securities, LLC, as senior managing agents, and other lenders party hereto (incorporated by reference to Exhibit 10.1 of Form 8-K, file No. 1-11727, filed November 2, 2011)
|
|
|
10.10
|
Contribution and Conveyance Agreement, dated November 1, 2006, between Energy Transfer Equity, L.P., and Energy Transfer Partners, L.P. (incorporated by reference to Exhibit 10.35 of Form 10-K, file No. 1-32740, filed November 29, 2006)
|
|
|
10.11
|
Contribution, Assumption and Conveyance Agreement, dated November 1, 2006, between Energy Transfer Equity, L.P., and Energy Transfer Investments, L.P. (incorporated by reference to Exhibit 10.36 of Form 10-K, file No. 1-32740, filed November 29, 2006)
|
|
|
10.12
|
Registration Rights Agreement, dated November 1, 2006, between Energy Transfer Partners, L.P. and Energy Transfer Equity, L.P. (incorporated by reference to Exhibit 3.1.10 of Form 8-K, file No. 1-11727, filed November 3, 2006)
|
|
|
10.13
|
Registration Rights Agreement, dated November 1, 2006, between Energy Transfer Equity, L.P. and Energy Transfer Investments, L.P. (incorporated by reference to Exhibit 10.38 of Form 10-K, file No. 1-32740, filed November 29, 2006)
|
|
|
10.14
|
Purchase and Sale Agreement, dated as of September 14, 2006, among Energy Transfer Partners, L.P. and EFS-PA, LLC (a/k/a GE Energy Financial Services), CDPQ Investments (U.S.) Inc., Lake Bluff, Inc., Merrill Lynch Ventures, L.P. and Kings Road Holding I LLC (incorporated by reference to Exhibit 10.1 of Form 8-K, file No. 1-11727, filed September 18, 2006)
|
|
|
10.15
|
Redemption Agreement, dated September 14, 2006, between Energy Transfer Partners, L.P. and CCE Holdings, LLC (incorporated by reference to Exhibit 10.2 of Form 8-K, file No. 1-11727, filed September 18, 2006)
|
|
|
10.16
|
Letter Agreement, dated September 14, 2006, between Energy Transfer Partners, L.P. and Southern Union Company (incorporated by reference to Exhibit 10.3 of Form 8-K, file No. 1-11727, filed September 18, 2006)
|
|
|
10.17
|
Registration Rights Agreement, dated November 27, 2006, by and among Energy Transfer Equity, L.P. and certain investors named therein (incorporated by reference to Exhibit 99.1 of Form 8-K, file No. 1-32740, filed November 30, 2006)
|
|
|
10.18
|
+
|
LE GP, LLC Outside Director Compensation Policy (incorporated by reference to Exhibit 99.1 of Form 8-K, file No. 1-32740, filed December 26, 2006)
|
|
10.19
|
Registration Rights Agreement, dated March 2, 2007, by and among Energy Transfer Equity, L.P. and certain investors named therein (incorporated by reference to Exhibit 99.1 of Form 8-K, file No. 1-32740, filed March 5, 2007)
|
|
E-
4
|
Exhibit
Number
|
||
|
10.20
|
Unitholder Rights and Restrictions Agreement, dated as of May 7, 2007, by and among Energy Transfer Equity, L.P., Ray C. Davis, Natural Gas Partners VI, L.P. and Enterprise GP Holdings, L.P. (incorporated by reference to Exhibit 10.45 of Form 8-K, file No. 1-32740, filed May 7, 2007)
|
|
|
10.21
|
Note Purchase Agreement, dated as of November 17, 2004, by and among Transwestern Pipeline Company, LLC and the Purchasers parties thereto (incorporated by reference to Exhibit 10.55 of Form 10-Q, file No. 1-11727, filed July 10, 2007)
|
|
|
10.21.1
|
Amendment No. 1 to the Note Purchase Agreement, dated as of April 18, 2007, by and among Transwestern Pipeline Company, LLC and the Purchasers parties thereto (incorporated by reference to Exhibit 10.55.1 of Form 10-Q, file No. 1-11727, filed July 10, 2007)
|
|
|
10.22
|
Note Purchase Agreement, dated as of May 24, 2007, by and among Transwestern Pipeline Company, LLC and the Purchasers parties thereto (incorporated by reference to Exhibit 10.56 of Form 10-Q, file No. 1-11727, filed July 10, 2007)
|
|
|
10.23
|
Second Amended and Restated Support Agreement, dated as of July 19, 2011, by and among, Energy Transfer Equity, L.P., Sigma Acquisition Corporation and certain stockholders of Southern Union Company (incorporated by reference to Exhibit 10.1 of Form 8-K, file No. 1-32740, filed July 20, 2011)
|
|
|
10.24
|
Guarantee of Collection, made as of March 26, 2012, by Citrus ETP Finance LLC, to Energy Transfer Partners, L.P. under the Indenture dated as of January 18, 2005, as supplemented by the Tenth Supplemental Indenture dated as of January 17, 2012 (incorporated by reference to Exhibit 10.1 of Form 8-K, file No. 1-32740, filed March 28, 2012)
|
|
|
10.25
|
Support Agreement, dated March 26, 2012, by and among PEPL Holdings, LLC, Energy Transfer Partners, L.P. and Citrus ETP Finance LLC (incorporated by reference to Exhibit 10.2 of Form 8-K, file No. 1-32740, filed March 28, 2012)
|
|
|
10.26
|
Letter Agreement, dated as of April 29, 2012, by and among Energy Transfer Partners, L.P. and Energy Transfer Equity, L.P. (incorporated by reference to Exhibit 10.1 of Form 8-K, file No. 1-32740, filed May 1, 2012)
|
|
|
10.27
|
Purchase and Sale Agreement dated as of December 14, 2012 among Southern Union Company, Plaza Missouri Acquisition, Inc. and for certain limited purposes The Laclede Group, Inc. (incorporated by reference to Exhibit 10.1 of Form 8-K, file No. 1-32740, filed December 17, 2012)
|
|
|
10.28
|
Purchase and Sale Agreement dated as of December 14, 2012 among Southern Union Company, Plaza Massachusetts Acquisition, Inc. and for certain limited purposes The Laclede Group, Inc. (incorporated by reference to Exhibit 10.2 of Form 8-K, file No. 1-32740, filed December 17, 2012)
|
|
|
10.29
|
First Amendment, dated April 30, 2013, to the Services Agreement, effective as of May 26, 2010, by and among Energy Transfer Equity, L.P., ETE Services Company LLC and Regency Energy Partners LP (incorporated by reference to Exhibit 10.1 of Form 8-K, file No. 1-32740, filed May 1, 2013)
|
|
|
10.30
|
Second Amendment, dated April 30, 2013, to the Shared Services Agreement dated as of August 26, 2005, as amended May 26, 2010, by and between Energy Transfer Equity, L.P. and Energy Transfer Partners, L.P.(incorporated by reference to Exhibit 10.2 of Form 8-K, file No. 1-32740, filed May 1, 2013)
|
|
|
10.31
|
Exchange and Redemption Agreement by and among Energy Transfer Partners, L.P., Energy Transfer Equity, L.P. and ETE Common Holdings, LLC dated August 7, 2013 (incorporated by reference to Exhibit 10.1 of Form 8-K, file No. 1-32740, filed August 8, 2013)
|
|
|
10.32
|
Credit Agreement dated as of December 2, 2013 among Energy Transfer Equity, L.P., Credit Suisse AG, Cayman Islands Branch, as administrative agent, and the other lenders party thereto (incorporated by reference to Exhibit 10.1 of Form 8-K, file No. 1-32740, filed December 2, 2013)
|
|
|
10.33
|
Senior Secured Term Loan Agreement dated as of December 2, 2013 among Energy Transfer Equity, L.P., Credit Suisse AG, Cayman Islands Branch, as administrative agent, and the other lenders party thereto (incorporated by reference to Exhibit 10.2 of Form 8-K, file No. 1-32740, filed December 2, 2013)
|
|
|
10.34
|
Second Amended and Restated Pledge and Security Agreement dated December 2, 2013 among Energy Transfer Equity, L.P., the other grantors named therein and U.S. Bank National Association, as collateral agent (incorporated by reference to Exhibit 10.3 of Form 8-K, file No. 1-32740, filed December 2, 2013)
|
|
|
10.35
|
Class D Unit Agreement (incorporated by reference to Exhibit 10.1 of Form 8-K, file No. 1-32740, filed December 27, 2013)
|
|
|
10.36
|
Third Amendment, dated February 19, 2014, to the Shared Services Agreement dated as of August 26, 2005, as amended May 26, 2010 and April 30, 2013 by and between Energy Transfer Equity, L.P. and Energy Transfer Partners, L.P. (incorporated by reference to Exhibit 10.1 of Form 8-K, file No. 1-32740, filed February 19, 2014)
|
|
|
10.37
|
Common Unit Purchase Agreement, dated June 4, 2014 (incorporated by reference to Exhibit 10.1 of Form 8-K, file No. 1-32740, filed June 5, 2014)
|
|
|
10.38
|
Registration Rights Agreement, dated June 4, 2014 (incorporated by reference to Exhibit 10.2 of Form 8-K, file No. 1-32740, filed June 5, 2014)
|
|
E-
5
|
Exhibit
Number
|
||
|
10.39
|
+
|
Energy Transfer Partners, L.L.C. Annual Bonus Plan effective January 1, 2014 (incorporated by reference to Exhibit 10.2 of Form 10-Q, file No. 1-11727, filed August 7, 2014)
|
|
10.40
|
Energy Transfer Equity, L.P. Incremental Loan Agreement No. 1, dated April 16, 2014 (incorporated by reference to Exhibit 10.5 of Form 10-Q, file No. 1-32470, filed August 7, 2014)
|
|
|
10.41
|
Energy Transfer Equity, L.P. Amendment and Incremental Commitment Agreement No. 2, dated May 6, 2014 (incorporated by reference to Exhibit 10.6 of Form 10-Q, file No. 1-32470, filed August 7, 2014)
|
|
|
10.42
|
Exchange and Repurchase Agreement, by and among Energy Transfer Partners, L.P., Energy Transfer Equity, L.P. and ETE Common Holdings, LLC, dated December 23, 2014 (incorporated by reference to Exhibit 10.1 of Form 8-K, file No. 1-32470, filed December 29, 2014)
|
|
|
10.43
|
Amendment and Incremental Commitment Agreement No. 3 dated as of February 10, 2015 among Energy Transfer Equity, L.P., Credit Suisse AG, Cayman Islands Branch, as administrative agent, and the other lenders party thereto (incorporated by reference to Exhibit 10.1 of Form 8-K, file No. 1-32740, filed February 17, 2015)
|
|
|
12.1*
|
Computation of Ratio of Earnings to Fixed Charges.
|
|
|
21.1*
|
List of Subsidiaries.
|
|
|
23.1*
|
Consent of Grant Thornton LLP related to Energy Transfer Equity, L.P.
|
|
|
23.2*
|
Consent to Grant Thornton LLP related to Energy Transfer Partners, L.P.
|
|
|
23.3*
|
Consent of Grant Thornton LLP related to Regency Energy Partners LP.
|
|
|
23.4*
|
Consent of Grant Thornton LLP related to RIGS Haynesville Partnership Co.
|
|
|
23.5*
|
Consent of Ernst & Young LLP related to Sunoco Logistics Partners L.P.
|
|
|
23.6*
|
Consent of Ernst & Young LLP related to Susser Holdings Corporation.
|
|
|
23.7*
|
Consent of Ernst & Young LLP related to Sunoco LP.
|
|
|
23.8*
|
Consent of PricewaterhouseCoopers LLP related to Midcontinent Express Pipeline LLC.
|
|
|
23.9*
|
Consent of KMPG LLP related to the Midstream Assets of Eagle Rock Energy Partners, L.P.
|
|
|
31.1*
|
Certification of President (Principal Executive Officer) pursuant to Section 302 of the Sarbanes-Oxley Act of 2002.
|
|
|
31.2*
|
Certification of Chief Financial Officer pursuant to Section 302 of the Sarbanes-Oxley Act of 2002.
|
|
|
32.1**
|
Certification of President (Principal Executive Officer) pursuant to 18 U.S.C. Section 1350, as adopted pursuant to Section 906 of the Sarbanes-Oxley Act of 2002.
|
|
|
32.2**
|
Certification Chief Financial Officer pursuant to 18 U.S.C. Section 1350, as adopted pursuant to Section 906 of the Sarbanes-Oxley Act of 2002.
|
|
|
99.1*
|
Report of Independent Registered Public Accounting Firm — Ernst & Young LLP opinion on consolidated financial statements of Sunoco Logistics Partners LP.
|
|
|
99.2*
|
Report of Independent Registered Public Accounting Firm — Ernst & Young LLP opinion on consolidated financial statements of Susser Holdings Corporation.
|
|
|
99.3*
|
Report of Independent Registered Public Accounting Firm — Ernst & Young LLP opinion on consolidated financial statements of Sunoco LP.
|
|
|
99.4
|
Audited financial statements of RIGS Haynesville Partnership Co. as of December 31, 2014 and 2013 and for the years ended December 31, 2014, 2013 and 2012 (incorporated by reference to Exhibit 99.2 of Regency Energy Partners LP Form 10-K, File No 1-35262, filed February 27, 2015)
|
|
|
99.5
|
Audited financial statements of Midcontinent Express Pipeline LLC as of December 31, 2014 and 2013 and for the years ended December 31, 2014, 2013 and 2012 (incorporated by reference to Exhibit 99.3 of Regency Energy Partners LP Form 10-K, File No. 1-35262, filed February 27, 2015)
|
|
|
99.6
|
Audited financial statements of the Midstream Assets of Eagle Rock Energy Partners, L.P. as of December 31, 2013 and December 21, 2012 and for the three years ended December 31, 2013 (incorporated by reference to Exhibit 99.5 of Regency Energy Partners LP Form 10-K, File No. 1-35262, filed February 26, 2015)
|
|
|
99.7
|
Statement of Policies Relating to Potential Conflicts among Energy Transfer Partners, L.P., Energy Transfer Equity, L.P. and Regency Energy Partners LP dated as of April 26, 2011 (incorporated by reference to Exhibit 99.1 of Form 10-Q, file No. 1-32740, filed August 8, 2011)
|
|
|
101*
|
Interactive data files pursuant to Rule 405 of Regulation S-T: (i) our Consolidated Balance Sheets as of December 31, 2014 and December 31, 2013; (ii) our Consolidated Statements of Operations for the years ended December 31, 2014, 2013 and 2012; (iii) our Consolidated Statements of Comprehensive Income for years ended December 31, 2014, 2013 and 2012; (iv) our Consolidated Statement of Equity for the years ended December 31, 2014, 2013 and 2012; and (v) our Consolidated Statements of Cash Flows for the years ended December 31, 2014, 2013 and 2012.
|
|
|
*
|
Filed herewith.
|
|
**
|
Furnished herewith.
|
|
+
|
Denotes a management contract or compensatory plan or arrangement.
|
E-
6
INDEX TO FINANCIAL STATEMENTS
Energy Transfer Equity, L.P. and Subsidiaries
|
|
Page
|
F - 1
REPORT OF INDEPENDENT REGISTERED PUBLIC ACCOUNTING FIRM
Partners
Energy Transfer Equity, L.P.
We have audited the accompanying consolidated balance sheets of Energy Transfer Equity, L.P. (a Delaware limited partnership) and subsidiaries (the “Partnership”) as of December 31, 2014 and 2013, and the related consolidated statements of operations, comprehensive income, equity, and cash flows for each of the three years in the period ended December 31, 2014. These financial statements are the responsibility of the Partnership’s management. Our responsibility is to express an opinion on these financial statements based on our audits. We did not audit the financial statements of Sunoco LP and Susser Holdings Corporation, both consolidated subsidiaries, as of December 31, 2014 and for the period from September 1, 2014 to December 31, 2014, whose combined statements reflect total assets constituting 7 percent of consolidated total assets as of December 31, 2014, and total revenues of 5 percent of consolidated total revenues for the year then ended. Those statements were audited by other auditors, whose reports have been furnished to us, and our opinion, insofar as it relates to the amounts included for Sunoco LP and Susser Holdings Corporation, is based solely on the reports of the other auditors. We did not audit the financial statements of Sunoco Logistics Partners L.P., a consolidated subsidiary, for the period from October 5, 2012 to December 31, 2012, which statements reflect revenues of 19 percent of consolidated total revenues for the year ended December 31, 2012. Those statements were audited by other auditors, whose report has been furnished to us, and our opinion, insofar as it relates to the amounts included for Sunoco Logistics Partners L.P. for the period from October 5, 2012 to December 31, 2012, is based solely on the report of the other auditors.
We conducted our audits in accordance with the standards of the Public Company Accounting Oversight Board (United States). Those standards require that we plan and perform the audit to obtain reasonable assurance about whether the financial statements are free of material misstatement. An audit includes examining, on a test basis, evidence supporting the amounts and disclosures in the financial statements. An audit also includes assessing the accounting principles used and significant estimates made by management, as well as evaluating the overall financial statement presentation. We believe that our audits and the reports of the other auditors provide a reasonable basis for our opinion.
In our opinion, based on our audits and the reports of the other auditors, the consolidated financial statements referred to above present fairly, in all material respects, the financial position of Energy Transfer Equity, L.P. and subsidiaries as of December 31, 2014 and 2013, and the results of their operations and their cash flows for each of the three years in the period ended December 31, 2014 in conformity with accounting principles generally accepted in the United States of America.
We also have audited, in accordance with the standards of the Public Company Accounting Oversight Board (United States), the Partnership’s internal control over financial reporting as of December 31, 2014, based on criteria established in the 2013
Internal Control-Integrated Framework
issued by the Committee of Sponsoring Organizations of the Treadway Commission (COSO), and our report dated
March 2, 2015
expressed an unqualified opinion thereon.
/s/ GRANT THORNTON LLP
Dallas, Texas
March 2, 2015
F - 2
ENERGY TRANSFER EQUITY, L.P. AND SUBSIDIARIES
(Dollars in millions)
|
|
December 31,
|
||||||
|
|
2014
|
2013
|
|||||
|
ASSETS
|
|||||||
|
CURRENT ASSETS:
|
|||||||
|
Cash and cash equivalents
|
$
|
847
|
|
$
|
590
|
|
|
|
Accounts receivable, net
|
3,378
|
|
3,658
|
|
|||
|
Accounts receivable from related companies
|
35
|
|
63
|
|
|||
|
Inventories
|
1,467
|
|
1,807
|
|
|||
|
Exchanges receivable
|
44
|
|
67
|
|
|||
|
Price risk management assets
|
81
|
|
39
|
|
|||
|
Other current assets
|
301
|
|
312
|
|
|||
|
Total current assets
|
6,153
|
|
6,536
|
|
|||
|
PROPERTY, PLANT AND EQUIPMENT
|
45,018
|
|
33,917
|
|
|||
|
ACCUMULATED DEPRECIATION AND DEPLETION
|
(4,726
|
)
|
(3,235
|
)
|
|||
|
40,292
|
|
30,682
|
|
||||
|
ADVANCES TO AND INVESTMENTS IN UNCONSOLIDATED AFFILIATES
|
3,659
|
|
4,014
|
|
|||
|
NON-CURRENT PRICE RISK MANAGEMENT ASSETS
|
10
|
|
18
|
|
|||
|
GOODWILL
|
7,865
|
|
5,894
|
|
|||
|
INTANGIBLE ASSETS, net
|
5,582
|
|
2,264
|
|
|||
|
OTHER NON-CURRENT ASSETS, net
|
908
|
|
922
|
|
|||
|
Total assets
|
$
|
64,469
|
|
$
|
50,330
|
|
|
The accompanying notes are an integral part of these consolidated financial statements.
F - 3
ENERGY TRANSFER EQUITY, L.P. AND SUBSIDIARIES
CONSOLIDATED BALANCE SHEETS
(Dollars in millions)
|
|
December 31,
|
||||||
|
|
2014
|
2013
|
|||||
|
LIABILITIES AND EQUITY
|
|||||||
|
CURRENT LIABILITIES:
|
|||||||
|
Accounts payable
|
$
|
3,349
|
|
$
|
3,834
|
|
|
|
Accounts payable to related companies
|
19
|
|
14
|
|
|||
|
Exchanges payable
|
184
|
|
284
|
|
|||
|
Price risk management liabilities
|
21
|
|
53
|
|
|||
|
Accrued and other current liabilities
|
2,201
|
|
1,678
|
|
|||
|
Current maturities of long-term debt
|
1,008
|
|
637
|
|
|||
|
Total current liabilities
|
6,782
|
|
6,500
|
|
|||
|
LONG-TERM DEBT, less current maturities
|
29,653
|
|
22,562
|
|
|||
|
DEFERRED INCOME TAXES
|
4,325
|
|
3,865
|
|
|||
|
NON-CURRENT PRICE RISK MANAGEMENT LIABILITIES
|
154
|
|
73
|
|
|||
|
OTHER NON-CURRENT LIABILITIES
|
1,193
|
|
1,019
|
|
|||
|
COMMITMENTS AND CONTINGENCIES (Note 12)
|
|
|
|
|
|||
|
REDEEMABLE NONCONTROLLING INTERESTS
|
15
|
|
—
|
|
|||
|
PREFERRED UNITS OF SUBSIDIARY (Note 7)
|
33
|
|
32
|
|
|||
|
EQUITY:
|
|||||||
|
General Partner
|
(1
|
)
|
(3
|
)
|
|||
|
Limited Partners:
|
|||||||
|
Common Unitholders (538,766,899 and 559,923,300 units authorized, issued and outstanding as of December 31, 2014 and 2013, respectively)
|
648
|
|
1,066
|
|
|||
|
Class D Units (1,540,000 units authorized, issued and outstanding)
|
22
|
|
6
|
|
|||
|
Accumulated other comprehensive income (loss)
|
(5
|
)
|
9
|
|
|||
|
Total partners’ capital
|
664
|
|
1,078
|
|
|||
|
Noncontrolling interest
|
21,650
|
|
15,201
|
|
|||
|
Total equity
|
22,314
|
|
16,279
|
|
|||
|
Total liabilities and equity
|
$
|
64,469
|
|
$
|
50,330
|
|
|
The accompanying notes are an integral part of these consolidated financial statements.
F - 4
ENERGY TRANSFER EQUITY, L.P. AND SUBSIDIARIES
(Dollars in millions, except per unit data)
|
|
Years Ended December 31,
|
||||||||||
|
|
2014
|
2013
|
2012
|
||||||||
|
REVENUES:
|
|||||||||||
|
Natural gas sales
|
$
|
5,386
|
|
$
|
3,842
|
|
$
|
2,705
|
|
||
|
NGL sales
|
5,845
|
|
3,618
|
|
2,253
|
|
|||||
|
Crude sales
|
16,416
|
|
15,477
|
|
2,872
|
|
|||||
|
Gathering, transportation and other fees
|
3,733
|
|
3,097
|
|
2,386
|
|
|||||
|
Refined product sales
|
19,437
|
|
18,479
|
|
5,299
|
|
|||||
|
Other
|
4,874
|
|
3,822
|
|
1,449
|
|
|||||
|
Total revenues
|
55,691
|
|
48,335
|
|
16,964
|
|
|||||
|
COSTS AND EXPENSES:
|
|||||||||||
|
Cost of products sold
|
48,389
|
|
42,554
|
|
13,088
|
|
|||||
|
Operating expenses
|
2,127
|
|
1,695
|
|
1,118
|
|
|||||
|
Depreciation, depletion and amortization
|
1,724
|
|
1,313
|
|
871
|
|
|||||
|
Selling, general and administrative
|
611
|
|
533
|
|
527
|
|
|||||
|
Goodwill impairments
|
370
|
|
689
|
|
—
|
|
|||||
|
Total costs and expenses
|
53,221
|
|
46,784
|
|
15,604
|
|
|||||
|
OPERATING INCOME
|
2,470
|
|
1,551
|
|
1,360
|
|
|||||
|
OTHER INCOME (EXPENSE):
|
|||||||||||
|
Interest expense, net of interest capitalized
|
(1,369
|
)
|
(1,221
|
)
|
(1,018
|
)
|
|||||
|
Bridge loan related fees
|
—
|
|
—
|
|
(62
|
)
|
|||||
|
Equity in earnings of unconsolidated affiliates
|
332
|
|
236
|
|
212
|
|
|||||
|
Gain on deconsolidation of Propane Business
|
—
|
|
—
|
|
1,057
|
|
|||||
|
Gain on sale of AmeriGas common units
|
177
|
|
87
|
|
—
|
|
|||||
|
Losses on extinguishments of debt
|
(25
|
)
|
(162
|
)
|
(123
|
)
|
|||||
|
Gains (losses) on interest rate derivatives
|
(157
|
)
|
53
|
|
(19
|
)
|
|||||
|
Non-operating environmental remediation
|
—
|
|
(168
|
)
|
—
|
|
|||||
|
Other, net
|
(11
|
)
|
(1
|
)
|
30
|
|
|||||
|
INCOME FROM CONTINUING OPERATIONS BEFORE INCOME TAX EXPENSE
|
1,417
|
|
375
|
|
1,437
|
|
|||||
|
Income tax expense from continuing operations
|
357
|
|
93
|
|
54
|
|
|||||
|
INCOME FROM CONTINUING OPERATIONS
|
1,060
|
|
282
|
|
1,383
|
|
|||||
|
Income (loss) from discontinued operations
|
64
|
|
33
|
|
(109
|
)
|
|||||
|
NET INCOME
|
1,124
|
|
315
|
|
1,274
|
|
|||||
|
LESS: NET INCOME ATTRIBUTABLE TO NONCONTROLLING INTEREST
|
491
|
|
119
|
|
970
|
|
|||||
|
NET INCOME ATTRIBUTABLE TO PARTNERS
|
633
|
|
196
|
|
304
|
|
|||||
|
GENERAL PARTNER’S INTEREST IN NET INCOME
|
2
|
|
—
|
|
2
|
|
|||||
|
CLASS D UNITHOLDER’S INTEREST IN NET INCOME
|
2
|
|
—
|
|
—
|
|
|||||
|
LIMITED PARTNERS’ INTEREST IN NET INCOME
|
$
|
629
|
|
$
|
196
|
|
$
|
302
|
|
||
|
INCOME FROM CONTINUING OPERATIONS PER LIMITED PARTNER UNIT:
|
|||||||||||
|
Basic
|
$
|
1.15
|
|
$
|
0.33
|
|
$
|
0.59
|
|
||
|
Diluted
|
$
|
1.14
|
|
$
|
0.33
|
|
$
|
0.59
|
|
||
|
NET INCOME PER LIMITED PARTNER UNIT:
|
|||||||||||
|
Basic
|
$
|
1.16
|
|
$
|
0.35
|
|
$
|
0.57
|
|
||
|
Diluted
|
$
|
1.15
|
|
$
|
0.35
|
|
$
|
0.57
|
|
||
The accompanying notes are an integral part of these consolidated financial statements.
F - 5
ENERGY TRANSFER EQUITY, L.P. AND SUBSIDIARIES
CONSOLIDATED STATEMENTS OF COMPREHENSIVE INCOME
(Dollars in millions)
|
|
Years Ended December 31,
|
||||||||||
|
|
2014
|
2013
|
2012
|
||||||||
|
Net income
|
$
|
1,124
|
|
$
|
315
|
|
$
|
1,274
|
|
||
|
Other comprehensive income (loss), net of tax:
|
|||||||||||
|
Reclassification to earnings of gains and losses on derivative instruments accounted for as cash flow hedges
|
3
|
|
(4
|
)
|
(17
|
)
|
|||||
|
Change in value of derivative instruments accounted for as cash flow hedges
|
—
|
|
(1
|
)
|
12
|
|
|||||
|
Change in value of available-for-sale securities
|
1
|
|
2
|
|
—
|
|
|||||
|
Actuarial gain (loss) relating to pension and other postretirement benefits
|
(113
|
)
|
66
|
|
(10
|
)
|
|||||
|
Foreign currency translation adjustment
|
(2
|
)
|
(1
|
)
|
—
|
|
|||||
|
Change in other comprehensive income from unconsolidated affiliates
|
(6
|
)
|
17
|
|
(9
|
)
|
|||||
|
(117
|
)
|
79
|
|
(24
|
)
|
||||||
|
Comprehensive income
|
1,007
|
|
394
|
|
1,250
|
|
|||||
|
Less: Comprehensive income attributable to noncontrolling interest
|
388
|
|
181
|
|
959
|
|
|||||
|
Comprehensive income attributable to partners
|
$
|
619
|
|
$
|
213
|
|
$
|
291
|
|
||
The accompanying notes are an integral part of these consolidated financial statements.
F - 6
ENERGY TRANSFER EQUITY, L.P. AND SUBSIDIARIES
CONSOLIDATED STATEMENTS OF EQUITY
(Dollars in millions)
|
General
Partner
|
Common
Unitholders
|
Class D Units
|
Accumulated
Other
Comprehensive
Income (Loss)
|
Non-
controlling
Interest
|
Total
|
||||||||||||||||||
|
Balance, December 31, 2011
|
$
|
—
|
|
$
|
52
|
|
$
|
—
|
|
$
|
1
|
|
$
|
7,335
|
|
$
|
7,388
|
|
|||||
|
Distributions to partners
|
(2
|
)
|
(664
|
)
|
—
|
|
—
|
|
—
|
|
(666
|
)
|
|||||||||||
|
Distributions to noncontrolling interest
|
—
|
|
—
|
|
—
|
|
—
|
|
(1,017
|
)
|
(1,017
|
)
|
|||||||||||
|
Units issued in Southern Union Merger (See Note 3)
|
—
|
|
2,354
|
|
—
|
|
—
|
|
—
|
|
2,354
|
|
|||||||||||
|
Subsidiary equity offerings, net of issue costs
|
—
|
|
33
|
|
—
|
|
—
|
|
1,070
|
|
1,103
|
|
|||||||||||
|
Subsidiary units issued in acquisition
|
—
|
|
47
|
|
—
|
|
—
|
|
2,248
|
|
2,295
|
|
|||||||||||
|
Non-cash compensation expense, net of units tendered by employees for tax withholdings
|
—
|
|
1
|
|
—
|
|
—
|
|
31
|
|
32
|
|
|||||||||||
|
Capital contributions received from noncontrolling interest
|
—
|
|
—
|
|
—
|
|
—
|
|
42
|
|
42
|
|
|||||||||||
|
ETP Holdco Transaction (see Note 3)
|
—
|
|
—
|
|
—
|
|
—
|
|
3,580
|
|
3,580
|
|
|||||||||||
|
Other, net
|
—
|
|
—
|
|
—
|
|
—
|
|
(11
|
)
|
(11
|
)
|
|||||||||||
|
Other comprehensive loss, net of tax
|
—
|
|
—
|
|
—
|
|
(13
|
)
|
(11
|
)
|
(24
|
)
|
|||||||||||
|
Net income
|
2
|
|
302
|
|
—
|
|
—
|
|
970
|
|
1,274
|
|
|||||||||||
|
Balance, December 31, 2012
|
—
|
|
2,125
|
|
—
|
|
(12
|
)
|
14,237
|
|
16,350
|
|
|||||||||||
|
Distributions to partners
|
(2
|
)
|
(731
|
)
|
—
|
|
—
|
|
—
|
|
(733
|
)
|
|||||||||||
|
Distributions to noncontrolling interest
|
—
|
|
—
|
|
—
|
|
—
|
|
(1,428
|
)
|
(1,428
|
)
|
|||||||||||
|
Subsidiary equity offerings, net of issue costs
|
—
|
|
122
|
|
—
|
|
—
|
|
1,637
|
|
1,759
|
|
|||||||||||
|
Subsidiary units issued in acquisition
|
(1
|
)
|
(506
|
)
|
—
|
|
—
|
|
507
|
|
—
|
|
|||||||||||
|
Non-cash compensation expense, net of units tendered by employees for tax withholdings
|
—
|
|
1
|
|
6
|
|
—
|
|
47
|
|
54
|
|
|||||||||||
|
Capital contributions received from noncontrolling interest
|
—
|
|
—
|
|
—
|
|
—
|
|
18
|
|
18
|
|
|||||||||||
|
Other, net
|
—
|
|
—
|
|
—
|
|
4
|
|
(39
|
)
|
(35
|
)
|
|||||||||||
|
Conversion of Regency Preferred Units for Regency Common Units
|
—
|
|
—
|
|
—
|
|
—
|
|
41
|
|
41
|
|
|||||||||||
|
Deemed distribution related to SUGS Transaction
|
—
|
|
(141
|
)
|
—
|
|
—
|
|
—
|
|
(141
|
)
|
|||||||||||
|
Other comprehensive income, net of tax
|
—
|
|
—
|
|
—
|
|
17
|
|
62
|
|
79
|
|
|||||||||||
|
Net income
|
—
|
|
196
|
|
—
|
|
—
|
|
119
|
|
315
|
|
|||||||||||
|
Balance, December 31, 2013
|
(3
|
)
|
1,066
|
|
6
|
|
9
|
|
15,201
|
|
16,279
|
|
|||||||||||
|
Distributions to partners
|
(2
|
)
|
(817
|
)
|
(2
|
)
|
—
|
|
—
|
|
(821
|
)
|
|||||||||||
|
Distributions to noncontrolling interest
|
—
|
|
—
|
|
—
|
|
—
|
|
(1,905
|
)
|
(1,905
|
)
|
|||||||||||
|
Subsidiary units issued for cash
|
—
|
|
148
|
|
2
|
|
—
|
|
2,907
|
|
3,057
|
|
|||||||||||
|
Subsidiary units issued in certain acquisitions
|
—
|
|
211
|
|
—
|
|
—
|
|
5,604
|
|
5,815
|
|
|||||||||||
|
Subsidiary units redeemed in Lake Charles LNG Transaction
|
2
|
|
480
|
|
—
|
|
—
|
|
(482
|
)
|
—
|
|
|||||||||||
|
Purchase of additional Regency Units
|
—
|
|
(99
|
)
|
—
|
|
—
|
|
99
|
|
—
|
|
|||||||||||
|
Subsidiary acquisition of a noncontrolling interest
|
—
|
|
—
|
|
—
|
|
—
|
|
(319
|
)
|
(319
|
)
|
|||||||||||
|
Non-cash compensation expense, net of units tendered by employees for tax withholdings
|
—
|
|
—
|
|
14
|
|
—
|
|
51
|
|
65
|
|
|||||||||||
|
Capital contributions received from noncontrolling interest
|
—
|
|
—
|
|
—
|
|
—
|
|
139
|
|
139
|
|
|||||||||||
|
Other, net
|
—
|
|
30
|
|
—
|
|
—
|
|
(33
|
)
|
(3
|
)
|
|||||||||||
|
Units repurchased under buyback program
|
—
|
|
(1,000
|
)
|
—
|
|
—
|
|
—
|
|
(1,000
|
)
|
|||||||||||
|
Other comprehensive loss, net of tax
|
—
|
|
—
|
|
—
|
|
(14
|
)
|
(103
|
)
|
(117
|
)
|
|||||||||||
|
Net income
|
2
|
|
629
|
|
2
|
|
—
|
|
491
|
|
1,124
|
|
|||||||||||
|
Balance, December 31, 2014
|
$
|
(1
|
)
|
$
|
648
|
|
$
|
22
|
|
$
|
(5
|
)
|
$
|
21,650
|
|
$
|
22,314
|
|
|||||
The accompanying notes are an integral part of these consolidated financial statements.
F - 7
ENERGY TRANSFER EQUITY, L.P. AND SUBSIDIARIES
(Dollars in millions)
|
|
Years Ended December 31,
|
||||||||||
|
|
2014
|
2013
|
2012
|
||||||||
|
CASH FLOWS FROM OPERATING ACTIVITIES:
|
|||||||||||
|
Net income
|
$
|
1,124
|
|
$
|
315
|
|
$
|
1,274
|
|
||
|
Reconciliation of net income to net cash provided by operating activities:
|
|||||||||||
|
Depreciation, depletion and amortization
|
1,724
|
|
1,313
|
|
871
|
|
|||||
|
Deferred income taxes
|
(50
|
)
|
43
|
|
51
|
|
|||||
|
Amortization included in interest expense
|
(51
|
)
|
(55
|
)
|
(13
|
)
|
|||||
|
Bridge loan related fees
|
—
|
|
—
|
|
62
|
|
|||||
|
Non-cash compensation expense
|
82
|
|
61
|
|
47
|
|
|||||
|
Goodwill impairment
|
370
|
|
689
|
|
—
|
|
|||||
|
Gain on sale of AmeriGas common units
|
(177
|
)
|
(87
|
)
|
—
|
|
|||||
|
Gain on deconsolidation of Propane Business
|
—
|
|
—
|
|
(1,057
|
)
|
|||||
|
Gain on curtailment of other postretirement benefit plans
|
—
|
|
—
|
|
(15
|
)
|
|||||
|
Losses on extinguishments of debt
|
25
|
|
162
|
|
123
|
|
|||||
|
(Gains) losses on disposal of assets
|
(1
|
)
|
2
|
|
4
|
|
|||||
|
Equity in earnings of unconsolidated affiliates
|
(332
|
)
|
(236
|
)
|
(212
|
)
|
|||||
|
Distributions from unconsolidated affiliates
|
291
|
|
313
|
|
208
|
|
|||||
|
Inventory valuation adjustments
|
473
|
|
(3
|
)
|
75
|
|
|||||
|
Other non-cash
|
(72
|
)
|
51
|
|
211
|
|
|||||
|
Net change in operating assets and liabilities, net of effects of acquisitions and deconsolidations (see Note 2)
|
(231
|
)
|
(149
|
)
|
(551
|
)
|
|||||
|
Net cash provided by operating activities
|
3,175
|
|
2,419
|
|
1,078
|
|
|||||
|
CASH FLOWS FROM INVESTING ACTIVITIES:
|
|||||||||||
|
Cash paid for Southern Union Merger, net of cash received (See Note 3)
|
—
|
|
—
|
|
(2,972
|
)
|
|||||
|
Cash paid for all other acquisitions
|
(2,367
|
)
|
(405
|
)
|
(10
|
)
|
|||||
|
Cash proceeds from contribution and sale of propane operations
|
—
|
|
—
|
|
1,443
|
|
|||||
|
Cash proceeds from the sale of AmeriGas common units
|
814
|
|
346
|
|
—
|
|
|||||
|
Proceeds from the sale of discontinued operations
|
77
|
|
1,008
|
|
207
|
|
|||||
|
Proceeds from the sale of other assets
|
62
|
|
89
|
|
44
|
|
|||||
|
Capital expenditures (excluding allowance for equity funds used during construction)
|
(5,381
|
)
|
(3,505
|
)
|
(3,271
|
)
|
|||||
|
Contributions in aid of construction costs
|
45
|
|
52
|
|
35
|
|
|||||
|
Contributions to unconsolidated affiliates
|
(334
|
)
|
(3
|
)
|
(37
|
)
|
|||||
|
Distributions from unconsolidated affiliates in excess of cumulative earnings
|
136
|
|
419
|
|
189
|
|
|||||
|
Change in restricted cash
|
172
|
|
(348
|
)
|
5
|
|
|||||
|
Other
|
(19
|
)
|
—
|
|
171
|
|
|||||
|
Net cash used in investing activities
|
(6,795
|
)
|
(2,347
|
)
|
(4,196
|
)
|
|||||
|
CASH FLOWS FROM FINANCING ACTIVITIES:
|
|||||||||||
|
Proceeds from borrowings
|
18,375
|
|
12,934
|
|
12,870
|
|
|||||
|
Repayments of long-term debt
|
(13,886
|
)
|
(11,951
|
)
|
(8,848
|
)
|
|||||
|
Subsidiary equity offerings, net of issue costs
|
3,057
|
|
1,759
|
|
1,103
|
|
|||||
|
Distributions to partners
|
(821
|
)
|
(733
|
)
|
(666
|
)
|
|||||
|
Distributions to noncontrolling interests
|
(1,905
|
)
|
(1,428
|
)
|
(1,017
|
)
|
|||||
|
Debt issuance costs
|
(77
|
)
|
(87
|
)
|
(112
|
)
|
|||||
|
Capital contributions received from noncontrolling interest
|
139
|
|
18
|
|
42
|
|
|||||
|
Redemption of Preferred Units
|
—
|
|
(340
|
)
|
—
|
|
|||||
|
Units repurchased under buyback program
|
(1,000
|
)
|
—
|
|
—
|
|
|||||
|
Other, net
|
(5
|
)
|
(26
|
)
|
(8
|
)
|
|||||
|
Net cash provided by financing activities
|
3,877
|
|
146
|
|
3,364
|
|
|||||
|
INCREASE IN CASH AND CASH EQUIVALENTS
|
257
|
|
218
|
|
246
|
|
|||||
|
CASH AND CASH EQUIVALENTS, beginning of period
|
590
|
|
372
|
|
126
|
|
|||||
|
CASH AND CASH EQUIVALENTS, end of period
|
$
|
847
|
|
$
|
590
|
|
$
|
372
|
|
||
The accompanying notes are an integral part of these consolidated financial statements.
F - 8
ENERGY TRANSFER EQUITY, L.P. AND SUBSIDIARIES
NOTES TO CONSOLIDATED FINANCIAL STATEMENTS
(Tabular dollar and unit amounts, except per unit data, are in millions)
|
1.
|
OPERATIONS AND ORGANIZATION
:
|
Financial Statement Presentation
The consolidated financial statements of Energy Transfer Equity, L.P. (the “Partnership,” “we” or “ETE”) presented herein for the years ended
December 31, 2014, 2013 and 2012
, have been prepared in accordance with GAAP and pursuant to the rules and regulations of the SEC. We consolidate all majority-owned subsidiaries and limited partnerships, which we control as the general partner or owner of the general partner. All significant intercompany transactions and accounts are eliminated in consolidation. Management has evaluated subsequent events through the date the financial statements were issued.
As discussed in Note 9, in January 2014, the Partnership completed a two-for-one split of ETE Common Units. All references to unit and per unit amounts in the consolidated financial statements and in these notes to the consolidated financial statements have been adjusted to reflect the effect of the unit split for all periods presented.
At
December 31, 2014
, our equity interests in Regency and ETP consisted of
100%
of the respective general partner interest and IDRs, as well as the following:
|
ETP
|
Regency
|
||
|
Units held by wholly-owned subsidiaries:
|
|||
|
Common units
|
30.8
|
57.2
|
|
|
ETP Class H units
|
50.2
|
—
|
|
|
Units held by less than wholly-owned subsidiaries:
|
|||
|
Common units
|
—
|
31.4
|
|
|
Regency Class F units
|
—
|
6.3
|
|
The consolidated financial statements of ETE presented herein include the results of operations of:
|
•
|
the Parent Company;
|
|
•
|
our controlled subsidiaries, ETP and Regency (see description of their respective operations below under “Business Operations”);
|
|
•
|
ETP’s and Regency’s consolidated subsidiaries and our wholly-owned subsidiaries that own the general partner and IDR interests in ETP and Regency; and
|
|
•
|
our wholly-owned subsidiary, Lake Charles LNG. Lake Charles LNG was acquired from ETP in February 2014.
|
Our subsidiaries also own varying undivided interests in certain pipelines. Ownership of these pipelines has been structured as an ownership of an undivided interest in assets, not as an ownership interest in a partnership, limited liability company, joint venture or other forms of entities. Each owner controls marketing and invoices separately, and each owner is responsible for any loss, damage or injury that may occur to their own customers. As a result, we apply proportionate consolidation for our interests in these entities.
Certain prior period amounts have been reclassified to conform to the
2014
presentation. These reclassifications had no impact on net income or total equity.
Unless the context requires otherwise, references to “we,” “us,” “our,” the “Partnership” and “ETE” mean Energy Transfer Equity, L.P. and its consolidated subsidiaries, which include ETP, ETP GP, ETP LLC, ETE Common Holdings, LLC, Regency, Regency GP, Regency LLC, Panhandle (or Southern Union prior to its merger into Panhandle in January 2014), Sunoco, Inc., Sunoco Logistics, Sunoco LP, Susser and ETP Holdco. References to the “Parent Company” mean Energy Transfer Equity, L.P. on a stand-alone basis.
In 2014, our consolidated subsidiaries, Trunkline LNG Company, LLC, Trunkline LNG Export, LLC and Susser Petroleum Partners LP, changed their names to Lake Charles LNG Company, LLC, Lake Charles LNG Export, LLC and Sunoco LP,
F - 9
respectively. All references to these subsidiaries throughout this document reflect the new names of those subsidiaries, regardless of whether the disclosure relates to periods or events prior to the dates of the name changes.
Business Operations
The Parent Company’s principal sources of cash flow are derived from its direct and indirect investments in the limited partner and general partner interests in ETP and Regency. The Parent Company’s primary cash requirements are for general and administrative expenses, debt service requirements and distributions to its partners. Parent Company-only assets are not available to satisfy the debts and other obligations of ETE’s subsidiaries. In order to understand the financial condition of the Parent Company on a stand-alone basis, see Note
18
for stand-alone financial information apart from that of the consolidated partnership information included herein.
Our activities are primarily conducted through our operating subsidiaries as follows:
|
•
|
ETP is a publicly traded partnership whose operations are conducted through the following subsidiaries:
|
|
•
|
ETC OLP, a Texas limited partnership primarily engaged in midstream and intrastate transportation and storage natural gas operations. ETC OLP owns and operates, through its wholly and majority-owned subsidiaries, natural gas gathering systems, intrastate natural gas pipeline systems and gas processing plants and is engaged in the business of purchasing, gathering, transporting, processing, and marketing natural gas and NGLs in the states of Texas, Louisiana, New Mexico and West Virginia. ETC OLP’s intrastate transportation and storage operations primarily focus on transporting natural gas in Texas through its Oasis pipeline, ET Fuel System, East Texas pipeline and HPL System. ETC OLP’s midstream operations focus on the gathering, compression, treating, conditioning and processing of natural gas, primarily on or through its Southeast Texas System, Eagle Ford System, North Texas System and Northern Louisiana assets. ETC OLP also owns a
70%
interest in Lone Star.
|
|
•
|
ET Interstate, a Delaware limited liability company with revenues consisting primarily of fees earned from natural gas transportation services and operational gas sales. ET Interstate is the parent company of:
|
|
•
|
Transwestern, a Delaware limited liability company engaged in interstate transportation of natural gas. Transwestern’s revenues consist primarily of fees earned from natural gas transportation services and operational gas sales.
|
|
•
|
ETC FEP, a Delaware limited liability company that directly owns a
50%
interest in FEP, which owns
100%
of the Fayetteville Express interstate natural gas pipeline.
|
|
•
|
ETC Tiger, a Delaware limited liability company engaged in interstate transportation of natural gas.
|
|
•
|
CrossCountry, a Delaware limited liability company that indirectly owns a
50%
interest in Citrus Corp., which owns
100%
of the FGT interstate natural gas pipeline.
|
|
•
|
ETC Compression, a Delaware limited liability company engaged in natural gas compression services and related equipment sales.
|
|
•
|
ETP Holdco, a Delaware limited liability company that indirectly owns Panhandle and Sunoco, Inc. Panhandle and Sunoco, Inc. operations are described as follows:
|
|
•
|
Panhandle owns and operates assets in the regulated and unregulated natural gas industry and is primarily engaged in the transportation and storage of natural gas in the United States. As discussed in Note
3
, in January 2014, Panhandle consummated a merger with Southern Union, the indirect parent of Panhandle, and PEPL Holdings, the sole limited partner of Panhandle, pursuant to which each of Southern Union and PEPL Holdings were merged with and into Panhandle, with Panhandle surviving the merger.
|
|
•
|
Sunoco, Inc. owns and operates retail marketing assets, which sell gasoline and middle distillates at retail locations and operates convenience stores primarily on the east coast and in the midwest region of the United States. Effective June 1, 2014, ETP combined certain Sunoco, Inc. retail assets with another wholly-owned subsidiary of ETP to form a limited liability company owned by ETP and Sunoco, Inc.
|
F - 10
|
•
|
Sunoco Logistics, a publicly traded Delaware limited partnership that owns and operates a logistics business, consisting of products, crude oil and NGL pipelines, terminalling and storage assets, and refined products, crude oil and NGL acquisition and marketing assets.
|
|
•
|
ETP owns an indirect 100% equity interest in Susser and the general partner interest, incentive distribution rights and a
42.8%
limited partner interest in Sunoco LP. Susser operates convenience stores in Texas, New Mexico and Oklahoma. Sunoco LP distributes motor fuels to convenience stores and retail fuel outlets in Texas, New Mexico, Oklahoma, Kansas and Louisiana and other commercial customers. As discussed in Note
3
, in October 2014, Sunoco LP acquired MACS from ETP.
|
|
•
|
Regency is a publicly traded partnership engaged in the gathering and processing, compression, treating and transportation of natural gas; the transportation, fractionation and storage of NGLs; the gathering, transportation and terminaling of oil (crude and/or condensate, a lighter oil) received from producers; the gathering and disposing of salt water; natural gas and NGL marketing and trading; and the management of coal and natural resource properties in the United States. Regency provides midstream services in some of the most prolific natural gas producing regions in the United States, including the Eagle Ford, Haynesville, Barnett, Fayetteville, Marcellus, Utica, Bone Spring, Avalon and Granite Wash shales. Its assets are located in Texas, Louisiana, Arkansas, West Virginia, Pennsylvania, Ohio, California, Mississippi, Alabama, New Mexico and the mid-continent region of the United States, which includes Kansas, Colorado and Oklahoma. Regency also holds a
30%
interest in Lone Star.
|
|
•
|
Lake Charles LNG operates a LNG import terminal, which has approximately
9.0
Bcf of above ground LNG storage capacity and re-gasification facilities on Louisiana’s Gulf Coast near Lake Charles, Louisiana. Lake Charles LNG is engaged in interstate commerce and is subject to the rules, regulations and accounting requirements of the FERC.
|
Subsequent to the Lake Charles LNG Transaction in February 2014, our reportable segments changed and currently reflect the following reportable business segments: Investment in ETP; Investment in Regency; Investment in Lake Charles LNG; and Corporate and Other.
|
2.
|
ESTIMATES, SIGNIFICANT ACCOUNTING POLICIES AND BALANCE SHEET DETAIL
:
|
Use of Estimates
The preparation of financial statements in conformity with GAAP requires management to make estimates and assumptions that affect the reported amounts of assets and liabilities and the accrual for and disclosure of contingent assets and liabilities at the date of the financial statements and the reported amounts of revenues and expenses during the reporting period.
The natural gas industry conducts its business by processing actual transactions at the end of the month following the month of delivery. Consequently, the most current month’s financial results for the midstream, NGL and intrastate transportation and storage operations are estimated using volume estimates and market prices. Any differences between estimated results and actual results are recognized in the following month’s financial statements. Management believes that the estimated operating results represent the actual results in all material respects.
Some of the other significant estimates made by management include, but are not limited to, the timing of certain forecasted transactions that are hedged, the fair value of derivative instruments, useful lives for depreciation, depletion and amortization, purchase accounting allocations and subsequent realizability of intangible assets, fair value measurements used in the goodwill impairment test, market value of inventory, assets and liabilities resulting from the regulated ratemaking process, contingency reserves and environmental reserves. Actual values and results could differ from those estimates.
New Accounting Pronouncements
In May 2014, the Financial Accounting Standards Board (“FASB”) issued Accounting Standards Update No. 2014-09,
Revenue from Contracts with Customers (Topic 606)
(“ASU 2014-09”), which clarifies the principles for recognizing revenue based on the core principle that an entity should recognize revenue to depict the transfer of promised goods or services to customers in an amount that reflects the consideration to which the entity expects to be entitled in exchange for those goods or services. ASU 2014-09 is effective for annual reporting periods beginning after December 15, 2016, including interim periods within that reporting period, with earlier adoption not permitted. ASU 2014-09 can be adopted either retrospectively to each prior reporting period presented or as a cumulative-effect adjustment as of the date of adoption. The Partnership is currently evaluating the impact, if any, that adopting this new accounting standard will have on our revenue recognition policies.
In April 2014, the FASB issued Accounting Standards Update No. 2014-08,
Presentation of Financial Statements (Topic 205) and Property, Plant, and Equipment (Topic 360): Reporting Discontinued Operations and Disclosures of Disposals of Components of an Entity
(“ASU 2014-08”), which changed the requirements for reporting discontinued operations. Under
F - 11
ASU 2014-08, a disposal of a component of an entity or a group of components of an entity is required to be reported in discontinued operations if the disposal represents a strategic shift that has or will have a major effect on an entity’s operations and financial results. ASU 2014-08 is effective for all disposals or classifications as held for sale of components of an entity that occur within fiscal years beginning after December 15, 2014, and early adoption is permitted. We expect to adopt this standard for the year ending December 31, 2015. ASU 2014-08 could have an impact on whether transactions will be reported in discontinued operations in the future, as well as the disclosures required when a component of an entity is disposed.
Revenue Recognition
Our segments are engaged in multiple revenue-generating activities. To the extent that those activities are similar among our segments, revenue recognition policies are similar. Below is a description of revenue recognition policies for significant revenue-generating activities within our segments.
Investment in ETP
Revenues for sales of natural gas and NGLs are recognized at the later of the time of delivery of the product to the customer or the time of sale or installation. Revenues from service labor, transportation, treating, compression and gas processing are recognized upon completion of the service. Transportation capacity payments are recognized when earned in the period the capacity is made available.
The results of ETP’s intrastate transportation and storage and interstate transportation and storage operations are determined primarily by the amount of capacity customers reserve as well as the actual volume of natural gas that flows through the transportation pipelines. Under transportation contracts, customers are charged (i) a demand fee, which is a fixed fee for the reservation of an agreed amount of capacity on the transportation pipeline for a specified period of time and which obligates the customer to pay even if the customer does not transport natural gas on the respective pipeline, (ii) a transportation fee, which is based on the actual throughput of natural gas by the customer, (iii) fuel retention based on a percentage of gas transported on the pipeline, or (iv) a combination of the three, generally payable monthly. Fuel retained for a fee is typically valued at market prices.
ETP’s intrastate transportation and storage operations also generate revenues and margin from the sale of natural gas to electric utilities, independent power plants, local distribution companies, industrial end-users and other marketing companies on the HPL System. Generally, ETP purchases natural gas from the market, including purchases from ETP’s marketing operations, and from producers at the wellhead.
In addition, ETP’s intrastate transportation and storage operations generate revenues and margin from fees charged for storing customers’ working natural gas in ETP’s storage facilities. ETP also engages in natural gas storage transactions in which ETP seeks to find and profit from pricing differences that occur over time utilizing the Bammel storage reservoir. ETP purchases physical natural gas and then sells financial contracts at a price sufficient to cover ETP’s carrying costs and provide for a gross profit margin. ETP expects margins from natural gas storage transactions to be higher during the periods from November to March of each year and lower during the period from April through October of each year due to the increased demand for natural gas during colder weather. However, ETP cannot assure that management’s expectations will be fully realized in the future and in what time period, due to various factors including weather, availability of natural gas in regions in which ETP operate, competitive factors in the energy industry, and other issues.
Results from ETP’s midstream operations are determined primarily by the volumes of natural gas gathered, compressed, treated, processed, purchased and sold through ETP’s pipeline and gathering systems and the level of natural gas and NGL prices. ETP generates midstream revenues and gross margins principally under fee-based or other arrangements in which ETP receives a fee for natural gas gathering, compressing, treating or processing services. The revenue earned from these arrangements is directly related to the volume of natural gas that flows through ETP’s systems and is not directly dependent on commodity prices.
ETP also utilizes other types of arrangements in ETP’s midstream operations, including (i) discount-to-index price arrangements, which involve purchases of natural gas at either (1) a percentage discount to a specified index price, (2) a specified index price less a fixed amount or (3) a percentage discount to a specified index price less an additional fixed amount, (ii) percentage-of-proceeds arrangements under which ETP gathers and processes natural gas on behalf of producers, sells the resulting residue gas and NGL volumes at market prices and remits to producers an agreed upon percentage of the proceeds based on an index price, (iii) keep-whole arrangements where ETP gathers natural gas from the producer, processes the natural gas and sells the resulting NGLs to third parties at market prices, (iv) purchasing all or a specified percentage of natural gas and/or NGL delivered from producers and treating or processing ETP’s plant facilities, and (v) making other direct purchases of natural gas and/or NGL at specified delivery points to meet operational or marketing objectives. In many cases, ETP provides services under contracts that contain a combination of more than one of the arrangements described above. The terms
F - 12
of ETP’s contracts vary based on gas quality conditions, the competitive environment at the time the contracts are signed and customer requirements. ETP’s contract mix may change as a result of changes in producer preferences, expansion in regions where some types of contracts are more common and other market factors.
NGL storage and pipeline transportation revenues are recognized when services are performed or products are delivered, respectively. Fractionation and processing revenues are recognized when product is either loaded into a truck or injected into a third party pipeline, which is when title and risk of loss pass to the customer.
In ETP’s natural gas compression business, revenue is recognized for compressor packages and technical service jobs using the completed contract method which recognizes revenue upon completion of the job. Costs incurred on a job are deducted at the time revenue is recognized.
ETP conducts marketing activities in which ETP markets the natural gas that flows through ETP’s assets, referred to as on-system gas. ETP also attracts other customers by marketing volumes of natural gas that do not move through ETP’s assets, referred to as off-system gas. For both on-system and off-system gas, ETP purchases natural gas from natural gas producers and other supply points and sells that natural gas to utilities, industrial consumers, other marketers and pipeline companies, thereby generating gross margins based upon the difference between the purchase and resale prices.
Terminalling and storage revenues are recognized at the time the services are provided. Pipeline revenues are recognized upon delivery of the barrels to the location designated by the shipper. Crude oil acquisition and marketing revenues, as well as refined product marketing revenues, are recognized when title to the product is transferred to the customer. Revenues are not recognized for crude oil exchange transactions, which are entered into primarily to acquire crude oil of a desired quality or to reduce transportation costs by taking delivery closer to end markets. Any net differential for exchange transactions is recorded as an adjustment of inventory costs in the purchases component of cost of products sold and operating expenses in the statements of operations.
ETP’s retail marketing operations sell gasoline and diesel in addition to a broad mix of merchandise such as groceries, fast foods and beverages at its convenience stores. A portion of our gasoline and diesel sales are to wholesale customers on a consignment basis, in which we retain title to inventory, control access to and sale of fuel inventory, and recognize revenue at the time the fuel is sold to the ultimate customer. We typically own the fuel dispensing equipment and underground storage tanks at consignment sites, and in some cases we own the entire site and have entered into an operating lease whit the wholesale customer operating the site. In addition, our retail outlets derive other income from lottery ticket sales, money orders, prepaid phone cards and wireless services, ATM transactions, car washes, movie rental and other ancillary product and service offerings. Some of Sunoco, Inc.’s retail outlets provide a variety of car care services. Revenues related to the sale of products are recognized when title passes, while service revenues are recorded on a net commission basis and are recognized when services are provided. Title passage generally occurs when products are shipped or delivered in accordance with the terms of the respective sales agreements. In addition, revenues are not recognized until sales prices are fixed or determinable and collectability is reasonably assured.
Investment in Regency
Regency earns revenue from (i) domestic sales of natural gas, NGLs and condensate, (ii) natural gas, NGL, condensate and salt water gathering, processing and transportation, (iii) contract compression and treating services and (iv) coal royalties. Revenue associated with sales of natural gas, NGLs and condensate are recognized when title passes to the customer, which is when the risk of ownership passes to the purchaser and physical delivery occurs. Revenue associated with transportation and processing fees are recognized when the service is provided. For contract compression and contract treating services, revenue is recognized when the service is performed. For gathering and processing services, Regency receives either fees or commodities from natural gas producers depending on the type of contract. Commodities received are in turn sold and recognized as revenue in accordance with the criteria outlined above. Under the percentage-of-proceeds contract type, Regency is paid for its services by keeping a percentage of the NGLs produced and a percentage of the residue gas resulting from processing the natural gas. Under the percentage-of-index contract type, Regency earns revenue by purchasing wellhead natural gas at a percentage of the index price and selling processed natural gas and NGLs at a price approximating the index price to third parties. Regency generally reports revenue gross in the consolidated statements of operations when it acts as the principal, takes title to the product, and incurs the risks and rewards of ownership. Revenue for fee-based arrangements is presented net, because Regency takes the role of an agent for the producers. Allowance for doubtful accounts is determined based on historical write-off experience and specific identification.
Regency recognizes coal royalties revenues on the basis of tons of coal sold by its lessees and the corresponding revenues from those sales. Regency does not have access to actual production and revenues information until 30 days following the month of production. Therefore, financial results include estimated revenues and accounts receivable for the month of production. Regency records any differences between the actual amounts ultimately received or paid and the original estimates
F - 13
in the period they become finalized. Most lessees must make minimum monthly or annual payments that are generally recoverable over certain time periods. These minimum payments are recorded as deferred income. If the lessee recovers a minimum payment through production, the deferred income attributable to the minimum payment is recognized as coal royalties revenues. If a lessee fails to meet its minimum production for certain pre-determined time periods, the deferred income attributable to the minimum payment is recognized as minimum rental revenues, which is a component of other revenues on our consolidated statements of operations. Other liabilities on the balance sheet also include deferred unearned income from a coal services facility lease, which is recognized as other income as it is earned.
Investment in Lake Charles LNG
Lake Charles LNG’s revenues from storage and re-gasification of natural gas are based on capacity reservation charges and, to a lesser extent, commodity usage charges. Reservation revenues are based on contracted rates and capacity reserved by the customers and recognized monthly. Revenues from commodity usage charges are also recognized monthly and represent the recovery of electric power charges at Lake Charles LNG’s terminal.
Regulatory Accounting – Regulatory Assets and Liabilities
ETP’s interstate transportation and storage operations are subject to regulation by certain state and federal authorities and certain subsidiaries in those operations have accounting policies that conform to the accounting requirements and ratemaking practices of the regulatory authorities. The application of these accounting policies allows certain of ETP’s regulated entities to defer expenses and revenues on the balance sheet as regulatory assets and liabilities when it is probable that those expenses and revenues will be allowed in the ratemaking process in a period different from the period in which they would have been reflected in the consolidated statement of operations by an unregulated company. These deferred assets and liabilities will be reported in results of operations in the period in which the same amounts are included in rates and recovered from or refunded to customers. Management’s assessment of the probability of recovery or pass through of regulatory assets and liabilities will require judgment and interpretation of laws and regulatory commission orders. If, for any reason, ETP ceases to meet the criteria for application of regulatory accounting treatment for these entities, the regulatory assets and liabilities related to those portions ceasing to meet such criteria would be eliminated from the consolidated balance sheet for the period in which the discontinuance of regulatory accounting treatment occurs.
Although Panhandle’s natural gas transmission systems and storage operations are subject to the jurisdiction of FERC in accordance with the NGA and NGPA, it does not currently apply regulatory accounting policies in accounting for its operations. In 1999, prior to its acquisition by Southern Union, Panhandle discontinued the application of regulatory accounting policies primarily due to the level of discounting from tariff rates and its inability to recover specific costs.
Cash, Cash Equivalents and Supplemental Cash Flow Information
Cash and cash equivalents include all cash on hand, demand deposits, and investments with original maturities of three months or less. We consider cash equivalents to include short-term, highly liquid investments that are readily convertible to known amounts of cash and which are subject to an insignificant risk of changes in value.
We place our cash deposits and temporary cash investments with high credit quality financial institutions. At times, our cash and cash equivalents may be uninsured or in deposit accounts that exceed the Federal Deposit Insurance Corporation insurance limit.
F - 14
The net change in operating assets and liabilities (net of effects of acquisitions, dispositions and deconsolidation) included in cash flows from operating activities was comprised as follows:
|
|
Years Ended December 31,
|
||||||||||
|
|
2014
|
2013
|
2012
|
||||||||
|
Accounts receivable
|
$
|
600
|
|
$
|
(556
|
)
|
$
|
267
|
|
||
|
Accounts receivable from related companies
|
30
|
|
64
|
|
(9
|
)
|
|||||
|
Inventories
|
51
|
|
(254
|
)
|
(258
|
)
|
|||||
|
Exchanges receivable
|
18
|
|
(8
|
)
|
14
|
|
|||||
|
Other current assets
|
133
|
|
(81
|
)
|
597
|
|
|||||
|
Other non-current assets, net
|
(6
|
)
|
(23
|
)
|
(129
|
)
|
|||||
|
Accounts payable
|
(850
|
)
|
541
|
|
(989
|
)
|
|||||
|
Accounts payable to related companies
|
5
|
|
(140
|
)
|
92
|
|
|||||
|
Exchanges payable
|
(99
|
)
|
128
|
|
—
|
|
|||||
|
Accrued and other current liabilities
|
(59
|
)
|
192
|
|
(159
|
)
|
|||||
|
Other non-current liabilities
|
(73
|
)
|
147
|
|
26
|
|
|||||
|
Price risk management assets and liabilities, net
|
19
|
|
(159
|
)
|
(3
|
)
|
|||||
|
Net change in operating assets and liabilities, net of effects of acquisitions and deconsolidations
|
$
|
(231
|
)
|
$
|
(149
|
)
|
$
|
(551
|
)
|
||
Non-cash investing and financing activities and supplemental cash flow information were as follows:
|
|
Years Ended December 31,
|
||||||||||
|
|
2014
|
2013
|
2012
|
||||||||
|
NON-CASH INVESTING ACTIVITIES:
|
|||||||||||
|
Accrued capital expenditures
|
$
|
643
|
|
$
|
226
|
|
$
|
420
|
|
||
|
Net gains (losses) from subsidiary common unit transactions
|
$
|
744
|
|
$
|
(384
|
)
|
$
|
80
|
|
||
|
AmeriGas limited partner interest received in Propane Contribution (see Note 4)
|
$
|
—
|
|
$
|
—
|
|
$
|
1,123
|
|
||
|
NON-CASH FINANCING ACTIVITIES:
|
|||||||||||
|
Issuance of Common Units in connection with Southern Union Merger (see Note 3)
|
$
|
—
|
|
$
|
—
|
|
$
|
2,354
|
|
||
|
Subsidiary issuance of common units in connection with certain acquisitions
|
$
|
—
|
|
$
|
—
|
|
$
|
2,295
|
|
||
|
Subsidiary issuances of common units in connection with PVR, Hoover and Eagle Rock Midstream acquisitions
|
$
|
4,281
|
|
$
|
—
|
|
$
|
—
|
|
||
|
Subsidiary issuances of common units in connection with the Susser Merger
|
$
|
908
|
|
$
|
—
|
|
$
|
—
|
|
||
|
Long-term debt assumed in PVR Acquisition
|
$
|
1,887
|
|
$
|
—
|
|
$
|
—
|
|
||
|
Long-term debt exchanged in Eagle Rock Midstream Acquisition
|
$
|
499
|
|
$
|
—
|
|
$
|
—
|
|
||
|
SUPPLEMENTAL CASH FLOW INFORMATION:
|
|||||||||||
|
Cash paid for interest, net of interest capitalized
|
$
|
1,416
|
|
$
|
1,256
|
|
$
|
997
|
|
||
|
Cash paid for income taxes
|
$
|
345
|
|
$
|
58
|
|
$
|
23
|
|
||
Accounts Receivable
Our subsidiaries assess the credit risk of their customers. Certain of our subsidiaries deal with counterparties that are typically either investment grade or are otherwise secured with a letter of credit or other form of security (corporate guarantee prepayment, master setoff agreement or collateral). Management reviews accounts receivable and an allowance for doubtful accounts is determined based on the overall creditworthiness of customers, historical write-off experience, general and specific economic trends, and specific identification.
F - 15
Inventories
Inventories consist principally of natural gas held in storage, crude oil, petroleum and chemical products. Natural gas held in storage is valued at the lower of cost or market utilizing the weighted-average cost method. The cost of crude oil and petroleum and chemical products is determined using the last-in, first out method. The cost of appliances, parts and fittings is determined by the first-in, first-out method.
Inventories consisted of the following:
|
|
December 31,
|
||||||
|
|
2014
|
2013
|
|||||
|
Natural gas and NGLs
|
$
|
392
|
|
$
|
577
|
|
|
|
Crude oil
|
364
|
|
488
|
|
|||
|
Refined products
|
392
|
|
543
|
|
|||
|
Appliances, parts and fittings and other
|
319
|
|
199
|
|
|||
|
Total inventories
|
$
|
1,467
|
|
$
|
1,807
|
|
|
During the year ended
December 31, 2014
, the Partnership recorded write downs of
$473 million
on its crude oil, refined products and NGL inventories as a result of a decline in the market price of these products. The write-down was calculated based upon current replacement costs.
ETP utilizes commodity derivatives to manage price volatility associated with certain of its natural gas inventory and designates certain of these derivatives as fair value hedges for accounting purposes. Changes in fair value of the designated hedged inventory have been recorded in inventory on our consolidated balance sheets and in cost of products sold in our consolidated statements of operations.
Exchanges
Exchanges consist of natural gas and NGL delivery imbalances (over and under deliveries) with others. These amounts, which are valued at market prices or weighted average market prices pursuant to contractual imbalance agreements, turn over monthly and are recorded as exchanges receivable or exchanges payable on our consolidated balance sheets. These imbalances are generally settled by deliveries of natural gas or NGLs, but may be settled in cash, depending on contractual terms.
Other Current Assets
Other current assets consisted of the following:
|
|
December 31,
|
||||||
|
|
2014
|
2013
|
|||||
|
Deposits paid to vendors
|
$
|
65
|
|
$
|
49
|
|
|
|
Deferred income taxes
|
14
|
|
—
|
|
|||
|
Prepaid expenses and other
|
222
|
|
263
|
|
|||
|
Total other current assets
|
$
|
301
|
|
$
|
312
|
|
|
Property, Plant and Equipment
Property, plant and equipment are stated at cost less accumulated depreciation. Depreciation is computed using the straight-line method over the estimated useful or FERC mandated lives of the assets, if applicable. Expenditures for maintenance and repairs that do not add capacity or extend the useful life are expensed as incurred. Expenditures to refurbish assets that either extend the useful lives of the asset or prevent environmental contamination are capitalized and depreciated over the remaining useful life of the asset. Natural gas and NGLs used to maintain pipeline minimum pressures is capitalized and classified as property, plant and equipment. Additionally, our subsidiaries capitalize certain costs directly related to the construction of assets including internal labor costs, interest and engineering costs. For the Lake Charles LNG project, a portion of the management fees are capitalized. Upon disposition or retirement of pipeline components or natural gas plant components, any gain or loss is recorded to accumulated depreciation. When entire pipeline systems, gas plants or other property and equipment are retired or sold, any gain or loss is included in our consolidated statements of operations.
F - 16
We and our subsidiaries review property, plant and equipment for impairment whenever events or changes in circumstances indicate that the carrying amount of such assets may not be recoverable. If such a review should indicate that the carrying amount of long-lived assets is not recoverable, we reduce the carrying amount of such assets to fair value.
Capitalized interest is included for pipeline construction projects, except for certain interstate projects for which an allowance for funds used during construction (“AFUDC”) is accrued. Interest is capitalized based on the current borrowing rate when the related costs are incurred. AFUDC is calculated under guidelines prescribed by the FERC and capitalized as part of the cost of utility plant for interstate projects. It represents the cost of servicing the capital invested in construction work-in-process. AFUDC is segregated into two component parts – borrowed funds and equity funds.
Components and useful lives of property, plant and equipment were as follows:
|
|
December 31,
|
||||||
|
|
2014
|
2013
|
|||||
|
Land and improvements
|
$
|
1,307
|
|
$
|
881
|
|
|
|
Buildings and improvements (1 to 45 years)
|
1,922
|
|
939
|
|
|||
|
Pipelines and equipment (5 to 83 years)
|
27,149
|
|
21,494
|
|
|||
|
Natural gas and NGL storage facilities (5 to 46 years)
|
1,214
|
|
1,083
|
|
|||
|
Bulk storage, equipment and facilities (2 to 83 years)
|
4,010
|
|
1,933
|
|
|||
|
Tanks and other equipment (5 to 40 years)
|
58
|
|
1,697
|
|
|||
|
Retail equipment (2 to 99 years)
|
515
|
|
450
|
|
|||
|
Vehicles (1 to 25 years)
|
203
|
|
156
|
|
|||
|
Right of way (20 to 83 years)
|
2,451
|
|
2,190
|
|
|||
|
Furniture and fixtures (2 to 25 years)
|
59
|
|
51
|
|
|||
|
Linepack
|
119
|
|
118
|
|
|||
|
Pad gas
|
44
|
|
52
|
|
|||
|
Natural resources
|
454
|
|
—
|
|
|||
|
Other (1 to 30 years)
|
999
|
|
708
|
|
|||
|
Construction work-in-process
|
4,514
|
|
2,165
|
|
|||
|
45,018
|
|
33,917
|
|
||||
|
Less – Accumulated depreciation and depletion
|
(4,726
|
)
|
(3,235
|
)
|
|||
|
Property, plant and equipment, net
|
$
|
40,292
|
|
$
|
30,682
|
|
|
We recognized the following amounts of depreciation expense and capitalized interest expense for the periods presented:
|
|
Years Ended December 31,
|
||||||||||
|
|
2014
|
2013
|
2012
|
||||||||
|
Depreciation expense
|
$
|
1,457
|
|
$
|
1,128
|
|
$
|
801
|
|
||
|
Capitalized interest, excluding AFUDC
|
$
|
113
|
|
$
|
43
|
|
$
|
99
|
|
||
Depletion expense related to Regency’s natural resources operations was
$11 million
for the year ended December 31, 2014. Coal properties are depleted on an area-by-area basis at a rate based on the cost of the mineral properties and the number of tons of estimated proven and probable coal reserves contained therein. Proven and probable coal reserves have been estimated by Regency’s own geologists. Regency’s estimates of coal reserves are updated periodically and may result in adjustments to coal reserves and depletion rates that are recognized prospectively. From time to time, Regency carries out core-hole drilling activities on coal properties in order to ascertain the quality and quantity of the coal contained in those properties. These core-hole drilling activities are expensed as incurred. Regency depletes timber using a methodology consistent with the units-of-production method, which is based on the quantity of timber harvested. Regency determines depletion of oil and gas royalty interests by the units-of-production method and these amounts could change with revisions to estimated proved recoverable reserves.
F - 17
Advances to and Investments in Affiliates
Certain of our subsidiaries own interests in a number of related businesses that are accounted for by the equity method. In general, we use the equity method of accounting for an investment for which we exercise significant influence over, but do not control, the investee’s operating and financial policies.
Goodwill
Goodwill is tested for impairment annually or more frequently if circumstances indicate that goodwill might be impaired. Our annual impairment test is performed as of August 31 for reporting units within ETP’s intrastate transportation and storage and midstream operations and during the fourth quarter for reporting units within ETP’s interstate transportation and storage and liquids transportation and services operations and all others, including all of Regency’s reporting units and Lake Charles LNG.
Changes in the carrying amount of goodwill were as follows:
|
Investment in ETP
|
Investment in Regency
|
Investment in Lake Charles LNG
|
Corporate, Other and Eliminations
|
Total
|
|||||||||||||||
|
Balance, December 31, 2012
|
$
|
5,606
|
|
$
|
1,127
|
|
$
|
873
|
|
$
|
(1,172
|
)
|
$
|
6,434
|
|
||||
|
Goodwill acquired
|
156
|
|
—
|
|
—
|
|
—
|
|
156
|
|
|||||||||
|
Deconsolidation of SUGS
(1)
|
(337
|
)
|
—
|
|
—
|
|
337
|
|
—
|
|
|||||||||
|
Goodwill impairment
|
(689
|
)
|
—
|
|
(689
|
)
|
689
|
|
(689
|
)
|
|||||||||
|
Other
|
(7
|
)
|
—
|
|
—
|
|
—
|
|
(7
|
)
|
|||||||||
|
Balance, December 31, 2013
|
4,729
|
|
1,127
|
|
184
|
|
(146
|
)
|
5,894
|
|
|||||||||
|
Goodwill acquired
|
1,874
|
|
449
|
|
—
|
|
—
|
|
2,323
|
|
|||||||||
|
Lake Charles LNG Transaction
(2)
|
(184
|
)
|
—
|
|
—
|
|
184
|
|
—
|
|
|||||||||
|
Goodwill impairment
|
—
|
|
(370
|
)
|
—
|
|
—
|
|
(370
|
)
|
|||||||||
|
Other
|
—
|
|
17
|
|
—
|
|
1
|
|
18
|
|
|||||||||
|
Balance, December 31, 2014
|
$
|
6,419
|
|
$
|
1,223
|
|
$
|
184
|
|
$
|
39
|
|
$
|
7,865
|
|
||||
|
(1)
|
As discussed in Note
3
, Regency completed its acquisition of SUGS on April 30, 2013 which was a transaction between entities under common control. Therefore, the investment in Regency segment amounts have been retrospectively adjusted to reflect SUGS beginning March 26, 2012. Therefore, the December 31, 2012 goodwill balance includes goodwill attributable to SUGS of
$337 million
in both segments that was correspondingly included in the elimination column. ETP deconsolidated SUGS on April 30, 2013.
|
|
(2)
|
As discussed in Note
3
, ETP completed the transfer to ETE of Lake Charles LNG on February 19, 2014. Therefore, the December 31, 2012 and 2013 goodwill balances include goodwill attributable to Lake Charles LNG of
$873 million
and
$184 million
, respectively, in both the investment in ETP and investment in Lake Charles LNG segments that was correspondingly included in the elimination column. The transaction was effective January 1, 2014.
|
Goodwill is recorded at the acquisition date based on a preliminary purchase price allocation and generally may be adjusted when the purchase price allocation is finalized. We recorded a net increase in goodwill of
$1.97 billion
during the year ended December 31, 2014 primarily due to the Susser Merger and PVR Acquisition where we recorded goodwill of
$1.73 billion
and
$370 million
, respectively, offset by an impairment of
$370 million
. The additional goodwill recorded during the years ended December 31, 2014 and 2013 is not expected to be deductible for tax purposes.
During the fourth quarter of 2014, a
$370 million
goodwill impairment was recorded related to Regency’s Permian Basin gathering and processing operations. The decline in estimated fair value of that reporting unit was primarily driven by the significant decline in commodity prices in the fourth quarter of 2014, and the resulting impact to future commodity prices as well as increases in future estimated operations and maintenance expenses. An assessment of these factors in the fourth quarter of 2014 led to a conclusion that the estimated fair value of Regency’s Permian reporting unit was less than its carrying amount.
During the fourth quarter of 2013, ETP performed a goodwill impairment test on its Lake Charles LNG reporting unit. In accordance with GAAP, ETP performed step one of the goodwill impairment test and determined that the estimated fair value of the Lake Charles LNG reporting unit was less than its carrying amount, primarily due to changes related to (i) the structure
F - 18
and capitalization of the planned LNG export project at Lake Charles LNG’s Lake Charles facility, (ii) an analysis of current macroeconomic factors, including global natural gas prices and relative spreads, as of the date of our assessment, (iii) judgments regarding the prospect of obtaining regulatory approval for a proposed LNG export project and the uncertainty associated with the timing of such approvals, and (iv) changes in assumptions related to potential future revenues from the import facility and the proposed export facility. An assessment of these factors in the fourth quarter of 2013 led to a conclusion that the estimated fair value of the Lake Charles LNG reporting unit was less than its carrying amount. ETP then applied the second step in the goodwill impairment test, allocating the estimated fair value of the reporting unit among all of the assets and liabilities of the reporting unit in a hypothetical purchase price allocation. The assets and liabilities of the reporting unit had recently been measured at fair value in 2012 as a result of the acquisition of Southern Union, and those estimated fair values had been recorded at the reporting unit through the application of “push-down” accounting. For purposes of the hypothetical purchase price allocation used in the goodwill impairment test, ETP estimated the fair value of the assets and liabilities of the reporting unit in a manner similar to the original purchase price allocation. In allocating value to the property, plant and equipment, ETP used current replacement costs adjusted for assumed depreciation. ETP also included the estimated fair value of working capital and identifiable intangible assets in the reporting unit. ETP adjusted deferred income taxes based on these estimated fair values. Based on this hypothetical purchase price allocation, estimated goodwill was
$184 million
, which was less than the balance of
$873 million
that had originally been recorded by the reporting unit through “push-down” accounting in 2012. As a result, ETP recorded a goodwill impairment of
$689 million
during the fourth quarter of 2013.
No other goodwill impairments were identified or recorded for our reporting units.
Intangible Assets
Intangible assets are stated at cost, net of amortization computed on the straight-line method. We eliminate from our consolidated balance sheets the gross carrying amount and the related accumulated amortization for any fully amortized intangibles in the year they are fully amortized.
Components and useful lives of intangible assets were as follows:
|
|
December 31, 2014
|
December 31, 2013
|
|||||||||||||
|
|
Gross Carrying
Amount
|
Accumulated
Amortization
|
Gross Carrying
Amount
|
Accumulated
Amortization
|
|||||||||||
|
Amortizable intangible assets:
|
|||||||||||||||
|
Customer relationships, contracts and agreements (3 to 46 years)
|
$
|
5,144
|
|
$
|
(485
|
)
|
$
|
2,135
|
|
$
|
(264
|
)
|
|||
|
Trade names (15 to 20 years)
|
556
|
|
(15
|
)
|
66
|
|
(12
|
)
|
|||||||
|
Patents (9 years)
|
48
|
|
(11
|
)
|
48
|
|
(6
|
)
|
|||||||
|
Other (1 to 15 years)
|
36
|
|
(7
|
)
|
7
|
|
(4
|
)
|
|||||||
|
Total amortizable intangible assets
|
5,784
|
|
(518
|
)
|
2,256
|
|
(286
|
)
|
|||||||
|
Non-amortizable intangible assets:
|
|||||||||||||||
|
Trademarks
|
316
|
|
—
|
|
294
|
|
—
|
|
|||||||
|
Total intangible assets
|
$
|
6,100
|
|
$
|
(518
|
)
|
$
|
2,550
|
|
$
|
(286
|
)
|
|||
Aggregate amortization expense of intangibles assets was as follows:
|
|
Years Ended December 31,
|
||||||||||
|
|
2014
|
2013
|
2012
|
||||||||
|
Reported in depreciation, depletion and amortization
|
$
|
219
|
|
$
|
120
|
|
$
|
70
|
|
||
F - 19
Estimated aggregate amortization expense of intangible assets for the next five years was as follows:
|
Years Ending December 31:
|
|
||
|
2015
|
$
|
263
|
|
|
2016
|
260
|
|
|
|
2017
|
260
|
|
|
|
2018
|
259
|
|
|
|
2019
|
256
|
|
|
We review amortizable intangible assets for impairment whenever events or changes in circumstances indicate that the carrying amount of such assets may not be recoverable. If such a review should indicate that the carrying amount of amortizable intangible assets is not recoverable, we reduce the carrying amount of such assets to fair value. We review non-amortizable intangible assets for impairment annually, or more frequently if circumstances dictate.
Other Non-Current Assets, net
Other non-current assets, net are stated at cost less accumulated amortization. Other non-current assets, net consisted of the following:
|
December 31,
|
|||||||
|
2014
|
2013
|
||||||
|
Unamortized financing costs (3 to 30 years)
|
$
|
203
|
|
$
|
167
|
|
|
|
Regulatory assets
|
85
|
|
86
|
|
|||
|
Deferred charges
|
220
|
|
144
|
|
|||
|
Restricted funds
|
177
|
|
378
|
|
|||
|
Other
|
223
|
|
147
|
|
|||
|
Total other non-current assets, net
|
$
|
908
|
|
$
|
922
|
|
|
Restricted funds primarily consisted of restricted cash held in our wholly-owned captive insurance companies.
Asset Retirement Obligations
We have determined that we are obligated by contractual or regulatory requirements to remove facilities or perform other remediation upon retirement of certain assets. The fair value of any ARO is determined based on estimates and assumptions related to retirement costs, which the Partnership bases on historical retirement costs, future inflation rates and credit-adjusted risk-free interest rates. These fair value assessments are considered to be Level 3 measurements, as they are based on both observable and unobservable inputs. Changes in the liability are recorded for the passage of time (accretion) or for revisions to cash flows originally estimated to settle the ARO.
An ARO is required to be recorded when a legal obligation to retire an asset exists and such obligation can be reasonably estimated. We will record an asset retirement obligation in the periods in which management can reasonably estimate the settlement dates.
Except for certain amounts recorded by Panhandle, Sunoco Logistics and ETP’s retail marketing operations. discussed below, management was not able to reasonably measure the fair value of asset retirement obligations as of
December 31, 2014
and
2013
, in most cases because the settlement dates were indeterminable. Although a number of other onshore assets in Panhandle’s system are subject to agreements or regulations that give rise to an ARO upon Panhandle’s discontinued use of these assets, AROs were not recorded because these assets have an indeterminate removal or abandonment date given the expected continued use of the assets with proper maintenance or replacement. Sunoco, Inc. has legal asset retirement obligations for several other assets at its previously owned refineries, pipelines and terminals, for which it is not possible to estimate when the obligations will be settled. Consequently, the retirement obligations for these assets cannot be measured at this time. At the end of the useful life of these underlying assets, Sunoco, Inc. is legally or contractually required to abandon in place or remove the asset. Sunoco Logistics believes it may have additional asset retirement obligations related to its pipeline assets and storage tanks, for which it is not possible to estimate whether or when the retirement obligations will be settled. Consequently, these retirement obligations cannot be measured at this time.
F - 20
Below is a schedule of AROs by segment recorded as other non-current liabilities in our consolidated balance sheets:
|
December 31,
|
|||||||
|
2014
|
2013
|
||||||
|
Investment in ETP:
|
|||||||
|
Interstate transportation and storage operations
|
$
|
58
|
|
$
|
55
|
|
|
|
Retail marketing operations
|
87
|
|
84
|
|
|||
|
Investment in Sunoco Logistics
|
41
|
|
41
|
|
|||
|
Investment in Regency
|
2
|
|
—
|
|
|||
|
$
|
188
|
|
$
|
180
|
|
||
Individual component assets have been and will continue to be replaced, but the pipeline and the natural gas gathering and processing systems will continue in operation as long as supply and demand for natural gas exists. Based on the widespread use of natural gas in industrial and power generation activities, management expects supply and demand to exist for the foreseeable future. We have in place a rigorous repair and maintenance program that keeps the pipelines and the natural gas gathering and processing systems in good working order. Therefore, although some of the individual assets may be replaced, the pipelines and the natural gas gathering and processing systems themselves will remain intact indefinitely.
As of December 31,
2014
, there were no legally restricted funds for the purpose of settling AROs.
Accrued and Other Current Liabilities
Accrued and other current liabilities consisted of the following:
|
|
December 31,
|
||||||
|
|
2014
|
2013
|
|||||
|
Interest payable
|
$
|
440
|
|
$
|
357
|
|
|
|
Customer advances and deposits
|
103
|
|
142
|
|
|||
|
Accrued capital expenditures
|
673
|
|
260
|
|
|||
|
Accrued wages and benefits
|
233
|
|
173
|
|
|||
|
Taxes payable other than income taxes
|
236
|
|
211
|
|
|||
|
Income taxes payable
|
54
|
|
4
|
|
|||
|
Deferred income taxes
|
99
|
|
119
|
|
|||
|
Other
|
363
|
|
412
|
|
|||
|
Total accrued and other current liabilities
|
$
|
2,201
|
|
$
|
1,678
|
|
|
Deposits or advances are received from customers as prepayments for natural gas deliveries in the following month. Prepayments and security deposits may also be required when customers exceed their credit limits or do not qualify for open credit.
Environmental Remediation
We accrue environmental remediation costs for work at identified sites where an assessment has indicated that cleanup costs are probable and reasonably estimable. Such accruals are undiscounted and are based on currently available information, estimated timing of remedial actions and related inflation assumptions, existing technology and presently enacted laws and regulations. If a range of probable environmental cleanup costs exists for an identified site, the minimum of the range is accrued unless some other point in the range is more likely in which case the most likely amount in the range is accrued.
Fair Value of Financial Instruments
The carrying amounts of cash and cash equivalents, accounts receivable and accounts payable approximate their fair value. Price risk management assets and liabilities are recorded at fair value.
Based on the estimated borrowing rates currently available to us and our subsidiaries for loans with similar terms and average maturities, the aggregate fair value and carrying amount of our consolidated debt obligations as of
December 31, 2014
was
$31.68 billion
and
$30.66 billion
, respectively. As of
December 31, 2013
, the aggregate fair value and carrying amount of
F - 21
our consolidated debt obligations was
$23.97 billion
and
$23.20 billion
, respectively. The fair value of our consolidated debt obligations is a Level 2 valuation based on the observable inputs used for similar liabilities.
We have commodity derivatives, interest rate derivatives, the Preferred Units, the preferred units of a subsidiary and embedded derivatives in the preferred units of a subsidiary (the “Regency Preferred Units”) that are accounted for as assets and liabilities at fair value in our consolidated balance sheets. We determine the fair value of our assets and liabilities subject to fair value measurement by using the highest possible “level” of inputs. Level 1 inputs are observable quotes in an active market for identical assets and liabilities. We consider the valuation of marketable securities and commodity derivatives transacted through a clearing broker with a published price from the appropriate exchange as a Level 1 valuation. Level 2 inputs are inputs observable for similar assets and liabilities. We consider OTC commodity derivatives entered into directly with third parties as a Level 2 valuation since the values of these derivatives are quoted on an exchange for similar transactions. Additionally, we consider our options transacted through our clearing broker as having Level 2 inputs due to the level of activity of these contracts on the exchange in which they trade. We consider the valuation of our interest rate derivatives as Level 2 as the primary input, the LIBOR curve, is based on quotes from an active exchange of Eurodollar futures for the same period as the future interest swap settlements. Level 3 inputs are unobservable. Derivatives related to the Regency Preferred Units are valued using a binomial lattice model. The market inputs utilized in the model include credit spread, probabilities of the occurrence of certain events, common unit price, dividend yield, and expected value, and are considered Level 3. At December 31, 2012, the fair value of the Preferred Units was based predominantly on an income approach model and considered Level 3. The Preferred Units were redeemed on April 1, 2013.
F - 22
The following tables summarize the fair value of our financial assets and liabilities measured and recorded at fair value on a recurring basis as of
December 31, 2014
and
2013
based on inputs used to derive their fair values:
|
|
Fair Value Measurements at
December 31, 2014 |
||||||||||||||
|
|
Fair Value
Total
|
Level 1
|
Level 2
|
Level 3
|
|||||||||||
|
Assets:
|
|||||||||||||||
|
Interest rate derivatives
|
$
|
3
|
|
$
|
—
|
|
$
|
3
|
|
$
|
—
|
|
|||
|
Commodity derivatives:
|
|||||||||||||||
|
Condensate — Forward Swaps
|
36
|
|
—
|
|
36
|
|
—
|
|
|||||||
|
Natural Gas:
|
|||||||||||||||
|
Basis Swaps IFERC/NYMEX
|
19
|
|
19
|
|
—
|
|
—
|
|
|||||||
|
Swing Swaps IFERC
|
26
|
|
1
|
|
25
|
|
—
|
|
|||||||
|
Fixed Swaps/Futures
|
566
|
|
541
|
|
25
|
|
—
|
|
|||||||
|
Forward Physical Contracts
|
1
|
|
—
|
|
1
|
|
—
|
|
|||||||
|
Power:
|
|||||||||||||||
|
Forwards
|
3
|
|
—
|
|
3
|
|
—
|
|
|||||||
|
Futures
|
4
|
|
4
|
|
—
|
|
—
|
|
|||||||
|
Natural Gas Liquids — Forwards/Swaps
|
69
|
|
46
|
|
23
|
|
—
|
|
|||||||
|
Refined Products — Futures
|
21
|
|
21
|
|
—
|
|
—
|
|
|||||||
|
Total commodity derivatives
|
745
|
|
632
|
|
113
|
|
—
|
|
|||||||
|
Total assets
|
$
|
748
|
|
$
|
632
|
|
$
|
116
|
|
$
|
—
|
|
|||
|
Liabilities:
|
|||||||||||||||
|
Interest rate derivatives
|
$
|
(155
|
)
|
$
|
—
|
|
$
|
(155
|
)
|
$
|
—
|
|
|||
|
Embedded derivatives in the Regency Preferred Units
|
(16
|
)
|
—
|
|
—
|
|
(16
|
)
|
|||||||
|
Commodity derivatives:
|
|||||||||||||||
|
Natural Gas:
|
|||||||||||||||
|
Basis Swaps IFERC/NYMEX
|
(18
|
)
|
(18
|
)
|
—
|
|
—
|
|
|||||||
|
Swing Swaps IFERC
|
(25
|
)
|
(2
|
)
|
(23
|
)
|
—
|
|
|||||||
|
Fixed Swaps/Futures
|
(490
|
)
|
(490
|
)
|
—
|
|
—
|
|
|||||||
|
Power:
|
|||||||||||||||
|
Forwards
|
(4
|
)
|
—
|
|
(4
|
)
|
—
|
|
|||||||
|
Futures
|
(2
|
)
|
(2
|
)
|
—
|
|
—
|
|
|||||||
|
Natural Gas Liquids — Forwards/Swaps
|
(32
|
)
|
(32
|
)
|
—
|
|
—
|
|
|||||||
|
Refined Products — Futures
|
(7
|
)
|
(7
|
)
|
—
|
|
—
|
|
|||||||
|
Total commodity derivatives
|
(578
|
)
|
(551
|
)
|
(27
|
)
|
—
|
|
|||||||
|
Total liabilities
|
$
|
(749
|
)
|
$
|
(551
|
)
|
$
|
(182
|
)
|
$
|
(16
|
)
|
|||
F - 23
|
|
Fair Value Measurements at
December 31, 2013 |
||||||||||||||
|
|
Fair Value
Total
|
Level 1
|
Level 2
|
Level 3
|
|||||||||||
|
Assets:
|
|||||||||||||||
|
Interest rate derivatives
|
$
|
47
|
|
$
|
—
|
|
$
|
47
|
|
$
|
—
|
|
|||
|
Commodity derivatives:
|
|||||||||||||||
|
Natural Gas:
|
|||||||||||||||
|
Basis Swaps IFERC/NYMEX
|
5
|
|
5
|
|
—
|
|
—
|
|
|||||||
|
Swing Swaps IFERC
|
8
|
|
1
|
|
7
|
|
—
|
|
|||||||
|
Fixed Swaps/Futures
|
203
|
|
201
|
|
2
|
|
—
|
|
|||||||
|
Natural Gas Liquids — Forwards/Swaps
|
7
|
|
5
|
|
2
|
|
—
|
|
|||||||
|
Power — Forwards
|
3
|
|
—
|
|
3
|
|
—
|
|
|||||||
|
Refined Products – Futures
|
5
|
|
5
|
|
—
|
|
—
|
|
|||||||
|
Total commodity derivatives
|
231
|
|
217
|
|
14
|
|
—
|
|
|||||||
|
Total assets
|
$
|
278
|
|
$
|
217
|
|
$
|
61
|
|
$
|
—
|
|
|||
|
Liabilities:
|
|||||||||||||||
|
Interest rate derivatives
|
$
|
(95
|
)
|
$
|
—
|
|
$
|
(95
|
)
|
$
|
—
|
|
|||
|
Embedded derivatives in the Regency Preferred Units
|
(19
|
)
|
—
|
|
—
|
|
(19
|
)
|
|||||||
|
Commodity derivatives:
|
|||||||||||||||
|
Condensate — Forward Swaps
|
(1
|
)
|
—
|
|
(1
|
)
|
—
|
|
|||||||
|
Natural Gas:
|
|||||||||||||||
|
Basis Swaps IFERC/NYMEX
|
(4
|
)
|
(4
|
)
|
—
|
|
—
|
|
|||||||
|
Swing Swaps IFERC
|
(6
|
)
|
—
|
|
(6
|
)
|
—
|
|
|||||||
|
Fixed Swaps/Futures
|
(206
|
)
|
(201
|
)
|
(5
|
)
|
—
|
|
|||||||
|
Forward Physical Contracts
|
(1
|
)
|
—
|
|
(1
|
)
|
—
|
|
|||||||
|
Natural Gas Liquids — Forwards/Swaps
|
(9
|
)
|
(5
|
)
|
(4
|
)
|
—
|
|
|||||||
|
Power — Forwards
|
(1
|
)
|
—
|
|
(1
|
)
|
—
|
|
|||||||
|
Refined Products – Futures
|
(5
|
)
|
(5
|
)
|
—
|
|
—
|
|
|||||||
|
Total commodity derivatives
|
(233
|
)
|
(215
|
)
|
(18
|
)
|
—
|
|
|||||||
|
Total liabilities
|
$
|
(347
|
)
|
$
|
(215
|
)
|
$
|
(113
|
)
|
$
|
(19
|
)
|
|||
At December 31, 2013, the fair value of the Lake Charles LNG reporting unit was classified as Level 3 of the fair value hierarchy due to the significance of unobservable inputs developed using company-specific information. We used the income approach to measure the fair value of the Lake Charles LNG reporting unit. Under the income approach, we calculated the fair value based on the present value of the estimated future cash flows. The discount rate used, which was an unobservable input, was based on the weighted-average cost of capital adjusted for the relevant risk associated with business-specific characteristics and the uncertainty related to the business's ability to execute on the projected cash flows.
The following table presents the material unobservable inputs used to estimate the fair value of Regency’s Preferred Units and the embedded derivatives in Regency’s Preferred Units:
|
Unobservable Input
|
December 31, 2014
|
|||
|
Embedded derivatives in the Regency Preferred Units
|
Credit Spread
|
4.76
|
%
|
|
|
Volatility
|
35.80
|
%
|
||
Changes in the remaining term of the Preferred Units, U.S. Treasury yields and valuations in related instruments would cause a change in the yield to value the Preferred Units. Changes in Regency’s cost of equity and U.S. Treasury yields would cause a change in the credit spread used to value the embedded derivatives in the Regency Preferred Units. Changes in Regency’s historical unit price volatility would cause a change in the volatility used to value the embedded derivatives.
F - 24
The following table presents a reconciliation of the beginning and ending balances for our Level 3 financial instruments measured at fair value on a recurring basis using significant unobservable inputs for the year ended
December 31, 2014
. There were no transfers between the fair value hierarchy levels during the years ended
December 31, 2014
or
2013
.
|
Balance, December 31, 2013
|
$
|
(19
|
)
|
|
Net unrealized gains included in other income (expense)
|
3
|
|
|
|
Balance, December 31, 2014
|
$
|
(16
|
)
|
Contributions in Aid of Construction Cost
On certain of our capital projects, third parties are obligated to reimburse us for all or a portion of project expenditures. The majority of such arrangements are associated with pipeline construction and production well tie-ins. Contributions in aid of construction costs (“CIAC”) are netted against our project costs as they are received, and any CIAC which exceeds our total project costs, is recognized as other income in the period in which it is realized.
Shipping and Handling Costs
Shipping and handling costs are included in cost of products sold, except for shipping and handling costs related to fuel consumed for compression and treating which are included in operating expenses.
Costs and Expenses
Costs of products sold include actual cost of fuel sold, adjusted for the effects of hedging and other commodity derivative activities, and the cost of appliances, parts and fittings. Operating expenses include all costs incurred to provide products to customers, including compensation for operations personnel, insurance costs, vehicle maintenance, advertising costs, purchasing costs and plant operations. Selling, general and administrative expenses include all partnership related expenses and compensation for executive, partnership, and administrative personnel.
We record the collection of taxes to be remitted to governmental authorities on a net basis except for our retail marketing operations in which consumer excise taxes on sales of refined products and merchandise are included in both revenues and costs and expenses in the consolidated statements of operations, with no effect on net income (loss). Excise taxes collected by ETP’s retail marketing operations were
$2.46 billion
,
$2.22 billion
and
$573 million
for the years ended
December 31, 2014
,
2013
and
2012
, respectively.
Issuances of Subsidiary Units
We record changes in our ownership interest of our subsidiaries as equity transactions, with no gain or loss recognized in consolidated net income or comprehensive income. For example, upon our subsidiaries’ issuance of common units in a public offering, we record any difference between the amount of consideration received or paid and the amount by which the noncontrolling interest is adjusted as a change in partners’ capital.
Income Taxes
ETE is a publicly traded limited partnership and is not taxable for federal and most state income tax purposes. As a result, our earnings or losses, to the extent not included in a taxable subsidiary, for federal and state income tax purposes are included in the tax returns of the individual partners. Net earnings for financial statement purposes may differ significantly from taxable income reportable to Unitholders as a result of differences between the tax basis and financial reporting basis of assets and liabilities, in addition to the allocation requirements related to taxable income under our Third Amended and Restated Agreement of Limited Partnership (the “Partnership Agreement”).
As a publicly traded limited partnership, we are subject to a statutory requirement that our “qualifying income” (as defined by the Internal Revenue Code, related Treasury Regulations, and IRS pronouncements) exceed 90% of our total gross income, determined on a calendar year basis. If our qualifying income does not meet this statutory requirement, we would be taxed as a corporation for federal and state income tax purposes. For the years ended
December 31, 2014, 2013 and 2012
, our qualifying income met the statutory requirement.
The Partnership conducts certain activities through corporate subsidiaries which are subject to federal, state and local income taxes. These corporate subsidiaries include Susser and ETP Holdco, which owns Sunoco, Inc. and Panhandle. The Partnership and its corporate subsidiaries account for income taxes under the asset and liability method.
F - 25
Under this method, deferred tax assets and liabilities are recognized for the estimated future tax consequences attributable to differences between the financial statement carrying amounts of existing assets and liabilities and their respective tax basis. Deferred tax assets and liabilities are measured using enacted tax rates in effect for the year in which those temporary differences are expected to be recovered or settled. The effect on deferred tax assets and liabilities of a change in tax rate is recognized in earnings in the period that includes the enactment date. Valuation allowances are established when necessary to reduce deferred tax assets to the amounts more likely than not to be realized.
The determination of the provision for income taxes requires significant judgment, use of estimates, and the interpretation and application of complex tax laws. Significant judgment is required in assessing the timing and amounts of deductible and taxable items and the probability of sustaining uncertain tax positions. The benefits of uncertain tax positions are recorded in our financial statements only after determining a more-likely-than-not probability that the uncertain tax positions will withstand challenge, if any, from taxing authorities. When facts and circumstances change, we reassess these probabilities and record any changes through the provision for income taxes.
Accounting for Derivative Instruments and Hedging Activities
For qualifying hedges, we formally document, designate and assess the effectiveness of transactions that receive hedge accounting treatment and the gains and losses offset related results on the hedged item in the statement of operations. The market prices used to value our financial derivatives and related transactions have been determined using independent third party prices, readily available market information, broker quotes and appropriate valuation techniques.
At inception of a hedge, we formally document the relationship between the hedging instrument and the hedged item, the risk management objectives, and the methods used for assessing and testing effectiveness and how any ineffectiveness will be measured and recorded. We also assess, both at the inception of the hedge and on a quarterly basis, whether the derivatives that are used in our hedging transactions are highly effective in offsetting changes in cash flows. If we determine that a derivative is no longer highly effective as a hedge, we discontinue hedge accounting prospectively by including changes in the fair value of the derivative in net income for the period.
If we designate a commodity hedging relationship as a fair value hedge, we record the changes in fair value of the hedged asset or liability in cost of products sold in the consolidated statement of operations. This amount is offset by the changes in fair value of the related hedging instrument. Any ineffective portion or amount excluded from the assessment of hedge ineffectiveness is also included in the cost of products sold in the consolidated statement of operations.
Cash flows from derivatives accounted for as cash flow hedges are reported as cash flows from operating activities, in the same category as the cash flows from the items being hedged.
If we designate a derivative financial instrument as a cash flow hedge and it qualifies for hedge accounting, a change in the fair value is deferred in AOCI until the underlying hedged transaction occurs. Any ineffective portion of a cash flow hedge’s change in fair value is recognized each period in earnings. Gains and losses deferred in AOCI related to cash flow hedges remain in AOCI until the underlying physical transaction occurs, unless it is probable that the forecasted transaction will not occur by the end of the originally specified time period or within an additional two-month period of time thereafter. For financial derivative instruments that do not qualify for hedge accounting, the change in fair value is recorded in cost of products sold in the consolidated statements of operations.
We previously have managed a portion of our interest rate exposures by utilizing interest rate swaps and similar instruments. Certain of our interest rate derivatives are accounted for as either cash flow hedges or fair value hedges. For interest rate derivatives accounted for as either cash flow or fair value hedges, we report realized gains and losses and ineffectiveness portions of those hedges in interest expense. For interest rate derivatives not designated as hedges for accounting purposes, we report realized and unrealized gains and losses on those derivatives in gains (losses) on interest rate derivatives in the consolidated statements of operations.
Unit-Based Compensation
For awards of restricted units, we recognize compensation expense over the vesting period based on the grant-date fair value, which is determined based on the market price of our common units on the grant date. For awards of cash restricted units, we remeasure the fair value of the award at the end of each reporting period based on the market price of our common units as of the reporting date, and the fair value is recorded in other non-current liabilities on our consolidated balance sheets.
Pensions and Other Postretirement Benefit Plans
Employers are required to recognize in their balance sheets the overfunded or underfunded status of defined benefit pension and other postretirement plans, measured as the difference between the fair value of the plan assets and the benefit obligation
F - 26
(the projected benefit obligation for pension plans and the accumulated postretirement benefit obligation for other postretirement plans). Each overfunded plan is recognized as an asset and each underfunded plan is recognized as a liability. Employers must recognize the change in the funded status of the plan in the year in which the change occurs through AOCI in equity or are reflected as a regulatory asset or regulatory liability for regulated entities.
Allocation of Income
For purposes of maintaining partner capital accounts, our Partnership Agreement specifies that items of income and loss shall generally be allocated among the partners in accordance with their percentage interests.
|
3.
|
ACQUISITIONS AND RELATED TRANSACTIONS
:
|
Pending Transaction
Regency Merger
In January 2015, ETP and Regency entered into a definitive merger agreement, as amended on February 18, 2015 (the “Merger Agreement”), pursuant to which Regency will merge with a wholly-owned subsidiary of ETP, with Regency continuing as the surviving entity and becoming a wholly-owned subsidiary of ETP (the “Regency Merger”). At the effective time of the Regency Merger (the “Effective Time”), each Regency common unit and Class F unit will be converted into the right to receive
0.4066
ETP Common Units, plus a number of additional ETP Common Units equal to
$0.32
per Regency common unit divided by the lesser of (i) the volume weighted average price of ETP Common Units for the five trading days ending on the third trading day immediately preceding the Effective Time and (ii) the closing price of ETP Common Units on the third trading day immediately preceding the Effective Time, rounded to the nearest ten thousandth of a unit. Each Regency series A preferred unit will be converted into the right to receive a preferred unit representing a limited partner interest in ETP, a new class of units in ETP to be established at the Effective Time. The transaction is subject to other customary closing conditions including approval by Regency’s unitholders.
In addition, ETE, which owns the general partner and
100%
of the incentive distribution rights of both Regency and ETP, has agreed to reduce the incentive distributions it receives from ETP by a total of
$320 million
over a five year period. The IDR subsidy will be
$80 million
in the first year post closing and
$60 million
per year for the following four years. The transaction is expected to close in the second quarter of 2015.
ETP and Regency are under common control of ETE; therefore, we expect to account for the Regency Merger at historical cost as a reorganization of entities under common control. Accordingly, ETP’s consolidated financial statements will be retrospectively adjusted to reflect consolidation of Regency beginning May 26, 2010 (the date ETE acquired Regency’s general partner).
2014 Transactions
Susser Merger
In August 2014, ETP and Susser completed the merger of an indirect wholly-owned subsidiary of ETP, with and into Susser, with Susser surviving the merger as a subsidiary of ETP for total consideration valued at approximately
$1.8 billion
(the “Susser Merger”). The total consideration paid in cash was approximately
$875 million
and the total consideration paid in equity was approximately
15.8 million
ETP Common Units. The Susser Merger broadens ETP’s retail geographic footprint and provides synergy opportunities and a platform for future growth.
In connection with the Susser Merger, ETP acquired an indirect
100%
equity interest in Susser and the general partner interest and the incentive distribution rights in Sunoco LP, approximately
11 million
Sunoco LP common and subordinated units, and Susser’s existing retail operations, consisting of
630
convenience store locations.
Effective with the closing of the transaction, Susser ceased to be a publicly traded company and its common stock discontinued trading on the NYSE.
Summary of Assets Acquired and Liabilities Assumed
We accounted for the Susser Merger using the acquisition method of accounting which requires, among other things, that assets acquired and liabilities assumed be recognized on the balance sheet at their fair values as of the acquisition date. Our consolidated balance sheet as of
December 31, 2014
reflected the preliminary purchase price allocations based on available information. Management is reviewing the valuation and confirming the results to determine the final purchase price allocation.
F - 27
The following table summarizes the preliminary assets acquired and liabilities assumed recognized as of the merger date:
|
Susser
|
||||
|
Total current assets
|
$
|
446
|
|
|
|
Property, plant and equipment
|
1,069
|
|
||
|
Goodwill
(1)
|
1,734
|
|
||
|
Intangible assets
|
611
|
|
||
|
Other non-current assets
|
17
|
|
||
|
3,877
|
|
|||
|
Total current liabilities
|
377
|
|
||
|
Long-term debt, less current maturities
|
564
|
|
||
|
Deferred income taxes
|
488
|
|
||
|
Other non-current liabilities
|
39
|
|
||
|
Noncontrolling interest
|
626
|
|
||
|
2,094
|
|
|||
|
Total consideration
|
1,783
|
|
||
|
Cash received
|
67
|
|
||
|
Total consideration, net of cash received
|
$
|
1,716
|
|
|
|
(1)
|
None of the goodwill is expected to be deductible for tax purposes.
|
The fair values of the assets acquired and liabilities assumed is being determined using various valuation techniques, including the income and market approaches.
ETP incurred merger related costs related to the Susser Merger of
$25 million
during the year ended
December 31, 2014
. Our consolidated statements of operations for the year ended
December 31, 2014
reflected revenue and net income related to Susser of
$2.32 billion
and
$105 million
, respectively.
No pro forma information has been presented for the Susser Merger, as the impact of this acquisition was not material in relation to our consolidated results of operations.
MACS to Sunoco LP
In October 2014, Sunoco LP acquired MACS from a subsidiary of ETP in a transaction valued at approximately
$768 million
(the “MACS Transaction”). The transaction included approximately
110
company-operated retail convenience stores and
200
dealer-operated and consignment sites from MACS, which had originally been acquired by ETP in October 2013. The consideration paid by Sunoco LP consisted of approximately
4 million
Sunoco LP common units issued to ETP and
$556 million
in cash, subject to customary closing adjustments. Sunoco LP initially financed the cash portion by utilizing availability under its revolving credit facility. In October 2014 and November 2014, Sunoco LP partially repaid borrowings on its revolving credit facility with aggregate net proceeds of
$405 million
from a public offering of
9.1 million
Sunoco LP common units.
Lake Charles LNG Transaction
On February 19, 2014, ETP completed the transfer to ETE of Lake Charles LNG, the entity that owns a LNG regasification facility in Lake Charles, Louisiana, in exchange for the redemption by ETP of
18.7 million
ETP Common Units held by ETE (the “Lake Charles LNG Transaction”). The transaction was effective as of January 1, 2014, at which time ETP deconsolidated Lake Charles LNG.
In connection with ETE’s acquisition of Lake Charles LNG, ETP agreed to continue to provide management services for ETE through 2015 in relation to both Lake Charles LNG’s regasification facility and the development of a liquefaction project at Lake Charles LNG’s facility, for which ETE has agreed to pay incremental management fees to ETP of
$75 million
per year for the years ending December 31, 2014 and 2015. ETE also agreed to provide additional subsidies to ETP through the relinquishment of future incentive distributions, as discussed further in Note
9
.
F - 28
Panhandle Merger
On January 10, 2014, Panhandle consummated a merger with Southern Union, the indirect parent of Panhandle at the time of the merger, and PEPL Holdings, a wholly-owned subsidiary of Southern Union and the sole limited partner of Panhandle at the time of the merger, pursuant to which each of Southern Union and PEPL Holdings were merged with and into Panhandle (the “Panhandle Merger”), with Panhandle surviving the Panhandle Merger. In connection with the Panhandle Merger, Panhandle assumed Southern Union’s obligations under its
7.6%
senior notes due 2024,
8.25%
senior notes due 2029 and the junior subordinated notes due 2066. At the time of the Panhandle Merger, Southern Union did not have material operations of its own, other than its ownership of Panhandle and noncontrolling interests in PEI Power II, LLC, Regency (
31.4 million
Regency Common Units and
6.3 million
Regency Class F Units), and ETP (
2.2 million
ETP Common Units). In connection with the Panhandle Merger, Panhandle also assumed PEPL Holdings’ guarantee of
$600 million
of Regency senior notes.
Regency’s Acquisition of PVR Partners, L.P.
On March 21, 2014, Regency acquired PVR for a total purchase price of
$5.7 billion
(based on Regency’s closing price of
$27.82
per Regency Common Unit on March 21, 2014), including
$1.8 billion
principal amount of assumed debt (the “PVR Acquisition”). PVR unitholders received (on a per unit basis)
1.02
Regency Common Units and a one-time cash payment of
$36 million
, which was funded through borrowings under Regency’s revolving credit facility. The PVR Acquisition enhances Regency’s geographic diversity with a strategic presence in the Marcellus and Utica shales in the Appalachian Basin and the Granite Wash in the Mid-Continent region. Regency accounted for the PVR Acquisition using the acquisition method of accounting, which requires, among other things, that assets acquired and liabilities assumed be recognized on the balance sheet at their fair values as of the acquisition date. Our consolidated statement of operations for the year ended December 31, 2014 included revenues and net income attributable to PVR’s operations of
$956 million
and
$166 million
, respectively.
Regency completed the evaluation of the assigned fair values to the assets acquired and liabilities assumed. The total purchase price was allocated as follows:
|
Assets
|
At March 21, 2014
|
||
|
Current assets
|
$
|
149
|
|
|
Property, plant and equipment
|
2,716
|
|
|
|
Investment in unconsolidated affiliates
|
62
|
|
|
|
Intangible assets (average useful life of 30 years)
|
2,717
|
|
|
|
Goodwill
|
370
|
|
|
|
Other non-current assets
|
18
|
|
|
|
Total assets acquired
|
6,032
|
|
|
|
Liabilities
|
|||
|
Current liabilities
|
168
|
|
|
|
Long-term debt
|
1,788
|
|
|
|
Premium related to senior notes
|
99
|
|
|
|
Non-current liabilities
|
30
|
|
|
|
Total liabilities assumed
|
2,085
|
|
|
|
Net assets acquired
|
$
|
3,947
|
|
The fair values of the assets acquired and liabilities assumed were determined using various valuation techniques, including the income and market approaches.
Regency’s Acquisition of Eagle Rock’s Midstream Business
On July 1, 2014, Regency acquired Eagle Rock’s midstream business (the “Eagle Rock Midstream Acquisition”) for
$1.3 billion
, including the assumption of
$499 million
of Eagle Rock’s 8.375% senior notes due 2019. The remainder of the purchase price was funded by
$400 million
in Regency Common Units sold to a wholly-owned subsidiary of ETE,
8.2 million
Regency Common Units issued to Eagle Rock and borrowings under Regency’s revolving credit facility. Regency accounted for the Eagle Rock Midstream Acquisition using the acquisition method of accounting, which requires, among other things, that assets acquired and liabilities assumed be recognized on the balance sheet at their fair values as of the acquisition date. This acquisition complements Regency’s core gathering and processing business and further diversifies Regency’s geographic presence in the Mid-Continent region, east Texas and south Texas. Our consolidated statement of operations for the year
F - 29
ended December 31, 2014 included revenues and net income attributable to Eagle Rock’s operations of
$903 million
and
$30 million
, respectively.
Regency’s evaluation of the assigned fair values is ongoing. The table below represents a preliminary allocation of the total purchase price:
|
Assets
|
At July 1, 2014
|
||
|
Current assets
|
$
|
120
|
|
|
Property, plant and equipment
|
1,295
|
|
|
|
Other non-current assets
|
4
|
|
|
|
Goodwill
(1)
|
49
|
|
|
|
Total assets acquired
|
1,468
|
|
|
|
Liabilities
|
|||
|
Current liabilities
|
116
|
|
|
|
Long-term debt
|
499
|
|
|
|
Other non-current liabilities
|
12
|
|
|
|
Total liabilities assumed
|
627
|
|
|
|
Net assets acquired
|
$
|
841
|
|
|
(1)
|
None of the goodwill is expected to be deductible for tax purposes.
|
The fair values of the assets acquired and liabilities assumed is being determined using various valuation techniques, including the income and market approaches.
Regency’s Acquisition of Hoover Energy
On February 3, 2014, Regency completed its acquistion of certain subsidiaries of Hoover Energy for a total purchase price of
$293 million
, consisted of (i)
4.0 million
Regency Common Units issued to Hoover Energy, (ii)
$184 million
in cash. and (iii)
$2 million
in asset retirement obligations assumed.
2013 Transactions
Sale of Southern Union’s Distribution Operations
In December 2012, Southern Union entered into a purchase and sale agreement with The Laclede Group, Inc., pursuant to which Laclede Missouri agreed to acquire the assets of Southern Union’s MGE division and Laclede Massachusetts agreed to acquire the assets of Southern Union NEG division (together, the “LDC Disposal Group”). Laclede Gas Company, a subsidiary of The Laclede Group, Inc., subsequently assumed all of Laclede Missouri’s rights and obligations under the purchase and sale agreement. In February 2013, The Laclede Group, Inc. entered into an agreement with Algonquin Power & Utilities Corp (“APUC”) that allowed a subsidiary of APUC to assume the rights of The Laclede Group, Inc. to purchase the assets of Southern Union’s NEG division.
In September 2013, Southern Union completed its sale of the assets of MGE for an aggregate purchase price of
$975 million
, subject to customary post-closing adjustments. In December 2013, Southern Union completed its sale of the assets of NEG for cash proceeds of
$40 million
, subject to customary post-closing adjustments, and the assumption of
$20 million
of debt.
The LDC Disposal Group’s operations have been classified as discontinued operations for all periods in the consolidated statements of operations.
F - 30
The following table summarizes selected financial information related to Southern Union’s distribution operations in 2013 through MGE and NEG’s sale dates in September 2013 and December 2013, respectively, and for the period from March 26, 2012 to December 31, 2012:
|
Years Ended December 31,
|
|||||||
|
2013
|
2012
|
||||||
|
Revenue from discontinued operations
|
$
|
415
|
|
$
|
324
|
|
|
|
Net income of discontinued operations, excluding effect of taxes and overhead allocations
|
65
|
|
43
|
|
|||
SUGS Contribution
On April 30, 2013, Southern Union completed its contribution to Regency of all of the issued and outstanding membership interest in Southern Union Gathering Company, LLC, and its subsidiaries, including SUGS (the “SUGS Contribution”). The general partner and IDRs of Regency are owned by ETE. The consideration paid by Regency in connection with this transaction consisted of (i) the issuance of approximately
31.4 million
Regency common units to Southern Union, (ii) the issuance of approximately
6.3 million
Regency Class F units to Southern Union, (iii) the distribution of
$463 million
in cash to Southern Union, net of closing adjustments, and (iv) the payment of
$30 million
in cash to a subsidiary of ETP. This transaction was between commonly controlled entities; therefore, the amounts recorded in the consolidated balance sheet for the investment in Regency and the related deferred tax liabilities were based on the historical book value of SUGS. In addition, PEPL Holdings, provided a guarantee of collection with respect to the payment of the principal amounts of Regency’s debt related to the SUGS Contribution. The Regency Class F units have the same rights, terms and conditions as the Regency common units, except that Southern Union will not receive distributions on the Regency Class F units for the first eight consecutive quarters following the closing, and the Regency Class F units will thereafter automatically convert into Regency common units on a one-for-one basis.
ETP’s Acquisition of ETE’s ETP Holdco Interest
On April 30, 2013, ETP acquired ETE’s
60%
interest in ETP Holdco for approximately
49.5 million
of newly issued ETP Common Units and
$1.40 billion
in cash, less
$68 million
of closing adjustments (the “ETP Holdco Acquisition”). As a result, ETP now owns
100%
of ETP Holdco. ETE, which owns the general partner and IDRs of ETP, agreed to forego incentive distributions on the newly issued ETP units for each of the first eight consecutive quarters beginning with the quarter in which the closing of the transaction occurred and 50% of incentive distributions on the newly issued ETP units for the following eight consecutive quarters. ETP controlled ETP Holdco prior to this acquisition; therefore, the transaction did not constitute a change of control.
2012 Transactions
Southern Union Merger
On March 26, 2012, ETE completed its acquisition of Southern Union. Southern Union was the surviving entity in the merger and operated as a wholly-owned subsidiary of ETE until our contribution to ETP Holdco discussed below.
Under the terms of the merger agreement, Southern Union stockholders received a total of approximately
57 million
ETE Common Units and a total of approximately
$3.01 billion
in cash. Effective with the closing of the transaction, Southern Union’s common stock was no longer publicly traded.
Citrus Acquisition
In connection with the Southern Union Merger on March 26, 2012, ETP completed its acquisition of CrossCountry, a subsidiary of Southern Union which owned an indirect
50%
interest in Citrus, the owner of FGT. The total merger consideration was approximately
$2.0 billion
, consisting of approximately
$1.9 billion
in cash and approximately
2.2 million
ETP Common Units. See Note
4
for more information regarding ETP’s equity method investment in Citrus.
Sunoco Merger
On October 5, 2012, ETP completed its merger with Sunoco, Inc. Under the terms of the merger agreement, Sunoco, Inc. shareholders received a total of approximately
55 million
ETP Common Units and a total of approximately
$2.6 billion
in cash.
F - 31
Sunoco, Inc. generates cash flow from a portfolio of retail outlets for the sale of gasoline and middle distillates in the east coast, midwest and southeast areas of the United States. Prior to October 5, 2012, Sunoco, Inc. also owned a
2%
general partner interest,
100%
of the IDRs, and
32%
of the outstanding common units of Sunoco Logistics. As discussed below, on October 5, 2012, Sunoco, Inc.’s interests in Sunoco Logistics were transferred to ETP.
Prior to the Sunoco Merger, on September 8, 2012, Sunoco, Inc. completed the exit from its Northeast refining operations by contributing the refining assets at its Philadelphia refinery and various commercial contracts to PES, a joint venture with The Carlyle Group, L.P. (“The Carlyle Group”). Sunoco, Inc. also permanently idled the main refining processing units at its Marcus Hook refinery in June 2012. The Marcus Hook Industrial Complex continued to support operations at the Philadelphia refinery prior to commencement of the PES joint venture. Under the terms of the joint venture agreement, The Carlyle Group contributed cash in exchange for a
67%
controlling interest in PES. In exchange for contributing its Philadelphia refinery assets and various commercial contracts to the joint venture, Sunoco, Inc. retained an approximately
33%
non-operating noncontrolling interest. The fair value of Sunoco, Inc.’s retained interest in PES, which was
$75 million
on the date on which the joint venture was formed, was determined based on the equity contributions of The Carlyle Group. Sunoco, Inc. has indemnified PES for environmental liabilities related to the Philadelphia refinery that arose from the operation of such assets prior the formation of the joint venture. The Carlyle Group will oversee day-to-day operations of PES and the refinery. JPMorgan Chase provides working capital financing to PES in the form of an asset-backed loan, supply crude oil and other feedstocks to the refinery at the time of processing and purchase certain blendstocks and all finished refined products as they are processed. Sunoco, Inc. entered into a supply contract for gasoline and diesel produced at the refinery for its retail marketing business.
ETP incurred merger related costs related to the Sunoco Merger of
$28 million
during the year ended December 31, 2012. Sunoco, Inc.’s revenue included in our consolidated statement of operations was approximately
$5.93 billion
during October through December 2012. Sunoco, Inc.’s net loss included in our consolidated statement of operations was approximately
$14 million
during October through December 2012. Sunoco Logistics’ revenue included in our consolidated statement of operations was approximately
$3.11 billion
during October through December 2012. Sunoco Logistics’ net income included in our consolidated statement of operations was approximately
$145 million
during October through December 2012.
ETP Holdco Transaction
Immediately following the closing of the Sunoco Merger, ETE contributed its interest in Southern Union into ETP Holdco, an ETP-controlled entity, in exchange for a
60%
equity interest in ETP Holdco. In conjunction with ETE’s contribution, ETP contributed its interest in Sunoco, Inc. to ETP Holdco and retained a
40%
equity interest in ETP Holdco. Prior to the contribution of Sunoco, Inc. to ETP Holdco, Sunoco, Inc. contributed
$2.0 billion
of cash and its interests in Sunoco Logistics to ETP in exchange for
90.7
million Class F Units representing limited partner interests in ETP (“ETP Class F Units”). The Class F Units were exchanged for Class G Units in 2013 as discussed in Note
9
. Pursuant to a stockholders agreement between ETE and ETP, ETP controlled ETP Holdco (prior to ETP’s acquisition of ETE’s 60% equity interest in ETP Holdco in 2013) and therefore, ETP consolidated ETP Holdco (including Sunoco, Inc. and Southern Union) in its financial statements subsequent to consummation of the ETP Holdco Transaction.
Under the terms of the ETP Holdco transaction agreement, ETE agreed to relinquish its right to
$210 million
of incentive distributions from ETP that ETE would otherwise be entitled to receive over
12
consecutive quarters beginning with the distribution paid on November 14, 2012.
Summary of Assets Acquired and Liabilities Assumed
We accounted for the Southern Union Merger and Sunoco Merger using the acquisition method of accounting, which requires, among other things, that assets acquired and liabilities assumed be recognized on the balance sheet at their fair values as of the acquisition date.
F - 32
The following table summarizes the assets acquired and liabilities assumed as of the respective acquisition dates:
|
Sunoco, Inc.
(1)
|
Southern Union
(2)
|
||||||
|
Current assets
|
$
|
7,312
|
|
$
|
556
|
|
|
|
Property, plant and equipment
|
6,686
|
|
6,242
|
|
|||
|
Goodwill
|
2,641
|
|
2,497
|
|
|||
|
Intangible assets
|
1,361
|
|
55
|
|
|||
|
Investments in unconsolidated affiliates
|
240
|
|
2,023
|
|
|||
|
Note receivable
|
821
|
|
—
|
|
|||
|
Other assets
|
128
|
|
163
|
|
|||
|
19,189
|
|
11,536
|
|
||||
|
Current liabilities
|
4,424
|
|
1,348
|
|
|||
|
Long-term debt obligations, less current maturities
|
2,879
|
|
3,120
|
|
|||
|
Deferred income taxes
|
1,762
|
|
1,419
|
|
|||
|
Other non-current liabilities
|
769
|
|
284
|
|
|||
|
Noncontrolling interest
|
3,580
|
|
—
|
|
|||
|
13,414
|
|
6,171
|
|
||||
|
Total consideration
|
5,775
|
|
5,365
|
|
|||
|
Cash received
|
2,714
|
|
37
|
|
|||
|
Total consideration, net of cash received
|
$
|
3,061
|
|
$
|
5,328
|
|
|
|
(1)
|
Includes amounts recorded with respect to Sunoco Logistics.
|
|
(2)
|
Includes ETP’s acquisition of Citrus.
|
The fair values of the assets acquired and liabilities assumed were determined using various valuation techniques, including the income and market approaches.
As a result of the Southern Union Merger, we recognized
$38 million
of merger-related costs during the year ended December 31, 2012. Southern Union’s revenue included in our consolidated statement of operations was approximately
$1.26 billion
since the acquisition date to December 31, 2012. Southern Union’s net income included in our consolidated statement of operations was approximately
$39 million
since the acquisition date to December 31, 2012.
Propane Operations
On January 12, 2012, ETP contributed its propane operations, consisting of HOLP and Titan to AmeriGas. ETP received approximately
$1.46 billion
in cash and approximately
29.6 million
AmeriGas common units. AmeriGas assumed approximately
$71 million
of existing HOLP debt. In connection with the closing of this transaction, ETP entered into a support agreement with AmeriGas pursuant to which ETP is obligated to provide contingent, residual support of
$1.50 billion
of intercompany indebtedness owed by AmeriGas to a finance subsidiary that in turn supports the repayment of
$1.50 billion
of senior notes issued by this AmeriGas finance subsidiary to finance the cash portion of the purchase price.
Our consolidated financial statements did not reflect the Propane Business as discontinued operations due to ETP’s continuing involvement in this business through their investment in AmeriGas that was transferred to ETP as consideration for the transaction.
In June 2012, ETP sold the remainder of its retail propane operations, consisting of its cylinder exchange business, to a third party. In connection with the contribution agreement with AmeriGas, certain excess sales proceeds from the sale of the cylinder exchange business were remitted to AmeriGas, and ETP received net proceeds of approximately
$43 million
.
Sale of Canyon
In October 2012, ETP sold Canyon for approximately
$207 million
. The results of continuing operations of Canyon have been reclassified to loss from discontinued operations. A write down of the carrying amounts of the Canyon assets to their fair values was recorded for approximately
$132 million
during the year ended December 31, 2012.
F - 33
Pro Forma Results of Operations
The following unaudited pro forma consolidated results of operations for the years ended December 31, 2014,
2013
and 2012 are presented as if Sunoco Merger and the ETP Holdco Transaction had been completed on January 1, 2012, and the PVR and Eagle Rock Midstream acquisitions had been completed on January 1, 2013, and assumes there were no other changes in operations.
|
|
Years Ended December 31,
|
||||||||||
|
|
2014
|
2013
|
2012
|
||||||||
|
Revenues
|
$
|
56,517
|
|
$
|
50,473
|
|
$
|
40,398
|
|
||
|
Net income
|
1,098
|
|
252
|
|
868
|
|
|||||
|
Net income attributable to partners
|
607
|
|
133
|
|
866
|
|
|||||
|
Basic net income per Limited Partner unit
|
$
|
1.12
|
|
$
|
0.24
|
|
$
|
1.55
|
|
||
|
Diluted net income per Limited Partner unit
|
$
|
1.11
|
|
$
|
0.24
|
|
$
|
1.55
|
|
||
The pro forma consolidated results of operations include adjustments to:
|
•
|
include the results of Southern Union and Sunoco, Inc. beginning January 1, 2012;
|
|
•
|
include the results of PVR and Eagle Rock midstream beginning January 1, 2013;
|
|
•
|
include the incremental expenses associated with the fair value adjustments recorded as a result of applying the acquisition method of accounting; and
|
•
include incremental interest expense related to the financing of a proportionate share of the purchase price.
The pro forma information is not necessarily indicative of the results of operations that would have occurred had the transactions been made at the beginning of the periods presented or the future results of the combined operations.
F - 34
|
4.
|
ADVANCES TO AND INVESTMENTS IN UNCONSOLIDATED AFFILIATES
:
|
AmeriGas
As discussed in
Note 3
, on January 12, 2012, ETP received approximately
29.6 million
AmeriGas common units in connection with the contribution of its propane operations. In the year ended
2013
, ETP sold
7.5 million
AmeriGas common units for net proceeds of
$346 million
, and in the year ended
2014
, ETP sold approximately
18.9 million
AmeriGas common units for net proceeds of
$814 million
. Net proceeds from these sales were used to repay borrowings under the ETP Credit Facility and general partnership purposes. Subsequent to the sales, ETP’s remaining interest in AmeriGas common units consisted of
3.1 million
units held by a wholly-owned captive insurance company.
Citrus
On March 26, 2012, ETE consummated the acquisition of Southern Union and, concurrently with the closing of the Southern Union acquisition, CrossCountry, a subsidiary of Southern Union that indirectly owned a
50%
interest in Citrus, merged with a subsidiary of ETP and, in connection therewith, ETP paid approximately
$1.9 billion
in cash and issued
$105 million
of ETP Common Units (the “Citrus Acquisition”) to a subsidiary of ETE. As a result of the consummation of the Citrus Acquisition, ETP owns CrossCountry, which in turn owns a
50%
interest in Citrus. The other
50%
interest in Citrus is owned by a subsidiary of Kinder Morgan, Inc. Citrus owns
100%
of FGT, a natural gas pipeline system that originates in Texas and delivers natural gas to the Florida peninsula.
ETP recorded its investment in Citrus at
$2.0 billion
, which exceeded its proportionate share of Citrus’ equity by
$1.03 billion
, all of which is treated as equity method goodwill due to the application of regulatory accounting. The carrying amount of ETP’s investment in Citrus was
$1.82 billion
and
$1.89 billion
at
December 31, 2014
and
2013
, respectively, and was reflected in ETP’s interstate transportation and storage operations.
FEP
ETP has a
50%
interest in FEP, a 50/50 joint venture with Kinder Morgan, Inc. FEP owns the Fayetteville Express pipeline, an approximately 185-mile natural gas pipeline that originates in Conway County, Arkansas, continues eastward through White County, Arkansas and terminates at an interconnect with Trunkline Gas Company in Panola County, Mississippi. The carrying amount of ETP’s investment in FEP was
$130 million
and
$144 million
as of
December 31, 2014
and
2013
, respectively, and was reflected in ETP’s interstate transportation and storage operations.
Midcontinent Express Pipeline LLC
Regency owns a
50%
interest in MEP, which owns approximately 500 miles of natural gas pipelines that extend from Southeast Oklahoma, across Northeast Texas, Northern Louisiana and Central Mississippi to an interconnect with the Transcontinental natural gas pipeline system in Butler, Alabama. The carrying amount of Regency’s investment in MEP was
$695 million
and
$548 million
as of
December 31, 2014
and
2013
, respectively, and was reflected in Regency’s natural gas transportation operations.
RIGS Haynesville Partnership Co.
Regency owns a
49.99%
interest in HPC, which, through its ownership of RIGS, delivers natural gas from Northwest Louisiana to downstream pipelines and markets through a 450-mile intrastate pipeline system. The carrying amount of Regency’s investment in HPC was
$422 million
and
$442 million
as of
December 31, 2014
and
2013
, respectively, and was reflected in Regency’s natural gas transportation operations.
F - 35
Summarized Financial Information
The following tables present aggregated selected balance sheet and income statement data for our unconsolidated affiliates, including AmeriGas, Citrus, FEP, HPC and MEP (on a 100% basis for all periods presented).
|
|
December 31,
|
||||||
|
|
2014
|
2013
|
|||||
|
Current assets
|
$
|
889
|
|
$
|
1,028
|
|
|
|
Property, plant and equipment, net
|
10,520
|
|
10,778
|
|
|||
|
Other assets
|
2,687
|
|
2,664
|
|
|||
|
Total assets
|
$
|
14,096
|
|
$
|
14,470
|
|
|
|
Current liabilities
|
$
|
1,983
|
|
$
|
1,039
|
|
|
|
Non-current liabilities
|
7,359
|
|
8,139
|
|
|||
|
Equity
|
4,754
|
|
5,292
|
|
|||
|
Total liabilities and equity
|
$
|
14,096
|
|
$
|
14,470
|
|
|
|
|
Years Ended December 31,
|
||||||||||
|
|
2014
|
2013
|
2012
|
||||||||
|
Revenue
|
$
|
4,925
|
|
$
|
4,695
|
|
$
|
4,492
|
|
||
|
Operating income
|
1,071
|
|
1,197
|
|
863
|
|
|||||
|
Net income
|
577
|
|
699
|
|
491
|
|
|||||
In addition to the equity method investments described above our subsidiaries have other equity method investments which are not significant to our consolidated financial statements.
F - 36
|
5.
|
NET INCOME PER LIMITED PARTNER UNIT
:
|
Basic net income per limited partner unit is computed by dividing net income, after considering the General Partner’s interest, by the weighted average number of limited partner interests outstanding. Diluted net income per limited partner unit is computed by dividing net income (as adjusted as discussed herein), after considering the General Partner’s interest, by the weighted average number of limited partner interests outstanding and the assumed conversion of our Preferred Units, see Note
7
. For the diluted earnings per share computation, income allocable to the limited partners is reduced, where applicable, for the decrease in earnings from ETE’s limited partner unit ownership in ETP or Regency that would have resulted assuming the incremental units related to ETP’s or Regency’s equity incentive plans, as applicable, had been issued during the respective periods. Such units have been determined based on the treasury stock method.
The calculation below for the year ended December 31, 2012 for diluted net income per limited partner unit excludes the impact of any ETE Common Units that would be issued upon conversion of the Preferred Units, because inclusion would have been antidilutive. The Preferred Units were redeemed April 1, 2013 as discussed in Note
7
.
A reconciliation of net income and weighted average units used in computing basic and diluted net income per unit is as follows:
|
|
Years Ended December 31,
|
||||||||||
|
|
2014
|
2013
|
2012
|
||||||||
|
Income from continuing operations
|
$
|
1,060
|
|
$
|
282
|
|
$
|
1,383
|
|
||
|
Less: Income from continuing operations attributable to noncontrolling interest
|
434
|
|
99
|
|
1,070
|
|
|||||
|
Income from continuing operations, net of noncontrolling interest
|
626
|
|
183
|
|
313
|
|
|||||
|
Less: General Partner’s interest in income from continuing operations
|
2
|
|
—
|
|
1
|
|
|||||
|
Less: Class D Unitholder’s interest in income from continuing operations
|
2
|
|
—
|
|
—
|
|
|||||
|
Income from continuing operations available to Limited Partners
|
$
|
622
|
|
$
|
183
|
|
$
|
312
|
|
||
|
Basic Income from Continuing Operations per Limited Partner Unit:
|
|||||||||||
|
Weighted average limited partner units
|
544.3
|
|
560.9
|
|
533.4
|
|
|||||
|
Basic income from continuing operations per Limited Partner unit
|
$
|
1.15
|
|
$
|
0.33
|
|
$
|
0.59
|
|
||
|
Basic income (loss) from discontinued operations per Limited Partner unit
|
$
|
0.01
|
|
$
|
0.02
|
|
$
|
(0.02
|
)
|
||
|
Diluted Income from Continuing Operations per Limited Partner Unit:
|
|||||||||||
|
Income from continuing operations available to Limited Partners
|
$
|
622
|
|
$
|
183
|
|
$
|
312
|
|
||
|
Dilutive effect of equity-based compensation of subsidiaries and distributions to Class D Unitholder
|
(2
|
)
|
—
|
|
(1
|
)
|
|||||
|
Diluted income from continuing operations available to Limited Partners
|
620
|
|
183
|
|
311
|
|
|||||
|
Weighted average limited partner units
|
544.3
|
|
560.9
|
|
533.4
|
|
|||||
|
Dilutive effect of unconverted unit awards
|
1.1
|
|
—
|
|
—
|
|
|||||
|
Weighted average limited partner units, assuming dilutive effect of unvested unit awards
|
545.4
|
|
560.9
|
|
533.4
|
|
|||||
|
Diluted income from continuing operations per Limited Partner unit
|
$
|
1.14
|
|
$
|
0.33
|
|
$
|
0.59
|
|
||
|
Diluted income (loss) from discontinued operations per Limited Partner unit
|
$
|
0.01
|
|
$
|
0.02
|
|
$
|
(0.02
|
)
|
||
F - 37
|
6.
|
DEBT OBLIGATIONS:
|
Our debt obligations consist of the following:
|
|
December 31,
|
||||||
|
|
2014
|
2013
|
|||||
|
Parent Company Indebtedness:
|
|||||||
|
7.50% Senior Notes, due October 15, 2020
|
$
|
1,187
|
|
$
|
1,187
|
|
|
|
5.875% Senior Notes, due January 15, 2024
|
1,150
|
|
450
|
|
|||
|
ETE Senior Secured Term Loan, due December 2, 2019
|
1,400
|
|
1,000
|
|
|||
|
ETE Senior Secured Revolving Credit Facility due December 18, 2018
|
940
|
|
171
|
|
|||
|
Unamortized premiums, discounts and fair value adjustments, net
|
3
|
|
(7
|
)
|
|||
|
4,680
|
|
2,801
|
|
||||
|
Subsidiary Indebtedness:
|
|||||||
|
ETP Debt
|
|||||||
|
8.5% Senior Notes due April 15, 2014
|
—
|
|
292
|
|
|||
|
5.95% Senior Notes due February 1, 2015
|
750
|
|
750
|
|
|||
|
6.125% Senior Notes due February 15, 2017
|
400
|
|
400
|
|
|||
|
6.7% Senior Notes due July 1, 2018
|
600
|
|
600
|
|
|||
|
9.7% Senior Notes due March 15, 2019
|
400
|
|
400
|
|
|||
|
9.0% Senior Notes due April 15, 2019
|
450
|
|
450
|
|
|||
|
4.15% Senior Notes due October 1, 2020
|
700
|
|
700
|
|
|||
|
4.65% Senior Notes due June 1, 2021
|
800
|
|
800
|
|
|||
|
5.20% Senior Notes due February 1, 2022
|
1,000
|
|
1,000
|
|
|||
|
3.60% Senior Notes due February 1, 2023
|
800
|
|
800
|
|
|||
|
4.9% Senior Notes due February 1, 2024
|
350
|
|
350
|
|
|||
|
7.6% Senior Notes due February 1, 2024
|
277
|
|
277
|
|
|||
|
8.25% Senior Notes due November 15, 2029
|
267
|
|
267
|
|
|||
|
6.625% Senior Notes due October 15, 2036
|
400
|
|
400
|
|
|||
|
7.5% Senior Notes due July 1, 2038
|
550
|
|
550
|
|
|||
|
6.05% Senior Notes due June 1, 2041
|
700
|
|
700
|
|
|||
|
6.5% Senior Notes due February 1, 2042
|
1,000
|
|
1,000
|
|
|||
|
5.15% Senior Notes due February 1, 2043
|
450
|
|
450
|
|
|||
|
5.95% Senior Notes due October 1, 2043
|
450
|
|
450
|
|
|||
|
Floating Rate Junior Subordinated Notes due November 1, 2066
|
546
|
|
546
|
|
|||
|
ETP $2.5 billion Revolving Credit Facility due October 27, 2019
|
570
|
|
65
|
|
|||
|
Unamortized premiums, discounts and fair value adjustments, net
|
(1
|
)
|
(34
|
)
|
|||
|
11,459
|
|
11,213
|
|
||||
|
Panhandle Debt
(1)
|
|||||||
|
6.20% Senior Notes due November 1, 2017
|
300
|
|
300
|
|
|||
|
7.00% Senior Notes due June 15, 2018
|
400
|
|
400
|
|
|||
|
8.125% Senior Notes due June 1, 2019
|
150
|
|
150
|
|
|||
|
7.60% Senior Notes due February 1, 2024
|
82
|
|
82
|
|
|||
|
7.00% Senior Notes due July 15, 2029
|
66
|
|
66
|
|
|||
|
8.25% Senior Notes due November 14, 2029
|
33
|
|
33
|
|
|||
|
Floating Rate Junior Subordinated Notes due November 1, 2066
|
54
|
|
54
|
|
|||
|
Unamortized premiums, discounts and fair value adjustments, net
|
99
|
|
155
|
|
|||
|
1,184
|
|
1,240
|
|
||||
|
Regency Debt
|
|||||||
|
6.875% Senior Notes due December 1, 2018
|
—
|
|
600
|
|
|||
|
5.75% Senior Notes due September 1, 2020
|
400
|
|
400
|
|
|||
|
6.5% Senior Notes due July 15, 2021
|
500
|
|
500
|
|
|||
|
5.875% Senior Notes due March 1, 2022
|
900
|
|
—
|
|
|||
|
5.5% Senior Notes due April 15, 2023
|
700
|
|
700
|
|
|||
|
4.5% Senior Notes due November 1, 2023
|
600
|
|
600
|
|
|||
F - 38
|
8.375% Senior Notes due June 1, 2020
|
390
|
|
—
|
|
|||
|
6.5% Senior Notes due May 15, 2021
|
400
|
|
—
|
|
|||
|
8.375% Senior Notes due June 1, 2019
|
499
|
|
—
|
|
|||
|
5.0% Senior Notes due October 1, 2022
|
700
|
|
—
|
|
|||
|
Regency $1.2 billion Revolving Credit Facility due November 25, 2019
|
1,504
|
|
510
|
|
|||
|
Unamortized premiums, discounts and fair value adjustments, net
|
48
|
|
—
|
|
|||
|
6,641
|
|
3,310
|
|
||||
|
Sunoco, Inc. Debt
|
|||||||
|
4.875% Senior Notes due October 15, 2014
|
—
|
|
250
|
|
|||
|
9.625% Senior Notes due April 15, 2015
|
250
|
|
250
|
|
|||
|
5.75% Senior Notes due January 15, 2017
|
400
|
|
400
|
|
|||
|
9.00% Debentures due November 1, 2024
|
65
|
|
65
|
|
|||
|
Unamortized premiums, discounts and fair value adjustments, net
|
35
|
|
70
|
|
|||
|
750
|
|
1,035
|
|
||||
|
Sunoco Logistics Debt
|
|||||||
|
8.75% Senior Notes due February 15, 2014
(2)
|
—
|
|
175
|
|
|||
|
6.125% Senior Notes due May 15, 2016
|
175
|
|
175
|
|
|||
|
5.50% Senior Notes due February 15, 2020
|
250
|
|
250
|
|
|||
|
4.65% Senior Notes due February 15, 2022
|
300
|
|
300
|
|
|||
|
3.45% Senior Notes due January 15, 2023
|
350
|
|
350
|
|
|||
|
4.25% Senior Notes due April 1, 2024
|
500
|
|
—
|
|
|||
|
6.85% Senior Notes due February 1, 2040
|
250
|
|
250
|
|
|||
|
6.10% Senior Notes due February 15, 2042
|
300
|
|
300
|
|
|||
|
4.95% Senior Notes due January 15, 2043
|
350
|
|
350
|
|
|||
|
5.30% Senior Notes due April 1, 2044
|
700
|
|
—
|
|
|||
|
5.35% Senior Notes due May 15, 2045
|
800
|
|
—
|
|
|||
|
Sunoco Logistics $35 million Revolving Credit Facility due April 30, 2015
(3)
|
35
|
|
35
|
|
|||
|
Sunoco Logistics $1.50 billion Revolving Credit Facility due November 19, 2018
|
150
|
|
200
|
|
|||
|
Unamortized premiums, discounts and fair value adjustments, net
|
100
|
|
118
|
|
|||
|
4,260
|
|
2,503
|
|
||||
|
Sunoco LP Debt
|
|||||||
|
Sunoco LP $1.25 billion Revolving Credit Facility due September 25, 2019
|
683
|
|
—
|
|
|||
|
683
|
|
—
|
|
||||
|
Transwestern Debt
|
|||||||
|
5.39% Senior Notes due November 17, 2014
|
—
|
|
88
|
|
|||
|
5.54% Senior Notes due November 17, 2016
|
125
|
|
125
|
|
|||
|
5.64% Senior Notes due May 24, 2017
|
82
|
|
82
|
|
|||
|
5.36% Senior Notes due December 9, 2020
|
175
|
|
175
|
|
|||
|
5.89% Senior Notes due May 24, 2022
|
150
|
|
150
|
|
|||
|
5.66% Senior Notes due December 9, 2024
|
175
|
|
175
|
|
|||
|
6.16% Senior Notes due May 24, 2037
|
75
|
|
75
|
|
|||
|
Unamortized premiums, discounts and fair value adjustments, net
|
(1
|
)
|
(1
|
)
|
|||
|
781
|
|
869
|
|
||||
|
Other
|
223
|
|
228
|
|
|||
|
30,661
|
|
23,199
|
|
||||
|
Less: current maturities
|
1,008
|
|
637
|
|
|||
|
$
|
29,653
|
|
$
|
22,562
|
|
||
|
(1)
|
In connection with the Panhandle Merger, Southern Union’s debt obligations were assumed by Panhandle.
|
|
(2)
|
Sunoco Logistics’
8.75%
senior notes due February 15, 2014 were classified as long-term debt as Sunoco Logistics repaid these notes in February 2014 with borrowings under its
$1.50 billion
credit facility due November 2018.
|
F - 39
|
(3)
|
The Sunoco Logistics
$35 million
credit facility outstanding amounts were classified as long-term debt as Sunoco Logistics has the ability and intent to refinance such borrowings on a long-term basis.
|
The following table reflects future maturities of long-term debt for each of the next five years and thereafter. These amounts exclude
$283 million
in unamortized premiums and fair value adjustments, net:
|
2015
|
$
|
1,050
|
|
|
2016
|
314
|
|
|
|
2017
|
1,228
|
|
|
|
2018
|
2,095
|
|
|
|
2019
|
5,662
|
|
|
|
Thereafter
|
20,029
|
|
|
|
Total
|
$
|
30,378
|
|
Long-term debt reflected on our consolidated balance sheets includes fair value adjustments related to interest rate swaps, which represent fair value adjustments that had been recorded in connection with fair value hedge accounting prior to the termination of the interest rate swap.
Notes and Debentures
ETE Senior Notes
The ETE Senior Notes are the Parent Company’s senior obligations, ranking equally in right of payment with our other existing and future unsubordinated debt and senior to any of its future subordinated debt. The Parent Company’s obligations under the ETE Senior Notes are secured on a first-priority basis with its obligations under the Revolver Credit Agreement and the ETE Term Loan Facility, by a lien on substantially all of the Parent Company’s and certain of its subsidiaries’ tangible and intangible assets, subject to certain exceptions and permitted liens. The ETE Senior Notes are not guaranteed by any of the Parent Company’s subsidiaries.
The covenants related to the ETE Senior Notes include a limitation on liens, a limitation on transactions with affiliates, a restriction on sale-leaseback transactions and limitations on mergers and sales of all or substantially all of the Parent Company’s assets.
As discussed above, the Parent Company’s outstanding senior notes are collateralized by its interests in certain of its subsidiaries. SEC Rule 3-16 of Regulation S-X (“Rule 3-16”) requires a registrant to file financial statements for each of its affiliates whose securities constitute a substantial portion of the collateral for registered securities. The Parent Company’s limited partner interests in ETP and Regency constitute substantial portions of the collateral for the Parent Company’s outstanding senior notes; accordingly, financial statements of ETP and Regency are required under Rule 3-16 to be included in this Annual Report on Form 10-K and have been included herein.
The Parent Company’s interests in ETP GP, ETE Common Holdings, LLC, ETE GP Acquirer LLC, and Regency GP LP (collectively, the “Non-Reporting Entities”) also constitute substantial portions of the collateral for the Parent Company’s outstanding senior notes. Accordingly, the financial statements of the Non-Reporting Entities would be required under Rule 3-16 to be included in the Parent Company’s Annual Report on Form 10-K. None of the Non-Reporting Entities has substantive operations of its own; rather, each of the Non-Reporting Entities holds only direct or indirect interests in ETP, Regency and/or the consolidated subsidiaries of ETP and Regency. Following is a summary of the interests held by each of the Non-Reporting Entities, as well as a summary of the significant differences between each of the Non-Reporting Entities compared to ETP and Regency, as applicable:
|
•
|
ETP GP owns 100% of the general partner interest in ETP. ETP GP does not own limited partner interests in ETP; therefore, the limited partner interests in ETP, which had a carrying value of
$11.9 billion
and
$11.3 billion
as of December 31, 2014 and 2013, respectively, would be reflected as noncontrolling interests on ETP GP’s balance sheets. Likewise, ETP’s income (loss) attributable to limited partners (including common unitholders and Class H unitholders) of
$823 million
,
$(50) million
and
$1.11 billion
for the years ended December 31, 2014, 2013 and 2012, respectively, would be reflected as income attributable to noncontrolling interest in ETP GP’s statements of operations.
|
|
•
|
ETE Common Holdings, LLC (“ETE Common Holdings”) owns 5.2 million ETP Common Units, representing approximately 1.5% of the total outstanding ETP Common Units, and 50.2 million ETP Class H Units, representing 100% of the total outstanding ETP Class H Units. ETE Common Holdings also owns 30.9 million Regency Common
|
F - 40
Units, representing approximately 7.5% of the total outstanding Regency Common Units; ETE Common Holdings’ interest in Regency was acquired in 2014. ETE Common Holdings does not own the general partner interests in ETP or Regency; therefore, the financial statements of ETE Common Holdings would only reflect equity method investments in ETP and Regency. The carrying values of ETE Common Holdings’ investments in ETP and Regency were
$1.72 billion
and
$760 million
, respectively, as of December 31, 2014 and
$1.66 billion
and
zero
, respectively, as of December 31, 2013. ETE Common Holdings’ equity in earnings (losses) from its investments in ETP and Regency were
$292 million
and
$(9) million
, respectively, for the year ended December 31, 2014 and
$134 million
and
zero
, respectively, for the period from April 26, 2013 (inception of ETE Common Holdings) to December 31, 2013.
|
•
|
ETE GP Acquirer LLC (“ETE GP Acquirer”) owns 100% of Regency GP, which owns 100% of the general partner interest in Regency. Neither ETE GP Acquirer nor Regency GP own limited partner interests in Regency; therefore, the limited partner interests in Regency, which had a carrying value of
$8.7 billion
and
$4.0 billion
as of December 31, 2014 and 2013, respectively, would be reflected as noncontrolling interests on ETE GP Acquirer’s and Regency GP’s balance sheets. Likewise, Regency’s income (loss) attributable to limited partners and preferred unitholders, which totaled
$(188) million
,
$8 million
and
$23 million
for the years ended December 31, 2014, 3013 and 2012, respectively, would be reflected as income attributable to noncontrolling interest in ETE GP Acquirer’s and Regency GP’s statements of operations.
|
ETP’s general partner interest, Common Units and Class H Units are reflected separately in ETP’s financial statements, and Regency’s general partner interest and Common Units are reflected separately in Regency’s financial statements. As a result, the financial statements of the Non-Reporting Entities would substantially duplicate information that is available in the financial statements of ETP and Regency. Therefore, the financial statements of the Non-Reporting Entities have been excluded from this Annual Report on Form 10-K.
ETP as Co-Obligor of Sunoco, Inc. Debt
In connection with the Sunoco Merger and ETP Holdco Transaction, ETP became a co-obligor on approximately
$965 million
of aggregate principal amount of Sunoco, Inc.’s existing senior notes and debentures. The balance of these notes was
$715 million
as of December 31, 2014.
Panhandle Junior Subordinated Notes
The interest rate on the remaining portion of Panhandle’s junior subordinated notes due 2066 is a variable rate based upon the
three-month LIBOR rate plus 3.0175%
. The balance of the variable rate portion of the junior subordinated notes was
$54 million
at an effective interest rate of
3.26%
at
December 31, 2014
.
ETP Senior Notes
The ETP senior notes were registered under the Securities Act of 1933 (as amended). ETP may redeem some or all of the ETP senior notes at any time, or from time to time, pursuant to the terms of the indenture and related indenture supplements related to the ETP senior notes. The balance is payable upon maturity. Interest on the ETP senior notes is paid semi-annually.
The ETP senior notes are unsecured obligations of ETP and the obligation of ETP to repay the ETP senior notes is not guaranteed by us or any of ETP’s subsidiaries. As a result, the ETP senior notes effectively rank junior to any future indebtedness of ours or our subsidiaries that is both secured and unsubordinated to the extent of the value of the assets securing such indebtedness, and the ETP senior notes effectively rank junior to all indebtedness and other liabilities of our existing and future subsidiaries.
Transwestern Senior Notes
The Transwestern notes are payable at any time in whole or pro rata in part, subject to a premium or upon a change of control event or an event of default, as defined. The balance is payable upon maturity. Interest is payable semi-annually.
Sunoco Logistics Senior Notes Offerings
In April 2014, Sunoco Logistics issued
$300 million
aggregate principal amount of
4.25%
senior notes due April 2024 and
$700 million
aggregate principal amount of
5.30%
senior notes due April 2044.
In November 2014, Sunoco Logistics issued an additional
$200 million
under the April 2024 senior notes and
$800 million
aggregate principal amount of
5.35%
senior notes due May 2045. Sunoco Logistics used the net proceeds from the offerings to pay borrowings under the Sunoco Logistics Credit Facility and for general partnership purposes.
F - 41
Regency Senior Notes
The Regency senior notes are unsecured obligations of Regency and the obligation of Regency to repay the Regency senior notes is not guaranteed by us or any of Regency’s subsidiaries. The Regency senior notes effectively rank junior to all indebtedness and other liabilities of Regency’s existing and future subsidiaries. Interest is payable semi-annually.
In February 2014, Regency issued
$900 million
aggregate principal amount of 5.875% senior notes due March 1, 2022.
In March 2014, as part of the PVR Acquisition, Regency assumed the outstanding senior notes of PVR with an aggregate notional amount of
$1.2 billion
. The PVR senior notes consisted of
$300 million
principal amount of 8.25% senior notes due April 15, 2018,
$400 million
principal amount of 6.5% senior notes due May 15, 2021, and
$473 million
principal amount of 8.375% senior notes due June 1, 2020. In April 2014, Regency redeemed all of the
$300 million
principal amount of 8.25% senior notes due April 15, 2018 for
$313 million
in cash. In July 2014, Regency redeemed
$83 million
of the
$473 million
principal amount of 8.375% senior notes due June 1, 2020 for
$91 million
, including
$8 million
of accrued interest and redemption premium.
In July 2014, Regency exchanged
$499 million
aggregate principal amount of 8.375% senior notes due 2019 of Eagle Rock and Eagle Rock Energy Finance Corp. for 8.375% senior notes due 2019 issued by Regency and its wholly-owned subsidiary.
In July 2014, Regency issued
$700 million
aggregate principal amount of 5.0% senior notes that mature on October 1, 2022.
In December 2014, Regency redeemed all of the outstanding
$600 million
senior notes due 2018, for a total price of
$621 million
.
Term Loans and Credit Facilities
ETE Term Loan Facility
The Parent Company has a Senior Secured Term Loan Agreement (the “ETE Term Credit Agreement”), which has a scheduled maturity date of December 2, 2019, with an option to extend the term subject to the terms and conditions set forth therein. Pursuant to the ETE Term Credit Agreement, the lenders have provided senior secured financing in an aggregate principal amount of
$1.0 billion
(the “ETE Term Loan Facility”). The Parent Company shall not be required to make any amortization payments with respect to the term loans under the Term Credit Agreement. Under certain circumstances, the Partnership is required to repay the term loan in connection with dispositions of (a) incentive distribution rights in ETP or Regency, (b) general partnership interests in Regency or (c) equity interests of any Person which owns, directly or indirectly, incentive distribution rights in ETP or Regency or general partnership interests in Regency, in each case, yielding net proceeds in excess of
$50 million
.
Under the Term Credit Agreement, the obligations of the Parent Company are secured by a lien on substantially all of the Parent Company’s and certain of its subsidiaries’ tangible and intangible assets, subject to certain exceptions and permitted liens. The ETE Term Loan Facility initially is not guaranteed by any of the Parent Company’s subsidiaries.
Interest accrues on advances at a LIBOR rate or a base rate plus an applicable margin based on the election of the Parent Company for each interest period. The applicable margin for LIBOR rate loans is
2.50%
and the applicable margin for base rate loans is
1.50%
.
In April 2014, the Parent Company amended its Senior Secured Term Loan Agreement (the “ETE Term Credit Agreement”) to increase the aggregate principal amount to
$1.4 billion
. The Parent Company used the proceeds from this
$400 million
increase to repay borrowings under its revolving credit facility and for general partnership purposes. No other significant changes were made to the terms of the ETE Term Credit Agreement, including maturity date and interest rate.
ETE Revolving Credit Facility
The Parent Company has a credit agreement (the “Revolving Credit Agreement”) which has a scheduled maturity date of December 2, 2018, with an option for the Partnership to extend the term subject to the terms and conditions set forth therein.
Pursuant to the Revolver Credit Agreement, the lenders have committed to provide advances up to an aggregate principal amount of
$600 million
at any one time outstanding (the “ETE Revolving Credit Facility”), and the Parent Company has the option to request increases in the aggregate commitments provided that the aggregate commitments never exceed
$1.0 billion
. In February 2014, the Partnership increased the capacity on the ETE Revolving Credit Facility to
$800 million
. In May 2014, the Parent Company amended its revolving credit facility to increase the capacity to
$1.2 billion
. In February 2015, the Parent Company amended its revolving credit facility to increase the capacity to
$1.5 billion
.
F - 42
As part of the aggregate commitments under the facility, the Revolver Credit Agreement provides for letters of credit to be issued at the request of the Parent Company in an aggregate amount not to exceed a
$150 million
sublimit.
Under the Revolver Credit Agreement, the obligations of the Parent Company are secured by a lien on substantially all of the Parent Company’s and certain of its subsidiaries’ tangible and intangible assets. Borrowings under the Revolver Credit Agreement are not guaranteed by any of the Parent Company’s subsidiaries.
Interest accrues on advances at a LIBOR rate or a base rate plus an applicable margin based on the election of the Parent Company for each interest period. The issuing fees for all letters of credit are also based on an applicable margin. The applicable margin used in connection with interest rates and fees is based on the then applicable leverage ratio of the Parent Company. The applicable margin for LIBOR rate loans and letter of credit fees ranges from
1.75%
to
2.50%
and the applicable margin for base rate loans ranges from
0.75%
to
1.50%
. The Parent Company will also pay a fee based on its leverage ratio on the actual daily unused amount of the aggregate commitments.
ETP Credit Facility
The ETP Credit Facility allows for borrowings of up to
$2.5 billion
and expires in October 2019. The indebtedness under the ETP Credit Facility is unsecured and not guaranteed by any of ETP’s subsidiaries and has equal rights to holders of our current and future unsecured debt. The indebtedness under the ETP Credit Facility has the same priority of payment as ETP’s other current and future unsecured debt. ETP uses the ETP Credit Facility to provide temporary financing for ETP’s growth projects, as well as for general partnership purposes. In February 2015, ETP amended its revolving credit facility to increase the capacity to
$3.75 billion
.
As of
December 31, 2014
, the ETP Credit Facility had
$570 million
outstanding, and the amount available for future borrowings was
$1.81 billion
after taking into account letters of credit of
$121 million
. The weighted average interest rate on the total amount outstanding as of
December 31, 2014
was
1.66%
.
Regency Credit Facility
The Regency Credit Facility has aggregate revolving commitments of
$2.0 billion
, with a
$500 million
incremental facility. The maturity date of the Regency Credit Facility is November 25, 2019.
As of
December 31, 2014
, Regency had a balance of
$1.50 billion
outstanding under the Regency Credit Facility in revolving credit loans and approximately
$23 million
in letters of credit. The total amount available under the Regency Credit Facility, as of
December 31, 2014
, which is reduced by any letters of credit, was approximately
$473 million
. The weighted average interest rate on the total amount outstanding as of
December 31, 2014
was
2.17%
.
The outstanding balance of revolving loans under the Regency Credit Facility bears interest at LIBOR plus a margin or an alternate base rate. The alternate base rate used to calculate interest on base rate loans will be calculated using the greater of a base rate, a federal funds effective rate plus
0.50%
and an adjusted one-month LIBOR rate plus
1.0%
. The applicable margin ranges from
0.63%
to
1.5%
for base rate loans and
1.63%
to
2.5%
for Eurodollar loans.
Regency pays (i) a commitment fee ranging between
0.3%
and
0.45%
per annum for the unused portion of the revolving loan commitments; (ii) a participation fee for each revolving lender participating in letters of credit ranging between
1.63%
and
2.5%
per annum of the average daily amount of such lender’s letter of credit exposure and; (iii) a fronting fee to the issuing bank of letters of credit equal to
0.2%
per annum of the average daily amount of its letter of credit exposure. In December 2011, Regency amended its credit facility to allow for additional investments in its joint ventures.
Sunoco Logistics Credit Facilities
Sunoco Logistics maintains a
$1.50 billion
unsecured credit facility (the “Sunoco Logistics Credit Facility”) which matures in November 2018. The Sunoco Logistics Credit Facility contains an accordion feature, under which the total aggregate commitment may be extended to
$2.25 billion
under certain conditions.
The Sunoco Logistics Credit Facility is available to fund Sunoco Logistics’ working capital requirements, to finance acquisitions and capital projects, to pay distributions and for general partnership purposes. The Sunoco Logistics Credit Facility bears interest at LIBOR or the Base Rate, each plus an applicable margin. The credit facility may be prepaid at any time. As of
December 31, 2014
, the Sunoco Logistics Credit Facility had
$150 million
of outstanding borrowings.
West Texas Gulf Pipe Line Company, a subsidiary of Sunoco Logistics, has a
$35 million
revolving credit facility which expires in April 2015. The facility is available to fund West Texas Gulf’s general corporate purposes including working capital and capital expenditures. At
December 31, 2014
, this credit facility had
$35 million
of outstanding borrowings.
F - 43
Sunoco LP Credit Facility
In September 2014, Sunoco LP entered into a
$1.25 billion
revolving credit agreement (the “Sunoco LP Credit Facility”), which matures in September 2019. The Sunoco LP Credit Facility can be increased from time to time upon Sunoco LP’s written request, subject to certain conditions, up to an additional
$250 million
. As of
December 31, 2014
, the Sunoco LP Credit Facility had
$683 million
of outstanding borrowings.
Covenants Related to Our Credit Agreements
Covenants Related to the Parent Company
The ETE Term Loan Facility and ETE Revolving Credit Facility contain customary representations, warranties, covenants and events of default, including a change of control event of default and limitations on incurrence of liens, new lines of business, merger, transactions with affiliates and restrictive agreements.
The ETE Term Loan Facility and ETE Revolving Credit Facility contain financial covenants as follows:
|
•
|
Maximum Leverage Ratio – Consolidated Funded Debt of the Parent Company (as defined) to EBITDA (as defined in the agreements) of the Parent Company of not more than
6.0
to
1
, with a permitted increase to
7
to
1
during a specified acquisition period following the close of a specified acquisition; and
|
|
•
|
EBITDA to interest expense of not less than
1.5
to
1
.
|
Covenants Related to ETP
The agreements relating to the ETP senior notes contain restrictive covenants customary for an issuer with an investment-grade rating from the rating agencies, which covenants include limitations on liens and a restriction on sale-leaseback transactions.
The credit agreement relating to the ETP Credit Facility contains covenants that limit (subject to certain exceptions) the ETP’s and certain of the ETP’s subsidiaries’ ability to, among other things:
|
•
|
incur indebtedness;
|
|
•
|
grant liens;
|
|
•
|
enter into mergers;
|
|
•
|
dispose of assets;
|
|
•
|
make certain investments;
|
|
•
|
make Distributions (as defined in such credit agreement) during certain Defaults (as defined in such credit agreement) and during any Event of Default (as defined in such credit agreement);
|
|
•
|
engage in business substantially different in nature than the business currently conducted by ETP and its subsidiaries;
|
|
•
|
engage in transactions with affiliates; and
|
|
•
|
enter into restrictive agreements.
|
The credit agreement relating to the ETP Credit Facility also contains a financial covenant that provides that the Leverage Ratio, as defined in the ETP Credit Facility, shall not exceed
5
to
1
as of the end of each quarter, with a permitted increase to
5.5
to
1
during a Specified Acquisition Period, as defined in the ETP Credit Facility.
The agreements relating to the Transwestern senior notes contain certain restrictions that, among other things, limit the incurrence of additional debt, the sale of assets and the payment of dividends and specify a maximum debt to capitalization ratio.
Covenants Related to Regency
The Regency senior notes contain various covenants that limit, among other things, Regency’s ability, and the ability of certain of its subsidiaries, to:
|
•
|
incur additional indebtedness;
|
|
•
|
pay distributions on, or repurchase or redeem equity interests;
|
F - 44
|
•
|
make certain investments;
|
|
•
|
incur liens;
|
|
•
|
enter into certain types of transactions with affiliates; and
|
|
•
|
sell assets, consolidate or merge with or into other companies.
|
If the Regency senior notes achieve investment grade ratings by both Moody’s and S&P and no default or event of default has occurred and is continuing, Regency will no longer be subject to these covenants except that the lien covenant will continue to be applicable. ETP has advised Regency that it intends to provide an ETP guarantee with respect to the outstanding Regency senior notes upon the closing of the Regency Merger, and it is expected that this will result in the Regency senior notes being upgraded an investment grade rating by both Moody’s and SAP.
The Regency Credit Facility contains the following financial covenants:
|
•
|
Regency’s consolidated EBITDA ratio for any preceding four fiscal quarter period, as defined in the credit agreement governing the Regency Credit Facility, must not exceed
5.00
to
1
.
|
|
•
|
Regency’s consolidated EBITDA to consolidated interest expense, as defined in the credit agreement governing the Regency Credit Facility, must be greater than
2.50
to
1
.
|
|
•
|
Regency’s consolidated senior secured leverage ratio for any preceding four fiscal quarter period, as defined in the credit agreement governing the Regency Credit Facility, must not exceed
3.25
to
1
.
|
The Regency Credit Facility also contains various covenants that limit, among other things, the ability of Regency and RGS to:
|
•
|
incur indebtedness;
|
|
•
|
grant liens;
|
|
•
|
enter into sale and leaseback transactions;
|
|
•
|
make certain investments, loans and advances;
|
|
•
|
dissolve or enter into a merger or consolidation;
|
|
•
|
enter into asset sales or make acquisitions;
|
|
•
|
enter into transactions with affiliates;
|
|
•
|
prepay other indebtedness or amend organizational documents or transaction documents (as defined in the credit agreement governing the Regency Credit Facility);
|
|
•
|
issue capital stock or create subsidiaries; or
|
|
•
|
engage in any business other than those businesses in which it was engaged at the time of the effectiveness of the Regency Credit Facility or reasonable extensions thereof.
|
Covenants Related to Panhandle
Panhandle is not party to any lending agreement that would accelerate the maturity date of any obligation due to a failure to maintain any specific credit rating, nor would a reduction in any credit rating, by itself, cause an event of default under any of Panhandle’s lending agreements. Financial covenants exist in certain of Panhandle’s debt agreements that require Panhandle to maintain a certain level of net worth, to meet certain debt to total capitalization ratios and to meet certain ratios of earnings before depreciation, interest and taxes to cash interest expense. A failure by Panhandle to satisfy any such covenant would give rise to an event of default under the associated debt, which could become immediately due and payable if Panhandle did not cure such default within any permitted cure period or if Panhandle did not obtain amendments, consents or waivers from its lenders with respect to such covenants.
Panhandle’s restrictive covenants include restrictions on debt levels, restrictions on liens securing debt and guarantees, restrictions on mergers and on the sales of assets, capitalization requirements, dividend restrictions, cross default and cross-acceleration and prepayment of debt provisions. A breach of any of these covenants could result in acceleration of Panhandle’s debt and other financial obligations and that of its subsidiaries.
In addition, Panhandle and/or its subsidiaries are subject to certain additional restrictions and covenants. These restrictions and covenants include limitations on additional debt at some of its subsidiaries; limitations on the use of proceeds from
F - 45
borrowing at some of its subsidiaries; limitations, in some cases, on transactions with its affiliates; limitations on the incurrence of liens; potential limitations on the abilities of some of its subsidiaries to declare and pay dividends and potential limitations on some of its subsidiaries to participate in Panhandle’s cash management program; and limitations on Panhandle’s ability to prepay debt.
Covenants Related to Sunoco Logistics
Sunoco Logistics’
$1.50 billion
credit facility contains various covenants, including limitations on the creation of indebtedness and liens, and other covenants related to the operation and conduct of the business of Sunoco Logistics and its subsidiaries. The credit facility also limits Sunoco Logistics, on a rolling four-quarter basis, to a maximum total consolidated debt to consolidated Adjusted EBITDA ratio, as defined in the underlying credit agreement, of
5.0
to
1
, which can generally be increased to
5.5
to
1
during an acquisition period. Sunoco Logistics’ ratio of total consolidated debt, excluding net unamortized fair value adjustments, to consolidated Adjusted EBITDA was
3.7
to
1
at
December 31, 2014
, as calculated in accordance with the credit agreements.
The West Texas Gulf Pipeline Company’s
$35 million
credit facility limits West Texas Gulf, on a rolling four-quarter basis, to a minimum fixed charge coverage ratio of
1.00
to
1
. In addition, the credit facility limits West Texas Gulf to a maximum leverage ratio of
2.00
to
1
. West Texas Gulf’s fixed charge coverage ratio and leverage ratio were
1.67
to
1
and
0.85
to
1
, respectively, at
December 31, 2014
.
Covenants Related to Sunoco LP
The Sunoco LP Credit Facility requires Sunoco LP to maintain a leverage ratio of not more than
5.50
to
1
. The maximum leverage ratio is subject to upwards adjustment of not more than
6.00
to
1
for a period not to exceed three fiscal quarters in the event Sunoco LP engages in an acquisition of assets, equity interests, operating lines or divisions by Sunoco LP, a subsidiary, an unrestricted subsidiary or a joint venture for a purchase price of not less than
$50 million
. Indebtedness under the Sunoco LP Credit Facility is secured by a security interest in, among other things, all of the Sunoco LP’s present and future personal property and all of the present and future personal property of its guarantors, the capital stock of its material subsidiaries (or
66%
of the capital stock of material foreign subsidiaries), and any intercompany debt. Upon the first achievement by Sunoco LP of an investment grade credit rating, all security interests securing the Sunoco LP Credit Facility will be released.
Compliance With Our Covenants
Failure to comply with the various restrictive and affirmative covenants of our revolving credit facilities and note agreements could require us or our subsidiaries to pay debt balances prior to scheduled maturity and could negatively impact the subsidiaries ability to incur additional debt and/or our ability to pay distributions.
We and our subsidiaries are required to assess compliance quarterly and were in compliance with all requirements, tests, limitations, and covenants related to our debt agreements as of
December 31, 2014
.
|
7.
|
REDEEMABLE PREFERRED UNITS:
|
ETE Preferred Units
In connection with ETE’s acquisition of Regency’s general partner in 2010, ETE issued
3,000,000
Preferred Units having an aggregate liquidation preference of
$300 million
. The Preferred Units were issued in a private placement at a stated price of
$100
per unit and were entitled to a preferential quarterly cash distribution of
$2.00
per Preferred Unit.
On April 1, 2013, ETE paid
$300 million
to redeem (the “Redemption”) all of its
3,000,000
outstanding Preferred Units. Prior to the Redemption, on March 28, 2013, ETE paid the holder of the Preferred Units
$40 million
in cash in exchange for the holder relinquishing its right to receive any premium in connection with a future redemption or conversion of the Preferred Units.
Prior to the April 1, 2013 Redemption, we recorded non-cash charges of approximately
$9 million
to increase the carrying value of the Preferred Units to the estimated fair value. During 2012, we recorded non-cash charges of approximately
$8 million
to increase the carrying value of the Preferred Units to the estimated fair value of $331 million.
Preferred Units of Subsidiary
Holders may elect to convert Regency Preferred Units to Regency Common Units at any time. In July 2013, certain holders of the Regency Preferred Units exercised their right to convert an aggregate
2,459,017
Series A Preferred Units into Regency Common Units. Concurrent with this transaction, a gain of
$26 million
was recognized in other income, net, related to the
F - 46
embedded derivative and reclassified
$41 million
from the Regency Preferred Units into Regency Common Units. As of December 31, 2014, the remaining Regency Preferred Units were convertible into
2,064,805
Regency Common Units, and if outstanding, are mandatorily redeemable on
September 2, 2029
for
$35 million
plus all accrued but unpaid distributions and interest thereon. The Regency Preferred Units received fixed quarterly cash distributions of $0.445 per unit if outstanding on the record dates of Regency’s common unit distributions. Holders can elect to convert Regency Preferred Units into Regency Common Units into common units at any time in accordance with the partnership agreement.
The following table provides a reconciliation of the beginning and ending balances of the Regency Preferred Units:
|
Regency
Preferred
Units
|
Amount
|
|||||||
|
Balance, January 1, 2013
|
4.4
|
|
$
|
73
|
|
|||
|
Regency Preferred Units converted into Regency Common Units
|
(2.5
|
)
|
(41
|
)
|
||||
|
Balance, December 31, 2013
|
1.9
|
|
$
|
32
|
|
(1
|
)
|
|
|
Accretion to redemption value
|
N/A
|
|
1
|
|
||||
|
Balance, December 31, 2014
|
1.9
|
|
33
|
|
||||
|
(1)
|
This amount will be accreted to
$35 million
plus any accrued but unpaid distributions and interest by deducting amounts from partners’ capital over the remaining periods until the mandatory redemption date of
September 2, 2029
. Accretion during 2013 was immaterial.
|
|
8.
|
REDEEMABLE NONCONTROLLING INTERESTS:
|
The noncontrolling interest holders in one of Sunoco Logistics’ consolidated subsidiaries have the option to sell their interests to Sunoco Logistics. In accordance with applicable accounting guidance, the noncontrolling interest is excluded from total equity and reflected as redeemable interest on our consolidated balance sheet.
|
9.
|
EQUITY:
|
Limited Partner Units
Limited partner interests in the Partnership are represented by Common Units that entitle the holders thereof to the rights and privileges specified in the Partnership Agreement. The Partnership’s Common Units are registered under the Securities Exchange Act of 1934 (as amended) and are listed for trading on the NYSE. Each holder of a Common Unit is entitled to one vote per unit on all matters presented to the Limited Partners for a vote. In addition, if at any time any person or group (other than the Partnership’s General Partner and its affiliates) owns beneficially
20%
or more of all Common Units, any Common Units owned by that person or group may not be voted on any matter and are not considered to be outstanding when sending notices of a meeting of Unitholders (unless otherwise required by law), calculating required votes, determining the presence of a quorum or for other similar purposes under the Partnership Agreement. The Common Units are entitled to distributions of Available Cash as described below under “Parent Company Quarterly Distributions of Available Cash.”
As of
December 31, 2014
, there were issued and outstanding
538.8 million
Common Units representing an aggregate
99.46%
limited partner interest in the Partnership.
Our Partnership Agreement contains specific provisions for the allocation of net earnings and losses to the partners for purposes of maintaining the partner capital accounts. For any fiscal year that the Partnership has net profits, such net profits are first allocated to the General Partner until the aggregate amount of net profits for the current and all prior fiscal years equals the aggregate amount of net losses allocated to the General Partner for the current and all prior fiscal years. Second, such net profits shall be allocated to the Limited Partners pro rata in accordance with their respective sharing ratios. For any fiscal year in which the Partnership has net losses, such net losses shall be first allocated to the Limited Partners in proportion to their respective adjusted capital account balances, as defined by the Partnership Agreement, (before taking into account such net losses) until their adjusted capital account balances have been reduced to zero. Second, all remaining net losses shall be allocated to the General Partner. The General Partner may distribute to the Limited Partners funds of the Partnership that the General Partner reasonably determines are not needed for the payment of existing or foreseeable Partnership obligations and expenditures.
F - 47
Common Units
The change in ETE Common Units during the years ended
December 31, 2014
,
2013
and
2012
was as follows:
|
|
Years Ended December 31,
|
|||||||
|
|
2014
|
2013
|
2012
|
|||||
|
Number of Common Units, beginning of period
|
559.9
|
|
559.9
|
|
445.9
|
|
||
|
Repurchase of common units under buyback program
|
(21.1
|
)
|
—
|
|
—
|
|
||
|
Issuance of common units in connection with Southern Union Merger (See Note 3)
|
—
|
|
—
|
|
114.0
|
|
||
|
Number of Common Units, end of period
|
538.8
|
|
559.9
|
|
559.9
|
|
||
Common Unit Split
On December 23, 2013, ETE announced that the board of directors of its general partner approved a two-for-one split of the Partnership’s outstanding common units (the “Unit Split”). The Unit Split was completed on January 27, 2014. The Unit Split was effected by a distribution of one ETE Common Unit for each common unit outstanding and held by unitholders of record at the close of business on January 13, 2014.
Repurchase Program
In December 2013, the Partnership announced a common unit repurchase program, whereby the Partnership may repurchase up to
$1 billion
of ETE Common Units in the open market at the Partnership’s discretion, subject to market conditions and other factors, and in accordance with applicable regulatory requirements. The Partnership repurchased
21.1 million
ETE Common Units under this program through May 23, 2014, and the program was completed.
In February 2015, the Partnership announced a common unit repurchase program, whereby the Partnership may repurchase up to
$2 billion
of ETE Common Units in the open market at the Partnership’s discretion, subject to market conditions and other factors, and in accordance with applicable regulatory requirements.
Class D Units
On May 1, 2013, Jamie Welch was appointed Group Chief Financial Officer and Head of Corporate Development of LE GP, LLC, the general partner of ETE, effective June 24, 2013. Pursuant to an equity award agreement between Mr. Welch and the Partnership dated April 23, 2013, Mr. Welch received
1,500,000
restricted ETE common units representing limited partner interest. The restricted ETE common units were subject to vesting, based on continued employment with ETE. On December 23, 2013, ETE and Mr. Welch entered into (i) a rescission agreement in order to rescind the original offer letter to the extent it relates to the award of
1,500,000
common units of ETE to Mr. Welch, the original award agreements, and the receipt of cash amounts by Mr. Welch with respect to such awarded units and (ii) a new Class D Unit Agreement between ETE and Mr. Welch providing for the issuance to Mr. Welch of an aggregate of
1,540,000
Class D Units of ETE, which number of Class D Units includes an additional
40,000
Class D Units that were issued to Mr. Welch in connection with other changes to his original offer letter.
Under the terms of the Class D Unit Agreement, 30% of the Class D Units will convert to ETE common units on a one-for-one basis on March 31, 2015, and the remaining 70% will convert to ETE common units on a one-for-one basis on March 31, 2018, subject in each case to (i) Mr. Welch being in Good Standing with ETE (as defined in the Class D Unit Agreement) and (ii) there being a sufficient amount of gain available (based on the ETE partnership agreement) to be allocated to the Class D Units being converted so as to cause the capital account of each such unit to equal the capital account of an ETE Common Unit on the conversion date.
Sale of Common Units by Subsidiaries
The Parent Company accounts for the difference between the carrying amount of its investment in subsidiaries and the underlying book value arising from issuance of units by subsidiaries (excluding unit issuances to the Parent Company) as a capital transaction. If a subsidiary issues units at a price less than the Parent Company’s carrying value per unit, the Parent Company assesses whether the investment has been impaired, in which case a provision would be reflected in our statement of operations. The Parent Company did not recognize any impairment related to the issuances of subsidiary common units during the periods presented.
F - 48
Sale of Common Units by ETP
The following table summarizes ETP’s public offerings of ETP Common Units, all of which have been registered under the Securities Act of 1933 (as amended):
|
Date
|
Number of
ETP Common
Units
|
Price per ETP
Unit
|
Net Proceeds
|
||||||||
|
July 2012
|
15.5
|
|
$
|
44.57
|
|
$
|
671
|
|
|||
|
April 2013
|
13.8
|
|
48.05
|
|
657
|
|
|||||
Proceeds from the offerings listed above were used to repay amounts outstanding under the ETP Credit Facility and/or to fund capital expenditures and capital contributions to joint ventures, and for general partnership purposes.
ETP’s Equity Distribution Program
From time to time, ETP has sold ETP Common Units through an equity distribution agreement. Such sales of ETP Common Units are made by means of ordinary brokers’ transactions on the NYSE at market prices, in block transactions or as otherwise agreed between us and the sales agent which is the counterparty to the equity distribution agreement.
In January 2013 and May 2013, ETP entered into equity distribution agreements pursuant to which ETP may sell from time to time ETP Common Units having aggregate offering prices of up to
$200 million
and
$800 million
, respectively. During the year ended
December 31, 2014
, ETP issued approximately
2.7 million
units for
$144 million
, net of commissions of
$2 million
.
No
amounts of ETP Common Units remain available to be issued under the January 2013 and May 2013 equity distribution agreements.
In May 2014 and November 2014, ETP entered into equity distribution agreements pursuant to which ETP may sell from time to time ETP Common Units having aggregate offering prices of up to
$1.0 billion
and
$1.50 billion
, respectively. During the year ended
December 31, 2014
, ETP issued approximately
18.8 million
units for
$1.08 billion
, net of commissions of
$11 million
. As of
December 31, 2014
, approximately
$1.41 billion
of ETP Common Units remained available to be issued under ETP’s currently effective equity distribution agreements.
ETP’s Equity Incentive Plan Activity
As discussed in Note
10
, ETP issues ETP Common Units to employees and directors upon vesting of awards granted under ETP’s equity incentive plans. Upon vesting, participants in the equity incentive plans may elect to have a portion of the ETP Common Units to which they are entitled withheld by ETP to satisfy tax-withholding obligations.
ETP’s Distribution Reinvestment Program
ETP’s Distribution Reinvestment Plan (the “DRIP”) provides ETP’s Unitholders of record and beneficial owners of ETP Common Units a voluntary means by which they can increase the number of ETP Common Units they own by reinvesting the quarterly cash distributions they would otherwise receive in the purchase of additional ETP Common Units.
During the years ended
December 31, 2014
,
2013
and
2012
, aggregate distributions of approximately
$155 million
,
$109 million
and
$43 million
, respectively, were reinvested under the DRIP resulting in the issuance in aggregate of approximately
6.1 million
ETP Common Units.
As of
December 31, 2014
, a total of
7.3 million
ETP Common Units remain available to be issued under the existing registration statement.
ETP Class E Units
These ETP Class E Units are entitled to aggregate cash distributions equal to
11.1%
of the total amount of cash distributed to all ETP Unitholders, including the ETP Class E Unitholders, up to
$1.41
per unit per year, with any excess thereof available for distribution to ETP Unitholders other than the holders of ETP Class E Units in proportion to their respective interests. The ETP Class E Units are treated by ETP as treasury units for accounting purposes because they are owned by a subsidiary of ETP Holdco, Heritage Holdings, Inc. Although no plans are currently in place, management may evaluate whether to retire some or all of the ETP Class E Units at a future date. All of the
8.9 million
ETP Class E Units outstanding are held by a subsidiary of ETP and therefore are reflected by ETP as treasury units in its consolidated financial statements.
F - 49
ETP Class G Units
In conjunction with the Sunoco Merger, ETP amended its partnership agreement to create ETP Class F Units. The number of ETP Class F Units issued was determined at the closing of the Sunoco Merger and equaled
90.7 million
, which included
40 million
ETP Class F Units issued in exchange for cash contributed by Sunoco, Inc. to ETP immediately prior to or concurrent with the closing of the Sunoco Merger. The ETP Class F Units generally did not have any voting rights. The ETP Class F Units were entitled to aggregate cash distributions equal to
35%
of the total amount of cash generated by ETP and its subsidiaries (other than ETP Holdco) and available for distribution, up to a maximum of
$3.75
per ETP Class F Unit per year. In April 2013, all of the outstanding ETP Class F Units were exchanged for ETP Class G Units on a one-for-one basis. The ETP Class G Units have terms that are substantially the same as the ETP Class F Units, with the principal difference between the ETP Class G Units and the ETP Class F Units being that allocations of depreciation and amortization to the ETP Class G Units for tax purposes are based on a predetermined percentage and are not contingent on whether ETP has net income or loss. The ETP Class G Units are held by a subsidiary of ETP and therefore are reflected by ETP as treasury units in its consolidated financial statements.
ETP Class H Units and Class I Units
Currently Outstanding
Pursuant to an Exchange and Redemption Agreement previously entered into between ETP, ETE and ETE Holdings, ETP redeemed and cancelled
50.2 million
of its Common Units representing limited partner interests (the “Redeemed Units”) owned by ETE Holdings on October 31, 2013 in exchange for the issuance by ETP to ETE Holdings of a new class of limited partner interest in ETP (the “Class H Units”), which are generally entitled to (i) allocations of profits, losses and other items from ETP corresponding to
50.05%
of the profits, losses, and other items allocated to ETP by Sunoco Partners, with respect to the IDRs and general partner interest in Sunoco Logistics held by Sunoco Partners, (ii) distributions from available cash at ETP for each quarter equal to
50.05%
of the cash distributed to ETP by Sunoco Partners with respect to the IDRs and general partner interest in Sunoco Logistics held by Sunoco Partners for such quarter and, to the extent not previously distributed to holders of the Class H Units, for any previous quarters.
Pending Transaction
In December 2014, ETP and ETE announced the final terms of a transaction, whereby ETE will transfer
30.8 million
ETP Common Units, ETE’s
45%
interest in the Bakken pipeline project, and
$879 million
in cash in exchange for
30.8 million
newly issued ETP Class H Units that, when combined with the
50.2 million
previously issued ETP Class H Units, generally entitle ETE to receive
90.05%
of the cash distributions and other economic attributes of the general partner interest and IDRs of Sunoco Logistics (the “Bakken Pipeline Transaction”). In connection with this transaction, ETP will also issue
100
ETP Class I Units, as described below. In addition, ETE and ETP agreed to reduce the IDR subsidies that ETE previously agreed to provide to ETP, with such reductions occurring in 2015 and 2016.
In connection with the transaction, ETP will also issue
100
ETP Class I Units. The ETP Class I Units are generally entitled to: (i) pro rata allocations of gross income or gain until the aggregate amount of such items allocated to the holders of the ETP Class I Units for the current taxable period and all previous taxable periods is equal to the cumulative amount of all distributions made to the holders of the ETP Class I Units and (ii) after making cash distributions to ETP Class H Units, any additional available cash deemed to be either operating surplus or capital surplus with respect to any quarter will be distributed to the ETP Class I Units in an amount equal to the excess of the distribution amount set forth in the ETP Partnership Agreement, as amended, (the “Partnership Agreement”) for such quarter over the cumulative amount of available cash previously distributed commencing with the quarter ending March 31, 2015 until the quarter ending December 31, 2016. The impact of (i) the IDR subsidy adjustments and (ii) the Class I Unit distributions, along with the currently effective IDR subsidies, is included in the table below under “ETP Quarterly Distributions of Available Cash” in the column titled “Pro Forma for ETP Class H and Class I Units.”
Sale of Common Units by Regency
The following table summarizes Regency’s public offerings of Regency Common Units during the periods presented:
|
Date
|
Number of
Regency Common
Units
|
Price per
Regency Unit
|
Net Proceeds
|
||||||||
|
March 2012
|
12.7
|
|
$
|
24.47
|
|
$
|
297
|
|
|||
F - 50
Proceeds were used to repay amounts outstanding under the Regency Credit Facility and/or fund capital expenditures and capital contributions to joint ventures, as well as for general partnership purposes.
Regency issued
4.0 million
,
140.4 million
and
8.2 million
Regency Common Units in connection with the Hoover, PVR and Eagle Rock Midstream acquisitions, respectively.
In June 2014, Regency sold
14.4 million
Regency Common Units to a wholly-owned subsidiary of ETE for approximately
$400 million
. Proceeds from the issuance were used to pay down borrowings on the Regency Credit Facility, to redeem certain Regency senior notes and for general partnership purposes. In July 2014, Regency sold an additional
16.5 million
Regency Common Units to a wholly-owned subsidiary of ETE in connection with the Eagle Rock Midstream Acquisition for approximately
$400 million
. Proceeds from the issuance were used to fund a portion of the cash consideration paid to Eagle Rock in connection with the Eagle Rock Midstream Acquisition.
Regency’s Equity Distribution Program
From time to time, Regency has sold Regency Common Units through an equity distribution agreement. Such sales of Regency Common Units are made by means of ordinary brokers’ transactions on the NYSE at market prices, in block transactions or as otherwise agreed between us and the sales agent which is the counterparty to the equity distribution agreement.
In June 2012, Regency entered into an equity distribution agreement with Citigroup Global Markets Inc. under which Regency may offer and sell Regency Common Units, representing limited partner interests, having an aggregate offering price of up to
$200 million
from time to time through Citi, as sales agent for Regency. For the years ended December 31, 2014 and 2013, Regency received net proceeds of
$34 million
and
$149 million
, respectively, from Regency Common Units issued pursuant to this equity distribution agreement. No amounts remain available to be issued under this agreement and it is no longer effective.
In May 2014, Regency entered into an equity distribution agreement with a group of banks and investment companies under which Regency may offer and sell Regency Common Units, representing limited partner interests, for an aggregate offering price of up to
$400 million
, from time to time through this group of institutions, as sales agent for Regency. For the year ended December 31, 2014, Regency received net proceeds of
$395 million
from Regency Common Units issued pursuant to this equity distribution agreement. No amounts remained available to be issued under this agreement and it is no longer effective.
In January 2015, Regency entered into an equity distribution agreement with a group of banks and investment companies (the “Managers”) under which Regency may offer and sell Regency Common Units for an aggregate offering price of up to
$1 billion
, from time to time through the Managers, as sales agent for Regency. Regency intends to use the net proceeds from the sale of Regency Common Units for general partnership purposes.
Sales of Common Units by Sunoco Logistics
In 2014, Sunoco Logistics entered into equity distribution agreements pursuant to which Sunoco Logistics may sell from time to time common units having aggregate offering prices of up to
$1.25 billion
. During the year ended
December 31, 2014
, Sunoco Logistics received proceeds of
$477 million
, net of commissions of
$5 million
, from the issuance of 10.3 million common units pursuant to the equity distribution agreement, which were used for general partnership purposes.
Additionally, Sunoco Logistics completed an overnight public offering of
7.7 million
common units for net proceeds of
$362 million
in September 2014. The net proceeds from this offering were used to repay outstanding borrowings under the
$1.50 billion
Sunoco Logistics Credit Facility and for general partnership purposes.
Sales of Common Units by Sunoco LP
In October 2014 and November 2014, Sunoco LP issued an aggregate total of
9.1 million
common units in an underwritten public offering. Aggregate net proceeds of
$405 million
from the offering were used to repay amounts outstanding under the
$1.25 billion
Sunoco LP Credit Facility and for general partnership purposes.
Contributions to Subsidiaries
The Parent Company indirectly owns the entire general partner interest in ETP through its ownership of ETP GP, the general partner of ETP. ETP GP has the right, but not the obligation, to contribute a proportionate amount of capital to ETP to maintain its current general partner interest. ETP GP’s interest in ETP’s distributions is reduced if ETP issues additional units and ETP GP does not contribute a proportionate amount of capital to ETP to maintain its General Partner interest.
F - 51
The Parent Company owns the entire general partner interest in Regency through its ownership of Regency GP. Regency GP has the right, but not the obligation, to contribute a proportionate amount of capital to Regency to maintain its current general partner interest. Regency GP’s interest in Regency’s distributions is reduced if Regency issues additional units and Regency GP does not contribute a proportionate amount of capital to Regency to maintain its General Partner interest.
Parent Company Quarterly Distributions of Available Cash
Our distribution policy is consistent with the terms of our Partnership Agreement, which requires that we distribute all of our available cash quarterly. The Parent Company’s only cash-generating assets currently consist of distributions from ETP and Regency related to limited and general partner interests, including IDRs, as well as cash generated from our investment in Lake Charles LNG.
Our distributions declared during the years ended
December 31, 2014, 2013 and 2012
were as follows:
|
Quarter Ended
|
|
Record Date
|
|
Payment Date
|
|
Rate
|
||
|
December 31, 2011
|
|
February 7, 2012
|
|
February 17, 2012
|
|
$
|
0.3125
|
|
|
March 31, 2012
|
May 4, 2012
|
|
May 18, 2012
|
|
0.3125
|
|
||
|
June 30, 2012
|
August 6, 2012
|
|
August 17, 2012
|
|
0.3125
|
|
||
|
September 30, 2012
|
November 6, 2012
|
|
November 16, 2012
|
|
0.3125
|
|
||
|
December 31, 2012
|
February 7, 2013
|
|
February 19, 2013
|
|
0.3175
|
|
||
|
March 31, 2013
|
May 6, 2013
|
|
May 17, 2013
|
|
0.3225
|
|
||
|
June 30, 2013
|
August 5, 2013
|
|
August 19, 2013
|
|
0.3275
|
|
||
|
September 30, 2013
|
November 4, 2013
|
|
November 19, 2013
|
|
0.3363
|
|
||
|
December 31, 2013
|
February 7, 2014
|
|
February 19, 2014
|
|
0.3463
|
|
||
|
March 31, 2014
|
May 5, 2014
|
|
May 19, 2014
|
|
0.3588
|
|
||
|
June 30, 2014
|
August 4, 2014
|
|
August 19, 2014
|
|
0.3800
|
|
||
|
September 30, 2014
|
November 3, 2014
|
|
November 19, 2014
|
|
0.4150
|
|
||
|
December 31, 2014
|
February 6, 2015
|
February 19, 2015
|
0.4500
|
|
||||
ETP’s Quarterly Distributions of Available Cash
ETP’s Partnership Agreement requires that ETP distribute all of its Available Cash to its Unitholders and its General Partner within
45
days following the end of each fiscal quarter, subject to the payment of incentive distributions to the holders of IDRs to the extent that certain target levels of cash distributions are achieved. The term Available Cash generally means, with respect to any fiscal quarter of ETP, all cash on hand at the end of such quarter, plus working capital borrowings after the end of the quarter, less reserves established by its General Partner in its sole discretion to provide for the proper conduct of ETP’s business, to comply with applicable laws or any debt instrument or other agreement, or to provide funds for future distributions to partners with respect to any one or more of the next four quarters. Available Cash is more fully defined in ETP’s Partnership Agreement.
F - 52
ETP’s distributions declared during the periods presented below were as follows:
|
Quarter Ended
|
|
Record Date
|
|
Payment Date
|
|
Distribution per
ETP Common Unit
|
||
|
December 31, 2011
|
|
February 7, 2012
|
February 14, 2012
|
$
|
0.8938
|
|
||
|
March 31, 2012
|
May 4, 2012
|
May 15, 2012
|
0.8938
|
|
||||
|
June 30, 2012
|
August 6, 2012
|
August 14, 2012
|
0.8938
|
|
||||
|
September 30, 2012
|
November 6, 2012
|
November 14, 2012
|
0.8938
|
|
||||
|
December 31, 2012
|
February 7, 2013
|
February 14, 2013
|
0.8938
|
|
||||
|
March 31, 2013
|
May 6, 2013
|
May 15, 2013
|
0.8938
|
|
||||
|
June 30, 2013
|
August 5, 2013
|
August 14, 2013
|
0.8938
|
|
||||
|
September 30, 2013
|
November 4, 2013
|
November 14, 2013
|
0.9050
|
|
||||
|
December 31, 2013
|
February 7, 2014
|
February 14, 2014
|
0.9200
|
|
||||
|
March 31, 2014
|
May 5, 2014
|
May 15, 2014
|
0.9350
|
|
||||
|
June 30, 2014
|
August 4, 2014
|
August 14, 2014
|
0.9550
|
|
||||
|
September 30, 2014
|
November 3, 2014
|
November 14, 2014
|
0.9750
|
|
||||
|
December 31, 2014
|
February 6, 2015
|
February 13, 2015
|
0.9950
|
|
||||
In connection with transactions between ETP and ETE, ETE has agreed to relinquish its right to certain incentive distributions in future periods. Following is a summary of the net reduction in total distributions that would potentially be made to ETE in future periods based on (i) the currently effective partnership agreement provisions, (ii) the assumed closing of the issuance of additional ETP Class H Units and ETP Class I Units, which is expected to occur in March 2015, and (iii) the assumed closing of the Regency Merger, which is expected to occur in the second quarter of 2015:
|
Years Ending December 31,
|
Currently Effective
|
Pro Forma for
ETP Class H and
Class I Units
(1)
|
Pro Forma for Regency Merger
(2)
|
|||||||||
|
2015
|
$
|
86
|
|
$
|
31
|
|
$
|
91
|
|
|||
|
2016
|
107
|
|
77
|
|
142
|
|
||||||
|
2017
|
85
|
|
85
|
|
145
|
|
||||||
|
2018
|
80
|
|
80
|
|
140
|
|
||||||
|
2019
|
70
|
|
70
|
|
130
|
|
||||||
|
2020
|
35
|
|
35
|
|
50
|
|
||||||
|
2021
|
35
|
|
35
|
|
35
|
|
||||||
|
2022
|
35
|
|
35
|
|
35
|
|
||||||
|
2023
|
35
|
|
35
|
|
35
|
|
||||||
|
2024
|
18
|
|
18
|
|
18
|
|
||||||
|
(1)
|
Pro forma amounts reflect the IDR subsidies, as adjusted for the pending issuance of additional ETP Class H Units and ETP Class I Units discussed above, as well as distributions on the ETP Class I Units. The issuance of additional ETP Class H Units and ETP Class I Units is expected to close in March 2015.
|
|
(2)
|
Pro forma amounts reflect the IDR subsidies, as adjusted for (i) the pending issuance of additional ETP Class H Units and ETP Class I Units (as described in Note (1) above) and (ii) the pending Regency Merger. Amounts reflected above assume that the Regency Merger is closed subsequent to the record date for the first quarter of 2015 distribution payment and prior to the record date for the second quarter 2015 distribution payment.
|
The amounts reflected above include the relinquishment of
$350 million
in the aggregate of incentive distributions that would potentially be made to ETE over the first forty fiscal quarters commencing immediately after the consummation of the Susser Merger. Such relinquishments would cease upon the agreement of an exchange of the Sunoco LP
general partner interest and the incentive distribution rights between ETE and ETP.
F - 53
Regency’s Quarterly Distributions of Available Cash
Regency’s Partnership Agreement requires that Regency distribute all of its Available Cash to its Unitholders and its General Partner within
45
days after the end of each quarter to unitholders of record on the applicable record date, as determined by the general partner. The term Available Cash generally consists of all cash and cash equivalents on hand at the end of that quarter less the amount of cash reserves established by the general partner to: (i) provide for the proper conduct of the Partnership’s business; (ii) comply with applicable law, any debt instruments or other agreements; or (iii) provide funds for distributions to the unitholders and to the General Partner for any one or more of the next four quarters and plus, all cash on hand on that date of determination of available cash for the quarter resulting from working capital borrowings made after the end of the quarter for which the determination is being made.
Distributions declared by Regency during the years ended
December 31, 2014, 2013 and 2012
were as follows:
|
Quarter Ended
|
|
Record Date
|
|
Payment Date
|
|
Distribution per
Regency Common
Unit
|
||
|
December 31, 2011
|
February 6, 2012
|
February 13, 2012
|
$
|
0.4600
|
|
|||
|
March 31, 2012
|
May 7, 2012
|
|
May 14, 2012
|
0.4600
|
|
|||
|
June 30, 2012
|
August 6, 2012
|
August 14, 2012
|
0.4600
|
|
||||
|
September 30, 2012
|
November 6, 2012
|
November 14, 2012
|
0.4600
|
|
||||
|
December 31, 2012
|
February 7, 2013
|
February 14, 2013
|
0.4600
|
|
||||
|
March 31, 2013
|
May 6, 2013
|
May 13, 2013
|
0.4600
|
|
||||
|
June 30, 2013
|
August 5, 2013
|
August 14, 2013
|
0.4650
|
|
||||
|
September 30, 2013
|
November 4, 2013
|
November 14, 2013
|
0.4700
|
|
||||
|
December 31, 2013
|
February 7, 2014
|
|
February 14, 2014
|
|
0.4750
|
|
||
|
March 31, 2014
|
May 8, 2014
|
May 15, 2014
|
0.4800
|
|
||||
|
June 30, 2014
|
August 7, 2014
|
August 14, 2014
|
0.4900
|
|
||||
|
September 30, 2014
|
November 4, 2014
|
November 14, 2014
|
0.5025
|
|
||||
|
December 31, 2014
|
February 6, 2015
|
February 13, 2015
|
0.5025
|
|
||||
In conjunction with Southern Union’s contributions of SUGS to Regency, ETE agreed to relinquish incentive distributions on the 31.4 million Regency Common Units issued for twenty-four months subsequent to the transaction closing.
Sunoco Logistics Quarterly Distributions of Available Cash
Distributions declared by Sunoco Logistics during the years ended
December 31, 2014, 2013 and 2012
were as follows:
|
Quarter Ended
|
|
Record Date
|
|
Payment Date
|
|
Distribution per
Sunoco Logistics
Common Unit
|
||
|
December 31, 2012
|
February 8, 2013
|
February 14, 2013
|
$
|
0.2725
|
|
|||
|
March 31, 2013
|
May 9, 2013
|
May 15, 2013
|
0.2863
|
|
||||
|
June 30, 2013
|
August 8, 2013
|
August 14, 2013
|
0.3000
|
|
||||
|
September 30, 2013
|
November 8, 2013
|
November 14, 2013
|
0.3150
|
|
||||
|
December 31, 2013
|
February 10, 2014
|
February 14, 2014
|
0.3312
|
|
||||
|
March 31, 2014
|
May 9, 2014
|
May 15, 2014
|
0.3475
|
|
||||
|
June 30, 2014
|
August 8, 2014
|
August 14, 2014
|
0.3650
|
|
||||
|
September 30, 2014
|
November 7, 2014
|
November 14, 2014
|
0.3825
|
|
||||
|
December 31, 2014
|
February 9, 2015
|
February 13, 2015
|
0.4000
|
|
||||
Sunoco Logistics Unit Split
On May 5, 2014, Sunoco Logistics’ board of directors declared a two-for-one split of Sunoco Logistics common units. The unit split resulted in the issuance of one additional Sunoco Logistics common unit for every one unit owned as of the close of business on June 5, 2014. The unit split was effective June 12, 2014. All Sunoco Logistics unit and per unit information included in this report is presented on a post-split basis.
F - 54
Sunoco LP Quarterly Distributions of Available Cash
Distributions declared by Sunoco LP subsequent to our acquisition on August 29, 2014 were as follows:
|
Quarter Ended
|
Record Date
|
Payment Date
|
Distribution per
Sunoco LP
Common Unit
|
|||||
|
September 30, 2014
|
November 18, 2014
|
November 28, 2014
|
$
|
0.5457
|
|
|||
|
December 31, 2014
|
February 17, 2015
|
February 27, 2015
|
0.6000
|
|
||||
Accumulated Other Comprehensive Income (Loss)
The following table presents the components of AOCI, net of tax:
|
|
December 31,
|
||||||
|
|
2014
|
2013
|
|||||
|
Available-for-sale securities
|
$
|
3
|
|
$
|
2
|
|
|
|
Foreign currency translation adjustment
|
(3
|
)
|
(1
|
)
|
|||
|
Net losses on commodity related hedges
|
(1
|
)
|
(4
|
)
|
|||
|
Actuarial gain (loss) related to pensions and other postretirement benefits
|
(57
|
)
|
56
|
|
|||
|
Investments in unconsolidated affiliates, net
|
2
|
|
8
|
|
|||
|
Subtotal
|
(56
|
)
|
61
|
|
|||
|
Amounts attributable to noncontrolling interest
|
51
|
|
(52
|
)
|
|||
|
Total AOCI included in partners’ capital, net of tax
|
$
|
(5
|
)
|
$
|
9
|
|
|
The table below sets forth the tax amounts included in the respective components of other comprehensive income (loss):
|
|
December 31,
|
||||||
|
|
2014
|
2013
|
|||||
|
Available-for-sale securities
|
$
|
(1
|
)
|
$
|
(1
|
)
|
|
|
Foreign currency translation adjustment
|
2
|
|
1
|
|
|||
|
Actuarial gain relating to pension and other postretirement benefits
|
(37
|
)
|
(39
|
)
|
|||
|
Total
|
$
|
(36
|
)
|
$
|
(39
|
)
|
|
|
10.
|
UNIT-BASED COMPENSATION PLANS:
|
We, ETP, Sunoco Logistics and Regency have issued equity incentive plans for employees, officers and directors, which provide for various types of awards, including options to purchase Common Units, restricted units, phantom units, distribution equivalent rights (“DERs”), common unit appreciation rights, cash restricted units and other unit-based awards.
ETE Long-Term Incentive Plan
The Board of Directors or the Compensation Committee of the board of directors of the our General Partner (the “Compensation Committee”) may from time to time grant additional awards to employees, directors and consultants of ETE’s general partner and its affiliates who perform services for ETE. The plan provides for the following types of awards: restricted units, phantom units, unit options, unit appreciation rights and distribution equivalent rights. The number of additional units that may be delivered pursuant to these awards is limited to
6,000,000
units. As of
December 31, 2014
,
5,690,101
units remain available to be awarded under the plan.
In December 2013,
1,540,000
Class D Units were granted to an ETE employee, Jamie Welch. Under the terms of the Class D Unit Agreement, 30% of the Class D Units granted to Welch will convert to ETE common units on a one-for-one basis on March 31, 2015, and the remaining 70% will convert to ETE common units on a one-for-one basis on March 31, 2018, subject in each case to (i) Mr. Welch being in Good Standing with ETE (as defined in the Class D Unit Agreement) and (ii) there being a sufficient amount of gain available (based on the ETE partnership agreement) to be allocated to the Class D Units
F - 55
being converted so as to cause the capital account of each such unit to equal the capital account of an ETE Common Unit on the conversion date. See further discussion at Note
9
to our consolidated financial statements.
During
2014
,
no
awards were granted to ETE employees and
3,687
ETE units were granted to non-employee directors. Under our equity incentive plans, our non-employee directors each receive grants that vest 60% in three years and 40% in five years and do not entitle the holders to receive distributions during the vesting period.
During
2014
, a total of
30,034
ETE Common Units vested, with a total fair value of
$1.5 million
as of the vesting date. As of
December 31, 2014
, excluding Class D units, a total of
34,340
restricted units granted to ETE employees and directors remain outstanding, for which we expect to recognize a total of
less than $1 million
in compensation over a weighted average period of
2.1 years
. As of
December 31, 2014
, a total of
1,540,000
Class D Units granted to Mr. Welch remain outstanding, for which we expect to recognize a total of
$23 million
in compensation over a weighted average period of
3.0 years
.
ETP Unit-Based Compensation Plans
Restricted Units
ETP has granted restricted unit awards to employees that vest over a specified time period, typically a
five
-year service vesting requirement, with vesting based on continued employment as of each applicable vesting date. Upon vesting, ETP Common Units are issued. These unit awards entitle the recipients of the unit awards to receive, with respect to each ETP Common Unit subject to such award that has not either vested or been forfeited, a cash payment equal to each cash distribution per ETP Common Unit made by ETP on its Common Units promptly following each such distribution by ETP to its Unitholders. We refer to these rights as “distribution equivalent rights.” Under ETP’s equity incentive plans, ETP’s non-employee directors each receive grants with a
five
-year service vesting requirement.
The following table shows the activity of the ETP awards granted to employees and non-employee directors:
|
Number of
ETP Units
|
Weighted Average
Grant-Date Fair Value
Per ETP Unit
|
|||||
|
Unvested awards as of December 31, 2013
|
3.2
|
|
$
|
49.65
|
|
|
|
Awards granted
|
1.0
|
|
60.85
|
|
||
|
Awards vested
|
(0.5
|
)
|
48.12
|
|
||
|
Awards forfeited
|
(0.1
|
)
|
32.36
|
|
||
|
Unvested awards as of December 31, 2014
|
3.6
|
|
53.83
|
|
||
During the years ended
December 31, 2014, 2013 and 2012
, the weighted average grant-date fair value per unit award granted was
$60.85
,
$50.54
and
$43.93
, respectively. The total fair value of awards vested was
$26 million
,
$29 million
and
$29 million
, respectively, based on the market price of ETP Common Units as of the vesting date. As of
December 31, 2014
, a total of
3.6 million
unit awards remain unvested, for which ETP expects to recognize a total of
$128 million
in compensation expense over a weighted average period of
2.0 years
.
Cash Restricted Units
ETP has also granted cash restricted units, which vest 100% at the end of the third year of service. A cash restricted unit entitles the award recipient to receive cash equal to the market value of one ETP Common Unit upon vesting. As of
December 31, 2014
, a total of
0.4 million
unvested cash restricted units units were outstanding.
Based on the trading price of ETP Common Units at
December 31, 2014
, ETP expects to recognize
$24 million
of unit-based compensation expense related to non-vested cash restricted units over a period of
1.8 years
.
Sunoco Logistics Unit-Based Compensation Plan
Sunoco Logistics’ general partner has a long-term incentive plan for employees and directors, which permits the grant of restricted units and unit options of Sunoco Logistics covering an additional
0.7 million
Sunoco, Inc. common units. As of
December 31, 2014
, a total of
1.5 million
Sunoco Logistics restricted units were outstanding for which Sunoco Logistics expects to recognize
$33 million
of expense over a weighted-average period of
2.9 years
.
F - 56
Regency Unit-Based Compensation Plans
Regency has the following awards outstanding as of
December 31, 2014
:
|
•
|
107,650
Regency Common Unit options, all of which are exercisable, with a weighted average exercise price of
$22.68
per unit option; and
|
|
•
|
2,167,719
Regency Phantom Units, with a weighted average grant date fair value of
$24.31
per Phantom Unit.
|
Regency expects to recognize
$42 million
of compensation expense related to the Regency Phantom Units over a period of
3.9 years
.
Cash Restricted Units
Regency began granting cash restricted units in 2014. These awards are service condition (time-based) grants which vest 100% at the end of the third year of service. A cash restricted unit entitles the award recipient to receive cash equal to the market value of one Regency Common Unit upon vesting. Regency has
379,328
cash restricted units outstanding at
December 31, 2014
.
Based on the trading price of Regency Common Units at
December 31, 2014
, Regency expects to recognize
$7 million
of unit-based compensation expense related to non-vested cash restricted units over a period of
2.5 years
.
|
11.
|
INCOME TAXES:
|
As a partnership, we are not subject to U.S. federal income tax and most state income taxes. However, the partnership conducts certain activities through corporate subsidiaries which are subject to federal and state income taxes. The components of the federal and state income tax expense (benefit) of our taxable subsidiaries were summarized as follows:
|
|
Years Ended December 31,
|
||||||||||
|
|
2014
|
2013
|
2012
|
||||||||
|
Current expense (benefit):
|
|||||||||||
|
Federal
|
$
|
321
|
|
$
|
51
|
|
$
|
(3
|
)
|
||
|
State
|
86
|
|
(1
|
)
|
6
|
|
|||||
|
Total
|
407
|
|
50
|
|
3
|
|
|||||
|
Deferred expense (benefit):
|
|||||||||||
|
Federal
|
(53
|
)
|
(14
|
)
|
41
|
|
|||||
|
State
|
3
|
|
57
|
|
10
|
|
|||||
|
Total
|
(50
|
)
|
43
|
|
51
|
|
|||||
|
Total income tax expense from continuing operations
|
$
|
357
|
|
$
|
93
|
|
$
|
54
|
|
||
F - 57
Historically, our effective tax rate differed from the statutory rate primarily due to partnership earnings that are not subject to U.S. federal and most state income taxes at the partnership level. The completion of the Southern Union Merger, Sunoco Merger, ETP Holdco Transaction and the Susser Merger (see Note
3
) significantly increased the activities conducted through corporate subsidiaries. A reconciliation of income tax expense (benefit) at the U.S. statutory rate to the income tax expense (benefit) attributable to continuing operations for the years ended
December 31, 2014
and
2013
is as follows:
|
December 31, 2014
|
December 31, 2013
|
||||||||||||||||||||||
|
|
Corporate Subsidiaries
(1)
|
Partnership
(2)
|
Consolidated
|
Corporate Subsidiaries
(1)
|
Partnership
(2)
|
Consolidated
|
|||||||||||||||||
|
Income tax expense (benefit) at U.S. statutory rate of 35 percent
|
$
|
212
|
|
|
$
|
—
|
|
$
|
212
|
|
$
|
(172
|
)
|
$
|
—
|
|
$
|
(172
|
)
|
||||
|
Increase (reduction) in income taxes resulting from:
|
|
|
|||||||||||||||||||||
|
Nondeductible goodwill
|
—
|
|
|
—
|
|
—
|
|
241
|
|
—
|
|
241
|
|
||||||||||
|
Nondeductible goodwill included in the Lake Charles LNG Transaction
|
105
|
|
—
|
|
105
|
|
—
|
|
—
|
|
—
|
|
|||||||||||
|
Premium on debt retirement
|
(10
|
)
|
—
|
|
(10
|
)
|
—
|
|
—
|
|
—
|
|
|||||||||||
|
Foreign taxes
|
(8
|
)
|
—
|
|
(8
|
)
|
—
|
|
—
|
|
—
|
|
|||||||||||
|
State income taxes (net of federal income tax effects)
|
9
|
|
|
46
|
|
55
|
|
31
|
|
10
|
|
41
|
|
||||||||||
|
Other
|
3
|
|
|
—
|
|
3
|
|
(16
|
)
|
(1
|
)
|
(17
|
)
|
||||||||||
|
Income tax from continuing operations
|
$
|
311
|
|
|
$
|
46
|
|
$
|
357
|
|
$
|
84
|
|
$
|
9
|
|
$
|
93
|
|
||||
|
(1)
|
Includes ETP Holdco, Susser, Oasis Pipeline Company, Susser Petroleum Property Company LLC, Aloha Petroleum Ltd, Pueblo, Inland Corporation, Mid-Valley Pipeline Company and West Texas Gulf Pipeline Company. ETP Holdco, which was formed via the Sunoco Merger and the ETP Holdco Transaction (see Note
3
), includes Sunoco, Inc. and Panhandle. ETE held a
60%
interest in ETP Holdco until April 30, 2013. Subsequent to the ETP Holdco Acquisition (see Note
3
) on April 30, 2013, ETP owns
100%
of ETP Holdco.
|
|
(2)
|
Includes ETE and its respective subsidiaries that are classified as pass-through entities for federal income tax purposes.
|
F - 58
Deferred taxes result from the temporary differences between financial reporting carrying amounts and the tax basis of existing assets and liabilities. The table below summarizes the principal components of the deferred tax assets (liabilities) as follows:
|
|
December 31,
|
||||||
|
|
2014
|
2013
|
|||||
|
Deferred income tax assets:
|
|||||||
|
Net operating losses and alternative minimum tax credit
|
$
|
116
|
|
$
|
217
|
|
|
|
Pension and other postretirement benefits
|
47
|
|
57
|
|
|||
|
Long term debt
|
53
|
|
108
|
|
|||
|
Other
|
111
|
|
104
|
|
|||
|
Total deferred income tax assets
|
327
|
|
486
|
|
|||
|
Valuation allowance
|
(84
|
)
|
(74
|
)
|
|||
|
Net deferred income tax assets
|
243
|
|
412
|
|
|||
|
Deferred income tax liabilities:
|
|||||||
|
Properties, plants and equipment
|
(1,583
|
)
|
(1,624
|
)
|
|||
|
Inventory
|
(153
|
)
|
(302
|
)
|
|||
|
Investments in unconsolidated affiliates
|
(2,530
|
)
|
(2,245
|
)
|
|||
|
Trademarks
|
(355
|
)
|
(180
|
)
|
|||
|
Other
|
(32
|
)
|
(45
|
)
|
|||
|
Total deferred income tax liabilities
|
(4,653
|
)
|
(4,396
|
)
|
|||
|
Net deferred income tax liability
|
(4,410
|
)
|
(3,984
|
)
|
|||
|
Less: current portion of deferred income tax liabilities, net
|
(85
|
)
|
(119
|
)
|
|||
|
Accumulated deferred income taxes
|
$
|
(4,325
|
)
|
$
|
(3,865
|
)
|
|
The completion of the Southern Union Merger, Sunoco Merger, ETP Holdco Transaction and Susser Merger (see Note
3
) significantly increased the deferred tax assets (liabilities). The table below provides a rollforward of the net deferred income tax liability as follows:
|
December 31,
|
|||||||
|
2014
|
2013
|
||||||
|
Net deferred income tax liability, beginning of year
|
$
|
(3,984
|
)
|
$
|
(3,696
|
)
|
|
|
Susser acquisition
|
(488
|
)
|
—
|
|
|||
|
SUGS Contribution to Regency
|
—
|
|
(115
|
)
|
|||
|
Tax provision (including discontinued operations)
|
62
|
|
(124
|
)
|
|||
|
Other
|
—
|
|
(49
|
)
|
|||
|
Net deferred income tax liability
|
$
|
(4,410
|
)
|
$
|
(3,984
|
)
|
|
ETP Holdco, Susser and other corporate subsidiaries have gross federal net operating loss carryforwards of
$5 million
, all of which will expire in 2032 and
2033
. Our corporate subsidiaries had
less than $1 million
of federal alternative minimum tax credits at December 31, 2014. Our corporate subsidiaries have state net operating loss carryforward benefits of
$111 million
, net of federal tax, which expire between
2014
and
2033
. The valuation allowance of
$84 million
is applicable to the state net operating loss carryforward benefits applicable to Sunoco, Inc. pre-acquisition periods.
F - 59
The following table sets forth the changes in unrecognized tax benefits:
|
|
Years Ended December 31,
|
||||||||||
|
|
2014
|
2013
|
2012
|
||||||||
|
Balance at beginning of year
|
$
|
429
|
|
$
|
27
|
|
$
|
2
|
|
||
|
Additions attributable to acquisitions
|
—
|
|
—
|
|
28
|
|
|||||
|
Additions attributable to tax positions taken in the current year
|
20
|
|
—
|
|
—
|
|
|||||
|
Additions attributable to tax positions taken in prior years
|
(1
|
)
|
406
|
|
—
|
|
|||||
|
Settlements
|
(5
|
)
|
—
|
|
—
|
|
|||||
|
Lapse of statute
|
(3
|
)
|
(4
|
)
|
(3
|
)
|
|||||
|
Balance at end of year
|
$
|
440
|
|
$
|
429
|
|
$
|
27
|
|
||
As of
December 31, 2014
, we have
$439 million
(
$425 million
after federal income tax benefits) related to tax positions which, if recognized, would impact our effective tax rate. We believe it is reasonably possible that its unrecognized tax benefits may be reduced by
$4 million
(
$2 million
, net of federal tax) within the next twelve months due to settlement of certain positions.
Sunoco, Inc. has historically included certain government incentive payments as taxable income on its federal and state income tax returns. In connection with Sunoco, Inc.’s
2004
through
2011
open statute years, Sunoco, Inc. has proposed to the IRS that these government incentive payments be excluded from federal taxable income. If Sunoco, Inc. is fully successful with its claims, it will receive tax refunds of approximately
$372 million
. However, due to the uncertainty surrounding the claims, a reserve of
$372 million
was established for the full amount of the claims. Due to the timing of the expected settlement of the claims and the related reserve, the receivable and the reserve for this issue have been netted in the consolidated balance sheet as of
December 31, 2014
.
Our policy is to accrue interest expense and penalties on income tax underpayments (overpayments) as a component of income tax expense. During
2014
, we recognized interest and penalties of less than
$1 million
. At
December 31, 2014
, we have interest and penalties accrued of
$6 million
, net of tax.
In general, ETE and its subsidiaries are no longer subject to examination by the IRS for 2010 and prior tax years. However, Sunoco, Inc. and its subsidiaries are no longer subject to examination by the IRS for tax years prior to 2007, and Southern Union and its subsidiaries are no longer subject to examination by the IRS for tax years prior to and 2004. Regency and its subsidiaries are no longer subject to examination by the IRS for tax years prior to 2007.
Sunoco, Inc. has been examined by the IRS for tax years through 2012. However, the statutes remain open for tax years 2007 and forward due to carryback of net operating losses and/or claims regarding government incentive payments discussed above. All other issues are resolved. Though we believe the tax years are closed by statue, tax years 2004 through 2006 are impacted by the carryback of net operating losses and under certain circumstances may be impacted by adjustments for government incentive payments. Southern Union is under examination for the tax years 2004 through 2009. As of December 31, 2014, the IRS has proposed only one adjustment for the years under examination. For the 2006 tax year, the IRS is challenging
$545 million
of the
$690 million
of deferred gain associated with a like kind exchange involving certain assets of its distribution operations and its gathering and processing operations. We have vigorously defended this tax position and believe we have reached a tentative settlement with the IRS which will not have a material impact on our consolidated financial position or results of operations. Regency is also under examination by the IRS for the 2007 and 2008 tax years. The IRS has proposed adjustments in both of these examinations which are under review at the Appeals level. We believe Regency will prevail against this challenge by the IRS. Accordingly, no unrecognized tax benefit has been recorded with respect to these tax positions. The proposed adjustments with respect to Regency would not have a material impact upon our financial statements.
ETE and its subsidiaries also have various state and local income tax returns in the process of examination or administrative appeal in various jurisdictions. We believe the appropriate accruals or unrecognized tax benefits have been recorded for any potential assessment with respect to these examinations.
|
12.
|
REGULATORY MATTERS, COMMITMENTS, CONTINGENCIES AND ENVIRONMENTAL LIABILITIES:
|
Contingent Matters Potentially Impacting the Partnership from Our Investment in Citrus
Florida Gas Pipeline Relocation Costs.
The Florida Department of Transportation, Florida’s Turnpike Enterprise (“FDOT/FTE”) has various turnpike/State Road 91 widening projects that have impacted or may, over time, impact one or more of FGTs’ mainline pipelines located in FDOT/FTE rights-of-way. Certain FDOT/FTE projects have been or are the subject of
F - 60
litigation in Broward County, Florida. On November 16, 2012, FDOT paid to FGT the sum of approximately
$100 million
, representing the amount of the judgment, plus interest, in a case tried in 2011.
On April 14, 2011, FGT filed suit against the FDOT/FTE and other defendants in Broward County, Florida seeking an injunction and damages as the result of the construction of a mechanically stabilized earth wall and other encroachments in FGT easements as part of FDOT/FTE’s I-595 project. On August 21, 2013, FGT and FDOT/FTE entered into a settlement agreement pursuant to which, among other things, FDOT/FTE paid FGT approximately
$19 million
in September 2013 in settlement of FGT’s claims with respect to the I-595 project. The settlement agreement also provided for agreed easement widths for FDOT/FTE right-of-way and for cost sharing between FGT and FDOT/FTE for any future relocations. Also in September 2013, FDOT/FTE paid FGT an additional approximate
$1 million
for costs related to the aforementioned turnpike/State Road 91 case tried in 2011.
FGT will continue to seek rate recovery in the future for these types of costs to the extent not reimbursed by the FDOT/FTE. There can be no assurance that FGT will be successful in obtaining complete reimbursement for any such relocation costs from the FDOT/FTE or from its customers or that the timing of such reimbursement will fully compensate FGT for its costs.
Contingent Residual Support Agreement — AmeriGas
In connection with the closing of the contribution of ETP’s propane operations in January 2012, ETP agreed to provide contingent, residual support of
$1.55 billion
of intercompany borrowings made by AmeriGas and certain of its affiliates with maturities through 2022 from a finance subsidiary of AmeriGas that have maturity dates and repayment terms that mirror those of an equal principal amount of senior notes issued by this finance company subsidiary to third party purchases.
PEPL Holdings Guarantee of Collection
In connection with the SUGS Contribution, Regency issued
$600 million
of
4.50%
senior notes due 2023
(the “Regency Debt”), the proceeds of which were used by Regency to fund the cash portion of the consideration, as adjusted, and pay certain other expenses or disbursements directly related to the closing of the SUGS Contribution. In connection with the closing of the SUGS Contribution on April 30, 2013, Regency entered into an agreement with PEPL Holdings, a subsidiary of Southern Union, pursuant to which PEPL Holdings provided a guarantee of collection (on a nonrecourse basis to Southern Union) to Regency and Regency Energy Finance Corp. with respect to the payment of the principal amount of the Regency Debt through maturity in 2023. In connection with the completion of the Panhandle Merger, in which PEPL Holdings was merged with and into Panhandle, the guarantee of collection for the Regency Debt was assumed by Panhandle.
NGL Pipeline Regulation
We have interests in NGL pipelines located in Texas and New Mexico. We commenced the interstate transportation of NGLs in 2013, which is subject to the jurisdiction of the FERC under the Interstate Commerce Act (“ICA”) and the Energy Policy Act of 1992. Under the ICA, tariff rates must be just and reasonable and not unduly discriminatory and pipelines may not confer any undue preference. The tariff rates established for interstate services were based on a negotiated agreement; however, the FERC’s rate-making methodologies may limit our ability to set rates based on our actual costs, may delay or limit the use of rates that reflect increased costs and may subject us to potentially burdensome and expensive operational, reporting and other requirements. Any of the foregoing could adversely affect our business, revenues and cash flow.
Transwestern Rate Case
On October 1, 2014, Transwestern filed a general NGA Section 4 rate case pursuant to the 2011 settlement agreement with its shippers. On December 2, 2014, the FERC issued an order accepting and suspending the rates to be effective April 1, 2015, subject to refund, and setting a procedural schedule with a hearing scheduled in August 2015.
FGT Rate Case
On October 31, 2014, FGT filed a general NGA Section 4 rate case pursuant to a 2010 settlement agreement with its shippers. On November 28, 2014, the FERC issued an order accepting and suspending the rates to be effective May 1, 2015, subject to refund, and setting a procedural schedule with a hearing scheduled in late 2015.
Commitments
In the normal course of business, ETP and Regency purchase, process and sell natural gas pursuant to long-term contracts and enter into long-term transportation and storage agreements. Such contracts contain terms that are customary in the industry. We believe that the terms of these agreements are commercially reasonable and will not have a material adverse effect on its financial position or results of operations.
F - 61
We have certain non-cancelable leases for property and equipment, which require fixed monthly rental payments and expire at various dates through
2058
. The table below reflects rental expense under these operating leases included in operating expenses in the accompanying statements of operations, which include contingent rentals, and rental expense recovered through related sublease rental income:
|
Years Ended December 31,
|
||||||||||||
|
2014
|
2013
|
2012
|
||||||||||
|
Rental expense
(1)
|
$
|
159
|
|
$
|
151
|
|
$
|
60
|
|
|||
|
Less: Sublease rental income
|
(26
|
)
|
(24
|
)
|
(4
|
)
|
||||||
|
Rental expense, net
|
$
|
133
|
|
$
|
127
|
|
$
|
56
|
|
|||
|
(1)
|
Includes contingent rentals totaling
$24 million
,
$22 million
and
$6 million
for the years ended
December 31, 2014
,
2013
and
2012
, respectively.
|
Future minimum lease commitments for such leases are:
|
Years Ending December 31:
|
|
||
|
2015
|
$
|
151
|
|
|
2016
|
129
|
|
|
|
2017
|
118
|
|
|
|
2018
|
108
|
|
|
|
2019
|
102
|
|
|
|
Thereafter
|
829
|
|
|
|
Future minimum lease commitments
|
1,437
|
|
|
|
Less: Sublease rental income
|
(34
|
)
|
|
|
Net future minimum lease commitments
|
$
|
1,403
|
|
ETP and Regency’s joint venture agreements require that they fund their proportionate share of capital contributions to their unconsolidated affiliates. Such contributions will depend upon their unconsolidated affiliates’ capital requirements, such as for funding capital projects or repayment of long-term obligations.
Litigation and Contingencies
We may, from time to time, be involved in litigation and claims arising out of our operations in the normal course of business. Natural gas and crude oil are flammable and combustible. Serious personal injury and significant property damage can arise in connection with their transportation, storage or use. In the ordinary course of business, we are sometimes threatened with or named as a defendant in various lawsuits seeking actual and punitive damages for product liability, personal injury and property damage. We maintain liability insurance with insurers in amounts and with coverage and deductibles management believes are reasonable and prudent, and which are generally accepted in the industry. However, there can be no assurance that the levels of insurance protection currently in effect will continue to be available at reasonable prices or that such levels will remain adequate to protect us from material expenses related to product liability, personal injury or property damage in the future.
MTBE Litigation
Sunoco, Inc., along with other refiners, manufacturers and sellers of gasoline, is a defendant in lawsuits alleging MTBE contamination of groundwater. The plaintiffs typically include water purveyors and municipalities responsible for supplying drinking water and governmental authorities. The plaintiffs are asserting primarily product liability claims and additional claims including nuisance, trespass, negligence, violation of environmental laws and deceptive business practices. The plaintiffs in all of the cases are seeking to recover compensatory damages, and in some cases also seek natural resource damages, injunctive relief, punitive damages and attorneys’ fees.
As of
December 31, 2014
, Sunoco, Inc. is a defendant in
five
cases, including cases initiated by the States of New Jersey, Vermont, the Commonwealth of Pennsylvania, and two others by the Commonwealth of Puerto Rico with the more recent Puerto Rico action being a companion case alleging damages for additional sites beyond those at issue in the initial Puerto Rico action.
Four
of these cases are venued in a multidistrict litigation proceeding in a New York federal court. The New Jersey, Puerto Rico, Vermont and Pennsylvania cases assert natural resource damage claims.
F - 62
Fact discovery has concluded with respect to an initial set of
19
sites each that will be the subject of the first trial phase in the New Jersey case and the initial Puerto Rico case. Insufficient information has been developed about the plaintiffs’ legal theories or the facts with respect to statewide natural resource damage claims to provide an analysis of the ultimate potential liability of Sunoco, Inc. in these matters. It is reasonably possible that a loss may be realized; however, we are unable to estimate the possible loss or range of loss in excess of amounts accrued. Management believes that an adverse determination with respect to one or more of the MTBE cases could have a significant impact on results of operations during the period in which any said adverse determination occurs, but does not believe that any such adverse determination would have a material adverse effect on the Partnership’s consolidated financial position.
Litigation Relating to the PVR Merger
Five putative class action lawsuits challenging the PVR Acquisition are currently pending. All of these cases name PVR, PVR GP and the current directors of PVR GP, as well as the Partnership and the General Partner (collectively, the “Regency Defendants”), as defendants. Each of the lawsuits has been brought by a purported unitholder of PVR, both individually and on behalf of a putative class consisting of public unitholders of PVR. The lawsuits generally allege, among other things, that the directors of PVR GP breached their fiduciary duties to unitholders of PVR, that PVR GP, PVR and the Regency Defendants aided and abetted the directors of PVR GP in the alleged breach of these fiduciary duties, and, as to the actions in federal court, that some or all of PVR, PVR GP, and the directors of PVR GP violated Section 14(a) of the Exchange Act and Rule 14a-9 promulgated thereunder and Section 20(a) of the Exchange Act. The lawsuits purport to seek, in general, (i) injunctive relief, (ii) disclosure of certain additional information concerning the transaction, (iii) in the event the merger is consummated, rescission or an award of rescissory damages, (iv) an award of plaintiffs’ costs and (v) the accounting for damages allegedly causes by the defendants to these actions, and, (iv) such further relief as the court deems just and proper. The styles of the pending cases are as follows: David Naiditch v. PVR Partners, L.P., et al. (Case No. 9015-VCL) in the Court of Chancery of the State of Delaware); Charles Monatt v. PVR Partners, LP, et al. (Case No. 2013-10606) and Saul Srour v. PVR Partners, L.P., et al. (Case No. 2013-011015), each pending in the Court of Common Pleas for Delaware County, Pennsylvania; Stephen Bushansky v. PVR Partners, L.P., et al. (C.A. No. 2:13-cv-06829-HB); and Mark Hinnau v. PVR Partners, L.P., et al. (C.A. No. 2:13-cv-07496-HB), pending in the United States District Court for the Eastern District of Pennsylvania.
On January 28, 2014, the defendants entered into a Memorandum of Understanding (“MOU”) with Monatt, Srour, Bushansky, Naiditch and Hinnau pursuant to which defendants and the referenced plaintiffs agreed in principle to a settlement of their lawsuits (“Settled Lawsuits”), which will be memorialized in a separate settlement agreement, subject to customary conditions, including consummation of the PVR Acquisition, completion of certain confirmatory discovery, class certification and final approval by the Court of Common Pleas for Delaware County, Pennsylvania. If the Court approves the settlement, the Settled Lawsuits will be dismissed with prejudice and all defendants will be released from any and all claims relating to the Settled Lawsuits.
The settlement will not affect any provisions of the merger agreement or the form or amount of consideration to be received by PVR unitholders in the PVR Acquisition. The defendants have denied and continue to deny any wrongdoing or liability with respect to the plaintiffs’ claims in the aforementioned litigation and have entered into the settlement to eliminate the uncertainty, burden, risk, expense, and distraction of further litigation.
Eagle Rock Shareholder Litigation
Three putative class action lawsuits challenging the Eagle Rock Midstream Acquisition are currently pending in federal district court in Houston, Texas. All cases name Eagle Rock and its current directors, as well as the Partnership and a subsidiary, as defendants. One of the lawsuits also names additional Eagle Rock entities as defendants. Each of the lawsuits has been brought by a purported unitholder of Eagle Rock (collectively, the “Plaintiffs”), both individually and on behalf of a putative class consisting of public unitholders of Eagle Rock. The Plaintiffs in each case seek to rescind the transaction, claiming, among other things, that it yields inadequate consideration, was tainted by conflict and constitutes breaches of common law fiduciary duties or contractually imposed duties to the shareholders. Plaintiffs also seek monetary damages and attorneys’ fees. Regency and its subsidiary are named as “aiders and abettors” of the allegedly wrongful actions of Eagle Rock and its board.
Enterprise Products Partners, L.P. and Enterprise Products Operating LLC Litigation
On January 27, 2014, a trial commenced between ETP against Enterprise Products Partners, L.P. and Enterprise Products Operating LLC (collectively, “Enterprise”) and Enbridge (US) Inc. Trial resulted in a verdict in favor of ETP against Enterprise that consisted of
$319 million
in compensatory damages and
$595 million
in disgorgement to ETP. The jury also found that ETP owed Enterprise
$1 million
under a reimbursement agreement. On July 29, 2014, the trial court entered a final judgment in favor of ETP and awarded ETP
$536 million
, consisting of compensatory damages, disgorgement, and pre-judgment interest. The trial court also ordered that ETP shall be entitled to recover post-judgment interest and costs of court and that Enterprise is not entitled to any net recovery on its counterclaims. Enterprise has filed a notice of appeal. In accordance with GAAP,
F - 63
no amounts related to the original verdict or the July 29, 2014 final judgment will be recorded in our financial statements until the appeal process is completed.
Other Litigation and Contingencies
We or our subsidiaries are a party to various legal proceedings and/or regulatory proceedings incidental to our businesses. For each of these matters, we evaluate the merits of the case, our exposure to the matter, possible legal or settlement strategies, the likelihood of an unfavorable outcome and the availability of insurance coverage. If we determine that an unfavorable outcome of a particular matter is probable and can be estimated, we accrue the contingent obligation, as well as any expected insurance recoverable amounts related to the contingency. As of
December 31, 2014
and 2013, accruals of approximately
$37 million
and
$46 million
, respectively, were reflected on our balance sheets related to these contingent obligations. As new information becomes available, our estimates may change. The impact of these changes may have a significant effect on our results of operations in a single period.
The outcome of these matters cannot be predicted with certainty and there can be no assurance that the outcome of a particular matter will not result in the payment of amounts that have not been accrued for the matter. Furthermore, we may revise accrual amounts prior to resolution of a particular contingency based on changes in facts and circumstances or changes in the expected outcome. Currently, we are not able to estimate possible losses or a range of possible losses in excess of amounts accrued.
No
amounts have been recorded in our
December 31, 2014
or
2013
consolidated balance sheets for contingencies and current litigation, other than amounts disclosed herein.
Attorney General of the Commonwealth of Massachusetts v New England Gas Company
On July 7, 2011, the Massachusetts Attorney General (“AG”) filed a regulatory complaint with the Massachusetts Department of Public Utilities (“MDPU”) against New England Gas Company with respect to certain environmental cost recoveries. The AG is seeking a refund to New England Gas Company customers for alleged “excessive and imprudently incurred costs” related to legal fees associated with Southern Union’s environmental response activities. In the complaint, the AG requests that the MDPU initiate an investigation into the New England Gas Company’s collection and reconciliation of recoverable environmental costs including: (i) the prudence of any and all legal fees, totaling approximately
$19 million
, that were charged by the Kasowitz, Benson, Torres & Friedman firm and passed through the recovery mechanism since 2005, the year when a partner in the firm, the Southern Union former Vice Chairman, President and Chief Operating Officer, joined Southern Union’s management team; (ii) the prudence of any and all legal fees that were charged by the Bishop, London & Dodds firm and passed through the recovery mechanism since 2005, the period during which a member of the firm served as Southern Union’s Chief Ethics Officer; and (iii) the propriety and allocation of certain legal fees charged that were passed through the recovery mechanism that the AG contends only qualify for a lesser,
50%
, level of recovery. Southern Union has filed its answer denying the allegations and moved to dismiss the complaint, in part on a theory of collateral estoppel. The hearing officer has deferred consideration of Southern Union’s motion to dismiss. The AG’s motion to be reimbursed expert and consultant costs by Southern Union of up to
$150,000
was granted. By tariff, these costs are recoverable through rates charged to New England Gas Company customers. The hearing officer previously stayed discovery pending resolution of a dispute concerning the applicability of attorney-client privilege to legal billing invoices. The MDPU issued an interlocutory order on June 24, 2013 that lifted the stay, and discovery has resumed. Panhandle (as successor to Southern Union) believes it has complied with all applicable requirements regarding its filings for cost recovery and has not recorded any accrued liability; however, Panhandle will continue to assess its potential exposure for such cost recoveries as the matter progresses.
Air Quality Control
SUGS is currently negotiating settlements to certain enforcement actions by the NMED and the TCEQ. The TCEQ recently initiated a state-wide emissions inventory for the sulfur dioxide emissions from sites with reported emissions of 10 tons per year or more. If this data demonstrates that any source or group of sources may cause or contribute to a violation of the National Ambient Air Quality Standards, they must be sufficiently controlled to ensure timely attainment of the standard. This may potentially affect three SUGS recovery units in Texas. It is unclear at this time how the NMED will address the sulfur dioxide standard.
Compliance Orders from the New Mexico Environmental Department
SUGS has been in discussions with the NMED concerning allegations of violations of New Mexico air regulations related to the Jal #3 and Jal #4 facilities. Hearings on the compliance orders were delayed until March 2014 to allow the parties to pursue substantive settlement discussions. SUGS has meritorious defenses to the NMED claims and can offer significant mitigating factors to the claimed violations. SUGS has recorded a liability of less than
$1 million
related to the claims and will continue to assess its potential exposure to the allegations as the matter progresses.
F - 64
Environmental Matters
Our operations are subject to extensive federal, state and local environmental and safety laws and regulations that require expenditures to ensure compliance, including related to air emissions and wastewater discharges, at operating facilities and for remediation at current and former facilities as well as waste disposal sites. Although we believe our operations are in substantial compliance with applicable environmental laws and regulations, risks of additional costs and liabilities are inherent in the business of transporting, storing, gathering, treating, compressing, blending and processing natural gas, natural gas liquids and other products. As a result, there can be no assurance that significant costs and liabilities will not be incurred. Costs of planning, designing, constructing and operating pipelines, plants and other facilities must incorporate compliance with environmental laws and regulations and safety standards. Failure to comply with these laws and regulations may result in the assessment of administrative, civil and criminal penalties, the imposition of remedial obligations, the issuance of injunctions and the filing of federally authorized citizen suits. Contingent losses related to all significant known environmental matters have been accrued and/or separately disclosed. However, we may revise accrual amounts prior to resolution of a particular contingency based on changes in facts and circumstances or changes in the expected outcome.
Environmental exposures and liabilities are difficult to assess and estimate due to unknown factors such as the magnitude of possible contamination, the timing and extent of remediation, the determination of our liability in proportion to other parties, improvements in cleanup technologies and the extent to which environmental laws and regulations may change in the future. Although environmental costs may have a significant impact on the results of operations for any single period, we believe that such costs will not have a material adverse effect on our financial position.
Based on information available at this time and reviews undertaken to identify potential exposure, we believe the amount reserved for environmental matters is adequate to cover the potential exposure for cleanup costs.
Environmental Remediation
Our subsidiaries are responsible for environmental remediation at certain sites, including the following:
|
•
|
Certain of our interstate pipelines conduct soil and groundwater remediation related to contamination from past uses of PCBs. PCB assessments are ongoing and, in some cases, our subsidiaries could potentially be held responsible for contamination caused by other parties.
|
|
•
|
Certain gathering and processing systems are responsible for soil and groundwater remediation related to releases of hydrocarbons.
|
|
•
|
Currently operating Sunoco, Inc. retail sites.
|
|
•
|
Legacy sites related to Sunoco, Inc., that are subject to environmental assessments include formerly owned terminals and other logistics assets, retail sites that Sunoco, Inc. no longer operates, closed and/or sold refineries and other formerly owned sites.
|
|
•
|
Sunoco, Inc. is potentially subject to joint and several liability for the costs of remediation at sites at which it ha
s been identified as a “potentially responsible party” (“PRP”). As of
December 31, 2014
, Sunoco, Inc. had been named as a PRP at approximatel
y
51
identified or potentially identifiable “Superfund” sites under federal and/or comparable state law. Sunoco, Inc. is usually one of a number of companies identified as a PRP at a site. Sunoco, Inc. has reviewed the nature and extent of its involvement at each site and other relevant circumstances and, based upon Sunoco, Inc.’s purported nexus to the sites, believes that its potential liability associated with such sites will not be significant.
|
To the extent estimable, expected remediation costs are included in the amounts recorded for environmental matters in our consolidated balance sheets. In some circumstances, future costs cannot be reasonably estimated because remediation activities are undertaken as claims are made by customers and former customers. To the extent that an environmental remediation obligation is recorded by a subsidiary that applies regulatory accounting policies, amounts that are expected to be recoverable through tariffs or rates are recorded as regulatory assets on our consolidated balance sheets.
F - 65
The table below reflects the amounts of accrued liabilities recorded in our consolidated balance sheets related to environmental matters that are considered to be probable and reasonably estimable. Currently, we are not able to estimate possible losses or a range of possible losses in excess of amounts accrued. Except for matters discussed above, we do not have any material environmental matters assessed as reasonably possible that would require disclosure in our consolidated financial statements.
|
December 31,
|
|||||||
|
|
2014
|
2013
|
|||||
|
Current
|
$
|
41
|
|
$
|
47
|
|
|
|
Non-current
|
360
|
|
356
|
|
|||
|
Total environmental liabilities
|
$
|
401
|
|
$
|
403
|
|
|
In 2013, we established a wholly-owned captive insurance company to bear certain risks associated with environmental obligations related to certain sites that are no longer operating. The premiums paid to the captive insurance company include estimates for environmental claims that have been incurred but not reported, based on an actuarially determined fully developed claims expense estimate. In such cases, we accrue losses attributable to unasserted claims based on the discounted estimates that are used to develop the premiums paid to the captive insurance company.
During the years ended
December 31, 2014
and
2013
, the Partnership recorded
$48 million
and
$41 million
, respectively, of expenditures related to environmental cleanup programs.
On June 29, 2011, the U.S. Environmental Protection Agency finalized a rule under the Clean Air Act that revised the new source performance standards for manufacturers, owners and operators of new, modified and reconstructed stationary internal combustion engines. The rule became effective on August 29, 2011. The rule modifications may require us to undertake significant expenditures, including expenditures for purchasing, installing, monitoring and maintaining emissions control equipment, if we replace equipment or expand existing facilities in the future. At this point, we are not able to predict the cost to comply with the rule’s requirements, because the rule applies only to changes we might make in the future.
Our pipeline operations are subject to regulation by the U.S. Department of Transportation under the PHMSA, pursuant to which the PHMSA has established requirements relating to the design, installation, testing, construction, operation, replacement and management of pipeline facilities. Moreover, the PHMSA, through the Office of Pipeline Safety, has promulgated a rule requiring pipeline operators to develop integrity management programs to comprehensively evaluate their pipelines, and take measures to protect pipeline segments located in what the rule refers to as “high consequence areas.” Activities under these integrity management programs involve the performance of internal pipeline inspections, pressure testing or other effective means to assess the integrity of these regulated pipeline segments, and the regulations require prompt action to address integrity issues raised by the assessment and analysis. Integrity testing and assessment of all of these assets will continue, and the potential exists that results of such testing and assessment could cause us to incur future capital and operating expenditures for repairs or upgrades deemed necessary to ensure the continued safe and reliable operation of our pipelines; however, no estimate can be made at this time of the likely range of such expenditures.
Our operations are also subject to the requirements of the OSHA, and comparable state laws that regulate the protection of the health and safety of employees. In addition, OSHA’s hazardous communication standard requires that information be maintained about hazardous materials used or produced in our operations and that this information be provided to employees, state and local government authorities and citizens. We believe that our operations are in substantial compliance with the OSHA requirements, including general industry standards, record keeping requirements, and monitoring of occupational exposure to regulated substances.
|
13.
|
PRICE RISK MANAGEMENT ASSETS AND LIABILITIES:
|
Commodity Price Risk
We are exposed to market risks related to the volatility of commodity prices. To manage the impact of volatility from these prices, our subsidiaries utilize various exchange-traded and OTC commodity financial instrument contracts. These contracts consist primarily of futures, swaps and options and are recorded at fair value in our consolidated balance sheets. Following is a description of price risk management activities by operating entity.
ETP
ETP injects and holds natural gas in its Bammel storage facility to take advantage of contango markets (i.e., when the price of natural gas is higher in the future than the current spot price). ETP uses financial derivatives to hedge the natural gas held
F - 66
in connection with these arbitrage opportunities. At the inception of the hedge, ETP locks in a margin by purchasing gas in the spot market or off peak season and entering into a financial contract to lock in the sale price. If ETP designates the related financial contract as a fair value hedge for accounting purposes, ETP values the hedged natural gas inventory at current spot market prices along with the financial derivative ETP uses to hedge it. Changes in the spread between the forward natural gas prices designated as fair value hedges and the physical inventory spot price result in unrealized gains or losses until the underlying physical gas is withdrawn and the related designated derivatives are settled. Once the gas is withdrawn and the designated derivatives are settled, the previously unrealized gains or losses associated with these positions are realized. Unrealized margins represent the unrealized gains or losses from ETP’s derivative instruments using mark-to-market accounting, with changes in the fair value of our derivatives being recorded directly in earnings. These margins fluctuate based upon changes in the spreads between the physical spot price and forward natural gas prices. If the spread narrows between the physical and financial prices, ETP will record unrealized gains or lower unrealized losses. If the spread widens, ETP will record unrealized losses or lower unrealized gains. Typically, as ETP enters the winter months, the spread converges so that ETP recognizes in earnings the original locked-in spread through either mark-to-market adjustments or the physical withdraw of natural gas.
ETP is also exposed to market risk on natural gas it retains for fees in its intrastate transportation and storage operations and operational gas sales on its interstate transportation and storage operations. ETP uses financial derivatives to hedge the sales price of this gas, including futures, swaps and options. Certain contracts that qualify for hedge accounting are designated as cash flow hedges of the forecasted sale of natural gas. The change in value, to the extent the contracts are effective, remains in AOCI until the forecasted transaction occurs. When the forecasted transaction occurs, any gain or loss associated with the derivative is recorded in cost of products sold in the consolidated statement of operations.
ETP is also exposed to commodity price risk on NGLs and residue gas it retains for fees in its midstream operations whereby its subsidiaries generally gather and process natural gas on behalf of producers, sell the resulting residue gas and NGL volumes at market prices and remit to producers an agreed upon percentage of the proceeds based on an index price for the residue gas and NGLs. ETP uses NGL and crude derivative swap contracts to hedge forecasted sales of NGL and condensate equity volumes. Certain contracts that qualify for hedge accounting are accounted for as cash flow hedges. The change in value, to the extent the contracts are effective, remains in AOCI until the forecasted transaction occurs. When the forecasted transaction occurs, any gain or loss associated with the derivative is recorded in cost of products sold in the consolidated statement of operations.
ETP may use derivatives in ETP’s liquids transportation and services operations to manage ETP’s storage facilities and the purchase and sale of purity NGLs.
Sunoco Logistics utilizes derivatives such as swaps, futures and other derivative instruments to mitigate the risk associated with market movements in the price of refined products and NGLs. These derivative contracts act as a hedging mechanism against the volatility of prices by allowing Sunoco Logistics to transfer this price risk to counterparties who are able and willing to bear it. Since the first quarter 2013, Sunoco Logistics has not designated any of its derivative contracts as hedges for accounting purposes. Therefore, all realized and unrealized gains and losses from these derivative contracts are recognized in the consolidated statements of operations during the current period.
ETP also uses derivatives to hedge a variety of price risks in its retail marketing operations. Futures and swaps are used to achieve ratable pricing of crude oil purchases, to convert certain expected refined product sales to fixed or floating prices, to lock in margins for certain refined products and to lock in the price of a portion of natural gas purchases or sales and transportation costs. The derivatives used in ETP’s retail marketing operations represent economic hedges; however, ETP has elected not to designate any of the hedges in these operations. Therefore, all realized and unrealized gains and losses from these derivative contracts are recognized in the consolidated statements of operations during the current period.
ETP’s trading activities include the use of financial commodity derivatives to take advantage of market opportunities. These trading activities are a complement to its transportation and storage operations and are netted in cost of products sold in the consolidated statements of operations. Additionally, ETP also has trading activities related to power and natural gas in its other operations which are also netted in cost of products sold. As a result of its trading activities and the use of derivative financial instruments in its transportation and storage operations, the degree of earnings volatility that can occur may be significant, favorably or unfavorably, from period to period. ETP attempts to manage this volatility through the use of daily position and profit and loss reports provided to its risk oversight committee, which includes members of senior management, and the limits and authorizations set forth in ETP’s commodity risk management policy.
F - 67
The following table details ETP’s outstanding commodity-related derivatives:
|
|
December 31, 2014
|
December 31, 2013
|
|||||||
|
|
Notional
Volume
|
Maturity
|
Notional
Volume
|
Maturity
|
|||||
|
Mark-to-Market Derivatives
|
|||||||||
|
(Trading)
|
|||||||||
|
Natural Gas (MMBtu):
|
|||||||||
|
Fixed Swaps/Futures
|
(232,500
|
)
|
2015
|
9,457,500
|
|
2014-2019
|
|||
|
Basis Swaps IFERC/NYMEX
(1)
|
(13,907,500
|
)
|
2015 - 2016
|
(487,500
|
)
|
2014-2017
|
|||
|
Swing Swaps
|
—
|
|
—
|
1,937,500
|
|
2014-2016
|
|||
|
Options – Calls
|
5,000,000
|
|
2015
|
—
|
|
—
|
|||
|
Power (Megawatt):
|
|||||||||
|
Forwards
|
288,775
|
|
2015
|
351,050
|
|
2014
|
|||
|
Futures
|
(156,000
|
)
|
2015
|
(772,476
|
)
|
2014
|
|||
|
Options — Puts
|
(72,000
|
)
|
2015
|
(52,800
|
)
|
2014
|
|||
|
Options — Calls
|
198,556
|
|
2105
|
103,200
|
|
2014
|
|||
|
Crude (Bbls) – Futures
|
—
|
|
—
|
103,000
|
|
2014
|
|||
|
(Non-Trading)
|
|||||||||
|
Natural Gas (MMBtu):
|
|||||||||
|
Basis Swaps IFERC/NYMEX
|
57,500
|
|
2015
|
570,000
|
|
2014
|
|||
|
Swing Swaps IFERC
|
46,150,000
|
|
2015
|
(9,690,000
|
)
|
2014-2016
|
|||
|
Fixed Swaps/Futures
|
(8,779,000
|
)
|
2015 - 2016
|
(8,195,000
|
)
|
2014-2015
|
|||
|
Forward Physical Contracts
|
(9,116,777
|
)
|
2015
|
5,668,559
|
|
2014-2015
|
|||
|
Natural Gas Liquid (Bbls) – Forwards/Swaps
|
(2,179,400
|
)
|
2015
|
(1,133,600
|
)
|
2014
|
|||
|
Refined Products (Bbls) – Futures
|
13,745,755
|
|
2015
|
(280,000
|
)
|
2014
|
|||
|
Fair Value Hedging Derivatives
|
|||||||||
|
(Non-Trading)
|
|||||||||
|
Natural Gas (MMBtu):
|
|||||||||
|
Basis Swaps IFERC/NYMEX
|
(39,287,500
|
)
|
2015
|
(7,352,500
|
)
|
2014
|
|||
|
Fixed Swaps/Futures
|
(39,287,500
|
)
|
2015
|
(50,530,000
|
)
|
2014
|
|||
|
Hedged Item — Inventory
|
39,287,500
|
|
2015
|
50,530,000
|
|
2014
|
|||
|
Cash Flow Hedging Derivatives
|
|||||||||
|
(Non-Trading)
|
|||||||||
|
Natural Gas (MMBtu):
|
|||||||||
|
Basis Swaps IFERC/NYMEX
|
—
|
|
—
|
(1,825,000
|
)
|
2014
|
|||
|
Fixed Swaps/Futures
|
—
|
|
—
|
(12,775,000
|
)
|
2014
|
|||
|
Natural Gas Liquid (Bbls) – Forwards/Swaps
|
—
|
|
—
|
(780,000
|
)
|
2014
|
|||
|
Crude (Bbls) – Futures
|
—
|
|
—
|
(30,000
|
)
|
2014
|
|||
|
(1)
|
Includes aggregate amounts for open positions related to Houston Ship Channel, Waha Hub, NGPL TexOk, West Louisiana Zone and Henry Hub locations.
|
Regency
Regency is a net seller of NGLs, condensate and natural gas as a result of its gathering and processing operations. The prices of these commodities are impacted by changes in the supply and demand as well as market forces. Regency’s profitability and cash flow are affected by the inherent volatility of these commodities, which could adversely affect its ability to make distributions to its unitholders. Regency manages this commodity price exposure through an integrated strategy that includes management of its contract portfolio, matching sales prices of commodities with purchases, optimization of its portfolio by
F - 68
monitoring basis and other price differentials in operating areas and the use of derivative contracts. In some cases, Regency may not be able to match pricing terms or to cover its risk to price exposure with financial hedges, and it may be exposed to commodity price risk.
Marketing & Trading
. Regency conducts natural gas marketing and trading activities through its Logistics and Trading subsidiary. Regency engages in activities intended to capitalize on favorable price differentials between various receipt and delivery locations. Regency enters into both financial derivatives and physical contracts. These financial derivatives, primarily basis swaps, are transacted: (i) to economically hedge subscribed capacity exposed to market rate fluctuations and (ii) to mitigate the price risk related to other purchase and sales of natural gas. By entering into a basis swap, one pricing index is exchanged for another, effectively locking in the margin between the natural gas purchase and sale by removing index spread risk on the combined physical and financial transaction. Changes in the fair value of these financial and physical contracts are recorded as adjustments to natural gas sales and realized (unrealized) gain (loss) from derivatives, as appropriate.
Through its natural gas marketing activity, Regency has credit exposure to additional counterparties. Regency minimizes the credit risk associated with natural gas marketing by limiting its exposure to any single counterparty and monitoring the creditworthiness of its counterparties on an ongoing basis. In addition, Regency’s natural gas purchase and sale contracts, for certain counterparties, are subject to counterparty netting agreements governing settlement under such natural gas purchase and sales contracts, and when possible, Regency nets the open positions of each counterparty.
Regency is exposed to market risks associated with commodity prices, counterparty credit, and interest rates. Regency’s management and the board of directors of Regency GP have established comprehensive risk management policies and procedures to monitor and manage these market risks. Regency GP is responsible for delegation of transaction authority levels, and the Audit and Risk Committee of Regency GP is responsible for the overall management of credit risk and commodity price risk, including monitoring exposure limits. Regency GP’s Audit and Risk Committee receives regular briefings on positions and exposures, credit exposures, and overall risk management in the context of market activities.
Regency’s Preferred Units (see Note
7
) contain embedded derivatives which are required to be bifurcated and accounted for separately, such as the holders’ conversion option and Regency’s call option. These embedded derivatives are accounted for using mark-to-market accounting. Regency does not expect the embedded derivatives to affect its cash flows.
The following table details Regency’s outstanding commodity-related derivatives:
|
|
December 31, 2014
|
December 31, 2013
|
|||||||
|
|
Notional
Volume
|
Maturity
|
Notional
Volume
|
Maturity
|
|||||
|
Mark-to-Market Derivatives
|
|||||||||
|
(Non-Trading)
|
|||||||||
|
Natural Gas (MMBtu) — Fixed Swaps/Futures
|
(25,525,000
|
)
|
2015
|
(24,455,000
|
)
|
2014-2015
|
|||
|
Propane (Gallons) — Forwards/Swaps
|
(29,148,000
|
)
|
2015
|
(52,122,000
|
)
|
2014-2015
|
|||
|
NGLs (Barrels) — Forwards/Swaps
|
(292,000
|
)
|
2015
|
(438,000
|
)
|
2014
|
|||
|
WTI Crude Oil (Barrels) — Forwards/Swaps
|
(1,252,000
|
)
|
2015-2016
|
(521,000
|
)
|
2014
|
|||
Interest Rate Risk
We are exposed to market risk for changes in interest rates. To maintain a cost effective capital structure, we borrow funds using a mix of fixed rate debt and variable rate debt. We also manage our interest rate exposure by utilizing interest rate swaps to achieve a desired mix of fixed and variable rate debt. We also utilize forward starting interest rate swaps to lock in the rate on a portion of anticipated debt issuances.
F - 69
The following table summarizes our interest rate swaps outstanding, none of which are designated as hedges for accounting purposes:
|
|
|
|
Notional Amount Outstanding
|
|||||||||
|
Entity
|
Term
|
Type
(1)
|
December 31,
2014 |
December 31,
2013 |
||||||||
|
ETP
|
July 2014
(2)
|
Forward-starting to pay a fixed rate of 4.25% and receive a floating rate
|
$
|
—
|
|
$
|
400
|
|
||||
|
ETP
|
July 2015
(2)
|
Forward-starting to pay a fixed rate of 3.38% and receive a floating rate
|
200
|
|
—
|
|
||||||
|
ETP
|
July 2016
(3)
|
Forward-starting to pay a fixed rate of 3.80% and receive a floating rate
|
200
|
|
—
|
|
||||||
|
ETP
|
July 2017
(4)
|
Forward-starting to pay a fixed rate of 3.84% and receive a floating rate
|
300
|
|
—
|
|
||||||
|
ETP
|
July 2018
(4)
|
Forward-starting to pay a fixed rate of 4.00% and receive a floating rate
|
200
|
|
—
|
|
||||||
|
ETP
|
July 2019
(4)
|
Forward-starting to pay a fixed rate of 3.19% and receive a floating rate
|
300
|
|
—
|
|
||||||
|
ETP
|
July 2018
|
Pay a floating rate plus a spread of 4.17% and receive a fixed rate of 6.70%
|
—
|
|
600
|
|
||||||
|
ETP
|
June 2021
|
Pay a floating rate plus a spread of 2.17% and receive a fixed rate of 4.65%
|
—
|
|
400
|
|
||||||
|
ETP
|
February 2023
|
Pay a floating rate plus a spread of 1.73% and receive a fixed rate of 3.60%
|
200
|
|
400
|
|
||||||
|
Panhandle
|
November 2021
|
Pay a fixed rate of 3.82% and receive a floating rate
|
—
|
|
275
|
|
||||||
|
(1)
|
Floating rates are based on 3-month LIBOR.
|
|
(2)
|
Represents the effective date. These forward-starting swaps have a term of 10 years with a mandatory termination date the same as the effective date.
|
|
(3)
|
Represents the effective date. These forward-starting swaps have terms of 10 and 30 years with a mandatory termination date the same as the effective date.
|
|
(4)
|
Represents the effective date. These forward-starting swaps have a term of 30 years with a mandatory termination date the same as the effective date.
|
Credit Risk
Credit risk refers to the risk that a counterparty may default on its contractual obligations resulting in a loss to the Partnership. Credit policies have been approved and implemented to govern ETP’s portfolio of counterparties with the objective of mitigating credit losses. These policies establish guidelines, controls and limits to manage credit risk within approved tolerances by mandating an appropriate evaluation of the financial condition of existing and potential counterparties, monitoring agency credit ratings, and by implementing credit practices that limit exposure according to the risk profiles of the counterparties. Furthermore, ETP may at times require collateral under certain circumstances to mitigate credit risk as necessary. ETP also implements the use of industry standard commercial agreements which allow for the netting of positive and negative exposures associated with transactions executed under a single commercial agreement. Additionally, ETP utilizes master netting agreements to offset credit exposure across multiple commercial agreements with a single counterparty or affiliated group of counterparties.
ETP’s counterparties consist of a diverse portfolio of customers across the energy industry, including petrochemical companies, commercial and industrials, oil and gas producers, municipalities, gas and electric utilities and midstream companies. ETP’s overall exposure may be affected positively or negatively by macroeconomic or regulatory changes that impact its counterparties to one extent or another. Currently, management does not anticipate a material adverse effect in our financial position or results of operations as a consequence of counterparty non-performance.
ETP has maintenance margin deposits with certain counterparties in the OTC market, primarily independent system operators, and with clearing brokers. Payments on margin deposits are required when the value of a derivative exceeds its pre-established
F - 70
credit limit with the counterparty. Margin deposits are returned to ETP on the settlement date for non-exchange traded derivatives, and ETP exchanges margin calls on a daily basis for exchange traded transactions. Since the margin calls are made daily with the exchange brokers, the fair value of the financial derivative instruments are deemed current and netted in deposits paid to vendors within other current assets in the consolidated balance sheets.
Regency is exposed to credit risk from its derivative counterparties. Regency does not require collateral from these counterparties as it deals primarily with financial institutions when entering into financial derivatives, and enters into master netting agreements that allow for netting of swap contract receivables and payables in the event of default by either party. If Regency’s counterparties failed to perform under existing swap contracts, Regency’s maximum loss as of
December 31, 2014
would be
$82 million
, which would be reduced by less than
$1 million
due to the netting feature. Regency has elected to present assets and liabilities under master netting agreements gross on the condensed consolidated balance sheets for it derivate contracts outside of its marketing and trading operations.
For financial instruments, failure of a counterparty to perform on a contract could result in our inability to realize amounts that have been recorded on our consolidated balance sheets and recognized in net income or other comprehensive income.
Derivative Summary
The following table provides a summary of our derivative assets and liabilities:
|
|
Fair Value of Derivative Instruments
|
||||||||||||||
|
|
Asset Derivatives
|
Liability Derivatives
|
|||||||||||||
|
|
December 31, 2014
|
December 31, 2013
|
December 31, 2014
|
December 31, 2013
|
|||||||||||
|
Derivatives designated as hedging instruments:
|
|||||||||||||||
|
Commodity derivatives (margin deposits)
|
$
|
43
|
|
$
|
3
|
|
$
|
—
|
|
$
|
(18
|
)
|
|||
|
43
|
|
3
|
|
—
|
|
(18
|
)
|
||||||||
|
Derivatives not designated as hedging instruments:
|
|||||||||||||||
|
Commodity derivatives (margin deposits)
|
$
|
617
|
|
$
|
227
|
|
$
|
(577
|
)
|
$
|
(209
|
)
|
|||
|
Commodity derivatives
|
107
|
|
43
|
|
(23
|
)
|
(48
|
)
|
|||||||
|
Interest rate derivatives
|
3
|
|
47
|
|
(155
|
)
|
(95
|
)
|
|||||||
|
Embedded derivatives in Regency Preferred Units
|
—
|
|
—
|
|
(16
|
)
|
(19
|
)
|
|||||||
|
727
|
|
317
|
|
(771
|
)
|
(371
|
)
|
||||||||
|
Total derivatives
|
$
|
770
|
|
$
|
320
|
|
$
|
(771
|
)
|
$
|
(389
|
)
|
|||
F - 71
The following table presents the fair value of our recognized derivative assets and liabilities on a gross basis and amounts offset on the consolidated balance sheets that are subject to enforceable master netting arrangements or similar arrangements:
|
Asset Derivatives
|
Liability Derivatives
|
|||||||||||||||||
|
Balance Sheet Location
|
December 31, 2014
|
December 31, 2013
|
December 31, 2014
|
December 31, 2013
|
||||||||||||||
|
Derivatives in offsetting agreements:
|
||||||||||||||||||
|
OTC contracts
|
Price risk management assets (liabilities)
|
$
|
23
|
|
$
|
42
|
|
$
|
(23
|
)
|
$
|
(38
|
)
|
|||||
|
Broker cleared derivative contracts
|
Other current assets
|
674
|
|
264
|
|
(574
|
)
|
(318
|
)
|
|||||||||
|
697
|
|
306
|
|
(597
|
)
|
(356
|
)
|
|||||||||||
|
Offsetting agreements:
|
||||||||||||||||||
|
Counterparty netting
|
Price risk management assets (liabilities)
|
(19
|
)
|
(36
|
)
|
19
|
|
36
|
|
|||||||||
|
Payments on margin deposit
|
Other current assets
|
5
|
|
(1
|
)
|
(22
|
)
|
55
|
|
|||||||||
|
(14
|
)
|
(37
|
)
|
(3
|
)
|
91
|
|
|||||||||||
|
Net derivatives with offsetting agreements
|
683
|
|
269
|
|
(600
|
)
|
(265
|
)
|
||||||||||
|
Derivatives without offsetting agreements
|
87
|
|
51
|
|
(171
|
)
|
(124
|
)
|
||||||||||
|
Total derivatives
|
$
|
770
|
|
$
|
320
|
|
$
|
(771
|
)
|
$
|
(389
|
)
|
||||||
We disclose the non-exchange traded financial derivative instruments as price risk management assets and liabilities on our consolidated balance sheets at fair value with amounts classified as either current or long-term depending on the anticipated settlement date.
The following tables summarize the amounts recognized with respect to our derivative financial instruments:
|
|
Change in Value Recognized in OCI
on Derivatives (Effective Portion)
|
||||||||||
|
|
Years Ended December 31,
|
||||||||||
|
|
2014
|
2013
|
2012
|
||||||||
|
Derivatives in cash flow hedging relationships:
|
|||||||||||
|
Commodity derivatives
|
$
|
—
|
|
$
|
(1
|
)
|
$
|
8
|
|
||
|
Total
|
$
|
—
|
|
$
|
(1
|
)
|
$
|
8
|
|
||
|
|
Location of
Gain/(Loss) Reclassified
from AOCI into Income
(Effective Portion)
|
Amount of Gain/(Loss) Reclassified from
AOCI into Income (Effective Portion)
|
|||||||||||
|
|
Years Ended December 31,
|
||||||||||||
|
|
2014
|
2013
|
2012
|
||||||||||
|
Derivatives in cash flow hedging relationships:
|
|||||||||||||
|
Commodity derivatives
|
Cost of products sold
|
$
|
(3
|
)
|
$
|
4
|
|
$
|
14
|
|
|||
|
Total
|
$
|
(3
|
)
|
$
|
4
|
|
$
|
14
|
|
||||
F - 72
|
|
Location of Gain/(Loss)
Recognized in
Income on Derivatives
|
Amount of Gain/(Loss) Recognized in Income
Representing Hedge Ineffectiveness and
Amount Excluded from the Assessment of
Effectiveness
|
|||||||||||
|
|
Years Ended December 31,
|
||||||||||||
|
|
2014
|
2013
|
2012
|
||||||||||
|
Derivatives in fair value hedging relationships (including hedged item):
|
|||||||||||||
|
Commodity derivatives
|
Cost of products sold
|
$
|
(8
|
)
|
$
|
8
|
|
$
|
54
|
|
|||
|
Total
|
$
|
(8
|
)
|
$
|
8
|
|
$
|
54
|
|
||||
|
|
Location of Gain/(Loss) Recognized in Income on Derivatives
|
Amount of Gain/(Loss) Recognized
in Income on Derivatives
|
|||||||||||
|
|
Years Ended December 31,
|
||||||||||||
|
|
2014
|
2013
|
2012
|
||||||||||
|
Derivatives not designated as hedging instruments:
|
|||||||||||||
|
Commodity derivatives – Trading
|
Cost of products sold
|
$
|
(6
|
)
|
$
|
(11
|
)
|
$
|
(7
|
)
|
|||
|
Commodity derivatives – Non-trading
|
Cost of products sold
|
199
|
|
(21
|
)
|
26
|
|
||||||
|
Commodity contracts – Non-trading
|
Deferred gas purchases
|
—
|
|
(3
|
)
|
(26
|
)
|
||||||
|
Interest rate derivatives
|
Gains (losses) on interest rate derivatives
|
(157
|
)
|
53
|
|
(19
|
)
|
||||||
|
Embedded derivatives
|
Other income
|
3
|
|
6
|
|
14
|
|
||||||
|
Total
|
$
|
39
|
|
$
|
24
|
|
$
|
(12
|
)
|
||||
F - 73
|
14.
|
RETIREMENT BENEFITS:
|
Savings and Profit Sharing Plans
We and our subsidiaries sponsor defined contribution savings and profit sharing plans, which collectively cover virtually all eligible employees, including those of ETP, Regency and Lake Charles LNG. Employer matching contributions are calculated using a formula based on employee contributions. We and our subsidiaries have made matching contributions of
$59 million
,
$47 million
and
$30 million
to the 401(k) savings plan for the years ended
December 31, 2014, 2013 and 2012
, respectively.
Pension and Other Postretirement Benefit Plans
Panhandle
Panhandle offered postretirement health care and life insurance plans that were available to substantially all of its employees, pending the retiree meeting certain age and service requirements.
Sunoco, Inc.
Sunoco, Inc. sponsors a defined benefit pension plan, which was frozen for most participants on June 30, 2010. On October 31, 2014, Sunoco, Inc. terminated the plan and anticipates approval for the distribution of assets from the plan, pending approval from the Pension Benefit Guaranty Corporation and the IRS, in the fourth quarter of 2015.
Sunoco, Inc. also has a plan which provides health care benefits for substantially all of its current retirees. The cost to provide the postretirement benefit plan is shared by Sunoco, Inc. and its retirees. Access to postretirement medical benefits was phased out or eliminated for all employees retiring after July 1, 2010. In March, 2012, Sunoco, Inc. established a trust for its postretirement benefit liabilities. Sunoco made a tax-deductible contribution of approximately
$200 million
to the trust. The funding of the trust eliminated substantially all of Sunoco, Inc.’s future exposure to variances between actual results and assumptions used to estimate retiree medical plan obligations.
Obligations and Funded Status
Pension and other postretirement benefit liabilities are accrued on an actuarial basis during the years an employee provides services.
F - 74
The following table contains information at the dates indicated about the obligations and funded status of pension and other postretirement plans on a combined basis:
|
December 31, 2014
|
December 31, 2013
|
||||||||||||||||||||||
|
Pension Benefits
|
Pension Benefits
|
||||||||||||||||||||||
|
Funded Plans
|
Unfunded Plans
|
Other Postretirement Benefits
|
Funded Plans
|
Unfunded Plans
|
Other Postretirement Benefits
|
||||||||||||||||||
|
Change in benefit obligation:
|
|||||||||||||||||||||||
|
Benefit obligation at beginning of period
|
$
|
632
|
|
$
|
61
|
|
$
|
223
|
|
$
|
1,117
|
|
$
|
78
|
|
$
|
296
|
|
|||||
|
Service cost
|
—
|
|
—
|
|
—
|
|
3
|
|
—
|
|
—
|
|
|||||||||||
|
Interest cost
|
28
|
|
3
|
|
5
|
|
33
|
|
2
|
|
6
|
|
|||||||||||
|
Amendments
|
—
|
|
—
|
|
1
|
|
—
|
|
—
|
|
2
|
|
|||||||||||
|
Benefits paid, net
|
(45
|
)
|
(9
|
)
|
(28
|
)
|
(99
|
)
|
(16
|
)
|
(26
|
)
|
|||||||||||
|
Actuarial (gain) loss and other
|
130
|
|
10
|
|
2
|
|
(74
|
)
|
(3
|
)
|
(14
|
)
|
|||||||||||
|
Settlements
|
(27
|
)
|
—
|
|
—
|
|
(95
|
)
|
—
|
|
—
|
|
|||||||||||
|
Dispositions
|
—
|
|
—
|
|
—
|
|
(253
|
)
|
—
|
|
(41
|
)
|
|||||||||||
|
Benefit obligation at end of period
|
$
|
718
|
|
$
|
65
|
|
$
|
203
|
|
$
|
632
|
|
$
|
61
|
|
$
|
223
|
|
|||||
|
Change in plan assets:
|
|||||||||||||||||||||||
|
Fair value of plan assets at beginning of period
|
600
|
|
—
|
|
284
|
|
906
|
|
—
|
|
312
|
|
|||||||||||
|
Return on plan assets and other
|
70
|
|
—
|
|
7
|
|
43
|
|
—
|
|
17
|
|
|||||||||||
|
Employer contributions
|
—
|
|
—
|
|
9
|
|
—
|
|
—
|
|
8
|
|
|||||||||||
|
Benefits paid, net
|
(45
|
)
|
—
|
|
(28
|
)
|
(99
|
)
|
—
|
|
(26
|
)
|
|||||||||||
|
Settlements
|
(27
|
)
|
—
|
|
—
|
|
(95
|
)
|
—
|
|
—
|
|
|||||||||||
|
Dispositions
|
—
|
|
—
|
|
—
|
|
(155
|
)
|
—
|
|
(27
|
)
|
|||||||||||
|
Fair value of plan assets at end of period
|
$
|
598
|
|
$
|
—
|
|
$
|
272
|
|
$
|
600
|
|
$
|
—
|
|
$
|
284
|
|
|||||
|
Amount underfunded (overfunded) at end of period
|
$
|
120
|
|
$
|
65
|
|
$
|
(69
|
)
|
$
|
32
|
|
$
|
61
|
|
$
|
(61
|
)
|
|||||
|
Amounts recognized in the consolidated balance sheets consist of:
|
|||||||||||||||||||||||
|
Non-current assets
|
$
|
—
|
|
$
|
—
|
|
$
|
96
|
|
$
|
—
|
|
$
|
—
|
|
$
|
86
|
|
|||||
|
Current liabilities
|
—
|
|
(9
|
)
|
(2
|
)
|
—
|
|
(9
|
)
|
(2
|
)
|
|||||||||||
|
Non-current liabilities
|
(120
|
)
|
(56
|
)
|
(25
|
)
|
(32
|
)
|
(52
|
)
|
(23
|
)
|
|||||||||||
|
$
|
(120
|
)
|
$
|
(65
|
)
|
$
|
69
|
|
$
|
(32
|
)
|
$
|
(61
|
)
|
$
|
61
|
|
||||||
|
Amounts recognized in accumulated other comprehensive loss (pre-tax basis) consist of:
|
|||||||||||||||||||||||
|
Net actuarial gain
|
$
|
18
|
|
$
|
7
|
|
$
|
(21
|
)
|
$
|
(86
|
)
|
$
|
(4
|
)
|
$
|
(25
|
)
|
|||||
|
Prior service cost
|
—
|
|
—
|
|
18
|
|
—
|
|
—
|
|
18
|
|
|||||||||||
|
$
|
18
|
|
$
|
7
|
|
$
|
(3
|
)
|
$
|
(86
|
)
|
$
|
(4
|
)
|
$
|
(7
|
)
|
||||||
F - 75
The following table summarizes information at the dates indicated for plans with an accumulated benefit obligation in excess of plan assets:
|
December 31, 2014
|
December 31, 2013
|
||||||||||||||||||||
|
Pension Benefits
|
Pension Benefits
|
||||||||||||||||||||
|
Funded Plans
|
Unfunded Plans
|
Other Postretirement Benefits
|
Funded Plans
|
Unfunded Plans
|
Other Postretirement Benefits
|
||||||||||||||||
|
Projected benefit obligation
|
$
|
718
|
|
$
|
65
|
|
N/A
|
|
$
|
632
|
|
61
|
|
N/A
|
|
||||||
|
Accumulated benefit obligation
|
718
|
|
65
|
|
203
|
|
632
|
|
61
|
|
$
|
223
|
|
||||||||
|
Fair value of plan assets
|
598
|
|
—
|
|
272
|
|
600
|
|
—
|
|
284
|
|
|||||||||
Components of Net Periodic Benefit Cost
|
December 31, 2014
|
December 31, 2013
|
||||||||||||||
|
Pension Benefits
|
Other Postretirement Benefits
|
Pension Benefits
|
Other Postretirement Benefits
|
||||||||||||
|
Net Periodic Benefit Cost:
|
|||||||||||||||
|
Service cost
|
$
|
—
|
|
$
|
—
|
|
$
|
3
|
|
$
|
—
|
|
|||
|
Interest cost
|
31
|
|
5
|
|
35
|
|
6
|
|
|||||||
|
Expected return on plan assets
|
(40
|
)
|
(8
|
)
|
(54
|
)
|
(9
|
)
|
|||||||
|
Prior service cost amortization
|
—
|
|
1
|
|
—
|
|
1
|
|
|||||||
|
Actuarial loss amortization
|
(1
|
)
|
(1
|
)
|
2
|
|
—
|
|
|||||||
|
Settlements
|
(4
|
)
|
—
|
|
(2
|
)
|
—
|
|
|||||||
|
(14
|
)
|
(3
|
)
|
(16
|
)
|
(2
|
)
|
||||||||
|
Regulatory adjustment
(1)
|
—
|
|
—
|
|
5
|
|
—
|
|
|||||||
|
Net periodic benefit cost
|
$
|
(14
|
)
|
$
|
(3
|
)
|
$
|
(11
|
)
|
$
|
(2
|
)
|
|||
|
(1)
|
Southern Union, the predecessor of Panhandle, historically recovered certain qualified pension benefit plan and other postretirement benefit plan costs through rates charged to utility customers in its distribution operation. Certain utility commissions require that the recovery of these costs be based on the Employee Retirement Income Security Act of 1974, as amended, or other utility commission specific guidelines. The difference between these regulatory-based amounts and the periodic benefit cost calculated pursuant to GAAP is deferred as a regulatory asset or liability and amortized to expense over periods in which this difference will be recovered in rates, as promulgated by the applicable utility commission.
|
Assumptions
The weighted-average assumptions used in determining benefit obligations at the dates indicated are shown in the table below:
|
December 31, 2014
|
December 31, 2013
|
||||||||||
|
Pension Benefits
|
Other Postretirement Benefits
|
Pension Benefits
|
Other Postretirement Benefits
|
||||||||
|
Discount rate
|
3.62
|
%
|
2.24
|
%
|
4.65
|
%
|
2.33
|
%
|
|||
|
Rate of compensation increase
|
N/A
|
|
N/A
|
|
N/A
|
|
N/A
|
|
|||
F - 76
The weighted-average assumptions used in determining net periodic benefit cost for the periods presented are shown in the table below:
|
December 31, 2014
|
December 31, 2013
|
||||||||||
|
Pension Benefits
|
Other Postretirement Benefits
|
Pension Benefits
|
Other Postretirement Benefits
|
||||||||
|
Discount rate
|
4.65
|
%
|
3.02
|
%
|
3.50
|
%
|
2.68
|
%
|
|||
|
Expected return on assets:
|
|||||||||||
|
Tax exempt accounts
|
7.50
|
%
|
7.00
|
%
|
7.50
|
%
|
6.95
|
%
|
|||
|
Taxable accounts
|
N/A
|
|
4.50
|
%
|
N/A
|
|
4.42
|
%
|
|||
|
Rate of compensation increase
|
N/A
|
|
N/A
|
|
N/A
|
|
N/A
|
|
|||
The long-term expected rate of return on plan assets was estimated based on a variety of factors including the historical investment return achieved over a long-term period, the targeted allocation of plan assets and expectations concerning future returns in the marketplace for both equity and fixed income securities. Current market factors such as inflation and interest rates are evaluated before long-term market assumptions are determined. Peer data and historical returns are reviewed to ensure reasonableness and appropriateness.
The assumed health care cost trend rates used to measure the expected cost of benefits covered by Panhandle’s and Sunoco, Inc.’s other postretirement benefit plans are shown in the table below:
|
December 31,
|
|||||
|
|
2014
|
2013
|
|||
|
Health care cost trend rate
|
7.09
|
%
|
7.57
|
%
|
|
|
Rate to which the cost trend is assumed to decline (the ultimate trend rate)
|
5.41
|
%
|
5.42
|
%
|
|
|
Year that the rate reaches the ultimate trend rate
|
2018
|
|
2018
|
|
|
Changes in the health care cost trend rate assumptions are not expected to have a significant impact on postretirement benefits.
Plan Assets
For the Panhandle plans, the overall investment strategy is to maintain an appropriate balance of actively managed investments with the objective of optimizing longer-term returns while maintaining a high standard of portfolio quality and achieving proper diversification. To achieve diversity within its other postretirement plan asset portfolio, Panhandle has targeted the following asset allocations: equity of
25%
to
35%
, fixed income of
65%
to
75%
and cash and cash equivalents of up to
10%
.
The investment strategy of Sunoco, Inc. funded defined benefit plans is to achieve consistent positive returns, after adjusting for inflation, and to maximize long-term total return within prudent levels of risk through a combination of income and capital appreciation. The objective of this strategy is to reduce the volatility of investment returns and maintain a sufficient funded status of the plans. In anticipation of the pension plan termination, Sunoco, Inc. targeted the asset allocations to a more stable position by investing in growth assets and liability hedging assets.
The fair value of the pension plan assets by asset category at the dates indicated is as follows:
|
Fair Value Measurements at December 31, 2014 Using Fair Value Hierarchy
|
||||||||||||||||
|
|
Fair Value as of December 31, 2014
|
Level 1
|
Level 2
|
Level 3
|
||||||||||||
|
Asset Category:
|
|
|
|
|
||||||||||||
|
Cash and cash equivalents
|
$
|
25
|
|
$
|
25
|
|
$
|
—
|
|
$
|
—
|
|
||||
|
Mutual funds
(1)
|
110
|
|
—
|
|
110
|
|
—
|
|
||||||||
|
Fixed income securities
|
463
|
|
—
|
|
463
|
|
—
|
|
||||||||
|
Total
|
$
|
598
|
|
$
|
25
|
|
$
|
573
|
|
$
|
—
|
|
||||
F - 77
|
(1)
|
Comprised of
100%
equities as of
December 31, 2014
.
|
|
Fair Value Measurements at December 31, 2013 Using Fair Value Hierarchy
|
||||||||||||||||
|
|
Fair Value as of December 31, 2013
|
Level 1
|
Level 2
|
Level 3
|
||||||||||||
|
Asset Category:
|
|
|
|
|
||||||||||||
|
Cash and cash equivalents
|
$
|
12
|
|
$
|
12
|
|
$
|
—
|
|
$
|
—
|
|
||||
|
Mutual funds
(1)
|
368
|
|
—
|
|
281
|
|
87
|
|
||||||||
|
Fixed income securities
|
220
|
|
—
|
|
220
|
|
—
|
|
||||||||
|
Total
|
$
|
600
|
|
$
|
12
|
|
$
|
501
|
|
$
|
87
|
|
||||
|
(1)
|
Primarily comprised of approximately
41%
equities,
45%
fixed income securities, and
14%
in other investments as of
December 31, 2013
.
|
The fair value of the other postretirement plan assets by asset category at the dates indicated is as follows:
|
Fair Value Measurements at December 31, 2014 Using Fair Value Hierarchy
|
||||||||||||||||
|
|
Fair Value as of December 31, 2014
|
Level 1
|
Level 2
|
Level 3
|
||||||||||||
|
Asset Category:
|
|
|
|
|
||||||||||||
|
Cash and Cash Equivalents
|
$
|
9
|
|
$
|
9
|
|
$
|
—
|
|
$
|
—
|
|
||||
|
Mutual funds
(1)
|
138
|
|
138
|
|
—
|
|
—
|
|
||||||||
|
Fixed income securities
|
125
|
|
—
|
|
125
|
|
—
|
|
||||||||
|
Total
|
$
|
272
|
|
$
|
147
|
|
$
|
125
|
|
$
|
—
|
|
||||
|
(1)
|
Primarily comprised of approximately
53%
equities,
41%
fixed income securities,
6%
cash as of
December 31, 2014
.
|
|
Fair Value Measurements at December 31, 2013 Using Fair Value Hierarchy
|
||||||||||||||||
|
|
Fair Value as of December 31, 2013
|
Level 1
|
Level 2
|
Level 3
|
||||||||||||
|
Asset Category:
|
|
|
|
|
||||||||||||
|
Cash and Cash Equivalents
|
$
|
10
|
|
$
|
10
|
|
$
|
—
|
|
$
|
—
|
|
||||
|
Mutual funds
(1)
|
130
|
|
112
|
|
18
|
|
—
|
|
||||||||
|
Fixed income securities
|
144
|
|
—
|
|
144
|
|
—
|
|
||||||||
|
Total
|
$
|
284
|
|
$
|
122
|
|
$
|
162
|
|
$
|
—
|
|
||||
|
(1)
|
Primarily comprised of approximately
41%
equities,
48%
fixed income securities,
6%
cash, and
5%
in other investments as of
December 31, 2013
.
|
The Level 1 plan assets are valued based on active market quotes. The Level 2 plan assets are valued based on the net asset value per share (or its equivalent) of the investments, which was not determinable through publicly published sources but was calculated consistent with authoritative accounting guidelines. See Note
2
for information related to the framework used to measure the fair value of its pension and other postretirement plan assets.
Contributions
We expect to contribute approxi
mately
$129 million
to pension plans and approximately
$10 million
to other po
stretirement plans in
2015
. The
cost of the plans are funded in accordance with federal regulations, not to exceed the amounts deductible for income tax purposes.
F - 78
Benefit Payments
Panhandle’s and Sunoco, Inc.’s estimate of expected benefit payments, which reflect expected future service, as appropriate, in each of the next five years and in the aggregate for the five years thereafter are shown in the table below:
|
Pension Benefits
|
||||||||||||
|
Years
|
Funded Plans
|
Unfunded Plans
|
Other Postretirement Benefits (Gross, Before Medicare Part D)
|
|||||||||
|
2015
|
$
|
717
|
|
$
|
9
|
|
$
|
28
|
|
|||
|
2016
|
—
|
|
8
|
|
26
|
|
||||||
|
2017
|
—
|
|
7
|
|
25
|
|
||||||
|
2018
|
—
|
|
7
|
|
23
|
|
||||||
|
2019
|
—
|
|
6
|
|
22
|
|
||||||
|
2020 – 2024
|
—
|
|
23
|
|
65
|
|
||||||
The Medicare Prescription Drug Act provides for a prescription drug benefit under Medicare (“Medicare Part D”) as well as a federal subsidy to sponsors of retiree health care benefit plans that provide a prescription drug benefit that is at least actuarially equivalent to Medicare Part D.
Panhandle does not expect to receive any Medicare Part D subsidies in any future periods.
|
15.
|
RELATED PARTY TRANSACTIONS:
|
The Parent Company has agreements with subsidiaries to provide or receive various general and administrative services. The Parent Company pays ETP to provide services on its behalf and the behalf of other subsidiaries of the Parent Company. The Parent Company receives management fees from certain of its subsidiaries, which include the reimbursement of various general and administrative services for expenses incurred by ETP on behalf of those subsidiaries. All such amounts have been eliminated in our consolidated financial statements.
In the ordinary course of business, our subsidiaries have related party transactions between each other which are generally based on transactions made at market-related rates. Our consolidated revenues and expenses reflect the elimination of all material intercompany transactions (see Note
16
).
In addition, subsidiaries of ETE recorded sales with affiliates of
$965 million
,
$1.44 billion
and
$189 million
during the years ended December 31, 2014, 2013 and 2012, respectively.
|
16.
|
REPORTABLE SEGMENTS:
|
As a result of the Lake Charles LNG Transaction in 2014, our reportable segments were re-evaluated and currently reflect the following reportable segments, which conduct their business exclusively in the United States, as follows:
|
•
|
Investment in ETP, including the consolidated operations of ETP;
|
|
•
|
Investment in Regency, including the consolidated operations of Regency;
|
|
•
|
Investment in Lake Charles LNG, including the operations of Lake Charles LNG; and
|
|
•
|
Corporate and Other, including the following:
|
|
•
|
activities of the Parent Company; and
|
|
•
|
the goodwill and property, plant and equipment fair value adjustments recorded as a result of the 2004 reverse acquisition of Heritage Propane Partners, L.P.
|
Related party transactions among our segments are generally based on transactions made at market-related rates. Consolidated revenues and expenses reflect the elimination of all material intercompany transactions.
We define Segment Adjusted EBITDA as earnings before interest, taxes, depreciation, depletion, amortization and other non-cash items, such as non-cash compensation expense, gains and losses on disposals of assets, the allowance for equity funds used during construction, unrealized gains and losses on commodity risk management activities, non-cash impairment charges, loss on extinguishment of debt, gain on deconsolidation and other non-operating income or expense items. Unrealized gains and losses on commodity risk management activities include unrealized gains and losses on commodity derivatives and
F - 79
inventory fair value adjustments (excluding lower of cost or market adjustments). Segment Adjusted EBITDA reflects amounts for unconsolidated affiliates based on the Partnership’s proportionate ownership and amounts for less than wholly owned subsidiaries based on 100% of the subsidiaries’ results of operations. Based on the change in our reportable segments we have recast the presentation of our segment results for the prior years to be consistent with the current year presentation.
Regency completed its acquisition of SUGS on April 30, 2013. Therefore, the investment in Regency segment amounts have been retrospectively adjusted to reflect SUGS beginning March 26, 2012.
Eliminations in the tables below include the following:
|
•
|
ETP’s Segment Adjusted EBITDA reflects 100% of Lone Star, which is a consolidated subsidiary of ETP. Regency’s Segment Adjusted EBITDA includes its 30% investment in Lone Star. Therefore, 30% of the results of Lone Star are included in eliminations.
|
|
•
|
ETP’s Segment Adjusted EBITDA reflects the results of SUGS from March 26, 2012 to April 30, 2013. Since the SUGS Contribution was a transaction between entities under common control, Regency’s results have been recast to retrospectively consolidate SUGS beginning March 26, 2012. Therefore, the eliminations also include the results of SUGS from March 26, 2012 to April 30, 2013.
|
|
•
|
ETP’s Segment Adjusted EBITDA reflected the results of Lake Charles LNG prior to the Lake Charles LNG Transaction, which was effective January 1, 2014. The Investment in Lake Charles LNG segment reflected the results of operations of Lake Charles LNG for all periods presented. Consequently, the results of operations of Lake Charles LNG were reflected in two segments for the years ended December 31, 2013 and 2012 beginning March 26, 2012. Therefore, the results of Lake Charles LNG were included in eliminations for 2013 and 2012.
|
F - 80
|
|
Years Ended December 31,
|
||||||||||
|
|
2014
|
2013
|
2012
|
||||||||
|
Revenues:
|
|||||||||||
|
Investment in ETP:
|
|||||||||||
|
Revenues from external customers
|
$
|
50,989
|
|
$
|
46,210
|
|
$
|
15,671
|
|
||
|
Intersegment revenues
|
169
|
|
129
|
|
31
|
|
|||||
|
51,158
|
|
46,339
|
|
15,702
|
|
||||||
|
Investment in Regency:
|
|||||||||||
|
Revenues from external customers
|
4,597
|
|
2,404
|
|
1,986
|
|
|||||
|
Intersegment revenues
|
354
|
|
117
|
|
14
|
|
|||||
|
4,951
|
|
2,521
|
|
2,000
|
|
||||||
|
Investment in Lake Charles LNG:
|
|||||||||||
|
Revenues from external customers
|
216
|
|
216
|
|
166
|
|
|||||
|
|
|
|
|
|
|
||||||
|
Adjustments and Eliminations:
|
(634
|
)
|
(741
|
)
|
(904
|
)
|
|||||
|
Total revenues
|
$
|
55,691
|
|
$
|
48,335
|
|
$
|
16,964
|
|
||
|
Costs of products sold:
|
|||||||||||
|
Investment in ETP
|
$
|
45,540
|
|
$
|
41,204
|
|
$
|
12,266
|
|
||
|
Investment in Regency
|
3,452
|
|
1,793
|
|
1,387
|
|
|||||
|
Adjustments and Eliminations
|
(603
|
)
|
(443
|
)
|
(565
|
)
|
|||||
|
Total costs of products sold
|
$
|
48,389
|
|
$
|
42,554
|
|
$
|
13,088
|
|
||
|
Depreciation, depletion and amortization:
|
|||||||||||
|
Investment in ETP
|
1,130
|
|
1,032
|
|
656
|
|
|||||
|
Investment in Regency
|
541
|
|
287
|
|
252
|
|
|||||
|
Investment in Lake Charles LNG
|
39
|
|
39
|
|
30
|
|
|||||
|
Corporate and Other
|
17
|
|
16
|
|
14
|
|
|||||
|
Adjustments and Eliminations
|
(3
|
)
|
(61
|
)
|
(81
|
)
|
|||||
|
Total depreciation, depletion and amortization
|
$
|
1,724
|
|
$
|
1,313
|
|
$
|
871
|
|
||
|
|
Years Ended December 31,
|
||||||||||
|
|
2014
|
2013
|
2012
|
||||||||
|
Equity in earnings of unconsolidated affiliates:
|
|||||||||||
|
Investment in ETP
|
$
|
234
|
|
$
|
172
|
|
$
|
142
|
|
||
|
Investment in Regency
|
195
|
|
135
|
|
105
|
|
|||||
|
Adjustments and Eliminations
|
(97
|
)
|
(71
|
)
|
(35
|
)
|
|||||
|
Total equity in earnings of unconsolidated affiliates
|
$
|
332
|
|
$
|
236
|
|
$
|
212
|
|
||
F - 81
|
|
Years Ended December 31,
|
||||||||||
|
|
2014
|
2013
|
2012
|
||||||||
|
Segment Adjusted EBITDA:
|
|||||||||||
|
Investment in ETP
|
$
|
4,829
|
|
$
|
3,953
|
|
$
|
2,744
|
|
||
|
Investment in Regency
|
1,172
|
|
608
|
|
517
|
|
|||||
|
Investment in Lake Charles LNG
|
195
|
|
187
|
|
135
|
|
|||||
|
Corporate and Other
|
(97
|
)
|
(43
|
)
|
(52
|
)
|
|||||
|
Adjustments and Eliminations
|
(259
|
)
|
(338
|
)
|
(239
|
)
|
|||||
|
Total Segment Adjusted EBITDA
|
5,840
|
|
4,367
|
|
3,105
|
|
|||||
|
Depreciation, depletion and amortization
|
(1,724
|
)
|
(1,313
|
)
|
(871
|
)
|
|||||
|
Interest expense, net of interest capitalized
|
(1,369
|
)
|
(1,221
|
)
|
(1,018
|
)
|
|||||
|
Bridge loan related fees
|
—
|
|
—
|
|
(62
|
)
|
|||||
|
Gain on deconsolidation of Propane Business
|
—
|
|
—
|
|
1,057
|
|
|||||
|
Gain on sale of AmeriGas common units
|
177
|
|
87
|
|
—
|
|
|||||
|
Goodwill impairment
|
(370
|
)
|
(689
|
)
|
—
|
|
|||||
|
Gains (losses) on interest rate derivatives
|
(157
|
)
|
53
|
|
(19
|
)
|
|||||
|
Non-cash unit-based compensation expense
|
(82
|
)
|
(61
|
)
|
(47
|
)
|
|||||
|
Unrealized gains on commodity risk management activities
|
116
|
|
48
|
|
10
|
|
|||||
|
Losses on extinguishments of debt
|
(25
|
)
|
(162
|
)
|
(123
|
)
|
|||||
|
Inventory valuation adjustments
|
(473
|
)
|
3
|
|
(75
|
)
|
|||||
|
Adjusted EBITDA related to discontinued operations
|
(27
|
)
|
(76
|
)
|
(99
|
)
|
|||||
|
Adjusted EBITDA related to unconsolidated affiliates
|
(748
|
)
|
(727
|
)
|
(647
|
)
|
|||||
|
Equity in earnings of unconsolidated affiliates
|
332
|
|
236
|
|
212
|
|
|||||
|
Non-operating environmental remediation
|
—
|
|
(168
|
)
|
—
|
|
|||||
|
Other, net
|
(73
|
)
|
(2
|
)
|
14
|
|
|||||
|
Income from continuing operations before income tax expense
|
$
|
1,417
|
|
$
|
375
|
|
$
|
1,437
|
|
||
|
|
December 31,
|
||||||||||
|
|
2014
|
2013
|
2012
|
||||||||
|
Total assets:
|
|||||||||||
|
Investment in ETP
|
$
|
48,221
|
|
$
|
43,702
|
|
$
|
43,230
|
|
||
|
Investment in Regency
|
17,103
|
|
8,782
|
|
8,123
|
|
|||||
|
Investment in Lake Charles LNG
|
1,210
|
|
1,338
|
|
1,917
|
|
|||||
|
Corporate and Other
|
1,153
|
|
720
|
|
707
|
|
|||||
|
Adjustments and Eliminations
|
(3,218
|
)
|
(4,212
|
)
|
(5,073
|
)
|
|||||
|
Total
|
$
|
64,469
|
|
$
|
50,330
|
|
$
|
48,904
|
|
||
F - 82
|
|
Years Ended December 31,
|
||||||||||
|
|
2014
|
2013
|
2012
|
||||||||
|
Additions to property, plant and equipment, net of contributions in aid of construction costs (accrual basis):
|
|||||||||||
|
Investment in ETP
|
$
|
4,478
|
|
$
|
2,455
|
|
$
|
3,049
|
|
||
|
Investment in Regency
|
1,112
|
|
1,011
|
|
599
|
|
|||||
|
Investment in Lake Charles LNG
|
1
|
|
2
|
|
4
|
|
|||||
|
Adjustments and Eliminations
|
(32
|
)
|
(126
|
)
|
(135
|
)
|
|||||
|
Total
|
$
|
5,559
|
|
$
|
3,342
|
|
$
|
3,517
|
|
||
|
|
December 31,
|
||||||||||
|
|
2014
|
2013
|
2012
|
||||||||
|
Advances to and investments in affiliates:
|
|||||||||||
|
Investment in ETP
|
$
|
3,840
|
|
$
|
4,436
|
|
$
|
3,502
|
|
||
|
Investment in Regency
|
2,418
|
|
2,097
|
|
2,214
|
|
|||||
|
Adjustments and Eliminations
|
(2,599
|
)
|
(2,519
|
)
|
(979
|
)
|
|||||
|
Total
|
$
|
3,659
|
|
$
|
4,014
|
|
$
|
4,737
|
|
||
The following tables provide revenues, grouped by similar products and services, for our reportable segments. These amounts include intersegment revenues for transactions between ETP and Regency.
Investment in ETP
|
Years Ended December 31,
|
|||||||||||
|
2014
|
2013
|
2012
|
|||||||||
|
Intrastate Transportation and Storage
|
$
|
2,652
|
|
$
|
2,250
|
|
$
|
2,012
|
|
||
|
Interstate Transportation and Storage
|
1,057
|
|
1,270
|
|
1,109
|
|
|||||
|
Midstream
|
1,210
|
|
1,307
|
|
1,757
|
|
|||||
|
Liquids Transportation and Services
|
3,790
|
|
2,063
|
|
619
|
|
|||||
|
Investment in Sunoco Logistics
|
17,920
|
|
16,480
|
|
3,109
|
|
|||||
|
Retail Marketing
|
22,484
|
|
21,004
|
|
5,926
|
|
|||||
|
All Other
|
2,045
|
|
1,965
|
|
1,170
|
|
|||||
|
Total revenues
|
51,158
|
|
46,339
|
|
15,702
|
|
|||||
|
Less: Intersegment revenues
|
169
|
|
129
|
|
31
|
|
|||||
|
Revenues from external customers
|
$
|
50,989
|
|
$
|
46,210
|
|
$
|
15,671
|
|
||
Investment in Regency
|
Years Ended December 31,
|
|||||||||||
|
2014
|
2013
|
2012
|
|||||||||
|
Gathering and Processing
|
$
|
4,570
|
|
$
|
2,287
|
|
$
|
1,797
|
|
||
|
Contract Services
|
307
|
|
215
|
|
183
|
|
|||||
|
Natural Gas Transportation
|
—
|
|
1
|
|
1
|
|
|||||
|
Natural Resources
|
58
|
|
—
|
|
—
|
|
|||||
|
Corporate and others
|
16
|
|
18
|
|
19
|
|
|||||
|
Total revenues
|
4,951
|
|
2,521
|
|
2,000
|
|
|||||
|
Less: Intersegment revenues
|
354
|
|
117
|
|
14
|
|
|||||
|
Revenues from external customers
|
$
|
4,597
|
|
$
|
2,404
|
|
$
|
1,986
|
|
||
F - 83
Investment in Lake Charles LNG
Lake Charles LNG’s revenues of
$216 million
,
$216 million
and
$166 million
for the year ended December 31, 2014, 2013 and 2012, respectively, were related to LNG terminalling.
|
17.
|
QUARTERLY FINANCIAL DATA (UNAUDITED):
|
Summarized unaudited quarterly financial data is presented below. Earnings per unit are computed on a stand-alone basis for each quarter and total year.
|
|
Quarters Ended
|
|
|||||||||||||||||
|
|
March 31
|
June 30
|
September 30
|
December 31
|
Total Year
|
||||||||||||||
|
2014:
|
|||||||||||||||||||
|
Revenues
|
$
|
13,080
|
|
$
|
14,143
|
|
$
|
14,987
|
|
$
|
13,481
|
|
$
|
55,691
|
|
||||
|
Gross margin
|
1,638
|
|
1,792
|
|
1,972
|
|
1,900
|
|
7,302
|
|
|||||||||
|
Operating income
|
710
|
|
773
|
|
822
|
|
165
|
|
2,470
|
|
|||||||||
|
Net income (loss)
|
448
|
|
500
|
|
470
|
|
(294
|
)
|
1,124
|
|
|||||||||
|
Limited Partners’ interest in net income
|
167
|
|
163
|
|
188
|
|
111
|
|
629
|
|
|||||||||
|
Basic net income per limited partner unit
|
$
|
0.30
|
|
$
|
0.30
|
|
$
|
0.35
|
|
$
|
0.21
|
|
$
|
1.16
|
|
||||
|
Diluted net income per limited partner unit
|
$
|
0.30
|
|
$
|
0.30
|
|
$
|
0.35
|
|
$
|
0.21
|
|
$
|
1.15
|
|
||||
|
|
Quarters Ended
|
|
|||||||||||||||||
|
|
March 31
|
June 30
|
September 30
|
December 31
|
Total Year
|
||||||||||||||
|
2013:
|
|||||||||||||||||||
|
Revenues
|
$
|
11,179
|
|
$
|
12,063
|
|
$
|
12,486
|
|
$
|
12,607
|
|
$
|
48,335
|
|
||||
|
Gross margin
|
1,372
|
|
1,498
|
|
1,422
|
|
1,489
|
|
5,781
|
|
|||||||||
|
Operating income (loss)
|
531
|
|
644
|
|
529
|
|
(153
|
)
|
1,551
|
|
|||||||||
|
Net income (loss)
|
322
|
|
338
|
|
356
|
|
(701
|
)
|
315
|
|
|||||||||
|
Limited Partners’ interest in net income (loss)
|
90
|
|
127
|
|
150
|
|
(171
|
)
|
196
|
|
|||||||||
|
Basic net income (loss) per limited partner unit
|
$
|
0.16
|
|
$
|
0.23
|
|
$
|
0.27
|
|
$
|
(0.31
|
)
|
$
|
0.35
|
|
||||
|
Diluted net income (loss) per limited partner unit
|
$
|
0.16
|
|
$
|
0.23
|
|
$
|
0.27
|
|
$
|
(0.31
|
)
|
$
|
0.35
|
|
||||
The three months ended
December 31, 2014
reflected the unfavorable impacts of
$456 million
related to non-cash inventory valuation adjustments primarily in ETP’s investment in Sunoco Logistics and retail marketing operations and Regency’s recognition of a goodwill impairment of $
370 million
. The three months ended December 31, 2013 reflected ETP’s recognition of a goodwill impairment of
$689 million
.
F - 84
|
18.
|
SUPPLEMENTAL FINANCIAL STATEMENT INFORMATION:
|
Following are the financial statements of the Parent Company, which are included to provide additional information with respect to the Parent Company’s financial position, results of operations and cash flows on a stand-alone basis:
BALANCE SHEETS
|
|
December 31,
|
||||||
|
|
2014
|
2013
|
|||||
|
ASSETS
|
|||||||
|
CURRENT ASSETS:
|
|||||||
|
Cash and cash equivalents
|
$
|
2
|
|
$
|
8
|
|
|
|
Accounts receivable from related companies
|
14
|
|
5
|
|
|||
|
Other current assets
|
1
|
|
—
|
|
|||
|
Total current assets
|
17
|
|
13
|
|
|||
|
ADVANCES TO AND INVESTMENTS IN UNCONSOLIDATED AFFILIATES
|
5,390
|
|
3,841
|
|
|||
|
INTANGIBLE ASSETS, net
|
10
|
|
14
|
|
|||
|
GOODWILL
|
9
|
|
9
|
|
|||
|
OTHER NON-CURRENT ASSETS, net
|
46
|
|
41
|
|
|||
|
Total assets
|
$
|
5,472
|
|
$
|
3,918
|
|
|
|
LIABILITIES AND PARTNERS’ CAPITAL
|
|||||||
|
CURRENT LIABILITIES:
|
|||||||
|
Accounts payable to related companies
|
$
|
11
|
|
$
|
11
|
|
|
|
Interest payable
|
58
|
|
24
|
|
|||
|
Accrued and other current liabilities
|
3
|
|
3
|
|
|||
|
Total current liabilities
|
72
|
|
38
|
|
|||
|
LONG-TERM DEBT, less current maturities
|
4,680
|
|
2,801
|
|
|||
|
NOTE PAYABLE TO AFFILIATE
|
54
|
|
—
|
|
|||
|
OTHER NON-CURRENT LIABILITIES
|
2
|
|
1
|
|
|||
|
COMMITMENTS AND CONTINGENCIES
|
|
|
|||||
|
PARTNERS’ CAPITAL:
|
|||||||
|
General Partner
|
(1
|
)
|
(3
|
)
|
|||
|
Limited Partners:
|
|||||||
|
Limited Partners – Common Unitholders (538,766,899 and 559,923,300 units authorized, issued and outstanding at December 31, 2014 and 2013, respectively)
|
648
|
|
1,066
|
|
|||
|
Class D Units (1,540,000 units authorized, issued and outstanding)
|
22
|
|
6
|
|
|||
|
Accumulated other comprehensive income (loss)
|
(5
|
)
|
9
|
|
|||
|
Total partners’ capital
|
664
|
|
1,078
|
|
|||
|
Total liabilities and partners’ capital
|
$
|
5,472
|
|
$
|
3,918
|
|
|
F - 85
STATEMENTS OF OPERATIONS
|
|
Years Ended December 31,
|
||||||||||
|
|
2014
|
2013
|
2012
|
||||||||
|
SELLING, GENERAL AND ADMINISTRATIVE EXPENSES
|
$
|
(111
|
)
|
$
|
(56
|
)
|
$
|
(53
|
)
|
||
|
OTHER INCOME (EXPENSE):
|
|||||||||||
|
Interest expense, net of interest capitalized
|
(205
|
)
|
(210
|
)
|
(235
|
)
|
|||||
|
Bridge loan related fees
|
—
|
|
—
|
|
(62
|
)
|
|||||
|
Equity in earnings of unconsolidated affiliates
|
955
|
|
617
|
|
666
|
|
|||||
|
Gains (losses) on interest rate derivatives
|
—
|
|
9
|
|
(15
|
)
|
|||||
|
Loss on extinguishment of debt
|
—
|
|
(157
|
)
|
—
|
|
|||||
|
Other, net
|
(5
|
)
|
(8
|
)
|
(4
|
)
|
|||||
|
INCOME BEFORE INCOME TAXES
|
634
|
|
195
|
|
297
|
|
|||||
|
Income tax expense (benefit)
|
1
|
|
(1
|
)
|
(7
|
)
|
|||||
|
NET INCOME
|
633
|
|
196
|
|
304
|
|
|||||
|
GENERAL PARTNER’S INTEREST IN NET INCOME
|
2
|
|
—
|
|
2
|
|
|||||
|
CLASS D UNITHOLDER’S INTEREST IN NET INCOME
|
2
|
|
—
|
|
—
|
|
|||||
|
LIMITED PARTNERS’ INTEREST IN NET INCOME
|
$
|
629
|
|
$
|
196
|
|
$
|
302
|
|
||
F - 86
STATEMENTS OF CASH FLOWS
|
|
Years Ended December 31,
|
||||||||||
|
|
2014
|
2013
|
2012
|
||||||||
|
NET CASH FLOWS PROVIDED BY OPERATING ACTIVITIES
|
$
|
816
|
|
$
|
768
|
|
$
|
555
|
|
||
|
CASH FLOWS FROM INVESTING ACTIVITIES:
|
|||||||||||
|
Cash paid for acquisitions
|
—
|
|
—
|
|
(1,113
|
)
|
|||||
|
Proceeds from ETP Holdco Transaction
|
—
|
|
1,332
|
|
—
|
|
|||||
|
Contributions to unconsolidated affiliates
|
(118
|
)
|
(8
|
)
|
(487
|
)
|
|||||
|
Purchase of additional interest in Regency
|
(800
|
)
|
—
|
|
—
|
|
|||||
|
Note payable to affiliate
|
54
|
|
—
|
|
—
|
|
|||||
|
Note receivable from affiliate
|
—
|
|
—
|
|
(221
|
)
|
|||||
|
Payments received on note receivable from affiliate
|
—
|
|
166
|
|
55
|
|
|||||
|
Net cash provided by (used in) investing activities
|
(864
|
)
|
1,490
|
|
(1,766
|
)
|
|||||
|
CASH FLOWS FROM FINANCING ACTIVITIES:
|
|||||||||||
|
Proceeds from borrowings
|
3,020
|
|
2,080
|
|
2,108
|
|
|||||
|
Principal payments on debt
|
(1,142
|
)
|
(3,235
|
)
|
(162
|
)
|
|||||
|
Distributions to partners
|
(821
|
)
|
(733
|
)
|
(666
|
)
|
|||||
|
Redemption of Preferred Units
|
—
|
|
(340
|
)
|
—
|
|
|||||
|
Units repurchased under buyback program
|
(1,000
|
)
|
—
|
|
—
|
|
|||||
|
Debt issuance costs
|
(15
|
)
|
(31
|
)
|
(78
|
)
|
|||||
|
Net cash provided by (used in) financing activities
|
42
|
|
(2,259
|
)
|
1,202
|
|
|||||
|
DECREASE IN CASH AND CASH EQUIVALENTS
|
(6
|
)
|
(1
|
)
|
(9
|
)
|
|||||
|
CASH AND CASH EQUIVALENTS, beginning of period
|
8
|
|
9
|
|
18
|
|
|||||
|
CASH AND CASH EQUIVALENTS, end of period
|
$
|
2
|
|
$
|
8
|
|
$
|
9
|
|
||
F - 87
ENERGY TRANSFER EQUITY, L.P. AND SUBSIDIARIES
INDEX TO FINANCIAL STATEMENTS
OF CERTAIN SUBSIDIARIES INCLUDED PURSUANT
TO RULE 3-16 OF REGULATION S-X
|
|
Page
|
|
1. Energy Transfer Partners, L.P. Financial Statements
|
S - 2
|
|
2. Regency Energy Partners LP Financial Statements
|
S - 75
|
S - 1
|
1.
|
ENERGY TRANSFER PARTNERS, L.P. FINANCIAL STATEMENTS
|
INDEX TO FINANCIAL STATEMENTS
|
|
Page
|
|
Report of Independent Registered Public Accounting Firm
|
S -6
|
|
Consolidated Balance Sheets – December 31, 2014 and 2013
|
S - 7
|
|
Consolidated Statements of Operations – Years Ended December 31, 2014, 2013 and 2012
|
S - 9
|
|
Consolidated Statements of Comprehensive Income – Years Ended December 31, 2014, 2013 and 2012
|
S - 10
|
|
Consolidated Statements of Equity – Years Ended December 31, 2014, 2013 and 2012
|
S - 11
|
|
Consolidated Statements of Cash Flows – Years Ended December 31, 2014, 2013 and 2012
|
S - 12
|
|
Notes to Consolidated Financial Statements
|
S - 14
|
S - 2
Definitions
The following is a list of certain acronyms and terms generally used in the energy industry and throughout this document:
|
/d
|
per day
|
||
|
AmeriGas
|
AmeriGas Partners, L.P.
|
||
|
AOCI
|
accumulated other comprehensive income (loss)
|
||
|
AROs
|
asset retirement obligations
|
||
|
Bbls
|
barrels
|
||
|
Bcf
|
billion cubic feet
|
||
|
Btu
|
British thermal unit, an energy measurement used by gas companies to convert the volume of gas used to its heat equivalent, and thus calculate the actual energy used
|
||
|
Capacity
|
capacity of a pipeline, processing plant or storage facility refers to the maximum capacity under normal operating conditions and, with respect to pipeline transportation capacity, is subject to multiple factors (including natural gas injections and withdrawals at various delivery points along the pipeline and the utilization of compression) which may reduce the throughput capacity from specified capacity levels
|
||
|
Citrus
|
Citrus, LLC
|
||
|
CrossCountry
|
CrossCountry Energy, LLC
|
||
|
DOE
|
U.S. Department of Energy
|
||
|
DOT
|
U.S. Department of Transportation
|
||
|
EPA
|
U.S. Environmental Protection Agency
|
||
|
ET Crude Oil
|
Energy Transfer Crude Oil Company, LLC, a joint venture owned 60% by ETE and 40% by ETP
|
||
|
ETC Compression
|
ETC Compression, LLC
|
||
|
ETC FEP
|
ETC Fayetteville Express Pipeline, LLC
|
||
|
ETC OLP
|
La Grange Acquisition, L.P., which conducts business under the assumed name of Energy Transfer Company
|
||
|
ETC Tiger
|
ETC Tiger Pipeline, LLC
|
||
|
ETE
|
Energy Transfer Equity, L.P., a publicly traded partnership and the owner of ETP LLC
|
||
|
ETE Holdings
|
ETE Common Holdings, LLC, a wholly-owned subsidiary of ETE
|
||
|
ET Interstate
|
Energy Transfer Interstate Holdings, LLC
|
||
|
ETP Credit Facility
|
ETP’s $2.5 billion revolving credit facility
|
||
|
ETP GP
|
Energy Transfer Partners GP, L.P., the general partner of ETP
|
||
|
ETP Holdco
|
ETP Holdco Corporation
|
||
|
ETP LLC
|
Energy Transfer Partners, L.L.C., the general partner of ETP GP
|
||
|
Exchange Act
|
Securities Exchange Act of 1934
|
||
|
FEP
|
Fayetteville Express Pipeline LLC
|
||
|
FERC
|
Federal Energy Regulatory Commission
|
||
|
FGT
|
Florida Gas Transmission Company, LLC
|
||
|
GAAP
|
accounting principles generally accepted in the United States of America
|
||
|
HOLP
|
Heritage Operating, L.P.
|
||
S - 3
|
IDRs
|
incentive distribution rights
|
||
|
Lake Charles LNG
|
Lake Charles LNG Company, LLC (previously named Trunkline LNG Company, LLC), a subsidiary of ETE
|
||
|
LCL
|
Lake Charles LNG Export Company, LLC, a subsidiary of ETP and ETE
|
||
|
LIBOR
|
London Interbank Offered Rate
|
||
|
LNG
|
Liquefied natural gas
|
||
|
Lone Star
|
Lone Star NGL LLC
|
||
|
LPG
|
liquefied petroleum gas
|
||
|
MACS
|
Mid-Atlantic Convenience Stores, LLC
|
||
|
MGE
|
Missouri Gas Energy
|
||
|
MMBtu
|
million British thermal units
|
||
|
MMcf
|
million cubic feet
|
||
|
MTBE
|
methyl tertiary butyl ether
|
||
|
NEG
|
New England Gas Company
|
||
|
NGL
|
natural gas liquid, such as propane, butane and natural gasoline
|
||
|
NYMEX
|
New York Mercantile Exchange
|
||
|
NYSE
|
New York Stock Exchange
|
||
|
OSHA
|
federal Occupational Safety and Health Act
|
||
|
OTC
|
over-the-counter
|
||
|
Panhandle
|
Panhandle Eastern Pipe Line Company, LP and its subsidiaries
|
||
|
PCBs
|
polychlorinated biphenyls
|
||
|
PEPL Holdings
|
PEPL Holdings, LLC
|
||
|
PES
|
Philadelphia Energy Solutions
|
||
|
PHMSA
|
Pipeline Hazardous Materials Safety Administration
|
||
|
Regency
|
Regency Energy Partners LP, a subsidiary of ETE
|
||
|
Retail Holdings
|
ETP Retail Holdings, a joint venture between subsidiaries of ETC OLP and Sunoco, Inc.
|
||
|
Sea Robin
|
Sea Robin Pipeline Company, LLC, a subsidiary of Panhandle
|
||
|
SEC
|
Securities and Exchange Commission
|
||
|
Southern Union
|
Southern Union Company
|
||
|
Southwest Gas
|
Pan Gas Storage, LLC (d.b.a. Southwest Gas)
|
||
|
SUGS
|
Southern Union Gas Services
|
||
S - 4
|
Sunoco Logistics
|
Sunoco Logistics Partners L.P.
|
||
|
Sunoco Partners
|
Sunoco Partners LLC, the general partner of Sunoco Logistics
|
||
|
Susser
|
Susser Holdings Corporation
|
||
|
Titan
|
Titan Energy Partners, L.P.
|
||
|
Transwestern
|
Transwestern Pipeline Company, LLC
|
||
|
TRRC
|
Texas Railroad Commission
|
||
|
Trunkline
|
Trunkline Gas Company, LLC, a subsidiary of Panhandle
|
||
Adjusted EBITDA is a term used throughout this document, which we define as earnings before interest, taxes, depreciation, amortization and other non-cash items, such as non-cash compensation expense, gains and losses on disposals of assets, the allowance for equity funds used during construction, unrealized gains and losses on commodity risk management activities and other non-operating income or expense items. Unrealized gains and losses on commodity risk management activities include unrealized gains and losses on commodity derivatives and inventory fair value adjustments (excluding lower of cost or market adjustments). Adjusted EBITDA reflects amounts for less than wholly-owned subsidiaries based on 100% of the subsidiaries’ results of operations and for unconsolidated affiliates based on the Partnership’s proportionate ownership.
S - 5
REPORT OF INDEPENDENT REGISTERED PUBLIC ACCOUNTING FIRM
Partners
Energy Transfer Partners, L.P.
We have audited the accompanying consolidated balance sheets of Energy Transfer Partners, L.P. (a Delaware limited partnership) and subsidiaries (the “Partnership”) as of December 31, 2014 and 2013, and the related consolidated statements of operations, comprehensive income, equity, and cash flows for each of the three years in the period ended December 31, 2014. These financial statements are the responsibility of the Partnership’s management. Our responsibility is to express an opinion on these financial statements based on our audits. We did not audit the financial statements of Sunoco LP and Susser Holdings Corporation, both consolidated subsidiaries, as of December 31, 2014 and for the period from September 1, 2014 to December 31, 2014, whose combined statements reflect total assets constituting 11 percent of consolidated total assets as of December 31, 2014, and total revenues of 5 percent of consolidated total revenues for the year then ended. Those statements were audited by other auditors, whose reports have been furnished to us, and our opinion, insofar as it relates to the amounts included for Sunoco LP and Susser Holdings Corporation, is based solely on the reports of the other auditors. We did not audit the financial statements of Sunoco Logistics Partners L.P., a consolidated subsidiary, for the period from October 5, 2012 to December 31, 2012, which statements reflect revenues of 20 percent of consolidated total revenues for the year ended December 31, 2012. Those statements were audited by other auditors, whose report has been furnished to us, and our opinion, insofar as it relates to the amounts included for Sunoco Logistics Partners L.P. for the period from October 5, 2012 to December 31, 2012, is based solely on the report of the other auditors.
We conducted our audits in accordance with the standards of the Public Company Accounting Oversight Board (United States). Those standards require that we plan and perform the audit to obtain reasonable assurance about whether the financial statements are free of material misstatement. An audit includes examining, on a test basis, evidence supporting the amounts and disclosures in the financial statements. An audit also includes assessing the accounting principles used and significant estimates made by management, as well as evaluating the overall financial statement presentation. We believe that our audits and the reports of the other auditors provide a reasonable basis for our opinion.
In our opinion, based on our audits and the reports of the other auditors, the consolidated financial statements referred to above present fairly, in all material respects, the financial position of Energy Transfer Partners, L.P. and subsidiaries as of December 31, 2014 and 2013, and the results of their operations and their cash flows for each of the three years in the period ended December 31, 2014 in conformity with accounting principles generally accepted in the United States of America.
We also have audited, in accordance with the standards of the Public Company Accounting Oversight Board (United States), the Partnership’s internal control over financial reporting as of December 31, 2014, based on criteria established in the 2013
Internal Control-Integrated Framework
issued by the Committee of Sponsoring Organizations of the Treadway Commission (COSO), and our report dated
March 2, 2015
(not separately included herein) expressed an unqualified opinion thereon.
/s/ GRANT THORNTON LLP
Dallas, Texas
March 2, 2015
S - 6
ENERGY TRANSFER PARTNERS, L.P. AND SUBSIDIARIES
CONSOLIDATED BALANCE SHEETS
(Dollars in millions)
|
December 31,
|
|||||||
|
2014
|
2013
|
||||||
|
ASSETS
|
|||||||
|
CURRENT ASSETS:
|
|||||||
|
Cash and cash equivalents
|
$
|
639
|
|
$
|
549
|
|
|
|
Accounts receivable, net
|
2,879
|
|
3,359
|
|
|||
|
Accounts receivable from related companies
|
210
|
|
165
|
|
|||
|
Inventories
|
1,389
|
|
1,765
|
|
|||
|
Exchanges receivable
|
44
|
|
56
|
|
|||
|
Price risk management assets
|
7
|
|
35
|
|
|||
|
Other current assets
|
271
|
|
310
|
|
|||
|
Total current assets
|
5,439
|
|
6,239
|
|
|||
|
PROPERTY, PLANT AND EQUIPMENT
|
33,200
|
|
28,430
|
|
|||
|
ACCUMULATED DEPRECIATION
|
(3,457
|
)
|
(2,483
|
)
|
|||
|
29,743
|
|
25,947
|
|
||||
|
ADVANCES TO AND INVESTMENTS IN UNCONSOLIDATED AFFILIATES
|
3,840
|
|
4,436
|
|
|||
|
NON-CURRENT PRICE RISK MANAGEMENT ASSETS
|
—
|
|
17
|
|
|||
|
GOODWILL
|
6,419
|
|
4,729
|
|
|||
|
INTANGIBLE ASSETS, net
|
2,087
|
|
1,568
|
|
|||
|
OTHER NON-CURRENT ASSETS, net
|
693
|
|
766
|
|
|||
|
Total assets
|
$
|
48,221
|
|
$
|
43,702
|
|
|
S - 7
ENERGY TRANSFER PARTNERS, L.P. AND SUBSIDIARIES
CONSOLIDATED BALANCE SHEETS
(Dollars in millions)
|
December 31,
|
|||||||
|
2014
|
2013
|
||||||
|
LIABILITIES AND EQUITY
|
|||||||
|
CURRENT LIABILITIES:
|
|||||||
|
Accounts payable
|
$
|
2,992
|
|
$
|
3,627
|
|
|
|
Accounts payable to related companies
|
62
|
|
45
|
|
|||
|
Exchanges payable
|
183
|
|
285
|
|
|||
|
Price risk management liabilities
|
21
|
|
45
|
|
|||
|
Accrued and other current liabilities
|
1,774
|
|
1,428
|
|
|||
|
Current maturities of long-term debt
|
1,008
|
|
637
|
|
|||
|
Total current liabilities
|
6,040
|
|
6,067
|
|
|||
|
LONG-TERM DEBT, less current maturities
|
18,332
|
|
16,451
|
|
|||
|
NON-CURRENT PRICE RISK MANAGEMENT LIABILITIES
|
138
|
|
54
|
|
|||
|
DEFERRED INCOME TAXES
|
4,226
|
|
3,762
|
|
|||
|
OTHER NON-CURRENT LIABILITIES
|
1,206
|
|
1,080
|
|
|||
|
COMMITMENTS AND CONTINGENCIES (Note 11)
|
|||||||
|
REDEEMABLE NONCONTROLLING INTERESTS
|
15
|
|
—
|
|
|||
|
EQUITY:
|
|||||||
|
General Partner
|
184
|
|
171
|
|
|||
|
Limited Partners:
|
|||||||
|
Common Unitholders (355,510,227 and 333,826,372 units authorized, issued and outstanding as of December 31, 2014 and 2013, respectively)
|
10,430
|
|
9,797
|
|
|||
|
Class E Unitholders (8,853,832 units authorized, issued and outstanding – held by subsidiary)
|
—
|
|
—
|
|
|||
|
Class G Unitholders (90,706,000 units authorized, issued and outstanding – held by subsidiary)
|
—
|
|
—
|
|
|||
|
Class H Unitholders (50,160,000 units authorized, issued and outstanding)
|
1,512
|
|
1,511
|
|
|||
|
Accumulated other comprehensive income (loss)
|
(56
|
)
|
61
|
|
|||
|
Total partners’ capital
|
12,070
|
|
11,540
|
|
|||
|
Noncontrolling interest
|
6,194
|
|
4,748
|
|
|||
|
Total equity
|
18,264
|
|
16,288
|
|
|||
|
Total liabilities and equity
|
$
|
48,221
|
|
$
|
43,702
|
|
|
S - 8
ENERGY TRANSFER PARTNERS, L.P. AND SUBSIDIARIES
CONSOLIDATED STATEMENTS OF OPERATIONS
(Dollars in millions, except per unit data)
|
Years Ended December 31,
|
|||||||||||
|
2014
|
2013
|
2012
|
|||||||||
|
REVENUES:
|
|||||||||||
|
Natural gas sales
|
$
|
3,561
|
|
$
|
3,165
|
|
$
|
2,387
|
|
||
|
NGL sales
|
4,293
|
|
2,817
|
|
1,718
|
|
|||||
|
Crude sales
|
16,416
|
|
15,477
|
|
2,872
|
|
|||||
|
Gathering, transportation and other fees
|
2,553
|
|
2,590
|
|
2,007
|
|
|||||
|
Refined product sales
|
19,437
|
|
18,479
|
|
5,299
|
|
|||||
|
Other
|
4,898
|
|
3,811
|
|
1,419
|
|
|||||
|
Total revenues
|
51,158
|
|
46,339
|
|
15,702
|
|
|||||
|
COSTS AND EXPENSES:
|
|||||||||||
|
Cost of products sold
|
45,540
|
|
41,204
|
|
12,266
|
|
|||||
|
Operating expenses
|
1,636
|
|
1,441
|
|
953
|
|
|||||
|
Depreciation and amortization
|
1,130
|
|
1,032
|
|
656
|
|
|||||
|
Selling, general and administrative
|
377
|
|
432
|
|
433
|
|
|||||
|
Goodwill impairment
|
—
|
|
689
|
|
—
|
|
|||||
|
Total costs and expenses
|
48,683
|
|
44,798
|
|
14,308
|
|
|||||
|
OPERATING INCOME
|
2,475
|
|
1,541
|
|
1,394
|
|
|||||
|
OTHER INCOME (EXPENSE):
|
|||||||||||
|
Interest expense, net of interest capitalized
|
(860
|
)
|
(849
|
)
|
(665
|
)
|
|||||
|
Equity in earnings of unconsolidated affiliates
|
234
|
|
172
|
|
142
|
|
|||||
|
Gain on deconsolidation of Propane Business
|
—
|
|
—
|
|
1,057
|
|
|||||
|
Gain on sale of AmeriGas common units
|
177
|
|
87
|
|
—
|
|
|||||
|
Loss on extinguishment of debt
|
—
|
|
—
|
|
(115
|
)
|
|||||
|
Gains (losses) on interest rate derivatives
|
(157
|
)
|
44
|
|
(4
|
)
|
|||||
|
Non-operating environmental remediation
|
—
|
|
(168
|
)
|
—
|
|
|||||
|
Other, net
|
(25
|
)
|
5
|
|
11
|
|
|||||
|
INCOME FROM CONTINUING OPERATIONS BEFORE INCOME TAX EXPENSE
|
1,844
|
|
832
|
|
1,820
|
|
|||||
|
Income tax expense from continuing operations
|
355
|
|
97
|
|
63
|
|
|||||
|
INCOME FROM CONTINUING OPERATIONS
|
1,489
|
|
735
|
|
1,757
|
|
|||||
|
Income (loss) from discontinued operations
|
64
|
|
33
|
|
(109
|
)
|
|||||
|
NET INCOME
|
1,553
|
|
768
|
|
1,648
|
|
|||||
|
LESS: NET INCOME ATTRIBUTABLE TO NONCONTROLLING INTEREST
|
217
|
|
312
|
|
79
|
|
|||||
|
NET INCOME ATTRIBUTABLE TO PARTNERS
|
1,336
|
|
456
|
|
1,569
|
|
|||||
|
GENERAL PARTNER’S INTEREST IN NET INCOME
|
513
|
|
506
|
|
461
|
|
|||||
|
CLASS H UNITHOLDER’S INTEREST IN NET INCOME
|
217
|
|
48
|
|
—
|
|
|||||
|
COMMON UNITHOLDERS’ INTEREST IN NET INCOME (LOSS)
|
$
|
606
|
|
$
|
(98
|
)
|
$
|
1,108
|
|
||
|
INCOME (LOSS) FROM CONTINUING OPERATIONS PER COMMON UNIT:
|
|||||||||||
|
Basic
|
$
|
1.58
|
|
$
|
(0.23
|
)
|
$
|
4.93
|
|
||
|
Diluted
|
$
|
1.58
|
|
$
|
(0.23
|
)
|
$
|
4.91
|
|
||
|
NET INCOME (LOSS) PER COMMON UNIT:
|
|||||||||||
|
Basic
|
$
|
1.77
|
|
$
|
(0.18
|
)
|
$
|
4.43
|
|
||
|
Diluted
|
$
|
1.77
|
|
$
|
(0.18
|
)
|
$
|
4.42
|
|
||
S - 9
ENERGY TRANSFER PARTNERS, L.P. AND SUBSIDIARIES
CONSOLIDATED STATEMENTS OF COMPREHENSIVE INCOME
(Dollars in millions)
|
Years Ended December 31,
|
|||||||||||
|
2014
|
2013
|
2012
|
|||||||||
|
Net income
|
$
|
1,553
|
|
$
|
768
|
|
$
|
1,648
|
|
||
|
Other comprehensive income (loss), net of tax:
|
|||||||||||
|
Reclassification to earnings of gains and losses on derivative instruments accounted for as cash flow hedges
|
3
|
|
(4
|
)
|
(14
|
)
|
|||||
|
Change in value of derivative instruments accounted for as cash flow hedges
|
—
|
|
(1
|
)
|
8
|
|
|||||
|
Change in value of available-for-sale securities
|
1
|
|
2
|
|
—
|
|
|||||
|
Actuarial gain (loss) relating to pension and other postretirement benefits
|
(113
|
)
|
66
|
|
(10
|
)
|
|||||
|
Foreign currency translation adjustment
|
(2
|
)
|
(1
|
)
|
—
|
|
|||||
|
Change in other comprehensive income from unconsolidated affiliates
|
(6
|
)
|
17
|
|
(9
|
)
|
|||||
|
(117
|
)
|
79
|
|
(25
|
)
|
||||||
|
Comprehensive income
|
1,436
|
|
847
|
|
1,623
|
|
|||||
|
Less: Comprehensive income attributable to noncontrolling interest
|
217
|
|
312
|
|
74
|
|
|||||
|
Comprehensive income attributable to partners
|
$
|
1,219
|
|
$
|
535
|
|
$
|
1,549
|
|
||
S - 10
ENERGY TRANSFER PARTNERS, L.P. AND SUBSIDIARIES
CONSOLIDATED STATEMENTS OF EQUITY
(Dollars in millions)
|
Limited Partners
|
|||||||||||||||||||||||
|
General
Partner
|
Common
Unitholders
|
Class H Units
|
Accumulated
Other
Comprehensive
Income (Loss)
|
Noncontrolling
Interest
|
Total
|
||||||||||||||||||
|
Balance, December 31, 2011
|
$
|
182
|
|
$
|
5,533
|
|
$
|
—
|
|
$
|
6
|
|
$
|
629
|
|
$
|
6,350
|
|
|||||
|
Distributions to partners
|
(454
|
)
|
(889
|
)
|
—
|
|
—
|
|
—
|
|
(1,343
|
)
|
|||||||||||
|
Distributions to noncontrolling interest
|
—
|
|
—
|
|
—
|
|
—
|
|
(233
|
)
|
(233
|
)
|
|||||||||||
|
Units issued for cash
|
—
|
|
791
|
|
—
|
|
—
|
|
—
|
|
791
|
|
|||||||||||
|
Capital contributions from noncontrolling interest
|
—
|
|
—
|
|
—
|
|
—
|
|
343
|
|
343
|
|
|||||||||||
|
Sunoco Merger (see Note 3)
|
—
|
|
2,288
|
|
—
|
|
—
|
|
3,580
|
|
5,868
|
|
|||||||||||
|
ETP Holdco Transaction (see Note 3)
|
—
|
|
165
|
|
—
|
|
—
|
|
3,748
|
|
3,913
|
|
|||||||||||
|
Issuance of units in other acquisitions (excluding Sunoco, Inc.)
|
—
|
|
7
|
|
—
|
|
—
|
|
—
|
|
7
|
|
|||||||||||
|
Other comprehensive loss, net of tax
|
—
|
|
—
|
|
—
|
|
(19
|
)
|
(6
|
)
|
(25
|
)
|
|||||||||||
|
Other, net
|
(1
|
)
|
23
|
|
—
|
|
—
|
|
(9
|
)
|
13
|
|
|||||||||||
|
Net income
|
461
|
|
1,108
|
|
—
|
|
—
|
|
79
|
|
1,648
|
|
|||||||||||
|
Balance, December 31, 2012
|
188
|
|
9,026
|
|
—
|
|
(13
|
)
|
8,131
|
|
17,332
|
|
|||||||||||
|
Distributions to partners
|
(523
|
)
|
(1,228
|
)
|
(51
|
)
|
—
|
|
—
|
|
(1,802
|
)
|
|||||||||||
|
Distributions to noncontrolling interest
|
—
|
|
—
|
|
—
|
|
—
|
|
(382
|
)
|
(382
|
)
|
|||||||||||
|
Units issued for cash
|
—
|
|
1,611
|
|
—
|
|
—
|
|
—
|
|
1,611
|
|
|||||||||||
|
Issuance of Class H Units (see Note 8)
|
—
|
|
(1,514
|
)
|
1,514
|
|
—
|
|
—
|
|
—
|
|
|||||||||||
|
Capital contributions from noncontrolling interest
|
—
|
|
—
|
|
—
|
|
—
|
|
137
|
|
137
|
|
|||||||||||
|
ETP Holdco Acquisition and SUGS Contribution (see Note 3)
|
—
|
|
2,013
|
|
—
|
|
(5
|
)
|
(3,448
|
)
|
(1,440
|
)
|
|||||||||||
|
Other comprehensive income, net of tax
|
—
|
|
—
|
|
—
|
|
79
|
|
—
|
|
79
|
|
|||||||||||
|
Other, net
|
—
|
|
(13
|
)
|
—
|
|
—
|
|
(2
|
)
|
(15
|
)
|
|||||||||||
|
Net income (loss)
|
506
|
|
(98
|
)
|
48
|
|
—
|
|
312
|
|
768
|
|
|||||||||||
|
Balance, December 31, 2013
|
171
|
|
9,797
|
|
1,511
|
|
61
|
|
4,748
|
|
16,288
|
|
|||||||||||
|
Distributions to partners
|
(500
|
)
|
(1,252
|
)
|
(212
|
)
|
—
|
|
—
|
|
(1,964
|
)
|
|||||||||||
|
Distributions to noncontrolling interest
|
—
|
|
—
|
|
—
|
|
—
|
|
(362
|
)
|
(362
|
)
|
|||||||||||
|
Units issued for cash
|
—
|
|
1,382
|
|
—
|
|
—
|
|
—
|
|
1,382
|
|
|||||||||||
|
Subsidiary units issued for cash
|
1
|
|
174
|
|
—
|
|
—
|
|
1,069
|
|
1,244
|
|
|||||||||||
|
Capital contributions from noncontrolling interest
|
—
|
|
—
|
|
—
|
|
—
|
|
161
|
|
161
|
|
|||||||||||
|
Lake Charles LNG Transaction (see Note 3)
|
—
|
|
(1,167
|
)
|
—
|
|
—
|
|
—
|
|
(1,167
|
)
|
|||||||||||
|
Susser Merger (see Note 3)
|
—
|
|
908
|
|
—
|
|
—
|
|
626
|
|
1,534
|
|
|||||||||||
|
Sunoco Logistics acquisition of a noncontrolling interest
|
(1
|
)
|
(79
|
)
|
—
|
|
—
|
|
(245
|
)
|
(325
|
)
|
|||||||||||
|
Other comprehensive loss, net of tax
|
—
|
|
—
|
|
—
|
|
(117
|
)
|
—
|
|
(117
|
)
|
|||||||||||
|
Other, net
|
—
|
|
61
|
|
(4
|
)
|
—
|
|
(20
|
)
|
37
|
|
|||||||||||
|
Net income
|
513
|
|
606
|
|
217
|
|
—
|
|
217
|
|
1,553
|
|
|||||||||||
|
Balance, December 31, 2014
|
$
|
184
|
|
$
|
10,430
|
|
$
|
1,512
|
|
$
|
(56
|
)
|
$
|
6,194
|
|
$
|
18,264
|
|
|||||
S - 11
ENERGY TRANSFER PARTNERS, L.P. AND SUBSIDIARIES
CONSOLIDATED STATEMENTS OF CASH FLOWS
(Dollars in millions)
|
Years Ended December 31,
|
|||||||||||
|
2014
|
2013
|
2012
|
|||||||||
|
CASH FLOWS FROM OPERATING ACTIVITIES:
|
|||||||||||
|
Net income
|
$
|
1,553
|
|
$
|
768
|
|
$
|
1,648
|
|
||
|
Reconciliation of net income to net cash provided by operating activities:
|
|||||||||||
|
Depreciation and amortization
|
1,130
|
|
1,032
|
|
656
|
|
|||||
|
Deferred income taxes
|
(47
|
)
|
48
|
|
62
|
|
|||||
|
Amortization included in interest expense
|
(61
|
)
|
(80
|
)
|
(35
|
)
|
|||||
|
Inventory valuation adjustments
|
473
|
|
(3
|
)
|
75
|
|
|||||
|
Non-cash compensation expense
|
58
|
|
47
|
|
42
|
|
|||||
|
Goodwill impairment
|
—
|
|
689
|
|
—
|
|
|||||
|
Gain on sale of AmeriGas common units
|
(177
|
)
|
(87
|
)
|
—
|
|
|||||
|
Gain on deconsolidation of Propane Business
|
—
|
|
—
|
|
(1,057
|
)
|
|||||
|
Gain on curtailment of other postretirement benefits
|
—
|
|
—
|
|
(15
|
)
|
|||||
|
Loss on extinguishment of debt
|
—
|
|
—
|
|
115
|
|
|||||
|
Write-down of assets included in loss from discontinued operations
|
—
|
|
—
|
|
132
|
|
|||||
|
Distributions on unvested awards
|
(16
|
)
|
(12
|
)
|
(8
|
)
|
|||||
|
Equity in earnings of unconsolidated affiliates
|
(234
|
)
|
(172
|
)
|
(142
|
)
|
|||||
|
Distributions from unconsolidated affiliates
|
203
|
|
247
|
|
132
|
|
|||||
|
Other non-cash
|
(60
|
)
|
42
|
|
68
|
|
|||||
|
Net change in operating assets and liabilities, net of effects of acquisitions and deconsolidations (see Note 2)
|
(264
|
)
|
(146
|
)
|
(475
|
)
|
|||||
|
Net cash provided by operating activities
|
2,558
|
|
2,373
|
|
1,198
|
|
|||||
|
CASH FLOWS FROM INVESTING ACTIVITIES:
|
|||||||||||
|
Cash paid for Susser Merger, net of cash received (see Note 3)
|
(808
|
)
|
—
|
|
—
|
|
|||||
|
Cash paid for acquisition of a noncontrolling interest
|
(325
|
)
|
—
|
|
—
|
|
|||||
|
Cash paid for ETP Holdco Acquisition (See Note 3)
|
—
|
|
(1,332
|
)
|
—
|
|
|||||
|
Cash paid for Citrus Merger
|
—
|
|
—
|
|
(1,895
|
)
|
|||||
|
Cash proceeds from the sale of AmeriGas common units
|
814
|
|
346
|
|
—
|
|
|||||
|
Cash proceeds from SUGS Contribution (See Note 3)
|
—
|
|
504
|
|
—
|
|
|||||
|
Cash proceeds from contribution and sale of propane operations
|
—
|
|
—
|
|
1,443
|
|
|||||
|
Cash (paid) received from all other acquisitions
|
(429
|
)
|
(405
|
)
|
531
|
|
|||||
|
Capital expenditures (excluding allowance for equity funds used during construction)
|
(4,158
|
)
|
(2,575
|
)
|
(2,840
|
)
|
|||||
|
Contributions in aid of construction costs
|
45
|
|
52
|
|
35
|
|
|||||
|
Contributions to unconsolidated affiliates
|
(170
|
)
|
(1
|
)
|
(30
|
)
|
|||||
|
Distributions from unconsolidated affiliates in excess of cumulative earnings
|
151
|
|
217
|
|
130
|
|
|||||
|
Proceeds from sale of discontinued operations
|
77
|
|
1,008
|
|
207
|
|
|||||
|
Proceeds from the sale of assets
|
50
|
|
53
|
|
18
|
|
|||||
|
Change in restricted cash
|
172
|
|
(348
|
)
|
5
|
|
|||||
|
Other
|
(17
|
)
|
21
|
|
111
|
|
|||||
|
Net cash used in investing activities
|
(4,598
|
)
|
(2,460
|
)
|
(2,285
|
)
|
|||||
S - 12
|
CASH FLOWS FROM FINANCING ACTIVITIES:
|
|||||||||||
|
Proceeds from borrowings
|
9,909
|
|
8,001
|
|
8,208
|
|
|||||
|
Repayments of long-term debt
|
(8,223
|
)
|
(7,016
|
)
|
(6,598
|
)
|
|||||
|
Proceeds from borrowings from affiliates
|
—
|
|
—
|
|
221
|
|
|||||
|
Repayments of borrowings from affiliates
|
—
|
|
(166
|
)
|
(55
|
)
|
|||||
|
Net proceeds from issuance of Common Units
|
1,382
|
|
1,611
|
|
791
|
|
|||||
|
Subsidiary equity offerings, net of issuance costs
|
1,244
|
|
—
|
|
—
|
|
|||||
|
Capital contributions received from noncontrolling interest
|
174
|
|
147
|
|
320
|
|
|||||
|
Distributions to partners
|
(1,964
|
)
|
(1,802
|
)
|
(1,343
|
)
|
|||||
|
Distributions to noncontrolling interest
|
(362
|
)
|
(382
|
)
|
(233
|
)
|
|||||
|
Debt issuance costs
|
(30
|
)
|
(32
|
)
|
(20
|
)
|
|||||
|
Other
|
—
|
|
(36
|
)
|
—
|
|
|||||
|
Net cash provided by financing activities
|
2,130
|
|
325
|
|
1,291
|
|
|||||
|
INCREASE IN CASH AND CASH EQUIVALENTS
|
90
|
|
238
|
|
204
|
|
|||||
|
CASH AND CASH EQUIVALENTS, beginning of period
|
549
|
|
311
|
|
107
|
|
|||||
|
CASH AND CASH EQUIVALENTS, end of period
|
$
|
639
|
|
$
|
549
|
|
$
|
311
|
|
||
S - 13
ENERGY TRANSFER PARTNERS, L.P. AND SUBSIDIARIES
NOTES TO CONSOLIDATED FINANCIAL STATEMENTS
(Tabular dollar and unit amounts, except per unit data, are in millions)
|
1.
|
OPERATIONS AND ORGANIZATION:
|
The consolidated financial statements and notes thereto of Energy Transfer Partners, L.P., and its subsidiaries (the “Partnership,” “we” or “ETP”) presented herein for the years ended
December 31, 2014, 2013 and 2012
, have been prepared in accordance with GAAP and pursuant to the rules and regulations of the SEC. We consolidate all majority-owned subsidiaries and subsidiaries we control, even if we do not have a majority ownership. All significant intercompany transactions and accounts are eliminated in consolidation. Management has evaluated subsequent events through the date the financial statements were issued.
We also own varying undivided interests in certain pipelines. Ownership of these pipelines has been structured as an ownership of an undivided interest in assets, not as an ownership interest in a partnership, limited liability company, joint venture or other forms of entities. Each owner controls marketing and invoices separately, and each owner is responsible for any loss, damage or injury that may occur to their own customers. As a result, we apply proportionate consolidation for our interests in these assets.
Certain prior period amounts have been reclassified to conform to the
2014
presentation. These reclassifications had no impact on net income or total equity.
We are managed by our general partner, ETP GP, which is in turn managed by its general partner, ETP LLC. ETE, a publicly traded master limited partnership, owns ETP LLC, the general partner of our General Partner. The consolidated financial statements of the Partnership presented herein include our operating subsidiaries described below.
Our consolidated subsidiary, Susser Petroleum Partners LP, changed its name in October 2014 to Sunoco LP. Additionally, Trunkline LNG Company, LLC, a consolidated subsidiary of ETE, changed its name in September 2014 to Lake Charles LNG Company, LLC. All references to these entities throughout this document reflect the new name of these entities, regardless of whether the disclosure relates to periods or events prior to the dates of the name changes.
Business Operations
Our activities are primarily conducted through our operating subsidiaries (collectively, the “Operating Companies”) as follows:
|
•
|
ETC OLP, a Texas limited partnership primarily engaged in midstream and intrastate transportation and storage natural gas operations. ETC OLP owns and operates, through its wholly and majority-owned subsidiaries, natural gas gathering systems, intrastate natural gas pipeline systems and gas processing plants and is engaged in the business of purchasing, gathering, transporting, processing, and marketing natural gas and NGLs in the states of Texas, Louisiana, New Mexico and West Virginia. ETC OLP’s intrastate transportation and storage operations primarily focus on transporting natural gas in Texas through our Oasis pipeline, ET Fuel System, East Texas pipeline and HPL System. ETC OLP’s midstream operations focus on the gathering, compression, treating, conditioning and processing of natural gas, primarily on or through our Southeast Texas System, Eagle Ford System, North Texas System and Northern Louisiana assets. ETC OLP also owns a
70%
interest in Lone Star.
|
|
•
|
ET Interstate, a Delaware limited liability company with revenues consisting primarily of fees earned from natural gas transportation services and operational gas sales. ET Interstate is the parent company of:
|
|
•
|
Transwestern, a Delaware limited liability company engaged in interstate transportation of natural gas. Transwestern’s revenues consist primarily of fees earned from natural gas transportation services and operational gas sales.
|
|
•
|
ETC FEP, a Delaware limited liability company that directly owns a
50%
interest in FEP, which owns
100%
of the Fayetteville Express interstate natural gas pipeline.
|
|
•
|
ETC Tiger, a Delaware limited liability company engaged in interstate transportation of natural gas.
|
|
•
|
CrossCountry, a Delaware limited liability company that indirectly owns a
50%
interest in Citrus, which owns
100%
of the FGT interstate natural gas pipeline.
|
|
•
|
ETC Compression, a Delaware limited liability company engaged in natural gas compression services and related equipment sales.
|
S - 14
|
•
|
ETP Holdco, a Delaware limited liability company that indirectly owns Panhandle and Sunoco, Inc. Panhandle and Sunoco, Inc. operations are described as follows:
|
|
•
|
Panhandle owns and operates assets in the regulated and unregulated natural gas industry and is primarily engaged in the transportation and storage of natural gas in the United States. As discussed in
Note 3
, in January 2014, Panhandle consummated a merger with Southern Union, the indirect parent of Panhandle, and PEPL Holdings, the sole limited partner of Panhandle, pursuant to which each of Southern Union and PEPL Holdings were merged with and into Panhandle, with Panhandle surviving the merger.
|
|
•
|
Sunoco, Inc. owns and operates retail marketing assets, which sell gasoline and middle distillates at retail locations and operates convenience stores primarily on the east coast and in the midwest region of the United States. Effective June 1, 2014, the Partnership combined certain Sunoco, Inc. retail assets with another wholly-owned subsidiary of ETP to form a limited liability company owned by ETP and Sunoco, Inc.
|
|
•
|
Sunoco Logistics, a publicly traded Delaware limited partnership that owns and operates a logistics business, consisting of products, crude oil and NGL pipelines, terminalling and storage assets, and refined products, crude oil and NGL acquisition and marketing assets.
|
|
•
|
ETP owns an indirect 100% equity interest in Susser and the general partner interest, incentive distribution rights and a
42.8%
limited partner interest in Sunoco LP. Susser operates convenience stores in Texas, New Mexico and Oklahoma. Sunoco LP distributes motor fuels to convenience stores and retail fuel outlets in Texas, New Mexico, Oklahoma, Kansas and Louisiana and other commercial customers. As discussed in
Note 3
, in October 2014, Sunoco LP acquired MACS from ETP. These operations are reported within the retail marketing segment.
|
Our financial statements reflect the following reportable business segments:
|
•
|
intrastate transportation and storage;
|
|
•
|
interstate transportation and storage;
|
|
•
|
midstream;
|
|
•
|
liquids transportation and services;
|
|
•
|
investment in Sunoco Logistics;
|
|
•
|
retail marketing; and
|
|
•
|
all other.
|
|
2.
|
ESTIMATES, SIGNIFICANT ACCOUNTING POLICIES AND BALANCE SHEET DETAIL:
|
Use of Estimates
The preparation of financial statements in conformity with GAAP requires management to make estimates and assumptions that affect the reported amounts of assets and liabilities and the accrual for and disclosure of contingent assets and liabilities at the date of the financial statements and the reported amounts of revenues and expenses during the reporting period.
The natural gas industry conducts its business by processing actual transactions at the end of the month following the month of delivery. Consequently, the most current month’s financial results for the midstream, NGL and intrastate transportation and storage operations are estimated using volume estimates and market prices. Any differences between estimated results and actual results are recognized in the following month’s financial statements. Management believes that the estimated operating results represent the actual results in all material respects.
Some of the other significant estimates made by management include, but are not limited to, the timing of certain forecasted transactions that are hedged, the fair value of derivative instruments, useful lives for depreciation and amortization, purchase accounting allocations and subsequent realizability of intangible assets, fair value measurements used in the goodwill impairment test, market value of inventory, assets and liabilities resulting from the regulated ratemaking process, contingency reserves and environmental reserves. Actual results could differ from those estimates.
New Accounting Pronouncements
In May 2014, the Financial Accounting Standards Board (“FASB”) issued Accounting Standards Update No. 2014-09,
Revenue from Contracts with Customers (Topic 606)
(“ASU 2014-09”), which clarifies the principles for recognizing revenue based on the core principle that an entity should recognize revenue to depict the transfer of promised goods or services to customers in an amount that reflects the consideration to which the entity expects to be entitled in exchange for those goods or services.
S - 15
ASU 2014-09 is effective for annual reporting periods beginning after December 15, 2016, including interim periods within that reporting period, with earlier adoption not permitted. ASU 2014-09 can be adopted either retrospectively to each prior reporting period presented or as a cumulative-effect adjustment as of the date of adoption. The Partnership is currently evaluating the impact, if any, that adopting this new accounting standard will have on our revenue recognition policies.
In April 2014, the FASB issued Accounting Standards Update No. 2014-08,
Presentation of Financial Statements (Topic 205) and Property, Plant, and Equipment (Topic 360): Reporting Discontinued Operations and Disclosures of Disposals of Components of an Entity
(“ASU 2014-08”), which changed the requirements for reporting discontinued operations. Under ASU 2014-08, a disposal of a component of an entity or a group of components of an entity is required to be reported in discontinued operations if the disposal represents a strategic shift that has or will have a major effect on an entity’s operations and financial results. ASU 2014-08 is effective for all disposals or classifications as held for sale of components of an entity that occur within fiscal years beginning after December 15, 2014, and early adoption is permitted. We expect to adopt this standard for the year ending December 31, 2015. ASU 2014-08 could have an impact on whether transactions will be reported in discontinued operations in the future, as well as the disclosures required when a component of an entity is disposed.
Revenue Recognition
Revenues for sales of natural gas and NGLs are recognized at the later of the time of delivery of the product to the customer or the time of sale or installation. Revenues from service labor, transportation, treating, compression and gas processing are recognized upon completion of the service. Transportation capacity payments are recognized when earned in the period the capacity is made available.
Our intrastate transportation and storage and interstate transportation and storage segments’ results are determined primarily by the amount of capacity our customers reserve as well as the actual volume of natural gas that flows through the transportation pipelines. Under transportation contracts, our customers are charged (i) a demand fee, which is a fixed fee for the reservation of an agreed amount of capacity on the transportation pipeline for a specified period of time and which obligates the customer to pay even if the customer does not transport natural gas on the respective pipeline, (ii) a transportation fee, which is based on the actual throughput of natural gas by the customer, (iii) fuel retention based on a percentage of gas transported on the pipeline, or (iv) a combination of the three, generally payable monthly. Fuel retained for a fee is typically valued at market prices.
Our intrastate transportation and storage segment also generates revenues and margin from the sale of natural gas to electric utilities, independent power plants, local distribution companies, industrial end-users and other marketing companies on the HPL System. Generally, we purchase natural gas from the market, including purchases from our marketing operations, and from producers at the wellhead.
In addition, our intrastate transportation and storage segment generates revenues and margin from fees charged for storing customers’ working natural gas in our storage facilities. We also engage in natural gas storage transactions in which we seek to find and profit from pricing differences that occur over time utilizing the Bammel storage reservoir. We purchase physical natural gas and then sell financial contracts at a price sufficient to cover our carrying costs and provide for a gross profit margin. We expect margins from natural gas storage transactions to be higher during the periods from November to March of each year and lower during the period from April through October of each year due to the increased demand for natural gas during colder weather. However, we cannot assure that management’s expectations will be fully realized in the future and in what time period, due to various factors including weather, availability of natural gas in regions in which we operate, competitive factors in the energy industry, and other issues.
Results from the midstream segment are determined primarily by the volumes of natural gas gathered, compressed, treated, processed, purchased and sold through our pipeline and gathering systems and the level of natural gas and NGL prices. We generate midstream revenues and gross margins principally under fee-based or other arrangements in which we receive a fee for natural gas gathering, compressing, treating or processing services. The revenue earned from these arrangements is directly related to the volume of natural gas that flows through our systems and is not directly dependent on commodity prices.
We also utilize other types of arrangements in our midstream segment, including (i) discount-to-index price arrangements, which involve purchases of natural gas at either (1) a percentage discount to a specified index price, (2) a specified index price less a fixed amount or (3) a percentage discount to a specified index price less an additional fixed amount, (ii) percentage-of-proceeds arrangements under which we gather and process natural gas on behalf of producers, sell the resulting residue gas and NGL volumes at market prices and remit to producers an agreed upon percentage of the proceeds based on an index price, (iii) keep-whole arrangements where we gather natural gas from the producer, process the natural gas and sell the resulting NGLs to third parties at market prices, (iv) purchasing all or a specified percentage of natural gas and/or NGL delivered from producers and treating or processing our plant facilities, and (v) making other direct purchases of natural gas and/or NGL at specified delivery points to meet operational or marketing obligations. In many cases, we provide services
S - 16
under contracts that contain a combination of more than one of the arrangements described above. The terms of our contracts vary based on gas quality conditions, the competitive environment at the time the contracts are signed and customer requirements. Our contract mix may change as a result of changes in producer preferences, expansion in regions where some types of contracts are more common and other market factors.
NGL storage and pipeline transportation revenues are recognized when services are performed or products are delivered, respectively. Fractionation and processing revenues are recognized when product is either loaded into a truck or injected into a third party pipeline, which is when title and risk of loss pass to the customer.
In our natural gas compression business, revenue is recognized for compressor packages and technical service jobs using the completed contract method which recognizes revenue upon completion of the job. Costs incurred on a job are deducted at the time revenue is recognized.
We conduct marketing activities in which we market the natural gas that flows through our assets, referred to as on-system gas. We also attract other customers by marketing volumes of natural gas that do not move through our assets, referred to as off-system gas. For both on-system and off-system gas, we purchase natural gas from natural gas producers and other supply points and sell that natural gas to utilities, industrial consumers, other marketers and pipeline companies, thereby generating gross margins based upon the difference between the purchase and resale prices.
Terminalling and storage revenues are recognized at the time the services are provided. Pipeline revenues are recognized upon delivery of the barrels to the location designated by the shipper. Crude oil acquisition and marketing revenues, as well as refined product marketing revenues, are recognized when title to the product is transferred to the customer. Revenues are not recognized for crude oil exchange transactions, which are entered into primarily to acquire crude oil of a desired quality or to reduce transportation costs by taking delivery closer to end markets. Any net differential for exchange transactions is recorded as an adjustment of inventory costs in the purchases component of cost of products sold and operating expenses in the statements of operations.
Our retail marketing segment sells gasoline and diesel in addition to a broad mix of merchandise such as groceries, fast foods and beverages at its convenience stores. A portion of our gasoline and diesel sales are to wholesale customers on a consignment basis, in which we retain title to inventory, control access to and sale of fuel inventory, and recognize revenue at the time the fuel is sold to the ultimate customer. We typically own the fuel dispensing equipment and underground storage tanks at consignment sites, and in some cases we own the entire site and have entered into an operating lease with the wholesale customer operating the site. In addition, our retail outlets derive other income from lottery ticket sales, money orders, prepaid phone cards and wireless services, ATM transactions, car washes, movie rental and other ancillary product and service offerings. Some of Sunoco, Inc.’s retail outlets provide a variety of car care services. Revenues related to the sale of products are recognized when title passes, while service revenues are recorded on a net commission basis and are recognized when services are provided. Title passage generally occurs when products are shipped or delivered in accordance with the terms of the respective sales agreements. In addition, revenues are not recognized until sales prices are fixed or determinable and collectability is reasonably assured.
Regulatory Accounting – Regulatory Assets and Liabilities
Our interstate transportation and storage segment is subject to regulation by certain state and federal authorities, and certain subsidiaries in that segment have accounting policies that conform to the accounting requirements and ratemaking practices of the regulatory authorities. The application of these accounting policies allows certain of our regulated entities to defer expenses and revenues on the balance sheet as regulatory assets and liabilities when it is probable that those expenses and revenues will be allowed in the ratemaking process in a period different from the period in which they would have been reflected in the consolidated statement of operations by an unregulated company. These deferred assets and liabilities will be reported in results of operations in the period in which the same amounts are included in rates and recovered from or refunded to customers. Management’s assessment of the probability of recovery or pass through of regulatory assets and liabilities will require judgment and interpretation of laws and regulatory commission orders. If, for any reason, we cease to meet the criteria for application of regulatory accounting treatment for these entities, the regulatory assets and liabilities related to those portions ceasing to meet such criteria would be eliminated from the consolidated balance sheet for the period in which the discontinuance of regulatory accounting treatment occurs.
Although Panhandle’s natural gas transmission systems and storage operations are subject to the jurisdiction of FERC in accordance with the Natural Gas Act of 1938 and Natural Gas Policy Act of 1978, it does not currently apply regulatory accounting policies in accounting for its operations. In 1999, prior to its acquisition by Southern Union, Panhandle discontinued the application of regulatory accounting policies primarily due to the level of discounting from tariff rates and its inability to recover specific costs.
S - 17
Cash, Cash Equivalents and Supplemental Cash Flow Information
Cash and cash equivalents include all cash on hand, demand deposits, and investments with original maturities of three months or less. We consider cash equivalents to include short-term, highly liquid investments that are readily convertible to known amounts of cash and that are subject to an insignificant risk of changes in value.
We place our cash deposits and temporary cash investments with high credit quality financial institutions. At times, our cash and cash equivalents may be uninsured or in deposit accounts that exceed the Federal Deposit Insurance Corporation insurance limit.
The net change in operating assets and liabilities (net of acquisitions) included in cash flows from operating activities is comprised as follows:
|
Years Ended December 31,
|
|||||||||||
|
2014
|
2013
|
2012
|
|||||||||
|
Accounts receivable
|
$
|
547
|
|
$
|
(458
|
)
|
$
|
300
|
|
||
|
Accounts receivable from related companies
|
(45
|
)
|
(17
|
)
|
(50
|
)
|
|||||
|
Inventories
|
79
|
|
(256
|
)
|
(253
|
)
|
|||||
|
Exchanges receivable
|
6
|
|
(24
|
)
|
11
|
|
|||||
|
Other current assets
|
120
|
|
(56
|
)
|
571
|
|
|||||
|
Other non-current assets, net
|
(6
|
)
|
(22
|
)
|
(53
|
)
|
|||||
|
Accounts payable
|
(804
|
)
|
525
|
|
(979
|
)
|
|||||
|
Accounts payable to related companies
|
20
|
|
(122
|
)
|
100
|
|
|||||
|
Exchanges payable
|
(100
|
)
|
131
|
|
—
|
|
|||||
|
Accrued and other current liabilities
|
(118
|
)
|
152
|
|
(151
|
)
|
|||||
|
Other non-current liabilities
|
(75
|
)
|
151
|
|
25
|
|
|||||
|
Price risk management assets and liabilities, net
|
112
|
|
(150
|
)
|
4
|
|
|||||
|
Net change in operating assets and liabilities, net of effects of acquisitions and deconsolidations
|
$
|
(264
|
)
|
$
|
(146
|
)
|
$
|
(475
|
)
|
||
S - 18
Non-cash investing and financing activities and supplemental cash flow information are as follows:
|
Years Ended December 31,
|
|||||||||||
|
2014
|
2013
|
2012
|
|||||||||
|
NON-CASH INVESTING ACTIVITIES:
|
|||||||||||
|
Accrued capital expenditures
|
$
|
541
|
|
$
|
167
|
|
$
|
359
|
|
||
|
Net gains from subsidiary common unit issuances
|
$
|
175
|
|
$
|
—
|
|
$
|
—
|
|
||
|
Regency common and Class F units received in exchange for contribution of SUGS
|
$
|
—
|
|
$
|
961
|
|
$
|
—
|
|
||
|
AmeriGas limited partner interest received in exchange for contribution of Propane Business
|
$
|
—
|
|
$
|
—
|
|
$
|
1,123
|
|
||
|
NON-CASH FINANCING ACTIVITIES:
|
|||||||||||
|
Issuance of Common Units in connection with the Susser Merger (see Note 3)
|
$
|
908
|
|
$
|
—
|
|
$
|
—
|
|
||
|
Redemption of Common Units in connection with the Lake Charles LNG Transaction (see Note 3)
|
$
|
1,167
|
|
$
|
—
|
|
$
|
—
|
|
||
|
Issuance of Common Units in connection with the ETP Holdco Acquisition
|
$
|
—
|
|
$
|
2,464
|
|
$
|
—
|
|
||
|
Issuance of Class H Units
|
$
|
—
|
|
$
|
1,514
|
|
$
|
—
|
|
||
|
Issuance of Common Units in connection with other acquisitions
|
$
|
—
|
|
$
|
—
|
|
$
|
2,295
|
|
||
|
Contributions receivable related to noncontrolling interest
|
$
|
—
|
|
$
|
13
|
|
$
|
23
|
|
||
|
SUPPLEMENTAL CASH FLOW INFORMATION:
|
|||||||||||
|
Cash paid for interest, net of interest capitalized
|
$
|
929
|
|
$
|
903
|
|
$
|
678
|
|
||
|
Cash paid for income taxes
|
$
|
343
|
|
$
|
57
|
|
$
|
22
|
|
||
Accounts Receivable
Our midstream, NGL and intrastate transportation and storage operations deal with a variety of counterparties across the energy sector, some of which are investment grade, and most of which are not. Internal credit ratings and credit limits are assigned for all counterparties and limits are monitored against credit exposure. Letters of credit or prepayments may be required from those counterparties that are not investment grade depending on the internal credit rating and level of commercial activity with the counterparty. Master setoff agreements are put in place with counterparties where appropriate to mitigate risk. Bad debt expense related to these receivables is recognized at the time an account is deemed uncollectible.
Our investment in Sunoco Logistics segment extends credit terms to certain customers after review of various credit indicators, including the customer’s credit rating. Based on that review, a letter of credit or other security may be required. Outstanding customer receivable balances are regularly reviewed for possible non-payment indicators and reserves are recorded for doubtful accounts based upon management’s estimate of collectability at the time of review. Actual balances are charged against the reserve when all collection efforts have been exhausted.
Our interstate transportation and storage operations have a concentration of customers in the electric and gas utility industries, municipalities, as well as natural gas producers. This concentration of customers may impact our overall exposure to credit risk, either positively or negatively, in that the customers may be similarly affected by changes in economic or other conditions. From time to time, specifically identified customers having perceived credit risk are required to provide prepayments or other forms of collateral. Management believes that the portfolio of receivables, which includes regulated electric utilities, regulated local distribution companies and municipalities, is subject to minimal credit risk. Our interstate transportation and storage operations establish an allowance for doubtful accounts on trade receivables based on the expected ultimate recovery of these receivables and consider many factors including historical customer collection experience, general and specific economic trends and known specific issues related to individual customers, sectors and transactions that might impact collectability.
Our retail marketing segment extends credit to customers after a review of various credit indicators. Depending on the type of customer and its risk profile, security in the form of a cash deposit, letter of credit or mortgages may be required. Management records reserves for bad debt by computing a proportion of average write-off activity over the past five years in comparison to the outstanding balance in accounts receivable. This proportion is then applied to the accounts receivable balance at the end of the reporting period to calculate a current estimate of what is uncollectible. The allowance computation may then be adjusted to reflect input provided by the credit department and business line managers who may have specific knowledge of
S - 19
uncollectible items. The credit department and business line managers make the decision to write off an account, based on understanding of the potential collectability.
We enter into netting arrangements with counterparties of derivative contracts to mitigate credit risk. Transactions are confirmed with the counterparty and the net amount is settled when due. Amounts outstanding under these netting arrangements are presented on a net basis in the consolidated balance sheets.
Inventories
Inventories consist principally of natural gas held in storage, crude oil, petroleum and chemical products. Natural gas held in storage is valued at the lower of cost or market utilizing the weighted-average cost method. The cost of crude oil and petroleum and chemical products is determined using the last-in, first out method. The cost of appliances, parts and fittings is determined by the first-in, first-out method.
Inventories consisted of the following:
|
December 31,
|
|||||||
|
2014
|
2013
|
||||||
|
Natural gas and NGLs
|
$
|
369
|
|
$
|
573
|
|
|
|
Crude oil
|
364
|
|
488
|
|
|||
|
Refined products
|
392
|
|
543
|
|
|||
|
Appliances, parts and fittings, and other
|
264
|
|
161
|
|
|||
|
Total inventories
|
$
|
1,389
|
|
$
|
1,765
|
|
|
During the year ended
December 31, 2014
, the Partnership recorded write-downs of
$473 million
on its crude oil, refined products and NGL inventories as a result of a decline in the market price of these products. The write-down was calculated based upon current replacement costs.
We utilize commodity derivatives to manage price volatility associated with our natural gas inventory. Changes in fair value of designated hedged inventory are recorded in inventory on our consolidated balance sheets and cost of products sold in our consolidated statements of operations.
Exchanges
Exchanges consist of natural gas and NGL delivery imbalances (over and under deliveries) with others. These amounts, which are valued at market prices or weighted average market prices pursuant to contractual imbalance agreements, turn over monthly and are recorded as exchanges receivable or exchanges payable on our consolidated balance sheets. These imbalances are generally settled by deliveries of natural gas or NGLs, but may be settled in cash, depending on contractual terms.
Other Current Assets
Other current assets consisted of the following:
|
December 31,
|
|||||||
|
2014
|
2013
|
||||||
|
Deposits paid to vendors
|
$
|
65
|
|
$
|
49
|
|
|
|
Deferred income taxes
|
14
|
|
—
|
|
|||
|
Prepaid expenses and other
|
192
|
|
261
|
|
|||
|
Total other current assets
|
$
|
271
|
|
$
|
310
|
|
|
Property, Plant and Equipment
Property, plant and equipment are stated at cost less accumulated depreciation. Depreciation is computed using the straight-line method over the estimated useful or FERC mandated lives of the assets, if applicable. Expenditures for maintenance and repairs that do not add capacity or extend the useful life are expensed as incurred. Expenditures to refurbish assets that either extend the useful lives of the asset or prevent environmental contamination are capitalized and depreciated over the remaining useful life of the asset. Additionally, we capitalize certain costs directly related to the construction of assets including internal
S - 20
labor costs, interest and engineering costs. Upon disposition or retirement of pipeline components or natural gas plant components, any gain or loss is recorded to accumulated depreciation. When entire pipeline systems, gas plants or other property and equipment are retired or sold, any gain or loss is included in our consolidated statements of operations.
We review property, plant and equipment for impairment whenever events or changes in circumstances indicate that the carrying amount of such assets may not be recoverable. If such a review should indicate that the carrying amount of long-lived assets is not recoverable, we reduce the carrying amount of such assets to fair value.
Capitalized interest is included for pipeline construction projects, except for certain interstate projects for which an allowance for funds used during construction (“AFUDC”) is accrued. Interest is capitalized based on the current borrowing rate of our revolving credit facility when the related costs are incurred. AFUDC is calculated under guidelines prescribed by the FERC and capitalized as part of the cost of utility plant for interstate projects. It represents the cost of servicing the capital invested in construction work-in-process. AFUDC is segregated into two component parts – borrowed funds and equity funds.
Components and useful lives of property, plant and equipment were as follows:
|
December 31,
|
|||||||
|
2014
|
2013
|
||||||
|
Land and improvements
|
$
|
1,173
|
|
$
|
878
|
|
|
|
Buildings and improvements (1 to 45 years)
|
1,868
|
|
900
|
|
|||
|
Pipelines and equipment (5 to 83 years)
|
19,274
|
|
16,966
|
|
|||
|
Natural gas and NGL storage facilities (5 to 46 years)
|
1,215
|
|
1,083
|
|
|||
|
Bulk storage, equipment and facilities (2 to 83 years)
|
2,583
|
|
1,933
|
|
|||
|
Tanks and other equipment (5 to 40 years)
|
35
|
|
1,685
|
|
|||
|
Retail equipment (2 to 99 years)
|
515
|
|
450
|
|
|||
|
Vehicles (1 to 25 years)
|
158
|
|
124
|
|
|||
|
Right of way (20 to 83 years)
|
2,059
|
|
1,901
|
|
|||
|
Furniture and fixtures (2 to 25 years)
|
53
|
|
48
|
|
|||
|
Linepack
|
117
|
|
116
|
|
|||
|
Pad gas
|
44
|
|
52
|
|
|||
|
Other (1 to 30 years)
|
919
|
|
626
|
|
|||
|
Construction work-in-process
|
3,187
|
|
1,668
|
|
|||
|
33,200
|
|
28,430
|
|
||||
|
Less – Accumulated depreciation
|
(3,457
|
)
|
(2,483
|
)
|
|||
|
Property, plant and equipment, net
|
$
|
29,743
|
|
$
|
25,947
|
|
|
We recognized the following amounts of depreciation expense for the periods presented:
|
Years Ended December 31,
|
|||||||||||
|
2014
|
2013
|
2012
|
|||||||||
|
Depreciation expense
|
$
|
1,026
|
|
$
|
944
|
|
$
|
615
|
|
||
|
Capitalized interest, excluding AFUDC
|
$
|
99
|
|
$
|
43
|
|
$
|
99
|
|
||
Advances to and Investments in Unconsolidated Affiliates
We own interests in a number of related businesses that are accounted for by the equity method. In general, we use the equity method of accounting for an investment for which we exercise significant influence over, but do not control, the investee’s operating and financial policies.
Goodwill
Goodwill is tested for impairment annually or more frequently if circumstances indicate that goodwill might be impaired. Our annual impairment test is performed as of August 31 for subsidiaries in our intrastate transportation and storage and midstream segments and during the fourth quarter for subsidiaries in our interstate transportation and storage, liquids
S - 21
transportation and services, and retail marketing segments and all others. We recorded goodwill impairments for the periods presented in these consolidated financial statements.
Changes in the carrying amount of goodwill were as follows:
|
Intrastate
Transportation
and Storage
|
Interstate
Transportation and Storage
|
Midstream
|
Liquids Transportation and Services
|
Investment in Sunoco Logistics
|
Retail Marketing
|
All Other
|
Total
|
||||||||||||||||||||||||
|
Balance, December 31, 2012
|
$
|
10
|
|
$
|
1,884
|
|
$
|
375
|
|
$
|
432
|
|
$
|
1,368
|
|
$
|
1,272
|
|
$
|
265
|
|
$
|
5,606
|
|
|||||||
|
Goodwill acquired
|
—
|
|
—
|
|
—
|
|
—
|
|
—
|
|
156
|
|
—
|
|
156
|
|
|||||||||||||||
|
Goodwill disposed
|
—
|
|
—
|
|
(337
|
)
|
—
|
|
—
|
|
—
|
|
—
|
|
(337
|
)
|
|||||||||||||||
|
Goodwill impairment
|
—
|
|
(689
|
)
|
—
|
|
—
|
|
—
|
|
—
|
|
—
|
|
(689
|
)
|
|||||||||||||||
|
Other
|
—
|
|
—
|
|
(2
|
)
|
—
|
|
(22
|
)
|
17
|
|
—
|
|
(7
|
)
|
|||||||||||||||
|
Balance, December 31, 2013
|
10
|
|
1,195
|
|
36
|
|
432
|
|
1,346
|
|
1,445
|
|
265
|
|
4,729
|
|
|||||||||||||||
|
Goodwill acquired
|
—
|
|
—
|
|
—
|
|
—
|
|
12
|
|
1,862
|
|
—
|
|
1,874
|
|
|||||||||||||||
|
Goodwill disposed
|
—
|
|
(184
|
)
|
—
|
|
—
|
|
—
|
|
—
|
|
—
|
|
(184
|
)
|
|||||||||||||||
|
Balance, December 31, 2014
|
$
|
10
|
|
$
|
1,011
|
|
$
|
36
|
|
$
|
432
|
|
$
|
1,358
|
|
$
|
3,307
|
|
$
|
265
|
|
$
|
6,419
|
|
|||||||
Goodwill is recorded at the acquisition date based on a preliminary purchase price allocation and generally may be adjusted when the purchase price allocation is finalized. We recorded a net increase in goodwill of
$1.69 billion
during the year ended
December 31, 2014
primarily due to
$1.73 billion
related to the Susser Merger.
During the fourth quarter of 2013, we performed a goodwill impairment test on our Lake Charles LNG reporting unit. In accordance with GAAP, we performed step one of the goodwill impairment test and determined that the estimated fair value of the Lake Charles LNG reporting unit was less than its carrying amount primarily due to changes related to (i) the structure and capitalization of the planned LNG export project at Lake Charles LNG’s Lake Charles facility, (ii) an analysis of current macroeconomic factors, including global natural gas prices and relative spreads, as of the date of our assessment, (iii) judgments regarding the prospect of obtaining regulatory approval for a proposed LNG export project and the uncertainty associated with the timing of such approvals, and (iv) changes in assumptions related to potential future revenues from the import facility and the proposed export facility. An assessment of these factors in the fourth quarter of 2013 led to a conclusion that the estimated fair value of the Lake Charles LNG reporting unit was less than its carrying amount. We then applied the second step in the goodwill impairment test, allocating the estimated fair value of the reporting unit among all of the assets and liabilities of the reporting unit in a hypothetical purchase price allocation. The assets and liabilities of the reporting unit had recently been measured at fair value in 2012 as a result of the acquisition of Southern Union, and those estimated fair values had been recorded at the reporting unit through the application of “push-down” accounting. For purposes of the hypothetical purchase price allocation used in the goodwill impairment test, we estimated the fair value of the assets and liabilities of the reporting unit in a manner similar to the original purchase price allocation. In allocating value to the property, plant and equipment, we used current replacement costs adjusted for assumed depreciation. We also included the estimated fair value of working capital and identifiable intangible assets in the reporting unit. We adjusted deferred income taxes based on these estimated fair values. Based on this hypothetical purchase price allocation, estimated goodwill was
$184 million
, which was less than the balance of
$873 million
that had originally been recorded by the reporting unit through “push-down” accounting in 2012. As a result, we recorded a goodwill impairment of
$689 million
during the fourth quarter of 2013.
No other goodwill impairments were identified or recorded for our reporting units.
Intangible Assets
Intangible assets are stated at cost, net of amortization computed on the straight-line method. We eliminate from our balance sheet the gross carrying amount and the related accumulated amortization for any fully amortized intangibles in the year they are fully amortized.
S - 22
Components and useful lives of intangible assets were as follows:
|
December 31, 2014
|
December 31, 2013
|
||||||||||||||
|
Gross Carrying
Amount
|
Accumulated
Amortization
|
Gross Carrying
Amount
|
Accumulated
Amortization
|
||||||||||||
|
Amortizable intangible assets:
|
|||||||||||||||
|
Customer relationships, contracts and agreements (3 to 46 years)
|
$
|
1,482
|
|
$
|
(267
|
)
|
$
|
1,393
|
|
$
|
(164
|
)
|
|||
|
Patents (9 years)
|
48
|
|
(11
|
)
|
48
|
|
(6
|
)
|
|||||||
|
Trade Names (15 years)
|
490
|
|
—
|
|
—
|
|
—
|
|
|||||||
|
Other (1 to 15 years)
|
36
|
|
(7
|
)
|
4
|
|
(1
|
)
|
|||||||
|
Total amortizable intangible assets
|
$
|
2,056
|
|
$
|
(285
|
)
|
$
|
1,445
|
|
$
|
(171
|
)
|
|||
|
Non-amortizable intangible assets:
|
|||||||||||||||
|
Trademarks
|
316
|
|
—
|
|
294
|
|
—
|
|
|||||||
|
Total intangible assets
|
$
|
2,372
|
|
$
|
(285
|
)
|
$
|
1,739
|
|
$
|
(171
|
)
|
|||
Aggregate amortization expense of intangible assets was as follows:
|
Years Ended December 31,
|
|||||||||||
|
2014
|
2013
|
2012
|
|||||||||
|
Reported in depreciation and amortization
|
$
|
104
|
|
$
|
88
|
|
$
|
36
|
|
||
Estimated aggregate amortization expense for the next five years is as follows:
|
Years Ending December 31:
|
|||
|
2015
|
$
|
128
|
|
|
2016
|
125
|
|
|
|
2017
|
125
|
|
|
|
2018
|
124
|
|
|
|
2019
|
121
|
|
|
We review amortizable intangible assets for impairment whenever events or changes in circumstances indicate that the carrying amount of such assets may not be recoverable. If such a review should indicate that the carrying amount of amortizable intangible assets is not recoverable, we reduce the carrying amount of such assets to fair value. We review non-amortizable intangible assets for impairment annually, or more frequently if circumstances dictate.
Other Non-Current Assets, net
Other non-current assets, net are stated at cost less accumulated amortization. Other non-current assets, net consisted of the following:
|
December 31,
|
|||||||
|
2014
|
2013
|
||||||
|
Unamortized financing costs (3 to 30 years)
|
$
|
63
|
|
$
|
70
|
|
|
|
Regulatory assets
|
85
|
|
86
|
|
|||
|
Deferred charges
|
220
|
|
144
|
|
|||
|
Restricted funds
|
177
|
|
378
|
|
|||
|
Other
|
148
|
|
88
|
|
|||
|
Total other non-current assets, net
|
$
|
693
|
|
$
|
766
|
|
|
Restricted funds primarily consisted of restricted cash held in our wholly-owned captive insurance companies.
S - 23
Asset Retirement Obligations
We have determined that we are obligated by contractual or regulatory requirements to remove facilities or perform other remediation upon retirement of certain assets. The fair value of any ARO is determined based on estimates and assumptions related to retirement costs, which the Partnership bases on historical retirement costs, future inflation rates and credit-adjusted risk-free interest rates. These fair value assessments are considered to be Level 3 measurements, as they are based on both observable and unobservable inputs. Changes in the liability are recorded for the passage of time (accretion) or for revisions to cash flows originally estimated to settle the ARO.
An ARO is required to be recorded when a legal obligation to retire an asset exists and such obligation can be reasonably estimated. We will record an asset retirement obligation in the periods in which management can reasonably estimate the settlement dates.
Except for certain amounts recorded by Panhandle, Sunoco Logistics and our retail marketing operations, discussed below, management was not able to reasonably measure the fair value of asset retirement obligations as of
December 31, 2014
and
2013
, in most cases because the settlement dates were indeterminable. Although a number of other onshore assets in Panhandle’s system are subject to agreements or regulations that give rise to an ARO upon Panhandle’s discontinued use of these assets, AROs were not recorded because these assets have an indeterminate removal or abandonment date given the expected continued use of the assets with proper maintenance or replacement. Sunoco, Inc. has legal asset retirement obligations for several other assets at its previously owned refineries, pipelines and terminals, for which it is not possible to estimate when the obligations will be settled. Consequently, the retirement obligations for these assets cannot be measured at this time. At the end of the useful life of these underlying assets, Sunoco, Inc. is legally or contractually required to abandon in place or remove the asset. Sunoco Logistics believes it may have additional asset retirement obligations related to its pipeline assets and storage tanks, for which it is not possible to estimate whether or when the retirement obligations will be settled. Consequently, these retirement obligations cannot be measured at this time.
Below is a schedule of AROs by segment recorded as other non-current liabilities in ETP’s consolidated balance sheet:
|
December 31,
|
|||||||
|
2014
|
2013
|
||||||
|
Interstate transportation and storage
|
$
|
58
|
|
$
|
55
|
|
|
|
Investment in Sunoco Logistics
|
41
|
|
41
|
|
|||
|
Retail marketing
|
87
|
|
84
|
|
|||
|
$
|
186
|
|
$
|
180
|
|
||
Individual component assets have been and will continue to be replaced, but the pipeline and the natural gas gathering and processing systems will continue in operation as long as supply and demand for natural gas exists. Based on the widespread use of natural gas in industrial and power generation activities, management expects supply and demand to exist for the foreseeable future. We have in place a rigorous repair and maintenance program that keeps the pipelines and the natural gas gathering and processing systems in good working order. Therefore, although some of the individual assets may be replaced, the pipelines and the natural gas gathering and processing systems themselves will remain intact indefinitely.
As of
December 31, 2014
, there were no legally restricted funds for the purpose of settling AROs.
S - 24
Accrued and Other Current Liabilities
Accrued and other current liabilities consisted of the following:
|
December 31,
|
|||||||
|
2014
|
2013
|
||||||
|
Interest payable
|
$
|
301
|
|
$
|
294
|
|
|
|
Customer advances and deposits
|
82
|
|
126
|
|
|||
|
Accrued capital expenditures
|
536
|
|
166
|
|
|||
|
Accrued wages and benefits
|
196
|
|
155
|
|
|||
|
Taxes payable other than income taxes
|
236
|
|
214
|
|
|||
|
Income taxes payable
|
50
|
|
3
|
|
|||
|
Deferred income taxes
|
99
|
|
119
|
|
|||
|
Other
|
274
|
|
351
|
|
|||
|
Total accrued and other current liabilities
|
$
|
1,774
|
|
$
|
1,428
|
|
|
Deposits or advances are received from our customers as prepayments for natural gas deliveries in the following month. Prepayments and security deposits may also be required when customers exceed their credit limits or do not qualify for open credit.
Environmental Remediation
We accrue environmental remediation costs for work at identified sites where an assessment has indicated that cleanup costs are probable and reasonably estimable. Such accruals are undiscounted and are based on currently available information, estimated timing of remedial actions and related inflation assumptions, existing technology and presently enacted laws and regulations. If a range of probable environmental cleanup costs exists for an identified site, the minimum of the range is accrued unless some other point in the range is more likely in which case the most likely amount in the range is accrued.
Fair Value of Financial Instruments
The carrying amounts of cash and cash equivalents, accounts receivable and accounts payable approximate their fair value. Price risk management assets and liabilities are recorded at fair value.
Based on the estimated borrowing rates currently available to us and our subsidiaries for loans with similar terms and average maturities, the aggregate fair value and carrying amount of our debt obligations as of
December 31, 2014
was
$20.40 billion
and
$19.34 billion
, respectively. As of
December 31, 2013
, the aggregate fair value and carrying amount of our debt obligations was
$17.69 billion
and
$17.09 billion
, respectively. The fair value of our consolidated debt obligations is a Level 2 valuation based on the observable inputs used for similar liabilities.
We have commodity derivatives and interest rate derivatives that are accounted for as assets and liabilities at fair value in our consolidated balance sheets. We determine the fair value of our assets and liabilities subject to fair value measurement by using the highest possible “level” of inputs. Level 1 inputs are observable quotes in an active market for identical assets and liabilities. We consider the valuation of marketable securities and commodity derivatives transacted through a clearing broker with a published price from the appropriate exchange as a Level 1 valuation. Level 2 inputs are inputs observable for similar assets and liabilities. We consider OTC commodity derivatives entered into directly with third parties as a Level 2 valuation since the values of these derivatives are quoted on an exchange for similar transactions. Additionally, we consider our options transacted through our clearing broker as having Level 2 inputs due to the level of activity of these contracts on the exchange in which they trade. We consider the valuation of our interest rate derivatives as Level 2 as the primary input, the LIBOR curve, is based on quotes from an active exchange of Eurodollar futures for the same period as the future interest swap settlements. Level 3 inputs are unobservable. During the period ended
December 31, 2014
,
no
transfers were made between any levels within the fair value hierarchy.
S - 25
The following tables summarize the fair value of our financial assets and liabilities measured and recorded at fair value on a recurring basis as of
December 31, 2014
and
2013
based on inputs used to derive their fair values:
|
Fair Value Total
|
Fair Value Measurements at December 31, 2014
|
||||||||||
|
Level 1
|
Level 2
|
||||||||||
|
Assets:
|
|||||||||||
|
Interest rate derivatives
|
$
|
3
|
|
$
|
—
|
|
$
|
3
|
|
||
|
Commodity derivatives:
|
|
|
|||||||||
|
Natural Gas:
|
|
||||||||||
|
Basis Swaps IFERC/NYMEX
|
19
|
|
19
|
|
—
|
|
|||||
|
Swing Swaps IFERC
|
26
|
|
1
|
|
25
|
|
|||||
|
Fixed Swaps/Futures
|
541
|
|
541
|
|
—
|
|
|||||
|
Forward Physical Swaps
|
1
|
|
—
|
|
1
|
|
|||||
|
Power:
|
|
|
|||||||||
|
Forwards
|
3
|
|
—
|
|
3
|
|
|||||
|
Futures
|
4
|
|
4
|
|
—
|
|
|||||
|
Natural Gas Liquids – Forwards/Swaps
|
46
|
|
46
|
|
—
|
|
|||||
|
Refined Products – Futures
|
21
|
|
21
|
|
—
|
|
|||||
|
Total commodity derivatives
|
661
|
|
632
|
|
29
|
|
|||||
|
Total assets
|
$
|
664
|
|
$
|
632
|
|
$
|
32
|
|
||
|
Liabilities:
|
|
|
|
|
|
||||||
|
Interest rate derivatives
|
$
|
(155
|
)
|
$
|
—
|
|
$
|
(155
|
)
|
||
|
Commodity derivatives:
|
|||||||||||
|
Natural Gas:
|
|
|
|||||||||
|
Basis Swaps IFERC/NYMEX
|
(18
|
)
|
(18
|
)
|
—
|
|
|||||
|
Swing Swaps IFERC
|
(25
|
)
|
(2
|
)
|
(23
|
)
|
|||||
|
Fixed Swaps/Futures
|
(490
|
)
|
(490
|
)
|
—
|
|
|||||
|
Power:
|
|
|
|||||||||
|
Forwards
|
(4
|
)
|
—
|
|
(4
|
)
|
|||||
|
Futures
|
(2
|
)
|
(2
|
)
|
—
|
|
|||||
|
Natural Gas Liquids – Forwards/Swaps
|
(32
|
)
|
(32
|
)
|
—
|
|
|||||
|
Refined Products – Futures
|
(7
|
)
|
(7
|
)
|
—
|
|
|||||
|
Total commodity derivatives
|
(578
|
)
|
(551
|
)
|
(27
|
)
|
|||||
|
Total liabilities
|
$
|
(733
|
)
|
$
|
(551
|
)
|
$
|
(182
|
)
|
||
S - 26
|
Fair Value
Total
|
Fair Value Measurements at December 31, 2013
|
||||||||||
|
Level 1
|
Level 2
|
||||||||||
|
Assets:
|
|||||||||||
|
Interest rate derivatives
|
$
|
47
|
|
$
|
—
|
|
$
|
47
|
|
||
|
Commodity derivatives:
|
|||||||||||
|
Natural Gas:
|
|||||||||||
|
Basis Swaps IFERC/NYMEX
|
5
|
|
5
|
|
—
|
|
|||||
|
Swing Swaps IFERC
|
8
|
|
1
|
|
7
|
|
|||||
|
Fixed Swaps/Futures
|
201
|
|
201
|
|
—
|
|
|||||
|
Power:
|
|||||||||||
|
Forwards
|
3
|
|
—
|
|
3
|
|
|||||
|
Natural Gas Liquids – Forwards/Swaps
|
5
|
|
5
|
|
—
|
|
|||||
|
Refined Products – Futures
|
5
|
|
5
|
|
—
|
|
|||||
|
Total commodity derivatives
|
227
|
|
217
|
|
10
|
|
|||||
|
Total assets
|
$
|
274
|
|
$
|
217
|
|
$
|
57
|
|
||
|
Liabilities:
|
|||||||||||
|
Interest rate derivatives
|
$
|
(95
|
)
|
$
|
—
|
|
$
|
(95
|
)
|
||
|
Commodity derivatives:
|
|||||||||||
|
Natural Gas:
|
|||||||||||
|
Basis Swaps IFERC/NYMEX
|
(4
|
)
|
(4
|
)
|
—
|
|
|||||
|
Swing Swaps IFERC
|
(6
|
)
|
—
|
|
(6
|
)
|
|||||
|
Fixed Swaps/Futures
|
(201
|
)
|
(201
|
)
|
—
|
|
|||||
|
Forward Physical Swaps
|
(1
|
)
|
—
|
|
(1
|
)
|
|||||
|
Power:
|
|||||||||||
|
Forwards
|
(1
|
)
|
—
|
|
(1
|
)
|
|||||
|
Natural Gas Liquids – Forwards/Swaps
|
(5
|
)
|
(5
|
)
|
—
|
|
|||||
|
Refined Products – Futures
|
(5
|
)
|
(5
|
)
|
—
|
|
|||||
|
Total commodity derivatives
|
(223
|
)
|
(215
|
)
|
(8
|
)
|
|||||
|
Total liabilities
|
$
|
(318
|
)
|
$
|
(215
|
)
|
$
|
(103
|
)
|
||
At December 31, 2013, the fair value of the Lake Charles LNG reporting unit was classified as Level 3 of the fair value hierarchy due to the significance of unobservable inputs developed using company-specific information. We used the income approach to measure the fair value of the Lake Charles LNG reporting unit. Under the income approach, we calculated the fair value based on the present value of the estimated future cash flows. The discount rate used, which was an unobservable input, was based on the weighted-average cost of capital adjusted for the relevant risk associated with business-specific characteristics and the uncertainty related to the business's ability to execute on the projected cash flows.
Contributions in Aid of Construction Costs
On certain of our capital projects, third parties are obligated to reimburse us for all or a portion of project expenditures. The majority of such arrangements are associated with pipeline construction and production well tie-ins. Contributions in aid of construction costs (“CIAC”) are netted against our project costs as they are received, and any CIAC which exceeds our total project costs, is recognized as other income in the period in which it is realized.
S - 27
Shipping and Handling Costs
Shipping and handling costs are included in cost of products sold, except for shipping and handling costs related to fuel consumed for compression and treating which are included in operating expenses.
Costs and Expenses
Costs of products sold include actual cost of fuel sold, adjusted for the effects of our hedging and other commodity derivative activities, and the cost of appliances, parts and fittings. Operating expenses include all costs incurred to provide products to customers, including compensation for operations personnel, insurance costs, vehicle maintenance, advertising costs, purchasing costs and plant operations. Selling, general and administrative expenses include all partnership related expenses and compensation for executive, partnership, and administrative personnel.
We record the collection of taxes to be remitted to government authorities on a net basis except for our retail marketing segment in which consumer excise taxes on sales of refined products and merchandise are included in both revenues and costs and expenses in the consolidated statements of operations, with no effect on net income (loss). Excise taxes collected by our retail marketing segment were
$2.46 billion
,
$2.22 billion
and
$573 million
for the years ended
December 31, 2014
,
2013
and
2012
, respectively.
Income Taxes
ETP is a publicly traded limited partnership and is not taxable for federal and most state income tax purposes. As a result, our earnings or losses, to the extent not included in a taxable subsidiary, for federal and most state purposes are included in the tax returns of the individual partners. Net earnings for financial statement purposes may differ significantly from taxable income reportable to Unitholders as a result of differences between the tax basis and financial basis of assets and liabilities, differences between the tax accounting and financial accounting treatment of certain items, and due to allocation requirements related to taxable income under our Second Amended and Restated Agreement of Limited Partnership (the “Partnership Agreement”).
As a publicly traded limited partnership, we are subject to a statutory requirement that our “qualifying income” (as defined by the Internal Revenue Code, related Treasury Regulations, and IRS pronouncements) exceed 90% of our total gross income, determined on a calendar year basis. If our qualifying income does not meet this statutory requirement, ETP would be taxed as a corporation for federal and state income tax purposes. For the years ended
December 31, 2014, 2013 and 2012
, our qualifying income met the statutory requirement.
The Partnership conducts certain activities through corporate subsidiaries which are subject to federal, state and local income taxes. These corporate subsidiaries include Susser and ETP Holdco, which owns Sunoco, Inc. and Panhandle. The Partnership and its corporate subsidiaries account for income taxes under the asset and liability method.
Under this method, deferred tax assets and liabilities are recognized for the estimated future tax consequences attributable to differences between the financial statement carrying amounts of existing assets and liabilities and their respective tax basis. Deferred tax assets and liabilities are measured using enacted tax rates in effect for the year in which those temporary differences are expected to be recovered or settled. The effect on deferred tax assets and liabilities of a change in tax rate is recognized in earnings in the period that includes the enactment date. Valuation allowances are established when necessary to reduce deferred tax assets to the amounts more likely than not to be realized.
The determination of the provision for income taxes requires significant judgment, use of estimates, and the interpretation and application of complex tax laws. Significant judgment is required in assessing the timing and amounts of deductible and taxable items and the probability of sustaining uncertain tax positions. The benefits of uncertain tax positions are recorded in our financial statements only after determining a more-likely-than-not probability that the uncertain tax positions will withstand challenge, if any, from taxing authorities. When facts and circumstances change, we reassess these probabilities and record any changes through the provision for income taxes.
Accounting for Derivative Instruments and Hedging Activities
For qualifying hedges, we formally document, designate and assess the effectiveness of transactions that receive hedge accounting treatment and the gains and losses offset related results on the hedged item in the statement of operations. The market prices used to value our financial derivatives and related transactions have been determined using independent third party prices, readily available market information, broker quotes and appropriate valuation techniques.
At inception of a hedge, we formally document the relationship between the hedging instrument and the hedged item, the risk management objectives, and the methods used for assessing and testing effectiveness and how any ineffectiveness will be
S - 28
measured and recorded. We also assess, both at the inception of the hedge and on a quarterly basis, whether the derivatives that are used in our hedging transactions are highly effective in offsetting changes in cash flows. If we determine that a derivative is no longer highly effective as a hedge, we discontinue hedge accounting prospectively by including changes in the fair value of the derivative in net income for the period.
If we designate a commodity hedging relationship as a fair value hedge, we record the changes in fair value of the hedged asset or liability in cost of products sold in our consolidated statements of operations. This amount is offset by the changes in fair value of the related hedging instrument. Any ineffective portion or amount excluded from the assessment of hedge ineffectiveness is also included in the cost of products sold in the consolidated statements of operations.
Cash flows from derivatives accounted for as cash flow hedges are reported as cash flows from operating activities, in the same category as the cash flows from the items being hedged.
If we designate a derivative financial instrument as a cash flow hedge and it qualifies for hedge accounting, the change in the fair value is deferred in AOCI until the underlying hedged transaction occurs. Any ineffective portion of a cash flow hedge’s change in fair value is recognized each period in earnings. Gains and losses deferred in AOCI related to cash flow hedges remain in AOCI until the underlying physical transaction occurs, unless it is probable that the forecasted transaction will not occur by the end of the originally specified time period or within an additional two-month period of time thereafter. For financial derivative instruments that do not qualify for hedge accounting, the change in fair value is recorded in cost of products sold in the consolidated statements of operations.
We manage a portion of our interest rate exposures by utilizing interest rate swaps and similar instruments. Certain of our interest rate derivatives are accounted for as either cash flow hedges or fair value hedges. For interest rate derivatives accounted for as either cash flow or fair value hedges, we report realized gains and losses and ineffectiveness portions of those hedges in interest expense. For interest rate derivatives not designated as hedges for accounting purposes, we report realized and unrealized gains and losses on those derivatives in “Gains (losses) on interest rate derivatives” in the consolidated statements of operations.
Unit-Based Compensation
For awards of restricted units, we recognize compensation expense over the vesting period based on the grant-date fair value, which is determined based on the market price of our Common Units on the grant date. For awards of cash restricted units, we remeasure the fair value of the award at the end of each reporting period based on the market price of our Common Units as of the reporting date, and the fair value is recorded in other non-current liabilities on our consolidated balance sheets.
Pensions and Other Postretirement Benefit Plans
Employers are required to recognize in their balance sheets the overfunded or underfunded status of defined benefit pension and other postretirement plans, measured as the difference between the fair value of the plan assets and the benefit obligation (the projected benefit obligation for pension plans and the accumulated postretirement benefit obligation for other postretirement plans). Each overfunded plan is recognized as an asset and each underfunded plan is recognized as a liability. Employers must recognize the change in the funded status of the plan in the year in which the change occurs through AOCI in equity or are reflected as a regulatory asset or regulatory liability for regulated subsidiaries.
Allocation of Income
For purposes of maintaining partner capital accounts, the Partnership Agreement specifies that items of income and loss shall generally be allocated among the partners in accordance with their percentage interests. The capital account provisions of our Partnership Agreement incorporate principles established for U.S. Federal income tax purposes and are not comparable to the partners’ capital balances reflected under GAAP in our consolidated financial statements. Our net income for partners’ capital and statement of operations presentation purposes is allocated to the General Partner and Limited Partners in accordance with their respective partnership percentages, after giving effect to priority income allocations for incentive distributions, if any, to our General Partner, the holder of the IDRs pursuant to our Partnership Agreement, which are declared and paid following the close of each quarter. Earnings in excess of distributions are allocated to the General Partner and Limited Partners based on their respective ownership interests.
S - 29
|
3.
|
ACQUISITIONS, DIVESTITURES AND RELATED TRANSACTIONS:
|
Pending Transaction
Regency Merger
In January 2015, ETP and Regency entered into a definitive merger agreement, as amended on February 18, 2015 (the “Merger Agreement”), pursuant to which Regency will merge with a wholly-owned subsidiary of ETP, with Regency continuing as the surviving entity and becoming a wholly-owned subsidiary of ETP (the “Regency Merger”). At the effective time of the Regency Merger (the “Effective Time”), each Regency common unit and Class F unit will be converted into the right to receive
0.4066
ETP Common Units, plus a number of additional ETP Common Units equal to
$0.32
per Regency common unit divided by the lesser of (i) the volume weighted average price of ETP Common Units for the five trading days ending on the third trading day immediately preceding the Effective Time and (ii) the closing price of ETP Common Units on the third trading day immediately preceding the Effective Time, rounded to the nearest ten thousandth of a unit. Each Regency series A preferred unit will be converted into the right to receive a preferred unit representing a limited partner interest in ETP, a new class of units in ETP to be established at the Effective Time. The transaction is subject to other customary closing conditions including approval by Regency’s unitholders.
In addition, ETE, which owns the general partner and
100%
of the incentive distribution rights of both Regency and ETP, has agreed to reduce the incentive distributions it receives from ETP by a total of
$320 million
over a five year period. The IDR subsidy will be
$80 million
in the first year post closing and
$60 million
per year for the following four years. The transaction is expected to close in the second quarter of 2015.
ETP and Regency are under common control of ETE; therefore, we expect to account for the Regency Merger at historical cost as a reorganization of entities under common control. Accordingly, ETP’s consolidated financial statements will be retrospectively adjusted to reflect consolidation of Regency beginning May 26, 2010 (the date ETE acquired Regency’s general partner).
2014 Transactions
Susser Merger
In August 2014, ETP and Susser completed the merger of an indirect wholly-owned subsidiary of ETP, with and into Susser, with Susser surviving the merger as a subsidiary of ETP for total consideration valued at approximately
$1.8 billion
(the “Susser Merger”). The total consideration paid in cash was approximately
$875 million
and the total consideration paid in equity was approximately
15.8 million
ETP Common Units. The Susser Merger broadens our retail geographic footprint and provides synergy opportunities and a platform for future growth.
In connection with the Susser Merger, ETP acquired an indirect
100%
equity interest in Susser and the general partner interest and the incentive distribution rights in Sunoco LP, approximately
11 million
Sunoco LP common and subordinated units, and Susser’s existing retail operations, consisting of
630
convenience store locations.
Effective with the closing of the transaction, Susser ceased to be a publicly traded company and its common stock discontinued trading on the NYSE.
Summary of Assets Acquired and Liabilities Assumed
We accounted for the Susser Merger using the acquisition method of accounting, which requires, among other things, that assets acquired and liabilities assumed be recognized on the balance sheet at their fair values as of the acquisition date. Our consolidated balance sheet as of
December 31, 2014
reflected the preliminary purchase price allocations based on available information. Management is reviewing the valuation and confirming the results to determine the final purchase price allocation.
S - 30
The following table summarizes the preliminary assets acquired and liabilities assumed recognized as of the merger date:
|
Susser
|
||||
|
Total current assets
|
$
|
446
|
|
|
|
Property, plant and equipment
|
1,069
|
|
||
|
Goodwill
(1)
|
1,734
|
|
||
|
Intangible assets
|
611
|
|
||
|
Other non-current assets
|
17
|
|
||
|
3,877
|
|
|||
|
Total current liabilities
|
377
|
|
||
|
Long-term debt, less current maturities
|
564
|
|
||
|
Deferred income taxes
|
488
|
|
||
|
Other non-current liabilities
|
39
|
|
||
|
Noncontrolling interest
|
626
|
|
||
|
2,094
|
|
|||
|
Total consideration
|
1,783
|
|
||
|
Cash received
|
67
|
|
||
|
Total consideration, net of cash received
|
$
|
1,716
|
|
|
|
(1)
|
None of the goodwill is expected to be deductible for tax purposes.
|
The fair values of the assets acquired and liabilities assumed is being determined using various valuation techniques, including the income and market approaches.
ETP incurred merger related costs related to the Susser Merger of
$25 million
during the year ended
December 31, 2014
. Our consolidated statements of operations for the year ended
December 31, 2014
reflected revenue and net income related to Susser of
$2.32 billion
and
$105 million
, respectively.
No pro forma information has been presented, as the impact of these acquisitions was not material in relation to ETP’s consolidated results of operations.
MACS to Sunoco LP
In October 2014, Sunoco LP acquired MACS from a subsidiary of ETP in a transaction valued at approximately
$768 million
(the “MACS Transaction”). The transaction included approximately
110
company-operated retail convenience stores and
200
dealer-operated and consignment sites from MACS, which had originally been acquired by ETP in October 2013. The consideration paid by Sunoco LP consisted of approximately
4 million
Sunoco LP common units issued to ETP and
$556 million
in cash, subject to customary closing adjustments. Sunoco LP initially financed the cash portion by utilizing availability under its revolving credit facility. In October 2014 and November 2014, Sunoco LP partially repaid borrowings on its revolving credit facility with aggregate net proceeds of
$405 million
from a public offering of
9.1 million
Sunoco LP common units.
Lake Charles LNG Transaction
On February 19, 2014, ETP completed the transfer to ETE of Lake Charles LNG, the entity that owns a LNG regasification facility in Lake Charles, Louisiana, in exchange for the redemption by ETP of
18.7 million
ETP Common Units held by ETE (the “Lake Charles LNG Transaction”). This transaction was effective as of January 1, 2014, at which time ETP deconsolidated Lake Charles LNG, including goodwill of
$184 million
and intangible assets of
$50 million
related to Lake Charles LNG. The results of Lake Charles LNG’s operations have not been presented as discontinued operations and Lake Charles LNG’s assets and liabilities have not been presented as held for sale in the Partnership’s consolidated financial statements due to the continuing involvement among the entities.
In connection with ETE’s acquisition of Lake Charles LNG, ETP agreed to continue to provide management services for ETE through 2015 in relation to both Lake Charles LNG’s regasification facility and the development of a liquefaction project at Lake Charles LNG’s facility, for which ETE has agreed to pay incremental management fees to ETP of
$75 million
per year
S - 31
for the years ending December 31, 2014 and 2015. ETE also agreed to provide additional subsidies to ETP through the relinquishment of future incentive distributions, as discussed further in
Note 8
.
Panhandle Merger
On January 10, 2014, Panhandle consummated a merger with Southern Union, the indirect parent of Panhandle at the time of the merger, and PEPL Holdings, a wholly-owned subsidiary of Southern Union and the sole limited partner of Panhandle at the time of the merger, pursuant to which each of Southern Union and PEPL Holdings were merged with and into Panhandle (the “Panhandle Merger”), with Panhandle surviving the Panhandle Merger. In connection with the Panhandle Merger, Panhandle assumed Southern Union’s obligations under its
7.6%
senior notes due 2024,
8.25%
senior notes due 2029 and the junior subordinated notes due 2066. At the time of the Panhandle Merger, Southern Union did not have material operations of its own, other than its ownership of Panhandle and noncontrolling interests in PEI Power II, LLC, Regency (
31.4 million
common units and
6.3 million
Class F Units), and ETP (
2.2 million
Common Units). In connection with the Panhandle Merger, Panhandle also assumed PEPL Holdings’ guarantee of
$600 million
of Regency senior notes.
2013 Transactions
Sale of Southern Union’s Distribution Operations
In December 2012, Southern Union entered into a purchase and sale agreement with The Laclede Group, Inc., pursuant to which Laclede Missouri agreed to acquire the assets of Southern Union’s MGE division and Laclede Massachusetts agreed to acquire the assets of Southern Union’s NEG division (together, the “LDC Disposal Group”). Laclede Gas Company, a subsidiary of The Laclede Group, Inc., subsequently assumed all of Laclede Missouri’s rights and obligations under the purchase and sale agreement. In February 2013, The Laclede Group, Inc. entered into an agreement with Algonquin Power & Utilities Corp (“APUC”) that allowed a subsidiary of APUC to assume the rights of The Laclede Group, Inc. to purchase the assets of Southern Union’s NEG division.
In September 2013, Southern Union completed its sale of the assets of MGE for an aggregate purchase price of
$975 million
, subject to customary post-closing adjustments. In December 2013, Southern Union completed its sale of the assets of NEG for cash proceeds of
$40 million
, subject to customary post-closing adjustments, and the assumption of
$20 million
of debt.
The LDC Disposal Group’s operations have been classified as discontinued operations for all periods in the consolidated statements of operations.
The following table summarizes selected financial information related to Southern Union’s distribution operations in 2013 through MGE and NEG’s sale dates in September 2013 and December 2013, respectively, and for the period from March 26, 2012 to December 31, 2012:
|
Years Ended December 31,
|
|||||||
|
2013
|
2012
|
||||||
|
Revenue from discontinued operations
|
$
|
415
|
|
$
|
324
|
|
|
|
Net income of discontinued operations, excluding effect of taxes and overhead allocations
|
65
|
|
43
|
|
|||
SUGS Contribution
On April 30, 2013, Southern Union completed its contribution to Regency of all of the issued and outstanding membership interest in Southern Union Gathering Company, LLC, and its subsidiaries, including SUGS (the “SUGS Contribution”). The general partner and IDRs of Regency are owned by ETE. The consideration paid by Regency in connection with this transaction consisted of (i) the issuance of approximately
31.4 million
Regency common units to Southern Union, (ii) the issuance of approximately
6.3 million
Regency Class F units to Southern Union, (iii) the distribution of
$463 million
in cash to Southern Union, net of closing adjustments, and (iv) the payment of
$30 million
in cash to a subsidiary of ETP. This transaction was between commonly controlled entities; therefore, the amounts recorded in the consolidated balance sheet for the investment in Regency and the related deferred tax liabilities were based on the historical book value of SUGS. In addition, PEPL Holdings provided a guarantee of collection with respect to the payment of the principal amounts of Regency’s debt related to the SUGS Contribution. The Regency Class F units have the same rights, terms and conditions as the Regency common units, except that Southern Union will not receive distributions on the Regency Class F units for the first eight consecutive quarters following the closing, and the Regency Class F units will thereafter automatically convert into Regency common units on a one-for-one basis. The Partnership has not presented SUGS as discontinued operations due to the Partnership’s
S - 32
continuing involvement with SUGS through affiliate relationships, as well as the direct investment in Regency common and Class F units received, which has been accounted for using the equity method.
Acquisition of ETE’s ETP Holdco Interest
On April 30, 2013, ETP acquired ETE’s
60%
interest in ETP Holdco for approximately
49.5 million
of newly issued ETP Common Units and
$1.40 billion
in cash, less
$68 million
of closing adjustments (the “ETP Holdco Acquisition”). As a result, ETP now owns
100%
of ETP Holdco. ETE, which owns the general partner and IDRs of ETP, agreed to forego incentive distributions on the newly issued ETP units for each of the first eight consecutive quarters beginning with the quarter in which the closing of the transaction occurred and
50%
of incentive distributions on the newly issued ETP units for the following eight consecutive quarters. ETP controlled ETP Holdco prior to this acquisition; therefore, the transaction did not constitute a change of control.
2012 Transactions
Southern Union Merger
On March 26, 2012, ETE completed its acquisition of Southern Union. Southern Union was the surviving entity in the merger and operated as a wholly-owned subsidiary of ETE. See below for discussion of ETP Holdco Transaction and ETE’s contribution of Southern Union to ETP Holdco.
Under the terms of the merger agreement, Southern Union stockholders received a total of
57 million
ETE Common Units and a total of approximately
$3.01 billion
in cash. Effective with the closing of the transaction, Southern Union’s common stock was no longer publicly traded.
Citrus Acquisition
In connection with the Southern Union Merger on March 26, 2012, we completed our acquisition of CrossCountry, a subsidiary of Southern Union which owned an indirect
50%
interest in Citrus, the owner of FGT. The total merger consideration was approximately
$2.0 billion
, consisting of approximately
$1.9 billion
in cash and approximately
2.2 million
ETP Common Units. See
Note 4
for more information regarding our equity method investment in Citrus.
Sunoco Merger
On October 5, 2012, ETP completed its merger with Sunoco, Inc. Under the terms of the merger agreement, Sunoco, Inc. shareholders received
55 million
ETP Common Units and a total of approximately
$2.6 billion
in cash.
Sunoco, Inc. generates cash flow from a portfolio of retail outlets for the sale of gasoline and middle distillates in the east coast, midwest and southeast areas of the United States. Prior to October 5, 2012, Sunoco, Inc. also owned a
2%
general partner interest,
100%
of the IDRs, and
32%
of the outstanding common units of Sunoco Logistics. As discussed below, on October 5, 2012, Sunoco, Inc.’s interests in Sunoco Logistics were transferred to the Partnership.
Prior to the Sunoco Merger, on September 8, 2012, Sunoco, Inc. completed the exit from its Northeast refining operations by contributing the refining assets at its Philadelphia refinery and various commercial contracts to PES, a joint venture with The Carlyle Group. Sunoco, Inc. also permanently idled the main refining processing units at its Marcus Hook refinery in June 2012. The Marcus Hook Industrial Complex continued to support operations at the Philadelphia refinery prior to commencement of the PES joint venture. Under the terms of the joint venture agreement, The Carlyle Group contributed cash in exchange for a
67%
controlling interest in PES. In exchange for contributing its Philadelphia refinery assets and various commercial contracts to the joint venture, Sunoco, Inc. retained an approximate
33%
non-operating noncontrolling interest. The fair value of Sunoco, Inc.’s retained interest in PES, which was
$75 million
on the date on which the joint venture was formed, was determined based on the equity contributions of The Carlyle Group. Sunoco, Inc. has indemnified PES for environmental liabilities related to the Philadelphia refinery that arose from the operation of such assets prior the formation of the joint venture. The Carlyle Group will oversee day-to-day operations of PES and the refinery. JPMorgan Chase provides working capital financing to PES in the form of an asset-backed loan, supply crude oil and other feedstocks to the refinery at the time of processing and purchase certain blendstocks and all finished refined products as they are processed. Sunoco, Inc. entered into a supply contract for gasoline and diesel produced at the refinery for its retail marketing business.
ETP incurred merger related costs related to the Sunoco Merger of
$28 million
during the year ended December 31, 2012. Sunoco, Inc.’s revenue included in our consolidated statement of operations was approximately
$5.93 billion
during October through December 2012. Sunoco, Inc.’s net loss included in our consolidated statement of operations was approximately
$14 million
during October through December 2012. Sunoco Logistics’ revenue included in our consolidated statement of
S - 33
operations was approximately
$3.11 billion
during October through December 2012. Sunoco Logistics’ net income included in our consolidated statement of operations was approximately
$145 million
during October through December 2012.
ETP Holdco Transaction
Immediately following the closing of the Sunoco Merger in 2012, ETE contributed its interest in Southern Union into ETP Holdco, an ETP-controlled entity, in exchange for a
60%
equity interest in ETP Holdco. In conjunction with ETE’s contribution, ETP contributed its interest in Sunoco, Inc. to ETP Holdco and retained a
40%
equity interest in ETP Holdco. Prior to the contribution of Sunoco, Inc. to ETP Holdco, Sunoco, Inc. contributed
$2.0 billion
of cash and its interests in Sunoco Logistics to ETP in exchange for
90.7 million
Class F Units representing limited partner interests in ETP (“Class F Units”). The Class F Units were exchanged for Class G Units in 2013 as discussed in
Note 8
. Pursuant to a stockholders agreement between ETE and ETP, ETP controlled ETP Holdco (prior to ETP’s acquisition of ETE’s
60%
equity interest in ETP Holdco in 2013) and therefore, ETP consolidated ETP Holdco (including Sunoco, Inc. and Southern Union) in its financial statements subsequent to consummation of the ETP Holdco Transaction.
Under the terms of the ETP Holdco transaction agreement, ETE agreed to relinquish its right to
$210 million
of incentive distributions from ETP that ETE would otherwise be entitled to receive over
12
consecutive quarters beginning with the distribution paid on November 14, 2012.
In accordance with GAAP, we have accounted for the ETP Holdco Transaction, whereby ETP obtained control of Southern Union, as a reorganization of entities under common control. Accordingly, ETP’s consolidated financial statements have been retrospectively adjusted to reflect consolidation of Southern Union into ETP beginning March 26, 2012 (the date ETE acquired Southern Union). This change only impacted interim periods in 2012, and no prior annual amounts have been adjusted.
Summary of Assets Acquired and Liabilities Assumed
We accounted for the Sunoco Merger using the acquisition method of accounting, which requires, among other things, that assets acquired and liabilities assumed be recognized on the balance sheet at their fair values as of the acquisition date. Upon consummation of the ETP Holdco Transaction, we applied the accounting guidance for transactions between entities under common control. In doing so, we recorded the values of assets and liabilities that had been recorded by ETE as reflected below.
The following table summarizes the assets acquired and liabilities assumed as of the respective acquisition dates:
|
Sunoco, Inc.
(1)
|
Southern Union
(2)
|
||||||
|
Current assets
|
$
|
7,312
|
|
$
|
556
|
|
|
|
Property, plant and equipment
|
6,686
|
|
6,242
|
|
|||
|
Goodwill
|
2,641
|
|
2,497
|
|
|||
|
Intangible assets
|
1,361
|
|
55
|
|
|||
|
Investments in unconsolidated affiliates
|
240
|
|
2,023
|
|
|||
|
Note receivable
|
821
|
|
—
|
|
|||
|
Other assets
|
128
|
|
163
|
|
|||
|
19,189
|
|
11,536
|
|
||||
|
Current liabilities
|
4,424
|
|
1,348
|
|
|||
|
Long-term debt obligations, less current maturities
|
2,879
|
|
3,120
|
|
|||
|
Deferred income taxes
|
1,762
|
|
1,419
|
|
|||
|
Other non-current liabilities
|
769
|
|
284
|
|
|||
|
Noncontrolling interest
|
3,580
|
|
—
|
|
|||
|
13,414
|
|
6,171
|
|
||||
|
Total consideration
|
5,775
|
|
5,365
|
|
|||
|
Cash received
|
2,714
|
|
37
|
|
|||
|
Total consideration, net of cash received
|
$
|
3,061
|
|
$
|
5,328
|
|
|
|
(1)
|
Includes amounts recorded with respect to Sunoco Logistics.
|
S - 34
|
(2)
|
Includes ETP’s acquisition of Citrus.
|
The fair values of the assets acquired and liabilities assumed were determined using various valuation techniques, including the income and market approaches.
As a result of the ETP Holdco Transaction, we recognized
$38 million
of merger-related costs during the year ended December 31, 2012 related to Southern Union. Southern Union’s revenue included in our consolidated statement of operations was approximately
$1.26 billion
since the acquisition date to December 31, 2012. Southern Union’s net income included in our consolidated statement of operations was approximately
$39 million
since the acquisition date to December 31, 2012.
Propane Operations
On January 12, 2012, we contributed our propane operations, consisting of HOLP and Titan (collectively, the “Propane Business”) to AmeriGas. We received approximately
$1.46 billion
in cash and approximately
29.6 million
AmeriGas common units. AmeriGas assumed approximately
$71 million
of existing HOLP debt. In connection with the closing of this transaction, we entered into a support agreement with AmeriGas pursuant to which we are obligated to provide contingent, residual support of
$1.50 billion
of intercompany indebtedness owed by AmeriGas to a finance subsidiary that in turn supports the repayment of
$1.50 billion
of senior notes issued by this AmeriGas finance subsidiary to finance the cash portion of the purchase price.
Our consolidated financial statements did not reflect the Propane Business as discontinued operations due to our continuing involvement in this business through our investment in AmeriGas that was transferred as consideration for the transaction.
In June 2012, we sold the remainder of our retail propane operations, consisting of our cylinder exchange business, to a third party. In connection with the contribution agreement with AmeriGas, certain excess sales proceeds from the sale of the cylinder exchange business were remitted to AmeriGas, and we received net proceeds of approximately
$43 million
.
Sale of Canyon
In October 2012, we sold Canyon for approximately
$207 million
. The results of continuing operations of Canyon have been reclassified to loss from discontinued operations and the prior year amounts have been restated to present Canyon’s operations as discontinued operations. A write down of the carrying amounts of the Canyon assets to their fair values was recorded for approximately
$132 million
during the year ended December 31, 2012. Canyon was previously included in our midstream segment.
Pro Forma Results of Operations
The following unaudited pro forma consolidated results of operations for the year ended December 31, 2012 are presented as if the Sunoco Merger and the ETP Holdco Transaction had been completed on January 1, 2012:
|
Year Ended December 31, 2012
|
||||
|
Revenues
|
$
|
39,136
|
|
|
|
Net income
|
1,133
|
|
||
|
Net income attributable to partners
|
788
|
|
||
|
Basic net income per Limited Partner unit
|
$
|
1.33
|
|
|
|
Diluted net income per Limited Partner unit
|
$
|
1.33
|
|
|
The pro forma consolidated results of operations include adjustments to:
|
•
|
include the results of Southern Union and Sunoco, Inc. beginning January 1, 2012;
|
|
•
|
include the incremental expenses associated with the fair value adjustments recorded as a result of applying the acquisition method of accounting;
|
|
•
|
include incremental interest expense related to the financing of ETP’s proportionate share of the purchase price; and
|
|
•
|
reflect noncontrolling interest related to ETE’s
60%
interest in ETP Holdco during the periods.
|
The pro forma information is not necessarily indicative of the results of operations that would have occurred had the transactions been made at the beginning of the periods presented or the future results of the combined operations.
S - 35
|
4.
|
ADVANCES TO AND INVESTMENTS IN UNCONSOLIDATED AFFILIATES:
|
Regency
On April 30, 2013, Southern Union completed its contribution to Regency of all of the issued and outstanding membership interest in Southern Union Gathering Company, LLC, and its subsidiaries, including SUGS (see
Note 3
). The consideration paid by Regency in connection with this transaction included approximately
31.4 million
Regency common units, approximately
6.3 million
Regency Class F units, the distribution of
$463 million
in cash to Southern Union, net of closing adjustments, and the payment of
$30 million
in cash to a subsidiary of ETP. This direct investment in Regency common and Class F units received has been accounted for using the equity method.
The carrying amount of our investment in Regency was
$1.34 billion
and
$1.41 billion
as of
December 31, 2014
and
2013
, respectively, and was reflected in our all other segment.
Citrus
On March 26, 2012, ETE consummated the acquisition of Southern Union and, concurrently with the closing of the Southern Union acquisition, CrossCountry, a subsidiary of Southern Union that indirectly owned a
50%
interest in Citrus, merged with a subsidiary of ETP and, in connection therewith, ETP paid approximately
$1.9 billion
in cash and issued
$105 million
of ETP Common Units (the “Citrus Acquisition”) to a subsidiary of ETE. As a result of the consummation of the Citrus Acquisition, ETP owns CrossCountry, which in turn owns a
50%
interest in Citrus. The other
50%
interest in Citrus is owned by a subsidiary of Kinder Morgan, Inc. Citrus owns
100%
of FGT, a natural gas pipeline system that originates in Texas and delivers natural gas to the Florida peninsula.
We recorded our investment in Citrus at
$2.0 billion
, which exceeded our proportionate share of Citrus’ equity by
$1.03 billion
, all of which is treated as equity method goodwill due to the application of regulatory accounting. The carrying amount of our investment in Citrus was
$1.82 billion
and
$1.89 billion
as of
December 31, 2014
and
2013
, respectively, and was reflected in our interstate transportation and storage segment.
AmeriGas
As discussed in
Note 3
, on January 12, 2012, we received approximately
29.6 million
AmeriGas common units in connection with the contribution of our propane operations. In the year ended
2013
, we sold
7.5 million
AmeriGas common units for net proceeds of
$346 million
, and in the year ended
2014
we sold approximately
18.9 million
AmeriGas common units for net proceeds of
$814 million
. Net proceeds from these sales were used to repay borrowings under the ETP Credit Facility and general partnership purposes. Subsequent to the sales, the Partnership’s remaining interest in AmeriGas common units consisted of
3.1 million
units held by a wholly-owned captive insurance company.
FEP
We have a
50%
interest in FEP, a 50/50 joint venture with KMP. FEP owns the Fayetteville Express pipeline, an approximately 185-mile natural gas pipeline that originates in Conway County, Arkansas, continues eastward through White County, Arkansas and terminates at an interconnect with Trunkline Gas Company in Panola County, Mississippi. The carrying amount of our investment in FEP was
$130 million
and
$144 million
as of
December 31, 2014
and
2013
, respectively, and was reflected in our interstate transportation and storage segment.
S - 36
Summarized Financial Information
The following tables present aggregated selected balance sheet and income statement data for our unconsolidated affiliates, FEP, AmeriGas, Citrus and Regency (on a 100% basis) for all periods presented:
|
December 31,
|
|||||||
|
2014
|
2013
|
||||||
|
Current assets
|
$
|
1,514
|
|
$
|
1,372
|
|
|
|
Property, plant and equipment, net
|
16,967
|
|
12,320
|
|
|||
|
Other assets
|
9,708
|
|
6,478
|
|
|||
|
Total assets
|
$
|
28,189
|
|
$
|
20,170
|
|
|
|
Current liabilities
|
$
|
2,324
|
|
$
|
1,455
|
|
|
|
Non-current liabilities
|
13,206
|
|
10,286
|
|
|||
|
Equity
|
12,659
|
|
8,429
|
|
|||
|
Total liabilities and equity
|
$
|
28,189
|
|
$
|
20,170
|
|
|
|
Years Ended December 31,
|
|||||||||||
|
2014
|
2013
|
2012
|
|||||||||
|
Revenue
|
$
|
9,467
|
|
$
|
6,806
|
|
$
|
4,057
|
|
||
|
Operating income
|
841
|
|
1,043
|
|
635
|
|
|||||
|
Net income
|
279
|
|
574
|
|
338
|
|
|||||
In addition to the equity method investments described above we have other equity method investments which are not significant to our consolidated financial statements.
S - 37
|
5.
|
NET INCOME PER LIMITED PARTNER UNIT:
|
A reconciliation of income from continuing operations and weighted average units used in computing basic and diluted income from continuing operations per unit is as follows:
|
Years Ended December 31,
|
|||||||||||
|
2014
|
2013
|
2012
|
|||||||||
|
Income from continuing operations
|
$
|
1,489
|
|
$
|
735
|
|
$
|
1,757
|
|
||
|
Less: Income from continuing operations attributable to noncontrolling interest
|
217
|
|
296
|
|
62
|
|
|||||
|
Income from continuing operations, net of noncontrolling interest
|
1,272
|
|
439
|
|
1,695
|
|
|||||
|
General Partner’s interest in income from continuing operations
|
513
|
|
505
|
|
463
|
|
|||||
|
Class H Unitholder’s interest in income from continuing operations
|
217
|
|
—
|
|
—
|
|
|||||
|
Common Unitholders’ interest in income (loss) from continuing operations
|
542
|
|
(66
|
)
|
1,232
|
|
|||||
|
Additional earnings allocated (to) from General Partner
|
(4
|
)
|
(2
|
)
|
1
|
|
|||||
|
Distributions on employee unit awards, net of allocation to General Partner
|
(13
|
)
|
(10
|
)
|
(9
|
)
|
|||||
|
Income (loss) from continuing operations available to Common Unitholders
|
$
|
525
|
|
$
|
(78
|
)
|
$
|
1,224
|
|
||
|
Weighted average Common Units – basic
|
331.5
|
|
343.4
|
|
248.3
|
|
|||||
|
Basic income (loss) from continuing operations per Common Unit
|
$
|
1.58
|
|
$
|
(0.23
|
)
|
$
|
4.93
|
|
||
|
Dilutive effect of unvested Unit Awards
|
1.3
|
|
—
|
|
0.7
|
|
|||||
|
Weighted average Common Units, assuming dilutive effect of unvested Unit Awards
|
332.8
|
|
343.4
|
|
249.0
|
|
|||||
|
Diluted income (loss) from continuing operations per Common Unit
|
$
|
1.58
|
|
$
|
(0.23
|
)
|
$
|
4.91
|
|
||
|
Basic income (loss) from discontinued operations per Common Unit
|
$
|
0.19
|
|
$
|
0.05
|
|
$
|
(0.50
|
)
|
||
|
Diluted income (loss) from discontinued operations per Common Unit
|
$
|
0.19
|
|
$
|
0.05
|
|
$
|
(0.50
|
)
|
||
|
6.
|
DEBT OBLIGATIONS:
|
Our debt obligations consist of the following:
|
December 31,
|
|||||||
|
2014
|
2013
|
||||||
|
ETP Debt
|
|||||||
|
8.5% Senior Notes due April 15, 2014
|
$
|
—
|
|
$
|
292
|
|
|
|
5.95% Senior Notes due February 1, 2015
|
750
|
|
750
|
|
|||
|
6.125% Senior Notes due February 15, 2017
|
400
|
|
400
|
|
|||
|
6.7% Senior Notes due July 1, 2018
|
600
|
|
600
|
|
|||
|
9.7% Senior Notes due March 15, 2019
|
400
|
|
400
|
|
|||
|
9.0% Senior Notes due April 15, 2019
|
450
|
|
450
|
|
|||
|
4.15% Senior Notes due October 1, 2020
|
700
|
|
700
|
|
|||
|
4.65% Senior Notes due June 1, 2021
|
800
|
|
800
|
|
|||
|
5.20% Senior Notes due February 1, 2022
|
1,000
|
|
1,000
|
|
|||
|
3.60% Senior Notes due February 1, 2023
|
800
|
|
800
|
|
|||
|
4.9% Senior Notes due February 1, 2024
|
350
|
|
350
|
|
|||
|
7.6% Senior Notes due February 1, 2024
|
277
|
|
277
|
|
|||
|
8.25% Senior Notes due November 15, 2029
|
267
|
|
267
|
|
|||
|
6.625% Senior Notes due October 15, 2036
|
400
|
|
400
|
|
|||
|
7.5% Senior Notes due July 1, 2038
|
550
|
|
550
|
|
|||
S - 38
|
6.05% Senior Notes due June 1, 2041
|
700
|
|
700
|
|
|||
|
6.50% Senior Notes due February 1, 2042
|
1,000
|
|
1,000
|
|
|||
|
5.15% Senior Notes due February 1, 2043
|
450
|
|
450
|
|
|||
|
5.95% Senior Notes due October 1, 2043
|
450
|
|
450
|
|
|||
|
Floating Rate Junior Subordinated Notes due November 1, 2066
|
546
|
|
546
|
|
|||
|
ETP $2.5 billion Revolving Credit Facility due October 27, 2019
|
570
|
|
65
|
|
|||
|
Unamortized premiums, discounts and fair value adjustments, net
|
(1
|
)
|
(34
|
)
|
|||
|
11,459
|
|
11,213
|
|
||||
|
Transwestern Debt
|
|||||||
|
5.39% Senior Notes due November 17, 2014
|
—
|
|
88
|
|
|||
|
5.54% Senior Notes due November 17, 2016
|
125
|
|
125
|
|
|||
|
5.64% Senior Notes due May 24, 2017
|
82
|
|
82
|
|
|||
|
5.36% Senior Notes due December 9, 2020
|
175
|
|
175
|
|
|||
|
5.89% Senior Notes due May 24, 2022
|
150
|
|
150
|
|
|||
|
5.66% Senior Notes due December 9, 2024
|
175
|
|
175
|
|
|||
|
6.16% Senior Notes due May 24, 2037
|
75
|
|
75
|
|
|||
|
Unamortized premiums, discounts and fair value adjustments, net
|
(1
|
)
|
(1
|
)
|
|||
|
781
|
|
869
|
|
||||
|
Panhandle Debt
(1)
|
|||||||
|
6.20% Senior Notes due November 1, 2017
|
300
|
|
300
|
|
|||
|
7.00% Senior Notes due June 15, 2018
|
400
|
|
400
|
|
|||
|
8.125% Senior Notes due June 1, 2019
|
150
|
|
150
|
|
|||
|
7.60% Senior Notes due February 1, 2024
|
82
|
|
82
|
|
|||
|
7.00% Senior Notes due July 15, 2029
|
66
|
|
66
|
|
|||
|
8.25% Senior Notes due November 14, 2029
|
33
|
|
33
|
|
|||
|
Floating Rate Junior Subordinated Notes due November 1, 2066
|
54
|
|
54
|
|
|||
|
Unamortized premiums, discounts and fair value adjustments, net
|
99
|
|
155
|
|
|||
|
1,184
|
|
1,240
|
|
||||
|
Sunoco, Inc. Debt
|
|||||||
|
4.875% Senior Notes due October 15, 2014
|
—
|
|
250
|
|
|||
|
9.625% Senior Notes due April 15, 2015
|
250
|
|
250
|
|
|||
|
5.75% Senior Notes due January 15, 2017
|
400
|
|
400
|
|
|||
|
9.00% Debentures due November 1, 2024
|
65
|
|
65
|
|
|||
|
Unamortized premiums, discounts and fair value adjustments, net
|
35
|
|
70
|
|
|||
|
750
|
|
1,035
|
|
||||
|
Sunoco Logistics Debt
|
|||||||
|
8.75% Senior Notes due February 15, 2014
(2)
|
—
|
|
175
|
|
|||
|
6.125% Senior Notes due May 15, 2016
|
175
|
|
175
|
|
|||
|
5.50% Senior Notes due February 15, 2020
|
250
|
|
250
|
|
|||
|
4.65% Senior Notes due February 15, 2022
|
300
|
|
300
|
|
|||
|
3.45% Senior Notes due January 15, 2023
|
350
|
|
350
|
|
|||
|
4.25% Senior Notes due April 1, 2024
|
500
|
|
—
|
|
|||
|
6.85% Senior Notes due February 15, 2040
|
250
|
|
250
|
|
|||
|
6.10% Senior Notes due February 15, 2042
|
300
|
|
300
|
|
|||
|
4.95% Senior Notes due January 15, 2043
|
350
|
|
350
|
|
|||
|
5.30% Senior Notes due April 1, 2044
|
700
|
|
—
|
|
|||
S - 39
|
5.35% Senior Notes due May 15, 2045
|
800
|
|
—
|
|
|||
|
Sunoco Logistics $35 million Revolving Credit Facility due April 30, 2015
(3)
|
35
|
|
35
|
|
|||
|
Sunoco Logistics $1.50 billion Revolving Credit Facility due November 19, 2018
|
150
|
|
200
|
|
|||
|
Unamortized premiums, discounts and fair value adjustments, net
|
100
|
|
118
|
|
|||
|
4,260
|
|
2,503
|
|
||||
|
Sunoco LP Debt
|
|||||||
|
Sunoco LP $1.25 billion Revolving Credit Facility due September 25, 2019
|
683
|
|
—
|
|
|||
|
683
|
|
—
|
|
||||
|
Other
|
223
|
|
228
|
|
|||
|
19,340
|
|
17,088
|
|
||||
|
Less: current maturities
|
1,008
|
|
637
|
|
|||
|
$
|
18,332
|
|
$
|
16,451
|
|
||
|
(1)
|
In connection with the Panhandle Merger, Southern Union’s debt obligations were assumed by Panhandle.
|
|
(2)
|
Sunoco Logistics’
8.75%
senior notes due February 15, 2014 were classified as long-term debt as Sunoco Logistics repaid these notes in February 2014 with borrowings under its
$1.50 billion
credit facility due November 2018.
|
|
(3)
|
The Sunoco Logistics
$35 million
credit facility outstanding amounts were classified as long-term debt as Sunoco Logistics has the ability and intent to refinance such borrowings on a long-term basis.
|
The following table reflects future maturities of long-term debt for each of the next five years and thereafter. These amounts exclude
$232 million
in unamortized net premiums and fair value adjustments:
|
2015
|
$
|
1,050
|
|
|
|
2016
|
314
|
|
||
|
2017
|
1,228
|
|
||
|
2018
|
1,155
|
|
||
|
2019
|
2,259
|
|
||
|
Thereafter
|
13,102
|
|
||
|
Total
|
$
|
19,108
|
|
|
ETP as Co-Obligor of Sunoco, Inc. Debt
In connection with the Sunoco Merger and ETP Holdco Transaction, ETP became a co-obligor on approximately
$965 million
of aggregate principal amount of Sunoco, Inc.’s existing senior notes and debentures. The balance of these notes was
$715 million
as of
December 31, 2014
.
ETP Senior Notes
The ETP senior notes were registered under the Securities Act of 1933 (as amended). The Partnership may redeem some or all of the ETP senior notes at any time, or from time to time, pursuant to the terms of the indenture and related indenture supplements related to the ETP senior notes. The balance is payable upon maturity. Interest on the ETP senior notes is paid semi-annually.
The ETP senior notes are unsecured obligations of the Partnership and the obligation of the Partnership to repay the ETP senior notes is not guaranteed by any of the Partnership’s subsidiaries. As a result, the ETP senior notes effectively rank junior to any future indebtedness of ours or our subsidiaries that is both secured and unsubordinated to the extent of the value of the assets securing such indebtedness, and the ETP senior notes effectively rank junior to all indebtedness and other liabilities of our existing and future subsidiaries.
Transwestern Senior Notes
The Transwestern notes are payable at any time in whole or pro rata in part, subject to a premium or upon a change of control event or an event of default, as defined. The balance is payable upon maturity. Interest is paid semi-annually.
S - 40
Panhandle Junior Subordinated Notes
The interest rate on the remaining portion of Panhandle’s junior subordinated notes due 2066 is a variable rate based upon the
three-month LIBOR rate plus 3.0175%
. The balance of the variable rate portion of the junior subordinated notes was
$54 million
at an effective interest rate of
3.26%
at
December 31, 2014
.
Sunoco Logistics Senior Notes Offerings
In April 2014, Sunoco Logistics issued
$300 million
aggregate principal amount of
4.25%
senior notes due April 2024 and
$700 million
aggregate principal amount of
5.30%
senior notes due April 2044.
In November 2014, Sunoco Logistics issued
$200 million
aggregate principal amount of
4.25%
senior notes due April 2024 and
$800 million
aggregate principal amount of
5.35%
senior notes due May 2045. Sunoco Logistics used the net proceeds from the offerings to pay outstanding borrowings under the Sunoco Logistics Credit Facility and for general partnership purposes.
Credit Facilities
ETP Credit Facility
The ETP Credit Facility allows for borrowings of up to
$2.5 billion
and expires in October 2019. The indebtedness under the ETP Credit Facility is unsecured and not guaranteed by any of the Partnership’s subsidiaries and has equal rights to holders of our current and future unsecured debt. The indebtedness under the ETP Credit Facility has the same priority of payment as our other current and future unsecured debt. We use the ETP Credit Facility to provide temporary financing for our growth projects, as well as for general partnership purposes. In February 2015, ETP amended its revolving credit facility to increase the capacity to
$3.75 billion
.
As of
December 31, 2014
, the ETP Credit Facility had
$570 million
outstanding, and the amount available for future borrowings was
$1.81 billion
after taking into account letters of credit of
$121 million
. The weighted average interest rate on the total amount outstanding as of
December 31, 2014
was
1.66%
.
Sunoco Logistics Credit Facilities
Sunoco Logistics maintains a
$1.50 billion
unsecured credit facility (the “Sunoco Logistics Credit Facility”) which matures in November 2018. The Sunoco Logistics Credit Facility contains an accordion feature, under which the total aggregate commitment may be extended to
$2.25 billion
under certain conditions.
The Sunoco Logistics Credit Facility is available to fund Sunoco Logistics’ working capital requirements, to finance acquisitions and capital projects, to pay distributions and for general partnership purposes. The Sunoco Logistics Credit Facility bears interest at LIBOR or the Base Rate, each plus an applicable margin. The credit facility may be prepaid at any time. As of
December 31, 2014
, the Sunoco Logistics Credit Facility had
$150 million
of outstanding borrowings.
West Texas Gulf Pipe Line Company, a subsidiary of Sunoco Logistics, maintains a
$35 million
revolving credit facility which expires in April 2015. The facility is available to fund West Texas Gulf’s general corporate purposes including working capital and capital expenditures. At
December 31, 2014
, this credit facility had
$35 million
of outstanding borrowings.
Sunoco LP Credit Facility
In September 2014, Sunoco LP entered into a
$1.25 billion
revolving credit agreement (the “Sunoco LP Credit Facility”), which matures in September 2019. The Sunoco LP Credit Facility can be increased from time to time upon Sunoco LP’s written request, subject to certain conditions, up to an additional
$250 million
. As of
December 31, 2014
, the Sunoco LP Credit Facility had
$683 million
of outstanding borrowings.
Covenants Related to Our Credit Agreements
Covenants Related to ETP
The agreements relating to the ETP senior notes contain restrictive covenants customary for an issuer with an investment-grade rating from the rating agencies, which covenants include limitations on liens and a restriction on sale-leaseback transactions.
S - 41
The credit agreement relating to the ETP Credit Facility contains covenants that limit (subject to certain exceptions) the Partnership’s and certain of the Partnership’s subsidiaries’ ability to, among other things:
|
•
|
incur indebtedness;
|
|
•
|
grant liens;
|
|
•
|
enter into mergers;
|
|
•
|
dispose of assets;
|
|
•
|
make certain investments;
|
|
•
|
make Distributions (as defined in such credit agreement) during certain Defaults (as defined in such credit agreement) and during any Event of Default (as defined in such credit agreement);
|
|
•
|
engage in business substantially different in nature than the business currently conducted by the Partnership and its subsidiaries;
|
|
•
|
engage in transactions with affiliates; and
|
|
•
|
enter into restrictive agreements.
|
The credit agreement relating to the ETP Credit Facility also contains a financial covenant that provides that the Leverage Ratio, as defined in the ETP Credit Facility, shall not exceed
5.0
to
1
as of the end of each quarter, with a permitted increase to
5.5
to
1
during a Specified Acquisition Period, as defined in the ETP Credit Facility.
The agreements relating to the Transwestern senior notes contain certain restrictions that, among other things, limit the incurrence of additional debt, the sale of assets and the payment of dividends and specify a maximum debt to capitalization ratio.
Failure to comply with the various restrictive and affirmative covenants of our revolving credit facilities could require us to pay debt balances prior to scheduled maturity and could negatively impact the Operating Companies’ ability to incur additional debt and/or our ability to pay distributions.
Covenants Related to Panhandle
Panhandle is not party to any lending agreement that would accelerate the maturity date of any obligation due to a failure to maintain any specific credit rating, nor would a reduction in any credit rating, by itself, cause an event of default under any of Panhandle’s lending agreements. Financial covenants exist in certain of Panhandle’s debt agreements that require Panhandle to maintain a certain level of net worth, to meet certain debt to total capitalization ratios and to meet certain ratios of earnings before depreciation, interest and taxes to cash interest expense. A failure by Panhandle to satisfy any such covenant would give rise to an event of default under the associated debt, which could become immediately due and payable if Panhandle did not cure such default within any permitted cure period or if Panhandle did not obtain amendments, consents or waivers from its lenders with respect to such covenants.
Panhandle’s restrictive covenants include restrictions on debt levels, restrictions on liens securing debt and guarantees, restrictions on mergers and on the sales of assets, capitalization requirements, dividend restrictions, cross default and cross-acceleration and prepayment of debt provisions. A breach of any of these covenants could result in acceleration of Panhandle’s debt and other financial obligations and that of its subsidiaries.
In addition, Panhandle and/or its subsidiaries are subject to certain additional restrictions and covenants. These restrictions and covenants include limitations on additional debt at some of its subsidiaries; limitations on the use of proceeds from borrowing at some of its subsidiaries; limitations, in some cases, on transactions with its affiliates; limitations on the incurrence of liens; potential limitations on the abilities of some of its subsidiaries to declare and pay dividends and potential limitations on some of its subsidiaries to participate in Panhandle’s cash management program; and limitations on Panhandle’s ability to prepay debt.
Covenants Related to Sunoco Logistics
Sunoco Logistics’
$1.50 billion
credit facility contains various covenants, including limitations on the creation of indebtedness and liens, and other covenants related to the operation and conduct of the business of Sunoco Logistics and its subsidiaries. The credit facility also limits Sunoco Logistics, on a rolling four-quarter basis, to a maximum total consolidated debt to consolidated Adjusted EBITDA ratio, as defined in the underlying credit agreement, of
5.0
to
1
, which can generally be increased to
5.5
to
1
during an acquisition period. Sunoco Logistics’ ratio of total consolidated debt, excluding net unamortized
S - 42
fair value adjustments, to consolidated Adjusted EBITDA was
3.7
to
1
at
December 31, 2014
, as calculated in accordance with the credit agreements.
The West Texas Gulf Pipeline Company’s
$35 million
credit facility limits West Texas Gulf, on a rolling four-quarter basis, to a minimum fixed charge coverage ratio of
1.00
to
1
. In addition, the credit facility limits West Texas Gulf to a maximum leverage ratio of
2.00
to
1
. West Texas Gulf’s fixed charge coverage ratio and leverage ratio were
1.67
to
1
and
0.85
to
1
, respectively, at
December 31, 2014
.
Covenants Related to Sunoco LP
The Sunoco LP Credit Facility requires Sunoco LP to maintain a leverage ratio of not more than
5.50
to
1
. The maximum leverage ratio is subject to upwards adjustment of not more than
6.00
to
1
for a period not to exceed three fiscal quarters in the event Sunoco LP engages in an acquisition of assets, equity interests, operating lines or divisions by Sunoco LP, a subsidiary, an unrestricted subsidiary or a joint venture for a purchase price of not less than
$50 million
. Indebtedness under the Sunoco LP Credit Facility is secured by a security interest in, among other things, all of the Sunoco LP’s present and future personal property and all of the present and future personal property of its guarantors, the capital stock of its material subsidiaries (or
66%
of the capital stock of material foreign subsidiaries), and any intercompany debt. Upon the first achievement by Sunoco LP of an investment grade credit rating, all security interests securing the Sunoco LP Credit Facility will be released.
We were in compliance with all requirements, tests, limitations, and covenants related to our debt agreements as of
December 31, 2014
.
|
7.
|
REDEEMABLE NONCONTROLLING INTERESTS:
|
The noncontrolling interest holders in one of Sunoco Logistics’ consolidated subsidiaries have the option to sell their interests to Sunoco Logistics. In accordance with applicable accounting guidance, the noncontrolling interest is excluded from total equity and reflected as redeemable interest on ETP’s consolidated balance sheet as of
December 31, 2014
.
|
8.
|
EQUITY:
|
Limited Partner interests are represented by Common, Class E Units, Class G Units and Class H Units that entitle the holders thereof to the rights and privileges specified in the Partnership Agreement. As of
December 31, 2014
, there were issued and outstanding
355.5 million
Common Units representing an aggregate
99.3%
Limited Partner interest in us. A total of
8.9 million
Class E Units and
90.7 million
Class G Units are outstanding and are reported as treasury units, which units are entitled to receive distributions in accordance with their terms. A total of
50.2 million
Class H Units are also outstanding representing Limited Partner interests owned by ETE Holdings (see “Class H Units” below).
No person is entitled to preemptive rights in respect of issuances of equity securities by us, except that ETP GP has the right, in connection with the issuance of any equity security by us, to purchase equity securities on the same terms as equity securities are issued to third parties sufficient to enable ETP GP and its affiliates to maintain the aggregate percentage equity interest in us as ETP GP and its affiliates owned immediately prior to such issuance.
IDRs represent the contractual right to receive an increasing percentage of quarterly distributions of Available Cash (as defined in our Partnership Agreement) from operating surplus after the minimum quarterly distribution has been paid. Please read “Quarterly Distributions of Available Cash” below. ETP GP, a wholly-owned subsidiary of ETE, owns all of the IDRs.
S - 43
Common Units
The change in Common Units was as follows:
|
Years Ended December 31,
|
||||||||
|
2014
|
2013
|
2012
|
||||||
|
Number of Common Units, beginning of period
|
333.8
|
|
301.5
|
|
225.5
|
|
||
|
Common Units issued in connection with the Susser Merger (see Note 3)
|
15.8
|
|
—
|
|
—
|
|
||
|
Common Units redeemed in connection with the Lake Charles LNG Transaction (see Note 3)
|
(18.7
|
)
|
—
|
|
—
|
|
||
|
Common Units issued in connection with public offerings
|
—
|
|
13.8
|
|
15.5
|
|
||
|
Common Units issued in connection with certain acquisitions
|
—
|
|
49.5
|
|
57.4
|
|
||
|
Common Units redeemed for Class H Units
|
—
|
|
(50.2
|
)
|
—
|
|
||
|
Common Units issued in connection with the Distribution Reinvestment Plan
|
2.8
|
|
2.3
|
|
1.0
|
|
||
|
Common Units issued in connection with Equity Distribution Agreements
|
21.4
|
|
16.9
|
|
1.6
|
|
||
|
Repurchases of Common Units in open-market transactions
|
—
|
|
(0.4
|
)
|
—
|
|
||
|
Issuance of Common Units under equity incentive plans
|
0.4
|
|
0.4
|
|
0.5
|
|
||
|
Number of Common Units, end of period
|
355.5
|
|
333.8
|
|
301.5
|
|
||
Our Common Units are registered under the Securities Exchange Act of 1934 (as amended) and are listed for trading on the NYSE. Each holder of a Common Unit is entitled to one vote per unit on all matters presented to the Limited Partners for a vote. In addition, if at any time any person or group (other than our General Partner and its affiliates) owns beneficially 20% or more of all Common Units, any Common Units owned by that person or group may not be voted on any matter and are not considered to be outstanding when sending notices of a meeting of Unitholders (unless otherwise required by law), calculating required votes, determining the presence of a quorum or for other similar purposes under the Partnership Agreement. The Common Units are entitled to distributions of Available Cash as described below under “Quarterly Distributions of Available Cash.”
Public Offerings
The following table summarizes our public offerings of Common Units during the periods presented, all of which have been registered under the Securities Act of 1933 (as amended):
|
Date
|
Number of Common Units
|
Price per Unit
|
Net Proceeds
|
||||||||
|
July 2012
|
15.5
|
|
$
|
44.57
|
|
$
|
671
|
|
|||
|
April 2013
|
13.8
|
|
48.05
|
|
657
|
|
|||||
Proceeds from the offerings listed above were used to repay amounts outstanding under the ETP Credit Facility and/or to fund capital expenditures and capital contributions to joint ventures, and for general partnership purposes.
Equity Distribution Program
From time to time, we have sold Common Units through an equity distribution agreement. Such sales of Common Units are made by means of ordinary brokers’ transactions on the NYSE at market prices, in block transactions or as otherwise agreed between us and the sales agent which is the counterparty to the equity distribution agreement.
In January 2013 and May 2013, we entered into equity distribution agreements pursuant to which we may sell from time to time Common Units having aggregate offering prices of up to
$200 million
and
$800 million
, respectively. During the year ended
December 31, 2014
, we issued approximately
2.7 million
units for
$144 million
, net of commissions of
$2 million
. No amounts of our Common Units remain available to be issued under our January 2013 and May 2013 equity distribution agreements.
In May 2014 and November 2014, we entered into equity distribution agreements pursuant to which we may sell from time to time Common Units having aggregate offering prices of up to
$1.0 billion
and
$1.50 billion
, respectively. During the year
S - 44
ended
December 31, 2014
, we issued approximately
18.8 million
units for
$1.08 billion
, net of commissions of
$11 million
. As of
December 31, 2014
, approximately
$1.41 billion
of our Common Units remained available to be issued under our currently effective equity distribution agreements.
Equity Incentive Plan Activity
As discussed in
Note 9
, we issue Common Units to employees and directors upon vesting of awards granted under our equity incentive plans. Upon vesting, participants in the equity incentive plans may elect to have a portion of the Common Units to which they are entitled withheld by the Partnership to satisfy tax-withholding obligations.
Distribution Reinvestment Program
Our Distribution Reinvestment Plan (the “DRIP”) provides Unitholders of record and beneficial owners of our Common Units a voluntary means by which they can increase the number of ETP Common Units they own by reinvesting the quarterly cash distributions they would otherwise receive in the purchase of additional Common Units.
During the years ended
December 31, 2014
,
2013
and
2012
, aggregate distributions of approximately
$155 million
,
$109 million
, and
$43 million
, respectively, were reinvested under the DRIP resulting in the issuance in aggregate of approximately
6.1 million
Common Units.
As of
December 31, 2014
, a total of
7.3 million
Common Units remain available to be issued under the existing registration statement.
Class E Units
The Class E Units are entitled to aggregate cash distributions equal to
11.1%
of the total amount of cash distributed to all Unitholders, including the Class E Unitholders, up to
$1.41
per unit per year, with any excess thereof available for distribution to Unitholders other than the holders of Class E Units in proportion to their respective interests. The Class E Units are treated as treasury units for accounting purposes because they are owned by a subsidiary of ETP Holdco, Heritage Holdings, Inc. Although no plans are currently in place, management may evaluate whether to retire some or all of the Class E Units at a future date. All of the
8.9 million
Class E Units outstanding are held by a subsidiary and are reported as treasury units.
Class G Units
In conjunction with the Sunoco Merger, we amended our partnership agreement to create Class F Units. The number of Class F Units issued was determined at the closing of the Sunoco Merger and equaled
90.7 million
, which included
40 million
Class F Units issued in exchange for cash contributed by Sunoco, Inc. to us immediately prior to or concurrent with the closing of the Sunoco Merger. The Class F Units generally did not have any voting rights. The Class F Units were entitled to aggregate cash distributions equal to
35%
of the total amount of cash generated by us and our subsidiaries, other than ETP Holdco, and available for distribution, up to a maximum of
$3.75
per Class F Unit per year. In April 2013, all of the outstanding Class F Units were exchanged for Class G Units on a one-for-one basis. The Class G Units have terms that are substantially the same as the Class F Units, with the principal difference between the Class G Units and the Class F Units being that allocations of depreciation and amortization to the Class G Units for tax purposes are based on a predetermined percentage and are not contingent on whether ETP has net income or loss. These units are held by a subsidiary and therefore are reflected as treasury units in the consolidated financial statements.
Class H Units and Class I Units
Currently Outstanding
Pursuant to an Exchange and Redemption Agreement previously entered into between ETP, ETE and ETE Holdings, ETP redeemed and cancelled
50.2 million
of its Common Units representing limited partner interests (the “Redeemed Units”) owned by ETE Holdings on October 31, 2013 in exchange for the issuance by ETP to ETE Holdings of a new class of limited partner interest in ETP (the “Class H Units”), which are generally entitled to (i) allocations of profits, losses and other items from ETP corresponding to
50.05%
of the profits, losses, and other items allocated to ETP by Sunoco Partners with respect to the IDRs and general partner interest in Sunoco Logistics held by Sunoco Partners and (ii) distributions from available cash at ETP for each quarter equal to
50.05%
of the cash distributed to ETP by Sunoco Partners with respect to the IDRs and general partner interest in Sunoco Logistics held by Sunoco Partners for such quarter and, to the extent not previously distributed to holders of the Class H Units, for any previous quarters.
S - 45
Pending Transaction
In December 2014, ETP and ETE announced the final terms of a transaction, whereby ETE will transfer
30.8 million
ETP Common Units, ETE’s
45%
interest in the Bakken pipeline project, and
$879 million
in cash in exchange for
30.8 million
newly issued Class H Units of ETP that, when combined with the
50.2 million
previously issued Class H Units, generally entitle ETE to receive
90.05%
of the cash distributions and other economic attributes of the general partner interest and IDRs of Sunoco Logistics (the “Bakken Pipeline Transaction”). In connection with this transaction, ETP will also issue
100
Class I Units, as described below. In addition, ETE and ETP agreed to reduce the IDR subsidies that ETE previously agreed to provide to ETP, with such reductions occurring in 2015 and 2016.
In connection with the transaction, ETP will also issue
100
Class I Units. The Class I Units will be generally entitled to: (i) pro rata allocations of gross income or gain until the aggregate amount of such items allocated to the holders of the Class I Units for the current taxable period and all previous taxable periods is equal to the cumulative amount of all distributions made to the holders of the Class I Units and (ii) after making cash distributions to Class H Units, any additional available cash deemed to be either operating surplus or capital surplus with respect to any quarter will be distributed to the Class I Units in an amount equal to the excess of the distribution amount set forth in our Partnership Agreement, as amended, (the “Partnership Agreement”) for such quarter over the cumulative amount of available cash previously distributed commencing with the quarter ending March 31, 2015 until the quarter ending December 31, 2016. The impact of (i) the IDR subsidy adjustments and (ii) the Class I Unit distributions, along with the currently effective IDR subsidies, is included in the table below under “Quarterly Distributions of Available Cash” in the column titled “Pro Forma for Class H and Class I Units.”
Sales of Common Units by Subsidiaries
With respect to our investments in Sunoco Logistics and Sunoco LP, we account for the difference between the carrying amount of our investment in and the underlying book value arising from the issuance or redemption of units by the respective subsidiary (excluding transactions with us) as capital transactions.
As a result of Sunoco Logistics’ issuances of commo
n units during the year ended
December 31, 2014
, we recognized increases in partners’ capital
of
$113 million
.
As a result of Sunoco LP’s issuances of commo
n units during the year ended
December 31, 2014
, we recognized increases in partners’ capital
of
$62 million
.
Sales of Common Units by Sunoco Logistics
In 2014, Sunoco Logistics entered into equity distribution agreements pursuant to which Sunoco Logistics may sell from time to time common units having aggregate offering prices of up to
$1.25 billion
. During the
year ended
ended
December 31, 2014
, Sunoco Logistics received proceeds of
$477 million
, net of commissions of
$5 million
, from the issuance of
10.3 million
common units pursuant to the equity distribution agreement, which were used for general partnership purposes.
Additionally, Sunoco Logistics completed an overnight public offering of
7.7 million
common units for net proceeds of
$362 million
in September 2014. The net proceeds from this offering were used to repay outstanding borrowings under the
$1.50 billion
Sunoco Logistics Credit Facility and for general partnership purposes.
Sales of Common Units by Sunoco LP
In October 2014 and November 2014, Sunoco LP issued an aggregate total of
9.1 million
common units in an underwritten public offering. Aggregate net proceeds of
$405 million
from the offering were used to repay amounts outstanding under the
$1.25 billion
Sunoco LP Credit Facility and for general partnership purposes.
Quarterly Distributions of Available Cash
The Partnership Agreement requires that we distribute all of our Available Cash to our Unitholders and our General Partner within forty-five days following the end of each fiscal quarter, subject to the payment of incentive distributions to the holders of IDRs to the extent that certain target levels of cash distributions are achieved. The term Available Cash generally means, with respect to any of our fiscal quarters, all cash on hand at the end of such quarter, plus working capital borrowings after the end of the quarter, less reserves established by the General Partner in its sole discretion to provide for the proper conduct of our business, to comply with applicable laws or any debt instrument or other agreement, or to provide funds for future distributions to partners with respect to any one or more of the next four quarters. Available Cash is more fully defined in our Partnership Agreement.
S - 46
Our distributions of Available Cash from operating surplus, excluding incentive distributions, to our General Partner and Limited Partner interests are based on their respective interests as of the distribution record date. Incentive distributions allocated to our General Partner are determined based on the amount by which quarterly distribution to common Unitholders exceed certain specified target levels, as set forth in our Partnership Agreement.
Distributions declared during the periods presented were as follows:
|
Quarter Ended
|
Record Date
|
|
Payment Date
|
Rate
|
||||
|
December 31, 2011
|
February 7, 2012
|
February 14, 2012
|
$
|
0.8938
|
|
|||
|
March 31, 2012
|
May 4, 2012
|
May 15, 2012
|
0.8938
|
|
||||
|
June 30, 2012
|
August 6, 2012
|
August 14, 2012
|
0.8938
|
|
||||
|
September 30, 2012
|
November 6, 2012
|
November 14, 2012
|
0.8938
|
|
||||
|
December 31, 2012
|
February 7, 2013
|
February 14, 2013
|
0.8938
|
|
||||
|
March 31, 2013
|
May 6, 2013
|
May 15, 2013
|
0.8938
|
|
||||
|
June 30, 2013
|
August 5, 2013
|
August 14, 2013
|
0.8938
|
|
||||
|
September 30, 2013
|
November 4, 2013
|
November 14, 2013
|
0.9050
|
|
||||
|
December 31, 2013
|
February 7, 2014
|
February 14, 2014
|
0.9200
|
|
||||
|
March 31, 2014
|
May 5, 2014
|
May 15, 2014
|
0.9350
|
|
||||
|
June 30, 2014
|
August 4, 2014
|
August 14, 2014
|
0.9550
|
|
||||
|
September 30, 2014
|
November 3, 2014
|
November 14, 2014
|
0.9750
|
|
||||
|
December 31, 2014
|
February 6, 2015
|
February 13, 2015
|
0.9950
|
|
||||
In connection with transactions between ETP and ETE, ETE has agreed to relinquish its right to certain incentive distributions in future periods. Following is a summary of the net reduction in total distributions that would potentially be made to ETE in future periods based on (i) the currently effective partnership agreement provisions, (ii) the assumed closing of the issuance of additional Class H Units and Class I Units, which is expected to occur in March 2015, and (iii) the assumed closing of the Regency Merger, which is expected to occur in the second quarter of 2015:
|
Years Ending December 31,
|
Currently Effective
|
Pro Forma for Class H and Class I Units
(1)
|
Pro Forma for Regency Merger
(2)
|
|||||||||
|
2015
|
$
|
86
|
|
$
|
31
|
|
$
|
91
|
|
|||
|
2016
|
107
|
|
77
|
|
142
|
|
||||||
|
2017
|
85
|
|
85
|
|
145
|
|
||||||
|
2018
|
80
|
|
80
|
|
140
|
|
||||||
|
2019
|
70
|
|
70
|
|
130
|
|
||||||
|
2020
|
35
|
|
35
|
|
50
|
|
||||||
|
2021
|
35
|
|
35
|
|
35
|
|
||||||
|
2022
|
35
|
|
35
|
|
35
|
|
||||||
|
2023
|
35
|
|
35
|
|
35
|
|
||||||
|
2024
|
18
|
|
18
|
|
18
|
|
||||||
|
(1)
|
Pro forma amounts reflect the IDR subsidies, as adjusted for the pending issuance of additional Class H Units and Class I Units discussed above, as well as distributions on the Class I Units. The issuance of additional Class H Units and Class I Units is expected to close in March 2015.
|
|
(2)
|
Pro forma amounts reflect the IDR subsidies, as adjusted for (i) the pending issuance of additional Class H Units and Class I Units (as described in Note (1) above) and (ii) the pending Regency Merger. Amounts reflected above assume that the Regency Merger is closed subsequent to the record date for the first quarter of 2015 distribution payment and prior to the record date for the second quarter 2015 distribution payment.
|
The amounts reflected above include the relinquishment of
$350 million
in the aggregate of incentive distributions that would potentially be made to ETE over the first forty fiscal quarters commencing immediately after the consummation of the Susser
S - 47
Merger. Such relinquishments would cease upon the agreement of an exchange of the Sunoco LP
general partner interest and the incentive distribution rights between ETE and ETP.
Sunoco Logistics Quarterly Distributions of Available Cash
Distributions declared during the periods presented were as follows:
|
Quarter Ended
|
Record Date
|
Payment Date
|
Rate
|
|||||
|
December 31, 2012
|
February 8, 2013
|
February 14, 2013
|
$
|
0.2725
|
|
|||
|
March 31, 2013
|
May 9, 2013
|
May 15, 2013
|
0.2863
|
|
||||
|
June 30, 2013
|
August 8, 2013
|
August 14, 2013
|
0.3000
|
|
||||
|
September 30, 2013
|
November 8, 2013
|
November 14, 2013
|
0.3150
|
|
||||
|
December 31, 2013
|
|
February 10, 2014
|
February 14, 2014
|
0.3312
|
|
|||
|
March 31, 2014
|
May 9, 2014
|
May 15, 2014
|
0.3475
|
|
||||
|
June 30, 2014
|
August 8, 2014
|
August 14, 2014
|
0.3650
|
|
||||
|
September 30, 2014
|
November 7, 2014
|
November 14, 2014
|
0.3825
|
|
||||
|
December 31, 2014
|
February 9, 2015
|
February 13, 2015
|
0.4000
|
|
||||
Sunoco Logistics Unit Split
On May 5, 2014, Sunoco Logistics’ board of directors declared a two-for-one split of Sunoco Logistics common units. The unit split resulted in the issuance of one additional Sunoco Logistics common unit for every one unit owned as of the close of business on June 5, 2014. The unit split was effective June 12, 2014. All Sunoco Logistics unit and per unit information included in this report is presented on a post-split basis.
Sunoco LP Quarterly Distributions of Available Cash
Distributions declared by Sunoco LP subsequent to our acquisition on August 29, 2014 were as follows:
|
Quarter Ended
|
Record Date
|
Payment Date
|
Rate
|
|||||
|
September 30, 2014
|
November 18, 2014
|
November 28, 2014
|
$
|
0.5457
|
|
|||
|
December 31, 2014
|
February 17, 2015
|
February 27, 2015
|
0.6000
|
|
||||
Accumulated Other Comprehensive Income (Loss)
The following table presents the components of AOCI, net of tax:
|
December 31,
|
|||||||
|
2014
|
2013
|
||||||
|
Available-for-sale securities
|
$
|
3
|
|
$
|
2
|
|
|
|
Foreign currency translation adjustment
|
(3
|
)
|
(1
|
)
|
|||
|
Net loss on commodity related hedges
|
(1
|
)
|
(4
|
)
|
|||
|
Actuarial gain (loss) related to pensions and other postretirement benefits
|
(57
|
)
|
56
|
|
|||
|
Investments in unconsolidated affiliates, net
|
2
|
|
8
|
|
|||
|
Total AOCI, net of tax
|
$
|
(56
|
)
|
$
|
61
|
|
|
S - 48
The tables below set forth the tax amounts included in the respective components of other comprehensive income (loss) for the periods presented:
|
December 31,
|
|||||||
|
2014
|
2013
|
||||||
|
Available-for-sale securities
|
$
|
(1
|
)
|
$
|
(1
|
)
|
|
|
Foreign currency translation adjustment
|
2
|
|
1
|
|
|||
|
Actuarial gain relating to pension and other postretirement benefits
|
(37
|
)
|
(39
|
)
|
|||
|
Total
|
$
|
(36
|
)
|
$
|
(39
|
)
|
|
|
9.
|
UNIT-BASED COMPENSATION PLANS:
|
ETP Unit-Based Compensation Plan
We have issued equity incentive plans for employees, officers and directors, which provide for various types of awards, including options to purchase ETP Common Units, restricted units, phantom units, Common Units, distribution equivalent rights (“DERs”), Common Unit appreciation rights, and other unit-based awards. As of
December 31, 2014
, an aggregate total of
5.4 million
ETP Common Units remain available to be awarded under our equity incentive plans.
Restricted Units
We have granted restricted unit awards to employees that vest over a specified time period, typically a
five
-year service vesting requirement, with vesting based on continued employment as of each applicable vesting date. Upon vesting, ETP Common Units are issued. These unit awards entitle the recipients of the unit awards to receive, with respect to each Common Unit subject to such award that has not either vested or been forfeited, a cash payment equal to each cash distribution per Common Unit made by us on our Common Units promptly following each such distribution by us to our Unitholders. We refer to these rights as “distribution equivalent rights.” Under our equity incentive plans, our non-employee directors each receive grants with a
five
-year service vesting requirement.
The following table shows the activity of the awards granted to employees and non-employee directors:
|
Number of Units
|
Weighted Average Grant-Date Fair Value Per Unit
|
|||||
|
Unvested awards as of December 31, 2013
|
3.2
|
|
$
|
49.65
|
|
|
|
Awards granted
|
1.0
|
|
60.85
|
|
||
|
Awards vested
|
(0.5
|
)
|
48.12
|
|
||
|
Awards forfeited
|
(0.1
|
)
|
32.36
|
|
||
|
Unvested awards as of December 31, 2014
|
3.6
|
|
53.83
|
|
||
During the years ended
December 31, 2014, 2013 and 2012
, the weighted average grant-date fair value per unit award granted was
$60.85
,
$50.54
and
$43.93
, respectively. The total fair value of awards vested was
$26 million
,
$29 million
and
$29 million
, respectively, based on the market price of ETP Common Units as of the vesting date. As of
December 31, 2014
, a total of
3.6 million
unit awards remain unvested, for which ETP expects to recognize a total of
$128 million
in compensation expense over a weighted average period of
2.0 years
.
Cash Restricted Units.
The Partnership has also granted cash restricted units, which vest 100% at the end of the third year of service. A cash restricted unit entitles the award recipient to receive cash equal to the market value of one ETP Common Unit upon vesting.
As of
December 31, 2014
, a total of
0.4 million
unvested cash restricted units were outstanding.
Based on the trading price of ETP Common Units at
December 31, 2014
, the Partnership expects to recognize
$24 million
of unit-based compensation expense related to non-vested cash restricted units over a period of
1.8 years
.
S - 49
Sunoco Logistics Unit-Based Compensation Plan
Sunoco Logistics’ general partner has a long-term incentive plan for employees and directors, which permits the grant of restricted units and unit options of Sunoco Logistics covering an additional
0.7 million
Sunoco Logistics common units. As of
December 31, 2014
, a total of
1.5 million
Sunoco Logistics restricted units were outstanding for which Sunoco Logistics expects to recognize
$33 million
of expense over a weighted average period of
2.9 years
.
|
10.
|
INCOME TAXES:
|
As a partnership, we are not subject to U.S. federal income tax and most state income taxes. However, the Partnership conducts certain activities through corporate subsidiaries which are subject to federal and state income taxes. The components of the federal and state income tax expense (benefit) are summarized as follows:
|
Years Ended December 31,
|
|||||||||||
|
2014
|
2013
|
2012
|
|||||||||
|
Current expense (benefit):
|
|||||||||||
|
Federal
|
$
|
321
|
|
$
|
51
|
|
$
|
(3
|
)
|
||
|
State
|
81
|
|
(2
|
)
|
4
|
|
|||||
|
Total
|
402
|
|
49
|
|
1
|
|
|||||
|
Deferred expense (benefit):
|
|||||||||||
|
Federal
|
(50
|
)
|
(6
|
)
|
45
|
|
|||||
|
State
|
3
|
|
54
|
|
17
|
|
|||||
|
Total
|
(47
|
)
|
48
|
|
62
|
|
|||||
|
Total income tax expense from continuing operations
|
$
|
355
|
|
$
|
97
|
|
$
|
63
|
|
||
Historically, our effective rate differed from the statutory rate primarily due to Partnership earnings that are not subject to U.S. federal and most state income taxes at the Partnership level. The completion of the Southern Union Merger, Sunoco Merger, ETP Holdco Transaction and Susser Merger (see
Note 3
) significantly increased the activities conducted through corporate subsidiaries. A reconciliation of income tax expense (benefit) at the U.S. statutory rate to the income tax expense (benefit) attributable to continuing operations for the years ended
December 31, 2014
and
2013
is as follows:
|
December 31, 2014
|
December 31, 2013
|
||||||||||||||||||||||
|
Corporate Subsidiaries
(1)
|
Partnership
(2)
|
Consolidated
|
Corporate Subsidiaries
(1)
|
Partnership
(2)
|
Consolidated
|
||||||||||||||||||
|
Income tax expense (benefit) at U.S. statutory rate of 35 percent
|
$
|
217
|
|
|
$
|
—
|
|
$
|
217
|
|
$
|
(166
|
)
|
|
$
|
—
|
|
$
|
(166
|
)
|
|||
|
Increase (reduction) in income taxes resulting from:
|
|
|
|
||||||||||||||||||||
|
Nondeductible goodwill
|
—
|
|
|
—
|
|
—
|
|
241
|
|
—
|
|
241
|
|
||||||||||
|
Nondeductible goodwill included in the Lake Charles LNG Transaction
|
105
|
|
—
|
|
105
|
|
—
|
|
|
—
|
|
—
|
|
||||||||||
|
State income taxes (net of federal income tax effects)
|
9
|
|
|
42
|
|
51
|
|
31
|
|
|
5
|
|
36
|
|
|||||||||
|
Premium on debt retirement
|
(10
|
)
|
—
|
|
(10
|
)
|
—
|
|
—
|
|
—
|
|
|||||||||||
|
Foreign
|
(8
|
)
|
—
|
|
(8
|
)
|
—
|
|
—
|
|
—
|
|
|||||||||||
|
Other
|
—
|
|
|
—
|
|
—
|
|
(13
|
)
|
|
(1
|
)
|
(14
|
)
|
|||||||||
|
Income tax from continuing operations
|
$
|
313
|
|
|
$
|
42
|
|
$
|
355
|
|
$
|
93
|
|
$
|
4
|
|
$
|
97
|
|
||||
|
(1)
|
Includes ETP Holdco, Susser, Oasis Pipeline Company, Susser Petroleum Property Company LLC, Aloha Petroleum Ltd., Inland Corporation, Mid-Valley Pipeline Company and West Texas Gulf Pipeline Company. ETP Holdco, which was formed via the Sunoco Merger and the ETP Holdco Transaction (see
Note 3
), includes Sunoco, Inc. and Panhandle. ETE held a 60% interest in ETP Holdco until April 30, 2013. Subsequent to the ETP Holdco Acquisition (see
Note 3
) on April 30, 2013, ETP owns 100% of ETP Holdco.
|
|
(2)
|
Includes ETP and its subsidiaries that are classified as pass-through entities for federal income tax purposes.
|
S - 50
Deferred taxes result from the temporary differences between financial reporting carrying amounts and the tax basis of existing assets and liabilities. The table below summarizes the principal components of the deferred tax assets (liabilities) as follows:
|
December 31,
|
|||||||
|
2014
|
2013
|
||||||
|
Deferred income tax assets:
|
|||||||
|
Net operating losses and alternative minimum tax credit
|
$
|
116
|
|
$
|
217
|
|
|
|
Pension and other postretirement benefits
|
47
|
|
57
|
|
|||
|
Long term debt
|
53
|
|
108
|
|
|||
|
Other
|
111
|
|
104
|
|
|||
|
Total deferred income tax assets
|
327
|
|
486
|
|
|||
|
Valuation allowance
|
(84
|
)
|
(74
|
)
|
|||
|
Net deferred income tax assets
|
$
|
243
|
|
$
|
412
|
|
|
|
Deferred income tax liabilities:
|
|||||||
|
Properties, plants and equipment
|
$
|
(1,486
|
)
|
$
|
(1,522
|
)
|
|
|
Inventory
|
(153
|
)
|
(302
|
)
|
|||
|
Investment in unconsolidated affiliates
|
(2,528
|
)
|
(2,244
|
)
|
|||
|
Trademarks
|
(355
|
)
|
(180
|
)
|
|||
|
Other
|
(32
|
)
|
(45
|
)
|
|||
|
Total deferred income tax liabilities
|
(4,554
|
)
|
(4,293
|
)
|
|||
|
Net deferred income tax liability
|
(4,311
|
)
|
(3,881
|
)
|
|||
|
Less: current portion of deferred income tax liabilities, net
|
(85
|
)
|
(119
|
)
|
|||
|
Accumulated deferred income taxes
|
$
|
(4,226
|
)
|
$
|
(3,762
|
)
|
|
The completion of the Southern Union Merger, Sunoco Merger, ETP Holdco Transaction and Susser Merger (see
Note 3
) significantly increased the deferred tax assets (liabilities). The table below provides a rollforward of the net deferred income tax liability as follows:
|
December 31,
|
|||||||
|
2014
|
2013
|
||||||
|
Net deferred income tax liability, beginning of year
|
$
|
(3,881
|
)
|
$
|
(3,606
|
)
|
|
|
Susser acquisition
|
(488
|
)
|
—
|
|
|||
|
SUGS Contribution to Regency
|
—
|
|
(115
|
)
|
|||
|
Tax provision (including discontinued operations)
|
58
|
|
(111
|
)
|
|||
|
Other
|
—
|
|
(49
|
)
|
|||
|
Net deferred income tax liability
|
$
|
(4,311
|
)
|
$
|
(3,881
|
)
|
|
ETP Holdco, Susser and other corporate subsidiaries have gross federal net operating loss carryforwards of
$5 million
, all of which will expire in
2032
and
2033
. Our corporate subsidiaries had
less than $1 million
of federal alternative minimum tax credits at
December 31, 2014
. Our corporate subsidiaries have state net operating loss carryforward benefits of
$111 million
, net of federal tax, which expire between
2014
and
2033
. The valuation allowance of
$84 million
is applicable to the state net operating loss carryforward benefits applicable to Sunoco, Inc. pre-acquisition periods.
S - 51
The following table sets forth the changes in unrecognized tax benefits:
|
Years Ended December 31,
|
|||||||||||
|
2014
|
2013
|
2012
|
|||||||||
|
Balance at beginning of year
|
$
|
429
|
|
$
|
27
|
|
$
|
2
|
|
||
|
Additions attributable to acquisitions
|
—
|
|
—
|
|
28
|
|
|||||
|
Additions attributable to tax positions taken in the current year
|
20
|
|
—
|
|
—
|
|
|||||
|
Additions attributable to tax positions taken in prior years
|
(1
|
)
|
406
|
|
—
|
|
|||||
|
Settlements
|
(5
|
)
|
—
|
|
—
|
|
|||||
|
Lapse of statute
|
(3
|
)
|
(4
|
)
|
(3
|
)
|
|||||
|
Balance at end of year
|
$
|
440
|
|
$
|
429
|
|
$
|
27
|
|
||
As of
December 31, 2014
, we have
$439 million
(
$425 million
after federal income tax benefits) related to tax positions which, if recognized, would impact our effective tax rate. We believe it is reasonably possible that its unrecognized tax benefits may be reduced by
$4 million
(
$2 million
, net of federal tax) within the next twelve months due to settlement of certain positions.
Sunoco, Inc. has historically included certain government incentive payments as taxable income on its federal and state income tax returns. In connection with Sunoco, Inc.’s
2004
through
2011
open statute years, Sunoco, Inc. has proposed to the IRS that these government incentive payments be excluded from federal taxable income. If Sunoco, Inc. is fully successful with its claims, it will receive tax refunds of approximately
$372 million
. However, due to the uncertainty surrounding the claims, a reserve of
$372 million
was established for the full amount of the claims. Due to the timing of the expected settlement of the claims and the related reserve, the receivable and the reserve for this issue have been netted in the financial statements as of
December 31, 2014
.
Our policy is to accrue interest expense and penalties on income tax underpayments (overpayments) as a component of income tax expense. During
2014
, we recognized interest and penalties of
less than $1 million
. At
December 31, 2014
, we have interest and penalties accrued of
$6 million
, net of tax.
In general, ETP and its subsidiaries are no longer subject to examination by the IRS for the 2010 and prior tax years. However, Sunoco, Inc. and its subsidiaries are no longer subject to examination by the IRS for tax years prior to 2007 and Southern Union and its subsidiaries are no longer subject to examination by the IRS for tax years prior to 2004.
Sunoco, Inc. has been examined by the IRS for tax years through 2012. However, statutes remain open for tax years 2007 and forward due to carryback of net operating losses and/or claims regarding government incentive payments discussed above. All other issues are resolved. Though we believe the tax years are closed by statute, tax years 2004 through 2006 are impacted by the carryback of net operating losses and under certain circumstances may be impacted by adjustments for government incentive payments. Southern Union is under examination for the tax years 2004 through 2009. As of
December 31, 2014
, the IRS has proposed only one adjustment for the years under examination. For the 2006 tax year, the IRS is challenging
$545 million
of the
$690 million
of deferred gain associated with a like kind exchange involving certain assets of its distribution operations and its gathering and processing operations. We have vigorously defended this tax position and believe we have reached a tentative settlement with the IRS which will not have a material impact on our consolidated financial position or results of operations.
ETP and its subsidiaries also have various state and local income tax returns in the process of examination or administrative appeal in various jurisdictions. We believe the appropriate accruals or unrecognized tax benefits have been recorded for any potential assessment with respect to these examinations.
|
11.
|
REGULATORY MATTERS, COMMITMENTS, CONTINGENCIES AND ENVIRONMENTAL LIABILITIES:
|
Contingent Matters Potentially Impacting the Partnership from Our Investment in Citrus
Florida Gas Pipeline Relocation Costs.
The Florida Department of Transportation, Florida’s Turnpike Enterprise (“FDOT/FTE”) has various turnpike/State Road 91 widening projects that have impacted or may, over time, impact one or more of FGTs’ mainline pipelines located in FDOT/FTE rights-of-way. Certain FDOT/FTE projects have been or are the subject of litigation in Broward County, Florida. On November 16, 2012, FDOT paid to FGT the sum of approximately
$100 million
, representing the amount of the judgment, plus interest, in a case tried in 2011.
S - 52
On April 14, 2011, FGT filed suit against the FDOT/FTE and other defendants in Broward County, Florida seeking an injunction and damages as the result of the construction of a mechanically stabilized earth wall and other encroachments in FGT easements as part of FDOT/FTE’s I-595 project. On August 21, 2013, FGT and FDOT/FTE entered into a settlement agreement pursuant to which, among other things, FDOT/FTE paid FGT approximately
$19 million
in September 2013 in settlement of FGT’s claims with respect to the I-595 project. The settlement agreement also provided for agreed easement widths for FDOT/FTE right-of-way and for cost sharing between FGT and FDOT/FTE for any future relocations. Also in September 2013, FDOT/FTE paid FGT an additional approximate
$1 million
for costs related to the aforementioned turnpike/State Road 91 case tried in 2011.
FGT will continue to seek rate recovery in the future for these types of costs to the extent not reimbursed by the FDOT/FTE. There can be no assurance that FGT will be successful in obtaining complete reimbursement for any such relocation costs from the FDOT/FTE or from its customers or that the timing of such reimbursement will fully compensate FGT for its costs.
Contingent Residual Support Agreement – AmeriGas
In connection with the closing of the contribution of its propane operations in January 2012, ETP agreed to provide contingent, residual support of
$1.55 billion
of intercompany borrowings made by AmeriGas and certain of its affiliates with maturities through 2022 from a finance subsidiary of AmeriGas that have maturity dates and repayment terms that mirror those of an equal principal amount of senior notes issued by this finance company subsidiary to third party purchases.
PEPL Holdings Guarantee of Collection
In connection with the SUGS Contribution, Regency issued
$600 million
of
4.50%
senior notes due 2023
(the “Regency Debt”), the proceeds of which were used by Regency to fund the cash portion of the consideration, as adjusted, and pay certain other expenses or disbursements directly related to the closing of the SUGS Contribution. In connection with the closing of the SUGS Contribution on April 30, 2013, Regency entered into an agreement with PEPL Holdings, a subsidiary of Southern Union, pursuant to which PEPL Holdings provided a guarantee of collection (on a nonrecourse basis to Southern Union) to Regency and Regency Energy Finance Corp. with respect to the payment of the principal amount of the Regency Debt through maturity in 2023. In connection with the completion of the Panhandle Merger, in which PEPL Holdings was merged with and into Panhandle, the guarantee of collection for the Regency Debt was assumed by Panhandle.
NGL Pipeline Regulation
We have interests in NGL pipelines located in Texas and New Mexico. We commenced the interstate transportation of NGLs in 2013, which is subject to the jurisdiction of the FERC under the Interstate Commerce Act (“ICA”) and the Energy Policy Act of 1992. Under the ICA, tariff rates must be just and reasonable and not unduly discriminatory and pipelines may not confer any undue preference. The tariff rates established for interstate services were based on a negotiated agreement; however, the FERC’s rate-making methodologies may limit our ability to set rates based on our actual costs, may delay or limit the use of rates that reflect increased costs and may subject us to potentially burdensome and expensive operational, reporting and other requirements. Any of the foregoing could adversely affect our business, revenues and cash flow.
Transwestern Rate Case
On October 1, 2014, Transwestern filed a general NGA Section 4 rate case pursuant to the 2011 settlement agreement with its shippers. On December 2, 2014, the FERC issued an order accepting and suspending the rates to be effective April 1, 2015, subject to refund, and setting a procedural schedule with a hearing scheduled in August 2015.
FGT Rate Case
On October 31, 2014, FGT filed a general NGA Section 4 rate case pursuant to a 2010 settlement agreement with its shippers. On November 28, 2014, the FERC issued an order accepting and suspending the rates to be effective May 1, 2015, subject to refund, and setting a procedural schedule with a hearing scheduled in late 2015.
Commitments
In the normal course of our business, we purchase, process and sell natural gas pursuant to long-term contracts and we enter into long-term transportation and storage agreements. Such contracts contain terms that are customary in the industry. We believe that the terms of these agreements are commercially reasonable and will not have a material adverse effect on our financial position or results of operations.
S - 53
We have certain non-cancelable leases for property and equipment, which require fixed monthly rental payments and expire at various dates through
2058
. The table below reflects rental expense under these operating leases included in operating expenses in the accompanying statements of operations, which include contingent rentals, and rental expense recovered through related sublease rental income:
|
Years Ended December 31,
|
||||||||||||
|
2014
|
2013
|
2012
|
||||||||||
|
Rental expense
(1)
|
$
|
139
|
|
$
|
140
|
|
$
|
57
|
|
|||
|
Less: Sublease rental income
|
(26
|
)
|
(24
|
)
|
(4
|
)
|
||||||
|
Rental expense, net
|
$
|
113
|
|
$
|
116
|
|
$
|
53
|
|
|||
|
(1)
|
Includes contingent rentals totaling
$24 million
,
$22 million
and
$6 million
for the years ended
December 31, 2014
,
2013
and
2012
, respectively.
|
Future minimum lease commitments for such leases are:
|
Years Ending December 31:
|
|||
|
2015
|
$
|
146
|
|
|
2016
|
124
|
|
|
|
2017
|
114
|
|
|
|
2018
|
105
|
|
|
|
2019
|
100
|
|
|
|
Thereafter
|
803
|
|
|
|
Future minimum lease commitments
|
1,392
|
|
|
|
Less: Sublease rental income
|
(34
|
)
|
|
|
Net future minimum lease commitments
|
$
|
1,358
|
|
Our joint venture agreements require that we fund our proportionate share of capital contributions to our unconsolidated affiliates. Such contributions will depend upon our unconsolidated affiliates’ capital requirements, such as for funding capital projects or repayment of long-term obligations.
Litigation and Contingencies
We may, from time to time, be involved in litigation and claims arising out of our operations in the normal course of business. Natural gas and crude oil are flammable and combustible. Serious personal injury and significant property damage can arise in connection with their transportation, storage or use. In the ordinary course of business, we are sometimes threatened with or named as a defendant in various lawsuits seeking actual and punitive damages for product liability, personal injury and property damage. We maintain liability insurance with insurers in amounts and with coverage and deductibles management believes are reasonable and prudent, and which are generally accepted in the industry. However, there can be no assurance that the levels of insurance protection currently in effect will continue to be available at reasonable prices or that such levels will remain adequate to protect us from material expenses related to product liability, personal injury or property damage in the future.
MTBE Litigation
Sunoco, Inc., along with other refiners, manufacturers and sellers of gasoline, is a defendant in lawsuits alleging MTBE contamination of groundwater. The plaintiffs typically include water purveyors and municipalities responsible for supplying drinking water and governmental authorities. The plaintiffs are asserting primarily product liability claims and additional claims including nuisance, trespass, negligence, violation of environmental laws and deceptive business practices. The plaintiffs in all of the cases are seeking to recover compensatory damages, and in some cases also seek natural resource damages, injunctive relief, punitive damages and attorneys’ fees.
As of
December 31, 2014
, Sunoco, Inc. is a defendant in
five
cases, including cases initiated by the States of New Jersey, Vermont, the Commonwealth of Pennsylvania, and two others by the Commonwealth of Puerto Rico with the more recent Puerto Rico action being a companion case alleging damages for additional sites beyond those at issue in the initial Puerto
S - 54
Rico action.
Four
of these cases are venued in a multidistrict litigation proceeding in a New York federal court. The New Jersey, Puerto Rico, Vermont, and Pennsylvania cases assert natural resource damage claims.
Fact discovery has concluded with respect to an initial set of
19
sites each that will be the subject of the first trial phase in the New Jersey case and the initial Puerto Rico case. Insufficient information has been developed about the plaintiffs’ legal theories or the facts with respect to statewide natural resource damage claims to provide an analysis of the ultimate potential liability of Sunoco, Inc. in these matters. It is reasonably possible that a loss may be realized; however, we are unable to estimate the possible loss or range of loss in excess of amounts accrued. Management believes that an adverse determination with respect to one or more of the MTBE cases could have a significant impact on results of operations during the period in which any said adverse determination occurs, but does not believe that any such adverse determination would have a material adverse effect on the Partnership’s consolidated financial position.
Enterprise Products Partners, L.P. and Enterprise Products Operating LLC Litigation
On January 27, 2014, a trial commenced between ETP against Enterprise Products Partners, L.P. and Enterprise Products Operating LLC (collectively, “Enterprise”) and Enbridge (US) Inc. Trial resulted in a verdict in favor of ETP against Enterprise that consisted of
$319 million
in compensatory damages and
$595 million
in disgorgement to ETP. The jury also found that ETP owed Enterprise
$1 million
under a reimbursement agreement. On July 29, 2014, the trial court entered a final judgment in favor of ETP and awarded ETP
$536 million
, consisting of compensatory damages, disgorgement, and pre-judgment interest. The trial court also ordered that ETP shall be entitled to recover post-judgment interest and costs of court and that Enterprise is not entitled to any net recovery on its counterclaims. Enterprise has filed a notice of appeal. In accordance with GAAP, no amounts related to the original verdict or the July 29, 2014 final judgment will be recorded in our financial statements until the appeal process is completed.
Other Litigation and Contingencies
We or our subsidiaries are a party to various legal proceedings and/or regulatory proceedings incidental to our businesses. For each of these matters, we evaluate the merits of the case, our exposure to the matter, possible legal or settlement strategies, the likelihood of an unfavorable outcome and the availability of insurance coverage. If we determine that an unfavorable outcome of a particular matter is probable and can be estimated, we accrue the contingent obligation, as well as any expected insurance recoverable amounts related to the contingency. As of
December 31, 2014
and
2013
, accruals of approximately
$37 million
and
$46 million
, respectively, were reflected on our consolidated balance sheets related to these contingent obligations. As new information becomes available, our estimates may change. The impact of these changes may have a significant effect on our results of operations in a single period.
The outcome of these matters cannot be predicted with certainty and there can be no assurance that the outcome of a particular matter will not result in the payment of amounts that have not been accrued for the matter. Furthermore, we may revise accrual amounts prior to resolution of a particular contingency based on changes in facts and circumstances or changes in the expected outcome. Currently, we are not able to estimate possible losses or a range of possible losses in excess of amounts accrued.
No
amounts have been recorded in our
December 31, 2014
or
2013
consolidated balance sheets for contingencies and current litigation, other than amounts disclosed herein.
Attorney General of the Commonwealth of Massachusetts v. New England Gas Company
On July 7, 2011, the Massachusetts Attorney General (“AG”) filed a regulatory complaint with the Massachusetts Department of Public Utilities (“MDPU”) against New England Gas Company with respect to certain environmental cost recoveries. The AG is seeking a refund to New England Gas Company customers for alleged “excessive and imprudently incurred costs” related to legal fees associated with Southern Union’s environmental response activities. In the complaint, the AG requests that the MDPU initiate an investigation into the New England Gas Company’s collection and reconciliation of recoverable environmental costs including: (i) the prudence of any and all legal fees, totaling approximately
$19 million
, that were charged by the Kasowitz, Benson, Torres & Friedman firm and passed through the recovery mechanism since 2005, the year when a partner in the firm, the Southern Union former Vice Chairman, President and Chief Operating Officer, joined Southern Union’s management team; (ii) the prudence of any and all legal fees that were charged by the Bishop, London & Dodds firm and passed through the recovery mechanism since 2005, the period during which a member of the firm served as Southern Union’s Chief Ethics Officer; and (iii) the propriety and allocation of certain legal fees charged that were passed through the recovery mechanism that the AG contends only qualify for a lesser,
50%
, level of recovery. Southern Union has filed its answer denying the allegations and moved to dismiss the complaint, in part on a theory of collateral estoppel. The hearing officer has deferred consideration of Southern Union’s motion to dismiss. The AG’s motion to be reimbursed expert and consultant costs by Southern Union of up to
$150,000
was granted. By tariff, these costs are recoverable through rates charged to New England Gas Company customers. The hearing officer previously stayed discovery pending resolution of a dispute concerning the
S - 55
applicability of attorney-client privilege to legal billing invoices. The MDPU issued an interlocutory order on June 24, 2013 that lifted the stay, and discovery has resumed. Panhandle (as successor to Southern Union) believes it has complied with all applicable requirements regarding its filings for cost recovery and has not recorded any accrued liability; however, Panhandle will continue to assess its potential exposure for such cost recoveries as the matter progresses.
Environmental Matters
Our operations are subject to extensive federal, state and local environmental and safety laws and regulations that require expenditures to ensure compliance, including related to air emissions and wastewater discharges, at operating facilities and for remediation at current and former facilities as well as waste disposal sites. Although we believe our operations are in substantial compliance with applicable environmental laws and regulations, risks of additional costs and liabilities are inherent in the business of transporting, storing, gathering, treating, compressing, blending and processing natural gas, natural gas liquids and other products. As a result, there can be no assurance that significant costs and liabilities will not be incurred. Costs of planning, designing, constructing and operating pipelines, plants and other facilities must incorporate compliance with environmental laws and regulations and safety standards. Failure to comply with these laws and regulations may result in the assessment of administrative, civil and criminal penalties, the imposition of remedial obligations, the issuance of injunctions and the filing of federally authorized citizen suits. Contingent losses related to all significant known environmental matters have been accrued and/or separately disclosed. However, we may revise accrual amounts prior to resolution of a particular contingency based on changes in facts and circumstances or changes in the expected outcome.
Environmental exposures and liabilities are difficult to assess and estimate due to unknown factors such as the magnitude of possible contamination, the timing and extent of remediation, the determination of our liability in proportion to other parties, improvements in cleanup technologies and the extent to which environmental laws and regulations may change in the future. Although environmental costs may have a significant impact on the results of operations for any single period, we believe that such costs will not have a material adverse effect on our financial position.
Based on information available at this time and reviews undertaken to identify potential exposure, we believe the amount reserved for environmental matters is adequate to cover the potential exposure for cleanup costs.
Environmental Remediation
Our subsidiaries are responsible for environmental remediation at certain sites, including the following:
|
•
|
Certain of our interstate pipelines conduct soil and groundwater remediation related to contamination from past uses of PCBs. PCB assessments are ongoing and, in some cases, our subsidiaries could potentially be held responsible for contamination caused by other parties.
|
|
•
|
Certain gathering and processing systems are responsible for soil and groundwater remediation related to releases of hydrocarbons.
|
|
•
|
Currently operating Sunoco, Inc. retail sites.
|
|
•
|
Legacy sites related to Sunoco, Inc., that are subject to environmental assessments include formerly owned terminals and other logistics assets, retail sites that Sunoco, Inc. no longer operates, closed and/or sold refineries and other formerly owned sites.
|
|
•
|
Sunoco, Inc. is potentially subject to joint and several liability for the costs of remediation at sites at which it has been identified as a potentially responsible party (“PRP”). As of
December 31, 2014
, Sunoco, Inc. had been named as a PRP at approximately
51
identified or potentially identifiable “Superfund” sites under federal and/or comparable state law. Sunoco, Inc. is usually one of a number of companies identified as a PRP at a site. Sunoco, Inc. has reviewed the nature and extent of its involvement at each site and other relevant circumstances and, based upon Sunoco, Inc.’s purported nexus to the sites, believes that its potential liability associated with such sites will not be significant.
|
To the extent estimable, expected remediation costs are included in the amounts recorded for environmental matters in our consolidated balance sheets. In some circumstances, future costs cannot be reasonably estimated because remediation activities are undertaken as claims are made by customers and former customers. To the extent that an environmental remediation obligation is recorded by a subsidiary that applies regulatory accounting policies, amounts that are expected to be recoverable through tariffs or rates are recorded as regulatory assets on our consolidated balance sheets.
S - 56
The table below reflects the amounts of accrued liabilities recorded in our consolidated balance sheets related to environmental matters that are considered to be probable and reasonably estimable. Currently, we are not able to estimate possible losses or a range of possible losses in excess of amounts accrued. Except for matters discussed above, we do not have any material environmental matters assessed as reasonably possible that would require disclosure in our consolidated financial statements.
|
December 31,
|
|||||||
|
2014
|
2013
|
||||||
|
Current
|
$
|
39
|
|
$
|
45
|
|
|
|
Non-current
|
352
|
|
350
|
|
|||
|
Total environmental liabilities
|
$
|
391
|
|
$
|
395
|
|
|
In 2013, we established a wholly-owned captive insurance company to bear certain risks associated with environmental obligations related to certain sites that are no longer operating. The premiums paid to the captive insurance company include estimates for environmental claims that have been incurred but not reported, based on an actuarially determined fully developed claims expense estimate. In such cases, we accrue losses attributable to unasserted claims based on the discounted estimates that are used to develop the premiums paid to the captive insurance company.
During the years ended
December 31, 2014
and
2013
, Sunoco, Inc. had
$46 million
and
$36 million
, respectively, of expenditures related to environmental cleanup programs.
On June 29, 2011, the U.S. Environmental Protection Agency finalized a rule under the Clean Air Act that revised the new source performance standards for manufacturers, owners and operators of new, modified and reconstructed stationary internal combustion engines. The rule became effective on August 29, 2011. The rule modifications may require us to undertake significant expenditures, including expenditures for purchasing, installing, monitoring and maintaining emissions control equipment, if we replace equipment or expand existing facilities in the future. At this point, we are not able to predict the cost to comply with the rule’s requirements, because the rule applies only to changes we might make in the future.
Our pipeline operations are subject to regulation by the U.S. Department of Transportation under the PHMSA, pursuant to which the PHMSA has established requirements relating to the design, installation, testing, construction, operation, replacement and management of pipeline facilities. Moreover, the PHMSA, through the Office of Pipeline Safety, has promulgated a rule requiring pipeline operators to develop integrity management programs to comprehensively evaluate their pipelines, and take measures to protect pipeline segments located in what the rule refers to as “high consequence areas.” Activities under these integrity management programs involve the performance of internal pipeline inspections, pressure testing or other effective means to assess the integrity of these regulated pipeline segments, and the regulations require prompt action to address integrity issues raised by the assessment and analysis. Integrity testing and assessment of all of these assets will continue, and the potential exists that results of such testing and assessment could cause us to incur future capital and operating expenditures for repairs or upgrades deemed necessary to ensure the continued safe and reliable operation of our pipelines; however, no estimate can be made at this time of the likely range of such expenditures.
Our operations are also subject to the requirements of the OSHA, and comparable state laws that regulate the protection of the health and safety of employees. In addition, OSHA’s hazardous communication standard requires that information be maintained about hazardous materials used or produced in our operations and that this information be provided to employees, state and local government authorities and citizens. We believe that our operations are in substantial compliance with the OSHA requirements, including general industry standards, record keeping requirements, and monitoring of occupational exposure to regulated substances.
|
12.
|
PRICE RISK MANAGEMENT ASSETS AND LIABILITIES:
|
Commodity Price Risk
We are exposed to market risks related to the volatility of commodity prices. To manage the impact of volatility from these prices, we utilize various exchange-traded and OTC commodity financial instrument contracts. These contracts consist primarily of futures, swaps and options and are recorded at fair value in our consolidated balance sheets.
We inject and hold natural gas in our Bammel storage facility to take advantage of contango markets (i.e., when the price of natural gas is higher in the future than the current spot price). We use financial derivatives to hedge the natural gas held in connection with these arbitrage opportunities. At the inception of the hedge, we lock in a margin by purchasing gas in the spot market or off peak season and entering into a financial contract to lock in the sale price. If we designate the related financial contract as a fair value hedge for accounting purposes, we value the hedged natural gas inventory at current spot
S - 57
market prices along with the financial derivative we use to hedge it. Changes in the spread between the forward natural gas prices designated as fair value hedges and the physical inventory spot price result in unrealized gains or losses until the underlying physical gas is withdrawn and the related designated derivatives are settled. Once the gas is withdrawn and the designated derivatives are settled, the previously unrealized gains or losses associated with these positions are realized. Unrealized margins represent the unrealized gains or losses from our derivative instruments using mark-to-market accounting, with changes in the fair value of our derivatives being recorded directly in earnings. These margins fluctuate based upon changes in the spreads between the physical spot price and forward natural gas prices. If the spread narrows between the physical and financial prices, we will record unrealized gains or lower unrealized losses. If the spread widens, we will record unrealized losses or lower unrealized gains. Typically, as we enter the winter months, the spread converges so that we recognize in earnings the original locked-in spread through either mark-to-market adjustments or the physical withdraw of natural gas.
We are also exposed to market risk on natural gas we retain for fees in our intrastate transportation and storage segment and operational gas sales on our interstate transportation and storage segment. We use financial derivatives to hedge the sales price of this gas, including futures, swaps and options. Certain contracts that qualify for hedge accounting are designated as cash flow hedges of the forecasted sale of natural gas. The change in value, to the extent the contracts are effective, remains in AOCI until the forecasted transaction occurs. When the forecasted transaction occurs, any gain or loss associated with the derivative is recorded in cost of products sold in the consolidated statement of operations.
We are also exposed to commodity price risk on NGLs and residue gas we retain for fees in our midstream segment whereby our subsidiaries generally gather and process natural gas on behalf of producers, sell the resulting residue gas and NGL volumes at market prices and remit to producers an agreed upon percentage of the proceeds based on an index price for the residue gas and NGLs. We use NGL and crude derivative swap contracts to hedge forecasted sales of NGL and condensate equity volumes. Certain contracts that qualify for hedge accounting are accounted for as cash flow hedges. The change in value, to the extent the contracts are effective, remains in AOCI until the forecasted transaction occurs. When the forecasted transaction occurs, any gain or loss associated with the derivative is recorded in cost of products sold in the consolidated statement of operations.
We may use derivatives in our liquids transportation and services segment to manage our storage facilities and the purchase and sale of purity NGLs.
Sunoco Logistics utilizes derivatives such as swaps, futures and other derivative instruments to mitigate the risk associated with market movements in the price of refined products and NGLs. These derivative contracts act as a hedging mechanism against the volatility of prices by allowing Sunoco Logistics to transfer this price risk to counterparties who are able and willing to bear it. Since the first quarter 2013, Sunoco Logistics has not designated any of its derivative contracts as hedges for accounting purposes. Therefore, all realized and unrealized gains and losses from these derivative contracts are recognized in the consolidated statements of operations during the current period.
We also use derivatives to hedge a variety of price risks in our retail marketing segment. Futures and swaps are used to achieve ratable pricing of crude oil purchases, to convert certain expected refined product sales to fixed or floating prices, to lock in margins for certain refined products and to lock in the price of a portion of natural gas purchases or sales and transportation costs. The derivatives used in our retail marketing segment represent economic hedges; however, we have elected not to designate any of the hedges in this business segment. Therefore, all realized and unrealized gains and losses from these derivative contracts are recognized in the consolidated statements of operations during the current period.
Our trading activities include the use of financial commodity derivatives to take advantage of market opportunities. These trading activities are a complement to our transportation and storage segment’s operations and are netted in cost of products sold in our consolidated statements of operations. Additionally, we also have trading and marketing activities related to power and natural gas in our all other segment which are also netted in cost of products sold. As a result of our trading activities and the use of derivative financial instruments in our transportation and storage segment, the degree of earnings volatility that can occur may be significant, favorably or unfavorably, from period to period. We attempt to manage this volatility through the use of daily position and profit and loss reports provided to our risk oversight committee, which includes members of senior management, and the limits and authorizations set forth in our commodity risk management policy.
S - 58
The following table details our outstanding commodity-related derivatives:
|
December 31, 2014
|
December 31, 2013
|
||||||||
|
Notional
Volume
|
Maturity
|
Notional
Volume
|
Maturity
|
||||||
|
Mark-to-Market Derivatives
|
|||||||||
|
(Trading)
|
|||||||||
|
Natural Gas (MMBtu):
|
|||||||||
|
Fixed Swaps/Futures
|
(232,500
|
)
|
2015
|
9,457,500
|
|
2014-2019
|
|||
|
Basis Swaps IFERC/NYMEX
(1)
|
(13,907,500
|
)
|
2015-2016
|
(487,500
|
)
|
2014-2017
|
|||
|
Swing Swaps
|
—
|
|
—
|
1,937,500
|
|
2014-2016
|
|||
|
Options – Calls
|
5,000,000
|
|
2015
|
—
|
|
—
|
|||
|
Power (Megawatt):
|
|||||||||
|
Forwards
|
288,775
|
|
2015
|
351,050
|
|
2014
|
|||
|
Futures
|
(156,000
|
)
|
2015
|
(772,476
|
)
|
2014
|
|||
|
Options – Puts
|
(72,000
|
)
|
2015
|
(52,800
|
)
|
2014
|
|||
|
Options – Calls
|
198,556
|
|
2015
|
103,200
|
|
2014
|
|||
|
Crude (Bbls) – Futures
|
—
|
|
—
|
103,000
|
|
2014
|
|||
|
(Non-Trading)
|
|||||||||
|
Natural Gas (MMBtu):
|
|||||||||
|
Basis Swaps IFERC/NYMEX
|
57,500
|
|
2015
|
570,000
|
|
2014
|
|||
|
Swing Swaps IFERC
|
46,150,000
|
|
2015
|
(9,690,000
|
)
|
2014-2016
|
|||
|
Fixed Swaps/Futures
|
(8,779,000
|
)
|
2015-2016
|
(8,195,000
|
)
|
2014-2015
|
|||
|
Forward Physical Contracts
|
(9,116,777
|
)
|
2015
|
5,668,559
|
|
2014-2015
|
|||
|
Natural Gas Liquid (Bbls) – Forwards/Swaps
|
(2,179,400
|
)
|
2015
|
(1,133,600
|
)
|
2014
|
|||
|
Refined Products (Bbls) – Futures
|
13,745,755
|
|
2015
|
(280,000
|
)
|
2014
|
|||
|
Fair Value Hedging Derivatives
|
|||||||||
|
(Non-Trading)
|
|||||||||
|
Natural Gas (MMBtu):
|
|||||||||
|
Basis Swaps IFERC/NYMEX
|
(39,287,500
|
)
|
2015
|
(7,352,500
|
)
|
2014
|
|||
|
Fixed Swaps/Futures
|
(39,287,500
|
)
|
2015
|
(50,530,000
|
)
|
2014
|
|||
|
Hedged Item – Inventory
|
39,287,500
|
|
2015
|
50,530,000
|
|
2014
|
|||
|
Cash Flow Hedging Derivatives
|
|||||||||
|
(Non-Trading)
|
|||||||||
|
Natural Gas (MMBtu):
|
|||||||||
|
Basis Swaps IFERC/NYMEX
|
—
|
|
—
|
(1,825,000
|
)
|
2014
|
|||
|
Fixed Swaps/Futures
|
—
|
|
—
|
(12,775,000
|
)
|
2014
|
|||
|
Natural Gas Liquid (Bbls) – Forwards/Swaps
|
—
|
|
—
|
(780,000
|
)
|
2014
|
|||
|
Crude (Bbls) – Futures
|
—
|
|
—
|
(30,000
|
)
|
2014
|
|||
|
(1)
|
Includes aggregate amounts for open positions related to Houston Ship Channel, Waha Hub, NGPL TexOk, West Louisiana Zone and Henry Hub locations.
|
Interest Rate Risk
We are exposed to market risk for changes in interest rates. To maintain a cost effective capital structure, we borrow funds using a mix of fixed rate debt and variable rate debt. We also manage our interest rate exposure by utilizing interest rate swaps to achieve a desired mix of fixed and variable rate debt. We also utilize forward starting interest rate swaps to lock in the rate on a portion of our anticipated debt issuances.
S - 59
The following table summarizes our interest rate swaps outstanding, none of which were designated as hedges for accounting purposes:
|
Entity
|
Term
|
Type
(1)
|
Notional Amount Outstanding
|
|||||||||
|
December 31, 2014
|
December 31, 2013
|
|||||||||||
|
ETP
|
July 2014
(2)
|
Forward-starting to pay a fixed rate of 4.25% and receive a floating rate
|
$
|
—
|
|
$
|
400
|
|
||||
|
ETP
|
July 2015
(2)
|
Forward-starting to pay a fixed rate of 3.38% and receive a floating rate
|
200
|
|
—
|
|
||||||
|
ETP
|
July 2016
(3)
|
Forward-starting to pay a fixed rate of 3.80% and receive a floating rate
|
200
|
|
—
|
|
||||||
|
ETP
|
July 2017
(4)
|
Forward-starting to pay a fixed rate of 3.84% and receive a floating rate
|
300
|
|
—
|
|
||||||
|
ETP
|
July 2018
(4)
|
Forward-starting to pay a fixed rate of 4.00% and receive a floating rate
|
200
|
|
—
|
|
||||||
|
ETP
|
July 2019
(4)
|
Forward-starting to pay a fixed rate of 3.19% and receive a floating rate
|
300
|
|
—
|
|
||||||
|
ETP
|
July 2018
|
Pay a floating rate plus a spread of 4.17% and receive a fixed rate of 6.70%
|
—
|
|
600
|
|
||||||
|
ETP
|
June 2021
|
Pay a floating rate plus a spread of 2.17% and receive a fixed rate of 4.65%
|
—
|
|
400
|
|
||||||
|
ETP
|
February 2023
|
Pay a floating rate plus a spread of 1.73% and receive a fixed rate of 3.60%
|
200
|
|
400
|
|
||||||
|
Panhandle
|
November 2021
|
Pay a fixed rate of 3.82% and receive a floating rate
|
—
|
|
275
|
|
||||||
|
(1)
|
Floating rates are based on 3-month LIBOR.
|
|
(2)
|
Represents the effective date. These forward-starting swaps have terms of 10 years with a mandatory termination date the same as the effective date.
|
|
(3)
|
Represents the effective date. These forward-starting swaps have terms of 10 and 30 years with a mandatory termination date the same as the effective date.
|
|
(4)
|
Represents the effective date. These forward-starting swaps have terms of 30 years with a mandatory termination date the same as the effective date.
|
Credit Risk
Credit risk refers to the risk that a counterparty may default on its contractual obligations resulting in a loss to the Partnership. Credit policies have been approved and implemented to govern the Partnership’s portfolio of counterparties with the objective of mitigating credit losses. These policies establish guidelines, controls and limits to manage credit risk within approved tolerances by mandating an appropriate evaluation of the financial condition of existing and potential counterparties, monitoring agency credit ratings, and by implementing credit practices that limit exposure according to the risk profiles of the counterparties. Furthermore, the Partnership may at times require collateral under certain circumstances to mitigate credit risk as necessary. We also implement the use of industry standard commercial agreements which allow for the netting of positive and negative exposures associated with transactions executed under a single commercial agreement. Additionally, we utilize master netting agreements to offset credit exposure across multiple commercial agreements with a single counterparty or affiliated group of counterparties.
The Partnership’s counterparties consist of a diverse portfolio of customers across the energy industry, including petrochemical companies, commercial and industrials, oil and gas producers, municipalities, gas and electric utilities and midstream companies. Our overall exposure may be affected positively or negatively by macroeconomic or regulatory changes that impact our counterparties to one extent or another. Currently, management does not anticipate a material adverse effect in our financial position or results of operations as a consequence of counterparty non-performance.
We have maintenance margin deposits with certain counterparties in the OTC market, primarily independent system operators, and with clearing brokers. Payments on margin deposits are required when the value of a derivative exceeds our pre-established credit limit with the counterparty. Margin deposits are returned to us on or about the settlement date for non-exchange traded
S - 60
derivatives, and we exchange margin calls on a daily basis for exchange traded transactions. Since the margin calls are made daily with the exchange brokers, the fair value of the financial derivative instruments are deemed current and netted in deposits paid to vendors within other current assets in the consolidated balance sheets.
For financial instruments, failure of a counterparty to perform on a contract could result in our inability to realize amounts that have been recorded on our consolidated balance sheets and recognized in net income or other comprehensive income.
Derivative Summary
The following table provides a summary of our derivative assets and liabilities:
|
Fair Value of Derivative Instruments
|
|||||||||||||||
|
Asset Derivatives
|
Liability Derivatives
|
||||||||||||||
|
December 31, 2014
|
December 31, 2013
|
December 31, 2014
|
December 31, 2013
|
||||||||||||
|
Derivatives designated as hedging instruments:
|
|||||||||||||||
|
Commodity derivatives (margin deposits)
|
$
|
43
|
|
$
|
3
|
|
$
|
—
|
|
$
|
(18
|
)
|
|||
|
43
|
|
3
|
|
—
|
|
(18
|
)
|
||||||||
|
Derivatives not designated as hedging instruments:
|
|||||||||||||||
|
Commodity derivatives (margin deposits)
|
617
|
|
227
|
|
(577
|
)
|
(209
|
)
|
|||||||
|
Commodity derivatives
|
23
|
|
39
|
|
(23
|
)
|
(38
|
)
|
|||||||
|
Interest rate derivatives
|
3
|
|
47
|
|
(155
|
)
|
(95
|
)
|
|||||||
|
643
|
|
313
|
|
(755
|
)
|
(342
|
)
|
||||||||
|
Total derivatives
|
$
|
686
|
|
$
|
316
|
|
$
|
(755
|
)
|
$
|
(360
|
)
|
|||
The following table presents the fair value of our recognized derivative assets and liabilities on a gross basis and amounts offset on the consolidated balance sheets that are subject to enforceable master netting arrangements or similar arrangements:
|
Asset Derivatives
|
Liability Derivatives
|
|||||||||||||||||
|
Balance Sheet Location
|
December 31, 2014
|
December 31, 2013
|
December 31, 2014
|
December 31, 2013
|
||||||||||||||
|
Derivatives in offsetting agreements:
|
||||||||||||||||||
|
OTC contracts
|
Price risk management assets (liabilities)
|
$
|
23
|
|
$
|
41
|
|
$
|
(23
|
)
|
$
|
(38
|
)
|
|||||
|
Broker cleared derivative contracts
|
Other current assets
|
674
|
|
265
|
|
(574
|
)
|
(318
|
)
|
|||||||||
|
697
|
|
306
|
|
(597
|
)
|
(356
|
)
|
|||||||||||
|
Offsetting agreements:
|
||||||||||||||||||
|
Counterparty netting
|
Price risk management assets (liabilities)
|
(19
|
)
|
(36
|
)
|
19
|
|
36
|
|
|||||||||
|
Payments on margin deposit
|
Other current assets
|
5
|
|
(1
|
)
|
(22
|
)
|
55
|
|
|||||||||
|
(14
|
)
|
(37
|
)
|
(3
|
)
|
91
|
|
|||||||||||
|
Net derivatives with offsetting agreements
|
683
|
|
269
|
|
(600
|
)
|
(265
|
)
|
||||||||||
|
Derivatives without offsetting agreements
|
3
|
|
47
|
|
(155
|
)
|
(95
|
)
|
||||||||||
|
Total derivatives
|
$
|
686
|
|
$
|
316
|
|
$
|
(755
|
)
|
$
|
(360
|
)
|
||||||
We disclose the non-exchange traded financial derivative instruments as price risk management assets and liabilities on our consolidated balance sheets at fair value with amounts classified as either current or long-term depending on the anticipated settlement date.
S - 61
The following tables summarize the amounts recognized with respect to our derivative financial instruments:
|
Change in Value Recognized in OCI on Derivatives (Effective Portion)
|
|||||||||||
|
Years Ended December 31,
|
|||||||||||
|
2014
|
2013
|
2012
|
|||||||||
|
Derivatives in cash flow hedging relationships:
|
|||||||||||
|
Commodity derivatives
|
$
|
—
|
|
$
|
(1
|
)
|
$
|
8
|
|
||
|
Total
|
$
|
—
|
|
$
|
(1
|
)
|
$
|
8
|
|
||
|
Location of Gain/(Loss) Reclassified from AOCI into Income (Effective Portion)
|
Amount of Gain/(Loss) Reclassified from AOCI into Income (Effective Portion)
|
||||||||||||
|
Years Ended December 31,
|
|||||||||||||
|
2014
|
2013
|
2012
|
|||||||||||
|
Derivatives in cash flow hedging relationships:
|
|||||||||||||
|
Commodity derivatives
|
Cost of products sold
|
$
|
(3
|
)
|
$
|
4
|
|
$
|
14
|
|
|||
|
Total
|
$
|
(3
|
)
|
$
|
4
|
|
$
|
14
|
|
||||
|
Location of Gain/(Loss) Recognized in Income on Derivatives
|
Amount of Gain (Loss) Recognized in Income Representing Hedge Ineffectiveness and Amount Excluded from the Assessment of Effectiveness
|
||||||||||||
|
Years Ended December 31,
|
|||||||||||||
|
2014
|
2013
|
2012
|
|||||||||||
|
Derivatives in fair value hedging relationships (including hedged item):
|
|||||||||||||
|
Commodity derivatives
|
Cost of products sold
|
$
|
(8
|
)
|
$
|
8
|
|
$
|
54
|
|
|||
|
Total
|
$
|
(8
|
)
|
$
|
8
|
|
$
|
54
|
|
||||
|
Location of Gain/(Loss) Recognized in Income on Derivatives
|
Amount of Gain (Loss) Recognized in Income on Derivatives
|
||||||||||||
|
Years Ended December 31,
|
|||||||||||||
|
2014
|
2013
|
2012
|
|||||||||||
|
Derivatives not designated as hedging instruments:
|
|||||||||||||
|
Commodity derivatives – Trading
|
Cost of products sold
|
$
|
(6
|
)
|
$
|
(11
|
)
|
$
|
(7
|
)
|
|||
|
Commodity derivatives – Non-trading
|
Cost of products sold
|
106
|
|
(12
|
)
|
(15
|
)
|
||||||
|
Commodity contracts – Non-trading
|
Deferred gas purchases
|
—
|
|
(3
|
)
|
(26
|
)
|
||||||
|
Interest rate derivatives
|
Gains (losses) on interest rate derivatives
|
(157
|
)
|
44
|
|
(4
|
)
|
||||||
|
Total
|
$
|
(57
|
)
|
$
|
18
|
|
$
|
(52
|
)
|
||||
|
13.
|
RETIREMENT BENEFITS:
|
Savings and Profit Sharing Plans
We and our subsidiaries sponsor defined contribution savings and profit sharing plans, which collectively cover virtually all eligible employees. Employer matching contributions are calculated using a formula based on employee contributions. We
S - 62
and our subsidiaries made matching contributions of
$50 million
,
$38 million
and
$21 million
to these 401(k) savings plans for the years ended
December 31, 2014, 2013 and 2012
, respectively.
Pension and Other Postretirement Benefit Plans
Panhandle
Panhandle offered postretirement health care and life insurance plans that were available to substantially all of its employees, pending the retiree meeting certain age and service requirements.
Sunoco, Inc.
Sunoco, Inc. sponsors a defined benefit pension plan, which was frozen for most participants on June 30, 2010. On October 31, 2014, Sunoco, Inc. terminated the plan and anticipates approval for the distribution of assets from the plan, pending approval from the Pension Benefit Guaranty Corporation and the IRS, in the fourth quarter of 2015.
Sunoco, Inc. also has a plan which provides health care benefits for substantially all of its current retirees. The cost to provide the postretirement benefit plan is shared by Sunoco, Inc. and its retirees. Access to postretirement medical benefits was phased out or eliminated for all employees retiring after July 1, 2010. In March, 2012, Sunoco, Inc. established a trust for its postretirement benefit liabilities. Sunoco made a tax-deductible contribution of approximately
$200 million
to the trust. The funding of the trust eliminated substantially all of Sunoco, Inc.’s future exposure to variances between actual results and assumptions used to estimate retiree medical plan obligations.
S - 63
Obligations and Funded Status
Pension and other postretirement benefit liabilities are accrued on an actuarial basis during the years an employee provides services. The following table contains information at the dates indicated about the obligations and funded status of pension and other postretirement plans on a combined basis:
|
December 31, 2014
|
December 31, 2013
|
||||||||||||||||||||||
|
Pension Benefits
|
Pension Benefits
|
||||||||||||||||||||||
|
Funded Plans
|
Unfunded Plans
|
Other Postretirement Benefits
|
Funded Plans
|
Unfunded Plans
|
Other Postretirement Benefits
|
||||||||||||||||||
|
Change in benefit obligation:
|
|||||||||||||||||||||||
|
Benefit obligation at beginning of period
|
$
|
632
|
|
$
|
61
|
|
$
|
223
|
|
$
|
1,117
|
|
$
|
78
|
|
$
|
296
|
|
|||||
|
Service cost
|
—
|
|
—
|
|
—
|
|
3
|
|
—
|
|
—
|
|
|||||||||||
|
Interest cost
|
28
|
|
3
|
|
5
|
|
33
|
|
2
|
|
6
|
|
|||||||||||
|
Amendments
|
—
|
|
—
|
|
1
|
|
—
|
|
—
|
|
2
|
|
|||||||||||
|
Benefits paid, net
|
(45
|
)
|
(9
|
)
|
(28
|
)
|
(99
|
)
|
(16
|
)
|
(26
|
)
|
|||||||||||
|
Actuarial (gain) loss and other
|
130
|
|
10
|
|
2
|
|
(74
|
)
|
(3
|
)
|
(14
|
)
|
|||||||||||
|
Settlements
|
(27
|
)
|
—
|
|
—
|
|
(95
|
)
|
—
|
|
—
|
|
|||||||||||
|
Dispositions
|
—
|
|
—
|
|
(1
|
)
|
(253
|
)
|
—
|
|
(41
|
)
|
|||||||||||
|
Benefit obligation at end of period
|
718
|
|
65
|
|
202
|
|
632
|
|
61
|
|
223
|
|
|||||||||||
|
Change in plan assets:
|
|||||||||||||||||||||||
|
Fair value of plan assets at beginning of period
|
600
|
|
—
|
|
284
|
|
906
|
|
—
|
|
312
|
|
|||||||||||
|
Return on plan assets and other
|
70
|
|
—
|
|
6
|
|
43
|
|
—
|
|
17
|
|
|||||||||||
|
Employer contributions
|
—
|
|
—
|
|
8
|
|
—
|
|
—
|
|
8
|
|
|||||||||||
|
Benefits paid, net
|
(45
|
)
|
—
|
|
(28
|
)
|
(99
|
)
|
—
|
|
(26
|
)
|
|||||||||||
|
Settlements
|
(27
|
)
|
—
|
|
—
|
|
(95
|
)
|
—
|
|
—
|
|
|||||||||||
|
Dispositions
|
—
|
|
—
|
|
(5
|
)
|
(155
|
)
|
—
|
|
(27
|
)
|
|||||||||||
|
Fair value of plan assets at end of period
|
598
|
|
—
|
|
265
|
|
600
|
|
—
|
|
284
|
|
|||||||||||
|
Amount underfunded (overfunded) at end of period
|
$
|
120
|
|
$
|
65
|
|
$
|
(63
|
)
|
$
|
32
|
|
$
|
61
|
|
$
|
(61
|
)
|
|||||
|
Amounts recognized in the consolidated balance sheets consist of:
|
|||||||||||||||||||||||
|
Non-current assets
|
$
|
—
|
|
$
|
—
|
|
$
|
90
|
|
$
|
—
|
|
$
|
—
|
|
$
|
86
|
|
|||||
|
Current liabilities
|
—
|
|
(9
|
)
|
(2
|
)
|
—
|
|
(9
|
)
|
(2
|
)
|
|||||||||||
|
Non-current liabilities
|
(120
|
)
|
(56
|
)
|
(25
|
)
|
(32
|
)
|
(52
|
)
|
(23
|
)
|
|||||||||||
|
$
|
(120
|
)
|
$
|
(65
|
)
|
$
|
63
|
|
$
|
(32
|
)
|
$
|
(61
|
)
|
$
|
61
|
|
||||||
|
Amounts recognized in accumulated other comprehensive loss (pre-tax basis) consist of:
|
|||||||||||||||||||||||
|
Net actuarial gain
|
$
|
18
|
|
$
|
7
|
|
$
|
(20
|
)
|
$
|
(86
|
)
|
$
|
(4
|
)
|
$
|
(25
|
)
|
|||||
|
Prior service cost
|
—
|
|
—
|
|
17
|
|
—
|
|
—
|
|
18
|
|
|||||||||||
|
$
|
18
|
|
$
|
7
|
|
$
|
(3
|
)
|
$
|
(86
|
)
|
$
|
(4
|
)
|
$
|
(7
|
)
|
||||||
S - 64
The following table summarizes information at the dates indicated for plans with an accumulated benefit obligation in excess of plan assets:
|
December 31, 2014
|
December 31, 2013
|
||||||||||||||||||||
|
Pension Benefits
|
Pension Benefits
|
||||||||||||||||||||
|
Funded Plans
|
Unfunded Plans
|
Other Postretirement Benefits
|
Funded Plans
|
Unfunded Plans
|
Other Postretirement Benefits
|
||||||||||||||||
|
Projected benefit obligation
|
$
|
718
|
|
$
|
65
|
|
N/A
|
|
$
|
632
|
|
61
|
|
N/A
|
|
||||||
|
Accumulated benefit obligation
|
718
|
|
65
|
|
202
|
|
632
|
|
61
|
|
$
|
223
|
|
||||||||
|
Fair value of plan assets
|
598
|
|
—
|
|
265
|
|
600
|
|
—
|
|
284
|
|
|||||||||
Components of Net Periodic Benefit Cost
|
December 31, 2014
|
December 31, 2013
|
||||||||||||||
|
Pension Benefits
|
Other Postretirement Benefits
|
Pension Benefits
|
Other Postretirement Benefits
|
||||||||||||
|
Net periodic benefit cost:
|
|||||||||||||||
|
Service cost
|
$
|
—
|
|
$
|
—
|
|
$
|
3
|
|
$
|
—
|
|
|||
|
Interest cost
|
31
|
|
5
|
|
35
|
|
6
|
|
|||||||
|
Expected return on plan assets
|
(40
|
)
|
(8
|
)
|
(54
|
)
|
(9
|
)
|
|||||||
|
Prior service cost amortization
|
—
|
|
1
|
|
—
|
|
1
|
|
|||||||
|
Actuarial loss amortization
|
(1
|
)
|
(1
|
)
|
2
|
|
—
|
|
|||||||
|
Settlements
|
(4
|
)
|
—
|
|
(2
|
)
|
—
|
|
|||||||
|
(14
|
)
|
(3
|
)
|
(16
|
)
|
(2
|
)
|
||||||||
|
Regulatory adjustment
(1)
|
—
|
|
—
|
|
5
|
|
—
|
|
|||||||
|
Net periodic benefit cost
|
$
|
(14
|
)
|
$
|
(3
|
)
|
$
|
(11
|
)
|
$
|
(2
|
)
|
|||
|
(1)
|
Southern Union, the predecessor of Panhandle, historically recovered certain qualified pension benefit plan and other postretirement benefit plan costs through rates charged to utility customers in its distribution operations. Certain utility commissions require that the recovery of these costs be based on the Employee Retirement Income Security Act of 1974, as amended, or other utility commission specific guidelines. The difference between these regulatory-based amounts and the periodic benefit cost calculated pursuant to GAAP is deferred as a regulatory asset or liability and amortized to expense over periods in which this difference will be recovered in rates, as promulgated by the applicable utility commission.
|
Assumptions
The weighted-average assumptions used in determining benefit obligations at the dates indicated are shown in the table below:
|
December 31, 2014
|
December 31, 2013
|
||||||||||
|
Pension Benefits
|
Other Postretirement Benefits
|
Pension Benefits
|
Other Postretirement Benefits
|
||||||||
|
Discount rate
|
3.62
|
%
|
2.24
|
%
|
4.65
|
%
|
2.33
|
%
|
|||
|
Rate of compensation increase
|
N/A
|
|
N/A
|
|
N/A
|
|
N/A
|
|
|||
S - 65
The weighted-average assumptions used in determining net periodic benefit cost for the periods presented are shown in the table below:
|
December 31, 2014
|
December 31, 2013
|
||||||||||
|
Pension Benefits
|
Other Postretirement Benefits
|
Pension Benefits
|
Other Postretirement Benefits
|
||||||||
|
Discount rate
|
4.65
|
%
|
3.02
|
%
|
3.50
|
%
|
2.68
|
%
|
|||
|
Expected return on assets:
|
|||||||||||
|
Tax exempt accounts
|
7.50
|
%
|
7.00
|
%
|
7.50
|
%
|
6.95
|
%
|
|||
|
Taxable accounts
|
N/A
|
|
4.50
|
%
|
N/A
|
|
4.42
|
%
|
|||
|
Rate of compensation increase
|
N/A
|
|
N/A
|
|
N/A
|
|
N/A
|
|
|||
The long-term expected rate of return on plan assets was estimated based on a variety of factors including the historical investment return achieved over a long-term period, the targeted allocation of plan assets and expectations concerning future returns in the marketplace for both equity and fixed income securities. Current market factors such as inflation and interest rates are evaluated before long-term market assumptions are determined. Peer data and historical returns are reviewed to ensure reasonableness and appropriateness.
The assumed health care cost trend rates used to measure the expected cost of benefits covered by Panhandle and Sunoco, Inc.’s other postretirement benefit plans are shown in the table below:
|
December 31,
|
||||||
|
2014
|
2013
|
|||||
|
Health care cost trend rate
|
7.09
|
%
|
7.57
|
%
|
||
|
Rate to which the cost trend is assumed to decline (the ultimate trend rate)
|
5.41
|
%
|
5.42
|
%
|
||
|
Year that the rate reaches the ultimate trend rate
|
2018
|
|
2018
|
|
||
Changes in the health care cost trend rate assumptions are not expected to have a significant impact on postretirement benefits.
Plan Assets
For the Panhandle plans, the overall investment strategy is to maintain an appropriate balance of actively managed investments with the objective of optimizing longer-term returns while maintaining a high standard of portfolio quality and achieving proper diversification. To achieve diversity within its other postretirement plan asset portfolio, Panhandle has targeted the following asset allocations: equity of
25%
to
35%
, fixed income of
65%
to
75%
and cash and cash equivalents of up to
10%
.
The investment strategy of Sunoco, Inc. funded defined benefit plans is to achieve consistent positive returns, after adjusting for inflation, and to maximize long-term total return within prudent levels of risk through a combination of income and capital appreciation. The objective of this strategy is to reduce the volatility of investment returns and maintain a sufficient funded status of the plans. In anticipation of the pension plan termination, Sunoco, Inc. targeted the asset allocations to a more stable position by investing in growth assets and liability hedging assets.
The fair value of the pension plan assets by asset category at the dates indicated is as follows:
|
Fair Value Measurements at December 31, 2014 Using Fair Value Hierarchy
|
|||||||||||||||
|
Fair Value as of December 31, 2014
|
Level 1
|
Level 2
|
Level 3
|
||||||||||||
|
Asset category:
|
|||||||||||||||
|
Cash and cash equivalents
|
$
|
25
|
|
$
|
25
|
|
$
|
—
|
|
$
|
—
|
|
|||
|
Mutual funds
(1)
|
110
|
|
—
|
|
110
|
|
—
|
|
|||||||
|
Fixed income securities
|
463
|
|
—
|
|
463
|
|
—
|
|
|||||||
|
Total
|
$
|
598
|
|
$
|
25
|
|
$
|
573
|
|
$
|
—
|
|
|||
S - 66
|
(1)
|
Primarily comprised of approximately
100%
equities as of
December 31, 2014
.
|
|
Fair Value Measurements at December 31, 2013 Using Fair Value Hierarchy
|
|||||||||||||||
|
Fair Value as of December 31, 2013
|
Level 1
|
Level 2
|
Level 3
|
||||||||||||
|
Asset category:
|
|||||||||||||||
|
Cash and cash equivalents
|
$
|
12
|
|
$
|
12
|
|
$
|
—
|
|
$
|
—
|
|
|||
|
Mutual funds
(1)
|
368
|
|
—
|
|
281
|
|
87
|
|
|||||||
|
Fixed income securities
|
220
|
|
—
|
|
220
|
|
—
|
|
|||||||
|
Total
|
$
|
600
|
|
$
|
12
|
|
$
|
501
|
|
$
|
87
|
|
|||
|
(1)
|
Primarily comprised of approximately
41%
equities,
45%
fixed income securities, and
14%
in other investments as of
December 31, 2013
.
|
The fair value of other postretirement plan assets by asset category at the dates indicated is as follows:
|
Fair Value Measurements at December 31, 2014 Using Fair Value Hierarchy
|
|||||||||||||||
|
Fair Value as of December 31, 2014
|
Level 1
|
Level 2
|
Level 3
|
||||||||||||
|
Asset category:
|
|||||||||||||||
|
Cash and cash equivalents
|
$
|
9
|
|
$
|
9
|
|
$
|
—
|
|
$
|
—
|
|
|||
|
Mutual funds
(1)
|
131
|
|
131
|
|
—
|
|
—
|
|
|||||||
|
Fixed income securities
|
125
|
|
—
|
|
125
|
|
—
|
|
|||||||
|
Total
|
$
|
265
|
|
$
|
140
|
|
$
|
125
|
|
$
|
—
|
|
|||
|
(1)
|
Primarily comprised of approximately
56%
equities,
38%
fixed income securities and
6%
cash as of
December 31, 2014
.
|
|
Fair Value Measurements at December 31, 2013 Using Fair Value Hierarchy
|
|||||||||||||||
|
Fair Value as of December 31, 2013
|
Level 1
|
Level 2
|
Level 3
|
||||||||||||
|
Asset category:
|
|||||||||||||||
|
Cash and cash equivalents
|
$
|
10
|
|
$
|
10
|
|
$
|
—
|
|
$
|
—
|
|
|||
|
Mutual funds
(1)
|
130
|
|
112
|
|
18
|
|
—
|
|
|||||||
|
Fixed income securities
|
144
|
|
—
|
|
144
|
|
—
|
|
|||||||
|
Total
|
$
|
284
|
|
$
|
122
|
|
$
|
162
|
|
$
|
—
|
|
|||
|
(1)
|
Primarily comprised of approximately
41%
equities,
48%
fixed income securities,
6%
cash, and
5%
in other investments as of
December 31, 2013
.
|
The Level 1 plan assets are valued based on active market quotes. The Level 2 plan assets are valued based on the net asset value per share (or its equivalent) of the investments, which was not determinable through publicly published sources but was calculated consistent with authoritative accounting guidelines. See
Note 2
for information related to the framework used to measure the fair value of its pension and other postretirement plan assets.
Contributions
We expect to contribute approximately
$129 million
to pension plans and approximately
$10 million
to other postretirement plans in
2015
. The cost of the plans are funded in accordance with federal regulations, not to exceed the amounts deductible for income tax purposes.
S - 67
Benefit Payments
Panhandle and Sunoco, Inc.’s estimate of expected benefit payments, which reflect expected future service, as appropriate, in each of the next five years and in the aggregate for the five years thereafter are shown in the table below:
|
Pension Benefits
|
||||||||||||
|
Years
|
Funded Plans
|
Unfunded Plans
|
Other Postretirement Benefits (Gross, Before Medicare Part D)
|
|||||||||
|
2015
|
$
|
717
|
|
$
|
9
|
|
$
|
28
|
|
|||
|
2016
|
—
|
|
8
|
|
26
|
|
||||||
|
2017
|
—
|
|
7
|
|
25
|
|
||||||
|
2018
|
—
|
|
7
|
|
23
|
|
||||||
|
2019
|
—
|
|
6
|
|
22
|
|
||||||
|
2020 – 2024
|
—
|
|
23
|
|
65
|
|
||||||
The Medicare Prescription Drug Act provides for a prescription drug benefit under Medicare (“Medicare Part D”) as well as a federal subsidy to sponsors of retiree health care benefit plans that provide a prescription drug benefit that is at least actuarially equivalent to Medicare Part D.
Panhandle does not expect to receive any Medicare Part D subsidies in any future periods.
|
14.
|
RELATED PARTY TRANSACTIONS:
|
ETE has agreements with subsidiaries to provide or receive various general and administrative services. ETE pays us to provide services on its behalf and on behalf of other subsidiaries of ETE, which includes the reimbursement of various operating and general and administrative expenses incurred by us on behalf of ETE and its subsidiaries.
In connection with the Lake Charles LNG Transaction, ETP agreed to continue to provide management services for ETE through 2015 in relation to both Lake Charles LNG’s regasification facility and the development of a liquefaction project at Lake Charles LNG’s facility, for which ETE has agreed to pay incremental management fees to ETP of
$75 million
per year for the years ending December 31, 2014 and 2015.
The Partnership also has related party transactions with several of its equity method investees. In addition to commercial transactions, these transactions include the provision of certain management services and leases of certain assets.
The following table summarizes the affiliate revenues on our consolidated statements of operations:
|
Years Ended December 31,
|
|||||||||||
|
2014
|
2013
|
2012
|
|||||||||
|
Affiliated revenues
|
$
|
1,117
|
|
$
|
1,550
|
|
$
|
173
|
|
||
S - 68
The following table summarizes the related company balances on our consolidated balance sheets:
|
December 31,
|
|||||||
|
2014
|
2013
|
||||||
|
Accounts receivable from related companies:
|
|||||||
|
ETE
|
$
|
11
|
|
$
|
18
|
|
|
|
Regency
|
74
|
|
53
|
|
|||
|
Dakota Access Pipeline
|
68
|
|
—
|
|
|||
|
PES
|
6
|
|
7
|
|
|||
|
FGT
|
9
|
|
29
|
|
|||
|
ET Crude Oil
|
10
|
|
24
|
|
|||
|
Lake Charles LNG
|
3
|
|
—
|
|
|||
|
Other
|
29
|
|
34
|
|
|||
|
Total accounts receivable from related companies:
|
$
|
210
|
|
$
|
165
|
|
|
|
Accounts payable to related companies:
|
|||||||
|
ETE
|
$
|
—
|
|
$
|
8
|
|
|
|
Regency
|
53
|
|
24
|
|
|||
|
FGT
|
2
|
|
8
|
|
|||
|
Lake Charles LNG
|
2
|
|
—
|
|
|||
|
Other
|
5
|
|
5
|
|
|||
|
Total accounts payable to related companies:
|
$
|
62
|
|
$
|
45
|
|
|
|
15.
|
REPORTABLE SEGMENTS:
|
Our financial statements currently reflect the following reportable segments, which conduct their business in the United States, as follows:
•
intrastate transportation and storage;
•
interstate transportation and storage;
•
midstream;
•
liquids transportation and services;
•
investment in Sunoco Logistics;
•
retail marketing; and
•
all other.
Previously, our reportable segments included a separate segment for NGL transportation and services, which has now been combined into our liquids transportation and services segment and includes our operations related to NGL and crude, except for the crude transportation operations that are included in Sunoco Logistics. The liquids transportation and services segment includes the Bakken crude project, for which capital expenditures had previously been reported in the “All other” segment.
During the fourth quarter 2013, management realigned the composition of our reportable segments, and as a result, our natural gas marketing operations are now aggregated into the “all other” segment. These operations were previously reported in the midstream segment. Based on this change in our segment presentation, we have recast the presentation of our segment results for the prior years to be consistent with the current year presentation.
Intersegment and intrasegment transactions are generally based on transactions made at market-related rates. Consolidated revenues and expenses reflect the elimination of all material intercompany transactions.
Revenues from our intrastate transportation and storage segment are primarily reflected in natural gas sales and gathering, transportation and other fees. Revenues from our interstate transportation and storage segment are primarily reflected in gathering, transportation and other fees. Revenues from our midstream segment are primarily reflected in natural gas sales,
S - 69
NGL sales and gathering, transportation and other fees. Revenues from our liquids transportation and services segment are primarily reflected in NGL sales and gathering, transportation and other fees. Revenues from our investment in Sunoco Logistics segment are primarily reflected in crude sales. Revenues from our retail marketing segment are primarily reflected in refined product sales.
We report Segment Adjusted EBITDA as a measure of segment performance. We define Segment Adjusted EBITDA as earnings before interest, taxes, depreciation, amortization and other non-cash items, such as non-cash compensation expense, gains and losses on disposals of assets, the allowance for equity funds used during construction, unrealized gains and losses on commodity risk management activities, non-cash impairment charges, loss on extinguishment of debt, gain on deconsolidation and other non-operating income or expense items. Unrealized gains and losses on commodity risk management activities include unrealized gains and losses on commodity derivatives and inventory fair value adjustments (excluding lower of cost or market adjustments). Segment Adjusted EBITDA reflects amounts for unconsolidated affiliates based on the Partnership’s proportionate ownership.
The following tables present financial information by segment:
|
Years Ended December 31,
|
|||||||||||
|
2014
|
2013
|
2012
|
|||||||||
|
Revenues:
|
|||||||||||
|
Intrastate transportation and storage:
|
|||||||||||
|
Revenues from external customers
|
$
|
2,652
|
|
$
|
2,250
|
|
$
|
2,012
|
|
||
|
Intersegment revenues
|
205
|
|
202
|
|
179
|
|
|||||
|
2,857
|
|
2,452
|
|
2,191
|
|
||||||
|
Interstate transportation and storage:
|
|||||||||||
|
Revenues from external customers
|
1,057
|
|
1,270
|
|
1,109
|
|
|||||
|
Intersegment revenues
|
15
|
|
39
|
|
—
|
|
|||||
|
1,072
|
|
1,309
|
|
1,109
|
|
||||||
|
Midstream:
|
|||||||||||
|
Revenues from external customers
|
1,210
|
|
1,307
|
|
1,757
|
|
|||||
|
Intersegment revenues
|
1,713
|
|
942
|
|
196
|
|
|||||
|
2,923
|
|
2,249
|
|
1,953
|
|
||||||
|
Liquids transportation and services:
|
|||||||||||
|
Revenues from external customers
|
3,790
|
|
2,063
|
|
619
|
|
|||||
|
Intersegment revenues
|
121
|
|
64
|
|
31
|
|
|||||
|
3,911
|
|
2,127
|
|
650
|
|
||||||
|
Investment in Sunoco Logistics:
|
|||||||||||
|
Revenues from external customers
|
17,920
|
|
16,480
|
|
3,109
|
|
|||||
|
Intersegment revenues
|
168
|
|
159
|
|
80
|
|
|||||
|
18,088
|
|
16,639
|
|
3,189
|
|
||||||
|
Retail marketing:
|
|||||||||||
|
Revenues from external customers
|
22,484
|
|
21,004
|
|
5,926
|
|
|||||
|
Intersegment revenues
|
3
|
|
8
|
|
—
|
|
|||||
|
22,487
|
|
21,012
|
|
5,926
|
|
||||||
|
All other:
|
|||||||||||
|
Revenues from external customers
|
2,045
|
|
1,965
|
|
1,170
|
|
|||||
|
Intersegment revenues
|
349
|
|
402
|
|
385
|
|
|||||
|
2,394
|
|
2,367
|
|
1,555
|
|
||||||
|
Eliminations
|
(2,574
|
)
|
(1,816
|
)
|
(871
|
)
|
|||||
|
Total revenues
|
$
|
51,158
|
|
$
|
46,339
|
|
$
|
15,702
|
|
||
S - 70
|
Years Ended December 31,
|
|||||||||||
|
2014
|
2013
|
2012
|
|||||||||
|
Cost of products sold:
|
|||||||||||
|
Intrastate transportation and storage
|
$
|
2,169
|
|
$
|
1,737
|
|
$
|
1,394
|
|
||
|
Midstream
|
2,174
|
|
1,579
|
|
1,273
|
|
|||||
|
Liquids transportation and services
|
3,166
|
|
1,655
|
|
361
|
|
|||||
|
Investment in Sunoco Logistics
|
17,110
|
|
15,574
|
|
2,885
|
|
|||||
|
Retail marketing
|
21,154
|
|
20,150
|
|
5,757
|
|
|||||
|
All other
|
2,338
|
|
2,309
|
|
1,496
|
|
|||||
|
Eliminations
|
(2,571
|
)
|
(1,800
|
)
|
(900
|
)
|
|||||
|
Total cost of products sold
|
$
|
45,540
|
|
$
|
41,204
|
|
$
|
12,266
|
|
||
|
Years Ended December 31,
|
|||||||||||
|
2014
|
2013
|
2012
|
|||||||||
|
Depreciation and amortization:
|
|||||||||||
|
Intrastate transportation and storage
|
$
|
125
|
|
$
|
122
|
|
$
|
122
|
|
||
|
Interstate transportation and storage
|
203
|
|
244
|
|
209
|
|
|||||
|
Midstream
|
184
|
|
172
|
|
168
|
|
|||||
|
Liquids transportation and services
|
113
|
|
91
|
|
53
|
|
|||||
|
Investment in Sunoco Logistics
|
296
|
|
265
|
|
63
|
|
|||||
|
Retail marketing
|
189
|
|
114
|
|
28
|
|
|||||
|
All other
|
20
|
|
24
|
|
13
|
|
|||||
|
Total depreciation and amortization
|
$
|
1,130
|
|
$
|
1,032
|
|
$
|
656
|
|
||
|
Years Ended December 31,
|
|||||||||||
|
2014
|
2013
|
2012
|
|||||||||
|
Equity in earnings (losses) of unconsolidated affiliates:
|
|||||||||||
|
Intrastate transportation and storage
|
$
|
(1
|
)
|
$
|
—
|
|
$
|
4
|
|
||
|
Interstate transportation and storage
|
151
|
|
142
|
|
120
|
|
|||||
|
Midstream
|
—
|
|
—
|
|
(9
|
)
|
|||||
|
Liquids transportation and services
|
(3
|
)
|
(2
|
)
|
2
|
|
|||||
|
Investment in Sunoco Logistics
|
23
|
|
18
|
|
5
|
|
|||||
|
Retail marketing
|
2
|
|
2
|
|
1
|
|
|||||
|
All other
|
62
|
|
12
|
|
19
|
|
|||||
|
Total equity in earnings of unconsolidated affiliates
|
$
|
234
|
|
$
|
172
|
|
$
|
142
|
|
||
S - 71
|
Years Ended December 31,
|
|||||||||||
|
2014
|
2013
|
2012
|
|||||||||
|
Segment Adjusted EBITDA:
|
|||||||||||
|
Intrastate transportation and storage
|
$
|
500
|
|
$
|
464
|
|
$
|
601
|
|
||
|
Interstate transportation and storage
|
1,110
|
|
1,269
|
|
1,013
|
|
|||||
|
Midstream
|
608
|
|
479
|
|
467
|
|
|||||
|
Liquids transportation and services
|
591
|
|
351
|
|
209
|
|
|||||
|
Investment in Sunoco Logistics
|
971
|
|
871
|
|
219
|
|
|||||
|
Retail marketing
|
731
|
|
325
|
|
109
|
|
|||||
|
All other
|
318
|
|
194
|
|
126
|
|
|||||
|
Total Segment Adjusted EBITDA
|
4,829
|
|
3,953
|
|
2,744
|
|
|||||
|
Depreciation and amortization
|
(1,130
|
)
|
(1,032
|
)
|
(656
|
)
|
|||||
|
Interest expense, net of interest capitalized
|
(860
|
)
|
(849
|
)
|
(665
|
)
|
|||||
|
Gain on deconsolidation of Propane Business
|
—
|
|
—
|
|
1,057
|
|
|||||
|
Gain on sale of AmeriGas common units
|
177
|
|
87
|
|
—
|
|
|||||
|
Goodwill impairment
|
—
|
|
(689
|
)
|
—
|
|
|||||
|
Gains (losses) on interest rate derivatives
|
(157
|
)
|
44
|
|
(4
|
)
|
|||||
|
Non-cash unit-based compensation expense
|
(58
|
)
|
(47
|
)
|
(42
|
)
|
|||||
|
Unrealized gains (losses) on commodity risk management activities
|
23
|
|
51
|
|
(9
|
)
|
|||||
|
Inventory valuation adjustments
|
(473
|
)
|
3
|
|
(75
|
)
|
|||||
|
Loss on extinguishment of debt
|
—
|
|
—
|
|
(115
|
)
|
|||||
|
Non-operating environmental remediation
|
—
|
|
(168
|
)
|
—
|
|
|||||
|
Adjusted EBITDA related to discontinued operations
|
(27
|
)
|
(76
|
)
|
(99
|
)
|
|||||
|
Adjusted EBITDA related to unconsolidated affiliates
|
(674
|
)
|
(629
|
)
|
(480
|
)
|
|||||
|
Equity in earnings of unconsolidated affiliates
|
234
|
|
172
|
|
142
|
|
|||||
|
Other, net
|
(40
|
)
|
12
|
|
22
|
|
|||||
|
Income from continuing operations before income tax expense
|
$
|
1,844
|
|
$
|
832
|
|
$
|
1,820
|
|
||
|
December 31,
|
|||||||||||
|
2014
|
2013
|
2012
|
|||||||||
|
Assets:
|
|||||||||||
|
Intrastate transportation and storage
|
$
|
4,563
|
|
$
|
4,606
|
|
$
|
4,691
|
|
||
|
Interstate transportation and storage
|
10,082
|
|
10,988
|
|
11,794
|
|
|||||
|
Midstream
|
3,548
|
|
3,133
|
|
4,946
|
|
|||||
|
Liquids transportation and services
|
4,581
|
|
4,326
|
|
3,765
|
|
|||||
|
Investment in Sunoco Logistics
|
13,619
|
|
11,650
|
|
10,291
|
|
|||||
|
Retail marketing
|
8,930
|
|
3,936
|
|
3,926
|
|
|||||
|
All other
|
2,898
|
|
5,063
|
|
3,817
|
|
|||||
|
Total assets
|
$
|
48,221
|
|
$
|
43,702
|
|
$
|
43,230
|
|
||
S - 72
|
Years Ended December 31,
|
|||||||||||
|
2014
|
2013
|
2012
|
|||||||||
|
Additions to property, plant and equipment excluding acquisitions, net of contributions in aid of construction costs (accrual basis):
|
|||||||||||
|
Intrastate transportation and storage
|
$
|
169
|
|
$
|
47
|
|
$
|
37
|
|
||
|
Interstate transportation and storage
|
411
|
|
152
|
|
133
|
|
|||||
|
Midstream
|
667
|
|
565
|
|
1,317
|
|
|||||
|
Liquids transportation and services
|
427
|
|
443
|
|
1,302
|
|
|||||
|
Investment in Sunoco Logistics
|
2,510
|
|
1,018
|
|
139
|
|
|||||
|
Retail marketing
|
259
|
|
176
|
|
58
|
|
|||||
|
All other
|
35
|
|
54
|
|
63
|
|
|||||
|
Total additions to property, plant and equipment excluding acquisitions, net of contributions in aid of construction costs
|
$
|
4,478
|
|
$
|
2,455
|
|
$
|
3,049
|
|
||
|
December 31,
|
|||||||||||
|
2014
|
2013
|
2012
|
|||||||||
|
Advances to and investments in unconsolidated affiliates:
|
|||||||||||
|
Intrastate transportation and storage
|
$
|
1
|
|
$
|
1
|
|
$
|
2
|
|
||
|
Interstate transportation and storage
|
1,954
|
|
2,040
|
|
2,142
|
|
|||||
|
Midstream
|
—
|
|
—
|
|
1
|
|
|||||
|
Liquids transportation and services
|
31
|
|
29
|
|
29
|
|
|||||
|
Investment in Sunoco Logistics
|
226
|
|
125
|
|
118
|
|
|||||
|
Retail marketing
|
19
|
|
22
|
|
21
|
|
|||||
|
All other
|
1,609
|
|
2,219
|
|
1,189
|
|
|||||
|
Total advances to and investments in unconsolidated affiliates
|
$
|
3,840
|
|
$
|
4,436
|
|
$
|
3,502
|
|
||
|
16.
|
QUARTERLY FINANCIAL DATA (UNAUDITED):
|
Summarized unaudited quarterly financial data is presented below. The sum of net income per Limited Partner unit by quarter does not equal the net income per limited partner unit for the year due to the computation of income allocation between the General Partner and Limited Partners and variations in the weighted average units outstanding used in computing such amounts.
|
Quarters Ended
|
||||||||||||||||||||
|
March 31
|
June 30
|
September 30
|
December 31
|
Total Year
|
||||||||||||||||
|
2014:
|
||||||||||||||||||||
|
Revenues
|
$
|
12,232
|
|
$
|
13,029
|
|
$
|
13,618
|
|
$
|
12,279
|
|
$
|
51,158
|
|
|||||
|
Gross profit
|
1,366
|
|
1,393
|
|
1,494
|
|
1,365
|
|
5,618
|
|
||||||||||
|
Operating income
|
688
|
|
736
|
|
668
|
|
383
|
|
2,475
|
|
||||||||||
|
Net income
|
491
|
|
581
|
|
447
|
|
34
|
|
1,553
|
|
||||||||||
|
Common Unitholders’ interest in net income (loss)
|
253
|
|
295
|
|
148
|
|
(90
|
)
|
606
|
|
||||||||||
|
Basic net income (loss) per Common Unit
|
$
|
0.76
|
|
$
|
0.92
|
|
$
|
0.44
|
|
$
|
(0.28
|
)
|
$
|
1.77
|
|
|||||
|
Diluted net income (loss) per Common Unit
|
$
|
0.76
|
|
$
|
0.92
|
|
$
|
0.44
|
|
$
|
(0.28
|
)
|
$
|
1.77
|
|
|||||
S - 73
|
Quarters Ended
|
||||||||||||||||||||
|
March 31
|
June 30
|
September 30
|
December 31
|
Total Year
|
||||||||||||||||
|
2013:
|
||||||||||||||||||||
|
Revenues
|
$
|
10,854
|
|
$
|
11,551
|
|
$
|
11,902
|
|
$
|
12,032
|
|
$
|
46,339
|
|
|||||
|
Gross profit
|
1,260
|
|
1,322
|
|
1,248
|
|
1,305
|
|
5,135
|
|
||||||||||
|
Operating income (loss)
|
534
|
|
632
|
|
526
|
|
(151
|
)
|
1,541
|
|
||||||||||
|
Net income (loss)
|
424
|
|
413
|
|
404
|
|
(473
|
)
|
768
|
|
||||||||||
|
Common Unitholders’ interest in net income (loss)
|
194
|
|
165
|
|
209
|
|
(666
|
)
|
(98
|
)
|
||||||||||
|
Basic net income (loss) per Common Unit
|
$
|
0.63
|
|
$
|
0.53
|
|
$
|
0.55
|
|
$
|
(1.90
|
)
|
$
|
(0.18
|
)
|
|||||
|
Diluted net income (loss) per Common Unit
|
$
|
0.63
|
|
$
|
0.53
|
|
$
|
0.55
|
|
$
|
(1.90
|
)
|
$
|
(0.18
|
)
|
|||||
The three months ended
December 31, 2014
reflected the unfavorable impacts of
$456 million
related to non-cash inventory valuation adjustments primarily in our investment in Sunoco Logistics and retail marketing segments. The three months ended
December 31, 2013
reflected ETP’s recognition of a goodwill impairment of
$689 million
.
For the three months ended
December 31, 2014
and
2013
, distributions paid for the period exceeded net income attributable to partners by
$544 million
and
$1.12 billion
, respectively. Accordingly, the distributions paid to the General Partner, including incentive distributions, further exceeded net income, and as a result, a net loss was allocated to the Limited Partners for the period.
S - 74
|
2.
|
REGENCY ENERGY PARTNERS LP FINANCIAL STATEMENTS
|
INDEX TO CONSOLIDATED FINANCIAL STATEMENTS
|
|
Page
|
|
Report of Independent Registered Public Accounting Firm
|
S - 78
|
|
Consolidated Balance Sheets – December 31, 2014 and 2013
|
S - 79
|
|
Consolidated Statements of Operations – Years Ended December 31, 2014, 2013 and 2012
|
S - 81
|
|
Consolidated Statements of Comprehensive Income – Years Ended December 31, 2014, 2013 and 2012
|
S - 82
|
|
Consolidated Statements of Cash Flows – Years Ended December 31, 2014, 2013 and 2012
|
S - 83
|
|
Consolidated Statements of Partners’ Capital and Noncontrolling Interest
– Years Ended December 31, 2014, 2013 and 2012 |
S - 85
|
|
Notes to Consolidated Financial Statements
|
S - 87
|
S - 75
Introductory Statement
References in this report to the “Partnership,” “we,” “our,” “us” and similar terms refer to Regency Energy Partners LP and its subsidiaries. We use the following definitions in these consolidated financial statements and footnotes:
|
Name
|
Definition or Description
|
|
|
2018 Notes
|
$600 million of 6.875% senior notes with original maturity on December 1, 2018
|
|
|
AOCI
|
Accumulated Other Comprehensive Income (Loss)
|
|
|
Aqua - PVR
|
Aqua - PVR Water Services, LLC
|
|
|
ARO
|
Asset Retirement Obligation
|
|
|
APM
|
Anadarko Pecos Midstream LLC
|
|
|
Barclays
|
Barclays Capital Inc.
|
|
|
bps
|
Basis points
|
|
|
Citi
|
Citigroup Global Markets Inc.
|
|
|
CM
|
Chesapeake West Texas Processing, L.L.C.
|
|
|
Coal Handling
|
Coal Handling Solutions LLC, Kingsport Handling LLC, and Kingsport Services LLC, now known as Materials Handling Solutions LLC
|
|
|
Eagle Rock
|
Eagle Rock Energy Partners, L.P.
|
|
|
EFS Haynesville
|
EFS Haynesville, LLC, a wholly-owned subsidiary of GECC
|
|
|
ELG
|
Edwards Lime Gathering LLC and its wholly-owned subsidiaries, ELG Oil LLC and ELG Utility LLC
|
|
|
EPD
|
Enterprise Products Partners L.P.
|
|
|
ETC
|
Energy Transfer Company, the name assumed by La Grange Acquisition, L.P. for conducting business and shared services, a wholly-owned subsidiary of ETP
|
|
|
ETE
|
Energy Transfer Equity, L.P.
|
|
|
ETE Common Holdings
|
ETE Common Holdings, LLC, a wholly-owned subsidiary of ETE
|
|
|
ETE GP
|
ETE GP Acquirer LLC
|
|
|
ETP
|
Energy Transfer Partners, L.P.
|
|
|
ETP GP
|
Energy Transfer Partners GP, LP
|
|
|
Exchange Act
|
Securities Exchange Act of 1934, as amended
|
|
|
FASB
|
Financial Accounting Standards Board
|
|
|
FASB ASC
|
FASB Accounting Standards Codification
|
|
|
Finance Corp.
|
Regency Energy Finance Corp., a wholly-owned subsidiary of the Partnership
|
|
|
GAAP
|
Accounting principles generally accepted in the United States of America
|
|
|
General Partner
|
Regency GP LP, the general partner of the Partnership, or Regency GP LLC, the general partner of Regency GP LP, which effectively manages the business and affairs of the Partnership through its board of directors and Regency Employees Management LLC
|
|
|
Grey Ranch
|
Grey Ranch Plant LP, a former joint venture of the Partnership
|
|
|
Gulf States
|
Gulf States Transmission LLC, a wholly-owned subsidiary of the Partnership
|
|
|
Holdco
|
ETP Holdco Corporation
|
|
|
Hoover
|
Hoover Energy Partners, LP
|
|
|
HPC
|
RIGS Haynesville Partnership Co. and its wholly-owned subsidiary, Regency Intrastate Gas LP
|
|
|
IDRs
|
Incentive Distribution Rights
|
|
|
IRS
|
Internal Revenue Service
|
|
|
KMP
|
Kinder Morgan Energy Partners, L.P.
|
|
|
LDH
|
LDH Energy Asset Holdings LLC
|
|
|
LIBOR
|
London Interbank Offered Rate
|
|
|
Lone Star
|
Lone Star NGL LLC
|
|
|
LTIP
|
Long-Term Incentive Plan
|
|
S - 76
|
Name
|
Definition or Description
|
|
|
MEP
|
Midcontinent Express Pipeline LLC
|
|
|
Mi Vida JV
|
Mi Vida JV LLC
|
|
|
MLP
|
Master Limited Partnership
|
|
|
NGLs
|
Natural gas liquids, including ethane, propane, normal butane, iso butane and natural gasoline
|
|
|
NMED
|
New Mexico Environmental Development
|
|
|
NYSE
|
New York Stock Exchange
|
|
|
ORS
|
Ohio River System LLC
|
|
|
PADEP
|
Pennsylvania Department of Environmental Protection
|
|
|
Partnership
|
Regency Energy Partners LP
|
|
|
PEPL
|
Panhandle Eastern Pipe Line Company, LP
|
|
|
PEPL Holdings
|
PEPL Holdings, LLC, a former wholly-owned subsidiary of Southern Union that merged into PEPL
|
|
|
PVR
|
PVR Partners, L.P.
|
|
|
Ranch JV
|
Ranch Westex JV LLC
|
|
|
Regency Western
|
Regency Western G&P LLC, a wholly-owned subsidiary of the Partnership
|
|
|
RGS
|
Regency Gas Services, LP, a wholly-owned subsidiary of the Partnership
|
|
|
RIGS
|
Regency Intrastate Gas System
|
|
|
SEC
|
Securities and Exchange Commission
|
|
|
Securities Act
|
Securities Act of 1933, as amended
|
|
|
Senior Notes
|
The collective of 2019 Notes, 2020 Notes, 2020 PVR Notes, 2021 Notes, 2021 PVR Notes, 2022 Notes, October 2022 Notes, 2023 4.5% Notes and 2023 5.5% Notes
|
|
|
Series A Preferred Units
|
Series A convertible redeemable preferred units
|
|
|
Services Co.
|
ETE Services Company, LLC
|
|
|
Southern Union
|
Southern Union Company
|
|
|
SUGS
|
Southern Union Gas Services
|
|
|
SUN
|
Sunoco LP (formerly known as Susser, L.P.)
|
|
|
Sweeny JV
|
Sweeny Gathering, L.P.
|
|
|
SXL
|
Sunoco Logistics Partners L.P.
|
|
|
TCEQ
|
Texas Commission on Environmental Quality
|
|
|
U.S.
|
United States
|
|
|
Wells Fargo
|
Wells Fargo Securities, LLC
|
|
|
WTI
|
West Texas Intermediate Crude
|
|
S - 77
REPORT OF INDEPENDENT REGISTERED PUBLIC ACCOUNTING FIRM
Partners
Regency Energy Partners LP
We have audited the accompanying consolidated balance sheets of Regency Energy Partners LP (a Delaware limited partnership) and subsidiaries (the “Partnership”) as of December 31, 2014 and 2013, and the related consolidated statements of operations, comprehensive income, cash flows, and partners’ capital and noncontrolling interest for each of the three years in the period ended December 31, 2014. These financial statements are the responsibility of the Partnership’s management. Our responsibility is to express an opinion on these financial statements based on our audits. We did not audit the financial statements of Midcontinent Express Pipeline LLC, a 50 percent owned investee company, the Partnership’s investment in which is accounted for under the equity method of accounting. The Partnership’s investment in Midcontinent Express Pipeline LLC as of December 31, 2014 and 2013 was $695 million and $549 million, respectively, and its equity in the earnings of Midcontinent Express Pipeline LLC was $45 million, $40 million, and $42 million, respectively, for each of the three years in the period ended December 31, 2014. Those statements were audited by other auditors, whose report has been furnished to us, and our opinion, insofar as it relates to the amounts included for Midcontinent Express Pipeline LLC, is based solely on the report of the other auditors.
We conducted our audits in accordance with the standards of the Public Company Accounting Oversight Board (United States). Those standards require that we plan and perform the audit to obtain reasonable assurance about whether the financial statements are free of material misstatement. An audit includes examining, on a test basis, evidence supporting the amounts and disclosures in the financial statements. An audit also includes assessing the accounting principles used and significant estimates made by management, as well as evaluating the overall financial statement presentation. We believe that our audits and the report of the other auditors provide a reasonable basis for our opinion.
In our opinion, based on our audits and the report of the other auditors, the consolidated financial statements referred to above present fairly, in all material respects, the financial position of Regency Energy Partners LP and subsidiaries as of December 31, 2014 and 2013, and the results of their operations and their cash flows for each of the three years in the period ended December 31, 2014 in conformity with accounting principles generally accepted in the United States of America.
We also have audited, in accordance with the standards of the Public Company Accounting Oversight Board (United States), the Partnership’s internal control over financial reporting as of December 31, 2014, based on criteria established in the 2013
Internal Control-Integrated Framework
issued by the Committee of Sponsoring Organizations of the Treadway Commission (COSO), and our report dated February 26, 2015 (not separately included herein) expressed an unqualified opinion thereon.
/s/ GRANT THORNTON LLP
Dallas, Texas
February 26, 2015
S - 78
REGENCY ENERGY PARTNERS LP
CONSOLIDATED BALANCE SHEETS
(Dollars in millions)
|
|
December 31,
|
||||||
|
2014
|
2013
|
||||||
|
ASSETS
|
|||||||
|
Current Assets:
|
|||||||
|
Cash and cash equivalents
|
$
|
24
|
|
$
|
19
|
|
|
|
Trade accounts receivable, net of allowance for doubtful accounts of $7 and $1
|
483
|
|
292
|
|
|||
|
Related party receivables
|
45
|
|
28
|
|
|||
|
Inventories
|
67
|
|
42
|
|
|||
|
Derivative assets
|
75
|
|
3
|
|
|||
|
Other current assets
|
9
|
|
16
|
|
|||
|
Total current assets
|
703
|
|
400
|
|
|||
|
Property, Plant and Equipment:
|
|||||||
|
Gathering and transmission systems
|
5,207
|
|
1,671
|
|
|||
|
Compression equipment
|
2,378
|
|
1,627
|
|
|||
|
Gas plants and buildings
|
386
|
|
825
|
|
|||
|
Other property, plant and equipment
|
679
|
|
414
|
|
|||
|
Natural resources
|
454
|
|
—
|
|
|||
|
Construction-in-progress
|
1,156
|
|
513
|
|
|||
|
Total property, plant and equipment
|
10,260
|
|
5,050
|
|
|||
|
Less accumulated depreciation and depletion
|
(1,043
|
)
|
(632
|
)
|
|||
|
Property, plant and equipment, net
|
9,217
|
|
4,418
|
|
|||
|
Other Assets:
|
|||||||
|
Investments in unconsolidated affiliates
|
2,418
|
|
2,097
|
|
|||
|
Other, net of accumulated amortization of debt issuance costs of $28 and $24
|
103
|
|
57
|
|
|||
|
Total other assets
|
2,521
|
|
2,154
|
|
|||
|
Intangible Assets and Goodwill:
|
|||||||
|
Intangible assets, net of accumulated amortization of $212 and $107
|
3,439
|
|
682
|
|
|||
|
Goodwill
|
1,223
|
|
1,128
|
|
|||
|
Total intangible assets and goodwill
|
4,662
|
|
1,810
|
|
|||
|
TOTAL ASSETS
|
$
|
17,103
|
|
$
|
8,782
|
|
|
S - 79
REGENCY ENERGY PARTNERS LP
CONSOLIDATED BALANCE SHEETS
(Dollars in millions)
|
|
December 31,
|
||||||
|
2014
|
2013
|
||||||
|
LIABILITIES AND PARTNERS’ CAPITAL AND NONCONTROLLING INTEREST
|
|||||||
|
Current Liabilities:
|
|||||||
|
Drafts payable
|
$
|
15
|
|
$
|
26
|
|
|
|
Trade accounts payable
|
529
|
|
291
|
|
|||
|
Related party payables
|
64
|
|
69
|
|
|||
|
Accrued expenses
|
43
|
|
25
|
|
|||
|
Accrued interest
|
81
|
|
38
|
|
|||
|
Other current liabilities
|
24
|
|
26
|
|
|||
|
Total current liabilities
|
756
|
|
475
|
|
|||
|
Long-term derivative liabilities
|
16
|
|
19
|
|
|||
|
Other long-term liabilities
|
72
|
|
30
|
|
|||
|
Long-term debt, net
|
6,641
|
|
3,310
|
|
|||
|
Commitments and contingencies
|
|||||||
|
Series A Preferred Units, redemption amount of $38 and $38
|
33
|
|
32
|
|
|||
|
Partners’ Capital and Noncontrolling Interest:
|
|||||||
|
Common units (412,681,151 and 214,287,955 units authorized; 409,406,482 and 210,850,232 units issued and outstanding at December 31, 2014 and 2013)
|
8,531
|
|
3,886
|
|
|||
|
Class F units (6,274,483 units authorized, issued and outstanding at December 31, 2014 and 2013)
|
153
|
|
146
|
|
|||
|
General partner interest
|
781
|
|
782
|
|
|||
|
Total partners’ capital
|
9,465
|
|
4,814
|
|
|||
|
Noncontrolling interest
|
120
|
|
102
|
|
|||
|
Total partners’ capital and noncontrolling interest
|
9,585
|
|
4,916
|
|
|||
|
TOTAL LIABILITIES AND PARTNERS’ CAPITAL AND NONCONTROLLING INTEREST
|
$
|
17,103
|
|
$
|
8,782
|
|
|
S - 80
REGENCY ENERGY PARTNERS LP
CONSOLIDATED STATEMENTS OF OPERATIONS
(Dollars in millions, except unit data and per unit data)
|
Years Ended December 31,
|
|||||||||||
|
|
2014
|
2013
|
2012
|
||||||||
|
REVENUES
|
|||||||||||
|
Gas sales, including related party amounts of $80, $71, and $42
|
$
|
1,903
|
|
$
|
826
|
|
$
|
508
|
|
||
|
NGL sales, including related party amounts of $282, $81, and $28
|
1,741
|
|
1,053
|
|
991
|
|
|||||
|
Gathering, transportation and other fees, including related party amounts of $23, $26, and $29
|
989
|
|
545
|
|
401
|
|
|||||
|
Net realized and unrealized gain (loss) from derivatives
|
93
|
|
(8
|
)
|
23
|
|
|||||
|
Other
|
225
|
|
105
|
|
77
|
|
|||||
|
Total revenues
|
4,951
|
|
2,521
|
|
2,000
|
|
|||||
|
OPERATING COSTS AND EXPENSES
|
|||||||||||
|
Cost of sales, including related party amounts of $66, $56, and $35
|
3,452
|
|
1,793
|
|
1,387
|
|
|||||
|
Operation and maintenance
|
448
|
|
296
|
|
228
|
|
|||||
|
General and administrative
|
158
|
|
88
|
|
100
|
|
|||||
|
(Gain) loss on asset sales, net
|
(1
|
)
|
2
|
|
3
|
|
|||||
|
Depreciation, depletion and amortization
|
541
|
|
287
|
|
252
|
|
|||||
|
Goodwill impairment
|
370
|
|
—
|
|
—
|
|
|||||
|
Total operating costs and expenses
|
4,968
|
|
2,466
|
|
1,970
|
|
|||||
|
OPERATING (LOSS) INCOME
|
(17
|
)
|
55
|
|
30
|
|
|||||
|
Income from unconsolidated affiliates
|
195
|
|
135
|
|
105
|
|
|||||
|
Interest expense, net
|
(304
|
)
|
(164
|
)
|
(122
|
)
|
|||||
|
Loss on debt refinancing, net
|
(25
|
)
|
(7
|
)
|
(8
|
)
|
|||||
|
Other income and deductions, net
|
12
|
|
7
|
|
29
|
|
|||||
|
(LOSS) INCOME BEFORE INCOME TAXES
|
(139
|
)
|
26
|
|
34
|
|
|||||
|
Income tax expense (benefit)
|
3
|
|
(1
|
)
|
—
|
|
|||||
|
NET (LOSS) INCOME
|
$
|
(142
|
)
|
$
|
27
|
|
$
|
34
|
|
||
|
Net income attributable to noncontrolling interest
|
(15
|
)
|
(8
|
)
|
(2
|
)
|
|||||
|
NET (LOSS) INCOME ATTRIBUTABLE TO REGENCY ENERGY PARTNERS LP
|
$
|
(157
|
)
|
$
|
19
|
|
$
|
32
|
|
||
|
Amounts attributable to Series A preferred units
|
4
|
|
6
|
|
10
|
|
|||||
|
General partner’s interest, including IDRs
|
31
|
|
11
|
|
9
|
|
|||||
|
Beneficial conversion feature for Class F units
|
7
|
|
4
|
|
—
|
|
|||||
|
Pre-acquisition loss from SUGS allocated to predecessor equity
|
—
|
|
(36
|
)
|
(14
|
)
|
|||||
|
Limited partners’ interest in net (loss) income
|
$
|
(199
|
)
|
$
|
34
|
|
$
|
27
|
|
||
|
Basic and diluted (loss) income per common unit:
|
|||||||||||
|
Limited partners’ interest in net (loss) income
|
$
|
(199
|
)
|
$
|
34
|
|
$
|
27
|
|
||
|
Weighted average number of common units outstanding
|
348,070,121
|
|
196,227,348
|
|
167,492,735
|
|
|||||
|
Basic (loss) income per common unit
|
$
|
(0.57
|
)
|
$
|
0.17
|
|
$
|
0.16
|
|
||
|
Diluted (loss) income per common unit
|
$
|
(0.57
|
)
|
$
|
0.17
|
|
$
|
0.13
|
|
||
|
Distributions per common unit
|
$
|
1.975
|
|
$
|
1.87
|
|
$
|
1.84
|
|
||
|
Amount allocated to beneficial conversion feature for Class F units
|
$
|
7
|
|
$
|
4
|
|
$
|
—
|
|
||
|
Total number of Class F units outstanding
|
6,274,483
|
|
6,274,483
|
|
—
|
|
|||||
|
Income per Class F unit due to beneficial conversion feature
|
$
|
1.08
|
|
$
|
0.72
|
|
$
|
—
|
|
||
S - 81
REGENCY ENERGY PARTNERS LP
CONSOLIDATED STATEMENTS OF COMPREHENSIVE (LOSS) INCOME
(Dollars in millions)
|
Years Ended December 31,
|
|||||||||||
|
|
2014
|
2013
|
2012
|
||||||||
|
Net (loss) income
|
$
|
(142
|
)
|
$
|
27
|
|
$
|
34
|
|
||
|
Other comprehensive income:
|
|||||||||||
|
Net cash flow hedge amounts reclassified to earnings
|
—
|
|
—
|
|
6
|
|
|||||
|
Change in fair value of cash flow hedges
|
—
|
|
—
|
|
(4
|
)
|
|||||
|
Total other comprehensive income
|
$
|
—
|
|
$
|
—
|
|
$
|
2
|
|
||
|
Comprehensive (loss) income
|
$
|
(142
|
)
|
$
|
27
|
|
$
|
36
|
|
||
|
Comprehensive income attributable to noncontrolling interest
|
15
|
|
8
|
|
2
|
|
|||||
|
Comprehensive (loss) income attributable to Regency Energy Partners LP
|
$
|
(157
|
)
|
$
|
19
|
|
$
|
34
|
|
||
S - 82
REGENCY ENERGY PARTNERS LP
CONSOLIDATED STATEMENTS OF CASH FLOWS
(Dollars in millions)
|
Years Ended December 31,
|
|||||||||||
|
|
2014
|
2013
|
2012
|
||||||||
|
OPERATING ACTIVITIES
|
|||||||||||
|
Net (loss) income
|
$
|
(142
|
)
|
$
|
27
|
|
$
|
34
|
|
||
|
Reconciliation of net (loss) income to net cash flows provided by operating activities:
|
|||||||||||
|
Depreciation, depletion and amortization, including debt issuance cost amortization and bond premium write-off and amortization
|
525
|
|
293
|
|
259
|
|
|||||
|
Income from unconsolidated affiliates
|
(195
|
)
|
(135
|
)
|
(105
|
)
|
|||||
|
Derivative valuation changes
|
(93
|
)
|
6
|
|
(12
|
)
|
|||||
|
(Gain) loss on asset sales, net
|
(1
|
)
|
2
|
|
3
|
|
|||||
|
Unit-based compensation expenses
|
10
|
|
7
|
|
5
|
|
|||||
|
Revaluation of unconsolidated affiliate upon acquisition
|
(6
|
)
|
—
|
|
—
|
|
|||||
|
Goodwill impairment
|
370
|
|
—
|
|
—
|
|
|||||
|
Cash flow changes in current assets and liabilities:
|
|||||||||||
|
Trade accounts receivable and related party receivables
|
28
|
|
(96
|
)
|
—
|
|
|||||
|
Other current assets and other current liabilities
|
34
|
|
(54
|
)
|
10
|
|
|||||
|
Trade accounts payable and related party payables
|
(16
|
)
|
119
|
|
18
|
|
|||||
|
Distributions of earnings received from unconsolidated affiliates
|
204
|
|
142
|
|
121
|
|
|||||
|
Cash flow changes in other assets and liabilities
|
1
|
|
125
|
|
(9
|
)
|
|||||
|
Net cash flows provided by operating activities
|
719
|
|
436
|
|
324
|
|
|||||
|
INVESTING ACTIVITIES
|
|||||||||||
|
Capital expenditures
|
(1,088
|
)
|
(1,034
|
)
|
(560
|
)
|
|||||
|
Contributions to unconsolidated affiliates
|
(355
|
)
|
(148
|
)
|
(356
|
)
|
|||||
|
Distributions in excess of earnings of unconsolidated affiliates
|
68
|
|
249
|
|
83
|
|
|||||
|
Acquisitions, net of cash received
|
(805
|
)
|
(475
|
)
|
—
|
|
|||||
|
Proceeds from asset sales
|
11
|
|
15
|
|
26
|
|
|||||
|
Net cash flows used in investing activities
|
(2,169
|
)
|
(1,393
|
)
|
(807
|
)
|
|||||
|
FINANCING ACTIVITIES
|
|||||||||||
|
Borrowings (repayments) under revolving credit facility, net
|
380
|
|
318
|
|
(140
|
)
|
|||||
|
Proceeds from issuance of senior notes
|
1,580
|
|
1,000
|
|
700
|
|
|||||
|
Redemptions of senior notes
|
(983
|
)
|
(163
|
)
|
(88
|
)
|
|||||
|
Debt issuance costs
|
(31
|
)
|
(24
|
)
|
(15
|
)
|
|||||
|
Partner distributions and distributions on unvested unit awards
|
(706
|
)
|
(386
|
)
|
(322
|
)
|
|||||
|
Noncontrolling interest contributions, net of distributions
|
3
|
|
17
|
|
42
|
|
|||||
|
Contributions from previous parent
|
—
|
|
—
|
|
51
|
|
|||||
|
Drafts payable
|
(11
|
)
|
18
|
|
4
|
|
|||||
|
Common units issued under unit offerings, equity distribution program and LTIP, net of issuance costs, forfeitures and tax withholding
|
1,227
|
|
149
|
|
311
|
|
|||||
|
Distributions to Series A Preferred Units
|
(4
|
)
|
(6
|
)
|
(8
|
)
|
|||||
|
Net cash flows provided by financing activities
|
1,455
|
|
923
|
|
535
|
|
|||||
S - 83
REGENCY ENERGY PARTNERS LP
CONSOLIDATED STATEMENTS OF CASH FLOWS
(Dollars in millions)
|
Years Ended December 31,
|
|||||||||||
|
|
2014
|
2013
|
2012
|
||||||||
|
Net change in cash and cash equivalents
|
5
|
|
(34
|
)
|
52
|
|
|||||
|
Cash and cash equivalents at beginning of period
|
19
|
|
53
|
|
1
|
|
|||||
|
Cash and cash equivalents at end of period
|
$
|
24
|
|
$
|
19
|
|
$
|
53
|
|
||
|
Supplemental cash flow information:
|
|||||||||||
|
Accrued capital expenditures
|
$
|
102
|
|
$
|
60
|
|
$
|
136
|
|
||
|
Issuance of Class F and common units in connection with SUGS Acquisition
|
—
|
|
961
|
|
—
|
|
|||||
|
Issuance of common units in connection with PVR, Hoover, and Eagle Rock acquisitions
|
4,281
|
|
—
|
|
—
|
|
|||||
|
Long-term debt assumed in PVR Acquisition
|
1,887
|
|
—
|
|
—
|
|
|||||
|
Long-term debt exchanged in connection with the Eagle Rock Midstream Acquisition
|
499
|
|
—
|
|
—
|
|
|||||
|
Interest paid, net of amounts capitalized
|
303
|
|
146
|
|
112
|
|
|||||
|
Accrued capital contribution to unconsolidated affiliate
|
—
|
|
13
|
|
23
|
|
|||||
S - 84
REGENCY ENERGY PARTNERS LP
CONSOLIDATED STATEMENTS OF PARTNERS’ CAPITAL
AND NONCONTROLLING INTEREST
(Dollars in millions)
|
Regency Energy Partners LP
|
|||||||||||||||||||||||||||
|
Common
Units
|
Class F Units
|
General
Partner
Interest
|
Predecessor Equity
|
AOCI
|
Non-controlling
Interest
|
Total
|
|||||||||||||||||||||
|
Balance - December 31, 2011
|
$
|
3,173
|
|
$
|
—
|
|
$
|
330
|
|
$
|
—
|
|
$
|
(5
|
)
|
$
|
33
|
|
$
|
3,531
|
|
||||||
|
Common unit offerings, net of costs
|
297
|
|
—
|
|
—
|
|
—
|
|
—
|
|
—
|
|
297
|
|
|||||||||||||
|
Issuance of common units under equity distribution program, net of costs
|
15
|
|
—
|
|
—
|
|
—
|
|
—
|
|
—
|
|
15
|
|
|||||||||||||
|
Common units issued under LTIP, net of forfeitures and tax withholding
|
(1
|
)
|
—
|
|
—
|
|
—
|
|
—
|
|
—
|
|
(1
|
)
|
|||||||||||||
|
Unit-based compensation expenses
|
5
|
|
—
|
|
—
|
|
—
|
|
—
|
|
—
|
|
5
|
|
|||||||||||||
|
Partner distributions
|
(309
|
)
|
—
|
|
(13
|
)
|
—
|
|
—
|
|
—
|
|
(322
|
)
|
|||||||||||||
|
Net income (loss)
|
37
|
|
—
|
|
9
|
|
(14
|
)
|
—
|
|
2
|
|
34
|
|
|||||||||||||
|
Noncontrolling interest contributions, net of distributions
|
—
|
|
—
|
|
—
|
|
—
|
|
—
|
|
42
|
|
42
|
|
|||||||||||||
|
Distributions to Series A Preferred Units
|
(8
|
)
|
—
|
|
—
|
|
—
|
|
—
|
|
—
|
|
(8
|
)
|
|||||||||||||
|
Accretion of Series A Preferred Units
|
(2
|
)
|
—
|
|
—
|
|
—
|
|
—
|
|
—
|
|
(2
|
)
|
|||||||||||||
|
Net cash flow hedge amounts reclassified to earnings
|
—
|
|
—
|
|
—
|
|
—
|
|
5
|
|
—
|
|
5
|
|
|||||||||||||
|
Contribution of net investment to unitholders
|
—
|
|
—
|
|
—
|
|
1,747
|
|
(3
|
)
|
—
|
|
1,744
|
|
|||||||||||||
|
Balance - December 31, 2012
|
$
|
3,207
|
|
$
|
—
|
|
$
|
326
|
|
$
|
1,733
|
|
$
|
(3
|
)
|
$
|
77
|
|
$
|
5,340
|
|
||||||
|
Contribution of net investment to the Partnership
|
—
|
|
—
|
|
1,925
|
|
(1,928
|
)
|
3
|
|
—
|
|
—
|
|
|||||||||||||
|
Issuance of common units in connection with the SUGS Acquisition, net of costs
|
819
|
|
—
|
|
(819
|
)
|
—
|
|
—
|
|
—
|
|
—
|
|
|||||||||||||
|
Issuance of Class F units in connection with the SUGS Acquisition, net of costs
|
—
|
|
142
|
|
(142
|
)
|
—
|
|
—
|
|
—
|
|
—
|
|
|||||||||||||
|
Contribution of assets between entities under common control below historical cost
|
—
|
|
—
|
|
(504
|
)
|
231
|
|
—
|
|
—
|
|
(273
|
)
|
|||||||||||||
|
Issuance of common units under equity distribution program, net of costs
|
149
|
|
—
|
|
—
|
|
—
|
|
—
|
|
—
|
|
149
|
|
|||||||||||||
|
Conversion of Series A Preferred Units for common units
|
41
|
|
—
|
|
—
|
|
—
|
|
—
|
|
—
|
|
41
|
|
|||||||||||||
|
Unit-based compensation expenses
|
7
|
|
—
|
|
—
|
|
—
|
|
—
|
|
—
|
|
7
|
|
|||||||||||||
|
Partner distributions and distributions on unvested unit awards
|
(371
|
)
|
—
|
|
(15
|
)
|
—
|
|
—
|
|
—
|
|
(386
|
)
|
|||||||||||||
|
Noncontrolling interest contributions, net of distributions
|
—
|
|
—
|
|
—
|
|
—
|
|
—
|
|
17
|
|
17
|
|
|||||||||||||
|
Net income (loss)
|
40
|
|
4
|
|
11
|
|
(36
|
)
|
—
|
|
8
|
|
27
|
|
|||||||||||||
|
Distributions to Series A Preferred Units
|
(6
|
)
|
—
|
|
—
|
|
—
|
|
—
|
|
—
|
|
(6
|
)
|
|||||||||||||
|
Balance - December 31, 2013
|
$
|
3,886
|
|
$
|
146
|
|
$
|
782
|
|
$
|
—
|
|
$
|
—
|
|
$
|
102
|
|
$
|
4,916
|
|
||||||
S - 85
REGENCY ENERGY PARTNERS LP
CONSOLIDATED STATEMENTS OF PARTNERS’ CAPITAL
AND NONCONTROLLING INTEREST
(Dollars in millions)
|
Regency Energy Partners LP
|
|||||||||||||||||||
|
Common
Units
|
Class F Units
|
General
Partner
Interest
|
Noncontrolling
Interest
|
Total
|
|||||||||||||||
|
Balance - December 31, 2013
|
$
|
3,886
|
|
$
|
146
|
|
$
|
782
|
|
$
|
102
|
|
$
|
4,916
|
|
||||
|
Issuance of common units under equity distribution program, net of costs
|
428
|
|
—
|
|
—
|
|
—
|
|
428
|
|
|||||||||
|
Issuance of common units to ETE Common Holdings
|
800
|
|
—
|
|
—
|
|
—
|
|
800
|
|
|||||||||
|
Issuance of common units in connection with Hoover Acquisition
|
109
|
|
—
|
|
—
|
|
—
|
|
109
|
|
|||||||||
|
Issuance of common units in connection with PVR Acquisition
|
3,906
|
|
—
|
|
—
|
|
—
|
|
3,906
|
|
|||||||||
|
Issuance of common units in connection with Eagle Rock Midstream Acquisition
|
266
|
|
—
|
|
—
|
|
—
|
|
266
|
|
|||||||||
|
Common units issued under LTIP, net of forfeitures and tax withholding
|
(1
|
)
|
—
|
|
—
|
|
—
|
|
(1
|
)
|
|||||||||
|
Unit-based compensation expenses
|
10
|
|
—
|
|
—
|
|
—
|
|
10
|
|
|||||||||
|
Partner distributions and distributions on unvested unit awards
|
(674
|
)
|
—
|
|
(32
|
)
|
—
|
|
(706
|
)
|
|||||||||
|
Noncontrolling interest contributions, net of distributions
|
—
|
|
—
|
|
—
|
|
3
|
|
3
|
|
|||||||||
|
Net (loss) income
|
(195
|
)
|
7
|
|
31
|
|
15
|
|
(142
|
)
|
|||||||||
|
Distributions to Series A Preferred Units
|
(4
|
)
|
—
|
|
—
|
|
—
|
|
(4
|
)
|
|||||||||
|
Balance - December 31, 2014
|
$
|
8,531
|
|
$
|
153
|
|
$
|
781
|
|
$
|
120
|
|
$
|
9,585
|
|
||||
S - 86
REGENCY ENERGY PARTNERS LP
NOTES TO CONSOLIDATED FINANCIAL STATEMENTS
(Tabular dollar amounts, except unit and per unit data, are in millions)
1.
ORGANIZATION AND BASIS OF PRESENTATION
Organization.
The consolidated financial statements presented herein contain the results of Regency Energy Partners LP and its subsidiaries (the “Partnership”), a Delaware limited partnership. The Partnership was formed on September 8, 2005, and completed its IPO on February 3, 2006. The Partnership and its subsidiaries are engaged in the business of gathering and processing, compression, treating and transportation of natural gas; the transportation, fractionation and storage of NGLs; the gathering, transportation and terminaling of oil (crude and/or condensate, a lighter oil) received from producers; natural gas and NGL marketing and trading; and the management of coal and natural resource properties in the United States. Regency GP LP is the Partnership’s general partner and Regency GP LLC (collectively the “General Partner”) is the managing general partner of the Partnership and the general partner of Regency GP LP.
Pending Merger with ETP.
On January 25, 2015,
the Partnership
and ETP entered into
the Merger Agreement
pursuant to which the Partnership will merge with a wholly-owned subsidiary of ETP, with the Partnership continuing as the surviving entity and becoming a wholly-owned subsidiary of ETP (the “Merger”). At the effective time of the Merger (the “Effective Time”), each Partnership common unit and Class F unit will be converted into the right to receive
0.4066
ETP common units, plus a number of additional ETP common units equal to
$0.32
per Partnership unit divided by the lesser of (i) the volume weighted average price of ETP common units for the five trading days ending on the third trading day immediately preceding the Effective Time and (ii) the closing price of ETP common units on the third trading day immediately preceding the Effective Time, rounded to the nearest ten thousandth of a unit. Each Series A Preferred Unit will be converted into the right to receive a preferred unit representing a limited partner interest in ETP, a new class of units in ETP to be established at the Effective Time. Early termination of the waiting period under the Hart-Scott-Rodino Antitrust Improvements Act of 1976, as amended, for the Merger was granted by the United States Federal Trade Commission on February 24, 2015. The transaction is expected to close in the second quarter of 2015 and is subject to other customary closing conditions including approval by the Partnership’s unitholders.
Basis of presentation.
The consolidated financial statements of the Partnership have been prepared in accordance with GAAP and include the accounts of all controlled subsidiaries after the elimination of all intercompany accounts and transactions. Certain prior year numbers have been conformed to the current year presentation.
Reclassifications.
During 2014, the Partnership reclassified amounts within property, plant and equipment asset categories. These reclassifications did not have any impact on amounts recorded for depreciation, depletion or amortization in 2014, and because the reclassified amounts have no significant effect on our consolidated balance sheets, prior period balances have not been adjusted for comparability purposes.
2.
SUMMARY OF SIGNIFICANT ACCOUNTING POLICIES
Use of Estimates.
These consolidated financial statements have been prepared in conformity with GAAP, which includes the use of estimates and assumptions by management that affect the reported amounts of assets, liabilities, revenues, expenses and disclosure of contingent assets and liabilities that exist at the date of the financial statements. Although these estimates are based on management’s available knowledge of current and expected future events, actual results could be different from those estimates.
Common Control Transactions.
Entities and assets acquired from ETE and its affiliates are accounted for as common control transactions whereby the net assets acquired are combined with the Partnership’s net assets at their historical amounts. If consideration transferred differs from the carrying value of the net assets acquired, the excess or deficiency is treated as a capital transaction similar to a dividend or capital contribution. To the extent that such transactions require prior periods to be recast, historical net equity amounts prior to the transaction date are reflected in predecessor equity.
Cash and Cash Equivalents.
Cash and cash equivalents include temporary cash investments with original maturities of three months or less.
Equity Method Investments.
The equity method of accounting is used to account for the Partnership’s interest in investments of greater than
20%
voting interest or where the Partnership exerts significant influence over an investee but lacks control over the investee. Even though there is a presumption of a controlling financial interest in Aqua - PVR (because of our
51%
ownership), our partner in this joint venture has substantive participating rights and management authority that preclude us from controlling the joint venture. Therefore, it is accounted for as an equity method investment. The Partnership acquired a
50%
interest in Coal Handling as part of the PVR Acquisition and purchased the remaining
50%
interest effective December 31, 2014 for
$16 million
, resulting in a gain on the purchase due to the revaluation of the Partnership’s previously held non-controlling interest.
S - 87
Inventories.
Inventories are valued at the lower of cost or market and include materials and parts primarily utilized by the Contract Services and Gathering & Processing segments.
Property, Plant and Equipment.
Property, plant and equipment is recorded at historical cost of construction or, upon acquisition, the fair value of the assets acquired. Gains or losses on sales or retirements of assets are included in operating income unless the disposition is treated as discontinued operations. Natural gas and NGLs used to maintain pipeline minimum pressures is classified as property, plant and equipment. Financing costs associated with the construction of larger assets requiring ongoing efforts over a period of time are capitalized. For the years ended
December 31, 2014
,
2013
and
2012
, the Partnership capitalized interest of
$14 million
,
$2 million
and
$1 million
, respectively. The costs of maintenance and repairs, which are not significant improvements, are expensed when incurred. Expenditures to extend the useful lives of the assets are capitalized.
Depreciation expense related to property, plant and equipment was
$418 million
,
$258 million
, and
$219 million
for the years ended
December 31, 2014
,
2013
and
2012
, respectively. In March 2012, the Partnership recorded a
$7 million
“out-of-period” adjustment to depreciation expense to correct the estimated useful lives of certain assets to comply with its policy.
Depreciation of property, plant and equipment is recorded on a straight-line basis over the following estimated useful lives:
|
Functional Class of Property
|
Useful Lives (Years)
|
|
|
Gathering and Transmission Systems
|
20 - 40
|
|
|
Compression Equipment
|
2 - 30
|
|
|
Gas Plants and Buildings
|
5 - 20
|
|
|
Other Property, Plant and Equipment
|
3 - 15
|
|
Depletion expense related to the Natural Resources segment was
$11 million
for the year ended December 31, 2014. Coal properties are depleted on an area-by-area basis at a rate based on the cost of the mineral properties and the number of tons of estimated proven and probable coal reserves contained therein. Proven and probable coal reserves have been estimated by the Partnership’s own geologists. The Partnership’s estimates of coal reserves are updated periodically and may result in adjustments to coal reserves and depletion rates that are recognized prospectively. From time to time, the Partnership carries out core-hole drilling activities on coal properties in order to ascertain the quality and quantity of the coal contained in those properties. These core-hole drilling activities are expensed as incurred. The Partnership depletes timber using a methodology consistent with the units-of-production method, which is based on the quantity of timber harvested. The Partnership determines depletion of oil and gas royalty interests by the units-of-production method and these amounts could change with revisions to estimated proved recoverable reserves.
Intangible Assets.
As of
December 31, 2014
, intangible assets consisted of trade names and customer relations, and are amortized on a straight line basis over their estimated useful lives, which is the period over which the assets are expected to contribute directly or indirectly to the Partnership’s future cash flows. The estimated useful lives range from
8
to
30
years.
The Partnership assesses long-lived assets, including property, plant and equipment and intangible assets, for impairment whenever events or changes in circumstances indicate that the carrying amount of an asset may not be recoverable. Recoverability is assessed by comparing the carrying amount of an asset to undiscounted future net cash flows expected to be generated by the asset. If such assets are considered to be impaired, the impairment to be recognized is measured as the amount by which the carrying amounts exceed the fair value of the assets. The Partnership did not record any impairment in 2014, 2013, or 2012.
Goodwill.
Goodwill represents the excess of the purchase price over the fair value of identifiable net assets acquired in a business combination. Goodwill is not amortized, but is tested for impairment annually based on the carrying values as of November 30 or December 31 depending upon the reporting unit, or more frequently if impairment indicators arise that suggest the carrying value of goodwill may not be recovered. The Partnership has the option to first assess qualitative factors to determine whether it is more likely than not that the fair value of the reporting unit is less than its carrying amount as a basis for determining whether further impairment testing is necessary. Impairment is indicated when the carrying amount of a reporting unit exceeds its fair value. To estimate the fair value of the reporting units, the Partnership makes estimates and judgments about future cash flows, as well as revenues, cost of sales, operating expenses, capital expenditures and net working capital based on assumptions that are consistent with the Partnership’s most recent forecast. At the time it is determined that an impairment has occurred, the carrying value of the goodwill is written down to its fair value.
In 2014, a
$370 million
goodwill impairment charge was recorded related to the Permian reporting unit within the Gathering and Processing segment. The decline in estimated fair value of that reporting unit is primarily driven by the significant decline in commodity prices in the fourth quarter of 2014, and the resulting impact to future commodity prices as well as increases in future estimated operations and maintenance expenses. As a result of the Partnership’s determination that the estimated fair value of the reporting unit being less than the carrying value, the Partnership performed the second step of the goodwill impairment assessment,
S - 88
which requires the assets and liabilities of the reporting unit to be fair valued on a hypothetical basis. Any excess value over the estimated fair value of the reporting unit, determined in this case through established valuation techniques such as discounted cash flow methods and market comparable analyses, compared to the hypothetical fair value of all assets and liabilities of the reporting unit is the implied fair value of goodwill. To the extent that the implied fair value of goodwill is less than the carrying value of goodwill, an impairment is recognized to eliminate any excess carrying amounts.
No other goodwill impairments were identified or recorded for the Partnership’s other reporting units in 2014. No goodwill impairment charges were incurred in 2013 or 2012.
Other Assets, net.
Other assets, net primarily consists of debt issuance costs, which are capitalized and amortized to interest expense, net over the life of the related debt.
Gas Imbalances.
Quantities of natural gas or NGLs over-delivered or under-delivered related to imbalance agreements are recorded monthly as other current assets or other current liabilities using then current market prices or the weighted average prices of natural gas or NGLs at the plant or system pursuant to imbalance agreements for which settlement prices are not contractually established.
Within certain volumetric limits determined at the sole discretion of the creditor, these imbalances are generally settled by deliveries of natural gas. Imbalance receivables and payables as of
December 31, 2014
and
2013
were immaterial.
Asset Retirement Obligations
. Legal obligations associated with the retirement of long-lived assets are recorded at fair value at the time the obligations are incurred, if a reasonable estimate of fair value can be made. Present value techniques are used which reflect assumptions such as removal and remediation costs, inflation, and profit margins that third parties would demand to settle the amount of the future obligation. The Partnership does not include a market risk premium for unforeseeable circumstances in its fair value estimates because such a premium cannot be reliably estimated. Upon initial recognition of the liability, costs are capitalized as a part of the long-lived asset and allocated to expense over the useful life of the related asset. The liability is accreted to its present value each period with accretion being recorded to operating expense with a corresponding increase in the carrying amount of the liability. The ARO assets and liabilities were immaterial as of
December 31, 2014
.
Environmental.
The Partnership’s operations are subject to federal, state and local laws and rules and regulations regarding water quality, hazardous and solid waste management, air quality control and other environmental matters. These laws, rules and regulations require the Partnership to conduct its operations in a specified manner and to obtain and comply with a wide variety of environmental registrations, licenses, permits, inspections and other approvals. Failure to comply with applicable environmental laws, rules and regulations may expose the Partnership to significant fines, penalties and/or interruptions in operations. The Partnership’s environmental policies and procedures are designed to achieve compliance with such applicable laws and regulations. These evolving laws and regulations and claims for damages to property, employees, other persons and the environment resulting from current or past operations may result in significant expenditures and liabilities in the future.
Predecessor Equity.
Predecessor equity included on the consolidated statements of partners’ capital and noncontrolling interest represents SUGS member’s capital prior to the acquisition date (April 30, 2013).
Revenue Recognition.
The Partnership earns revenue from (i) domestic sales of natural gas, NGLs and condensate, (ii) natural gas, NGL, condensate, and salt water gathering, processing and transportation, (iii) contract compression and treating services, and (iv) coal royalties. Revenue associated with sales of natural gas, NGLs and condensate are recognized when title passes to the customer, which is when the risk of ownership passes to the purchaser and physical delivery occurs. Revenue associated with transportation and processing fees are recognized when the service is provided. For contract compression and contract treating services, revenue is recognized when the service is performed. For gathering and processing services, the Partnership receives either fees or commodities from natural gas producers depending on the type of contract. Commodities received are in turn sold and recognized as revenue in accordance with the criteria outlined above. Under the percentage-of-proceeds contract type, the Partnership is paid for its services by keeping a percentage of the NGLs produced and a percentage of the residue gas resulting from processing the natural gas. Under the percentage-of-index contract type, the Partnership earns revenue by purchasing wellhead natural gas at a percentage of the index price and selling processed natural gas and NGLs at a price approximating the index price to third parties. The Partnership generally reports revenue gross in the consolidated statements of operations when it acts as the principal, takes title to the product, and incurs the risks and rewards of ownership. Revenue for fee-based arrangements is presented net, because the Partnership takes the role of an agent for the producers. Allowance for doubtful accounts is determined based on historical write-off experience and specific identification.
Coal Royalties Revenues and Deferred Income.
The Partnership recognizes coal royalties revenues on the basis of tons of coal sold by its lessees and the corresponding revenues from those sales. The Partnership does not have access to actual production and revenues information until 30 days following the month of production. Therefore, financial results include estimated revenues and accounts receivable for the month of production. The Partnership records any differences between the actual amounts ultimately received or paid and the original estimates in the period they become finalized. Most lessees must make minimum monthly or
S - 89
annual payments that are generally recoverable over certain time periods. These minimum payments are recorded as deferred income. If the lessee recovers a minimum payment through production, the deferred income attributable to the minimum payment is recognized as coal royalties revenues. If a lessee fails to meet its minimum production for certain pre-determined time periods, the deferred income attributable to the minimum payment is recognized as minimum rental revenues, which is a component of other revenues on our consolidated statements of operations. Other liabilities on the balance sheet also include deferred unearned income from a coal services facility lease, which is recognized in other income as it is earned.
Derivative Instruments.
The Partnership’s net income and cash flows are subject to volatility stemming from changes in market prices such as natural gas prices, NGLs prices, processing margins and interest rates. The Partnership uses product-specific swaps to create offsetting positions to specific commodity price exposures, and uses interest rate swap contracts to create offsetting positions to specific interest rate exposures. Derivative financial instruments are recorded on the balance sheet at their fair value based on their settlement date. The Partnership employs derivative financial instruments in connection with an underlying asset, liability and/or anticipated transaction and not for speculative purposes. Furthermore, the Partnership regularly assesses the creditworthiness of counterparties to manage the risk of default. As of December 31, 2014 and 2013, no derivative financial instruments were designated as hedges. In the statement of cash flows, the effects of settlements of derivative instruments are classified consistent with the related hedged transactions.
Benefits.
The Partnership provides medical, dental, and other healthcare benefits to employees. The total amount incurred by the Partnership for the years ended
December 31, 2014
,
2013
and
2012
, was
$17 million
,
$9 million
and
$9 million
, respectively, in operation and maintenance and general and administrative expenses, as appropriate. The Partnership also provides a matching contribution to its employee’s 401(k) accounts which vest immediately upon contribution. The total amount of matching contributions for the years ended
December 31, 2014
,
2013
and
2012
was
$9 million
,
$7 million
and
$4 million
, respectively, and were recorded in operation and maintenance and general and administrative expenses, as appropriate. The Partnership has no pension obligations or other post-employment benefits. Beginning January 1, 2013, the Partnership provides a
3%
profit sharing contribution to employee 401(k) accounts for all employees with base compensation below a specified threshold. The contribution is in addition to the 401(k) matching contribution and employees become vested based on years of service.
Income Taxes.
The Partnership is generally not subject to income taxes, except as discussed below, because its income is taxed directly to its partners. The Partnership is subject to the gross margins tax enacted by the state of Texas. The Partnership has one wholly-owned subsidiary that is subject to income tax and provides for deferred income taxes using the asset and liability method. Accordingly, deferred taxes are recorded for differences between the tax and book basis that will reverse in future periods. The Partnership has deferred tax liabilities of
$20 million
and
$22 million
as of
December 31, 2014
and
2013
, respectively, related to the difference between the book and tax basis of property, plant and equipment and intangible assets and they are included in other long-term liabilities in the accompanying consolidated balance sheets. The Partnership follows the guidance for uncertainties in income taxes where a liability for an unrecognized tax benefit is recorded for a tax position that does not meet the “more likely than not” criteria. The Partnership has not recorded any uncertain tax positions meeting the more likely than not criteria as of
December 31, 2014
and
2013
. The Partnership recognized $3 million for current and deferred federal and state income tax for the year ended December 31, 2014 and an immaterial amount for current and deferred federal and state income tax benefit for the years ended December 31, 2013 and 2012.
Effective with the Partnership’s acquisition of SUGS on April 30, 2013, SUGS is generally no longer subject to federal income taxes and subject only to gross margins tax in the state of Texas. Substantially all previously recorded current and deferred tax liabilities were settled with Southern Union, along with all other intercompany receivables and payables at the date of acquisition.
The Partnership has its 2007 and 2008 tax years under audit by the IRS. Until this matter is fully resolved, it is not known whether any amounts ultimately recorded would be material, or how such adjustments would affect unitholders. The statute of limitations for these audits has been extended to December 31, 2015.
Equity-Based Compensation.
The Partnership accounts for common unit options and phantom units by recognizing the grant-date fair value of awards into expense as they are earned, using an estimated forfeiture rate. The forfeiture rate assumption is reviewed annually to determine whether any adjustments to expense are required. Cash restricted units are recorded in other long-term liabilities on our consolidated balance sheet. The fair value of cash restricted units is remeasured at the end of each reporting period, based on the trading price of our common units, and compensation expense is recorded using the straight-line method over the vesting period.
Earnings per Unit.
Basic net income per common unit is computed through the use of the two-class method, which allocates earnings to each class of equity security based on their participation in distributions and deemed distributions. Accretion of the Series A Preferred Units is considered as deemed distributions. Distributions and deemed distributions to the Series A Preferred Units reduce the amount of net income available to the general partner and limited partner interests. The general partners’ interest in net income or loss consists of its respective percentage interest, make-whole allocations for any losses allocated in a prior tax year and IDRs. After deducting the General Partner’s interest, the limited partners’ interest in the remaining net income or loss is
S - 90
allocated to each class of equity units based on distributions and beneficial conversion feature amounts, if applicable, then divided by the weighted average number of common and subordinated units outstanding in each class of security. Diluted net income per common unit is computed by dividing limited partners’ interest in net income, after deducting the General Partner’s interest, by the weighted average number of units outstanding and the effect of non-vested phantom units, Series A Preferred Units and unit options. For special classes of common units, such as the Class F units issued with a beneficial conversion feature, the amount of the benefit associated with the period is added back to net income and the unconverted class is added to the denominator.
New Accounting Pronouncement.
In May 2014, the FASB issued Accounting Standards Update No. 2014-09, Revenue from Contracts with Customers (Topic 606) (“ASU 2014-09”), which clarifies the principles for recognizing revenue based on the core principle that an entity should recognize revenue to depict the transfer of promised goods or services to customers in an amount that reflects the consideration to which the entity expects to be entitled in exchange for those goods or services. ASU 2014-09 is effective for annual reporting periods beginning after December 15, 2016, including interim periods within that reporting period, with earlier adoption not permitted. ASU 2014-09 can be adopted either retrospectively to each prior reporting period presented or as a cumulative-effect adjustment as of the date of adoption. The Partnership is currently evaluating the impact, if any, that adopting this new accounting standard will have on our revenue recognition policies.
3.
PARTNERS’ CAPITAL AND DISTRIBUTIONS
Units Activity
. The changes in common and Class F units were as follows:
|
Common
|
Class F
|
|||||
|
Balance - December 31, 2011
|
157,437,608
|
|
—
|
|
||
|
Common unit offerings, net of costs
|
12,650,000
|
|
—
|
|
||
|
Issuance of common units under the equity distribution agreement, net of cost
|
691,129
|
|
—
|
|
||
|
Issuance of common units under LTIP, net of forfeitures and tax withholding
|
172,720
|
|
—
|
|
||
|
Balance - December 31, 2012
|
170,951,457
|
|
—
|
|
||
|
Issuance of common units under LTIP, net of forfeitures and tax withholding
|
184,995
|
|
—
|
|
||
|
Issuance of common units under the equity distribution agreement, net of cost
|
5,712,138
|
|
—
|
|
||
|
Conversion of Series A preferred units for common units
|
2,629,223
|
|
—
|
|
||
|
Issuance of common units and Class F units in connection with SUGS Acquisition
|
31,372,419
|
|
(1)
|
6,274,483
|
|
(2)
|
|
Balance - December 31, 2013
|
210,850,232
|
|
6,274,483
|
|
||
|
Issuance of common units under LTIP, net of forfeitures and tax withholding
|
163,054
|
|
—
|
|
||
|
Issuance of common units under the equity distribution agreements
|
14,827,919
|
|
—
|
|
||
|
Issuance of common units in connection with Hoover Acquisition
|
4,040,471
|
|
—
|
|
||
|
Issuance of common units in connection with PVR Acquisition
|
140,388,382
|
|
—
|
|
||
|
Issuance of common units in connection with Eagle Rock Midstream Acquisition
|
8,245,859
|
|
—
|
|
||
|
Issuance of common units to ETE Common Holdings
|
30,890,565
|
|
—
|
|
||
|
Balance - December 31, 2014
|
409,406,482
|
|
6,274,483
|
|
||
|
(1)
|
ETE has agreed to forgo IDR payments on the Partnership common units issued with the SUGS Acquisition for twenty-four months post-transaction closing.
|
|
(2)
|
The Class F units are not entitled to participate in the Partnership’s distributions or earnings for twenty-four months post-transaction closing.
|
Equity Distribution Agreement.
In June 2012,
the Partnership
entered into an equity distribution agreement with Citi under which
the Partnership
offered and sold common units for an aggregate offering price of
$200 million
, from time to time through Citi, as sales agent for the Partnership. Sales of these common units made from time to time under the equity distribution agreement were made by means of ordinary brokers’ transactions on the New York Stock Exchange at market prices, in block transactions, or as otherwise agreed upon by
the Partnership
and Citi.
The Partnership
used the net proceeds from the sale of these common units for general partnership purposes. For the years ended
December 31, 2014
and
2013
, the Partnership
received net proceeds of
$34 million
and
$149 million
, respectively, from common units sold pursuant to this equity distribution agreement. No amounts remain available to be issued under this agreement and it is no longer effective.
In May 2014,
the Partnership
entered into an equity distribution agreement with a group of banks and investment companies (the “Managers”) under which
the Partnership
offered and sold common units for an aggregate offering price of
$400 million
,
from time to time through the Managers, as sales agent for
the Partnership.
Sales of these units made from time to time under the equity distribution agreement were made by means of ordinary brokers’ transactions on the New York Stock Exchange at market prices, in block transactions, or as otherwise agreed upon by
the Partnership
and the Managers.
The Partnership
used the net proceeds
S - 91
from the sale of these units for general partnership purposes. For the year ended
December 31, 2014
, the Partnership
received net proceeds of
$395 million
from common units sold pursuant to this equity distribution agreement.
No amounts remained available to be issues under this agreement and it is no longer effective.
In January 2015
, the Partnership
entered into an equity distribution agreement with another group of banks and investment companies (the "2015 Managers") under which
the Partnership
may offer and sell common units for an aggregate offering price of up to
$1 billion
,
from time to time through the 2015 Managers, as sales agent for
the Partnership.
Sales of these common units made from time to time under the equity distribution agreement will be made by means of ordinary brokers’ transactions on the New York Stock Exchange at market prices, in block transactions, or as otherwise agreed upon by
the Partnership
and the 2015 Managers.
The Partnership
may also sell common units to the 2015 Managers as principal for their own accounts at a price agreed upon at the time of sale. Any sale of common units to the 2015 Managers as principal would be pursuant to the terms of a separate agreement between
the Partnership
and the 2015 Managers.
The Partnership intends
to use the net proceeds from the sale of these common units for general partnership purposes.
Common Units Sold.
In June 2014,
the Partnership
sold
14.4 million
common units to ETE Common Holdings for proceeds of
$400 million
. Proceeds from the issuance were used to pay down borrowings on
the Partnership’s
revolving credit facility, to redeem certain senior notes of the Partnership and for general partnership purposes. In July 2014,
the Partnership
sold
16.5 million
common units to ETE Common Holdings for proceeds of
$400 million
. Proceeds from the issuance were used to fund a portion of the cash consideration paid to Eagle Rock in connection with the Eagle Rock Midstream Acquisition.
Public Common Unit Offerings
. In March 2012, the Partnership issued
12,650,000
common units representing limited partner interests in a public offering at a price of
$24.47
per common unit, resulting in net proceeds of
$297 million
. In May 2012, the Partnership used the net proceeds from this offering to redeem
35%
, or
$88 million
, in aggregate principal amounts of its outstanding senior notes due 2016; pay related premium, expenses and accrued interest; and repay outstanding borrowings under the revolving credit facility.
Beneficial Conversion Feature.
The Partnership issued
6,274,483
Class F units in connection with the SUGS Acquisition. At the commitment date (February 27, 2013), the sales price of
$23.91
per unit represented a
$2.19
per unit discount from the fair value of the Partnership’s common units as of April 30, 2013. Under FASB ASC 470-20, “
Debt with Conversion and Other Options
,” the discount represents a beneficial conversion feature that is treated as a non-cash distribution for purposes of calculating earnings per unit. The beneficial conversion feature is reflected in income per unit using the effective yield method over the period the Class F units are outstanding, as indicated on the statement of operations in the line item entitled “beneficial conversion feature for Class F units.” The Class F units are convertible to common units on a one-for-one basis on May 8, 2015.
Noncontrolling Interest
. The Partnership operates ELG, a gas gathering joint venture in south Texas in which other third party companies own a
40%
interest, and ORS, a gathering joint venture in Ohio in which a third party company owns a
25%
interest, which are reflected on the Partnership’s consolidated balance sheet as noncontrolling interest.
Distributions
. The partnership agreement requires the distribution of all of the Partnership’s Available Cash (defined below) within
45
days after the end of each quarter to unitholders of record on the applicable record date, as determined by the General Partner.
Available Cash.
Available Cash, for any quarter, generally consists of all cash and cash equivalents on hand at the end of that quarter less the amount of cash reserves established by the general partner to: (i) provide for the proper conduct of the Partnership’s business; (ii) comply with applicable law, any debt instruments or other agreements; or (iii) provide funds for distributions to the unitholders and to the General Partner for any one or more of the next four quarters and plus, all cash on hand on that date of determination of available cash for the quarter resulting from working capital borrowings made after the end of the quarter for which the determination is being made.
General Partner Interest and Incentive Distribution Rights
. The General Partner is entitled to its proportionate share of all quarterly distributions that the Partnership makes prior to its liquidation. The General Partner has the right, but not the obligation, to contribute a proportionate amount of capital to the Partnership to maintain its current general partner interest. The General Partner’s initial
2%
interest in these distributions has been reduced since the Partnership has issued additional units and the General Partner has not contributed a proportionate amount of capital to the Partnership to maintain its General Partner interest. The General Partner ownership interest as of
December 31, 2014
was
0.69%
. This General Partner interest is represented by
2,834,381
equivalent units as of
December 31, 2014
.
The IDRs held by the General Partner entitle it to receive an increasing share of Available Cash when pre-defined distribution targets are achieved. The General Partner’s IDRs are not reduced if the Partnership issues additional units in the future and the general partner does not contribute a proportionate amount of capital to the Partnership to maintain its general partner interest.
S - 92
In connection with the SUGS Acquisition, ETE agreed to forgo IDR payments on the Partnership common units issued with this transaction for the twenty-four months post-transaction closing.
Distributions
. The Partnership made the following cash distributions per unit during the years ended
December 31, 2014
and
2013
:
|
Distribution Date
|
Cash Distribution
(per common unit)
|
|||
|
November 14, 2014
|
$
|
0.5025
|
|
|
|
August 14, 2014
|
0.490
|
|
||
|
May 15, 2014
|
0.480
|
|
||
|
February 14, 2014
|
0.475
|
|
||
|
November 14, 2013
|
$
|
0.470
|
|
|
|
August 14, 2013
|
0.465
|
|
||
|
May 13, 2013
|
0.460
|
|
||
|
February 14, 2013
|
0.460
|
|
||
The Partnership paid a cash distribution of
$0.5025
per common unit on
February 13, 2015
.
4.
(LOSS) INCOME PER LIMITED PARTNER UNIT
The following table provides a reconciliation of the numerator and denominator of the basic and diluted (loss) earnings per unit computations for the years ended
December 31, 2014
,
2013
, and
2012
.
|
|
Years Ended December 31,
|
|||||||||||||||||||||||||||||||
|
2014
|
2013
|
2012
|
||||||||||||||||||||||||||||||
|
Loss
(Numerator)
|
Units
(Denominator)
|
Per-Unit
Amount
|
Income
(Numerator)
|
Units
(Denominator)
|
Per-Unit
Amount
|
Income
(Numerator)
|
Units
(Denominator)
|
Per-Unit
Amount
|
||||||||||||||||||||||||
|
Basic (loss) income per unit
|
||||||||||||||||||||||||||||||||
|
Limited Partners’ interest in net (loss) income
|
$
|
(199
|
)
|
348,070,121
|
|
$
|
(0.57
|
)
|
$
|
34
|
|
196,227,348
|
|
$
|
0.17
|
|
$
|
27
|
|
167,492,735
|
|
$
|
0.16
|
|
||||||||
|
Effect of Dilutive Securities:
|
||||||||||||||||||||||||||||||||
|
Common unit options
|
—
|
|
—
|
|
—
|
|
22,714
|
|
—
|
|
10,854
|
|
||||||||||||||||||||
|
Phantom units *
|
—
|
|
—
|
|
—
|
|
357,230
|
|
—
|
|
223,325
|
|
||||||||||||||||||||
|
Series A Preferred Units
|
—
|
|
—
|
|
—
|
|
2,050,854
|
|
(5
|
)
|
4,658,700
|
|
||||||||||||||||||||
|
Diluted (loss) income per unit
|
$
|
(199
|
)
|
348,070,121
|
|
$
|
(0.57
|
)
|
$
|
34
|
|
198,658,146
|
|
$
|
0.17
|
|
$
|
22
|
|
172,385,614
|
|
$
|
0.13
|
|
||||||||
__________________
|
*
|
Amount assumes maximum conversion rate for market condition awards.
|
S - 93
The following data show securities that could potentially dilute earnings per unit in the future that were not included in the computation of diluted earnings per unit because to do so would have been antidilutive for the period presented:
|
Year Ended December 31, 2014
|
||
|
Common unit options
|
25,959
|
|
|
Phantom units
|
469,264
|
|
|
Series A Preferred Units
|
2,059,503
|
|
The partnership agreement requires that the General Partner shall receive a
100%
allocation of income until its capital account is made whole for all of the net losses allocated to it in prior years.
5.
ACQUISITIONS
2014
Eagle Rock Midstream Acquisition.
On July 1, 2014,
the Partnership
acquired Eagle Rock’s midstream business
(the “Eagle Rock Midstream Acquisition”)
for
$1.3 billion
, including the issuance of
8.2 million
Regency common units to Eagle Rock and the assumption of
$499 million
of Eagle Rock’s 8.375% Senior Notes due 2019. The remainder of the purchase price was funded by
$400 million
in common units issued to ETE Common Holdings and borrowings under the Partnership’s revolving credit facility. The Partnership accounted for the Eagle Rock Midstream Acquisition using the acquisition method of accounting, which requires, among other things, that assets acquired and liabilities assumed be recognized on the balance sheet at their fair values as of the acquisition date.
This acquisition complemented
the Partnership’s
core gathering and processing business
and
further diversified
the Partnership’s geographic presence in the mid-continent region, east Texas and south Texas. Revenues and net income attributable to Eagle Rock’s operations included in the statement of operations for the year ended
December 31, 2014
were
$903 million
and
$30 million
, respectively.
Management’s evaluation of the assigned fair values is ongoing. The table below represents a preliminary allocation of the total purchase price:
|
Assets
|
At July 1, 2014
|
||
|
Current assets
|
$
|
120
|
|
|
Property, plant and equipment
|
1,295
|
|
|
|
Other long-term assets
|
4
|
|
|
|
Goodwill
(1)
|
49
|
|
|
|
Total Assets Acquired
|
$
|
1,468
|
|
|
Liabilities
|
|||
|
Current liabilities
|
$
|
116
|
|
|
Long-term debt
|
499
|
|
|
|
Long-term liabilities
|
12
|
|
|
|
Total Liabilities Assumed
|
$
|
627
|
|
|
Net Assets Acquired
|
$
|
841
|
|
(1)
Goodwill is reported in the Gathering and Processing segment.
The fair values of the assets acquired and liabilities assumed is being determined using various valuation techniques, including the income and market approaches.
PVR Acquisition.
On March 21, 2014,
the Partnership
acquired PVR for a total purchase price of
$5.7 billion
, including
$1.8 billion
principal amount of assumed debt (“PVR Acquisition”). PVR unitholders received (on a per unit basis)
1.02
Partnership common units and a one-time cash payment of
$36 million
, which was funded through borrowings under the Partnership’s revolving credit facility.
The PVR Acquisition enhanced
the Partnership’s
geographic diversity by adding a strategic presence in the Marcellus and Utica shales in the Appalachian Basin and the Granite Wash in the Mid-Continent region.
The Partnership accounted for the acquisition of PVR using the acquisition method of accounting, which requires, among other things, that assets acquired and liabilities assumed be recognized on the balance sheet at their fair values as of the acquisition date. Revenues and net income
S - 94
attributable to PVR’s operations included in the statement of operations for the year ended
December 31, 2014
were
$956 million
and
$166 million
, respectively.
Management completed the evaluation of the assigned fair values to the assets acquired and liabilities assumed. The total purchase price was allocated as follows:
|
Assets
|
At March 21, 2014
|
||
|
Current assets
|
$
|
149
|
|
|
Gathering and transmission systems
|
1,396
|
|
|
|
Compression equipment
|
342
|
|
|
|
Gas plants and buildings
|
110
|
|
|
|
Natural resources
|
454
|
|
|
|
Other property, plant and equipment
|
229
|
|
|
|
Construction in process
|
185
|
|
|
|
Investments in unconsolidated affiliates
|
62
|
|
|
|
Intangible assets
|
2,717
|
|
|
|
Goodwill
(1)
|
370
|
|
|
|
Other long-term assets
|
18
|
|
|
|
Total Assets Acquired
|
$
|
6,032
|
|
|
Liabilities
|
|||
|
Current liabilities
|
$
|
168
|
|
|
Long-term debt
|
1,788
|
|
|
|
Premium related to senior notes
|
99
|
|
|
|
Long-term liabilities
|
30
|
|
|
|
Total Liabilities Assumed
|
$
|
2,085
|
|
|
Net Assets Acquired
|
$
|
3,947
|
|
(1)
Goodwill is reported in the Gathering and Processing segment.
The fair values of the assets acquired and liabilities assumed were determined using various valuation techniques, including the income and market approaches.
Assets.
Cash and cash equivalents, accounts receivable, net, other current assets, and construction in process, were valued using a cost basis as this basis approximates fair value due to the current nature of these items. Real property, including gathering and transmission systems, compression equipment, gas plants and buildings, and other property, plant and equipment, were valued based on a combination of the income, market and cost approaches, depending on the type of asset. Coal and timber reserves were valued using the income approach for active coal and timber reserves. The investments in unconsolidated affiliates were valued using the income approach. Intangible assets, other than goodwill, are customer contract related intangibles, which have an average useful life of
30 years
, and have been valued using the income approach. The goodwill is the excess of the consideration transferred over the net assets recognized and represents the future economic benefits arising from other assets acquired that could not be individually identified and separately recognized.
Liabilities.
The Partnership assumed accounts payable, accrued liabilities, deferred income, and other long-term liabilities as part of the PVR Acquisition. The Partnership determined that the historical cost basis of these liabilities approximated fair value as they comprise normal operating liabilities. The Partnership assumed long-term debt as part of the acquisition, consisting of amounts outstanding under PVR’s revolving credit facility and PVR’s outstanding senior notes. The amount related to the revolving credit facility was valued at historical book value while the senior notes were valued using quoted market prices, which are considered Level 1 inputs.
Change in Control
. The PVR Acquisition constituted a change of control for certain PVR employment agreements. Pursuant to the terms of those agreements, certain payments and benefits, including severance payments, were triggered by the PVR Acquisition. The Partnership recorded
$10 million
of severance payments due to the change in control and recorded
$2 million
in retention bonuses that were paid to various retained PVR employees upon the expiration of their retention period.
S - 95
Hoover Energy Acquisition.
On February 3, 2014, the Partnership acquired certain subsidiaries of Hoover for a total purchase price of
$293 million
, consisting of (i)
4,040,471
common units issued to Hoover and (ii)
$184 million
in cash, and (iii)
$2 million
in asset retirement obligations assumed (the “Hoover Acquisition”). The Hoover Acquisition increased the Partnership’s fee-based revenue, expanding its existing footprint in the southern portion of the Delaware Basin in west Texas, and its services to producers into crude and water gathering. A portion of the consideration is in escrow as security for certain indemnification claims. The Partnership financed the cash portion of the purchase price through borrowings under its revolving credit facility. The Partnership accounted for the Hoover Acquisition using the acquisition method of accounting, which requires, among other things, that assets acquired and liabilities assumed be recognized on the balance sheet at their fair values as of the acquisition date. Revenues and net income attributable to Hoover’s operations included in the statement of operations for the year ended
December 31, 2014
were
$35 million
and less than $1 million, respectively.
Management completed the evaluation of the assigned fair values to the assets acquired and liabilities assumed. The total purchase price was allocated as follows:
|
Assets
|
At February 3, 2014
|
||
|
Accounts receivable, net
|
$
|
5
|
|
|
Gathering and transmission systems
|
60
|
|
|
|
Compression equipment
|
16
|
|
|
|
Gas plants and buildings
|
12
|
|
|
|
Other property, plant, and equipment
|
23
|
|
|
|
Construction in process
|
6
|
|
|
|
Intangible assets
|
148
|
|
|
|
Goodwill
(1)
|
30
|
|
|
|
Total Assets Acquired
|
$
|
300
|
|
|
Liabilities
|
|||
|
Accounts payable and accrued liabilities
|
$
|
5
|
|
|
Asset retirement obligation
|
2
|
|
|
|
Total Liabilities Assumed
|
$
|
7
|
|
|
Net Assets Acquired
|
$
|
293
|
|
(1)
Goodwill is reported in the Gathering and Processing segment.
The fair values of the assets acquired and liabilities assumed were determined using various valuation techniques, including the income and market approaches.
Assets.
Accounts receivable, net, other current assets, and construction in process were valued using a cost basis as this basis approximates fair value due to the current nature of these items. Real property, including gathering and transmission systems, compression equipment, and other property, plant and equipment, were valued based on a combination of the income, market and cost approaches, depending on the type of asset. Intangible assets, other than goodwill, are customer contract related intangibles, which have an average useful life of
30 years
, and have been valued using the income approach. The goodwill is the excess of the consideration transferred over the net assets recognized and represents the future economic benefits arising from other assets acquired that could not be individually identified and separately recognized.
Liabilities.
The Partnership assumed accounts payable, accrued liabilities, and an asset retirement obligation as part of the Hoover Acquisition. The Partnership determined that the historical cost basis of the accounts payable and the accrued liabilities approximated fair value as they comprise normal operating liabilities. The asset retirement obligation was valued based on estimates prepared by an independent environmental consulting firm.
S - 96
Pro Forma Results of Operations
The following unaudited pro forma consolidated results of operations for the years ended
December 31, 2014
and
2013
are presented as if the PVR, Hoover and Eagle Rock Midstream acquisitions had been completed on January 1, 2013. The pro forma information includes adjustments to reflect
incremental expenses associated with the fair value adjustments recorded as a result of applying the acquisition method of accounting and incremental interest expense related to the financing of a portion of the purchase price. This pro forma information is not necessarily indicative of the results that would have occurred had the acquisitions occurred on January 1, 2013, nor is it indicative of future results of operations. Actual results for the year ended
December 31, 2014
include PVR, Hoover, and the Eagle Rock midstream business from their respective dates of acquisition.
|
Years Ended December 31,
|
|||||||
|
2014
|
2013
|
||||||
|
Revenues
|
$
|
5,780
|
|
$
|
4,695
|
|
|
|
Net loss attributable to the Partnership
|
(252
|
)
|
(195
|
)
|
|||
|
Basic net loss per Limited Partner unit
|
$
|
(0.76
|
)
|
$
|
(0.50
|
)
|
|
|
Diluted net loss per Limited Partner unit
|
$
|
(0.76
|
)
|
$
|
(0.50
|
)
|
|
2013
SUGS Acquisition.
In April 2013, the Partnership acquired SUGS from Southern Union, a wholly-owned subsidiary of Holdco, for
$1.5 billion
(the “SUGS Acquisition”).
The Partnership accounted for the SUGS Acquisition in a manner similar to the pooling of interest method of accounting as it was a transaction between commonly controlled entities. The Partnership retrospectively adjusted its financial statements to include the balances and operations of SUGS for periods March 26, 2012 to April 30, 2013. The SUGS Acquisition did not impact historical earnings per unit as pre-acquisition earnings were allocated to predecessor equity.
The assets acquired and liabilities assumed in the SUGS Acquisition were as follows:
|
|
April 30, 2013
|
||
|
Current assets
|
$
|
113
|
|
|
Property, plant and equipment, net
|
1,608
|
|
|
|
Goodwill
|
337
|
|
|
|
Other non-current assets
|
1
|
|
|
|
Total Assets Acquired
|
$
|
2,059
|
|
|
Less:
|
|||
|
Current liabilities
|
(93
|
)
|
|
|
Non-current liabilities
|
(36
|
)
|
|
|
Net Assets Acquired
|
$
|
1,930
|
|
S - 97
The following table presents the revenues and net income (loss) for the previously separate entities and combined amounts presented herein:
|
Years Ended December 31,
|
|||||||
|
2013
(1)
|
2012
|
||||||
|
Revenues:
|
|||||||
|
Partnership
|
$
|
2,253
|
|
$
|
1,339
|
|
|
|
SUGS
(1)
|
268
|
|
661
|
|
|||
|
Combined
|
$
|
2,521
|
|
$
|
2,000
|
|
|
|
Net income (loss):
|
|||||||
|
Partnership
|
$
|
63
|
|
$
|
48
|
|
|
|
SUGS
(1)
|
(36
|
)
|
(14
|
)
|
|||
|
Combined
|
$
|
27
|
|
$
|
34
|
|
|
|
(1)
|
Combined amounts attributable to SUGS include the period from March 26, 2012 to December 31, 2012 for the year ended December 31, 2012, and the period from January 1, 2013 to April 30, 2013 for the year ended December 31, 2013. Subsequent to the closing of the SUGS Acquisition on April 30, 2013, the results of SUGS were attributable to the Partnership.
|
6.
INVESTMENTS IN UNCONSOLIDATED AFFILIATES
The carrying value of the Partnership’s investment in each of the unconsolidated affiliates as of
December 31, 2014
and
2013
is as follows:
|
December 31,
|
||||||||||||
|
Ownership
|
Type
|
2014
|
2013
|
|||||||||
|
HPC
|
49.99%
|
General Partner
|
$
|
422
|
|
$
|
442
|
|
||||
|
MEP
|
50.00%
|
Membership Interest
|
695
|
|
549
|
|
||||||
|
Lone Star
|
30.00%
|
Membership Interest
|
1,162
|
|
1,070
|
|
||||||
|
Ranch JV
|
33.33%
|
Membership Interest
|
38
|
|
36
|
|
||||||
|
Aqua - PVR
|
51.00%
|
Membership Interest
|
46
|
|
—
|
|
||||||
|
Mi Vida JV
|
50.00%
|
Membership Interest
|
54
|
|
—
|
|
||||||
|
Others
(1)
|
1
|
|
—
|
|
||||||||
|
$
|
2,418
|
|
$
|
2,097
|
|
|||||||
(1)
Others includes Coal Handling, Sweeny JV and Grey Ranch
The Partnership’s interests in the Aqua - PVR joint venture was acquired in the PVR Acquisition. In March 2014, the Partnership entered into an agreement, whereby the Partnership’s
50%
interest in Grey Ranch was assigned to SandRidge Midstream, Inc., resulting in a cash settlement of
$4 million
and a loss of
$1 million
recorded to income from unconsolidated affiliates.
The following tables summarize the changes in the Partnership’s investment activities in each of the unconsolidated affiliates for the years ended
December 31, 2014
,
2013
and
2012
:
|
Year Ended December 31, 2014
|
|||||||||||||||||||||||||||
|
HPC
|
MEP
(2)
|
Lone Star
|
Ranch JV
|
Aqua - PVR
|
Mi Vida JV
|
Others
(4)
|
|||||||||||||||||||||
|
Contributions to unconsolidated affiliates
|
$
|
—
|
|
$
|
175
|
|
$
|
114
|
|
$
|
—
|
|
$
|
—
|
|
$
|
54
|
|
$
|
—
|
|
||||||
|
Distributions from unconsolidated affiliates
|
(48
|
)
|
(73
|
)
|
(137
|
)
|
(8
|
)
|
(1
|
)
|
—
|
|
(4
|
)
|
|||||||||||||
|
Share of earnings of unconsolidated affiliates’ net income (loss)
|
33
|
|
45
|
|
116
|
|
9
|
|
(4
|
)
|
—
|
|
2
|
|
|||||||||||||
|
Amortization of excess fair value of investment
(1)
|
(6
|
)
|
—
|
|
—
|
|
—
|
|
—
|
|
—
|
|
—
|
|
|||||||||||||
S - 98
|
Year Ended December 31, 2013
|
|||||||||||||||||||
|
HPC
(3)
|
MEP
|
Lone Star
|
Ranch JV
|
Others
(4)
|
|||||||||||||||
|
Contributions to unconsolidated affiliates
|
$
|
—
|
|
$
|
—
|
|
$
|
137
|
|
$
|
2
|
|
$
|
—
|
|
||||
|
Distributions from unconsolidated affiliates
|
(238
|
)
|
(72
|
)
|
(79
|
)
|
(2
|
)
|
—
|
|
|||||||||
|
Share of earnings of unconsolidated affiliates’ net income
|
36
|
|
40
|
|
64
|
|
1
|
|
—
|
|
|||||||||
|
Amortization of excess fair value of investment
(1)
|
(6
|
)
|
—
|
|
—
|
|
—
|
|
—
|
|
|||||||||
|
Year Ended December 31, 2012
|
|||||||||||||||||||
|
HPC
|
MEP
|
Lone Star
|
Ranch JV
|
Others
(4)
|
|||||||||||||||
|
Contributions to unconsolidated affiliates
|
$
|
—
|
|
$
|
—
|
|
$
|
343
|
|
$
|
36
|
|
$
|
—
|
|
||||
|
Distributions from unconsolidated affiliates
|
(61
|
)
|
(75
|
)
|
(68
|
)
|
—
|
|
—
|
|
|||||||||
|
Share of earnings of unconsolidated affiliates’ net income (loss)
|
35
|
|
42
|
|
44
|
|
(1
|
)
|
(9
|
)
|
|||||||||
|
Amortization of excess fair value of investment
(1)
|
(6
|
)
|
—
|
|
—
|
|
—
|
|
—
|
|
|||||||||
__________________
|
(1)
|
The Partnership’s investment in HPC was adjusted to its fair value on May 26, 2010 and the excess fair value over net book value was comprised of two components: (1)
$155 million
was attributed to HPC’s long-lived assets and is being amortized as a reduction of income from unconsolidated affiliates over the useful lives of the respective assets, which vary from
15
to
30
years, and (2)
$32 million
could not be attributed to a specific asset and therefore will not be amortized in future periods.
|
|
(2)
|
The Partnership contributed
$175 million
to MEP in September 2014 for the repayment of MEP’s debt.
|
|
(3)
|
HPC entered into a
$500 million
5-year revolving credit facility in September 2013, pursuant to which the Partnership pledged its
49.99%
equity interest in HPC. Upon closing such credit facility, HPC borrowed
$370 million
to fund a non-recurring return of investment to its partners of which the Partnership received
$185 million
. The amount outstanding under this facility was
$450 million
as of
December 31, 2014
. The Partnership’s contingent obligation with respect to the outstanding borrowings under this facility was
$225 million
at
December 31, 2014
.
|
|
(4)
|
Includes Coal Handling, Grey Ranch, and Sweeny JV.
|
Summarized Financial Information
Consolidated financial statements for HPC, MEP, and Lone Star are filed as exhibits to this Form 10-K. The following tables present aggregated selected balance sheet and income statement data for Ranch JV (on a 100% basis) for all periods presented:
|
December 31,
|
|||||||
|
2014
|
2013
|
||||||
|
Current assets
|
$
|
16
|
|
$
|
7
|
|
|
|
Property, plant and equipment, net
|
95
|
|
100
|
|
|||
|
Other assets
|
4
|
|
4
|
|
|||
|
Total assets
|
$
|
115
|
|
$
|
111
|
|
|
|
Current liabilities
|
$
|
2
|
|
$
|
3
|
|
|
|
Equity
|
113
|
|
108
|
|
|||
|
Total liabilities and equity
|
$
|
115
|
|
$
|
111
|
|
|
|
Years Ended December 31,
|
|||||||||||
|
2014
|
2013
|
2012
|
|||||||||
|
Revenue
|
$
|
41
|
|
$
|
16
|
|
$
|
1
|
|
||
|
Operating income (loss)
|
29
|
|
4
|
|
(2
|
)
|
|||||
|
Net income (loss)
|
29
|
|
4
|
|
(2
|
)
|
|||||
7.
DERIVATIVE INSTRUMENTS
Policies
. The Partnership established comprehensive risk management policies and procedures to monitor and manage the market risks associated with commodity prices, counterparty credit and interest rates. The General Partner is responsible for delegation
S - 99
of transaction authority levels, and the Audit and Risk Committee of the General Partner is responsible for overseeing the management of these risks, including monitoring exposure limits. The Audit and Risk Committee receives regular briefings on exposures and overall risk management in the context of market activities.
Commodity Price Risk
. The Partnership is a net seller of NGLs, condensate and natural gas as a result of its gathering and processing operations. The prices of these commodities are impacted by changes in supply and demand as well as market forces. Both the Partnership’s profitability and cash flow are affected by the inherent volatility of these commodities which could adversely affect its ability to make distributions to its unitholders. The Partnership manages this commodity price exposure through an integrated strategy that includes management of its contract portfolio, matching sales prices of commodities with purchases, optimization of its portfolio by monitoring basis and other price differentials in operating areas, and the use of derivative contracts. In some cases, the Partnership may not be able to match pricing terms or cover its risk to price exposure with financial hedges, and it may be exposed to commodity price risk.
The Partnership has swap contracts settled against certain NGLs, condensate and natural gas market prices.
Marketing & Trading
. The Partnership conducts natural gas marketing and trading activities intended to capitalize on favorable price differentials between various receipt and delivery locations. The Partnership enters into both financial derivatives and physical contracts. These financial derivatives, primarily basis swaps, are transacted: (i) to economically hedge subscribed capacity exposed to market rate fluctuations and (ii) to mitigate the price risk related to other purchases and sales of natural gas. By entering into a basis swap, one pricing index is exchanged for another, effectively locking in the margin between the natural gas purchase and sale by removing index spread risk on the combined physical and financial transaction. Changes in the fair value of these financial and physical contracts are recorded as adjustments to natural gas sales and realized (unrealized) gain (loss) from derivatives, as appropriate.
The Partnership has credit exposure to additional counterparties. The Partnership monitors its exposure to any single counterparty and the creditworthiness of its counterparties on an ongoing basis. In addition, the Partnership’s natural gas purchase and sale contracts, for certain counterparties, are subject to counterparty netting agreements governing settlement under such natural gas purchase and sales contracts, and when possible, the Partnership nets the open positions of each counterparty.
Interest Rate Risk.
The Partnership is exposed to variable interest rate risk as a result of borrowings under its revolving credit facility. As of
December 31, 2014
, the Partnership had
$1.5 billion
of outstanding borrowings exposed to variable interest rate risk.
Credit Risk
. The Partnership’s resale of NGLs, condensate and natural gas exposes it to credit risk, as the margin on any sale is generally a very small percentage of the total sales price. Therefore, a credit loss can be very large relative to overall profitability on these transactions. The Partnership attempts to ensure that it issues credit only to credit-worthy counterparties and that in appropriate circumstances any such extension of credit is backed by adequate collateral, such as a letter of credit or parental guarantee from a parent company with potentially better credit.
The Partnership is exposed to credit risk from its derivative contract counterparties. The Partnership does not require collateral from these counterparties. The Partnership deals primarily with financial institutions when entering into financial derivatives, and utilizes master netting agreements that allow for netting of swap contract receivables and payables in the event of default by either party. If the Partnership’s counterparties failed to perform under existing swap contracts, the Partnership’s maximum loss as of
December 31, 2014
was
$82 million
, which would be reduced by less than
$1 million
due to the netting feature. The Partnership has elected to present assets and liabilities under master netting agreements gross on the consolidated balance sheets.
Embedded Derivatives.
The Series A Preferred Units contain embedded derivatives which are required to be bifurcated and accounted for separately, such as the holders’ conversion option and the Partnership’s call option. These embedded derivatives are accounted for using mark-to-market accounting. The Partnership does not expect the embedded derivatives to affect its cash flows.
S - 100
The Partnership’s derivative assets and liabilities, including credit risk adjustments, as of
December 31, 2014
and
2013
are detailed below:
|
|
Assets
|
Liabilities
|
|||||||||||||
|
|
December 31,
|
December 31,
|
|||||||||||||
|
2014
|
2013
|
2014
|
2013
|
||||||||||||
|
Derivatives not designated as cash flow hedges
|
|||||||||||||||
|
Current amounts
|
|||||||||||||||
|
Commodity contracts
|
$
|
75
|
|
$
|
3
|
|
$
|
—
|
|
$
|
9
|
|
|||
|
Long-term amounts
|
|||||||||||||||
|
Commodity contracts
|
10
|
|
1
|
|
—
|
|
—
|
|
|||||||
|
Embedded derivatives in Series A Preferred Units
|
—
|
|
—
|
|
16
|
|
19
|
|
|||||||
|
Total derivatives
|
$
|
85
|
|
$
|
4
|
|
$
|
16
|
|
$
|
28
|
|
|||
The Partnership’s statements of operations for the years ended
December 31, 2014
,
2013
and
2012
were impacted by derivative instruments activities as detailed below:
|
|
|
Years Ended December 31,
|
|||||||||||
|
2014
|
2013
|
2012
|
|||||||||||
|
Derivatives in cash flow hedging relationships:
|
Change in Value Recognized in AOCI on Derivatives
(Effective Portion)
|
||||||||||||
|
Commodity derivatives
|
$
|
—
|
|
$
|
—
|
|
$
|
(4
|
)
|
||||
|
Derivatives in cash flow hedging relationships:
|
Location of Gain/(Loss)
Recognized in Income
|
Amount of Gain/(Loss) Reclassified from AOCI into Income (Effective Portion)
|
|||||||||||
|
Commodity derivatives
|
Revenue
|
$
|
—
|
|
$
|
—
|
|
$
|
6
|
|
|||
|
|
|
Years Ended December 31,
|
|||||||||||
|
2014
|
2013
|
2012
|
|||||||||||
|
Derivatives not designated in a hedging relationship:
|
Location of Gain/(Loss)
Recognized in Income
|
Amount of Gain/(Loss) from De-designation Amortized from AOCI into Income
|
|||||||||||
|
Commodity derivatives
|
Revenue
|
$
|
—
|
|
$
|
—
|
|
$
|
(5
|
)
|
|||
|
Derivatives not designated in a hedging relationship:
|
Location of Gain/(Loss)
Recognized in Income
|
Amount of Gain/(Loss) Recognized in Income from Derivatives
|
|||||||||||
|
Commodity derivatives
|
Revenue
|
$
|
93
|
|
$
|
(9
|
)
|
$
|
16
|
|
|||
|
Embedded derivatives
|
Other income & deductions
|
3
|
|
6
|
|
14
|
|
||||||
|
$
|
96
|
|
$
|
(3
|
)
|
$
|
30
|
|
|||||
S - 101
8.
LONG-TERM DEBT
Obligations in the form of senior notes and borrowings under the credit facilities are as follows:
|
December 31,
|
|||||||
|
2014
|
2013
|
||||||
|
Senior notes
|
$
|
5,089
|
|
$
|
2,800
|
|
|
|
Revolving loans
|
1,504
|
|
510
|
|
|||
|
Unamortized premiums and discounts
|
48
|
|
—
|
|
|||
|
Long-term debt
|
$
|
6,641
|
|
$
|
3,310
|
|
|
|
Availability under revolving credit facility:
|
|||||||
|
Total credit facility limit
|
$
|
2,000
|
|
$
|
1,200
|
|
|
|
Revolving loans
|
(1,504
|
)
|
(510
|
)
|
|||
|
Letters of credit
|
(23
|
)
|
(14
|
)
|
|||
|
Total available
|
$
|
473
|
|
$
|
676
|
|
|
Long-term debt maturities as of
December 31, 2014
for each of the next five years are as follows:
|
Year Ended December 31,
|
Amount
|
||
|
2015
|
$
|
—
|
|
|
2016
|
—
|
|
|
|
2017
|
—
|
|
|
|
2018
|
—
|
|
|
|
2019
|
2,003
|
|
|
|
Thereafter
|
4,590
|
|
|
|
Total *
|
$
|
6,593
|
|
|
*
|
Excludes a
$67 million
unamortized premium on the 2020 PVR Notes and the 2021 PVR Notes assumed by the Partnership and a
$19 million
unamortized discount on the combined 2022 Notes.
|
Revolving Credit Facility
In the years ended
December 31, 2014
,
2013
and
2012
the Partnership borrowed
$3.86 billion
,
$1.83 billion
and
$1.56 billion
, respectively, under its revolving credit facility; these borrowings were to fund capital expenditures and acquisitions. During the same periods, the Partnership repaid
$3.48 billion
,
$1.52 billion
and
$1.70 billion
, respectively, with proceeds from equity offerings and issuances of senior notes.
In February 2014, RGS entered into the First Amendment (the "First Amendment") to the Sixth Amended and Restated Credit Agreement (the “Credit Agreement”) to, among other things, expressly permit the pending PVR and Eagle Rock Midstream acquisitions, and to increase the commitment base to
$1.5 billion
and increase the uncommitted incremental facility to
$500 million
.
The First Amendment allowed
the Partnership
to assume the legacy PVR senior notes that mature prior to the Credit Agreement.
In September 2014, RGS entered into the Second Amendment to the Credit Agreement to, among other things, increase the letter of credit sublimit from
$50 million
to
$100 million
, with none of the four individual issuing banks being required to issue letters of credit in excess of
$25 million
; increase in the general basket of permitted investments from
$300 million
to
$500 million
; add provisions permitting investments in ORS, affording it similar treatment to
the Partnership’s
existing joint ventures; and update various swap agreement provisions to conform to current market standards.
In November 2014, RGS entered into the Seventh Amended and Restated Credit Agreement (the "New Credit Agreement") to increase the commitment to
$2 billion
and extended the maturity date to November 25, 2019. The material differences between the Credit Agreement and the New Credit Agreement include:
|
•
|
the addition of provisions permitting investments in Mi Vida JV affording it similar treatment to the Partnership’s existing joint ventures;
|
|
•
|
an increase in certain permitted covenant baskets; and
|
|
•
|
updates to various pricing terms and the permitted maximum total leverage ratio to reflect the Partnership’s growth.
|
S - 102
In connection with the New Credit Agreement,
the Partnership
capitalized
$5 million
of net loan fees related to the amendments completed in the year ended December 31, 2014, which are being amortized over the remaining term.
In May 2013, RGS entered into the Credit Agreement to increase the commitment to
$1.2 billion
with a
$300 million
uncommitted incremental facility and extended the maturity date to May 21, 2018. The material differences between the Fifth Amended and Restated Credit Agreement and the Credit Agreement include:
|
•
|
A 75 bps decrease in pricing, with an additional 50 bps decrease upon the achievement of an investment grade rating;
|
|
•
|
No limitation on the maximum amount that the loan parties may invest in joint ventures existing on the date of the credit agreement so long as the Partnership is in pro forma compliance with the financial covenants;
|
|
•
|
The addition of a “Restricted Subsidiary” structure such that certain designated subsidiaries are not subject to the credit facility covenants and do not guarantee the obligations thereunder or pledge their assets in support thereof;
|
|
•
|
The addition of provisions such that upon the achievement of an investment grade rating by the Partnership, the collateral package will be released; the facility will become unsecured; and the covenant package will be significantly reduced;
|
|
•
|
An eight-quarter increase in the permitted Total Leverage Ratio; and
|
|
•
|
After March 2015, an increase in the permitted total leverage ratio for the two fiscal quarters following any
$50 million
or greater acquisition.
|
In connection with the Credit Agreement,
the Partnership
capitalized
$6 million
of net loan fees related to this amendment which are being amortized over the remaining term.
Borrowings under
the New Credit Agreement are secured by substantially all of
the Partnership’s
assets and are guaranteed by
the Partnership
and
its
consolidated subsidiaries, except for ELG and ORS. The New Credit Agreement and the guarantees thereunder are senior to
the Partnership’s
and the guarantors’ unsecured obligations.
The outstanding balance under the New Credit Agreement bears interest at LIBOR plus a margin or alternate base rate (equivalent to the U.S. prime lending rate) plus a margin, or a combination of both. The alternate base rate used to calculate interest on base rate loans will be calculated based on the greatest to occur of a base rate, a federal funds effective rate plus
0.50%
and an adjusted one-month LIBOR rate plus
1.00%
. The applicable margin shall range from
0.50%
to
1.25%
for base rate loans,
1.50%
to
2.25%
for Eurodollar loans.
The weighted average interest rate on the amounts outstanding under the Partnership’s Credit Agreement was
2.17%
as of
December 31, 2014
and
2013
.
RGS must
pay (i) a commitment fee ranging from
0.25%
to
0.375%
per annum of the unused portion of the revolving loan commitments, (ii) a participation fee for each revolving lender participating in letters of credit ranging from
1.5%
to
2.25%
per annum of the average daily amount of such lender’s letter of credit exposure and (iii) a fronting fee to the issuing bank of letters of credit equal to
0.20%
per annum of the average daily amount of the letter of credit exposure.
These fees are included in interest expense, net in the consolidated statement of operations.
The New Credit Agreement contains financial covenants requiring RGS and its subsidiaries to maintain a debt to consolidated EBITDA (as defined in the credit agreement) ratio less than
5.50
, a consolidated EBITDA to consolidated interest expense ratio greater than
2.50
and a secured debt to consolidated EBITDA ratio less than
3.25
. At
December 31, 2014
and
2013
,
RGS and its subsidiaries were in compliance with these covenants.
The New Credit Agreement restricts the ability of RGS to pay dividends and distributions other than reimbursements to
the Partnership
for expenses and payment of dividends to
the Partnership
for the amount of available cash (as defined) so long as no default or event of default has occurred or is continuing. The New Credit Agreement also contains various covenants that limit (subject to certain exceptions), among other things, the ability of RGS to:
|
•
|
incur indebtedness;
|
|
•
|
grant liens;
|
|
•
|
enter into sale and leaseback transactions;
|
|
•
|
make certain investments, loans and advances;
|
|
•
|
dissolve or enter into a merger or consolidation;
|
|
•
|
enter into asset sales or make acquisitions;
|
|
•
|
enter into transactions with affiliates;
|
|
•
|
prepay other indebtedness or amend organizational documents or transactions documents (as defined in the New Credit Agreement);
|
|
•
|
issue capital stock or create subsidiaries; or
|
|
•
|
engage in any business other than those businesses in which it was engaged at the time of the effectiveness of the New Credit Agreement or reasonable extension thereof.
|
S - 103
In February 2015, RGS exercised the accordion feature of the New Credit Agreement to increase commitments under the revolving credit facility by
$500 million
to a total of
$2.5 billion
.
The increased commitments will be available pursuant to the same terms and subject to the same interest rates and fees as the existing commitments under the New Credit Agreement.
Senior Notes
The Partnership
and Finance Corp. have the following series of senior notes (collectively “Senior Notes”):
|
•
|
$400 million
in aggregate principal amount of our
5.75%
senior notes due September 1, 2020 (the “2020 Notes“) with interest payable semi-annually in arrears on March 1 and September 1;
|
|
•
|
$500 million
in aggregate principal amount of our
6.5%
senior notes due July 15, 2021 (the “2021 Notes“) with interest payable semi-annually in arrears on January 15 and July 15;
|
|
•
|
$900 million
in aggregate principal of our
5.875%
senior notes due March 1, 2022 (the “2022 Notes“), issued in February 2014, with interest payable semi-annually in arrears on March 1 and September 1;
|
|
•
|
$700 million
in aggregate principal amount of our
5.5%
senior notes due April 15, 2023 (the “2023 5.5% Notes“) with interest payable semi-annually in arrears on April 15 and October 15;
|
|
•
|
$600 million
in aggregate principal amount of our
4.5%
senior notes due November 1, 2023 (the “2023 4.5% Notes“) with interest payable semi-annually in arrears on May 1 and November 1;
|
|
•
|
$390 million
, after partial redemption, in aggregate principal amount of our
8.375%
senior notes due June 1, 2020 (the “2020 PVR Notes“) with interest payable semi-annually in arrears on June 1 and December 1;
|
|
•
|
$400 million
in aggregate principal amount of our
6.5%
senior notes due May 15, 2021 (the “2021 PVR Notes“) with interest payable semi-annually in arrears on May 15 and November 15;
|
|
•
|
$499 million
in aggregate principal amount of our
8.375%
senior notes due June 1, 2019 (the “2019 Notes“) with interest payable semi-annually in arrears on June 1 and December 1; and
|
|
•
|
$700 million
in aggregate principal amount of our
5%
senior notes due October 1, 2022 (the “October 2022 Notes“) with interest payable semi-annually in arrears on April 1 and October 1.
|
In May 2009,
the Partnership
and Finance Corp. issued
$250 million
of senior notes with a maturity of June 1, 2016 (the “2016 Notes”). The 2016 Notes bore interest at
9.375%
with interest payable semi-annually in arrears on June 1 and December 1. In May 2012,
the Partnership
redeemed
35%
, or
$88 million
, of the 2016 Notes, bringing the total outstanding principal amount to
$163 million
.
A redemption premium of
$8 million
was charged to loss on debt refinancing, net in the consolidated statements of operations and
$4 million
of accrued interest was paid.
The Partnership
also wrote off the unamortized loan fee of
$1 million
and unamortized bond premium of
$2 million
to loss on debt refinancing, net in the consolidated statement of operations. In June 2013,
the Partnership
redeemed all amounts outstanding 2016 Notes for
$178 million
cash, inclusive of accrued and unpaid interest of
$7 million
and other fees and expenses.
In February 2014,
the Partnership
and Finance Corp. issued
$900 million
of senior notes that mature on March 1, 2022 (the “2022 Notes”). The 2022 Notes bear interest at
5.875%
with interest payable semi-annually in arrears on September 1 and March 1. At any time prior to December 1, 2021,
the Partnership
may redeem some or all of the notes at
100%
of the principal amount thereof, plus a “make-whole” redemption price and accrued and unpaid interest, if any, to the redemption date. On or after December 1, 2021,
the Partnership
may redeem some or all of the 2022 Notes at a redemption price equal to
100%
of the principal amount thereof, plus accrued and unpaid interest, if any, to the redemption date.
The 2022 Notes rank equally with
the Partnership’s
other Senior Notes.
In March 2014, in connection with the PVR Acquisition,
the Partnership
assumed
$1.2 billion
in aggregate principal amount of PVR’s outstanding senior notes, consisting of
$300 million
of
8.25%
senior notes that mature on April 15, 2018 (the “2018 PVR Notes”),
$400 million
of
6.5%
senior notes that mature on May 15, 2021 (the “2021 PVR Notes”), and
$473 million
of
8.375%
senior notes that mature on June 1, 2020 (the “2020 PVR Notes”, and together with the 2021 PVR Notes, the "PVR Notes"). In April 2014,
the Partnership
redeemed all of the 2018 PVR Notes for
$313 million
at a price of
104.125%
plus accrued and unpaid interest paid to the redemption date. Interest on the 2021 PVR Notes and the 2020 PVR Notes accrue semi-annually on May 15 and November 15 and June 1 and December 1, respectively.
The PVR Notes rank equally with
the Partnership’s
other Senior Notes.
On March 24, 2014, in accordance with
the Partnership’s
obligations under the indentures governing the PVR Notes,
the Partnership
commenced change of control offers pursuant to which holders of such notes were entitled to require
the Partnership
to repurchase all or a portion of
its
PVR Notes at a purchase price of
101%
of the principal amount thereof, plus accrued and unpaid interest to the repurchase date. The change of control offers for the PVR Notes expired on April 22, 2014 and, on April 23, 2014,
the Partnership
accepted for purchase less than $1 million in aggregate principal amount of 2021 PVR Notes.
S - 104
In July 2014, in connection with the Eagle Rock Midstream Acquisition,
the Partnership
exchanged
$499 million
of
8.375%
Senior Notes due 2019 of Eagle Rock and Eagle Rock Energy Finance Corp. for
8.375%
Senior Notes due 2019 issued by
the Partnership
and Finance Corp. (the “New Partnership Notes”). The New Partnership Notes rank equally with
the Partnership’s
other Senior Notes.
In July 2014,
the Partnership
and Finance Corp. issued
$700 million
of senior notes that mature on October 1, 2022 (the “October 2022 Notes”). The October 2022 Notes bear interest at
5%
with interest payable semi-annual in arrears on October 1 and April 1, beginning April 1, 2015. At any time prior to July 1, 2022,
the Partnership
may redeem some or all of the October 2022 Notes at
100%
of the principal amount thereof, plus a “make-whole” redemption price and accrued and unpaid interest, if any, to the redemption date. On or after, July 1, 2022,
the Partnership
may redeem some or all of the October 2022 Notes at a redemption price equal to
100%
of the principal amount thereof, plus accrued and unpaid interest, if any, to the redemption date.
The October 2022 Notes rank equally with
the Partnership’s
other Senior Notes.
In July 2014,
the Partnership
redeemed
$83 million
of the
$473 million
outstanding 2020 PVR Notes for
$91 million
, including
$8 million
of accrued interest and redemption premium.
In December 2014,
the Partnership
redeemed all of the outstanding
$600 million
2018 Notes, for a total price of
103.438%
or
$621 million
.
The Senior Notes issued by
the Partnership
and Finance Corp. are fully and unconditionally guaranteed, on a joint and several
basis, by
all of
the Partnership’s
consolidated subsidiaries, except for ELG and ORS.
The Senior Notes are redeemable at any time prior to the dates specified below at a price equal to 100% of the principal amount of the applicable series, plus a make-whole premium and accrued and unpaid interest, if any, to the redemption date:
|
•
|
2020 Notes
- Redeemable, in whole or in part, prior to June 1, 2020 at
100%
of the principal amount plus a make-whole premium and accrued and unpaid interest, if any, to the redemption date; redeemable, in whole or in part, on or after June 1, 2020 at
100%
of the principal amount thereof, plus accrued and unpaid interest, if any, to the redemption date
|
|
•
|
2021 Notes
- Any time prior to July 15, 2014, up to
35%
may be redeemed at a price of
106.5%
plus accrued and unpaid interest, if any; beginning July 15, 2016,
100%
may be redeemed at fixed redemption price of
103.25%
(July 15, 2017 -
102.167%
, July 15, 2018 -
101.083%
and July 15, 2019 and thereafter -
100%
) plus accrued and unpaid interest, if any, to the redemption date
|
|
•
|
2022 Notes
- Redeemable, in whole or in part, prior to December 1, 2021 at
100%
at the principal amount plus a make-whole premium and accrued and unpaid interest, if any, to the redemption date; redeemable, in whole or in part, on or after December 1, 2021 at
100%
at the principal amount thereof, plus accrued and unpaid interest, if any, to the redemption date
|
|
•
|
2023 5.5% Notes
- Any time prior to October 15, 2015, up to
35%
may be redeemed at a price of
105.5%
plus accrued and unpaid interest, if any; beginning October 15, 2017,
100%
may be redeemed at fixed redemption price of
102.75%
(October 15, 2018 -
101.833%
, October 15, 2019 -
100.917%
and October 15, 2020 and thereafter -
100%
) plus accrued and unpaid interest, if any, to the redemption date
|
|
•
|
2023 4.5% Notes
- Redeemable, in whole or in part, prior to August 1, 2023 at
100%
of the principal amount plus a make-whole premium and accrued and unpaid interest, if any, to the redemption date; redeemable, in whole or in part, on or after August 1, 2023 at
100%
of the principal amount thereof, plus accrued and unpaid interest, if any, to the redemption date
|
|
•
|
2020 PVR Notes
- Any time prior to June 1, 2015, up to
35%
may be redeemed at a price of
108.375%
plus accrued and unpaid interest, if any;
beginning June 1, 2016,
100%
may be redeemed at fixed redemption price of
104.188%
(June 1, 2017 -
102.094%
, June 1, 2018 and thereafter -
100%
) plus accrued and unpaid interest, if any, to the redemption date
|
|
•
|
2021 PVR Notes -
Any time prior to May 15, 2016, up to
35%
may be redeemed at a price of
106.5%
plus accrued and unpaid interest and liquidated damages, if any; beginning May 15, 2016,
100%
may be redeemed at a fixed redemption price of
104.875%
(May 15, 2017 -
103.250%
, May 15, 2018 -
101.625%
and May 15, 2019 and thereafter -
100%
) plus accrued and unpaid interest, if any, to the redemption date
|
|
•
|
2019 Notes
- Redeemable, in whole or in part, prior to June 1, 2015 at
100%
at the principal amount plus a make-whole premium and accrued and unpaid interest, if any, to the redemption date; beginning June 1, 2015,
100%
may be redeemed at a fixed redemption price of
104.188%
(June 1, 2016 -
102.094%
and June 1, 2017 and thereafter -
100%
) plus accrued and unpaid interest, if any, to the redemption date
|
|
•
|
October 2022 Notes
- Redeemable, in whole or in part, prior to July 1, 2022 at
100%
of the principal amount plus a make-whole premium and accrued and unpaid interest, if any, to the redemption date; redeemable, in whole or in part, on or
|
S - 105
after July 1, 2022 at
100%
of the principal amount thereof, plus accrued and unpaid interest, if any, to the redemption date
Upon a change of control followed by a ratings downgrade within 90 days of a change of control, each holder of
the Partnership’s
Senior Notes, other than the PVR Notes, will be entitled to require
the Partnership
to repurchase all or a portion of its notes at a purchase price of
101%
plus accrued and unpaid interest, if any.
Upon a change of control, the indenture governing the PVR Notes requires
the Partnership
to make an offer to repurchase all outstanding notes at
101%
of the principal amount thereof, plus accrued and unpaid interest (and additional interest, if any) to the date of repurchase.
The Partnership’s
ability to repurchase the Senior Notes upon a change of control will be limited by the terms of
our
debt agreements, including
the Partnership’s
revolving credit facility.
The Senior Notes contain various covenants that limit, among other things,
the Partnership’s
ability, and the ability of certain of
the Partnership’s
subsidiaries, to:
|
•
|
incur additional indebtedness;
|
|
•
|
pay distributions on, or repurchase or redeem our equity interests;
|
|
•
|
make certain investments;
|
|
•
|
incur liens;
|
|
•
|
enter into certain types of transactions with affiliates; and
|
|
•
|
sell assets or consolidate or merge with or into other companies.
|
If the Senior Notes achieve investment grade ratings by both Moody’s and Standard & Poor’s and no default or event of default has occurred and is continuing,
the Partnership
will no longer be subject to many of the foregoing covenants.
At
December 31, 2014
, the Partnership was
in compliance with these covenants.
9.
INTANGIBLE ASSETS
Activity related to intangible assets, net consisted of the following:
|
|
Customer
Relations
|
Trade Names
|
Total
|
||||||||
|
Balance at January 1, 2013
|
$
|
655
|
|
$
|
57
|
|
$
|
712
|
|
||
|
Amortization
|
(26
|
)
|
(4
|
)
|
(30
|
)
|
|||||
|
Balance at December 31, 2013
|
629
|
|
53
|
|
682
|
|
|||||
|
Amortization
|
(105
|
)
|
(3
|
)
|
(108
|
)
|
|||||
|
Intangible assets acquired
|
2,865
|
|
—
|
|
2,865
|
|
|||||
|
Balance at December 31, 2014
|
$
|
3,389
|
|
$
|
50
|
|
$
|
3,439
|
|
||
The average remaining amortization periods for customer relations and trade names are
28
and
15
years, respectively. The expected amortization of the intangible assets for each of the five succeeding years is
$135 million
.
10.
FAIR VALUE MEASURES
The fair value measurement provisions establish a three-tiered fair value hierarchy that prioritizes inputs to valuation techniques used in fair value calculations. The three levels of inputs are defined as follows:
|
•
|
Level 1—unadjusted quoted prices for identical assets or liabilities in active accessible markets;
|
|
•
|
Level 2—inputs that are observable in the marketplace other than those classified as Level 1; and
|
|
•
|
Level 3—inputs that are unobservable in the marketplace and significant to the valuation.
|
Entities are encouraged to maximize the use of observable inputs and minimize the use of unobservable inputs. If a financial instrument uses inputs that fall in different levels of the hierarchy, the instrument will be categorized based upon the lowest level of input that is significant to the fair value calculation.
The Partnership’s financial assets and liabilities measured at fair value on a recurring basis are derivatives related to commodity
swaps and embedded derivatives in the Series A Preferred Units. Derivatives related to commodity swaps are valued using discounted cash flow techniques. These techniques incorporate Level 1 and Level 2 inputs such as commodity prices. These market inputs are utilized in the discounted cash flow calculation considering the instrument’s term, notional amount, discount rate and credit risk and are classified as Level 2 in the hierarchy. Embedded derivatives related to Series A Preferred Units are valued using
S - 106
a binomial lattice model. The inputs utilized in the model include credit spread, probabilities of the occurrence of certain events, common unit price, dividend yield, and expected volatility, and are classified as Level 3 in the hierarchy.
The following table presents the Partnership’s derivative assets and liabilities measured at fair value on a recurring basis:
|
|
Fair Value Measurement at December 31,
|
||||||||||||||||||||||
|
2014
|
2013
|
||||||||||||||||||||||
|
|
Fair Value
Total
|
Level 2
|
Level 3
|
Fair Value
Total
|
Level 2
|
Level 3
|
|||||||||||||||||
|
Assets
|
|||||||||||||||||||||||
|
Commodity Derivatives:
|
|||||||||||||||||||||||
|
Natural Gas
|
$
|
26
|
|
$
|
26
|
|
$
|
—
|
|
$
|
2
|
|
$
|
2
|
|
$
|
—
|
|
|||||
|
Natural Gas Liquids
|
23
|
|
23
|
|
—
|
|
2
|
|
2
|
|
—
|
|
|||||||||||
|
Condensate
|
36
|
|
36
|
|
—
|
|
—
|
|
—
|
|
—
|
|
|||||||||||
|
Total Assets
|
$
|
85
|
|
$
|
85
|
|
$
|
—
|
|
$
|
4
|
|
$
|
4
|
|
$
|
—
|
|
|||||
|
Liabilities
|
|||||||||||||||||||||||
|
Commodity Derivatives:
|
|
||||||||||||||||||||||
|
Natural Gas
|
$
|
—
|
|
$
|
—
|
|
$
|
—
|
|
$
|
4
|
|
$
|
4
|
|
$
|
—
|
|
|||||
|
Natural Gas Liquids
|
—
|
|
—
|
|
—
|
|
4
|
|
4
|
|
—
|
|
|||||||||||
|
Condensate
|
—
|
|
—
|
|
—
|
|
1
|
|
1
|
|
—
|
|
|||||||||||
|
Embedded Derivatives in Series A Preferred Units
|
16
|
|
—
|
|
16
|
|
19
|
|
—
|
|
19
|
|
|||||||||||
|
Total Liabilities
|
$
|
16
|
|
$
|
—
|
|
$
|
16
|
|
$
|
28
|
|
$
|
9
|
|
$
|
19
|
|
|||||
The following table presents the material unobservable inputs used to estimate the fair value of the embedded derivatives in the Series A Preferred Units:
|
Unobservable Input
|
December 31, 2014
|
||
|
Credit Spread
|
4.76
|
%
|
|
|
Volatility
|
35.8
|
%
|
|
Changes in the Partnership’s cost of equity and U.S. Treasury yields would cause a change in the credit spread used to value the embedded derivatives.
The following table presents the changes in Level 3 derivatives measured on a recurring basis for the years ended
December 31, 2014
and
2013
. There were
no
transfers between Level 2 and Level 3 derivatives for the years ended
December 31, 2014
and
2013
.
|
|
Embedded Derivatives in
Series A Preferred Units
|
||
|
Balance at January 1, 2013
|
$
|
25
|
|
|
Change in fair value, net of gain at conversion of $26 million
|
(6
|
)
|
|
|
Balance at December 31, 2013
|
19
|
|
|
|
Change in fair value
|
(3
|
)
|
|
|
Balance at December 31, 2014
|
$
|
16
|
|
The carrying amount of cash and cash equivalents, accounts receivable and accounts payable approximates fair value due to their short-term maturities. Long-term debt, other than the Senior Notes, is comprised of borrowings under which interest accrues under a floating interest rate structure. Accordingly, the carrying value approximates fair value.
The aggregate fair value and carrying amount of the Senior Notes at
December 31, 2014
and
2013
was
$5.1 billion
and
$2.8 billion
, respectively. The fair value of the Senior Notes is a Level 1 valuation based on third party market value quotations.
S - 107
11.
LEASES
The following table is a schedule of future minimum lease payments for office space and certain equipment leased by the Partnership, that had initial or remaining non-cancelable lease terms in excess of one year as of
December 31, 2014
:
|
For the year ending December 31,
|
Operating Lease
|
|||
|
2015
|
$
|
5
|
|
|
|
2016
|
5
|
|
||
|
2017
|
4
|
|
||
|
2018
|
3
|
|
||
|
2019
|
2
|
|
||
|
Thereafter
|
26
|
|
||
|
Total minimum lease payments
|
$
|
45
|
|
|
Total rent expense for operating leases, including those leases with terms of less than one year, was
$20 million
,
$11 million
and
$11 million
for the years ended
December 31, 2014
,
2013
and
2012
, respectively.
12.
COMMITMENTS AND CONTINGENCIES
Legal.
The Partnership is involved in various claims, lawsuits and audits by taxing authorities incidental to its business. These claims and lawsuits in the aggregate are not expected to have a material adverse effect on the Partnership’s business, financial condition, results of operations or cash flows.
ETP Merger Shareholder Litigation.
Following the January 26, 2015 announcement of the definitive merger agreement with ETP, purported Partnership unitholders filed lawsuits in state and federal courts in Dallas, Texas asserting claims relating to the proposed transaction.
On February 3, 2015, William Engel and Enno Seago, purported Partnership unitholders, filed a class action petition on behalf of the Partnership’s common unitholders and a derivative suit on behalf of the Partnership in the 162nd Judicial District Court of Dallas County, Texas (the “Engel Lawsuit”). The lawsuit names as defendants the General Partner, the members of the General Partner’s board of directors, ETP, ETP GP, ETE, and, as a nominal party, the Partnership. The Engel Lawsuit alleges that (1) the General Partner’s directors breached duties to the Partnership and the Partnership’s unitholders by employing a conflicted and unfair process and failing to maximize the merger consideration; (2) the General Partner’s directors breached the implied covenant of good faith and fair dealing by engaging in a flawed merger process; and (3) the non-director defendants aided and abetted in these claimed breaches. The plaintiffs seek an injunction preventing the defendants from closing the proposed transaction or an order rescinding the transaction if it has already been completed. The plaintiffs also seek money damages and court costs, including attorney’s fees.
On February 9, 2015, Stuart Yeager, a purported Partnership unitholder, filed a class action petition on behalf of the Partnership’s common unitholders and a derivative suit on behalf of the Partnership in the 134th Judicial District Court of Dallas County, Texas (the “Yeager Lawsuit”). The allegations, claims, and relief sought in the Yeager Lawsuit are nearly identical to those in the Engel Lawsuit.
On February 10, 2015, Lucien Coggia a purported Partnership unitholder, filed a class action petition on behalf of the Partnership’s common unitholders and a derivative suit on behalf of the Partnership in the 192nd Judicial District Court of Dallas County, Texas (the “Coggia Lawsuit”). The allegations, claims, and relief sought in the Coggia Lawsuit are nearly identical to those in the Engel Lawsuit.
On February 3, 2015, Linda Blankman, a purported Partnership unitholder, filed a class action complaint on behalf of the Partnership’s common unitholders in the United States District Court for the Northern District of Texas (the “Blankman Lawsuit”). The allegations and claims in the Blankman Lawsuit are similar to those in the Engel Lawsuit. However, the Blankman Lawsuit does not allege any derivative claims and includes the Partnership as a defendant rather than a nominal party. The lawsuit also omits one of the General Partner’s directors, Richard Brannon, who was named in the Engel Lawsuit. The Blankman Lawsuit alleges that the General Partner’s directors breached their fiduciary duties to the unitholders by failing to maximize the value of the Partnership, failing to properly value the Partnership, and ignoring conflicts of interest. The plaintiff also asserts a claim against the non-director defendants for aiding and abetting the directors’ alleged breach of fiduciary duty. The Blankman Lawsuit seeks the same relief that the plaintiffs seek in the Engel Lawsuit.
S - 108
On February 6, 2015, Edwin Bazini, a purported Partnership unitholder, filed a class action complaint on behalf of the Partnership’s common unitholders in the United States District Court for the Northern District of Texas (the “Bazini Lawsuit”). The allegations, claims, and relief sought in the Bazini Lawsuit are nearly identical to those in the Blankman Lawsuit.
On February 11, 2015, Mark Hinnau, a purported Partnership unitholder, filed a class action complaint on behalf of the Partnership’s common unitholders in the United States District Court for the Northern District of Texas (the “Hinnau Lawsuit”). The allegations, claims, and relief sought in the Hinnau Lawsuit are nearly identical to those in the Blankman Lawsuit.
On February 11, 2015, Stephen Weaver, a purported Partnership unitholder, filed a class action complaint on behalf of the Partnership’s common unitholders in the United States District Court for the Northern District of Texas (the “Weaver Lawsuit”). The allegations, claims, and relief sought in the Weaver Lawsuit are nearly identical to those in the Blankman Lawsuit.
On February 11, 2015, Adrian Dieckman, a purported Partnership unitholder, filed a class action complaint on behalf of the Partnership’s common unitholders in the United States District Court for the Northern District of Texas (the “Dieckman Lawsuit”). The allegations, claims, and relief sought in the Dieckman Lawsuit are similar to those in the Blankman Lawsuit, except that the Dieckman Lawsuit does not assert an aiding and abetting claim.
On February 13, 2015, Irwin Berlin, a purported Partnership unitholder, filed a class action complaint on behalf of the Partnership’s common unitholders in the United States District Court for the Northern District of Texas (the “Dieckman Lawsuit”). The allegations, claims, and relief sought in the Berlin Lawsuit are similar to those in the Blankman Lawsuit.
Each of these lawsuits is at a preliminary stage. We cannot predict the outcome of these or any other lawsuits that might be filed, nor can we predict the amount of time and expense that will be required to resolve these lawsuits. The Partnership and the other defendants named in the lawsuits intend to defend vigorously against these and any other actions.
PVR Shareholder Litigation.
Five putative class action lawsuits challenging the PVR Acquisition are currently pending. All of the cases name PVR, PVR GP and the then-incumbent directors of PVR GP, as well as the Partnership and the General Partner (collectively, the “Regency Defendants”), as defendants. Each of the lawsuits has been brought by a purported unitholder of PVR, both individually and on behalf of a putative class consisting of public unitholders of PVR. The lawsuits generally allege, among other things, that the directors of PVR GP breached their fiduciary duties to unitholders of PVR, that PVR GP, PVR and the Regency Defendants aided and abetted the directors of PVR GP in the alleged breach of these fiduciary duties, and, as to the actions in federal court, that some or all of PVR, PVR GP, and the directors of PVR GP violated Section 14(a) of the Exchange Act and Rule 14a-9 promulgated thereunder and Section 20(a) of the Exchange Act. The lawsuits purport to seek, in general, (i) injunctive relief, (ii) disclosure of certain additional information concerning the transaction, (iii) rescission or an award of rescissory damages, (iv) an award of plaintiffs’ costs and (v) the accounting for damages allegedly causes by the defendants to these actions, and, (vi) such further relief as the court deems just and proper. The styles of the pending cases are as follows: David Naiditch v. PVR Partners, L.P., et al. in the Court of Chancery of the State of Delaware); Charles Monatt v. PVR Partners, LP, et al. and Saul Srour v. PVR Partners, L.P., et al., each pending in the Court of Common Pleas for Delaware County, Pennsylvania; Stephen Bushansky v. PVR Partners, L.P., et al.; and Mark Hinnau v. PVR Partners, L.P., et al., pending in the United States District Court for the Eastern District of Pennsylvania.
On January 28, 2014, the defendants entered into a Memorandum of Understanding (“MOU”) with Monatt, Srour, Bushansky, Naiditch and Hinnau pursuant to which defendants and the referenced plaintiffs agreed in principle to a settlement of their lawsuits (“Settled Lawsuits”), which will be memorialized in a separate settlement agreement, subject to customary conditions, including consummation of the PVR Acquisition, which occurred on March 21, 2014, completion of certain confirmatory discovery (which was completed as of September 5, 2014), class certification and final approval by the Court of Common Pleas for Delaware County, Pennsylvania. If the Court approves the settlement, the Settled Lawsuits will be dismissed with prejudice and all defendants will be released from any and all claims relating to the Settled Lawsuits.
The settlement did not affect any provisions of the merger agreement or the form or amount of consideration received by PVR unitholders in the PVR Acquisition. The defendants have denied and continue to deny any wrongdoing or liability with respect to the plaintiffs’ claims in the aforementioned litigation and have entered into the settlement to eliminate the uncertainty, burden, risk, expense, and distraction of further litigation.
Eagle Rock Shareholder Litigation.
Three putative class action lawsuits challenging the Eagle Rock Midstream Acquisition were previously filed in federal district court in Houston, Texas. All cases name Eagle Rock and its current directors, as well as the Partnership and a subsidiary, as defendants. One of the lawsuits also names additional Eagle Rock entities as defendants. Each of the lawsuits has been brought by a purported unitholder of Eagle Rock (collectively, the “Plaintiffs”), both individually and on behalf of a putative class consisting of public unitholders of Eagle Rock. The Plaintiffs in each case seek to rescind the transaction,
S - 109
claiming, among other things, that it yields inadequate consideration, was tainted by conflict and constitutes breaches of common law fiduciary duties or contractually imposed duties to the shareholders. Plaintiffs also seek monetary damages and attorneys’ fees. The Partnership and its subsidiary are named as “aiders and abettors” of the allegedly wrongful actions of Eagle Rock and its board. In November 2014, the US District Court issued a Notice of Voluntary Dismissal without Prejudice of all claims in this matter.
PADEP Consent Assessment.
On November 21, 2014, our subsidiary, Regency Marcellus Gas Gathering LLC (“Regency Marcellus”), received a Notice of Violation (“NOV”) from the Pennsylvania Department of Environmental Protection (“PADEP”) relating to unpermitted wetlands and streams along the second phase of construction of the Canton Pipeline Project with proposed civil penalties potentially in excess of $100,000. Regency Marcellus has submitted amended permit applications for this phase of construction and is working with the PADEP to acquire amended permits for the proposed crossings of the wetland resources. Regency Marcellus is in discussions with the PADEP regarding the aforementioned NOV. The timing or outcome of this matter cannot reasonably be determined at this time, however we do not expect there to be a material impact on our business or results of operations.
CDM Sales Tax Audit
. CDM Resource Management LLC (“CDM”), a subsidiary of the Partnership, has historically claimed the manufacturing exemption from sales tax in Texas, as is common in the industry. The exemption is based on the fact that CDM’s natural gas compression equipment is used in the process of treating natural gas for ultimate use and sale. In a recent audit by the Texas Comptroller’s office, the Comptroller has challenged the applicability of the manufacturing exemption to CDM. The period being audited is from August 2006 to August 2007, and liability for that period is potentially covered by an indemnity obligation from CDM’s prior owners. CDM may also have liability for periods since 2008, and prospectively, if the Comptroller’s challenge is ultimately successful. An audit of the 2008 period has commenced. In April 2013, an independent audit review agreed with the Comptroller’s position. While CDM continues to disagree with this position and intends to seek redetermination and other relief, we are unable to predict the final outcome of this matter.
Environmental
. The Partnership is responsible for environmental remediation at certain sites on its gathering and processing systems, resulting primarily from releases of hydrocarbons. The Partnership’s remediation program typically involves the management of contaminated soils and may involve remediation of groundwater. Activities vary with site conditions and locations, the extent and nature of the contamination, remedial requirements and complexity. The ultimate liability and total costs associated with these sites will depend upon many factors. In addition, the Partnership has reclamation and bonding requirements with respect to certain un-leased and inactive coal properties.
The table below reflects the undiscounted environmental liabilities recorded in the consolidated balance sheet at
December 31, 2014
and
2013
where management believes a loss is probable and reasonably estimable. The Partnership does not have any material environmental remediation matters assessed as reasonably possible that would require disclosure in the financial statements.
|
December 31,
|
|||||||
|
2014
|
2013
|
||||||
|
Current
|
$
|
2
|
|
$
|
2
|
|
|
|
Noncurrent
|
8
|
|
6
|
|
|||
|
Total environmental liabilities
|
$
|
10
|
|
$
|
8
|
|
|
The Partnership made expenditures related to environmental remediation of
$2 million
for the year ended
December 31, 2014
.
Air Quality Control.
The Partnership is currently negotiating settlements to certain enforcement actions by the NMED and the TCEQ. The TCEQ recently initiated a state-wide emissions inventory for the sulfur dioxide emissions from sites with reported emissions of 10 tons per year or more. If this data demonstrates that any source or group of sources may cause or contribute to a violation of the National Ambient Air Quality Standards, they must be sufficiently controlled to ensure timely attainment of the standard. This may potentially affect three recovery units in Texas. It is unclear at this time how the NMED will address the sulfur dioxide standard.
Compliance Orders from the NMED.
The Partnership has been in discussions with the NMED concerning allegations of violations of New Mexico air regulations related to the Jal #3 and Jal #4 facilities. Hearings on the compliance orders were delayed until May 2015 to allow the parties to pursue substantive settlement discussions. The Partnership has meritorious defenses to the NMED claims and can offer significant mitigating factors to the claimed violations. The Partnership has recorded a liability of less than
$1 million
related to the claims and will continue to assess its potential exposure to the allegations as the matters progress.
S - 110
Mine Health and Safety Laws.
There are numerous mine health and safety laws and regulations applicable to the coal mining industry. However, since the Partnership does not operate any mines and does not employ any coal miners, it is not subject to such laws and regulations. Accordingly, the Partnership has not accrued any related liabilities.
In addition to the matters discussed above, the Partnership is involved in legal, tax and regulatory proceedings before various courts, regulatory commissions and governmental agencies regarding matters arising in the ordinary course of business.
13.
SERIES A PREFERRED UNITS
On September 2, 2009, the Partnership issued
4,371,586
Series A Preferred Units for net proceeds of
$79 million
, inclusive of the General Partner’s contribution of
$2 million
.
Holders may elect to convert Series A Preferred Units to common units at any time. In July 2013, certain holders of Series A Preferred Units exercised their right to convert
2,459,017
Series A Preferred Units into common units. Concurrent with this transaction, the Partnership recognized a
$26 million
gain in other income and deductions, net, related to the embedded derivative and reclassified
$41 million
from the Series A Preferred Units into common units. As of
December 31, 2014
, the remaining Series A Preferred Units were convertible into
2,064,805
common units, and if outstanding, are mandatorily redeemable on September 2, 2029 for
$35 million
plus all accrued but unpaid distributions and interest thereon (the “Series A Liquidation Value”). The Series A Preferred Units receive fixed quarterly cash distributions of
$0.445
per unit if outstanding on the record dates of the Partnership’s common unit distributions.
Distributions on the Series A Preferred Units were accrued for the first two quarters (and not paid in cash) and will result in an increase in the number of common units issuable upon conversion. If on any distribution payment date beginning March 31, 2010, the Partnership (1) fails to pay distributions on the Series A Preferred Units, (2) reduces the distributions on the common units to zero and (3) is prohibited by its material financing agreements from paying cash distributions, such distributions shall automatically accrue and accumulate until paid in cash. If the Partnership has failed to pay cash distributions in full for two quarters (whether or not consecutive) from and including the quarter ended on March 31, 2010, then if the Partnership fails to pay cash distributions on the Series A Preferred Units, all future distributions on the Series A Preferred Units that are accrued rather than being paid in cash by the Partnership will consist of the following: (1)
$0.35375
per Series A Preferred Unit per quarter, (2)
$0.09125
per Series A Preferred Unit per quarter (the “Common Unit Distribution Amount”), payable solely in common units, and (3)
$0.09125
per Series A Preferred Unit per quarter (the “PIK Distribution Additional Amount”), payable solely in common units. The total number of common units payable in connection with the Common Unit Distribution Amount or the PIK Distribution Additional Amount cannot exceed
$2 million
in any period of
20
consecutive fiscal quarters.
Upon the Partnership’s breach of certain covenants (a “Covenant Default”), the holders of the Series A Preferred Units will be entitled to an increase of
$0.1825
per quarterly distribution, payable solely in common units (the “Covenant Default Additional Amount”). All accumulated and unpaid distributions will accrue interest (i) at a rate of
2.432%
per quarter, or (ii) if the Partnership has failed to pay all PIK Distribution Additional Amounts or Covenant Default Additional Amounts or any Covenant Default has occurred and is continuing, at a rate of
3.429%
per quarter while such failure to pay or such Covenant Default continues.
The Series A Preferred Units are convertible, at the holder’s option, into common units, provided that the holder must request conversion of at least
375,000
Series A Preferred Units. The conversion price will initially be
$18.30
, subject to adjustment for customary events (such as unit splits). The number of common units issuable is equal to the issue price of the Series A Preferred Units (i.e.
$18.30
) being converted plus all accrued but unpaid distributions and accrued but unpaid interest thereon (the “Redeemable Face Amount”), divided by the applicable conversion price.
If at any time the volume-weighted average trading price of the common units over the trailing 20-trading day period (the “VWAP Price”) is less than the then-applicable conversion price, the conversion ratio is increased to: the quotient of (1) the Redeemable Face Amount on the date that the holder’s conversion notice is delivered, divided by (2) the product of (x) the VWAP Price set forth in the applicable conversion notice and (y)
91%
, but will not be less than
$10
.
The Partnership has the right at any time to convert all or part of the Series A Preferred Units into common units, if (1) the daily volume-weighted average trading price of the common units is greater than
150%
of the then-applicable conversion price for
20
out of the trailing
30
trading days, and (2) certain minimum public float and trading volume requirements are satisfied.
In the event of a change of control, the Partnership will be required to make an offer to the holders of the Series A Preferred Units to purchase their Series A Preferred Units for an amount equal to
101%
of their Series A Liquidation Value. In addition, in the event of certain business combinations or other transactions involving the Partnership in which the holders of common units receive cash consideration exclusively in exchange for their common units (a “Cash Event”), the Partnership must use commercially reasonable efforts to ensure that the holders of the Series A Preferred Units will be entitled to receive a security issued by the surviving entity in the Cash Event with comparable powers, preferences and rights to the Series A Preferred Units. If the Partnership
S - 111
is unable to ensure that the holders of the Series A Preferred Units will be entitled to receive such a security, then the Partnership will be required to make an offer to the holders of the Series A Preferred Units to purchase their Series A Preferred Units for an amount equal to
120%
of their Series A Liquidation Value. If the Partnership enters into any recapitalization, reorganization, consolidation, merger, spin-off that is not a Cash Event, the Partnership will make appropriate provisions to ensure that the holders of the Series A Preferred Units receive a security with comparable powers, preferences and rights to the Series A Preferred Units upon consummation of such transaction. Subsequent to the ETE Acquisition, no unitholder exercised this option.
As of
December 31, 2014
, the Series A Preferred Units were convertible to
2,064,805
common units.
The following table provides a reconciliation of the beginning and ending balances of the Series A Preferred Units for the years ended
December 31, 2014
and
2013
:
|
Units
|
Amount
|
||||||
|
Balance at January 1, 2013
|
4,371,586
|
|
$
|
73
|
|
|
|
|
Series A Preferred Units converted to common units
|
(2,459,017
|
)
|
(41
|
)
|
|
||
|
Balance at January 1, 2014
|
1,912,569
|
|
32
|
|
|
||
|
Accretion to redemption value
|
N/A
|
|
1
|
|
|
||
|
Balance at December 31, 2014
|
1,912,569
|
|
$
|
33
|
|
*
|
|
* This amount will be accreted to
$35 million
plus any accrued but unpaid distributions and interest by deducting amounts from
partners’ capital over the remaining periods until the mandatory redemption date of September 2, 2029. Accretion during
2013
was immaterial.
14.
RELATED PARTY TRANSACTIONS
As of
December 31, 2014
and
2013
, details of the Partnership’s related party receivables and related party payables were as follows:
|
|
December 31,
|
||||||
|
2014
|
2013
|
||||||
|
Related party receivables
|
|||||||
|
ETE and its subsidiaries
|
43
|
|
25
|
|
|||
|
HPC
|
1
|
|
1
|
|
|||
|
Ranch JV
|
1
|
|
2
|
|
|||
|
Total related party receivables
|
$
|
45
|
|
$
|
28
|
|
|
|
Related party payables
|
|||||||
|
ETE and its subsidiaries
|
50
|
|
68
|
|
|||
|
HPC
|
3
|
|
1
|
|
|||
|
Mi Vida JV
|
11
|
|
—
|
|
|||
|
Total related party payables
|
$
|
64
|
|
$
|
69
|
|
|
Transactions with ETE and its subsidiaries.
Under the service agreement with Services Co., the Partnership paid Services Co.’s direct expenses for services performed, plus an annual fee of
$10 million
, and received the benefit of any cost savings recognized for these services. The services agreement has a five year term ending May 26, 2015, subject to earlier termination rights in the event of a change in control, the failure to achieve certain cost savings for the Partnership or upon an event of default. On April 30, 2013, this agreement was amended to provide for a waiver of the
$10 million
annual fee effective as of May 1, 2013 through and including April 30, 2015 and to clarify the scope and expenses chargeable as direct expenses thereunder.
On April 30, 2013, the Partnership entered into the second amendment (the “Operation and Service Amendment”) to the Operation and Service Agreement (the “Operation and Service Agreement”), by and among the Partnership, ETC, the General Partner and RGS. Under the Operation and Service Agreement, ETC performs certain operations, maintenance and related services reasonably required to operate and maintain certain facilities owned by the Partnership, and the Partnership reimburses ETC for actual costs and expenses incurred in connection with the provision of these services based on an annual budget agreed upon by both parties.
The Partnership incurred total service fees related to the agreements described above from ETE and its subsidiaries of
$6 million
,
$11 million
and
$17 million
for the years ended
December 31, 2014
,
2013
and
2012
, respectively.
S - 112
In conjunction with distributions made by the Partnership to the limited and general partner interests, ETE and its subsidiaries received cash distributions of
$175 million
,
$107 million
and
$62 million
for the years ended
December 31, 2014
,
2013
and
2012
, respectively.
The General Partner has the right, but not the obligation, to contribute a proportionate amount of capital to the Partnership to maintain its general partner interest. No capital contributions were contributed during the years ended
December 31, 2014
and
2013
.
The Partnership’s Gathering and Processing segment, in the ordinary course of business, sells natural gas and NGLs to subsidiaries of ETE and records the revenue in gas sales and NGL sales. The Partnership’s Contract Services segment provides contract compression services to a subsidiary of ETE and records revenue in gathering, transportation and other fees on the statement of operations. As these transactions are between entities under common control, partners’ capital was increased, which represented a deemed contribution of the excess sales price over the carrying amounts. The Partnership’s Gathering and Processing segment recorded revenues from subsidiaries of ETE of
$351 million
and cost of sales to subsidiaries of ETE of
$52 million
for the year ended
December 31, 2014
. The Partnership’s Contract Services segment recorded revenues from a subsidiary of ETE of
$1 million
for the year ended
December 31, 2014
. The Partnership’s Contract Services segment purchased
$67 million
and
$95 million
of compression equipment from a subsidiary of ETE during the years ended
December 31, 2014
and
2013
, respectively.
Prior to April 30, 2013, Southern Union provided certain administrative services for SUGS that were either based on SUGS’s pro-rata share of combined net investment, margin and certain expenses or direct costs incurred by Southern Union on the behalf of SUGS. Southern Union also charged a management and royalty fee to SUGS for certain management support services provided by Southern Union on the behalf of SUGS and for the use of certain Southern Union trademarks, trade names and service marks by SUGS. The amounts were
$21 million
and
$1 million
for the period from March 26, 2012 to December 31, 2012. These administrative services were no longer being provided subsequent to the SUGS Acquisition.
Transactions with Lone Star.
The Partnership entered into various agreements to sell NGLs to Lone Star. For the year ended
December 31, 2014
, the Partnership had recorded
$257 million
in NGL sales under these contracts.
Transactions with HPC.
Under a Master Services Agreement with HPC, the Partnership operates and provides all employees and services for the operation and management of HPC. For the years ended
December 31, 2014
,
2013
, and
2012
, the related party general and administrative expenses reimbursed to the Partnership were
$14 million
,
$18 million
, and
$20 million
, respectively, which is recorded in gathering, transportation and other fees.
The Partnership’s Contract Services segment provides compression services to HPC and records revenue in gathering, transportation and other fees. The Partnership also receives transportation services from HPC and records it as cost of sales.
15.
CONCENTRATION RISK
The following table provides information about the extent of reliance on major customers and gas suppliers. Total revenues and cost of sales from transactions with an external customer or supplier amounting to
10%
or more of revenue or cost of gas and liquids are disclosed below, together with the identity of the reportable segment.
|
Years Ended December 31,
|
|||||||||||||
|
|
Reportable Segment
|
2014
|
2013
|
2012
|
|||||||||
|
Customer
|
|||||||||||||
|
Customer A
|
Gathering and Processing
|
$
|
—
|
|
$
|
381
|
|
$
|
367
|
|
|||
|
Customer B
|
Gathering and Processing
|
780
|
|
362
|
|
451
|
|
||||||
|
Supplier
|
|||||||||||||
|
Supplier A
|
Gathering and Processing
|
—
|
|
164
|
|
171
|
|
||||||
|
Supplier B
|
Gathering and Processing
|
—
|
|
185
|
|
—
|
|
||||||
The Partnership is a party to various commercial netting agreements that allow it and contractual counterparties to net receivable and payable obligations. These agreements are customary and the terms follow standard industry practice. In the opinion of management, these agreements reduce the overall counterparty risk exposure.
S - 113
16.
SEGMENT INFORMATION
The Partnership has
six
reportable segments: Gathering and Processing, Natural Gas Transportation, NGL Services, Contract Services, Natural Resources and Corporate. The reportable segments are as described below:
|
•
|
Gathering and Processing.
The Partnership provides
“wellhead-to-market” services to producers of natural gas, which include transporting raw natural gas from the wellhead through gathering systems, processing raw natural gas to separate NGLs from the raw natural gas and selling or delivering pipeline-quality natural gas and NGLs to various markets and pipeline systems, the gathering of oil (crude and/or condensate, a lighter oil) received from producers, the gathering and disposing of salt water, and natural gas and NGL marketing and trading. This segment also includes
the Partnership’s
60%
membership interest in ELG, which operates natural gas gathering, oil pipeline, and oil stabilization facilities in south Texas,
the Partnership’s
33.33%
membership interest in Ranch JV, which processes natural gas delivered from NGL-rich shale formations in west Texas,
the Partnership’s
50%
interest in Sweeny JV,
which operates a natural gas gathering facility in south Texas,
the Partnership’s
51%
membership interest in Aqua - PVR, which transports and supplies fresh water to natural gas producers in the Marcellus shale in Pennsylvania,
the Partnership’s
75%
membership interest in ORS, which will operate a natural gas gathering system in the Utica shale in Ohio, and
the Partnership’s
50%
interest in Mi Vida JV, which will operate a cryogenic processing plant and related facilities in west Texas.
|
|
•
|
Natural Gas Transportation.
The Partnership owns a
49.99%
general partner interest in HPC, which owns RIGS, a
450
-mile intrastate pipeline that delivers natural gas from northwest Louisiana to downstream pipelines and markets, and a
50%
membership interest in MEP, which owns a
500
-mile interstate natural gas pipeline stretching from southeast Oklahoma through northeast Texas, northern Louisiana and central Mississippi to an interconnect with the Transcontinental Gas Pipe Line system in Butler, Alabama. This segment also includes Gulf States, which owns a
10
-mile interstate pipeline that extends from Harrison County, Texas to Caddo Parish, Louisiana.
|
|
•
|
NGL Services.
The Partnership owns a
30%
membership interest in Lone Star, an entity owning a diverse set of midstream energy assets including NGL pipelines, storage, fractionation and processing facilities located in Texas, New Mexico, Mississippi and Louisiana.
|
|
•
|
Contract Services.
The Partnership owns and operates
a fleet of compressors used to provide turn-key natural gas compression services for customer specific systems.
The Partnership also owns and operates
a fleet of equipment used to provide treating services, such as carbon dioxide and hydrogen sulfide removal, natural gas cooling, dehydration and BTU management.
|
|
•
|
Natural Resources.
The Partnership is
involved in the management of coal and natural resources properties and the related collection of royalties.
The Partnership also earns
revenues from other land management activities, such as selling standing timber, leasing coal-related infrastructure facilities, and collecting oil and gas royalties. This segment also included
the Partnership’s
50%
interest in Coal Handling, which owns and operates end-user coal handling facilities.
The Partnership
purchased the remaining
50%
interest in these companies effective December 31, 2014
.
|
|
•
|
Corporate.
The Corporate segment comprises
the Partnership’s
corporate assets.
|
The Partnership accounts for intersegment revenues as if the revenues were to third parties, exclusive of certain cost of capital charges.
Management evaluates the performance of each segment and makes capital allocation decisions through the separate consideration of segment margin and operation and maintenance expenses. Segment margin, for the Gathering and Processing and the Natural Gas Transportation segments is defined as total revenues, including service fees, less cost of sales. In the Contract Services segment, segment margin is defined as revenues less direct costs. The Natural Resources segment margin is generally equal to total revenues
as there is typically minimal cost of sales associated with the management and leasing of properties.
Management believes segment margin is an important measure because it directly relates to volume, commodity price changes, and revenue generating horsepower. Operation and maintenance expenses are a separate measure used by management to evaluate performance of field operations. Direct labor, insurance, property taxes, repair and maintenance, utilities and contract services comprise the most significant portion of operation and maintenance expenses. These expenses fluctuate depending on the activities performed during a specific period. The Partnership does not deduct operation and maintenance expenses from total revenues in calculating segment margin because management separately evaluates commodity volume and price changes in segment margin. The Partnership does not record segment margin for its investments in unconsolidated affiliates (
HPC, MEP, Lone Star, Ranch JV, Aqua - PVR, Mi Vida JV and Sweeny JV
) because it records its ownership percentages of their net income as income from unconsolidated affiliates in accordance with the equity method of accounting.
S - 114
Results for each period, together with amounts related to each segment are shown below:
|
Years Ended December 31,
|
|||||||||||
|
2014
|
2013
|
2012
|
|||||||||
|
External Revenue
|
|||||||||||
|
Gathering and Processing
|
$
|
4,570
|
|
$
|
2,287
|
|
$
|
1,797
|
|
||
|
Natural Gas Transportation
|
—
|
|
1
|
|
1
|
|
|||||
|
NGL Services
|
—
|
|
—
|
|
—
|
|
|||||
|
Contract Services
|
307
|
|
215
|
|
183
|
|
|||||
|
Natural Resources
|
58
|
|
—
|
|
—
|
|
|||||
|
Corporate
|
16
|
|
18
|
|
19
|
|
|||||
|
Eliminations
|
—
|
|
—
|
|
—
|
|
|||||
|
Total
|
$
|
4,951
|
|
$
|
2,521
|
|
$
|
2,000
|
|
||
|
Intersegment Revenue
|
|||||||||||
|
Gathering and Processing
|
$
|
—
|
|
$
|
—
|
|
$
|
—
|
|
||
|
Natural Gas Transportation
|
—
|
|
—
|
|
—
|
|
|||||
|
NGL Services
|
—
|
|
—
|
|
—
|
|
|||||
|
Contract Services
|
14
|
|
15
|
|
21
|
|
|||||
|
Natural Resources
|
—
|
|
—
|
|
—
|
|
|||||
|
Corporate
|
—
|
|
—
|
|
—
|
|
|||||
|
Eliminations
|
(14
|
)
|
(15
|
)
|
(21
|
)
|
|||||
|
Total
|
$
|
—
|
|
$
|
—
|
|
$
|
—
|
|
||
|
Cost of Sales
|
|||||||||||
|
Gathering and Processing
|
$
|
3,381
|
|
$
|
1,767
|
|
$
|
1,373
|
|
||
|
Natural Gas Transportation
|
—
|
|
—
|
|
(1
|
)
|
|||||
|
NGL Services
|
—
|
|
—
|
|
—
|
|
|||||
|
Contract Services
|
67
|
|
26
|
|
15
|
|
|||||
|
Natural Resources
|
—
|
|
—
|
|
—
|
|
|||||
|
Corporate
|
4
|
|
—
|
|
—
|
|
|||||
|
Eliminations
|
—
|
|
—
|
|
—
|
|
|||||
|
Total
|
$
|
3,452
|
|
$
|
1,793
|
|
$
|
1,387
|
|
||
|
Segment Margin
|
|||||||||||
|
Gathering and Processing
|
$
|
1,189
|
|
$
|
520
|
|
$
|
423
|
|
||
|
Natural Gas Transportation
|
—
|
|
1
|
|
2
|
|
|||||
|
NGL Services
|
—
|
|
—
|
|
—
|
|
|||||
|
Contract Services
|
254
|
|
204
|
|
189
|
|
|||||
|
Natural Resources
|
58
|
|
—
|
|
—
|
|
|||||
|
Corporate
|
12
|
|
18
|
|
20
|
|
|||||
|
Eliminations
|
(14
|
)
|
(15
|
)
|
(21
|
)
|
|||||
|
Total
|
$
|
1,499
|
|
$
|
728
|
|
|
$
|
613
|
|
|
S - 115
|
Years Ended December 31,
|
|||||||||||
|
2014
|
2013
|
2012
|
|||||||||
|
Operation and Maintenance
|
|||||||||||
|
Gathering and Processing
|
$
|
360
|
|
$
|
237
|
|
$
|
183
|
|
||
|
Natural Gas Transportation
|
—
|
|
—
|
|
—
|
|
|||||
|
NGL Services
|
—
|
|
—
|
|
—
|
|
|||||
|
Contract Services
|
86
|
|
72
|
|
66
|
|
|||||
|
Natural Resources
|
12
|
|
—
|
|
—
|
|
|||||
|
Corporate
|
3
|
|
1
|
|
—
|
|
|||||
|
Eliminations
|
(13
|
)
|
(14
|
)
|
(21
|
)
|
|||||
|
Total
|
$
|
448
|
|
$
|
296
|
|
$
|
228
|
|
||
|
Depreciation, Depletion and Amortization
|
|||||||||||
|
Gathering and Processing
|
$
|
385
|
|
$
|
186
|
|
$
|
159
|
|
||
|
Natural Gas Transportation
|
—
|
|
—
|
|
—
|
|
|||||
|
NGL Services
|
—
|
|
—
|
|
—
|
|
|||||
|
Contract Services
|
134
|
|
98
|
|
86
|
|
|||||
|
Natural Resources
|
14
|
|
—
|
|
—
|
|
|||||
|
Corporate
|
8
|
|
3
|
|
7
|
|
|||||
|
Eliminations
|
—
|
|
—
|
|
—
|
|
|||||
|
Total
|
$
|
541
|
|
$
|
287
|
|
$
|
252
|
|
||
|
Income from Unconsolidated Affiliates
|
|||||||||||
|
Gathering and Processing
|
$
|
5
|
|
$
|
1
|
|
$
|
(10
|
)
|
||
|
Natural Gas Transportation
|
72
|
|
70
|
|
71
|
|
|||||
|
NGL Services
|
116
|
|
64
|
|
44
|
|
|||||
|
Contract Services
|
—
|
|
—
|
|
—
|
|
|||||
|
Natural Resources
|
2
|
|
—
|
|
—
|
|
|||||
|
Corporate
|
—
|
|
—
|
|
—
|
|
|||||
|
Eliminations
|
—
|
|
—
|
|
—
|
|
|||||
|
Total
|
$
|
195
|
|
$
|
135
|
|
$
|
105
|
|
||
|
Expenditures for Long-Lived Assets
|
|||||||||||
|
Gathering and Processing
|
$
|
700
|
|
$
|
721
|
|
$
|
395
|
|
||
|
Natural Gas Transportation
|
—
|
|
—
|
|
—
|
|
|||||
|
NGL Services
|
—
|
|
—
|
|
—
|
|
|||||
|
Contract Services
|
371
|
|
311
|
|
164
|
|
|||||
|
Natural Resources
|
—
|
|
—
|
|
—
|
|
|||||
|
Corporate
|
17
|
|
2
|
|
1
|
|
|||||
|
Eliminations
|
—
|
|
—
|
|
—
|
|
|||||
|
Total
|
$
|
1,088
|
|
$
|
1,034
|
|
$
|
560
|
|
||
S - 116
|
December 31,
|
|||||||||||
|
2014
|
2013
|
2012
|
|||||||||
|
Assets
|
|||||||||||
|
Gathering and Processing
|
$
|
12,069
|
|
$
|
4,748
|
|
$
|
4,210
|
|
||
|
Natural Gas Transportation
|
1,119
|
|
991
|
|
1,232
|
|
|||||
|
NGL Services
|
1,162
|
|
1,070
|
|
948
|
|
|||||
|
Contract Services
|
2,035
|
|
1,897
|
|
1,672
|
|
|||||
|
Natural Resources
|
529
|
|
—
|
|
—
|
|
|||||
|
Corporate
|
189
|
|
76
|
|
61
|
|
|||||
|
Eliminations
|
—
|
|
—
|
|
—
|
|
|||||
|
Total
|
$
|
17,103
|
|
$
|
8,782
|
|
$
|
8,123
|
|
||
|
Investments in Unconsolidated Affiliates
|
|||||||||||
|
Gathering and Processing
|
$
|
139
|
|
$
|
36
|
|
$
|
35
|
|
||
|
Natural Gas Transportation
|
1,117
|
|
991
|
|
1,231
|
|
|||||
|
NGL Services
|
1,162
|
|
1,070
|
|
948
|
|
|||||
|
Contract Services
|
—
|
|
—
|
|
—
|
|
|||||
|
Natural Resources
|
—
|
|
—
|
|
—
|
|
|||||
|
Corporate
|
—
|
|
—
|
|
—
|
|
|||||
|
Eliminations
|
—
|
|
—
|
|
—
|
|
|||||
|
Total
|
$
|
2,418
|
|
$
|
2,097
|
|
$
|
2,214
|
|
||
|
Goodwill
|
|||||||||||
|
Gathering and Processing
(1)
|
$
|
732
|
|
$
|
651
|
|
$
|
651
|
|
||
|
Natural Gas Transportation
|
—
|
|
—
|
|
—
|
|
|||||
|
NGL Services
|
—
|
|
—
|
|
—
|
|
|||||
|
Contract Services
|
476
|
|
477
|
|
477
|
|
|||||
|
Natural Resources
|
15
|
|
—
|
|
—
|
|
|||||
|
Corporate
|
—
|
|
—
|
|
—
|
|
|||||
|
Eliminations
|
—
|
|
—
|
|
—
|
|
|||||
|
Total
|
$
|
1,223
|
|
$
|
1,128
|
|
$
|
1,128
|
|
||
(1) In 2014, the Partnership recorded a
$370 million
impairment charge at the Permian reporting unit within this segment.
S - 117
The table below provides a reconciliation of total segment margin to (loss) income before income taxes:
|
Years Ended December 31,
|
||||||||||||
|
|
2014
|
2013
|
2012
|
|||||||||
|
Total segment margin
|
$
|
1,499
|
|
$
|
728
|
|
$
|
613
|
|
|||
|
Operation and maintenance
|
(448
|
)
|
(296
|
)
|
(228
|
)
|
||||||
|
General and administrative
|
(158
|
)
|
(88
|
)
|
(100
|
)
|
||||||
|
Gain (loss) on assets sales, net
|
1
|
|
(2
|
)
|
(3
|
)
|
||||||
|
Depreciation, depletion and amortization
|
(541
|
)
|
(287
|
)
|
(252
|
)
|
||||||
|
Goodwill impairment
|
(370
|
)
|
—
|
|
—
|
|
||||||
|
Income from unconsolidated affiliates
|
195
|
|
135
|
|
105
|
|
||||||
|
Interest expense, net
|
(304
|
)
|
(164
|
)
|
(122
|
)
|
||||||
|
Loss on debt refinancing, net
|
(25
|
)
|
(7
|
)
|
(8
|
)
|
||||||
|
Other income and deductions, net
|
12
|
|
7
|
|
29
|
|
*
|
|||||
|
(Loss) income before income taxes
|
$
|
(139
|
)
|
$
|
26
|
|
$
|
34
|
|
|||
__________________
|
*
|
Other income and deductions, net for the year ended December 31, 2012, included a one-time producer payment of
$16 million
related to an assignment of certain contracts.
|
17.
EQUITY-BASED COMPENSATION
In December 2011, the Partnership’s unitholders approved the Regency Energy Partners LP 2011 Long-Term Incentive Plan (the “2011 Incentive Plan”), which provides for awards of options to purchase the Partnership’s common units; awards of the Partnership’s restricted units, phantom units and common units; awards of distribution equivalent rights; awards of common unit appreciation rights; and other unit-based awards to employees, directors and consultants of the Partnership and its affiliates and subsidiaries. The 2011 Incentive Plan will be administered by the Compensation Committee of the board of directors, which may, in its sole discretion, delegate its powers and duties under the 2011 Incentive Plan to the Chief Executive Officer. Up to
3,000,000
of the Partnership’s common units may be granted as awards under the 2011 Incentive Plan, with such amount subject to adjustment as provided for under the terms of the 2011 Incentive Plan.
The 2011 Incentive Plan may be amended or terminated at any time by the board of directors or the Compensation Committee without the consent of any participant or unitholder, including an amendment to increase the number of common units available for awards under the plan; however, any material amendment, such as a change in the types of awards available under the plan, would require the approval of the unitholders of the Partnership. The Compensation Committee is also authorized to make adjustments in the terms and conditions of, and the criteria included in awards under the 2011 Incentive Plan in specified circumstances. The 2011 Incentive Plan is effective until December 19, 2021 or, if earlier, the time at which all available units under the 2011 Incentive Plan have been issued to participants or the time of termination of the plan by the board of directors.
Unit-based compensation expense of
$10 million
,
$7 million
, and
$5 million
is recorded in general and administrative expense in the statement of operations for the years ended
December 31, 2014
,
2013
and
2012
, respectively.
Common Unit Options.
The fair value of each option award is estimated on the date of grant using the Black-Scholes Option Pricing Model. Upon the exercise of the common unit options, the Partnership intends to settle these obligations with new issues of common units on a net basis. The common unit options activity for the year ended
December 31, 2014
is as follows:
|
Common Unit Options
|
Units
|
Weighted Average Exercise Price
|
|||||
|
Outstanding at the beginning of period
|
142,550
|
|
$
|
22.04
|
|
||
|
Exercised
|
(34,900
|
)
|
20.03
|
|
|||
|
Outstanding at end of period
|
107,650
|
|
22.68
|
|
|||
|
Exercisable at the end of the period
|
107,650
|
|
|||||
The common unit options have an intrinsic value of less than $1 million related to non-vested units with a weighted average contractual term of
1.5 years
. Intrinsic value is the closing market price of a common unit less the option strike price, multiplied by the number of unit options outstanding as of the end of the period presented. Unit options with an exercise price greater than the end of the period closing market price are excluded.
S - 118
Phantom Units.
During 2014, the Partnership awarded
1,450,230
phantom units to senior management and certain key employees. These awards are service condition (time-based) grants that vest
60%
after the third year of continued employment and
40%
after the fifth year of continued employment. Distributions on the phantom units will be paid concurrent with the Partnership’s distribution for common units.
During 2013, the Partnership awarded
62,360
phantom units to senior management and certain key employees. These awards are service condition (time-based) grants that generally vest
60%
after the third year of continued employment and
40%
after the fifth year of continued employment. Distributions on the phantom units will be paid concurrent with the Partnership’s distribution for common units.
In December 2012, the Partnership awarded
495,375
phantom units to senior management and certain key employees. These awards are service condition (time-based) grants that vest
60%
after the third year of continued employment and
40%
after the fifth year of continued employment. Also during 2012,
8,250
phantom units were awarded to senior management and key employees as service condition (time-based) grants that generally vest ratably over a
5
year period. Distributions on the phantom units will be paid concurrent with the Partnership’s distribution for common units.
The following table presents phantom unit activity for the year ended
December 31, 2014
:
|
Phantom Units
|
Units
|
Weighted Average
Grant Date
Fair Value
|
|||||
|
Outstanding at the beginning of the period
|
982,242
|
|
$
|
23.16
|
|
||
|
Service condition grants
|
1,450,230
|
|
25.24
|
|
|||
|
Vested service condition
|
(183,380
|
)
|
25.25
|
|
|||
|
Forfeited service condition
|
(81,373
|
)
|
24.83
|
|
|||
|
Total outstanding at end of period
|
2,167,719
|
|
24.31
|
|
|||
During the years ended
December 31, 2014
,
2013
and
2012
, the weighted average grant date fair value per phantom unit granted was
$25.24
,
$25.44
, and
$21.39
, respectively. The total fair value of awards vested was
$5 million
,
$6 million
, and
$5 million
for the years ended
December 31, 2014
,
2013
and
2012
, respectively, based on the market price of Regency common units as of the vesting date.
The Partnership expects to recognize
$42 million
of unit-based compensation expense related to non-vested phantom units over a period of
3.9 years
.
Cash Restricted Units.
The Partnership began granting cash restricted units in 2014. These awards are service condition (time-based) grants of notional units that vest
100%
after the third year of continued employment. A cash restricted unit entitles the award recipient to receive cash equal to the market price of one Regency common unit as of the vesting date.
The following table presents cash restricted unit activity for the year ended
December 31, 2014
:
|
Cash Restricted Units
|
Units
|
||
|
Outstanding at the beginning of the period
|
—
|
|
|
|
Service condition grants
|
400,928
|
|
|
|
Vested service condition
|
(500
|
)
|
|
|
Forfeited service condition
|
(21,100
|
)
|
|
|
Total outstanding at end of period
|
379,328
|
|
|
Based on the trading price of Regency common units at
December 31, 2014
, the Partnership expects to recognize
$7 million
of unit-based compensation expense related to non-vested cash restricted units over a period of
2.5 years
.
18.
CONSOLIDATING GUARANTOR FINANCIAL INFORMATION
ELG, Aqua - PVR, and ORS do not fully and unconditionally guarantee, on a joint and several basis, the Senior Notes issued and outstanding as of
December 31, 2014
, by the Partnership and Finance Corp. Included in the Parent financial statements are the Partnership’s intercompany investments in all consolidated subsidiaries and the Partnership’s investments in unconsolidated affiliates. ELG, Aqua - PVR, and ORS are included in the non-guarantor subsidiaries.
S - 119
The consolidating financial information for the Parent, Guarantor Subsidiaries, and Non Guarantor Subsidiaries are as follows:
|
December 31, 2014
|
|||||||||||||||||||
|
Parent
|
Guarantor Subsidiaries
|
Non-Guarantor Subsidiaries
|
Eliminations
|
Consolidated Partnership
|
|||||||||||||||
|
ASSETS
|
|||||||||||||||||||
|
Cash
|
$
|
—
|
|
$
|
—
|
|
$
|
32
|
|
$
|
(8
|
)
|
$
|
24
|
|
||||
|
All other current assets
|
—
|
|
667
|
|
13
|
|
(1
|
)
|
679
|
|
|||||||||
|
Property, plant, and equipment, net
|
—
|
|
8,948
|
|
353
|
|
(84
|
)
|
9,217
|
|
|||||||||
|
Investments in subsidiaries
|
19,829
|
|
—
|
|
—
|
|
(19,829
|
)
|
—
|
|
|||||||||
|
Investments in unconsolidated affiliates
|
—
|
|
2,252
|
|
—
|
|
166
|
|
2,418
|
|
|||||||||
|
All other assets
|
—
|
|
4,765
|
|
—
|
|
—
|
|
4,765
|
|
|||||||||
|
TOTAL ASSETS
|
$
|
19,829
|
|
$
|
16,632
|
|
$
|
398
|
|
$
|
(19,756
|
)
|
$
|
17,103
|
|
||||
|
LIABILITIES AND PARTNERS’ CAPITAL AND NONCONTROLLING INTEREST
|
|||||||||||||||||||
|
All other current liabilities
|
—
|
|
723
|
|
34
|
|
(1
|
)
|
756
|
|
|||||||||
|
Long-term liabilities
|
5,185
|
|
1,575
|
|
6
|
|
(4
|
)
|
6,762
|
|
|||||||||
|
Noncontrolling interest
|
—
|
|
—
|
|
—
|
|
120
|
|
120
|
|
|||||||||
|
Total partners’ capital and noncontrolling interest
|
14,644
|
|
14,334
|
|
358
|
|
(19,871
|
)
|
9,465
|
|
|||||||||
|
TOTAL LIABILITIES AND PARTNERS’ CAPITAL AND NONCONTROLLING INTEREST
|
$
|
19,829
|
|
$
|
16,632
|
|
$
|
398
|
|
$
|
(19,756
|
)
|
$
|
17,103
|
|
||||
|
December 31, 2013
|
|||||||||||||||||||
|
Parent
|
Guarantor Subsidiaries
|
Non-Guarantor Subsidiaries
|
Eliminations
|
Consolidated Partnership
|
|||||||||||||||
|
ASSETS
|
|||||||||||||||||||
|
Cash
|
$
|
—
|
|
$
|
—
|
|
$
|
19
|
|
$
|
—
|
|
$
|
19
|
|
||||
|
All other current assets
|
—
|
|
366
|
|
15
|
|
—
|
|
381
|
|
|||||||||
|
Property, plant, and equipment, net
|
—
|
|
4,244
|
|
174
|
|
—
|
|
4,418
|
|
|||||||||
|
Investments in subsidiaries
|
10,446
|
|
—
|
|
—
|
|
(10,446
|
)
|
—
|
|
|||||||||
|
Investments in unconsolidated affiliates
|
—
|
|
1,995
|
|
—
|
|
102
|
|
2,097
|
|
|||||||||
|
All other assets
|
—
|
|
1,867
|
|
—
|
|
—
|
|
1,867
|
|
|||||||||
|
TOTAL ASSETS
|
$
|
10,446
|
|
$
|
8,472
|
|
$
|
208
|
|
$
|
(10,344
|
)
|
$
|
8,782
|
|
||||
|
LIABILITIES AND PARTNERS’ CAPITAL AND NONCONTROLLING INTEREST
|
|||||||||||||||||||
|
All other current liabilities
|
—
|
|
466
|
|
9
|
|
—
|
|
475
|
|
|||||||||
|
Long-term liabilities
|
2,832
|
|
559
|
|
—
|
|
—
|
|
3,391
|
|
|||||||||
|
Noncontrolling interest
|
—
|
|
—
|
|
—
|
|
102
|
|
102
|
|
|||||||||
|
Total partners’ capital and noncontrolling interest
|
7,614
|
|
7,447
|
|
199
|
|
(10,446
|
)
|
4,814
|
|
|||||||||
|
TOTAL LIABILITIES AND PARTNERS’ CAPITAL AND NONCONTROLLING INTEREST
|
$
|
10,446
|
|
$
|
8,472
|
|
$
|
208
|
|
$
|
(10,344
|
)
|
$
|
8,782
|
|
||||
S - 120
|
For the year ended December 31, 2014
|
|||||||||||||||||||
|
Parent
|
Guarantor Subsidiaries
|
Non-Guarantor Subsidiaries
|
Eliminations
|
Consolidated Partnership
|
|||||||||||||||
|
Revenues
|
$
|
—
|
|
$
|
4,888
|
|
$
|
66
|
|
$
|
(3
|
)
|
$
|
4,951
|
|
||||
|
Operating costs, expenses, and other
|
—
|
|
4,942
|
|
35
|
|
(9
|
)
|
4,968
|
|
|||||||||
|
Operating (loss) income
|
—
|
|
(54
|
)
|
31
|
|
6
|
|
(17
|
)
|
|||||||||
|
Income from unconsolidated affiliates
|
—
|
|
195
|
|
—
|
|
—
|
|
195
|
|
|||||||||
|
Interest expense, net
|
(290
|
)
|
(14
|
)
|
—
|
|
—
|
|
(304
|
)
|
|||||||||
|
Loss on debt refinancing, net
|
(24
|
)
|
(1
|
)
|
—
|
|
—
|
|
(25
|
)
|
|||||||||
|
Equity in consolidated subsidiaries
|
166
|
|
—
|
|
—
|
|
(166
|
)
|
—
|
|
|||||||||
|
Other income and deductions, net
|
3
|
|
9
|
|
—
|
|
—
|
|
12
|
|
|||||||||
|
(Loss) income before income taxes
|
(145
|
)
|
135
|
|
31
|
|
(160
|
)
|
(139
|
)
|
|||||||||
|
Income tax expense (benefit)
|
4
|
|
(2
|
)
|
1
|
|
—
|
|
3
|
|
|||||||||
|
Net (loss) income
|
(149
|
)
|
137
|
|
30
|
|
(160
|
)
|
(142
|
)
|
|||||||||
|
Net income attributable to noncontrolling interest
|
—
|
|
—
|
|
—
|
|
(15
|
)
|
(15
|
)
|
|||||||||
|
Net (loss) income attributable to Regency Energy Partners LP
|
$
|
(149
|
)
|
$
|
137
|
|
$
|
30
|
|
$
|
(175
|
)
|
$
|
(157
|
)
|
||||
|
Total other comprehensive income
|
$
|
—
|
|
$
|
—
|
|
$
|
—
|
|
$
|
—
|
|
$
|
—
|
|
||||
|
Comprehensive (loss) income
|
(149
|
)
|
137
|
|
30
|
|
(160
|
)
|
(142
|
)
|
|||||||||
|
Comprehensive income attributable to noncontrolling interest
|
—
|
|
—
|
|
—
|
|
15
|
|
15
|
|
|||||||||
|
Comprehensive (loss) income attributable to Regency Energy Partners LP
|
$
|
(149
|
)
|
$
|
137
|
|
$
|
30
|
|
$
|
(175
|
)
|
$
|
(157
|
)
|
||||
S - 121
|
For the year ended December 31, 2013
|
|||||||||||||||||||
|
Parent
|
Guarantor Subsidiaries
|
Non-Guarantor Subsidiaries
|
Eliminations
|
Consolidated Partnership
|
|||||||||||||||
|
Revenues
|
$
|
—
|
|
$
|
2,489
|
|
$
|
32
|
|
$
|
—
|
|
$
|
2,521
|
|
||||
|
Operating costs, expenses, and other
|
3
|
|
2,448
|
|
15
|
|
—
|
|
2,466
|
|
|||||||||
|
Operating (loss) income
|
(3
|
)
|
41
|
|
17
|
|
—
|
|
55
|
|
|||||||||
|
Income from unconsolidated affiliates
|
—
|
|
135
|
|
—
|
|
—
|
|
135
|
|
|||||||||
|
Interest expense, net
|
(148
|
)
|
(16
|
)
|
—
|
|
—
|
|
(164
|
)
|
|||||||||
|
Loss on debt refinancing, net
|
(7
|
)
|
—
|
|
—
|
|
—
|
|
(7
|
)
|
|||||||||
|
Equity in consolidated subsidiaries
|
172
|
|
—
|
|
—
|
|
(172
|
)
|
—
|
|
|||||||||
|
Other income and deductions, net
|
7
|
|
—
|
|
—
|
|
—
|
|
7
|
|
|||||||||
|
Income before income taxes
|
21
|
|
160
|
|
17
|
|
(172
|
)
|
26
|
|
|||||||||
|
Income tax expense (benefit)
|
1
|
|
(2
|
)
|
—
|
|
—
|
|
(1
|
)
|
|||||||||
|
Net income
|
20
|
|
162
|
|
17
|
|
(172
|
)
|
27
|
|
|||||||||
|
Net income attributable to noncontrolling interest
|
—
|
|
(8
|
)
|
—
|
|
—
|
|
(8
|
)
|
|||||||||
|
Net income attributable to Regency Energy Partners LP
|
$
|
20
|
|
$
|
154
|
|
$
|
17
|
|
$
|
(172
|
)
|
$
|
19
|
|
||||
|
Total other comprehensive income
|
$
|
—
|
|
$
|
—
|
|
$
|
—
|
|
$
|
—
|
|
$
|
—
|
|
||||
|
Comprehensive income
|
20
|
|
162
|
|
17
|
|
(172
|
)
|
27
|
|
|||||||||
|
Comprehensive income attributable to noncontrolling interest
|
—
|
|
8
|
|
—
|
|
—
|
|
8
|
|
|||||||||
|
Comprehensive income attributable to Regency Energy Partners LP
|
$
|
20
|
|
$
|
154
|
|
$
|
17
|
|
$
|
(172
|
)
|
$
|
19
|
|
||||
S - 122
|
For the year ended December 31, 2012
|
|||||||||||||||||||
|
Parent
|
Guarantor Subsidiaries
|
Non-Guarantor Subsidiaries
|
Eliminations
|
Consolidated Partnership
|
|||||||||||||||
|
Revenues
|
$
|
—
|
|
$
|
1,985
|
|
$
|
15
|
|
$
|
—
|
|
$
|
2,000
|
|
||||
|
Operating costs, expenses, and other
|
10
|
|
1,951
|
|
9
|
|
—
|
|
1,970
|
|
|||||||||
|
Operating (loss) income
|
(10
|
)
|
34
|
|
6
|
|
—
|
|
30
|
|
|||||||||
|
Income from unconsolidated affiliates
|
—
|
|
105
|
|
—
|
|
—
|
|
105
|
|
|||||||||
|
Interest expense, net
|
(104
|
)
|
(18
|
)
|
—
|
|
—
|
|
(122
|
)
|
|||||||||
|
Gain (loss) on debt refinancing, net
|
(8
|
)
|
—
|
|
—
|
|
—
|
|
(8
|
)
|
|||||||||
|
Equity in consolidated subsidiaries
|
141
|
|
—
|
|
—
|
|
(141
|
)
|
—
|
|
|||||||||
|
Other income and deductions, net
|
14
|
|
15
|
|
—
|
|
—
|
|
29
|
|
|||||||||
|
Income before income taxes
|
33
|
|
136
|
|
6
|
|
(141
|
)
|
34
|
|
|||||||||
|
Income tax expense (benefit)
|
1
|
|
(1
|
)
|
—
|
|
—
|
|
—
|
|
|||||||||
|
Net income
|
32
|
|
137
|
|
6
|
|
(141
|
)
|
34
|
|
|||||||||
|
Net income attributable to noncontrolling interest
|
—
|
|
(2
|
)
|
—
|
|
—
|
|
(2
|
)
|
|||||||||
|
Net income attributable to Regency Energy Partners LP
|
$
|
32
|
|
$
|
135
|
|
$
|
6
|
|
$
|
(141
|
)
|
$
|
32
|
|
||||
|
Total other comprehensive income (loss)
|
$
|
—
|
|
$
|
2
|
|
$
|
—
|
|
$
|
—
|
|
$
|
2
|
|
||||
|
Comprehensive income
|
32
|
|
139
|
|
6
|
|
(141
|
)
|
36
|
|
|||||||||
|
Comprehensive income attributable to noncontrolling interest
|
—
|
|
2
|
|
—
|
|
—
|
|
2
|
|
|||||||||
|
Comprehensive income attributable to Regency Energy Partners LP
|
$
|
32
|
|
$
|
137
|
|
$
|
6
|
|
$
|
(141
|
)
|
$
|
34
|
|
||||
|
For the year ended December 31, 2014
|
|||||||||||||||||||
|
Parent
|
Guarantor Subsidiaries
|
Non-Guarantor Subsidiaries
|
Eliminations
|
Consolidated Partnership
|
|||||||||||||||
|
Cash flows from operating activities
|
$
|
—
|
|
$
|
664
|
|
$
|
56
|
|
$
|
(1
|
)
|
$
|
719
|
|
||||
|
Cash flows from investing activities
|
—
|
|
(2,130
|
)
|
(30
|
)
|
(9
|
)
|
(2,169
|
)
|
|||||||||
|
Cash flows from financing activities
|
—
|
|
1,466
|
|
(13
|
)
|
2
|
|
1,455
|
|
|||||||||
|
Change in cash
|
—
|
|
—
|
|
13
|
|
(8
|
)
|
5
|
|
|||||||||
|
Cash at beginning of period
|
—
|
|
—
|
|
19
|
|
—
|
|
19
|
|
|||||||||
|
Cash at end of period
|
$
|
—
|
|
$
|
—
|
|
$
|
32
|
|
$
|
(8
|
)
|
$
|
24
|
|
||||
|
For the year ended December 31, 2013
|
|||||||||||||||||||
|
Parent
|
Guarantor Subsidiaries
|
Non-Guarantor Subsidiaries
|
Eliminations
|
Consolidated Partnership
|
|||||||||||||||
|
Cash flows from operating activities
|
$
|
—
|
|
$
|
424
|
|
$
|
12
|
|
$
|
—
|
|
$
|
436
|
|
||||
|
Cash flows from investing activities
|
—
|
|
(1,303
|
)
|
(90
|
)
|
—
|
|
(1,393
|
)
|
|||||||||
|
Cash flows from financing activities
|
—
|
|
879
|
|
44
|
|
—
|
|
923
|
|
|||||||||
|
Change in cash
|
—
|
|
—
|
|
(34
|
)
|
—
|
|
(34
|
)
|
|||||||||
|
Cash at beginning of period
|
—
|
|
—
|
|
53
|
|
—
|
|
53
|
|
|||||||||
|
Cash at end of period
|
$
|
—
|
|
$
|
—
|
|
$
|
19
|
|
$
|
—
|
|
$
|
19
|
|
||||
S - 123
|
For the year ended December 31, 2012
|
|||||||||||||||||||
|
Parent
|
Guarantor Subsidiaries
|
Non-Guarantor Subsidiaries
|
Eliminations
|
Consolidated Partnership
|
|||||||||||||||
|
Cash flows from operating activities
|
$
|
—
|
|
$
|
316
|
|
$
|
8
|
|
$
|
—
|
|
$
|
324
|
|
||||
|
Cash flows from investing activities
|
—
|
|
(746
|
)
|
(61
|
)
|
—
|
|
(807
|
)
|
|||||||||
|
Cash flows from financing activities
|
—
|
|
430
|
|
105
|
|
—
|
|
535
|
|
|||||||||
|
Change in cash
|
—
|
|
—
|
|
52
|
|
—
|
|
52
|
|
|||||||||
|
Cash at beginning of period
|
—
|
|
—
|
|
1
|
|
—
|
|
1
|
|
|||||||||
|
Cash at end of period
|
$
|
—
|
|
$
|
—
|
|
$
|
53
|
|
$
|
—
|
|
$
|
53
|
|
||||
19.
QUARTERLY FINANCIAL DATA (UNAUDITED)
|
Quarter Ended
|
||||||||||||||||
|
2014
|
December 31
|
September 30
|
June 30
|
March 31
|
||||||||||||
|
Operating revenues
|
$
|
1,427
|
|
$
|
1,483
|
|
$
|
1,178
|
|
$
|
863
|
|
||||
|
Operating (loss) income
|
(218
|
)
|
144
|
|
35
|
|
22
|
|
||||||||
|
Net (loss) income attributable to Regency Energy Partners LP
|
(261
|
)
|
103
|
|
(8
|
)
|
9
|
|
||||||||
|
Earnings per common units:
|
||||||||||||||||
|
Basic net (loss) income per common unit
|
(0.67
|
)
|
0.23
|
|
(0.05
|
)
|
0.00
|
|
||||||||
|
Diluted net (loss) income per common unit
|
(0.67
|
)
|
0.23
|
|
(0.05
|
)
|
0.00
|
|
||||||||
|
Quarter Ended
|
||||||||||||||||
|
2013
|
December 31
|
September 30
|
June 30
|
March 31
|
||||||||||||
|
Operating revenues
|
$
|
677
|
|
$
|
665
|
|
$
|
639
|
|
$
|
540
|
|
||||
|
Operating income (loss)
|
12
|
|
24
|
|
34
|
|
(15
|
)
|
||||||||
|
Net (loss) income attributable to Regency Energy Partners LP
|
(1
|
)
|
39
|
|
10
|
|
(29
|
)
|
||||||||
|
Earnings per common units:
|
||||||||||||||||
|
Basic net (loss) income per common unit
|
(0.03
|
)
|
0.16
|
|
0.07
|
|
(0.06
|
)
|
||||||||
|
Diluted net (loss) income per common unit
|
(0.03
|
)
|
0.05
|
|
0.07
|
|
(0.06
|
)
|
||||||||
The three months ended December 31, 2014 includes a
$370 million
goodwill impairment charge recorded related to the Permian reporting unit within the Gathering and Processing segment.
S - 124
TABLE OF CONTENTS
Part IItem 1. BusinessItem 1A. Risk FactorsItem 1B. Unresolved Staff CommentsItem 2. PropertiesItem 3. Legal ProceedingsItem 4. Mine Safety DisclosuresPart IIItem 5. Market For Registrant S Common Units, Related Unitholder Matters and Issuer Purchases Of Equity SecuritiesItem 6. Selected Financial DataItem 7. Management S Discussion and Analysis Of Financial ConditionItem 7A. Quantitative and Qualitative Disclosures About Market RiskItem 8. Financial Statements and Supplementary DataItem 9. Changes in and Disagreements with Accountants on AccountingItem 9A. Controls and ProceduresItem 9B. Other InformationPart IIIItem 10. Directors, Executive Officers and Corporate GovernanceItem 11. Executive CompensationItem 12. Security Ownership Of Certain Beneficial Owners and Management and Related Unitholder MattersItem 13. Certain Relationships and Related Transactions, and Director IndependenceItem 14. Principal Accounting Fees and ServicesPart IVItem 15. Exhibits and Financial Statement Schedules