ETSY INC
10-Ks and 10-Qs
|
|
|
|
|
|
|
|
|
|
|
|
|
|
|
|
|
|
|
|
|
|
|
|
|
|
|
|
|
|
|
|
UNITED STATES
SECURITIES AND EXCHANGE COMMISSION
Washington, D.C. 20549
_________________________
FORM 10-K
_________________________
|
x
|
Annual Report Pursuant to Section 13 or 15(d) of the Securities Exchange Act of 1934
|
|
For the fiscal year ended December 31, 2018
|
|
|
OR
|
|
|
¨
|
Transition Report Pursuant to Section 13 or 15(d) of the Securities Exchange Act of 1934
For the transition period from
to
|
Commission File Number 001-36911
_________________________
ETSY, INC.
(Exact name of registrant as specified in its charter)
_________________________
|
Delaware
|
20-4898921
|
|
|
(State or other jurisdiction of incorporation or organization)
|
(I.R.S. Employer Identification No.)
|
|
|
117 Adams Street, Brooklyn, NY
|
11201
|
|
|
(Address of principal executive offices)
|
(Zip code)
|
|
(718) 880-3660
(Registrant’s telephone number, including area code)
Securities registered pursuant to Section 12(b) of the Act:
|
Title of each class
|
|
Name of each exchange on which registered
|
|
Common Stock, par value $0.001 per share
|
|
The Nasdaq Stock Market LLC
|
Securities registered pursuant to Section 12(g) of the Act: None
Indicate by check mark if the registrant is a well-known seasoned issuer, as defined in Rule 405 of the Securities Act. Yes
x
No
¨
Indicate by check mark if the registrant is not required to file reports pursuant to Section 13 or Section 15(d) of the Act. Yes
¨
No
x
Indicate by check mark whether the registrant (1) has filed all reports required to be filed by Section 13 or 15(d) of the Securities Exchange Act of 1934 during the preceding 12 months (or for such shorter period that the registrant was required to file such reports), and (2) has been subject to such filing requirements for the past 90 days. Yes
x
No
¨
Indicate by check mark whether the registrant has submitted electronically every Interactive Data File required to be submitted pursuant to Rule 405 of Regulation S-T (§232.405 of this chapter) during the preceding 12 months (or for such shorter period that the registrant was required to submit such files). Yes
x
No
¨
Indicate by check mark if disclosure of delinquent filers pursuant to Item 405 of Regulation S-K (§229.405 of this chapter) is not contained herein, and will not be contained, to the best of the registrant’s knowledge, in definitive proxy or information statements incorporated by reference in Part III of this Form 10-K or any amendment to this Form 10-K.
x
Indicate by check mark whether the registrant is a large accelerated filer, an accelerated filer, a non-accelerated filer, a smaller reporting company or an emerging growth company. See the definitions of “large accelerated filer,” “accelerated filer,” “smaller reporting company” and “emerging growth company” in Rule 12b-2 of the Exchange Act.
|
Large accelerated filer
x
|
Accelerated filer
¨
|
|
Non-accelerated filer
¨
|
Smaller reporting company
¨
|
|
Emerging growth company
¨
|
|
If an emerging growth company, indicate by check mark if the registrant has elected not to use the extended transition period for complying with any new or revised financial accounting standards provided pursuant to Section 13(a) of the Exchange Act.
¨
Indicate by check mark whether the registrant is a shell company (as defined in Rule 12b-2 of the Exchange Act). Yes
¨
No
x
The aggregate market value of the voting and non-voting common equity held by non-affiliates of the registrant as of June 30,
2018
(the last business day of the registrant’s most recently completed second fiscal quarter), was approximately
$4,991,820,388
.
The number of shares of common stock outstanding as of
February 21, 2019
was
119,566,393
.
Documents Incorporated By Reference
Portions of the registrant’s Proxy Statement for its
2019
Annual Meeting of Stockholders, to be filed with the Securities and Exchange Commission no later than 120 days after
December 31, 2018
, are incorporated by reference in Part III of this Annual Report on Form 10-K.
Etsy, Inc.
Table of Contents
|
Page
|
||
|
Note Regarding Forward-Looking Statements
|
||
|
Part I
|
||
|
Item 1.
|
Business
|
|
|
Item 1A.
|
Risk Factors
|
|
|
Item 1B.
|
Unresolved Staff Comments
|
|
|
Item 2.
|
Properties
|
|
|
Item 3.
|
Legal Proceedings
|
|
|
Item 4.
|
Mine Safety Disclosures
|
|
|
Part II
|
||
|
Item 5.
|
Market for Registrant's Common Equity, Related Stockholder Matters and Issuer Purchases of Equity Securities
|
|
|
Item 6.
|
Selected Consolidated Financial and Other Data
|
|
|
Item 7.
|
Management's Discussion and Analysis of Financial Condition and Results of Operations
|
|
|
Item 7A.
|
Quantitative and Qualitative Disclosures About Market Risk
|
|
|
Item 8.
|
Financial Statements and Supplementary Data
|
|
|
Report of Independent Registered Public Accounting Firm
|
||
|
Consolidated Balance Sheets as of December 31, 2018 and 2017
|
||
|
Consolidated Statements of Operations for the years ended December 31, 2018, 2017, and 2016
|
||
|
Consolidated Statements of Comprehensive Income (Loss) for the years ended December 31, 2018, 2017, and 2016
|
||
|
Consolidated Statement of Changes in Stockholders' Equity for the years ended December 31, 2018, 2017, and 2016
|
||
|
Consolidated Statements of Cash Flows for the years ended December 31, 2018, 2017, and 2016
|
||
|
Notes to Consolidated Financial Statements
|
||
|
Item 9.
|
Changes in and Disagreements with Accountants on Accounting and Financial Disclosure
|
|
|
Item 9A.
|
Controls and Procedures
|
|
|
Item 9B.
|
Other Information
|
|
|
Part III
|
||
|
Item 10.
|
Directors, Executive Officers and Corporate Governance
|
|
|
Item 11.
|
Executive Compensation
|
|
|
Item 12.
|
Security Ownership of Certain Beneficial Owners and Management and Related Stockholder Matters
|
|
|
Item 13.
|
Certain Relationships and Related Transactions, and Director Independence
|
|
|
Item 14.
|
Principal Accounting Fees and Services
|
|
|
Part IV
|
||
|
Item 15.
|
Exhibits, Financial Statement Schedules
|
|
|
Exhibit Index
|
||
|
Item 16.
|
Form 10-K Summary
|
|
|
Signatures
|
||
Unless the context otherwise requires, we use the terms “Etsy,” the “Company,” “we,” “us” and “our” in this
Annual
Report on Form
10-K
, (“Annual Report”), to refer to Etsy, Inc. and, where appropriate, our consolidated subsidiaries.
See “
Management
’
s Discussion and Analysis of Financial Condition and Results of Operations
—
Key Operating and Financial Metrics
” for the definitions of the following terms used in this
Annual
Report: “active buyer,” “active seller,” “Adjusted EBITDA,” “GMS,” “international GMS,” and “mobile GMS.”
NOTE REGARDING FORWARD-LOOKING STATEMENTS
This
Annual
Report on Form
10-K
contains forward-looking statements within the meaning of the federal securities laws. Forward-looking statements include information relating to our anticipated international growth, the timing of product launches and our cloud migration, the impact of our strategy, marketing and product investments, and cloud migration on future GMS and revenue growth, our economic, social and ecological impact strategy, goals and future plans, expected conversion and visit growth, the impact of mobile web on conversion rates, efforts to optimize the buyer experience, search and discovery effectiveness and overall marketplace optimization, and our anticipated expenses and their impact on our future financial performance. Forward-looking statements include all statements that are not historical facts. In some cases, forward-looking statements can be identified by terms such as “anticipates,” “believes,” “could,” “estimates,” “expects,” “intends,” “may,” “plans,” “potential,” “predicts,” “projects,” “seeks,” “should,” “will,” “would,” or similar expressions and the negatives of those terms.
Forward-looking statements are not guarantees of performance and involve known and unknown risks, uncertainties, and other factors that may cause our actual results, performance, or achievements to be materially different from any future results, performance, or achievements expressed or implied by the forward-looking statements. Those risks include those described in the section titled “Risk Factors” and elsewhere in this
Annual
Report. Given these uncertainties, you should read this
Annual
Report in its entirety and not place undue reliance on any forward-looking statements in this
Annual
Report.
In addition, statements that “we believe” and similar statements reflect our beliefs and opinions on the relevant subject. These statements are based upon information available to us as of the date of this
Annual
Report and, although we believe such information forms a reasonable basis for such statements, such information may be limited or incomplete, and our statements should not be read to indicate that we have conducted an exhaustive inquiry into, or review of, all potentially available relevant information. These statements are inherently uncertain and investors are cautioned not to unduly rely upon these statements.
Moreover, we operate in a competitive and rapidly changing environment. New risks and uncertainties emerge from time to time and it is not possible for us to predict all risks and uncertainties that could have an impact on the forward-looking statements made in this
Annual
Report. In light of these risks, uncertainties, and assumptions, the future events and trends discussed in this
Annual
Report may not occur and actual results could differ materially and adversely from those anticipated or implied in the forward-looking statements.
Forward-looking statements represent our beliefs and assumptions only as of the date of this
Annual
Report. We disclaim any obligation to update forward-looking statements.
PART I.
Item 1. Business.
Overview
Etsy is the global two-sided marketplace for unique and creative goods. Our mission is to “Keep Commerce Human,” and we’re committed to using the power of business and technology to strengthen communities and empower people around the world. We connect creative entrepreneurs with thoughtful consumers looking for items that are intended to be special, reflect their sense of style, or represent a meaningful occasion. Etsy was founded in June 2005 in Brooklyn, New York.
Our sellers are the heart and soul of Etsy, and our technology platform allows our sellers to turn their creative passions into economic opportunity. We have a seller-aligned business model: we make money when our sellers make money. We offer our sellers a marketplace with millions of buyers along with a range of seller tools and services that are specifically designed to help our creative entrepreneurs generate more sales and scale their businesses.
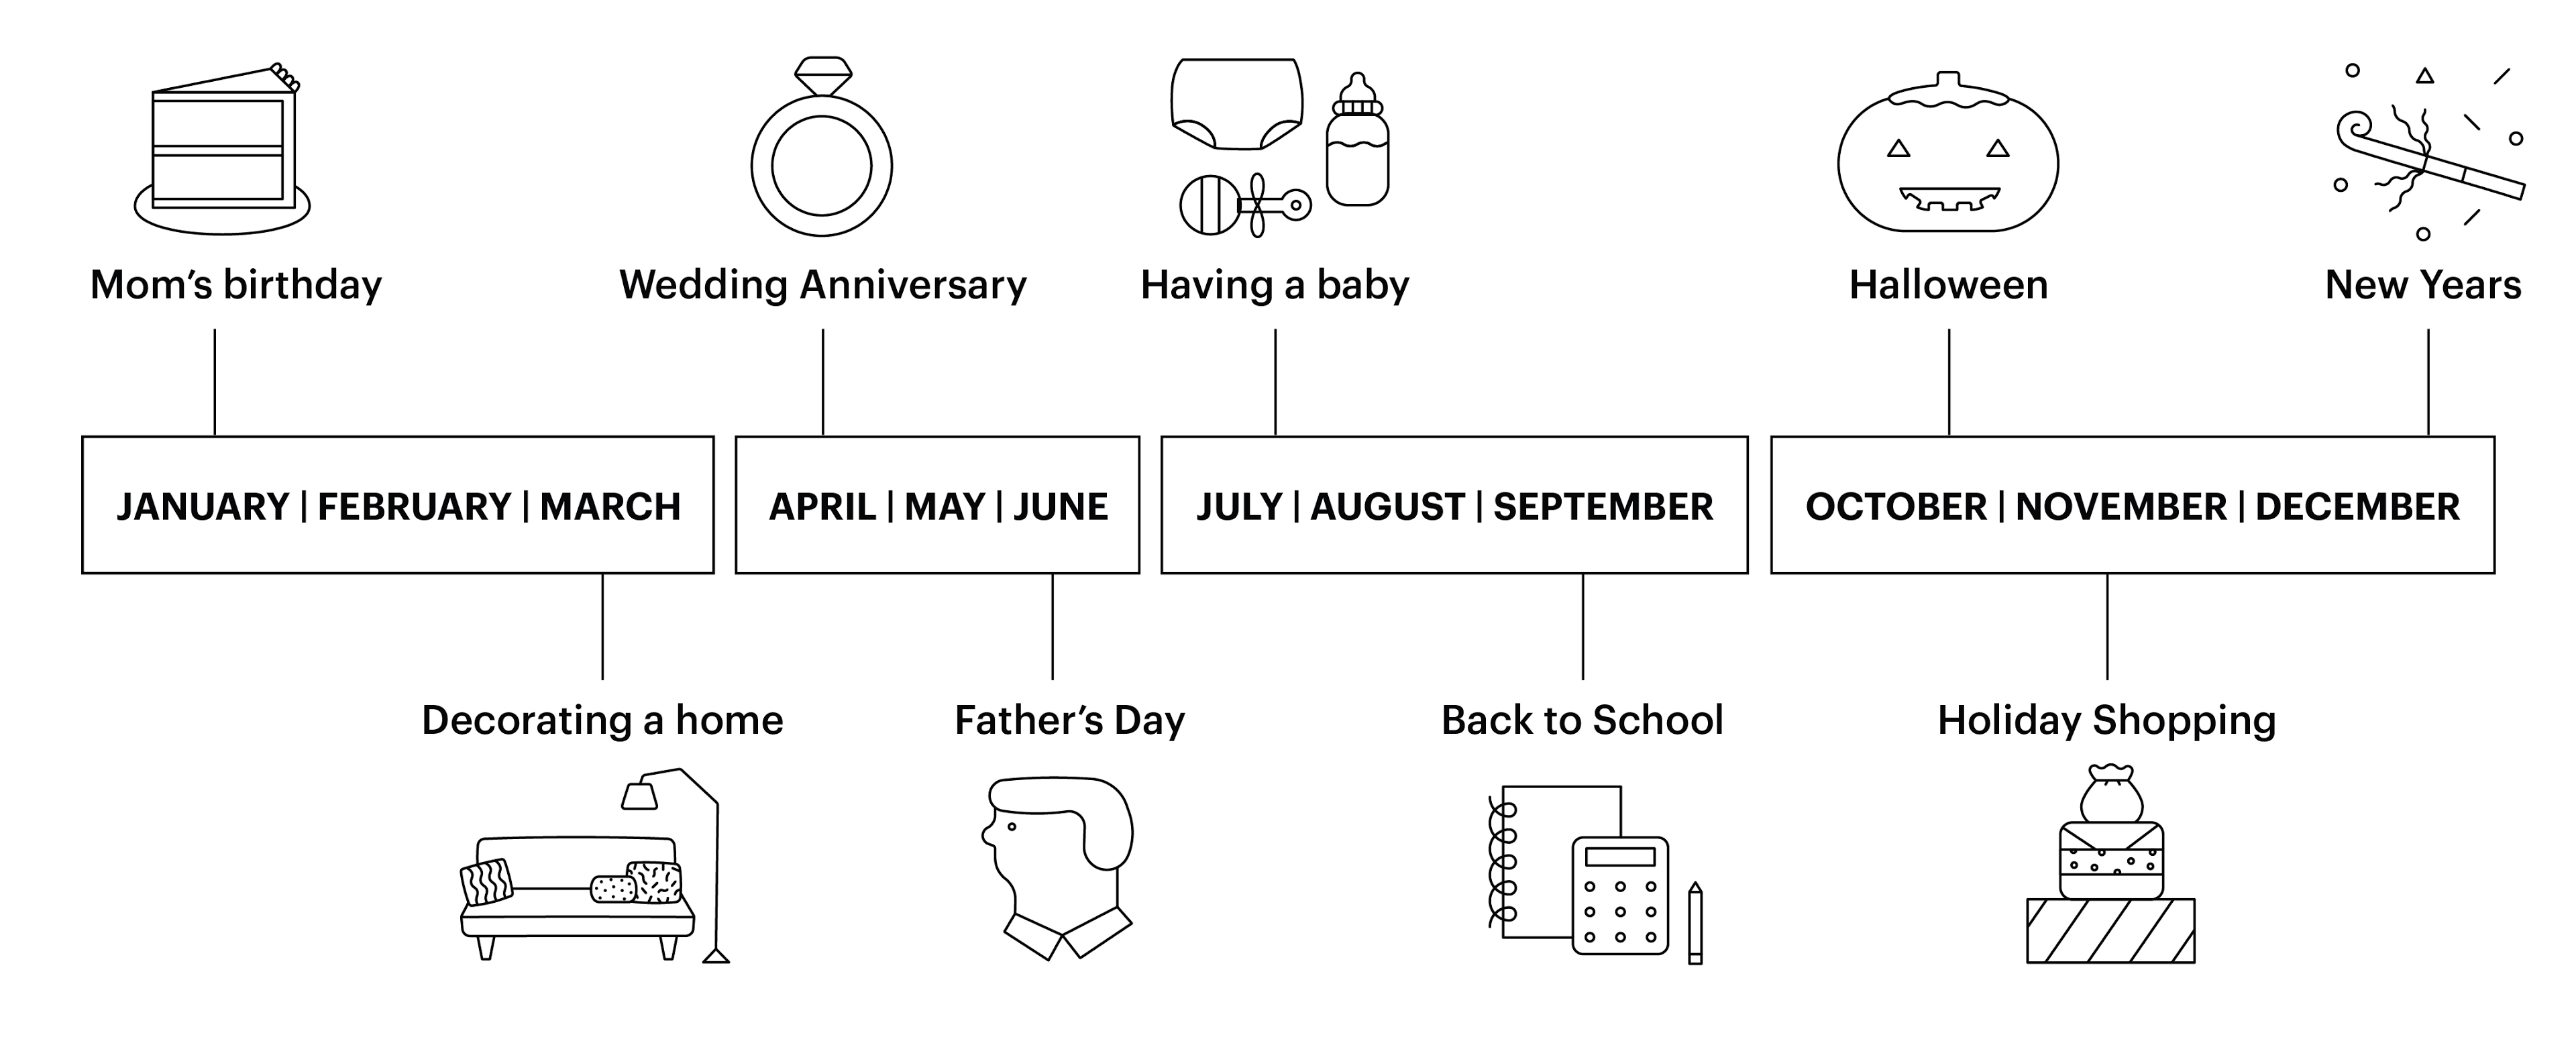
We are focused on attracting potential buyers to the Etsy marketplace for “special” purchase occasions throughout the year and deepening engagement with our existing buyers by inspiring purchases across multiple categories and special occasions. These special purchase occasions can occur many times throughout the year and include shopping that reflects an individual's unique style; gifting that demonstrates thought and care; and celebrations that express creativity and fun. Buyers tell us that they come to Etsy because Etsy sellers offer items that they can’t find anywhere else. In fact, in a
2018
survey of Etsy buyers,
78%
of buyers agreed that Etsy has items that you can’t find anywhere else.

Special purchase occasions happen throughout the year when a buyer is decorating a home, dressing for an event, celebrating a special moment, or buying a gift for someone special.
1
As of
December 31, 2018
, our marketplace connected
2.1 million
active Etsy sellers to
39.4 million
active Etsy buyers. Etsy buyers and sellers are located all over the world, and our six core geographic markets are the United States, United Kingdom, Canada, Australia, Germany, and France. We will continue to invest in these markets, as this is where we have our strongest concentration of both buyers and sellers, and continue to evaluate geographies in which to make strategic investments. There are currently more than
60 million
items for sale across
dozens
of retail categories on Etsy.com. In
2018
, our marketplace generated
$3.9 billion
of Gross Merchandise Sales, (“GMS”), of which approximately
55%
came from purchases made on mobile devices. In
2018
, our top six retail categories were: homewares and home furnishings, jewelry and personal accessories, apparel, craft supplies, paper and party supplies, and beauty and personal care. We are a global company and
35%
of our
2018
GMS was generated when the Etsy seller or Etsy buyer, or both, were located outside of the United States.
Our revenue is diversified, generated from a mix of marketplace activities and other optional services we provide to Etsy sellers to help them generate more sales and scale their businesses.
Marketplace revenue is comprised of the fees an Etsy seller pays us for marketplace activities. Marketplace activities include listing an item for sale, completing transactions between a buyer and a seller, and using Etsy Payments to process payments, including foreign currency payments. Fees include the
5%
transaction fee that an Etsy seller pays for each completed transaction, inclusive of shipping fees charged, the
$0.20
listing fee she pays for each item she lists (for up to four months) on Etsy.com, and fees for Etsy Payments, our payment processing product. On
July 16, 2018
, we increased our seller transaction fee from
3.5%
to
5%
, and now apply it to the cost of shipping in addition to the cost of the item. The revised fee structure is intended to support increased investments in the growth and health of the marketplace. Revenue from Etsy Payments, included in Services revenue prior to 2018, is now included in Marketplace revenue because Etsy Payments is required to be used by Etsy sellers in the countries where it is available.
Services revenue, formerly called Seller Services revenue, is comprised of the fees an Etsy seller pays us for our optional services (“Services”). Services include Promoted Listings, our on-site advertising service that allows sellers to pay for prominent placement of their listings in search results; Etsy Shipping Labels, which allows sellers in the United States, Canada, United Kingdom, and Australia to purchase discounted shipping labels; Pattern, a service that allows sellers to build custom websites; and Etsy Plus, a subscription offering that provides sellers with enhanced tools and credits for use on our platform.
We also generate additional revenue through our commercial partnerships, which is classified as other revenue.
2
Our Opportunity
We believe that the nature of commerce is continuing to evolve: more people are choosing to purchase goods online and many consumers are looking for unique items as an alternative to mass produced goods. According to estimates by Euromonitor, a market research company, worldwide retail ecommerce will generate double-digit growth each year through 2022, and worldwide retail ecommerce sales will reach $3 trillion by the end of 2022. (Source: Euromonitor — Worldwide Internet Retailing.) We estimate that, in 2018, the online market size across all relevant retail categories within our six core geographic markets; United States, United Kingdom, Canada, Australia, Germany, and France, represents a $249 billion market opportunity, and a $1.7 trillion market opportunity when offline is included.
Our Platform
Etsy leverages technology to connect people around the world through commerce. Our platform includes our marketplace, our seller tools and services, our passionate and engaged sellers and buyers, and our technology. Our commitment to transparency and integrity underpins our platform and establishes trust within our marketplace and our community.

|
Key Components of Our Platform
|
Our Marketplace
Our marketplace, Etsy.com, is where thoughtful buyers come to discover a broad selection of unique goods that are hard to find elsewhere. In a world of increasing automation and commoditization, Etsy celebrates creativity and human interaction.
We believe our marketplace is characterized by several unique qualities, including:
|
•
|
Unique Products:
Our marketplace boasts a large assortment of handmade, customized, personalized, vintage, and craft supply products from all of the world. There are currently more than
60 million
items listed on our marketplace. We intend to continue to improve the customer experience by investing in our search and discovery capabilities to help buyers efficiently find the special items they are looking for and deliver a brand promise around shipping to align with our buyers’ expectations of when they can expect to receive our unique items.
|
|
•
|
Global Reach:
Etsy’s six core geographic markets are the United States, United Kingdom, Canada, Australia, Germany, and France, and there are people using our platform to buy and sell in nearly every country around the world. Our platform makes it easy for Etsy buyers and Etsy sellers to interact across borders even if they do not speak the same language and wish to transact in different currencies. We use innovative machine translation technology to translate listings, reviews, Promoted Listings, and conversations between Etsy buyers and Etsy sellers. Our payments platform allows Etsy sellers to offer Etsy buyers a wide range of payment options. In
2018
,
37%
of Etsy sellers were located outside the United States, and
35%
of our GMS was generated between an Etsy seller, Etsy buyer, or both, located outside of the United States.
|
|
•
|
Organic Traffic Base:
We’ve built a loyal, global base of buyers on the platform without significant investment in acquisition marketing until 2013, eight years after being founded. Unlike many other ecommerce companies, the vast majority of visits to Etsy.com came through organic channels. In fact, approximately,
85%
of visits in
2018
were from organic sources, including a large portion from buyers visiting Etsy.com directly as well as from non-paid channels such as search, social, email, and push notifications.
|
|
•
|
Connection Between Buyers and Sellers:
We believe that human connection is central to buyer engagement. On Etsy, we emphasize that the items listed for sale are brought to life by real people. Additionally, buyers are able to connect directly with sellers in order to ask questions and personalize or customize items to their specifications. We also encourage buyers
|
3
and sellers to connect in a variety of other ways, such as through sharing reviews on social media or connecting off-line through the Etsy Local feature on our mobile app. We believe that meaningful interactions with Etsy sellers differentiates us from other e-commerce platforms, drives buyer engagement, and keeps our buyers coming back.
|
•
|
Connected Experience Across all Devices:
We want to engage Etsy buyers wherever they are and to provide an enjoyable and accessible shopping experience no matter how they come to Etsy. Our mobile website and our “Buy on Etsy” mobile app for Etsy buyers include search and discovery, curation, personalization and social shopping features. Our Etsy.com iOS and Android mobile apps have been downloaded approximately
56 million
times as of
December 31, 2018
. We offer a connected experience through each channel, desktop, mobile web, and mobile app, to help ensure that no matter what device our buyers use they will have the best possible experience. For the year ended
December 31, 2018
approximately
55%
of our GMS was generated on a mobile device. This is an
increase
compared with 2017, during which
51%
of our GMS was generated on a mobile device. We are focused on increasing conversion rates in general; however, we are particularly focused on mobile web, which continued to be the largest driver of both overall visits growth and mobile GMS growth. Mobile web conversion rate is about
half
the conversion rate on desktop and the conversion rate on our mobile Buy on Etsy app is about
1.2
x the desktop conversion rate. Therefore, if mobile web visits continue to grow as a percentage of overall visits, it could be a headwind to future conversion rate gains.
|
|
•
|
Buyer Intent; People Come to Etsy to Browse and be Inspired:
Our platform is designed to provide a personalized search experience to Etsy buyers, adjusting in real time based on transaction data and previous browsing history. A large portion of our buyers come to Etsy not in search of a specific item, but to browse and be inspired. We are continuing to build more sophisticated algorithms that allow us to deliver more personalized results to our buyers, utilizing browse and transaction data to surface items they didn’t know they wanted. In
2018
, we launched a number of products to enhance search, including adding recommendations to item landing pages and incorporating more attributes to our search algorithm to improve search ranking. All of this helps bring fun to the discovery and shopping experience. We believe we have significant opportunities to further enhance our search and discovery capabilities and plan to leverage our machine learning technology to deliver an even more personalized shopping experience. In addition, our full migration to Google Cloud by the beginning of 2020 is expected to further improve our search and discovery effectiveness.
|
Etsy sellers are required to pay a fixed listing fee of
$0.20
for each item listed on Etsy.com for a period of four months or, if earlier, until a sale occurs. Once a sale is consummated, sellers pay variable transaction fees and Etsy Payments fees. On
July 16, 2018
, we increased our seller transaction fee from
3.5%
to
5%
, and now apply it to the cost of shipping in addition to the cost of the item. Etsy Payments processing fees vary between
3
% to
4.5%
of an item’s total sale price, including shipping, plus a flat fee per order, depending on the country in which a seller’s bank account is located. When a foreign currency payment is processed, an additional
2.5
% to
5%
fee is applied. As of
December 31, 2018
, Etsy Payments was available in
36
countries and
12
currencies and nearly all sellers in countries where Etsy Payments is available are required to use the service. In fact,
86%
of total GMS was processed through Etsy Payments in 2018,
up
from
85%
in 2017. Our ability to expand Etsy Payments into additional countries is dependent upon the third-party providers we use to support this service.
Our Seller Tools and Services
Seller tools and services help Etsy sellers generate more sales and scale their businesses. In addition to driving incremental revenue streams to Etsy, these offerings play a key role in supporting sellers’ businesses and driving sales. Our optional paid services are (in order of 2018 revenue contribution): Promoted Listings, Etsy Shipping Labels, Pattern, and subscription packages. Services revenue
grew
42.1%
, and represented
26.3%
of our total revenue,
up
from
25.4%
in
2017
.
|
•
|
Promoted Listings:
Promoted Listings enable Etsy sellers to pay a cost-per-click based fee to feature and promote their goods in our marketplace in search results generated by Etsy buyers. This service allows Etsy sellers to target Etsy buyers who are specifically searching for goods similar to those she offers for sale. During
2018
,
15.1%
of active sellers used Promoted Listings
up
from
15.0%
in
2017
. In
2018
, we enhanced Promoted Listings by expanding inventory across all devices and adding context specific search ranking to improve ad relevance and higher click-through rates, which both led to accelerated year-over-year revenue growth for this service. We optimized our sellers’ budgets and generated a positive return on their spend in 2018. We aim for sellers to be ROI positive and often utilize less than their allocated budget.
|
|
•
|
Etsy Shipping Labels:
This service allows sellers in the United States, Canada, United Kingdom, and Australia to purchase discounted United States Postal Service, FedEx, Canada Post, Royal Mail, and DAI Post shipping labels through our platform. The ability to print the shipping labels at home reduces the cost and time it takes Etsy sellers to ship items to Etsy buyers, reduces the chance for administrative error through features such as auto population of shipping addresses, and automatically provides tracking information when available and shipping notifications to buyers. During
2018
,
24.7%
of active sellers in regions where Etsy Shipping Labels is offered used this product,
down
from
28.1%
in
2017
. The reduction in percentage of active sellers using Etsy Shipping Labels was driven by the expansion of the service in the United
|
4
Kingdom and Australia in late 2018 where adoption could take some time to develop. Despite this, year-over-year revenue growth for this service accelerated compared to 2017 driven by GMS growth.
|
•
|
Pattern:
With Pattern, Etsy sellers can create their own custom websites with unique domain names within minutes. Pattern imports listings and content from Etsy shops, syncs inventory and orders, and utilizes our Etsy Payments and Etsy Shipping Label services. In
2018
, we began allowing sellers to sell items or services on their Pattern website that don’t follow the handmade and vintage guidelines within our Etsy.com marketplace. Sellers may use Pattern for free for the first 30 days, then they are charged
$15
per month, plus payment processing fees and Etsy Shipping Label fees, if they choose to use this service.
|
|
•
|
Subscription Packages:
Our subscription packages were launched in July 2018 as a way for us to bundle and simplify our offerings for sellers. The Etsy Plus subscription package, which allows sellers to pay for enhanced tools and credits to use on the Etsy.com platform, is
$10
per month and features enhanced tools such as advanced shop customization options, targeted restock notifications, discounts on branded packaging and promotional materials, and free or discounted custom web addresses. Additionally, Etsy Plus includes
$5
of Promoted Listing credits and
15
free listing credits per month.
|
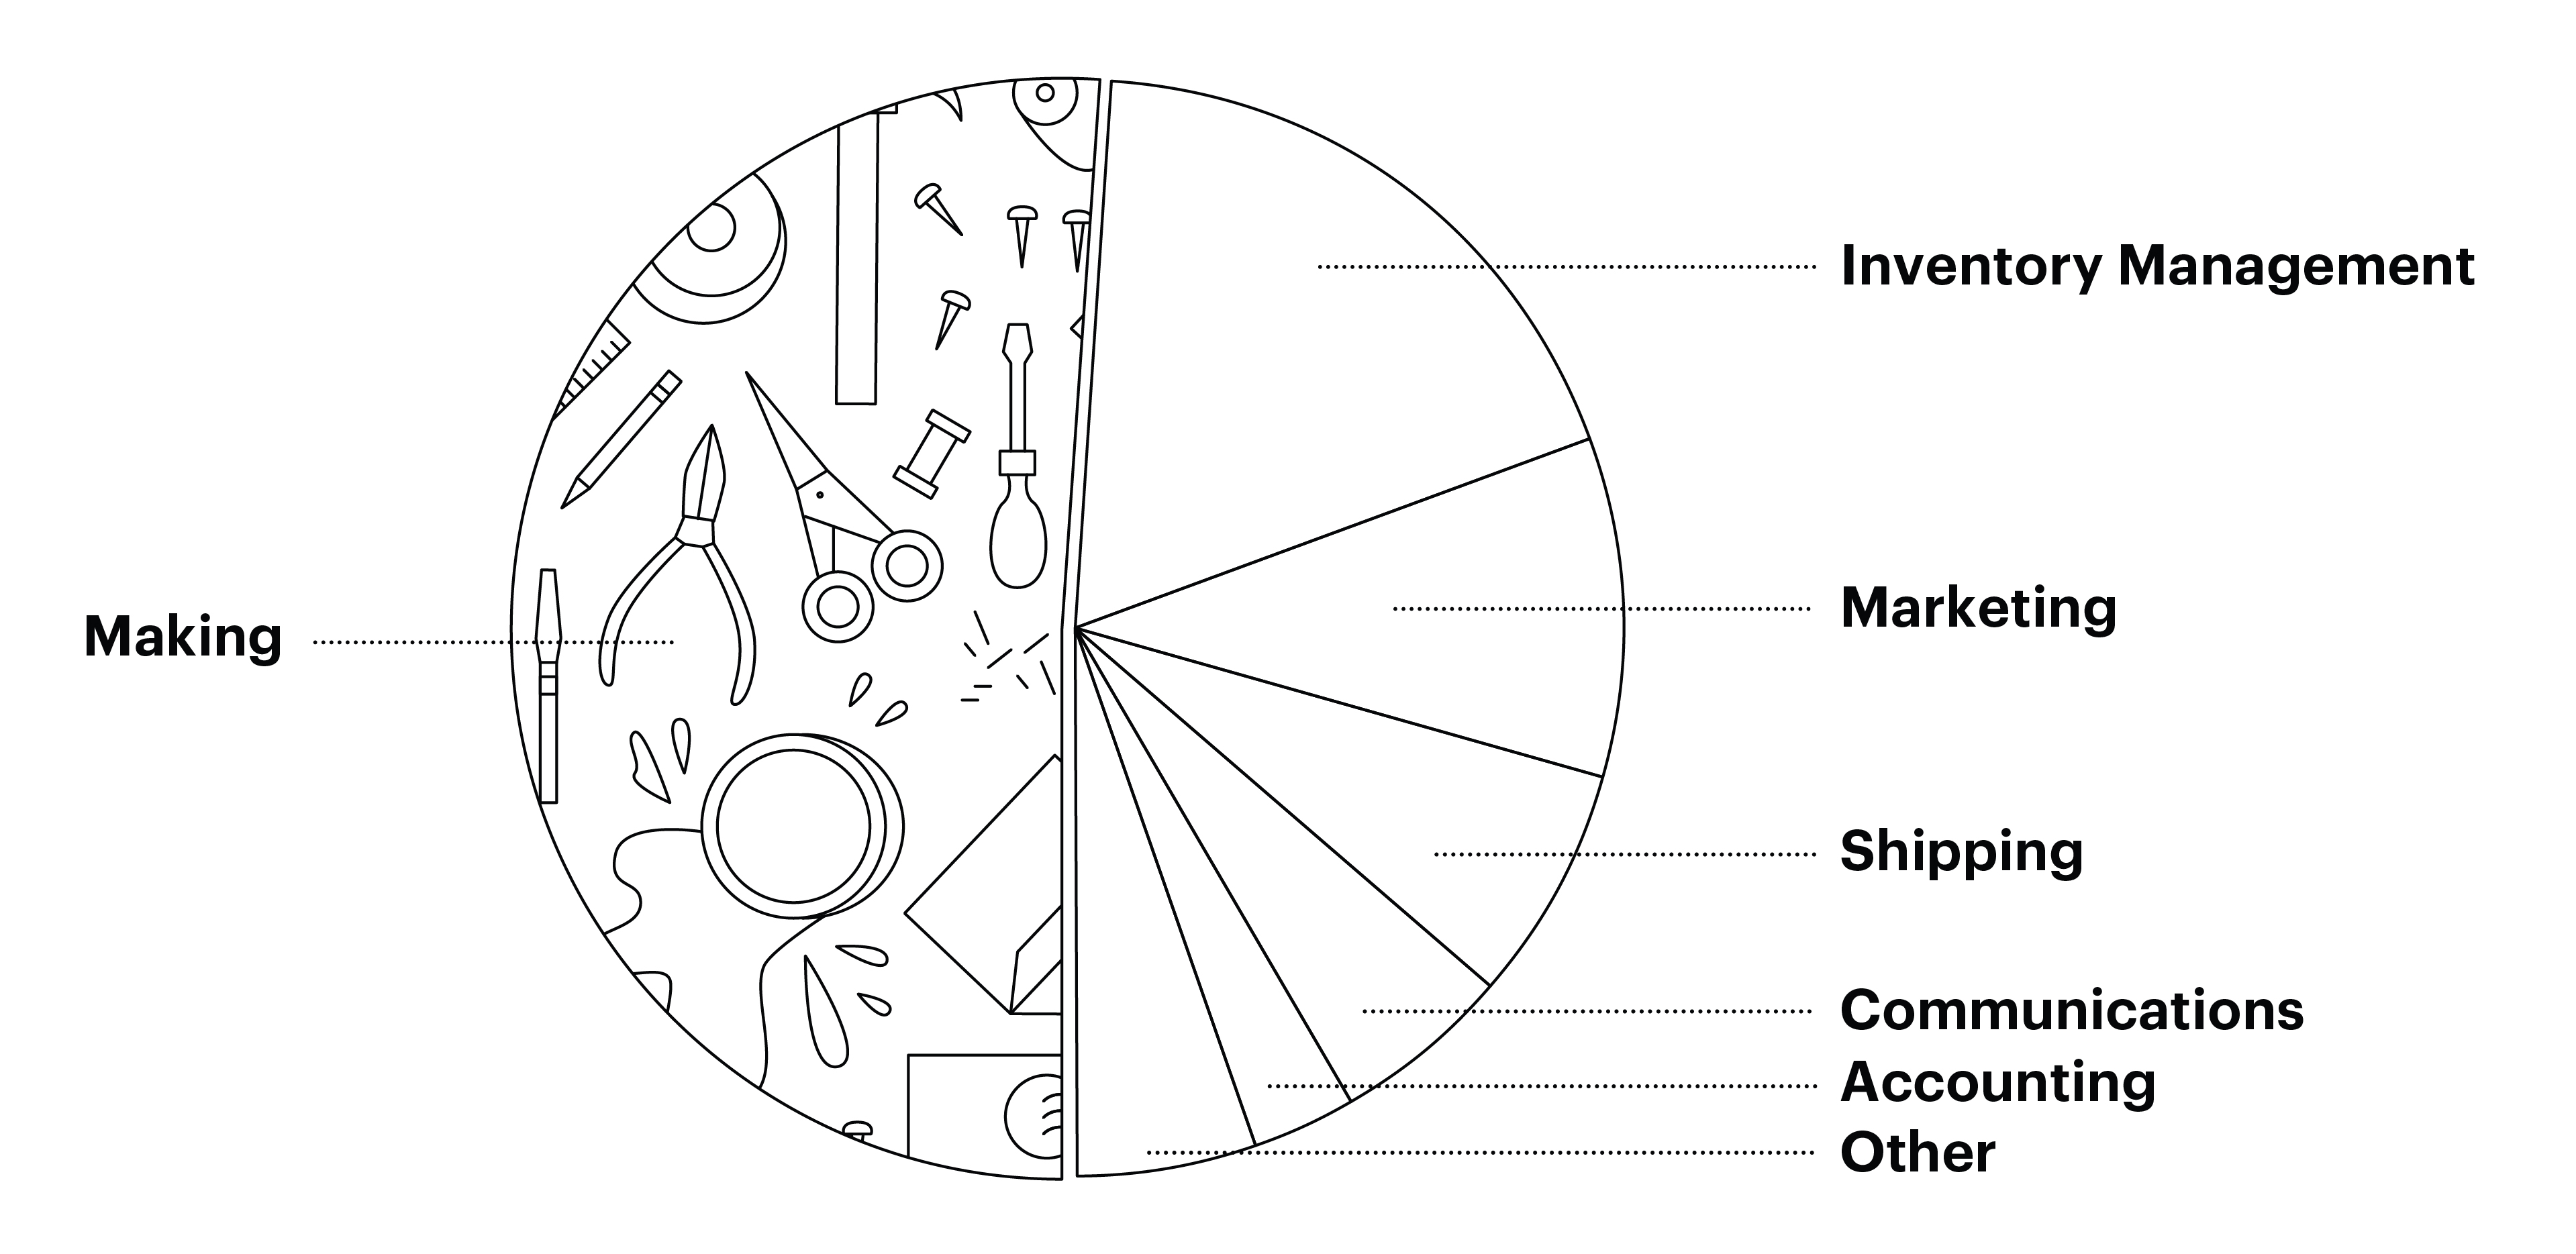
We believe we can grow our optional paid services in three ways: expand the utility of existing services, expand the geographic reach of existing services, and launch new services offerings. In addition to our paid services, we provide a wide range of tools and educational resources to give Etsy sellers the support they need to manage the administrative side of their businesses. According to our bi-annual seller survey, most recently conducted in
2018
, for every hour that an Etsy seller spends making her products, she spends almost another hour doing business-related tasks, including inventory management, marketing, shipping, customer service, and accounting. Our tools and educational resources help manage these administrative burdens.
|
•
|
Seller Tools:
We offer a variety of free tools to Etsy sellers, including marketing tools such as our Google Shopping tool. Google Shopping gives our sellers a complementary way to target buyers outside of the Etsy marketplace at key moments when they are searching for items on Google. Sellers set a daily budget and a target country or a number of geographies through their Shop Manager dashboard and we optimize their budget and target a return on their spend. Our Shop Manager dashboard, which we launched in 2017, serves as a centralized hub for Etsy sellers to track orders, manage inventory, view metrics and statistics, and have conversations with their customers across all of their Etsy shops. In 2018, we added a single, easy-to-use interface that streamlines sellers’ bills and payments accounts. Other marketing tools include Targeted Offers, our sales and promotions tool, and our social media tool, which help sellers with their marketing needs and allows them to stand out on and off the Etsy platform. Also, through a partnership with Intuit, sellers in the United States and the United Kingdom can simplify their accounting and bookkeeping.
|
|
•
|
Education:
We provide extensive educational resources to teach Etsy sellers how to start, manage, and scale their businesses on our platform, including blog posts, video tutorials, the Etsy Seller Handbook (available on Etsy.com), Etsy.com online forums, and insights from Etsy.com support teams. In addition to our resources, Etsy sellers connect through self-organized Etsy Teams to build personal relationships with other Etsy sellers, collaborate, educate, and support each other as they build their independent creative businesses. Currently, over
16,000
Etsy Teams have formed around the world.
|
5
Etsy’s focus on supporting our sellers in starting, managing, and scaling their businesses strengthens our marketplace and positions it for continued growth. When our sellers succeed, Etsy succeeds.
|
How an Etsy Seller Spends Her Time
|
2018 seller survey
|
|||
Key 2018 Investments
Marketing:
In July 2018, we revised our fee structure which enabled us to invest more in marketing while maintaining our return on investment. We increased digital marketing spend by
58.5%
in 2018 to
$112.2 million
, and continued to optimize our marketing attribution model. We experimented with offline marketing and television advertising tests in the second half of 2018, and conducted pre- and post-brand awareness research to supplement our quantitative data.
Google Cloud:
We made progress and are on track with our migration to Google Cloud, which we expect to complete by the beginning of 2020. Among other anticipated benefits discussed below, we believe the migration will enhance our overall infrastructure by providing faster processing speed, improved page load time and more nimble server capacity on an as needed basis.
Search
: We continued investing in our machine learning capabilities in order to help buyers find the right selection of products, from the over
60 million
items available in our marketplace. In 2018, we improved search relevance and began localizing search results by using context specific ranking.
Customer Support:
Our partnership with Zendesk supported improvements to our customer experience and lower costs. We introduced live chat for our sellers, and dedicated 24x7 phone support for both buyers and sellers.
Shipping:
We made progress evolving our search algorithms in order to more prominently promote items that have competitively priced shipping, introduced shipping price notifications for sellers, and launched the ability for sellers to display an expected delivery date. Also, in 2018, we expanded our Etsy Shipping Labels offering to sellers in the United Kingdom and Australia.
6
Our Passionate and Engaged Sellers and Buyers
Etsy Sellers
Our sellers are the backbone of Etsy’s business and what matters most to them is our community of over
39 million
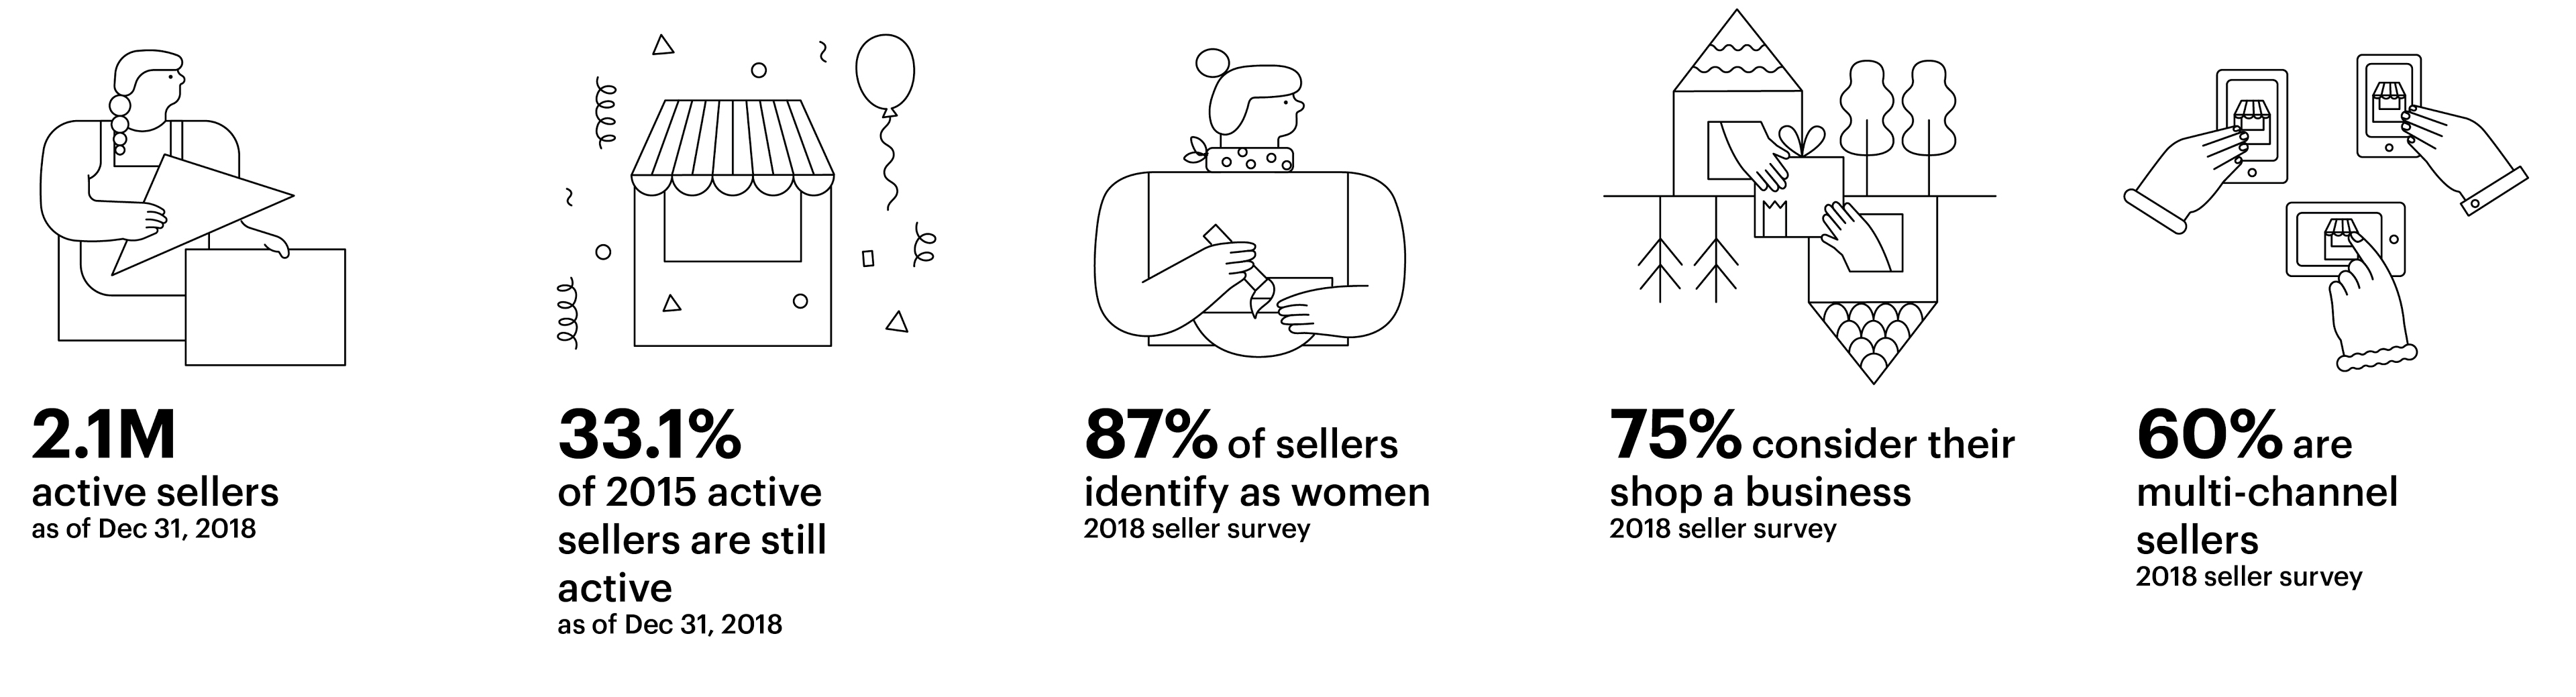
buyers. In order to continue to support our sellers’ growth, we are focused on making Etsy the best place to start and run a creative business. We serve those creative entrepreneurs around the world who choose to pursue their passions, offering them a global base of millions of buyers and a cohesive suite of tools and services to help them run their business and drive sales. Etsy sellers range from hobbyists to professional merchants, and have a broad range of personal and professional goals. Our
2018
seller survey found that
60%
of Etsy sellers are multi-channel sellers and on average Etsy is their primary source of sales.
According to the
2018
seller survey:
|
•
|
87%
identify as women;
|
|
•
|
75%
consider their Etsy shop to be a business;
|
|
•
|
97%
run their shops from their homes;
|
|
•
|
82%
aspire to grow their sales in the future; and
|
|
•
|
64%
started their Etsy shop as a way to supplement income.
|
Our
2018
seller survey found that
32%
of Etsy sellers were pursuing their creative business as their sole occupation. In addition to our
2018
seller survey, we conducted a separate survey of our top decile sellers in 2017. Key findings included that
95%
of our top decile sellers intended to remain with Etsy for the next 12 months.
|
Etsy Sellers
|
||||
Etsy Buyers
Etsy supports a community of over
39 million
buyers, who value self expression, unique items, and buying directly from creative entrepreneurs. In a 2018 survey of Etsy.com buyers,
78%
of buyers agreed that Etsy offers products they cannot find anywhere else. Etsy buyers can enjoy a personalized shopping experience and build relationships through direct interactions with Etsy sellers. Etsy buyers can also purchase customized items and craft supplies from Etsy sellers. By shopping on Etsy.com, Etsy buyers are supporting creative entrepreneurs in their local communities and around the world.
We are focused on driving more new buyers to the platform and encouraging existing buyers to purchase more often. New buyers are considered unique buyers that have never made a purchase on Etsy. During 2018, we had
17.5 million
new buyers, which represented approximately
18%
of overall GMS. GMS from new buyers was
up
16%
year-over-year. GMS from existing buyers
grew
23%
year-over-year in 2018 and represented approximately
82%
of overall GMS, an
increase
compared to last year.
7
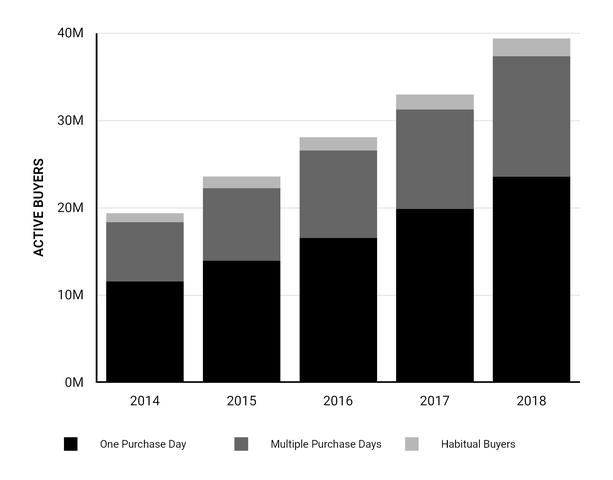
Repeat buyers represent shoppers who have ever bought on Etsy, regardless of when their first purchase day occurred. We believe repeat purchases demonstrate the loyalty of Etsy buyers. In
2018
, approximately
40.1%
of our active buyers made purchases on two or more days in the previous 12 months, a slight increase compared to last year. Within that category, we are particularly focused on increasing our number of habitual buyers, or buyers who have spent $200 or more and made purchases on six or more days in the previous 12 months. As of December 31, 2018, habitual buyers grew to
2.0 million
, an increase of
21.7%
compared to 2017. This is faster than overall active buyer growth, indicating our efforts to convert buyers into more loyal shoppers on the platform are seeing signs of success.
|
Active Buyers by Purchase Type
|
8
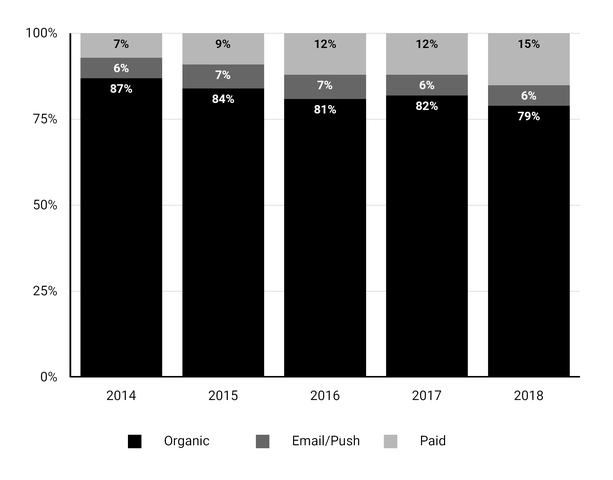
Unlike many other ecommerce companies, the vast majority of visits come to Etsy from organic channels. In
2018
,
85%
of visits came to Etsy.com from an organic source, including a large portion from buyers visiting Etsy.com directly as well as from non-paid channels such as search, social, email, and push notifications. Paid visits are attributed to visits generated from our marketing efforts. Over the last five years, paid visits have increased as a percentage of total visits as a result of our increased investment in marketing. A visit represents activity from a unique browser or mobile app. A visit ends after 30 minutes of inactivity.
|
Visits Contribution by Source Type
|
9
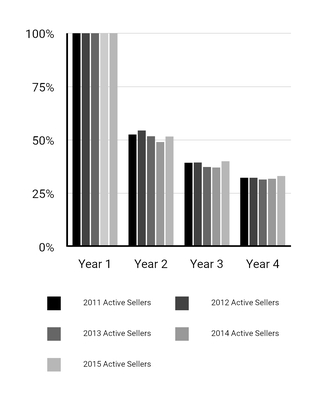
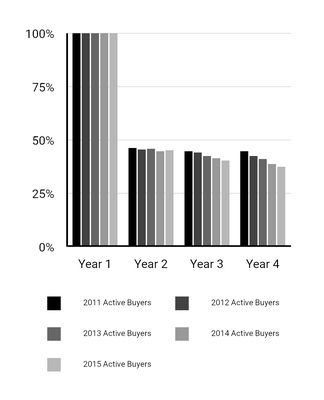
Etsy Seller & Buyer Retention
Our active sellers and active buyers typically remain so for multiple years. For example,
33.1%
of active sellers and
37.5%
of active buyers as of December 31, 2015 continued to be active sellers and active buyers through their fourth year on the platform and
31.8%
of active sellers and
38.7%
of active buyers as of December 31, 2014 continued to be active sellers and active buyers through their fourth year on the platform. In addition, as of
December 31, 2018
,
19.6%
of active sellers have been selling on Etsy for more than four years. Likewise, as of
December 31, 2018
,
24.5%
of active buyers have been Etsy buyers for more than four years.
|
AVG GMS
|
2011
|
$817
|
$2,241
|
$3,314
|
$4,299
|
AVG GMS
|
2011
|
$103
|
$177
|
$186
|
$195
|
|||||||||||||||
|
PER SELLER
|
2012
|
$1,079
|
$2,598
|
$3,935
|
$4,557
|
PER BUYER
|
2012
|
$96
|
$163
|
$173
|
$181
|
|||||||||||||||
|
2013
|
$1,260
|
$3,110
|
$4,190
|
$4,620
|
2013
|
$96
|
$161
|
$168
|
$174
|
|||||||||||||||||
|
2014
|
$1,465
|
$3,325
|
$4,228
|
$4,615
|
2014
|
$99
|
$157
|
$164
|
$169
|
|||||||||||||||||
|
2015
|
$1,558
|
$3,296
|
$4,062
|
$4,939
|
2015
|
$101
|
$158
|
$163
|
$180
|
|||||||||||||||||
|
Cohorts of 2015, 2014, 2013, 2012, and 2011 Active Sellers and Active Buyers
|
See “
Management
’
s Discussion and Analysis of Financial Condition and Results of Operations
—
Key Factors Affecting Our Performance
—
Growth and Retention of Active Buyers and Active Sellers
” for more information.
10
Our Technology
Our widely respected engineering team has built a sophisticated platform that enables millions of Etsy sellers and Etsy buyers to smoothly transact across borders, languages, and devices. We collect and analyze large volumes of data to enhance the performance of our platform. For example, on average, we capture roughly
one billion
user-generated events every day to produce personalized recommendations, improve our search experience and test features on our website.
Our use of machine learning algorithms creates an engaging shopping experience and also helps Etsy sellers and Etsy buyers connect across our platform. We apply proprietary machine learning to the search and discovery processes, enabling shoppers to more easily browse, filter, and buy that perfect item, even when they may not have something specific in mind.
Machine translation and machine learning also play an important role in making it easy for Etsy sellers and Etsy buyers to connect even if they don’t speak the same language. We translate listings within our Etsy.com market into
10
languages which we believe significantly increases the inventory available to non-English speaking Etsy buyers and gives Etsy sellers access to a truly global audience.
Our technology infrastructure allows us to scale our efforts across the platform. In late 2017, we announced our migration to Google Cloud, which we believe will enable us to focus on growing our core Etsy.com marketplace, prioritize the buyer and seller experience, improve our search and discovery effectiveness, and increase the pace of launching new features. We expect the migration will result in increased engineering efficiency shifting the focus from maintaining on-premise systems to product engineering work that is more strategic. We also believe the migration will enhance our overall infrastructure by providing faster processing speed, improved page load time, and more nimble fulfillment to capacity on an as needed basis. In the third quarter of 2018, we achieved a significant milestone by successfully migrating our website and mobile apps to Google Cloud. We expect to complete the migration by the beginning of 2020.
Commitment to Integrity and Transparency
Members of our community rely on us to maintain a trusted marketplace. Our policies are designed to encourage transparency and clearly outline the rights and responsibilities of Etsy sellers and Etsy buyers participating on our platform. Most fundamentally, we require that goods listed in our marketplace be handmade or unique and assembled with production partners, vintage, or craft supplies.
Transparency within our community helps to support our trustworthiness. For example, we publish an annual report that details progress toward our ideals and shares our hopes for the years to come. We also annually report statistics regarding shops that do not meet our guidelines or which list items that are alleged to infringe third party rights. In 2018, we closed
3,609
Etsy.com shops that were subject to repeat notices of intellectual property infringement and closed
109,473
Etsy.com accounts for non-IP policy violations.
Additionally, we are focused on enhancing customer service for Etsy sellers and Etsy buyers, which we believe bolsters the trustworthiness of our marketplace. In 2018, we migrated our legacy support platform to a new third-party customer service platform, Zendesk, to improve our customer experience. This migration enabled us to introduce live chat for our sellers, and dedicated 24x7 phone support for both buyers and sellers.
We strive to give the Etsy buyer comfort that she is purchasing goods from a shop that adheres to certain principles. Etsy buyers have a high degree of insight into Etsy sellers’ business practices. Our policies ask Etsy sellers to be transparent about themselves, their businesses and the goods they sell. We also have dedicated teams and sophisticated tools to help enforce our policies. For example, our Integrity team uses a combination of machine learning, automated systems, and community-generated flags to review items and shops that may violate our policies. Our Trust and Safety team helps to prevent and detect fraud through human review and automated tools and algorithms. We also recognize that sometimes transactions don’t go as planned. When that happens, our online Case System provides a way for Etsy sellers and Etsy buyers to communicate with each other to resolve disputes. In 2018,
0.3%
of orders resulted in a case. We also establish trust by emphasizing the person behind every transaction. We deepen connections between Etsy sellers and Etsy buyers through our direct communication tools, seller stories on our website and apps, and in-person events, highlighting personal relationships as a key part of the Etsy experience. For example, Etsy sellers are encouraged to share their stories to reach Etsy buyers on our platform and on social media. The trustworthiness of our marketplace and the connections among people in our community are cornerstones of our business.
11
Our Strategy
Since mid-2017, we have focused our strategy on growing the Etsy.com marketplace in our six core geographies and executing upon four key initiatives to make Etsy a better place to shop and sell. These initiatives involved making investments and improvements in search and discovery, trust and reliability, marketing capabilities, and seller tools and services. Successfully delivering on these initiatives has resulted in significant improvements to and growth of our marketplace.
In order to deliver sustainable long-term growth, we are building upon this strategy to incorporate additional elements that we believe, over time, will make Etsy a best-in-class marketplace. Our investments in product, marketing, and talent will be focused on capitalizing on what we believe are our core competitive advantages; or what we think of as our “Right to Win.”
The foundation of Etsy’s competitive advantage is our collection of unique items, which, we believe, when combined with best-in-class search and discovery, human connections, and a trusted brand, will enable us to continue to stand out among other ecommerce platforms and marketplaces. We will lean into the humanity and vibrancy of our market, increasing the connection between buyers and sellers, establishing strong trust signals for product quality and customer experience, removing barriers to purchase, and giving sellers more ways to generate sales and scale their businesses.
Ultimately, the goal of our long-term strategy is to drive more new buyers to the website, give existing buyers reasons to come back more often, encourage buyers to spend more per order, and fuel success for our sellers, which we believe will drive growth. Etsy has a significant number of habitual buyers (Etsy buyers that have purchased $200 or more on Etsy.com and have made purchases on six or more purchase days in the last 12 months) and we believe we have the ability to attract many more buyers like them to Etsy and convert them into habitual buyers. For example, we believe we can deepen engagement with our existing buyers by inspiring purchases in additional categories and on additional occasions. We also plan to continue supporting our sellers by focusing on enhancing the seller tools and services that will drive buyer demand. We believe that we are just getting started improving this virtuous cycle of growth.
Further expanding on these two primary components of our long-term strategy we will:
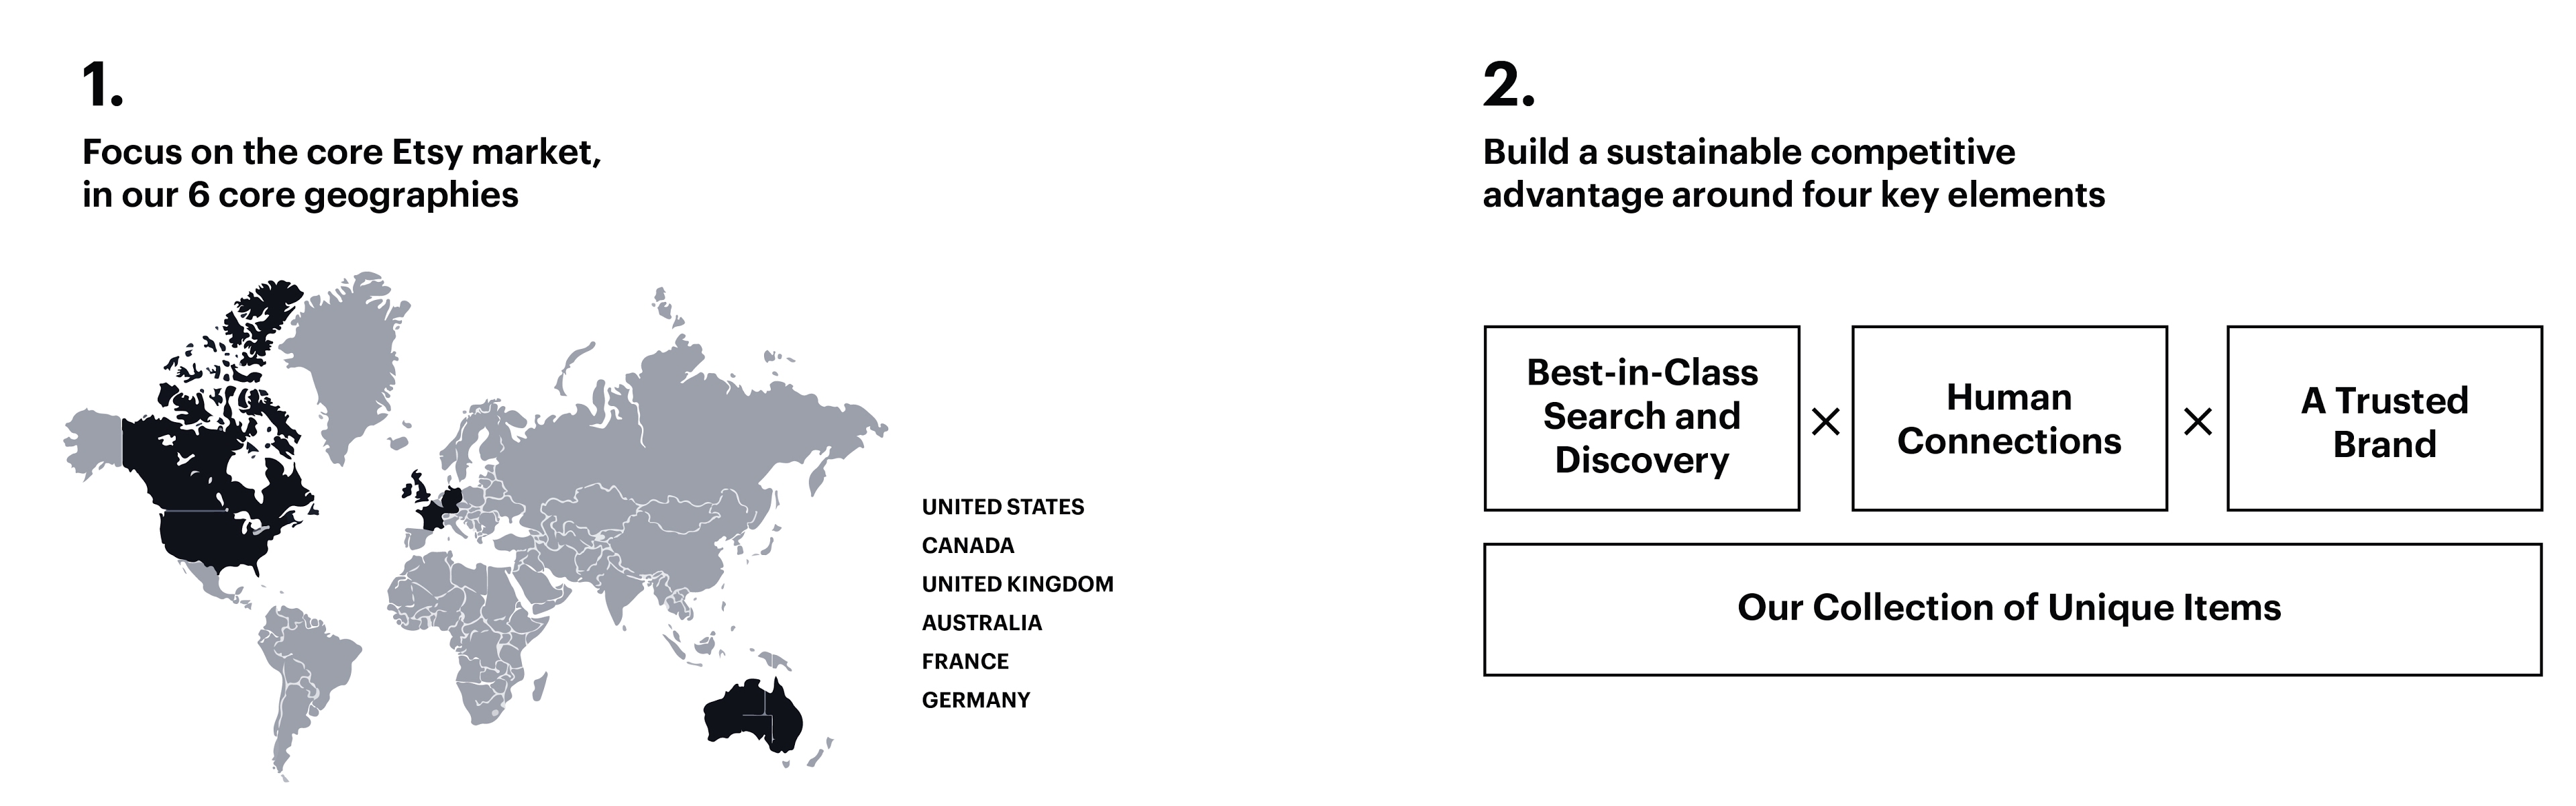
1. Focus on the Etsy marketplace in our six core geographies:
The first component and foundation of our growth strategy remains to focus on the Etsy marketplace in our six core geographies (the United States, United Kingdom, Canada, Australia, Germany, and France). These six locations are where we have our largest concentrations of buyers and sellers and, consequently, where we believe we have the most significant opportunities for growth. We are building local marketplaces globally, deepening local Etsy communities around the world, each with its own ecosystem of Etsy sellers and Etsy buyers. A barometer of our local market vibrancy is the performance of our international domestic trade route, by which we mean GMS generated between a non-U.S. buyer and a non-U.S. seller both in the same country. GMS from this trade route grew approximately
36%
in
2018
compared with
2017
, making it the fastest growing category of international GMS.
In
2018
, we announced a referral agreement with DaWanda, a privately held marketplace for gifts and handmade goods based in Germany, encouraging its community of buyers and sellers to migrate to the Etsy platform. This agreement brought meaningful new breadth and depth of inventory to Etsy, helping to make Germany our second largest international market (after the United Kingdom) by domestic activity. While we focus on our six core markets, we will also continue to evaluate additional geographies in which to make strategic investments. For example, we have made initial investments to explore growth opportunities in India.
12
We see significant opportunity to deliver a more localized shopping experience to non-U.S. buyers in the future, including investments in the elevation of local products and sellers in search, improving non-English search, and more local specific marketing and campaigns.
2. Build a sustainable competitive advantage:
As described above, the second component of our go-forward strategy is predicated around building a sustainable competitive advantage centered on these four key elements;
Our Collection of Unique Items:
The foundation of Etsy’s competitive advantage is our collection of unique items. Our marketplace features over
60 million
items listed across
dozens
of retail categories, and boasts a large assortment of unique, handmade, vintage, and craft supply products from all over the world. This unique inventory is the result of having created a community that attracts, supports, and retains some of the world’s most talented makers. In a
2018
survey of Etsy buyers,
78%
agreed that Etsy has items that you can’t find anywhere else - that something “special in a sea of sameness.” We believe our marketplace is the only place where you can find the depth and breadth of one-of-a-kind items, including millions that can be customized and personalized. The breadth and depth of the special items listed in our marketplace is the linchpin of our long-term strategy. However, the unique nature of these items requires that we invest in the other three parts of our long-term strategy: search and discovery, human connections, and our trusted brand in order deliver a best-in-class marketplace experience.
Best-in-class search and discovery:
We are focused on continuing to develop a search and discovery experience that unlocks the value of the unique items in our marketplace. With millions of items listed on Etsy.com that don’t map to a catalog or a stock keeping unit (“SKU”), our challenge is delivering world-class search and discovery technology that surfaces the right product to the right buyer at the right time in order to drive sales and buyer satisfaction. We are utilizing artificial intelligence and machine learning to help personalize the search experience and enable buyers to more easily browse, filter and find the item they desire.
In
2018
, we significantly enhanced the search and discovery experience in our marketplace. We leveraged Context Specific Search Ranking (“CSR”) by adding even more attributes such as location and shipping prices into our ranking algorithm to deliver more relevant results. We also began to leverage user generated content, introduced a new discovery feed and discovery badges to inspire buyers to explore more products and expand their search beyond their original intent and optimized landing pages by adding more recommendations and notifications, including alerts on listing cards when scarce items appear in other people’s carts.
We will also work to ensure that buyers have more help discovering the perfect item for them. Since our marketplace is built on over two million individual but largely unknown brands, we see significant opportunity to improve how we signal high quality items and deliver a great customer experience to buyers. We believe that by personalizing the Etsy search and discovery experience we can deepen buyer engagement and drive greater visit and purchase frequency. We expect that our transition to cloud-based technology and additional future investments in machine learning and artificial intelligence, among other factors, will enable us to deliver a best-in-class search experience.
The power of human connections:
Our mission to “Keep Commerce Human” is a vital part of our strategy.We will continue to emphasize the role that humans play in every aspect of our marketplace. What makes Etsy special isn’t just the items in our marketplace; it’s also the stories of how those items were brought to life by the hands of real people. Our buyer experience highlights the story behind each item, and also allows buyers to create their own stories by working with a seller to personalize or customize items to their exact specifications. In fact, data shows that when a buyer reaches out to a seller with a question they are significantly more likely to purchase a listing from that seller, and conversion rate goes up as response time gets shorter.
In
2018
, we began to streamline the purchase flow for orders that are personalized or customized and made it easier for buyers to connect with sellers to design high quality items on the platform. We plan to invest more to make sure that buyers and sellers know that Etsy is the destination for personalized items, and it is our goal to make buying and selling such items intuitive and easy.
We believe that fostering and elevating the quality of these interactions will also enable us to drive buyer engagement, loyalty, and purchase frequency, and continue to differentiate Etsy from other ecommerce platforms. Shifting over time from our current item-first framework to one that highlights shops and sellers is a way to elevate the role of our makers and their creative processes. Our goal is to bring human connections to life through improvements in member support, seller forums
13
management, our brand and marketing campaigns, and other ways that we promote our marketplace. Lastly, we plan to deepen loyalty by creating opportunities for buyers to experience Etsy across categories and occasions.
A brand you can trust:
We will continue to focus on being a brand that inspires trust in our customers across the buyer journey -- when they search, purchase, anticipate and receive their special items, and all the steps in between. Since our sellers have relatively unknown brands and unbranded items, we aim to ensure that the Etsy brand is recognized and valued for providing an excellent end-to-end experience. There are two key elements to being a trusted brand: standing for something that customers understand and rely on, and delivering a purchasing experience that feels safe and supportive. Our goal is to bolster trust in the Etsy brand, Etsy sellers, the items available in our marketplace, and in the overall Etsy experience. In
2018
, we improved buyer confidence with the launch of several new products, including a new iteration of guest checkout on mobile web, an alternative payment option common to German buyers, and an improved purchase path for items that are personalized or customized. We also made significant progress in customer support by partnering with Zendesk, a customer service software company. Our Zendesk partnership has enabled us to launch live chat and dedicated 24x7 phone support, which has improved the support experience for our buyers and sellers.
We plan to continue to optimize the core buyer shopping experience - to make it less fragmented and to remove friction. This will involve making sure that buyers can find what they want, can easily keep exploring for inspiration, and have the right information to make a purchase decision at every step along the way. We see significant room for additional improvements to our landing pages, our ability to surface recommendations so buyers do not hit dead ends, and to make sure we are surfacing relevant purchase information. By focusing on shipping enhancements and transparent delivery and returns we can help buyers better understand what to expect across Etsy.
In addition, we plan to evolve our marketing strategy and investments to reinforce our core brand promise in the hearts and minds of buyers. We believe that we can continue to grow our acquisition marketing efforts. We expect to add new marketing channels, optimize our spend in these channels and work with sellers to help them better understand the impact of marketing on their business (for example, with improved seller analytics tools), and to promote their shops to Etsy buyers.
Our Mission, Guiding Principles, and Team
Mission
Etsy’s mission to “Keep Commerce Human” is rooted in our belief that, although automation and commoditization are parts of modern life, human creativity cannot be automated and human connection cannot be commoditized. This is what makes Etsy and our marketplace distinct from mass retailers. Our mission guides our daily decisions, sets the path for our long-term success and reinforces our commitment to make a positive social, economic, and environmental impact.
Guiding Principles
Our guiding principles define who we strive to be, inform our business decisions, and enable us to achieve our mission. Our guiding principles are:
We commit to our craft.
Our work has the power to change lives. That’s why we strive to continuously learn and excel at what we do.
We minimize waste.
Time, resources, and energy are precious, so we focus only on what will have the greatest impact.
We embrace differences.
Diverse teams are stronger, and inclusive cultures are more resilient. When we seek out different perspectives, we make better decisions and build better products.
We dig deeper.
The best solutions to meaningful challenges are rarely easy or obvious. We stay curious, balance our intuition with insights, and decide with confidence.
We lead with optimism.
We believe in our mission, and we believe in each other. We see the world as it is, set ambitious goals, and inspire one another with generosity of spirit. Together, we reimagine what’s possible.
14
Our Team
We pride ourselves on our action-oriented, values-based, and purpose-driven work culture. Etsy’s employees work hard to bring innovative ideas and energy every day to strengthen the experience for sellers and buyers on Etsy.com. As of
December 31, 2018
, we had
874
employees worldwide, with
545
employees located in our headquarters in Brooklyn, New York. Of those employees, we had
318
in engineering,
121
in product,
162
in member operations,
112
in marketing, and
161
in facilities, IT, and other corporate teams.
We focus on maximizing our employees’ engagement, and their professional and personal well-being.
In July 2018, Etsy conducted an engagement survey of all global employees and seventy percent of respondents reported favorable employee engagement.
We believe employee engagement comes from fulfilling work focused on serving the needs of our sellers and buyers and from ample personal and professional growth opportunities. We use the results of our engagement survey guide the development of more dynamic programs that build knowledge and skills and build connectedness between employees.
We also offer our employees paid time off to volunteer so that they can support the causes and organizations they are passionate about. In 2016, we introduced a 26-week gender-blind parental leave policy that is available to all Etsy employees globally. Through this policy we aim to support and enable parents to play equal roles in building successful companies and nurturing their families.
15
Our Impact Strategy and Progress
We believe that consumers are demanding more of the businesses they support and that the companies best positioned to succeed will build win-win solutions that are good for people, the planet, and profit. We are committed to growing sustainably by aligning our mission, guiding principles, and business strategy.
We have developed an impact strategy that reflects the positive economic, social, and environmental impact we want to have on the world while advancing and complementing our business strategy. Since announcing our impact strategy in 2017, we have updated some of our goals to be more specific, measurable, and time bound. We expect to continue to evolve our impact strategy in the future as our impact work matures. We are pleased to share our progress as we execute on this strategy, and we will continue to report our results transparently as it relates to our impact goals.
|
Economic Impact:
Make creative entrepreneurship a path to economic security and personal empowerment
|
||
|
2018 GOALS
|
2018 PROGRESS
|
2019 GOALS
|
|
Ensure the economic opportunities Etsy creates meaningfully benefit a broad swath of our seller community
|
Commissioned Etsy’s first economic impact study with ECONorthwest, an independent economic consulting firm, to explore the ways Etsy sellers in the United States contribute to the national economic landscape. We found that in 2018, Etsy sellers:
- Contributed $5.37 billion to the U.S. economy, more than double their direct business sales;
- Created 1.52 million jobs in the independent worker economy, enough jobs to employ the entire city of San Antonio;
- Generated more than $1.76 billion in income; and,
- Produced $3 billion in additional economic value by harnessing their creativity and bringing unique products to market.
|
Double U.S. Etsy sellers’ economic output by 2023
|
|
Foster economic security and personal empowerment for creative entrepreneurs through charitable and in-kind contributions
|
Invested $280K in programs and initiatives that enable creative entrepreneurship, and support Etsy sellers on their paths to economic security and personal empowerment.
—
Collectively, Etsy employees donated over 2,700 hours of volunteer time in their communities through Etsy’s Volunteer Time Off program.
|
Invest in social programs that foster economic security and personal empowerment for our stakeholders
|
|
Advance public policies that increase economic security and reduce administrative burdens for creative entrepreneurs
|
Continued to prioritize seller issues, including tax burdens, financial security and championing micro-business more broadly in our key markets.
—
Focused on policy solutions that help to grow the creative economy, advocating for net neutrality and internet sales tax policy. Etsy sellers generated over 140,000 messages to policymakers on these issues.
|
Advance public policies that increase economic security and reduce administrative burdens for creative entrepreneurs
|
16
|
Social Impact:
Enable equitable access to the opportunities that we create
|
||
|
2018 GOALS
|
2018 PROGRESS
|
2019 GOALS
|
|
Meaningfully increase representation of underrepresented groups and ensure equity in Etsy’s workforce
|
Increased our targeted recruiting efforts, created hiring guidelines to ensure that all candidates are evaluated fairly and with objective criteria, and implemented a more formal company-wide performance management process to support consistent and fair evaluations. As a result, female engineers now make up 33.2% of our engineering workforce at Etsy, up 4% from the prior year.
—
Commissioned a pay equity study using a third party consulting firm which revealed no influence of age, race, or gender in Etsy’s pay practices.
—
Ramped up our targeted recruitment efforts by focusing on growing our employer brand awareness and maximizing our presence at industry conferences and events.
—
Focused on growing our strategic and data-driven recruiting efforts, launching employee mentorship and sponsorship programs, tracking our diversity & inclusion efforts through recruiting, hiring, survey, and exit interview data.
|
Approximately double the percentage of Black and Latinx employees in Etsy’s workforce by 2023
|
|
Build a diverse, equitable, and sustainable supply chain to support our operations and bring value to both Etsy and our vendors
|
Updated Etsy’s supplier code of conduct to highlight the importance of progressive social, environmental, and economic business practices.
—
Incorporated priority questions into our vendor compliance screening tool in order to develop a comprehensive baseline of our supply chain impact.
|
Build a diverse, equitable, and sustainable supply chain to support our operations and bring value to both Etsy and our vendors
|
|
Increase the presence of underrepresented populations within the Etsy seller community
|
Undertook research to understand and address barriers and activate opportunities for underrepresented populations within the Etsy seller community.
—
In 2019, we plan to continue investing in this stream of work, embedding our insights into our product, expanding to focus on both our buyers and our sellers, and building an inviting and inclusive user experience.
|
Make Etsy a more inclusive and welcoming marketplace for people from underrepresented backgrounds
|
17
|
Ecological Impact:
Build long-term resilience by eliminating our carbon impacts and fostering responsible resource use
|
||
|
2018 GOALS
|
2018 PROGRESS
|
2019 GOALS
|
|
Utilize and source energy responsibly so that we can power our operations with 100% renewable electricity by 2020 and reduce the intensity of our energy use by 25% by 2025
|
Procured 58% of our electricity from renewable sources, up from 30% in 2017.
—
Entered into a virtual power purchase agreement for solar energy to help us meet our goal of powering our operations with 100% renewable electricity by 2020.
—
Began transition to cloud computing to help reduce our energy consumption and selected Google Cloud Platform, a partner that shares our commitment to 100% renewable electricity.
—
In 2018, our colocated data centers accounted for 68% of total energy consumed, or 7,330 MWh. Due to data availability challenges, our current energy footprint is not inclusive of cloud computing, but does include our colocated data centers. In 2019, we will continue to explore how to accurately quantify our cloud energy footprint, and how to activate levers of change to drive further efficiencies in computing.
—
Achieved a 25% reduction in energy intensity (kWh per square foot) across our office operations based on a 2016 baseline, and an associated 15% reduction in carbon intensity across office operations (tCO2e per square foot).
|
Utilize and source energy responsibly so that we can power our operations with 100% renewable electricity by 2020 and reduce the intensity of our energy use by 25% by 2025
|
|
In 2018, develop a plan and set a goal to mitigate the carbon impacts of our marketplace that aligns with business growth
|
Developed a strategy to mitigate the carbon impacts of our marketplace which includes taking immediate action to balance our footprint:
- In February 2019, we announced that we will offset 100% of our emissions from shipping through investment in verified emissions reductions, and,
- We plan to activate levers of change that will help to drive carbon reduction in the long term, including policy advocacy, vendor negotiation and peer collaboration.
|
Mitigate the ecological impact of our marketplace by offering carbon neutral shipping on 100% of transactions by 2020
|
|
Run zero waste operations by 2020
|
Diverted 95% of waste from global operations from landfill or incineration, up from 87% in 2017.
|
Run zero waste operations by 2020
|
18
Etsy’s mission to “Keep Commerce Human” means that we celebrate the uniqueness, authenticity, and richness of the human experience. Our diversity & inclusion efforts are integral to who we are as a company; namely, one that is in the business of servicing and celebrating the vibrant spectrum of unique and special qualities people possess.
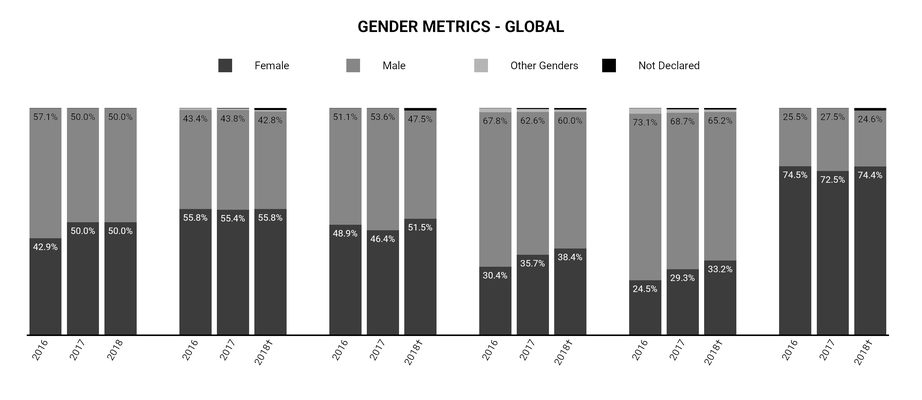
We are committed to reporting transparently on workforce diversity at Etsy. All metrics below are as of December 31 of the stated year. Leadership is defined as Director level and above. Tech employees are defined as those employees who work on Product, Engineering, Analytics and HR Information and Financial Systems Administration teams. Other business roles are defined as those employees who work in roles outside of the Tech definition, and is inclusive of non-tech Leadership positions. Gender and age metrics represent Etsy’s global employee base, while race and ethnicity metrics represent U.S. employees only.
|
Board
|
Overall
|
Leadership
|
Tech
|
Engineering
|
Other Business Roles
|
†
Etsy commissioned an external third party to perform attest procedures with respect to our diversity metrics for the period from January 1, 2018 to December 31, 2018.
19
|
RACE & ETHNICITY METRICS - U.S. ONLY
|
||||||||||||||||||||||||||||||
|
Overall
|
Leadership
|
Tech
|
Engineering
|
Other Business Roles
|
||||||||||||||||||||||||||
|
2016
|
|
2017
|
|
2018†
|
|
2016
|
|
2017
|
|
2018†
|
|
2016
|
|
2017
|
|
2018†
|
|
2016
|
|
2017
|
|
2018†
|
|
2016
|
|
2017
|
|
2018†
|
|
|
|
American Indian or Alaska Native
|
—
|
%
|
0.2
|
%
|
0.1
|
%
|
—
|
%
|
—
|
%
|
—
|
%
|
—
|
%
|
—
|
%
|
—
|
%
|
—
|
%
|
—
|
%
|
—
|
%
|
—
|
%
|
0.3
|
%
|
0.3
|
%
|
|
Asian
|
13.2
|
%
|
13.9
|
%
|
16.5
|
%
|
11.4
|
%
|
16.9
|
%
|
19.3
|
%
|
18.0
|
%
|
20.9
|
%
|
22.6
|
%
|
17.7
|
%
|
20.4
|
%
|
21.9
|
%
|
9.0
|
%
|
7.0
|
%
|
8.5
|
%
|
|
Black/African American
|
3.9
|
%
|
4.4
|
%
|
3.7
|
%
|
2.5
|
%
|
3.4
|
%
|
3.4
|
%
|
3.2
|
%
|
3.3
|
%
|
2.6
|
%
|
3.3
|
%
|
4.2
|
%
|
3.2
|
%
|
4.5
|
%
|
5.4
|
%
|
5.5
|
%
|
|
Hispanic
|
4.1
|
%
|
4.1
|
%
|
4.8
|
%
|
1.3
|
%
|
1.7
|
%
|
—
|
%
|
4.4
|
%
|
4.5
|
%
|
4.7
|
%
|
3.9
|
%
|
4.2
|
%
|
5.1
|
%
|
3.6
|
%
|
3.8
|
%
|
5.2
|
%
|
|
Two or More Races
|
3.5
|
%
|
2.7
|
%
|
2.8
|
%
|
5.1
|
%
|
5.1
|
%
|
2.3
|
%
|
4.2
|
%
|
2.1
|
%
|
3.0
|
%
|
4.6
|
%
|
2.0
|
%
|
3.2
|
%
|
2.9
|
%
|
3.5
|
%
|
2.7
|
%
|
|
White
|
73.9
|
%
|
71.8
|
%
|
67.0
|
%
|
78.5
|
%
|
72.9
|
%
|
75.0
|
%
|
68.4
|
%
|
65.6
|
%
|
60.8
|
%
|
68.9
|
%
|
65.0
|
%
|
60.8
|
%
|
78.6
|
%
|
78.1
|
%
|
74.8
|
%
|
|
Not Declared
|
1.4
|
%
|
2.9
|
%
|
5.1
|
%
|
1.2
|
%
|
—
|
%
|
—
|
%
|
1.8
|
%
|
3.6
|
%
|
6.3
|
%
|
1.6
|
%
|
4.2
|
%
|
5.8
|
%
|
1.4
|
%
|
1.9
|
%
|
3.0
|
%
|
|
AGE METRICS - GLOBAL
|
||||||
|
2016
|
|
2017
|
|
2018†
|
|
|
|
24 years and younger
|
5.7
|
%
|
4.2
|
%
|
5.3
|
%
|
|
25-29 years
|
29.2
|
%
|
28.4
|
%
|
27.9
|
%
|
|
30-34 years
|
35.8
|
%
|
34.1
|
%
|
32.2
|
%
|
|
35-39 years
|
19.0
|
%
|
21.2
|
%
|
20.8
|
%
|
|
40-49 years
|
8.3
|
%
|
9.4
|
%
|
11.1
|
%
|
|
50+ years
|
1.9
|
%
|
2.7
|
%
|
2.7
|
%
|
†
Etsy commissioned an external third party to perform attest procedures with respect to our diversity metrics for the period from January 1, 2018 to December 31, 2018.
20
SASB Disclosure
The Sustainability Accounting Standards Board’s (SASB) mission is to develop sustainability metrics for public corporations to disclose material, decision-useful information to investors. Etsy supports work that contributes directly to generating comparable and consistent data. We have considered SASB’s Consumer Goods Sector – E-Commerce industry standard and have provided key details below.
|
SASB Metrics
|
||||||||
|
SASB Code
|
Metric
|
2016
|
|
2017
|
|
2018
|
|
|
|
CG-EC-000.A
|
Entity-defined measure of user activity
|
Active buyers (thousands)
|
28,566
|
|
33,364
|
|
39,447
|
|
|
Active sellers (thousands)
|
1,748
|
|
1,933
|
|
2,115
|
|
||
|
CG-EC-000.B
|
Data processing capacity
|
In December 2017, we announced our Google Cloud Partnership, an initiative that will transition our infrastructure to the Google Cloud Platform. We are currently in the process of migrating our colocated data centers to Google Cloud. In 2018, we successfully migrated our website and mobile apps to the platform, and we expect to complete the migration by the beginning of 2020.
|
||||||
|
Percentage outsourced
|
100
|
%
|
100
|
%
|
100
|
%
|
||
|
Hardware Infrastructure Energy & Water Management
|
||||||||
|
CG-EC-130a.1
|
Total energy consumed, MWh
|
6,155
|
|
7,111
|
|
7,330
|
|
|
|
Percentage renewable energy
|
—
|
%
|
32
|
%
|
65
|
%
|
||
|
Percentage grid electricity
|
100
|
%
|
100
|
%
|
100
|
%
|
||
|
CG-EC-130.a
|
Discussion of the integration of environmental considerations into strategic planning for data center needs.
Etsy’s goals include powering our operations with 100% renewable electricity by 2020, and reducing the intensity of our energy use by 25% by 2025. These goals are included as key considerations as we plan for our computing needs, and have been a focus of our sustainability efforts. When transitioning to a cloud computing infrastructure, we selected Google Cloud Platform, a partner that shares our commitment to 100% renewable electricity. Their highly efficient data centers are expected to help us save significant energy. Moreover, moving to flexible cloud-based infrastructure should enable us to reduce major idle time and associated energy consumption.
In 2018, Etsy entered into a virtual power purchase agreement for solar energy in Virginia. Once operational, this project is expected to provide us with renewable attributes to apply to our operations and computing infrastructure, furthering our goals of creating a cleaner internet and reducing our impact on the planet. We actively monitor and manage energy consumption from our computing infrastructure. In 2018, our colocated data centers accounted for 68% of total energy consumed, or 7330 MWh.
|
|||||||
|
Data Privacy and Advertising Standards
|
||||||||
|
CG-EC-220a.2
|
Description of the policies and practices relating to behavioral advertising and user privacy
. We care deeply about privacy and we’re committed to being upfront about our privacy practices, including how we treat personal information. Etsy’s Privacy Policy provides a detailed explanation of our privacy practices. Among other things, our Privacy Policy covers the user information that Etsy collects or receives, the choices and control that a user has in relation to this data including based on type and sensitivity, the purpose for which Etsy uses such information (including first and third party advertising purposes), our policies relating to our usage and sharing within Etsy and its affiliates, and user controls for sharing and controlling such information with third parties.
|
|||||||
|
Data Security
|
||||||||
|
CG-EC-230a.1
|
Description of approach to identifying and addressing data security risks.
Data security is overseen by our Chief Information Security Officer who reports to our Chief Technical Officer. We strive to protect sensitive information through various means, such as technical safeguards, procedural requirements and policies, an intensive program of monitoring on both our web platform and within our corporate network, continuous testing of aspects of our security posture internally and with outside vendors, a robust incident response program, and regular training for employees.
|
|||||||
|
Employee Recruitment, Inclusion and Performance
|
||||||||
|
CG-EC-330a.1
|
Employee engagement as a percentage
|
80
|
%
|
60
|
%
|
70
|
%
|
|
|
Employee engagement as a percentage and discussion of methodology.
In July 2018, Etsy conducted an engagement survey of all global employees. Of employees surveyed, 82% submitted a response. The survey was conducted through the Culture Amp platform and consisted of 48 questions - 45 rating questions on which employees were asked to indicate their level of agreement with a statement based on a five-point scale from Strongly Agree to Strongly Disagree, and three free-text questions to which employees were asked to write out a response. The responses were analyzed against the results from a similar survey conducted in 2017, as well as Culture Amp's 2018 New Tech - 500+ Benchmark, which consists of survey results from companies that are primarily internet-based or focused on creating new technologies, and that have between 500 and 5,000 employees.
|
||||||||
|
CG-EC-330a.3
|
Gender and racial/ethnic group representation for leadership, technical staff and other business functions
|
See Impact Strategy section for detailed metrics.
|
||||||
|
Discussion of diversity and inclusion strategy and performance
|
See Impact Strategy - Social Impact for details.
|
|||||||
|
CG-EC-330a.4
|
Percentage of technical employees who are H-1B visa holders
|
2.5
|
%
|
|||||
21
|
SASB Metrics
|
||||||||
|
SASB Code
|
Metric
|
2016
|
|
2017
|
|
2018
|
|
|
|
Product Packaging and Distribution
|
||||||||
|
CG-EC-410a.1
|
Total greenhouse gas (GHG) footprint of product shipments in metric tons CO
2
e
|
103,646
|
‡
|
118,153
|
‡
|
135,459
|
†
|
|
|
CG-EC-410a.2
|
Discussion of strategies to reduce the environmental impact of product delivery.
The delivery of products sold on our marketplace represents the majority of Etsy’s carbon footprint. As a peer-to-peer marketplace, Etsy does not directly control seller shipping or the associated logistics networks, however, we are committed to addressing carbon emissions from shipping. We have identified a number of levers that we expect to help to drive carbon reduction in the long term, including policy advocacy, vendor negotiation, and peer collaboration. In the near term, Etsy recognizes the need to act on climate change and we are taking immediate action to help balance our footprint. In 2019, we are committing to offset 100% of our emissions from shipping through investments in verified emissions reductions.
|
|||||||
|
Greenhouse Gas (“GHG”) Emissions Summary
(tCO
2
e)
|
2016
|
|
2017
|
|
2018
|
|
|
GHG Emissions by Scope
|
||||||
|
Scope 1
|
410
|
‡
|
467
|
‡
|
372
|
†
|
|
Scope 2 - Market
|
2,946
|
‡
|
2,209
|
‡
|
1,213
|
†
|
|
Scope 2 - Location
|
3,076
|
‡
|
3,152
|
‡
|
2,923
|
†
|
|
Scope 3
|
105,295
|
|
119,444
|
|
137,042
|
|
|
Scope 3 GHG Emissions by Activity Source
|
||||||
|
Shipping
|
103,646
|
‡
|
118,153
|
‡
|
135,459
|
†
|
|
Air Travel
|
967
|
‡
|
550
|
‡
|
943
|
†
|
|
Commuting
|
597
|
|
663
|
|
544
|
|
|
Remote Workers
|
49
|
|
64
|
|
87
|
|
|
Waste
|
18
|
|
7
|
|
6
|
|
|
Water
|
9
|
|
4
|
|
3
|
|
|
Electricity, Transmission and Distribution Losses
|
9
|
|
3
|
|
<1
|
|
†
Etsy commissioned an external third party to perform attest procedures with respect to our carbon and energy metrics for the period from January 1, 2018 to December 31, 2018. Full details and data methodology are available at investors.etsy.com.
‡
Metrics for which historical data has also been subject to previous attest procedures.
22
Competition
We compete for Etsy sellers with both retailers and companies that sell software to small businesses. An Etsy seller can list her goods for sale with online retailers or sell her goods through local consignment and vintage stores and other venues and marketplaces, including through commerce channels on social networks like Facebook and Instagram. She may also sell wholesale directly to traditional retailers, including large national retailers, who discover her goods in our marketplace or otherwise. We also compete with companies that sell software and services to small businesses, enabling an Etsy seller to sell from her own website or otherwise run her business independently of our platform. We are able to compete for Etsy sellers based on our brand awareness, the global scale of our marketplace and the breadth of our online presence, the number and engagement of Etsy buyers, our seller tools and services, our seller education resources, our policies and fees, our mobile apps, the strength of our community, and our values.
We also compete with retailers for the attention of the Etsy buyer. An Etsy buyer has the choice of shopping with any online or offline retailer, whether large marketplaces or national retail chains or local consignment and vintage stores or other venues or marketplaces. We are able to compete for Etsy buyers based on the unique goods that Etsy sellers list in our marketplace, our brand awareness, the person-to-person commerce experience, customer service, our reputation as a trusted marketplace, our mobile apps, the availability of fair and free shipping offered by Etsy sellers, ease of payment, and the availability and reliability of our platform.
Intellectual Property
Protection of our technology and intellectual property is an important component of our success. We rely on intellectual property laws, including patent, trade secret, copyright, and trademark laws, in the United States and abroad. We also use confidentiality procedures, defensive licensing and acquisitions, non-disclosure agreements, invention assignment agreements, and other contractual rights to protect Etsy and our intellectual property.
We file patents and register domain names, trademarks, copyrights, and service marks in the United States and abroad. We rely upon unregistered copyrights and common law protection for certain trademarks. We also use internal and external brand protection mechanisms that are intended to protect Etsy’s brand from misuse by third parties.
Government Regulation
As with any company operating on the internet, we are subject to a growing number of local, national, and international laws and regulations. These laws are often complex, sometimes contradict other laws, and are frequently changing. Laws may be interpreted and enforced in different ways in various locations around the world, posing a significant challenge to our global business. For example, U.S. federal and state laws, E.U. directives, and other national laws govern the processing of payments, consumer protection, and the privacy of consumer information; other laws define and regulate unfair and deceptive trade practices. Still other laws dictate when and how sales or other taxes must be collected. Laws of defamation apply online and vary by country. The growing regulation of e-commerce worldwide could impose additional compliance burdens and costs on us or on Etsy sellers and could subject us to significant liability for any failure to comply. Additionally, because we operate internationally, we need to comply with various laws associated with doing business outside of the United States, including anti-money laundering, sanctions, anti-corruption, and export control laws.
23
Available Information
We are subject to the informational requirements of the Securities Exchange Act of 1934, as amended, (“the Exchange Act”), and file or furnish reports, proxy statements and other information with the Securities and Exchange Commission, (the “SEC”). Our Annual Report on Form 10-K, Quarterly Reports on Form 10-Q, Current Reports on Form 8-K, and amendments to these reports are available free of charge on our website at investors.etsy.com as soon as reasonably practicable after we have filed or furnished them to the SEC. The information on our website is not incorporated into this Annual Report and investors should not rely on such information in deciding whether to invest in our common stock. Copies of our SEC reports and other documents are also available, without charge, by sending a letter to Investor Relations, Etsy, Inc., 117 Adams Street, Brooklyn, NY 11201, by sending an email to ir@etsy.com or by calling (347) 382-7582.
Our SEC reports are also available on the SEC’s website at www.sec.gov free of charge as soon as reasonably practicable after we have filed or furnished them to the SEC. For information regarding classes of products or services that accounted for 10% or more of consolidated revenue in the last three fiscal years, see “
Management
’
s Discussion and Analysis of Financial Condition and Results of Operations
—
Results of Operations
.”
24
Item 1A.
Risk Factors
.
Investing in our common stock involves a high degree of risk. You should consider carefully the risks and uncertainties described below, our Consolidated Financial Statements and related notes, and the other information in this
Annual
Report on Form
10-K
. If any of these risks actually occur, our business, financial condition, results of operations, and prospects could be adversely affected. As a result, the price of our common stock could decline and you could lose part or all of your investment.
Risks Related to Our Business and Industry
Our quarterly operating results may fluctuate, which could cause our stock price to decline.
Our quarterly operating results, as well as our key metrics, may fluctuate for a variety of reasons, many of which are beyond our control, including:
|
•
|
fluctuations in revenue generated from Etsy sellers on our platform, including as a result of the seasonality of market transactions, and Etsy sellers’ use of services;
|
|
•
|
our ability to convert visits to Etsy.com into sales for our sellers;
|
|
•
|
the amount and timing of our operating expenses;
|
|
•
|
our success in attracting and retaining Etsy sellers and Etsy buyers;
|
|
•
|
our success in executing on our strategy and the impact of any changes in our strategy;
|
|
•
|
the timing and success of product launches, including new services and features we may introduce;
|
|
•
|
the success of our marketing efforts;
|
|
•
|
economic and market conditions, such as currency fluctuations and global events;
|
|
•
|
disruptions or defects in our marketplace, such as privacy or data security breaches or other incidents that impact the reliability of our platform;
|
|
•
|
the impact of competitive developments and our response to those developments;
|
|
•
|
our ability to manage our existing business and future growth;
|
|
•
|
our ability to recruit and retain employees; and
|
|
•
|
the impact of our revised global corporate structure that was implemented on January 1, 2015.
|
Fluctuations in our quarterly operating results and key metrics may cause those results to fall below our financial guidance or other projections, or the expectations of analysts or investors, which could cause the price of our common stock to decline. Fluctuations in our results could also cause a number of other problems. For example, analysts or investors might change their models for valuing our common stock, we could experience short-term liquidity issues, our ability to retain or attract key personnel may diminish, and other unanticipated issues may arise.
In addition, we believe that our quarterly operating results and key metrics may vary in the future and that period-to-period comparisons of our operating results may not be meaningful. For example, our overall historical growth rate may have overshadowed the effect of seasonal variations on our historical operating results. These seasonal effects may become more pronounced over time, which could also cause our operating results and key metrics to fluctuate. You should not rely on the results of one quarter as an indication of future performance.
If we are unable to successfully execute on our business strategy or if our strategy proves to be ineffective, our business, financial performance and growth could be adversely affected.
Our ability to execute our strategy is dependent on a number of factors, including the ability of our senior management team and key team leaders to execute our strategy, our ability to maintain our pace of product experiments coupled with the success of such initiatives and introduce offerings that meet the changing needs of our sellers and buyers, and the ability of our employees to perform at a high-level. If we are unable to execute our strategy, if our strategy does not drive the growth that we
25
anticipate, or if our market opportunity is not as large as we have estimated, it could adversely affect our business, financial performance and growth.
Our business, financial performance and growth depends on our ability to attract and retain an active and engaged community of Etsy buyers and Etsy sellers.
Our financial performance has been and will continue to be significantly determined by our success in attracting and retaining active buyers and active sellers. For example, our revenue is driven by the number of the number of active buyers and buyer engagement, as well as active sellers and seller engagement. We must encourage buyers to return to Etsy and purchase items in our marketplace more frequently. We must also continue to encourage Etsy sellers to list items for sale and use our services.
We believe that many new Etsy buyers and Etsy Sellers find Etsy by word of mouth and other non-paid referrals from existing Etsy buyers and Etsy Sellers. If existing Etsy buyers do not find our platform appealing, whether because of a negative experience, lack of competitive shipping costs, inadequate customer service, lack of buyer-friendly features, declining interest in the nature of the goods offered by Etsy sellers, or other factors, they may make fewer purchases and they may stop referring others to us. Likewise, if existing Etsy sellers are dissatisfied with their experience on our platform, they may stop listing items in our marketplace and using our services and may stop referring others to us. Under any of these circumstances, we may have difficulty attracting new Etsy buyers and Etsy sellers without incurring additional expense.
Our GMS and revenue is concentrated in our most active buyers and sellers. If we lose those buyers and sellers, our financial performance and growth could be harmed. Even if we are able to attract new Etsy buyers and Etsy sellers to replace the ones that we lose, they may not maintain the same level of activity, and the GMS and revenue generated from new Etsy buyers and Etsy sellers may not be as high as the GMS and revenue generated from the ones who leave our marketplace. If we are unable to retain existing Etsy buyers and Etsy sellers and attract new Etsy buyers and Etsy sellers who contribute to an active community, our business, financial performance, and growth would be harmed.
Additionally, the demand for the goods listed in our marketplace is dependent on consumer preferences which can change quickly and may differ across generations and cultures. If demand for the goods that Etsy sellers offer declines, we may not be able to attract and retain Etsy buyers and our business would be harmed. Trends in socially-conscious consumerism and buying unique rather than mass produced goods could also shift or slow which would make it more difficult to attract new Etsy buyers and Etsy sellers. Our growth would also be harmed if the shift to ecommerce does not continue.
We have a history of losses and we may not achieve or maintain profitability in the future.
We generated net income of
$77.5 million
and
$81.8 million
and incurred a net loss of
$29.9 million
for the
years ended December 31, 2018, 2017, and 2016
, respectively. We may not maintain profitability in the future. Our costs may increase as we continue to invest in the development of our platform, including our services and technological enhancements, and increase our marketing efforts, expand our operations, and hire additional employees. These efforts may be more costly than we expect and our revenue may not increase sufficiently to offset these additional expenses. In addition, our revenue may decline for a number of reasons, including those described elsewhere in these Risk Factors.
Further, our revenue growth rate may decelerate in the future for a number of reasons, including the deceleration of our GMS growth rate. For further information about the rate of revenue and GMS growth, see “
Management
’
s Discussion and Analysis of Financial Condition and Results of Operations
—
Results of Operations
—
Revenue
.” You should not rely on growth rates of prior periods as an indication of our future performance.
Our business could be adversely affected by economic downturns, natural disasters, public health crises, political crises or other unexpected events.
Macroeconomic conditions may adversely affect our business. If general economic conditions deteriorate in the United States or other markets where we operate, consumer discretionary spending may decline and demand for the goods and services available in our platform may be reduced. This would cause our Marketplace and Services revenue to decline and adversely impact our business. Conversely, if recent trends supporting self-employment and the desire for supplemental income were to reverse, the number of Etsy sellers offering their goods in our marketplace could decline and the number of goods listed in our marketplace could decline. In addition, currency exchange rates may directly and indirectly impact our business. For example, continued uncertainty around the United Kingdom’s decision to exit the European Union, or E.U., commonly referred to as Brexit, may result in future exchange rate volatility, which may strengthen the U.S. dollar against foreign currencies. If the U.S. dollar strengthens against foreign currencies, our translation of foreign currency denominated GMS and revenue will result in lower U.S. denominated GMS and revenue. Currency exchange rates may also dampen demand from buyers outside the United
26
States for goods denominated in U.S. dollars, which could impact GMS and revenue. For
the year ended December 31, 2018
, approximately
83%
of our GMS was denominated in U.S. dollars.
Natural disasters and other adverse weather and climate conditions, public health crises, political instability or crises, terrorist attacks, war, or other unexpected events, could disrupt our operations, internet or mobile networks, or the operations of one or more of our third-party service providers. Certain events, such as hurricanes and other natural disasters and political instability, are likely to impact buyer behavior for discretionary goods and sellers’ ability to run their businesses on our marketplace and ship their goods. These kinds of events may also impact consumer perceptions of well-being and security, which may adversely impact consumer discretionary spending. If any of these events occurs, our business could be adversely affected.
Our ability to recruit and retain employees is important to our success.
Our ability to attract, retain, and motivate employees, including our management team, is important to our success. We strive to attract, retain, and motivate employees, from our office administrators to our management team, who share our dedication to our community and our mission to “Keep Commerce Human.” We cannot guarantee we will continue to attract and retain the number or caliber of employees we need to maintain our competitive position.
Some of the challenges we face in attracting and retaining employees include:
|
•
|
perceived uncertainties as to our commitment to our mission, guiding principles and culture;
|
|
•
|
skepticism regarding our ability to continue to accelerate GMS growth in the future;
|
|
•
|
continuing to offer competitive compensation and benefits;
|
|
•
|
enhancing engagement levels among existing employees and supporting their work-life balance;
|
|
•
|
attracting and retaining qualified employees who support our mission and guiding principles;
|
|
•
|
promotion opportunities for employees into leadership positions ;
|
|
•
|
hiring employees in multiple locations globally; and
|
|
•
|
responding to competitive pressures and changing business conditions in ways that do not divert us from our guiding principles.
|
Filling engineering, product management, and other technical positions, particularly in New York City and San Francisco, is challenging. Qualified individuals are limited and in high demand, and we may incur significant costs to attract, develop, and motivate them. Even if we were to offer higher compensation and other benefits, people with suitable technical skills may choose not to join us or to continue to work for us. In addition, job candidates and existing employees often consider the value of the stock awards they receive in connection with their employment. If the perceived value of our stock awards declines, it may adversely affect our ability to recruit and retain highly skilled employees.
In general, our employees, including our management team, work for us on an at-will basis. The unexpected loss of or failure to retain one or more of our key employees, such as our Chief Executive Officer, Chief Financial Officer or Chief Technology Officer, or unsuccessful succession planning, could adversely affect our business. Other companies, including our competitors, may be successful in recruiting and hiring our employees, and it may be difficult for us to find suitable replacements on a timely basis or on competitive terms.
If we experience increased voluntary attrition in the future and if we are unable to attract and retain qualified employees, particularly in critical areas of operations such as engineering, we may not achieve our strategic goals and our business and operations could be harmed.
The trustworthiness of our marketplace and the connections within our community are important to our success. If we are unable to maintain them, our ability to attract and retain Etsy sellers and Etsy buyers could suffer.
We have built a trusted marketplace that embodies our values-based culture and continue to focus on ensuring that we deliver trust and reliability throughout the buyer experience on Etsy.com. Our reputation depends upon our Etsy sellers, their unique offerings and their adherence to our policies.
27
The trustworthiness of our marketplace and the connections among the members of our community are the cornerstones of our business. Many things could undermine these cornerstones, such as:
|
•
|
complaints or negative publicity about us, our platform or our policies and guidelines, even if factually incorrect or based on isolated incidents;
|
|
•
|
an inability to gain the trust of prospective buyers;
|
|
•
|
disruptions or defects in our marketplace, such as the increased pace of product experimentation, privacy or data security breaches, website outages, payment disruptions or other incidents that impact the reliability of our platform;
|
|
•
|
lack of awareness of our policies or confusion about how they are applied;
|
|
•
|
changes to our policies that members of our community perceive as inconsistent with their best interests or our mission, or that are not clearly articulated;
|
|
•
|
inadequacies in our terms of use;
|
|
•
|
a failure to enforce our policies effectively, fairly and transparently, including, for example, by allowing the widespread listing of prohibited items in our marketplace;
|
|
•
|
inadequate or unsatisfactory customer service experiences;
|
|
•
|
a failure to respond to feedback from our community; or
|
|
•
|
a failure to operate our business in a way that is consistent with our guiding principles and mission.
|
In particular, we are focused on enhancing customer service for Etsy sellers and Etsy buyers and have migrated our legacy support platform to a new third-party customer service platform. We plan to introduce new customer service features and tools to support a positive user experience on our platform. If our efforts to enhance customer service are unsuccessful or if our new customer service platform fails to meet our needs, we may need to invest additional resources in customer service and our ability to maintain a trustworthy marketplace could be harmed.
If we are unable to maintain a trustworthy marketplace and encourage connections among members of our community, then our ability to attract and retain Etsy sellers and Etsy buyers could be impaired and our reputation and business could be adversely affected.
If we are not able to keep pace with technological changes and enhance our current offerings and develop new offerings to respond to the changing needs of Etsy sellers and Etsy buyers, our business, financial performance and growth may be harmed.
Our industry is characterized by rapidly changing technology, new service and product introductions, and changing customer demands and we are not able to predict the effect of these changes on our business. The technologies that we currently use to support our platform may become inadequate or obsolete and the cost of incorporating new technologies into our products and services may be substantial. We strive to respond to evolving customer needs and regularly launch new products, features and services including, for example, our recently announced seller subscription packages and tools. Etsy sellers and Etsy buyers, however, may not be satisfied with our enhancements or new offerings or may perceive that these offerings do not respond to their needs or create value for them. Additionally, as we experiment with new offerings or changes to our platform, Etsy sellers and Etsy buyers may find these changes to be disruptive and may perceive them negatively. In addition, developing new services and features is complex, and the timetable for public launch is difficult to predict and may vary from our historical experience. As a result, the introduction of new offerings may occur after anticipated release dates or they may be introduced as pilot programs, which may not be continued for various reasons. In addition, new offerings may not be successful due to defects or errors, negative publicity, or our failure to market them effectively.
New offerings may not drive GMS or revenue growth, may require substantial investment and planning, and may bring us more directly into competition with companies that are better established or have greater resources than we do.
If we do not continue to cost-effectively develop new offerings that satisfy Etsy sellers and Etsy buyers, then our competitive position and growth prospects may be harmed. In addition, new offerings may have lower margins than existing offerings and our revenue from the new offerings may not be enough to offset the cost of developing them, which could adversely affect our business, financial performance and growth.
28
Our marketing efforts to help grow our business may not be effective.
Maintaining and promoting awareness of our marketplace and services is important to our ability to attract and retain Etsy sellers and Etsy buyers. One of the key parts of our strategy is to create more habitual buyers by inspiring purchases across multiple categories and special occasions. In addition, one of the primary goals of our 2018 pricing increase was to enable us to make further investments in marketing designed to attract more buyers to Etsy. Generating a meaningful return on our investments in marketing initiatives, however, may be difficult, particularly as we anticipate that our marketing investments will be more speculative in the future. In addition, there can be no assurance that we will deploy additional funds resulting from our 2018 pricing increase effectively.
The marketing efforts we implement may not succeed for a variety of reasons, including our inability to execute and implement our plans. External factors beyond our control may also impact the success of our marketing initiatives. Our primary marketing efforts currently include search engine optimization, search engine marketing, affiliate marketing and display advertising, as well as, social media, mobile push notifications, and email. Additionally, we have begun experimenting with television and digital video advertising. We obtain a significant number of visits via search engines such as Google. Search engines frequently change the algorithms that determine the ranking and display of results of a user’s search and may make other changes to the way results are displayed, which can negatively affect the placement of links to our marketplace and, therefore, reduce the number of visits to our marketplace. In addition, search engines and other third-parties typically require compliance with their policies and procedures, which may be subject to change or new interpretation with limited ability to negotiate, which could negatively impact our marketing capabilities and GMS. The growing use of online ad-blocking software, including on mobile devices, may also impact the success of our marketing efforts because we may reach a smaller audience and fail to bring more Etsy buyers to our platform. In addition, ongoing privacy regulatory changes, such as the E.U. General Data Protection Regulation, may impact the scope and effectiveness of marketing and advertising services generally, including those used on our platform.
We also obtain a significant number of visits through email. If we are unable to successfully deliver emails to Etsy sellers and Etsy buyers, or if Etsy sellers and Etsy buyers do not open our emails, whether by choice, because those emails are marked as low priority or spam, or for other reasons, our business could be adversely affected. Social networking websites, such as Facebook and Pinterest, are another important source of visits to our marketplace. As ecommerce and social networking evolve, we must continue to evolve our marketing tactics accordingly and, if we are unable to do so, our business could be adversely affected.
If the mobile solutions available to Etsy sellers and Etsy buyers are not effective, the use of our marketplace could decline.
Purchases made on mobile devices by consumers, including Etsy buyers, have increased significantly in recent years. The smaller screen size and reduced functionality associated with some mobile devices may make the use of our platform more difficult or less appealing. Etsy sellers are also increasingly using mobile devices to operate their businesses on our platform. If we are not able to deliver a rewarding experience on mobile devices, Etsy sellers’ ability to manage and scale their businesses may be harmed and, consequently, our business may suffer. Further, although we strive to provide engaging mobile experiences for both Etsy sellers and Etsy buyers who visit our mobile website using a browser on their mobile device, we depend on Etsy sellers and Etsy buyers using our mobile apps for the optimal mobile experience. Mobile web conversion rate is about
half
the conversion rate on desktop and the conversion rate on our mobile Buy on Etsy app is about
1.2
x the desktop conversion rate. Therefore, if mobile web visits continue to grow as a percentage of overall visits, it could be a headwind to future conversion rate gains and result in less GMS and revenue for us.
As new mobile devices and mobile platforms are released, we may encounter problems in developing or supporting apps for them. In addition, supporting new devices and mobile device operating systems may require substantial time and resources.
The success of our mobile apps could also be harmed by factors outside our control, such as:
|
•
|
actions taken by providers of mobile operating systems or mobile app download stores;
|
|
•
|
unfavorable treatment received by our mobile apps, especially as compared to competing apps, such as the placement of our mobile apps in a mobile app download store;
|
|
•
|
increased costs to distribute or use our mobile apps; or
|
|
•
|
changes in mobile operating systems, such as iOS and Android, that degrade the functionality of our mobile website or mobile apps or that give preferential treatment to competitive products.
|
29
If Etsy sellers and Etsy buyers encounter difficulty accessing or using our platform on their mobile devices, or if they choose not to use our platform on their mobile devices, our business, financial performance, and growth may be adversely affected.
Expanding our community outside of the United States is part of our strategy and the growth of our business could be harmed if our expansion efforts do not succeed.
Our vision is both global and local and we are focused on growing our business outside of the United States.
Although we have a significant number of Etsy sellers and Etsy buyers outside of the United States, we are a U.S.-based company with less experience developing local markets outside the United States and may not execute our strategy successfully. Operating outside of the United States also requires significant management attention, including managing operations over a broad geographic area with varying cultural norms and customs, and adapting our platform to local markets.
Despite our execution efforts, the goods that Etsy sellers list on Etsy.com may not appeal to non-U.S. consumers in the same way as they do to consumers in the United States. In addition, non-U.S. buyers are not as familiar with the Etsy brand as buyers in the United States and may not perceive us as relevant or trustworthy. Also, visits to Etsy.com from Etsy buyers outside the United States may not convert into sales as often as visits from within the United States, including due to the impact of the strong U.S. dollar relative to other currencies and the fact that most of the goods listed on our platform are denominated in U.S. dollars.
Our ability to grow our international operations may also be adversely affected by any circumstances that reduce or hinder cross-border trade. For example, the shipping of goods cross-border is typically more expensive and slower than domestic shipping and often involves complex customs and duty inspections and the dependency of national postal carrier systems.
Our success outside the United States depends upon our ability to attract Etsy sellers and Etsy buyers from the same countries in order to enable the growth of local markets. If we are not able to expand outside of the United States successfully, our growth prospects could be harmed. An inability to develop Etsy’s community globally or to otherwise grow our business outside of the United States on a cost-effective basis could adversely affect our GMS, revenue, and operating results.
Competition is also likely to intensify outside of the United States, both where we operate now and where we plan to expand our operations. Local companies based outside the United States may have a substantial competitive advantage because of their greater understanding of, and focus on, their local markets. Some of our competitors may also be able to develop and grow internationally more quickly than we will.
Continued expansion outside of the United States may also require significant financial investment. For example, in June 2018, we announced a referral agreement with DaWanda, a German e-commerce marketplace, which encouraged the migration of DaWanda buyers and sellers to Etsy’s marketplace and helped expand Etsy’s presence in Central Europe. Etsy also made initial investments to explore growth opportunities in India, a dynamic market where we have limited operating experience. We plan to invest in seller and buyer acquisition marketing, enhancing our machine translation and machine learning to help sellers and buyers connect even if they do not speak the same language, forming relationships with third-party service providers, supporting operations in multiple countries, and potentially acquiring companies based outside the United States and integrating those companies with our operations. Our investment outside of the United States may be more costly than we expect or unsuccessful.
Further expansion outside of the United States will subject us to risks associated with operations abroad.
Doing business outside of the United States subjects us to increased risks and burdens such as:
|
•
|
complying with different (and sometimes conflicting) laws and regulatory standards (particularly including those related to the use and disclosure of personal information, online payments and money transmission, intellectual property, consumer protection, online platform liability and taxation of goods and services);
|
|
•
|
fluctuations of foreign exchange rates;
|
|
•
|
potentially heightened risk of fraudulent or other illegal transactions;
|
|
•
|
limitations on the repatriation of funds;
|
|
•
|
exposure to liabilities under anti-corruption, anti-money laundering and export control laws, including the U.S. Foreign Corrupt Practices Act of 1977, as amended, the U.K. Bribery Act of 2010, trade controls and sanctions administered by the U.S. Office of Foreign Assets Control, and similar laws and regulations in other jurisdictions;
|
30
|
•
|
varying levels of internet, e-commerce, and mobile technology adoption and infrastructure;
|
|
•
|
our ability to enforce contracts and intellectual property rights in jurisdictions outside the United States;
|
|
•
|
geopolitical events such as natural disasters, terrorism and acts of war;
|
|
•
|
uncertainties and instability in European markets caused by Brexit; and
|
|
•
|
barriers to international trade, such as tariffs, customs or other taxes.
|
Etsy sellers face similar risks in conducting their businesses across borders. Even if we are successful in managing the risks of conducting our business across borders, if Etsy sellers are not, our business could be adversely affected. In particular, Etsy buyers and sellers seeking to engage in cross-border sales may become subject to an increasing number of barriers to international trade such as tariffs, customs or other taxes.
If we invest substantial time and resources to expand our operations outside of the United States and cannot manage these risks effectively, the costs of doing business in those markets may be prohibitive or our expenses may increase disproportionately to the revenue generated in those markets.
Legal, political and economic uncertainty surrounding the planned exit of the United Kingdom from the European Union may be a source of instability in international markets, create significant currency fluctuations, adversely affect our operations in the United Kingdom and pose additional risks to our business, revenue, financial condition, and results of operations.
On March 29, 2017, the United Kingdom formally notified the European Council of its intention to leave the E.U. It is unclear how long it will take to negotiate a withdrawal agreement, but it appears likely that Brexit will continue to involve a process of lengthy negotiations between the United Kingdom and E.U. member states to determine the future terms of the United Kingdom’s relationship with the E.U.
Lack of clarity about future U.K. laws and regulations as the United Kingdom determines which E.U. rules and regulations to replace or replicate in the event of a withdrawal, including financial laws and regulations, tax and free trade agreements, intellectual property rights, supply chain logistics, environmental, health and safety laws and regulations, immigration laws and employment laws, could decrease foreign direct investment in the United Kingdom, increase costs, depress economic activity, and restrict access to capital. In addition, depending on the terms of the United Kingdom’s withdrawal from the E.U., the United Kingdom could lose the benefits of global trade agreements negotiated by the E.U. on behalf of its members. The long-term effects of Brexit will depend on any agreements (or lack thereof) between the United Kingdom and the E.U. and, in particular, any arrangements for the United Kingdom to retain access to E.U. markets either during a transitional period or more permanently.
Such a withdrawal from the E.U. is unprecedented, and it is unclear how the United Kingdom’s access to the European single market for goods, capital, services and labor within the E.U., or the European single market, and the wider commercial, legal and regulatory environment, will impact our U.K. operations, including our sellers and buyers in the United Kingdom. We may also face new regulatory costs and challenges that could have an adverse effect on our operations. The announcement of Brexit has already created economic uncertainty, and its consequences could adversely impact our business, revenue, financial condition, and results of operations.
Regulation in the areas of privacy and protection of user data could harm our business.
In addition to the actual and potential changes in law described elsewhere in these Risk Factors, global developments in privacy and data security regulations are changing some of the ways we and our vendors collect, use, and share personal information. Compliance with these changing regulations have necessitated some specific product changes for our non-U.S. activities. In May 2018, the General Data Protection Regulation (“GDPR”) went into effect in the E.U., effectively extending the scope of E.U. data protection law to all non-E.U. companies processing data of E.U. persons. The GDPR seeks to harmonize the data protection regulations throughout the entire E.U. The regulation contains numerous requirements and changes from existing E.U. law, including more robust obligations on data processors, greater rights for data subjects (requiring potentially significant changes to both our technology and operations), security and accountability obligations, and significantly heavier documentation and record-keeping requirements for data protection compliance programs. Specifically, the GDPR introduced numerous privacy-related changes for companies operating in the E.U., including greater control over personal data by data subjects (e.g., the “right to be forgotten”), increased data portability, access and redress rights for E.U. consumers, data breach notification requirements, increased rules for online and e-mail marketing, and stronger regulatory enforcement regimes. The
31
GDPR requirements apply to some third-party transactions (such as commercial contracts with partners and vendors) and to transfers of information between us and our subsidiaries, including user and employee information. GDPR requirements may also apply, depending on interpretation of its reach, to some users in Etsy’s worldwide community of sellers. We may experience difficulty retaining or obtaining new E.U. sellers or new sellers selling into the E.U. due to the legal requirements, compliance cost, potential risk exposure, and uncertainty for them in respect of their own compliance obligations with respect to GDPR. In addition, although Etsy sellers are independent businesses, it is possible that a privacy authority could deem Etsy jointly and severally liable for actions of Etsy sellers, which would increase our potential liability exposure and costs of compliance, which could negatively impact our business. We could face potential liability, regulatory investigation, and costly litigation, which may not be adequately covered by insurance.
GDPR, the recently passed California Consumer Privacy Act, and similar laws coming into effect in other jurisdictions may continue to change the data protection landscape globally and could result in potentially significant operational costs for internal compliance and risk to our business. Some of these requirements introduce friction into the buying and selling experience on Etsy and may impact the scope and effectiveness of our marketing efforts, which could negatively impact our business and future outlook. Non-compliance with these laws could result in proceedings against us by data protection authorities, other public authorities, third-parties, or individuals. Under GDPR alone, noncompliance could result in fines up to 20 million Euros or up to 4% of the annual global revenue of the noncompliant company, whichever is greater.
In addition, the laws relating to the transfer of personal data outside of the E.U. continue to evolve and remain uncertain.
Although we are taking steps to comply and mitigate the potential impact to us, the efficacy and longevity of these steps are uncertain. We may find it necessary to establish systems to maintain personal data originating from the E.U. in the European Economic Area, which may involve substantial expense and distraction from other aspects of our business. In the meantime, the evolving data protection landscape also creates uncertainty as to how to comply with E.U. privacy law, including potentially inconsistent guidance, rulings or requirements from multiple authorities in the E.U., as well as in the U.S. and worldwide. Further, we may not be entirely successful in our compliance efforts due to various factors either within our control (such as limited internal resource allocation) or outside our control (such as a lack of vendor cooperation, new regulatory interpretations, or lack of regulatory guidance in respect of certain GDPR requirements).
Our payments system depends on third-party providers, requires ongoing investment, and is subject to evolving laws, regulations, rules, and standards.
Etsy buyers primarily pay for purchases using Etsy Payments or PayPal. In the United States and other countries where Etsy Payments is available, Etsy Payments enables our sellers to accept various forms of payments such as credit cards, debit cards, PayPal, Google Wallet, Apple Pay, and Etsy Gift Cards.
We rely upon third-party service providers to perform underlying compliance, credit card processing and payment disbursing, currency exchange, identity verification, sanctions screening, and fraud analysis services. If these service providers do not perform adequately or if our relationships with these service providers were to terminate, Etsy sellers’ ability to receive orders or payment could be adversely affected and certain fraud prevention and detection tools may not be effective, which could lead to potential legal liability and negatively impact our business. In addition, Etsy and our third-party service providers may experience service outages from time to time that negatively impact payments on Etsy. We have in the past experienced, and may in the future experience, such service outages and, if we are unable to provide an alternative payment solution, our business could be harmed. In addition, if our third-party providers increase the fees they charge us, our operating expenses could increase. If we respond by increasing the fees we charge to Etsy sellers, some Etsy sellers may stop listing new items for sale or even close their accounts altogether.
The laws and regulations that govern payments are complex, evolving, and subject to change and vary across different jurisdictions in the United States and globally. Moreover, even in regions where such laws have been harmonized, regulatory interpretations of such laws may differ. As a result, we are required to spend significant time and effort to determine whether various laws and licensing regulations relating to payments apply to Etsy and to comply with applicable laws and licensing regulations. Any failure or claim of our failure to comply, or any failure by our third-party service providers to comply, could cost us substantial resources, could result in liabilities, could cause us significant reputational damage, or could force us to stop offering Etsy Payments in certain markets. Additionally, changes in payment regulation may occur that could render our payments systems less profitable. For example, any significant change in credit or debit card interchange rates in the United States or other markets, including as a result of changes in interchange fee limitations, may negatively impact payments on Etsy.
We plan to invest ongoing internal resources into our payments tools in order to maintain its existing availability, expand into additional markets and offer new payment methods and tools to Etsy buyers and sellers. If we fail to invest adequate resources
32
into payments on Etsy, or if our investment efforts are unsuccessful or unreliable, payments on Etsy may not function properly or keep pace with competitive offerings, which could negatively impact Etsy Payments usage and our marketplace
.
Further, our ability to expand Etsy Payments into additional countries is dependent upon the third-party providers we use to support this service. As we expand the availability of Etsy Payments to additional markets or offer new payment methods to Etsy sellers and Etsy buyers in the future, we may become subject to additional regulations, compliance requirements, and exposed to heightened fraud risk, which could lead to an increase in our operating expenses.
Further, through our agreements with our third-party payment processors, we are indirectly subject to payment card association operating rules and certification requirements, including the Payment Card Industry Data Security Standard, which are subject to change. Failure to comply with these rules and certification requirements could impact our ability to meet our contractual obligations with our third-party payment processors and could result in potential fines. We are also subject to rules governing electronic funds transfers. Any change in these rules and requirements, including as a result of a change in our designation by major payment card providers, could make it difficult or impossible for us to comply and could require a change in our business operations. In addition, similar to a potential increase in costs from third-party providers described above, any increased costs associated with compliance with payment card association rules or payment card provider rules could lead to increased fees for Etsy or Etsy sellers, which may negatively impact payments on our platform, usage of Etsy Payments, and our marketplace.
If sensitive information about members of our community or employees is misused or disclosed, or if we or our third-party providers are subject to cyber attacks, members of our community may curtail use of our platform, we may be exposed to liability, and our reputation could suffer.
Like all online services, our platform is vulnerable to power outages, telecommunications failures, and catastrophic events, as well as computer viruses, break-ins, phishing attacks, denial-of-service attacks, and other cyber attacks. Any of these incidents could lead to interruptions or shutdowns of our platform, loss of data or unauthorized disclosure of personal or financial information of our members or employees. Cyber attacks could also result in the theft of our intellectual property. As we grow our business, expand internationally, and gain greater public visibility, we may face a higher risk of being targeted by cyber attacks. Although we rely on a variety of security measures, including security testing, encryption of sensitive information, and authentication technology, we cannot assure you that such measures will provide absolute security, particularly given the increasingly sophisticated tools and methods used by hackers and cyber terrorists. In addition, we have experienced in the past, and may experience in the future, security breaches as a result of non-technical issues, including intentional, inadvertent, or social engineering breaches occurring through our employees or employees of our third-party service providers. In addition, if our employees or employees of our third-party service providers fail to comply with our internal security policies and practices, member or employee data may be improperly accessed, used, or disclosed.
We are also reliant on the security practices of our third party service providers, which may be outside of our direct control. Additionally, some of our third party service providers, such as identity verification and payment processing providers, regularly have access to some confidential and sensitive member data. If these third parties fail to adhere to adequate security practices, or experience a breach of their networks, our members’ data may be improperly accessed, used or disclosed.
Cyber attacks aimed at disrupting our and our third-party service providers’ services have occurred regularly in the past, and we expect they will continue to occur in the future. If we or our third-party service providers experience security breaches that result in marketplace performance or availability problems or the loss or unauthorized disclosure of sensitive information, or if we fail to respond appropriately to any security breaches that we may experience, people may become unwilling to provide us the information necessary to set up an account with us. Existing Etsy sellers and Etsy buyers may stop listing new items for sale, decrease their purchases or close their accounts altogether. We could also face potential liability, regulatory investigation, costly remediation efforts and litigation, which may not be adequately covered by insurance. Any of these results could harm our growth prospects, our business, and our reputation for maintaining a trusted marketplace.
Adherence to our guiding principles and our focus on our mission and long-term sustainability may negatively influence our financial performance. Further, our reputation could be harmed if we fail to meet our impact strategy goals.
We intend to operate in line with our guiding principles, focus on the long-term sustainability of our business, and work toward our mission to “Keep Commerce Human.” We may take actions in line with our mission and guiding principles that we believe will benefit our business and, therefore, our stockholders over a longer period of time, even if those actions do not maximize short- or medium-term financial performance. However, these longer-term benefits may not materialize within the time frame we expect or at all. For example:
|
•
|
we may choose to prohibit the sale of items in our marketplace that are inconsistent with our policies even though we could benefit financially from the sale of those items; or
|
33
|
•
|
we may choose to revise our policies in ways that we believe will be beneficial to our community in the long term even though the changes may be perceived unfavorably, such as updates to the way we define “handmade.”
|
Additionally, we have developed an impact strategy that focuses on leveraging Etsy’s core business to generate value for our community and stakeholders through positive economic, social and environmental efforts. Our impact strategy aims to create more economic opportunity for sellers, greater diversity in our workforce and build long-term resilience by reducing our carbon footprint. If we don’t demonstrate progress against our impact strategy or if our impact strategy is not perceived to be adequate, our reputation could be harmed.
Failure to deal effectively with fraud or other illegal activity could harm our business.
Although we have measures in place to detect and limit the occurrence of fraudulent and other illegal activity in our marketplace, those measures may not always be effective.
For example, Etsy sellers occasionally receive orders placed with fraudulent or stolen credit card data. Under current credit card chargeback rules, we could be held liable for orders placed through Etsy Payments with fraudulent credit card data even if the associated financial institution approved the credit card transaction. Although we attempt to detect or challenge fraudulent transactions, we may not be able to do so effectively. As a result, our business could be adversely affected. We could also incur significant fines or lose our ability to give the option of paying with credit cards if we fail to follow payment card industry data security standards or payment card association rules or fail to limit fraudulent transactions conducted in our marketplace.
We have adopted policies and procedures that are intended to ensure compliance with anti-corruption, anti-money laundering, export controls, and trade sanctions requirements. In addition, as stated elsewhere in these Risk Factors, we rely upon third-party service providers to perform certain underlying compliance, credit card processing identity verification, and fraud analysis services. If we or our service providers do not perform adequately, certain of our fraud prevention and detection tools may not be effective, which could lead to potential legal liability and negatively impact our business.
Negative publicity and sentiment resulting from fraudulent, illegal, or deceptive conduct by members of our community or the perception that our levels of responsiveness and support for Etsy sellers and Etsy buyers are inadequate could reduce our ability to attract and retain Etsy sellers and Etsy buyers and damage our reputation.
We are subject to risks related to our corporate social responsibility metrics.
We voluntarily report certain corporate social responsibility metrics. This transparency is consistent with our commitment to executing on a strategy that reflects the positive economic, social, and environmental impact we want to have on the world while advancing and complementing our business strategy. These metrics, whether it be the standards we set for ourselves and/or our failure to meet such metrics, may influence our reputation and the value of our brand. For example, the perception held by Etsy buyers or sellers, our partners or vendors, other key stakeholders, or the communities in which we do business may depend, in part, on the metrics we have chosen to aspire to and whether or not we meet these metrics on a timely basis, if at all. While selected metrics receive limited assurance from an independent third party, this is inherently a less rigorous process than reasonable assurance sought in a typical auditing engagement. Our failure to achieve progress on our metrics on a timely basis, or at all, could adversely affect our business, financial performance, or growth.
By electing to set and share publicly these corporate social responsibility metrics, our business may also face increased scrutiny related to environmental, social, and governance activities. As a result, we could damage our reputation and the value of our brand if we fail to act responsibly in the areas in which we report, such as economic security and personal empowerment, diversity and inclusion, energy and water management, carbon footprint, and data privacy or if we are perceived not to have rigorously measured our achievement against such metrics. Any harm to our reputation resulting from setting these metrics or our failure or perceived failure to meet such metrics could impact: employee engagement and retention; the willingness of Etsy buyers and sellers and our partners and vendors to do business with us; or investors willingness to purchase or hold shares of our common stock, any of which could adversely affect our business, financial performance, and growth.
We face intense competition and may not be able to compete effectively.
Our industry is highly competitive and we expect competition to increase in the future. To be successful, we need to attract and retain Etsy sellers and Etsy buyers. As a result, we face competition from a wide range of online and offline competitors.
We compete for Etsy sellers with both retailers and companies that sell software and services to small businesses. In addition to listing her goods for sale on Etsy, an Etsy seller can list her goods with other online retailers, such as Amazon, eBay, or Alibaba, or sell her goods through local consignment and vintage stores and other venues or marketplaces, including through
34
commerce channels on social networks like Facebook and Instagram. She may also sell wholesale directly to traditional retailers, including large national retailers, who discover her goods in our marketplace or otherwise. We also compete with companies that sell software and services to small businesses, enabling an Etsy seller to sell from her own website or otherwise run her business independently of our platform, such as Bigcommerce, and Shopify.
We compete to attract, engage, and retain Etsy sellers based on many factors, including:
|
•
|
our brand awareness;
|
|
•
|
the extent to which our tools and services can ease the administrative tasks that an Etsy seller might encounter in running her business;
|
|
•
|
the global scale of our marketplace and the breadth of our online presence;
|
|
•
|
the number and engagement of Etsy buyers;
|
|
•
|
our seller education resources and tools;
|
|
•
|
our policies and fees;
|
|
•
|
the ability to scale her business, including through Pattern or with a production partner;
|
|
•
|
our mobile apps;
|
|
•
|
the strength of our community; and
|
|
•
|
our mission.
|
In addition, we compete with retailers for the attention of the Etsy buyer. An Etsy buyer has the choice of shopping with any online or offline retailer, including large e-commerce marketplaces, such as Amazon, eBay or Alibaba, national retail chains, such as West Elm or Target, local consignment and vintage stores, social commerce channels like Instagram, event-driven platforms and vertical experiences like Zola and Wayfair, and other venues or marketplaces. Many of these competitors offer low-cost or free shipping, fast shipping times, favorable return policies, and other features that may be difficult or impossible for Etsy sellers to match.
We compete to attract, engage, and retain Etsy buyers based on many factors, including:
|
•
|
the breadth of unique goods that Etsy sellers list in our marketplace;
|
|
•
|
the ease of finding the special item a buyer is looking for;
|
|
•
|
our brand awareness;
|
|
•
|
the person-to-person commerce experience;
|
|
•
|
customer service;
|
|
•
|
our reputation for trustworthiness;
|
|
•
|
our mobile apps;
|
|
•
|
the availability of fair and free shipping offered by Etsy sellers;
|
|
•
|
ease of payment; and
|
|
•
|
the availability and reliability of our platform.
|
Many of our competitors and potential competitors have longer operating histories, greater resources, better name recognition, or more customers than we do.
They may invest more to develop and promote their services than we do, and they may offer lower fees to sellers than we do. Additionally, we believe that it is relatively easy for new businesses to create online commerce offerings or tools or services that enable entrepreneurship.
35
Local companies or more established companies based in markets where we operate outside of the United States may also have a better understanding of local customs, providing them a competitive advantage. For example, in certain markets outside the United States, we compete with smaller, but similar, local online marketplaces with a focus on unique goods that are attempting to attract sellers and buyers in those markets.
If we are unable to compete successfully, or if competing successfully requires us to expend significant resources in response to our competitors’ actions, our business could be adversely affected.
We rely on Etsy sellers to provide a fulfilling experience to Etsy buyers.
A small portion of Etsy buyers complain to us about their experience with our platform. For example, Etsy buyers may report that they have not received the items that they purchased, that the items received were not as represented by an Etsy seller or that an Etsy seller has not been responsive to their questions.
Negative publicity and sentiment generated as a result of these types of complaints could reduce our ability to attract and retain Etsy sellers and Etsy buyers or damage our reputation. A perception that our levels of responsiveness and support for Etsy sellers and Etsy buyers are inadequate could have similar results. In some situations, we may choose to reimburse Etsy buyers for their purchases to help avoid harm to our reputation, but we may not be able to recover the funds we expend for those reimbursements. Although we are focused on enhancing customer service, our efforts may be unsuccessful and Etsy sellers and Etsy buyers may be disappointed in their Etsy experience and not return.
Anything that prevents the timely processing of orders or delivery of goods to Etsy buyers could harm Etsy sellers. Service interruptions and delivery delays may be caused by events that are beyond the control of Etsy sellers, such as interruptions in order or payment processing, transportation disruptions, natural disasters, inclement weather, terrorism, public health crises, or political unrest. Disruptions in the operations of a substantial number of Etsy sellers could also result in negative experiences for a substantial number of Etsy buyers, which could harm our reputation and adversely affect our business.
Our reputation may be harmed if members of our community use illegal or unethical business practices.
Our emphasis on our mission and guiding principles makes our reputation particularly sensitive to allegations of illegal or unethical business practices by Etsy sellers or other members of our community. Our policies promote legal and ethical business practices, such as encouraging Etsy sellers to work only with manufacturers who do not use child or involuntary labor, who do not discriminate, and who promote sustainability and humane working conditions. However, we do not control Etsy sellers or other members of our community or their business practices and cannot ensure that they comply with our policies. If members of our community engage in illegal or unethical business practices or are perceived to do so, we may receive negative publicity and our reputation may be harmed.
Our business depends on network and mobile infrastructure provided by third parties and on our ability to maintain and scale the technology underlying our platform.
The reliability of our platform is important to our reputation and our ability to attract and retain Etsy sellers and Etsy buyers. As the number of Etsy sellers and Etsy buyers, volume of traffic, number of transactions, and the amount of information shared on our platform grow, our need for additional network capacity and computing power will also grow. The operation of the technology underlying our platform is expensive and complex, and we could experience operational failures. If we fail to accurately predict the rate or timing of the growth of our platform, we may be required to incur significant additional costs to maintain reliability. The investments we make in our platform are designed to grow our business and to improve our operating results in the long term, but these investments could also delay our ability to achieve profitability or reduce profitability in the near term.
We also depend on the development and maintenance of the internet, cloud and mobile infrastructure, and increasingly rely on the availability, features, cost, and reliability of third-party service providers and platforms. For example, this includes maintenance of reliable internet and mobile networks with the necessary speed, data capacity, and security, as well as timely development of complementary products.
Third-party providers host much of our technology infrastructure and are likely to host more in the future. Any disruption in their services, or any failure of our providers to handle the demands of our marketplace could significantly harm our business. We exercise little control over these providers, which increases our vulnerability to their financial conditions and to problems with the services they provide, such as security concerns. Our efforts to update our infrastructure may not be successful or may take longer than anticipated. If we experience failures in our technology infrastructure or do not expand our technology
36
infrastructure successfully, then our ability to attract and retain Etsy sellers and Etsy buyers could be adversely affected, which could harm our growth prospects and our business.
We will rely on Google Cloud for a substantial portion of our computing, storage, data processing, networking, and other services. Any disruption of or interference with our use of the Google Cloud operation would adversely affect our business, financial performance, and growth.
Google Cloud Platform provides a distributed computing infrastructure as a service platform for business operations, and we are in the process of migrating our data centers to Google Cloud, increasing our reliance on cloud infrastructure. As we implement the transition to the cloud, there will be occasional planned or unplanned downtime for our websites and apps and potential site delays, all of which will impact our sellers’ ability to conduct transactions and our buyers’ ability to purchase items. We may also need to divert engineering resources away from other important business operations, which could significantly harm our business and growth. Additionally, if the costs to migrate to Google Cloud are greater than we expect or take significantly more time than we anticipate, our business could be harmed.
Any transition of the cloud services currently provided by Google Cloud to another cloud provider would be difficult to implement and will cause us to incur significant time and expense. Any significant disruption of, or interference with, our use of Google Cloud would negatively impact our operations and our business would be seriously harmed. In addition, if hosting costs increase over time and if we require more computing or storage capacity, our costs could increase disproportionately. If we are unable to grow our revenues faster than the cost of utilizing the services of Google or similar providers, our business and financial condition could be adversely affected.
We may be subject to claims that items listed in our marketplace are counterfeit, infringing or illegal.
Although we do not create or take possession of the items listed in our marketplace by Etsy sellers, we frequently receive communications alleging that items listed in our marketplace infringe third-party copyrights, trademarks, patents, or other intellectual property rights. We have intellectual property complaint and take-down procedures in place to address these communications, and we believe such procedures are important to promote confidence in our marketplace. We follow these procedures to review complaints and relevant facts to determine the appropriate action, which may include removal of the item from our marketplace and, in certain cases, closing the shops of Etsy sellers who repeatedly violate our policies.
Our procedures may not effectively reduce or eliminate our liability. In particular, we may be subject to civil or criminal liability for activities carried out by Etsy sellers on our platform, especially outside the United States where laws may offer less protection for intermediaries and platforms than the United States. Under current U.S. copyright law and the Communications Decency Act, we may benefit from statutory safe harbor provisions that protect us from copyright liability for content posted on our platform by Etsy sellers and Etsy buyers. However, trademark and patent laws do not include similar statutory provisions, and liability for these forms of intellectual property is often determined by court decisions. These safe harbors and court rulings may change unfavorably. In that event, we may be held secondarily liable for the intellectual property infringement of Etsy sellers.
Regardless of the validity of any claims made against us, we may incur significant costs and efforts to defend against or settle them. If a governmental authority determines that we have aided and abetted the infringement or sale of counterfeit goods or if legal changes result in us potentially being liable for actions by Etsy sellers on our platform, we could face regulatory, civil, or criminal penalties. Successful claims by third-party rights owners could require us to pay substantial damages or refrain from permitting any further listing of the relevant items. These types of claims could force us to modify our business practices, which could lower our revenue, increase our costs or make our platform less user-friendly. Moreover, public perception that counterfeit or other unauthorized items are common in our marketplace, even if factually incorrect, could result in negative publicity and damage to our reputation.
Our business and our Etsy sellers and Etsy buyers may be subject to sales and other taxes.
The application of indirect taxes, such as sales and use tax, value-added tax, provincial taxes, goods and services tax, business tax, withholding tax, digital service tax, and gross receipt tax, to businesses like ours and to Etsy sellers and Etsy buyers is a complex and evolving issue. Significant judgment is required to evaluate applicable tax obligations and as a result amounts recorded are estimates and are subject to adjustments. In many cases, the ultimate tax determination is uncertain because it is not clear when and how new and existing statutes might apply to our business or to Etsy sellers’ businesses. If Etsy is found to be deficient in how it has addressed its tax obligations, our business could be adversely impacted.
37
One or more states, the federal government, or other countries are seeking to, or have recently imposed additional reporting, record-keeping, or indirect tax collection and remittance obligations on businesses like ours that facilitate online commerce. If requirements like these become applicable in additional jurisdictions, our business could be harmed. For example, taxing authorities in certain U.S. states and in other countries have identified e-commerce platforms as a means to calculate, collect, and remit indirect taxes for transactions taking place over the internet, and are considering related legislation. Additionally, the Supreme Court’s recent decision in
South Dakota v. Wayfair, Inc. et al
overturned existing law that sellers are not required to collect sales and use tax unless they have a physical presence in the buyer’s state. As a result of the
Wayfair
decision, states or the federal government may adopt, or begin to enforce laws requiring Etsy sellers to calculate, collect, and remit taxes on their sales. Such changes to current law or new legislation could adversely affect our business if the requirement of tax to be charged on items sold on Etsy causes our marketplace to be less attractive to current and prospective Etsy buyers, which could materially impact our business, financial performance, and growth. Additionally, new legislation could require us or Etsy sellers to incur substantial costs in order to comply, including costs associated with tax calculation, collection, remittance, and audit requirements, which could make selling in our marketplace less attractive.
Our business is subject to a large number of U.S. and non-U.S. laws, many of which are evolving.
We are subject to a variety of laws and regulations in the United States and around the world, including those relating to traditional businesses, such as employment laws and taxation, and laws and regulations focused on ecommerce and online marketplaces, such as online payments, privacy, anti-spam, data security and protection, online platform liability, intellectual property, and consumer protection. In light of our international operations, we need to comply with various laws associated with doing business outside of the United States, including anti-money laundering, sanctions, anti-corruption, and export control laws. In some cases, non-U.S. privacy, data security, consumer protection, e-commerce, and other laws and regulations are more detailed than those in the United States and, in some countries, are actively enforced.
These laws and regulations are continuously evolving, and compliance is costly and can require changes to our business practices and significant management time and effort.
Additionally, it is not always clear how existing laws apply to online marketplaces as many of these laws do not address the unique issues raised by online marketplaces or ecommerce. For example, as described elsewhere in these Risk Factors, laws relating to privacy are evolving differently in different jurisdictions. Federal, state, and non-U.S. governmental authorities, as well as courts interpreting the laws, continue to evaluate and assess the privacy requirements that are applicable to Etsy.
Some providers of consumer devices and web browsers have implemented, or have announced plans to implement, ways to block tracking technologies which, if widely adopted, could also result in online tracking methods becoming significantly less effective. Any reduction in our ability to make effective use of such technologies could harm our ability to personalize the experience of Etsy buyers, increase our costs and limit our ability to attract and retain Etsy sellers and Etsy buyers on cost-effective terms. As a result, our business could be adversely affected.
Existing and future laws and regulations enacted by federal, state, or non-U.S. governments or the inconsistent enforcement of such laws and regulations could impede the growth of ecommerce or online marketplaces, which could have a negative impact on our business and operations. Examples include data localization requirements, limitation on marketplace scope or ownership, intellectual property intermediary liability rules, regulation of online speech, limits on network neutrality, and rules related to security, privacy, or national security, which may impede Etsy or our users. We could also face regulatory challenges or be subject to discriminatory or anti-competitive practices that could impede both our and Etsy sellers’ growth prospects, increase our costs, and harm our business.
We strive to comply with all applicable laws, but they may conflict with each other, and by complying with the laws or regulations of one jurisdiction, we may find that we are violating the laws or regulations of another jurisdiction. Despite our efforts, we may not have fully complied in the past and may not in the future. If we become liable under laws or regulations applicable to us, we could be required to pay significant fines and penalties, our reputation may be harmed and we may be forced to change the way we operate. That could require us to incur significant expenses or to discontinue certain services, which could negatively affect our business.
Additionally, if third parties with whom we work violate applicable laws or our policies, those violations could result in other liabilities for us and could harm our business. Furthermore, the circumstances in which we may be held liable for the acts, omissions or responsibilities of our sellers is uncertain, complex, and evolving. For example, certain laws have recently been enacted seeking to hold marketplaces like ours responsible for certain compliance obligations for which sellers have traditionally been responsible. If an increasing number of such laws are passed, the resulting compliance costs and potential liability risk could negatively impact our business.
38
Our software is highly complex and may contain undetected errors.
The software underlying our platform is highly interconnected and complex and may contain undetected errors or vulnerabilities, some of which may only be discovered after the code has been released. We rely heavily on a software engineering practice known as “continuous deployment,” meaning that we typically release software code many times per day. This practice may result in the more frequent introduction of errors or vulnerabilities into the software underlying our platform, which can impact the user experience on Etsy.com. Additionally, due to the interconnected nature of the software underlying our platform, updates to certain parts of our code, including changes to Etsy or third party APIs on which Etsy relies, could have an unintended impact on other sections of our code, which may result in errors or vulnerabilities to our platform that negatively impact the user experience and functionality of our marketplace. Any errors or vulnerabilities discovered in our code after release could result in damage to our reputation, loss of our community members, loss of revenue or liability for damages, any of which could adversely affect our growth prospects and our business.
Our business depends on continued and unimpeded access to the internet and mobile networks.
Etsy sellers and Etsy buyers rely on access to the internet or mobile networks to access our marketplace. Internet service providers may choose to disrupt or degrade access to our platform or increase the cost of such access. Mobile network operators or operating system providers could block or place onerous restrictions on the ability to download and use our mobile apps.
Internet service providers or mobile network operators could also attempt to charge us for providing access to our platform. In addition, we could face discriminatory or anticompetitive practices that could impede both our and Etsy sellers’ growth prospects, increase our costs, and harm our business. In 2015, rules approved by the Federal Communications Commission (“FCC”) went into effect that prohibited internet service providers from charging content providers higher rates in order to deliver their content over certain “fast traffic” lanes; however, those rules were repealed in June 2018. This repeal may make it more difficult or costly for many small businesses such as our community of sellers, as well as our buyers, to access our platform and may result in increased costs for us, which could significantly harm our business, and the millions of microbusinesses that utilize our platform. We, along with other companies and public interest groups, are challenging this repeal in the courts, but these efforts may not be successful and may be costly.
Outside of the United States, it is possible that governments of one or more countries may seek to censor content available on our platform or may even attempt to block access to our platform. If we are restricted from operating in one or more countries, our ability to attract and retain Etsy sellers and Etsy buyers may be adversely affected and we may not be able to grow our business as we anticipate.
Our business could be negatively affected as a result of actions of activist stockholders.
The actions of activist stockholders could adversely affect our business. Specifically, responding to common actions of an activist stockholder, such as requests for special meetings, potential nominations of candidates for election to our Board of Directors, requests to pursue a strategic combination, or other transaction or other special requests, could disrupt our operations, be costly and time-consuming, or divert the attention of our management and employees. In addition, perceived uncertainties as to our future direction in relation to the actions of an activist stockholder may result in the loss of potential business opportunities or the perception that we are unstable as a company, which may make it more difficult to attract and retain qualified employees. Actions of an activist stockholder may also cause fluctuations in our stock price based on speculative market perceptions or other factors that do not necessarily reflect the underlying fundamentals and prospects of our business.
We may be subject to intellectual property claims, which are extremely costly to defend, could require us to pay significant damages, and could limit our ability to use certain technologies in the future.
Companies in the internet and technology industries are frequently subject to litigation based on allegations of infringement or other violations of intellectual property rights. We periodically receive communications that claim we have infringed, misappropriated, or misused others’ intellectual property rights. To the extent we gain greater public recognition, we may face a higher risk of being the subject of intellectual property claims. Third-parties may have intellectual property rights that cover significant aspects of our technologies or business methods and prevent us from expanding our offerings. Third parties may also allege a company is secondarily liable for intellectual property infringement, or that it is a joint infringer with another party. Any intellectual property claim against us, with or without merit, could be time consuming and expensive to settle or litigate and could divert the attention of our management. Litigation regarding intellectual property rights is inherently uncertain due to the complex issues involved, and we may not be successful in defending ourselves in such matters. In addition,
39
some of our competitors have extensive portfolios of issued patents. Many potential litigants, including some of our competitors and patent holding companies, have the ability to dedicate substantial resources to enforcing their intellectual property rights. Any claims successfully brought against us could subject us to significant liability for damages and we may be required to stop using technology or other intellectual property alleged to be in violation of a third party’s rights in one or more jurisdictions where Etsy does business. We also might be required to seek a license for third-party intellectual property. Even if a license is available, we could be required to pay significant royalties or submit to unreasonable terms, which would increase our operating expenses. We may also be required to develop alternative non-infringing technology, which could require significant time and expense. If we cannot license or develop technology for any allegedly infringing aspect of our business, we would be forced to limit our service and may be unable to compete effectively. Any of these results could harm our business.
We may be unable to protect our intellectual property adequately.
Our intellectual property is an essential asset of our business. To establish and protect our intellectual property rights, we rely on a combination of trade secret, copyright, trademark, and patent laws, as well as confidentiality procedures and contractual provisions. The efforts we have taken to protect our intellectual property may not be sufficient or effective. We generally do not elect to register our copyrights, relying instead on the laws protecting unregistered intellectual property, which may not be sufficient. We rely on both registered and unregistered trademarks, which may not always be comprehensive in scope. In addition, our copyrights and trademarks, whether or not registered, and patents may be held invalid or unenforceable if challenged, and may be of limited territorial reach. While we have obtained or applied for patent protection with respect to some of our intellectual property, we generally do not rely on patents as a principal means of protecting intellectual property. To the extent we do seek patent protection, any U.S. or other patents issued to us may not be sufficiently broad to protect our proprietary technologies.
In addition, we may not be effective in policing unauthorized use of our intellectual property and authorized uses may not have the intended effect. Even if we do detect violations, we may need to engage in litigation to enforce our intellectual property rights. Any enforcement efforts we undertake, including litigation, could be time-consuming and expensive and could divert our management’s attention. In addition, our efforts may be met with defenses and counterclaims challenging the validity and enforceability of our intellectual property rights or may result in a court determining that our intellectual property rights are unenforceable. The legal framework surrounding protection of intellectual property changes frequently throughout the world, and these changes may impact our ability to protect our intellectual property and defend against third party claims. If we are unable to cost-effectively protect our intellectual property rights, then our business could be harmed.
We are subject to the terms of open source licenses because our platform incorporates open source software.
The software powering our marketplace incorporates software covered by open source licenses. In addition, we regularly contribute source code to open source software projects and release internal software projects under open source licenses, and we anticipate doing so in the future. The terms of many open source licenses relied upon by Etsy and the internet and technology industries have been interpreted by only a few court decisions and there is a risk that the licenses could be construed in a manner that imposes unanticipated conditions or restrictions on our ability to operate our marketplace. Under certain open source licenses, if certain conditions were met, we could be required to publicly release aspects of the source code of our software or to make our software available under open source licenses. To avoid the public release of the affected portions of our source code, we could be required to expend substantial time and resources to re-engineer some or all of our software. In addition, use of open source software can lead to greater risks than use of third-party commercial software because open source licensors generally do not provide warranties or controls on the origin of the software. Use of open source software may also present additional security risks because the public availability of such software may make it easier for hackers and other third parties to determine how to compromise our platform. Additionally, because any software source code we contribute to open source projects is publicly available, while we may benefit from the contributions of others, our ability to protect our intellectual property rights in such software source code may be limited or lost entirely, and we will be unable to prevent our competitors or others from using such contributed software source code. Any of these risks could be difficult to eliminate or manage and, if not addressed, could adversely affect our business, financial performance and growth.
We may experience fluctuations in our tax obligations and effective tax rate.
We are subject to taxation in the United States and in numerous other jurisdictions. We record tax expense based on current tax payments and our estimates of future tax payments, which may include reserves for estimates of probable settlements of tax audits. At any one time, multiple tax years could be subject to audit by various taxing jurisdictions. As a result, we could be subject to higher than anticipated tax liabilities as well as ongoing variability in our quarterly tax rates as audits close and exposures are re-evaluated. Further, our effective tax rate in a given financial statement period may be adversely impacted by
40
changes in tax laws, changes in the mix of revenue among different jurisdictions, changes to accounting rules, and changes to our ownership or capital structure. Fluctuations in our tax obligations and effective tax rate could adversely affect our business.
In December 2017, the U.S. government enacted comprehensive tax legislation that includes significant changes to the taxation of business entities. These changes include, among others, (1) a permanent reduction to the corporate income tax rate, (2) a partial limitation on the deductibility of business interest expense, (3) a shift of the U.S. taxation of multinational corporations from a tax on worldwide income to a quasi-territorial system (along with certain rules designed to prevent erosion of the U.S. income tax base), and (4) a one-time tax on accumulated offshore earnings held in cash and illiquid assets, with the latter taxed at a lower rate. Notwithstanding the reduction in the corporate income tax rate, the overall impact of this tax reform is uncertain, and our business and financial condition could be adversely affected.
In January 2015, we implemented a revised corporate structure to more closely align our structure with our global operations and future expansion plans outside of the United States. Our new corporate structure changed how we use our intellectual property and implemented certain intercompany arrangements. We believe this may result in a reduction in our overall effective tax rate over the long term and other operational efficiencies; however, the tax laws of the jurisdictions in which we operate are subject to interpretation, and their application may depend on our ability to operate our business in a manner consistent with our corporate structure. Moreover, these tax laws are subject to change. Tax authorities may disagree with our position as to the tax treatment of our transfer of intangible assets or determine that the manner in which we operate our business does not achieve the intended tax consequences. If our new corporate structure does not achieve our expectations for any of these or other reasons, we may be subject to a higher overall effective tax rate and our business may be adversely affected.
We may be involved in litigation matters that are expensive and time consuming.
In addition to intellectual property claims, we may become involved in other litigation matters, including class action lawsuits. For example, as described further in “
Note 14—Commitments and Contingencies
—
Legal Proceedings
” in the Notes to Consolidated Financial Statements, a purported securities class action lawsuit was recently dismissed that named Etsy and certain of our officers and/or directors as defendants. Under certain circumstances, we have contractual and other legal obligations to indemnify and to incur legal expenses on behalf of current and former directors, officers, and underwriters. Any lawsuit to which we are a party, with or without merit, may result in an unfavorable judgment. We also may decide to settle lawsuits on unfavorable terms. Any such negative outcome could result in payments of substantial damages or fines, damage to our reputation, or adverse changes to our offerings or business practices. Any of these results could adversely affect our business. In addition, defending claims is costly and can impose a significant burden on our management.
We may expand our business through acquisitions of other businesses, which may divert management’s attention and/or prove to be unsuccessful.
We have acquired a number of other businesses in the past and may acquire additional businesses or technologies in the future. Acquisitions may divert management’s time and focus from operating our business. Acquisitions also may require us to spend a substantial portion of our available cash, issue stock, incur debt or other liabilities, amortize expenses related to intangible assets, or incur write-offs of goodwill or other assets. In addition, integrating an acquired business or technology is risky. Completed and future acquisitions may result in unforeseen operational difficulties and expenditures associated with:
|
•
|
integrating new businesses and technologies into our infrastructure;
|
|
•
|
consolidating operational and administrative functions;
|
|
•
|
coordinating outreach to our community;
|
|
•
|
maintaining morale and culture and retaining and integrating key employees;
|
|
•
|
maintaining or developing controls, procedures and policies (including effective internal control over financial reporting and disclosure controls and procedures); and
|
|
•
|
assuming liabilities related to the activities of the acquired business before and after the acquisition, including liabilities for violations of laws and regulations, commercial disputes, cyber attacks, taxes, and other matters.
|
Moreover, we may not benefit from our acquisitions as we expect, or in the time frame we expect. We also may issue additional equity securities in connection with an acquisition, which could cause dilution to our stockholders. Finally, acquisitions could be viewed negatively by analysts, investors or the members of our community.
41
If our insurance coverage is insufficient or our insurers are unable to meet their obligations, our insurance may not mitigate the risks facing our business.
Our insurance policies cover a number of risks and potential liabilities, such as general liability, property coverage, errors, and omissions liability, employment liability, business interruptions, data breaches, crime, product liability, and directors’ and officers’ liability. For certain types of business risk, we may not be able to, or may choose not to, acquire insurance. In addition, our insurance may not adequately mitigate the risks we face or we may have to pay high premiums and/or deductibles for the coverage we do obtain. Additionally, if any of our insurers becomes insolvent, it would be unable to pay any claims that we make.
The growth of our business may strain our management team and our operational and financial infrastructure.
We have experienced rapid growth in our business, in the number of Etsy sellers and the number of countries in which we have Etsy sellers and Etsy buyers, and we plan to continue to grow in the future, both in the United States and abroad. The growth of our business places significant demands on our management team and pressure to expand our operational and financial infrastructure. For example, we may need to continue to develop and improve our operational, financial, and management controls and enhance our reporting systems and procedures. If we do not manage our growth effectively, the increases in our operating expenses could outpace any increases in our revenue and our business could be harmed.
Operating as a public company requires us to incur substantial costs and requires substantial management attention.
As a public company, we incur substantial legal, accounting, and other expenses that we did not incur as a private company. For example, we are subject to the reporting requirements of the Exchange Act, the applicable requirements of the Sarbanes-Oxley Act of 2002, (“the Sarbanes-Oxley Act”), and the Dodd-Frank Wall Street Reform and Consumer Protection Act and the rules and regulations of the Securities and Exchange Commission (“SEC”). The rules and regulations of the Nasdaq Global Select Market (“Nasdaq”) also apply to us. As part of these requirements, we have established and maintained effective disclosure and financial controls and made changes to our corporate governance practices. Continued compliance with these requirements may increase our legal and financial compliance costs in the future and may make some activities more time-consuming. In addition, as described elsewhere in these Risk Factors, as a public company, we may be subject to stockholder activism, which can lead to additional substantial costs, distract management, and impact the manner in which we operate our business in ways we cannot currently anticipate.
If we are unable to maintain effective internal control over financial reporting, investors may lose confidence in the accuracy of our financial reports.
As a public company, we are required to maintain internal control over financial reporting and to report any material weaknesses in such internal controls. Section 404 of the Sarbanes-Oxley Act requires that we evaluate and determine the effectiveness of our internal control over financial reporting. It also requires our independent registered public accounting firm to attest to our evaluation of our internal controls over financial reporting. Although our management has determined, and our independent registered public accounting firm has attested, that our internal control over financial reporting was effective as of
December 31, 2018
, we cannot assure you that we or our independent registered public accounting firm will not identify a material weakness in our internal control in the future.
If we have a material weakness in our internal control over financial reporting in the future, we may not detect errors on a timely basis. If we are not able to comply with the requirements of Section 404 of the Sarbanes-Oxley Act, or if we identify a material weakness in our internal control over financial reporting in the future, it could harm our operating results, cause us to fail to meet our SEC reporting obligations or Nasdaq listing requirements, adversely affect our reputation, cause our stock price to decline, or result in inaccurate financial reporting or material misstatements in our annual or interim financial statements. Further, if there are material weaknesses or failures in our ability to meet any of the requirements related to the maintenance and reporting of our internal controls, such as Section 404 of the Sarbanes-Oxley Act, investors may lose confidence in the accuracy and completeness of our financial reports and that could cause the price of our common stock to decline. We could become subject to investigations by Nasdaq, the SEC or other regulatory authorities, which could require additional management attention and which could adversely affect our business.
In addition, our internal control over financial reporting will not prevent or detect all errors and fraud. Because of the inherent limitations in all control systems, no evaluation of controls can provide absolute assurance that misstatements due to error or fraud will not occur or that all control issues and instances of fraud will be detected.
42
We have a significant amount of debt and may incur additional debt in the future. We may not have sufficient cash flow from our business to pay our substantial debt when due.
Our ability to pay our debt when due or to refinance our indebtedness, including the
0%
Convertible Senior Notes due
2023
we issued in
March 2018
, (the “Notes”), depends on our future performance, which is subject to economic, financial, competitive, and other factors beyond our control. Our business may not continue to generate cash flow from operations in the future sufficient to service our debt and make necessary capital expenditures. In addition, any required repurchase of the Notes for cash as a result of a fundamental change would lower our current cash on hand such that we would not have those funds available for us in our business. If we are unable to generate such cash flow, we may be required to adopt one or more alternatives, such as selling assets, restructuring debt or obtaining additional equity capital on terms that may be onerous or highly dilutive. Our ability to refinance our indebtedness will depend on the capital markets and our financial condition at such time. We may not be able to engage in any of these activities or engage in these activities on desirable terms, which could result in a default on our debt obligations.
In addition, we and our subsidiaries may be able to incur substantial additional debt in the future, subject to the restrictions contained in our debt instruments, some of which may be secured debt. If, for example, we incur additional debt, secure existing or future debt or recapitalize our debt, these actions may diminish our ability to make payments on our substantial debt when due.
The accounting method for convertible debt securities that may be settled in cash, such as the Notes, could have a material effect on our reported financial results.
In May 2008, the Financial Accounting Standards Board (“FASB”) issued FASB Staff Position No. APB 14-1,
Accounting for Convertible Debt Instruments That May Be Settled in Cash Upon Conversion (Including Partial Cash Settlement)
, which has subsequently been codified as Accounting Standards Codification 470-20
—Debt with Conversion and Other Options
, (“ASC 470-20”). Under ASC 470-20, an entity must separately account for the liability and equity components of the convertible debt instruments (such as the Notes) that may be settled entirely or partially in cash upon conversion in a manner that reflects the issuer’s economic interest cost. The effect of ASC 470-20 on the accounting for the Notes is that the equity component is required to be included in the additional paid-in capital section of stockholders’ equity on our Consolidated Balance Sheet, and the value of the equity component would be treated as original issue discount for purposes of accounting for the debt component of the Notes. As a result, we will be required to record a greater amount of non-cash interest expense in current periods presented as a result of the amortization of the discounted carrying value of the Notes to their face amount over the term of the Notes. We will report lower net income in our financial results because ASC 470-20 will require interest to include both the current period’s amortization of the debt discount and the instrument’s coupon interest, which could adversely affect our reported or future financial results, the trading price of our common stock and the trading price of the Notes.
In addition, under certain circumstances, convertible debt instruments (such as the Notes) that may be settled entirely or partly in cash are currently accounted for utilizing the treasury stock method, the effect of which is that the shares issuable upon conversion of the Notes are not included in the calculation of diluted earnings per share except to the extent that the conversion value of the Notes exceeds their principal amount. Under the treasury stock method, for diluted earnings per share purposes, the transaction is accounted for as if the number of shares of common stock that would be necessary to settle such excess, if we elected to settle such excess in shares, are issued. We cannot be sure that the accounting standards in the future will continue to permit the use of the treasury stock method. If we are unable to use the treasury stock method in accounting for the shares issuable upon conversion of the Notes, then our diluted earnings per share would be adversely affected.
The terms of our debt instruments may restrict our ability to pursue our business strategies.
We do not currently have any obligations outstanding under our credit facility. However, our credit facility requires us to comply with various covenants that limit our ability to take actions such as:
|
•
|
disposing of assets;
|
|
•
|
completing mergers or acquisitions;
|
|
•
|
incurring additional indebtedness;
|
|
•
|
encumbering our properties or assets;
|
|
•
|
paying dividends or making other distributions;
|
43
|
•
|
making specified investments; and
|
|
•
|
engaging in transactions with our affiliates.
|
These restrictions could limit our ability to pursue our business strategies. If we default under our credit facility and if the default is not cured or waived, the lenders could terminate their commitments to lend to us and cause any amounts outstanding to be payable immediately. Such a default could also result in cross defaults under other debt instruments. Moreover, any such default would limit our ability to obtain additional financing, which may have an adverse effect on our cash flow and liquidity.
We may need additional capital, which may not be available to us on acceptable terms or at all.
We believe that our existing cash and cash equivalents and short-term investments, together with cash generated from operations will be enough to meet our anticipated cash needs for at least the next 12 months. However, we may require additional cash resources due to changes in business conditions or other developments, such as acquisitions or investments we may decide to pursue. We may seek to borrow funds under our credit facility or sell additional equity or debt securities. The sale of additional equity or convertible debt securities could result in dilution to our existing stockholders. Any debt financing that we may secure in the future could result in additional operating and financial covenants that would limit or restrict our ability to take certain actions, such as incurring additional debt, making capital expenditures or declaring dividends. It is also possible that financing may not be available to us in amounts or on terms acceptable to us, if at all.
Risks Related to Ownership of Our Common Stock
The price of our common stock has been and will likely continue to be volatile and declines in the price of common stock could subject us to litigation.
The price of our common stock has been and is likely to continue to be volatile. For example, since January 1, 2018, our common stock’s daily closing price on Nasdaq has ranged from a low of $17.73 to a high of $57.43 through
February 21, 2019
. The price of our common stock may fluctuate significantly for numerous reasons, many of which are beyond our control, such as:
|
•
|
variations in our operating results and other financial and operational metrics, including the key financial and operating metrics disclosed in this Annual Report, as well as how those results and metrics compare to analyst and investor expectations;
|
|
•
|
forward-looking statements related to our financial guidance or projections, our failure to meet or exceed our financial guidance or projections or changes in our financial guidance or projections;
|
|
•
|
failure of analysts to initiate or maintain coverage of our company, changes in their estimates of our operating results or changes in recommendations by analysts that follow our common stock or a negative view of our financial guidance or projections and our failure to meet or exceed the estimates of such analysts;
|
|
•
|
announcements of new services or enhancements, strategic alliances or significant agreements or other developments by us or our competitors;
|
|
•
|
announcements by us or our competitors of mergers or acquisitions or rumors of such transactions involving us or our competitors;
|
|
•
|
the amount and timing of our operating expenses and the success of any cost-savings actions we take;
|
|
•
|
changes in our Board of Directors or senior management team;
|
|
•
|
disruptions in our marketplace due to hardware, software or network problems, security breaches, or other issues;
|
|
•
|
the strength of the global economy or the economy in the jurisdictions in which we operate, currency fluctuations, and market conditions in our industry and those affecting members of our community;
|
|
•
|
the trading activity of our largest stockholders;
|
|
•
|
the number of shares of our common stock that are available for public trading;
|
44
|
•
|
litigation or other claims against us;
|
|
•
|
stockholder activism;
|
|
•
|
the performance of the equity markets in general and in our industry;
|
|
•
|
the operating performance of other similar companies;
|
|
•
|
changes in legal requirements relating to our business; and
|
|
•
|
any other factors discussed in this Annual Report.
|
In addition, if the market for technology stocks or the stock market in general experiences a loss of investor confidence, the price of our common stock could decline for reasons unrelated to our business, financial performance, or growth. Stock prices of many internet and technology companies have historically been highly volatile. Some companies that have experienced volatility in the trading price of their stock have been the subject of securities class action litigation. We have experienced securities class action lawsuits in the past and may experience more such litigation following future periods of volatility or declines in our stock price. Any securities litigation, could result in substantial costs and divert our management’s attention and resources, which could adversely affect our business.
If analysts do not publish research about our business, or if they publish inaccurate or unfavorable research, our stock price and trading volume could decline.
The trading market for our common stock depends in part on the research and reports that analysts publish about our business. We do not have any control over these analysts. If one or more of the analysts who cover us downgrade our common stock or publish inaccurate or unfavorable research about our business, the price of our common stock would likely decline. If few analysts cover us, demand for our common stock could decrease and our common stock price and trading volume may decline. Similar results may occur if one or more of these analysts stop covering us in the future or fail to publish reports on us regularly.
Our stock repurchases may not achieve the desired objectives.
In November 2018, our Board of Directors approved a stock repurchase program authorizing us to repurchase up to
$200 million
of our common stock. Previously, in November 2017, our Board of Directors approved a stock repurchase program authorizing us to repurchase up to
$100 million
of our common stock, which we completed in the second quarter of 2018. There can be no assurance that these stock repurchases will enhance stockholder value because the market price of our common stock may decline below the levels at which we repurchased such shares. In addition, there is no guarantee that our stock repurchases in the past or in the future will be able to successfully mitigate the dilutive effect of recent and future employee stock option exercises and restricted stock vesting.
We do not intend to pay dividends on our capital stock, so any returns will be limited to increases in the value of our common stock.
We have never declared or paid any cash dividends on our capital stock. We currently anticipate that we will retain future earnings for the operation and expansion of our business and do not anticipate declaring any dividends in the foreseeable future. In addition, our ability to pay cash dividends on our capital stock is restricted by the terms of our credit facility. As a result, stockholders will not receive dividends or other distributions and may only receive a return on their investment if the trading price of our common stock increases.
Future sales and issuances of our common stock or rights to purchase common stock could result in additional dilution to our stockholders and could cause the price of our common stock to decline.
We may issue additional common stock, convertible securities, or other equity in the future. We also issue common stock to our employees, directors, and other service providers pursuant to our equity incentive plans. Such issuances could be dilutive to investors and could cause the price of our common stock to decline. New investors in such issuances could also receive rights senior to those of current stockholders.
45
Anti-takeover provisions in our charter documents and under Delaware law could make an acquisition of our company more difficult, could limit attempts to make changes in our management and could depress the price of our common stock.
Provisions in our certificate of incorporation and bylaws may have the effect of delaying or preventing a change in control of our company or limiting changes in our management. Among other things, these provisions:
|
•
|
provide for a classified board of directors so that not all members of our Board of Directors are elected at one time;
|
|
•
|
permit our Board of Directors to establish the number of directors and fill any vacancies and newly created directorships;
|
|
•
|
provide that directors may only be removed for cause;
|
|
•
|
require super-majority voting to amend some provisions in our certificate of incorporation and bylaws;
|
|
•
|
authorize the issuance of “blank check” preferred stock that our Board of Directors could use to implement a stockholder rights plan;
|
|
•
|
eliminate the ability of our stockholders to call special meetings of stockholders;
|
|
•
|
prohibit stockholder action by written consent, which means all stockholder actions must be taken at a meeting of our stockholders;
|
|
•
|
provide that our Board of Directors is expressly authorized to amend or repeal any provision of our bylaws;
|
|
•
|
restrict the forum for certain litigation against us to Delaware; and
|
|
•
|
require advance notice for nominations for election to our Board of Directors or for proposing matters that can be acted upon by stockholders at annual stockholder meetings.
|
These provisions may delay or prevent attempts by our stockholders to replace members of our management by making it more difficult for stockholders to replace members of our Board of Directors, which is responsible for appointing the members of our management. In addition, Section 203 of the Delaware General Corporation Law (“DGCL”) may delay or prevent a change in control of our company. Section 203 of the DGCL imposes certain restrictions on mergers, business combinations and other transactions between us and holders of 15% or more of our common stock. Anti-takeover provisions could depress the price of our common stock by acting to delay or prevent a change in control of our company.
Our certificate of incorporation provides that the Court of Chancery of the State of Delaware is the exclusive forum for substantially all disputes between us and our stockholders, which could limit our stockholders’ ability to obtain a favorable judicial forum for disputes with us or our directors, officers or employees.
Our certificate of incorporation provides that the Court of Chancery of the State of Delaware is the exclusive forum for any derivative action or proceeding brought on our behalf, any action asserting a breach of fiduciary duty, any action asserting a claim against us arising pursuant to the DGCL, our certificate of incorporation or our bylaws or any action asserting a claim against us that is governed by the internal affairs doctrine. This choice of forum provision may limit a stockholder’s ability to bring a claim in a judicial forum that it finds favorable for disputes with us or our directors, officers or other employees and may discourage these types of lawsuits. Alternatively, if a court were to find the choice of forum provision contained in our certificate of incorporation to be inapplicable or unenforceable in an action, we may incur additional costs associated with resolving such action in other jurisdictions.
46
Item 1B. Unresolved Staff Comments.
None.
Item 2. Properties.
Our headquarters are located in Brooklyn, New York where we occupy approximately 198,635 square feet under a lease that expires in 2026. We use these facilities for our principal administration, technology and development and engineering activities. Our European headquarters are located in Dublin, Ireland.
We believe that our current facilities are suitable and adequate to meet our ongoing needs and that, if we require additional space, we will be able to obtain additional facilities.
Item 3. Legal Proceedings.
See “
Note 14—Commitments and Contingencies
—
Legal Proceedings
” in the Notes to Consolidated Financial Statements.
Item 4. Mine Safety Disclosures.
Not applicable.
47
PART II.
Item 5. Market for Registrant’s Common Equity, Related Stockholder Matters and Issuer Purchases of Equity Securities.
Market for Etsy’s Common Stock
Our common stock has been listed on the Nasdaq Global Select Market under the symbol “ETSY” since April 16, 2015. Prior to that date, there was no public trading market for our common stock.
Holders of Record
As of the close of business on
February 21, 2019
, there were approximately
168
stockholders of record of our common stock. The number of stockholders of record is based upon the actual number of holders registered on this date and does not include holders of common stock in “street name” by brokers or other entities on behalf of stockholders.
Dividend Policy
We have never declared or paid cash dividends on our capital stock. We intend to retain all available funds and future earnings and do not anticipate paying cash dividends in the foreseeable future. Any future decision to declare cash dividends will be made at the discretion of our Board of Directors, subject to applicable laws and will depend on a number of factors, including our financial condition, results of operations, capital requirements, contractual restrictions, general business conditions, and other factors that our Board of Directors thinks are relevant.
Unregistered Sales of Equity Securities
On September 19, 2016, we issued
685,749
shares of our common stock to the former stockholders of Blackbird Technologies, Inc. (“Blackbird”), a machine learning company, in connection with the acquisition of Blackbird. This transaction was exempt from registration under the Securities Act pursuant to Section 4(a)(2) of the Securities Act and Regulation D.
On May 5, 2016, we issued and sold an aggregate of
80,011
shares of our common stock upon the net exercise of warrants to purchase
97,931
shares of our common stock. The shares of common stock were issued pursuant to Section 3(a)(9) of the Securities Act.
Issuer Purchases of Equity Securities
The table below provides information with respect to repurchases of shares of our common stock during
the three months ended December 31, 2018
:
|
Period
|
Total Number of Shares Purchased
|
Average Price Paid per Share(2)
|
Total Number of Shares Purchased as Part of Publicly Announced Plans or Programs(3)(4)
|
|
Approximate Dollar Value of Shares that May Yet be Purchased under the Plans or Programs
(in thousands)(3) |
||||||||
|
October 1 - 31, 2018 (1)
|
138,695
|
|
$
|
49.96
|
|
—
|
|
$
|
—
|
|
|||
|
November 1 - 30, 2018
|
676,955
|
|
47.27
|
|
676,955
|
|
168,000
|
|
|||||
|
December 1 - 31, 2018
|
239,128
|
|
54.37
|
|
239,128
|
|
155,000
|
|
|||||
|
Total
|
1,054,778
|
|
$
|
49.23
|
|
916,083
|
|
$
|
155,000
|
|
|||
|
(1)
|
The total number of shares purchased includes
138,695
shares withheld to satisfy tax withholding obligations in connection with the vesting of employee restricted stock units (“RSUs”).
|
|
(2)
|
Average price paid per share excludes broker commissions.
|
|
(3)
|
On November 6, 2018, we announced that our Board of Directors had approved a stock repurchase program for the repurchase of up to
$200 million
of our common stock. The stock repurchase program has no expiration date.
|
|
(4)
|
A portion of these shares were purchased pursuant to a 10b5-1 trading plan.
|
48
Performance Graph
The following graph shows a comparison from April 16, 2015 (the date our common stock commenced trading on Nasdaq) through
December 31, 2018
, of the cumulative total returns for our common stock, the Nasdaq Composite Index and the Russell 2000 Index. The graph assumes $100 was invested at the market close on April 16, 2015 in the common stock of Etsy, Inc. Such returns are based on historical results and are not intended to suggest future performance. The Nasdaq Composite Index and Russell 2000 Index assume reinvestment of any dividends.
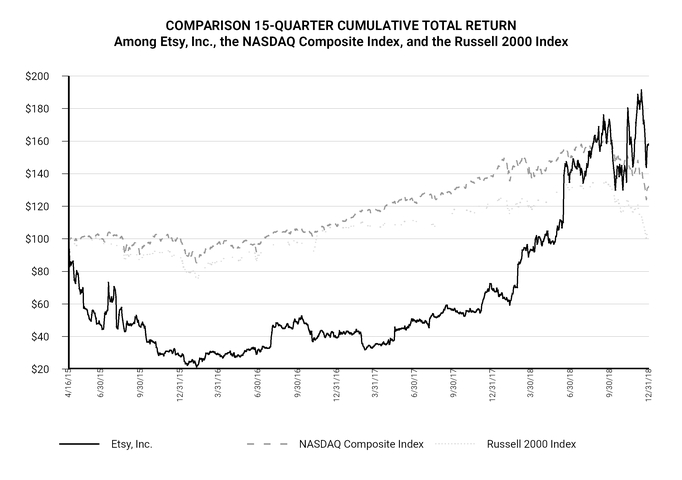
This performance graph shall not be deemed “filed” with the SEC for purposes of Section 18 of the Exchange Act, or incorporated by reference into any of our other filings under the Securities Act or the Exchange Act.
49
Item 6. Selected Consolidated Financial and Other Data.
The following tables show selected consolidated financial data. The selected Consolidated Statements of Operations data for the years ended
December 31, 2018
,
2017
, and
2016
, and the selected Consolidated Balance Sheet data as of
December 31, 2018
and
2017
, are derived from our audited Consolidated Financial Statements and related notes included elsewhere in this Annual Report on Form 10-K. The selected Consolidated Statement of Operations data for the years ended December 31,
2015
and
2014
, and the selected Consolidated Balance Sheets data as of December 31,
2016
,
2015
, and
2014
is derived from our audited Consolidated Financial Statements and related notes not included in this Annual Report.
The following tables also show certain unaudited operational and non-GAAP financial measures as well as a reconciliation between certain GAAP and non-GAAP measures. The selected consolidated financial data and key metrics should be read together with “
Management
’
s Discussion and Analysis of Financial Condition and Results of Operations
” and our Consolidated Financial Statements and related notes included elsewhere in this Annual Report. See “
Management
’
s Discussion and Analysis of Financial Condition and Results of Operations
—
Key Operating and Financial Metrics
” for the definitions of the following terms: “active buyer,” “active seller,” “Adjusted EBITDA,” “GMS,” “international GMS,” and “mobile GMS.”
Our historical results and key metrics are not necessarily indicative of future results.
|
|
Year Ended December 31,
|
||||||||||||||||||
|
|
2018
|
2017
|
2016
|
2015
|
2014
|
||||||||||||||
|
|
(in thousands except share and per share amounts)
|
||||||||||||||||||
|
Consolidated Statements of Operations Data:
|
|||||||||||||||||||
|
Revenue:
|
|||||||||||||||||||
|
Marketplace (1)
|
$
|
440,740
|
|
$
|
326,076
|
|
$
|
269,628
|
|
$
|
204,333
|
|
$
|
156,821
|
|
||||
|
Services (1)
|
158,928
|
|
111,869
|
|
89,433
|
|
64,923
|
|
34,413
|
|
|||||||||
|
Other
|
4,025
|
|
3,286
|
|
5,906
|
|
4,243
|
|
4,357
|
|
|||||||||
|
Total revenue
|
603,693
|
|
441,231
|
|
364,967
|
|
273,499
|
|
195,591
|
|
|||||||||
|
Cost of revenue (2)(3)
|
190,762
|
|
150,986
|
|
123,328
|
|
96,979
|
|
73,633
|
|
|||||||||
|
Gross profit
|
412,931
|
|
290,245
|
|
241,639
|
|
176,520
|
|
121,958
|
|
|||||||||
|
Operating expenses:
|
|||||||||||||||||||
|
Marketing (2)(3)
|
158,013
|
|
109,085
|
|
82,248
|
|
66,771
|
|
39,655
|
|
|||||||||
|
Product development (2)(3)
|
97,249
|
|
74,616
|
|
55,083
|
|
42,694
|
|
36,634
|
|
|||||||||
|
General and administrative (2)(3)
|
82,883
|
|
91,486
|
|
86,180
|
|
68,939
|
|
51,920
|
|
|||||||||
|
Asset impairment charges
|
—
|
|
3,162
|
|
551
|
|
—
|
|
—
|
|
|||||||||
|
Total operating expenses
|
338,145
|
|
278,349
|
|
224,062
|
|
178,404
|
|
128,209
|
|
|||||||||
|
Income (loss) from operations
|
74,786
|
|
11,896
|
|
17,577
|
|
(1,884
|
)
|
(6,251
|
)
|
|||||||||
|
Other (expense) income, net
|
(19,708
|
)
|
20,369
|
|
(20,453
|
)
|
(26,110
|
)
|
(4,009
|
)
|
|||||||||
|
Income (loss) before income taxes
|
55,078
|
|
32,265
|
|
(2,876
|
)
|
(27,994
|
)
|
(10,260
|
)
|
|||||||||
|
Benefit (provision) for income taxes (4)
|
22,413
|
|
49,535
|
|
(27,025
|
)
|
(26,069
|
)
|
(4,983
|
)
|
|||||||||
|
Net income (loss)
|
$
|
77,491
|
|
$
|
81,800
|
|
$
|
(29,901
|
)
|
$
|
(54,063
|
)
|
$
|
(15,243
|
)
|
||||
|
Net income (loss) per share attributable to common stockholders:
|
|||||||||||||||||||
|
Basic
|
$
|
0.64
|
|
$
|
0.69
|
|
$
|
(0.26
|
)
|
$
|
(0.59
|
)
|
$
|
(0.38
|
)
|
||||
|
Diluted
|
$
|
0.61
|
|
$
|
0.68
|
|
$
|
(0.26
|
)
|
$
|
(0.59
|
)
|
$
|
(0.38
|
)
|
||||
|
Weighted average common shares outstanding:
|
|||||||||||||||||||
|
Basic
|
120,146,076
|
|
118,538,687
|
|
113,562,738
|
|
91,122,291
|
|
40,246,663
|
|
|||||||||
|
Diluted
|
127,084,785
|
|
122,267,673
|
|
113,562,738
|
|
91,122,291
|
|
40,246,663
|
|
|||||||||
50
|
(1)
|
In connection with the adoption of ASU 2014-09
—
Revenue from Contracts with Customers (“ASC 606”) in the first quarter of 2018, we renamed our revenue categories Marketplace and Services revenue. In addition, we reclassified Etsy Payments from Services to Marketplace revenue as described in “
Note 2—Revenue
.” The following table provides our Marketplace and Services revenue under our previous and current presentation:
|
|
Year-to-Date Period Ended
|
|||||||||||||||
|
Previous Presentation
|
Updated Presentation
|
||||||||||||||
|
Marketplace Revenue
|
Services Revenue
|
Marketplace Revenue
|
Services Revenue
|
||||||||||||
|
(in thousands)
|
|||||||||||||||
|
December 31, 2017
|
$
|
179,492
|
|
$
|
258,453
|
|
$
|
326,076
|
|
$
|
111,869
|
|
|||
|
December 31, 2016
|
158,204
|
|
200,857
|
|
269,628
|
|
89,433
|
|
|||||||
|
December 31, 2015
|
132,648
|
|
136,608
|
|
204,333
|
|
64,923
|
|
|||||||
|
December 31, 2014
|
108,732
|
|
82,502
|
|
156,821
|
|
34,413
|
|
|||||||
|
(2)
|
Includes total stock-based compensation expense as follows:
|
|
|
Year Ended December 31,
|
||||||||||||||||||
|
|
2018
|
2017
|
2016
|
2015
|
2014
|
||||||||||||||
|
|
(in thousands)
|
||||||||||||||||||
|
Cost of revenue
|
$
|
3,357
|
|
$
|
1,739
|
|
$
|
1,057
|
|
$
|
871
|
|
$
|
1,113
|
|
||||
|
Marketing
|
2,507
|
|
1,933
|
|
971
|
|
560
|
|
216
|
|
|||||||||
|
Product development
|
21,234
|
|
8,274
|
|
5,079
|
|
2,860
|
|
1,461
|
|
|||||||||
|
General and administrative
|
11,133
|
|
14,613
|
|
8,794
|
|
6,550
|
|
7,260
|
|
|||||||||
|
Total stock-based compensation expense
|
$
|
38,231
|
|
$
|
26,559
|
|
$
|
15,901
|
|
$
|
10,841
|
|
$
|
10,050
|
|
||||
|
(3)
|
Includes the impact of
$0.2 million
in restructuring and other exit income recognized in the year ended
December 31, 2018
and
$13.9 million
in restructuring and other exit costs recognized in the year ended
December 31, 2017
. For a summary of restructuring and other exit costs (income), see “
Note 17—Restructuring and Other Exit Costs (Income)
” in the Notes to Consolidated Financial Statements.
|
|
(4)
|
In the year ended
December 31, 2018
, we recognized an income tax benefit associated with the release of a valuation allowance on certain deferred tax assets. The valuation allowance release resulted in a non-recurring benefit for income taxes of
$23.4 million
for the year ended
December 31, 2018
. In the year ended
December 31, 2017
, we recognized an income tax benefit associated with the enactment of the Tax Cuts and Jobs Act (the “TCJA”). As a result of the TCJA, our deferred taxes at
December 31, 2017
have been revalued at the reduced 21% corporate income tax rate. The revaluation resulted in a non-recurring benefit for income taxes of approximately
$31.1 million
for the year ended
December 31, 2017
.
|
|
|
Year Ended December 31,
|
||||||||||||||||||
|
|
2018
|
2017
|
2016
|
2015
|
2014
|
||||||||||||||
|
|
(in thousands except percentages)
|
||||||||||||||||||
|
Other Operational and Non-GAAP Financial Data:
|
|||||||||||||||||||
|
GMS
|
$
|
3,931,745
|
|
$
|
3,253,609
|
|
$
|
2,841,985
|
|
$
|
2,388,387
|
|
$
|
1,931,981
|
|
||||
|
Adjusted EBITDA
|
$
|
139,510
|
|
$
|
80,009
|
|
$
|
57,124
|
|
$
|
31,007
|
|
$
|
23,081
|
|
||||
|
Active sellers
|
2,115
|
|
1,933
|
|
1,748
|
|
1,563
|
|
1,353
|
|
|||||||||
|
Active buyers
|
39,447
|
|
33,364
|
|
28,566
|
|
24,046
|
|
19,810
|
|
|||||||||
|
Percent mobile GMS
|
55
|
%
|
51
|
%
|
48
|
%
|
43
|
%
|
37
|
%
|
|||||||||
|
Percent international GMS
|
35
|
%
|
33
|
%
|
30
|
%
|
30
|
%
|
31
|
%
|
|||||||||
51
|
Year Ended December 31,
|
|||||||||||||||||||
|
2018
|
2017
|
2016
|
2015
|
2014
|
|||||||||||||||
|
(in thousands)
|
|||||||||||||||||||
|
Net income (loss)
|
$
|
77,491
|
|
$
|
81,800
|
|
$
|
(29,901
|
)
|
$
|
(54,063
|
)
|
$
|
(15,243
|
)
|
||||
|
Excluding:
|
|||||||||||||||||||
|
Interest and other non-operating expense, net
|
13,221
|
|
8,736
|
|
5,502
|
|
1,202
|
|
549
|
|
|||||||||
|
(Benefit) provision for income taxes
|
(22,413
|
)
|
(49,535
|
)
|
27,025
|
|
26,069
|
|
4,983
|
|
|||||||||
|
Depreciation and amortization
|
26,742
|
|
27,197
|
|
22,525
|
|
18,550
|
|
17,223
|
|
|||||||||
|
Stock-based compensation expense (1)
|
34,477
|
|
19,953
|
|
13,168
|
|
8,981
|
|
5,920
|
|
|||||||||
|
Stock-based compensation expense—acquisitions
|
3,754
|
|
3,904
|
|
2,733
|
|
1,860
|
|
4,130
|
|
|||||||||
|
Foreign exchange loss (gain)
|
6,487
|
|
(29,105
|
)
|
14,951
|
|
21,775
|
|
3,049
|
|
|||||||||
|
Restructuring and other exit costs (income)
|
(249
|
)
|
13,897
|
|
—
|
|
—
|
|
—
|
|
|||||||||
|
Asset impairment charges
|
—
|
|
3,162
|
|
551
|
|
—
|
|
—
|
|
|||||||||
|
Acquisition-related expenses
|
—
|
|
—
|
|
570
|
|
—
|
|
2,059
|
|
|||||||||
|
Net unrealized loss on warrant and other liabilities
|
—
|
|
—
|
|
—
|
|
3,133
|
|
411
|
|
|||||||||
|
Contribution to Good Work Institute (formerly Etsy.org)
|
—
|
|
—
|
|
—
|
|
3,500
|
|
—
|
|
|||||||||
|
Adjusted EBITDA
|
$
|
139,510
|
|
$
|
80,009
|
|
$
|
57,124
|
|
$
|
31,007
|
|
$
|
23,081
|
|
||||
|
(1)
|
$2.7 million
of restructuring-related stock-based compensation expense has been excluded from the year ended
December 31, 2017
, and is included in the restructuring and other exit costs (income) line.
|
|
|
As of December 31,
|
||||||||||||||||||
|
|
2018
|
2017
|
2016
|
2015
|
2014
|
||||||||||||||
|
|
(in thousands)
|
||||||||||||||||||
|
Consolidated Balance Sheet Data:
|
|||||||||||||||||||
|
Cash, cash equivalents and short-term investments
|
$
|
624,287
|
|
$
|
340,550
|
|
$
|
282,086
|
|
$
|
292,864
|
|
$
|
88,843
|
|
||||
|
Net working capital
|
568,227
|
|
336,787
|
|
287,024
|
|
278,932
|
|
85,608
|
|
|||||||||
|
Total assets
|
901,851
|
|
605,583
|
|
581,193
|
|
553,061
|
|
246,203
|
|
|||||||||
|
Deferred revenue
|
7,478
|
|
6,262
|
|
5,648
|
|
4,712
|
|
3,452
|
|
|||||||||
|
Long-term debt, net (1)
|
276,486
|
|
—
|
|
—
|
|
—
|
|
—
|
|
|||||||||
|
Long-term liabilities
|
388,891
|
|
106,212
|
|
152,428
|
|
142,441
|
|
57,450
|
|
|||||||||
|
Convertible preferred stock
|
—
|
|
—
|
|
—
|
|
—
|
|
80,212
|
|
|||||||||
|
Total stockholders’ equity
|
400,898
|
|
396,894
|
|
344,757
|
|
330,498
|
|
67,088
|
|
|||||||||
|
(1)
|
In
March 2018
, we issued
$345.0 million
aggregate principal amount of
0%
Convertible Senior Notes due
2023
in a private placement to qualified institutional buyers pursuant to Rule 144A under the Securities Act. For more information on the Notes, see “
Note 13—Debt
” in the Notes to Consolidated Financial Statements.
|
52
Item 7.
Management
’
s Discussion and Analysis of Financial Condition and Results of Operations
.
You should read the following discussion and analysis of our financial condition and results of operations together with our Consolidated Financial Statements and related notes and other financial information included elsewhere in this
Annual
Report on Form
10-K
. This discussion, particularly information with respect to our outlook, our plans and strategy for our business and our performance and future success, includes forward-looking statements that involve risks and uncertainties. Our actual results could differ materially from those discussed below. Factors that could cause or contribute to these differences include those discussed below and elsewhere in this
Annual
Report, particularly in the “Risk Factors” section. For more information regarding key factors affecting our performance, see “
Key Factors Affecting Our Performance
” below.
Overview
Business
Etsy is the global two-sided marketplace for unique and creative goods. Our mission is to “Keep Commerce Human,” and we’re committed to using the power of business and technology to strengthen communities and empower people around the world. We connect creative entrepreneurs with thoughtful consumers looking for items that are intended to be special, reflect their sense of style, or represent a meaningful occasion.
Our sellers are the heart and soul of Etsy, and our technology platform allows our sellers to turn their creative passions into economic opportunity. We have a seller-aligned business model: we make money when our sellers make money. We offer our sellers a marketplace with millions of buyers along with a range of seller tools and services that are specifically designed to help our creative entrepreneurs generate more sales and scale their businesses.
We are focused on attracting potential buyers to the Etsy marketplace for “special” purchase occasions throughout the year and deepening engagement with our existing buyers by inspiring purchases across multiple categories and special occasions. These special purchase occasions can occur many times throughout the year and include shopping that reflects an individual's unique style; gifting that demonstrates thought and care; and celebrations that express creativity and fun. Buyers tell us that they come to Etsy because Etsy sellers offer items that they can’t find anywhere else. Special purchase occasions happen throughout the year when a buyer is decorating a home, dressing for an event, celebrating a special moment, or buying a gift for someone special.
Our revenue is diversified, generated from a mix of marketplace activities and other optional services we provide to Etsy sellers to help them generate more sales and scale their businesses.
Marketplace revenue is comprised of the fees an Etsy seller pays us for marketplace activities. Marketplace activities include listing an item for sale, completing transactions between a buyer and a seller, and using Etsy Payments to process payments, including foreign currency payments. Revenue from Etsy Payments, our payment processing product, included in Services revenue prior to 2018, is now included in Marketplace revenue because Etsy Payments is required to be used by Etsy sellers in the countries where it is available.
Services revenue, called Seller Services revenue prior to 2018, is comprised of the fees an Etsy seller pays us for our optional other services (“Services”). Services include Promoted Listings, our on-site advertising service that allows sellers to pay for prominent placement of their listings in search results; Etsy Shipping Labels, which allows sellers in the United States, Canada, United Kingdom, and Australia to purchase discounted shipping labels; Pattern, a service that allows sellers to build custom websites; and Etsy Plus, a subscription offering that provides sellers with enhanced tools and credits for use on our platform.
We also generate additional revenue through our commercial partnerships, which is classified as other revenue.
Our strategy is focused on growing our Etsy.com marketplace in our six core geographies and building a sustainable competitive advantage around four areas of our business that we believe differentiate us from our competitors, or what we call our “Right to Win.”
The foundation of Etsy’s competitive advantage is our collection of unique items, which, we believe, when combined with best-in-class search and discovery, human connections, and a trusted brand, will enable us to continue to stand out among other ecommerce platforms and marketplaces. Our investments in product, marketing, and talent will be focused on capitalizing on these four areas of our business. Ultimately, the goal of our long-term strategy is to drive more new buyers to the website, give existing buyers reasons to come back more often, and fuel success for our sellers.
53
Year Highlights
Total revenue was
$603.7 million
in
the year ended December 31, 2018
, driven by growth in both Marketplace and Services revenue. In
the year ended December 31, 2018
, we recorded
net income
of
$77.5 million
, and non-GAAP Adjusted EBITDA of
$139.5 million
. See “
Non-GAAP Financial Measures
” for more information and for a reconciliation of Adjusted EBITDA to
net income (loss)
, the most directly comparable financial measure calculated in accordance with GAAP.
As of
December 31, 2018
, our marketplace connected
2.1 million
active Etsy sellers and
39.4 million
active Etsy buyers, in nearly every country in the world. In
the year ended December 31, 2018
, Etsy sellers generated GMS of
$3.9 billion
, of which approximately
55%
came from purchases made on mobile devices. We are a global company and
35%
of our GMS in
the year ended December 31, 2018
came from transactions where either an Etsy seller or an Etsy buyer was located outside of the United States.
2018 Pricing Updates
Effective July 16, 2018, we increased our seller transaction fee from 3.5% to 5%, and now apply it to the cost of shipping in addition to the cost of the item. The revised fee structure is intended to support increased investments in the growth and health of the marketplace. We believe these pricing updates will continue to have a positive effect on revenue
.
We also announced new subscription packages and enhanced tools that are intended to support global sellers at different stages of their business life cycles. In mid-July, we launched Etsy Plus, which sellers can opt into for $10 per month. Sellers may also choose Etsy Standard and continue to have access to the same tools and services that are already available on Etsy without an additional monthly fee. Given that our learnings on subscription packages are still nascent, we are continuing to evaluate and learn from the recent launch of Etsy Plus and will evaluate the best strategy for our current and planned subscription packages going forward as we optimize for seller success.
Other Operational Highlights
In 2018 we focused on growing our Etsy.com marketplace in our core geographies, and owning special purchase occasions – style, gifting, and celebrations – throughout the year. Below are key operational highlights:
|
•
|
We continued to launch new product enhancements and build upon prior launches to help buyers find the right product at the right time, or discover inspiration among the items in our marketplace. We improved search relevance using context specific ranking (“CSR”), optimized landing pages by adding more recommendations and notifications, including alerts on listing cards when scarce items appear in other people’s carts, and reduced friction in the search and discovery experience by accelerating home and search page load times.
|
|
•
|
We launched several product enhancements aimed at bolstering trust in the Etsy brand, Etsy sellers, the items available in our marketplace, and the overall Etsy experience. We made customer support improvements by introducing live chat for our sellers and inbound phone support for both buyers and sellers. We improved our checkout experience to make it easier for buyers to provide information for personalization and customization details on the listing and cart pages, enhanced guest checkout on mobile web and introduced Klarna, a pay later option for buyers in Germany. We also added trust signals to give more confidence in making a purchase decision, including best-seller badges on listing cards and shop review ratings on the cart page.
|
|
•
|
We continued to focus on utilizing our marketing efforts to drive new and existing buyers to Etsy. We made structural improvements to Search Engine Optimization, one of our largest channels, to drive incremental traffic to Etsy. We began sending on-site and email notifications to inform buyers when one of their recently favorited items goes on sale. Additionally, following the increase in our marketplace transaction fee, we were able to invest a portion of our incremental revenue into marketing. We ran our first-ever television advertising campaign in the U.S and also began to test offline marketing campaigns.
|
|
•
|
We continued to enhance, expand and introduce new product offerings and seller tools. We optimized Promoted Listings by using context specific ranking to surface more relevant ads, and launched a tool to better utilize seller’s budgets. We focused on shipping improvements, including the expansion of the Etsy Shipping Labels offering to our sellers in the United Kingdom and Australia through our new agreements with Royal Mail and DAI Post. We also launched Etsy Plus and Targeted Offers, new products and tools designed to give sellers more ways to grow their businesses and brands. Additionally, we launched a redesigned payment account intended to make it easier to manage
|
54
all seller shop finances in one place, and have begun to process charges in the seller’s ledger currency and automatically deduct fees and applicable taxes from the seller’s money earned through sales using Etsy Payments.
We have also focused on growth investments, such as our migration to Google Cloud. In 2018, we achieved a significant milestone in the process by successfully migrating our website and mobile apps to Google Cloud. We expect to complete the migration by the beginning of 2020, and anticipate spending approximately
$25 million
on cloud migration in 2019. Additionally, during the migration we will maintain some of our existing data center infrastructure to ensure the reliability of our platform. We believe that moving to Google Cloud is positioning us well for growth by allowing us to focus on strategic initiatives, enhance site performance, and improve engineering efficiency.
Reclassification of Revenue Categories
In connection with the adoption of ASU 2014-09
—Revenue from Contracts with Customers (
“ASC 606”) in the first quarter of 2018, we renamed our revenue categories Marketplace and Services revenue. In addition, we reclassified Etsy Payments from Services to Marketplace revenue as described in “
Business
” above.
The following table provides our Marketplace and Services revenue under our previous and current presentation for the years ended December 31, 2017 and 2016:
|
Year-to-Date Period Ended
|
|||||||||||||||
|
Previous Presentation
|
Updated Presentation
|
||||||||||||||
|
Marketplace Revenue
|
Services Revenue
|
Marketplace Revenue
|
Services Revenue
|
||||||||||||
|
(in thousands)
|
|||||||||||||||
|
December 31, 2017
|
$
|
179,492
|
|
$
|
258,453
|
|
$
|
326,076
|
|
$
|
111,869
|
|
|||
|
December 31, 2016
|
158,204
|
|
200,857
|
|
269,628
|
|
89,433
|
|
|||||||
Key Operating and Financial Metrics
We collect and analyze operating and financial data to evaluate the health and performance of our business and allocate our resources (such as capital, people and technology investments). The unaudited non-GAAP financial measure and key operating and financial metrics we use are:
|
|
Year Ended December 31,
|
% Growth
(Decline)
Y/Y |
Year Ended December 31,
|
% Growth
Y/Y |
||||||||||||||
|
|
2018
|
2017
|
2016
|
|||||||||||||||
|
|
(in thousands except percentages)
|
|||||||||||||||||
|
GMS
|
$
|
3,931,745
|
|
$
|
3,253,609
|
|
20.8
|
%
|
$
|
2,841,985
|
|
14.5
|
%
|
|||||
|
Revenue
|
$
|
603,693
|
|
$
|
441,231
|
|
36.8
|
%
|
$
|
364,967
|
|
20.9
|
%
|
|||||
|
Marketplace revenue
|
$
|
440,740
|
|
$
|
326,076
|
|
35.2
|
%
|
$
|
269,628
|
|
20.9
|
%
|
|||||
|
Services revenue
|
$
|
158,928
|
|
$
|
111,869
|
|
42.1
|
%
|
$
|
89,433
|
|
25.1
|
%
|
|||||
|
Net income (loss)
|
$
|
77,491
|
|
$
|
81,800
|
|
(5.3
|
)%
|
$
|
(29,901
|
)
|
373.6
|
%
|
|||||
|
Adjusted EBITDA
|
$
|
139,510
|
|
$
|
80,009
|
|
74.4
|
%
|
$
|
57,124
|
|
40.1
|
%
|
|||||
|
Active sellers
|
2,115
|
|
1,933
|
|
9.4
|
%
|
1,748
|
|
10.6
|
%
|
||||||||
|
Active buyers
|
39,447
|
|
33,364
|
|
18.2
|
%
|
28,566
|
|
16.8
|
%
|
||||||||
|
Percent mobile GMS
|
55
|
%
|
51
|
%
|
400
|
bps
|
48
|
%
|
300
|
bps
|
||||||||
|
Percent international GMS
|
35
|
%
|
33
|
%
|
200
|
bps
|
30
|
%
|
300
|
bps
|
||||||||
GMS
Gross merchandise sales (“GMS”) is the dollar value of items sold in our marketplace within the applicable period, excluding shipping fees and net of refunds associated with canceled transactions. GMS does not represent revenue earned by Etsy. GMS is largely driven by transactions in our marketplace and is not directly impacted by Services activity. However, because our revenue and cost of revenue depend significantly on the dollar value of items sold in our marketplace, we believe that GMS is an indicator of the success of Etsy sellers, the satisfaction of Etsy buyers, and the health, scale, and growth of our business.
55
Adjusted EBITDA
Adjusted EBITDA represents our
net income (loss)
adjusted to exclude:
interest and other non-operating expense, net
;
(benefit) provision for income taxes
;
depreciation and amortization
;
stock-based compensation expense
;
foreign exchange loss (gain)
; restructuring and other exit costs (income) related to the Actions discussed in “
Non-GAAP Financial Measures
;”
asset impairment charges
;
acquisition-related expenses
;
net unrealized loss on warrant and other liabilities
; and
contributions to Good Work Institute (formerly Etsy.org)
. See “
Non-GAAP Financial Measures
” for more information regarding our use of Adjusted EBITDA, including its limitations as a financial measure, and for a reconciliation of Adjusted EBITDA to
net income (loss)
, the most directly comparable financial measure calculated in accordance with GAAP.
Active Sellers
An active seller is an Etsy seller who has incurred at least one charge from us in the last 12 months. Charges include Marketplace, Services, and Other Revenue fees discussed in “
Note 1—Basis of Presentation and Summary of Significant Accounting Policies
—Revenue Recognition” in the Notes to Consolidated Financial Statements. An Etsy seller is identified by a unique e-mail address; a single person can have multiple Etsy seller accounts. We succeed when Etsy sellers succeed, so we view the number of active sellers as a key indicator of the awareness of our brand, the reach of our platform, the potential for growth in GMS and revenue, and the health of our business.
Active Buyers
An active buyer is an Etsy buyer who has made at least one purchase in the last 12 months. An Etsy buyer is identified by a unique e-mail address; a single person can have multiple Etsy buyer accounts. We generate revenue when Etsy buyers order items from Etsy sellers, so we view the number of active buyers as a key indicator of our potential for growth in GMS and revenue, the reach of our platform, awareness of our brand, the engagement and loyalty of Etsy buyers, and the health of our business.
Mobile GMS
Mobile GMS is GMS that results from a transaction completed on a mobile device, such as a tablet or a smartphone. Mobile GMS excludes A Little Market (“ALM”) and Etsy Wholesale and orders initiated on mobile devices but ultimately completed on a desktop. When calculating percent mobile GMS, we do not take into account refunds associated with canceled transactions. We believe that mobile GMS indicates our success in converting mobile activity into mobile purchases and demonstrates our ability to grow GMS and revenue.
International GMS
International GMS is GMS from transactions where either the billing address for the Etsy seller or the shipping address for the Etsy buyer at the time of sale is outside of the United States. When calculating percent international GMS, we do not take into account refunds associated with canceled transactions. We believe that international GMS shows the level of engagement of our community outside the United States and demonstrates our ability to grow GMS and revenue.
Currency-Neutral GMS Growth
We calculate currency-neutral GMS growth by translating current period GMS for goods sold that were listed in non-U.S. dollar currencies into U.S. dollars using prior year foreign currency exchange rates.
As reported and currency-neutral GMS growth for the periods presented below is as follows:
|
|
Year-to-Date Period Ended
|
|||||||
|
As Reported
|
Currency-Neutral
|
FX Impact
|
||||||
|
December 31, 2018
|
20.8
|
%
|
20.4
|
%
|
0.4
|
%
|
||
|
December 31, 2017
|
14.5
|
%
|
14.3
|
%
|
0.2
|
%
|
||
|
December 31, 2016
|
19.0
|
%
|
20.0
|
%
|
(1.0
|
)%
|
||
56
Non-GAAP Financial Measures
Adjusted EBITDA
In this Annual Report on Form 10-K, we provide Adjusted EBITDA, a non-GAAP financial measure that represents our
net income (loss)
adjusted to exclude:
interest and other non-operating expense, net
;
(benefit) provision for income taxes
;
depreciation and amortization
;
stock-based compensation expense
;
foreign exchange loss (gain)
; restructuring and other exit costs (income) related to the Actions as defined below;
asset impairment charges
; and
acquisition-related expenses
. Below is a reconciliation of Adjusted EBITDA to
net income (loss)
, the most directly comparable GAAP financial measure.
We have included Adjusted EBITDA because it is a key measure used by our management and Board of Directors to evaluate our operating performance and trends, allocate internal resources, prepare and approve our annual budget, develop short- and long-term operating plans, determine incentive compensation, and assess the health of our business. As our Adjusted EBITDA increases, we are able to invest more in our platform.
We believe that Adjusted EBITDA can provide a useful measure for period-to-period comparisons of our business as it removes the impact of certain non-cash items and certain variable charges.
Adjusted EBITDA has limitations as an analytical tool, and you should not consider it in isolation or as a substitute for analysis of our results as reported under GAAP. Some of these limitations are:
|
•
|
Adjusted EBITDA does not reflect other non-operating expenses, net of other non-operating income, including net interest expense;
|
|
•
|
Adjusted EBITDA does not reflect tax payments that may represent a reduction in cash available to us;
|
|
•
|
although depreciation and amortization are non-cash charges, the assets being depreciated and amortized may have to be replaced in the future, and Adjusted EBITDA does not reflect cash capital expenditure requirements for such replacements or for new capital expenditure requirements;
|
|
•
|
Adjusted EBITDA does not consider the impact of
stock-based compensation expense
;
|
|
•
|
Adjusted EBITDA does not consider the impact of
foreign exchange loss (gain)
;
|
|
•
|
Adjusted EBITDA does not consider the impact of restructuring and other exit costs (income) related to the Actions as described below;
|
|
•
|
Adjusted EBITDA does not consider the impact of
asset impairment charges
;
|
|
•
|
Adjusted EBITDA does not reflect
acquisition-related expenses
; and
|
|
•
|
other companies, including companies in our industry, may calculate Adjusted EBITDA differently, which reduces its usefulness as a comparative measure.
|
Because of these limitations, you should consider Adjusted EBITDA alongside other financial performance measures, including
net income (loss)
and our other GAAP results.
57
The following table reflects the reconciliation of
net income (loss)
to Adjusted EBITDA for each of the periods indicated:
|
|
Year Ended December 31,
|
||||||||||
|
|
2018
|
2017
|
2016
|
||||||||
|
|
(in thousands)
|
||||||||||
|
Net income (loss)
|
$
|
77,491
|
|
$
|
81,800
|
|
$
|
(29,901
|
)
|
||
|
Excluding:
|
|||||||||||
|
Interest and other no
n-operating expense, net (1)
|
13,221
|
|
8,736
|
|
5,502
|
|
|||||
|
(Benefit) provision for income taxes
|
(22,413
|
)
|
(49,535
|
)
|
27,025
|
|
|||||
|
Depreciation and amortization (1)
|
26,742
|
|
27,197
|
|
22,525
|
|
|||||
|
Stock-based compensation expense (2)
|
34,477
|
|
19,953
|
|
13,168
|
|
|||||
|
Stock-based compensation expense—acquisitions
|
3,754
|
|
3,904
|
|
2,733
|
|
|||||
|
Foreign exchange loss (gain) (3)
|
6,487
|
|
(29,105
|
)
|
14,951
|
|
|||||
|
Restructuring and other exit costs (income) (4)
|
(249
|
)
|
13,897
|
|
—
|
|
|||||
|
Asset impairment charges (5)
|
—
|
|
3,162
|
|
551
|
|
|||||
|
Acquisition-related expenses
|
—
|
|
—
|
|
570
|
|
|||||
|
Adjusted EBITDA
|
$
|
139,510
|
|
$
|
80,009
|
|
$
|
57,124
|
|
||
(1) Included in interest and depreciation expense amounts above are interest and depreciation expense related to our headquarters under build-to-suit accounting requirements, which commenced in May 2016. For the
year
s ended
December 31, 2018
,
2017
, and
2016
those amounts are as follows:
|
Year Ended December 31,
|
|||||||||||
|
2018
|
2017
|
2016
|
|||||||||
|
|
(in thousands)
|
||||||||||
|
Interest expense
|
$
|
8,996
|
|
$
|
9,000
|
|
$
|
5,337
|
|
||
|
Depreciation
|
3,276
|
|
3,276
|
|
2,186
|
|
|||||
(2)
$2.7 million
of restructuring-related stock-based compensation expense has been excluded from the year ended
December 31, 2017
and is included in the restructuring and other exit costs (income) line. See footnote (4) below. Total stock-based compensation expense included in the Consolidated Statements of Operations is as follows:
|
|
Year Ended December 31,
|
||||||||||
|
|
2018
|
2017
|
2016
|
||||||||
|
|
(in thousands)
|
||||||||||
|
Cost of revenue
|
$
|
3,357
|
|
$
|
1,739
|
|
$
|
1,057
|
|
||
|
Marketing
|
2,507
|
|
1,933
|
|
971
|
|
|||||
|
Product development
|
21,234
|
|
8,274
|
|
5,079
|
|
|||||
|
General and administrative
|
11,133
|
|
14,613
|
|
8,794
|
|
|||||
|
Total stock-based compensation expense
|
$
|
38,231
|
|
$
|
26,559
|
|
$
|
15,901
|
|
||
|
(3)
|
See “
Results of Operations
—
Other (Expense) Income, net
” for more information on the fluctuation in foreign exchange loss (gain) in the years ended
December 31, 2018
,
2017
, and
2016
.
|
(4) Total restructuring and other exit costs (income) included in the Consolidated Statements of Operations are as follows:
|
|
Year Ended December 31,
|
||||||||||
|
|
2018
|
2017
|
2016
|
||||||||
|
|
(in thousands)
|
||||||||||
|
Cost of revenue
|
$
|
(19
|
)
|
$
|
738
|
|
$
|
—
|
|
||
|
Marketing
|
(82
|
)
|
2,950
|
|
—
|
|
|||||
|
Product development
|
(110
|
)
|
3,232
|
|
—
|
|
|||||
|
General and administrative
|
(38
|
)
|
6,977
|
|
—
|
|
|||||
|
Total restructuring and other exit costs (income)
|
$
|
(249
|
)
|
$
|
13,897
|
|
$
|
—
|
|
||
58
|
(5)
|
In the fourth quarter of 2017, we made the decision to discontinue certain product offerings, including Etsy Studio and Etsy Manufacturing, which resulted in the recognition of a $3.2 million impairment charge to write the related capitalized web development and internal-use software assets down to zero. This decision was based on our strategy to focus on the growth of the Etsy.com marketplace.
|
Consolidated Statement of Operations Line Items Excluding Restructuring and Other Exit Costs (Income)
In the second quarter of 2017, the Board of Directors approved plans to increase efficiency and streamline our cost structure and improve focus on key strategic growth opportunities (the “Actions”). In this Annual Report, we discuss certain financial statement line items excluding restructuring and other exit costs (income), each non-GAAP financial measure that represents the income statement line item adjusted to exclude restructuring and other exit costs (income) incurred in the years ended
December 31, 2018
and
2017
.
We have included these financial statement line items excluding restructuring and other exit costs (income) because the Actions were unusual and do not necessarily reflect the ongoing trends in these financial statement line items. We believe that these non-GAAP measures can provide a useful measure for period-to-period comparisons of our business as they remove the impact of the Actions.
These non-GAAP measures have limitations as analytical tools, and you should not consider them in isolation or as a substitute for analysis of our results as reported under GAAP. Some of these limitations are:
|
•
|
many of these costs were settled in cash;
|
|
•
|
there is no certainty that restructuring and other exit costs (income) will not recur; and
|
|
•
|
other companies, including companies in our industry, may adjust for similar items in a different manner, or may not exclude such charges, which reduces its usefulness as a comparative measure.
|
Because of these limitations, you should consider these non-GAAP measures alongside other financial performance measures, including the GAAP financial statement line items.
Reconciliation of GAAP Consolidated Statement of Operations Line Items to Non-GAAP Line Items Excluding Restructuring and Other Exit Costs (Income)
The following table reflects the reconciliation of each affected GAAP line item of the Consolidated Statement of Operations to the non-GAAP line item excluding restructuring and other exit costs (income) for each of the periods indicated:
|
Year Ended December 31, 2018
|
|||||||||||
|
As Reported
|
Restructuring and Other Exit Costs (Income)
|
Excluding Restructuring and Other Exit Costs (Income)
|
|||||||||
|
(in thousands)
|
|||||||||||
|
Revenue
|
$
|
603,693
|
|
$
|
—
|
|
$
|
603,693
|
|
||
|
Cost of revenue
|
190,762
|
|
(19
|
)
|
190,781
|
|
|||||
|
Gross profit
|
412,931
|
|
(19
|
)
|
412,912
|
|
|||||
|
Operating expenses:
|
|||||||||||
|
Marketing
|
158,013
|
|
(82
|
)
|
158,095
|
|
|||||
|
Product development
|
97,249
|
|
(110
|
)
|
97,359
|
|
|||||
|
General and administrative
|
82,883
|
|
(38
|
)
|
82,921
|
|
|||||
|
Total operating expenses
|
338,145
|
|
(230
|
)
|
338,375
|
|
|||||
|
Income from operations
|
$
|
74,786
|
|
$
|
(249
|
)
|
$
|
74,537
|
|
||
59
|
Year Ended December 31, 2017
|
|||||||||||
|
As Reported
|
Restructuring and Other Exit Costs (Income)
|
Excluding Restructuring and Other Exit Costs (Income)
|
|||||||||
|
(in thousands)
|
|||||||||||
|
Revenue
|
$
|
441,231
|
|
$
|
—
|
|
$
|
441,231
|
|
||
|
Cost of revenue
|
150,986
|
|
738
|
|
150,248
|
|
|||||
|
Gross profit
|
290,245
|
|
738
|
|
290,983
|
|
|||||
|
Operating expenses:
|
|||||||||||
|
Marketing
|
109,085
|
|
2,950
|
|
106,135
|
|
|||||
|
Product development
|
74,616
|
|
3,232
|
|
71,384
|
|
|||||
|
General and administrative
|
91,486
|
|
6,977
|
|
84,509
|
|
|||||
|
Asset impairment charges
|
3,162
|
|
—
|
|
3,162
|
|
|||||
|
Total operating expenses
|
278,349
|
|
13,159
|
|
265,190
|
|
|||||
|
Income from operations
|
$
|
11,896
|
|
$
|
13,897
|
|
$
|
25,793
|
|
||
60
Key Factors Affecting Our Performance
We believe that our performance and future success depend on a number of factors that present significant opportunities for us but also pose risks and challenges, including those discussed in the section titled “
Risk Factors
.”
Growth and Retention of Active Buyers and Active Sellers
Our success depends in part on the growth and retention of our active buyers and active sellers. Our revenue is driven by the number of active buyers, buyer engagement, active sellers, seller engagement, and our ability to maintain a trusted marketplace. As of
December 31, 2018
, our marketplace had grown to
39.4 million
active buyers and
2.1 million
active sellers, up from
33.4 million
active buyers and
1.9 million
active sellers as of
December 31, 2017
. We believe two of our most significant opportunities to drive growth in our marketplace are to bring new buyers to Etsy and encourage repeat buyers to purchase more frequently. We are particularly focused on increasing our number of habitual buyers, or buyers who have spent $200 or more and made purchases on six or more purchase days in the year. We are also focused on keeping our best sellers on the platform and helping them grow their businesses by enhancing the seller tools and services that help drive buyer demand.
During 2018, Etsy had
17.5 million
new buyers, or buyers who made their first-ever purchase on Etsy. GMS from new buyers was
up
16%
year-over-year and represented approximately
18%
of overall GMS, a slight
decrease
compared to last year. GMS from existing buyers
grew
23%
year-over-year in 2018 and represented approximately
82%
of overall GMS, an
increase
compared to last year. Repeat purchases demonstrate the loyalty of Etsy buyers. In
2018
, approximately
40.1%
of our active buyers made purchases on two or more days in the previous 12 months, up from
39.6%
in
2017
.
Habitual buyers, are approximately
5.2%
of our active buyers as of
December 31, 2018
. Habitual buyers grew to
2.0 million
as of
December 31, 2018
, an increase of
21.7%
compared to 2017. We aim to increase repeat purchases and habitual buyers by inspiring purchases in additional categories and on additional occasions, building trust in the Etsy brand, and removing friction from the buying experience to improve conversion rates.
To analyze our retention rates, we measure repeat activity by Active Buyers (buyers who have made at least one purchase through Etsy in the last 12 months) and Active Sellers (sellers who have incurred at least one charge in the last 12 months).
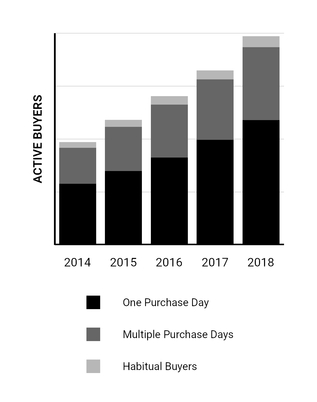
61
Cohort of 2015, 2014, 2013, 2012 and 2011 Active Buyers
We refer to active buyers as of December 31, 2015 as “2015 Active Buyers,” as of December 31, 2014 as “2014 Active Buyers,” as of December 31, 2013 as “2013 Active Buyers,” as of December 31, 2012 as “2012 Active Buyers,” and as of December 31, 2011 as “2011 Active Buyers.” Of total 2015 Active Buyers,
37.5%
remained active buyers through their fourth year on the platform, compared to
38.7%
for 2014 Active Buyers,
41.1%
for 2013 Active Buyers,
42.5%
for 2012 Active Buyers, and
44.7%
for 2011 Active Buyers. The average annual GMS per 2015 Active Buyer during their fourth year on the platform was
78%
higher than their first year, compared to
70%
for 2014 Active Buyers,
81%
for 2013 Active Buyers,
88%
for 2012 Active Buyers, and
89%
for 2011 Active Buyers. We note that 2013 was the first year we started to significantly invest in our paid acquisition marketing efforts to grow our buyer base.
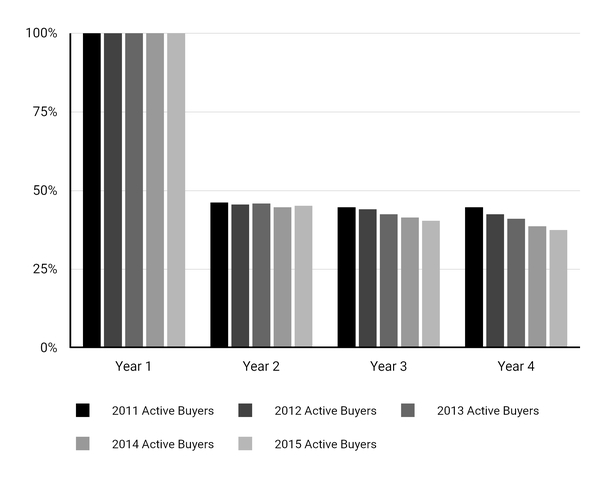
|
AVG GMS
|
2011
|
$103
|
$177
|
$186
|
$195
|
|||||||
|
PER BUYER
|
2012
|
$96
|
$163
|
$173
|
$181
|
|||||||
|
2013
|
$96
|
$161
|
$168
|
$174
|
||||||||
|
2014
|
$99
|
$157
|
$164
|
$169
|
||||||||
|
2015
|
$101
|
$158
|
$163
|
$180
|
||||||||
|
Cohort of 2015, 2014, 2013, 2012, and 2011 Active Buyers
|
These cohort data demonstrate our ability to consistently retain buyers over a multi-year period and reflects the loyalty of our buyer base. We have identified our ability to increase purchase frequency among these long-term and habitual buyers as one of our significant opportunities for growth and we are focused on improving search and recommendations to better match our buyers with the
60 million
items listed on Etsy.com, driving buyer growth and retention.
62
Cohort of 2015, 2014, 2013, 2012 and 2011 Active Sellers
We refer to active sellers as of December 31, 2015 as “2015 Active Sellers,” as of December 31, 2014 as “2014 Active Sellers,” as of December 31, 2013 as “2013 Active Sellers,” as of December 31, 2012 as “2012 Active Sellers” and December 31, 2011 as “2011 Active Sellers.” Of the 2015 Active Sellers,
33.1%
remained active through their fourth year on the platform, compared to
31.8%
for 2014 Active Sellers,
31.5%
for 2013 Active Sellers,
32.3%
for 2012 Active Sellers, and
32.3%
for 2011 Active Sellers. The average annual GMS per 2015 Active Seller during their fourth year on the platform was over
three
times higher than their first year, compared to over
three
times higher for 2014 Active Sellers, almost
four
times higher for 2013 Active Sellers, over
four
times higher for 2012 Active Sellers, and over
five
times higher for 2011 Active Sellers.
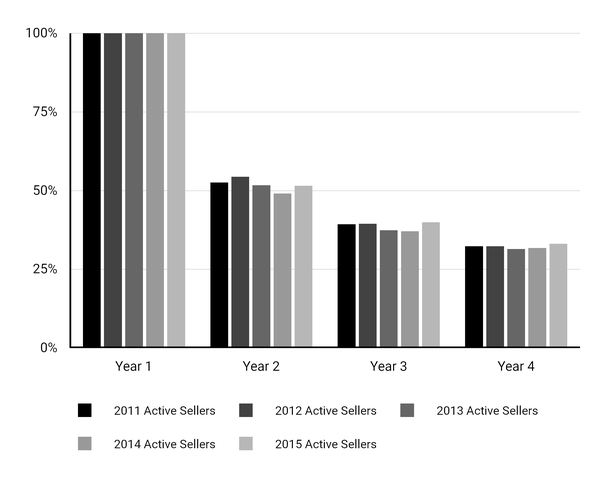
|
AVG GMS
|
2011
|
$817
|
$2,241
|
$3,314
|
$4,299
|
|||||||
|
PER SELLER
|
2012
|
$1,079
|
$2,598
|
$3,935
|
$4,557
|
|||||||
|
2013
|
$1,260
|
$3,110
|
$4,190
|
$4,620
|
||||||||
|
2014
|
$1,465
|
$3,325
|
$4,228
|
$4,615
|
||||||||
|
2015
|
$1,558
|
$3,296
|
$4,062
|
$4,939
|
||||||||
|
Cohort of 2015, 2014, 2013, 2012, and 2011 Active Sellers
|
These cohort data demonstrate our success in retaining sellers over a multi-year period, with the sellers that remain on our platform maintaining consistent GMS growth. We believe there is significant opportunity for growth by fueling seller success through continued investment in paid services and tools to help Etsy sellers generate more sales on our platform.
63
Services Growth
We have a seller-aligned business model: we make money when Etsy sellers make money. Our goal is to enhance the seller tools and services that will drive buyer demand. To achieve this, we continue to invest our resources in developing a cohesive platform of paid services and free tools specifically designed to help our creative entrepreneurs generate more sales and scale their businesses. We believe we can grow our optional paid services in three ways: expand the utility of existing services, expand the geographic reach of existing services, and launch new services offerings. For
December 31, 2018
,
15.1%
of active sellers used Promoted Listings, and
24.7%
of active sellers in the United States, Canada, United Kingdom, and Australia used Etsy Shipping Labels.
Investment in Marketing
We are focusing on initiatives to drive traffic to Etsy.com and shape perceptions of our marketplace as the go-to shopping destination for special purchase occasions by investing primarily in digital and other marketing initiatives, such as search engine optimization and television channels, and in our team to support marketing activities. We believe that we can continue to grow our acquisition marketing efforts, both in scaling and improving our current efforts and by expanding into new marketing channels. In 2018, paid GMS attributable to our marketing efforts was
17%
of GMS and grew
53%
compared to 2017. Additionally, following the increase in our marketplace transaction fee, we were able to invest a portion of our incremental revenue into marketing. In 2018, we ran our first-ever television advertising campaign in the United States and also began to test offline marketing campaigns. We believe these campaigns can increase brand awareness, visits, and purchase intent. In
2018
, we spent
$158.0 million
on marketing expenses, or
26.2%
of revenue,
up
44.9%
over
2017
. In
2017
, we spent
$109.1 million
on marketing expenses, or
24.7%
of revenue,
up
32.6%
over
2016
.
Investment in Technology
Our engineering team has built a sophisticated platform that enables millions of Etsy sellers and Etsy buyers to smoothly transact across borders, languages and devices. We have made, and will continue to make, significant investments in our platform to attract buyers and sellers to our marketplace and enhance their experience.
In September 2016, we acquired Blackbird Technologies, Inc., (“Blackbird”), a machine learning company, and, during 2017, fully integrated it into our search team. During
2017
, we launched CSR, which leverages our internal data to create a more personalized search experience. We continued to improve the search experience using CSR throughout 2018 and will continue to leverage artificial intelligence and machine learning to enable shoppers to more easily browse, filter and transact, even when they may not have something specific in mind.
Our technology infrastructure allows us to scale our efforts across the platform. In the fourth quarter of 2017, we began working on an initiative to migrate our data centers to the cloud. We believe that moving to Google Cloud will enable us to focus on growing our core Etsy.com marketplace, prioritizing the buyer and seller experience, improving our search and discovery effectiveness, and increasing the pace of launching new features. In the third quarter of 2018, we achieved a significant milestone in the process by successfully migrating our website and mobile apps to Google Cloud. While this initiative is underway, we will incur implementation costs in addition to costs associated with maintaining our current infrastructure. We expect to complete the migration by the beginning of 2020.
In
2018
, we spent
$97.2 million
on product development expenses, or
16.1%
of revenue,
up
30.3%
over
2017
and in
2017
, we spent
$74.6 million
on product development expenses, or
16.9%
of revenue,
up
35.5%
over
2016
. In addition, we capitalized website development and internal-use software costs, including stock-based compensation, of
$22.1 million
and
$10.8 million
in
2018
and
2017
, respectively. We plan to continue to invest in innovation to address the needs of our community and increase our efforts to recruit and hire employees to work on our engineering teams.
Investment in Connected Experience—Mobile and Desktop
We want to engage Etsy buyers wherever they are and to provide an enjoyable and accessible shopping experience no matter what device they use to access our marketplace. Mobile is integrated into everything that we do, and expanding our mobile capabilities is an important focus area. Our mobile website and our “Buy on Etsy” mobile apps for Etsy buyers include search, discovery, curation, personalization, and social shopping features, optimized for a personal mobile experience. Our Etsy.com iOS and Android mobile apps have been downloaded approximately
56 million
times as of
December 31, 2018
. Mobile GMS was
55%
of total GMS in
2018
,
up
from
51%
of total GMS in
2017
. We are focused on increasing conversion rates in general; however, we are particularly focused on mobile web, which continued to be the largest driver of both overall visits growth and mobile GMS growth. Mobile web conversion rate is about
half
the conversion rate on desktop and the conversion rate on our
64
mobile Buy on Etsy app is about
1.2
x the desktop conversion rate. Therefore, if mobile web visits continue to grow as a percentage of overall visits, it could be a headwind to future conversion rate gains. We are focused on continuing to enhance the buyer experience through mobile offering improvements in 2019.
International Growth
Our growth will depend in part on international Etsy sellers and international Etsy buyers constituting an increasing portion of our community. Our vision is global and local. Etsy.com is available in
10
languages and supports buyers and sellers in nearly every country in the world. In 2018, we entered into a referral agreement with DaWanda GmbH (“DaWanda”), a privately held Germany-based marketplace for gifts and handmade items. As part of this agreement, DaWanda agreed to encourage its community of buyers and sellers to migrate to the Etsy platform. The referral agreement with DaWanda allowed us to grow our international business by expanding our footprint in Central Europe, particularly in Germany, one of our core geographic markets. International GMS was
35%
of total GMS in
2018
compared to
33%
in
2017
. We expect international GMS to grow faster than U.S. GMS in
2019
, assuming that currency rates remain stable compared to average levels in December
2018
, driven by our efforts to build local communities and foster local connections. In
2018
,
37.5%
of Etsy sellers were located outside the United States. Cross-border transactions is the largest component of international GMS and we remain committed to reducing barriers such as language and currency so that sellers and buyers from different countries can easily connect and transact. GMS generated between a non-U.S. buyer and a non-U.S. seller both in the same country grew approximately
36%
in
2018
compared with
2017
, making it the fastest growing category of international GMS. We are also focused on building local marketplaces globally, and deepening local Etsy communities around the world, each with its own ecosystem of Etsy sellers and Etsy buyers. To execute on our international strategy, we plan to continue to invest in local marketing and other locally-relevant tools and enhancements, such as local search boost, to encourage these connections around the world.
Our Company Culture
Our success depends, in part, on our ability to attract, retain, and motivate exceptional employees who share our dedication to our community and our mission to “Keep Commerce Human.” We believe that our action-oriented, values-based and purpose-driven work culture is a competitive advantage in attracting and retaining top talent.
We are focused on employee engagement, which is linked with high performance, retention, innovation, and growth. Each year, Etsy conducts an internal survey to measure employee engagement. In
2018
, our overall engagement score was
70%
favorable, up
10%
from the prior year. We are also committed to fostering a diverse and inclusive workplace because we firmly believe that diverse backgrounds, thoughts, and experiences are beneficial to innovation, decision making, and our business as a whole. We are proud that as of December 31, 2018, our Board of Directors and leadership were at least
50%
female.
Components of Our Results of Operations
Revenue
Our revenue consists of Marketplace revenue, Services revenue, and Other revenue.
Marketplace revenue.
Marketplace revenue is primarily comprised of the 5% transaction fee that an Etsy seller pays for each completed transaction, inclusive of shipping fees charged, the listing fee of $0.20 she pays for each item she lists (for up to four months) on Etsy.com, and Etsy Payments, our payment processing service. On
July 16, 2018
, we increased our seller transaction fee from
3.5%
to
5%
, and now apply it to the cost of shipping in addition to the cost of the item.
Services revenue.
Services revenue is derived from optional services offered to Etsy sellers, which include Promoted Listings, Etsy Shipping Labels, Pattern, and Etsy Plus.
|
•
|
Revenue from Promoted Listings, our on-site advertising service, consists of cost-per-click fees an Etsy seller pays us for prominent placement of her listings in search results in our marketplace.
|
|
•
|
Revenue from Etsy Shipping Labels consists of fees an Etsy seller pays us when she purchases shipping labels directly through our platform, net of the cost we incur in purchasing those shipping labels. We are able to provide our sellers shipping labels from the United States Postal Service, FedEx, Canada Post, Royal Mail, and DAI Post at discounted pricing due to the volume of purchases through our platform.
|
|
•
|
Revenue from Pattern consists of monthly subscription fees an Etsy seller pays to use our custom website services.
|
65
|
•
|
Revenue from Etsy Plus consists of monthly subscription fees an Etsy seller pays for enhanced tools and credits for use on our platform.
|
Other revenue.
Other revenue includes the fees we receive from commercial partnerships.
Our revenue recognition policies are discussed under “
Critical Accounting Policies and Significant Judgments and Estimates
.”
Cost of Revenue
Cost of revenue primarily consists of the cost of interchange and other fees for credit card processing services, credit card verification service fees, and credit card chargebacks to support Etsy Payments revenue, and costs of refunds made to Etsy buyers that we are not able to collect from Etsy sellers. Cost of revenue also includes expenses associated with the operation and maintenance of our platform and our data centers, including employee-related costs, hosting and bandwidth costs, and depreciation and amortization. Our cost of revenue as a percentage of revenue may change over time as our revenue mix changes; for example, to the extent that Etsy Payments revenue increases as a percentage of revenue, there may be a dampening effect on our gross margin, as Etsy Payments is a lower margin product compared to our other offerings.
Operating Expenses
Operating expenses consist of marketing, product development, general and administrative expenses, and asset impairment charges. Direct and indirect employee-related expenses are the most significant component of the product development and general and administrative expense categories. We include stock-based compensation expense in the applicable operating expense category based on the respective equity award recipient’s function. We include restructuring and other exit costs (income) related to the Actions in the applicable operating expense category of the impacted function.
Marketing:
Marketing expenses largely consist of direct marketing and indirect employee-related expenses to support our marketing initiatives. Direct marketing includes digital marketing, brand marketing and television, seller lifecycle and growth activities, public relations, communications, and marketing partnerships. Digital marketing, also referred to as performance marketing, primarily consists of targeted promotional campaigns through electronic channels, such as product listing ads, search engine marketing, affiliate programs, and display advertising which are focused on buyer acquisition and brand marketing.
Product development:
Product development expenses consist primarily of employee-related expenses for our engineering, product management, product design, and product research activities. Additional expenses include consulting costs related to the development, quality assurance, and testing of new technology and enhancement of our existing technology.
General and administrative
. General and administrative expenses consist primarily of employee-related expenses for our general corporate functions. General and administrative expenses also include costs associated with the use of facilities and equipment, including depreciation and amortization and office overhead, and certain professional services expenses.
Asset impairment charges:
Asset impairment charges consist primarily of non-cash charges related to our decisions to discontinue certain product offerings and the impairment of the related capitalized web development and internal-use software costs.
Other (Expense) Income, net
Other (expense) income, net
consists of interest expense, interest and other income, and
foreign exchange (loss) gain
. Interest expense consists primarily of non-cash interest and amortization of debt issuance costs related to our Convertible Senior Notes due
2023
, interest associated with the build-to-suit accounting treatment of our Brooklyn headquarters lease, and, to a lesser extent, interest on our capital lease obligations. Interest and other income is primarily comprised of interest and dividend income from our investment accounts.
66
Results of Operations
The following tables show our results of operations for the periods presented and express the relationship of certain line items as a percentage of revenue for those periods. The period-to-period comparison of financial results is not necessarily indicative of future results.
|
|
Year Ended
December 31, |
||||||||||
|
|
2018
|
2017
|
2016
|
||||||||
|
|
(in thousands)
|
||||||||||
|
Revenue:
|
|||||||||||
|
Marketplace
|
$
|
440,740
|
|
$
|
326,076
|
|
$
|
269,628
|
|
||
|
Services
|
158,928
|
|
111,869
|
|
89,433
|
|
|||||
|
Other
|
4,025
|
|
3,286
|
|
5,906
|
|
|||||
|
Total revenue
|
603,693
|
|
441,231
|
|
364,967
|
|
|||||
|
Cost of revenue
|
190,762
|
|
150,986
|
|
123,328
|
|
|||||
|
Gross profit
|
412,931
|
|
290,245
|
|
241,639
|
|
|||||
|
Operating expenses:
|
|||||||||||
|
Marketing
|
158,013
|
|
109,085
|
|
82,248
|
|
|||||
|
Product development
|
97,249
|
|
74,616
|
|
55,083
|
|
|||||
|
General and administrative
|
82,883
|
|
91,486
|
|
86,180
|
|
|||||
|
Asset impairment charges
|
—
|
|
3,162
|
|
551
|
|
|||||
|
Total operating expenses
|
338,145
|
|
278,349
|
|
224,062
|
|
|||||
|
Income from operations
|
74,786
|
|
11,896
|
|
17,577
|
|
|||||
|
Other (expense) income, net
|
(19,708
|
)
|
20,369
|
|
(20,453
|
)
|
|||||
|
Income (loss) before income taxes
|
55,078
|
|
32,265
|
|
(2,876
|
)
|
|||||
|
Benefit (provision) for income taxes
|
22,413
|
|
49,535
|
|
(27,025
|
)
|
|||||
|
Net income (loss)
|
$
|
77,491
|
|
$
|
81,800
|
|
$
|
(29,901
|
)
|
||
|
|
Year Ended
December 31, |
||||||||||
|
|
2018
|
2017
|
2016
|
||||||||
|
Revenue:
|
|||||||||||
|
Marketplace
|
73.0
|
%
|
73.9
|
%
|
73.9
|
%
|
|||||
|
Services
|
26.3
|
|
25.4
|
|
24.5
|
|
|||||
|
Other
|
0.7
|
|
0.7
|
|
1.6
|
|
|||||
|
Total revenue
|
100.0
|
|
100.0
|
|
100.0
|
|
|||||
|
Cost of revenue
|
31.6
|
|
34.2
|
|
33.8
|
|
|||||
|
Gross profit
|
68.4
|
|
65.8
|
|
66.2
|
|
|||||
|
Operating expenses:
|
|||||||||||
|
Marketing
|
26.2
|
|
24.7
|
|
22.5
|
|
|||||
|
Product development
|
16.1
|
|
16.9
|
|
15.1
|
|
|||||
|
General and administrative
|
13.7
|
|
20.7
|
|
23.6
|
|
|||||
|
Asset impairment charges
|
—
|
|
0.7
|
|
0.2
|
|
|||||
|
Total operating expenses
|
56.0
|
|
63.1
|
|
61.4
|
|
|||||
|
Income from operations
|
12.4
|
|
2.7
|
|
4.8
|
|
|||||
|
Other (expense) income, net
|
(3.3
|
)
|
4.6
|
|
(5.6
|
)
|
|||||
|
Income (loss) before income taxes
|
9.1
|
|
7.3
|
|
(0.8
|
)
|
|||||
|
Benefit (provision) for income taxes
|
3.7
|
|
11.2
|
|
(7.4
|
)
|
|||||
|
Net income (loss)
|
12.8
|
%
|
18.5
|
%
|
(8.2
|
)%
|
|||||
67
Comparison of Years Ended
December 31, 2018
and
2017
Revenue
|
|
Year Ended
December 31, |
Change
|
|||||||||||||
|
|
2018
|
2017
|
$
|
%
|
|||||||||||
|
|
(in thousands except percentages)
|
||||||||||||||
|
Revenue:
|
|||||||||||||||
|
Marketplace
|
$
|
440,740
|
|
$
|
326,076
|
|
$
|
114,664
|
|
35.2
|
%
|
||||
|
Percentage of total revenue
|
73.0
|
%
|
73.9
|
%
|
|||||||||||
|
Services
|
$
|
158,928
|
|
$
|
111,869
|
|
$
|
47,059
|
|
42.1
|
%
|
||||
|
Percentage of total revenue
|
26.3
|
%
|
25.4
|
%
|
|||||||||||
|
Other
|
$
|
4,025
|
|
$
|
3,286
|
|
$
|
739
|
|
22.5
|
%
|
||||
|
Percentage of total revenue
|
0.7
|
%
|
0.7
|
%
|
|||||||||||
|
Total revenue
|
$
|
603,693
|
|
$
|
441,231
|
|
$
|
162,462
|
|
36.8
|
%
|
||||
GMS
increased
$
678.1 million
, or
20.8%
, to $
3.9 billion
in
the year ended December 31, 2018
compared to
the year ended December 31, 2017
. On a currency-neutral basis (excluding the direct impact of currency translation on GMS from goods that are not listed in U.S. dollars) GMS
growth
for
the year ended December 31, 2018
would have been
20.4%
, or approximately
40
basis points
lower
than the reported
20.8%
growth. Supporting this
growth
in GMS, active sellers
increased
9.4%
to
2.1 million
and active buyers
increased
18.2%
to
39.4 million
at
December 31, 2018
compared to
December 31, 2017
. In
the year ended December 31, 2018
, GMS from new buyers
grew
16%
year-over-year and represented approximately
18%
of overall GMS, a
decrease
compared to last year. In
the year ended December 31, 2018
, GMS from existing buyers
grew
23%
year-over-year and represented approximately
82%
of overall GMS, an
increase
compared to last year. We anticipate continued visit growth and improved conversion in 2019. We believe conversion improvements will be driven primarily by product launches enhancing the buyer experience.
During
the year ended December 31, 2018
, mobile GMS
increased
as a percentage of total GMS to approximately
55%
,
up
from approximately
51%
for
the year ended December 31, 2017
. We believe this
increase
was a result of increased mobile traffic, and, to a lesser extent, continued improvements in our mobile offerings for Etsy buyers. Mobile GMS
growth
during
the year ended December 31, 2018
was approximately
30%
, with mobile web and mobile app GMS each continuing to grow faster than desktop GMS during the year.
For
the year ended December 31, 2018
, international GMS
increased
as a percentage of total GMS to
35%
,
up
from approximately
33%
for
the year ended December 31, 2017
. International GMS was
up
approximately
28%
in
the year ended December 31, 2018
compared to
the year ended December 31, 2017
, driven by GMS between U.S. buyers and international sellers and by our fastest growing international trade route, international domestic, which is GMS generated between a non-U.S. buyer and a non-U.S. seller both in the same country. International domestic GMS grew approximately
36%
in
2018
compared with
2017
. On a currency-neutral basis international GMS
growth
for
the year ended December 31, 2018
would have been
27%
. We expect international GMS to continue to grow faster than U.S. GMS, assuming that currency rates remain stable compared to average levels in December
2018
, driven by our global product enhancements and marketing.
Revenue
increased
$
162.5 million
, or
36.8%
, to $
603.7 million
in
the year ended December 31, 2018
compared to
the year ended December 31, 2017
, of which
73.0%
consisted of Marketplace revenue and
26.3%
consisted of Services revenue.
Marketplace revenue
increased
$
114.7 million
, or
35.2%
, to $
440.7 million
in
the year ended December 31, 2018
compared to
the year ended December 31, 2017
. This
growth
corresponded with a
20.8%
increase
in GMS to a total of
$3.9 billion
for
the year ended December 31, 2018
. Marketplace revenue
increased
at a faster rate than GMS primarily due to the
increase
in transaction revenue and Etsy Payments revenue for
the year ended December 31, 2018
compared to
the year ended December 31, 2017
. Transaction revenue
increased
59.6%
year-over-year, primarily driven by our 2018 pricing updates, which drove approximately 41% of the
59.6%
increase
. Etsy Payments revenue
increased
24.4%
, largely driven by overall GMS growth trends and increased seller adoption. The share of GMS processed through our Etsy Payments platform was
86%
for
the year ended December 31, 2018
, up from
85%
for
the year ended December 31, 2017
, primarily due to the transition of sellers in eligible countries to the platform. During the second quarter of 2018, we reached the anniversary of the Etsy Payments adoption requirement, which has been a substantial driver of year-over-year Etsy Payments revenue growth, and therefore, we expect Etsy Payments to grow more closely in-line with year-over-year GMS growth in future quarters. Listing fee revenue
grew
17.0%
, driven by an increase in charged listings year-over-year corresponding with the increase in overall GMS growth.
68
Listing fee revenue increased at a slower rate than GMS primarily due to the issuance of free listings in our international markets, including France and Germany.
Services revenue
increased
$
47.1 million
, or
42.1%
, to $
158.9 million
in
the year ended December 31, 2018
compared to
the year ended December 31, 2017
. The
growth
in Services revenue was primarily driven by an
increase
in Promoted Listings,
up
41.4%
, and, to a lesser extent, Etsy Shipping Labels,
up
39.9%
. The
increase
in Promoted Listings revenue was due to higher click volume and overall product enhancements, including expansion of Promoted Listing budgets and context specific ranking on Promoted Listings, which increased the relevance of promoted ads in our search results. The
increase
in Etsy Shipping Label revenue was primarily driven by a combination of an increase in label volume and an increase in average margin per label. Additionally, Etsy Shipping Label revenue reflects a one-time adjustment to recognize prior period revenue which drove $2.8 million of the
increase
. At
December 31, 2018
,
15.1%
of active sellers used Promoted Listings, and
24.7%
of active sellers in the United States, Canada, United Kingdom, and Australia used Etsy Shipping Labels.
Cost of Revenue
|
|
Year Ended
December 31, |
Change
|
|||||||||||||
|
|
2018
|
2017
|
$
|
%
|
|||||||||||
|
|
(in thousands except percentages)
|
||||||||||||||
|
Cost of revenue
|
$
|
190,762
|
|
$
|
150,986
|
|
$
|
39,776
|
|
26.3
|
%
|
||||
|
Percentage of total revenue
|
31.6
|
%
|
34.2
|
%
|
|||||||||||
Cost of revenue
increased
$39.8 million
, or
26.3%
, to $
190.8 million
in
the year ended December 31, 2018
compared to
the year ended December 31, 2017
, primarily driven by additional costs as a result of the increase in transactions and related revenue generated on the Etsy platform. The remaining increase was driven by hosting and bandwidth costs incurred as a result of our migration to the cloud while also maintaining our current infrastructure, and, to a lesser extent, increases in employee-related and professional services expenses. Cost of revenue decreased as a percentage of revenue largely due to 2018 changes in our pricing.
Operating Expenses
There were a total of
874
employees on
December 31, 2018
, compared with
744
on
December 31, 2017
.
Marketing
|
|
Year Ended
December 31, |
Change
|
|||||||||||||
|
|
2018
|
2017
|
$
|
%
|
|||||||||||
|
|
(in thousands except percentages)
|
||||||||||||||
|
Marketing
|
$
|
158,013
|
|
$
|
109,085
|
|
$
|
48,928
|
|
44.9
|
%
|
||||
|
Percentage of total revenue
|
26.2
|
%
|
24.7
|
%
|
|||||||||||
Marketing expenses
increased
$48.9 million
, or
44.9%
, to $
158.0 million
in
the year ended December 31, 2018
compared to
the year ended December 31, 2017
, primarily as a result of increased spend on digital marketing related to buyer acquisition, and, to a lesser extent, increased direct marketing expenses associated with our television ad campaigns. These increases were offset by decreases in employee-related expenses due to a reduction in average headcount and
$3.0 million
of restructuring and other exit costs associated with the Actions included in marketing expense for
the year ended December 31, 2017
that did not recur in 2018. Excluding the impact of restructuring and other exit costs, non-GAAP marketing expenses increased
$52.0 million
, or
49.0%
. In 2019, we expect to increase our investment in marketing, including into channels such as television.
69
Product development
|
|
Year Ended
December 31, |
Change
|
|||||||||||||
|
|
2018
|
2017
|
$
|
%
|
|||||||||||
|
|
(in thousands except percentages)
|
||||||||||||||
|
Product development
|
$
|
97,249
|
|
$
|
74,616
|
|
$
|
22,633
|
|
30.3
|
%
|
||||
|
Percentage of total revenue
|
16.1
|
%
|
16.9
|
%
|
|||||||||||
Product development expenses
increased
$22.6 million
, or
30.3%
, to $
97.2 million
in
the year ended December 31, 2018
compared to
the year ended December 31, 2017
, primarily as a result of an increase in employee-related expenses, including stock-based compensation, and professional services expenses for consultants working on our product and engineering teams. The increase in employee-related expenses includes approximately $8.5 million of expense in connection with certain employee departures, including
$7.0 million
in expense resulting from the modification of stock options and RSUs. Additionally,
$3.2 million
of restructuring and other exit costs associated with the Actions is included in product development expenses for
the year ended December 31, 2017
. Excluding the impact of restructuring and other exit costs, non-GAAP product development expenses increased
$26.0 million
, or
36.4%
.
General and administrative
|
|
Year Ended
December 31, |
Change
|
|||||||||||||
|
|
2018
|
2017
|
$
|
%
|
|||||||||||
|
|
(in thousands except percentages)
|
||||||||||||||
|
General and administrative
|
$
|
82,883
|
|
$
|
91,486
|
|
$
|
(8,603
|
)
|
(9.4
|
)%
|
||||
|
Percentage of total revenue
|
13.7
|
%
|
20.7
|
%
|
|||||||||||
General and administrative expenses
decreased
$8.6 million
, or
9.4%
, to $
82.9 million
in
the year ended December 31, 2018
compared to
the year ended December 31, 2017
, primarily due to decreased employee-related expenses, including stock-based compensation, mainly the result of a reduction in average headcount and
$7.0 million
of restructuring and other exit costs associated with the Actions included in general and administrative expenses for
the year ended December 31, 2017
that did not recur in 2018. Excluding the impact of restructuring and other exit costs, non-GAAP general and administrative expenses decreased
$1.6 million
, or
1.9%
. Upon adoption of ASU 2016-02,
Leases
in 2019
,
we expect to recognize additional depreciation and amortization expense compared to the year ended December 31, 2018 related to the accounting treatment for our Brooklyn headquarters lease.
Asset impairment charges
|
|
Year Ended
December 31, |
Change
|
|||||||||||||
|
|
2018
|
2017
|
$
|
%
|
|||||||||||
|
|
(in thousands except percentages)
|
||||||||||||||
|
Asset impairment charges
|
$
|
—
|
|
$
|
3,162
|
|
$
|
(3,162
|
)
|
(100.0
|
)%
|
||||
|
Percentage of total revenue
|
—
|
%
|
0.7
|
%
|
|||||||||||
There were no asset impairment charges in
the year ended December 31, 2018
. Asset impairment charges were
$3.2 million
in
the year ended December 31, 2017
. In the fourth quarter of 2017, we made the decision to discontinue certain product offerings, including Etsy Studio and Etsy Manufacturing, which resulted in the recognition of a
$3.2 million
impairment charge to write the related capitalized web development and internal-use software assets down to zero. This decision was based on our strategy to focus on the growth of the Etsy.com marketplace.
70
Other (Expense) Income, net
|
|
Year Ended
December 31, |
Change
|
||||||||||||
|
|
2018
|
2017
|
$
|
%
|
||||||||||
|
|
(in thousands except percentages)
|
|||||||||||||
|
Other (expense) income, net:
|
||||||||||||||
|
Interest expense
|
$
|
(22,178
|
)
|
$
|
(11,130
|
)
|
$
|
(11,048
|
)
|
99.3
|
%
|
|||
|
Percentage of total revenue
|
(3.7
|
)%
|
(2.5
|
)%
|
||||||||||
|
Interest and other income
|
$
|
8,957
|
|
$
|
2,394
|
|
$
|
6,563
|
|
274.1
|
%
|
|||
|
Percentage of total revenue
|
1.5
|
%
|
0.5
|
%
|
||||||||||
|
Foreign exchange (loss) gain
|
$
|
(6,487
|
)
|
$
|
29,105
|
|
$
|
(35,592
|
)
|
(122.3
|
)%
|
|||
|
Percentage of total revenue
|
(1.1
|
)%
|
6.6
|
%
|
||||||||||
|
Other (expense) income, net
|
$
|
(19,708
|
)
|
$
|
20,369
|
|
$
|
(40,077
|
)
|
(196.8
|
)%
|
|||
|
Percentage of total revenue
|
(3.3
|
)%
|
4.6
|
%
|
||||||||||
Other expense, net
was $
19.7 million
in
the year ended December 31, 2018
, which increased
$40.1 million
from
other income, net
of
$20.4 million
in
the year ended December 31, 2017
. The increase in expense was primarily driven by the change in U.S. Dollar to Euro exchange rates on our intercompany and other non-functional currency balances, and higher interest expense, mainly non-cash interest related to our convertible debt issued in the first quarter of 2018, partially offset by increased interest and dividend income related to our investment accounts. Interest expense also includes non-cash interest expense associated with the build-to-suit lease accounting related to our corporate headquarters, which remained flat year-over-year. Upon adoption of ASU 2016-02,
Leases
in 2019
,
we expect to recognize decreased interest expense compared to the year ended December 31, 2018 related to the accounting treatment for our Brooklyn headquarters lease.
Benefit for Income Taxes
|
|
Year Ended
December 31, |
Change
|
|||||||||||||
|
|
2018
|
2017
|
$
|
%
|
|||||||||||
|
|
(in thousands except percentages)
|
||||||||||||||
|
Benefit for income taxes
|
$
|
22,413
|
|
$
|
49,535
|
|
$
|
(27,122
|
)
|
(54.8
|
)%
|
||||
|
Percentage of total revenue
|
3.7
|
%
|
11.2
|
%
|
|||||||||||
Our income tax
benefit
for the years ended
December 31, 2018
and
2017
was
$22.4 million
and
$49.5 million
, respectively.
The primary drivers of our income tax
benefit
for
the year ended December 31, 2018
were tax benefit related to valuation allowance of
$28.7 million
, stock-based compensation of
$11.7 million
, and our research and development tax credit of
$4.1 million
. These were partially offset by tax expense related to income before income taxes of
$11.3 million
, state and local tax expense of
$3.8 million
, and the inclusion of additional taxes of
$3.9 million
due to certain provisions of the Tax Cuts and Jobs Act of 2017, as enacted by the U.S. Federal Government on December 22, 2017, (the “TCJA”).
The primary driver of our income tax
benefit
for the year ended
December 31, 2017
was the impact on deferred taxes from the reduction in the U.S. federal corporate tax rate beginning in 2018. As a result of the TCJA, which reduced the corporate income tax rate from 35% to 21%, our deferred taxes and certain unrecognized tax benefits at December 31, 2017 have been revalued at the reduced 21% rate. The revaluation resulted in a benefit for income taxes of approximately
$31.1 million
for the year ended
December 31, 2017
.
The secondary driver of the income tax benefit for the year ended
December 31, 2017
was the recognition of excess tax benefits from stock-based compensation as a result of the adoption of ASU 2016-09
—Stock Compensation: Improvements to Employee Share-based Payment Accounting
in the first quarter of 2017. As a result of this updated guidance, we recorded
$12.8 million
of excess tax benefits, rather than additional paid-in capital, for the year ended
December 31, 2017
.
For both periods, other drivers include the mix of income and losses in jurisdictions with a wide range of tax rates, the disallowance of the benefit of losses in certain foreign jurisdictions and the amount of non-deductible stock-based compensation expense.
71
Comparison of Years Ended
December 31,
2017
and
2016
Revenue
|
|
Year Ended
December 31, |
Change
|
|||||||||||||
|
|
2017
|
2016
|
$
|
%
|
|||||||||||
|
|
(in thousands except percentages)
|
||||||||||||||
|
Revenue:
|
|||||||||||||||
|
Marketplace
|
$
|
326,076
|
|
$
|
269,628
|
|
$
|
56,448
|
|
20.9
|
%
|
||||
|
Percentage of total revenue
|
73.9
|
%
|
73.9
|
%
|
|||||||||||
|
Services
|
$
|
111,869
|
|
$
|
89,433
|
|
$
|
22,436
|
|
25.1
|
%
|
||||
|
Percentage of total revenue
|
25.4
|
%
|
24.5
|
%
|
|||||||||||
|
Other
|
$
|
3,286
|
|
$
|
5,906
|
|
$
|
(2,620
|
)
|
(44.4
|
)%
|
||||
|
Percentage of total revenue
|
0.7
|
%
|
1.6
|
%
|
|||||||||||
|
Total revenue
|
$
|
441,231
|
|
$
|
364,967
|
|
$
|
76,264
|
|
20.9
|
%
|
||||
GMS
increased
$411.6 million
, or
14.5%
, to
$3.3 billion
in
the year ended December 31, 2017
compared to
the year ended December 31, 2016
. On a currency-neutral basis (excluding the direct impact of currency translation on GMS from goods that are not listed in U.S. dollars) GMS
growth
for
the year ended December 31, 2017
would have been
14.3%
, or approximately
20
basis points
lower
than the reported
14.5%
growth. Supporting this growth in GMS, active sellers
increased
10.6%
to
1.9 million
and active buyers
increased
16.8%
to
33.4 million
at
December 31, 2017
compared to
December 31, 2016
. In
the year ended December 31, 2017
, GMS from new buyers
increased
13%
year-over-year and represented approximately
19%
of overall GMS, a slight
decrease
compared to last year. In
the year ended December 31, 2017
, GMS from existing buyers
increased
16%
year-over-year and represented approximately
81%
of overall GMS, a slight
increase
compared to last year.
During
the year ended December 31, 2017
, mobile GMS
increased
as a percentage of total GMS to approximately
51%
,
up
from approximately
48%
for
the year ended December 31, 2016
. We believe this increase was a result of increased mobile traffic, and, to a lesser extent, continued improvements in our mobile offerings for Etsy buyers. Mobile web continued to be the largest driver of mobile GMS growth. Mobile GMS
growth
during
the year ended December 31, 2017
was approximately
22%
, with mobile web and mobile app GMS each continuing to grow faster than desktop GMS during the year. Year-over-year, mobile conversion rates continued to grow faster than desktop conversion rates.
For
the year ended December 31, 2017
, international GMS
increased
as a percentage of total GMS to
33%
, from
30%
for
the year ended December 31, 2016
, largely driven by continued GMS growth between U.S. buyers and international sellers, and buyers and sellers outside of the U.S., both in the same country and cross-border. GMS
growth
between international buyers and sellers in the same country was the fastest growing category of international GMS, up approximately
45%
year-over-year during
the year ended December 31, 2017
compared to
the year ended December 31, 2016
. International GMS was
up
approximately
23%
in
the year ended December 31, 2017
compared to
the year ended December 31, 2016
, growing faster than overall GMS.
Revenue
increased
$76.3 million
, or
20.9%
, to
$441.2 million
in
the year ended December 31, 2017
compared to
the year ended December 31, 2016
, of which
73.9%
consisted of Marketplace revenue and
25.4%
consisted of Services revenue.
Marketplace revenue
increased
$56.4 million
, or
20.9%
, to
$326.1 million
in
the year ended December 31, 2017
compared to
the year ended December 31, 2016
. This
growth
corresponded with a
14.5%
increase
in GMS to a total of
$3.3 billion
in
the year ended December 31, 2017
. Marketplace
grew
at a faster rate than GMS primarily due to the
increase
in Etsy Payments,
up
31.6%
, largely driven by overall GMS
growth
trends and increased seller adoption. The share of GMS processed through our Etsy Payments platform was
85%
, for
the year ended December 31, 2017
,
up
from
78%
in
the year ended December 31, 2016
, primarily due to the transition of nearly all sellers in eligible countries to the platform. Transaction fee revenue
grew
14.1%
and listing fee revenue
grew
12.3%
, driven by overall GMS trends. Listing fee revenue
grew
at a slower rate than GMS primarily due to the issuance of free listings for promotional activities focused on driving growth in our international markets in the second half of 2017, including listings granted for the transition of our ALM sellers to the Etsy marketplace.
Services revenue increased
$22.4 million
, or
25.1%
, to
$111.9 million
in
the year ended December 31, 2017
compared to
the year ended December 31, 2016
. The
growth
in Services revenue was primarily driven by an
increase
in revenue from Promoted Listings, up
25.0%
, and, to a lesser extent, Etsy Shipping Labels,
up
16.7%
, and Pattern, up 84.8%. The
increase
in Promoted Listings revenue was due to higher click volume and overall product enhancements. The
increase
in Etsy Shipping Label
72
revenue reflects a combination of an increase in label volume and average margin per label. The increase in Pattern revenue was primarily due to the incremental monthly paid subscription periods in 2017, as the product launched in April 2016, with the first paid subscriptions beginning in May 2016. At
December 31, 2017
,
15.0%
of active sellers used Promoted Listings, and
28.1%
of active sellers in the United States and Canada used Etsy Shipping Labels.
Other revenue
decreased
$2.6 million
, or
44.4%
, to
$3.3 million
in
the year ended December 31, 2017
compared to
the year ended December 31, 2016
, mainly due to a decrease in revenue from accumulated unused gift card funds received from our third-party service provider, down 73.4%. In the year ended December 31, 2016, we recognized $1.7 million in revenue from accumulated unused gift cards, which represented the three-year cumulative value of gift cards that the third-party service provider has concluded are not likely to be redeemed. In 2017, unused gift card revenue was recognized monthly as earned and is not anticipated to be significant in future periods. In addition, processing fees from PayPal, a third-party payment processor, decreased 30.2% as a result of the transition of nearly all sellers in eligible countries to Etsy Payments in 2017.
Cost of Revenue
|
|
Year Ended
December 31, |
Change
|
|||||||||||||
|
|
2017
|
2016
|
$
|
%
|
|||||||||||
|
|
(in thousands except percentages)
|
||||||||||||||
|
Cost of revenue
|
$
|
150,986
|
|
$
|
123,328
|
|
$
|
27,658
|
|
22.4
|
%
|
||||
|
Percentage of total revenue
|
34.2
|
%
|
33.8
|
%
|
|||||||||||
Cost of revenue
increased
$27.7 million
, or
22.4%
, to
$151.0 million
in
the year ended December 31, 2017
compared to
the year ended December 31, 2016
, primarily as a result of additional costs to support the increase in Etsy Payments revenue and, to a lesser extent, an increase in employee-related costs. Cost of revenue
increased
as a percentage of revenue primarily due to an increase in professional services expenses related to customer service support. Restructuring and other exit costs of
$0.7 million
associated with the Actions were included in cost of revenue for
the year ended December 31, 2017
.
Operating Expenses
There were a total of
744
employees on
December 31, 2017
, compared with
1,043
on
December 31, 2016
, reflecting headcount reductions associated with the Actions.
Marketing
|
|
Year Ended
December 31, |
Change
|
|||||||||||||
|
|
2017
|
2016
|
$
|
%
|
|||||||||||
|
|
(in thousands except percentages)
|
||||||||||||||
|
Marketing
|
$
|
109,085
|
|
$
|
82,248
|
|
$
|
26,837
|
|
32.6
|
%
|
||||
|
Percentage of total revenue
|
24.7
|
%
|
22.5
|
%
|
|||||||||||
Marketing expenses
increased
$26.8 million
, or
32.6%
, to
$109.1 million
in
the year ended December 31, 2017
compared to
the year ended December 31, 2016
, primarily as a result of increased spend on digital marketing related to buyer acquisition, and an increase in employee-related expenses in our marketing team, including
$3.0 million
of restructuring and other exit costs associated with the Actions.
73
Product development
|
|
Year Ended
December 31, |
Change
|
|||||||||||||
|
|
2017
|
2016
|
$
|
%
|
|||||||||||
|
|
(in thousands except percentages)
|
||||||||||||||
|
Product development
|
$
|
74,616
|
|
$
|
55,083
|
|
$
|
19,533
|
|
35.5
|
%
|
||||
|
Percentage of total revenue
|
16.9
|
%
|
15.1
|
%
|
|||||||||||
Product development expenses
increased
$19.5 million
, or
35.5%
, to
$74.6 million
in
the year ended December 31, 2017
compared to
the year ended December 31, 2016
, primarily as a result of an increase in employee-related expenses in our product and engineering teams, up $10.3 million, including
$3.2 million
of restructuring and other exit costs associated with the Actions, and $6.2 million of additional expenses resulting from the acquisition of Blackbird in September 2016.
General and administrative
|
|
Year Ended
December 31, |
Change
|
|||||||||||||
|
|
2017
|
2016
|
$
|
%
|
|||||||||||
|
|
(in thousands except percentages)
|
||||||||||||||
|
General and administrative
|
$
|
91,486
|
|
$
|
86,180
|
|
$
|
5,306
|
|
6.2
|
%
|
||||
|
Percentage of total revenue
|
20.7
|
%
|
23.6
|
%
|
|||||||||||
General and administrative expenses
increased
$5.3 million
, or
6.2%
, to
$91.5 million
in
the year ended December 31, 2017
compared to
the year ended December 31, 2016
, primarily driven by an increase in employee-related expenses, including
$7.0 million
of restructuring and other exit costs associated with the Actions. This increase was partially offset by decreases in professional services and office overhead expenses.
Asset impairment charges
|
|
Year Ended
December 31, |
Change
|
|||||||||||||
|
|
2017
|
2016
|
$
|
%
|
|||||||||||
|
|
(in thousands except percentages)
|
||||||||||||||
|
Asset impairment charges
|
$
|
3,162
|
|
$
|
551
|
|
$
|
2,611
|
|
473.9
|
%
|
||||
|
Percentage of total revenue
|
0.7
|
%
|
0.2
|
%
|
|||||||||||
Asset impairment charges
increased
$2.6 million
, or
473.9%
, to
$3.2 million
in
the year ended December 31, 2017
, compared to
the year ended December 31, 2016
. In the fourth quarter of 2017, we made the decision to discontinue certain product offerings, including Etsy Studio and Etsy Manufacturing, which resulted in the recognition of a
$3.2 million
impairment charge to write the related capitalized web development and internal-use software assets down to zero. This decision was based on our strategy to focus on the growth of the Etsy.com marketplace. This compares to
$0.6 million
in
the year ended December 31, 2016
, related to the impairment of nonrecoverable intangible assets acquired in the ALM and Jarvis Labs, Inc. acquisitions for customer relationships and trademarks.
74
Other Income (Expense), net
|
|
Year Ended
December 31, |
Change
|
||||||||||||
|
|
2017
|
2016
|
$
|
%
|
||||||||||
|
|
(in thousands except percentages)
|
|||||||||||||
|
Other income (expense), net:
|
||||||||||||||
|
Interest expense
|
$
|
(11,130
|
)
|
$
|
(7,204
|
)
|
$
|
(3,926
|
)
|
54.5
|
%
|
|||
|
Percentage of total revenue
|
(2.5
|
)%
|
(2.0
|
)%
|
||||||||||
|
Interest and other income
|
$
|
2,394
|
|
$
|
1,702
|
|
$
|
692
|
|
40.7
|
%
|
|||
|
Percentage of total revenue
|
0.5
|
%
|
0.5
|
%
|
||||||||||
|
Foreign exchange gain (loss)
|
$
|
29,105
|
|
$
|
(14,951
|
)
|
$
|
44,056
|
|
(294.7
|
)%
|
|||
|
Percentage of total revenue
|
6.6
|
%
|
(4.1
|
)%
|
||||||||||
|
Other income (expense), net
|
$
|
20,369
|
|
$
|
(20,453
|
)
|
$
|
40,822
|
|
(199.6
|
)%
|
|||
|
Percentage of total revenue
|
4.6
|
%
|
(5.6
|
)%
|
||||||||||
Other income, net
was
$20.4 million
in
the year ended December 31, 2017
, which increased
$40.8 million
from
other expense, net
of
$20.5 million
in
the year ended December 31, 2016
. The
increase
in income was primarily driven by the change in U.S. Dollar to Euro exchange rates on our intercompany and other non-functional currency balances, partially offset by an increase in interest expense, largely associated with the build-to-suit lease accounting related to our corporate headquarters. In the fourth quarter of 2017, we established a new legal entity based in Ireland with a U.S. dollar functional currency to help mitigate the currency rate risk on our intercompany debt.
Benefit (Provision) for Income Taxes
|
|
Year Ended
December 31, |
Change
|
|||||||||||||
|
|
2017
|
2016
|
$
|
%
|
|||||||||||
|
|
(in thousands except percentages)
|
||||||||||||||
|
Benefit (provision) for income taxes
|
$
|
49,535
|
|
$
|
(27,025
|
)
|
$
|
76,560
|
|
283.3
|
%
|
||||
|
Percentage of total revenue
|
11.2
|
%
|
(7.4
|
)%
|
|||||||||||
Our income tax
benefit
and
provision
for the years ended
December 31, 2017
and
2016
was
$49.5 million
and
$27.0 million
, respectively.
The primary driver of the income tax benefit for the year ended
December 31, 2017
was the impact on deferred taxes from the reduction in the U.S. federal corporate tax rate beginning in 2018. On December 22, 2017 the TCJA was signed into law, which, among other items, reduced the corporate income tax rate from 35% to 21%. As a result, our deferred taxes and certain unrecognized tax benefits at December 31, 2017 have been revalued at the reduced 21% rate. The revaluation resulted in a benefit for income taxes of approximately
$31.1 million
for the year ended
December 31, 2017
.
The secondary driver of the income tax benefit for the year ended
December 31, 2017
was the recognition of excess tax benefits from stock-based compensation as a result of the adoption of ASU 2016-09
—Stock Compensation: Improvements to Employee Share-based Payment Accounting
in the first quarter of 2017. As a result of this updated guidance, we recorded
$12.8 million
of excess tax benefits, rather than additional paid-in capital, for the year ended
December 31, 2017
.
The primary driver of the income tax provision for the year ended
December 31, 2016
was tax expense related to our updated corporate structure of $17.1 million.
For both periods, other drivers include the mix of income and losses in jurisdictions with a wide range of tax rates, the disallowance of the benefit of losses in certain foreign jurisdictions and the amount of non-deductible stock-based compensation expense.
75
Quarterly Results of Operations
The following tables show selected unaudited quarterly results of operations and other unaudited operational and non-GAAP financial data for the eight quarters ended
December 31, 2018
and the percentage that each line item in the following results of operations data represents of revenue. The results of operations data for each of these quarters have been prepared on the same basis as the audited annual Consolidated Financial Statements included elsewhere in this Annual Report on Form 10-K and includes all adjustments, which include only normal recurring adjustments, necessary for the fair statement of our results of operations for these periods. This data should be read in conjunction with our Consolidated Financial Statements and related notes included elsewhere in this Annual Report. Our quarterly results of operations and operational and non-GAAP financial data will vary in the future. These quarterly operating results are not necessarily indicative of our operating results for any future quarter or year.
|
|
Three Months Ended
|
|||||||||||||||||||||||
|
|
Dec. 31,
2018 (1) |
Sept. 30,
2018 |
June 30,
2018 |
Mar. 31,
2018 |
Dec. 31,
2017 |
Sept. 30,
2017 |
June 30,
2017 |
Mar. 31,
2017 |
||||||||||||||||
|
|
(in thousands except share and per share amounts)
|
|||||||||||||||||||||||
|
Revenue:
|
||||||||||||||||||||||||
|
Marketplace (2)
|
$
|
150,540
|
|
$
|
110,927
|
|
$
|
91,306
|
|
$
|
87,967
|
|
$
|
102,261
|
|
$
|
77,808
|
|
$
|
75,445
|
|
$
|
70,562
|
|
|
Services (2)
|
48,622
|
|
38,194
|
|
39,507
|
|
32,605
|
|
34,309
|
|
27,976
|
|
25,440
|
|
24,144
|
|
||||||||
|
Other
|
866
|
|
1,245
|
|
1,574
|
|
340
|
|
(302
|
)
|
596
|
|
807
|
|
2,185
|
|
||||||||
|
Total revenue
|
200,028
|
|
150,366
|
|
132,387
|
|
120,912
|
|
136,268
|
|
106,380
|
|
101,692
|
|
96,891
|
|
||||||||
|
Cost of revenue (3)(4)
|
57,111
|
|
46,947
|
|
45,409
|
|
41,295
|
|
44,220
|
|
36,383
|
|
35,724
|
|
34,659
|
|
||||||||
|
Gross profit
|
142,917
|
|
103,419
|
|
86,978
|
|
79,617
|
|
92,048
|
|
69,997
|
|
65,968
|
|
62,232
|
|
||||||||
|
Operating expenses:
|
||||||||||||||||||||||||
|
Marketing (3)(4)
|
63,362
|
|
39,516
|
|
28,941
|
|
26,194
|
|
34,590
|
|
23,520
|
|
27,521
|
|
23,454
|
|
||||||||
|
Product development (3)(4)
|
28,542
|
|
24,418
|
|
23,568
|
|
20,721
|
|
17,788
|
|
16,958
|
|
21,754
|
|
18,116
|
|
||||||||
|
General and administrative (3)(4)
|
21,524
|
|
20,748
|
|
21,707
|
|
18,904
|
|
18,218
|
|
22,094
|
|
28,411
|
|
22,763
|
|
||||||||
|
Asset impairment charges
|
—
|
|
—
|
|
—
|
|
—
|
|
3,162
|
|
—
|
|
—
|
|
—
|
|
||||||||
|
Total operating expenses
|
113,428
|
|
84,682
|
|
74,216
|
|
65,819
|
|
73,758
|
|
62,572
|
|
77,686
|
|
64,333
|
|
||||||||
|
Income (loss) from operations
|
29,489
|
|
18,737
|
|
12,762
|
|
13,798
|
|
18,290
|
|
7,425
|
|
(11,718
|
)
|
(2,101
|
)
|
||||||||
|
Other (expense) income, net
|
(6,613
|
)
|
(4,141
|
)
|
(8,137
|
)
|
(817
|
)
|
(24
|
)
|
5,815
|
|
13,950
|
|
628
|
|
||||||||
|
Income (loss) before income taxes
|
22,876
|
|
14,596
|
|
4,625
|
|
12,981
|
|
18,266
|
|
13,240
|
|
2,232
|
|
(1,473
|
)
|
||||||||
|
Benefit (provision) for income taxes (5)
|
18,375
|
|
5,298
|
|
(1,246
|
)
|
(14
|
)
|
26,484
|
|
12,562
|
|
9,437
|
|
1,052
|
|
||||||||
|
Net income (loss)
|
$
|
41,251
|
|
$
|
19,894
|
|
$
|
3,379
|
|
$
|
12,967
|
|
$
|
44,750
|
|
$
|
25,802
|
|
$
|
11,669
|
|
$
|
(421
|
)
|
|
Net income (loss) per share attributable to common stockholders:
|
||||||||||||||||||||||||
|
Basic
|
$
|
0.34
|
|
$
|
0.17
|
|
$
|
0.03
|
|
$
|
0.11
|
|
$
|
0.37
|
|
$
|
0.22
|
|
$
|
0.10
|
|
$
|
0.00
|
|
|
Diluted
|
$
|
0.32
|
|
$
|
0.15
|
|
$
|
0.03
|
|
$
|
0.10
|
|
$
|
0.36
|
|
$
|
0.21
|
|
$
|
0.10
|
|
$
|
0.00
|
|
|
Weighted average common shares outstanding:
|
||||||||||||||||||||||||
|
Basic
|
120,192,912
|
|
119,870,711
|
|
119,450,194
|
|
121,267,092
|
|
121,586,991
|
|
119,592,191
|
|
116,933,216
|
|
115,696,024
|
|
||||||||
|
Diluted
|
129,012,508
|
|
129,086,137
|
|
125,551,759
|
|
125,772,315
|
|
124,818,322
|
|
123,224,559
|
|
120,723,938
|
|
115,696,024
|
|
||||||||
|
(1)
|
During the three months ended
December 31, 2018
, we recorded adjustments to correct errors in the years ended
December 31, 2018
and
2017
that increased income before income taxes by $1.6 million in the current quarter and decreased net income by $1.8 million in the current quarter. The Company has concluded that the errors and their correction were not material to the Consolidated Financial Statements for any of the periods impacted nor are they material for results in the fourth quarter of 2018.
|
76
|
(2)
|
In connection with the adoption of ASU 2014-09
—
Revenue from Contracts with Customers (“ASC 606”) in the first quarter of 2018, we renamed our revenue categories Marketplace and Services revenue. In addition, we reclassified Etsy Payments from Services to Marketplace revenue as described in “
Note 2—Revenue
.” The following table provides our Marketplace and Services revenue under our previous and current presentation:
|
|
Quarter-to-Date Period Ended
|
|||||||||||||||
|
Previous Presentation
|
Updated Presentation
|
||||||||||||||
|
Marketplace Revenue
|
Services Revenue
|
Marketplace Revenue
|
Services Revenue
|
||||||||||||
|
(in thousands)
|
|||||||||||||||
|
December 31, 2017
|
$
|
54,251
|
|
$
|
82,319
|
|
$
|
102,261
|
|
$
|
34,309
|
|
|||
|
September 30, 2017
|
42,413
|
|
63,371
|
|
77,808
|
|
27,976
|
|
|||||||
|
June 30, 2017
|
42,069
|
|
58,816
|
|
75,445
|
|
25,440
|
|
|||||||
|
March 31, 2017
|
40,759
|
|
53,947
|
|
70,562
|
|
24,144
|
|
|||||||
|
(3)
|
Includes total stock-based compensation expense as follows:
|
|
Three Months Ended
|
||||||||||||||||||||||||
|
Dec. 31,
2018 |
Sept. 30,
2018 |
June 30,
2018 |
Mar. 31,
2018 |
Dec. 31,
2017 |
Sept. 30,
2017 |
June 30,
2017 |
Mar. 31,
2017 |
|||||||||||||||||
|
(in thousands)
|
||||||||||||||||||||||||
|
Cost of revenue
|
$
|
990
|
|
$
|
894
|
|
$
|
927
|
|
$
|
546
|
|
$
|
508
|
|
$
|
469
|
|
$
|
398
|
|
$
|
364
|
|
|
Marketing
|
688
|
|
642
|
|
699
|
|
478
|
|
514
|
|
447
|
|
528
|
|
444
|
|
||||||||
|
Product development (a)
|
9,873
|
|
4,697
|
|
4,025
|
|
2,639
|
|
2,021
|
|
2,180
|
|
2,053
|
|
2,020
|
|
||||||||
|
General and administrative
|
2,693
|
|
2,683
|
|
2,966
|
|
2,791
|
|
2,948
|
|
4,425
|
|
5,183
|
|
2,057
|
|
||||||||
|
Total stock-based compensation expense
|
$
|
14,244
|
|
$
|
8,916
|
|
$
|
8,617
|
|
$
|
6,454
|
|
$
|
5,991
|
|
$
|
7,521
|
|
$
|
8,162
|
|
$
|
4,885
|
|
|
(a)
|
Product development includes $6.0 million and $1.0 million of expense resulting from the modification of stock options and RSUs in the three months ended December 31, 2018 and September 30, 2018, respectively, in connection with certain employee departures See “
Note 16—Stock-based Compensation
” in the Notes to Consolidated Financial Statements for additional information.
|
|
(4)
|
Includes restructuring and other exit costs (income), as shown in the quarterly reconciliation of
net income (loss)
to Adjusted EBITDA below. For a summary of restructuring and other exit costs (income) see “
Note 17—Restructuring and Other Exit Costs (Income)
” in the Notes to Consolidated Financial Statements.
|
|
(5)
|
In the year ended
December 31, 2018
, we recognized an income tax benefit associated with the release of a valuation allowance on certain deferred tax assets. The valuation allowance release resulted in a non-recurring benefit for income taxes of
$23.4 million
for the year ended
December 31, 2018
. In the quarter ended
December 31, 2017
, we recognized an income tax benefit associated with the enactment of the TCJA as defined above. As a result of the TCJA, our deferred taxes at
December 31, 2017
have been revalued at the reduced 21% corporate income tax rate. The revaluation resulted in a non-recurring benefit for income taxes of approximately
$31.1 million
for the quarter ended
December 31, 2017
.
|
77
|
|
Three Months Ended
|
|||||||||||||||
|
|
Dec. 31,
2018 |
Sept. 30,
2018 |
June 30,
2018 |
Mar. 31,
2018 |
Dec. 31,
2017 |
Sept. 30,
2017 |
June 30,
2017 |
Mar. 31,
2017 |
||||||||
|
Revenue:
|
||||||||||||||||
|
Marketplace
|
75.3
|
%
|
73.8
|
%
|
69.0
|
%
|
72.8
|
%
|
75.0
|
%
|
73.1
|
%
|
74.2
|
%
|
72.8
|
%
|
|
Services
|
24.3
|
|
25.4
|
|
29.8
|
|
27.0
|
|
25.2
|
|
26.3
|
|
25.0
|
|
24.9
|
|
|
Other
|
0.4
|
|
0.8
|
|
1.2
|
|
0.3
|
|
(0.2
|
)
|
0.6
|
|
0.8
|
|
2.3
|
|
|
Total revenue
|
100.0
|
|
100.0
|
|
100.0
|
|
100.0
|
|
100.0
|
|
100.0
|
|
100.0
|
|
100.0
|
|
|
Cost of revenue
|
28.6
|
|
31.2
|
|
34.3
|
|
34.2
|
|
32.5
|
|
34.2
|
|
35.1
|
|
35.8
|
|
|
Gross profit
|
71.4
|
|
68.8
|
|
65.7
|
|
65.8
|
|
67.5
|
|
65.8
|
|
64.9
|
|
64.2
|
|
|
Operating expenses:
|
||||||||||||||||
|
Marketing
|
31.7
|
|
26.3
|
|
21.9
|
|
21.7
|
|
25.4
|
|
22.1
|
|
27.1
|
|
24.2
|
|
|
Product development
|
14.3
|
|
16.2
|
|
17.8
|
|
17.1
|
|
13.1
|
|
15.9
|
|
21.4
|
|
18.7
|
|
|
General and administrative
|
10.8
|
|
13.8
|
|
16.4
|
|
15.6
|
|
13.4
|
|
20.8
|
|
27.9
|
|
23.5
|
|
|
Asset impairment charges
|
—
|
|
—
|
|
—
|
|
—
|
|
2.3
|
|
—
|
|
—
|
|
—
|
|
|
Total operating expenses
|
56.7
|
|
56.3
|
|
56.1
|
|
54.4
|
|
54.1
|
|
58.8
|
|
76.4
|
|
66.4
|
|
|
Income (loss) from operations
|
14.7
|
|
12.5
|
|
9.6
|
|
11.4
|
|
13.4
|
|
7.0
|
|
(11.5
|
)
|
(2.2
|
)
|
|
Other (expense) income, net
|
(3.3
|
)
|
(2.8
|
)
|
(6.1
|
)
|
(0.7
|
)
|
—
|
|
5.5
|
|
13.7
|
|
0.6
|
|
|
Income (loss) before income taxes
|
11.4
|
|
9.7
|
|
3.5
|
|
10.7
|
|
13.4
|
|
12.4
|
|
2.2
|
|
(1.5
|
)
|
|
Benefit (provision) for income taxes
|
9.2
|
|
3.5
|
|
(0.9
|
)
|
—
|
|
19.4
|
|
11.8
|
|
9.3
|
|
1.1
|
|
|
Net income (loss)
|
20.6
|
%
|
13.2
|
%
|
2.6
|
%
|
10.7
|
%
|
32.8
|
%
|
24.3
|
%
|
11.5
|
%
|
(0.4
|
)%
|
|
|
Three Months Ended
|
|||||||||||||||||||||||
|
|
Dec. 31,
2018 |
Sept. 30,
2018 |
June 30,
2018 |
Mar. 31,
2018 |
Dec. 31,
2017 |
Sept. 30,
2017 |
June 30,
2017 |
Mar. 31,
2017 |
||||||||||||||||
|
|
(in thousands except percentages)
|
|||||||||||||||||||||||
|
Other financial and operations data (1):
|
||||||||||||||||||||||||
|
GMS
|
$
|
1,246,472
|
|
$
|
922,513
|
|
$
|
901,685
|
|
$
|
861,075
|
|
$
|
1,019,452
|
|
$
|
766,354
|
|
$
|
748,762
|
|
$
|
719,041
|
|
|
GMS growth
|
22.3
|
%
|
20.4
|
%
|
20.4
|
%
|
19.8
|
%
|
17.8
|
%
|
13.2
|
%
|
11.8
|
%
|
14.2
|
%
|
||||||||
|
Currency-neutral GMS growth
|
23.1
|
%
|
20.8
|
%
|
19.3
|
%
|
17.6
|
%
|
16.5
|
%
|
12.6
|
%
|
12.6
|
%
|
15.2
|
%
|
||||||||
|
Adjusted EBITDA
|
$
|
51,359
|
|
$
|
34,035
|
|
$
|
27,695
|
|
$
|
26,421
|
|
$
|
34,822
|
|
$
|
22,769
|
|
$
|
12,696
|
|
$
|
9,722
|
|
|
Active sellers
|
2,115
|
|
2,043
|
|
1,983
|
|
1,970
|
|
1,933
|
|
1,891
|
|
1,834
|
|
1,801
|
|
||||||||
|
Active buyers
|
39,447
|
|
37,134
|
|
35,830
|
|
34,693
|
|
33,364
|
|
31,680
|
|
30,584
|
|
29,669
|
|
||||||||
|
Percent mobile GMS
|
56
|
%
|
56
|
%
|
55
|
%
|
54
|
%
|
52
|
%
|
52
|
%
|
51
|
%
|
51
|
%
|
||||||||
|
Percent international GMS
|
36
|
%
|
35
|
%
|
34
|
%
|
35
|
%
|
33
|
%
|
34
|
%
|
32
|
%
|
32
|
%
|
||||||||
|
(1)
|
See “
Key Operating and Financial Metrics
” for the definitions of the following terms: “active buyer,” “active seller,” “Adjusted EBITDA,” “GMS,” “international GMS,” and “mobile GMS.”
|
78
The following table reflects the reconciliation of
net income (loss)
to Adjusted EBITDA for each of the periods indicated:
|
|
Three Months Ended
|
|||||||||||||||||||||||
|
|
Dec. 31,
2018 |
Sept. 30,
2018 |
June 30,
2018 |
Mar. 31,
2018 |
Dec. 31,
2017 |
Sept. 30,
2017 |
June 30,
2017 |
Mar. 31,
2017 |
||||||||||||||||
|
(in thousands)
|
||||||||||||||||||||||||
|
Net income (loss)
|
$
|
41,251
|
|
$
|
19,894
|
|
$
|
3,379
|
|
$
|
12,967
|
|
$
|
44,750
|
|
$
|
25,802
|
|
$
|
11,669
|
|
$
|
(421
|
)
|
|
Excluding:
|
||||||||||||||||||||||||
|
Interest and other non-operating expense, net
|
3,099
|
|
3,768
|
|
3,687
|
|
2,667
|
|
2,177
|
|
2,254
|
|
2,153
|
|
2,152
|
|
||||||||
|
(Benefit) provision for income taxes
|
(18,375
|
)
|
(5,298
|
)
|
1,246
|
|
14
|
|
(26,484
|
)
|
(12,562
|
)
|
(9,437
|
)
|
(1,052
|
)
|
||||||||
|
Depreciation and amortization
|
7,626
|
|
6,439
|
|
6,357
|
|
6,320
|
|
6,577
|
|
7,022
|
|
6,660
|
|
6,938
|
|
||||||||
|
Stock-based compensation expense(1)
|
12,648
|
|
8,191
|
|
7,898
|
|
5,740
|
|
5,197
|
|
5,832
|
|
4,881
|
|
4,043
|
|
||||||||
|
Stock-based compensation expense—acquisitions
|
1,596
|
|
725
|
|
719
|
|
714
|
|
725
|
|
724
|
|
1,613
|
|
842
|
|
||||||||
|
Foreign exchange loss (gain)
|
3,514
|
|
373
|
|
4,450
|
|
(1,850
|
)
|
(2,153
|
)
|
(8,069
|
)
|
(16,103
|
)
|
(2,780
|
)
|
||||||||
|
Restructuring and other exit costs (income)
|
—
|
|
(57
|
)
|
(41
|
)
|
(151
|
)
|
871
|
|
1,766
|
|
11,260
|
|
—
|
|
||||||||
|
Asset impairment charges (2)
|
—
|
|
—
|
|
—
|
|
—
|
|
3,162
|
|
—
|
|
—
|
|
—
|
|
||||||||
|
Adjusted EBITDA
|
$
|
51,359
|
|
$
|
34,035
|
|
$
|
27,695
|
|
$
|
26,421
|
|
$
|
34,822
|
|
$
|
22,769
|
|
$
|
12,696
|
|
$
|
9,722
|
|
|
(1)
|
$0.1 million
,
$1.0 million
, and
$1.7 million
of restructuring-related stock-based compensation expense has been excluded from the three months ended
December 31, 2017
, September 30, 2017, and June 30, 2017, respectively, and is included in the restructuring and other exit costs (income) line.
|
(2) In the fourth quarter of 2017, we made the decision to discontinue certain product offerings, including Etsy Studio and Etsy Manufacturing, which resulted in the recognition of a $3.2 million impairment charge to write the related capitalized web development and internal-use software assets down to zero. This decision was based on our strategy to focus on the growth of the Etsy.com marketplace.
Seasonality
Etsy sellers experience increased sales and use more Services during the fourth-quarter holiday shopping season. This has resulted in increased GMS and revenue for us during the fourth quarter of each fiscal year, which can compare to lower GMS and revenue in the first quarter of the following fiscal year. For example, revenue in the first quarter of
2018
decreased when compared with revenue in the fourth quarter of
2017
. We expect this seasonality to continue in future years. Our cost of revenue and marketing expenses also follow this trend, with the highest costs corresponding with the fourth quarter and lower costs in the first quarter of each fiscal year. As our growth rates moderate, the impact of these seasonality trends on our results of operations may become more pronounced.
Our quarterly revenue
increased sequentially
quarter-to-quarter for all periods presented above, other than the first quarter of
2018
,
corresponding
to our GMS performance in the same periods. We cannot assure you that this pattern of sequential revenue and GMS growth will continue. We believe that it is generally more meaningful to compare year-over-year results than sequential quarter-over-quarter results.
79
Liquidity and Capital Resources
The following tables show our cash and cash equivalents, short-term investments, accounts receivable and net working capital as of the dates indicated:
|
|
As of December 31,
|
|||||||
|
|
2018
|
2017
|
||||||
|
|
(in thousands)
|
|||||||
|
Cash and cash equivalents
|
$
|
366,985
|
|
$
|
315,442
|
|
||
|
Short-term investments
|
257,302
|
|
25,108
|
|
||||
|
Accounts receivable, net
|
12,244
|
|
33,677
|
|
||||
|
Net working capital
|
568,227
|
|
336,787
|
|
||||
As of
December 31, 2018
, our cash and cash equivalents, a majority of which were held in cash deposits and money market funds, were held in the United States for future investments, working capital funding, and general corporate purposes.
We invest in short-term instruments, including fixed-income funds and U.S. Government and agency securities aligned with our investment strategy. These investments are intended to allow us to preserve our principal, maintain the ability to meet our liquidity needs, deliver positive yields across a balanced portfolio, and continue to provide us with direct fiduciary control. In accordance with our investment policy, all investments have maturities no longer than 36 months, with the average maturity of these investments maintained at 12 months or less.
Sources of Liquidity
In
March 2018
, we issued
$345.0 million
aggregate principal amount of
0%
Convertible Senior Notes due
2023
(the “Notes”) in a private placement to qualified institutional buyers pursuant to Rule 144A under the Securities Act. The initial conversion price of the Notes represented a premium of approximately 37.5% over the price of Etsy’s common stock. The net proceeds from the sale of the Notes were
$335.0 million
after deducting initial purchasers’ discount and offering expenses. As of
December 31, 2018
, we had not received any conversion notices, and, as such, the Notes are not currently redeemable for cash and are therefore classified as long-term debt. For more information on the Notes, see “
Note 13—Debt
” in the Notes to Consolidated Financial Statements.
We believe that our existing cash and cash equivalents and short-term investments, together with cash generated from operations, will be sufficient to meet our anticipated cash needs for at least the next 12 months. Our future capital requirements and the adequacy of available funds will depend on many factors, including those described in “
Key Factors Affecting Our Performance
” above and in our “Risk Factors” in this Annual Report on Form 10-K.
Subsequent Event
On
February 25, 2019
, we entered into a
$200.0 million
senior secured revolving credit facility pursuant to a Credit Agreement with several lenders (the “
2019 Credit Agreement
”). The
2019 Credit Agreement
will mature in
February 2024
. The
2019 Credit Agreement
includes a letter of credit sublimit of
$30.0 million
and a swingline loan sublimit of
$10.0 million
. See “
Note 13—Debt
—Subsequent Event” in the Notes to Consolidated Financial Statements for additional information.
80
Historical Cash Flows
|
|
Year Ended December 31,
|
|||||||||||
|
|
2018
|
2017
|
2016
|
|||||||||
|
|
(in thousands)
|
|||||||||||
|
Cash provided by (used in):
|
||||||||||||
|
Operating activities
|
$
|
198,925
|
|
$
|
69,101
|
|
$
|
47,964
|
|
|||
|
Investing activities
|
(285,393
|
)
|
61,836
|
|
(135,430
|
)
|
||||||
|
Financing activities
|
144,006
|
|
6,555
|
|
(524
|
)
|
||||||
See “
Note 1—Basis of Presentation and Summary of Significant Accounting Policies
—Revisions” in the Notes to Consolidated Financial Statements for information on revisions to our Consolidated Statements of Cash Flows for the years ended December 31, 2017 and 2016.
Net Cash Provided by Operating Activities
Our cash flows from operations are largely dependent on the amount of revenue generated on our platform, as well as associated cost of revenue and other operating expenses. Our primary source of cash from operating activities is cash collections from our customers.
Net cash provided by operating activities
in each period presented has been influenced by changes in accounts receivable, prepaid expenses and other current assets, accounts payable, and accrued liabilities.
Net cash provided by operating activities
was
$198.9 million
in
the year ended December 31, 2018
, primarily driven by
cash net income
of
$139.6 million
as a result of increased revenue generated on our platform, and changes in our operating assets and liabilities that
provided
$59.3 million
in cash, largely driven by timing of collections of accounts receivable due to the launch of our redesigned payment account in the fourth quarter of 2018, which now automatically deducts our fees and applicable taxes from the seller’s funds earned through sales using Etsy Payments prior to settlement of those funds to the seller’s bank account and payment timing of payables.
Net cash provided by operating activities
was
$69.1 million
in
the year ended December 31, 2017
, primarily driven by
cash net income
of
$68.8 million
as a result of increased revenue generated on our platform and changes in our operating assets and liabilities that
provided
$0.3 million
in cash.
Net cash provided by operating activities
was
$48.0 million
in
the year ended December 31, 2016
, as a result of the
cash net income
of
$58.4 million
as a result of increased revenue generated on our platform, partially offset by changes in our operating assets and liabilities that
used
$10.5 million
in cash.
Net Cash (Used in) Provided by Investing Activities
Our primary investing activities consist of sales, maturities, and purchases of short-term marketable securities, cash paid to purchase intangible assets, and capital expenditures, including investments in capitalized website development and internal-use software and purchases of property and equipment to support our overall business growth.
Net cash used in investing activities
was
$285.4 million
in
the year ended December 31, 2018
. This was primarily attributable to
net purchases
of marketable securities of
$229.3 million
,
$35.3 million
in cash paid for the DaWanda intangible asset acquisition, and
$20.6 million
in capital expenditures, including
$19.5 million
for website development and internal-use software as we continued to invest in projects adding new features and functionality to the Etsy platform and focused on growth investments, such as our migration to Google Cloud.
Net cash provided by investing activities
was
$61.8 million
in
the year ended December 31, 2017
. This was primarily attributable to
net sales
of marketable securities of
$75.0 million
, offset by
$13.2 million
in capital expenditures, including
$9.2 million
for capitalized website development and internal-use software and
$4.0 million
for purchases of property and equipment.
Net cash used in investing activities
was
$135.4 million
in
the year ended December 31, 2016
. This was primarily attributable to
net purchases
of marketable securities of
$79.8 million
, capital expenditures of
$47.7 million
, including
$36.0 million
for purchases of property and equipment,
$11.7 million
for capitalized website development and internal-use software, and
$7.9 million
in cash paid to acquire Blackbird.
81
Net Cash Provided by (Used in) Financing Activities
Our primary financing activities include proceeds from the issuance of the Notes, repurchase of common stock under share repurchase programs, payments related to capped call transactions (“Capped Call Transactions”) with the initial purchasers and/or their respective affiliates in connection with the Notes, shares withheld to satisfy tax withholding obligations in connection with the vesting of employee RSUs, proceeds from exercise of stock options, payments on our facility financing obligation related to the build-to-suit accounting treatment of our Brooklyn headquarters lease, and financing of capital leases for computer and hosting equipment.
Net cash provided by financing activities
was
$144.0 million
in
the year ended December 31, 2018
. This was primarily attributable to proceeds from the issuance of the Notes of
$345.0 million
and proceeds from the exercise of stock options of
$18.3 million
, partially offset by stock repurchases under share repurchase programs of
$134.6 million
, payments of
$34.2 million
for the Capped Call Transactions, stock repurchases of vested RSUs withheld to satisfy tax obligations of
$24.1 million
, payments on our facility financing obligation of
$10.2 million
, related to our Brooklyn headquarters lease, and
$10.0 million
of debt issuance cost payments.
Net cash provided by financing activities
was
$6.6 million
in
the year ended December 31, 2017
. This was primarily attributable to proceeds from the exercise of stock options of
$33.8 million
and proceeds from other financing activities of
$3.1 million
, partially offset by repurchase of stock under the share repurchase program of
$10.3 million
, payments on capital lease obligations of
$7.8 million
, stock repurchases of vested RSUs withheld to satisfy tax obligations of
$6.4 million
, and payments on our facility financing obligation of
$5.9 million
, related to our Brooklyn headquarters lease.
Net cash used in financing activities
was
$0.5 million
in
the year ended December 31, 2016
. This was primarily attributable to payments on capital lease obligations of
$6.1 million
, outflows from other financing activities of
$3.1 million
, stock repurchases of vested RSUs withheld to satisfy tax obligations of
$1.3 million
and a deferred payment related to the acquisition of ALM of
$0.6 million
, offset by proceeds from the exercise of stock options of
$10.6 million
.
Off-Balance Sheet Arrangements
We did not have any off-balance sheet arrangements, as defined in Item 303(a)(4)(ii) of Regulation S-K, in
2018
,
2017
, or
2016
.
Contractual Obligations
The following table summarizes our future fixed contractual obligations as of
December 31, 2018
:
|
Total
|
Less than 1
Year
|
1–3
Years
|
3–5
Years
|
More than
5 Years
|
||||||||||||||||
|
(in thousands)
|
||||||||||||||||||||
|
Capital lease obligations
|
$
|
5,979
|
|
$
|
3,884
|
|
$
|
2,095
|
|
$
|
—
|
|
$
|
—
|
|
|||||
|
Operating lease obligations
|
32,017
|
|
4,904
|
|
8,968
|
|
8,385
|
|
9,760
|
|
||||||||||
|
Long-term obligations
|
345,223
|
|
132
|
|
91
|
|
345,000
|
|
—
|
|
||||||||||
|
Interest payments
|
648
|
|
504
|
|
144
|
|
—
|
|
—
|
|
||||||||||
|
Facility financing obligations
|
78,161
|
|
9,451
|
|
19,876
|
|
21,119
|
|
27,715
|
|
||||||||||
|
Purchase obligations
|
61,070
|
|
10,696
|
|
33,374
|
|
17,000
|
|
—
|
|
||||||||||
|
Total contractual obligations
|
$
|
523,098
|
|
$
|
29,571
|
|
$
|
64,548
|
|
$
|
391,504
|
|
$
|
37,475
|
|
|||||
Capital lease obligations consist of obligations under capital leases for computer and hosting equipment.
Operating lease obligations consist of obligations under non-cancelable operating leases for our headquarters in Brooklyn, New York and for our offices in San Francisco, Hudson (New York), London, Dublin, Toronto, and New Delhi.
Long-term obligations consist of the issuance of Convertible Senior Notes in 2018, which will mature on March 1, 2023, unless earlier converted or repurchased and commitments we assumed in connection with our 2014 acquisition of ALM.
Interest payments consist of interest due in connection with our capital leases.
82
Facility financing obligations consist of the portion of our obligations for our headquarters in Brooklyn, New York that is accounted for as a build-to-suit lease.
Purchase obligations consist of commitments related to the migration of our data centers to the cloud, the related ongoing service fees, and other support services. For those agreements with variable terms, we do not estimate what the total obligation may be beyond any minimum quantities and/or pricing.
In addition, we have uncertain tax positions of
$18.8 million
and non-income tax related contingency reserves of
$0.9 million
, which are not reflected in the table as the ultimate resolution and timing are uncertain.
Critical Accounting Policies and Significant Judgments and Estimates
Our management’s discussion and analysis of our financial condition and results of operations is based on our Consolidated Financial Statements, which have been prepared in accordance with GAAP. The preparation of these Consolidated Financial Statements requires us to make estimates and assumptions that affect the reported amounts of assets, liabilities, equity, revenue, expenses, and related disclosures. We evaluate our estimates and assumptions on an ongoing basis. Our estimates are based on historical experience and various other assumptions that we believe to be reasonable under the circumstances. Our actual results could differ from these estimates.
We believe that the assumptions and estimates associated with revenue recognition, determining the nature and timing of satisfaction of performance obligations and stand-alone selling price for use in allocating the subscription price; stock-based compensation, income taxes, including the assessment of valuation allowances and the accounting for uncertain tax positions; website development costs and internal-use software, purchase price allocations for business combinations, valuation of goodwill and intangible assets, leases, restructuring and other exit costs (income), and fair value of financial instruments have the greatest potential impact on our Consolidated Financial Statements. Therefore, we consider these to be our critical accounting policies and estimates. For further information on all of our significant accounting policies, see “
Note 1—Basis of Presentation and Summary of Significant Accounting Policies
” in the Notes to Consolidated Financial Statements.
Revenue Recognition
Our revenue is diversified; generated from a mix of marketplace activities and other optional services to help Etsy sellers to generate more sales and scale their businesses. We recognize revenue as we transfer control of promised goods or services to Etsy sellers, in an amount that reflects the consideration we expect to be entitled to in exchange for those goods or services. We evaluate whether it is appropriate to recognize revenue on a gross or net basis based upon our evaluation of whether we obtain control of the specified goods or services by considering if we are primarily responsible for fulfillment of the promise, have inventory risk, and have latitude in establishing pricing and selecting suppliers, among other factors. Based on our evaluation of these factors, revenue is recorded either gross or net of costs associated with the transaction. With the exception of Etsy Shipping Labels, our revenues are recognized on a gross basis. Sales and usage-based taxes are excluded from revenues.
Marketplace revenue:
As members of the Etsy marketplace, Etsy sellers receive the benefit of marketplace activities, including listing items for sale, completing sales transactions, and payments processing, which represents a single stand-ready performance obligation. Etsy sellers pay a fixed listing fee of
$0.20
for each item listed on Etsy.com for a period of four months or, if earlier, until a sale occurs. Variable fees include the
5%
transaction fee that an Etsy seller pays for each completed transaction, inclusive of shipping fees charged and Etsy Payments fees for processing payments, including foreign currency payments. On
July 16, 2018
, we increased our seller transaction fee from
3.5%
to
5%
, and now apply it to the cost of shipping in addition to the cost of the item. Etsy Payments processing fees vary between
3
% to
4.5%
of an item’s total sale price, including shipping, plus a flat fee per order, depending on the country in which a seller’s bank account is located. When a foreign currency payment is processed, an additional
2.5
% to
5%
transaction fee is applied.
The listing fee is recognized ratably over a
four
-month listing period, unless the item is sold or the seller re-lists it, at which time any remaining listing fee is recognized. The transaction fee and Etsy Payments fees are recognized when the corresponding transaction is consummated. Listing fees are nonrefundable while transaction fees and Etsy Payments fees are recorded net of refunds.
83
Services revenue:
Services revenue is derived from optional services we offer to Etsy sellers, which include Promoted Listings, Etsy Shipping Labels, Pattern, and Etsy Plus. Each service below represents an individual obligation that we must perform when an Etsy seller chooses to use the service.
|
•
|
Revenue from Promoted Listings, our on-site advertising service, consists of cost-per-click fees an Etsy seller pays us for prominent placement of the seller’s listings in search results in our marketplace. Promoted Listings fees are based on an auction system, which utilizes the budget that each Etsy seller sets when using Promoted Listings to determine the cost-per-click fee. Promoted Listing fees are nonrefundable and are charged to a seller’s Etsy bill when the Promoted Listing is clicked; at which time revenue is recognized.
|
|
•
|
Revenue from Etsy Shipping Labels consists of fees an Etsy seller pays us when she purchases shipping labels through our platform, net of the cost we incur in purchasing those shipping labels. We provide our sellers access to purchase shipping labels from the United States Postal Service, FedEx, Canada Post, Royal Mail and DAI Post at discounted pricing due to the volume of purchases through its platform. We recognize Etsy Shipping Label revenue when an Etsy seller purchases a shipping label. We recognize Etsy Shipping Label revenue on a net basis as we are an agent in this arrangement and do not take control of shipping labels prior to transferring the labels to the Etsy Seller. Etsy Shipping Label revenue is recorded net of refunds.
|
|
•
|
Revenue from Pattern consists of monthly subscription fees an Etsy seller pays to use our custom website services. We recognize revenue from Pattern ratably over the term of the subscription. The Pattern subscription fee is
$15
per month and is nonrefundable.
|
|
•
|
Revenue from Etsy Plus consists of monthly subscription fees an Etsy seller pays for enhanced tools and credits for use on our platform. The Etsy Plus subscription fee is
$10
per month and is nonrefundable. Each feature represents its own distinct performance obligation. We allocate subscription revenue based on the relative actual or estimated stand-alone selling price of the features included in the Etsy Plus offering. Enhanced tools include advanced shop customization options, targeted restock notifications, discounts on branded packaging and promotional materials, and free or discounted custom web addresses, all of which are recognized ratably over the
30
-day subscription period. Additionally, the subscription includes
$5
of Promoted Listing credits and
15
free listing credits per month. The allocated value of Promoted Listing credits is recognized when the Promoted Listing is clicked, or when the 30-day subscription period expires. The allocated value of listing credits is deferred until the option is used, and once used, allocated over the four-month listing period. Any unused listing credits are recognized when the 30-day subscription period expires.
|
Other revenue:
Other revenue typically includes revenue generated from commercial partnerships, which are recognized as the customer in each contract consumes the benefit of the service we provide in each arrangement.
Stock-Based Compensation
We account for our stock-based compensation awards in accordance with Accounting Standards Codification (“ASC”) Topic 718
—Compensation—Stock Compensation
(“ASC 718”). Stock options and RSUs are awarded to employees and members of our Board of Directors and are measured at fair value at each grant date. For both options and RSUs, vesting is typically over a
four
-year period and is contingent upon continued employment on each vesting date. In general, options granted to newly-hired employees prior to July 2018 vest
25%
after the first year of service and ratably each month over the remaining
36
-month period. In general, RSUs granted to newly-hired employees prior to July 2018 vest
25%
after the first year following the vesting commencement date, which is the first day of the fiscal quarter closest to the date of grant, and then vest ratably each quarter over the remaining 12-quarter period. In general, for current employees who received an additional grant prior to March 2018, options vest ratably each month over a
48
-month period. In general, for current employees who received an additional grant prior to March 2018, RSUs vest ratably each quarter over a 16-quarter period following the vesting commencement date, which is the first day of the fiscal quarter closest to the date of grant.
Beginning in July
2018, in general
, for newly-hired employees, both options and RSUs vest
25%
after the first year of service and ratably each
six
-month period over a
four
-year period following the vesting commencement date, which is the first day of the month closest to the date of grant. Beginning in March 2018,
in general, for current employees who receive an additional grant, both options and RSUs vest ratably each
six
-month period over a
four
-year period
following the vesting commencement date
.
Stock-based compensation cost is measured on the grant date, based on the estimated fair value of the award using a Black-Scholes pricing model and recognized as an expense over the employee’s or director’s requisite service period on a straight-line basis. The fair value of RSUs is determined based on the closing price of our common stock on Nasdaq on the grant date. In the first quarter of 2017, we made an accounting policy election to recognize forfeitures as they occur upon adoption of guidance in ASU 2016-09
—Compensation—Stock Compensation: Scope of Modification Accounting
. In reporting periods prior to 2017, we
84
estimated forfeitures at the time of grant and revised in subsequent periods as necessary if actual forfeitures differed from estimates. We expect to continue to grant stock options and RSUs in the future, and, to the extent that we do, our stock-based compensation expense recognized in future periods will likely increase.
Key Assumptions
Our Black-Scholes option-pricing model requires the input of subjective assumptions, including the fair value of the underlying common stock, the expected volatility of the price of our common stock, risk-free interest rates, the expected term of the option, and the expected dividend yield of our common stock. These estimates involve inherent uncertainties and the application of management’s judgment. If factors change and different assumptions are used, our stock-based compensation expense could be materially different in the future.
|
•
|
Fair Value of Our Common Stock:
Prior to our initial public offering in April 2015, our Board of Directors considered numerous objective and subjective factors to determine the fair value of our common stock at each meeting at which awards were approved. The factors included: contemporaneous third-party valuations of our common stock; the prices, rights, preferences, and privileges of our preferred stock relative to those of our common stock; the prices of preferred stock sold by us to third-party investors in arms-length transactions; the prices of common stock sold to third-party investors by us and in secondary transactions or repurchased by us in arms-length transactions; the lack of marketability of our common stock; our operating and financial results; current business conditions and projections; and the likelihood of achieving a liquidity event, such as an initial public offering or sale of our company, given then prevailing market conditions. Since our initial public offering, we have used the market closing price for our common stock as reported on the Nasdaq to determine the fair value of our common stock.
|
|
•
|
Expected Volatility:
As we do not have a sufficient trading history for our common stock, the expected stock price volatility for our common stock is estimated by taking the average historical price volatility for Etsy and certain industry peers based on daily price observations over a period equivalent to the expected term of the stock option grants. Industry peers, which we have selected, consist of several public companies in the industry similar in size, stage of life cycle, and financial leverage. We intend to continue to consistently apply this process using the same or similar public companies until a sufficient amount of historical information regarding the volatility of our own common stock share price becomes available, or unless circumstances change such that the identified companies are no longer similar to us, in which case more suitable companies whose share prices are publicly available would be used in the calculation.
|
|
•
|
Risk-free Interest Rate:
The risk-free interest rate is based on the yields of U.S. Treasury securities with maturities similar to the expected term of the options for each option group.
|
|
•
|
Expected Term:
The expected term represents the period that our stock-based awards are expected to be outstanding. We base our expected term for awards issued to employees or members of our Board of Directors on the simplified method, which represents the average period from vesting to the expiration of the stock option.
|
|
•
|
Expected Dividend Yield:
We have never declared or paid any cash dividends to common stockholders and do not presently plan to pay cash dividends in the foreseeable future. Consequently, we use an expected dividend yield of zero.
|
In determining the fair value of stock options granted, the following weighted-average assumptions were used in the Black-Scholes option-pricing model for awards granted in the periods indicated:
|
|
Year Ended
December 31,
|
|||||
|
|
2018
|
2017
|
2016
|
|||
|
Expected volatility
|
38.6% - 47.8%
|
41.7% - 44.2%
|
38.6% - 44.6%
|
|||
|
Risk-free interest rate
|
2.6% - 2.9%
|
1.9% - 2.2%
|
1.1% - 2.1%
|
|||
|
Expected term (in years)
|
5.5 - 6.3
|
5.5 - 6.3
|
5.5 - 6.3
|
|||
|
Dividend rate
|
—%
|
—%
|
—%
|
|||
Income Taxes
We account for the income tax (provision) benefit based on income (loss) before income taxes using the asset and liability method. Under this method, deferred tax assets and liabilities are recognized for the future tax consequences attributable to differences between the financial statement and tax bases of assets and liabilities using enacted tax rates in effect for the year in which the differences are expected to settle. The effect on deferred tax assets and liabilities of a change in tax rates is recognized as income or expense in the period that includes the enactment date. We assess the need for a valuation allowance on a quarterly basis to reduce deferred tax assets to the amounts we expect to be realized.
85
On December 22, 2017 the TCJA was signed into law. The TCJA requires us to make an accounting policy election of either (1) treating taxes due on future U.S. inclusions in taxable income related to Global Intangible Low Taxed Income ("GILTI") as a current period expense when incurred (the “period cost method”) or (2) factoring such amounts into our measurement of our deferred taxes (the “deferred method”). We recorded tax expense related to GILTI in our effective tax rate for 2018, and have elected to treat taxes due on future U.S. inclusions in taxable income related to GILTI using the period cost method.
We account for uncertainty in income taxes using a recognition threshold and a measurement attribute for the financial statement recognition and measurement of tax positions taken or expected to be taken in a tax return. For benefits to be recognized, a tax position must be more likely than not to be sustained upon examination by the taxing authorities. The amount recognized is measured as the largest amount of benefit that has a greater than 50% likelihood of being realized upon ultimate audit settlement.
We recognize interest and penalties, if any, associated with tax matters as part of the income tax provision and include accrued interest and penalties with the related tax liability in our Consolidated Balance Sheet.
Website Development and Internal-use Software Costs
Costs incurred to develop our website and software for internal-use are capitalized and amortized over the estimated useful life of the software, generally
three
to
five
years. In accordance with authoritative accounting guidance, we begin to capitalize our costs to develop software when preliminary development efforts are successfully completed, management has authorized and committed project funding, and it is probable that the project will be completed and the software will be used as intended. We also capitalize costs related to upgrades and enhancements when it is probable the expenditures will result in additional functionality or will extend the useful life of existing functionality. Costs related to the design or maintenance of website development and internal-use software are expensed as incurred. We periodically review these capitalized website development and internal-use software costs to determine whether the projects will be completed, placed in service, removed from service, or replaced by other internally-developed or third-party software. If an asset is not expected to provide any future use, the asset is retired and any unamortized cost is expensed.
If an asset will continue to be used, but the net book value is not expected to be fully recoverable, the asset is impaired to its fair value. When events or changes in circumstances require, we assess the likelihood of recovering the cost of website development and internal-use software costs based on its expectations of future profitability, undiscounted cash flows, and our plans with respect to operations to determine if the asset is impaired and subject to write-off. Measurement of any impairment loss is based on the excess of the carrying value of the asset over the fair value.
Asset Acquisitions
We have completed asset acquisitions and may complete additional asset acquisitions in the future. In an asset acquisition, we initially determine whether we acquired a single or group of assets. Acquired assets are recognized based on the purchase price, which is presumed to equal the fair value of the net assets acquired and amortized in the period over which the asset is expected to contribute directly or indirectly to the future cash flows of that entity. When circumstances indicate that the carrying value of these assets may not be recoverable, we review our identifiable amortizable intangible assets for impairment. We accrue for contingent consideration when payout becomes probable and is reasonably estimable.
Business Combinations, Intangible Assets and Goodwill
We have completed a number of acquisitions of other businesses in the past and may acquire additional businesses or technologies in the future. In an acquisition, we first review if substantially all of the fair value of the assets acquired is concentrated in a single identifiable asset or group of similar identifiable assets, in which case the set is not considered a business and is accounted for as an asset acquisition.
The results of businesses acquired in a business combination are included in our Consolidated Financial Statements from the date of acquisition. We allocate the purchase price, which is the sum of the consideration provided and may consist of cash, equity, or a combination of the two, in a business combination to the identifiable assets and liabilities of the acquired business at their acquisition date fair values. The excess of the purchase price over the amount allocated to the identifiable assets and liabilities, if any, is recorded as goodwill. Determining the fair value of assets acquired and liabilities assumed requires management to use significant judgment and estimates, including the selection of valuation methodologies, estimates of future revenue and cash flows, discount rates, and selection of comparable companies.
When we issue stock-based or cash awards to an acquired company’s stockholders, we evaluate whether the awards are contingent consideration or compensation for post-combination services. The evaluation includes, among other things, whether
86
the vesting of the awards is contingent on the continued employment of the acquired company’s stockholder beyond the acquisition date. If continued employment is required for vesting, the awards are treated as compensation for post-combination services and recognized as expense over the requisite service period.
We initially recognize intangible assets at fair value, and we amortize them on a straight-line basis over their estimated useful lives. When circumstances indicate that the carrying value of these assets may not be recoverable, we review our identifiable amortizable intangible assets for impairment.
Goodwill represents the excess of the aggregate fair value of the consideration transferred in a business combination over the fair value of the assets acquired, net of liabilities assumed. Goodwill is not amortized, but is subject to an annual impairment test. We have determined that we have a single reporting unit and we perform our annual goodwill impairment test during the fourth quarter or more frequently if events or changes in circumstances indicate that the goodwill may be impaired.
We have the option to first assess qualitative factors to determine whether the existence of events or circumstances leads to a determination that it is more likely than not that the fair value of the reporting unit is less than its carrying amount. If, after assessing the totality of events or circumstances, we determine it is not more likely than not that the fair value of the reporting unit is less than its carrying amount, then additional impairment testing is not required. However, if we conclude otherwise, we are then required to perform a quantitative assessment for impairment.
The quantitative assessment involves comparing the estimated fair value of the reporting unit with its respective book value, including goodwill. If we determine that the estimated fair value exceeds book value, goodwill is considered not to be impaired and no additional steps are necessary. If, however, we determine that the book value of the reporting unit exceeds the fair value, we would recognize an impairment loss in an amount equal to the excess, not to exceed the total amount of goodwill allocated to that reporting unit.
Leases
We lease office space and certain computer equipment in multiple locations under non-cancelable lease agreements. The leases are reviewed for classification as operating, capital, or build-to-suit leases. For operating leases, rent is recognized on a straight-line basis over the lease period. For capital leases, we record the leased asset with a corresponding liability. Payments are recorded as reductions to the liability with an appropriate interest charge recorded based on the then-outstanding remaining liability. Upon adoption of ASU 2016-02
—Leases,
we will recognize additional operating liabilities and corresponding right-of-use assets of the same amount based on the present value of the remaining minimum rental payments under current leasing standards for existing operating leases.
We consider the nature of the renovations and our involvement during the construction period of newly-leased office space to determine if we are considered, for accounting purposes only, to be the owner of the construction project during the construction period. If we determine that we are the owner of the construction project, we are required to capitalize the fair value of the building as well as the construction costs incurred on our Consolidated Balance Sheet along with a corresponding financing liability (“build-to-suit accounting”). Upon occupancy for build-to-suit leases, we assess whether the circumstances qualify for sales recognition under the sale-leaseback accounting guidance. If the lease meets the sale-leaseback criteria, we will remove the asset and related financial obligation from the balance sheet and treat the building lease as an operating lease. If upon completion of construction, the project does not meet the sale-leaseback criteria, the leased property will be treated as a capital lease for financial reporting purposes.
In May 2016, we took possession of our corporate headquarters in Brooklyn, New York upon substantial completion of the construction phase of the build-out. Upon completion of the project, we performed a sale-leaseback analysis pursuant to Accounting Standards Codification (“ASC”) 840
—Leases
, to determine the appropriateness of removing the previously capitalized assets from the Consolidated Balance Sheets. We concluded that components of “continuing involvement” were evident as a result of this review, precluding the derecognition of the related assets from the Consolidated Balance Sheets. In conjunction with the initiation of the lease in May 2014, we also recorded a facility financing obligation equal to the fair market value of the assets received from the landlord. We do not report rent expense for the lease. Rather, rental payments under the lease are recognized as a reduction of the financing obligation and interest expense, and the associated asset capitalized throughout the construction project is depreciated over its estimated useful life. Upon adoption of ASU 2016-02
—Leases,
we will derecognize the facility financing obligation and any gains or losses associated with this change in accounting will be recognized through a cumulative-effect adjustment to accumulated deficit as of January 1, 2019. Additionally, a new right-of-use asset and lease liability will be recognized on the Consolidated Balance Sheet for the associated lease. See “
Note 1—Basis of Presentation and Summary of Significant Accounting Policies
—Recently Issued Accounting Pronouncements” for additional information on the impact of ASU 2016-02
—Leases
.
87
Restructuring and Other Exit Costs (Income)
Under certain circumstances, such as the Actions described in “
Non-GAAP Financial Measures
,” we establish restructuring accruals for estimated employee severance and other exit costs. These accruals require the use of estimates, and though we believe the estimates and assumptions are reasonable, they may differ materially from actual costs. We include restructuring and other exit costs (income) in the applicable operating expense category of the impacted function in the Consolidated Statements of Operations. See “
Note 17—Restructuring and Other Exit Costs (Income)
” in the Notes to Consolidated Financial Statements for additional information.
Fair Value of Financial Instruments
In accounting for the issuance of the Notes discussed in “
Liquidity and Capital Resources
—Sources of Liquidity,” we used estimates and assumptions to calculate the carrying amounts of the liability and equity components by measuring the fair value of similar securities. See “
Note 13—Debt
” in the Notes to Consolidated Financial Statements for additional information.
Recent Accounting Pronouncements
For information regarding our recently issued accounting pronouncements and recently adopted accounting pronouncements, please see “
Note 1—Basis of Presentation and Summary of Significant Accounting Policies
” in the Notes to Consolidated Financial Statements.
88
Item 7A. Quantitative and Qualitative Disclosures About Market Risk.
We have operations both within the United States and internationally and we are exposed to market risks in the ordinary course of our business, including the effects of interest rate changes and foreign currency fluctuations. Information relating to quantitative and qualitative disclosures about these market risks is described below.
Interest Rate Sensitivity
As of
December 31, 2018
and
December 31, 2017
, the majority of our cash and cash equivalents and short-term investments were held in cash deposits, money market funds, fixed-income funds and U.S. Government and agency securities. The fair value of our cash, cash equivalents and short-term investments would not be significantly affected by either an increase or decrease in interest rates due mainly to the short-term nature of these instruments. The majority of our current interest expense is attributable to our facility financing obligation related to our build-to-suit lease and debt discount related to our Notes and is not impacted by external factors on interest rates. A 10% increase or decrease in our current interest rate would not have a significant impact on our interest expense.
Currency Risk
We are a global marketplace. Our revenues are denominated in the currencies of our seller’s ledger currencies, and our operating expenses are denominated in the currencies of the countries in which our operations are located. In addition, in the fourth quarter of 2018, we launched a redesigned payment account and began processing seller charges in our seller’s ledger currencies. Prior to this launch, only Etsy Payments revenues were processed in our seller’s ledger currencies. As a result of transacting business in multiple foreign currencies, primarily the Euro and Pound Sterling, we are subject to the risk of fluctuations in foreign currency exchange rates against the U.S. dollar.
In
the year ended December 31, 2018
, approximately
17%
of GMS was from goods that were not listed in U.S. dollars and, therefore, subject to currency exchange fluctuations. On a currency-neutral basis, GMS growth for
the year ended December 31, 2018
would have been
20.4%
, or approximately
40 basis points
lower
than the reported
20.8%
growth. On a currency-neutral basis, GMS growth for
the three months ended December 31, 2018
would have been
23.1%
compared with the reported
22.3%
growth.
In
the year ended December 31, 2017
, approximately
15%
of GMS was from goods that were not listed in U.S. dollars and, therefore, subject to currency exchange fluctuations. On a currency-neutral basis, GMS growth for
the year ended December 31, 2017
would have been
14.3%
, or approximately
20
basis points lower than the reported
14.5%
growth.
On January 1, 2015, we implemented a revised corporate structure to more closely align our structure with our global operations and future expansion plans outside of the United States, which resulted in a U.S. dollar-denominated intercompany debt on a Euro-denominated ledger that was subject to continued currency exchange rate risk through the middle of the fourth quarter of 2017. In the fourth quarter of 2017, we established a new legal entity based in Ireland with a U.S. dollar functional currency to help mitigate the currency rate risk on our intercompany debt.
For the purpose of analyzing foreign currency exchange risk, we considered the historical trends in foreign currency exchange rates and determined that it was reasonably possible that adverse changes in exchange rates of 10% could be experience in the near term. An adverse 10% foreign currency exchange rate would have resulted in a decrease to revenue of $7.5 million or approximately 1.2% of total revenue and a currency exchange loss of
$17.0 million
for
the year ended December 31, 2018
. This compares to a revenue decrease of $3.7 million or 0.8% of total revenue and currency exchange loss of
$22.5 million
based on the same analysis performed for
the year ended December 31, 2017
.
89
Item 8. Financial Statements and Supplementary Data.
The supplementary financial information required by this item is included in “Management’s Discussion and Analysis of Financial Condition and Results of Operations.”
Etsy, Inc.
Index to the Consolidated Financial Statements
|
Report of Independent Registered Public Accounting Firm
|
|
|
Consolidated Balance Sheets as of December 31, 2018 and 2017
|
|
|
Consolidated Statements of Operations for the years ended December 31, 2018, 2017, and 2016
|
|
|
Consolidated Statements of Comprehensive Income (Loss) for the years ended December 31, 2018, 2017, and 2016
|
|
|
Consolidated Statement of Changes in Stockholders' Equity for the years ended December 31, 2018, 2017, and 2016
|
|
|
Consolidated Statements of Cash Flows for the years ended December 31, 2018, 2017, and 2016
|
|
|
Notes to Consolidated Financial Statements
|
|
90

Report of Independent Registered Public Accounting Firm
To the Stockholders and Board of Directors of Etsy, Inc.
Opinions on the Financial Statements and Internal Control over Financial Reporting
We have audited the accompanying consolidated balance sheets of Etsy, Inc. and its subsidiaries
(the “Company”) as of December 31, 2018 and 2017,
and the related consolidated statements of operations, comprehensive income (loss), changes in stockholders’ equity and cash flows for each of the three years in the period ended December 31, 2018, including the related notes (collectively referred to as the “consolidated financial statements”).
We also have audited the Company's internal control over financial reporting as of December 31, 2018, based on criteria established in
Internal Control - Integrated Framework
(2013)
issued by the Committee of Sponsoring Organizations of the Treadway Commission (COSO).
In our opinion, the consolidated
financial statements referred to above present fairly, in all material respects, the financial position of the Company as of December 31, 2018
and 2017
,
and the results of its
operations and its
cash flows for each of the three years in the period ended December 31, 2018
in conformity with accounting principles generally accepted in the United States of America. Also in our opinion, the Company maintained, in all material respects, effective internal control over financial reporting as of December 31, 2018, based on criteria established in
Internal Control - Integrated Framework
(2013)
issued by the COSO.
Basis for Opinions
The Company's management is responsible for these consolidated financial statements, for maintaining effective internal control over financial reporting, and for its assessment of the effectiveness of internal control over financial reporting, included in Management’s Report on Internal Control Over Financial Reporting appearing under Item 9A. Our responsibility is to express opinions on the Company’s consolidated
financial statements and on the Company's internal control over financial reporting based on our audits. We are a public accounting firm registered with the Public Company Accounting Oversight Board (United States) (PCAOB) and are required to be independent with respect to the Company in accordance with the U.S. federal securities laws and the applicable rules and regulations of the Securities and Exchange Commission and the PCAOB.
We conducted our audits in accordance with the standards of the PCAOB. Those standards require that we plan and perform the audits to obtain reasonable assurance about whether the consolidated
financial statements are free of material misstatement, whether due to error or fraud, and whether effective internal control over financial reporting was maintained in all material respects.
Our audits of the consolidated
financial statements included performing procedures to assess the risks of material misstatement of the consolidated
financial statements, whether due to error or fraud, and performing procedures that respond to those risks. Such procedures included examining, on a test basis, evidence regarding the amounts and disclosures in the consolidated
financial statements. Our audits also included evaluating the accounting principles used and significant estimates made by management, as well as evaluating the overall presentation of the consolidated
financial statements. Our audit of internal control over financial reporting included obtaining an understanding of internal control over financial reporting, assessing the risk that a material weakness exists, and testing and evaluating the design and operating effectiveness of internal control based on the assessed risk. Our audits also included performing such other procedures as we considered necessary in the circumstances. We believe that our audits provide a reasonable basis for our opinions.
Definition and Limitations of Internal Control over Financial Reporting
A company’s internal control over financial reporting is a process designed to provide reasonable assurance regarding the reliability of financial reporting and the preparation of financial statements for external purposes in accordance with generally accepted accounting principles. A company’s internal control over financial reporting includes those policies and procedures that (i) pertain to the maintenance of records that, in reasonable detail, accurately and fairly reflect the transactions and
91
dispositions of the assets of the company; (ii) provide reasonable assurance that transactions are recorded as necessary to permit preparation of financial statements in accordance with generally accepted accounting principles, and that receipts and expenditures of the company are being made only in accordance with authorizations of management and directors of the company; and (iii) provide reasonable assurance regarding prevention or timely detection of unauthorized acquisition, use, or disposition of the company’s assets that could have a material effect on the financial statements.
Because of its inherent limitations, internal control over financial reporting may not prevent or detect misstatements. Also, projections of any evaluation of effectiveness to future periods are subject to the risk that controls may become inadequate because of changes in conditions, or that the degree of compliance with the policies or procedures may deteriorate.
/s/ PricewaterhouseCoopers LLP
New York, New York
February 28, 2019
We have served as the Company’s auditor since 2012.
92
Consolidated Balance Sheets
(In thousands except share and per share amounts)
|
As of December 31,
|
|||||||
|
2018
|
2017
|
||||||
|
ASSETS
|
|||||||
|
Current assets:
|
|||||||
|
Cash and cash equivalents
|
$
|
366,985
|
|
$
|
315,442
|
|
|
|
Short-term investments
|
257,302
|
|
25,108
|
|
|||
|
Accounts receivable, net
|
12,244
|
|
33,677
|
|
|||
|
Prepaid and other current assets
|
22,686
|
|
20,379
|
|
|||
|
Funds receivable and seller accounts
|
21,072
|
|
44,658
|
|
|||
|
Total current assets
|
680,289
|
|
439,264
|
|
|||
|
Restricted cash
|
5,341
|
|
5,341
|
|
|||
|
Property and equipment, net
|
120,179
|
|
117,617
|
|
|||
|
Goodwill
|
37,482
|
|
38,541
|
|
|||
|
Intangible assets, net
|
34,589
|
|
4,100
|
|
|||
|
Deferred tax assets
|
23,464
|
|
159
|
|
|||
|
Other assets
|
507
|
|
561
|
|
|||
|
Total assets
|
$
|
901,851
|
|
$
|
605,583
|
|
|
|
LIABILITIES AND STOCKHOLDERS’ EQUITY
|
|||||||
|
Current liabilities:
|
|||||||
|
Accounts payable
|
$
|
26,545
|
|
$
|
13,622
|
|
|
|
Accrued expenses
|
49,158
|
|
28,743
|
|
|||
|
Capital lease obligations—current
|
3,884
|
|
5,798
|
|
|||
|
Funds payable and amounts due to sellers
|
21,072
|
|
44,658
|
|
|||
|
Deferred revenue
|
7,478
|
|
6,262
|
|
|||
|
Other current liabilities
|
3,925
|
|
3,394
|
|
|||
|
Total current liabilities
|
112,062
|
|
102,477
|
|
|||
|
Capital lease obligations—net of current portion
|
2,095
|
|
4,115
|
|
|||
|
Deferred tax liabilities
|
30,455
|
|
23,786
|
|
|||
|
Facility financing obligation
|
59,991
|
|
60,049
|
|
|||
|
Long-term debt, net
|
276,486
|
|
—
|
|
|||
|
Other liabilities
|
19,864
|
|
18,262
|
|
|||
|
Total liabilities
|
500,953
|
|
208,689
|
|
|||
|
Commitments and contingencies
(Note 14)
|
|
|
|
|
|||
|
Stockholders’ equity:
|
|||||||
|
Common stock ($0.001 par value, 1,400,000,000 shares authorized as of December 31, 2018 and 2017; 119,771,702 and 121,769,238 shares issued and outstanding as of December 31, 2018 and 2017, respectively)
|
120
|
|
122
|
|
|||
|
Preferred stock ($0.001 par value, 25,000,000 shares authorized as of December 31, 2018 and 2017)
|
—
|
|
—
|
|
|||
|
Additional paid-in capital
|
562,033
|
|
499,441
|
|
|||
|
Accumulated deficit
|
(153,442
|
)
|
(96,290
|
)
|
|||
|
Accumulated other comprehensive loss
|
(7,813
|
)
|
(6,379
|
)
|
|||
|
Total stockholders’ equity
|
400,898
|
|
396,894
|
|
|||
|
Total liabilities and stockholders’ equity
|
$
|
901,851
|
|
$
|
605,583
|
|
|
The accompanying notes are an integral part of these Consolidated Financial Statements
93
Consolidated Statements of Operations
(In thousands except share and per share amounts)
|
|
Year Ended
December 31, |
||||||||||
|
|
2018
|
2017
|
2016
|
||||||||
|
Revenue
|
$
|
603,693
|
|
$
|
441,231
|
|
$
|
364,967
|
|
||
|
Cost of revenue
|
190,762
|
|
150,986
|
|
123,328
|
|
|||||
|
Gross profit
|
412,931
|
|
290,245
|
|
241,639
|
|
|||||
|
Operating expenses:
|
|||||||||||
|
Marketing
|
158,013
|
|
109,085
|
|
82,248
|
|
|||||
|
Product development
|
97,249
|
|
74,616
|
|
55,083
|
|
|||||
|
General and administrative
|
82,883
|
|
91,486
|
|
86,180
|
|
|||||
|
Asset impairment charges
|
—
|
|
3,162
|
|
551
|
|
|||||
|
Total operating expenses
|
338,145
|
|
278,349
|
|
224,062
|
|
|||||
|
Income from operations
|
74,786
|
|
11,896
|
|
17,577
|
|
|||||
|
Other (expense) income:
|
|||||||||||
|
Interest expense
|
(22,178
|
)
|
(11,130
|
)
|
(7,204
|
)
|
|||||
|
Interest and other income
|
8,957
|
|
2,394
|
|
1,702
|
|
|||||
|
Foreign exchange (loss) gain
|
(6,487
|
)
|
29,105
|
|
(14,951
|
)
|
|||||
|
Total other (expense) income
|
(19,708
|
)
|
20,369
|
|
(20,453
|
)
|
|||||
|
Income (loss) before income taxes
|
55,078
|
|
32,265
|
|
(2,876
|
)
|
|||||
|
Benefit (provision) for income taxes
|
22,413
|
|
49,535
|
|
(27,025
|
)
|
|||||
|
Net income (loss)
|
$
|
77,491
|
|
$
|
81,800
|
|
$
|
(29,901
|
)
|
||
|
Net income (loss) per share attributable to common stockholders:
|
|||||||||||
|
Basic
|
$
|
0.64
|
|
$
|
0.69
|
|
$
|
(0.26
|
)
|
||
|
Diluted
|
$
|
0.61
|
|
$
|
0.68
|
|
$
|
(0.26
|
)
|
||
|
Weighted average common shares outstanding:
|
|||||||||||
|
Basic
|
120,146,076
|
|
118,538,687
|
|
113,562,738
|
|
|||||
|
Diluted
|
127,084,785
|
|
122,267,673
|
|
113,562,738
|
|
|||||
The accompanying notes are an integral part of these Consolidated Financial Statements
94
Consolidated Statements of
Comprehensive Income (Loss)
(In thousands)
|
|
Year Ended
December 31, |
||||||||||
|
|
2018
|
2017
|
2016
|
||||||||
|
Net income (loss)
|
$
|
77,491
|
|
$
|
81,800
|
|
$
|
(29,901
|
)
|
||
|
Other comprehensive (loss) income:
|
|||||||||||
|
Cumulative translation adjustment
|
(1,399
|
)
|
(24,898
|
)
|
7,675
|
|
|||||
|
Unrealized (losses) gains on marketable securities, net of tax of $0, $15, and $5, respectively
|
(35
|
)
|
47
|
|
(8
|
)
|
|||||
|
Total other comprehensive (loss) income
|
(1,434
|
)
|
(24,851
|
)
|
7,667
|
|
|||||
|
Comprehensive income (loss)
|
$
|
76,057
|
|
$
|
56,949
|
|
$
|
(22,234
|
)
|
||
The accompanying notes are an integral part of these Consolidated Financial Statements
95
Consolidated Statements of Changes in Stockholders’ Equity
(In thousands except share amounts)
|
|
Common Stock
|
Additional
Paid-in
Capital
|
Accumulated Deficit
|
Accumulated Other Comprehensive Income (Loss)
|
Total
|
|||||||||||||||||
|
|
||||||||||||||||||||||
|
|
Shares
|
Amount
|
||||||||||||||||||||
|
Balance as of December 31, 2015
|
112,563,354
|
|
$
|
113
|
|
$
|
406,020
|
|
$
|
(86,440
|
)
|
$
|
10,805
|
|
$
|
330,498
|
|
|||||
|
Stock-based compensation
|
—
|
|
—
|
|
13,960
|
|
—
|
|
—
|
|
13,960
|
|
||||||||||
|
Exercise of vested options
|
2,535,620
|
|
3
|
|
10,565
|
|
—
|
|
—
|
|
10,568
|
|
||||||||||
|
Vesting of restricted stock units, net of shares withheld
|
144,651
|
|
—
|
|
(1,258
|
)
|
—
|
|
—
|
|
(1,258
|
)
|
||||||||||
|
Exercise of warrants, net of shares withheld
|
80,011
|
|
—
|
|
—
|
|
—
|
|
—
|
|
—
|
|
||||||||||
|
Retirement of restricted shares
|
(36,346
|
)
|
—
|
|
—
|
|
—
|
|
—
|
|
—
|
|
||||||||||
|
Issuance of common stock at acquisition date
|
685,749
|
|
—
|
|
6,966
|
|
—
|
|
—
|
|
6,966
|
|
||||||||||
|
Stock-based compensation—acquisitions
|
—
|
|
—
|
|
1,080
|
|
—
|
|
—
|
|
1,080
|
|
||||||||||
|
Conversion of liability-classified restricted shares upon vesting
|
—
|
|
—
|
|
1,942
|
|
—
|
|
—
|
|
1,942
|
|
||||||||||
|
Excess tax benefit from the exercise of options
|
—
|
|
—
|
|
3,235
|
|
—
|
|
—
|
|
3,235
|
|
||||||||||
|
Other comprehensive income
|
—
|
|
—
|
|
—
|
|
—
|
|
7,667
|
|
7,667
|
|
||||||||||
|
Net loss
|
—
|
|
—
|
|
—
|
|
(29,901
|
)
|
—
|
|
(29,901
|
)
|
||||||||||
|
Balance as of December 31, 2016
|
115,973,039
|
|
116
|
|
442,510
|
|
(116,341
|
)
|
18,472
|
|
344,757
|
|
||||||||||
|
Stock-based compensation
|
—
|
|
—
|
|
23,462
|
|
—
|
|
—
|
|
23,462
|
|
||||||||||
|
Exercise of vested options
|
5,760,263
|
|
6
|
|
33,832
|
|
—
|
|
—
|
|
33,838
|
|
||||||||||
|
Vesting of restricted stock units, net of shares withheld
|
622,167
|
|
1
|
|
(6,418
|
)
|
—
|
|
—
|
|
(6,417
|
)
|
||||||||||
|
Stock repurchase
|
(586,231
|
)
|
(1
|
)
|
—
|
|
(10,300
|
)
|
—
|
|
(10,301
|
)
|
||||||||||
|
Stock-based compensation—acquisitions
|
—
|
|
—
|
|
3,132
|
|
—
|
|
—
|
|
3,132
|
|
||||||||||
|
Conversion of liability-classified restricted shares upon vesting
|
—
|
|
—
|
|
2,838
|
|
—
|
|
—
|
|
2,838
|
|
||||||||||
|
Cumulative effect adjustment
|
—
|
|
—
|
|
85
|
|
(51,449
|
)
|
—
|
|
(51,364
|
)
|
||||||||||
|
Other comprehensive loss
|
—
|
|
—
|
|
—
|
|
—
|
|
(24,851
|
)
|
(24,851
|
)
|
||||||||||
|
Net income
|
—
|
|
—
|
|
—
|
|
81,800
|
|
—
|
|
81,800
|
|
||||||||||
|
Balance as of December 31, 2017
|
121,769,238
|
|
122
|
|
499,441
|
|
(96,290
|
)
|
(6,379
|
)
|
396,894
|
|
||||||||||
|
Stock-based compensation
|
—
|
|
—
|
|
36,729
|
|
|
|
|
|
36,729
|
|
||||||||||
|
Exercise of vested options
|
1,588,779
|
|
1
|
|
18,252
|
|
—
|
|
—
|
|
18,253
|
|
||||||||||
|
Issuance of convertible senior notes, net of issuance costs and taxes
|
—
|
|
—
|
|
53,323
|
|
—
|
|
—
|
|
53,323
|
|
||||||||||
|
Purchase of capped call, net of taxes
|
—
|
|
—
|
|
(25,400
|
)
|
—
|
|
—
|
|
(25,400
|
)
|
||||||||||
|
Vesting of restricted stock units, net of shares withheld
|
860,102
|
|
1
|
|
(24,066
|
)
|
—
|
|
—
|
|
(24,065
|
)
|
||||||||||
|
Stock repurchase
|
(4,446,417
|
)
|
(4
|
)
|
—
|
|
(134,643
|
)
|
—
|
|
(134,647
|
)
|
||||||||||
|
Stock-based compensation—acquisitions
|
—
|
|
—
|
|
3,754
|
|
—
|
|
—
|
|
3,754
|
|
||||||||||
|
Other comprehensive loss
|
—
|
|
—
|
|
—
|
|
—
|
|
(1,434
|
)
|
(1,434
|
)
|
||||||||||
|
Net income
|
—
|
|
—
|
|
—
|
|
77,491
|
|
—
|
|
77,491
|
|
||||||||||
|
Balance as of December 31, 2018
|
119,771,702
|
|
$
|
120
|
|
$
|
562,033
|
|
$
|
(153,442
|
)
|
$
|
(7,813
|
)
|
$
|
400,898
|
|
|||||
The accompanying notes are an integral part of these Consolidated Financial Statements
96
Consolidated Statements of Cash Flows
(In thousands
)
|
|
Year Ended
December 31, |
||||||||||
|
|
2018
|
2017
|
2016
|
||||||||
|
Cash flows from operating activities
|
|||||||||||
|
Net income (loss)
|
$
|
77,491
|
|
$
|
81,800
|
|
$
|
(29,901
|
)
|
||
|
Adjustments to reconcile net income (loss) to net cash provided by operating activities:
|
|||||||||||
|
Stock-based compensation expense
|
34,477
|
|
22,655
|
|
13,168
|
|
|||||
|
Stock-based compensation expense—acquisitions
|
3,754
|
|
3,904
|
|
2,733
|
|
|||||
|
Depreciation and amortization expense
|
26,742
|
|
27,197
|
|
22,525
|
|
|||||
|
Bad debt expense
|
4,124
|
|
2,497
|
|
1,770
|
|
|||||
|
Foreign exchange loss (gain)
|
5,997
|
|
(27,424
|
)
|
12,921
|
|
|||||
|
Amortization of debt issuance costs
|
1,191
|
|
463
|
|
184
|
|
|||||
|
Non-cash interest expense
|
10,968
|
|
3,117
|
|
5,337
|
|
|||||
|
Interest on marketable securities
|
(2,887
|
)
|
426
|
|
914
|
|
|||||
|
Loss on disposal of assets
|
136
|
|
520
|
|
1,143
|
|
|||||
|
Asset impairment charges
|
—
|
|
3,162
|
|
551
|
|
|||||
|
Deferred income taxes
|
(22,414
|
)
|
(49,535
|
)
|
9,969
|
|
|||||
|
Amortization of deferred tax charge
|
—
|
|
—
|
|
17,132
|
|
|||||
|
Changes in operating assets and liabilities, net of acquisitions:
|
|||||||||||
|
Accounts receivable
|
17,215
|
|
(8,826
|
)
|
(8,192
|
)
|
|||||
|
Funds receivable and seller accounts
|
23,436
|
|
(13,477
|
)
|
(10,910
|
)
|
|||||
|
Prepaid expenses and other current assets
|
(4,785
|
)
|
3,024
|
|
(1,384
|
)
|
|||||
|
Other assets
|
43
|
|
(28
|
)
|
438
|
|
|||||
|
Accounts payable
|
13,364
|
|
2,837
|
|
(3,585
|
)
|
|||||
|
Accrued and other current liabilities
|
23,079
|
|
(2,659
|
)
|
795
|
|
|||||
|
Funds payable and amounts due to sellers
|
(23,436
|
)
|
13,477
|
|
10,910
|
|
|||||
|
Deferred revenue
|
1,331
|
|
434
|
|
964
|
|
|||||
|
Other liabilities
|
9,099
|
|
5,537
|
|
482
|
|
|||||
|
Net cash provided by operating activities
|
198,925
|
|
69,101
|
|
47,964
|
|
|||||
|
Cash flows from investing activities
|
|||||||||||
|
Cash paid for asset acquisition and intangible assets
|
(35,494
|
)
|
—
|
|
—
|
|
|||||
|
Acquisition of businesses, net of cash acquired
|
—
|
|
—
|
|
(7,880
|
)
|
|||||
|
Purchases of property and equipment
|
(1,019
|
)
|
(3,948
|
)
|
(35,981
|
)
|
|||||
|
Development of internal-use software
|
(19,537
|
)
|
(9,208
|
)
|
(11,769
|
)
|
|||||
|
Purchases of marketable securities
|
(514,286
|
)
|
(62,348
|
)
|
(160,504
|
)
|
|||||
|
Sales of marketable securities
|
284,943
|
|
137,340
|
|
80,704
|
|
|||||
|
Net cash (used in) provided by investing activities
|
(285,393
|
)
|
61,836
|
|
(135,430
|
)
|
|||||
|
Cash flows from financing activities
|
|||||||||||
|
Payment of tax obligations on vested equity awards
|
(24,065
|
)
|
(6,417
|
)
|
(1,258
|
)
|
|||||
|
Repurchase of stock
|
(134,647
|
)
|
(10,301
|
)
|
—
|
|
|||||
|
Proceeds from exercise of stock options
|
18,253
|
|
33,838
|
|
10,568
|
|
|||||
|
Proceeds from issuance of convertible senior notes
|
345,000
|
|
—
|
|
—
|
|
|||||
|
Payment of debt issuance costs
|
(9,962
|
)
|
—
|
|
—
|
|
|||||
|
Purchase of capped call
|
(34,224
|
)
|
—
|
|
—
|
|
|||||
|
Payments on capital lease obligations
|
(6,057
|
)
|
(7,798
|
)
|
(6,086
|
)
|
|||||
|
Deferred payments on acquisition of business
|
—
|
|
—
|
|
(649
|
)
|
|||||
|
Payments on facility financing obligation
|
(10,164
|
)
|
(5,883
|
)
|
—
|
|
|||||
|
Other financing, net
|
(128
|
)
|
3,116
|
|
(3,099
|
)
|
|||||
|
Net cash provided by (used in) financing activities
|
144,006
|
|
6,555
|
|
(524
|
)
|
|||||
|
Effect of exchange rate changes on cash
|
(5,995
|
)
|
(3,642
|
)
|
(1,662
|
)
|
|||||
|
Net increase (decrease) in cash, cash equivalents, and restricted cash
|
51,543
|
|
133,850
|
|
(89,652
|
)
|
|||||
|
Cash, cash equivalents, and restricted cash
at beginning of period
|
320,783
|
|
186,933
|
|
276,585
|
|
|||||
|
Cash, cash equivalents, and restricted cash
at end of period
|
$
|
372,326
|
|
$
|
320,783
|
|
$
|
186,933
|
|
||
97
Consolidated Statements of Cash Flows
(In thousands)
|
|
Year Ended
December 31, |
||||||||||
|
|
2018
|
2017
|
2016
|
||||||||
|
Supplemental cash flow disclosures:
|
|||||||||||
|
Cash paid for interest
|
$
|
10,002
|
|
$
|
7,555
|
|
$
|
2,000
|
|
||
|
Cash paid for income taxes
|
$
|
966
|
|
$
|
1,003
|
|
$
|
10,559
|
|
||
|
Supplemental non-cash disclosures:
|
|||||||||||
|
Equipment acquired under capital lease obligations
|
$
|
2,122
|
|
$
|
5,586
|
|
$
|
5,030
|
|
||
|
Stock-based compensation capitalized in development of capitalized software
|
$
|
2,252
|
|
$
|
807
|
|
$
|
792
|
|
||
|
Additions to development of internal-use software and property and equipment included in accounts payable and accrued expenses
|
$
|
1,211
|
|
$
|
956
|
|
$
|
2,239
|
|
||
|
Fair value of common stock issued in acquisition
|
$
|
—
|
|
$
|
—
|
|
$
|
6,966
|
|
||
The accompanying notes are an integral part of these Consolidated Financial Statements
98
Notes to Consolidated Financial Statements
Note 1—Basis of Presentation and Summary of Significant Accounting Policies
Description of Business
Etsy, Inc. (the “Company” or “Etsy”) was incorporated in Delaware in February 2006. Etsy is the global marketplace for unique and creative goods. The Company generates revenue primarily from transaction and listing fees, Etsy Payments fees, Promoted Listing fees, Etsy Shipping Label sales, Pattern fees, and Etsy Plus subscription fees.
Basis of Consolidation
The Consolidated Financial Statements include the accounts of Etsy and its wholly-owned subsidiaries. All intercompany balances and transactions have been eliminated in consolidation.
Reclassifications
Certain items in the prior years’ Consolidated Financial Statements have been reclassified to conform to the current year presentation reflected in the Consolidated Financial Statements. Specifically, the Company reclassified
$0.2 million
previously included in other assets to deferred tax assets on the Consolidated Balance Sheet for the year ended
December 31, 2017
to conform to the current year presentation.
Additionally, the Company reclassified
$146.6 million
and
$111.4 million
previously included in Services revenue to Marketplace revenue (see “
Note 2—Revenue
”) for the years ended
December 31, 2017
and
2016
, respectively, to conform to the current year presentation in connection with the adoption of Accounting Standards Codification (“ASC”) 606
—Revenue from Contracts with Customers
.
The Company also reclassified
$5.3 million
on the Consolidated Statement of Cash Flows in the years ended
December 31, 2017
and
2016
to include restricted cash in the beginning and ending cash, cash equivalents, and restricted cash balances to conform to the current year presentation upon adoption of Accounting Standards Update (“ASU”) 2016-18
—Statement of Cash Flows: Restricted Cash.
The Company also reclassified
$1.6 million
and
$7.8 million
previously included in changes in prepaid expenses and other current assets, accrued and other current liabilities, and other liabilities to deferred income taxes on the Consolidated Statements of Cash Flows for the years ended
December 31, 2017
and
2016
, respectively, to conform to the current year presentation.
Revisions
The Company revised the Consolidated Statement of Cash Flows for the years ended December 31, 2017 and 2016 to correct the presentation of the effect of exchange rate changes on cash. This revision resulted in an increase (decrease) of
$1.7 million
in cash flows from operating activities,
$3.1 million
in cash flows from financing activities, and
$(4.8) million
in effect of exchange rate changes on cash in the year ended December 31, 2017 and an increase (decrease) of
$(2.0) million
in cash flows from operating activities,
$(3.1) million
in cash flows from financing activities, and
$5.1 million
in effect of exchange rate changes on cash in the year ended December 31, 2016.
Additionally, the 2018 quarterly periods will also be revised in connection with our future 2019 unaudited interim condensed Consolidated Financial Statement filings in Quarterly Reports on Form 10-Q. The Company will revise the Consolidated Statements of Cash Flows for the year-to-date periods ended September 30, 2018, June 30, 2018 and March 31, 2018 to correct the presentation of the effect of exchange rate changes on cash. This revision will result in an increase (decrease) of
$(0.3) million
in cash flows from operating activities,
$4.0 million
in cash flows from financing activities, and
$(3.7) million
in effect of exchange rate changes on cash in the nine months ended September 30, 2018, an increase (decrease) of
$0.3 million
in cash flows from operating activities,
$1.0 million
in cash flows from financing activities, and
$(1.3) million
in effect of exchange rate changes on cash in the six months ended June 30, 2018, and an increase (decrease) of
$(0.3) million
in cash flows from operating activities,
$(2.7) million
in cash flows from financing activities, and
$3.0 million
in effect of exchange rate changes on cash in the three months ended March 31, 2018.
99
These revisions do not impact the Consolidated Statements of Operations, the Consolidated Statements of Comprehensive Income (Loss), or the Consolidated Balance Sheets. The Company has concluded that the effect of this revision is not material to any of our previously issued financial statements.
Correction of Errors
During the year ended
December 31, 2018
, the Company recorded adjustments to correct errors in the years ended
December 31, 2018
,
2017
and
2016
that increased income before income taxes by
$1.5 million
in the current year and decreased net income by
$1.3 million
in the current year. The Company has concluded that the errors and their correction were not material to the Consolidated Financial Statements for any of the periods impacted nor are they material for the 2018 results.
Use of Estimates
The preparation of the Company’s Consolidated Financial Statements in conformity with accounting principles generally accepted in the United States of America (“GAAP”) requires management to make estimates and judgments that affect the reported amounts of assets and liabilities and disclosure of contingent assets, liabilities and equity at the date of the Consolidated Financial Statements and the reported amounts of revenues and expenses during the reporting period. The accounting estimates that require management’s most difficult and subjective judgments include: for revenue recognition, determining the nature and timing of satisfaction of performance obligations and stand-alone selling price for use in allocating the subscription price; income taxes, including the assessment of valuation allowances and the accounting for uncertain tax positions; website development costs and internal-use software; purchase price allocations for business combinations; valuation of goodwill and intangible assets; leases; stock-based compensation; restructuring and other exit costs (income); and fair value of financial instruments. The Company evaluates its estimates and judgments on an ongoing basis and revises them when necessary. Actual results may differ from the original or revised estimates.
Revenue Recognition
The Company’s revenue is diversified; generated from a mix of marketplace activities and other optional services to help Etsy sellers to generate more sales and scale their businesses. Revenues are recognized as the Company transfers control of promised goods or services to Etsy sellers, in an amount that reflects the consideration the Company expects to be entitled to in exchange for those goods or services. The Company evaluates whether it is appropriate to recognize revenue on a gross or net basis based upon its evaluation of whether the Company obtains control of the specified goods or services by considering if it is primarily responsible for fulfillment of the promise, has inventory risk, and has the latitude in establishing pricing and selecting suppliers, among other factors. Based on its evaluation of these factors, revenue is recorded either gross or net of costs associated with the transaction. With the exception of Etsy Shipping Labels, the Company’s revenues are recognized on a gross basis. Sales and usage-based taxes are excluded from revenues.
Marketplace revenue:
As members of the Etsy marketplace, Etsy sellers receive the benefit of marketplace activities, including listing items for sale, completing sales transactions, and payments processing, which represents a single stand-ready performance obligation. Etsy sellers pay a fixed listing fee of
$0.20
for each item listed on Etsy.com for a period of four months or, if earlier, until a sale occurs. Variable fees include the
5%
transaction fee that an Etsy seller pays for each completed transaction, inclusive of shipping fees charged, and Etsy Payments fees for processing payments, including foreign currency payments. On
July 16, 2018
, the Company increased the seller transaction fee from
3.5%
to
5%
of each completed transaction, and now applies it to the cost of shipping in addition to the cost of the item. Etsy Payments processing fees vary between
3
–
4.5%
of an item’s total sale price, including shipping, plus a flat fee per order, depending on the country in which a seller’s bank account is located. When a foreign currency payment is processed, an additional
2.5
–
5%
transaction fee is applied.
The listing fee is recognized ratably over a
four
-month listing period, unless the item is sold or the seller re-lists it, at which time any remaining listing fee is recognized. The transaction fee and Etsy Payments fees are recognized when the corresponding transaction is consummated. Listing fees are nonrefundable while transaction fees and Etsy Payments fees are recorded net of refunds.
100
Services revenue:
Services revenue is derived from optional services offered to Etsy sellers, which include Promoted Listings, Etsy Shipping Labels, Pattern, and Etsy Plus. Each service below represents an individual obligation that the Company must perform when an Etsy seller chooses to use the service.
|
•
|
Revenue from Promoted Listings, the Company’s on-site advertising service, consists of cost-per-click fees an Etsy seller pays for prominent placement of the seller’s listings in search results in the Company’s marketplace. Promoted Listings fees are based on an auction system, which utilizes the budget that each Etsy seller sets when using Promoted Listings to determine the cost-per-click fee. Promoted Listing fees are nonrefundable and are charged to a seller’s Etsy bill when the Promoted Listing is clicked; at which time revenue is recognized.
|
|
•
|
Revenue from Etsy Shipping Labels consists of fees an Etsy seller pays the Company when she purchases shipping labels through its platform, net of the cost the Company incurs in purchasing those shipping labels. The Company provides its sellers access to purchase shipping labels from the United States Postal Service, FedEx, Canada Post, Royal Mail, and DAI Post at discounted pricing due to the volume of purchases through its platform. The Company recognizes Etsy Shipping Label revenue when an Etsy seller purchases a shipping label. The Company recognizes Etsy Shipping Label revenue on a net basis as it is an agent in this arrangement and does not take control of shipping labels prior to transferring the labels to the Etsy Seller. Etsy Shipping Label revenue is recorded net of refunds.
|
|
•
|
Revenue from Pattern consists of monthly subscription fees an Etsy seller pays to use the Company’s custom website services. The Company recognizes revenue from Pattern ratably over the term of the subscription. The Pattern subscription fee is
$15
per month and is nonrefundable.
|
|
•
|
Revenue from Etsy Plus consists of monthly subscription fees an Etsy seller pays for enhanced tools and credits for use on the Company’s platform. The Etsy Plus subscription fee is
$10
per month and is nonrefundable. Each feature represents its own distinct performance obligation. The Company allocates subscription revenue based on the relative actual or estimated stand-alone selling price of the features included in the Etsy Plus offering. Enhanced tools include advanced shop customization options, targeted restock notifications, discounts on branded packaging and promotional materials, and free or discounted custom web addresses, all of which are recognized ratably over the
30
-day subscription period. Additionally, the subscription includes
$5
of Promoted Listing credits and
15
free listing credits per month. The allocated value of Promoted Listing credits is recognized when the Promoted Listing is clicked, or when the 30-day subscription period expires. The allocated value of listing credits is deferred until the option is used, and once used, allocated over the four-month listing period. Any unused listing credits are recognized when the 30-day subscription period expires.
|
Other revenue
: Other revenue typically includes revenue generated from commercial partnerships, which are recognized as the customer in each contract consumes the benefit of the service Etsy provides in each arrangement.
Cost of Revenue
Cost of revenue primarily consists of the cost of interchange and other fees for credit card processing services, credit card verification service fees, and credit card chargebacks to support Etsy Payments revenue, and costs of refunds made to Etsy buyers that the Company is not able to collect from Etsy sellers. Cost of revenue also includes expenses associated with the operation and maintenance of the Company’s platform and its data centers, including employee-related costs, hosting and bandwidth costs, and depreciation and amortization.
Marketing
Marketing expenses largely consist of direct marketing and indirect employee-related expenses to support our marketing initiatives. Direct marketing includes digital marketing, brand marketing and television, seller lifecycle and growth activities, public relations, communications, and marketing partnerships. Digital marketing, also referred to as performance marketing, primarily consists of targeted promotional campaigns through electronic channels, such as product listing ads, search engine marketing, affiliate programs, and display advertising which are focused on buyer acquisition and brand marketing. Advertising expenses are recognized as incurred, with the exception of certain production expenses related to television and display advertising which are deferred until the first time an advertisement airs or is published. If such advertising is not expected to occur, costs are expensed immediately. Advertising expenses related to direct marketing, included in marketing expenses on the Consolidated Statements of Operations, were
$129.1 million
,
$78.4 million
, and
$55.5 million
in the years ended
December 31, 2018
,
2017
, and
2016
, respectively.
101
Product Development
Product development expenses consist primarily of employee-related expenses for engineering, product management, product design, and product research activities. Additional expenses include consulting costs related to the development, quality assurance, and testing of new technology and enhancement of our existing technology.
Stock-Based Compensation
The Company accounts for its stock-based compensation awards in accordance with ASC Topic 718
—Compensation—Stock Compensation
(“ASC 718”). Stock options and restricted stock units (“RSUs”) are awarded to employees and members of the Company’s Board of Directors and are measured at fair value at each grant date. The Company calculates the fair value of stock options on the date of grant using the Black-Scholes option-pricing model and the expense is recognized over the requisite service period. Prior to the IPO, the Company utilized equity valuations based on comparable publicly-traded companies, discounted free cash flows, an analysis of the Company’s enterprise value, and other factors deemed relevant in estimating the fair value of its common stock. Subsequent to the IPO, the Company has used the closing price of its common stock on Nasdaq as the fair value of its common stock. The risk-free rate for periods within the contractual life of the option is based on the U.S. Treasury yield curve in effect at the time of grant. Expected volatilities are based on implied volatilities from market comparisons of Etsy and certain publicly traded companies, and other factors. The expected term of stock options granted has been determined using the simplified method, which uses the midpoint between the vesting date and the contractual term. The fair value of RSUs is determined based on the closing price of the Company’s common stock on Nasdaq on the grant date. The requisite service period for stock options and RSUs is generally four years from the date of grant.
In the first quarter of 2017, the Company made an accounting policy election to recognize forfeitures as they occur upon adoption of guidance in ASU 2016-09
—Compensation—Stock Compensation: Scope of Modification Accounting
. In reporting periods prior to 2017, the Company estimated forfeitures at the time of grant and revised in subsequent periods as necessary if actual forfeitures differed from estimates.
The Company accounted for stock-based compensation arrangements related to the A Little Market (“ALM”) acquisition in restricted shares, subject to a put option that allows the holder of the shares to put the shares back to the Company for cash, as liability-classified stock awards. These awards were re-measured at fair value each reporting period, with changes in fair value being charged to the Consolidated Statement of Operations. Compensation expense was recognized using a graded vesting methodology for each separately vesting tranche as though the award were, in substance, multiple awards. Unless the put option was exercised, the restricted shares were to be reclassified from a liability to an equity classified award upon the termination of the put option at the vesting of each separate tranche. In 2017, all outstanding restricted shares subject to a put option became fully vested and the Company is no longer required to remeasure these awards at fair value going forward.
Foreign Currency
The Company has determined that the functional currency for each of its foreign operations is the currency of the primary cash flow of the operations, which is generally the local currency in which the operation is located. All assets and liabilities are translated into U.S. dollars using exchange rates in effect at the balance sheet date. Revenue and expenses are translated using average exchange rates during the period. Foreign currency translation adjustments are reflected in stockholders’ equity as a component of other comprehensive income (loss). Transaction gains and losses including intercompany balances denominated in a currency other than the functional currency of the entity involved are included in foreign exchange gain (loss) within other income (expense) in the Consolidated Statement of Operations.
Income Taxes
The income tax (provision) benefit is based on income (loss) before income taxes and is accounted for under the asset and liability method. Under this method, deferred tax assets and liabilities are recognized for the future tax consequences attributable to differences between the financial statement and tax bases of assets and liabilities using enacted tax rates in effect for the year in which the differences are expected to settle. The effect on deferred tax assets and liabilities of a change in tax rates is recognized as income or expense in the period that includes the enactment date. Management assesses the need for a valuation allowance on a quarterly basis to reduce deferred tax assets to the amounts expected to be realized.
102
On December 22, 2017 the Tax Cuts and Jobs Act of 2017 (the “TCJA”) was signed into law. The TCJA requires the Company to make an accounting policy election of either (1) treating taxes due on future U.S. inclusions in taxable income related to Global Intangible Low Taxed Income ("GILTI") as a current period expense when incurred (the “period cost method”) or (2) factoring such amounts into the Company’s measurement of its deferred taxes (the “deferred method”). The Company has recorded tax expense related to GILTI in its effective tax rate for 2018, and has elected to treat taxes due on future U.S. inclusions in taxable income related to GILTI as a current period expense when incurred using the period cost method.
The Company accounts for uncertainty in income taxes using a recognition threshold and a measurement attribute for the financial statement recognition and measurement of tax positions taken or expected to be taken in a tax return. For benefits to be recognized, a tax position must be more likely than not to be sustained upon examination by the taxing authorities. The amount recognized is measured as the largest amount of benefit that has a greater than 50% likelihood of being realized upon ultimate audit settlement.
The Company recognizes interest and penalties, if any, associated with income tax matters as part of the income tax provision and includes accrued interest and penalties with the related income tax liability in the Consolidated Balance Sheet.
Excess Tax Benefits from Exercise of Stock Options
As of the first quarter of 2017, the Company adopted ASU 2016-09
—Stock Compensation: Improvements to Employee Share-based Payment Accounting
, for share-based payment transactions that require a reporting entity to recognize excess tax benefits and deficiencies as income tax expense or benefit in the income statement. Prior to this adoption, including the year ended December 31, 2016, the Company used the “with and without” approach in determining the order in which tax attributes were utilized. As a result, the Company recognized a tax benefit from stock-based awards (“windfall”) in additional paid-in capital only if an incremental tax benefit was realized after all other tax attributes available to the Company had been utilized. When tax deductions from stock-based awards were less than the cumulative book compensation expense, the tax effect of the resulting difference (“shortfall”) was charged first to additional paid-in capital, to the extent of the Company’s pool of windfall tax benefits, with any remainder recognized in income tax expense.
Net Income (Loss) Per Share
Basic net income (loss) per share attributable to common stockholders is computed by dividing the net income (loss) attributable to common stockholders by the weighted-average number of common shares outstanding for the period. Diluted net income (loss) per share is computed by dividing net income (loss) for the period by the weighted-average number of shares of common stock and potentially dilutive common stock outstanding during the period. Net income in the diluted net income per share calculation is adjusted for income or loss from fair value adjustments on instruments accounted for as liabilities, but which may be settled in shares. The dilutive effect of outstanding options and stock-based compensation awards is reflected in diluted net income (loss) per share by application of the treasury stock method. Since the Company expects to settle in cash the principal outstanding under the
0%
Convertible Senior Notes due
2023
the Company issued in
March 2018
(the “Notes,” see “
Note 13—Debt
”), it uses the treasury stock method when calculating the potential dilutive effect of the conversion spread on diluted net income per share, if applicable. The conversion spread will have a dilutive impact on diluted net income per share of common stock when the average market price of the Company’s common stock for a given period exceeds the conversion price of
$36.27
per share.
The calculation of diluted net income (loss) per share excludes all anti-dilutive common shares. For periods in which the Company has reported net losses, diluted net loss per share attributable to common stockholders is the same as basic net loss per share attributable to common stockholders, because dilutive common shares are not assumed to have been issued if their effect is anti-dilutive.
103
Segment Data
The Company identifies operating segments as components of an entity for which discrete financial information is available and is regularly reviewed by the chief operating decision maker, or decision-making group, in making decisions regarding resource allocation and performance assessment. The Company defines the term “chief operating decision maker” to be its chief executive officer. The Company has determined it operates in
one
operating segment and
one
reportable segment, as its chief operating decision maker reviews financial information presented on only a consolidated basis for purposes of allocating resources and evaluating financial performance.
Cash, Cash Equivalents, and Short-term Investments
The Company considers all investments with an original maturity of three months or less at time of purchase to be cash equivalents. Cash restricted by third parties is not considered cash and cash equivalents. Short-term investments, consisting primarily of commercial paper, U.S. Government and agency securities, and corporate bonds with original maturities of greater than three months but less than one year when purchased, are classified as available-for-sale and are reported at fair value using the specific identification method. Unrealized gains and losses are excluded from earnings and reported as a component of other comprehensive income (loss), net of related estimated income tax provisions or benefits.
The following table provides cash, cash equivalents, and short-term investments within the Consolidated Balance Sheets as of the dates indicated (in thousands):
|
As of December 31,
|
|||||||
|
2018
|
2017
|
||||||
|
Cash and cash equivalents
|
$
|
366,985
|
|
$
|
315,442
|
|
|
|
Short-term investments
|
257,302
|
|
25,108
|
|
|||
|
Total cash, cash equivalents, and short-term investments
|
$
|
624,287
|
|
$
|
340,550
|
|
|
Concentration of Credit Risk
Financial instruments that potentially subject the Company to concentrations of credit risk consist of cash and cash equivalents, short-term investments, and funds receivable and seller accounts. The Company reduces credit risk by placing its cash and cash equivalents with major financial institutions with high credit ratings. At times, such amounts may exceed federally insured limits. In addition, funds receivable are generated primarily with credit card and payment processing companies which management believes are of high credit quality.
Fair Value of Financial Instruments
Management believes that the fair value of financial instruments, consisting of cash and cash equivalents, short-term investments, accounts receivable, funds receivable and seller accounts, accounts payable, and funds payable and seller accounts approximates carrying value due to the immediate or short-term maturity associated with these instruments.
In accounting for the issuance of the Notes discussed in “
Note 13—Debt
,” management used estimates and assumptions to calculate the carrying amounts of the liability and equity components by measuring the fair value of similar securities.
Accounts Receivable and Allowance for Doubtful Accounts
The Company’s trade accounts receivable are recorded at amounts billed to Etsy sellers and are presented on the Consolidated Balance Sheet net of the allowance for doubtful accounts. The allowance is determined by a number of factors, including age of the receivable, current economic conditions, historical losses, and management’s assessment of the financial condition of Etsy sellers. Receivables are written off once they are deemed uncollectible, which may arise when Etsy sellers file for bankruptcy or are otherwise deemed unable to repay the amounts owed to the Company. Estimates of uncollectible accounts receivable are recorded to general and administrative expense. See “
Note 2—Revenue
” for additional information on payment terms related to the Company’s accounts receivable balances.
104
The following table summarizes the allowance activity during the periods indicated (in thousands):
|
|
Year Ended
December 31, |
||||||||||
|
|
2018
|
2017
|
2016
|
||||||||
|
Balance as of the beginning of period
|
$
|
2,687
|
|
$
|
1,999
|
|
$
|
2,071
|
|
||
|
Bad debt expense
|
4,124
|
|
2,497
|
|
1,770
|
|
|||||
|
Write-offs, net of recoveries and other adjustments
|
(2,091
|
)
|
(1,809
|
)
|
(1,842
|
)
|
|||||
|
Balance as of the end of period
|
$
|
4,720
|
|
$
|
2,687
|
|
$
|
1,999
|
|
||
Funds Receivable and Seller Accounts and Funds Payable and Amounts due to Sellers
The Company records funds receivable and seller accounts and funds payable and amounts due to sellers as current assets and liabilities, respectively, on the Consolidated Balance Sheet. Funds receivable and seller accounts represent amounts received or expected to be received from Etsy buyers via third-party credit card processors, which flow through an Etsy bank account for payment to Etsy sellers. This cash and related receivable represent the total amount due to sellers, and as such a liability for the same amount is recorded to funds payable and amounts due to Etsy sellers.
Property and Equipment
Property and equipment, consisting principally of building, capitalized website development and internal-use software, leasehold improvements, and computer equipment, are recorded at cost. The Company capitalizes construction in progress for build-to-suit lease agreements where we are the owner, for accounting purposes only, during the construction period. Depreciation and amortization begin at the time the asset is placed into service and are recognized using the straight-line method in amounts sufficient to relate the cost of depreciable and amortizable assets to the Consolidated Statements of Operations over their estimated useful lives. Repairs and maintenance are charged to the Consolidated Statements of Operations as incurred. Upon sale or retirement of assets, the cost and related accumulated depreciation or amortization are removed from the balance sheet and the resulting gain or loss is reflected in the Consolidated Statements of Operations.
When events or changes in circumstances require, the Company assesses the likelihood of recovering the cost of tangible long-lived assets based on its expectations of future profitability, undiscounted cash flows, and management’s plans with respect to operations to determine if the asset is impaired and subject to write-off. Measurement of any impairment loss is based on the excess of the carrying value of the asset over the fair value. See “Recently Issued Accounting Pronouncements” below for information on the impact of ASU 2016-02
—Leases
on property and equipment balances.
Website Development and Internal-use Software Costs
Costs incurred to develop the Company’s website and software for internal-use are capitalized and amortized over the estimated useful life of the software, generally
three
to
five
years. In accordance with authoritative accounting guidance, capitalization of costs to develop software begin when preliminary development efforts are successfully completed, management has authorized and committed project funding, and it is probable that the project will be completed and the software will be used as intended. The Company also capitalizes costs related to upgrades and enhancements when it is probable the expenditures will result in additional functionality or will extend the useful life of existing functionality. Costs related to the design or maintenance of website development and internal-use software are expensed as incurred. The Company periodically reviews capitalized website development and internal-use software costs to determine whether the projects will be completed, placed in service, removed from service, or replaced by other internally-developed or third-party software. If an asset is not expected to provide any future use, the asset is retired and any unamortized cost is expensed.
If an asset will continue to be used, but the net book value is not expected to be fully recoverable, the asset is impaired to its fair value. When events or changes in circumstances require, the Company assesses the likelihood of recovering the cost of website development and internal-use software costs based on its expectations of future profitability, undiscounted cash flows, and our plans with respect to operations to determine if the asset is impaired and subject to write-off. Measurement of any impairment loss is based on the excess of the carrying value of the asset over the fair value.
No
impairment of capitalized website development and internal-use software assets was recorded during the years ended
December 31, 2018
and 2016. The Company
105
recognized an asset impairment charge of
$3.2 million
related to capitalized web development and internal-use software assets in
the year ended December 31, 2017
as a result of its decision to discontinue certain product offerings, including Etsy Studio and Etsy Manufacturing.
Capitalized website development and internal-use software costs are included in property and equipment within the Consolidated Balance Sheets.
Asset Acquisitions
The Company has completed asset acquisitions and may complete additional asset acquisitions in the future. In an asset acquisition, the Company initially determines whether it acquired a single or group of assets. Acquired assets are recognized based on the purchase price, which is presumed to equal the fair value of the net assets acquired and amortized in the period over which the asset is expected to contribute directly or indirectly to the future cash flows of that entity. When circumstances indicate that the carrying value of these assets may not be recoverable, the Company reviews its identifiable amortizable intangible assets for impairment. The Company accrues for contingent consideration when payout becomes probable and is reasonably estimable.
Business Combinations
The Company has completed a number of acquisitions of other businesses in the past and may acquire additional businesses or technologies in the future. In an acquisition, the Company first reviews if substantially all of the fair value of the assets acquired is concentrated in a single identifiable asset or group of similar identifiable assets, in which case the set is not considered a business and is accounted for as an asset acquisition.
The results of businesses acquired in a business combination are included in the Company’s Consolidated Financial Statements from the date of acquisition. The Company allocates the purchase price, which is the sum of the consideration provided and may consist of cash, equity, or a combination of the two, in a business combination to the identifiable assets and liabilities of the acquired business at their acquisition date fair values. The excess of the purchase price over the amount allocated to the identifiable assets and liabilities, if any, is recorded as goodwill. Determining the fair value of assets acquired and liabilities assumed requires management to use significant judgment and estimates, including the selection of valuation methodologies, estimates of future revenue and cash flows, discount rates, and selection of comparable companies.
When the Company issues stock-based or cash awards to an acquired company’s stockholders, the Company evaluates whether the awards are contingent consideration or compensation for post-combination services. The evaluation includes, among other things, whether the vesting of the awards is contingent on the continued employment of the acquired company’s stockholder beyond the acquisition date. If continued employment is required for vesting, the awards are treated as compensation for post-combination services and recognized as expense over the requisite service period.
The Company initially recognizes intangible assets at fair value, and amortizes them on a straight-line basis over their estimated useful lives. When circumstances indicate that the carrying value of these assets may not be recoverable, the Company reviews its identifiable amortizable intangible assets for impairment.
To date, the assets acquired and liabilities assumed in the Company’s business combinations have primarily consisted of goodwill and finite-lived intangible assets, consisting primarily of developed technologies, customer relationships, and trademarks. The estimated fair values and useful lives of identifiable intangible assets are based on many factors, including estimates and assumptions of future operating performance and cash flows of the acquired business, the nature of the business acquired, and the specific characteristics of the identified intangible assets. The estimates and assumptions used to determine the fair values and useful lives of identified intangible assets could change due to numerous factors, including market conditions, technological developments, economic conditions, and competition. In connection with determination of fair values, the Company may engage independent appraisal firms to assist with the valuation of intangible and certain tangible assets acquired and certain assumed obligations.
Acquisition-related transaction costs incurred by the Company are not included as a component of consideration transferred, but are accounted for as an expense in the period in which the costs are incurred.
106
Goodwill
Goodwill represents the excess of the aggregate fair value of the consideration transferred in a business combination over the fair value of the assets acquired, net of liabilities assumed. Goodwill is not amortized, but is subject to an annual impairment test. Management has determined that the Company has a single reporting unit and performs its annual goodwill impairment test during the fourth quarter or more frequently if events or changes in circumstances indicate that the goodwill may be impaired.
Events or changes in circumstances which could trigger an impairment review include significant changes in the manner of the Company’s use of the acquired assets or the strategy for the Company’s overall business, significant negative industry or economic trends, significant underperformance relative to historical or projected future results of operations, a significant adverse change in the business climate, cost factors that have a negative effect on earnings and cash flows, an adverse action or assessment by a regulator, a sustained decrease in share price, unanticipated competition, or a loss of key personnel.
The Company has the option to first assess qualitative factors to determine whether the existence of events or circumstances leads to a determination that it is more likely than not that the fair value of the reporting unit is less than its carrying amount. If, after assessing the totality of events or circumstances, the Company determines it is not more likely than not that the fair value of the reporting unit is less than its carrying amount, then additional impairment testing is not required. However, if the Company concludes otherwise, then it is required to perform a quantitative assessment for impairment.
The quantitative assessment involves comparing the estimated fair value of the reporting unit with its respective book value, including goodwill. If the estimated fair value exceeds book value, goodwill is considered not to be impaired and no additional steps are necessary. If, however, the book value of the reporting unit exceeds the fair value, an impairment loss is recognized in an amount equal to the excess, not to exceed the total amount of goodwill allocated to that reporting unit.
The Company completed a qualitative analysis during the fourth quarter of
2018
.
No
impairment of goodwill was recorded during the three
years ended December 31, 2018, 2017, and 2016
.
Intangible Assets
Intangible assets are amortized over the estimated useful life of the asset. The estimated useful lives of acquired technology, customer relationships, and trademarks are generally
three
years and the estimated useful life of the referral agreement is
ten years
. When events or changes in circumstances require, the Company assesses the likelihood of recovering the cost of intangible assets based on its expectations of future profitability, undiscounted cash flows, and management’s plans with respect to operations to determine if the asset is impaired and subject to write-off. Measurement of any impairment loss is based on the excess of the carrying value of the asset over the fair value.
No
impairment of intangible assets was recorded during the two years ended
December 31, 2018 and 2017
. The Company recognized an asset impairment charge of
$0.6 million
in
the year ended December 31, 2016
, related to the impairment of nonrecoverable intangible assets acquired in the ALM and Jarvis Labs, Inc. acquisitions for customer relationships and trademarks.
Leases
The Company leases office space and certain computer equipment in multiple locations under non-cancelable lease agreements. The leases are reviewed for classification as operating, capital, or build-to-suit leases. For operating leases, rent is recognized on a straight-line basis over the lease period. For capital leases, the Company records the leased asset with a corresponding liability. Payments are recorded as reductions to the liability with an appropriate interest charge recorded based on the then-outstanding remaining liability. Upon adoption of ASU 2016-02
—Leases,
the Company will recognize additional operating liabilities and corresponding right-of-use assets of the same amount based on the present value of the remaining minimum rental payments under current leasing standards for existing operating leases.
The Company considers the nature of the renovations and the Company’s involvement during the construction period of newly-leased office space to determine if it is considered, for accounting purposes only, to be the owner of the construction project during the construction period. If the Company determines that it is the owner of the construction project, it is required to capitalize the fair value of the building as well as the construction costs incurred on its Consolidated Balance Sheet along with a corresponding financing liability (“build-to-suit accounting”). Upon occupancy for build-to-suit leases, the Company assesses
107
whether the circumstances qualify for sales recognition under the sale-leaseback accounting guidance. If the lease meets the sale-leaseback criteria, the Company will remove the asset and related financial obligation from the balance sheet and treat the building lease as an operating lease. If upon completion of construction, the project does not meet the sale-leaseback criteria, the leased property will be treated as a capital lease for financial reporting purposes.
In May 2016, the Company took possession of its corporate headquarters in Brooklyn, New York upon substantial completion of the construction phase of the build-out. Upon completion of the project, the Company performed a sale-leaseback analysis pursuant to Accounting Standards Codification (“ASC”) 840
—Leases
, to determine the appropriateness of removing the previously capitalized assets from the Consolidated Balance Sheets. The Company concluded that components of “continuing involvement” were evident as a result of this review, precluding the derecognition of the related assets from the Consolidated Balance Sheets. In conjunction with the initiation of the lease in May 2014, the Company also recorded a facility financing obligation equal to the fair market value of the assets received from the landlord. As of
December 31, 2018
, the facility financing obligation outstanding was
$60.0 million
. The Company does not report rent expense for the lease. Rather, rental payments under the lease are recognized as a reduction of the financing obligation and interest expense, and the associated asset capitalized throughout the construction project is depreciated over its estimated useful life. Upon adoption of ASU 2016-02
—Leases,
the Company will derecognize the facility financing obligation and any gains or losses associated with this change in accounting will be recognized through a cumulative-effect adjustment to accumulated deficit as of January 1, 2019. Additionally, a new right-of-use asset and lease liability will be recognized on the Consolidated Balance Sheet for the associated lease. See “Recently Issued Accounting Pronouncements” below for additional information on the impact of ASU 2016-02
—Leases
.
Contingencies
The Company accrues for loss contingencies when losses become probable and are reasonably estimable. If the reasonable estimate of the loss is a range and no amount within the range is a better estimate, the minimum amount of the range is recorded as a liability. The Company does not accrue for contingent losses that, in its judgment, are considered to be reasonably possible, but not probable; however, it discloses the range of such reasonably possible losses.
Recently Issued Accounting Pronouncements
In February 2016, the Financial Accounting Standards Board (“FASB”) issued ASU 2016-02
—Leases
, and additional changes, modifications, clarifications, or interpretations related to this guidance thereafter, which require a reporting entity to recognize right-of-use assets and lease liabilities on the balance sheet for operating leases to increase transparency and comparability. The new guidance is effective for annual and interim periods beginning after December 15, 2018, and early adoption is permitted. The Company will adopt this guidance on a modified retrospective basis as of January 1, 2019, utilizing transition guidance introduced in ASU 2018-11
—Leases: Targeted Improvements
and expects to elect the ‘package of practical expedients,’ which permits the Company not to reassess prior conclusions about lease identification, classification and initial direct costs. The Company does not expect to elect the use-of-hindsight or the practical expedient pertaining to land easements; the latter not being applicable.
The Company has not yet finalized the review, however, the Company is expecting that this standard will have a material effect on the Company’s Consolidated Financial Statements. The most significant effects relate to the recognition of new right-of-use assets and lease liabilities on the Consolidated Balance Sheet for real estate operating leases; the derecognition of existing assets and liabilities for a sale-leaseback transaction (arising from a build-to-suit lease arrangement on our Brooklyn headquarters for which construction is complete and the Company is leasing the constructed asset) that currently does not qualify for sale accounting; and providing significant new disclosures about leasing activities. However, the Company does not expect adoption to have a material impact on its results of operations or liquidity. The accounting for capital leases is expected to remain substantially unchanged. Upon adoption, the Company will:
|
•
|
recognize additional operating liabilities and corresponding right-of-use assets of the same amount based on the present value of the remaining minimum rental payments under current leasing standards for existing operating leases;
|
|
•
|
derecognize existing facility financing obligations and the related existing building asset for our corporate headquarters. Any gains or losses associated with this change in accounting will be recognized through a cumulative-effect adjustment to accumulated deficit as of January 1, 2019. Additionally, a new right-of-use asset and lease liability
|
108
will be recognized on the Consolidated Balance Sheet for the associated lease, which will be classified as a financing lease.
The new standard also provides practical expedients for an entity’s ongoing accounting. The Company will elect the short-term lease recognition exemption for all leases that qualify. Accordingly, we will not recognize right-of-use assets or lease liabilities for leases that qualify, including leases for existing short-term leases in effect at transition and will recognize those payments on the Consolidated Statements of Operations on a straight-line basis over the lease term. The Company will elect the practical expedient to not separate lease and non-lease components for all its leases.
In January 2016, the FASB issued ASU 2016-13
—Financial Instruments—Credit Losses
, and additional changes, modifications, clarifications or interpretations related to this guidance thereafter, which require a reporting entity to estimate credit losses on certain types of financial instruments, and present assets held at amortized cost and available-for-sale debt securities at the amount expected to be collected. The new guidance is effective for annual and interim periods beginning after December 15, 2019, and early adoption is permitted. The Company is currently evaluating the impact of the new guidance on its Consolidated Financial Statements.
In July 2018, FASB issued ASU 2018-09
—Codification Improvements
, which clarifies, corrects, and makes minor improvements across multiple topics in the codification. The transition and effective dates are based on the facts and circumstances of each amendment, with some amendments becoming effective upon issuance of the update, and others becoming effective for annual periods beginning after December 15, 2018. The amendments that were effective upon issuance of the update did not have an impact on the Company’s Consolidated Financial Statements. The Company is currently evaluating the impact of the adoption of the other amendments on its Consolidated Financial Statements.
In August 2018, the FASB issued ASU 2018-15
—Customer’s Accounting for Implementation Costs Incurred in a Cloud Computing Arrangement That Is a Service Contract,
which aligns the requirements for capitalizing implementation costs incurred in a hosting arrangement that is a service contract with the requirements for capitalizing implementation costs incurred to develop or obtain internal-use software. The new guidance is effective for annual and interim periods beginning after December 15, 2019, and early adoption is permitted. The Company is currently evaluating the impact of the adoption of the new guidance on its Consolidated Financial Statements.
Recently Adopted Accounting Pronouncements
In May 2014, the FASB issued ASU 2014-09
—Revenue from Contracts with Customers
, and additional changes, modifications, clarifications, or interpretations related to this guidance thereafter, which replaces existing revenue recognition guidance. The new guidance was effective for the annual and interim periods beginning after December 15, 2017. Among other things, the updated guidance requires companies to recognize revenue in a way that depicts the transfer of promised goods or services to customers in an amount that reflects the consideration to which the entity expects to be entitled in exchange for those goods or services. The Company adopted the requirements of the new guidance as of January 1, 2018, utilizing the full retrospective method of transition. In connection with the adoption, the company reclassified Etsy Payments revenue from Services revenue to Marketplace revenue in the Consolidated Statements of Operations. Aside from this presentation reclassification, adoption of the new guidance did not result in changes to the prior year or current year Consolidated Financial Statements. See
“Revenue Recognition” above and
Note 2—Revenue
” for additional information regarding revenue recognition.
In November 2016, the FASB issued ASU 2016-18
—Statement of Cash Flows: Restricted Cash
, which requires that a statement of cash flows explain the change during the period in the total of cash, cash equivalents, and amounts generally described as restricted cash or restricted cash equivalents. The new guidance is effective for the annual and interim periods beginning after December 15, 2017. The Company adopted this standard in the first quarter of 2018 utilizing the full retrospective method of transition. As a result of this guidance, the Company reclassified
$5.3 million
on the Consolidated Statement of Cash Flows in
the year ended December 31, 2018
,
2017
, and
2016
to include restricted cash in the beginning and ending cash, cash equivalents, and restricted cash balances.
109
The following table provides a reconciliation of cash, cash equivalents, and restricted cash reported within the Consolidated Balance Sheets that sum to the total of the same such amounts shown in the Consolidated Statement of Cash Flows (in thousands):
|
Year Ended December 31,
|
|||||||||||
|
2018
|
2017
|
2016
|
|||||||||
|
Beginning balance:
|
|||||||||||
|
Cash and cash equivalents
|
$
|
315,442
|
|
$
|
181,592
|
|
$
|
271,244
|
|
||
|
Restricted cash
|
5,341
|
|
5,341
|
|
5,341
|
|
|||||
|
Total cash, cash equivalents, and restricted cash
|
$
|
320,783
|
|
$
|
186,933
|
|
$
|
276,585
|
|
||
|
Ending balance:
|
|||||||||||
|
Cash and cash equivalents
|
$
|
366,985
|
|
$
|
315,442
|
|
$
|
181,592
|
|
||
|
Restricted cash
|
5,341
|
|
5,341
|
|
5,341
|
|
|||||
|
Total cash, cash equivalents, and restricted cash
|
$
|
372,326
|
|
$
|
320,783
|
|
$
|
186,933
|
|
||
The balances included in restricted cash represent amounts held as collateral associated with the lease of the Company’s Brooklyn, New York headquarters. This standard had no other impact to the Consolidated Financial Statements.
In June 2018, the FASB issued ASU 2018-07
—Improvements to Nonemployee Share-Based Payment Accounting
, which expands the scope of ASC Topic 718
—Compensation—Stock Compensation
, to include share-based payment transactions for acquiring goods and services from non-employees. The new guidance is effective for annual and interim periods beginning after December 15, 2018, and early adoption is permitted. The Company adopted this standard in the third quarter of 2018 noting that the adoption of the standard had no material impact on its Consolidated Financial Statements.
In August 2018, the FASB issued ASU 2018-13
—Disclosure Framework—Changes to the Disclosure Requirements for Fair Value Measurement,
which adds, modifies, and removes various disclosure requirements for fair value measurements. The new guidance is effective for annual and interim periods beginning after December 15, 2019, and early adoption is permitted. The Company adopted this standard in the third quarter of 2018 noting that the adoption of the standard had no impact on its fair value measurement disclosures.
Note 2—Revenue
The following table summarizes revenue by type of service for the periods presented (in thousands):
|
Year Ended December 31,
|
|||||||||||
|
2018
|
2017
|
2016
|
|||||||||
|
Marketplace revenue (1)
|
$
|
440,740
|
|
$
|
326,076
|
|
$
|
269,628
|
|
||
|
Services revenue
|
158,928
|
|
111,869
|
|
89,433
|
|
|||||
|
Other revenue
|
4,025
|
|
3,286
|
|
5,906
|
|
|||||
|
Revenue
|
$
|
603,693
|
|
$
|
441,231
|
|
$
|
364,967
|
|
||
|
(1)
|
Etsy Payments revenue for the
years ended December 31, 2018, 2017, and 2016
has been reclassified and presented within Marketplace revenue. Comparative periods have been reclassified to conform to current period presentation.
|
See “
Note 1—Basis of Presentation and Summary of Significant Accounting Policies
—Revenue Recognition” for additional information on recognition.
110
Payment terms
As of November 13, 2018, for Etsy sellers using Etsy Payments, all charges, including listing fees, transaction fees, Etsy Payments fees, Promoted Listings fees, Etsy Shipping Labels fees, Pattern fees, Etsy Plus fees, are deducted from the funds credited to the seller’s shop payment account in the seller’s ledger currency prior to settlement of those funds to the seller’s bank account. Etsy sellers receive a statement electronically on the first day of each month outlining the previous month’s charges and any remaining amount due after the Company’s fees are deducted from the seller’s shop payment account. Etsy sellers that do not use Etsy Payments receive a statement electronically on the first day of each month for the previous month’s charges in U.S. Dollars, including all listing fees, transactions fees, Promoted Listing fees, Etsy Shipping Labels fees, Pattern fees, and Etsy Plus fees. Payment is due by the 15th of every month.
Prior to November 13, 2018, Etsy sellers would receive a statement electronically on the first day of each month for the previous month’s charges in U.S. Dollars, including all listing fees, transactions fees, Promoted Listing fees, Etsy Shipping Labels fees, Pattern fees, and Etsy Plus fees. Payment was due by the 15th of every month. Prior to November 13, 2018 only Etsy Payments fees were deducted from the funds credited to the seller’s shop payment account in the seller’s ledger currency prior to settlement of those funds to the seller’s bank account.
Contract balances
Deferred revenues
The Company records deferred revenues when cash payments are received or due in advance of the completion of the listing or subscription period, which represents the value of the Company’s unsatisfied performance obligations. Deferred listing revenue is recognized ratably over the remainder of the
four
-month listing period, unless the item is sold or the seller re-lists it, at which time any remaining listing fee is recognized.
Deferred Etsy Plus subscription revenues related to the enhanced features described in “
Note 1—Basis of Presentation and Summary of Significant Accounting Policies
—Revenue Recognition” are recognized ratably over the 30-day subscription period. Credits for Promoted Listings are recognized when used, or when the 30-day subscription period expires. Credits for listing fees are recognized over the four-month listing period when used, and any unused credits are recognized when the 30-day subscription period expires. The amount of revenue recognized in
the year ended December 31, 2018
that was included in the deferred balance at the beginning of the period was
$6.3 million
.
Significant judgments
Judgment is required to assess the nature of the services that the Company promises to its customers and the timing of satisfaction of those promised services.
For services that are refundable, the Company accounts for the right of return as a refund liability and reduction of revenue recognized in the amount of refunds that are expected to be issued.
Refunds are estimated monthly, are based on historical refund patterns, and are updated at the end of each reporting period as additional information becomes available.
Note 3—Income Taxes
The following are the domestic and foreign components of the Company’s
income (loss) before income taxes
(in thousands):
|
|
Year Ended
December 31, |
||||||||||
|
|
2018
|
2017
|
2016
|
||||||||
|
Domestic
|
$
|
36,157
|
|
$
|
(16,583
|
)
|
$
|
25,910
|
|
||
|
Foreign
|
18,921
|
|
48,848
|
|
(28,786
|
)
|
|||||
|
Income (loss) before income taxes
|
$
|
55,078
|
|
$
|
32,265
|
|
$
|
(2,876
|
)
|
||
111
The
income tax (benefit) provision
is comprised of the following (in thousands):
|
|
Year Ended
December 31, |
||||||||||
|
|
2018
|
2017
|
2016
|
||||||||
|
Current:
|
|||||||||||
|
Federal
|
$
|
709
|
|
$
|
(6,397
|
)
|
$
|
22,084
|
|
||
|
State
|
(578
|
)
|
79
|
|
2,623
|
|
|||||
|
Foreign
|
600
|
|
476
|
|
580
|
|
|||||
|
Total current
|
731
|
|
(5,842
|
)
|
25,287
|
|
|||||
|
Deferred:
|
|||||||||||
|
Federal
|
(3,343
|
)
|
(34,948
|
)
|
2,008
|
|
|||||
|
State
|
3,496
|
|
(8,778
|
)
|
(247
|
)
|
|||||
|
Foreign
|
(23,297
|
)
|
33
|
|
(23
|
)
|
|||||
|
Total deferred
|
(23,144
|
)
|
(43,693
|
)
|
1,738
|
|
|||||
|
Total income tax (benefit) provision
|
$
|
(22,413
|
)
|
$
|
(49,535
|
)
|
$
|
27,025
|
|
||
Beginning in the first quarter of 2017, the Company adopted ASU 2016-09
—Stock Compensation: Improvements to Employee Share-based Payment Accounting,
and subsequently recorded excess tax deductions on share-based compensation as income tax benefit in its income statement. The current tax expense listed above does not reflect income tax benefits of
$3.2 million
for the year ended
December 31, 2016
related to excess tax deductions on share-based compensation because these benefits were recorded directly to additional paid-in capital. Please refer to “
Note 1—Basis of Presentation and Summary of Significant Accounting Policies
—Excess Tax Benefits from Exercise of Stock Options” for additional detail regarding the adoption of this accounting standard and its impact on the Consolidated Financial Statements.
A reconciliation of the
income tax (benefit) provision
at the U.S. federal statutory income tax rate of
21%
in 2018 and 35% in 2017 and 2016 to the Company’s total
income tax (benefit) provision
is as follows (in thousands):
|
|
Year Ended
December 31, |
||||||||||
|
|
2018
|
2017
|
2016
|
||||||||
|
Income tax provision (benefit) at federal statutory rate
|
$
|
11,566
|
|
$
|
11,308
|
|
$
|
(1,007
|
)
|
||
|
State and local taxes net of federal benefit
|
3,839
|
|
(691
|
)
|
1,545
|
|
|||||
|
Foreign income tax rate differential
|
(298
|
)
|
(11,878
|
)
|
5,849
|
|
|||||
|
Stock-based compensation
|
(11,717
|
)
|
(12,584
|
)
|
1,412
|
|
|||||
|
Non-deductible items
|
(329
|
)
|
168
|
|
267
|
|
|||||
|
Uncertain tax positions
|
382
|
|
789
|
|
4,033
|
|
|||||
|
Return to provision adjustment
|
3,293
|
|
167
|
|
(498
|
)
|
|||||
|
Non-deductible acquisition costs
|
—
|
|
—
|
|
199
|
|
|||||
|
Change in valuation allowance
|
(28,733
|
)
|
(4,673
|
)
|
4,911
|
|
|||||
|
Research and development credit
|
(4,115
|
)
|
(1,098
|
)
|
(2,170
|
)
|
|||||
|
Deferred charge on restructuring
|
—
|
|
—
|
|
12,168
|
|
|||||
|
U.S. tax reform
|
3,897
|
|
(31,063
|
)
|
—
|
|
|||||
|
Other
|
(198
|
)
|
20
|
|
316
|
|
|||||
|
Total income tax (benefit) provision
|
$
|
(22,413
|
)
|
$
|
(49,535
|
)
|
$
|
27,025
|
|
||
On December 22, 2017, the U.S. government enacted the TCJA, as described above, which includes significant changes to the taxation of business entities. These changes include, among others, (1) a permanent reduction to the corporate income tax rate, (2) a partial limitation on the deductibility of business interest expense (“163(j) Interest Limitation”), and (3) a shift of the U.S. taxation of multinational corporations from a tax on worldwide income to a quasiterritorial system (along with certain rules designed to prevent erosion of the U.S. income tax base).
112
Effective January 1, 2018, the Company is subject to several provisions of the TCJA including computations under GILTI and Foreign Derived Intangible Income (“FDII”). The Company does not currently meet the revenue threshold for the Base Erosion and Anti-Abuse Tax (“BEAT”). For the GILTI and FDII computations, the Company recorded tax expense using the current available regulations and technical guidance on the interpretations of the TCJA. As required by SEC Staff Accounting Bulletin 118, Income Tax Accounting Implications of the Tax Cuts and Jobs Act, we have finalized our accounting analysis based on the guidance and regulations available as of December 31, 2018. We have recorded the impacts of the TCJA in our effective tax rate and have elected to treat taxes due on future U.S. inclusions in taxable income related to GILTI using the period cost method. The Company will continue to monitor the forthcoming regulations and additional guidance of the GILTI, FDII, and BEAT provisions under the TCJA, which are complex and subject to continuing regulatory interpretation by the IRS.
A secondary driver of the income tax provision for the year ended December 31, 2018 and
December 31, 2017
was the recognition of excess tax benefits from stock-based compensation as a result of the adoption of ASU 2016-09
—Stock Compensation: Improvements to Employee Share-based Payment Accounting
in the first quarter of 2017. As a result of this updated guidance, we recorded
$12.0 million
and
12.8 million
of excess tax benefits, rather than additional paid-in capital, for the years ended
December 31, 2018 and 2017
.
The primary driver of the income tax benefit for the year ended
December 31, 2017
was the impact on deferred taxes from the reduction in the U.S. federal corporate tax rate beginning in 2018. On December 22, 2017, the TCJA was signed into law, which, among other items, reduced the corporate income tax rate from 35% to 21%. As a result, our deferred taxes and certain unrecognized tax benefits at December 31, 2017 have been revalued at the reduced 21% rate. The revaluation resulted in a benefit for income taxes of approximately
$31.1 million
for the year ended
December 31, 2017
.
Deferred income taxes reflect the net tax effect of temporary differences between the carrying amounts of assets and liabilities for financial reporting purposes and the amounts used for income tax purposes. Significant components of the Company’s deferred tax assets (liabilities) are as follows (in thousands):
|
|
As of December 31,
|
||||||
|
|
2018
|
2017
|
|||||
|
Deferred tax assets:
|
|||||||
|
Net operating loss carryforwards
|
$
|
13,347
|
|
$
|
24,625
|
|
|
|
Amortization of acquired intangibles
|
12,109
|
|
15,631
|
|
|||
|
Research and development credit carryforwards
|
7,567
|
|
3,597
|
|
|||
|
Stock-based compensation expense
|
6,623
|
|
3,776
|
|
|||
|
Accrued VAT liability
|
43
|
|
42
|
|
|||
|
Alternative minimum tax credit
|
274
|
|
274
|
|
|||
|
Allowance for doubtful accounts
|
545
|
|
384
|
|
|||
|
Deferred rent
|
529
|
|
573
|
|
|||
|
Accrued vacation
|
744
|
|
623
|
|
|||
|
Unrealized loss on foreign currency
|
—
|
|
527
|
|
|||
|
Other, net
|
1,301
|
|
300
|
|
|||
|
Total deferred tax assets
|
43,082
|
|
50,352
|
|
|||
|
Less valuation allowance
|
1,673
|
|
32,455
|
|
|||
|
Total net deferred tax asset
|
41,409
|
|
17,897
|
|
|||
|
Deferred tax liabilities:
|
|||||||
|
Depreciation
|
(6,933
|
)
|
(6,850
|
)
|
|||
|
Global corporate restructuring liability
|
(33,730
|
)
|
(33,783
|
)
|
|||
|
Convertible debt
|
(7,283
|
)
|
—
|
|
|||
|
Unrealized gain on foreign currency
|
(92
|
)
|
—
|
|
|||
|
Other liabilities
|
(362
|
)
|
(891
|
)
|
|||
|
Total deferred tax liabilities
|
(48,400
|
)
|
(41,524
|
)
|
|||
|
Net deferred tax liabilities
|
$
|
(6,991
|
)
|
$
|
(23,627
|
)
|
|
113
The 2017 deferred tax balances have been revised to correct the Company’s disclosures related to the adoption of ASU 2016-16
—Income Taxes: Intra-entity Transfers of Assets other than Inventory.
The revision increases both the deferred tax assets and valuation allowance by
$21.4 million
resulting in no change to the net deferred tax asset. The Company has concluded that this disclosure omission was not material to the 2017 Consolidated Financial Statements.
The Company anticipates utilizing federal and state income tax NOL carryforwards as a result of its
2018
activity. The NOL deferred tax asset balance additionally includes losses in certain foreign jurisdictions that are currently subject to a valuation allowance.
As of
December 31, 2018 and 2017
, the Company had
$7.6 million
and
$3.6 million
, respectively, of federal research and development tax credit carryforwards which will begin to expire in 2035 if unused.
The Company assesses the likelihood of its ability to realize the benefit of its deferred tax assets in each jurisdiction by evaluating all relevant positive and negative evidence at each reporting date. To the extent the Company determines that some or all of its deferred tax assets are not more likely than not to be realized, it establishes a valuation allowance. For the year ended
December 31, 2018
, in part because in the current year, the Company achieved three years of cumulative pre-tax income in certain of its foreign jurisdictions, management determined that sufficient positive evidence exists as of
December 31, 2018
, to conclude that is is more likely than not that deferred tax assets of
$23.4 million
will be utilized in those jurisdictions. Additionally, the Company determined that the existence of a
three
-year cumulative loss incurred in certain other foreign jurisdictions, inclusive of
2018
, constituted sufficiently strong negative evidence to warrant the maintenance of a valuation allowance. As a result, a valuation allowance of
$1.7 million
as of
December 31, 2018
has been recorded against certain of the Company’s deferred tax assets. The amount of the deferred tax assets considered realizable is
$41.4 million
.
The following table summarizes the valuation allowance activity for the periods indicated (in thousands). It has been revised to reflect the Company’s adoption of ASU 2016-16
—Income Taxes: Intra-entity Transfers of Assets other than Inventory
:
|
|
Year Ended
December 31, |
||||||||||
|
|
2018
|
2017
|
2016
|
||||||||
|
Balance as of the beginning of period
|
$
|
32,455
|
|
$
|
13,839
|
|
$
|
9,540
|
|
||
|
Additions charged to expense
|
—
|
|
16,743
|
|
4,886
|
|
|||||
|
Deletions credited to expense
|
(28,733
|
)
|
—
|
|
—
|
|
|||||
|
Currency translation
|
(2,049
|
)
|
1,873
|
|
(587
|
)
|
|||||
|
Balance as of the end of period
|
$
|
1,673
|
|
$
|
32,455
|
|
$
|
13,839
|
|
||
The Company has not recorded deferred income taxes and withholding taxes with respect to undistributed earnings from its non-U.S. subsidiaries as such earnings are intended to be reinvested indefinitely. The amount of undistributed earnings of non-U.S. subsidiaries at
December 31, 2018
, as well as the related deferred income tax, if any, is not material.
The following table summarizes the unrecognized tax benefit activity for the periods indicated (in thousands):
|
|
As of December 31,
|
||||||||||
|
|
2018
|
2017
|
2016
|
||||||||
|
Balance as of the beginning of period
|
$
|
17,013
|
|
$
|
23,574
|
|
$
|
22,229
|
|
||
|
Additions based on tax positions related to the current year
|
921
|
|
732
|
|
1,071
|
|
|||||
|
Additions for tax positions of prior years
|
946
|
|
118
|
|
274
|
|
|||||
|
Reductions for tax provisions of prior years
|
(61
|
)
|
(7,411
|
)
|
—
|
|
|||||
|
Balance as of the end of period
|
$
|
18,819
|
|
$
|
17,013
|
|
$
|
23,574
|
|
||
The amount of unrecognized tax benefits included on the Consolidated Balance Sheets as of
December 31, 2018, 2017, and 2016
are
$18.8 million
,
$17.0 million
, and
$23.6 million
, respectively. The total amount of unrecognized tax benefits that, if recognized, would favorably affect the effective tax rate is
$18.8 million
at
December 31, 2018
.
114
We recognize interest and/or penalties related to uncertain tax positions in income tax expense. In 2018,
$0.3 million
was included in tax expense for interest and penalties. The amount of interest and penalties accrued as of
December 31, 2018 and 2017
was approximately
$0.5 million
and
$0.2 million
, respectively.
In January 2015, the Company implemented an updated global corporate structure to more closely align with its global operations and future expansion plans outside of the United States. The new structure changed how the Company uses its intellectual property and implemented certain intercompany arrangements. The Company believes this may eventually result in a reduction in its overall effective tax rate and other operational efficiencies. The revised structure resulted in the setup of a deferred tax liability in the amount of
$66.0 million
on the taxable gain created in the transaction. Concurrently, the Company recorded an asset of
$66.0 million
for the deferred tax charge representing the future income tax on the gain, which would have been amortized into income tax expense through 2019. During the first quarter of 2017, the Company adopted ASU 2016-16
—Income Taxes: Intra-entity Transfers of Assets other than Inventory
, resulting in a cumulative adjustment to retained earnings for the unamortized balance of the deferred tax charge at December 31, 2016.
The Company is subject to taxation in the United States, New York, and various other states and foreign jurisdictions. As of
December 31, 2018
, tax year 2014 and later remain open to examination.
Note 4—
Net Income (Loss) Per Share
The following table presents the calculation of basic and diluted
net income (loss) per share
for periods presented (in thousands except share and per share amounts):
|
|
Year Ended
December 31, |
||||||||||
|
|
2018
|
2017
|
2016
|
||||||||
|
Numerator:
|
|||||||||||
|
Net income (loss)
|
$
|
77,491
|
|
$
|
81,800
|
|
$
|
(29,901
|
)
|
||
|
Net income (loss) allocated to participating securities under the two-class method
|
(37
|
)
|
(80
|
)
|
—
|
|
|||||
|
Net income (loss) applicable to common stockholders—basic
|
77,454
|
|
81,720
|
|
(29,901
|
)
|
|||||
|
Dilutive effect of net income allocated to participating securities under the two-class method
|
37
|
|
80
|
|
—
|
|
|||||
|
Change in fair value of liability classified restricted stock
|
—
|
|
771
|
|
—
|
|
|||||
|
Net income (loss) applicable to common stockholders—diluted
|
$
|
77,491
|
|
$
|
82,571
|
|
$
|
(29,901
|
)
|
||
|
Denominator:
|
|||||||||||
|
Weighted average common shares outstanding—basic (1)
|
120,146,076
|
|
118,538,687
|
|
113,562,738
|
|
|||||
|
Dilutive effect of assumed conversion of options to purchase common stock
|
4,238,622
|
|
2,498,448
|
|
—
|
|
|||||
|
Dilutive effect of assumed conversion of restricted stock units
|
1,721,658
|
|
1,177,799
|
|
—
|
|
|||||
|
Dilutive effect of assumed conversion of convertible debt
|
900,580
|
|
—
|
|
—
|
|
|||||
|
Diluted effective of assumed conversion of restricted stock from acquisition
|
77,849
|
|
52,739
|
|
—
|
|
|||||
|
Weighted average common shares outstanding—diluted
|
127,084,785
|
|
122,267,673
|
|
113,562,738
|
|
|||||
|
|
|||||||||||
|
Net income (loss) per share applicable to common stockholders—basic
|
$
|
0.64
|
|
$
|
0.69
|
|
$
|
(0.26
|
)
|
||
|
Net income (loss) per share applicable to common stockholders—diluted
|
$
|
0.61
|
|
$
|
0.68
|
|
$
|
(0.26
|
)
|
||
|
(1)
|
57,482
shares of unvested stock are considered participating securities and are excluded from basic shares outstanding for
the year ended December 31, 2018
.
|
115
The following potential common shares were excluded from the calculation of diluted
net income (loss) per share
attributable to common stockholders because their effect would have been anti-dilutive for the periods presented:
|
|
Year Ended
December 31, |
|||||||
|
|
2018
|
2017
|
2016
|
|||||
|
Stock options
|
475,238
|
|
4,902,664
|
|
10,041,403
|
|
||
|
Restricted stock units
|
136,998
|
|
435,358
|
|
2,043,544
|
|
||
|
Warrants
|
—
|
|
—
|
|
33,447
|
|
||
|
Total anti-dilutive securities
|
612,236
|
|
5,338,022
|
|
12,118,394
|
|
||
Note 5—Business Combinations
On
September 19, 2016
, the Company acquired all of the outstanding common stock of Blackbird Technologies Inc (“Blackbird”), a machine learning company, for
$32.5 million
. The Company completed this acquisition to improve the quality and relevance of search on Etsy.com. Total consideration for the acquisition was approximately
$15.0 million
, consisting of
$8.1 million
in cash and
513,304
shares of the Company’s common stock with a fair value of
$6.9 million
on the acquisition date. Additionally, the Company issued
184,230
shares of restricted stock and restricted stock units (“RSUs”) on the acquisition date with a fair value of
$2.5 million
which are tied to continuous service with the Company as an employee and are being accounted for as post-combination stock-based compensation expense over up to a
three
-year vesting period. The Company agreed to pay up to an additional
$8.8 million
in cash and issue an aggregate of up to
460,575
shares of RSUs post-close with a fair value of
$6.2 million
, both of which are also tied to continuous service with the Company as an employee and are being accounted for as post-combination stock-based and other compensation expense over up to a
three
-year vesting period. A portion of the consideration and post-combination compensation is subject to indemnification provisions.
The below table summarizes the components of the Blackbird purchase price and allocation of the purchase price at fair value (in thousands):
|
Cash paid
|
$
|
8,050
|
|
|
Common shares
|
6,966
|
|
|
|
Total purchase consideration
|
$
|
15,016
|
|
|
Net working capital
|
$
|
81
|
|
|
Developed technology
|
7,200
|
|
|
|
Customer relationships
|
1,250
|
|
|
|
Goodwill
|
8,660
|
|
|
|
Deferred tax liability
|
(2,175
|
)
|
|
|
Net assets acquired
|
$
|
15,016
|
|
Included in working capital is approximately
$0.2 million
of cash acquired.
The amounts allocated to developed technology and customer relationships (the acquired intangible assets) total
$8.5 million
. The acquired identifiable intangible assets are being amortized on a straight-line basis approximating the pattern in which the assets are utilized. Acquired technology intangible assets will amortize over
three
years and acquired customer relationships were amortized over
six
months from the acquisition date. The fair value assigned to developed technology was determined primarily by using the cost approach, which estimates the cost to reproduce the asset, adjusted for loss due to functional and economic obsolescence. The fair value of the Company’s customer relationships was determined primarily by using the income approach, which discounts expected future cash flows to present value using estimates and assumptions determined by management. Goodwill recorded in connection with the Blackbird acquisition is primarily attributed to the value of the acquired workforce and their future contribution to Etsy. None of the resulting goodwill is deductible for tax purposes.
The Company incurred approximately
$0.6 million
in acquisition-related costs in the Blackbird acquisition in the year ended December 31, 2016, included in general and administrative expenses. This acquisition contributed
$2.4 million
to the Company’s consolidated net loss in
the year ended December 31, 2016
.
116
The following unaudited pro forma financial information presents the combined operating results of the Company and Blackbird as if the acquisition had occurred on January 1,
2015
. The unaudited pro forma financial information includes the accounting effects of the business combination, including adjustments to the amortization of intangible assets, stock-based and other compensation expenses, and professional fees associated with the acquisition. The unaudited pro forma information does not necessarily reflect the actual results that would have been achieved, nor is it necessarily indicative of our future consolidated results.
The unaudited pro forma financial information is presented in the table below for the year ended
December 31, 2016
(in thousands except per share amounts):
|
Year Ended December 31,
|
|||
|
|
2016
|
||
|
Revenue
|
$
|
365,786
|
|
|
Net loss
|
(35,401
|
)
|
|
|
Basic and diluted net loss per share
|
(0.31
|
)
|
|
Note 6—Goodwill and Intangible Assets
The following table summarizes the changes in the carrying amount of goodwill for the periods indicated (in thousands):
|
Year Ended
December 31, |
|||||||
|
2018
|
2017
|
||||||
|
Balance as of the beginning of the period
|
$
|
38,541
|
|
$
|
35,657
|
|
|
|
Foreign currency translation adjustments
|
(1,059
|
)
|
2,884
|
|
|||
|
Balance as of the end of the period
|
$
|
37,482
|
|
$
|
38,541
|
|
|
The Company did not recognize any goodwill impairments during the years ended
December 31, 2018, 2017, and 2016
.
At
December 31, 2018 and 2017
, the gross book value and accumulated amortization of intangible assets were as follows (in thousands):
|
|
As of December 31, 2018
|
As of December 31, 2017
|
|||||||||||||||||||||
|
|
Gross book
value |
Accumulated
amortization |
Net book
value |
Gross book
value |
Accumulated
amortization |
Net book
value |
|||||||||||||||||
|
Technology
|
$
|
7,200
|
|
$
|
(5,500
|
)
|
$
|
1,700
|
|
$
|
7,200
|
|
$
|
(3,100
|
)
|
$
|
4,100
|
|
|||||
|
Referral agreement
|
34,595
|
|
(1,874
|
)
|
32,721
|
|
—
|
|
—
|
|
—
|
|
|||||||||||
|
Patent licenses
|
172
|
|
(4
|
)
|
168
|
|
—
|
|
—
|
|
—
|
|
|||||||||||
|
Intangible assets, net
|
$
|
41,967
|
|
$
|
(7,378
|
)
|
$
|
34,589
|
|
$
|
7,200
|
|
$
|
(3,100
|
)
|
$
|
4,100
|
|
|||||
On June 15, 2018, the Company entered into a referral agreement with DaWanda GmbH (“DaWanda”), a privately held Germany-based marketplace for gifts and handmade items. As part of this agreement, DaWanda agreed to encourage its community of buyers and sellers to migrate to the Etsy platform. DaWanda wound down its operations and shut down its site on August 30, 2018. Etsy did not acquire any of DaWanda’s assets, liabilities, or employees as part of this agreement. The Company accounted for the agreement as an asset acquisition and the referral agreement intangible asset will be amortized on a straight-line basis over a period of
10 years
.
The Company acquired intangible assets valued at
$8.5 million
in the Blackbird acquisition on
September 19, 2016
.
Amortization expense for the years ended
December 31, 2018, 2017, and 2016
was
$4.3 million
,
$3.4 million
, and
$3.3 million
, respectively.
The Company did not recognize any intangible asset impairment losses in the years ended
December 31, 2018
and
2017
. The Company recognized a
$0.6 million
intangible asset impairment loss during the year ended
December 31, 2016
, included in
117
asset impairment charges. During the fourth quarter of 2016, the Company determined that there were indicators present that the carrying amount of intangible assets acquired in the ALM and Jarvis Labs, Inc. (“Grand St.”) acquisitions may not be recoverable. The Company prepared an undiscounted cash flow analysis and determined that intangible assets for customer relationships and trademarks acquired in the ALM and Grand St. acquisitions were not recoverable. The Company used the income approach to determine the fair value of intangible assets and concluded that these assets were fully impaired.
Based on amounts recorded at
December 31, 2018
, the Company estimates intangible asset amortization expense in each of the years ending December 31 as follows (in thousands):
|
2019
|
$
|
5,178
|
|
|
2020
|
3,477
|
|
|
|
2021
|
3,477
|
|
|
|
2022
|
3,477
|
|
|
|
2023
|
3,477
|
|
|
|
Thereafter
|
15,503
|
|
|
|
Total amortization expense
|
$
|
34,589
|
|
Note 7—Segment and Geographic Information
The Company has determined it operates as one operating and reportable segment for purposes of allocating resources and evaluating financial performance.
Revenue by country is based on the billing address of the seller. The following table summarizes revenue,
income (loss) before income taxes
and
net income (loss)
by geographic area (in thousands):
|
|
Year Ended
December 31, |
||||||||||
|
|
2018
|
2017
|
2016
|
||||||||
|
United States
|
$
|
425,841
|
|
$
|
317,755
|
|
$
|
276,537
|
|
||
|
International
|
177,852
|
|
123,476
|
|
88,430
|
|
|||||
|
Revenue
|
$
|
603,693
|
|
$
|
441,231
|
|
$
|
364,967
|
|
||
|
United States (1)
|
$
|
10,778
|
|
$
|
(43,014
|
)
|
$
|
9,123
|
|
||
|
International (2)
|
44,300
|
|
75,279
|
|
(11,999
|
)
|
|||||
|
Income (loss) before income taxes
|
$
|
55,078
|
|
$
|
32,265
|
|
$
|
(2,876
|
)
|
||
|
United States (3)
|
$
|
10,493
|
|
$
|
7,029
|
|
$
|
(17,345
|
)
|
||
|
International (2)
|
66,998
|
|
74,771
|
|
(12,556
|
)
|
|||||
|
Net income (loss)
|
$
|
77,491
|
|
$
|
81,800
|
|
$
|
(29,901
|
)
|
||
|
(1)
|
The United States loss before income taxes in
the year ended December 31, 2017
was primarily driven by a foreign exchange loss, interest associated with the build-to-suit lease accounting related to our corporate headquarters, restructuring and other exit costs, and asset impairment charges. See “
Note 17—Restructuring and Other Exit Costs (Income)
” and “
Note 6—Goodwill and Intangible Assets
” for additional information on restructuring and other exit costs and asset impairment charges.
|
|
(2)
|
The international loss before income taxes and net loss in
the year ended December 31, 2016
was primarily driven by a foreign exchange loss related to the U.S. Dollar to Euro exchange rate fluctuations on the Company's intercompany and other non-functional currency balances.
|
|
(3)
|
The United States net loss in
the year ended December 31, 2016
was primarily driven by an income tax provision recorded in the period, mainly attributable to tax expense related to the updated corporate structure. See “
Note 3—Income Taxes
” for additional information.
|
No individual international country’s revenue exceeded
10%
of total revenue. All significant long-lived assets are located in the United States.
118
Note 8—Fair Value Measurements
The Company has characterized its investments in marketable securities, based on the priority of the inputs used to value the investments, into a three-level fair value hierarchy. The fair value hierarchy gives the highest priority to quoted prices in active markets for identical assets or liabilities (Level 1), and lowest priority to unobservable inputs (Level 3). If the inputs used to measure the investments fall within different levels of the hierarchy, the categorization is based on the lowest level input that is significant to the fair value measurement of the investment. Investments recorded in the accompanying Consolidated Balance Sheet are categorized based on the inputs to valuation techniques as follows:
Level 1—These are investments where values are based on unadjusted quoted prices for identical assets in an active market that the Company has the ability to access.
Level 2—These are investments where values are based on quoted market prices in markets that are not active or model derived valuations in which all significant inputs are observable in active markets.
Level 3—These are liabilities where values are derived from techniques in which one or more significant inputs are unobservable.
The following are the major categories of assets and liabilities measured at fair value on a recurring basis as of the dates indicated (in thousands):
|
|
As of December 31, 2018
|
||||||||||||||
|
|
Level 1
|
Level 2
|
Level 3
|
Total
|
|||||||||||
|
Asset
|
|||||||||||||||
|
Cash equivalents:
|
|||||||||||||||
|
Commercial paper
|
$
|
—
|
|
$
|
7,775
|
|
$
|
—
|
|
$
|
7,775
|
|
|||
|
Money market funds
|
244,856
|
|
—
|
|
—
|
|
244,856
|
|
|||||||
|
244,856
|
|
7,775
|
|
—
|
|
252,631
|
|
||||||||
|
Short-term investments:
|
|||||||||||||||
|
Commercial paper
|
—
|
|
147,860
|
|
—
|
|
147,860
|
|
|||||||
|
Corporate bonds
|
—
|
|
46,801
|
|
—
|
|
46,801
|
|
|||||||
|
U.S. Government and agency securities
|
62,641
|
|
—
|
|
—
|
|
62,641
|
|
|||||||
|
62,641
|
|
194,661
|
|
—
|
|
257,302
|
|
||||||||
|
Funds receivable and seller accounts:
|
|||||||||||||||
|
Money market funds
|
9,229
|
|
—
|
|
—
|
|
9,229
|
|
|||||||
|
9,229
|
|
—
|
|
—
|
|
9,229
|
|
||||||||
|
$
|
316,726
|
|
$
|
202,436
|
|
$
|
—
|
|
$
|
519,162
|
|
||||
119
|
|
As of December 31, 2017
|
||||||||||||||
|
|
Level 1
|
Level 2
|
Level 3
|
Total
|
|||||||||||
|
Asset
|
|||||||||||||||
|
Cash equivalents:
|
|||||||||||||||
|
Commercial paper
|
$
|
—
|
|
$
|
11,290
|
|
$
|
—
|
|
$
|
11,290
|
|
|||
|
Money market funds
|
204,867
|
|
—
|
|
—
|
|
204,867
|
|
|||||||
|
U.S. Government and agency securities
|
24,989
|
|
—
|
|
—
|
|
24,989
|
|
|||||||
|
229,856
|
|
11,290
|
|
—
|
|
241,146
|
|
||||||||
|
Short-term investments:
|
|||||||||||||||
|
Commercial paper
|
—
|
|
2,998
|
|
—
|
|
2,998
|
|
|||||||
|
Corporate bonds
|
—
|
|
12,748
|
|
—
|
|
12,748
|
|
|||||||
|
U.S. Government and agency securities
|
9,362
|
|
—
|
|
—
|
|
9,362
|
|
|||||||
|
9,362
|
|
15,746
|
|
—
|
|
25,108
|
|
||||||||
|
Funds receivable and seller accounts:
|
|||||||||||||||
|
Money market funds
|
14,144
|
|
—
|
|
—
|
|
14,144
|
|
|||||||
|
14,144
|
|
—
|
|
—
|
|
14,144
|
|
||||||||
|
$
|
253,362
|
|
$
|
27,036
|
|
$
|
—
|
|
$
|
280,398
|
|
||||
Level 1 instruments include investments in debt securities including money market funds and U.S. Government and agency securities, which are valued based on inputs including quotes from broker-dealers or recently executed transactions in the same or similar securities.
Level 2 instruments include investments in debt securities, including fixed-income funds consisting of investments in commercial paper and corporate bonds, which are valued based on quoted market prices in markets that are not active or model derived valuations in which all significant inputs are observable in active markets.
Level 3 instruments historically included post-combination compensation classified as a liability in connection with the acquisition of ALM. The post-combination compensation was classified as a liability due to its affiliation with a related put option, which expired upon vesting of the underlying consideration in the second quarter of 2017, and its fair value was previously determined based on the fair value of the Company’s common stock at the period-end reporting date, with adjustments included in general and administrative expenses.
See “
Note 9—Marketable Securities
” for additional information on the Company’s marketable securities measured at fair value.
Disclosure of Fair Values
Our financial instruments that are not remeasured at fair value include the Notes (see “
Note 13—Debt
”). The Company estimates the fair value of the Notes through consideration of quoted market prices of similar instruments, classified as Level 2 as described above. The estimated fair value of the Notes was
$279.1 million
as of
December 31, 2018
.
120
Note 9—Marketable Securities
Short-term investments and certain cash equivalents consist of investments in debt securities that are available-for-sale. The cost and fair value of available-for-sale securities were as follows as of the dates indicated (in thousands):
|
Cost
|
Gross
Unrealized Holding Loss |
Gross
Unrealized Holding Gain |
Fair Value
|
||||||||||||
|
December 31, 2018
|
|||||||||||||||
|
Cash equivalents:
|
|||||||||||||||
|
Commercial paper
|
$
|
7,775
|
|
$
|
—
|
|
$
|
—
|
|
$
|
7,775
|
|
|||
|
7,775
|
|
—
|
|
—
|
|
7,775
|
|
||||||||
|
Short-term investments:
|
|||||||||||||||
|
Commercial paper
|
147,860
|
|
—
|
|
—
|
|
147,860
|
|
|||||||
|
Corporate bonds
|
46,836
|
|
(35
|
)
|
—
|
|
46,801
|
|
|||||||
|
U.S. Government and agency securities
|
62,638
|
|
(9
|
)
|
12
|
|
62,641
|
|
|||||||
|
257,334
|
|
(44
|
)
|
12
|
|
257,302
|
|
||||||||
|
$
|
265,109
|
|
$
|
(44
|
)
|
$
|
12
|
|
$
|
265,077
|
|
||||
|
December 31, 2017
|
|||||||||||||||
|
Cash equivalents:
|
|||||||||||||||
|
Commercial paper
|
$
|
11,290
|
|
$
|
—
|
|
$
|
—
|
|
$
|
11,290
|
|
|||
|
U.S. Government and agency securities
|
24,990
|
|
(1
|
)
|
—
|
|
24,989
|
|
|||||||
|
36,280
|
|
|
(1
|
)
|
|
—
|
|
|
36,279
|
|
|||||
|
Short-term investments:
|
|||||||||||||||
|
Commercial paper
|
2,998
|
|
—
|
|
—
|
|
2,998
|
|
|||||||
|
Corporate bonds
|
12,754
|
|
(6
|
)
|
—
|
|
12,748
|
|
|||||||
|
U.S. Government and agency securities
|
9,352
|
|
(1
|
)
|
11
|
|
9,362
|
|
|||||||
|
25,104
|
|
(7
|
)
|
11
|
|
25,108
|
|
||||||||
|
$
|
61,384
|
|
$
|
(8
|
)
|
$
|
11
|
|
$
|
61,387
|
|
||||
The Company’s investments in marketable securities consist primarily of investments debt securities, including fixed-income funds and U.S. Government and agency securities. When evaluating investments for other-than-temporary impairment, the Company reviews factors such as length of time and extent to which fair value has been below cost basis, the financial condition of the issuer and the Company’s ability, and intent to hold the investment for a period of time, which may be sufficient for anticipated recovery in market value. The Company evaluates fair values for each individual security in the investment portfolio.
See “
Note 8—Fair Value Measurements
” for additional information on the Company’s marketable securities measured at fair value.
Note 10—Warrants
As of
December 31, 2018, 2017, and 2016
, the Company did not have any outstanding warrants.
In May 2016, the Company issued
80,011
shares of common stock upon the net exercise of warrants to purchase
97,931
shares of common stock with a weighted-average exercise price of
$1.62
per share and a weighted-average fair market value of common stock at the date of exercise of
$8.88
. The warrant holders exercised this warrant in a cashless transaction and
17,920
shares were forfeited to the Company as payment of the exercise price.
The Company did not record any unrealized gains or losses from the remeasurement of the warrants to fair value in the years ended
December 31, 2018, 2017, and 2016
.
121
Note 11—Property and Equipment
Property and equipment consisted of the following as of the dates indicated (in thousands):
|
|
|
As of
December 31, |
|||||||
|
|
Estimated useful lives
|
2018
|
2017
|
||||||
|
Computer equipment
|
3 years
|
$
|
36,670
|
|
$
|
35,587
|
|
||
|
Furniture and equipment
|
2 - 4 years
|
6,574
|
|
6,194
|
|
||||
|
Software
|
1 - 3 years
|
—
|
|
908
|
|
||||
|
Leasehold improvements
|
Shorter of life of asset or lease term
|
10,731
|
|
10,929
|
|
||||
|
Construction in progress
|
Not applicable
|
551
|
|
—
|
|
||||
|
Building
|
25 years
|
81,892
|
|
81,892
|
|
||||
|
Website development and internal-use software
|
Shorter of life of asset or contract term
|
69,201
|
|
48,333
|
|
||||
|
205,619
|
|
183,843
|
|
||||||
|
Less: Accumulated depreciation and amortization
|
85,440
|
|
66,226
|
|
|||||
|
$
|
120,179
|
|
$
|
117,617
|
|
||||
Depreciation and amortization expense on property and equipment was
$22.4 million
,
$23.8 million
, and
$19.2 million
for the years ended
December 31, 2018, 2017, and 2016
, respectively, which includes amortization expense for equipment acquired under capital leases of
$5.9 million
,
$7.7 million
, and
$6.3 million
for the years ended
December 31, 2018, 2017, and 2016
, respectively. The gross balance of leased equipment as of
December 31, 2018 and 2017
was
$29.7 million
and
$27.7 million
, respectively. The related accumulated amortization of equipment under capital leases was
$24.4 million
and
$18.6 million
at
December 31, 2018 and 2017
, respectively.
The following table summarizes capitalized website development and internal-use software activities during the periods indicated (in thousands):
|
Year Ended
December 31, |
|||||||
|
2018
|
2017
|
||||||
|
Balance as of the beginning of the period
|
$
|
48,333
|
|
$
|
43,294
|
|
|
|
Additions to website development, excluding stock-based compensation
|
19,816
|
|
10,028
|
|
|||
|
Additions to website development—stock-based compensation
|
2,252
|
|
807
|
|
|||
|
Less: Retirements
|
1,200
|
|
625
|
|
|||
|
Less: Impairments
|
—
|
|
5,171
|
|
|||
|
69,201
|
|
48,333
|
|
||||
|
Less:
|
|||||||
|
Accumulated amortization balance as of the beginning of the period
|
29,991
|
|
24,155
|
|
|||
|
Amortization Expense
|
9,519
|
|
8,209
|
|
|||
|
Less: Retirements
|
1,092
|
|
364
|
|
|||
|
Less: Impairments
|
—
|
|
2,009
|
|
|||
|
Accumulated amortization balance as of the end of the period
|
38,418
|
|
29,991
|
|
|||
|
$
|
30,783
|
|
$
|
18,342
|
|
||
For the years ended
December 31, 2018, 2017, and 2016
, the Company recorded amortization expense relating to capitalized website development and internal-use software of
$9.5 million
,
$8.2 million
, and
$6.3 million
, respectively. The loss on write-off for capitalized website development and internal-use software assets that were retired during the years ended
December 31, 2018, 2017, and 2016
was
$0.1 million
,
$0.3 million
, and
$0.9 million
, respectively.
The Company recognized a
$3.2 million
impairment loss related to capitalized website development and internal-use software during the year ended
December 31, 2017
, included in asset impairment charges. During the fourth quarter of 2017, the Company made the decision to discontinue certain product offerings, including Etsy Studio and Etsy Manufacturing, which was
122
an indicator that the carrying amount of certain capitalized website development and internal-use software assets may not be recoverable. The Company prepared an undiscounted cash flow analysis and determined that the values for these assets exceeded the expected future cash flows and impaired the remaining book values based on a negative present value of projected undiscounted cash flows.
Note 12—Accrued Expenses
Accrued expenses consisted of the following as of the dates indicated (in thousands):
|
As of December 31,
|
|||||||
|
2018
|
2017
|
||||||
|
Vendor accruals
|
$
|
17,817
|
|
$
|
14,576
|
|
|
|
Accrued bonus
|
12,906
|
|
4,364
|
|
|||
|
Sales and use tax payable
|
12,232
|
|
3,682
|
|
|||
|
Accrued vacation
|
3,787
|
|
3,136
|
|
|||
|
Payroll-related liabilities
|
2,406
|
|
2,920
|
|
|||
|
Other
|
10
|
|
65
|
|
|||
|
Total accrued expenses
|
$
|
49,158
|
|
$
|
28,743
|
|
|
Note 13—Debt
Convertible Debt
In
March 2018
, the Company issued
$345.0 million
aggregate principal amount of
0%
Convertible Senior Notes due
2023
(the “Notes”) in a private placement to qualified institutional buyers pursuant to Rule 144A under the Securities Act of 1933, as amended (the “Securities Act”). The net proceeds from the sale of the Notes were
$335.0 million
after deducting the initial purchasers’ discount and offering expenses.
The Notes are convertible based upon an initial conversion rate of
27.5691
shares of the Company’s common stock per
$1,000
principal amount of Notes (equivalent to an initial conversion price of approximately
$36.27
per share). The conversion rate will be subject to adjustment upon the occurrence of certain specified events, including certain distributions and dividends to all or substantially all of the holders of the Company’s common stock. The Company will settle any conversions of the Notes in cash, shares of the Company’s common stock, or a combination thereof, with the form of consideration determined at the Company’s election.
The Notes will mature on
March 1, 2023
, unless earlier converted or repurchased. Prior to the close of business on the business day immediately preceding
November 1, 2022
, holders may convert all or a portion of their Notes only under the following circumstances: (1) during any calendar quarter commencing after the calendar quarter ending on
June 30, 2018
(and only during such calendar quarter), if the last reported sale price of the Company’s common stock for at least
20
trading days (whether or not consecutive) during a period of
30
consecutive trading days ending on, and including, the last trading day of the immediately preceding calendar quarter is greater than or equal to
130%
of the conversion price on each applicable trading day; (2) during the
5
business day period after any
10
consecutive trading day period (the “measurement period”) in which the trading price per
$1,000
principal amount of Notes for each trading day of the measurement period was less than
98%
of the product of the last reported sale price of the Company’s common stock and the conversion rate on each such trading day; (3) with respect to any or all of the Notes called for redemption by the Company prior to the close of business on the business day immediately preceding
November 1, 2022
, holders may convert all or any portion of their Notes at any time prior to the close of business on the second scheduled trading day prior to the redemption date, even if the Notes are not otherwise convertible at such time; (4) upon the occurrence of specified corporate events. On and after
November 1, 2022
until the close of business on the second scheduled trading day immediately preceding the maturity date, holders may convert their Notes at any time, regardless of the foregoing circumstances.
If a fundamental change occurs prior to the maturity date, holders may require the Company to repurchase all or a portion of their Notes for cash at a price equal to
100%
of the principal amount of the Notes to be repurchased. Holders of Notes who convert their Notes in connection with a notice of a redemption or a make-whole fundamental change may be entitled to a
123
premium in the form of an increase in the conversion rate of the Notes. During the fourth quarter of 2018, the closing price of the Company’s common stock exceeded
130%
of the applicable conversion price of the Notes on at least
20
of the last
30
consecutive trading days of the quarter; therefore, holders of the Notes may convert their Notes during the first quarter of 2019. As of
December 31, 2018
, the Company had not received any conversion notices, and, as such, the Notes are not currently redeemable for cash and are therefore classified as long-term debt. As of
December 31, 2018
, the if-converted value of the Notes was approximately
$107.5 million
higher than the aggregate principal amount, or
$452.5 million
, offset in entirety by the capped call transactions described below.
The Notes are general unsecured obligations of the Company. The Notes rank senior in right of payment to all of the Company’s future indebtedness that is expressly subordinated in right of payment to the Notes; rank equal in right of payment with all of our liabilities that are not so subordinated; are effectively junior to any of the Company’s secured indebtedness; and are structurally junior to all indebtedness and liabilities (including trade payables) of the Company’s subsidiaries.
In accounting for the issuance of the Notes, the Company separated the Notes into liability and equity components. The carrying amount of the liability component was calculated by measuring the fair value of a similar liability that does not have an associated convertible feature. The carrying amount of the equity component, representing the conversion option, which does not meet the criteria for separate accounting as a derivative as it is indexed to the Company’s own stock, was determined by deducting the fair value of the liability component from the par value of the Notes. The difference between the principal amount of the Notes and the liability component represents the debt discount, which is recorded as a direct deduction from the related debt liability in the Consolidated Balance Sheet and accreted over the period from the date of issuance to the contractual maturity date, resulting in the recognition of non-cash interest expense. The equity component of the Notes of approximately
$72.8 million
is included in additional paid-in capital in the Consolidated Balance Sheet and is not remeasured as long as it continues to meet the conditions for equity classification. Transaction costs were allocated to the liability and equity components in the same proportion as the allocation of the proceeds. Transaction costs attributable to the liability component were recorded as a direct deduction from the related debt liability in the Consolidated Balance Sheet and are amortized to interest expense using the effective interest method over the term of the Notes, and transaction costs attributable to the equity component were netted with the equity component in stockholders’ equity.
Non-cash interest expense related to the Notes for
the year ended December 31, 2018
was
$12.2 million
. Total unamortized debt issuance costs were
$6.7 million
as of
December 31, 2018
.
The estimated fair value of the Notes was
$279.1 million
as of
December 31, 2018
. The estimated fair value of the Notes was determined through consideration of quoted market prices for similar instruments. The fair value is classified as Level 2, as defined in “
Note 8—Fair Value Measurements
.”
Capped Call Transactions
The Company used
$34.2 million
of the net proceeds from the Notes offering to enter into separate capped call transactions (“Capped Call Transactions”) with the initial purchasers and/or their respective affiliates. The Capped Call Transactions are expected generally to reduce the potential dilution and/or offset the cash payments the Company is required to make in excess of the principal amount of the Notes upon conversion of the Notes in the event that the market price per share of the Company’s common stock is greater than the strike price of the Capped Call Transactions with such reduction and/or offset subject to a cap. The Capped Call Transactions have an initial cap price of
$52.76
per share of the Company’s common stock, which represents a premium of
100%
over the last reported sale price of the Company’s common stock on
March 8, 2018
, and is subject to certain adjustments under the terms of the Capped Call Transactions. Collectively, the Capped Call Transactions cover, initially, the number of shares of the Company’s common stock underlying the Notes, subject to anti-dilution adjustments substantially similar to those applicable to the Notes.
The Capped Call Transactions do not meet the criteria for separate accounting as a derivative as they are indexed to the Company’s stock. The premiums paid for the Capped Call Transactions have been included as a net reduction to additional paid-in capital within stockholders’ equity.
124
Credit Agreement
The Company terminated the senior secured revolving credit facility pursuant to a Revolving Credit and Guaranty Agreement with several lenders (the “2014 Credit Agreement”) effective as of November 21, 2017. As of the date of termination, there were no borrowings outstanding under the 2014 Credit Agreement and we incurred no additional fees as a result of early termination. In
May 2014
, the Company entered into a
$35.0
million Credit Agreement. In March 2015, the Company amended the 2014 Credit Agreement to increase the credit facility to
$50.0
million. In December 2015, the Company amended the 2014 Credit Agreement to clarify certain provisions relating to permitted investments and to make other immaterial updates. The amended 2014 Credit Agreement included a letter of credit sublimit of
$10.0
million and a swingline loan sublimit of
$15.0
million. The 2014 Credit Agreement, as amended, would have expired in May 2019.
Subsequent Event
On
February 25, 2019
, the Company entered into a
$200.0 million
senior secured revolving credit facility pursuant to a Credit Agreement (the “
2019 Credit Agreement
”) with lenders party thereto from time to time, and Citibank N.A., as administrative Agent. The
2019 Credit Agreement
will mature in
February 2024
. The
2019 Credit Agreement
includes a letter of credit sublimit of
$30.0 million
and a swingline loan sublimit of
$10.0 million
.
Borrowings under the
2019 Credit Agreement
(other than swingline loans) bear interest, at the Company’s option, at (i) a base rate equal to the highest of (a) the prime rate, (b) the federal funds rate plus
0.50%
, and (c) an adjusted LIBOR rate for a one-month interest period plus
1.00%
, in each case plus a margin ranging from
0.25%
to
0.875%
or (ii) an adjusted LIBOR rate plus a margin ranging from
1.25%
to
1.875%
. Swingline loans under the
2019 Credit Agreement
bear interest at the same base rate (plus the margin applicable to borrowings bearing interest at the base rate). These margins are determined based on the senior secured net leverage ratio (defined as secured funded debt, net of unrestricted cash up to
$100 million
, to EBITDA) for the preceding four fiscal quarter period. The Company is also obligated to pay other customary fees for a credit facility of this size and type, including an unused commitment fee, ranging from
0.20%
to
0.35%
depending on the Company’s senior secured net leverage ratio, and fees associated with letters of credit. The
2019 Credit Agreement
also permits the Company, in certain circumstances, to request an increase in the facility by an amount of up to
$100.0 million
at the same maturity, pricing and other terms and to request an extension of the maturity date for the facility. In connection with the
2019 Credit Agreement
, the Company also paid the lenders certain upfront fees.
The
2019 Credit Agreement
contains customary representations and warranties applicable to the Company and its subsidiaries and customary affirmative and negative covenants applicable to the Company and its restricted subsidiaries. The negative covenants include restrictions on, among other things, indebtedness, liens, certain fundamental changes (including mergers), investments, dispositions, restricted payments (including dividends and stock repurchases), prepayments of junior debt, and transactions with affiliates. These restrictions do not prohibit a subsidiary of the Company from making pro rata payments to the Company or any other person that owns an equity interest in such subsidiary. The
2019 Credit Agreement
contains financial covenants, that require the Company and its subsidiaries to maintain (i) a secured net leverage ratio not to exceed
3.00
to
1.00
, subject to an increase, at the option of the Company, to
3.50
to
1.00
for a specified period of time in the event of certain material acquisitions, tested as of the last day of each fiscal quarter and (ii) an interest coverage ratio (defined as the ratio of EBITDA to cash interest expense) of not less than
2.50
to
1.00
, tested for each fiscal quarter.
The
2019 Credit Agreement
includes customary events of default, including, but not limited to, nonpayment of principal or interest, breaches of representations and warranties, failure to perform or observe covenants, cross-defaults with certain other indebtedness, final judgments or orders, certain change of control events, and certain bankruptcy-related events or proceedings. Upon the occurrence of an event of default (subject to notice and grace periods), obligations under the
2019 Credit Agreement
could be accelerated.
Subject to certain exceptions, to the extent the Company has any material domestic subsidiaries, the obligations under the
2019 Credit Agreement
would be required to be guaranteed by such material domestic subsidiaries. The obligations under the
2019 Credit Agreement
are secured by all or substantially all of the assets of the Company and any such subsidiary guarantors.
At February 28, 2018, the Company did not have any borrowings under the
2019 Credit Agreement
.
125
Note 14—Commitments and Contingencies
Lease Commitments
Capital Leases
The Company entered into a credit agreement with Dell Financial Services, LLC. (“DFS”) on February 17, 2016, which provided the Company with a credit line of up to
$6.0 million
for hosting equipment leases (the “DFS Line”), which was increased to
$9.0 million
during 2017. This credit line expired in December 2018. The DFS Line allowed the Company to lease hosting equipment from DFS. The leases have a
36
-month term,
zero
interest and are payable in equal monthly installments with a buy-out option of
$1
at the end of the lease term. As of
December 31, 2018
, the Company has lease obligations of approximately
$2.9 million
related to leased hosting equipment using the previously active DFS Line.
The Company entered into a credit agreement with ePlus Group, Inc. (“ePlus”) on January 3, 2014, which provided the Company with a credit line of up to
$8.0 million
for computer equipment leases (the “ePlus Line”), which was increased to
$18.0 million
during 2015. The ePlus Line allows the Company to order equipment from any approved vendor. ePlus purchases the equipment on behalf of the Company and leases it back to the Company. The leases have a
36
-month term, interest rate of
3.71
-
6.93%
and are payable in equal monthly installments with a fair market value or a
$1
buy-out option at the end of the lease term depending on the equipment. As of
December 31, 2018
, the Company has lease obligations of approximately
$3.1 million
related to leased computer equipment using the ePlus Line.
For the
years ended December 31, 2018, 2017, and 2016
, the accompanying Consolidated Statement of Operations includes charges of approximately
$1.0 million
,
$1.6 million
, and
$1.6 million
for interest expense, respectively, related to the equipment leased using the DFS and ePlus Lines.
Operating Leases
The Company did not enter into any material operating leases or extensions in
2018
,
2017
, or
2016
. Rent expense for the Company’s operating leases is recognized over the term of each respective lease on a straight-line basis. In addition, the Company leases other office facilities under shorter terms and cancelable leases.
Total rent expense for the
years ended December 31, 2018, 2017, and 2016
was
$3.8 million
,
$4.1 million
, and
$6.0 million
, respectively.
Build-to-Suit Lease
In May 2014, the Company entered into a
10
-year lease agreement for approximately
199,000
rentable square feet of office space in Brooklyn, New York for the Company’s headquarters, which commenced in
2015
. Of the total office space, approximately
172,000
rentable square feet is being accounted for as a build-to-suit lease and approximately
27,000
rentable square feet located in an adjacent building is being accounted for as an operating lease. In connection with the lease agreement, the Company established a
$5.3 million
collateral account, reflected in the restricted cash balance on the Consolidated Balance Sheet.
Purchase Obligations
The Company has
$61.1 million
of non-cancelable contractual commitments as of
December 31, 2018
, primarily related to the initiative to migrate its data centers to the cloud, as well as other support services. These commitments are primarily due within four years.
126
The following table represents the Company’s commitments under its current capital, operating and build-to-suit lease agreements and purchase obligations as of
December 31, 2018
(in thousands):
|
Capital Lease
Obligations |
Operating
Leases |
Build-to-Suit
Lease |
Purchase Obligations
|
||||||||||||
|
Periods ending
|
|||||||||||||||
|
2019
|
$
|
4,392
|
|
$
|
4,904
|
|
$
|
9,451
|
|
$
|
10,696
|
|
|||
|
2020
|
1,754
|
|
4,783
|
|
9,522
|
|
17,374
|
|
|||||||
|
2021
|
481
|
|
4,185
|
|
10,354
|
|
16,000
|
|
|||||||
|
2022
|
—
|
|
4,180
|
|
10,520
|
|
17,000
|
|
|||||||
|
2023
|
—
|
|
4,205
|
|
10,599
|
|
—
|
|
|||||||
|
Thereafter
|
—
|
|
9,760
|
|
27,715
|
|
—
|
|
|||||||
|
Total minimum payments required
|
$
|
6,627
|
|
$
|
32,017
|
|
$
|
78,161
|
|
$
|
61,070
|
|
|||
|
Amounts representing interest
|
648
|
|
|||||||||||||
|
Present value of net minimum payments
|
5,979
|
|
|||||||||||||
|
Current maturities
|
3,884
|
|
|||||||||||||
|
Long-term payment obligations
|
$
|
2,095
|
|
||||||||||||
Long-Term Debt
In
March 2018
, the Company issued
$345.0 million
aggregate principal amount of
0%
Convertible Senior Notes due
2023
(the “Notes”) in a private placement to qualified institutional buyers pursuant to Rule 144A under the Securities Act. The Notes will mature on
March 1, 2023
, unless earlier converted or repurchased, and there are no contractual payments required until maturity. For more information on the Notes, see “
Note 13—Debt
.”
Non-Income Tax Contingencies
The Company had reserves of
$0.9 million
and
$0.4 million
at
December 31, 2018 and 2017
, respectively, for certain non-income tax obligations, representing management’s best estimate of its potential liability. The Company could also be subject to examination in various jurisdictions related to income tax and non-income tax matters. The resolution of these types of matters, if in excess of the recorded reserve, could have an adverse impact on the Company’s business.
Legal Proceedings
Cervantes and Weiss Cases
On July 21, 2015, a purported securities class action complaint (
Cervantes v. Dickerson, et.al
., Case No. CIV 534768) was filed in the Superior Court of State of California, County of San Mateo against the Company, certain officers, directors, and underwriters. The complaint asserted violations of Sections 11 and 15 of the Securities Act. The complaint alleged misrepresentations in the Company’s Registration Statement on Form S-1 and Prospectus with respect to, among other things, merchandise for sale on the Company’s website that may be counterfeit or constitute trademark or copyright infringement. The complaint sought certification as a class action and unspecified compensatory damages plus interest and attorneys’ fees. On December 7, 2015, the Company and the underwriter defendants moved to stay the Cervantes action on the grounds of forum non conveniens.
On November 5, 2015, another purported securities class action complaint (
Weiss v. Etsy et al.
, No. CIV 536123) was filed in the Superior Court of State of California, County of San Mateo. The
Weiss
complaint named as defendants the Company and the same officers, directors, and underwriters named in the
Cervantes
complaint, and also asserts violations of Sections 11 and 15 of the Securities Act based on allegedly false or misleading statements or omissions with respect to, among other things, merchandise for sale on the Company’s website that may be counterfeit or constitute trademark or copyright infringement. On December 24, 2015, the court consolidated the
Cervantes
and
Weiss
actions. On February 3, 2016, the court granted the Company’s motion to stay the consolidated actions. On September 19, 2018, the court granted plaintiffs’ request to dismiss the consolidated
Cervantes
and
Weiss
actions with prejudice.
127
In addition, from time to time in the normal course of business, various other claims and litigation have been asserted or commenced against the Company. Due to uncertainties inherent in litigation and other claims, the Company can give no assurance that it will prevail in any such matters, which could subject the Company to significant liability for damages. Any claims or litigation, regardless of their success, could have an adverse effect on the Company’s Consolidated Results of Operations or Cash Flows in the period the claims or litigation are resolved. Although the results of litigation and claims cannot be predicted with certainty, we currently believe that the final outcome of these ordinary course matters will not have a material adverse effect on our business.
Note 15—Stockholders’ Equity
At
December 31, 2018
and
2017
, the authorized capital stock of the Company included
1,400,000,000
shares of common stock. At
December 31, 2018
and
2017
there were
25,000,000
shares of preferred stock authorized.
Common Stock
At
December 31, 2018
and
2017
there were
119,771,702
and
121,769,238
shares of common stock issued and outstanding, respectively. Holders of common stock are entitled to
one
vote per share. Holders of common stock are not entitled to receive dividends unless declared by the Board of Directors.
No
dividends have been declared through
December 31, 2018
. The common stock has a
$0.001
par value.
Convertible Preferred Stock
Upon the closing of the IPO on April 21, 2015, all outstanding shares of convertible preferred stock were converted into
53,448,243
shares of common stock. As of
December 31, 2018, 2017, and 2016
, there was
no
convertible preferred stock outstanding.
Common Stock Issuances
In
the year ended December 31, 2016
, the Company issued a total of
685,749
shares of common stock in connection with the acquisition of Blackbird, of which
513,304
shares with an aggregate fair value of
$6.9 million
on the applicable acquisition date is included in the purchase price and
172,445
shares with an aggregate fair value of
$2.3 million
on the applicable acquisition date is tied to continued employment with the Company and is being accounted for as post-combination compensation expense.
Share Repurchase Program
On November 1, 2018, the Board of Directors approved a stock repurchase program that enables the Company to repurchase up to
$200 million
of its common stock. The program does not have a time limit and may be modified, suspended, or terminated at any time by the Board of Directors. The number of shares repurchased and the timing of repurchases will depend on a number of factors, including, but not limited to, stock price, trading volume and general market conditions, along with Etsy’s working capital requirements, general business conditions and other factors.
In November 2017, the Board of Directors approved a stock repurchase program that enabled the Company to repurchase up to
$100 million
of its common stock. The program was completed in the second quarter of 2018.
Under the stock repurchase program, the Company may purchase shares of its common stock through various means, including open market transactions, privately negotiated transactions, tender offers or any combination thereof. In addition, open market repurchases of common stock may be made pursuant to trading plans established pursuant to Rule 10b5-1 under the Securities Exchange Act of 1934, as amended, which would permit common stock to be repurchased at a time that the Company might otherwise be precluded from doing so under insider trading laws or self-imposed trading restrictions.
128
The following table summarizes the Company’s share repurchase activity, excluding shares withheld to satisfy tax withholding obligations in connection with the vesting of employee restricted stock units (in thousands except share and per share amounts):
|
Shares Repurchased
|
Average Price Paid per Share (1)
|
Value of Shares Repurchased
|
Remaining Amount Authorized
|
|||||||||||
|
New Authorization on November 17, 2017 of $100 million
|
—
|
|
$
|
—
|
|
$
|
—
|
|
$
|
100,000
|
|
|||
|
Repurchases of common stock for the three months ended:
|
||||||||||||||
|
December 31, 2017
|
586,231
|
|
17.57
|
|
10,301
|
|
(10,301
|
)
|
||||||
|
Balance as of December 31, 2017
|
586,231
|
|
$
|
17.57
|
|
$
|
10,301
|
|
$
|
89,699
|
|
|||
|
Repurchases of common stock for the three months ended:
|
||||||||||||||
|
March 31, 2018
|
2,807,393
|
|
24.43
|
|
68,586
|
|
(68,586
|
)
|
||||||
|
June 30, 2018
|
722,941
|
|
29.15
|
|
21,113
|
|
(21,113
|
)
|
||||||
|
September 30, 2018
|
—
|
|
—
|
|
—
|
|
—
|
|
||||||
|
New Authorization on November 1, 2018 of $200 million
|
—
|
|
—
|
|
—
|
|
200,000
|
|
||||||
|
Repurchases of common stock for the three months ended:
|
||||||||||||||
|
December 31, 2018
|
916,083
|
|
49.11
|
|
45,000
|
|
(45,000
|
)
|
||||||
|
Balance as of December 31, 2018
|
5,032,648
|
|
$
|
28.80
|
|
$
|
145,000
|
|
$
|
155,000
|
|
|||
(1) Average price paid per share excludes broker commissions.
All repurchases were made using cash resources.
Note 16—Stock-based Compensation
The Company’s 2015 Equity Incentive Plan (the “2015 Plan”) was adopted by its Board of Directors and approved by stockholders in March 2015. The 2015 Plan became effective immediately upon adoption although no awards were made under it until the effective date of the IPO. The 2015 Plan replaced the 2006 Stock Plan, and no further grants were made under the 2006 Stock Plan as of the effective date of the IPO.
Under the 2006 Stock Plan, incentive and nonqualified stock options or rights to purchase common stock were granted to eligible participants. Options were generally granted for a term of
10 years
and generally vested
25%
after the first year of service and ratably each month over the remaining
36
-month period contingent on continued employment with the Company on each vesting date.
The 2015 Plan provides for the grant of incentive stock options, non-statutory stock options, stock appreciation rights, restricted stock, restricted stock units (“RSUs”), and performance cash awards to employees, directors, and consultants. Beginning in 2016, the number of shares available for issuance under the 2015 Plan may be increased annually by an amount equal to the lesser of
7,050,000
shares of common stock,
5%
of the outstanding shares of common stock as of the last day of the immediately preceding fiscal year, or such other amount as determined by the Company’s Board of Directors. The Board of Directors approved an increase of
2,395,434
,
6,088,461
, and
5,798,651
shares available for issuance under the 2015 Plan as of January 2, 2019, January 2, 2018, and January 3, 2017, respectively. Any awards issued under the 2015 Plan that are forfeited by the participant will become available for future grant under the 2015 Plan. The number of shares of the Company’s common stock initially reserved for issuance under the 2015 Plan equaled the sum of
14,100,000
shares plus up to
12,653,075
shares reserved for issuance or subject to outstanding awards under the 2006 Stock Plan. At
December 31, 2018
,
29,436,374
shares were authorized under the 2015 Plan and
18,645,783
shares were available for future grant.
In the first quarter of 2017, the Company made an accounting policy election to recognize forfeitures as they occur upon adoption of guidance in ASU 2016-09
—Stock Compensation: Improvements to Employee Share-based Payment Accounting
. In reporting periods prior to 2017, the Company estimated forfeitures at the time of grant and revised in subsequent periods as necessary if actual forfeitures differed from estimates.
In the
year
ended
December 31, 2018
, the Company granted nonqualified stock options and RSUs to eligible participants. Options were generally granted for a term of
10 years
.
For both options and RSUs, vesting is typically over a
four
-year period
129
and is contingent upon continued employment with the Company on each vesting date.
In general, options granted to newly-hired employees prior to July 2018 vest
25%
after the first year of service and ratably each month over the remaining
36
-month period. In general, RSUs granted to newly-hired employees prior to July 2018 vest
25%
after the first year following the vesting commencement date, which is the first day of the fiscal quarter closest to the date of grant, and then vest ratably each quarter over the remaining 12-quarter period. In general, for current employees who received an additional grant prior to March 2018, options vest ratably each month over a
48
-month period. In general, for current employees who received an additional grant prior to March 2018, RSUs vest ratably each quarter over a 16-quarter period following the vesting commencement date, which is the first day of the fiscal quarter closest to the date of grant.
Beginning in July
2018, in general
, for newly-hired employees, both options and RSUs vest
25%
after the first year of service and ratably each
six
-month period over a
four
-year period following the vesting commencement date, which is the first day of the month closest to the date of grant. Beginning in March 2018,
in general, for current employees who receive an additional grant, both options and RSUs vest ratably each
six
-month period over a
four
-year period
following the vesting commencement date
.
The fair value of each option award is estimated on the date of grant using the Black-Scholes option-pricing model using the inputs below. Prior to the IPO, the Company utilized equity valuations based on comparable publicly-traded companies, discounted free cash flows, an analysis of the Company’s enterprise value, and other factors deemed relevant in estimating the fair value of its common stock. Subsequent to the IPO, the Company has used the closing price of its common stock on Nasdaq as the fair value of its common stock. The risk-free rate for periods within the contractual life of the option is based on the U.S. Treasury yield curve in effect at the time of grant for time periods that approximate the expected life of the option awards. Expected volatilities are based on implied volatilities from Etsy and market comparisons of certain publicly traded companies and other factors. The expected term of stock options granted has been determined using the simplified method, which uses the midpoint between the vesting date and the contractual term. The requisite service period is generally
four
years from the date of grant. The fair value of RSUs is determined based on the closing price of the Company’s common stock on Nasdaq on the grant date.
The fair value of options granted in each year using the Black-Scholes pricing model has been based on the following assumptions:
|
|
Year Ended
December 31, |
||||
|
|
2018
|
2017
|
2016
|
||
|
Volatility
|
38.6% - 47.8%
|
41.7% - 44.2%
|
38.6% - 44.6%
|
||
|
Risk-free interest rate
|
2.6% - 2.9%
|
1.9% - 2.2%
|
1.1% - 2.1%
|
||
|
Expected term (in years)
|
5.5 - 6.3
|
5.5 - 6.3
|
5.5 - 6.3
|
||
|
Dividend rate
|
—%
|
—%
|
—%
|
||
130
The following table summarizes the activity for the Company’s options (in thousands except share and per share amounts):
|
Shares
|
Weighted-Average
Exercise Price |
Weighted-Average
Remaining Contract Term (in years) |
Aggregate
Intrinsic Value |
|||||||||
|
Outstanding at December 31, 2015
|
11,068,859
|
|
$
|
6.94
|
|
7.01
|
$
|
31,932
|
|
|||
|
Granted
|
1,700,234
|
|
9.35
|
|
||||||||
|
Exercised
|
(2,535,620
|
)
|
4.17
|
|
||||||||
|
Forfeited/Canceled
|
(893,906
|
)
|
9.51
|
|
||||||||
|
Outstanding at December 31, 2016
|
9,339,567
|
|
7.89
|
|
6.64
|
43,613
|
|
|||||
|
Granted
|
5,887,183
|
|
11.04
|
|
||||||||
|
Exercised
|
(5,760,263
|
)
|
5.87
|
|
||||||||
|
Forfeited/Canceled
|
(1,518,548
|
)
|
11.36
|
|
||||||||
|
Outstanding at December 31, 2017
|
7,947,939
|
|
11.02
|
|
7.93
|
74,996
|
|
|||||
|
Granted
|
797,201
|
|
29.87
|
|
||||||||
|
Exercised
|
(1,588,779
|
)
|
11.49
|
|
||||||||
|
Forfeited/Canceled
|
(265,367
|
)
|
15.68
|
|
||||||||
|
Outstanding at December 31, 2018
|
6,890,994
|
|
12.91
|
|
7.94
|
239,177
|
|
|||||
|
Total exercisable at December 31, 2018
|
3,032,251
|
|
10.94
|
|
7.28
|
111,071
|
|
|||||
The following table summarizes the weighted-average grant date fair value of options granted, intrinsic value of options exercised and fair value of awards vested in periods indicated (in thousands except per share amounts):
|
|
Year Ended December 31,
|
||||||||||
|
|
2018
|
2017
|
2016
|
||||||||
|
Weighted average grant date fair value of options granted
|
$
|
13.33
|
|
$
|
4.85
|
|
$
|
4.03
|
|
||
|
Intrinsic value of options exercised
|
34,268
|
|
52,693
|
|
19,130
|
|
|||||
|
Fair value of awards vested
|
32,717
|
|
19,826
|
|
9,533
|
|
|||||
The total unrecognized compensation expense at
December 31, 2018
was
$22.9 million
, which will be recognized over a weighted-average period of
2.59 years
.
The following table summarizes the activity for the Company’s unvested RSUs:
|
Shares
|
Weighted-Average
Fair Value |
|||||
|
Unvested at December 31, 2015
|
395,846
|
|
$
|
13.70
|
|
|
|
Granted
|
3,200,297
|
|
10.29
|
|
||
|
Vested
|
(255,868
|
)
|
10.64
|
|
||
|
Forfeited/Canceled
|
(205,094
|
)
|
10.15
|
|
||
|
Unvested at December 31, 2016
|
3,135,181
|
|
10.70
|
|
||
|
Granted
|
2,360,315
|
|
12.17
|
|
||
|
Vested
|
(1,072,321
|
)
|
10.44
|
|
||
|
Forfeited/Canceled
|
(1,348,928
|
)
|
10.56
|
|
||
|
Unvested at December 31, 2017
|
3,074,247
|
|
11.98
|
|
||
|
Granted
|
2,448,169
|
|
28.22
|
|
||
|
Vested
|
(1,496,906
|
)
|
13.80
|
|
||
|
Forfeited/Canceled
|
(545,142
|
)
|
18.47
|
|
||
|
Unvested at December 31, 2018
|
3,480,368
|
|
22.87
|
|
||
The total unrecognized compensation at
December 31, 2018
was
$70.5 million
, which will be recognized over a weighted-average period of
3.03 years
.
131
Total stock-based compensation expense included in the Consolidated Statements of Operations is as follows (in thousands):
|
|
Year Ended
December 31, |
||||||||||
|
|
2018
|
2017
|
2016
|
||||||||
|
Cost of revenue
|
$
|
3,357
|
|
$
|
1,739
|
|
$
|
1,057
|
|
||
|
Marketing
|
2,507
|
|
1,933
|
|
971
|
|
|||||
|
Product development
|
21,234
|
|
8,274
|
|
5,079
|
|
|||||
|
General and administrative
|
11,133
|
|
14,613
|
|
8,794
|
|
|||||
|
Total stock-based compensation expense
|
$
|
38,231
|
|
$
|
26,559
|
|
$
|
15,901
|
|
||
The total stock-based compensation expense in the
years ended December 31, 2018, 2017, and 2016
includes
$3.8 million
,
$3.9 million
, and
$2.7 million
, in acquisition-related stock-based compensation expense, respectively.
During
the year ended December 31, 2018
, the Company incurred non-cash stock-based compensation expense of
$7.0 million
resulting from the modification of stock options and RSUs to accelerate vesting of certain stock-based compensation in connection with the departure of two employees. See “
Note 17—Restructuring and Other Exit Costs (Income)
” for information on stock modifications incurred in 2017 related to restructuring.
Note 17—Restructuring and Other Exit Costs (Income)
On April 30, 2017, the Board of Directors approved a plan to increase efficiency and streamline the Company’s cost structure through headcount reductions and a reduction in internal program expenses (the “May Actions”). On June 16, 2017, the Board of Directors approved additional initiatives designed to improve focus on key strategic growth opportunities (together with the May Actions, the “Actions”). The Actions included total headcount reductions of
245
positions or
23%
of the total workforce as of December 31, 2016, closing ALM, a marketplace in France, and closing or consolidating certain international offices.
In connection with the Actions, the Company incurred
$13.9 million
of restructuring and other exit costs in
the year ended December 31, 2017
, comprised of employee severance, stock compensation modifications, and other exit costs, largely made up of cash expenditures. The Company generated
$0.2 million
of income in
the year ended December 31, 2018
due to changes in estimated severance costs.
132
The following table displays restructuring and other exit costs (income) recorded related to the Actions and a rollforward of the charges to the accrued expenses balance as of
December 31, 2018
(in thousands):
|
Severance Charge
|
Stock-Based Compensation
|
Other Exit Costs
|
Total
|
||||||||||||
|
Balance, December 31, 2016
|
$
|
—
|
|
$
|
—
|
|
$
|
—
|
|
$
|
—
|
|
|||
|
Total restructuring and other exit costs
|
8,972
|
|
1,668
|
|
620
|
|
11,260
|
|
|||||||
|
Costs charged against equity/assets
|
—
|
|
(1,668
|
)
|
—
|
|
(1,668
|
)
|
|||||||
|
Cash payments
|
(2,110
|
)
|
—
|
|
(278
|
)
|
(2,388
|
)
|
|||||||
|
Balance, June 30, 2017
|
6,862
|
|
—
|
|
342
|
|
7,204
|
|
|||||||
|
Total restructuring and other exit costs
|
871
|
|
965
|
|
(70
|
)
|
1,766
|
|
|||||||
|
Costs charged against equity/assets
|
—
|
|
(965
|
)
|
—
|
|
(965
|
)
|
|||||||
|
Cash payments
|
(4,385
|
)
|
—
|
|
(180
|
)
|
(4,565
|
)
|
|||||||
|
Balance, September 30, 2017
|
3,348
|
|
—
|
|
92
|
|
3,440
|
|
|||||||
|
Total restructuring and other exit costs
|
361
|
|
68
|
|
442
|
|
871
|
|
|||||||
|
Costs charged against equity/assets
|
—
|
|
(68
|
)
|
(286
|
)
|
(354
|
)
|
|||||||
|
Cash payments
|
(2,401
|
)
|
—
|
|
(214
|
)
|
(2,615
|
)
|
|||||||
|
Balance, December 31, 2017
|
1,308
|
|
—
|
|
34
|
|
1,342
|
|
|||||||
|
Total restructuring and other exit costs (income)
|
(156
|
)
|
—
|
|
5
|
|
(151
|
)
|
|||||||
|
Cash payments
|
(793
|
)
|
—
|
|
—
|
|
(793
|
)
|
|||||||
|
Balance, March 31, 2018
|
359
|
|
—
|
|
39
|
|
398
|
|
|||||||
|
Total restructuring and other exit costs (income)
|
(43
|
)
|
—
|
|
2
|
|
(41
|
)
|
|||||||
|
Cash payments
|
(271
|
)
|
—
|
|
(16
|
)
|
(287
|
)
|
|||||||
|
Balance, June 30, 2018
|
45
|
|
—
|
|
25
|
|
70
|
|
|||||||
|
Total restructuring and other exit costs (income)
|
(45
|
)
|
—
|
|
(12
|
)
|
(57
|
)
|
|||||||
|
Cash payments
|
—
|
|
—
|
|
(13
|
)
|
(13
|
)
|
|||||||
|
Balance, September 30, 2018
|
—
|
|
—
|
|
—
|
|
—
|
|
|||||||
|
Balance, December 31, 2018
|
$
|
—
|
|
$
|
—
|
|
$
|
—
|
|
$
|
—
|
|
|||
Total restructuring and other exit costs (income) included in the Consolidated Statements of Operations are as follows (in thousands):
|
|
Year Ended
December 31, |
||||||||||
|
2018
|
2017
|
2016
|
|||||||||
|
Cost of revenue
|
$
|
(19
|
)
|
$
|
738
|
|
$
|
—
|
|
||
|
Marketing
|
(82
|
)
|
2,950
|
|
—
|
|
|||||
|
Product development
|
(110
|
)
|
3,232
|
|
—
|
|
|||||
|
General and administrative
|
(38
|
)
|
6,977
|
|
—
|
|
|||||
|
Total restructuring and other exit costs (income)
|
$
|
(249
|
)
|
$
|
13,897
|
|
$
|
—
|
|
||
133
Item 9. Changes in and Disagreements With Accountants on Accounting and Financial Disclosure.
None.
Item 9A. Controls and Procedures.
Evaluation of Disclosure Controls and Procedures
Our management, with the participation of our Chief Executive Officer and our Chief Financial Officer, evaluated the effectiveness of our disclosure controls and procedures as of
December 31, 2018
. “Disclosure controls and procedures,” as defined in Rules 13a-15(e) and 15d-15(e) under the Exchange Act, are designed to ensure that information required to be disclosed by a company in the reports that it files or submits under the Exchange Act is (i) recorded, processed, summarized, and reported within the time periods specified in the Securities and Exchange Commission’s rules and forms and (ii) accumulated and communicated to the company’s management, including its principal executive officer and principal financial officer, as appropriate to allow timely decisions regarding required disclosure. Based on the evaluation of our disclosure controls and procedures, our Chief Executive Officer and Chief Financial Officer concluded that our disclosure controls and procedures were effective as of
December 31, 2018
at the reasonable assurance level.
Management’s Report on Internal Controls Over Financial Reporting
Our management is responsible for establishing and maintaining adequate internal control over financial reporting, as defined in Rule 13a-15(f) and 15d-15(f) under the Exchange Act. Our management conducted an assessment of the effectiveness of our internal control over financial reporting as of
December 31, 2018
based on the criteria set forth in
Internal Control-Integrated Framework
(2013) issued by the Committee of Sponsoring Organizations of the Treadway Commission. Based on the assessment, our management has concluded that its internal control over financial reporting was effective as of
December 31, 2018
to provide reasonable assurance regarding the reliability of financial reporting and the preparation of financial statements in accordance with GAAP.
Our independent registered public accounting firm, PricewaterhouseCoopers LLP, has issued an audit report with respect to the effectiveness of our internal control over financial reporting as of
December 31, 2018
, which appears in Part II, Item 8 of this Annual Report on Form 10-K.
Changes in Internal Control over Financial Reporting
There were no changes in our internal control over financial reporting identified during the
fourth
quarter ended December, 31,
2018
that materially affected, or are reasonably likely to materially affect, our internal control over financial reporting.
Limitations on Controls
Our disclosure controls and procedures and internal control over financial reporting are designed to provide reasonable assurance of achieving the desired control objectives. Our management recognizes that any control system, no matter how well designed and operated, is based upon certain judgments and assumptions and cannot provide absolute assurance that its objectives will be met. Similarly, an evaluation of controls cannot provide absolute assurance that misstatements due to error or fraud will not occur or that all control issues and instances of fraud, if any, have been detected.
Item 9B. Other Information.
None.
134
PART III.
Item 10. Directors, Executive Officers and Corporate Governance.
The information required by this item is incorporated by reference to our Proxy Statement for the
2019
Annual Meeting of Stockholders (“Proxy Statement”) to be filed with the SEC within 120 days of the fiscal year ended
December 31, 2018
.
Our Board of Directors has adopted a Code of Conduct applicable to all officers, directors, and employees, which is available on our website (investors.etsy.com) under “Governance
—
Governance Documents.” We intend to satisfy the disclosure requirement under Item 5.05 of Form 8-K regarding amendments and waivers of our Code of Conduct by posting information on the website address specified above.
Item 11. Executive Compensation.
The information required by this item is incorporated by reference to our Proxy Statement.
Item 12. Security Ownership of Certain Beneficial Owners and Management and Related Stockholder Matters
.
The information required by this item is incorporated by reference to our Proxy Statement.
Item 13. Certain Relationships and Related Transactions, and Director Independence.
The information required by this item is incorporated by reference to our Proxy Statement.
Item 14. Principal Accounting Fees and Services.
The information required by this item is incorporated by reference to our Proxy Statement.
135
PART IV.
Item 15. Exhibits, Financial Statement Schedules.
(a) The following documents are filed as part of this report:
(1) Financial Statements.
Our Consolidated Financial Statements are listed in the “Index to Consolidated Financial Statements” under Part II, Item 8
of this Annual Report on Form 10-K.
(2) Financial Statement Schedules.
All schedules are omitted because they are not applicable or because the required information is shown in the Consolidated Financial Statements and Notes.
(3) Exhibits.
Exhibit Index
|
Exhibit
Number
|
Incorporated by Reference
|
Filed
Herewith
|
|||||||||
|
Exhibit Description
|
Form
|
File No.
|
Exhibit
|
Filing Date
|
|||||||
|
8-K
|
001-36911
|
3.1
|
4/21/2015
|
||||||||
|
8-K
|
001-36911
|
3.2
|
4/21/2015
|
||||||||
|
S-1/A
|
333-202497
|
10.1
|
3/31/2015
|
||||||||
|
S-1
|
333-202497
|
10.2.1
|
3/4/2015
|
||||||||
|
S-1/A
|
333-202497
|
10.3
|
4/14/2015
|
||||||||
|
X
|
|||||||||||
|
S-1/A
|
333-202497
|
10.4
|
3/31/2015
|
||||||||
|
S-1
|
333-202497
|
10.6
|
3/4/2015
|
||||||||
|
10-K
|
001-36911
|
10.15
|
2/28/2017
|
||||||||
|
10-Q
|
001-36911
|
10.1
|
11/7/2018
|
||||||||
|
10-Q
|
001-36911
|
10.1
|
8/7/2017
|
||||||||
|
8-K
|
001-36911
|
10.1
|
4/3/2017
|
||||||||
|
10-Q
|
001-36911
|
10.2.2
|
8/7/2017
|
||||||||
|
10-K
|
001-36911
|
10.11
|
3/1/2018
|
||||||||
|
10-K
|
001-36911
|
10.12
|
3/1/2018
|
||||||||
|
X
|
|||||||||||
|
S-1
|
333-202497
|
10.14
|
3/4/2015
|
||||||||
|
10-Q
|
001-36911
|
10.1
|
8/4/2016
|
||||||||
136
|
10-K
|
001-36911
|
10.19.3
|
3/1/2018
|
||||||||
|
X
|
|||||||||||
|
X
|
|||||||||||
|
X
|
|||||||||||
|
X
|
|||||||||||
|
X
|
|||||||||||
|
X
|
|||||||||||
|
X
|
|||||||||||
|
101.INS
|
XBRL Instance Document
|
X
|
|||||||||
|
101.SCH
|
XBRL Taxonomy Schema Linkbase Document
|
X
|
|||||||||
|
101.CAL
|
XBRL Taxonomy Calculation Linkbase Document
|
X
|
|||||||||
|
101.DEF
|
XBRL Taxonomy Definition Linkbase Document
|
X
|
|||||||||
|
101.LAB
|
XBRL Taxonomy Labels Linkbase Document
|
X
|
|||||||||
|
101.PRE
|
XBRL Taxonomy Presentation Linkbase Document
’
|
X
|
|||||||||
|
*
|
Indicates a management contract or compensatory plan.
|
|
†
|
These certifications are not deemed to be filed with the SEC and are not to be incorporated by reference into any filing of Etsy, Inc. under the Securities Act of 1933, as amended, or the Securities Exchange Act of 1934, as amended.
|
Item 16. Form 10-K Summary
None.
137
Signatures
Pursuant to the requirements of Section 13 or 15(d) of the Securities Exchange Act of 1934, the registrant has duly caused this report to be signed on its behalf by the undersigned, thereunto duly authorized.
|
ETSY, INC.
|
|
|
Date: February 28, 2019
|
/s/ Rachel Glaser
|
|
Rachel Glaser
Chief Financial Officer
|
|
|
(Principal Financial and Accounting Officer)
|
|
Power of Attorney
KNOW ALL PERSONS BY THESE PRESENTS, that each person whose signature appears below hereby constitutes and appoints Josh Silverman and Rachel Glaser, and each of them, as his or her true and lawful attorney-in-fact and agent with full power of substitution, for him or her in any and all capacities, to sign any and all amendments to this Annual Report on Form 10-K and to file the same, with all exhibits thereto and other documents in connection therewith, with the Securities and Exchange Commission, granting unto said attorney-in-fact and agent full power and authority to do and perform each and every act and thing requisite and necessary to be done in connection therewith, as fully for all intents and purposes as he or she might or could do in person, hereby ratifying and confirming all that said attorney-in-fact and agent, or his or her substitute, may lawfully do or cause to be done by virtue hereof.
Pursuant to the requirements of the Securities Exchange Act of 1934, this report has been signed below by the following persons on behalf of the registrant and in the capacities and on the dates indicated.
|
Signature
|
Title
|
Date
|
|
/s/ Josh Silverman
Josh Silverman
|
President, Chief Executive Officer, and Director (Principal Executive Officer)
|
February 28, 2019
|
|
/s/ Rachel Glaser
Rachel Glaser
|
Chief Financial Officer (Principal Financial and Accounting Officer)
|
February 28, 2019
|
|
/s/ Fred Wilson
Fred Wilson
|
Chair
|
February 28, 2019
|
|
/s/ Gary Briggs
Gary Briggs
|
Director
|
February 28, 2019
|
|
/s/ M. Michele Burns
M. Michele Burns
|
Director
|
February 28, 2019
|
|
/s/ Edith Cooper
Edith Cooper
|
Director
|
February 28, 2019
|
|
/s/ Jonathan D. Klein
Jonathan D. Klein
|
Director
|
February 28, 2019
|
|
/s/ Melissa Reiff
Melissa Reiff
|
Director
|
February 28, 2019
|
|
/s/ Margaret M. Smyth
Margaret M. Smyth
|
Director
|
February 28, 2019
|
138
TABLE OF CONTENTS
Part IItem 1. BusinessItem 1A. Risk FactorsNote 14 Commitments and ContingenciesItem 1B. Unresolved Staff CommentsItem 2. PropertiesItem 3. Legal ProceedingsItem 4. Mine Safety DisclosuresPart IIItem 5. Market For Registrant S Common Equity, Related Stockholder Matters and Issuer Purchases Of Equity SecuritiesItem 6. Selected Consolidated Financial and Other DataNote 2 RevenueNote 17 Restructuring and Other Exit Costs (income)Note 13 DebtItem 7. Management S Discussion and Analysis Of Financial Condition and Results Of OperationsNote 1 Basis Of Presentation and Summary Of Significant Accounting PoliciesNote 16 Stock-based CompensationItem 7A. Quantitative and Qualitative Disclosures About Market RiskItem 8. Financial Statements and Supplementary DataNote 3 Income TaxesNote 4 Net Income (loss) Per ShareNote 5 Business CombinationsNote 6 Goodwill and Intangible AssetsNote 7 Segment and Geographic InformationNote 8 Fair Value MeasurementsNote 9 Marketable SecuritiesNote 10 WarrantsNote 11 Property and EquipmentNote 12 Accrued ExpensesNote 15 Stockholders EquityItem 9. Changes in and Disagreements with Accountants on Accounting and Financial DisclosureItem 9A. Controls and ProceduresItem 9B. Other InformationPart IIIItem 10. Directors, Executive Officers and Corporate GovernanceItem 11. Executive CompensationItem 12. Security Ownership Of Certain Beneficial Owners and Management and Related Stockholder MattersItem 13. Certain Relationships and Related Transactions, and Director IndependenceItem 14. Principal Accounting Fees and ServicesPart IVItem 15. Exhibits, Financial Statement SchedulesItem 16. Form 10-k Summary