EVOLENT HEALTH, INC.
10-Ks and 10-Qs
|
|
|
|
|
|
|
|
|
|
|
|
|
|
|
|
|
|
|
|
|
|
|
|
|
|
|
|
|
|
|
|
|
|
|
|
|
|
|
UNITED STATES
|
|
SECURITIES AND EXCHANGE COMMISSION
|
|
WASHINGTON, D.C. 20549
|
|
_________________________
|
|
FORM 10-K
|
|
_________________________
|
(Mark One)
|
☒
|
ANNUAL REPORT PURSUANT TO SECTION 13 OR 15(d) OF THE SECURITIES EXCHANGE ACT OF 1934
|
For the fiscal year ended
December 31, 2017
OR
|
☐
|
TRANSITION REPORT PURSUANT TO SECTION 13 OR 15(d) OF THE SECURITIES EXCHANGE ACT OF 1934
|
For the transition period from
to
Commission File Number: 001-37415
_________________________
Evolent Health, Inc.
(Exact name of registrant as specified in its charter)
_________________________
|
Delaware
|
32-0454912
|
|
(State or other jurisdiction of
incorporation or organization)
|
(I.R.S. Employer
Identification No.)
|
|
800 N. Glebe Road, Suite 500, Arlington, Virginia
|
22203
|
|
(Address of principal executive offices)
|
(Zip Code)
|
(571) 389-6000
Registrant’s telephone number, including area code
_________________________
|
Securities registered pursuant to section 12(b) of the Act:
|
||
|
Title of each class
|
Name of each exchange on which registered
|
|
|
Class A Common Stock, par value $0.01 per share
|
New York Stock Exchange
|
|
Securities registered pursuant to section 12(g) of the Act: None
Indicate by check mark if the registrant is a well-known seasoned issuer, as defined by Rule 405 of the Securities Act. Yes ☒ No ☐
Indicate by check mark if the registrant is not required to file reports pursuant to Section 12 or Section 15(d) of the Act. Yes ☐ No ☒
Indicate by check mark whether the registrant (1) has filed all reports required to be filed by Section 13 or 15(d) of the Securities Exchange Act of 1934 during the preceding 12 months (or for such shorter period that the registrant was required to file such reports), and (2) has been subject to such filing requirements for the past 90 days. Yes ☒ No ☐
Indicate by check mark whether the registrant has submitted electronically and posted on its corporate Web site, if any, every Interactive Data File required to be submitted and posted pursuant to Rule 405 of Regulation S-T (§232.405 of this chapter) during the preceding 12 months (or for such shorter period that the registrant was required to submit and post such files). Yes ☒ No ☐
Indicate by check mark if disclosure of delinquent filers pursuant to Item 405 of Regulation S-K (§229.405 of this chapter) is not contained herein, and will not be contained, to the best of the registrant’s knowledge, in definitive proxy or information statements incorporated by reference in Part III of this Form 10-K or any amendment to this Form 10-K. ☒
Indicate by check mark whether the registrant is a large accelerated filer, an accelerated filer, a non-accelerated filer, a smaller reporting company or an emerging growth company. See the definitions of “large accelerated filer,” “accelerated filer,” “smaller reporting company” and “emerging growth company” in Rule 12b-2 of the Exchange Act. Large accelerated filer ☒ Accelerated filer ☐ Non-accelerated filer ☐ Smaller reporting company ☐
Emerging growth company
☐
If an emerging growth company, indicate by check mark if the registrant has elected not to use the extended transition period for complying with any new or revised financial accounting standards provided pursuant to Section 13 (a) of the Exchange Act.
☐
Indicate by check mark whether the registrant is a shell company (as defined in Rule 12b-2 of the Exchange Act). Yes ☐ No ☒
The aggregate market value of the voting and non-voting common equity held by non-affiliates of the registrant (based on the closing price of the shares on the New York Stock Exchange on such date) as of the last business day of the registrant’s most recently completed second fiscal quarter was
$1,191.7 million
.
As of
February 23, 2018
, there were
74,784,529
shares of the registrant’s Class A common stock outstanding and
2,653,544
shares of the registrant’s Class B common stock outstanding.
Documents Incorporated by Reference
Selected portions of the Proxy Statement for the Annual Meeting of Shareholders, scheduled for
June 13, 2018
, have been incorporated by reference into Part III of this Form 10-K to the extent stated herein. Such proxy statement will be filed with the Securities and Exchange Commission within 120 days of the registrant’s fiscal year ended
December 31, 2017
.
————————————————————————————————————————————————————————
Evolent Health, Inc.
Table of Contents
|
Item
|
Page
|
|
|
1.
|
||
|
1A.
|
||
|
1B.
|
||
|
2.
|
||
|
3.
|
||
|
4.
|
||
|
5.
|
||
|
6.
|
||
|
7.
|
||
|
7A.
|
||
|
8.
|
||
|
9.
|
||
|
9A.
|
||
|
9B.
|
||
|
10.
|
||
|
11.
|
||
|
12.
|
||
|
13.
|
||
|
14.
|
||
|
15.
|
||
|
16.
|
||
|
E-1
|
||
Explanatory Note
In this Annual Report on 10-K, unless the context otherwise requires, “Evolent,” the “Company,” “we,” “our” and “us” refer to (1) prior to the completion of the Offering Reorganization described in “Part II - Item 8. Financial Statements and Supplementary Data - Note 4”, Evolent Health Holdings, Inc., our predecessor, (including its operating subsidiary, Evolent Health LLC), and (2) after giving effect to such reorganization, Evolent Health, Inc. and its consolidated subsidiaries. Evolent Health LLC, a subsidiary of Evolent Health, Inc. through which we conduct our operations, has owned all of our operating assets and substantially all of our business since inception. Evolent Health, Inc. is a holding company and its principal asset is all of the Class A common units of Evolent Health LLC. As described below under “Part II - Item 7. Management’s Discussion and Analysis of Financial Condition and Results of Operations - Results of Operations,” the financial statements of Evolent Health, Inc. for the year ended December 31, 2015, does not reflect a complete view of the operational results for that period as follows:
|
•
|
Evolent Health, Inc.'s results for 2015 reflect (i) the investment of Evolent Health, Inc.'s predecessor in its equity method investee, Evolent Health LLC, for the period from January 1, 2015, through June 3, 2015, and (ii) the consolidated results of Evolent Health LLC from the time of the Offering Reorganization, or June 4, 2015, through December 31, 2015.
|
For
more
information
about
the Offering Reorganization, refer to “Part II - Item 8. Financial Statements and Supplementary Data - Note 4.”
As used in this Annual Report on Form 10-K:
|
•
|
“2021 Notes” means the $125.0 million aggregate principal amount 2.00% Convertible Senior Notes due 2021, issued by Evolent Health, Inc. in December 2016;
|
|
•
|
“ACA” means the Patient Protection and Affordable Care Act;
|
|
•
|
“Accordion” means Accordion Health, Inc.;
|
|
•
|
“accountable care organizations,” or “ACOs,” means organizations of groups of doctors, hospitals and other health care providers which have come together voluntarily to provide coordinated care to their Medicare patients;
|
|
•
|
“Aldera” means Aldera Holdings, Inc.;
|
|
•
|
“ASU” means Accounting Standards Update;
|
|
•
|
“capitated arrangements” means health care payment arrangements whereby providers are paid a fixed amount of money per patient during a given period of time rather than on a per-service or per-procedure basis;
|
|
•
|
“CMS” means the Centers for Medicare and Medicaid Services;
|
|
•
|
“DGCL” means General Corporation Law of the State of Delaware;
|
|
•
|
“EMR” means electronic medical records;
|
|
•
|
“Evolent Health Holdings” means Evolent Health Holdings, Inc., the predecessor to Evolent Health, Inc.;
|
|
•
|
“Exchange Act” means the Securities Exchange Act of 1934, as amended;
|
|
•
|
“FASB” means the Financial Accounting Standards Board;
|
|
•
|
“FFS” means fee-for-service;
|
|
•
|
“founders” means the Advisory Board Company (“The Advisory Board”), and the University of Pittsburgh Medical Center (“UPMC”);
|
|
•
|
“FTC” means the United States Federal Trade Commission;
|
|
•
|
“GAAP” means United States of America generally accepted accounting principles;
|
|
•
|
“GPAC” means Georgia Physicians for Accountable Care, LLC;
|
|
•
|
“health insurance exchanges” means organizations that provide a marketplace for individuals to purchase standardized and government regulated health insurance policies;
|
|
•
|
“HIPAA” means The Health Insurance Portability and Accountability Act;
|
|
•
|
“HITECH Act” means The Health Information Technology for Economic and Clinical Health Act;
|
|
•
|
“Indenture” means the indenture between Evolent Health, Inc. and U.S. Bank National Association, as trustee, related to the 2.00% convertible senior notes due 2021, dated as of December 5, 2016;
|
|
•
|
“IPO” means our initial public offering as described in “Part II – Item 8. Financial Statements and Supplementary Data - Note 1;”
|
|
•
|
“NMHC” means New Mexico Health Connections;
|
|
•
|
“NOL” means net operating loss;
|
|
•
|
“Note” means notes to consolidated financial statements presented in “Part II – Item 8. Financial Statements and Supplementary Data;”
|
|
•
|
“NYSE” means the New York Stock Exchange;
|
|
•
|
“Offering Reorganization” means the reorganization undertaken in 2015 prior to our IPO. See “Part II – Item 8. Financial Statements and Supplementary Data - Note 4” for further details of the Offering Reorganization;
|
|
•
|
“partners” means our customers, unless we indicate otherwise or the context otherwise implies;
|
|
•
|
“Passport” means University Health Care, Inc. d./b/a/ Passport Health Plan;
|
i
|
•
|
“pharmacy benefit management,” or “PBM,” means the administration of prescription drug programs, including developing and maintaining a list of medications that are approved to be prescribed, contracting with pharmacies, negotiating discounts and rebates with drug manufacturers and processing prescription drug claim payments;
|
|
•
|
“PMPM” means per member per month;
|
|
•
|
“population health” means an approach to health care that seeks to improve the health of an entire human population;
|
|
•
|
“Private Placement” means Evolent Health, Inc.’s offering of the $125.0 million aggregate principal amount 2.00% Convertible Senior Notes due 2021, to qualified institutional buyers within the meaning of Rule 144A under the Securities Act of 1933, as amended;
|
|
•
|
“Ptolemy Capital” means Ptolemy Capital, LLC;
|
|
•
|
“RAF” means risk-adjustment factor;
|
|
•
|
“RSUs” means restricted stock units;
|
|
•
|
“SEC” means the Securities and Exchange Commission;
|
|
•
|
“Securities Act” means the Securities Act of 1933, as amended;
|
|
•
|
“Series B Reorganization” means our reorganization undertaken in 2013 in connection with a round of equity financing;
|
|
•
|
“third-party administration,” or “TPA,” means the processing of insurance claims or the administration of certain aspects of employee benefit plans for a separate entity;
|
|
•
|
“True Health” means True Health New Mexico, Inc., a wholly-owned subsidiary of Evolent Health, Inc.;
|
|
•
|
“TPG” means TPG Global, LLC and its affiliates including one or both of TPG Growth II BDH, LP and TPG Eagle Holdings, L.P.;
|
|
•
|
“TRA” means the Income Tax Receivables Agreement. See “Part II – Item 8. Financial Statements and Supplementary Data - Note 12” for further details of the Tax Receivables Agreement;
|
|
•
|
“UR” means utilization review;
|
|
•
|
“Valence Health” means Valence Health, Inc., excluding Cicerone Health Solutions, Inc.;
|
|
•
|
“value-based care” means a health care management strategy that is focused on high-quality and cost-effective care with the goals of promoting a healthy lifestyle, enhancing the patient experience and reducing preventable hospital admissions and emergency visits; and
|
|
•
|
“Vestica” means Vestica Healthcare, LLC.
|
FORWARD-LOOKING STATEMENTS - CAUTIONARY LANGUAGE
Certain statements made in this report and in other written or oral statements made by us or on our behalf are “forward-looking statements” within the meaning of the Private Securities Litigation Reform Act of 1995 (“PSLRA”). A forward-looking statement is a statement that is not a historical fact and, without limitation, includes any statement that may predict, forecast, indicate or imply future results, performance or achievements, and may contain words like: “believe,” “anticipate,” “expect,” “estimate,” “aim,” “predict,” “potential,” “continue,” “plan,” “project,” “will,” “should,” “shall,” “may,” “might” and other words or phrases with similar meaning in connection with a discussion of future operating or financial performance. In particular, these include statements relating to future actions, trends in our businesses, prospective services, future performance or financial results and the outcome of contingencies, such as legal proceedings. We claim the protection afforded by the safe harbor for forward-looking statements provided by the PSLRA.
These statements are only predictions based on our current expectations and projections about future events. Forward-looking statements involve risks and uncertainties that may cause actual results, level of activity, performance or achievements to differ materially from the results contained in the forward-looking statements. Risks and uncertainties that may cause actual results to vary materially, some of which are described within the forward-looking statements, include, among others:
|
•
|
the structural change in the market for health care in the United States;
|
|
•
|
uncertainty in the health care regulatory framework;
|
|
•
|
uncertainty in the public exchange market;
|
|
•
|
the uncertain impact of CMS waivers to Medicaid rules;
|
|
•
|
the uncertain impact the results of the 2018 congressional, state and local elections, as well as subsequent elections, may have on health care laws and regulations;
|
|
•
|
our ability to effectively manage our growth;
|
|
•
|
the significant portion of revenue we derive from our largest partners, and the potential loss, termination or renegotiation of customer contracts;
|
|
•
|
our ability to offer new and innovative products and services;
|
|
•
|
risks related to completed and future acquisitions, investments and alliances, including the acquisition of assets from NMHC and the acquisitions of Valence Health and Aldera, which may be difficult to integrate, divert management resources, result in unanticipated costs or dilute our stockholders;
|
|
•
|
certain risks and uncertainties associated with the acquisition of assets from NMHC and the acquisition of Valence Health, including future revenues may be less than expected, the timing and extent of new lives expected to come onto the platform may not occur as expected and the expected results of Evolent may not be impacted as anticipated;
|
ii
|
•
|
the growth and success of our partners, which is difficult to predict and is subject to factors outside of our control, including premium pricing reductions, selection bias in at-risk membership and the ability to control and, if necessary, reduce health care costs, particularly in New Mexico;
|
|
•
|
our ability to attract new partners;
|
|
•
|
the increasing number of risk-sharing arrangements we enter into with our partners;
|
|
•
|
our ability to recover the significant upfront costs in our partner relationships;
|
|
•
|
our ability to estimate the size of our target market;
|
|
•
|
our ability to maintain and enhance our reputation and brand recognition;
|
|
•
|
consolidation in the health care industry;
|
|
•
|
competition which could limit our ability to maintain or expand market share within our industry;
|
|
•
|
risks related to governmental payor audits and actions, including whistleblower claims;
|
|
•
|
our ability to partner with providers due to exclusivity provisions in our contracts;
|
|
•
|
restrictions and penalties as a result of privacy and data protection laws;
|
|
•
|
adequate protection of our intellectual property, including trademarks;
|
|
•
|
any alleged infringement, misappropriation or violation of third-party proprietary rights;
|
|
•
|
our use of “open source” software;
|
|
•
|
our ability to protect the confidentiality of our trade secrets, know-how and other proprietary information;
|
|
•
|
our reliance on third parties and licensed technologies;
|
|
•
|
our ability to use, disclose, de-identify or license data and to integrate third-party technologies;
|
|
•
|
data loss or corruption due to failures or errors in our systems and service disruptions at our data centers;
|
|
•
|
online security risks and breaches or failures of our security measures;
|
|
•
|
our reliance on Internet infrastructure, bandwidth providers, data center providers, other third parties and our own systems for providing services to our users;
|
|
•
|
our reliance on third-party vendors to host and maintain our technology platform;
|
|
•
|
our ability to contain health care costs, implement increases in premium rates on a timely basis, maintain adequate reserves for policy benefits or maintain cost effective provider agreements;
|
|
•
|
the risk of a significant reduction in the enrollment in our health plan;
|
|
•
|
our dependency on our key personnel, and our ability to attract, hire, integrate and retain key personnel;
|
|
•
|
the risk of potential future goodwill impairment on our results of operations;
|
|
•
|
our indebtedness and our ability to obtain additional financing;
|
|
•
|
our ability to achieve profitability in the future;
|
|
•
|
the requirements of being a public company;
|
|
•
|
our adjusted results may not be representative of our future performance;
|
|
•
|
the risk of potential future litigation;
|
|
•
|
our holding company structure and dependence on distributions from Evolent Health LLC;
|
|
•
|
our obligations to make payments to certain of our pre-IPO investors for certain tax benefits we may claim in the future;
|
|
•
|
our ability to utilize benefits under the tax receivables agreement described herein;
|
|
•
|
our ability to realize all or a portion of the tax benefits that we currently expect to result from past and future exchanges of Class B common units of Evolent Health LLC for our Class A common stock, and to utilize certain tax attributes of Evolent Health Holdings and an affiliate of TPG;
|
|
•
|
distributions that Evolent Health LLC will be required to make to us and to the other members of Evolent Health LLC;
|
|
•
|
our obligations to make payments under the tax receivables agreement that may be accelerated or may exceed the tax benefits we realize;
|
|
•
|
different interests among our pre-IPO investors, or between us and our pre-IPO investors;
|
|
•
|
the terms of agreements between us and certain of our pre-IPO investors;
|
|
•
|
the potential volatility of our Class A common stock price;
|
|
•
|
the potential decline of our Class A common stock price if a substantial number of shares are sold or become available for sale or if a large number of Class B common units are exchanged for shares of Class A common stock;
|
|
•
|
provisions in our second amended and restated certificate of incorporation and second amended and restated by-laws and provisions of Delaware law that discourage or prevent strategic transactions, including a takeover of us;
|
|
•
|
the ability of certain of our investors to compete with us without restrictions;
|
|
•
|
provisions in our second amended and restated certificate of incorporation which could limit our stockholders’ ability to obtain a favorable judicial forum for disputes with us or our directors, officers or employees;
|
|
•
|
our intention not to pay cash dividends on our Class A common stock;
|
|
•
|
our ability to remediate the material weakness in our internal control over financial reporting;
|
|
•
|
our expectations regarding the additional management attention and costs that will be required as we transition from an “emerging growth company” to a “large accelerated filer”; and
|
|
•
|
our lack of public company operating experience.
|
The risks included here are not exhaustive. Although we believe the expectations reflected in the forward-looking statements are reasonable, we cannot guarantee future results, level of activity, performance or achievements. More information on potential factors
iii
that could affect our businesses and financial performance is included in “Forward Looking Statements - Cautionary Language,” “Risk Factors” and “Management’s Discussion and Analysis of Financial Condition and Results of Operations” or similarly captioned sections of this Annual Report and the other period and current filings we make from time to time with the SEC. Moreover, we operate in a rapidly changing and competitive environment. New risk factors emerge from time to time, and it is not possible for management to predict all such risk factors.
Further, it is not possible to assess the effect of all risk factors on our businesses or the extent to which any factor, or combination of factors, may cause actual results to differ materially from those contained in any forward-looking statements. Given these risks and uncertainties, investors should not place undue reliance on forward-looking statements as a prediction of actual results. In addition, we disclaim any obligation to update any forward-looking statements to reflect events or circumstances that occur after the date of this report.
Market Data and Industry Forecasts and Projections
We use market data and industry forecasts and projections throughout this Annual Report on Form 10-K, and in particular in “Part I - Item 1. Business.” We have obtained the market data from certain publicly available sources of information, including publicly available independent industry publications and other third-party sources. Unless otherwise indicated, statements in this Annual Report on Form 10-K concerning our industry and the markets in which we operate, including our general expectations and competitive position, business opportunity and market size, growth and share, are based on information from independent industry organizations and other third-party sources (including industry publications, surveys and forecasts), data from our internal research and management estimates. Forecasts are based on industry surveys and the preparer’s expertise in the industry and there is no assurance that any of the forecasted amounts will be achieved. We believe the data that third parties have compiled is reliable, but we have not independently verified the accuracy of this information (other than information provided by our affiliates). Any forecasts are based on data (including third-party data), models and experience of various professionals and are based on various assumptions, all of which are subject to change without notice. While we are not aware of any misstatements regarding the industry data presented herein, forecasts, assumptions, expectations, beliefs, estimates and projections involve risks and uncertainties and are subject to change based on various factors, including those described under the heading “Forward-Looking Statements - Cautionary Language” and in “Part I - Item IA. Risk Factors.”
iv
Company Overview
We are a market leader in the new era of health care delivery and payment, in which leading health systems and physician organizations, which we refer to as providers, are taking on increasing clinical and financial responsibility for the populations they serve. Our purpose-built platform, powered by our technology, proprietary processes and integrated services, enables providers to migrate their economic orientation from FFS reimbursement to payment models that reward high-quality and cost-effective care, or value-based payment models. By partnering with providers to accelerate their path to value-based care, we enable our provider partners to expand their market opportunity, diversify their revenue streams, grow market share and improve the quality of the care they provide.
We believe we are pioneers in enabling health systems to succeed in value-based payment models. We were founded in 2011 by members of our management team, UPMC, an integrated delivery system based in Pittsburgh, Pennsylvania, and The Advisory Board, to enable providers to pursue a value-based business model and evolve their competitive position and market opportunity. We consider value-based care to be the necessary convergence of health care payment and delivery. We believe the pace of this convergence is accelerating, driven by price pressure in traditional FFS health care, a market environment that is incentivizing value-based care models and innovation in data and technology. We believe providers are positioned to lead this transition to value-based care because of their control over large portions of health care delivery costs, their primary position with consumers and their strong local brand.
Today, increasing numbers of providers are adopting value-based strategies, including contracting for capitated arrangements with existing insurance companies, governmental payers or large self-funded employers and managing their own captive health plans. Through value-based care, providers are in the early stages of transforming their role in health care as they attempt to defend their existing position and capture a greater portion of the more than two trillion dollars in annual health insurance expenditures. While there is not a universally agreed-upon definition of value-based care, we estimate that approximately 10% of health care payments were paid through value-based care programs as of June 2014, including through models created by systems like UPMC, Kaiser Permanente and Intermountain Healthcare, it is estimated that this number will grow to over approximately 50% by 2020. There were over 140 provider-owned health plans as of 2016 and this number continues to grow. The number of ACOs constructed to manage capitated or value-based arrangements with existing insurance companies or government payers grew to 838 as of January 2016.
We believe the transformation of the provider business model will require a set of core capabilities, including the ability to aggregate and understand disparate clinical and financial data, standardize and integrate technology into care processes, manage population health and build a financial and administrative infrastructure that capitalizes on the clinical and financial value it delivers. We provide an end-to-end, built-for-purpose, technology-enabled services platform for providers to transition their organization and business model to succeed in value-based payment models. In certain instances, we participate alongside our partners in risk-sharing arrangements whereby we share in a portion of the upside and downside performance of the value strategy. The core elements of our services platform include:
|
•
|
Integrated technology, proprietary process and financial and administrative services model
that enables the delivery of a high-performing population health organization, an aligned clinical delivery network to provide high-quality, coordinated care and an efficient administrative infrastructure to administer value-based care payment relationships.
|
|
◦
|
Identifi
®
, our proprietary technology,
delivers the data aggregation and stratification, proven value-based care content, EMR optimization and proprietary applications that allow providers to standardize the delivery of care and enable clinical and financial analytics.
|
|
◦
|
Our complementary value-based operations
are empowered and supported by Identifi®. Other elements include: (1) an aligned clinical delivery network to provide improved, coordinated care, (2) a high-performing population health organization that drives clinical outcomes and (3) integration of cost management solutions including PBM and patient risk scoring.
|
|
◦
|
Our comprehensive financial and administrative management services
enable providers to operate, manage and capitalize on a variety of value-based payment arrangements
|
|
•
|
A single point of integration between payers and the provider community
enables us to provide an indispensable single point of integration between a diverse set of payers that becomes more valuable over time as our services platform becomes the standard for value-based care contracting and operations.
|
In October 2016, we acquired Valence Health. Valence Health, based in Chicago, Illinois, was founded in 1996 and provides value- based administration, population health and advisory services with a particular focus on the Medicaid and pediatric markets. We believe that the acquisition of Valence Health is highly complementary to Evolent’s business and brings a number of strategic benefits including: (1) enhanced capabilities in value-based care administration and claims processing; (2) increased presence and experience in the Medicaid market and (3) additional scale to our platform in the form of approximately 1.0 million incremental lives under
1
operating agreements. On January 2, 2018, we completed the acquisition of assets related to NMHC’s commercial business. Following the completion of the transaction, we contributed the assets of NMHC’s commercial business to True Health, a wholly-owned subsidiary of the Company. True Health is a commercial health plan we operate in New Mexico that focuses on small and large businesses. We expect to be able to leverage our platform to support a value-based provider-centric model of care in the state.
We believe our business model provides strong visibility and aligns our partners’ incentives with our own. Through our financial and administrative management services, we capture value through a variety of value-based payment arrangements and, in certain circumstances, participate alongside our partners in risk-sharing arrangements. A large portion of our revenue is derived from our multi-year contracts, which are linked to the number of members that our partners are managing under a value-based care arrangement. This variable pricing model depends on the population being served as well as the number of services and technology applications that our partners utilize to advance their value-based care strategies and the number of members they are able to attract over time. We expect to grow with current partners as they increase membership in their existing value-based programs, through expanding the number of services we provide to our existing partners, by adding new partners and by capturing value through upside risk-sharing arrangements.
We believe we are in the early stages of capitalizing on these aligned operating partnerships. We believe our health system partners’ current value-based care arrangements represent a small portion of the health system’s total revenue each year. We believe the proportion of value-based care related revenues to total health system revenues will continue to grow, driven by continued price pressure in FFS, new government payment programs, growth in consumer-focused insurance programs, such as Medicare Advantage and managed Medicaid, and innovation in data and technology. Our business model benefits from scale, as we leverage our purpose-built technology-enabled services platform and centralized resources in conjunction with the growth of our partners’ membership base. These resources include our network development capabilities, health plan administrative services, PBM administration, technology development, clinical program development and data analytics and network development. While our absolute investment in our centralized resources and technologies will increase over time, we expect it will decrease as a percentage of revenue as we are able to scale this investment across a broader group of partners.
We manage our operations and allocate resources as a single reportable segment; however, we anticipate that we will report the results of True Health as a new reportable segment effective first quarter of 2018. See “Part II - Management’s Discussion and Analysis of Financial Condition and Results of Operations” and “Part II - Item 8 - Financial Statements and Supplementary Data” of this Annual Report on Form 10-K regarding revenue, profit and total assets of our single operating segment. All of our revenue is recognized in the United States and all of our long-lived assets are located in the United States.
Our Market Opportunity
For 2017, health care spending in the United States was projected to be more than $3.4 trillion. We believe that for the U.S. health care system to shift to a value-based care delivery model, providers must be an empowered part of the solution. Our comprehensive technology and services platform enables providers to capitalize on this transition, which we believe will position us to be at the forefront of the transformation to value-based care.
We believe our total market opportunity for our services platform is over $10.0 billion today based on health insurance expenditures, the total percentage of payments providers receive under value-based contracting, the size of the provider-sponsored health plan market and the fees we believe we can charge. We believe this opportunity will grow to over $45.0 billion by 2020 driven by health insurance expenditures increasing from approximately $2.1 trillion in 2013 to approximately $3.2 trillion in 2020, the total percentage of payments providers receive under value-based care models growing from 10% as of June 2014 to over 50% in 2020, and the provider-sponsored health plan market representing 15% of total health plan membership in 2020.
Our Solution
We provide an end-to-end, built-for-purpose, technology-enabled services platform for providers to succeed in value-based payment models.
Supporting Multiple Value-Based Care Models
Our services platform was built to support a diverse set of provider value-based care strategies. It provides the core technology and services necessary for all models pursued by providers.
Providers partner with us on at least one of three types of value-based contracting models, with most supporting at least the Direct to Employer model and one additional type of contracting arrangement.
|
•
|
Direct to Employer:
Manage costs for self-funded employers including a health system’s own employees
|
|
•
|
Payer contracts:
Value-based contracts with third-party payors (including commercial insurers and the government) that include a full spectrum of risk for pay for performance through full capitation arrangements
|
2
|
•
|
Health plan:
Launching a provider-owned health plan allows providers to control all of the health care insurance premiums, or premium dollars, across multiple populations, including commercial, Medicare and Medicaid.
|
Our partners benefit from a single platform that enables them to utilize our core suite of ongoing solutions, regardless of the size or type of value-based care models they are pursuing. Our services platform grows through health systems increasing membership in their existing value-based care payment model, as well as their pursuit of additional payer contracts and health plans. In certain cases, we participate alongside our partners through various risk-sharing arrangements, including loans, provision of letters of credit, equity investments, reinsurance arrangements and other extensions of capital.
Proprietary Technology - Identifi®
Identifi® is our proprietary technology system that aggregates and analyzes data, manages care workflows and engages patients. Identifi® links our processes with those of our provider partners and other third parties in order to create a connected clinical delivery ecosystem, stratify patient populations, standardize clinical work flows and enable high-quality, cost-effective care. The configurable nature and broad capabilities of Identifi® help enhance the benefits our partners receive from our Value-Based Operations and increase the effectiveness of our partners’ existing technology architecture. Highlights of the capabilities of Identifi® include the following:
|
•
|
Data and integration services
: Data from disparate sources, such as EMRs, and lab and pharmacy data, is collected, assembled, integrated and maintained in order to provide health care professionals with a holistic view of the patient.
|
|
•
|
Clinical and business content
: Clinical and business content is applied to the integrated data to create actionable information in order to optimize clinical and financial performance.
|
|
•
|
EMR integration
: Data and clinical insights from Identifi® are fed back into partner EMRs to improve both provider and patient satisfaction, create workflow efficiencies, promote clinical documentation and coding and provide clinical support at the point-of-care.
|
|
•
|
Applications
: A suite of cloud-based applications manages the clinical, financial and operational aspects of the value-based model. Our applications are individually purchased and scale with the clinical, financial and administrative needs of our provider partners. As additional capabilities are required through our services platform, they are often deployed as applications through Identifi®.
|
Value-Based Operations
Our Value-Based Operations are empowered and supported by Identifi®. Other elements include: (1) an aligned clinical delivery network to provide improved, coordinated care, (2) a high-performing population health organization that drives clinical outcomes and (3) integration of cost management solutions including PBM and patient risk scoring. We integrate change management processes and ongoing physician-led transformation into all value-based services to build engagement, integration and alignment within our partners in order to successfully deliver value-based care and sustain performance. We have standardized the processes described below and are able to leverage our expertise across our entire partner base. Through the technological and clinical integration we achieve, our solutions are delivered as ingrained components of our partner’s core operations rather than add-on solutions.
Delivery Network Alignment
We help our partners build the capabilities that are required to develop and maintain a coordinated and financially-aligned provider network that can deliver high-quality care necessary for value-based contracts. These capabilities include:
|
•
|
High-performance network
: Supporting the capabilities needed to build, maintain and optimize provider- and clinically-integrated networks.
|
|
•
|
Value compensation models
: Developing and supporting physician incentive payment programs that are linked to quality outcomes, payer shared savings arrangements and health plan performance.
|
|
•
|
Integrated specialty partnerships
: Supporting the technology-enabled strategies, analytics and staff needed to optimize network referral patterns.
|
Population Health Performance
Population Health Performance is an integrated suite of technology-enabled solutions that supports the delivery of quality care in an environment where a provider’s need to manage health has significantly expanded. These solutions include:
|
•
|
Clinical programs
: Care processes and ongoing clinical innovation that enables providers to target the right intervention at the right time for a given patient.
|
|
•
|
Specialized care team
: Multi-disciplinary team that is deployed telephonically from a centralized location or throughout a local market to operate clinical programs, engage patients and support physicians.
|
|
•
|
Patient engagement
: Integrated technologies and processes that enable outreach to engage patients in their own care process.
|
3
|
•
|
Quality and risk coding
: Engagement of physicians to identify opportunities to close gaps in care and improve clinical documentation efforts.
|
Integrated Cost and Revenue Management Solutions
We seek to integrate traditional cost and revenue management solutions such as PBM and risk adjustment to achieve greater adoption and performance than traditional payer-led models.
|
•
|
Pharmacy benefit management:
Our team of professionals support the drug component of providers’ plan offerings and bring national buying power and dedicated resources that are tightly integrated with the care delivery model. Differentiated from what we consider to be traditional PBMs, our solution is integrated into patient care and engages population health levers including generic utilization, provider management, and utilization management to reduce unit pharmacy costs.
|
|
•
|
Risk adjustment:
Our provider-led risk adjustment solution leverages Identifi® and integrates with partners’ EMRs to minimize disruption to the physician practice and maximize physician engagement. Our prospective and retrospective risk adjustment offerings utilize comprehensive data sources to capture medical history and sophisticated analytics and workflow tools with the aim of increasing the accuracy and efficiency of retrieval and documentation. We believe that through better provider engagement and intelligent use of data, our integrated model drives more accurate documentation of patient acuity, which optimizes reimbursement and improves the quality of care.
|
Financial and Administrative Management Services
We help providers assemble the complete infrastructure required to operate, manage and capitalize on a variety of value-based payment arrangements. These capabilities include:
|
•
|
Health plan services
: A comprehensive suite of services including third-party administration, enrollment and billing support, medical and utilization management, third-party payment and program integrity support and provider network contracting services. Other health plan related services include sales and marketing, product development, actuarial, and regulatory and compliance.
|
|
•
|
Risk management:
The capabilities needed to successfully manage risk from payers, including analysis, data and operational integration with payer processes, and ongoing performance management.
|
|
•
|
Analytics and reporting
: The ongoing and ad hoc analytic teams and reports required to measure, inform and improve performance, including population health analytics, market analytics, network evaluation, staffing models, physician effectiveness, clinical delivery optimization and patient engagement.
|
|
•
|
Leadership and management
: Our local and national talent assist our partners in effectively managing the performance of their value-based operations.
|
True Health
Following our acquisition of assets from NMHC on January 2, 2018, we own and operate True Health, a commercial health plan focused on serving small and large businesses across New Mexico, with approximately 20,000 members as of December 31, 2017. We expect to be able to leverage our platform to support a value-based provider-centric model of care in the state.
Competitive Strengths
We believe we are well-positioned to benefit from the transformations occurring in health care payment and delivery described above. We believe this new environment that rewards the better use of information to drive patient outcomes aligns with our platform, recent investments and other competitive strengths.
Early Innovator
We believe we are an innovator in the delivery of a comprehensive value-based care solution for providers. We were founded in 2011, ahead of the implementation of the ACA and before the rapid expansion of programs, such as Medicare ACOs or Medicare Bundled Payment Initiatives. Since our inception, we have invested a significant amount in our offerings.
Comprehensive End-to-End Solution
We provide an end-to-end, built-for-purpose, technology-enabled services platform for providers to transition their organization and business model to succeed in value-based payment models. We believe that offering a comprehensive and integrated solution which brings together population health management along with financial and administrative management on a single platform allows providers to accelerate their path to adoption of value-based care.
4
Integrated Proprietary Technology
Our integrated proprietary technology, Identifi®, allows us to deliver a connected delivery ecosystem, implement replicable clinical processes, scale our Value-Based Operations and capitalize on multiple types of value-based payment relationships. Identifi® supports the following capabilities:
|
•
|
Data aggregation from internal and external sources, such as EMRs and payer claims;
|
|
•
|
Algorithmic interpretation of aggregated data to stratify populations and identify high-risk patients;
|
|
•
|
Standardized workflows and dashboards to enable consistency across disparate clinical resources;
|
|
•
|
Applications to support value-based business models;
|
|
•
|
Patient outreach and engagement tools;
|
|
•
|
Integration into physician workflows to proactively engage high-priority patients; and
|
|
•
|
Reporting and tracking of clinical and financial outcomes.
|
We believe we are creating scaled benefits for our provider partners in areas such as data analytics, administrative services and care management. We expect Identifi® to enable us to deliver increasing levels of efficiency to our provider partners.
Provider-Centric Brand Identity
We believe our provider-centric brand identity and origins differentiate us from our competitors. We believe our solutions, which have built on capabilities developed at UPMC, resonate with potential partners seeking proven solutions from providers rather than large payers or non-health care businesses. Our analytical and clinical solutions are rooted in UPMC’s experience in growing a provider-led, integrated delivery network over the past 15 years, and growing to become one of the largest provider-owned health plans in the country. Our unique position allows for the sharing of data across multiple payers and care delivery integration regardless of payer, which we believe is not possible with payer led solutions.
Partnership-Driven Business Model
Our business model is predicated on strategic partnerships with leading providers that are attempting to evolve two of their most critical business functions: how they deliver care and how they are compensated for it. The partnership model enables cultural alignment, integration into the provider care delivery and payment work flow, contractual relationships and a cycle of clinical and cost improvement with shared financial benefit. In certain cases, we also agree to participate alongside our partners in risk-sharing or other support arrangements to increase our alignment of interests.
Proven Leadership Team
We have made a significant investment in building an industry-leading management team. Our senior leadership team has extensive experience in the health care industry and a track record of delivering measurable clinical, financial and operational improvement for health care providers and payers. Our chief executive officer, Frank Williams, was formerly the chief executive officer of The Advisory Board, where he oversaw the growth of the company and its IPO.
Growth Opportunities
Multiple Avenues for Growth with Our Existing, Embedded Partner Base
We have established a multi-year partnership model with multiple drivers of embedded growth through the following avenues:
|
•
|
growth in lives in existing covered populations;
|
|
•
|
partners expanding into new lines of value-based care to capture growth in new profit pools;
|
|
•
|
partners utilizing our additional capabilities, such as new Identifi® applications, PBM and TPA services; and
|
|
•
|
capturing value created through a variety of value-based arrangements by participating alongside our partners in upside risk sharing arrangements.
|
In addition to growth within our existing partner base, opportunities exist with providers utilizing our Blueprint, who sign short-term contracts under which we analyze the opportunities available to them in the value-based care market. From time to time, we also evaluate and consider pursuing opportunities to expand into businesses related to the services we currently provide.
5
Early Stages of a Rapidly Growing Transformational Addressable Market
We believe that our existing partners represent a small fraction of health systems that could benefit from our solutions. The transformation of the care delivery and payment model in the United States has been rapid, but it is still in the early stages. While approximately 10% of health care payments were paid through value-based care programs as of June 2014, it is estimated that this number will grow to over 50% by 2020.
Capitalize on Growth in Select Government-Driven Programs
Significant growth is projected in the number of people managed by government-driven programs in the United States over the next eight years. Specifically, CMS projects the number of Medicare beneficiaries to grow to approximately 63 million by 2020 from approximately 56 million at the end of 2016. We expect health systems to be direct beneficiaries of growth in Medicare Advantage and Medicaid Managed Care because those specific markets are well suited for value-based care. We believe that the growth in government programs will create an opportunity for health systems to capture a greater portion of the over two trillion dollars in annual health insurance expenditures. For example, in 2016, we launched our Next Generation ACO offering wherein, in addition to our services offering, we share in a portion of the upside and downside financial performance of the ACO through our fee structures with certain customers. The nature of our variable fee economic model enables us to benefit from this growth in government-managed lives. A significant portion of our revenues are attributable to government-driven programs, primarily comprised of Medicaid and, to a less significant extent, Medicare. This dynamic represents a change from prior periods and results in part from our acquisition of Valence Health as well as our strategic alliance with Passport. Since 2016, the Company has significantly expanded its presence in Medicaid and continues to look for additional ways to expand in the market, in part, by aligning itself with providers by participating in state mandated managed Medicaid initiatives. To this end, the Company has entered into a number of joint venture agreements to participate in various state mandated managed Medicaid initiatives.
Ability to Capture Additional Value through Delivering Clinical Results
We are capturing only a portion of the administrative dollars in the market through our current solution, which represent over 10% of total premium dollars. We believe there is a significant opportunity to capture a portion of the medical dollar over time—namely the remainder of the premium dollar which goes to medical expenses. As our health system partners continue to own a larger percentage of overall premiums, we have begun to pursue business models that allow us to participate in the medical savings through a variety of risk-sharing arrangements that align incentives to reduce costs and improve quality outcomes.
Expand Platform Offerings to Meet Evolving Market Needs
There are multiple business offerings that health systems may require to operate in a value-based care environment that we do not currently provide, including but not limited to:
|
•
|
PBM expansion to include additional specialty pharmacy management capabilities;
|
|
•
|
health savings account administration;
|
|
•
|
on-site or specialty clinic services; and
|
|
•
|
consumer engagement and digital outreach.
|
Selectively Pursue Strategic Acquisitions and Investments
We believe that the nature of our competitive landscape provides meaningful acquisition opportunities. Our industry is in the early stages of its life cycle and there are multiple firms attempting to capitalize on the transformation of the care delivery model and the various forms of new profit pools. We believe that providers will require an end-to-end solution and we believe we are well positioned to meet this demand by expanding the breadth of our offerings through not only organic growth, but also the acquisition of niche providers and non-core portions of larger enterprises. From time to time, we may also pursue acquisition and investment opportunities of businesses related to services we currently provide or that are complementary to our technical capabilities. As an example of executing on our strategy, in February 2016, we entered into a strategic alliance with a leading nonprofit community-based and provider-sponsored health plan administering Kentucky Medicaid and federal Medicare Advantage benefits. This alliance created the Medicaid Center of Excellence, which offers centralized services for provider-led Medicaid health plans. In addition, in the fourth quarter of 2016, we completed the acquisitions of Valence Health and Aldera, expanding our capabilities and expertise in the Medicaid and pediatric markets, as well as the provision of certain third party administration services. On January 2, 2018, we completed the acquisition of assets related to NMHC’s commercial business. Following the completion of the transaction, we contributed the assets of NMHC’s commercial business to True Health. True Health is a commercial health plan we operate in New Mexico that focuses on small and large businesses. We expect to be able to leverage our platform to support a value-based provider-centric model of care in the state.
6
Sales and Marketing
We market and sell our services to providers throughout the United States. Our dedicated sales team targets provider opportunities for our services platform solutions. Our sales team works closely with our leadership team and subject matter experts to foster long-term relationships with our provider partner’s leadership and board of directors given the nature of our partnerships. Our dedicated business development team works closely with our partners to identify additional service opportunities that can be offered from our services platform on a continuous basis.
Partner Relationships
Our business model is predicated on strategic partnerships with leading providers that are attempting to evolve two of their most critical business functions: how they deliver care and how they are compensated for it. The partnership model enables cultural alignment, integration into the provider care delivery and payment work flow, contractual relationships and a cycle of clinical and cost improvement with shared financial benefit.
We have sought to partner with leading providers in sizable markets, which we believe creates a growth cycle that benefits from the secular transition to value-based care. By helping these systems lower clinical and administrative costs, we believe we are positioning them to offer a low cost, effective care setting to payers, employers and consumers, which enables them to capture greater market share. As providers have succeeded in lowering costs and growing market share, this enables them to increase their value-based offerings. By virtue of our business model, we benefit from our partners’ growth.
As of
December 31, 2017
, we had contractual relationships with over 25 operating partners and a significant portion of our revenue is concentrated with a single partner, Passport, which comprised
20.6%
of our revenue for 2017. As of
December 31, 2017
, our average contractual relationship with our operating partners was approximately
four
years, with an average of
1.8
years of performance remaining per contract. The contracts governing the relationships with our operating partners include key terms which may include the period of performance, revenue rates, advanced billing terms, service level agreements, termination clauses, exclusivity clauses and right of first refusal clauses.
Typically, the terms of these contracts provide for a monthly payment that is calculated based on a specified rate multiplied by the number of members that our partners are managing under a value-based care arrangement. The specified rate varies depending on which market-facing solutions the partner has adopted and the number of services and technology applications they are utilizing. Typically, the terms of these contracts allow for advance billing of our partners. In some of our contracts, a defined portion of the revenue is at risk and can be refunded to the partner if certain service levels are not attained. We monitor our compliance with the service levels to determine whether a refund will be provided and record an estimate of these refunds.
Although the revenue from our contracts is not guaranteed because certain of our contracts are terminable for convenience by our partners after a notice period has passed, certain partners would be required to pay us a termination fee in certain circumstances. Termination fees and the related notice period in certain of our contracts are determined based on the scope of the market-facing solutions that the partner has adopted and the duration of the contract. Most of our contracts include cure periods for certain breaches, during which time we may attempt to resolve any issues that would trigger a partner’s ability to terminate the contract. However, certain of our contracts are also terminable immediately on the occurrence of certain events. For example, some of our contracts may be terminated by the partner if we fail to achieve target performance metrics over a specified period. Certain of our contracts may be terminated by the partner immediately following repeated failures by us to provide specified levels of service over periods ranging from six months to more than a year. Certain of our contracts may be terminated immediately by the partner if we lose applicable licenses, go bankrupt, lose our liability insurance, become insolvent, file for bankruptcy or receive an exclusion, suspension or debarment from state or federal government authorities. The loss, termination or renegotiation of any contract could negatively impact our results. In addition, as our partners’ businesses respond to market dynamics and financial pressures, and as our partners make strategic business decisions in respect of the lines of business they pursue and programs in which they participate, we expect that certain of our partners will, from time to time, seek to restructure their agreements with us.
The contracts often contain exclusivity or other restrictive provisions, which may limit our ability to partner with or provide services to other providers or purchase services from other vendors within certain time periods and in certain geographic areas. The exclusivity and other restrictive provisions are negotiated on an individual basis and vary depending on many factors, including the term and scope of the contract. The time limit on these exclusivity and other restrictive provisions typically corresponds to the term of the contract. These exclusivity or other restrictive provisions often apply to specific competitors of our health system partners or specific geographic areas within a particular state or an entire state, subject to certain exceptions, including, for example, exceptions for employer plan entities that have operations in the restricted geographic areas but that are headquartered elsewhere. Accordingly, these exclusivity clauses may prevent us from entering into relationships with certain potential partners.
The contracts with our partners impose other obligations on us. For example, we typically agree that all services provided under the partner contract and all employees providing such services will comply with our partner’s policies and procedures. In addition, in
7
most instances, we have agreed to indemnify our partners against certain third-party claims, which may include claims that our services infringe the intellectual property rights of such third parties.
Competition
The market for our products and services is fragmented, competitive and characterized by rapidly evolving technology standards, customer needs and the frequent introduction of new products and services. Our competitors range from smaller niche companies to large, well-financed and technologically-sophisticated entities.
We compete on the basis of several factors, including breadth, depth and quality of product and service offerings, ability to deliver clinical, financial and operational performance improvement through the use of products and services, quality and reliability of services, ease of use and convenience, brand recognition and the ability to integrate services with existing technology. We also compete on the basis of price.
Our health plan, True Health, also competes with local and regional health care benefits plans, health care benefits and other plans sponsored by large commercial health care benefit insurance companies, health system owned health plans, new entrants into the marketplace and numerous for-profit and not-for-profit organizations. For additional information related to competition in our health plan business, see “Part I - Item 1A. Risk Factors - Risks relating to our business and industry.”
Health Care and Insurance Laws and Regulations
Our business is subject to extensive, complex and rapidly changing federal and state laws and regulations. Various federal and state agencies have discretion to issue regulations and interpret and enforce health care laws. While we believe we comply in all material respects with applicable health care and insurance laws and regulations, these regulations can vary significantly from jurisdiction to jurisdiction, and interpretation of existing laws and regulations may change periodically. Federal and state legislatures also may enact various legislative proposals that could materially impact certain aspects of our business. The following are summaries of key federal and state laws and regulations that impact our operations:
Health Care Reform
In March 2010, the ACA and the Health Care and Education Reconciliation Act of 2010, which we refer to, collectively, as health care reform, was signed into law. Health care reform contains provisions that have changed and will continue to change the health insurance industry in substantial ways. For example, health care reform includes a mandate that employers with over 50 employees offer their employees group health insurance coverage or face tax penalties; prohibitions against insurance companies that offer Individual Major Medical plans using pre-existing health conditions as a reason to deny an application for health insurance; medical loss ratio requirements that require each health insurance carrier to spend a certain percentage of their premium revenue on reimbursement for clinical services and activities that improve health care quality; establishment of health insurance exchanges to facilitate access to, and the purchase of, health insurance; and subsidies and cost-sharing credits to make health insurance more affordable for those below certain income levels.
Health care reform amended various provisions in many federal laws, including the Code, the Employee Retirement Income Security Act of 1974 and the Public Health Services Act. Health care reform is being implemented by the Department of Health and Human Services, the Department of Labor and the Department of Treasury. Most of the ACA regulations became effective on January 1, 2014.
The current administration and Congress have been seeking, and we expect they will continue to seek, legislative and regulatory changes to health care laws and regulations, including repeal and replacement of certain provisions of the ACA. In January 2017, President Trump issued an executive order titled “Minimizing the Economic Burden of the Patient Protection and Affordable Care Act Pending Repeal.” The order directed agencies with authorities and responsibilities under the ACA to waive, defer, grant exemptions from, or delay the implementation of any provision of the ACA that would impose a fiscal or regulatory burden on states, individuals, health care providers, health insurers, or manufacturers of pharmaceuticals or medical devices. Since January 2017, Congressional efforts to repeal and replace the ACA have been unsuccessful. However, the individual mandate was repealed by Congress as part of the Tax Cuts and Jobs Act (the “Tax Act”) that was signed into law on December 22, 2017. We are continuing to evaluate the impact of the repeal of the individual mandate on our business. The impact of the repeal and the executive order as well as the future of the ACA remain unclear. Further, the public exchange market is currently experiencing significant disruptions, as many insurers have incurred significant losses and announced their withdrawal from health insurance exchanges in a number of states. Because of the continued uncertainty about the implementation of the ACA, including the timing of and potential for further legal challenges, repeal or amendment of that legislation and future of the health insurance exchanges, we cannot quantify or predict with any certainty the likely impact of the ACA on our business, financial condition, operating results and prospects. In addition, Congress, state legislatures and third-party payors may continue to review and assess alternative health care delivery and payment systems and may in the future propose and adopt legislation or policy changes or implementations effecting additional fundamental changes in the health care delivery system, including with respect to Medicare and Medicaid programs. We cannot assure you as to the ultimate content, timing,
8
or effect of any changes, nor is it possible at this time to estimate the impact of any such potential legislation or changes. Health care reform has resulted in profound changes to the individual health insurance market and our business, and we expect these changes to continue.
Stark Law
We are subject to federal and state “self-referral” laws. The Stark Law is a federal statute that prohibits physicians from referring patients for items covered by Medicare or Medicaid to entities with which the physician has a financial relationship, unless that relationship falls within a specified exception. The Stark Law is a strict liability statute and is violated even if the parties did not have an improper intent to induce physician referrals. The Stark Law is relevant to our business because we frequently organize arrangements of various kinds under which (a) physicians and hospitals jointly invest in and own ACOs, clinically integrated networks and other entities that engage in value-based contracting with third-party payors or (b) physicians are paid by hospitals or hospital affiliates for care management, medical or other services related to value-based contracts. We evaluate when these investment and compensation arrangements create financial relationships under the Stark Law and design structures that are intended to satisfy exceptions under the Stark Law or Medicare Shared Savings Program waiver.
Anti-kickback Laws
In the United States, there are federal and state anti-kickback laws that generally prohibit the payment or receipt of kickbacks, bribes or other remuneration in exchange for the referral of patients or other health-related business. The United States federal health care programs’ Anti-Kickback Statute makes it unlawful for individuals or entities knowingly and willfully to solicit, offer, receive or pay any kickback, bribe or other remuneration, directly or indirectly, in exchange for or to induce the referral of an individual to a person for the furnishing or arranging for the furnishing of any item or service for which payment may be made in whole or in part under a federal health care program or the purchase, lease or order, or arranging for or recommending purchasing, leasing or ordering, any good, facility, service, or item for which payment may be made in whole or in part under a federal health care program. Penalties for violations include criminal penalties and civil sanctions such as fines, imprisonment and possible exclusion from federal health care programs. The Anti-Kickback Statute raises similar compliance issues as the Stark Law. While there are safe harbors under the Anti-Kickback Statute, they differ from the Stark Law exceptions in that compliance with a safe harbor is not mandatory. If an arrangement falls outside the safe harbors, it must be evaluated on its specific facts to assess whether regulatory authorities might take the position that one purpose of the arrangement is to induce referrals of federal health care program business. Our business arrangements implicate the Anti-Kickback Statute for the same reasons they raise Stark Law issues. We evaluate whether investment and compensation arrangements being developed by us on behalf of hospital partners fall within one of the safe harbors or Medicare Shared Savings Program waiver. If not, we consider the factors that regulatory authorities are likely to consider in attempting to identify the intent behind such arrangements. We also design business models that reduce the risk that any such arrangements might be viewed as abusive and trigger Anti-Kickback Statute claims.
Antitrust Laws
The antitrust laws are designed to prevent competitors from jointly fixing prices. However, competitors often work collaboratively in order to reduce the cost of health care and improve quality. To balance these competing goals, antitrust enforcement agencies have established a regulatory framework under which claims of per se price fixing can be avoided if a network of competitors (such as an ACO or clinically integrated network) is financially or clinically integrated. In this context, we evaluate the tests for financial and clinical integration that would be applied to the provider networks that we are helping to create and support, including the nature and extent of any financial risk that must be assumed to be deemed financially integrated and the types of programs that must be implemented to achieve clinical integration. However, even if a network is integrated, it is still subject to a “rule of reason” test to determine whether its activities are, on balance, pro-competitive. The key factors in the rule of reason analysis are market share and exclusivity. We focus on network size, composition and contracting policies to strengthen our partners’ position that their networks meet the rule of reason test.
Federal Civil False Claims Act and State False Claims Laws
The federal civil False Claims Act imposes liability on any person or entity who, among other things, knowingly presents, or causes to be presented, a false or fraudulent claim for payment by a federal health care program. The “qui tam” or “whistleblower” provisions of the False Claims Act allow a private individual to bring actions on behalf of the federal government alleging that the defendant has submitted a false claim to the federal government, and to share in any monetary recovery. Our activities relating to the manner in which we sell and market our services, including our provider-led risk adjustment solution, may be subject to scrutiny under these laws.
HIPAA, Privacy and Data Security Regulations
By processing data on behalf of our partners, we are subject to specific compliance obligations under privacy and data security-related laws, including HIPAA, the HITECH Act and related state laws. We are also subject to federal and state security breach notification
9
laws, as well as state laws regulating the processing of protected personal information, including laws governing the collection, use and disclosure of social security numbers and related identifiers.
The regulations that implement HIPAA and the HITECH Act establish uniform standards governing the conduct of certain electronic health care transactions and protecting the security and privacy of individually identifiable health information maintained or transmitted by health care providers, health plans and health care clearinghouses, all of which are referred to as “covered entities,” and their “business associates” (which includes anyone who performs a service on behalf of a covered entity involving the use or disclosure of protected health information and is not a member of the covered entity’s workforce). Our partners’ health plans generally will be covered entities, and, as their business associate, they may ask us to contractually comply with certain aspects of these standards by entering into requisite business associate agreements.
HIPAA Health Care Fraud Standards
The HIPAA health care fraud statute created a class of federal crimes, including health care fraud and false statements relating to health care matters, known as the “federal health care offenses.” The HIPAA health care fraud statute prohibits, among other things, executing a scheme to defraud any health care benefit program, while the HIPAA false statements statute prohibits, among other things, concealing a material fact or making a materially false statement in connection with the payment for health care benefits, items or services. Entities that are found to have aided or abetted in a violation of the HIPAA federal health care offenses are deemed by statute to have committed the offense and are punishable as a principal.
Medicare and Medicaid
Medicare is a federal program that provides hospital and medical insurance benefits to persons age 65 and over, as well as certain other individuals. Medicaid programs are jointly funded by federal and state governments and are administered by states under an approved plan that provides hospital and other health care benefits to qualifying individuals. As we increase our exposure to Medicare and Medicaid businesses through new and existing partners, including through our strategic alliance with Passport as well as our acquisition of Valence Health, we increase our exposure to changes in government policy with respect to and regulation of the Medicaid and Medicare programs in which we and our partners participate. We are subject to regulation by both CMS and state agencies in respect of certain services we provide relating to Medicaid and Medicare programs.
Because some of our partners are participants in governmental programs, our services have in the past and may again in the future be subject to periodic surveys and audits by governmental entities or contractors for compliance with Medicare and other standards and requirements. As a result of surveys or audits, CMS may seek premium and other refunds, prohibit us from continuing to market or enroll members in plans, exclude us from participating in one or more programs or institute other sanctions against us if we fail to comply with CMS regulations or Medicare contractual requirements.
The regulations and requirements applicable to us and other participants in Medicaid and Medicare programs are complex and subject to change. In January 2018, CMS released guidance to states on how to design and test programs that require “community engagement” as a condition to receiving Medicaid benefits. Shortly thereafter, CMS approved Kentucky’s application for a waiver to Medicaid’s rules to impose such a requirement. As a result, we expect the Kentucky waiver to reduce Passport’s membership in 2018. Consequently, this could have an impact on our revenues from Passport, which represented 20.6% of our revenue in 2017. Other states have applied for similar waivers from CMS and we cannot quantify or predict with any certainty the likely impact of such waivers on our business, financial condition, operating results and prospects.
Following the 2018 congressional, state and local elections, Congress and state and local legislatures may propose and adopt legislation or policy changes or implementations effecting additional fundamental changes with respect to Medicare and Medicaid programs. Such changes in the law, or new interpretations of existing laws, may have a significant impact on our methods and costs of doing business. Additionally, expansion of enforcement activity could adversely affect our business and financial condition. Going forward, we expect CMS and Congress to continue to closely scrutinize each component of the Medicare program as well as modify the terms and requirements of the program. It is not possible to predict the outcome of this Congressional or regulatory activity, either of which could adversely affect us. Similarly, we cannot predict whether pending or future federal or state legislation or court proceedings will change various aspects of the Medicaid and Medicare programs, nor can we predict the impact those changes will have on our business operations or financial results, but the effects could be materially adverse.
Consumer Protection Laws
Federal and state consumer protection laws are being applied increasingly by the FTC, Federal Communications Commission and states’ attorneys general to regulate the collection, use, storage and disclosure of personal or patient information, through websites or otherwise, and to regulate the presentation of website content and to regulate direct marketing, including telemarketing and telephonic communication. Courts may also adopt the standards for fair information practices promulgated by the FTC, which concern consumer notice, choice, security and access.
10
State Privacy Laws
In addition to federal regulations issued under HIPAA, some states have enacted privacy and security statutes or regulations, which we refer to as state privacy laws, that govern the use and disclosure of a person’s medical information or records and, in some cases, are more stringent than those issued under HIPAA. These state privacy laws include regulation of health insurance providers and agents, regulation of organizations that perform certain administrative functions, such as UR, or TPA, issuance of notices of privacy practices and reporting and providing access to law enforcement authorities. In those cases, it may be necessary to modify our operations and procedures to comply with these more stringent state privacy laws. If we fail to comply with applicable state privacy laws, we could be subject to additional sanctions.
Other State Laws
State insurance laws require licenses for certain health plan administrative activities, including TPA licenses for the processing, handling and adjudication of health insurance claims and UR agent licenses for providing medical management services. Given the nature and scope of services that we provide to certain partners, we are required to maintain TPA and UR agent licenses and ensure that such licenses are in good standing on an annual basis. In addition, laws in many states govern prompt payment obligations for health care services. These laws generally define claims payment processes and set specific time frames for submission, payment, and appeal steps. Failure to meet these requirements and time frames may result in rejection, delay of claims and possible interest and regulatory penalties. The Company has also established a captive insurance company under the laws of the State of Vermont and is subject to the captive insurance laws of that state.
Insurance subsidiaries must be licensed by and are subject to the regulations of the jurisdictions in which they conduct business. For example, True Health is regulated under specific New Mexico laws and regulations and indirectly affected by other health care-related laws and regulations. State regulations mandate minimum capital or restricted cash reserve requirements.
Employees
As of
December 31, 2017
, we had approximately
2,600
employees. None of our employees are represented by a labor union, and we are not a party to any collective bargaining agreements. We consider our employee relations to be good.
Intellectual Property
Our continued growth and success depends, in part, on our ability to protect our intellectual property and proprietary technology, including our Identifi® software. We primarily protect our intellectual property through a combination of copyrights, trademarks and trade secrets, intellectual property licenses and other contractual rights (including confidentiality, non-disclosure and assignment-of-invention agreements with our with employees, independent contractors, consultants and companies with which we conduct business).
However, these intellectual property rights and procedures may not prevent others from creating a competitive online presence or otherwise competing with us. We may be unable to obtain, maintain and enforce the intellectual property rights on which our business depends, and assertions by third parties that we violate their intellectual property rights could have a material adverse effect on our business, financial condition and results of operations. For additional information related to our intellectual property position see “Part I - Item 1A. Risk Factors - Risks relating to our business and industry.”
Research and Development
Our research and development expenditures primarily consist of our strategic investment in enhancing the functionality and usability of our software, Identifi® and developing programs and processes to maximize care delivery efficiency and effectiveness. We also capitalize software development costs related to Identifi®. Our research and development expenditures and capitalized software development costs also include the suite of products developed by Accordion, Valence Health and Aldera.
We expensed
$17.2 million
,
$11.1 million
and
$5.8 million
in research and development costs for the years ended
December 31, 2017
,
2016
and
2015
, respectively. We capitalized
$27.1 million
,
$15.0 million
and
$6.4 million
of internal-use software development costs for the years ended
December 31, 2017
,
2016
and
2015
, respectively.
11
Organizational Structure
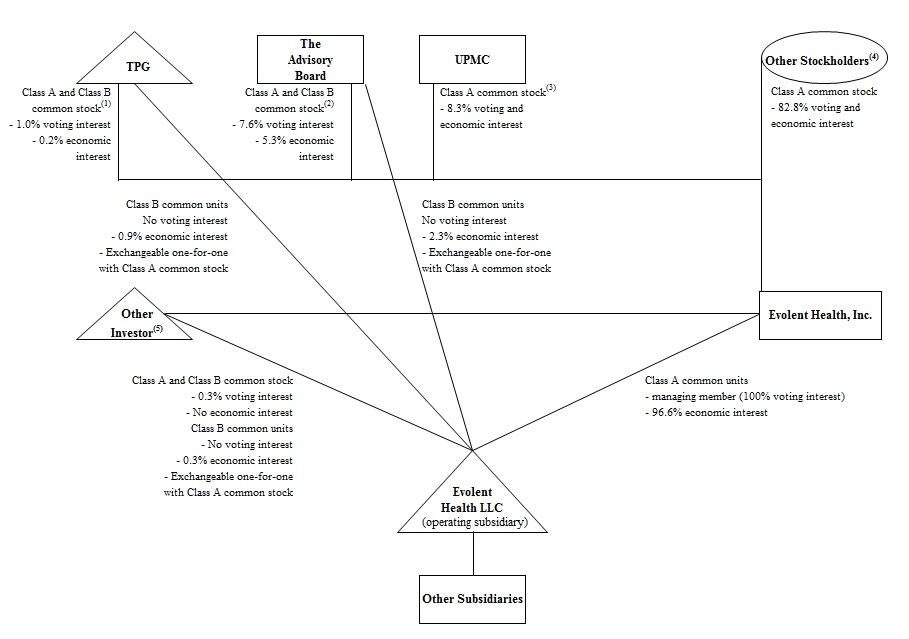
(1) As of December 31, 2017, TPG beneficially owned approximately 0.2% of our outstanding Class A common stock and approximately 24.9% of our outstanding Class B common stock. David Bonderman and James G. Coulter are sole shareholders of TPG Growth II Advisors, Inc. and therefore may be deemed to share voting and dispositive power with respect to, and be the beneficial owners of, the shares of Class A and Class B common stock beneficially owned by TPG.
(2) As of December 31, 2017, The Advisory Board beneficially owned approximately 5.5% of our outstanding Class A common stock and approximately 66.8% of our outstanding Class B common stock. The board of directors of The Advisory Board has voting and dispositive power over the shares of Class A common stock and Class B common stock held by The Advisory Board. The members of such board of directors disclaim beneficial ownership with respect to such shares.
(3) The board of directors of UPMC has voting and dispositive power over the shares of Class A common stock held by UPMC. The members of such board of directors disclaim beneficial ownership with respect to such shares.
(4)
Includes public stockholders and employees/partners.
(5) Such shares are held by Ptolemy. Michael R. Stone has voting and dispositive power over the shares of Class B common stock held by Ptolemy.
Corporate Information
Evolent began business operations in August 2011. Evolent Health, Inc., the registrant, was incorporated in the State of Delaware in December 2014. We completed our IPO in June 2015 and our Class A common stock is listed on the NYSE under the symbol “EVH.” Evolent Health, Inc. is a holding company whose principal asset is all of the Class A common units it holds in Evolent Health LLC, and its only business is to act as sole managing member of Evolent Health LLC. Substantially all of our operations are conducted through Evolent Health LLC and its consolidated subsidiaries and, subsequent to the Offering Reorganization, the financial results of Evolent Health LLC are consolidated in the financial statements of Evolent Health, Inc. For more information regarding the Offering Reorganization, see “Part II - Item 8. Financial Statements and Supplementary Data - Note
4
.”
Available Information
We file annual, quarterly and current reports, proxy statements and other documents with the SEC under the Exchange Act. The public may read and copy any materials that we file with the SEC at the SEC’s Public Reference Room at 100 F Street, NE,
Washington, DC 20549. The public may obtain information on the operation of the Public Reference Room by calling the SEC at
1-800-SEC-0330. Also, the SEC maintains a website that contains reports, proxy and information statements and other information regarding issuers, including Evolent, that file electronically with the SEC. The public can obtain any documents that we file with the SEC at www.sec.gov.
12
We also make available, free of charge, on or through our website, ir.evolenthealth.com, our Annual Report on Form 10-K, Quarterly
Reports on Form 10-Q, Current Reports on Form 8-K and amendments to those reports filed or furnished pursuant to Section 13(a) or 15(d) of the Exchange Act as soon as reasonably practicable after we electronically file such material with, or furnish it to, the SEC. Except as specifically indicated otherwise, the information available on our website and the SEC’s website is not and shall not be deemed a part of this Annual Report on Form 10-K.
Executive Officers of the Registrant
Our executive officers as of
March 1, 2018
, were as follows:
|
Name
|
Age
(1)
|
Position
|
||
|
Frank Williams
|
51
|
Chief Executive Officer and Director
|
||
|
Seth Blackley
|
39
|
President
|
||
|
Nicholas McGrane
|
49
|
Chief Financial Officer
|
||
|
Tom Peterson
|
47
|
Chief Operating Officer
|
||
|
Jonathan Weinberg
|
50
|
General Counsel
|
||
|
Steve Wigginton
|
51
|
Executive Vice President
|
||
|
Lydia Stone
|
42
|
Chief Accounting Officer and Corporate Controller
|
||
(1)
Age shown is as of
March 1, 2018
.
Frank Williams
is the Chief Executive Officer, co-founder and member of the Board of Directors of Evolent. Prior to Evolent, he served as the Chief Executive Officer of The Advisory Board from June 2001 to September 2008, and as its Chairman from September 2008 to August 2011. Previously, Mr. Williams also served as President of MedAmerica OnCall, President of Vivra Orthopedics and as a management consultant for Bain & Co. He currently serves on the boards of Business Talent Group and Peer Health Exchange. Mr. Williams holds a bachelor of arts with high honors in political economies of industrial societies from the University of California, Berkeley, and a master of business administration from Harvard Business School.
Seth Blackley
has served as our President since August 2011. Prior to co-founding the company, Mr. Blackley was the Executive Director of Corporate Development and Strategic Planning at The Advisory Board from May 2004 to August 2011. Mr. Blackley began his career as an analyst in the Washington, D.C. office of McKinsey & Company. Mr. Blackley holds a bachelor of arts degree in business from The University of North Carolina at Chapel Hill, and a master of business administration from Harvard Business School.
Nicholas McGrane
has served as our Chief Financial Officer since October 2014. Prior to joining Evolent, Mr. McGrane was Managing Director with Riverside Management Group from July 2013 to October 2014. Prior to joining Riverside Management Group, Mr. McGrane was an independent consultant for clients including Evolent Health LLC. He served as Interim Chief Executive Officer and Interim President of Sbarro Inc. from July 2010 to February 2012. Sbarro Inc. was a portfolio company of MidOcean Partners, where Mr. McGrane held various roles, including Managing Director, from 1997 to 2012. Mr. McGrane holds a bachelor of science degree in management from Trinity College Dublin and a master of business administration from Harvard Business School.
Tom Peterson
has served as our Chief Operating Officer since August 2011. From June 2009 to August 2011, Mr. Peterson was Chief Executive Officer of Inflect Advisors. From November 1999 to 2009, Mr. Peterson held executive roles with The Advisory Board. Prior to The Advisory Board, Mr. Peterson was Vice President of HealthSouth Corporation from January 1996 to November 1999. Mr. Peterson holds a bachelor of arts in government from Harvard University and a masters degree in mental health counseling from George Washington University.
Jonathan Weinberg
has served as our General Counsel since January 2014. Prior to joining Evolent, Mr. Weinberg was a Senior Vice President and Deputy General Counsel for Coventry Health Care, Inc. from 2002 to 2013, and was in charge of the day-to-day management of the legal department as well as the company’s risk management department. Prior to joining Coventry, Mr. Weinberg was an associate and then partner at Epstein Becker and Green, P.C. in the firm’s health care practice, specializing in managed care issues from 1992 to 2002. Mr. Weinberg received his bachelor of arts in history and political science from the University of Wisconsin-Madison and his juris doctorate from the Catholic University of America.
Steve Wigginton
joined Evolent in 2012 and has held several senior executive positions, including Chief Development Officer and Executive Vice President. Prior to joining Evolent, Mr. Wigginton served as the founding Chief Executive Officer of Medley Health, a venture-backed technology and services provider for physician practices, from 2010 to 2012. From 2005 to 2010, Mr. Wigginton was the President of Health Integrated, a provider of health management. Prior to Health Integrated, Mr. Wigginton was Executive Vice
13
President of Neoforma from 2000 to 2004. Mr. Wigginton joined Neoforma’s executive team after its acquisition of Pharos Technologies–a company he co-founded. Mr. Wigginton holds a bachelor of science in finance from Indiana University and a master of business administration from the Kelley School of Business, Indiana University.
Lydia Stone
has served as our Controller since May 2013. She was appointed Principal Accounting Officer in September 2015, and Chief Accounting Officer in August 2017. Prior to joining Evolent, Ms. Stone was a Senior Manager at BAE Systems, Inc. from November 2010 to May 2013, and was a manager at Ernst & Young LLP in its Assurance practice from August 2004 to November 2010. Ms. Stone received her master’s degree in accounting from the College of William & Mary. Ms. Stone is a Certified Public Accountant in the Commonwealth of Virginia.
Risk factors
Our business, operations and financial position are subject to various risks. You should carefully consider the risks and uncertainties described below, together with all of the other information in this Annual Report on Form 10-K, including the audited annual financial statements and notes thereto included elsewhere in this Form 10-K, when evaluating your investment in our securities. The risks and uncertainties described below are those that we currently believe may materially affect the company. Additional risks and uncertainties of which we are unaware or that we currently deem immaterial also may become important factors that affect the Company. If any of the following risks are realized, our business, financial condition, operating results and prospects could be materially and adversely affected. In that event, the price of our securities could decline, and you could lose part or all of your investment. Some statements in this Form 10-K, including statements in the following risk factors, constitute forward-looking statements. Please refer to the section entitled “Forward-Looking Statements - Cautionary Language.”
Risks relating to our business and industry
The market for health care in the United States is in the early stages of structural change and is rapidly evolving, which makes it difficult to forecast demand for our products and services.
The market for health care in the United States is in the early stages of structural change and is rapidly evolving. Our future financial performance will depend in part on growth in this market and on our ability to adapt to emerging demands of this market. It is difficult to predict with any precision the future growth rate and size of our target market.
The rapidly evolving nature of the market in which we operate, as well as other factors that are beyond our control, reduce our ability to accurately evaluate our long-term outlook and forecast annual performance. We believe that demand for our products and services has been driven in large part by price pressure in traditional FFS health care, a regulatory environment that is incentivizing value-based care models, a rapid expansion of retail insurance, broader use of the Internet and advances in technology. Widespread acceptance of the value-based care model is critical to our future growth and success. A reduction in demand for our products and services caused by lack of acceptance, technological challenges, competing offerings or other factors would result in a lower revenue growth rate or decreased revenue, either of which could negatively impact our business and results of operations. In addition, our business, financial condition and results of operations may be adversely affected if health care reform is not implemented in accordance with our expectations or if it is amended in a way that impacts our business and results in our failure to execute our growth strategies.
The health care regulatory and political framework is uncertain and evolving.
Health care laws and regulations are rapidly evolving and may change significantly in the future, which could adversely affect our financial condition and results of operations. For example, in March 2010, the ACA was adopted, which is a health care reform measure that provides health care insurance for approximately 20 million more Americans. The ACA includes a variety of health care reform provisions and requirements that were expected to become effective at varying times through 2018 and to substantially change the way health care is financed by both governmental and private insurers, which may significantly impact our industry and our business. The current administration and Congress have been seeking, and we expect they will continue to seek, legislative and regulatory changes to health care laws and regulations, including repeal and replacement of certain provisions of the ACA. In January 2017, President Trump issued an executive order titled “Minimizing the Economic Burden of the Patient Protection and Affordable Care Act Pending Repeal.” The order directed agencies with authorities and responsibilities under the ACA to waive, defer, grant exemptions from, or delay the implementation of any provision of the ACA that would impose a fiscal or regulatory burden on states, individuals, healthcare providers, health insurers, or manufacturers of pharmaceuticals or medical devices. Since January 2017, Congressional efforts to repeal and replace the ACA have been unsuccessful. However, the individual mandate was repealed by Congress as part of the Tax Cuts and Jobs Act that was signed into law on December 22, 2017. We are continuing to evaluate the impact of the repeal of the individual mandate on our business. The impact of the repeal and the executive order as well as the future of the ACA remain unclear. Further, the public exchange market is currently experiencing significant disruptions, as many insurers have incurred significant losses and announced their withdrawal from health insurance exchanges in a number of states. Because of
14
the continued uncertainty about the implementation of the ACA, including the timing of and potential for further legal challenges, repeal or amendment of that legislation and future of the health insurance exchanges, we cannot quantify or predict with any certainty the likely impact of the ACA on our business, financial condition, operating results and prospects.
In addition, Congress, state legislatures and third-party payors may continue to review and assess alternative health care delivery and payment systems and may in the future propose and adopt legislation or policy changes or implementations effecting additional fundamental changes in the health care delivery system, including with respect to Medicare and Medicaid programs. In January 2018, CMS released guidance to states on how to design and test programs that require “community engagement” as a condition to receiving Medicaid benefits. Shortly thereafter, CMS approved Kentucky’s application for a waiver to Medicaid’s rules to impose such a requirement. As a result, we expect the Kentucky waiver to reduce Passport’s membership in 2018. Consequently, this could have an impact on our revenues from Passport, which represented 20.6% of our revenue in 2017. Other states have applied for similar waivers from CMS and we cannot quantify or predict with any certainty the likely impact of such waivers, other changes in the law or new interpretations of existing laws, on our methods and costs of doing business.
Additionally, expansion of enforcement activity could adversely affect our business and financial condition. Going forward, we expect CMS and Congress to continue to closely scrutinize each component of the Medicare program as well as modify the terms and requirements of the program. It is not possible to predict the outcome of this Congressional or regulatory activity, either of which could adversely affect us. Similarly, we cannot predict whether pending or future federal or state legislation or court proceedings will change various aspects of the health care delivery system, including Medicaid and Medicare programs, nor can we predict the impact those changes will have on our business operations or financial results, but the effects could be materially adverse.
Insurance subsidiaries must be licensed by and are subject to the regulations of the jurisdictions in which they conduct business. For example, True Health is regulated under specific New Mexico laws and regulations and indirectly affected by other health care-related laws and regulations. State regulations mandate minimum capital or restricted cash reserve requirements. In addition, state guaranty fund laws and related regulations subject us to assessments for certain obligations to policyholders and claimants of impaired or insolvent insurance companies (including state insurance cooperatives). Any such assessment could expose us to the risk of paying a portion of an impaired or insolvent insurance company's claims through state guaranty association assessments.
In addition to these health care laws and regulations, we are subject to various other laws and regulations, including, among others, other aspects of state insurance laws, the Stark Law relating to self-referrals, the whistleblower provisions of the False Claims Act, anti-kickback laws, antitrust laws, the privacy and data protection laws. We have identified instances of noncompliance in the past and cannot guarantee that we will not identify other instances in the future, or the outcome of any regulatory investigation into any non-compliance. See “Part I-Item 1. Business-Health Care Laws and Regulations” for additional information. If we were to become subject to litigation, liabilities or penalties under these or other laws or as part of a governmental review or audit, our business could be adversely affected.
If we fail to effectively manage our growth, our business and results of operations could be harmed.
We have expanded our operations significantly since our inception, organically as well as through acquisitions. For example, we grew from six full-time employees at inception to approximately
2,600
employees as of December 31, 2017, and our revenue increased from $25.7 million for 2013 to
$435.0 million
for 2017 (after the completion of the Valence Health and Aldera acquisitions). If we do not effectively manage our growth as we continue to expand, the quality of our products and services could suffer. Our growth to date has increased the significant demands on our management, our operational and financial systems and infrastructure and other resources. In order to successfully expand our business, we must effectively recruit, integrate and motivate new employees, while maintaining the beneficial aspects of our corporate culture. We may not be able to hire new employees quickly enough to meet our needs. If we fail to effectively manage our hiring needs and successfully integrate our new employees, our efficiency and ability to meet our forecasts and our employee morale, productivity and retention could suffer, and our business and results of operations could be harmed. We must also continue to improve our existing systems for operational and financial management, including our reporting systems, procedures and controls. These improvements could require significant capital expenditures and place increasing demands on our management. We may not be successful in managing or expanding our operations or in maintaining adequate financial and operating systems and controls. If we do not successfully manage these processes, our business and results of operations could be harmed.
We derive a significant portion of our revenues from our largest partners. The loss, termination or renegotiation of any contract could negatively impact our results.
Historically, we have relied on a limited number of partners for a substantial portion of our total revenue and accounts receivable. Our largest partner in 2017, Passport Health Plan, comprised
20.6%
of our revenue for 2017. Our three largest partners in terms of accounts receivable in 2017, Cook County Health and Hospitals System, Indiana University Health Plan and MDWise Inc., comprised
32.1%
,
16.5%
and
11.8%
, respectively, of such total amount as of December 31, 2017, or
60.4%
in the aggregate. The sudden loss of any of our partners, including our strategic alliance partner, Passport or the renegotiation of any of our partner contracts, could adversely affect our operating results. In the ordinary course of business we engage in active discussions and renegotiations with our
15
partners in respect of the services we provide and the terms of our partner agreements, including our fees. As our partners’ businesses respond to market dynamics and financial pressures, and as our partners make strategic business decisions in respect of the lines of business they pursue and programs in which they participate, we expect that certain of our partners will, from time to time, seek to restructure their agreements with us. We are currently in discussions with several of our partners, including some of our significant partners, to renegotiate their agreements with us. These discussions and future discussions could result in reductions to the fees and changes to the scope of services contemplated by our original partner contracts and consequently could negatively impact our revenues, business and prospects.
Because we rely on a limited number of partners for a significant portion of our revenues, we depend on the creditworthiness of these partners. Our partners are subject to a number of risks including reductions in payment rates from governmental payers, higher than expected health care costs and lack of predictability of financial results when entering new lines of business, particularly with high-risk populations, such as plans established under the ACA and Aged, Blind and Disabled Medicaid. If the financial condition of our partners declines, our credit risk could increase. Should one or more of our significant partners declare bankruptcy, be declared insolvent or otherwise be restricted by state or federal laws or regulation from continuing in some or all of their operations, this could adversely affect our ongoing revenues, the collectability of our accounts receivable and affect our bad debt reserves and net income.
Although we have long-term contracts with many partners, these contracts may be terminated before their term expires for various reasons, such as changes in the regulatory landscape and poor performance by us, subject to certain conditions. For example, after a specified period, certain of these contracts are terminable for convenience by our partners after a notice period has passed and the partner has paid a termination fee. Certain of our contracts are terminable immediately upon the occurrence of certain events. For example, some of our contracts may be terminated by the partner if we fail to achieve target performance metrics over a specified period. Certain of our contracts may be terminated by the partner immediately following repeated failures by us to provide specified levels of service over periods ranging from six months to more than a year. Certain of our contracts may be terminated immediately by the partner if we lose applicable licenses, go bankrupt, lose our liability insurance or receive an exclusion, suspension or debarment from state or federal government authorities. In addition, one of our contracts may be terminated immediately if we become insolvent or file for bankruptcy. If any of our contracts with our partners is terminated, we may not be able to recover all fees due under the terminated contract, which may adversely affect our operating results. We expect that future contracts will contain similar provisions.
If we are unable to offer new and innovative products and services or our products and services fail to keep pace with advances in industry standards, technology and our partners’ needs, our partners may terminate or fail to renew their relationship with us and our revenue and results of operations may suffer.
Our success depends on providing high-quality products and services that health care providers use to improve clinical, financial and operational performance. If we cannot adapt to rapidly evolving industry standards, technology and increasingly sophisticated and varied partner needs, our existing technology could become undesirable, obsolete or harm our reputation. We must continue to invest significant resources in our personnel and technology in a timely and cost-effective manner in order to enhance our existing products and services and introduce new high-quality products and services that existing partners and potential new partners will want. Our operating results would also suffer if our innovations are not responsive to the needs of our existing partners or potential new partners, are not appropriately timed with market opportunity, are not effectively brought to market or significantly increase our operating costs. If our new or modified product and service innovations are not responsive to partner preferences, emerging industry standards or regulatory changes, are not appropriately timed with market opportunity or are not effectively brought to market, we may lose existing partners or be unable to obtain new partners and our results of operations may suffer. In addition, should any of our partners terminate their relationship with us after implementation has begun, we would not only lose our time, effort and resources invested in that implementation, but we would also have lost the opportunity to leverage those resources to build a relationship with other partners over that same period of time.
We also engage third-party vendors to develop, maintain and enhance our technology solutions, and our ability to develop and implement new technologies is therefore dependent on our ability to engage suitable vendors. We may also need to license software or technology from third parties in order to maintain, expand or modify our technology services platform. However, there is no guarantee we will be able to enter into such agreements on acceptable terms or at all. The functionality of our platform depends, in part, on our ability to integrate it with third-party applications and data management systems that our partners use and from which they obtain data. These third parties may terminate their relationships with us, change the features of their applications and platforms, restrict our access to their applications and platforms or alter the terms governing use of their applications, data management systems and application programming interfaces and access to those applications and platforms in an adverse manner.
We have made and may make acquisitions, investments and alliances, including the acquisitions of Valence Health, Aldera and assets from NMHC, which may be difficult to integrate, divert management resources, result in unanticipated costs or dilute our stockholders.
Part of our business strategy is to acquire or invest in companies, businesses, products or technologies that complement our current products and services, enhance our market coverage or technical capabilities or offer growth opportunities. This may include acquiring or investing in companies, businesses, products or technologies that are tangential to our current business and in which we
16
have limited or no prior operating experience, which was the case in our recent acquisition of assets from NMHC. That and other acquisitions, investments or alliances could result in new, material risks to our results of operations, financial condition, business and prospects. These new risks could include increased variability in revenues and prospects associated with various risk sharing arrangements. Consistent with our business strategy, we continuously evaluate, and are currently in the process of evaluating, potential acquisition targets and investments. However, there can be no assurance that any of these potential acquisitions or investments will be consummated. As an example, in December 2017, we announced the termination of a previously announced agreement whereby we had agreed to purchase Premier Health Plan, subject to certain closing conditions.
In February 2016, we entered into a strategic alliance with a leading nonprofit community-based and provider-sponsored health plan administering Kentucky Medicaid and federal Medicare Advantage benefits. More recently, on October 3, 2016, we completed the acquisition of Valence Health, on November 1, 2016, we completed the acquisition of Aldera and on January 2, 2018, we completed the acquisition of assets from NMHC. The recently completed acquisitions of Valence Health, Aldera and assets from NMHC, as well as other acquisitions, investments and alliances could pose numerous risks to our business which could negatively impact our financial condition and results of operations, including:
|
•
|
difficulty integrating the purchased operations, products or technologies;
|
|
•
|
substantial unanticipated integration costs, delays and challenges that may arise in integration;
|
|
•
|
assimilation of the acquired businesses, which may divert significant management attention and financial resources from our other operations and could disrupt our ongoing business;
|
|
•
|
the loss of key customers who are in turn subject to risks and financial dislocation in their businesses;
|
|
•
|
the loss of key employees, particularly those of the acquired operations;
|
|
•
|
difficulty retaining or developing the acquired business’ customers;
|
|
•
|
adverse effects on our existing business relationships with customers, suppliers, other partners, standing with regulators;
|
|
•
|
challenges related to the integration and operation of businesses that operate in new geographic areas and new markets or lines of business;
|
|
•
|
unanticipated financial losses in the acquired business, including the risk of higher than expected health care costs;
|
|
•
|
failure to realize the potential cost savings or other financial benefits or the strategic benefits of the acquisitions, including failure to consummate any proposed or contemplated transaction; and
|
|
•
|
liabilities, including acquired litigation, and expenses from the acquired businesses for contractual disputes with customers and other third parties, infringement of intellectual property rights, data privacy violations or other claims and failure to obtain indemnification for such liabilities or claims, and distraction of our personnel in connection with any related proceedings.
|
We may be unable to integrate the operations, products, technologies or personnel gained through the Valence Health, Aldera or NMHC acquisitions or integrate or complete any other such transaction without a material adverse effect on our business, financial condition and results of operations. Transaction agreements may impose limitations on our ability, or the ability of the business to be acquired, to conduct business. Events outside our control, including operating changes or regulatory changes, could also adversely affect our ability to realize anticipated revenues, synergies, benefits and cost savings. In addition, revenues of acquired businesses or companies, prior to and after consummation of a transaction, may be less than expected. Counterparties in transactions may have contracts with customers and other business partners which may require consents from these parties in connection with a transaction. If these consents cannot be obtained, the Company may suffer a loss of potential future revenue and may lose rights that are material to its business and the business of any combined company. Any such disruptions could limit our ability to achieve the anticipated benefits of the transaction. Any integration may be unpredictable, or subject to delays or changed circumstances, and we and any targets may not perform in accordance with our expectations.
In connection with these acquisitions, investments or alliances, we could incur significant costs, debt, amortization expenses related to intangible assets or large and immediate write-offs or other impairments or charges, assume liabilities or issue stock that would dilute our current stockholders’ ownership. For example, as part of the closing consideration for the Valence Health acquisition we issued
6.8 million
shares of the Company’s Class A common stock. In addition, the market price for our Class A common stock could be affected, following the consummation of any other transaction, by factors that have not historically affected the market price for our Class A common stock.
17
Our revenues and the growth of our business rely, in part, on the growth and success of our partners and certain revenues from our engagements, which are difficult to predict and are subject to factors outside of our control, including governmental funding reductions and other policy changes.
We enter into agreements with our partners under which a significant portion of our fees are variable, including fees which are dependent upon the number of members that are covered by our partner’s health care plan each month, expansion of our partners and the services that we provide, as well as performance-based metrics. The number of members covered by a partner’s health care plan is often impacted by factors outside of our control, such as the actions of our partner or third parties. In addition, ongoing payment of fees by our partners could be negatively impacted by the general financial condition of our partners. Accordingly, revenue under these agreements is unpredictable. If the number of members covered by one or more of our partner’s plans were to be reduced by a material amount, such decrease would lead to a decrease in our revenue, which could harm our business, financial condition and results of operations. In addition, growth forecasts of our partners are subject to significant uncertainty and are based on assumptions and estimates that may prove to be inaccurate. Even if the markets in which our partners compete meet the size estimates and growth forecasted, their health plan membership could fail to grow at similar rates, if at all. In addition, a portion of the revenue under certain of our service contracts is tied to the customer’s continued participation in specified payer programs over which we have no control. If the customer ceases to participate or is disqualified from participation in any such program, this would lead to a decrease in our expected revenue under the relevant contract.
In addition, the transition to value-based care may be challenging for our partners. For example, fully capitated or other provider risk arrangements have had a history of financial challenges for providers. Our partners may also have difficulty in value-based care if premium pricing is under pressure or if they incur selection bias in the health plans under which they assume risk and in so doing the premium, capitation amount or other risk-sharing arrangement they undertake does not adequately reflect the health status of the membership. Our partners may choose not to continue to capitalize affiliated health plans or subsidize losses to their reimbursement rates. Furthermore, revenue under our partner contracts may differ from our projections because of the termination of the contract for cause or at specified life cycle events, or because of fee reductions that are occasionally given after the contract is initially signed.
Our partners derive a substantial portion of their revenue from third-party private and federal and state governmental payers, including Medicaid programs. Revenue under certain of our agreements could be negatively impacted as a result of governmental funding reductions impacting government-sponsored programs, changes in reimbursement rates, and premium pricing reductions, as well as the inability of our partners to control and, if necessary, reduce health care costs, all of which are out of our control. Because certain of our partners’ revenues are highly reliant on third-party payor reimbursement funding rates and mechanisms, overall reductions of rates from such payors could adversely impact the liquidity of our partners, resulting in their inability to make payments to us on agreed payment terms. See “Risk factors–The health care regulatory and political framework is uncertain and evolving” for additional information.
If we do not continue to attract new partners, we may not achieve our revenue projections, and our results of operations would be harmed.
In order to grow our business, we must continually attract new partners. Our ability to do so depends in large part on the success of our sales and marketing efforts. Potential partners may seek out other options. Therefore, we must demonstrate that our products and services provide a viable solution for potential partners. If we fail to provide high-quality solutions and convince individual partners of our value proposition, we may not be able to retain existing partners or attract new partners. In addition, there may be a limited-time opportunity to achieve and maintain a significant share of the market for our products and services due in part to the rapidly evolving nature of the health care and technology industries and the substantial resources available to our existing and potential competitors. If the market for our products and services declines or grows more slowly than we expect, or if the number of individual partners that use our solutions declines or fails to increase as we expect, our revenue, results of operations, financial condition, business and prospects could be harmed.
As we enter into an increasing number and variety of risk sharing arrangements with partners, our revenues and profitability could be limited and negatively impacted.
We may choose to incorporate certain risk sharing arrangements as part of our contractual arrangements with our partners, and we expect to enter an increasing number and variety of risk sharing arrangements in the future. As an example, as part of our strategy to support certain partners in the Next Generation Accountable Care Program, we entered into upside and downside risk-sharing arrangements, with the downside arrangements limited to our fees and executed through our captive insurance subsidiary. Another example of risk sharing is our strategic alliance with Passport, where in February 2016 we invested alongside Passport in the creation of a joint Medicaid Center of Excellence in Louisville, Kentucky. As the market evolves, we expect to engage in similar and new risk sharing strategies with our partners. As of December 31, 2017, Evolent had approximately $24.7 million of restricted cash and restricted investments related to risk-sharing arrangements. These arrangements have included and may include provision of letters of credit, loans, reinsurance arrangements, equity investments and other extensions of capital, where we are and may be at risk of not recovering all or a portion of any such loan or other extension of capital. These and any other potential risk sharing arrangements
18
could limit and negatively impact our revenue, results of operations, financial condition, business and prospects. In addition, our failure to agree on satisfactory risk sharing solutions with potential partners could negatively impact our ability to attract new partners.
In addition, as we invest and enter into new joint ventures and strategic alliances, we may be required to make additional capital contributions.
We typically incur significant upfront costs in our partner relationships, and if we are unable to develop or grow these partner relationships over time, we are unlikely to recover these costs and our operating results may suffer.
We devote significant resources to establish relationships with our partners and for the year ended December 31, 2017, our business development expenses represented approximately
4.3%
of our total revenues. Some of our partners undertake a significant and prolonged evaluation process, including to determine whether our products and services meet their unique health system needs, which has in the past resulted in extended periods of time to establish a partner relationship. Our efforts involve educating our partners about the use, technical capabilities and benefits of our products and services. Accordingly, our operating results will depend in substantial part on our ability to deliver a successful partner experience and persuade our partners to grow their relationship with us over time. There is no guarantee that we will be able to successfully convert a customer of our transformation services into a partner of our platform and operations services. If we are unable to sell additional products and services to existing partners, enter into and maintain favorable relationships with new partners or sufficiently grow our partners’ lives on platform, it could have a material adverse effect on our business, financial condition and results of operations. As we grow, our customer acquisition costs could outpace our build-up of recurring revenue, and we may be unable to reduce our total operating costs through economies of scale such that we are unable to achieve profitability. In addition, we estimate the costs and timing for completing the transformation phase of relevant partner relationships. These estimates reflect our best judgment. Any increased or unexpected costs or unanticipated delays, including delays caused by factors outside our control, could cause our operating results to suffer.
If the estimates and assumptions we use to determine the size of the target market for our core services are inaccurate, our future growth rate may be impacted and our business would be harmed.
Market opportunity estimates and growth forecasts are subject to significant uncertainty and are based on assumptions and estimates that may not prove to be accurate. Our estimates and forecasts relating to the size and expected growth of the market for our services may prove to be inaccurate. Even if the market in which we compete meets our size estimates and forecasted growth, our business could fail to grow at similar rates, if at all.
The principal assumptions relating to our market opportunity for our core services include health insurance expenditures, the total percentage of payments providers receive under value-based contracting, the size of the provider-sponsored health plan market and the fees we believe we can charge. Our market opportunity for our core services is also based on the assumption that the strategic approach that our solution enables for our potential partners will be more attractive to our partners than competing solutions. The solution we offer our target market contemplates one strategic option—to pursue clinical and technological integration to reduce utilization and total cost—among several such options our potential partners may pursue to achieve their objectives. Our potential partners may elect to pursue a different strategic option. In addition, our assumptions could be impacted by changes to health care laws and regulations as a result of the 2018 congressional, state and local elections and subsequent elections. If these assumptions prove inaccurate, our business, financial condition and results of operations could be adversely affected.
If we are not able to maintain and enhance our reputation and brand recognition, our business and results of operations will be harmed.
We believe that maintaining and enhancing our reputation and brand recognition is critical to our relationships with existing partners and to our ability to attract new partners. The promotion of our brands may require us to make substantial investments and we anticipate that, as our market becomes increasingly competitive, these marketing initiatives may become increasingly difficult and expensive. Our marketing activities may not be successful or yield increased revenue, and to the extent that these activities yield increased revenue, the increased revenue may not offset the expenses we incur and our results of operations could be harmed. In addition, any factor that diminishes our reputation or that of our management, including failing to meet the expectations of our partners, or any adverse publicity surrounding one of our joint venture partners, investors or strategic alliance partners, could make it substantially more difficult for us to attract new partners. Similarly, because our existing partners often act as references for us with prospective new partners, any existing partner that questions the quality of our work or that of our employees could impair our ability to secure additional new partners. Therefore, financial adversity of our partners’ affiliated health plans may adversely affect our reputation. In addition, negative publicity resulting from any adverse government payor audit could injure our reputation. If we do not successfully maintain and enhance our reputation and brand recognition, our business may not grow and we could lose our relationships with partners, which would harm our business, results of operations and financial condition.
19
Consolidation in the health care industry could have a material adverse effect on our business, financial condition and results of operations.
Many health care industry participants and payers are consolidating to create larger and more integrated health care delivery systems with greater market power. We expect regulatory and economic conditions to result in additional consolidation in the health care industry in the future. As consolidation accelerates, the economies of scale of our partners’ organizations may grow. If a partner experiences sizable growth following consolidation, it may determine that it no longer needs to rely on us and may reduce its demand for our products and services. In addition, as health care providers consolidate to create larger and more integrated health care delivery systems with greater market power, these providers may try to use their market power to negotiate fee reductions for our products and services. Finally, consolidation may also result in the acquisition or future development by our partners of products and services that compete with our products and services. Any of these potential results of consolidation could have a material adverse effect on our business, financial condition and results of operations.
We may face intense competition, which could limit our ability to maintain or expand market share within our industry, and if we do not maintain or expand our market share our business and operating results will be harmed.
The market for our products and services is fragmented, competitive and characterized by rapidly evolving technology standards, customer needs and the frequent introduction of new products and services. Our competitors range from smaller niche companies to large, well-financed and technologically-sophisticated entities.
We compete on the basis of several factors, including breadth, depth and quality of product and service offerings, ability to deliver clinical, financial and operational performance improvement through the use of products and services, quality and reliability of services, ease of use and convenience, brand recognition and the ability to integrate services with existing technology. Some of our competitors are more established, benefit from greater brand recognition, have larger client bases and have substantially greater financial, technical and marketing resources. Other competitors have proprietary technology that differentiates their product and service offerings from ours. Our competitors are constantly developing products and services that may become more efficient or appealing to our existing partners and potential partners. Additionally, some health care information technology providers have begun to incorporate enhanced analytical tools and functionality into their core product and service offerings used by health care providers. As a result of these competitive advantages, our competitors and potential competitors may be able to respond more quickly to market forces, undertake more extensive marketing campaigns for their brands, products and services and make more attractive offers to our existing partners and potential partners.
We also compete on the basis of price. We may be subject to pricing pressures as a result of, among other things, competition within the industry, consolidation of health care industry participants, practices of managed care organizations, government action and financial stress experienced by our partners. If our pricing experiences significant downward pressure, our business will be less profitable and our results of operations will be adversely affected.
We cannot be certain that we will be able to retain our current partners or expand our partner base in this competitive environment. If we do not retain current partners or expand our partner base, or if we have to renegotiate existing contracts, our business, financial condition and results of operations will be harmed. Moreover, we expect that competition will continue to increase as a result of consolidation in both the health care information technology and health care industries. If one or more of our competitors or potential competitors were to merge or partner with another of our competitors, the change in the competitive landscape could also adversely affect our ability to compete effectively and could harm our business, financial condition and results of operations.
In addition, with respect to True Health, we face competition in the health care benefits industry, which is highly competitive and subject to significant changes from legislative reform, business consolidations, new strategic alliances, aggressive marketing practices by other health benefits organizations and market pressures brought about by an informed and organized customer base, particularly among large employers. We will have to respond to pricing and other actions taken by existing competitors and potentially disruptive new entrants, proliferation of competing products and our competitors’ marketing and pricing. If we do not compete effectively in the geographies and product areas in which True Health operates, our business, financial condition, results of operations or prospects could be adversely affected.
Our offerings could be subject to audits by CMS and other governmental payors and whistleblower claims under the False Claims Act.
We support provider-sponsored health plans with Medicare Advantage, Medicaid and Exchange products, as well as health systems and physician groups participating in payer-delegated risk arrangements or in the CMS Next Generation ACO Model. We anticipate that CMS and other governmental payors will continue to review and audit the results of our services including risk adjustment offerings, with a focus on identifying possible false claims.
20
In addition, aspects of our review process and coding procedures could be subject to claims under the False Claims Act or Anti-Kickback Statute. Negative results of any such audit or claim could have a material adverse effect on our business, financial condition, results of operations or prospects and could damage our reputation.
Exclusivity and right of first refusal clauses in some of our partner and founder contracts may prohibit us from partnering with certain other providers in the future, and as a result may limit our growth.
Some of our partner and founder contracts include exclusivity and right of first refusal clauses. Any founder contracts with exclusivity, right of first refusal or other restrictive provisions may limit our ability to conduct business with certain potential partners, including competitors of our founders. For example, under the UPMC IP Agreement, if we were to conduct business with certain precluded providers, it would result in the loss of the license thereunder. Partner contracts with exclusivity or other restrictive provisions may limit our ability to partner with or provide services to other providers or purchase services from other vendors within certain time periods. These exclusivity or other restrictive provisions often apply to specific competitors of our health system partners or specific geographic areas within a particular state or an entire state. Accordingly, these exclusivity clauses may prevent us from entering into relationships with potential partners and could cause our business, financial condition and results of operations to be harmed.
In addition, we were party to a services, reseller and non-competition agreement with The Advisory Board that terminated on July 20, 2017, which we refer to as The Advisory Board Reseller Agreement, that, among other things, prohibits us from promoting, marketing, offering or selling certain unbundled technology services, consulting services unless reasonably expected to lead to a services contract or be part of a Blueprint engagement, or certain other services that are substantially similar to or competitive with certain Advisory Board services. Accordingly, that agreement prohibits us from selling such software or technology services on a standalone basis, but permits us to sell such services if they are part of an integrated offering to our partners and such services account for no more than 50% of the aggregate revenue attributable to our partner during the term of the contract. The Advisory Board Reseller Agreement also prohibits us from promoting, marketing, offering or selling consulting services that are not intended to be a part of our Blueprint services or any services that are substantially similar to or competitive with certain Advisory Board services. These restrictions are in effect until the earlier of June 27, 2020, and the date on which The Advisory Board no longer holds shares of our common stock. We have also entered into a reseller, services and non-competition agreement with an affiliate of UPMC, which we refer to as the UPMC Reseller Agreement, pursuant to which we are prohibited from providing products or services to certain third parties and in certain territories. These restrictions could cause our business, financial condition and results of operations to be harmed if we found it advantageous to provide products or services to such third parties or in such territories during the restricted period.
We are subject to privacy and data protection laws governing the transmission, security and privacy of health information, which may impose restrictions on the manner in which we access personal data and subject us to penalties if we are unable to fully comply with such laws.
As described below, we are required to comply with numerous federal and state laws and regulations governing the collection, use, disclosure, storage and transmission of individually identifiable health information that we may obtain or have access to in connection with the provision of our services. These laws and regulations, including their interpretation by governmental agencies, are subject to frequent change and could have a negative impact on our business.
|
•
|
HIPAA expanded protection of the privacy and security of personal health information and required the adoption of standards for the exchange of electronic health information. Among the standards that the Department of Health and Human Services has adopted pursuant to HIPAA are standards for electronic transactions and code sets, unique identifiers for providers, employers, health plans and individuals, security, electronic signatures, privacy and enforcement. Failure to comply with HIPAA could result in fines and penalties that could have a material adverse effect on us.
|
|
•
|
The Health Information Technology for Economic and Clinical Health Act, or the HITECH Act, enacted as part of the American Recovery and Reinvestment Act of 2009, also known as the “Stimulus Bill,” effective February 22, 2010, set forth health information security breach notification requirements and increased penalties for violation of HIPAA. The HITECH Act requires individual notification for all breaches, media notification of breaches for over 500 individuals and at least annual reporting of all breaches to the Department of Health and Human Services. The HITECH Act also replaced the prior penalty system of one tier of penalties of $100 per violation and an annual maximum of $25,000 with a four-tier system of sanctions for breaches. Penalties now range from the original $100 per violation and an annual maximum of $25,000 for the first tier to a minimum of $50,000 per violation and an annual maximum of $1.5 million for the fourth tier. Failure to comply with the HITECH Act could result in fines and penalties that could have a material adverse effect on us.
|
|
•
|
Numerous other federal and state laws may apply that restrict the use and protect the privacy and security of individually identifiable information, as well as employee personal information. These include state medical privacy laws, state social security number protection laws and federal and state consumer protection laws. These various laws in many cases are not preempted by HIPAA and may be subject to varying interpretations by the courts and government agencies, creating complex compliance issues for us and our partners and potentially exposing us to additional expense, adverse publicity and liability, any of which could adversely affect our business.
|
21
|
•
|
Federal and state consumer protection laws are increasingly being applied by the FTC and states’ attorneys general to regulate the collection, use, storage and disclosure of personal or individually identifiable information, through websites or otherwise, and to regulate the presentation of website content.
|
There is ongoing concern from privacy advocates, regulators and others regarding data protection and privacy issues, and the number of jurisdictions with data protection and privacy laws have been increasing. Also, there are ongoing public policy discussions regarding whether the standards for de-identified, anonymous or pseudonomized health information are sufficient, and the risk of re-identification sufficiently small, to adequately protect patient privacy. These discussions may lead to further restrictions on the use of such information. There can be no assurance that these initiatives or future initiatives will not adversely affect our ability to access and use data or to develop or market current or future services.
The security measures that we and our third-party vendors and subcontractors have in place to ensure compliance with privacy and data protection laws may not protect our facilities and systems from security breaches, acts of vandalism or theft, computer viruses, misplaced or lost data, programming and human errors or other similar events. Under the HITECH Act, as a business associate we may also be liable for privacy and security breaches and failures of our subcontractors. Even though we provide for appropriate protections through our agreements with our subcontractors, we still have limited control over their actions and practices. A breach of privacy or security of individually identifiable health information by a subcontractor may result in an enforcement action, including criminal and civil liability, against us. Due to the recent enactment of the HITECH Act, we are not able to predict the extent of the impact such incidents may have on our business. Our failure to comply may result in criminal and civil liability because the potential for enforcement action against business associates is now greater. Enforcement actions against us could be costly and could interrupt regular operations, which may adversely affect our business. While we have not received any notices of violation of the applicable privacy and data protection laws and believe we are in compliance with such laws, there can be no assurance that we will not receive such notices in the future.
If we are unable to obtain, maintain and enforce intellectual property protection for our technology and products or if the scope of our intellectual property protection is not sufficiently broad, others may be able to develop and commercialize technology and products substantially similar to ours, and our ability to successfully commercialize our technology and products may be adversely affected.
Our business depends on proprietary technology and content, including software, databases, confidential information and know-how, the protection of which is crucial to the success of our business. We rely on a combination of trademark, trade-secret and copyright laws and confidentiality procedures and contractual provisions to protect our intellectual property rights in our proprietary technology and content. We are pursuing the registration of our trademarks and service marks in the United States.
We may, over time, increase our investment in protecting our intellectual property through additional trademark, patent and other intellectual property filings that could be expensive and time-consuming. Effective trademark, trade-secret and copyright protection is expensive to develop and maintain, both in terms of initial and ongoing registration requirements and the costs of defending our rights. These measures, however, may not be sufficient to offer us meaningful protection. If we are unable to protect our intellectual property and other proprietary rights, our competitive position and our business could be harmed, as third parties may be able to commercialize and use technologies and software products that are substantially the same as ours without incurring the development and licensing costs that we have incurred. Any of our owned or licensed intellectual property rights could be challenged, invalidated, circumvented, infringed or misappropriated, our trade secrets and other confidential information could be disclosed in an unauthorized manner to third parties, or our intellectual property rights may not be sufficient to permit us to take advantage of current market trends or otherwise to provide us with competitive advantages, which could result in costly redesign efforts, discontinuance of certain offerings or other competitive harm.
Monitoring unauthorized use of our intellectual property is difficult and costly. From time to time, we seek to analyze our competitors’ products and services, and may in the future seek to enforce our rights against potential infringement. However, the steps we have taken to protect our proprietary rights may not be adequate to prevent infringement or misappropriation of our intellectual property. We may not be able to detect unauthorized use of, or take appropriate steps to enforce, our intellectual property rights. Any inability to meaningfully protect our intellectual property rights could result in harm to our ability to compete and reduce demand for our technology and products. Moreover, our failure to develop and properly manage new intellectual property could adversely affect our market positions and business opportunities. Also, some of our products and services rely on technologies and software developed by or licensed from third parties, and we may not be able to maintain our relationships with such third parties or enter into similar relationships in the future on reasonable terms or at all.
We may also be required to protect our proprietary technology and content in an increasing number of jurisdictions, a process that is expensive and may not be successful, or which we may not pursue in every location. In addition, effective intellectual property protection may not be available to us in every country, and the laws of some foreign countries may not be as protective of intellectual property rights as those in the United States. Additional uncertainty may result from changes to intellectual property legislation enacted in the United States and elsewhere, and from interpretations of intellectual property laws by applicable courts and agencies. Accordingly, despite our efforts, we may be unable to obtain and maintain the intellectual property rights necessary to provide us with
22
a competitive advantage. Our failure to obtain, maintain and enforce our intellectual property rights could therefore have a material adverse effect on our business, financial condition and results of operations.
If our trademarks and trade names are not adequately protected, we may not be able to build name recognition in our markets of interest and our business may be adversely affected.
The registered or unregistered trademarks or trade names that we own or license may be challenged, infringed, circumvented, declared generic, lapsed or determined to be infringing on or dilutive of other marks. We may not be able to protect our rights in these trademarks and trade names, which we need in order to build name recognition with potential partners. In addition, third parties may in the future file for registration of trademarks similar or identical to our trademarks. If they succeed in registering or developing common law rights in such trademarks, and if we are not successful in challenging such third-party rights, we may not be able to use these trademarks to commercialize our technologies or products in certain relevant countries. If we are unable to establish name recognition based on our trademarks and trade names, we may not be able to compete effectively and our business may be adversely affected.
Third parties may initiate legal proceedings alleging that we are infringing or otherwise violating their intellectual property rights, the outcome of which would be uncertain and could have a material adverse effect on our business, financial condition and results of operations.
Our commercial success depends on our ability to develop and commercialize our services and use our proprietary technology without infringing the intellectual property or proprietary rights of third parties. Intellectual property disputes can be costly to defend and may cause our business, operating results and financial condition to suffer. As the market for health care in the United States expands and more patents are issued, the risk increases that there may be patents issued to third parties that relate to our products and technology of which we are not aware or that we must challenge to continue our operations as currently contemplated. Whether merited or not, we may face allegations that we, our partners, our licensees or parties indemnified by us have infringed or otherwise violated the patents, trademarks, copyrights or other intellectual property rights of third parties. Such claims may be made by competitors seeking to obtain a competitive advantage or by other parties. Additionally, in recent years, individuals and groups have begun purchasing intellectual property assets for the purpose of making claims of infringement and attempting to extract settlements from companies like ours. We may also face allegations that our employees have misappropriated the intellectual property or proprietary rights of their former employers or other third parties. It may be necessary for us to initiate litigation to defend ourselves in order to determine the scope, enforceability and validity of third-party intellectual property or proprietary rights, or to establish our respective rights. Regardless of whether claims that we are infringing patents or other intellectual property rights have merit, such claims can be time-consuming, divert management’s attention and financial resources and can be costly to evaluate and defend. Results of any such litigation are difficult to predict and may require us to stop commercializing or using our products or technology, obtain licenses, modify our services and technology while we develop non-infringing substitutes or incur substantial damages, settlement costs or face a temporary or permanent injunction prohibiting us from marketing or providing the affected products and services. If we require a third-party license, it may not be available on reasonable terms or at all, and we may have to pay substantial royalties, upfront fees or grant cross-licenses to intellectual property rights for our products and services. We may also have to redesign our products or services so they do not infringe third-party intellectual property rights, which may not be possible or may require substantial monetary expenditures and time, during which our technology and products may not be available for commercialization or use. Even if we have an agreement to indemnify us against such costs, the indemnifying party may be unable to uphold its contractual obligations. If we cannot or do not obtain a third-party license to the infringed technology at all, license the technology on reasonable terms or obtain similar technology from another source, our revenue and earnings could be adversely impacted.
From time to time, we may be subject to legal proceedings and claims in the ordinary course of business with respect to intellectual property. We are not currently subject to any claims from third parties asserting infringement of their intellectual property rights. Some third parties may be able to sustain the costs of complex litigation more effectively than we can because they have substantially greater resources. Even if resolved in our favor, litigation or other legal proceedings relating to intellectual property claims may cause us to incur significant expenses, and could distract our technical and management personnel from their normal responsibilities. In addition, there could be public announcements of the results of hearings, motions or other interim proceedings or developments, and if securities analysts or investors perceive these results to be negative, it could have a material adverse effect on the price of our Class A common stock. Moreover, any uncertainties resulting from the initiation and continuation of any legal proceedings could have a material adverse effect on our ability to raise the funds necessary to continue our operations. Assertions by third parties that we violate their intellectual property rights could therefore have a material adverse effect on our business, financial condition and results of operations.
Our use of “open source” software could adversely affect our ability to offer our services and subject us to possible litigation.
We may use open source software in connection with our products and services. Companies that incorporate open source software into their products have, from time to time, faced claims challenging the use of open source software and/or compliance with open source license terms. As a result, we could be subject to suits by parties claiming ownership of what we believe to be open source software or claiming noncompliance with open source licensing terms. Some open source software licenses require users who
23
distribute software containing open source software to publicly disclose all or part of the source code to such software and/or make available any derivative works of the open source code, which could include valuable proprietary code of the user, on unfavorable terms or at no cost. While we monitor the use of open source software and try to ensure that none is used in a manner that would require us to disclose our proprietary source code or that would otherwise breach the terms of an open source agreement, such use could inadvertently occur, in part because open source license terms are often ambiguous. Any requirement to disclose our proprietary source code or pay damages for breach of contract could have a material adverse effect on our business, financial condition and results of operations and could help our competitors develop products and services that are similar to or better than ours.
If we are unable to protect the confidentiality of our trade secrets, know-how and other proprietary information, the value of our technology and products could be adversely affected.
We may not be able to protect our trade secrets, know-how and other proprietary information adequately. Although we use reasonable efforts to protect this proprietary information and technology, our employees, consultants and other parties may unintentionally or willfully disclose our information or technology to competitors. Enforcing a claim that a third-party illegally obtained and is using any of our proprietary information or technology is expensive and time-consuming, and the outcome is unpredictable. In addition, courts outside the United States are sometimes less willing to protect trade secrets, know-how and other proprietary information. We rely, in part, on non-disclosure, confidentiality and invention assignment agreements with our employees, consultants and other parties to protect our trade secrets, know-how and other intellectual property and proprietary information. These agreements may not be self-executing, or they may be breached and we may not have adequate remedies for such breach. Moreover, third parties may independently develop similar or equivalent proprietary information or otherwise gain access to our trade secrets, know-how and other proprietary information.
We depend on certain technologies that are licensed to us. We do not control the intellectual property rights covering these technologies and any loss of our rights to these technologies or the rights licensed to us could prevent us from developing and/or commercializing our products.
We are a party to a number of license agreements under which we are granted rights to intellectual property that is important to our business, and we expect that we may need to enter into additional license agreements in the future. We rely on these licenses to use various proprietary technologies that may be material to our business, including without limitation those technologies licensed under an intellectual property and development services license agreement between us and UPMC, or the UPMC IP Agreement, a technology license agreement between us and UPMC, or the UPMC Technology Agreement, and an intellectual property license and data access agreement with The Advisory Board, or The Advisory Board IP Agreement. Under the UPMC IP Agreement, certain of UPMC’s proprietary analytics models and know-how are licensed to us on a nonexclusive basis from UPMC; pursuant to the UPMC Technology Agreement, UPMC’s proprietary technology platform, associated know-how and the Identifi
®
trademark are licensed to us on an irrevocable, non-exclusive basis from UPMC; in each case, subject to certain ongoing territorial, time and use restrictions. Under The Advisory Board IP Agreement, we hold a license to use a business plan and operating model designed by The Advisory Board, a right to access certain analysis, data and proprietary information of The Advisory Board, we obtain a membership in The Advisory Board’s health care industry program, and the right to access key Advisory Board personnel and assistance in our promotion and sales efforts. Our rights to use these technologies and know-how and employ the software claimed in the licensed technologies are subject to the continuation of and our compliance with the terms of those licenses. Our existing license agreements impose, and we expect that future license agreements will impose on us, various exclusivity obligations. If we fail to comply with our obligations under these agreements, the applicable licensor may have the right to terminate our license, in which case we may not be able to develop or commercialize the products or technologies covered by the license.
Disputes may arise between us and our licensors regarding intellectual property rights subject to a license agreement, including:
|
•
|
the scope of rights granted under the license agreement and other interpretation-related issues;
|
|
•
|
whether and the extent to which our technology and processes infringe on intellectual property of the licensor that is not subject to the license agreement;
|
|
•
|
our obligations with respect to the use of the licensed technology in relation to our services and technologies, and which activities satisfy those obligations;
|
|
•
|
whether our activities are in compliance with the restrictions placed upon our rights to use the licensed technology by our licensors; and
|
|
•
|
the ownership of inventions and know-how resulting from the joint creation or use of intellectual property by our licensors and us and our partners.
|
If disputes over intellectual property rights that we have licensed prevent or impair our ability to maintain our current licensing arrangements on acceptable terms, we may be unable to obtain equivalent replacement licensing arrangements or to successfully develop and commercialize the affected products and technologies.
The risks described elsewhere pertaining to our intellectual property rights also apply to the intellectual property rights that we license, and any failure by us or our licensors to obtain, maintain and enforce these rights could have a material adverse effect on our business.
24
In some cases, we do not have control over the prosecution, maintenance or enforcement of the intellectual property rights that we license, and may not have sufficient ability to consult and input into the prosecution and maintenance process with respect to such intellectual property, and our licensors may fail to take the steps we feel are necessary or desirable in order to obtain, maintain and enforce the licensed intellectual property rights and, as a result, our ability to retain our competitive advantage with respect to our products and technologies may be materially affected.
Any restrictions on our use of, or ability to license, data, or our failure to license data and integrate third-party technologies, could have a material adverse effect on our business, financial condition and results of operations.
We depend upon licenses from third parties for some of the technology and data used in our applications, and for some of the technology platforms upon which these applications are built and operate, including under the UPMC IP Agreement, the UPMC Technology Agreement and The Advisory Board IP Agreement. We expect that we may need to obtain additional licenses from third parties in the future in connection with the development of our products and services. In addition, we obtain a portion of the data that we use from government entities, public records and from our partners for specific partner engagements. We believe that we have all rights necessary to use the data that is incorporated into our products and services. However, we cannot assure you that our licenses for information will allow us to use that information for all potential or contemplated applications and products. In addition, certain of our products depend on maintaining our data and analytics platform, which is populated with data disclosed to us by our partners with their consent. If these partners revoke their consent for us to maintain, use, de-identify and share this data, consistent with applicable law, our data assets could be degraded.
In the future, data providers could withdraw their data from us or restrict our usage for any reason, including if there is a competitive reason to do so, if legislation is passed restricting the use of the data or if judicial interpretations are issued restricting use of the data that we currently use in our products and services. In addition, data providers could fail to adhere to our quality control standards in the future, causing us to incur additional expense to appropriately utilize the data. If a substantial number of data providers were to withdraw or restrict their data, or if they fail to adhere to our quality control standards, and if we are unable to identify and contract with suitable alternative data suppliers and integrate these data sources into our service offerings, our ability to provide products and services to our partners would be materially adversely impacted, which could have a material adverse effect on our business, financial condition and results of operations.
We also integrate into our proprietary applications and use third-party software to maintain and enhance, among other things, content generation and delivery, and to support our technology infrastructure. Some of this software is proprietary and some is open source software. Our use of third-party technologies exposes us to increased risks, including, but not limited to, risks associated with the integration of new technology into our solutions, the diversion of our resources from development of our own proprietary technology and our inability to generate revenue from licensed technology sufficient to offset associated acquisition and maintenance costs. These technologies may not be available to us in the future on commercially reasonable terms or at all and could be difficult to replace once integrated into our own proprietary applications. Most of these licenses can be renewed only by mutual consent and may be terminated if we breach the terms of the license and fail to cure the breach within a specified period of time. Our inability to obtain, maintain or comply with any of these licenses could delay development until equivalent technology can be identified, licensed and integrated, which would harm our business, financial condition and results of operations.
Most of our third-party licenses are non-exclusive and our competitors may obtain the right to use any of the technology covered by these licenses to compete directly with us. Our use of third-party technologies exposes us to increased risks, including, but not limited to, risks associated with the integration of new technology into our solutions, the diversion of our resources from development of our own proprietary technology and our inability to generate revenue from licensed technology sufficient to offset associated acquisition and maintenance costs. In addition, if our data suppliers choose to discontinue support of the licensed technology in the future, we might not be able to modify or adapt our own solutions.
Data loss or corruption due to failures or errors in our systems or service disruptions at our data centers may adversely affect our reputation and relationships with existing partners, which could have a negative impact on our business, financial condition and results of operations.
Because of the large amount of data that we collect and manage, it is possible that hardware failures or errors in our systems could result in data loss or corruption or cause the information that we collect to be incomplete or contain inaccuracies that our partners regard as significant. Complex software such as ours may contain errors or failures that are not detected until after the software is introduced or updates and new versions are released. We continually introduce new software and updates and enhancements to our existing software. Despite testing by us, we may discover defects or errors in our software. In addition, we may encounter defects or errors in connection with the integration of software and technology we acquire, such as in our acquisitions of Valence Health, Aldera or other future transactions. Any defects or errors could expose us to risk of liability to partners and the government and could cause delays in the introduction of new products and services, result in increased costs and diversion of development resources, require design modifications, decrease market acceptance or partner satisfaction with our products and services or cause harm to our reputation.
25
Furthermore, our partners might use our software together with products from other companies. As a result, when problems occur, it might be difficult to identify the source of the problem. Even when our software does not cause these problems, the existence of these errors might cause us to incur significant costs, divert the attention of our technical personnel from our product development efforts, impact our reputation and lead to significant partner relations problems.
Our business is subject to online security risks, and if we are unable to safeguard the security and privacy of confidential data, our reputation and business will be harmed.
Our services involve the collection, storage and analysis of confidential information. In certain cases such information is provided to third parties, for example, to the service providers who provide hosting services for our technology platform, and we may be unable to control the use of such information or the security protections employed by such third parties. We may be required to expend significant capital and other resources to protect against security breaches or to alleviate problems caused by security breaches. Despite our implementation of security measures designed to help ensure data security and compliance with applicable laws and rules, our facilities and systems, and those of our third-party providers, may be vulnerable to cyber-attacks, security breaches, acts of vandalism or theft, computer viruses, misplaced or lost data, programming and/or human errors or other similar events. A cyber-attack that bypasses our, or our third-party providers’, security systems successfully could require us to expend significant resources to remediate any damage, interrupt our operations, damage our reputation and our relationship with our partners, expose us or other third parties to a risk of loss or misuse of confidential information, reduce demand for our products and services or subject us to significant liability as well as regulatory action.
In addition, techniques used to obtain unauthorized access to information or to sabotage information technology systems change frequently. As a result, the costs of attempting to protect against cybersecurity risks and the costs of responding to cyber-attacks are significant. This could require us to expend significant resources to continue to modify or enhance our protective measures and to remediate any damage.
In the event that new data security laws are implemented, we may not be able to timely comply with such requirements, or such requirements may not be compatible with our current processes. Changing our processes could be time consuming and expensive, and failure to timely implement required changes could subject us to liability for non-compliance.
We rely on Internet infrastructure, bandwidth providers, data center providers, other third parties and our own systems for providing services to our partners, and any failure or interruption in the services provided by these third parties or our own systems could expose us to litigation and negatively impact our relationships with partners, adversely affecting our brand and our business.
Our ability to deliver our products and services, particularly our cloud-based solutions, is dependent on the development and maintenance of the infrastructure of the Internet and other telecommunications services by third parties. This includes maintenance of a reliable network connection with the necessary speed, data capacity and security for providing reliable Internet access and services and reliable telephone and facsimile services. As a result, our information systems require an ongoing commitment of significant resources to maintain and enhance existing systems and develop new systems in order to keep pace with continuing changes in information technology, emerging cybersecurity risks and threats, evolving industry and regulatory standards and changing preferences of our partners.
Our services are designed to operate without interruption in accordance with our service level commitments. However, we have experienced limited interruptions in these systems in the past, including server failures that temporarily slow down the performance of our services, and we may experience more significant interruptions in the future. We rely on internal systems as well as third-party suppliers, including bandwidth and telecommunications equipment providers, to provide our services. We do not maintain redundant systems or facilities for some of these services. Interruptions in these systems, whether due to system failures, computer viruses, physical or electronic break-ins or other catastrophic events, could affect the security or availability of our services and prevent or inhibit the ability of our partners to access our services.
In the event of a catastrophic event with respect to one or more of these systems or facilities, we may experience an extended period of system unavailability, which could result in substantial costs to remedy those problems or negatively impact our relationship with our partners, our business, results of operations and financial condition. To operate without interruption, both we and our service providers must guard against:
|
•
|
damage from fire, power loss and other natural disasters;
|
|
•
|
telecommunications failures;
|
|
•
|
software and hardware errors, failures and crashes;
|
|
•
|
security breaches, computer viruses and similar disruptive problems; and
|
|
•
|
other potential interruptions.
|
Any disruption in the network access, telecommunications or co-location services provided by third-party providers or any failure of or by third-party providers’ systems or our own systems to handle current or higher volume of use could significantly harm our
26
business. We exercise limited control over our third-party suppliers, which increases our vulnerability to problems with services they provide. Any errors, failures, interruptions or delays experienced in connection with these third-party technologies and information services or our own systems could negatively impact our relationships with partners and adversely affect our business and could expose us to third-party liabilities. Although we maintain insurance for our business, the coverage under our policies may not be adequate to compensate us for all losses that may occur. In addition, we cannot provide assurance that we will continue to be able to obtain adequate insurance coverage at an acceptable cost.
The reliability and performance of our Internet connection may be harmed by increased usage or by denial-of-service attacks. The Internet has experienced a variety of outages and other delays as a result of damages to portions of its infrastructure, and it could face outages and delays in the future. These outages and delays could reduce the level of Internet usage as well as the availability of the Internet to us for delivery of our Internet-based services.
We rely on third-party vendors to host and maintain our technology platform.
We rely on third-party vendors to host and maintain our technology platform, including Identifi
®
. Our ability to offer our services and operate our business is therefore dependent on maintaining our relationships with third-party vendors and entering into new relationships to meet the changing needs of our business. Any deterioration in our relationships with such vendors or our failure to enter into agreements with vendors in the future could harm our business, results of operations and financial condition. Despite precautions taken at our vendors’ facilities, the occurrence of a natural disaster, a decision to close the facilities without adequate notice or other unanticipated problems could result in lengthy interruptions in our service. These service interruption events could cause our platform to be unavailable to our partners and impair our ability to deliver services and to manage our relationships with new and existing partners, which in turn could materially affect our results of operations.
If our vendors are unable or unwilling to provide the services necessary to support our business, or if our agreements with such vendors are terminated, our operations could be significantly disrupted. Certain vendor agreements may be unilaterally terminated by the licensor for convenience, and if such agreements are terminated, we may not be able to enter into similar relationships in the future on reasonable terms or at all. We may also incur substantial costs, delays and disruptions to our business in transitioning such services to ourselves or other third-party vendors. In addition, third-party vendors may not be able to provide the services required in order to meet the changing needs of our business.
Our inability to contain health care costs relating to True Health, implement increases in premium rates on a timely basis, maintain adequate reserves for policy benefits or maintain cost effective provider agreements may adversely affect our business and profitability.
The profitability of our health plan business depends in large part on accurately predicting health care costs and on our ability to manage future health care costs through medical management, product design, negotiation of favorable provider contracts and underwriting criteria. Government-imposed limitations on Medicare and Medicaid reimbursement have also caused the private sector to bear a greater share of increasing health care costs. Changes in health care practices, demographic characteristics, inflation, new technologies, the cost of prescription drugs, clusters of high cost cases, changes in the regulatory environment and numerous other factors affecting the cost of health care may adversely affect our ability to predict and manage health care costs, as well as our business, financial condition and results of operations.
In addition to the challenge of managing health care costs, we face pressure to contain premium rates. Our customers may renegotiate their contracts to seek to contain their costs or may move to a competitor to obtain more favorable premiums. Further, federal and state regulatory agencies may restrict our ability to implement changes in premium rates. Fiscal concerns regarding the continued viability of programs such as Medicare and Medicaid may cause decreasing reimbursement rates, including retroactive decreases in Medicaid reimbursement rates, and/or retrospective changes in membership and associated financial responsibility, delays in premium payments or a lack of sufficient increase in reimbursement rates for government-sponsored programs in which we participate. A limitation on our ability to increase or maintain our premium or reimbursement levels or a significant loss of membership resulting from our need to increase or maintain premium or reimbursement levels could adversely affect our business, cash flows, financial condition and results of operations.
The reserves that we establish for health insurance policy benefits and other contractual rights and benefits are based upon assumptions concerning a number of factors, including trends in health care costs, expenses, general economic conditions and other factors. To the extent the actual claims experience is unfavorable as compared to our underlying assumptions, our incurred losses would increase and future earnings could be adversely affected.
The profitability of our health plan business is dependent in part upon our ability to contract on favorable terms with hospitals, physicians, PBM service providers and other health care providers. Physicians, hospitals and other health care providers may refuse to contract with us, and the failure to secure or maintain cost-effective health care provider contracts on competitive terms may result in a loss of membership or higher medical costs, which could adversely affect our business. In addition, consolidation among health care providers, ACO practice management companies, which aggregate physician practices for administrative efficiency and marketing
27
leverage, and other organizational structures that physicians, hospitals and other care providers choose may change the way that these providers interact with us and may change the competitive landscape. Such organizations or groups of physicians may compete directly with us, which may impact our relationship with these providers or affect the way that we price our products and estimate our costs and may require us to incur costs to change our operations, and our business, cash flows, financial condition and results of operations could be adversely affected.
Our inability to contract with providers, or if providers attempt to use their market position to negotiate more favorable contracts or place us at a competitive disadvantage, or the inability of providers to provide adequate care, could adversely affect our business. In addition, we do not have contracts with all providers that render services to our members and, as a result, do not have a pre-established agreement about the amount of compensation those out-of-network providers will accept for the services they render, which can result in significant litigation or arbitration proceedings, or provider attempts to obtain payment from our members for the difference between the amount we have paid and the amount they have charged.
A significant reduction in the enrollment in our health plan could have an adverse effect on our business and profitability.
A significant reduction in the number of enrollees in our health plan could adversely affect our business, cash flows, financial condition and results of operations. Factors that could contribute to a reduction in enrollment include: reductions in workforce by existing customers; general economic downturn that results in business failures and high unemployment rates; employers no longer offering certain health care coverage as an employee benefit or electing to offer coverage on a voluntary, employee-funded basis; participation on public exchanges; federal and state regulatory changes; failure to obtain new customers or retain existing customers; premium increases and benefit changes; negative publicity and news coverage; and failure to attain or maintain nationally recognized accreditations.
We depend on our senior management team, and the loss of one or more of our executive officers or key employees or an inability to attract and retain highly skilled employees could adversely affect our business.
Our success depends largely upon the continued services of our key executive officers and recruitment of additional highly skilled employees. From time to time, there may be changes in our senior management team resulting from the hiring or departure of executives, which could disrupt our business. Hiring executives with needed skills or the replacement of one or more of our executive officers or other key employees would likely involve significant time and costs and may significantly delay or prevent the achievement of our business objectives.
In addition, competition for qualified management in our industry is intense. Many of the companies with which we compete for management personnel have greater financial and other resources than we do. We have not entered into employment agreements with our executive officers. All of our employees are “at-will” employees, and their employment can be terminated by us or them at any time, for any reason and without notice and without the payment of any severance. The departure of key personnel could adversely affect the conduct of our business. In such event, we would be required to hire other personnel to manage and operate our business, and there can be no assurance that we would be able to employ a suitable replacement for the departing individual, or that a replacement could be hired on terms that are favorable to us. In addition, volatility or lack of performance in our stock price may affect our ability to attract replacements should key personnel depart. If we are not able to retain any of our key management personnel, our business could be harmed.
We have recorded a significant amount of goodwill, and we may never realize the full value of our intangible assets, causing us to record impairments that may negatively affect our results of operations.
Our total assets include substantial goodwill. At December 31, 2017, we had
$628.2 million
of goodwill on our Consolidated Balance Sheets related to our one operating segment and reporting unit. Goodwill represents the excess of the purchase price, plus the fair value of any non-controlling interests in the acquiree, over the fair value of identifiable net assets acquired. Goodwill is not amortized, but is reviewed at least annually for indications of impairment, with consideration given to financial performance and other relevant factors. In the first quarter of 2016, we recorded an impairment charge of $160.6 million on our Consolidated Statements of Operations.
While our annual goodwill impairment test is conducted at October 31, we have processes to monitor for interim triggering events. Under GAAP, we review our goodwill for impairment when events or changes in circumstances indicate the carrying value may not be recoverable. Factors that may be considered a change in circumstances indicating that the carrying value of our goodwill may not be recoverable include macroeconomic conditions, industry and market considerations, our overall financial performance including an analysis of our current and projected cash flows, revenue and earnings, a sustained decrease in our share price and other relevant entity-specific events including changes in strategy, customers or litigation.
A detailed discussion of our impairment testing is included in “Part II - Item 7. Management’s Discussion and Analysis of Financial Condition and Results of Operations - Critical Accounting Policies and Estimates.” Subsequent to our 2015 annual impairment testing in the fourth quarter of 2015, our Class A common stock price declined significantly, reaching our historic low in the first quarter of
28
2016. During the three months ended March 31, 2016, our Class A common stock traded between $8.48 and $12.32, or an average Class A common stock price of $10.33 compared to an average Class A common stock price of $19.51 and $14.73 during the three-month periods ended September 30, 2015, and December 31, 2015, respectively. A sustained decline in our Class A common stock price and the resulting impact on our market capitalization is one of several qualitative factors we consider each quarter when evaluating whether events or changes in circumstances indicate it is more likely than not that a potential goodwill impairment exists. We concluded that the further decline in Class A common stock price observed during the first quarter of 2016 did represent a sustained decline and that triggering events occurred during this period requiring an interim goodwill impairment test as of March 31, 2016, ultimately resulting in an impairment charge of $160.6 million.
In addition, following our 2017 annual goodwill review, we concluded that a sustained decline in the average closing price per share of our Class A common stock was an indicator that our goodwill might be impaired and we performed a quantitative goodwill impairment test as of December 14, 2017. Though we determined that fair value was greater than carrying value and goodwill was not impaired as of December 14, 2017, if our Class A common stock price continues to decline or if other indications of impairment exist, we may be required to recognize additional impairments in the future as a result of market conditions or other factors related to our performance, including changes in our forecasted results, investment strategy or interest rates. Any further impairment charges that we may record in the future could be material to our results of operations.
We may need to obtain additional financing which may not be available or, if it is available, may result in a reduction in the ownership of our stockholders.
We may need to raise additional funds in order to:
|
•
|
finance unanticipated working capital requirements;
|
|
•
|
develop or enhance our technological infrastructure and our existing products and services;
|
|
•
|
fund strategic relationships, including joint ventures and co-investments;
|
|
•
|
fund additional implementation engagements;
|
|
•
|
respond to competitive pressures; and
|
|
•
|
acquire complementary businesses, technologies, products or services.
|
Additional financing may not be available on terms favorable to us, or at all. If adequate funds are unavailable or are unavailable on acceptable terms, our ability to fund our expansion strategy, take advantage of unanticipated opportunities, develop or enhance technology or services or otherwise respond to competitive pressures could be significantly limited. If we raise additional funds by issuing equity or convertible debt securities, the ownership of our then-existing stockholders may be reduced, and holders of these securities may have rights, preferences or privileges senior to those of our then-existing stockholders. In addition, any indebtedness we incur and restrictive covenants contained in the agreements related thereto could:
|
•
|
make it difficult for us to satisfy our obligations, including interest payments on any debt obligations;
|
|
•
|
limit our ability to obtain additional financing to operate our business;
|
|
•
|
require us to dedicate a substantial portion of our cash flow to payments on our debt, reducing our ability to use our cash flow to fund capital expenditures and working capital and other general operational requirements;
|
|
•
|
limit our flexibility to plan for and react to changes in our business and the health care industry;
|
|
•
|
place us at a competitive disadvantage relative to our competitors;
|
|
•
|
limit our ability to pursue acquisitions; and
|
|
•
|
increase our vulnerability to general adverse economic and industry conditions, including changes in interest rates or a downturn in our business or the economy.
|
The occurrence of any one of these events could cause a significant decrease in our liquidity and impair our ability to pay amounts due on any indebtedness, and could have a material adverse effect on our business, financial condition and results of operations.
We have experienced net losses in the past and we may not achieve profitability in the future.
We have incurred significant net losses in the past and we anticipate that our operating expenses will increase substantially in the foreseeable future as we continue to invest to grow our business and build relationships with partners, develop our platform, develop new solutions and comply with being a public company. These efforts may prove to be more expensive than we currently anticipate, and we may not succeed in increasing our revenue sufficiently to offset these higher expenses. In addition, to the extent we are successful in increasing our partner base, we could incur increased losses because significant costs associated with entering into partner agreements are generally incurred up front, while revenue under certain of our partner agreements is recognized each period in the month in which the services are delivered. As a result, we may need to raise additional capital through equity and debt financings in order to fund our operations. We may also fail to improve the gross margins of our business. If we are unable to effectively manage these risks and difficulties as we encounter them, our business, financial condition and results of operations may suffer.
29
The requirements of being a public company may strain our resources and distract our management, which could make it difficult to manage our business, especially now that we are no longer an “emerging growth company.”
As a public company, we are required to comply with various regulatory and reporting requirements, including those required by the SEC. Complying with these reporting and other regulatory requirements is time-consuming and will continue to result in increased costs to us and could have a negative effect on our business, financial condition and results of operations.
As a public company, we are subject to the reporting requirements of the Exchange Act and the Sarbanes-Oxley Act. These requirements may place a strain on our systems and resources. The Exchange Act requires that we file annual, quarterly and current reports with respect to our business and financial condition. The Sarbanes-Oxley Act requires that we maintain effective disclosure controls and procedures and internal controls over financial reporting. To maintain and improve the effectiveness of our disclosure controls and procedures, we may need to commit significant resources, hire additional staff and provide additional management oversight. We have been and will be continuing to implement additional procedures and processes for the purpose of addressing the standards and requirements applicable to public companies. Sustaining our growth as a public company also requires us to commit additional management, operational and financial resources to identify new professionals to join our company and to maintain appropriate operational and financial systems to adequately support expansion. These activities may divert management’s attention from other business concerns, which could have a material adverse effect on our business, financial condition and results of operations. We cannot predict or estimate the amount of additional costs we may continue to incur as a result of becoming a public company or the timing of such costs.
We were an “emerging growth company” as defined in the JOBS Act until December 31, 2017. As an emerging growth company, we took advantage of certain temporary exemptions from various reporting requirements, including, but not limited to, a delay in the timeframe required to comply with the auditor attestation requirements of Section 404 of the Sarbanes-Oxley Act and reduced disclosure obligations regarding executive compensation in our periodic reports and proxy statements. Due to the loss of our emerging growth company status, we will no longer be able to take advantage of these exemptions. As a result, we will be required to devote increased management effort and incur additional expenses, which include higher legal fees, accounting and related fees and fees associated with investor relations activities, among others, to ensure compliance with the various reporting requirements. We cannot predict or estimate the amount of additional costs or the timing of such costs.
Our adjusted results may not be representative of our future performance.
In preparing the adjusted results included in our MD&A in this Form 10-K, we have made adjustments to our historical financial information to reflect the Offering Reorganization as if it had occurred on the first day of the relevant period and we have adjusted the results to exclude the impact of purchase accounting adjustments, stock-based compensation expenses and transaction expenses related to the Offering Reorganization, IPO and other transactions as well as certain other adjustments. These adjusted measures do not represent and should not be considered as alternatives to GAAP measurements, and our calculations thereof may not be comparable to similarly entitled measures reported by other companies. See “Part II – Item 7. Management’s Discussion and Analysis of Financial Condition and Results of Operations - Non-GAAP Financial Measures” for additional information.
We are and may become subject to litigation, proceedings, government inquiries, reviews, audits or investigations which could have a material adverse effect on our business, financial condition and results of operations.
We are and may become subject to litigation, proceedings, government inquiries, reviews, audits or investigations in the future, including potential claims against us by our partners, with or without merit. Some of these matters and claims may result in significant defense costs and potentially significant judgments against us, some of which we are not, or cannot be, insured against. We generally intend to defend ourselves vigorously; however, we cannot be certain of the ultimate outcomes of any claims or other matters that may arise in the future. Resolution of these types of matters against us may result in our having to pay significant fines, judgments or settlements, which, if uninsured, or if the fines, judgments and settlements exceed insured levels, could adversely impact our earnings and cash flows, thereby having a material adverse effect on our business, financial condition, results of operations, cash flow and per share trading price of our Class A common stock. Certain litigation, proceedings, government inquiries, reviews, audits or investigations or the resolution of such matters may affect the availability or cost of some of our insurance coverage, which could adversely impact our results of operations and cash flows, expose us to increased risks that would be uninsured and adversely impact our ability to attract directors and officers.
Risks relating to our structure
We are a holding company and our principal asset is our interest in Evolent Health LLC and, accordingly, we are dependent upon distributions from Evolent Health LLC to pay taxes and other expenses, including interest on the 2021 Notes.
We are a holding company and our principal asset is our ownership of Class A common units of Evolent Health LLC. We have no independent means of generating revenue. Evolent Health LLC is treated as a partnership for U.S. federal income tax purposes and, as such, is not itself subject to U.S. federal income tax. Instead, its net taxable income is generally allocated to its members, including us, pro rata according to the number of common units each member owns. Accordingly, we incur income taxes on our allocable share of any net taxable income of Evolent Health LLC and also incur expenses related to our operations. We intend to continue to cause
30
Evolent Health LLC to distribute cash to its members, including us, in an amount sufficient to cover all of our tax liabilities and dividends, if any, declared by us, as well as any payments due under the TRA, as described in “Part II – Item 8. Financial Statements and Supplementary Data - Note
12
- Tax Receivables Agreement.” In addition, we intend to cause Evolent Health LLC to distribute cash to us in an amount sufficient to cover all of our liabilities under our notes. To the extent that we need funds to pay our tax, interest or other liabilities or to fund our operations, and Evolent Health LLC is restricted from making distributions to us under applicable agreements, laws or regulations or does not have sufficient cash to make these distributions, we may have to borrow funds to meet these obligations and operate our business, and our liquidity and financial condition could be materially adversely affected. To the extent that we are unable to make payments under the TRA for any reason, such payments will be deferred and will accrue interest until paid.
We are required to pay certain of our pre-IPO investors for certain tax benefits we may claim in the future, and these amounts are expected to be material.
Class B Exchanges have occurred and will likely occur in the future. Past exchanges have resulted in, and future exchanges are expected to result in, increases in the tax basis of our share of the assets of Evolent Health LLC. These increases in tax basis have increased as a result of past exchanges, and future exchanges may result in increases in the tax basis of the assets of Evolent Health LLC that otherwise would not have been available. In addition, we expect that certain NOLs will be available to us as a result of the transactions as described in “Part II – Item 8. Financial Statements and Supplementary Data - Note
12
- “Tax Receivables Agreement.” These increases in tax basis and NOLs may reduce the amount of tax that we would otherwise be required to pay in the future, although the Internal Revenue Service (“IRS”) may challenge all or a part of the tax basis increases and NOLs, and a court could sustain such a challenge.
We have entered into the TRA, related to the tax basis step-up of the assets of Evolent Health LLC and certain NOLs of the former members of Evolent Health LLC, with the holders of Class B common units and certain of our other investors (the “TRA Holders”).
Pursuant to the TRA, we will pay the TRA Holders 85% of the amount of the cash savings, if any, in U.S. federal, state and local and non-U.S. income tax that we realize as a result of increases in tax basis resulting from exchanges of Class B common units for shares of our Class A common stock (calculated assuming that any post-IPO transfer of Class B common units (other than the exchanges) had not occurred) as well as certain other benefits attributable to payments under the TRA itself.
The TRA also requires us to pay 85% of the amount of the cash savings, if any, in U.S. federal, state and local and non-U.S. income tax that we realize as a result of the utilization of the NOLs of Evolent Health Holdings and an affiliate of TPG attributable to periods prior to our IPO and the deduction of any imputed interest attributable to our payment obligations under the TRA.
The payments that we make under the TRA could be substantial. Assuming no material changes in relevant tax law (after giving effect to the reduction in the corporate income tax rate under the Tax Act) and based on our current operating plan and other assumptions, including our estimate of the tax basis of our assets as of the date of the Offering Reorganization and the estimated tax basis step-ups resulting from each completed exchange, if all of the Class B common units currently outstanding were acquired by us in taxable transactions on December 31, 2017, for a price of $12.30 per Class B common unit (based on the last reported sale price of our Class A common stock on December 29, 2017), we estimate that the total amount that we would be required to pay under the TRA could be approximately
$105.6 million
. This estimated amount includes approximately $17.1 million of potential future payments under the TRA related to the future utilization of the pre-IPO NOLs described above and approximately $80.8 million of potential future payments related to the tax basis step-up of the assets of Evolent Health LLC in connection with the exchanges that occurred in connection with our completed secondary offerings. This estimated amount of approximately
$105.6 million
is less than the approximately $197.5 million we estimated as of August 4, 2017, in connection with our follow-on primary offering; this difference is, in part, attributable to the reduction in the corporate income tax rate under the Tax Act, as described in “Part II - Item 8. Financial Statements and Supplementary Data - Note
12
,” which has the effect of reducing the value of tax attributes that offset taxable income, as well as to the decline in our Class A common stock from $24.60 as of August 4, 2017.
The actual amount we will be required to pay under the TRA may be materially greater than these hypothetical amounts, as potential future payments will vary as a consequence of our tax position, the relevant tax basis analysis, the timing of further exchanges, the price of our Class A common stock at the time of further exchanges, the amount of our Class B common units surrendered in further exchanges, the value of our assets at the time of further exchanges and allocation of our tax basis step-up to such assets, our ability to generate sufficient future taxable income in order to be able to benefit from the aforementioned tax attributes, the character and timing of our taxable income and the income tax rates applicable at the time we realize cash savings attributable to our recognition and utilization of the aforementioned tax attributes. Payments under the TRA are not conditioned on our existing investors’ continued ownership of any of our equity.
31
We will not be reimbursed for any payments made under the TRA in the event that any tax benefits are disallowed.
If the IRS successfully challenges the tax basis increases resulting from the Exchanges or the existence or amount of the pre-IPO NOLs at any point in the future after payments are made under the TRA, we will not be reimbursed for any payments made under the TRA (although future payments under the TRA, if any, would be netted against any unreimbursed payments to reflect the result of any such successful challenge by the IRS). As a result, in certain circumstances, we could be required to make payments under the TRA in excess of our cash tax savings.
We may not be able to realize all or a portion of the tax benefits that are expected to result from the exchanges of Class B common units for our Class A common stock from the utilization of NOLs previously held by Evolent Health Holdings and an affiliate of TPG and from payments made under the TRA.
Our ability to realize the tax benefits that we expect to be available as a result of the increases in tax basis created by any exchanges of Class B common units (together with an equal number of shares of our Class B common stock) for our Class A common stock and by the payments made pursuant to the TRA, and our ability to utilize the pre-IPO NOLs of Evolent Health Holdings and an affiliate of TPG and the interest deductions imputed under the TRA all depend on a number of assumptions, including that we earn sufficient taxable income each year during the period over which such deductions are available and that there are no adverse changes in applicable law or regulations. If our actual taxable income is insufficient or there are adverse changes in applicable law or regulations, we may be unable to realize all or a portion of these expected benefits and our cash flows and stockholders’ equity could be negatively affected. Please refer to the discussion in “Part II – Item 8. Financial Statements and Supplementary Data - Note
12
- Tax Receivables Agreement” for additional information.
In certain circumstances, Evolent Health LLC will be required to make distributions to us and the other members of Evolent Health LLC and the distributions that Evolent Health LLC will be required to make may be substantial.
Evolent Health LLC is treated as a partnership for U.S. federal income tax purposes and, as such, is not subject to U.S. federal income tax. Instead, taxable income is allocated to its members, including us. We intend to cause Evolent Health LLC to make pro rata cash distributions, or tax distributions, to its members in an amount sufficient to allow each member to pay taxes on such member’s allocable share of the net taxable income of Evolent Health LLC. Funds used by Evolent Health LLC to satisfy its tax distribution obligations will not be available for reinvestment in our business. Moreover, these tax distributions may be substantial, and will likely exceed (as a percentage of Evolent Health LLC’s income) the overall effective tax rate applicable to a similarly situated corporate taxpayer. As a result of the potential differences in the amount of net taxable income allocable to us and the Class B common unit holders, it is possible that we will receive distributions significantly in excess of our tax liabilities and obligations to make payments under the TRA. To the extent we do not distribute such cash balances as dividends on our Class A common stock and instead, for example, hold such cash balances or lend them to Evolent Health LLC, the Class B common unit holders would benefit from any value attributable to such accumulated cash balances as a result of their ownership of Class A common stock following an exchange of their Class B common units in Evolent Health LLC (including any exchange upon an acquisition of us). See “Part II – Item 5. Market for Registrant’s Common Equity, Related Stockholder Matters and Issuer Purchases of Equity Securities - Dividends” for a discussion of our dividend policy.
In certain cases, payments by us under the TRA may be accelerated or significantly exceed the tax benefits we realize in respect of the tax attributes subject to the TRA.
The TRA provides that upon certain changes of control, or if, at any time, we elect an early termination of the TRA or are in material breach of our obligations under the TRA, we would be required to make an immediate payment equal to the present value of the anticipated future tax benefits to the holders of Class B common units, the former stockholders of Evolent Health Holdings and the former stockholders of an affiliate of TPG. Such payment would be based on certain valuation assumptions and deemed events set forth in the TRA, including the assumption that we have sufficient taxable income to fully utilize such tax benefits. The benefits would be payable even though, in certain circumstances, no Class B common units are actually exchanged, thereby resulting in no corresponding tax basis step-up at the time of such accelerated payment under the TRA and no NOLs are actually used at the time of the accelerated payment under the TRA. Accordingly, payments under the TRA may be made years in advance of the actual realization, if any, of the anticipated future tax benefits and may be significantly greater than the benefits we realize in respect of the tax attributes subject to the TRA. In these situations, our obligations under the TRA could have a substantial negative impact on our liquidity. We may not be able to finance our obligations under the TRA and any indebtedness we incur may limit our subsidiaries’ ability to make distributions to us to pay these obligations. In addition, our obligations under the TRA could have the effect of delaying, deferring or preventing certain mergers, asset sales, other forms of business combinations or other changes of control that could be in the best interests of holders of our Class A common stock.
32
Different interests among our investors or between our investors and us, including with respect to related party transactions, could prevent us from achieving our business goals.
As of
February 23, 2018
, The Advisory Board and UPMC owned
5.5%
and
8.6%
of our Class A common stock, respectively, while The Advisory Board also owned
66.8%
of our Class B common stock. As of
February 23, 2018
, The Advisory Board and UPMC owned a
7.6%
and
8.3%
economic interest in Evolent Health LLC, respectively. These pre-IPO investors could have business interests that conflict with those of the other investors, which may make it difficult for us to pursue strategic initiatives that require consensus among our owners.
Our relationship with our pre-IPO investors could create conflicts of interest among our investors, or between our investors and us, in a number of areas relating to our past and ongoing relationships. For example, certain of our products and services compete (or may compete in the future) with various products and services of our investors. On November 17, 2017, OptumInsight, Inc., a wholly owned indirect subsidiary of UnitedHealth Group Incorporated (“United”), acquired The Advisory Board. United and its subsidiaries could have business interests that compete or conflict with us and our other investors and we cannot predict how United’s acquisition of The Advisory Board will impact our relationship with The Advisory Board as a shareholder or otherwise.
In addition, our pre-IPO investors may have different tax positions from ours which could influence their decisions regarding whether and when to dispose of assets, whether and when to incur new or refinance existing indebtedness, especially in light of the existence of the TRA, and whether and when Evolent Health, Inc. should terminate the TRA and accelerate its obligations thereunder. In addition, the structuring of future transactions may take into consideration these pre-IPO investors’ tax or other considerations even if no similar benefit would accrue to us. Except as set forth in the TRA and the stockholders’ agreement that we entered into with our pre-IPO investors at the time of our IPO, which we refer to as the stockholders’ agreement, there are not any formal dispute resolution procedures in place to resolve conflicts between us and our pre-IPO investors or among our pre-IPO investors. We may not be able to resolve any potential conflicts between us and a pre-IPO investor and, even if we do, the resolution may be less favorable to us than if we were negotiating with an unaffiliated party.
The agreements between us and certain of our pre-IPO investors were made in the context of an affiliated relationship and may contain different terms than comparable agreements with unaffiliated third parties.
The contractual agreements that we have with certain of our pre-IPO investors were negotiated in the context of an affiliated relationship in which representatives of such pre-IPO investors and their affiliates comprised a significant portion of our board of directors. As a result, the financial provisions, and the other terms of these agreements, such as covenants, contractual obligations on our part and on the part of such pre-IPO investors and termination and default provisions, may be less favorable to us than terms that we might have obtained in negotiations with unaffiliated third parties in similar circumstances, which could have a material adverse effect on our business, financial condition and results of operations.
Risks relating to ownership of our Class A common stock
We expect that our stock price will be volatile and may fluctuate or decline significantly.
The trading price of our Class A common stock is likely to be volatile and subject to wide price fluctuations in response to various factors, including:
|
•
|
economic and political conditions or events;
|
|
•
|
market conditions in the broader stock market in general, or in our industry in particular;
|
|
•
|
actual or anticipated fluctuations in our quarterly financial reports and results of operations;
|
|
•
|
our ability to satisfy our ongoing capital needs and unanticipated cash requirements;
|
|
•
|
indebtedness incurred in the future;
|
|
•
|
introduction of new products and services by us or our competitors;
|
|
•
|
issuance of new or changed securities analysts’ reports or recommendations;
|
|
•
|
sales of large blocks of our stock;
|
|
•
|
additions or departures of key personnel;
|
|
•
|
regulatory developments; and
|
|
•
|
litigation and governmental investigations.
|
These and other factors may cause the market price and demand for our Class A common stock to fluctuate substantially, which may limit or prevent investors from readily selling their shares of Class A common stock, including any shares of Class A common stock they receive upon conversion of our 2021 Notes, and may otherwise negatively affect the liquidity of our Class A common stock. In addition, in the past, when the market price of a stock has been volatile, holders of that stock have instituted securities class action litigation against the company that issued the stock. If any of our stockholders brought a lawsuit against us, we could incur substantial costs defending the lawsuit. Such a lawsuit could also divert the time and attention of our management from our business.
33
The trading market for our Class A common stock will also be influenced by the research and reports that industry or securities analysts publish about us or our business. As a new public company, if one or more of the analysts who cover us downgrades our stock, or if our results of operations do not meet their expectations, our stock price could decline.
The market price of our Class A common stock could decline as a result of issuances by us or sales by our existing stockholders or if a substantial number of shares become available for sale and are sold in a short period of time in the future.
Sales or issuances of substantial amounts of our Class A common stock in the public market by us or sales by our existing stockholders of substantial amounts of our Class A common stock (including by the Advisory Board, who owns
4.1 million
shares of our Class A common stock and
1.8 million
shares of our Class B common stock as of
February 23, 2018
, or by UPMC, who owns
6.4 million
shares of our Class A common stock as of
February 23, 2018
) in the public market could cause the market price of our Class A common stock to decrease significantly. The perception in the public market that these issuances or sales may occur could also depress our market price. As of
February 23, 2018
, there were
74.7 million
shares of Class A common stock outstanding. In addition,
4.3 million
options that are held by our employees are currently exercisable or will be exercisable in 2018.
In connection with acquisitions and other transactions, from time to time we issue shares of our Class A common stock in transactions exempt from registration under the Securities Act. For example, in connection with the acquisition of Valence Health, we issued 6.8
million shares of our Class A common stock in transactions exempt from registration under the Securities Act. See “Part II - Item 8. Financial Statements and Supplementary Data - Note 4” for additional information. The market price of shares of our Class A common stock may drop significantly as a result of the issuance of additional shares, the resale of such shares or when the restrictions on resale by our existing stockholders lapse. A decline in the price of shares of our Class A common stock might impede our ability to raise capital through the issuance of additional shares of our Class A common stock or other equity securities.
The market price of our Class A common stock could decline due to the large number of shares of Class A common stock issuable upon conversion of the 2021 Notes or upon exchange of Class B common units.
The market price of our Class A common stock could decline as a result of sales of a large number of the shares of our Class A common stock issuable upon the conversion of our 2021 Notes or upon the exchange of Class B common units (together with an equal number of shares of our Class B common stock), or the perception that such sales could occur. These sales, or the possibility that these sales may occur, may also make it more difficult for us to raise additional capital by selling equity or equity-linked securities in the future, at a time and price that we deem appropriate.
As of
February 23, 2018
,
74.7 million
shares of our Class A common stock and
2.7 million
Class B common units were outstanding. Up to a maximum of 6.6 million shares of our Class A common stock is reserved for issuance upon the conversion of the 2021 Notes. In addition, each Class B common unit, together with one share of our Class B common stock, is exchangeable for one share of Class A common stock. Pursuant to our registration rights agreement, we granted registration rights to the holders of the Class B common units with respect to their shares of Class A common stock delivered in exchange for their Class B common units, as well as certain other holders of our Class A common stock. Resales of these securities were registered pursuant to our Registration Statement on Form S-3, File No. 333-212709, initially filed on July 28, 2016 and declared effective on August 12, 2016. We cannot assure you if or when any future offerings or resales of these shares may occur.
Some provisions of Delaware law, our second amended and restated certificate of incorporation and our second amended and restated by-laws and certain of our contracts may deter third parties from acquiring us.
Among other things, our second amended and restated certificate of incorporation and our second amended and restated by-laws:
|
•
|
divide our board of directors into three staggered classes of directors that are each elected to three-year terms;
|
|
•
|
prohibit stockholder action by written consent;
|
|
•
|
authorize the issuance of “blank check” preferred stock that could be issued by our board of directors to increase the number of outstanding shares of capital stock, making a takeover more difficult and expensive;
|
|
•
|
prohibit cumulative voting in the election of directors, which would otherwise allow less than a majority of stockholders to elect director candidates;
|
|
•
|
provide that special meetings of the stockholders may be called only by or at the direction of the board of directors, the chairman of our board or the chief executive officer;
|
|
•
|
require advance notice to be given by stockholders for any stockholder proposals or director nominees;
|
|
•
|
require the affirmative vote of holders of at least 75% of the voting power of our outstanding shares of stock to amend certain provisions of our second amended and restated certificate of incorporation and any provision of our second amended and restated by-laws; and
|
|
•
|
require the affirmative vote of holders of at least 75% of the voting power of our outstanding shares of stock to remove directors and only for cause.
|
34
In addition, Section 203 of the DGCL may affect the ability of an “interested stockholder” to engage in certain business combinations, for a period of three years following the time that the stockholder becomes an “interested stockholder.” We have elected in our second amended and restated certificate of incorporation not to be subject to Section 203 of the DGCL. Nevertheless, our second amended and restated certificate of incorporation contains provisions that have the same effect as Section 203 of the DGCL, except that they provide that each of TPG, UPMC and The Advisory Board and their transferees will not be deemed to be “interested stockholders,” and accordingly are not subject to such restrictions.
These and other provisions could have the effect of discouraging, delaying or preventing a transaction involving a change in control of our company or could make it more difficult for stockholders to elect directors of their choosing or to cause us to take other corporate actions that they desire. Provisions in certain of our contracts may also deter third parties from acquiring us. For example, under the UPMC IP Agreement, Evolent Health LLC’s license to certain intellectual property of UPMC would cease if we are acquired by certain specified acquirers. In addition, our contracts with certain partners would terminate if we are acquired by certain competitors.
Our second amended and restated certificate of incorporation and stockholders’ agreement contain provisions renouncing our interest and expectation to participate in certain corporate opportunities identified by or presented to certain of our pre-IPO investors.
Each of TPG, The Advisory Board and UPMC and their respective affiliates (including, in the case of The Advisory Board, its owner, United) may engage in activities similar to ours or lines of business or have an interest in the same areas of corporate opportunities as we do. Our second amended and restated certificate of incorporation and stockholders’ agreement provide that such stockholders and their respective affiliates do not have any duty to refrain from (1) engaging, directly or indirectly, in the same or similar business activities or lines of business as us, including those business activities or lines of business deemed to be competing with us, or (2) doing business with any of our clients, customers or vendors. In the event that TPG, The Advisory Board or UPMC or any of their respective affiliates (including, in the case of The Advisory Board, its owner, United) acquires knowledge of a potential business opportunity which may be a corporate opportunity for us, they have no duty to communicate or offer such corporate opportunity to us. Our second amended and restated certificate of incorporation and stockholders’ agreement also provide that, to the fullest extent permitted by law, none of such stockholders or their respective affiliates will be liable to us, for breach of any fiduciary duty or otherwise, by reason of the fact that any such stockholder or any of its affiliates directs such corporate opportunity to another person, or otherwise does not communicate information regarding such corporate opportunity to us, and we have waived and renounced any claim that such business opportunity constituted a corporate opportunity that should have been presented to us. These potential conflicts of interest could have a material adverse effect on our business, financial condition, results of operations or prospects if attractive business opportunities are allocated by TPG, The Advisory Board or UPMC to themselves or their respective affiliates (including, in the case of The Advisory Board, its owner, United) instead of to us.
Our second amended and restated certificate of incorporation designates courts in the State of Delaware as the sole and exclusive forum for certain types of actions and proceedings that may be initiated by our stockholders, which could limit our stockholders’ ability to obtain a favorable judicial forum for disputes with us or our directors, officers or employees.
Our second amended and restated certificate of incorporation provides that, subject to limited exceptions, the Court of Chancery of the State of Delaware is the sole and exclusive forum for (a) any derivative action or proceeding brought on our behalf, (b) any action asserting a claim of breach of a fiduciary duty owed by any of our directors, officers or other employees to us or our stockholders, (c) any action asserting a claim against us arising pursuant to any provision of the DGCL, our second amended and restated certificate of incorporation or our second amended and restated by-laws, (d) any action to interpret, apply, enforce or determine the validity of our second amended and restated certificate of incorporation or second amended and restated by-laws or (e) any other action asserting a claim against us that is governed by the internal affairs doctrine. We refer to each of these proceedings as a covered proceeding. In addition, our second amended and restated certificate of incorporation provides that if any action the subject matter of which is a covered proceeding is filed in a court other than the specified Delaware courts without the approval of our board of directors, which we refer to as a foreign action, the claiming party will be deemed to have consented to (1) the personal jurisdiction of the specified Delaware courts in connection with any action brought in any such courts to enforce the exclusive forum provision described above and (2) having service of process made upon such claiming party in any such enforcement action by service upon such claiming party’s counsel in the foreign action as agent for such claiming party. Any person or entity purchasing or otherwise acquiring any interest in shares of our capital stock will be deemed to have notice of and to have consented to these provisions. These provisions may limit a stockholder’s ability to bring a claim in a judicial forum that it finds favorable for disputes with us or our directors, officers or other employees, which may discourage such lawsuits against us and our directors, officers and employees. Alternatively, if a court were to find these provisions of our second amended and restated certificate of incorporation inapplicable to, or unenforceable in respect of, one or more of the specified types of actions or proceedings, we may incur additional costs associated with resolving such matters in other jurisdictions, which could adversely affect our business and financial condition.
35
We do not anticipate paying any cash dividends in the foreseeable future.
We currently intend to retain our future earnings, if any, for the foreseeable future to fund the development and growth of our business. We do not intend to pay any dividends to holders of our Class A common stock. As a result, capital appreciation in the price of our Class A common stock, if any, will be your only source of gain on an investment in our Class A common stock. See “Part II – Item 5. Market for Registrant’s Common Equity, Related Stockholder Matters and Issuer Purchases of Equity Securities - Dividends” for a discussion of our dividend policy.
Because we have a material weakness in our internal control over financial reporting and because we have concluded that our internal control over financial reporting is not effective, we may be unable to produce timely and accurate financial statements and this could adversely impact our investors’ confidence and our stock price.
Prior to the completion of our IPO, we were a private company and had limited accounting personnel to fully execute our accounting processes and address our internal control over financial reporting. Upon becoming a publicly-traded company, we became required to comply with the SEC’s rules implementing Sections 302 and 404 of the Sarbanes-Oxley Act, which require management to certify financial and other information in our quarterly and annual reports and provide an annual management report on the effectiveness of controls over financial reporting.
Our management is responsible for establishing and maintaining adequate internal control over financial reporting. Internal control over financial reporting is a process designed to provide reasonable assurance regarding the reliability of financial reporting and the preparation of financial statements in accordance with GAAP. During the course of preparing for our IPO, we determined that we had a material weakness in the design and operating effectiveness of our internal control over financial reporting. A material weakness is a deficiency, or a combination of deficiencies, in internal control over financial reporting such that there is a reasonable possibility that a material misstatement of our annual or interim financial statements will not be prevented or detected on a timely basis. The material weakness that we identified was that we did not maintain a sufficient complement of resources with an appropriate level of accounting knowledge, experience and training to address accounting for complex, non-routine transactions. This material weakness resulted in the revision of the Company’s consolidated financial statements for the quarter ended June 30, 2017. Additionally, this material weakness could result in a misstatement of account balances or disclosures that would result in a material misstatement to the annual or interim consolidated financial statements that would not be prevented or detected. As a result of this material weakness, our management concluded as of December 31, 2016 and as of December 31, 2017 that our internal control over financial reporting was not effective, and also that our disclosure controls and procedures were not effective. In addition, our independent registered public accounting firm has issued an opinion that appears herein indicating that we have not maintained, in all material respects, effective internal control over financial reporting. Because we have been unable to assert that our internal control over financial reporting is effective, or because our independent registered public accounting firm has expressed an opinion that our internal control over financial reporting is not effective, investors may lose confidence in the accuracy and completeness of our financial reports and the market price of our Class A common stock could be negatively affected.
We are currently in the process of remediating the material weakness and have taken numerous steps that we believe will address the underlying causes of the material weakness. Steps we have taken include hiring additional, and reallocating existing, accounting and finance personnel with technical accounting and financial reporting experience, enhancing our training programs within our accounting and finance department, enhancing our internal review procedures during the financial statement close process and refining our existing internal control documentation. This initiative has placed significant demands on our financial and operational resources, as well as our IT systems. Our efforts to design and implement an effective control environment may not be sufficient to remediate or prevent future material weaknesses or significant deficiencies from occurring. The material weakness described above or any newly identified material weakness could result in a misstatement of our financial statements or disclosures that would result in a material misstatement of our annual or interim consolidated financial statements that would not be prevented or detected. A control system, no matter how well designed and operated, can provide only reasonable assurance that the control system’s objectives will be met. Because of the inherent limitations in all control systems, no evaluation of controls can provide absolute assurance that misstatements due to error or fraud will not occur or that all control issues and all instances of fraud will be detected. In addition, if we fail to effectively remediate deficiencies in our control environment, if we identify future material weaknesses in our internal controls over financial reporting or if we are unable to comply with the demands that will be placed upon us as a public company, including the requirements of Section 404 of the Sarbanes-Oxley Act, in a timely manner, we may be unable to accurately report our financial results, or report them within the timeframes required by the SEC. We also could become subject to investigations by the NYSE, the SEC or other regulatory authorities.
Our business and stock price may suffer as a result of our lack of public company operating experience.
Prior to our listing in 2015, we were a privately-held company since we began operations in 2011. Our lack of public company operating experience may make it difficult to forecast and evaluate our future prospects. If we are unable to execute our business strategy, either as a result of our inability to effectively manage our business in a public company environment or for any other reason, our prospects, financial condition, results of operations and stock price may be harmed.
36
Not applicable.
Our corporate headquarters and executive officers are located in Arlington, Virginia, where we occupy approximately 91,000 square feet of office space. We occupy office space in Riverside, Illinois and approximately 90,000 square feet of office space in Chicago, Illinois, each as a result of our acquisition of Valence Health. We also occupy office space in Lisle, Illinois, as a result of our acquisition of Aldera. In addition, we occupy office space in Texas and California and also incur monthly rental expense to have a limited number of personnel on-site at certain client locations. We lease all of our facilities and we do not own any real property. As provided in “Part II – Item 8. Financial Statements and Supplementary Data - Note
9
- Commitments and Contingencies,” the total rental expense on operating leases, net of sublease income, was
$10.9 million
for the year ended December 31,
2017
.
For information regarding legal proceedings, see “Part II – Item 8. Financial Statements and Supplementary Data - Note
9
- Commitments and Contingencies - Litigation Matters.”
Not applicable.
(a) Market and Dividend Information
Market Information
On June 5, 2015, we closed an IPO of our Class A common stock at a price of $17.00 per share. Prior to that time, there was no public market for our stock. Our Class A common stock is traded on the New York Stock Exchange (“NYSE”) under the symbol “EVH.” The following presents the high and low prices for our Class A common stock on the New York Stock Exchange during the periods indicated:
|
2017
|
2016
|
|||||||||||||||
|
Fiscal Period
|
High
|
Low
|
High
|
Low
|
||||||||||||
|
First Quarter
|
$
|
23.35
|
|
$
|
14.50
|
|
$
|
12.80
|
|
$
|
8.14
|
|
||||
|
Second Quarter
|
27.50
|
|
20.75
|
|
19.22
|
|
9.78
|
|
||||||||
|
Third Quarter
|
27.15
|
|
15.00
|
|
26.84
|
|
17.94
|
|
||||||||
|
Fourth Quarter
|
19.20
|
|
10.30
|
|
25.66
|
|
14.70
|
|
||||||||
Our Class B common stock is neither listed nor traded on any stock exchange.
Holders
As of
February 23, 2018
, there were 30 holders of record of our Class A common stock. The number of record holders does not include individuals or entities who beneficially own shares but whose shares are held of record by a broker, bank, or other nominee, but does include each such broker, bank, or other nominee as one record holder. As of
February 23, 2018
, there were three holders of record of our Class B common stock.
Dividends
We have not declared or paid any cash dividends on our common stock. We do not anticipate paying any cash dividends on our Class A common stock for the foreseeable future. Our Class B common stockholders are not entitled to any dividend payments. The timing and amount of future cash dividends, if any, is periodically evaluated by our board of directors and would depend on, among other factors, our current and expected earnings, financial condition, projected cash flows and anticipated financing needs.
38
Performance Graph
The following graph compares the cumulative total stockholder return on our Class A common stock between June 5, 2015, and
December 31, 2017
, to the cumulative total returns of the NASDAQ Health Care Index and the NYSE Composite Index over the same period. This graph assumes an investment of $100 at the closing price of the markets on June 5, 2015, in our Class A common stock, the NASDAQ Health Care Index and the NYSE Composite Index, and assumes the reinvestment of dividends, if any.
The comparisons shown in the following graph are based upon historical data. We caution that the stock price performance shown in the graph below is not necessarily indicative of, nor is it intended to forecast, the potential future performance of our Class A common stock.
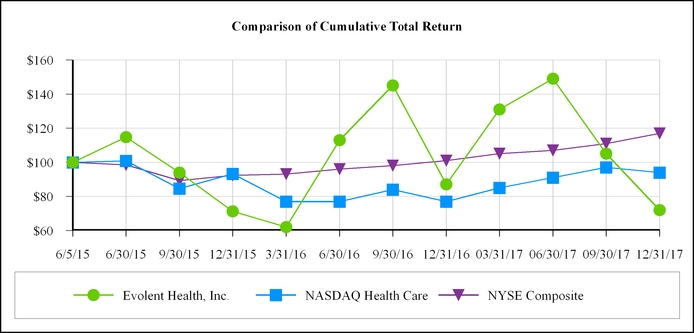
(b) None
(c) None
39
Evolent Health, Inc. is a holding company and its principal asset is all of the Class A common units in its operating subsidiary, Evolent Health LLC, which has owned all of our operating assets and substantially all of our business since inception. Subsequent to the Series B Reorganization on September 23, 2013, and prior to the Offering Reorganization on June 4, 2015, the predecessor of Evolent Health, Inc. accounted for Evolent Health LLC as an equity method investment. As a result, the financial statements of Evolent Health, Inc. for the years ended December 31, 2015, 2014 and 2013, do not reflect a complete view of the operational results for those periods as follows:
|
•
|
Evolent Health, Inc.’s results for 2015 reflect (i) the investment of Evolent Health, Inc.’s predecessor in its equity method investee, Evolent Health LLC, for the period from January 1, 2015, through June 3, 2015, and (ii) the consolidated results of Evolent Health LLC from the time of the Offering Reorganization, or June 4, 2015, through December 31, 2015;
|
|
•
|
Evolent Health, Inc.’s results for 2014 reflect only the investment of Evolent Health, Inc.’s predecessor in its equity method investee, Evolent Health LLC; and
|
|
•
|
Evolent Health, Inc.'s results for 2013 reflect (i) the consolidated results of Evolent Health LLC from January 1, 2013, through September 22, 2013, and (ii) the investment of Evolent Health, Inc.'s predecessor in its equity method investee, Evolent Health LLC, for the period from the date of the Series B Reorganization, or September 23, 2013, through December 31, 2013.
|
The selected financial data (in thousands, except per share data) presented below as of December 31, 2017 and 2016, and for the years ended December 31, 2017, 2016 and 2015 was derived from the audited consolidated financial statements included elsewhere in this Form 10-K. The selected financial data (in thousands, except per share data) presented below as of December 31, 2015, 2014 and 2013, and for the years ended December 31, 2014 and 2013 was derived from our audited consolidated financial statements not included in this Form 10-K. You should read the following selected financial data in conjunction with “Part I - Item 1A. Risk Factors,” “Part II - Item 7. Management’s Discussion and Analysis of Financial Condition and Results of Operations” and the accompanying audited consolidated financial statements and notes to consolidated financial statements included in “Part II - Item 8. Financial Statements and Supplementary Data.” Our historical results are not necessarily indicative of the results that may be expected in future periods.
|
For the Years Ended December 31,
|
|||||||||||||||||||
|
2017
|
2016
|
2015
|
2014
|
2013
|
|||||||||||||||
|
Total revenue
|
$
|
434,950
|
|
$
|
254,188
|
|
$
|
96,878
|
|
$
|
—
|
|
$
|
25,671
|
|
||||
|
Goodwill impairment
|
—
|
|
160,600
|
|
—
|
|
—
|
|
—
|
|
|||||||||
|
Gain on consolidation
|
—
|
|
—
|
|
414,133
|
|
—
|
|
—
|
|
|||||||||
|
Gain on deconsolidation
|
—
|
|
—
|
|
—
|
|
—
|
|
46,246
|
|
|||||||||
|
Income (loss) from equity affiliates
|
(1,755
|
)
|
(841
|
)
|
(28,165
|
)
|
(25,246
|
)
|
(4,241
|
)
|
|||||||||
|
Net income (loss)
|
(69,767
|
)
|
(226,778
|
)
|
319,814
|
|
(25,246
|
)
|
20,023
|
|
|||||||||
|
Per share data:
|
|||||||||||||||||||
|
Net income (loss) - basic
|
$
|
(0.94
|
)
|
$
|
(3.55
|
)
|
$
|
13.14
|
|
$
|
(13.46
|
)
|
$
|
2.51
|
|
||||
|
Net income (loss) - diluted
|
(0.94
|
)
|
(3.55
|
)
|
6.93
|
|
(13.46
|
)
|
0.99
|
|
|||||||||
|
|
|
|
|
||||||||||||||||
|
As of December 31,
|
|||||||||||||||||||
|
2017
|
2016
|
2015
|
2014
|
2013
|
|||||||||||||||
|
Goodwill
|
$
|
628,186
|
|
$
|
626,569
|
|
$
|
608,903
|
|
$
|
—
|
|
$
|
—
|
|
||||
|
Investments in and advances to affiliates
|
1,531
|
|
2,159
|
|
—
|
|
37,203
|
|
50,940
|
|
|||||||||
|
Total assets
|
1,312,697
|
|
1,199,839
|
|
1,015,514
|
|
37,203
|
|
50,940
|
|
|||||||||
|
Long-term debt
|
121,394
|
|
120,283
|
|
—
|
|
—
|
|
—
|
|
|||||||||
|
Redeemable preferred stock
|
—
|
|
—
|
|
—
|
|
39,273
|
|
37,680
|
|
|||||||||
|
Non-controlling interests
|
35,427
|
|
209,588
|
|
285,238
|
|
—
|
|
—
|
|
|||||||||
|
Total equity (deficit)
|
1,046,306
|
|
912,114
|
|
934,579
|
|
(2,070
|
)
|
13,260
|
|
|||||||||
The financial results of Evolent Health LLC were consolidated in the financial statements of Evolent Health, Inc. for the entire twelve-month periods ended December 31, 2017 and 2016, and include the results from Passport, Valence Health and Aldera from February 1, 2016, October 3, 2016, and November 1, 2016, respectively. See “Part II - Item 8. Financial Statements and Supplementary Data - Note 4” for further information about the acquisitions.
40
The following Management’s Discussion and Analysis of Financial Condition and Results of Operations (“MD&A”) is intended to help the reader understand the Company’s financial condition and results of operations. The MD&A is provided as a supplement to, and should be read in conjunction with our consolidated financial statements and the accompanying notes to consolidated financial statements presented in “Part II – Item 8. Financial Statements and Supplementary Data” as well as “Part I - Item 1A. Risk Factors.”
INTRODUCTION
Background and Recent Events
Evolent Health, Inc. is a holding company whose principal asset is all of the Class A common units it holds in Evolent Health LLC, and its only business is to act as sole managing member of Evolent Health LLC. Evolent Health, Inc. was incorporated in the state of Delaware in December 2014 and completed its IPO in June 2015. Substantially all of its operations are conducted through Evolent Health LLC and its consolidated subsidiaries. The financial results of Evolent Health LLC are consolidated in the financial statements of Evolent Health, Inc.
During
2017,
the Company undertook several transactions (including various offerings of its Class A common shares, investments in affiliates and an asset acquisition), some of which may impact year-to-year comparisons. In addition, subsequent to year-end, the Company undertook transactions that may impact our results of operations in future periods. The following is a discussion of certain transactions.
Acquisition of New Mexico Health Connections
On January 2, 2018, the Company, through its wholly-owned subsidiary, True Health, completed its previously announced acquisition of assets related to NMHC’s commercial business. The assets include a health plan management services organization with a leadership team and employee base with experience working locally with providers to run NMHC’s suite of preventive, disease and care management programs. The consideration paid by the Company in connection with the acquisition consisted of
$10.3 million
in cash (subject to certain adjustments), of which
$0.3 million
was deposited in an escrow account. This acquisition is expected to allow the Company to leverage its platform to support a value-based, provider-centric model of care in New Mexico. At the time of the acquisition, the Company also entered into a managed services agreement with NMHC to support its ongoing business. The Company will begin reporting the results of True Health during the first quarter of 2018, and anticipates the results will be presented as a new reportable segment.
Medicaid Opportunities
Following the establishment of our Medicaid Center of Excellence alongside Passport and our acquisitions of Valence Health and Aldera in 2016, the Company has significantly expanded its presence in Medicaid and continues to look for additional ways to expand in the market. A part of the Company’s strategy is to align with providers by participating in state mandated managed Medicaid initiatives. In connection with select initiatives, the Company may create a dedicated managed services organization (“MSO”) in which it would acquire a minority stake and its provider partner would own a majority position. As member lives are added to the MSO through the program, the Company may provide additional financial support to the MSO to support reserve requirements. This support could take the form of provision of letters of credit, loans, equity investments, reinsurance arrangements and other extensions of capital, and the Company has provided and in the future may provide similar forms of support to partners outside of an MSO arrangement.
Securities Offerings
August 2017 Primary Offering
In August 2017, the Company completed a primary offering of 8.8 million shares of its Class A common stock at a price to the public of $19.85 per share and a corresponding price to the underwriters of
$19.01
per share (the “August 2017 Primary”). This offering resulted in net cash proceeds to the Company of approximately
$166.9 million
(gross proceeds of $175.0 million, net of
$8.1 million
in underwriting discounts and stock issuance costs). For each share of Class A common stock issued by Evolent Health, Inc., the Company received a corresponding Class A common unit from Evolent Health LLC in exchange for contributing the issuance proceeds to Evolent Health LLC. As a result of the Class A common stock and Class A common units of Evolent Health LLC issued during the August 2017 Primary, the Company’s economic interest in Evolent Health LLC increased from 96.1% to 96.6% immediately following the August 2017 Primary, and, accordingly, the Company reclassified a portion of its non-controlling interests into shareholders’ equity attributable to Evolent Health, Inc.
41
2017 Secondary Offerings
Certain affiliates of TPG, The Advisory Board, UPMC and Ptolemy Capital (together, the “Investor Stockholders”) have an existing exchange right that allows receipt of newly-issued shares of the Company’s Class A common stock in exchange (a “Class B Exchange”) for an equal number of shares of the Company’s Class B common stock (which are subsequently canceled) and an equal number of Evolent Health LLC’s Class B common units. The Class B common units of Evolent Health LLC received by the Company from relevant Investor Stockholders are simultaneously exchanged for an equivalent number of Class A common units of Evolent Health LLC, and Evolent Health LLC cancels the Class B common units of Evolent Health LLC it receives in the Class B Exchange. The Class B Exchanges and subsequent cancellation of Class B common units of Evolent Health LLC result in an increase in the Company’s economic interest in Evolent Health LLC. The Company did not receive any proceeds from Class B exchanges or the sale of Class A common stock in the secondary offerings described below.
The Investor Stockholders initiated several Class B Exchanges as part of various secondary offerings during 2017, thus increasing the Company’s economic interest in Evolent Health LLC, as discussed below.
June 2017 Secondary Offering
In June 2017, the Company completed a secondary offering of 4.5 million shares of its Class A common stock at a price to the underwriters of $25.87 per share (the “June 2017 Secondary”).
The shares sold in the June 2017 Secondary consisted of 0.7 million existing shares of the Company’s Class A common stock owned and held by certain Investor Stockholders and 3.8 million newly issued shares of the Company’s Class A common stock received by certain Investor Stockholders pursuant to Class B Exchanges.
As a result of these Class B Exchanges and Evolent Health LLC’s cancellation of its Class B common units during the June 2017 Secondary, the Company’s economic interest in Evolent Health LLC increased from 90.5% to 96.1% immediately following the June 2017 Secondary, and, accordingly, the Company reclassified a portion of its non-controlling interests into shareholders’ equity attributable to Evolent Health, Inc.
May 2017 Secondary Offering
In May 2017, the Company completed a secondary offering of 7.0 million shares of its Class A common stock at a price to the underwriters of $24.30 per share (the “May 2017 Secondary”). The shares were sold by the Investor Stockholders and certain management selling stockholders (together with the Investor Stockholders, the “Selling Stockholders”).
The shares sold in the May 2017 Secondary consisted of 3.1 million existing shares of the Company’s Class A common stock owned and held by the Selling Stockholders, 3.8 million newly issued shares of the Company’s Class A common stock received by certain Investor Stockholders pursuant to Class B Exchanges and 0.1 million shares issued upon the exercise of options by certain management selling stockholders.
As a result of these Class B Exchanges and Evolent Health LLC’s cancellation of its Class B common units during the May 2017 Secondary, the Company’s economic interest in Evolent Health LLC increased from 84.9% to 90.5% immediately following the May 2017 Secondary, and, accordingly, the Company reclassified a portion of its non-controlling interests into shareholders’ equity attributable to Evolent Health, Inc.
March 2017 Secondary Offering
In March 2017, the Company completed a secondary offering of 7.5 million shares of its Class A common stock at a price to the underwriters of $19.53 per share (the “March 2017 Secondary”).
The shares sold in the March 2017 Secondary consisted of 3.1 million existing shares of the Company’s Class A common stock owned and held by the Investor Stockholders and 4.4 million newly issued shares of the Company’s Class A common stock received by certain Investor Stockholders pursuant to Class B Exchanges.
As a result of these Class B Exchanges and Evolent Health LLC’s cancellation of its Class B common units during the March 2017 Secondary, the Company’s economic interest in Evolent Health LLC increased from 77.4% to 83.9% immediately following the March 2017 Secondary, and, accordingly, the Company reclassified a portion of its non-controlling interests into shareholders’ equity attributable to Evolent Health, Inc.
In connection with the March 2017 Secondary, the underwriters exercised, in full, their option to purchase an additional 1.1 million shares of Class A common stock (the “March 2017 Option to Purchase Additional Shares”) from the Investor Stockholders at a price of $19.53 per share. The March 2017 Option to Purchase Additional Shares closed on May 1, 2017.
42
The shares sold in the March 2017 Option to Purchase Additional Shares consisted of 0.5 million existing shares of the Company’s Class A common stock owned and held by certain Investor Stockholders. It also included 0.6 million newly issued shares of the Company’s Class A common stock received by certain Investor Stockholders pursuant to Class B Exchanges.
As a result of the Class B Exchanges and Evolent Health LLC’s cancellation of its Class B common units during the March 2017 Option to Purchase Additional Shares, the Company’s economic interest in Evolent Health LLC increased from 83.9% to 84.9% immediately following the March 2017 Option to Purchase Additional Shares, and, accordingly, the Company reclassified a portion of its non-controlling interests into shareholders’ equity attributable to Evolent Health, Inc.
The June 2017 Secondary, May 2017 Secondary, March 2017 Secondary and March 2017 Option to Purchase Additional Shares are collectively referred to as the “2017 Secondary Offerings.”
The Company owned
96.6%
and
77.4%
of the economic interests and
100%
of the voting rights in Evolent Health LLC as of
December 31, 2017
and
2016
, respectively.
Asset Acquisitions
Accordion Health, Inc.
On
June 8, 2017
, the Company entered into an agreement to acquire Accordion for
$3.2 million
(the “Accordion Purchase Agreement”). Accordion provides technology that the Company believes enhances its RAF services to its partners. In addition to technology assets, the software development team from Accordion joined Evolent as full-time employees. Under the terms of the Accordion Purchase Agreement, members of the software development team will be eligible for an additional
$0.8 million
earn-out, contingent upon the completion of specified software development targets.
The Company accounted for the transaction as an asset acquisition as substantially all of the fair value of the gross assets acquired was concentrated in a single identified asset, thus satisfying the requirements of the screen test introduced in ASU 2017-01. The assets acquired in the transaction were measured based on the amount of cash paid to Accordion, including transaction costs, as the fair value of the assets given was more readily determinable than the fair value of the assets received. The Company classified and designated the identifiable assets acquired as a
$3.3 million
technology intangible asset, inclusive of approximately
$0.1 million
of capitalized transaction costs. The Company also assessed and determined the useful life of the acquired intangible assets to be
5
years, and the intangible assets will be amortized on a straight line basis over this period. The Company will account for the contingent earn-out as a post-acquisition expense if the specified software development targets are achieved. The transaction was a taxable stock acquisition and the Company recognized deferred tax liability of approximately
$2.0 million
related to the book-tax basis difference in the acquired asset, which resulted in an income tax benefit related to the reduction in the Company’s previously established valuation allowance, the reduction of which is accounted for outside of acquisition accounting. This amount was recorded as an intangible asset. The deferred tax liability represents a future source of potential taxable income that enables the Company to release some of its previously established valuation allowance, the reduction of which is accounted for outside of acquisition accounting, resulting in income tax benefit.
43
Business Overview
We are a market leader in the new era of health care delivery and payment, in which leading providers are taking on increasing clinical and financial responsibility for the populations they serve. Our purpose-built platform, powered by our technology, proprietary processes and integrated services, enables providers to migrate their economic orientation from FFS reimbursement to value-based payment models. By partnering with providers to accelerate their path to value-based care, we enable our provider partners to expand their market opportunity, diversify their revenue streams, grow market share and improve the quality of the care they provide.
We believe we are pioneers in enabling health systems to succeed in value-based payment models. We were founded in 2011 by members of our management team, UPMC, an integrated delivery system based in Pittsburgh, Pennsylvania, and The Advisory Board, to enable providers to pursue a value-based business model and evolve their competitive position and market opportunity. We consider value-based care to be the necessary convergence of health care payment and delivery. We believe the pace of this convergence is accelerating, driven by price pressure in traditional FFS health care, a market environment that is incentivizing value-based care models and innovation in data and technology. We believe providers are positioned to lead this transition to value-based care because of their control over large portions of health care delivery costs, their primary position with consumers and their strong local brand.
We market and sell our services primarily to major providers throughout the United States. We typically work with our partners in two phases. In the transformation phase, we initially work with our partners to develop a strategic plan for their transition to a value-based care model which includes sizing the market opportunity for our partner and creating a Blueprint for executing that opportunity. During the second portion of the transformation phase, which typically lasts 12 to 15 months, we generally work with our partner to implement the Blueprint by establishing the resources necessary to launch its strategy and capitalize on the opportunity. During the transformation phase, we seek to enter into agreements which we call the platform and operations phase and for which we deliver a wide range of services that support our partner in the execution of its new strategy. Contracts in the platform and operations phase can range from three to ten years in length. In the platform and operations phase, we establish a local market presence and embed our resources alongside our partners. Revenue from these contracts is not guaranteed because certain of these contracts are terminable for convenience by our partners after a notice period has passed, and certain partners would be required to pay us a termination fee in certain circumstances. At times our contracts may be amended to change the nature and price of the services and/or the time period over which they are provided.
As of
December 31, 2017
, we had contractual relationships with over 25 operating partners, and a significant portion of our revenue is concentrated with a single partner
, Passport, which comprised
20.6%
of our revenue for
2017
.
We have incurred operating losses since our inception, as we have invested heavily in resources to support our growth. We intend to continue to invest aggressively in the success of our partners, expand our geographic footprint and further develop our capabilities. We also expect to continue to incur operating losses for the foreseeable future and may need to raise additional capital through equity and debt financings in order to fund our operations. Additional funds may not be available on terms favorable to us or at all. If we are unable to achieve our revenue growth and cost management objectives, we may not be able to achieve profitability. As of the date the financial statements were available to be issued, we believe we have sufficient liquidity for the next 12 months.
We manage our operations and allocate resources as a single reportable segment. All of our revenue is recognized in the United States and all of our long-lived assets are located in the United States.
Critical Accounting Policies and Estimates
We have identified the accounting policies below as critical to the understanding of our results of operations and our financial condition. In applying these critical accounting policies in preparing our financial statements, management must use critical assumptions, estimates and judgments concerning future results or other developments, including the likelihood, timing or amount of one or more future events. Actual results may differ from these estimates under different assumptions or conditions. On an ongoing basis, we evaluate our assumptions, estimates and judgments based upon historical experience and various other information that we believe to be reasonable under the circumstances. For a detailed discussion of other significant accounting policies, see “Part II - Item 8. Financial Statements and Supplementary Data - Note
2
.”
44
Goodwill
We recognize the excess of the purchase price, plus the fair value of any non-controlling interests in the acquiree, over the fair value of identifiable net assets acquired as goodwill. Goodwill is not amortized, but is reviewed at least annually for indications of impairment, with consideration given to financial performance and other relevant factors. Our annual goodwill impairment testing date is October 31. We perform impairment tests between annual tests if an event occurs, or circumstances change, that would more likely than not reduce the fair value of a reporting unit below its carrying amount. We perform impairment tests of goodwill at our single reporting unit level, which is consistent with the way management evaluates our business. Acquisitions to date have been complementary to the Company’s core business, and therefore goodwill is assigned to our single reporting unit to reflect the synergies arising from each business combination.
The Company adopted Accounting Standards Update (“ASU”) 2017-04,
Intangibles-Goodwill and Other - Simplifying the Test for Goodwill Impairment,
effective January 1, 2017. The adoption resulted in an update to our accounting policy for goodwill impairment, which is described below.
Our goodwill impairment analysis first assesses qualitative factors to determine whether events or circumstances existed that would lead the Company to conclude it is more likely than not that the fair value of its reporting unit is below its carrying amount. If the Company determines that it is more likely than not that the fair value of its reporting unit is below the carrying amount, a quantitative goodwill assessment is required. In the quantitative evaluation, the fair value of the relevant reporting unit is determined and compared to the carrying value. If the fair value is greater than the carrying value, then the carrying value is deemed to be recoverable and no further action is required. If the fair value estimate is less than the carrying value, goodwill is considered impaired for the amount by which the carrying amount exceeds the reporting unit’s fair value and a charge is reported in impairment of goodwill on our Consolidated Statements of Operations.
A description of our goodwill impairment tests during
2017
and
2016
follows below.
2017
Goodwill Impairment Tests
On October 31,
2017
, the Company performed its annual goodwill impairment review for fiscal year
2017
. Based on our qualitative assessment, we did not identify sufficient indicators of impairment that would suggest fair value of our single reporting unit was below the carrying value. As a result, a quantitative goodwill impairment analysis was not required.
Following the date of our annual goodwill review, the price of our Class A common stock declined significantly. The average closing price per share of our Class A common stock for the month of November was approximately
$12.01
, a
42.4%
decrease compared to the average closing price for the period from January to October. A sustained decline in the price of our Class A common stock and the resulting impact on our market capitalization is one of several qualitative factors we consider each quarter when evaluating whether events or changes in circumstances indicate it is more likely than not that a potential goodwill impairment exists. We concluded that the decline in the price of our Class A common stock in November did represent a sustained decline and therefore was an indicator that our goodwill might be impaired. The Company proceeded to perform a quantitative goodwill impairment test as of
December 14, 2017
.
Quantitative Assessment Results
To determine the implied fair value for our single reporting unit, we used both a market multiple valuation approach (“market approach”) and a discounted cash flow valuation approach (“income approach”). In determining the estimated fair value using the market approach, we considered the level of our Class A common stock price and assumptions that we believe market participants would make in valuing our reporting unit, including the application of a control premium. In determining the estimated fair value using the income approach, we projected future cash flows based on management’s estimates and long-term plans and applied a discount rate based on the Company’s weighted average cost of capital. This analysis required us to make judgments about revenues, expenses, fixed asset and working capital requirements, the timing of exchanges of our Class B common units, the impact of updated tax legislation, capital market assumptions and other subjective inputs. If the fair value of the reporting unit derived using one approach is significantly different from the fair value estimate using the other approach, the Company re-evaluates its assumptions used in the two models. The fair values determined by the market approach and income approach, as described above, are weighted to determine the concluded fair value for the reporting unit. For purposes of this analysis, the Company weighted the results 70% towards the market approach and 30% towards the income approach, to give greater prominence to the Level 1 inputs used in the market approach.
In our
December 14, 2017
, quantitative assessment, our most sensitive assumption for purposes of the market approach was our estimate of the control premium, and the most sensitive assumption related to the income approach, other than the projected cash flows, was the discount rate. A significant decrease in the control premium or a significant increase in the discount rate in isolation would result in a significantly lower fair value. The concluded fair value under the market approach exceeded carrying value by approximately
$140.4 million
, or
13.4%
. Decreasing the selected control premium of
27.5%
by
300 basis points
(approximately
10%
)
45
would result in the concluded fair value exceeding the carrying value by approximately
$112.3 million
, or
10.7%
. The concluded fair value under the income approach exceeded carrying value by approximately
$233.2 million
, or
22.2%
. Increasing the selected discount rate of
13.0%
by
50 basis points
(approximately
5%
) would result in the concluded fair value exceeding the carrying value by approximately
$164.5 million
, or
15.7%
.
As fair value was greater than carrying value under both the market and income approaches, goodwill was not impaired as of
December 14, 2017
.
As of
December 31, 2017
, Evolent assessed whether there were events or changes in circumstances that would more likely than not reduce the fair value of its goodwill below its carrying amount and require an additional impairment test. The Company determined that there have been no such indicators. Therefore, it was unnecessary to perform an interim goodwill impairment assessment as of
December 31, 2017
.
2016
Goodwill Impairment Tests
As discussed in Notes
2
and
3
of “Item II - Part 8. Financial Statements and Supplementary Data,” we adopted ASU 2017-04 effective January 1, 2017, thus changing our policy with regard to goodwill impairment testing. The discussion below of our goodwill impairment testing during 2016 was performed using a two-step method under our previous policy. Under our previous policy, Step 1 of the goodwill impairment test involved a quantitative calculation of the Company’s fair value, which was then compared to the carrying value. If the fair value estimate was less than the carrying value, it was an indicator that goodwill impairment may exist, and Step 2 was required. In Step 2, the implied fair value of goodwill was determined. The fair value as determined in Step 1 was assigned to all of the Company’s net assets (recognized and unrecognized) as if the entity was acquired in a business combination as of the date of the impairment test. If the implied fair value of goodwill was lower than its carrying amount, goodwill was impaired and written down to its fair value; and a charge was reported in impairment of goodwill on our Consolidated Statements of Operations.
As a result of the Offering Reorganization described in “Item II - Part 8. Financial Statements and Supplementary Data - Note
4
,” we revalued our Consolidated Balance Sheets to the market value of our IPO share price of
$17.00
and recorded
$608.9 million
in goodwill on our Consolidated Balance Sheets.
Subsequent to our 2015 annual impairment testing, our common stock price declined significantly, reaching our historic low in the first quarter of 2016. During the three months ended March 31, 2016, our common stock traded between
$8.48
and
$12.32
, or an average common stock price of
$10.33
compared to an average common stock price of
$19.51
and
$14.73
during the three month periods ended September 30, 2015, and December 31, 2015, respectively. A sustained decline in our common stock price and the resulting impact on our market capitalization is one of several qualitative factors we consider each quarter when evaluating whether events or changes in circumstances indicate it is more likely than not that a potential goodwill impairment exists. We concluded that the further decline in common stock price observed during the first quarter of 2016 did represent a sustained decline and that triggering events occurred during the period requiring an interim goodwill impairment test as of March 31, 2016. As such, we performed a Step 1 impairment test of our goodwill as of March 31, 2016.
Step 1 Results
To determine the implied fair value for our single reporting unit, we used both a market approach and income approach, as described above. In our March 31, 2016, Step 1 test, our most sensitive assumption for purposes of the market approach was our estimate of the control premium, and the most sensitive assumption related to the income approach, other than the projected cash flows, was the discount rate. As of March 31, 2016, our single reporting unit failed the Step 1 analysis as we determined that its implied fair value was less than its carrying value based on the weighting of the fair values determined under both the market and income approaches. As fair value was less than carrying value, we performed a Step 2 test to determine the implied fair value of our goodwill.
Step 2 Results
In our March 31, 2016, Step 2 test, the fair value of all assets and liabilities was estimated, including our tangible assets (corporate trade name, customer relationships and technology), for the purpose of deriving an estimate of the implied fair value of goodwill. The implied fair value of goodwill was then compared to the carrying amount of goodwill, resulting in an impairment charge of
$160.6 million
on our Consolidated Statements of Operations.
The impairment was driven primarily by the sustained decline in our share price as our estimates of our future cash flows and the control premium have remained consistent, combined with an increase in the discount rate period over period. As noted above, our determination of fair value used a weighting of the fair values determined under both the market and income approaches, with the market approach driving the significant reduction in overall firm value and related impairment of goodwill.
46
On October 31,
2016
, the Company performed its annual goodwill impairment review for fiscal year
2016
. Based on our qualitative assessment, we did not identify sufficient indicators of impairment that would suggest fair value was below carrying value. As a result, a quantitative Step 1 goodwill impairment analysis was not required.
As of
December 31, 2016
, Evolent assessed whether there were events or changes in circumstances that would more likely than not reduce the fair value of its goodwill below its carrying amount and require an additional impairment test. The Company determined that there have been no such indicators. Therefore, it was unnecessary to perform an interim goodwill impairment assessment as of
December 31, 2016
.
Intangible Assets, Net
Intangible assets are reviewed for impairment if circumstances indicate the Company may not be able to recover the asset’s carrying value.
Examples of such circumstances include a significant decrease in the market price of a long-lived asset, a significant adverse change in the extent or manner in which a long-lived asset is being used or in its physical condition, or a significant adverse change in legal factors or in the business climate that could affect the value of a long-lived asset.
The Company evaluates recoverability by determining whether the undiscounted cash flows expected to result from the use and eventual disposition of that asset or group exceed the carrying value at the evaluation date. If the undiscounted cash flows are not sufficient to cover the carrying value, the Company measures an impairment loss as the excess of the carrying amount of the long-lived asset or group over its fair value. The estimation of future undiscounted cash flows expected to result from the use and disposition of an asset or group requires significant judgment and future results may vary from current assumptions.
As discussed above, we identified a triggering event and performed a quantitative analysis over the carrying value of our goodwill balance during the fourth quarter of 2017. Identification of the triggering event also triggered an impairment analysis of the carrying value of our intangible asset group. In conjunction with the impairment testing of the carrying value of our goodwill, we performed an analysis to determine whether the carrying amount of our intangible asset group was recoverable. We performed a quantitative analysis, which required management to compare the total pre-tax, undiscounted future cash flows of the intangible asset group to the current carrying amount. The total undiscounted cash flows included only the future cash flows that are directly associated with and that were expected to arise as a result of the use and eventual disposal of the asset group. Based on our quantitative analysis, we determined that the pre-tax, undiscounted cash flows exceeded the carrying value and therefore concluded that our intangible assets were recoverable.
Also as discussed above, our single reporting unit failed the Step 1 test for goodwill impairment during the first quarter of 2016, thus triggering an impairment analysis of the carrying value of our intangible asset group. Based on our Step 1 test for the intangible asset group, we concluded the carrying amount of our intangible assets were recoverable given the pre-tax, undiscounted cash flows exceeded the carrying value of the intangible asset group.
Management did not identify any additional indicators of impairment during
2017
, or for the years ended
December 31,
2016
and
2015
.
Revenue Recognition
Revenue from the Company’s services is recognized when there is persuasive evidence of an arrangement, performance or delivery has occurred, the fee is fixed or determinable and collectability is reasonably assured.
At times, the Company enters into contracts that contain multiple deliverables and we evaluate each deliverable to determine whether it represents a separate unit of accounting based on the following criteria: (i) if the delivered item has value to the customer on a standalone basis, and (ii) if the contract includes a general right of return relative to the delivered item, and delivery or performance of the undelivered item(s) is considered probable and substantially in the control of the vendor. Revenue is then allocated to the units of accounting based on an estimate of each unit’s relative selling price.
Revenue Recognition - Transformation
Transformation contracts consist of strategic assessments, or Blueprint contracts, and implementation contracts. Based on the strategic assessment generated in a Blueprint contract, a customer may decide to move forward with a population health or health plan strategy; in these cases, the customer enters into an implementation contract in which the Company provides services related to the launch of this strategy.
The Company recognizes revenue associated with certain transformation contracts based on a proportionate performance method, where revenue is recognized each period in proportion to the amount of the contract completed during that period. In the case of implementation revenues tied to certain health plan services activities, such revenue is deferred and amortized over the life of the contract. Contract completion is measured using output measures as best estimated by labor hours incurred compared to the total estimated labor hours necessary to complete our performance obligations contained in the contract.
47
Revenue Recognition - Platform and Operations
After the transformation phase, the Company often enters into a multi-year service contract with its customers where various population health, health plan operations, third-party health plan and PBM services are provided on an ongoing basis to the members of the customers’ plans typically in exchange for a monthly service fee, PMPM fee or a percentage of plan premiums. Revenue from these contracts is recognized in the month in which the services are delivered. In certain arrangements, there is a contingent portion of our service fee including meeting service level targets, sharing in rebates, shared medical savings arrangements based on financial performance and other performance measures. The Company continuously monitors its compliance with these arrangements and recognizes revenue when the amount is estimable and there is evidence to support meeting the criteria.
Credits and Discounts
We also provide credits and discounts to our customers often based on achieving certain volume commitments or other criteria. Credits are assessed to determine whether they reflect significant and incremental discounts. If the discounts are significant, the Company allocates them between the contract deliverables or future purchases as appropriate. If the future credit expires unused, it is recognized as revenue at that time.
Stock-based Compensation
The Company sponsors a stock-based incentive plan that provides for the issuance of stock-based awards to employees and non-employee directors of the Company or its consolidated subsidiaries. Our stock-based awards generally vest over a
four
year period and expire
ten
years from the date of grant.
We expense the fair value of stock-based awards included in our incentive compensation plans. The fair value of awards are determined by either the closing price of our stock on the New York Stock Exchange on the grant date for RSUs, or using a Black-Scholes options valuation model for our stock option awards. The Black-Scholes options valuation model requires significant estimates and judgments including:
|
•
|
Expected volatility - Expected volatility is based on the historical volatility of a peer group of public companies over the most recent period commensurate with the estimated expected term of the Company’s awards due to the limited history of our own stock price.
|
|
•
|
Expected term - The expected term of the options granted represents the weighted-average period of time from the grant date to the date of exercise, expiration or cancellation based on the midpoint convention.
|
|
•
|
Dividend rate - The dividend rate is based on the expected dividend rate during the expected life of the option.
|
|
•
|
Risk-free interest rate - The risk-free interest rate is based on the U.S. Treasury yield curve in effect at the time of the grant.
|
The fair value of the awards is expensed over the performance or service period, which generally corresponds to the vesting period, on a straight-line basis and is recognized as an increase to additional paid-in capital. Stock-based compensation expense is reflected in “Cost of revenue” and “Selling, general and administrative expenses” in our Consolidated Statements of Operations. Additionally we capitalize personnel expenses attributable to the development of internal-use software, which include stock-based compensation costs. We recognize share-based award forfeitures as they occur.
Income Taxes
Significant management judgment is required in determining our provision for income taxes, our deferred tax assets and liabilities and any valuation allowance recorded against our net deferred tax assets. We make these estimates and judgments about our future taxable income based on assumptions that are consistent with our future plans.
We are a holding company and our assets consist of our direct ownership in Evolent Health LLC, for which we are the managing member. Evolent Health LLC is classified as a partnership for U.S. federal and applicable state and local income tax purposes and, as such, is not subject to U.S. federal, state and local income taxes. Taxable income or loss generated by Evolent Health LLC is allocated to holders of its units, including us, on a pro rata basis. Accordingly, we are subject to U.S. federal, state and local income taxes with respect to our allocable share of any taxable income of Evolent Health LLC.
Adoption of New Accounting Standards
In November 2016, the FASB issued Accounting Standards Update ASU 2016-18, which reduces diversity in practice regarding the classification and presentation of changes in restricted cash on the statement of cash flows. The Company elected to early adopt ASU 2016-18 effective December 15, 2017.
48
The amendments in the ASU require that a statement of cash flows explain the change during the period in the total of cash, cash equivalents, and amounts generally described as restricted cash or restricted cash equivalents. Therefore, amounts generally described as restricted cash and restricted cash equivalents should be included with cash and cash equivalents when reconciling the beginning-of-period and end-of-period total amounts shown on the statement of cash flows.
A significant portion of the Company’s restricted cash consists of cash held on behalf of partners to process PBM claims. These are pass-through amounts and can fluctuate materially from period to period depending on the timing of when the claims are processed. Under the previous standard, there was no net impact to the statement of cash flows related to these amounts as the change in accounts payable was offset by the change in restricted cash. Upon adoption of ASU 2016-18, the change in restricted cash held on behalf of PBM partners would no longer net to zero, thereby potentially having a significant impact on cash flows from operations period over period. Given the pass-through nature of these PBM claim payments, the change in restricted cash held on behalf of PBM partners will be presented within cash flows from financing activities on our statements of changes in cash flows under the updated requirements of ASU 2016-18.
The following table summarizes the impact of the change in accounting principle to the Company’s Consolidated Statements of Cash Flows for the years ended December 31, 2017, 2016 and 2015 (in thousands):
|
Prior to
|
Adoption
|
||||||||||
|
Adoption
|
Adjustments
|
As Reported
|
|||||||||
|
For the year ended December 31, 2017
|
|||||||||||
|
Cash Flows from Investing Activities
|
|||||||||||
|
Change in restricted cash and restricted investments
|
$
|
(29,471
|
)
|
$
|
29,471
|
|
$
|
—
|
|
||
|
Purchase of restricted investments
|
—
|
|
(3,805
|
)
|
(3,805
|
)
|
|||||
|
Net cash and restricted cash provided by (used in) investing activities
|
(37,931
|
)
|
25,666
|
|
(12,265
|
)
|
|||||
|
Cash Flows from Financing Activities
|
|||||||||||
|
Change in restricted cash held on behalf of partners for claims processing
|
—
|
|
(4,200
|
)
|
(4,200
|
)
|
|||||
|
Net cash and restricted cash provided by (used in) financing activities
|
169,758
|
|
(4,200
|
)
|
165,558
|
|
|||||
|
Net increase (decrease) in cash and cash equivalents and restricted cash
|
103,868
|
|
21,466
|
|
125,334
|
|
|||||
|
Cash and cash equivalents and restricted cash as of beginning-of-period
|
134,563
|
|
35,466
|
|
170,029
|
|
|||||
|
Cash and cash equivalents and restricted cash as of end-of-period
|
$
|
238,431
|
|
$
|
56,932
|
|
$
|
295,363
|
|
||
|
As Originally
|
|||||||||||
|
Reported
|
Adjustments
|
As Adjusted
|
|||||||||
|
For the year ended December 31, 2016
|
|||||||||||
|
Cash Flows from Investing Activities
|
|||||||||||
|
Change in restricted cash and restricted investments
|
$
|
(6,090
|
)
|
$
|
6,090
|
|
$
|
—
|
|
||
|
Purchase of restricted investments
|
—
|
|
(4,950
|
)
|
(4,950
|
)
|
|||||
|
Net cash and restricted cash provided by (used in) investing activities
|
(97,797
|
)
|
1,140
|
|
(96,657
|
)
|
|||||
|
Cash Flows from Financing Activities
|
|||||||||||
|
Change in restricted cash held on behalf of partners for claims processing
|
—
|
|
28,041
|
|
28,041
|
|
|||||
|
Net cash and restricted cash provided by (used in) financing activities
|
122,144
|
|
28,041
|
|
150,185
|
|
|||||
|
Net increase (decrease) in cash and cash equivalents and restricted cash
|
(11,163
|
)
|
29,181
|
|
18,018
|
|
|||||
|
Cash and cash equivalents and restricted cash as of beginning-of-period
|
145,726
|
|
6,285
|
|
152,011
|
|
|||||
|
Cash and cash equivalents and restricted cash as of end-of-period
|
$
|
134,563
|
|
$
|
35,466
|
|
$
|
170,029
|
|
||
|
As Originally
|
|||||||||||
|
Reported
|
Adjustments
|
As Adjusted
|
|||||||||
|
For the year ended December 31, 2015
|
|||||||||||
|
Cash Flows from Financing Activities
|
|||||||||||
|
Change in restricted cash held on behalf of partners for claims processing
|
$
|
—
|
|
$
|
6,285
|
|
$
|
6,285
|
|
||
|
Net cash and restricted cash provided by (used in) financing activities
|
207,878
|
|
6,285
|
|
214,163
|
|
|||||
|
Net increase (decrease) in cash and cash equivalents and restricted cash
|
145,726
|
|
6,285
|
|
152,011
|
|
|||||
|
Cash and cash equivalents and restricted cash as of beginning-of-period
|
—
|
|
—
|
|
—
|
|
|||||
|
Cash and cash equivalents and restricted cash as of end-of-period
|
$
|
145,726
|
|
$
|
6,285
|
|
$
|
152,011
|
|
||
49
In May 2014, the FASB issued ASU 2014-09,
Revenue from Contracts with Customers
, in order to clarify the principles of recognizing revenue. This standard establishes the core principle of recognizing revenue to depict the transfer of promised goods or services in an amount that reflects the consideration to which the entity expects to be entitled in exchange for those goods or services. The FASB defines a five-step process that systematically identifies the various components of the revenue recognition process, culminating with the recognition of revenue upon satisfaction of an entity’s performance obligations. By completing all five steps of the process, the core principles of revenue recognition will be achieved. In March 2016, the FASB issued an update to the new revenue standard (ASU 2014-09) in the form of ASU 2016-08, which amended the principal-versus-agent implementation guidance and illustrations in the new revenue guidance. The update clarifies that an entity should evaluate whether it is the principal or the agent for each specified good or service promised in a contract with a customer. In April 2016, the FASB issued another update to the new revenue standard in the form of ASU 2016-10, which amended the guidance on identifying performance obligations and the implementation guidance on licensing. These ASUs were followed by two further updates issued during May 2016: ASU 2016-11, which rescinds certain SEC guidance, such as the adoption of ASUs 2014-09 and 2014-16, including accounting for consideration given by a vendor to a customer, and ASU 2016-12, which is intended to clarify the objective of the collectability criterion while identifying the contract(s) with a customer. The new revenue standard (including updates) is effective for annual and interim reporting periods beginning after December 15, 2017, with early adoption permitted only as of annual reporting periods beginning after December 15, 2016. The guidance permits two methods of adoption: i) the full retrospective method applying the standard to each prior reporting period presented, or ii) the modified retrospective method with a cumulative effect of initially applying the guidance recognized at the date of initial application. The standard also allows entities to apply certain practical expedients at their discretion. We adopted this standard effective January 1, 2018, using the modified retrospective method with a cumulative catch up adjustment and providing additional disclosures comparing results to previous rules. We anticipate that the adoption of the standard will result in changes related to revenue recognition for certain contracts that contain features, such as variable consideration. These changes will generally accelerate revenue recognition. In addition, certain customer setup costs which have historically been expensed as incurred will be capitalized. We are making changes to our accounting policies and practices, business processes, systems and controls to support the new revenue recognition and disclosure requirements. We have also updated our internal controls related to revenue recognition and contract costs to address internal controls over financial reporting necessary to ensure compliance with ASC 606 and ASC 340-40.
We have preliminarily assessed the cumulative impact of adopting the standard as of January 1, 2018, to be an increase in stockholders’ equity of approximately
$15.0 million
to
$18.0 million
, primarily as a result of deferral of expenses related to contract acquisition and fulfillment costs and acceleration of revenue due to variable consideration estimation.
In February 2016, the FASB issued ASU 2016-02,
Leases
, in order to establish the principles to report transparent and economically neutral information about the assets and liabilities that arise from leases.
This update introduces a new standard on accounting for leases, including a lessee model that brings most leases on the balance sheet. The new standard also aligns many of the underlying principles of the new lessor model with those in ASC 606, the FASB’s new revenue recognition standard (e.g., those related to evaluating when profit can be recognized). The standard also requires lessors to increase the transparency of their exposure to changes in value of their residual assets and how they manage that exposure. The ASU is effective for fiscal years beginning after December 15, 2018, including interim periods within those fiscal years. Early application is permitted. We intend to adopt the requirements of this standard effective January 1, 2019, and are currently evaluating the impact of the adoption on our financial condition and results of operations.
In June 2016, the FASB issued ASU 2016-13,
Financial Instruments - Credit Losses: Measurement of Credit Losses on Financial Instruments
. With respect to assets measured at amortized cost, such as held-to-maturity assets, the update requires presentation of the amortized cost net of a credit loss allowance. The update eliminates the probable initial recognition threshold that was previously required prior to recognizing a credit loss on financial instruments. The credit loss estimate can now reflect an entity’s current estimate of all future expected credit losses as opposed to the previous standard, when an entity only considered past events and current conditions. With respect to available for sale debt securities, the update requires that credit losses be presented as an allowance rather than as a write-down. The update is effective for fiscal years beginning after December 15, 2019, including interim periods within those fiscal years. Early adoption is permitted as of the fiscal years beginning after December 15, 2018, including interim periods within those fiscal years. We intend to adopt the requirements of this standard effective January 1, 2020, and are currently evaluating the impact of the adoption on our financial condition and results of operations.
See “Part II - Item 8. Financial Statements and Supplementary Data - Note
3
” for further information about the Company’s adoption of new accounting standards.
50
RESULTS OF OPERATIONS
Evolent Health, Inc. is a holding company and its principal asset is all of the Class A common units in Evolent Health LLC, which has owned all of our operating assets and substantially all of our business since inception. Subsequent to the Series B Reorganization on September 23, 2013, and prior to the Offering Reorganization on June 4, 2015, the predecessor of Evolent Health, Inc. accounted for Evolent Health LLC as an equity method investment. As a result, the financial statements of Evolent Health, Inc. for the year ended December 31, 2015, do not reflect a complete view of the operational results for those periods as follows:
|
•
|
Evolent Health, Inc.’s results for 2015 reflect (i) the investment of Evolent Health, Inc.’s predecessor in its equity method investee, Evolent Health LLC, for the period from January 1, 2015, through June 3, 2015, and (ii) the consolidated results of Evolent Health LLC from the time of the Offering Reorganization, or June 4, 2015, through December 31, 2015.
|
The financial results of Evolent Health LLC were consolidated in the financial statements of Evolent Health, Inc. for the entire twelve- month periods ended December 31, 2017 and 2016.
Key Components of our Results of Operations
Revenue
We derive our revenue from two sources: transformation and platform and operations services. We collect a fixed fee from our partners during the transformation phase and revenue is recognized based upon proportionate performance over the life of the engagement. In the case of implementation revenues tied to certain health plan services activities, such revenue is deferred and amortized over the life of the contract. Transformation revenue can fluctuate based on both the timing of when contracts are executed with partners, the scope of the delivery and the timing of work being performed. During the platform and operations phase, our revenue structure shifts to a primarily variable fee structure which typically includes a monthly payment that is calculated based on a specified rate, or per member per month, multiplied by the number of members that our partners are managing under a value-based care arrangement or a percentage of plan premiums. The platform and operations agreements often include contingent fees such as service level agreements, shared medical savings arrangements and other performance measures which are recognized when the amount is estimable and there is evidence to support meeting the criteria. In some cases, we recognize revenue when the cash is received as we have limited data to support our estimate. Our platform and operations revenue may vary based on the nature of the population, the timing of new populations transitioning to our platform and the type of services being utilized by our partners. After a specified period, certain of our platform and operations contracts are terminable for convenience by our partners after a notice period has passed and the partner has paid a termination fee. We also have arrangements with multiple deliverables (including both transformation and platform and operations components) and we evaluate the deliverables to determine whether they represent a separate unit of accounting. Revenue is then allocated to the units of accounting based on each unit’s relative selling price.
Cost of revenue (exclusive of depreciation and amortization)
Our cost of revenue includes direct expenses and shared resources that perform services in direct support of clients. Costs consist primarily of employee-related expenses (including compensation, benefits and stock-based compensation), expenses for TPA support and other services, as well as other professional fees.
Selling, general and administrative expenses
Our selling, general and administrative expenses consist of employee-related expenses (including compensation, benefits and stock-based compensation) for selling and marketing, corporate development, finance, legal, human resources, corporate information technology, professional fees and other corporate expenses associated with these functional areas. Selling, general and administrative expenses also include costs associated with our centralized infrastructure and research and development activities to support our network development capabilities, PBM administration, technology infrastructure, clinical program development and data analytics.
Depreciation and amortization expense
Depreciation and amortization expenses consist of the amortization of intangible assets associated with the step up in fair value of Evolent Health LLC’s assets and liabilities for the Offering Reorganization, amortization of intangible assets recorded as part of the Vestica, Valence Health, Aldera and Accordion transactions and depreciation of property and equipment, including the amortization of capitalized software.
51
Evolent Health, Inc. Results
|
For the Years Ended
|
Change Over
|
For the Years Ended
|
Change Over
|
||||||||||||||||||||||||
|
December 31,
|
Prior Period
|
December 31,
|
Prior Period
(1)
|
||||||||||||||||||||||||
|
(in thousands)
|
2017
|
2016
(2)
|
$
|
%
|
2016
(2)
|
2015
|
$
|
%
|
|||||||||||||||||||
|
Revenue
|
|||||||||||||||||||||||||||
|
Transformation
|
$
|
29,466
|
|
$
|
38,320
|
|
$
|
(8,854
|
)
|
(23.1)%
|
$
|
38,320
|
|
$
|
19,906
|
|
$
|
18,414
|
|
N/A
|
|||||||
|
Platform and operations
|
405,484
|
|
215,868
|
|
189,616
|
|
87.8%
|
215,868
|
|
76,972
|
|
138,896
|
|
N/A
|
|||||||||||||
|
Total revenue
|
434,950
|
|
254,188
|
|
180,762
|
|
71.1%
|
254,188
|
|
96,878
|
|
157,310
|
|
N/A
|
|||||||||||||
|
Expenses
|
|||||||||||||||||||||||||||
|
Cost of revenue (exclusive of
|
|||||||||||||||||||||||||||
|
depreciation and amortization
|
|||||||||||||||||||||||||||
|
expenses presented separately below)
|
269,352
|
|
155,177
|
|
114,175
|
|
73.6%
|
155,177
|
|
57,398
|
|
97,779
|
|
N/A
|
|||||||||||||
|
Selling, general and
|
|||||||||||||||||||||||||||
|
administrative expenses
|
205,670
|
|
160,692
|
|
44,978
|
|
28.0%
|
160,692
|
|
75,286
|
|
85,406
|
|
N/A
|
|||||||||||||
|
Depreciation and amortization expenses
|
32,368
|
|
17,224
|
|
15,144
|
|
87.9%
|
17,224
|
|
7,166
|
|
10,058
|
|
N/A
|
|||||||||||||
|
Goodwill impairment
|
—
|
|
160,600
|
|
(160,600
|
)
|
(100.0)%
|
160,600
|
|
—
|
|
160,600
|
|
N/A
|
|||||||||||||
|
Loss (gain) on change in fair value
|
|||||||||||||||||||||||||||
|
of contingent consideration
|
400
|
|
(2,086
|
)
|
2,486
|
|
(119.2)%
|
(2,086
|
)
|
—
|
|
(2,086
|
)
|
N/A
|
|||||||||||||
|
Total operating expenses
|
507,790
|
|
491,607
|
|
16,183
|
|
3.3%
|
491,607
|
|
139,850
|
|
351,757
|
|
N/A
|
|||||||||||||
|
Operating income (loss)
|
$
|
(72,840
|
)
|
$
|
(237,419
|
)
|
$
|
164,579
|
|
69.3%
|
$
|
(237,419
|
)
|
$
|
(42,972
|
)
|
$
|
(194,447
|
)
|
N/A
|
|||||||
|
Transformation revenue as
|
|||||||||||||||||||||||||||
|
a % of total revenue
|
6.8
|
%
|
15.1
|
%
|
15.1
|
%
|
20.5
|
%
|
|||||||||||||||||||
|
Platform and operations revenue
|
|||||||||||||||||||||||||||
|
as a % of total revenue
|
93.2
|
%
|
84.9
|
%
|
84.9
|
%
|
79.5
|
%
|
|||||||||||||||||||
|
Cost of revenue as a %
|
|||||||||||||||||||||||||||
|
of total revenue
|
61.9
|
%
|
61.0
|
%
|
61.0
|
%
|
59.2
|
%
|
|||||||||||||||||||
|
Selling, general and administrative
|
|||||||||||||||||||||||||||
|
expenses as a % of total revenue
|
47.3
|
%
|
63.2
|
%
|
63.2
|
%
|
77.7
|
%
|
|||||||||||||||||||
(1)
As a result of the Offering Reorganization, the operational results for the year ended December 31, 2015, do not reflect a complete view of the Company’s operations for that period. Therefore, we believe that a comparison of the year ended December 31, 2016, which reflects the full operations of Evolent Health LLC for that entire period, to the year ended December 31, 2015, would not yield a meaningful comparison for the reader. As such, we have excluded the presentation of percentage changes from the table above. See “Part II - Item 8. Financial Statements and Supplementary Data - Note
4
” for further information regarding the Offering Reorganization.
(2)
Results for the year ended December 31, 2016, include the results of Passport, Valence Health and Aldera from February 1, 2016, October 3, 2016 and November 1, 2016, respectively. See “Part II - Item 8. Financial Statements and Supplementary Data - Note
4
” for further information regarding these transactions.
Comparison of the Results for the Year Ended December 31,
2017
to
2016
Revenue
Total revenue increased by
$180.8 million
, or
71.1%
, to
$435.0 million
for the year ended
December 31, 2017
, as compared to
2016
.
Transformation revenue decreased by
$8.9 million
, or
23.1%
, to
$29.5 million
for the year ended
December 31, 2017
, as compared to
2016
, due primarily to the fact that our offering has become more product-oriented, thereby resulting in a lower average transformation revenue per newly added partner. As a result, we expect transformation revenue to continue to decrease as a percentage of total revenue. Transformation revenue accounted for
6.8%
and
15.1%
of our total revenue for the years ended
December 31, 2017
and
2016
, respectively.
Platform and operations revenue accounted for
93.2%
and
84.9%
of our total revenue for the years ended
December 31, 2017
and
2016
, respectively. Platform and operations revenue increased by
$189.6 million
, or
87.8%
, to
$405.5 million
for the year ended
December 31, 2017
, as compared to
2016
, primarily as a result of additional revenue from business combinations and aggregate enrollment growth of
34.8%
from approximately
2.0 million
lives on our platform as of
December 31, 2016
, to approximately
2.7 million
lives on our platform as of
December 31, 2017
. We had over 25 operating
partners as of
December 31, 2017
and
2016
.
52
Cost of Revenue
Cost of revenue increased by
$114.2 million
, or
73.6%
, to
$269.4 million
for the year ended
December 31, 2017
, as compared to
2016
. Cost of revenue increased period over period as a result of our business combinations during the fourth quarter of 2016
. We incurred additional personnel costs and professional fees of
$74.7 million
and
$14.3 million
, respectively, to support our growing customer base and service offerings. Approximately
$1.4 million
and
$2.7 million
of total personnel costs was attributable to stock-based compensation expense for the
years ended
December 31, 2017
and
2016
, respectively. Additionally, our technology services, TPA fees and other costs increased by
$25.2 million
period over period. The increase is attributable to costs to support our growth. Transaction and other acquisition-related costs accounted for approximately
$5.5 million
and
$2.8 million
of cost of revenue for the
years ended
December 31, 2017
and
2016
, respectively. Cost of revenue
represented
61.9%
and
61.0%
of total revenue for the years ended
December 31, 2017
and
2016
, respectively. Our cost of revenue increased as a percentage of our total revenue as we integrated new businesses acquired during the fourth quarter of 2016; however, we expect our cost of revenue to decrease as a percentage of total revenue going forward.
Selling, General and Administrative Expenses
Selling, general, and administrative expenses increased by
$45.0 million
, or
28.0%
, to
$205.7 million
for the year ended
December 31, 2017
, as compared to
2016
.
During the
year ended
December 31, 2017
, we incurred additional selling, general, and administrative expenses due partially to growth in our business resulting from our business combinations during the fourth quarter of 2016. Our selling, general and administrative expenses period over period also increased as a result of additional personnel costs, in areas such as business development, research and development and general overhead, of
$26.1 million
. Approximately
$19.1 million
and
$19.8 million
of total personnel costs were attributable to stock-based compensation expense for the
years ended
December 31, 2017
and
2016
, respectively. Additionally, technology costs, professional fees and other costs increased
$5.6 million
,
$9.2 million
and
$4.1 million
, respectively, period over period, as a result of the growing customer base and service offerings and the Passport, Valence Health and Aldera transactions. Transaction and other acquisition-related costs accounted for approximately
$10.5 million
and
$6.5 million
of total selling, general and administrative expenses for the
years ended
December 31, 2017
and
2016
, respectively. Selling, general and administrative expenses for the year ended December 31, 2016, also included a one-time charge of approximately
$6.5 million
related to a lease abandonment expense incurred as a result of the Valence Health acquisition. Selling, general and administrative expenses represented
47.3%
and
63.2%
of total revenue for the
years ended
December 31, 2017
and
2016
, respectively. While our selling, general and administrative expenses are expected to grow as our business grows, we
expect them to decrease as a percentage of our total revenue over the long term.
Depreciation and Amortization Expenses
Depreciation and amortization expens
es increased
$15.1 million
, or
87.9%
, to
$32.4 million
for the
year ended
December 31, 2017
, as compared to
2016
. The increase was due primarily to additional depreciation and amortization expenses related to assets acquired through business combinations and asset acquisitions in 2017 and the fourth quarter of 2016 and the continued capitalization of internal-use software. We expect depreciation and amortization expenses to increase in future periods as we continue to capitalize internal-use software and amortize intangible assets resulting from asset acquisitions and business combinations (including possible future transactions).
Goodwill impairment
During the first quarter of 2016, we recorded an impairment charge of
$160.6 million
on our consolidated statements of operations as the implied fair value of goodwill was less than the carrying amount. See “Part II - Item 8.
Financial
Statements
and Supplementary Data - Note
7
” for further details of the impairment charge to goodwill.
Loss on change in fair value of contingent consideration
Loss on change in fair value of contingent consideration was
$0.4 million
for the year ended
December 31, 2017
, as compared to a gain of
$2.1 million
in
2016
. This increase was the result of changes in value of mark-to-market contingent liabilities acquired through business combinations during 2016. See “Part II - Item 8.
Financial
Statements
and Supplementary Data
- Note
16
” for further details regarding the fair value of our mark-to-market contingent liabilities.
Discussion of Non-Operating Results
Interest income
Interest income consists of interest from investing cash in money market funds and interest from both our short-term and long-term investments. Interest income increased by approximately $0.7 million for the year ended December 31, 2017, compared to 2016, as a result of additional interest income generated from cash received from the August 2017 Primary Offering.
53
Interest expense
In
December 2016
, the Company issued
$125.0 million
aggregate principal amount of its
2.00%
Convertible Senior Notes due
2021
. Holders of the 2021 Notes are entitled to interest, which is payable semiannually in arrears on
June 1
and
December 1
of each year, beginning on
June 1, 2017
, at a rate equal to
2.00%
per annum. In addition, we incurred
$4.6 million
of debt issuance costs in connection with the 2021 Notes, which we are amortizing to non-cash interest expense over the contractual term of the 2021 Notes. We recorded interest expense (including amortization of deferred financing costs) of approximately
$3.4 million
and
$0.2 million
related to our 2021 Notes for the years ended
December 31, 2017
and
2016
. See “Part II - Item 8.
Financial
Statements
and Supplementary Data - Note
8
” for further details of the convertible debt offering.
Income (loss) from affiliate
During 2017 and 2016, the Company acquired economic interests in several entities that are accounted for under the equity method of accounting. The Company is allocated its proportional share of the investees’ earnings and losses each reporting period.
The Company’s proportional share of the losses from these investments was approximately
$1.8 million
and
$0.8 million
for the years ended
December 31, 2017
and
2016
, respectively. The equity method investments are further discussed at “Part II - Item 8.
Financial
Statements
and Supplementary Data - Note
14
.”
Provision (benefit) for income taxes
Our income tax expense relates to federal and state jurisdictions in the United States. The difference between our effective tax rate and our statutory rate is due primarily to the impact of the Tax Cuts and Jobs Act (the “Tax Act”) and the fact that we have certain permanent items which include, but are not limited to, income attributable to the non-controlling interest, the impact of certain tax deduction limits related to meals and entertainment and other permanent nondeductible expenses. The Company will report taxes only on its share of Evolent Health LLC income and the consolidated income tax benefit, which excludes earnings allocable to the non-controlling interest.
During 2017 and 2016, we examined all sources of taxable income that may be available for the realization of remaining net deferred tax assets. Given the Company’s cumulative loss position, we concluded that there are no other current sources of taxable income and are currently reflecting a full valuation allowance in our financial statements recorded against our net deferred tax assets, with the exception of a portion of the indefinite lived components and those expected to reverse outside of the net operating loss carryover period as part of the outside basis difference in our partnership interest in Evolent Health LLC. As such, our effective tax rate in 2017 and 2016 was lower than the
35%
U.S. federal statutory rate applicable for those tax periods. See “Part II - Item 8.
Financial
Statements
and Supplementary Data - Note
12
” for additional discussion of the implications of the Tax Act.
Net income (loss) attributable to non-controlling interests
We consolidate the results of Evolent Health LLC as we have 100% of the voting rights of the entity; however, as of
December 31, 2017
, we owned only
96.6%
of the economic rights of the results of operations of Evolent Health LLC and, therefore, allocated the portion of the results of operations of Evolent Health LLC attributable to non-controlling interest to those shareholders. For the years ended
December 31, 2017
and
2016
, our results reflected net losses of
$9.1 million
and
$67.0 million
, respectively, attributable to non-controlling interests, which represented
12.5%
and
28.2%
, respectively, of the operating losses of Evolent Health LLC. The Company’s economic interest in Evolent Health LLC increased as compared to the prior period as a result of the Class B Exchanges in connection with the 2017 Secondary Offerings, as well as our issuance of shares of Class A common stock in conjunction with the August 2017 Primary and option exercises and RSU vests during the year.
Comparison of the Results for the Year Ended December 31,
2016
to
2015
Evolent Health, Inc.'s results for the year ended December 31, 2016, reflect a complete view of the operational results as the results of operations of Evolent Health LLC have been included for the full period. However, Evolent Health, Inc.’s results for the year ended December 31, 2015, consolidate the results of Evolent Health LLC only for the period subsequent to the Offering Reorganization. We believe that a more detailed comparative discussion of the results for the year ended December 31, 2016, and the year ended December 31, 2015, would not yield a meaningful comparison for the reader. Revenue in 2016 was
$254.2 million
, as compared to
$96.9 million
in the prior year. Transformation revenue in 2016 was
$38.3 million
, as compared to
$19.9 million
in the prior year. Platform and operations revenue in 2016 was
$215.9 million
, as compared to
$77.0 million
in the prior year. Cost of revenue in 2016 was
$155.2 million
as compared to
$57.4 million
in the prior year. Selling, general and administrative expenses in 2016 were
$160.7 million
, as compared to
$75.3 million
in the prior year. Depreciation and amortization expenses in 2016 were
$17.2 million
, as compared to
$7.2 million
in the prior year. Revenue and operating expenses increased over the prior year period primarily as a result of the consolidation of Evolent Health LLC, growth in the organization and an increase in contracted customers. Goodwill impairment in 2016 was
$160.6 million
, as compared to
zero
in the prior year as a result of an impairment charge recorded during the first quarter of 2016. Gain on change in fair value of contingent liability was
$2.1 million
in 2016, as compared to
zero
in the prior
54
year. This increase was the result of changes in value of mark-to-market contingent liabilities acquired through business combinations during 2016.
NON-GAAP FINANCIAL MEASURES
As described above, Evolent Health, Inc. is a holding company and its principal asset is all of the Class A common units in Evolent Health LLC, which has owned all of our operating assets and substantially all of our business since inception. Prior to the Offering Reorganization on June 4, 2015, the predecessor of Evolent Health, Inc. accounted for Evolent Health LLC as an equity method investment. The financial results of Evolent Health LLC have been consolidated in the financial statements of Evolent Health, Inc. following the Offering Reorganization. As a result, the financial statements of Evolent Health, Inc. for the year ended December 31, 2015, do not reflect a complete view of the operational results for the respective period. The financial results of Evolent Health LLC were consolidated in the financial statements of Evolent Health, Inc. for the entire year ended December 31, 2016. In order to provide a consistent presentation for the periods before and after June 4, 2015, and effectively provide comparative results, the adjusted results of Evolent Health, Inc. presented and discussed below reflect the Offering Reorganization as if it had occurred at the beginning of each respective period, and therefore include the operations of Evolent Health LLC for the entire period from January 1, 2015, through June 3, 2015, and the period from June 4, 2015, through December 31, 2015, when the results were consolidated. Including Evolent Health LLC’s results for these periods is not consistent with GAAP and should not be considered as an alternative to comparable GAAP measures. Certain non-GAAP measures below reflect certain income statement line items in relevant periods as adjusted to reflect results from operations for the year ended December 31, 2015, as if the Offering Reorganization had occurred at the beginning of the respective period. The presentation also reflects other adjustments, as discussed below.
In addition to disclosing financial results that are determined in accordance with GAAP, we present and discuss Adjusted Revenue, Adjusted Transformation Revenue, Adjusted Platform and Operations Revenue, Adjusted Cost of Revenue, Adjusted Selling, General and Administrative Expenses, Adjusted Depreciation and Amortization Expenses, Adjusted Total Operating Expenses and Adjusted Operating Income (Loss), which are all non-GAAP financial measures, as supplemental measures to help investors evaluate our fundamental operational performance. We believe these measures are useful across time in evaluating our fundamental core operating performance. Management also uses certain of these measures to manage our business, including in preparing its annual operating budget, financial projections and compensation plans. We believe that certain of these measures are also useful to investors because similar measures are frequently used by securities analysts, investors and other interested parties in their evaluation of companies in similar industries.
Adjusted Revenue, Adjusted Transformation Revenue and Adjusted Platform and Operations Revenue are defined as revenue, transformation revenue, and platform and operations revenue, respectively, adjusted to include revenue, transformation revenue and platform and operations revenue, as applicable, of Evolent Health LLC for periods prior to the Offering Reorganization, and to exclude the impact of purchase accounting adjustments. Management uses Adjusted Revenue, Adjusted Transformation Revenue and Adjusted Platform and Operations Revenue as supplemental performance measures because they reflect a complete view of the operational results. The measures are also useful to investors because they reflect the full view of our operational performance in line with how we generate our long term forecasts.
Adjusted Cost of Revenue and Adjusted Selling, General and Administrative Expenses are defined as cost of revenue and selling, general and administrative expenses, respectively, adjusted to include cost of revenue and selling, general and administrative expenses, as applicable, of Evolent Health LLC for periods prior to the Offering Reorganization, and to exclude the impact of stock-based compensation expenses and transaction costs related to acquisitions and business combinations, the Offering Reorganization, IPO and other securities offerings as well as other one-time adjustments. Management uses Adjusted Cost of Revenue and Adjusted Selling, General and Administrative Expenses as supplemental performance measures which are also useful to investors because they facilitate an understanding of our long term operational costs while removing the effect of transaction costs that are one-time and costs that are non-cash (stock-based compensation expenses) in nature. Additionally, these supplemental performance measures facilitate an understanding of a breakdown of our Adjusted Total Operating Expenses.
Adjusted Depreciation and Amortization Expenses is defined as depreciation and amortization expenses adjusted to include depreciation and amortization expenses of Evolent Health LLC for periods prior to the Offering Reorganization, and to exclude the impact of amortization expenses related to intangible assets acquired through acquisitions and business combinations. Management uses Adjusted Depreciation and Amortization Expenses as a supplemental performance measure because it reflects a complete view of the operational results while removing the impact of purchase accounting adjustments. The measure is also useful to investors because it facilitates an understanding of a breakdown of our Adjusted Total Operating Expenses.
Adjusted Total Operating Expenses is defined as the sum of Adjusted Cost of Revenue, Adjusted Selling, General and Administrative Expenses, Adjusted Depreciation and Amortization Expenses, and reflects the adjustments made in those non-GAAP measures. Adjusted Total Operating Expenses is adjusted to exclude the impact of one-time adjustments, such as goodwill impairment, and items arising from acquisitions and business combinations, such as gain on change in fair value of contingent consideration.
55
Adjusted Operating Income (Loss) is defined as Adjusted Revenue less Adjusted Total Operating Expenses, and reflects the adjustments made in those non-GAAP measures.
These adjusted measures do not represent and should not be considered as alternatives to GAAP measurements, and our calculations thereof may not be comparable to similarly entitled measures reported by other companies. A reconciliation of these adjusted measures to their most comparable GAAP financial measures is presented in the table below.
56
Evolent Health, Inc. Adjusted Results
|
For the Year Ended December 31, 2016
|
For the Year Ended December 31, 2015
|
|||||||||||||||||||||||||||||||||||
|
Add:
|
Evolent Health, Inc.
|
|||||||||||||||||||||||||||||||||||
|
Evolent
|
Evolent
|
Evolent
|
Evolent
|
Evolent
|
as Adjusted
|
|||||||||||||||||||||||||||||||
|
Health, Inc.
|
Health, Inc.
|
Health, Inc.
|
Health LLC
|
Health, Inc.
|
Change Over Prior Period *
|
|||||||||||||||||||||||||||||||
|
(in thousands)
|
as Reported
|
Adjustments
|
as Adjusted
|
as Reported
|
Operations
(1)
|
Adjustments
|
as Adjusted
|
$
|
%
|
|||||||||||||||||||||||||||
|
Revenue
|
||||||||||||||||||||||||||||||||||||
|
Transformation
(2)
|
$
|
38,320
|
|
$
|
114
|
|
$
|
38,434
|
|
$
|
19,906
|
|
$
|
15,755
|
|
$
|
1,524
|
|
$
|
37,185
|
|
$
|
1,249
|
|
3.4
|
%
|
||||||||||
|
Platform and operations
(2)
|
215,868
|
|
1,976
|
|
217,844
|
|
76,972
|
|
46,059
|
|
3,304
|
|
126,335
|
|
91,509
|
|
72.4
|
%
|
||||||||||||||||||
|
Total revenue
|
254,188
|
|
2,090
|
|
256,278
|
|
96,878
|
|
61,814
|
|
4,828
|
|
163,520
|
|
92,758
|
|
56.7
|
%
|
||||||||||||||||||
|
Expenses
|
||||||||||||||||||||||||||||||||||||
|
Cost of revenue (exclusive of
|
||||||||||||||||||||||||||||||||||||
|
depreciation and amortization
|
||||||||||||||||||||||||||||||||||||
|
expenses presented separately below)
(3)
|
155,177
|
|
(5,431
|
)
|
149,746
|
|
57,398
|
|
44,839
|
|
(2,518
|
)
|
99,719
|
|
50,027
|
|
50.2
|
%
|
||||||||||||||||||
|
Selling, general and administrative expenses
(4)
|
160,692
|
|
(32,753
|
)
|
127,939
|
|
75,286
|
|
58,457
|
|
(38,230
|
)
|
95,513
|
|
32,426
|
|
33.9
|
%
|
||||||||||||||||||
|
Depreciation and amortization expenses
(5)
|
17,224
|
|
(2,773
|
)
|
14,451
|
|
7,166
|
|
2,637
|
|
—
|
|
9,803
|
|
4,648
|
|
47.4
|
%
|
||||||||||||||||||
|
Goodwill impairment
(6)
|
160,600
|
|
(160,600
|
)
|
—
|
|
—
|
|
—
|
|
—
|
|
—
|
|
—
|
|
—
|
%
|
||||||||||||||||||
|
(Gain) loss on change in fair value of
|
||||||||||||||||||||||||||||||||||||
|
contingent consideration
(7)
|
(2,086
|
)
|
2,086
|
|
—
|
|
—
|
|
—
|
|
—
|
|
—
|
|
—
|
|
—
|
%
|
||||||||||||||||||
|
Total operating expenses
|
491,607
|
|
(199,471
|
)
|
292,136
|
|
139,850
|
|
105,933
|
|
(40,748
|
)
|
205,035
|
|
87,101
|
|
42.5
|
%
|
||||||||||||||||||
|
Operating income (loss)
|
$
|
(237,419
|
)
|
$
|
201,561
|
|
$
|
(35,858
|
)
|
$
|
(42,972
|
)
|
$
|
(44,119
|
)
|
$
|
45,576
|
|
$
|
(41,515
|
)
|
$
|
5,657
|
|
13.6
|
%
|
||||||||||
|
Adjusted Transformation Revenue
|
||||||||||||||||||||||||||||||||||||
|
as a percent of Adjusted Revenue
|
15.0
|
%
|
22.7
|
%
|
||||||||||||||||||||||||||||||||
|
Adjusted Platform and Operations Revenue
|
||||||||||||||||||||||||||||||||||||
|
as a percent of Adjusted Revenue
|
85.0
|
%
|
77.3
|
%
|
||||||||||||||||||||||||||||||||
|
Adjusted Cost of Revenue as a percent
|
||||||||||||||||||||||||||||||||||||
|
of Adjusted Revenue
|
58.4
|
%
|
61.0
|
%
|
||||||||||||||||||||||||||||||||
|
Adjusted Selling, General and Administrative
|
||||||||||||||||||||||||||||||||||||
|
Expenses as a percent of Adjusted Revenue
|
49.9
|
%
|
58.4
|
%
|
||||||||||||||||||||||||||||||||
|
(1)
|
Represents the operational results of Evolent Health LLC for the period January 1, 2015, through June 3, 2015, prior to consolidation.
|
|
(2)
|
As part of our acquisitions of Valence Health and Aldera, we recorded deferred revenue purchase accounting adjustments to transformation revenue and platform and operations revenue of approximately
$2.0 million
for the year ended December 31, 2016. As part of the Offering Reorganization and as a result of gaining control of Evolent Health LLC, we recorded the fair value of deferred revenue resulting in a
$4.9 million
reduction to the book value. See “Part II - Item 8. Financial Statements and Supplementary Data - Note
4
” for additional details of the Offering Reorganization. This resulted in adjustments of approximately
$0.1 million
and
$4.8 million
to transformation revenue and platform and operations revenue for the years ended December 31, 2016 and 2015, respectively, related to purchase accounting adjustments which reflect the portion of the adjustment that would have been recognized in the respective period.
|
|
(3)
|
Adjustments to cost of revenue include approximately
$2.7 million
and
$2.5 million
in stock-based compensation expense for the years ended December 31, 2016 and 2015, respectively, including approximately
$1.1 million
in 2016 related to the acceleration of Valence Health’s unvested equity awards that vested upon close of the Valence Health acquisition. Stock-based compensation expense includes the value of equity awards granted to employees and non-employee directors of the Company or its consolidated subsidiaries. Adjustments also include transaction costs of approximately
$2.8 million
for the year ended December 31, 2016, resulting from acquisitions and business combinations.
|
|
(4)
|
Adjustments to selling, general and administrative expenses include approximately
$19.8 million
and
$34.0 million
in stock-based compensation expense for the years ended December 31, 2016 and 2015, respectively, including approximately
$2.8 million
in 2016 related to the acceleration of Valence Health’s unvested equity awards that vested upon close of the Valence Health acquisition. Stock-based compensation expense includes the value of equity awards granted to employees and non-employee directors of the Company or its consolidated subsidiaries. Adjustments also include transaction costs of approximately
$6.5 million
and
$4.3 million
for the years ended December 31, 2016 and 2015, respectively, resulting from acquisitions and business combinations and costs relating to our Offering Reorganization, IPO and other securities offerings. There was an additional one-time adjustment of approximately
$6.5 million
for the year ended December 31, 2016, related to a lease abandonment expense incurred as a result of the Valence Health acquisition.
|
|
(5)
|
Adjustments to depreciation and amortization expenses of approximately
$2.8 million
for 2016 relate to amortization of intangible assets acquired via asset acquisitions and business combinations in 2016.
|
|
(6)
|
The adjustment represents a write down of goodwill as described in “Part II - Item 7. Management’s Discussion and Analysis of Financial Condition and Results of Operations - Critical Accounting Policies and Estimates.”
|
|
(7)
|
The adjustment represents a change in the fair value of contingent consideration associated with the Valence Health and Passport transactions, as discussed further in “Part II - Item 8. Financial Statements - Note
4
.”
|
* The dollar and percentage changes over prior period based on GAAP results are presented in “Evolent Health, Inc. Results” above.
57
Comparison of the Adjusted Results for the Year Ended December 31, 2016 to 2015
Adjusted Revenue
Adjusted Revenue increased by
$92.8 million
, or
56.7%
, to
$256.3 million
in 2016 as compared to the prior year.
Adjusted Transformation Revenue increased by
$1.2 million
, or
3.4%
, to
$38.4 million
in 2016 as compared to the prior year. The increase was attributable primarily to the timing of work being performed on existing contracts and timing of contracts executed with new partners. Adjusted Transformation Revenue accounted for
15.0%
and
22.7%
of our total Adjusted Revenue in 2016 and 2015, respectively. Over time, we expect Adjusted Transformation Revenue to decrease as a percentage of total Adjusted Revenue as we expect Adjusted Transformation Revenue to be relatively stable as we seek to add a similar number of customers each year combined with the higher growth we are experiencing in our platform and operations revenue.
Adjusted Platform and Operations Revenue accounted for
85.0%
and
77.3%
of our total Adjusted Revenue in 2016 and 2015, respectively. Adjusted Platform and Operations Revenue increased by
$91.5 million
, or
72.4%
, to
$217.8 million
in 2016 as compared to the prior year. This increase was driven primarily by the addition of approximately 0.8 million lives on our platform during the year. Furthermore, the acquisition of Valence Health on October 3, 2016, added approximately 0.5 million incremental lives to our existing lives on platform, bringing the total to approximately 2.0 million lives on platform as of December 31, 2016. Combined, this represented a growth of approximately 1.3 million lives or 181.5% over the prior year. We ended 2016 with over 25 revenue-producing partners compared to 9 as of December 31, 2015, with 10 such partners added during the fourth quarter of 2016 as a result of our acquisition of Valence Health.
Adjusted Cost of Revenue (exclusive of Adjusted Depreciation and Amortization Expenses)
Adjusted Cost of Revenue increased
$50.0 million
, or
50.2%
, to
$149.7 million
, in 2016 as compared to the prior year, of which $18.0 million and $0.8 million were related to Valence Health and Aldera, respectively. Other than increases due to Valence Health and Aldera, the increase in our Adjusted Cost of Revenue was due primarily to additional personnel costs, professional fees and other general costs of $15.8 million, $12.8 million and $2.6 million, respectively, to support our growing customer base and service offerings. The $18.0 million in Adjusted Cost of Revenue related to Valence Health was primarily made up of $13.9 million, $1.5 million and $1.7 million in personnel costs, professional fees and technology services, respectively. The $0.8 million in Adjusted Cost of Revenue related to Aldera was primarily a result of $0.5 million incurred in personnel costs.
Adjusted Cost of Revenue represented
58.4%
and
61.0%
of total Adjusted Revenue in 2016 and 2015, respectively. Our Adjusted Cost of Revenue decreased as a percentage of our total Adjusted Revenue year-over-year resulting from greater economies of scale.
Adjusted Selling, General and Administrative Expenses
Adjusted Selling, General and Administrative Expenses increased
$32.4 million
, or
33.9%
, to
$127.9 million
in 2016 as compared to the prior year, of which $9.4 million and $1.5 million were related to Valence Health and Aldera, respectively. Other than increases due to Valence Health and Aldera, the increase in Adjusted Selling, General and Administrative Expenses was due primarily to additional personnel costs, including investments in business development, research and development and general overhead of $15.1 million. Additionally, our legal fees, professional fees, and technology service costs related to our growth increased $2.8 million, $2.6 million and $2.2 million, respectively, year over year. These amounts were offset by a net $1.6 million decrease in other costs during 2016. The $9.4 million in Adjusted Selling, General and Administrative Expenses related to Valence Health included $4.7 million, $1.5 million and $1.1 million in personnel costs, rent expense and technology service costs, respectively. The $1.5 million of Adjusted Selling, General and Administrative Expenses related to Aldera was primarily the result of $1.1 million incurred in personnel costs. While our Adjusted Selling, General and Administrative Expenses are expected to grow as our business grows, we expect them to decrease as a percentage of our total Adjusted Revenue over the long term. Adjusted Selling, General and Administrative Expenses represented
49.9%
and
58.4%
of total Adjusted Revenue in 2016 and 2015, respectively.
Adjusted Depreciation and Amortization Expenses
Adjusted Depreciation and Amortization Expenses increased
$4.6 million
, or
47.4%
, to
$14.5 million
in 2016 as compared to the prior year. The increase in Adjusted Depreciation and Amortization Expenses was due primarily to the full year of amortization of the intangible assets recorded as a result of the Offering Reorganization in 2015. We expect Adjusted Depreciation and Amortization Expenses to increase in future periods as we continue to capitalize internal-use software and depreciate acquired assets resulting from future acquisitions and business combinations.
58
REVIEW OF CONSOLIDATED FINANCIAL CONDITION
Liquidity and Capital Resources
The financial statements of Evolent Health, Inc. include the consolidated results and cash flows of Evolent Health LLC for the twelve months ended December 31, 2017 and 2016. As noted in “Results of Operations” above, Evolent Health, Inc. is the managing member of Evolent Health LLC. The financial statements of Evolent Health, Inc. for the year ended December 31, 2015, include the consolidated results and cash flows of Evolent Health LLC for the period June 4, 2015, through December 31, 2015, and reflect the results of Evolent Health LLC as an equity method investment for the period January 1, 2015, through June 3, 2015. As a result, we did not have cash flows from operating, investing or financing activities for the period January 1, 2015, through June 3, 2015.
Since its inception, the Company has incurred operating losses and net cash outflows from operations. The Company incurred operating losses of
$72.8 million
,
$237.4 million
and
$43.0 million
, in
2017
,
2016
and
2015
, respectively. Net cash and restricted cash used in operating activities was
$28.0 million
,
$35.5 million
and
$18.5 million
in
2017
,
2016
and
2015
, respectively.
As of
December 31, 2017
, the Company had
$238.4 million
of cash and cash equivalents and
$65.7 million
in restricted cash and restricted investments.
We believe our current cash and cash equivalents and other sources of liquidity will be sufficient to meet our working capital and capital expenditure requirements for the next twelve months as of the date these financial statements were available to be issued. Our future capital requirements will depend on many factors, including our rate of revenue growth, the expansion of our sales and marketing activities and the timing and extent of our spending to support our investment efforts and expansion into other markets. We may also seek to invest in, or acquire complementary businesses, applications or technologies.
Cash Flows
The following summary of cash flows (in thousands) has been derived from our financial statements included in “Part II - Item 8. Financial Statements and Supplementary Data:”
|
For the Years Ended December 31,
|
|||||||||||
|
|
2017
|
2016
|
2015
|
||||||||
|
Net cash and restricted cash provided by (used in) operating activities
|
$
|
(27,958
|
)
|
$
|
(35,510
|
)
|
$
|
(18,468
|
)
|
||
|
Net cash and restricted cash provided by (used in) investing activities
|
(12,265
|
)
|
(96,657
|
)
|
(43,684
|
)
|
|||||
|
Net cash and restricted cash provided by (used in) financing activities
|
165,557
|
|
150,185
|
|
214,163
|
|
|||||
We did not have cash flows from operating, investing or financing activities from January 1, 2015, through June 3, 2015, (prior to the Offering Reorganization), as the only activity for the Company was our portion of the losses from our equity method investment as noted in the introductory paragraph above.
Operating Activities
Cash flows used in operating activities of
$28.0 million
in
2017
were due primarily to our net loss of
$69.8 million
, partially offset by non-cash items, including depreciation and amortization expenses of
$32.4 million
and stock-based compensation expense of
$20.4 million
.
Our operating cash outflows were affected by the timing of our customer and vendor payments. Decreases in accrued liabilities, accrued compensation and employee benefits and other long-term liabilities, combined with an increase in accounts receivable, contributed approximately
$18.7 million
to our cash outflows. Those cash outflows were partially offset by increases in deferred revenue and accounts payable, combined with a decrease in prepaid expenses and other current assets, of approximately
$11.8 million
.
Cash flows used in operating activities of
$35.5 million
in
2016
were due primarily to our net loss of
$226.8 million
, partially offset by non-cash items, including goodwill impairment of
$160.6 million
, stock-based compensation expense of
$18.6 million
, depreciation and amortization expenses of
$17.2 million
, a
$6.5 million
loss related to the abandonment of the 14
th
Floor Space lease and a
$7.0 million
prepayment of a license with Aldera. Our operating cash flows were affected by the timing of customer billings and vendor payments, including the timing of pass-through payments related to PBM programs.
Cash flows used in operating activities of
$18.5 million
in
2015
, were due primarily to our net income of
$319.8 million
offset by non-cash items including a gain of
$414.1 million
as a result of the consolidation of Evolent Health LLC. Our operating cash flows were affected by the timing of customer billings and vendor payments, including the timing of pass-through payments related to PBM programs. Our operating cash flows were negatively impacted by an
$18.0 million
decrease in deferred revenue due to a change in billing terms with one of our largest customers which now prevents advance billings combined with additional reductions as we held our fourth quarter advanced billings in order to reconcile new membership data. Partially offsetting those items were favorable
59
receivables activity during the period, driven by our increased revenue, as well as increases in accrued liabilities and accrued compensation and employee benefits.
Investing Activities
Cash flows
used in
investing activities of
$12.3 million
in
2017
, primarily relate to purchases of property and equipment of
$27.8 million
, payment of a
$20.0 million
implementation funding loan, purchases of restricted investments of
$3.8 million
and cash paid to acquire intangible technology assets of
$3.7 million
. These amounts were partially offset by the maturity of investment securities in the amount of
$44.2 million
.
Cash flows used in investing activities of
$96.7 million
in
2016
were due primarily to cash outflows for the acquisitions of Valence Health and Aldera for
$53.7 million
and
$17.5 million
, respectively. We also paid
$11.5 million
in connection with our acquisition of Vestica’s assets and
$3.0 million
for our equity investment in GPAC. Purchases of property and equipment and restricted investments resulted in further cash outflows of
$15.5 million
and
$5.0 million
, respectively, during the year. These amounts were partially offset by the maturity of investment securities in the amount of
$9.4 million
.
Cash flows used in investing activities of
$43.7 million
in
2015
were due primarily to the investment of a portion of our IPO proceeds into held-to-maturity investments of
$54.2 million
and the purchase of
$6.5 million
of property and equipment, partially offset by cash acquired upon the consolidation of Evolent Health LLC of
$13.1 million
and maturities of investments of
$4.0 million
.
Financing Activities
Cash flows provided by financing activities of
$165.6 million
in
2017
were primarily related to proceeds of
$166.9 million
from the August 2017 Primary. Stock option exercises during the quarter resulted in additional proceeds of
$4.1 million
, which were partially offset by
$1.3 million
of taxes withheld and paid for vests of restricted stock units. The inflows were further offset by a
$4.2 million
reduction in the amount of restricted cash held on behalf of our partners to process PBM and other claims.
Cash flows provided by financing activities of
$150.2 million
in
2016
were due primarily to net proceeds received from the issuance of our 2021 Notes of
$121.3 million
, along with an increase of
$28.0 million
in the amount of restricted cash held on behalf of our partners to process PBM and other claims. In addition, the Company received
$1.3 million
in proceeds from exercises of stock options, partially offset by taxes withheld and paid for vests of restricted stock units.
Cash flows provided by financing activities of
$214.2 million
in
2015
included proceeds received from our IPO of
$209.1 million
, partially offset by the payment of
$1.4 million
in deferred offering costs.
Convertible Senior Debt Offering
In
December 2016
, the Company issued
$125.0 million
aggregate principal amount of its
2.00%
Convertible Senior Notes due
2021
in a Private Placement to qualified institutional buyers within the meaning of Rule 144A under the Securities Act of 1933, as amended. The 2021 Notes were issued at par for net proceeds of
$120.4 million
. We incurred
$4.6 million
of debt issuance costs in connection with the 2021 Notes, which we are amortizing to non-cash interest expense over the contractual term of the 2021 Notes. The closing of the Private Placement of the 2021 Notes occurred on
December 5, 2016
.
Holders of the 2021 Notes are entitled to cash interest payments, which are payable semiannually in arrears on
June 1
and
December 1
of each year, beginning on
June 1, 2017
, at a rate equal to
2.00%
per annum. The 2021 Notes will mature on
December 1, 2021
, unless earlier repurchased or converted in accordance with their terms prior to such date. In addition, holders of the 2021 Notes may require the Company to repurchase their 2021 Notes upon the occurrence of a fundamental change at a price equal to
100.00%
of the principal amount of the 2021 Notes being repurchased, plus any accrued and unpaid interest. Upon maturity, and at the option of the holders of the 2021 Notes, the principal amount of the notes may be settled via shares of the Company’s Class A common stock.
The 2021 Notes are convertible into shares of the Company’s Class A common stock, based on an initial conversion rate of
41.6082
shares of Class A common stock per
$1,000
principal amount of the 2021 Notes, which is equivalent to an initial conversion price of approximately
$24.03
per share of the Company’s Class A common stock. In the aggregate, the 2021 Notes are initially convertible into
5.2 million
shares of the Company’s Class A common stock (excluding any shares issuable by the Company upon a conversion in connection with a make-whole fundamental change under the Indenture).
Reinsurance Agreement
During the fourth quarter of 2017, the Company entered into a
15
-month,
$10.0 million
capital-only reinsurance arrangement with NMHC, expiring on December 31, 2018. The purpose of the capital-only reinsurance is to provide balance sheet support to NMHC. There is no uncertainty to the outcome of the arrangement as there is no transfer of underwriting risk to Evolent or True Health, and neither Evolent nor True Health is at risk for any cash payments on behalf of NMHC. As a result, this arrangement does not qualify for
60
reinsurance accounting. The Company will record a quarterly fee of approximately
$0.2 million
as non-operating income on its consolidated statements of operations and will maintain
$10.0 million
in restricted cash and restricted investments on its consolidated balance sheets for the duration of the reinsurance agreement.
Medicaid Opportunities
During the first quarter of 2017, the Company entered into an agreement to provide a letter of credit, for up to
$5.0 million
, to assist a customer in demonstrating adequate reserves to the customer’s state regulatory authorities for its managed Medicaid initiative. Additionally, during the fourth quarter of 2017, the Company contributed $20.0 million in the form of an implementation funding loan (the “Implementation Loan”) to support implementation services to assist an existing customer in expanding its Medicaid membership. See “Part II - Item 8. Financial Statements and Supplementary Data - Note
9
and see “Part II - Item 8. Financial Statements and Supplementary Data - Note
2
” for further discussion.
Contractual Obligations
Our contractual obligations (in thousands) as of
December 31, 2017
, were as follows:
|
Less
|
More
|
||||||||||||||||||
|
Than
|
1 to 3
|
3 to 5
|
Than
|
||||||||||||||||
|
1 Year
|
Years
|
Years
|
5 Years
|
Total
|
|||||||||||||||
|
Operating leases for facilities
|
$
|
8,328
|
|
$
|
14,102
|
|
$
|
5,400
|
|
$
|
13,462
|
|
$
|
41,292
|
|
||||
|
Purchase obligations related to vendor contracts
|
6,567
|
|
430
|
|
—
|
|
—
|
|
6,997
|
|
|||||||||
|
2021 Notes interest payments
|
2,496
|
|
4,992
|
|
2,526
|
|
—
|
|
10,014
|
|
|||||||||
|
2021 Notes principal repayment
|
—
|
|
—
|
|
125,000
|
|
—
|
|
125,000
|
|
|||||||||
|
Total
|
$
|
17,391
|
|
$
|
19,524
|
|
$
|
132,926
|
|
$
|
13,462
|
|
$
|
183,303
|
|
||||
During the year ended
December 31, 2017
, there were no material changes outside the ordinary course of business to our contractual obligations set forth above.
Restricted Cash and Restricted Investments
Restricted cash and restricted investments of
$65.7 million
is carried at cost and includes cash held on behalf of other entities for pharmacy and claims management services of
$26.3 million
, collateral for letters of credit required as security deposits for facility leases of
$3.8 million
, amounts held with financial institutions for risk-sharing arrangements of
$24.7 million
, amounts held as supplemental capital for a reinsurance agreement of
$10.0 million
and other restricted balances as of
December 31, 2017
. See “Part II - Item 8. Financial Statements and Supplementary Data - Note
2
” for further details of the Company’s restricted cash balances.
Uses of Capital
Our principal uses of cash are in the operation and expansion of our business and the pursuit of strategic acquisitions. The Company does not anticipate paying a cash dividend on our Class A common stock in the foreseeable future.
Immaterial Correction of an Error in Previously Issued Financial Statements
Subsequent to the filing of the Company’s Quarterly Report on Form 10-Q for the period ended June 30, 2017, the Company identified an error related to the classification of restricted cash and restricted investments on its Consolidated Statement of Cash Flows.
Accordingly, the Company corrected this error by revising the classification of certain changes in restricted cash and restricted investments within the Consolidated Statement of Cash Flows.
61
The following table summarizes the impact of the correction of the error to the Company’s Consolidated Statement of Cash Flows for the six months ended June 30, 2017 (in thousands):
|
As Reported
|
Correction
|
As Revised*
|
|||||||||
|
Cash Flows from Operating Activities
|
|||||||||||
|
Changes in assets and liabilities, net of acquisitions:
|
|||||||||||
|
Accounts receivables, net
|
$
|
(5,247
|
)
|
$
|
(2,655
|
)
|
$
|
(7,902
|
)
|
||
|
Accounts payable, net of change in restricted
|
|||||||||||
|
cash and restricted investments
|
(2,514
|
)
|
9,555
|
|
7,041
|
|
|||||
|
Net cash provided by (used in) operating activities
|
(44,712
|
)
|
6,900
|
|
(37,812
|
)
|
|||||
|
Cash Flows from Investing Activities
|
|||||||||||
|
Change in restricted cash and restricted investments
|
3,200
|
|
(6,900
|
)
|
(3,700
|
)
|
|||||
|
Net cash provided by (used in) investing activities
|
7,739
|
|
(6,900
|
)
|
839
|
|
|||||
* The table above does not reflect the impact of the adoption of ASU 2016-18. The Company adopted ASU 2016-18 effective December 31, 2017. As a result, our future filings will reflect the presentation of our statement of cash flows as required under ASU 2016-18 and not as depicted in the table above. See “Part II - Item 8. Financial Statements and Supplementary Data - Note
3
” for further discussion of our adoption of ASU 2016-18.
The Company assessed the materiality of the misstatement both quantitatively and qualitatively and determined the correction of this error to be immaterial to all prior consolidated financial statements taken as a whole. The Company will revise its Consolidated Statements of Cash Flows for the six months ended June 30, 2017, in future filings to reflect the correction of the error.
OTHER MATTERS
Off-balance Sheet Arrangements
Through
December 31, 2017
, the Company had not entered into any off-balance sheet arrangements, other than the operating leases noted above, and did not have any holdings in variable interest entities.
Related Party Transactions
In the ordinary course of business, we enter into transactions with related parties, including our partners and our pre-IPO investors, TPG, UPMC and The Advisory Board. Information regarding transactions and amounts with related parties is discussed in “Part II - Item 8. Financial Statements and Supplementary Data - Note
17
.”
Other Factors Affecting Our Business
In general, our business is subject to a changing social, economic, legal, legislative and regulatory environment. Although the eventual effect on us of the changing environment in which we operate remains uncertain, these factors and others could have a material effect on our results of operations, liquidity and capital resources. Factors that could cause actual results to differ materially from those set forth in this section are described in “Part I - Item 1A. Risk Factors” and “Forward-Looking Statements – Cautionary Language.”
We are exposed to market risks in the ordinary course of our business. Market risk represents the risk of loss that may impact our financial position due to adverse changes in financial market prices and rates.
Interest Rate Risk
As of
December 31, 2017
, the Company had cash and cash equivalents and restricted cash and restricted investments of
$304.1 million
, which consisted of bank deposits with FDIC participating banks of
$218.3 million
, cash equivalents deposited in a money-market fund of
$77.1 million
, and
$8.8 million
of restricted investments held in certificates of deposits with original maturities in excess of 12 months. The cash on deposit with banks is not susceptible to interest rate risk. Our restricted investments are classified as held-to-maturity and therefore are not subject to interest rate risk. We do not enter into investments for trading or speculative purposes and have not used any derivative financial instruments to manage our interest rate risk exposure.
62
As of
December 31, 2017
, we had
$121.4 million
, net of deferred offering costs, of aggregate principal amount of convertible notes outstanding, which are fixed rate instruments. Therefore, our results of operations are not subject to fluctuations in interest rates.
Inflation Risk
We do not believe that inflation has had a material effect on our business, financial condition or results of operations. If our costs were to become subject to significant inflationary pressures, we may not be able to fully offset such higher costs through price increases. Our inability or failure to do so could harm our business, financial condition and results of operations.
Equity Market Risk
We have exposure to equity market risk related to the potential exchange of our Class B common shares. Pursuant to and subject to the terms of an exchange agreement and the third amended and restated LLC agreement of Evolent Health LLC, holders of our Class B common shares may at any time and from time to time exchange their Class B common shares, together with an equal number of Class B common units of Evolent Health LLC, for shares of our Class A common stock on a one-for-one basis. A decision to exchange these shares may be, in part, driven by equity market conditions and, more specifically, the price of our Class A common stock. An exchange of our Class B common shares would:
|
•
|
Increase our ownership in our consolidated operating subsidiary, Evolent Health LLC. See “Item 8. Financial Statements and Supplementary Data - Note
4
” for additional information;
|
|
•
|
Increase the number of outstanding shares of our Class A common stock. See “Item 8. Financial Statements and Supplementary Data - Note
10
” for information relating to potentially dilutive securities and the impact on our historical earnings per share; and
|
|
•
|
Increase our tax basis in our share of Evolent Health LLC’s tangible and intangible assets and possibly subject us to payments under the TRA agreement. See “Item 8. Financial Statements and Supplementary Data - Note
12
” for further information on tax matters related to the exchange of Class B common shares.
|
For example, as discussed in “Item 8. Financial Statements and Supplementary Data - Note
4
,”
12.6 million
shares of the Company’s Class A common stock were issued to certain Investor Stockholders pursuant to Class B Exchanges relating to multiple secondary offerings during 2017. As a result of these Class B Exchanges and Evolent Health LLC’s cancellation of its Class B common units triggered by the 2017 Secondary Offerings, the Company’s economic interest in Evolent Health LLC increased from
77.4%
to
96.1%
immediately following the June 2017 Secondary.
63
INDEX TO CONSOLIDATED FINANCIAL STATEMENTS
|
Page
|
|
64
Report of Independent Registered Public Accounting Firm
To the
Board of Directors and Shareholders of Evolent Health, Inc.
Opinions on the Financial Statements and Internal Control over Financial Reporting
We have audited the accompanying consolidated balance sheets of Evolent Health, Inc. and its subsidiaries
as of December 31, 2017
and 2016,
and the related consolidated statements of operations, changes in shareholders’ equity (deficit) and redeemable preferred stock and of cash flows for each of the three years in the period ended December 31, 2017, including the related notes (collectively referred to as the “consolidated financial statements”).
We also have audited the Company's internal control over financial reporting as of December 31, 2017, based on criteria established in
Internal Control - Integrated Framework
(2013)
issued by the Committee of Sponsoring Organizations of the Treadway Commission (COSO).
In our opinion, the consolidated financial statements referred to above present fairly, in all material respects, the financial position of the Company as of
December 31, 2017
and 2016, and the results of their operations and their cash flows for each of the three years in the period ended
December 31, 2017 in conformity with accounting principles generally accepted in the United States of America. Also in our opinion, the Company did not maintain, in all material respects, effective internal control over financial reporting as of December 31, 2017, based on criteria established in
Internal Control - Integrated Framework
(2013)
issued by the COSO because
a material weakness in internal control over financial reporting related to an insufficient complement of resources with an appropriate level of accounting knowledge, experience and training to address accounting for complex, non-routine transactions
existed as of that date.
A material weakness is a deficiency, or a combination of deficiencies, in internal control over financial reporting, such that there is a reasonable possibility that a material misstatement of the annual or interim financial statements will not be prevented or detected on a timely basis. The material weakness referred to above is described in Management's Report on Internal Control over Financial Reporting appearing under Item 9A. We considered this material weakness in determining the nature, timing, and extent of audit tests applied in our audit of the 2017
consolidated
financial statements, and our opinion regarding the effectiveness of the Company’s internal control over financial reporting does not affect our opinion on those consolidated
financial statements.
Changes in Accounting Principle
As discussed in Note 2 to the consolidated financial statements, the Company changed the manner in which it defines a business when performing the accounting for an acquisition and the manner in which it performs the annual goodwill impairment assessment in 2017 and the manner in which restricted cash is presented in the Statement of Cash Flows.
Basis for Opinions
The Company's management is responsible for these consolidated
financial statements, for maintaining effective internal control over financial reporting, and for its assessment of the effectiveness of internal control over financial reporting included in management's report referred to above. Our responsibility is to express opinions on the Company’s consolidated
financial statements and on the Company's internal control over financial reporting based on our audits. We are a public accounting firm registered with the Public Company Accounting Oversight Board (United States) ("PCAOB") and are required to be independent with respect to the Company in accordance with the U.S. federal securities laws and the applicable rules and regulations of the Securities and Exchange Commission and the PCAOB.
We conducted our audits in accordance with the standards of the PCAOB. Those standards require that we plan and perform the audits to obtain reasonable assurance about whether the consolidated
financial statements are free of material misstatement, whether due to error or fraud, and whether effective internal control over financial reporting was maintained in all material respects.
Our audits of the consolidated
financial statements included performing procedures to assess the risks of material misstatement of the consolidated
financial statements, whether due to error or fraud, and performing procedures that respond to those risks. Such procedures included examining, on a test basis, evidence regarding the amounts and disclosures in the consolidated financial statements. Our audits also included evaluating the accounting principles used and significant estimates made by management, as well as evaluating the overall presentation of the consolidated
financial statements. Our audit of internal control over financial reporting included obtaining an understanding of internal control over financial reporting, assessing the risk that a material weakness exists, and testing and evaluating the design and operating effectiveness of internal control based on the assessed risk. Our audits also included performing such other procedures as we considered necessary in the circumstances. We believe that our audits provide a reasonable basis for our opinions.
65
Definition and Limitations of Internal Control over Financial Reporting
A company’s internal control over financial reporting is a process designed to provide reasonable assurance regarding the reliability of financial reporting and the preparation of financial statements for external purposes in accordance with generally accepted accounting principles. A company’s internal control over financial reporting includes those policies and procedures that (i) pertain to the maintenance of records that, in reasonable detail, accurately and fairly reflect the transactions and dispositions of the assets of the company; (ii) provide reasonable assurance that transactions are recorded as necessary to permit preparation of financial statements in accordance with generally accepted accounting principles, and that receipts and expenditures of the company are being made only in accordance with authorizations of management and directors of the company; and (iii) provide reasonable assurance regarding prevention or timely detection of unauthorized acquisition, use, or disposition of the company’s assets that could have a material effect on the financial statements.
Because of its inherent limitations, internal control over financial reporting may not prevent or detect misstatements. Also, projections of any evaluation of effectiveness to future periods are subject to the risk that controls may become inadequate because of changes in conditions, or that the degree of compliance with the policies or procedures may deteriorate.
/s/ PricewaterhouseCoopers LLP
McLean, Virginia
March 1, 2018
We have served as the Company’s or its predecessor’s auditor since 2012. The Company completed an initial public offering in 2015.
66
EVOLENT HEALTH, INC.
(in thousands, except share data)
|
As of December 31,
|
|||||||
|
|
2017
|
2016
|
|||||
|
ASSETS
|
|||||||
|
Current assets:
|
|||||||
|
Cash and cash equivalents
|
$
|
238,433
|
|
$
|
134,563
|
|
|
|
Restricted cash and restricted investments
|
62,398
|
|
34,416
|
|
|||
|
Accounts receivable, net (amounts related to affiliates: 2017 - $3,358; 2016 - $8,258)
|
48,947
|
|
40,635
|
|
|||
|
Prepaid expenses and other current assets (amounts related to affiliates: 2017 - $25; 2016 - $4,507)
|
8,404
|
|
11,011
|
|
|||
|
Notes receivable
|
20,000
|
|
—
|
|
|||
|
Investments, at amortized cost
|
—
|
|
44,341
|
|
|||
|
Total current assets
|
378,182
|
|
264,966
|
|
|||
|
Restricted cash and restricted investments
|
3,287
|
|
6,000
|
|
|||
|
Investments in and advances to affiliates
|
1,531
|
|
2,159
|
|
|||
|
Property and equipment, net
|
50,922
|
|
31,179
|
|
|||
|
Prepaid expenses and other non-current assets
|
9,328
|
|
10,043
|
|
|||
|
Intangible assets, net
|
241,261
|
|
258,923
|
|
|||
|
Goodwill
|
628,186
|
|
626,569
|
|
|||
|
Total assets
|
$
|
1,312,697
|
|
$
|
1,199,839
|
|
|
|
LIABILITIES AND SHAREHOLDERS’ EQUITY (DEFICIT)
|
|||||||
|
Liabilities
|
|||||||
|
Current liabilities:
|
|||||||
|
Accounts payable (amounts related to affiliates: 2017 - $10,284; 2016 - $13,480)
|
$
|
42,930
|
|
$
|
43,892
|
|
|
|
Accrued liabilities (amounts related to affiliates: 2017 - $719; 2016 - $3,211)
|
29,572
|
|
29,160
|
|
|||
|
Accrued compensation and employee benefits
|
35,390
|
|
38,408
|
|
|||
|
Deferred revenue
|
24,807
|
|
20,481
|
|
|||
|
Total current liabilities
|
132,699
|
|
131,941
|
|
|||
|
Long-term debt, net of discount
|
121,394
|
|
120,283
|
|
|||
|
Other long-term liabilities
|
9,861
|
|
14,655
|
|
|||
|
Deferred tax liabilities, net
|
2,437
|
|
20,846
|
|
|||
|
Total liabilities
|
266,391
|
|
287,725
|
|
|||
|
Commitments and Contingencies (See Note 9)
|
|
|
|||||
|
Shareholders' Equity (Deficit)
|
|||||||
|
Class A common stock - $0.01 par value; 750,000,000 shares authorized as of December 31, 2017 and 2016;
|
|||||||
|
74,723,597 and 52,586,899 shares issued and outstanding as of December 31, 2017 and 2016, respectively
|
747
|
|
506
|
|
|||
|
Class B common stock - $0.01 par value; 100,000,000 shares authorized as of December 31, 2017 and 2016;
|
|||||||
|
2,653,544 and 15,346,981 shares issued and outstanding as of December 31, 2017 and 2016, respectively
|
27
|
|
153
|
|
|||
|
Additional paid-in-capital
|
924,153
|
|
555,250
|
|
|||
|
Retained earnings (accumulated deficit)
|
85,952
|
|
146,617
|
|
|||
|
Total shareholders' equity (deficit) attributable to Evolent Health, Inc.
|
1,010,879
|
|
702,526
|
|
|||
|
Non-controlling interests
|
35,427
|
|
209,588
|
|
|||
|
Total shareholders' equity (deficit)
|
1,046,306
|
|
912,114
|
|
|||
|
Total liabilities and shareholders' equity (deficit)
|
$
|
1,312,697
|
|
$
|
1,199,839
|
|
|
See accompanying Notes to Consolidated Financial Statements
67
EVOLENT HEALTH, INC.
(in thousands, except per share data)
|
For the Years Ended December 31,
|
|||||||||||
|
2017
|
2016
|
2015
|
|||||||||
|
Revenue
|
|||||||||||
|
Transformation
(1)
|
$
|
29,466
|
|
$
|
38,320
|
|
$
|
19,906
|
|
||
|
Platform and operations
(1)
|
405,484
|
|
215,868
|
|
76,972
|
|
|||||
|
Total revenue
|
434,950
|
|
254,188
|
|
96,878
|
|
|||||
|
Expenses
|
|||||||||||
|
Cost of revenue (exclusive of depreciation and amortization
|
|||||||||||
|
expenses presented separately below)
(1)
|
269,352
|
|
155,177
|
|
57,398
|
|
|||||
|
Selling, general and administrative expenses
(1)
|
205,670
|
|
160,692
|
|
75,286
|
|
|||||
|
Depreciation and amortization expenses
|
32,368
|
|
17,224
|
|
7,166
|
|
|||||
|
Goodwill impairment
|
—
|
|
160,600
|
|
—
|
|
|||||
|
Loss (gain) on change in fair value of contingent consideration
|
400
|
|
(2,086
|
)
|
—
|
|
|||||
|
Total operating expenses
|
507,790
|
|
491,607
|
|
139,850
|
|
|||||
|
Operating income (loss)
|
(72,840
|
)
|
(237,419
|
)
|
(42,972
|
)
|
|||||
|
Interest income
|
1,656
|
|
970
|
|
293
|
|
|||||
|
Interest expense
|
(3,636
|
)
|
(247
|
)
|
—
|
|
|||||
|
Gain on consolidation
|
—
|
|
—
|
|
414,133
|
|
|||||
|
Income (loss) from equity affiliates
|
(1,755
|
)
|
(841
|
)
|
(28,165
|
)
|
|||||
|
Other income (expense), net
|
171
|
|
4
|
|
—
|
|
|||||
|
Income (loss) before income taxes and non-controlling interests
|
(76,404
|
)
|
(237,533
|
)
|
343,289
|
|
|||||
|
Provision (benefit) for income taxes
|
(6,637
|
)
|
(10,755
|
)
|
23,475
|
|
|||||
|
Net income (loss)
|
(69,767
|
)
|
(226,778
|
)
|
319,814
|
|
|||||
|
Net income (loss) attributable to non-controlling interests
|
(9,102
|
)
|
(67,036
|
)
|
(12,680
|
)
|
|||||
|
Net income (loss) attributable to Evolent Health, Inc.
|
$
|
(60,665
|
)
|
$
|
(159,742
|
)
|
$
|
332,494
|
|
||
|
Earnings (Loss) Available for Common Shareholders
|
|||||||||||
|
Basic
|
$
|
(60,665
|
)
|
$
|
(159,742
|
)
|
$
|
330,310
|
|
||
|
Diluted
|
(60,665
|
)
|
(159,742
|
)
|
319,814
|
|
|||||
|
Earnings (Loss) per Common Share
|
|||||||||||
|
Basic
|
$
|
(0.94
|
)
|
$
|
(3.55
|
)
|
$
|
13.14
|
|
||
|
Diluted
|
(0.94
|
)
|
(3.55
|
)
|
6.93
|
|
|||||
|
Weighted-Average Common Shares Outstanding
|
|||||||||||
|
Basic
|
64,351
|
|
45,031
|
|
25,129
|
|
|||||
|
Diluted
|
64,351
|
|
45,031
|
|
46,136
|
|
|||||
|
(1)
|
Amounts related to affiliates included above are as follows (see Note 17):
|
|||||||||||
|
Revenue
|
||||||||||||
|
Transformation
|
$
|
597
|
|
$
|
482
|
|
$
|
940
|
|
|||
|
Platform and operations
|
32,335
|
|
34,267
|
|
23,642
|
|
||||||
|
Expenses
|
||||||||||||
|
Cost of revenue (exclusive of depreciation and amortization expenses)
|
22,389
|
|
22,207
|
|
14,050
|
|
||||||
|
Selling, general and administrative expenses
|
1,153
|
|
2,027
|
|
1,542
|
|
||||||
See accompanying Notes to Consolidated Financial Statements
68
EVOLENT HEALTH, INC.
(in thousands)
|
For the Years Ended December 31,
|
|||||||||||
|
|
2017
|
2016
|
2015
|
||||||||
|
Cash Flows from Operating Activities
|
|||||||||||
|
Net income (loss)
|
$
|
(69,767
|
)
|
$
|
(226,778
|
)
|
$
|
319,814
|
|
||
|
Adjustments to reconcile net income (loss) to net cash and restricted cash
|
|||||||||||
|
provided by (used in) operating activities:
|
|||||||||||
|
Gain on consolidation
|
—
|
|
—
|
|
(414,133
|
)
|
|||||
|
Change in fair value of contingent liability
|
400
|
|
(2,086
|
)
|
—
|
|
|||||
|
Loss from lease abandonment
|
—
|
|
6,456
|
|
—
|
|
|||||
|
(Income) loss from affiliates
|
1,755
|
|
841
|
|
28,165
|
|
|||||
|
Depreciation and amortization expenses
|
32,368
|
|
17,224
|
|
7,166
|
|
|||||
|
Goodwill impairment
|
—
|
|
160,600
|
|
—
|
|
|||||
|
Stock-based compensation expense
|
20,437
|
|
18,604
|
|
14,730
|
|
|||||
|
Acceleration of unvested equity awards for Valence Health employees
|
—
|
|
3,897
|
|
—
|
|
|||||
|
Deferred tax provision (benefit)
|
(7,271
|
)
|
(10,755
|
)
|
23,460
|
|
|||||
|
Amortization of deferred financing costs
|
914
|
|
—
|
|
—
|
|
|||||
|
Other
|
490
|
|
916
|
|
172
|
|
|||||
|
Changes in assets and liabilities, net of acquisitions:
|
|||||||||||
|
Accounts receivables, net
|
(11,258
|
)
|
(11,044
|
)
|
11,756
|
|
|||||
|
Prepaid expenses and other assets
|
2,729
|
|
(9,968
|
)
|
(2,036
|
)
|
|||||
|
Accounts payable
|
5,563
|
|
(6,371
|
)
|
2,764
|
|
|||||
|
Accrued liabilities
|
(2,781
|
)
|
15,229
|
|
(3,788
|
)
|
|||||
|
Accrued compensation and employee benefits
|
(3,303
|
)
|
6,678
|
|
11,402
|
|
|||||
|
Deferred revenue
|
3,548
|
|
1,200
|
|
(17,998
|
)
|
|||||
|
Other liabilities
|
(1,782
|
)
|
(153
|
)
|
58
|
|
|||||
|
Net cash and restricted cash provided by (used in) operating activities
|
(27,958
|
)
|
(35,510
|
)
|
(18,468
|
)
|
|||||
|
Cash Flows from Investing Activities
|
|||||||||||
|
Cash acquired upon consolidation of affiliate
|
—
|
|
—
|
|
13,065
|
|
|||||
|
Cash paid for asset acquisition or business combination
|
(3,694
|
)
|
(82,560
|
)
|
—
|
|
|||||
|
Loan for implementation funding
|
(20,000
|
)
|
—
|
|
—
|
|
|||||
|
Purchases of investments
|
—
|
|
—
|
|
(54,234
|
)
|
|||||
|
Investments in and advances to affiliates
|
(1,128
|
)
|
(3,000
|
)
|
—
|
|
|||||
|
Maturities and sales of investments
|
44,210
|
|
9,379
|
|
4,000
|
|
|||||
|
Purchases of property and equipment
|
(27,848
|
)
|
(15,526
|
)
|
(6,515
|
)
|
|||||
|
Purchase of restricted investments
|
(3,805
|
)
|
(4,950
|
)
|
—
|
|
|||||
|
Net cash and restricted cash provided by (used in) investing activities
|
(12,265
|
)
|
(96,657
|
)
|
(43,684
|
)
|
|||||
|
Cash Flows from Financing Activities
|
|||||||||||
|
Proceeds from issuance of common stock, net of stock issuance costs
|
166,947
|
|
—
|
|
209,087
|
|
|||||
|
Change in restricted cash held on behalf of partners for claims processing
|
(4,200
|
)
|
28,041
|
|
6,285
|
|
|||||
|
Proceeds from stock option exercises
|
4,082
|
|
1,259
|
|
152
|
|
|||||
|
Proceeds from issuance of convertible notes, net of issuance costs
|
—
|
|
121,250
|
|
—
|
|
|||||
|
Payments of deferred offering costs
|
—
|
|
—
|
|
(1,361
|
)
|
|||||
|
Taxes withheld and paid for vesting of restricted stock units
|
(1,272
|
)
|
(365
|
)
|
—
|
|
|||||
|
Net cash and restricted cash provided by (used in) financing activities
|
165,557
|
|
150,185
|
|
214,163
|
|
|||||
|
Net increase (decrease) in cash and cash equivalents and restricted cash
|
125,334
|
|
18,018
|
|
152,011
|
|
|||||
|
Cash and cash equivalents and restricted cash as of beginning-of-period
|
170,029
|
|
152,011
|
|
—
|
|
|||||
|
Cash and cash equivalents and restricted cash as of end-of-period
|
$
|
295,363
|
|
$
|
170,029
|
|
$
|
152,011
|
|
||
See accompanying Notes to Consolidated Financial Statements
69
EVOLENT HEALTH, INC.
CONSOLIDATED STATEMENTS OF CHANGES IN SHAREHOLDERS’ EQUITY (DEFICIT) AND REDEEMABLE PREFERRED STOCK
(in thousands)
|
Retained
|
||||||||||||||||||||||||||||||||||||||||||||||||||||||||||
|
Earnings
|
||||||||||||||||||||||||||||||||||||||||||||||||||||||||||
|
Series A Redeemable
|
Series B Redeemable
|
Series B-1 Redeemable
|
Series A
|
Class A
|
Class B
|
Additional
|
(Accum-
|
Non-
|
Total
|
|||||||||||||||||||||||||||||||||||||||||||||||||
|
Preferred Stock
|
Preferred Stock
|
Preferred Stock
|
Preferred Stock
|
Common Stock
|
Common Stock
|
Paid-in
|
ulated
|
controlling
|
Equity
|
|||||||||||||||||||||||||||||||||||||||||||||||||
|
Shares
|
Amount
|
Shares
|
Amount
|
Shares
|
Amount
|
Shares
|
Amount
|
Shares
|
Amount
|
Shares
|
Amount
|
Capital
|
Deficit)
|
Interests
|
(Deficit)
|
|||||||||||||||||||||||||||||||||||||||||||
|
Balance as of December 31, 2014
|
7,900
|
|
12,847
|
|
6,468
|
|
24,833
|
|
360
|
|
1,593
|
|
7,400
|
|
2
|
|
4,048
|
|
1
|
|
—
|
|
—
|
|
23,733
|
|
(25,806
|
)
|
—
|
|
(2,070
|
)
|
||||||||||||||||||||||||||
|
Non-cash issuance of common stock
|
||||||||||||||||||||||||||||||||||||||||||||||||||||||||||
|
to Evolent Health, LLC
|
—
|
|
—
|
|
—
|
|
—
|
|
—
|
|
—
|
|
—
|
|
—
|
|
—
|
|
—
|
|
—
|
|
—
|
|
21,810
|
|
—
|
|
—
|
|
21,810
|
|
||||||||||||||||||||||||||
|
Net loss prior to the Offering Reorganization
|
—
|
|
—
|
|
—
|
|
—
|
|
—
|
|
—
|
|
—
|
|
—
|
|
—
|
|
—
|
|
—
|
|
—
|
|
—
|
|
(28,165
|
)
|
—
|
|
(28,165
|
)
|
||||||||||||||||||||||||||
|
Effects of the Offering Reorganization:
|
||||||||||||||||||||||||||||||||||||||||||||||||||||||||||
|
Conversion of existing equity
|
(7,900
|
)
|
(12,847
|
)
|
(6,468
|
)
|
(24,833
|
)
|
(360
|
)
|
(1,593
|
)
|
(7,400
|
)
|
(2
|
)
|
22,128
|
|
261
|
|
—
|
|
—
|
|
39,014
|
|
—
|
|
—
|
|
39,273
|
|
||||||||||||||||||||||||||
|
Issuance of Class B common stock
|
—
|
|
—
|
|
—
|
|
—
|
|
—
|
|
—
|
|
—
|
|
—
|
|
—
|
|
—
|
|
19,576
|
|
196
|
|
(196
|
)
|
—
|
|
332,793
|
|
332,793
|
|
||||||||||||||||||||||||||
|
Merger with TPG affiliate
|
—
|
|
—
|
|
—
|
|
—
|
|
—
|
|
—
|
|
—
|
|
—
|
|
2,051
|
|
21
|
|
(2,051
|
)
|
(21
|
)
|
34,875
|
|
—
|
|
(34,875
|
)
|
—
|
|
||||||||||||||||||||||||||
|
Issuance of Class A common stock sold in
|
||||||||||||||||||||||||||||||||||||||||||||||||||||||||||
|
initial public offering, net of offering costs
|
—
|
|
—
|
|
—
|
|
—
|
|
—
|
|
—
|
|
—
|
|
—
|
|
13,225
|
|
132
|
|
—
|
|
—
|
|
205,801
|
|
—
|
|
—
|
|
205,933
|
|
||||||||||||||||||||||||||
|
Tax effect of Offering Reorganization
|
—
|
|
—
|
|
—
|
|
—
|
|
—
|
|
—
|
|
—
|
|
—
|
|
—
|
|
—
|
|
—
|
|
—
|
|
2,144
|
|
—
|
|
—
|
|
2,144
|
|
||||||||||||||||||||||||||
|
Stock-based compensation expense
|
||||||||||||||||||||||||||||||||||||||||||||||||||||||||||
|
subsequent to the Offering Reorganization
|
—
|
|
—
|
|
—
|
|
—
|
|
—
|
|
—
|
|
—
|
|
—
|
|
—
|
|
—
|
|
—
|
|
—
|
|
14,730
|
|
—
|
|
—
|
|
14,730
|
|
||||||||||||||||||||||||||
|
Exercise of stock options
|
—
|
|
—
|
|
—
|
|
—
|
|
—
|
|
—
|
|
—
|
|
—
|
|
39
|
|
—
|
|
—
|
|
—
|
|
152
|
|
—
|
|
—
|
|
152
|
|
||||||||||||||||||||||||||
|
Net income (loss) subsequent to the
|
||||||||||||||||||||||||||||||||||||||||||||||||||||||||||
|
Offering Reorganization
|
—
|
|
—
|
|
—
|
|
—
|
|
—
|
|
—
|
|
—
|
|
—
|
|
—
|
|
—
|
|
—
|
|
—
|
|
—
|
|
360,659
|
|
(12,680
|
)
|
347,979
|
|
||||||||||||||||||||||||||
|
Balance as of December 31, 2015
|
—
|
|
—
|
|
—
|
|
—
|
|
—
|
|
—
|
|
—
|
|
—
|
|
41,491
|
|
415
|
|
17,525
|
|
175
|
|
342,063
|
|
306,688
|
|
285,238
|
|
934,579
|
|
||||||||||||||||||||||||||
|
Cumulative-effect adjustment from
|
||||||||||||||||||||||||||||||||||||||||||||||||||||||||||
|
adoption of new accounting principle
|
—
|
|
—
|
|
—
|
|
—
|
|
—
|
|
—
|
|
—
|
|
—
|
|
—
|
|
—
|
|
—
|
|
—
|
|
468
|
|
(329
|
)
|
(139
|
)
|
—
|
|
||||||||||||||||||||||||||
|
Stock-based compensation expense
|
—
|
|
—
|
|
—
|
|
—
|
|
—
|
|
—
|
|
—
|
|
—
|
|
—
|
|
—
|
|
—
|
|
—
|
|
16,147
|
|
—
|
|
—
|
|
16,147
|
|
||||||||||||||||||||||||||
|
Acceleration of unvested equity awards
|
||||||||||||||||||||||||||||||||||||||||||||||||||||||||||
|
for Valence Health employees
|
—
|
|
—
|
|
—
|
|
—
|
|
—
|
|
—
|
|
—
|
|
—
|
|
162
|
|
2
|
|
—
|
|
—
|
|
3,897
|
|
—
|
|
—
|
|
3,899
|
|
||||||||||||||||||||||||||
|
Exercise of stock options
|
—
|
|
—
|
|
—
|
|
—
|
|
—
|
|
—
|
|
—
|
|
—
|
|
221
|
|
—
|
|
—
|
|
—
|
|
1,259
|
|
—
|
|
—
|
|
1,259
|
|
||||||||||||||||||||||||||
|
Restricted stock units vested, net of shares
|
||||||||||||||||||||||||||||||||||||||||||||||||||||||||||
|
withheld for taxes
|
—
|
|
—
|
|
—
|
|
—
|
|
—
|
|
—
|
|
—
|
|
—
|
|
84
|
|
—
|
|
—
|
|
—
|
|
2,193
|
|
—
|
|
—
|
|
2,193
|
|
||||||||||||||||||||||||||
|
Exchange of Class B common stock
|
—
|
|
—
|
|
—
|
|
—
|
|
—
|
|
—
|
|
—
|
|
—
|
|
2,178
|
|
22
|
|
(2,178
|
)
|
(22
|
)
|
28,220
|
|
—
|
|
(28,220
|
)
|
—
|
|
||||||||||||||||||||||||||
|
Tax impact of Class B common stock exchange
|
—
|
|
—
|
|
—
|
|
—
|
|
—
|
|
—
|
|
—
|
|
—
|
|
—
|
|
—
|
|
—
|
|
—
|
|
1,606
|
|
—
|
|
—
|
|
1,606
|
|
||||||||||||||||||||||||||
|
Issuance of Class A common stock for
|
||||||||||||||||||||||||||||||||||||||||||||||||||||||||||
|
business combinations
|
—
|
|
—
|
|
—
|
|
—
|
|
—
|
|
—
|
|
—
|
|
—
|
|
8,451
|
|
67
|
|
—
|
|
—
|
|
177,715
|
|
—
|
|
—
|
|
177,782
|
|
||||||||||||||||||||||||||
|
Tax impact of Class A common stock
|
||||||||||||||||||||||||||||||||||||||||||||||||||||||||||
|
issued for business combinations
|
—
|
|
—
|
|
—
|
|
—
|
|
—
|
|
—
|
|
—
|
|
—
|
|
—
|
|
—
|
|
—
|
|
—
|
|
1,427
|
|
—
|
|
—
|
|
1,427
|
|
||||||||||||||||||||||||||
|
Reclassification of non-controlling interests
|
—
|
|
—
|
|
—
|
|
—
|
|
—
|
|
—
|
|
—
|
|
—
|
|
—
|
|
—
|
|
—
|
|
—
|
|
(19,745
|
)
|
—
|
|
19,745
|
|
—
|
|
||||||||||||||||||||||||||
|
Net income (loss)
|
—
|
|
—
|
|
—
|
|
—
|
|
—
|
|
—
|
|
—
|
|
—
|
|
—
|
|
—
|
|
—
|
|
—
|
|
—
|
|
(159,742
|
)
|
(67,036
|
)
|
(226,778
|
)
|
||||||||||||||||||||||||||
|
Balance as of December 31, 2016
|
—
|
|
—
|
|
—
|
|
—
|
|
—
|
|
—
|
|
—
|
|
—
|
|
52,587
|
|
506
|
|
15,347
|
|
153
|
|
555,250
|
|
146,617
|
|
209,588
|
|
912,114
|
|
||||||||||||||||||||||||||
|
Stock-based compensation expense
|
—
|
|
—
|
|
—
|
|
—
|
|
—
|
|
—
|
|
—
|
|
—
|
|
—
|
|
—
|
|
—
|
|
—
|
|
20,437
|
|
—
|
|
—
|
|
20,437
|
|
||||||||||||||||||||||||||
|
Exercise of stock options
|
—
|
|
—
|
|
—
|
|
—
|
|
—
|
|
—
|
|
—
|
|
—
|
|
788
|
|
28
|
|
—
|
|
—
|
|
4,054
|
|
—
|
|
—
|
|
4,082
|
|
||||||||||||||||||||||||||
|
Restricted stock units vested, net of shares
|
||||||||||||||||||||||||||||||||||||||||||||||||||||||||||
|
withheld for taxes
|
—
|
|
—
|
|
—
|
|
—
|
|
—
|
|
—
|
|
—
|
|
—
|
|
149
|
|
2
|
|
—
|
|
—
|
|
(1,274
|
)
|
—
|
|
—
|
|
(1,272
|
)
|
||||||||||||||||||||||||||
|
Shares released from Valence Health escrow
|
—
|
|
—
|
|
—
|
|
—
|
|
—
|
|
—
|
|
—
|
|
—
|
|
(310
|
)
|
(3
|
)
|
—
|
|
—
|
|
911
|
|
—
|
|
—
|
|
908
|
|
||||||||||||||||||||||||||
|
Exchange of Class B common stock
|
—
|
|
—
|
|
—
|
|
—
|
|
—
|
|
—
|
|
—
|
|
—
|
|
12,693
|
|
126
|
|
(12,693
|
)
|
(126
|
)
|
168,883
|
|
—
|
|
(168,883
|
)
|
—
|
|
||||||||||||||||||||||||||
|
Tax impact of 2017 Securities Offerings
|
—
|
|
—
|
|
—
|
|
—
|
|
—
|
|
—
|
|
—
|
|
—
|
|
—
|
|
—
|
|
—
|
|
—
|
|
12,857
|
|
—
|
|
—
|
|
12,857
|
|
||||||||||||||||||||||||||
|
Issuance of Class A common stuck during
|
||||||||||||||||||||||||||||||||||||||||||||||||||||||||||
|
August 2017 Primary
|
—
|
|
—
|
|
—
|
|
—
|
|
—
|
|
—
|
|
—
|
|
—
|
|
8,816
|
|
88
|
|
—
|
|
—
|
|
166,859
|
|
—
|
|
—
|
|
166,947
|
|
||||||||||||||||||||||||||
|
Reclassification of non-controlling interests
|
—
|
|
—
|
|
—
|
|
—
|
|
—
|
|
—
|
|
—
|
|
—
|
|
—
|
|
—
|
|
—
|
|
—
|
|
(3,824
|
)
|
—
|
|
3,824
|
|
—
|
|
||||||||||||||||||||||||||
|
Net income (loss)
|
—
|
|
—
|
|
—
|
|
—
|
|
—
|
|
—
|
|
—
|
|
—
|
|
—
|
|
—
|
|
—
|
|
—
|
|
—
|
|
(60,665
|
)
|
(9,102
|
)
|
(69,767
|
)
|
||||||||||||||||||||||||||
|
Balance as of December 31, 2017
|
—
|
|
$
|
—
|
|
—
|
|
$
|
—
|
|
—
|
|
$
|
—
|
|
|
—
|
|
$
|
—
|
|
74,723
|
|
$
|
747
|
|
2,654
|
|
$
|
27
|
|
$
|
924,153
|
|
$
|
85,952
|
|
$
|
35,427
|
|
$
|
1,046,306
|
|
|||||||||||||||
See accompanying Notes to Consolidated Financial Statements
70
EVOLENT HEALTH, INC.
NOTES TO CONSOLIDATED FINANCIAL STATEMENTS
1
. Organization
Evolent Health, Inc. was incorporated in December 2014 in the state of Delaware, and is a managed services firm that supports leading health systems and physician organizations in their migration toward value-based care and population health management. The Company’s services include providing our customers, who we refer to as partners, with a population management platform, integrated data and analytics capabilities, PBM services and comprehensive health plan administration services. Together these services enable health systems to manage patient health in a more cost-effective manner. The Company’s contracts are structured as a combination of advisory fees, monthly member service fees, percentage of plan premiums and shared medical savings arrangements. The Company’s headquarters is located in Arlington, Virginia.
The Company’s predecessor, Evolent Health Holdings, Inc. (“Evolent Health Holdings”), merged with and into Evolent Health, Inc. in connection with the Offering Reorganization. As a result, the consolidated financial statements of Evolent Health, Inc. reflect the historical accounting of Evolent Health Holdings.
Prior to the organizational transactions noted below, due to certain participating rights granted to our investor, TPG Global, LLC and certain of its affiliates (“TPG”), Evolent Health Holdings did not control Evolent Health LLC, our operating subsidiary company, but was able to exert significant influence and, accordingly, accounted for its investment in Evolent Health LLC using the equity method of accounting through June 3, 2015. Subsequent to the Offering Reorganization, IPO, primary and secondary offerings (as described in Note
4
) and acquisitions (as described in Note
4
), as of
December 31, 2017
, Evolent Health, Inc. owned
96.6%
of Evolent Health LLC, holds
100%
of the voting rights, is the sole managing member and, therefore, controls its operations. The financial results of Evolent Health LLC have been consolidated in the financial statements of Evolent Health, Inc. subsequent to the Offering Reorganization.
Initial Public Offering
In June 2015, we completed an IPO of
13.2 million
shares of our Class A common stock at a public offering price of
$17.00
per share. We received
$209.1 million
in proceeds, net of underwriting discounts and commissions. Offering expenses incurred were
$3.2 million
which were recorded as a reduction of proceeds from the offering. We used the net proceeds to purchase newly issued Class A common units from Evolent Health LLC, our consolidated subsidiary. Evolent Health LLC will use the net proceeds for working capital and other general corporate and strategic purposes. See Note
4
for further details surrounding the IPO and related transactions.
Organizational Transactions
In connection with the IPO, we completed the following organizational transactions (the “Offering Reorganization”) as further described in Note
4
:
|
•
|
We amended and restated our certificate of incorporation to, among other things, authorize
two
classes of common stock - Class A common stock and Class B exchangeable common stock. Both classes of stock will vote together as a single class.
|
|
•
|
We acquired, by merger, an affiliate of a member of Evolent Health LLC, for which we issued
2.1 million
shares of Class A common stock.
|
|
•
|
We issued shares of our Class B exchangeable common stock to certain existing members of Evolent Health LLC.
|
Since its inception, the Company has incurred losses from operations. As of
December 31, 2017
, the Company had cash and cash equivalents of
$238.4 million
. The Company believes it has sufficient liquidity for the next twelve months as of the date the financial statements were available to be issued.
71
2
. Basis of Presentation, Summary of Significant Accounting Policies and Change in Accounting Principle
Basis of Presentation
The accompanying consolidated financial statements are prepared in accordance with GAAP. Certain GAAP policies that significantly affect the determination of our financial position, results of operations and cash flows, are summarized below.
As discussed in Note
4
, amounts for the period January 1, 2015, through June 3, 2015, presented in our consolidated financial statements and notes to consolidated financial statements represent the historical operations of our predecessor entity, Evolent Health Holdings, which did not consolidate the operations of Evolent Health LLC for that period. The amounts for the period from June 4, 2015, through December 31, 2015, and as of dates and for periods thereafter, reflect our operations, which consolidate the operations of Evolent Health LLC.
Summary of Significant Accounting Policies
Accounting Estimates and Assumptions
The preparation of financial statements in conformity with GAAP requires management to make estimates and assumptions affecting the reported amounts of assets and liabilities and the disclosures of contingent assets and liabilities as of the date of the financial statements and the reported amounts of revenue and expenses for the reporting period. Those estimates are inherently subject to change and actual results could differ from those estimates. In the accompanying consolidated financial statements, estimates are used for, but not limited to, the valuation of assets, liabilities, consideration related to business combinations and asset acquisitions, revenue recognition including discounts and credits, estimated selling prices for deliverables in multiple element arrangements, contingent payments, allowance for doubtful accounts, depreciable lives of assets, impairment of long lived assets (including equity method investments), stock-based compensation, deferred income taxes and valuation allowance, contingent liabilities, valuation of intangible assets (including goodwill), purchase price allocation in taxable stock transactions and the useful lives of intangible assets.
Principles of Consolidation
The consolidated financial statements include the accounts of Evolent Health, Inc. and its subsidiaries. All inter-company accounts and transactions are eliminated in consolidation.
Comprehensive Income
No elements of comprehensive income were present for any periods presented.
Fair Value Measurement
Fair value is the price that would be received from the sale of an asset or paid to transfer a liability assuming an orderly transaction in the most advantageous market at the measurement date. Our Consolidated Balance Sheets include various financial instruments (primarily cash not held in money-market funds, restricted cash, accounts receivable, accounts payable, accrued expenses and other liabilities) that are carried at cost and that approximate fair value.
See Note
16
for further discussion regarding fair value measurement.
Cash and Cash Equivalents
We consider all highly liquid instruments with original maturities of three months or less to be cash equivalents. The Company holds materially all of our cash in bank deposits with FDIC participating banks, at cost, which approximates fair value. Cash and cash equivalents held in money market funds are carried at fair value, which approximates cost.
72
Restricted Cash and Restricted Investments
Restricted cash and restricted investments include cash and investments used to collateralize various contractual obligations (in thousands) as follows:
|
As of December 31,
|
|||||||
|
2017
|
2016
|
||||||
|
Collateral for letters of credit
|
|||||||
|
for facility leases
(1)
|
$
|
3,812
|
|
$
|
4,852
|
|
|
|
Collateral with financial institutions
(2)
|
24,725
|
|
4,950
|
|
|||
|
Pharmacy benefit management
|
|||||||
|
and claims processing services
(3)
|
26,286
|
|
30,555
|
|
|||
|
Collateral for reinsurance agreement
(4)
|
10,000
|
|
—
|
|
|||
|
Other
|
862
|
|
59
|
|
|||
|
Total restricted cash
|
|||||||
|
and restricted investments
|
65,685
|
|
40,416
|
|
|||
|
Current restricted investments
|
8,150
|
|
—
|
|
|||
|
Current restricted cash
|
54,248
|
|
34,416
|
|
|||
|
Total current restricted cash
|
|||||||
|
and restricted investments
|
62,398
|
|
34,416
|
|
|||
|
Non-current restricted investments
|
605
|
|
4,950
|
|
|||
|
Non-current restricted cash
|
2,682
|
|
1,050
|
|
|||
|
Total non-current restricted cash
|
|||||||
|
and restricted investments
|
$
|
3,287
|
|
$
|
6,000
|
|
|
(1)
Represents restricted cash related to collateral for letters of credit required in conjunction with lease agreements. See Note
9
for further discussion of our lease commitments.
(2)
Represents collateral held with financial institutions for risk-sharing arrangements. As of
December 31, 2017
, approximately
$8.2 million
of the collateral amount was invested in restricted certificates of deposit with remaining maturities of less than 12 months. Approximately
$5.0 million
of the collateral amount was invested in restricted certificates of deposit with remaining maturities of greater than 12 months as of
December 31, 2016
. The restricted investments are classified as held-to-maturity and stated at amortized cost. Fair value of the certificates of deposit is determined using Level 2 inputs and approximates amortized cost as of
December 31, 2017
and
2016
. As of
December 31, 2017
, approximately
$16.6 million
of the collateral amount was in a trust account and invested in a money market fund. The amounts invested in money market funds are considered restricted cash and are carried at fair value, which approximates cost. See Note
16
for further discussion of our fair value measurement. For purposes of our risk sharing arrangements, the approximately
$8.2 million
invested in restricted certificates of deposit as of December 31, 2017 was no longer required beginning January 1, 2018. See Note
9
for further discussion of our risk-sharing arrangements.
(3)
Represents cash held by Evolent on behalf of partners to process PBM and other claims.
(4)
This amount represents restricted cash required as part of our capital only reinsurance agreement to provide balance sheet support to NMHC. There is no transfer of underwriting risk to Evolent and we are not at risk for any cash payments on behalf of NMHC as part of the agreement. The reinsurance agreement is further discussed in Note
9
.
The following table provides a reconciliation of cash and cash equivalents and restricted cash reported within the consolidated balance sheets that sum to the total of the same such amounts shown in the statements of cash flows.
|
As of December 31,
|
|||||||
|
2017
|
2016
|
||||||
|
Cash and cash equivalents
|
$
|
238,433
|
|
$
|
134,563
|
|
|
|
Restricted cash and restricted investments
|
65,685
|
|
40,416
|
|
|||
|
Restricted investments included in
|
|||||||
|
restricted cash and restricted investments
|
(8,755
|
)
|
(4,950
|
)
|
|||
|
Total cash and cash equivalents and restricted cash
|
|||||||
|
shown in the consolidated statements of cash flows
|
$
|
295,363
|
|
$
|
170,029
|
|
|
73
Accounts Receivable and Allowance for Doubtful Accounts
Accounts receivable are recorded when amounts are contractually billable under our customer contracts and are recorded at the invoiced amount and do not bear interest. The Company’s contracts typically include installment payments that do not necessarily correlate to the pattern of revenue recognition. In assessing the valuation of the allowance for doubtful accounts, management reviews the collectability of accounts receivable on an individual account basis. The allowance is adjusted periodically based on management’s determination of collectability, and any accounts that are determined to be uncollectible are written off against the allowance. The Company does
no
t have an allowance for doubtful accounts as of
December 31, 2017
or
2016
, as all amounts were determined to be materially collectible.
Due to the timing of invoicing, the Company had recorded unbilled receivables of
$2.4 million
and
$1.8 million
as of
December 31, 2017
and
2016
, respectively. Unbilled receivables are considered short-term and generally invoiced subsequent to the month the services are provided. While terms vary by contract, payment for services is typically contractually linked to the provision of specified services, with the timing of invoicing occurring in advance or subsequent to the services period.
Notes Receivable
Notes receivable are carried at the face amount of each note plus respective accrued interest receivable, less received payments. The Company does not typically carry notes receivable in the course of its regular business, but contributed
$20.0 million
in the form of an implementation funding loan (the “Implementation Loan”) under an agreement with a current customer entered during the year ended December 31, 2017. The Implementation Loan is expected to support implementation services to assist the customer in expanding its Medicaid membership. Repayments under the loan are recorded as they are received and are immediately offset against any outstanding accrued interest before they are applied against the outstanding principal balance on the loan. The Implementation Loan carries a fixed interest rate of
2.5%
per annum and the terms of the agreement governing the Implementation Loan require it to be repaid in
ten
equal monthly installments of
$2.0 million
, plus accrued interest, during 2018.
As of December 31, 2017, the outstanding balance of the Implementation Loan was
$20.0 million
and approximately
$0.1 million
of accrued interest.
Property and Equipment, Net
Property and equipment are carried at cost less accumulated depreciation and amortization. Depreciation and amortization of property and equipment are computed using the straight-line method over the shorter of the estimated useful lives of the assets or the lease term. Based on the current competitive environment and constantly changing landscape for similar technology, effective September 1, 2017, the Company changed its estimate of the useful life of internal-use software from
7
years to
5
years. This change in useful life has been accounted for as a change in accounting estimate and will be applied to all new internal-use software. This change in estimate will also be applied prospectively to the remaining carrying amounts of existing internal-use software. For these existing assets the useful lives were adjusted at the individual asset level and will be amortized over a period of time such that the carrying value is fully amortized
5
years from the date the individual assets were initially placed in service. See Note
6
for additional discussion regarding the change in estimate related to our property and equipment.
The following summarizes the updated estimated useful lives by asset classification:
|
Computer hardware
|
3 years
|
|
Furniture and equipment
|
3-7 years
|
|
Internal-use software development costs
|
5 years
|
|
Leasehold improvements
|
Shorter of useful life or remaining lease term
|
When an item is sold or retired, the cost and related accumulated depreciation or amortization is eliminated and the resulting gain or loss, if any, is recorded in our Consolidated Statements of Operations.
We periodically review the carrying value of our long-lived assets, including property and equipment, for impairment whenever events or circumstances indicate that the carrying amount of such assets may not be fully recoverable. For long-lived assets to be held and used, impairments are recognized when the carrying amount of a long-lived asset group is not recoverable and exceeds fair value. The carrying amount of a long-lived asset group is not recoverable if it exceeds the sum of the undiscounted cash flows expected to result from the use and eventual disposition of the asset group. An impairment loss is measured as the amount by which the carrying amount of a long-lived asset group exceeds its fair value.
74
Software Development Costs
The Company capitalizes the cost of developing internal-use software, consisting primarily of personnel and related expenses (including stock-based compensation and employee taxes and benefits) for employees and third parties who devote time to their respective projects. Internal-use software costs are capitalized during the application development stage – when the research stage is complete and management has committed to a project to develop software that will be used for its intended purpose and any costs incurred during subsequent efforts to significantly upgrade and enhance the functionality of the software are also capitalized. Capitalized software costs are included in property and equipment, net on our Consolidated Balance Sheets. Amortization of internal-use software costs are recorded on a straight-line basis over their estimated useful life and begin once the project is substantially complete and the software is ready for its intended purpose.
Research and Development Costs
Research and development costs consist primarily of personnel and related expenses (including stock-based compensation) for employees engaged in research and development activities as well as third-party fees. All such costs are expensed as incurred. We focus our research and development efforts on activities that support our technology infrastructure, clinical program development, data analytics and network development capabilities. Research and development costs are recorded within “Selling, general and administrative expenses” on our Consolidated Statements of Operations and were
$17.2 million
,
$11.1 million
and
$5.8 million
for the years ended
December 31, 2017
,
2016
and
2015
, respectively.
Goodwill
We recognize the excess of the purchase price, plus the fair value of any non-controlling interests in the acquiree, over the fair value of identifiable net assets acquired as goodwill. Goodwill is not amortized, but is reviewed at least annually for indications of impairment, with consideration given to financial performance and other relevant factors. Our annual goodwill impairment testing date is October 31. We perform impairment tests between annual tests if an event occurs, or circumstances change, that would more likely than not reduce the fair value of a reporting unit below its carrying amount. We perform impairment tests of goodwill at our single reporting unit level, which is consistent with the way management evaluates our business. Acquisitions to date have been complementary to the Company’s core business, and therefore goodwill is assigned to our single reporting unit to reflect the synergies arising from each business combination.
As discussed in Note
3
, we adopted ASU 2017-04,
Intangibles-Goodwill and Other - Simplifying the Test for Goodwill Impairment,
effective January 1, 2017. The adoption resulted in an update to our accounting policy for goodwill impairment. Our updated policy is described below.
Our goodwill impairment analysis first assesses qualitative factors to determine whether events or circumstances existed that would lead the Company to conclude it is more likely than not that the fair value of its reporting unit is below its carrying amount. If the Company determines that it is more likely than not that the fair value of its reporting unit is below the carrying amount, a quantitative goodwill assessment is required. In the quantitative evaluation, the fair value of the relevant reporting unit is determined and compared to the carrying value. If the fair value is greater than the carrying value, then the carrying value is deemed to be recoverable and no further action is required. If the fair value estimate is less than the carrying value, goodwill is considered impaired for the amount by which the carrying amount exceeds the reporting unit’s fair value and a charge is reported in impairment of goodwill on our Consolidated Statements of Operations. See Note
7
for additional discussion regarding the goodwill impairment tests conducted during
2017
and
2016
.
Intangible Assets, Net
As noted above, on June 4, 2015, the Company completed the Offering Reorganization, following which we were required to remeasure the assets, liabilities and non-controlling interests of our equity-method investee, Evolent Health LLC, at fair value. The Company acquired additional intangible assets in conjunction with strategic acquisitions made during 2016 and
2017
. Information regarding the determination and allocation of the fair value of the acquired assets and liabilities are further described within Note
4
.
Identified intangible assets are recorded at their estimated fair values at the date of acquisition and are amortized over their respective estimated useful lives using a method of amortization that reflects the pattern in which the economic benefits of the intangible assets are used. Based on the current competitive environment and constantly changing landscape for similar technology, effective September 1, 2017, the Company changed its estimate of the useful life of intangible technology from a range of
5
-
7
years to
5
years. This change in useful life has been accounted for as a change in accounting estimate and will be applied to all new intangible technology, provided the facts and circumstances of the intangible technology do not suggest otherwise. This change in estimate will also be applied prospectively to the remaining carrying amounts of existing technology assets. For these existing assets the useful lives were adjusted at the individual asset level and will be amortized over a period of time such that the carrying value is fully amortized
5
years from the date the individual assets were initially capitalized.
75
The following summarizes the updated estimated useful lives by asset classification:
|
Corporate trade name
|
20 years
|
|
Customer relationships
|
15-25 years
|
|
Technology
|
5 years
|
Intangible assets are reviewed for impairment if circumstances indicate the Company may not be able to recover the asset’s carrying value. The Company evaluates recoverability by determining whether the undiscounted cash flows expected to result from the use and eventual disposition of that asset or group exceed the carrying value at the evaluation date. If the undiscounted cash flows are not sufficient to cover the carrying value, the Company measures an impairment loss as the excess of the carrying amount of the long-lived asset or group over its fair value. See Note
7
for additional discussion regarding our intangible assets.
Long-term Debt
As discussed in Note
8
, the Company issued
$125.0 million
aggregate principal amount of its
2.00%
Convertible Senior Notes due
2021
in a Private Placement in December 2016. The 2021 Notes are carried at cost, net of deferred financing costs, as long-term debt on the Consolidated Balance Sheets. The deferred financing costs will be amortized to non-cash interest expense using the straight line method over the contractual term of the 2021 Notes, since this method was not materially different from the effective interest rate method. Cash interest payments are due semi-annually in arrears - on June 1 and December 1 each year, starting on June 1, 2017. We will accrue interest expense monthly based on the annual coupon rate of
2.00%
. The 2021 Notes have embedded conversion options and contingent interest provisions, which have not been recorded as separate financial instruments.
Leases
The Company leases all of its office space and enters into various other operating lease agreements in conducting its business. At the inception of each lease, the Company evaluates the lease agreement to determine whether the lease is an operating or capital lease. The operating lease agreements may contain tenant improvement allowances, rent holidays or rent escalation clauses. When such items are included in a lease agreement, the Company records a deferred rent asset or liability on our Consolidated Balance Sheets equal to the difference between the rent expense and future minimum lease payments due. The rent expense related to these items is recognized on a straight-line basis in the Consolidated Statements of Operations over the terms of the leases. In addition, the Company has entered into sublease agreements for some of its leased office space. Total rental income attributable to the subleases is offset against rent expense recorded in the Consolidated Statements of Operations over the terms of the leases. As of
December 31, 2017
and
2016
, the Company had not entered into any capital leases.
The Company is subject to non-cancellable leases for offices or portions of offices for which use might cease, resulting in a lease abandonment. When a lease abandonment is determined to have occurred, the present value of the future lease payments, net of estimated sublease payments, along with any unamortized tenant improvement costs, are recognized as lease abandonment expense in the Company’s Consolidated Statements of Operations with a corresponding liability in the Company’s Consolidated Balance Sheets. See No
te
9
for
discussion of the lease abandonment.
Impairment of Equity Method Investments
The Company considers potential impairment triggers for its equity method investments, and the equity method investments will be written down to fair value if there is evidence of a loss in value which is other-than-temporary. The Company may estimate the fair value of its equity method investments by considering recent investee equity transactions, discounted cash flow analyses and recent operating results. If the fair value of the investment has dropped below the carrying amount, management considers several factors when determining whether other-than-temporary impairment has occurred. The estimation of fair value and whether other-than-temporary impairment has occurred requires the application of significant judgment and future results may vary from current assumptions. There was
no
such impairment for the years ended
December 31, 2017
,
2016
and
2015
.
Deferred Revenue
Deferred revenue consists of billings or payments received in advance of providing the requisite services or other instances where the revenue recognition criteria have not been met. Amounts deferred that are not anticipated to be recognized as revenue within a year of the balance sheet date are reported as long-term deferred liabilities.
Revenue Recognition
Revenue from the Company’s services is recognized when there is persuasive evidence of an arrangement, performance or delivery has occurred, the fee is fixed or determinable and collectability is reasonably assured.
76
At times, the Company enters into contracts that contain multiple deliverables and we evaluate each deliverable to determine whether it represents a separate unit of accounting based on the following criteria: (i) if the delivered item has value to the customer on a standalone basis, and (ii) if the contract includes a general right of return relative to the delivered item, and delivery or performance of the undelivered item(s) is considered probable and substantially in the control of the vendor. Revenue is then allocated to the units of accounting based on an estimate of each unit’s relative selling price.
Revenue Recognition - Transformation
Transformation contracts consist of strategic assessments, or Blueprint contracts, and implementation contracts. Based on the strategic assessment generated in a Blueprint contract, a customer may decide to move forward with a population health or health plan strategy; in these cases, the customer enters into an implementation contract in which the Company provides services related to the launch of this strategy.
The Company recognizes revenue associated with transformation contracts based on a proportionate performance method, where revenue is recognized each period in proportion to the amount of the contract completed during that period. In the case of implementation revenues tied to certain health plan services activities, such revenue is deferred and amortized over the life of the contract. Contract completion is measured using output measures as best estimated by labor hours incurred compared to the total estimated labor hours necessary to complete our performance obligations contained in the contract.
Revenue Recognition - Platform and Operations
After the transformation phase, the Company often enters into a multi-year service contract with its customers where various population health, health plan operations, third-party health plan and PBM services are provided on an ongoing basis to the members of the customers’ plans typically in exchange for a monthly service fee, PMPM fee or a percentage of plan premiums. Revenue from these contracts is recognized in the month in which the services are delivered. In certain arrangements, there is a contingent portion of our service fee including meeting service level targets, sharing in rebates, shared medical savings arrangements based on financial performance and other performance measures. The Company continuously monitors its compliance with these arrangements and recognizes revenue when the amount is estimable and there is evidence to support meeting the criteria.
Credits and Discounts
We also provide credits and discounts to our customers often based on achieving certain volume commitments or other criteria. Credits are assessed to determine whether they reflect significant and incremental discounts. If the discounts are significant, the Company allocates them between the contract deliverables or future purchases as appropriate. If the future credit expires unused, it is recognized as revenue at that time.
Cost of Revenue (exclusive of depreciation and amortization)
Our cost of revenue includes direct expenses and shared resources that perform services in direct support of clients. Costs consist primarily of employee-related expenses (including compensation, benefits and stock-based compensation), expenses for TPA support and other services, as well as other professional fees.
Stock-based Compensation
The Company sponsors a stock-based incentive plan that provides for the issuance of stock-based awards to employees and non-employee directors of the Company or its consolidated subsidiaries. Our stock-based awards generally vest over a
four
year period and expire
ten
years from the date of grant.
We expense the fair value of stock-based awards granted under our incentive compensation plans. Fair value of stock options is determined using a Black-Scholes options valuation methodology. The fair value of the awards is expensed over the performance or service period, which generally corresponds to the vesting period, on a straight-line basis and is recognized as an increase to additional paid-in capital. Stock-based compensation expense is reflected in “Cost of revenue” and “Selling, general and administrative expenses” in our Consolidated Statements of Operations. Additionally we capitalize personnel expenses attributable to the development of internal-use software, which include stock-based compensation costs. We recognize share-based award forfeitures as they occur.
Prior to the Offering Reorganization on June 3, 2015, stock-based awards were granted in the stock of the Company to employees of its equity-method investee, Evolent Health LLC. As such, the Company was required to use a “non-employee” model for recognizing stock-based compensation, which required the awards to be marked-to-market through
net income at the end of each reporting period until vesting occurred. Subsequent to the Offering Reorganization described in Note
4
, stock-based awards are granted in the Company’s stock to the employees of Evolent Health LLC and compensation costs are therefore recognized using an “employee” model. Under the “employee” model, we no longer mark the awards to market at the end of each reporting period.
77
Income Taxes
Deferred income taxes are recognized, based on enacted rates, when assets and liabilities have different values for financial statement and tax reporting purposes. A valuation allowance is recorded to the extent required. Considerable judgment and the use of estimates are required in determining whether a valuation allowance is necessary and, if so, the amount of such valuation allowance. In evaluating the need for a valuation allowance, we consider many factors, including: the nature and character of the deferred tax assets and liabilities; taxable income in prior carryback years; future reversals of temporary differences; the length of time carryovers can be utilized; and any tax planning strategies we would employ to avoid a tax benefit from expiring unused.
We use a recognition threshold and a measurement attribute for the financial statement recognition and measurement of uncertain tax positions taken or expected to be taken in a tax return. For those benefits to be recognized, a tax position must be more-likely-than-not to be sustained upon examination by taxing authorities. We recognize interest and penalties accrued on any unrecognized tax exposures as a component of income tax expense, when applicable. As of
December 31, 2017
, our identified balance of uncertain income tax positions would not have a material impact to the consolidated financial statements. We did not have any such amounts accrued as of
December 31, 2016
, as we had not identified any uncertain income tax positions that could have a material impact to the consolidated financial statements. We are subject to taxation in various jurisdictions in the U.S. and remain subject to examination by taxing jurisdictions for the years 2011 and all subsequent periods due to the availability of NOL carryforwards.
We are a holding company and our assets consist of our direct ownership in Evolent Health LLC, for which we are the managing member. Evolent Health LLC is classified as a partnership for U.S. federal and applicable state and local income tax purposes and, as such, is not subject to U.S. federal, state and local income taxes. Taxable income or loss generated by Evolent Health LLC is allocated to holders of its units, including us, on a pro rata basis. Accordingly, we are subject to U.S. federal, state and local income taxes with respect to our allocable share of any taxable income of Evolent Health LLC.
Earnings (Loss) per Share
Basic earnings (loss) per share is computed by dividing net income (loss) available to Class A common shareholders by the weighted-average number of Class A common shares outstanding.
For periods of net income, and when the effects are not anti-dilutive, we calculate diluted earnings per share by dividing net income available to Class A common shareholders by the weighted average number of Class A common shares assuming the conversion of the convertible preferred securities, which occurred on the date of the Offering Reorganization, plus the weighted average number of Class A common shares assuming the conversion of our 2021 Notes, as well as the impact of all potential dilutive common shares, consisting primarily of common stock options and unvested restricted stock awards using the treasury stock method and our exchangeable Class B common stock. For periods of net loss, shares used in the diluted earnings (loss) per share calculation represent basic shares as using potentially dilutive shares would be anti-dilutive.
Prior to the Offering Reorganization, the Company issued securities other than common stock that participated in dividends (“participating securities”), and therefore, we utilized the two-class method to calculate earnings (loss) per share for the applicable periods. Participating securities include redeemable convertible preferred stock. The two-class method requires a portion of earnings to be allocated to the participating securities to determine the earnings available to common stockholders. Earnings (loss) available to the common stockholders is equal to net income (loss) less dividends paid on preferred stock, assumed periodic cumulative preferred stock dividends, repurchases of preferred stock for an amount in excess of carrying value and an allocation of any remaining earnings (loss) in accordance with the bylaws between the outstanding common and preferred stock as of the end of each applicable period.
Operating Segments
Operating segments are defined as components of a business that earn revenue and incur expenses for which discrete financial information is available that is evaluated, on a regular basis, by the chief operating decision maker (“CODM”) to decide how to allocate resources and assess performance. The Company’s CODM, the Chief Executive Officer, allocates resources at a consolidated level and therefore the Company views its operations and manages its business as one operating segment. All of the Company’s revenue is generated in the United States and all assets are located in the United States.
Change in Accounting Principle
In November 2016, the Financial Accounting Standards Board (“FASB”) issued Accounting Standards Update (“ASU”) 2016-18, which reduces diversity in practice regarding the classification and presentation of changes in restricted cash on the statement of cash flows. We adopted the requirements of this standard effective December 31, 2017, using the retroactive transition method, which resulted in the recast of our statement of cash flows for each period presented.
78
The amendments in the ASU require that a statement of cash flows explain the change during the period in the total of cash, cash equivalents, and amounts generally described as restricted cash or restricted cash equivalents. Therefore, amounts generally described as restricted cash and restricted cash equivalents should be included with cash and cash equivalents when reconciling the beginning-of-period and end-of-period total amounts shown on the statement of cash flows.
A significant portion of the Company’s restricted cash consists of cash held on behalf of partners to process PBM claims. These are pass-through amounts and can fluctuate materially from period to period depending on the timing of when the claims are processed. Under the previous standard, there was no net impact to the statement of cash flows related to these amounts as the change in accounts payable was offset by the change in restricted cash. Upon adoption of ASU 2016-18, the change in restricted cash held on behalf of PBM partners would no longer net to zero, thereby potentially having a significant impact on cash flows from operations period over period. Given the pass-through nature of these PBM claim payments, the change in restricted cash held on behalf of PBM partners will be presented within cash flows from financing activities on our statements of changes in cash flows under the updated requirements of ASU 2016-18.
The following table summarizes the impact of the change in accounting principle to the Company’s Consolidated Statements of Cash Flows for the years ended December 31, 2017, 2016 and 2015 (in thousands):
|
Prior to
|
Adoption
|
||||||||||
|
Adoption
|
Adjustments
|
As Reported
|
|||||||||
|
For the year ended December 31, 2017
|
|||||||||||
|
Cash Flows from Investing Activities
|
|||||||||||
|
Change in restricted cash and restricted investments
|
$
|
(29,471
|
)
|
$
|
29,471
|
|
$
|
—
|
|
||
|
Purchase of restricted investments
|
—
|
|
(3,805
|
)
|
(3,805
|
)
|
|||||
|
Net cash and restricted cash provided by (used in) investing activities
|
(37,931
|
)
|
25,666
|
|
(12,265
|
)
|
|||||
|
Cash Flows from Financing Activities
|
|||||||||||
|
Change in restricted cash held on behalf of partners for claims processing
|
—
|
|
(4,200
|
)
|
(4,200
|
)
|
|||||
|
Net cash and restricted cash provided by (used in) financing activities
|
169,758
|
|
(4,200
|
)
|
165,558
|
|
|||||
|
Net increase (decrease) in cash and cash equivalents and restricted cash
|
103,868
|
|
21,466
|
|
125,334
|
|
|||||
|
Cash and cash equivalents and restricted cash as of beginning-of-period
|
134,563
|
|
35,466
|
|
170,029
|
|
|||||
|
Cash and cash equivalents and restricted cash as of end-of-period
|
$
|
238,431
|
|
$
|
56,932
|
|
$
|
295,363
|
|
||
|
As Originally
|
|||||||||||
|
Reported
|
Adjustments
|
As Adjusted
|
|||||||||
|
For the year ended December 31, 2016
|
|||||||||||
|
Cash Flows from Investing Activities
|
|||||||||||
|
Change in restricted cash and restricted investments
|
$
|
(6,090
|
)
|
$
|
6,090
|
|
$
|
—
|
|
||
|
Purchase of restricted investments
|
—
|
|
(4,950
|
)
|
(4,950
|
)
|
|||||
|
Net cash and restricted cash provided by (used in) investing activities
|
(97,797
|
)
|
1,140
|
|
(96,657
|
)
|
|||||
|
Cash Flows from Financing Activities
|
|||||||||||
|
Change in restricted cash held on behalf of partners for claims processing
|
—
|
|
28,041
|
|
28,041
|
|
|||||
|
Net cash and restricted cash provided by (used in) financing activities
|
122,144
|
|
28,041
|
|
150,185
|
|
|||||
|
Net increase (decrease) in cash and cash equivalents and restricted cash
|
(11,163
|
)
|
29,181
|
|
18,018
|
|
|||||
|
Cash and cash equivalents and restricted cash as of beginning-of-period
|
145,726
|
|
6,285
|
|
152,011
|
|
|||||
|
Cash and cash equivalents and restricted cash as of end-of-period
|
$
|
134,563
|
|
$
|
35,466
|
|
$
|
170,029
|
|
||
|
As Originally
|
|||||||||||
|
Reported
|
Adjustments
|
As Adjusted
|
|||||||||
|
For the year ended December 31, 2015
|
|||||||||||
|
Cash Flows from Financing Activities
|
|||||||||||
|
Change in restricted cash held on behalf of partners for claims processing
|
$
|
—
|
|
$
|
6,285
|
|
$
|
6,285
|
|
||
|
Net cash and restricted cash provided by (used in) financing activities
|
207,878
|
|
6,285
|
|
214,163
|
|
|||||
|
Net increase (decrease) in cash and cash equivalents and restricted cash
|
145,726
|
|
6,285
|
|
152,011
|
|
|||||
|
Cash and cash equivalents and restricted cash as of beginning-of-period
|
—
|
|
—
|
|
—
|
|
|||||
|
Cash and cash equivalents and restricted cash as of end-of-period
|
$
|
145,726
|
|
$
|
6,285
|
|
$
|
152,011
|
|
||
79
3
. Recently Issued Accounting Standards
Adoption of New Accounting Standards
In November 2016, the FASB issued ASU 2016-18,
Statement of Cash Flows: Restricted Cash
. The purpose of the ASU is to reduce diversity in practice regarding the classification and presentation of changes in restricted cash on the statement of cash flows. The amendments in the ASU require that a statement of cash flows explain the change during the period in the total of cash, cash equivalents, and amounts generally described as restricted cash or restricted cash equivalents. Therefore, amounts generally described as restricted cash and restricted cash equivalents should be included with cash and cash equivalents when reconciling the beginning-of-period and end-of-period total amounts shown on the statement of cash flows. The amendments are effective for fiscal years beginning after December 15, 2017, and interim periods within those fiscal years. Early adoption is permitted, including adoption in an interim period. The amendments in this ASU should be applied using a retrospective transition method to each period presented. We adopted the requirements of this standard effective December 31, 2017, which resulted in the recast of our statement of cash flows for each period presented. The adoption of this ASU had an impact on our financial statements with respect to presentation of our statement of cash flows. See the “Change in Accounting Principle” section within Note
2
above for further information on the adoption of ASU 2016-18.
In August 2016, the FASB issued ASU 2016-15,
Statement of Cash Flows - Classification of Certain Cash Receipts and Cash Payments
. This ASU provides updated guidance on eight specific cash flow issues to reduce diversity in practice in how certain cash receipts and cash payments are presented and classified in the statement of cash flows. The amendments are effective for public business entities for fiscal years beginning after December 15, 2017, and interim periods within those fiscal years. Early adoption is permitted, including adoption in an interim period. If an entity early adopts the amendments in an interim period, any adjustments should be reflected as of the beginning of the fiscal year that includes that interim period. We adopted the requirements of this standard, effective December 31, 2017.
The adoption of this ASU may have an impact on the presentation of our statement of cash flows if we encounter specific cash receipts and cash payments in the purview of this ASU, such as cash outflows related to a contingent consideration and cash receipts from our equity method investees. There was no impact of the adoption for the years ended
December 31, 2017
, 2016 or 2015.
In May 2017, the FASB issued ASU 2017-09,
Compensation-Stock Compensation - Scope of Modification Accounting
. The purpose of the ASU is to
limit the circumstances in which an entity applies modification accounting to share-based awards by setting criteria whereby an entity would be precluded from applying modification accounting guidance in Topic 718. The ASU also removes guidance in Topic 718 stating that modification accounting is not required when an entity adds an anti-dilution provision if that modification is not made in contemplation of an equity restructuring.
The amendments are effective for annual periods, and interim periods within those annual periods, beginning after December 15, 2017. Early adoption is permitted, including adoption in any interim periods. The amendments should be applied prospectively to an award modified on or after the adoption date. We adopted this standard, effective June 1, 2017. The adoption of this ASU may have an impact if we have a modification to our share-based awards at a future date. There was no impact of the adoption for the year ended
December 31, 2017
.
In January 2017, the FASB issued ASU 2017-01,
Business Combinations - Clarifying the Definition of a Business
. The purpose of the ASU is to add guidance to assist entities with evaluating whether transactions should be accounted for as acquisitions (or disposals) of assets or businesses. The ASU provides a screen to determine when an integrated set of assets and activities is not a business. The ASU also provides a framework to assist entities in evaluating whether both an input and a substantive process are present. The amendments are effective for annual periods beginning after December 15, 2017, including interim periods within those periods. The amendments should be applied prospectively on or after the effective date. Early adoption is permitted for transactions for which the acquisition date occurs before the issuance date or effective date of the amendments, only when the transaction has not been reported in financial statements that have been issued or made available for issuance. We adopted this standard during June 2017, in conjunction with the acquisition of Accordion Health, Inc. (see Note
4
). The adoption had an impact on our financial statements with respect to the accounting for the Accordion Health, Inc. acquisition, and we anticipate it will have an impact if we engage in future business combinations or asset acquisitions.
In January 2017, the FASB issued ASU 2017-04,
Intangibles-Goodwill and Other - Simplifying the Test for Goodwill Impairment
. The purpose of the ASU is to simplify the subsequent measurement of goodwill. The ASU eliminates Step 2 from the goodwill impairment test. An entity no longer will determine goodwill impairment by calculating the implied fair value of goodwill by assigning the fair value of a reporting unit to all of its assets and liabilities as if that reporting unit had been acquired in a business combination. This update is effective for annual or any interim goodwill impairment tests in fiscal years beginning after December 15, 2019. Early adoption is permitted for interim or annual goodwill impairment tests performed on testing dates after January 1, 2017. We believe this newly adopted principle is preferable as it reduces the complexity of performing a goodwill impairment test. As a result, we adopted this standard effective January 1, 2017. Our updated accounting policy for goodwill impairment is described in Note
2
. See Note
7
for a description of our 2017 goodwill impairment tests as performed under the updated standard.
In March 2016, the FASB issued ASU 2016-07,
Investments-Equity Method and Joint Ventures - Simplifying the Transition to the Equity Method of Accounting
. The purpose of this ASU is to eliminate the requirement to retroactively adopt the equity method of
80
accounting when an investment qualifies for the equity method as a result of an increase in the level of ownership interest or degree of influence. The amendments require that the equity method investor add the cost of acquiring the additional interest in the investee to the current basis of the investor’s previously held interest and adopt the equity method of accounting as of the date the investment becomes qualified for equity method accounting. Therefore, upon qualifying for the equity method of accounting, no retroactive adjustment of the investment is required. The amendments in this ASU are effective for all entities for fiscal years, and interim periods within those fiscal years, beginning after December 15, 2016. We adopted this standard effective January 1, 2017. The adoption did not have a material impact on our financial statements for the
year ended
December 31, 2017
.
In March 2016, the FASB issued ASU 2016-06,
Derivatives and Hedging - Contingent Put and Call Options in Debt Instruments
. The purpose of this ASU is to clarify the requirements for assessing whether contingent call (put) options that can accelerate the payment of principal on debt instruments are clearly and closely rated to their debt hosts. An entity performing the assessment under the amendments in the ASU is required to assess the embedded call (put) options solely in accordance with the four-step decision sequence. For public business entities, the amendments in this ASU are effective for financial statements issued for fiscal years beginning after December 15, 2016, and interim periods within those fiscal years. We adopted this standard effective January 1, 2017. The adoption did not have a material impact on our financial statements for the
year ended
December 31, 2017
.
Future Adoption of New Accounting Standards
In June 2016, the FASB issued ASU 2016-13,
Financial Instruments - Credit Losses: Measurement of Credit Losses on Financial Instruments
. With respect to assets measured at amortized cost, such as held-to-maturity assets, the update requires presentation of the amortized cost net of a credit loss allowance. The update eliminates the probable initial recognition threshold that was previously required prior to recognizing a credit loss on financial instruments. The credit loss estimate can now reflect an entity’s current estimate of all future expected credit losses as opposed to the previous standard, when an entity only considered past events and current conditions. With respect to available for sale debt securities, the update requires that credit losses be presented as an allowance rather than as a write-down. The update is effective for fiscal years beginning after December 15, 2019, including interim periods within those fiscal years. Early adoption is permitted as of the fiscal years beginning after December 15, 2018, including interim periods within those fiscal years. We intend to adopt the requirements of this standard effective January 1, 2020, and are currently evaluating the impact of the adoption on our financial condition and results of operations.
In February 2016, the FASB issued ASU 2016-02,
Leases
, in order to establish the principles to report transparent and economically neutral information about the assets and liabilities that arise from leases.
This update introduces a new standard on accounting for leases, including a lessee model that brings most leases on the balance sheet. The new standard also aligns many of the underlying principles of the new lessor model with those in ASC 606, the FASB’s new revenue recognition standard (e.g., those related to evaluating when profit can be recognized). The standard also requires lessors to increase the transparency of their exposure to changes in value of their residual assets and how they manage that exposure. The ASU is effective for fiscal years beginning after December 15, 2018, including interim periods within those fiscal years. Early application is permitted. We intend to adopt the requirements of this standard effective January 1, 2019, and are currently evaluating the impact of the adoption on our financial condition and results of operations.
In May 2014, the FASB issued ASU 2014-09,
Revenue from Contracts with Customers
, in order to clarify the principles of recognizing revenue. This standard establishes the core principle of recognizing revenue to depict the transfer of promised goods or services in an amount that reflects the consideration to which the entity expects to be entitled in exchange for those goods or services. The FASB defines a five-step process that systematically identifies the various components of the revenue recognition process, culminating with the recognition of revenue upon satisfaction of an entity’s performance obligations. By completing all five steps of the process, the core principles of revenue recognition will be achieved. In March 2016, the FASB issued an update to the new revenue standard (ASU 2014-09) in the form of ASU 2016-08, which amended the principal-versus-agent implementation guidance and illustrations in the new revenue guidance. The update clarifies that an entity should evaluate whether it is the principal or the agent for each specified good or service promised in a contract with a customer. In April 2016, the FASB issued another update to the new revenue standard in the form of ASU 2016-10, which amended the guidance on identifying performance obligations and the implementation guidance on licensing. These ASUs were followed by two further updates issued during May 2016: ASU 2016-11, which rescinds certain SEC guidance, such as the adoption of ASUs 2014-09 and 2014-16, including accounting for consideration given by a vendor to a customer, and ASU 2016-12, which is intended to clarify the objective of the collectability criterion while identifying the contract(s) with a customer. The new revenue standard (including updates) is effective for annual and interim reporting periods beginning after December 15, 2017, with early adoption permitted only as of annual reporting periods beginning after December 15, 2016. The guidance permits two methods of adoption: i) the full retrospective method applying the standard to each prior reporting period presented, or ii) the modified retrospective method with a cumulative effect of initially applying the guidance recognized at the date of initial application. The standard also allows entities to apply certain practical expedients at their discretion. We adopted this standard effective January 1, 2018, using the modified retrospective method with a cumulative catch up adjustment and providing additional disclosures comparing results to previous rules. We anticipate that the adoption of the standard will result in changes related to revenue recognition for certain contracts that contain features, such as variable consideration. These changes will generally accelerate revenue recognition. In addition, certain customer setup costs which have historically been expensed as incurred will be capitalized. We are making changes to our accounting policies and practices, business processes, systems and controls to
81
support the new revenue recognition and disclosure requirements. We have also updated our internal controls related to revenue recognition and contract costs to address internal controls over financial reporting necessary to ensure compliance with ASC 606 and ASC 340-40.
We have preliminarily assessed the cumulative impact of adopting the standard as of January 1, 2018, to be an increase in stockholders’ equity of approximately
$15.0 million
to
$18.0 million
, primarily as a result of deferral of expenses related to contract acquisition and fulfillment costs and acceleration of revenue due to variable consideration estimation.
We have evaluated all other issued and unadopted ASUs and believe the adoption of these standards will not have a material impact on our results of operations, financial position, or cash flows.
4
. Transactions
Business Combinations
Aldera
On
November 1, 2016
, the Company completed the acquisition of Aldera, including
100%
of the voting equity interests. The acquisition provides control over Aldera, a key vendor and the primary software provider for the Valence Health TPA platform. The merger consideration, net of certain closing and post-closing adjustments was
$34.3 million
based on the closing price of the Company’s Class A common stock on the NYSE on
November 1, 2016
, and consisted of approximately
0.5 million
shares of the Company’s Class A common stock,
$17.5 million
in cash and
$7.0 million
related to the settlement of a prepaid software license. As a result of the Class A common stock issued for the Aldera transaction, the Company’s ownership of Evolent Health LLC increased from
77.2%
to
77.4%
, immediately after the acquisition, as the Company was issued Class A membership units in Evolent Health LLC in exchange for the contribution of Aldera to Evolent Health LLC post acquisition.
Prior to the acquisition of Aldera, Evolent entered into a perpetual license agreement for development rights and use of Aldera proprietary software for
$7.0 million
. Upon closing the acquisition of Aldera, the Company concluded that the
$7.0 million
prepaid asset recorded by Evolent and the deferred revenue balance recorded by Aldera for the perpetual software license should be assessed as a prepayment for a software license that was effectively settled upon acquisition and was eliminated in the post-combination consolidated financial statements. No gain or loss was recognized on settlement as management determined the
$7.0 million
license fee to be priced at fair value and the license agreement did not include a settlement provision. The Company increased the consideration transferred for the acquisition of Aldera by
$7.0 million
for the effective settlement of the prepaid software license at the recorded amount, which brought the total consideration paid for the acquisition to
$34.3 million
.
The Company incurred approximately
$0.2 million
in transaction costs related to the Aldera acquisition, which were recorded within “Selling, general and administrative expenses” on our Consolidated Statements of Operations for the year ended December 31, 2016. The Company accounted for the transaction as a business combination using purchase accounting.
82
During the year ended December 31, 2017, the Company recorded net measurement period adjustments of approximately
$0.4 million
. The purchase price allocation, as previously determined, the measurement period adjustments and the purchase price allocation, as revised, are as follows (in thousands):
|
Measurement
|
||||||||||||||
|
As Previously
|
Period
|
|||||||||||||
|
Determined
|
Adjustments
|
As Revised
|
||||||||||||
|
Purchase consideration:
|
||||||||||||||
|
Fair value of Class A common stock issued
|
$
|
9,864
|
|
$
|
—
|
|
$
|
9,864
|
|
|||||
|
Cash for settlement of software license
|
7,000
|
|
—
|
|
7,000
|
|
||||||||
|
Cash
|
17,481
|
|
—
|
|
17,481
|
|
||||||||
|
Total consideration
|
$
|
34,345
|
|
$
|
34,345
|
|
||||||||
|
Tangible assets acquired:
|
||||||||||||||
|
Receivables
|
$
|
624
|
|
$
|
(194
|
)
|
$
|
430
|
|
|||||
|
Prepaid expenses and other current assets
|
272
|
|
—
|
|
272
|
|
||||||||
|
Property and equipment
|
1,065
|
|
—
|
|
1,065
|
|
||||||||
|
Other non-current assets
|
9
|
|
—
|
|
9
|
|
||||||||
|
Identifiable intangible assets acquired:
|
||||||||||||||
|
Customer relationships
|
7,000
|
|
—
|
|
7,000
|
|
||||||||
|
Technology
|
2,500
|
|
—
|
|
2,500
|
|
||||||||
|
Liabilities assumed:
|
||||||||||||||
|
Accounts payable
|
429
|
|
—
|
|
429
|
|
||||||||
|
Accrued liabilities
|
1,204
|
|
205
|
|
1,409
|
|
||||||||
|
Accrued compensation and employee benefits
|
605
|
|
—
|
|
605
|
|
||||||||
|
Deferred revenue
|
44
|
|
—
|
|
44
|
|
||||||||
|
Goodwill
|
25,157
|
|
399
|
|
25,556
|
|
||||||||
|
Net assets acquired
|
$
|
34,345
|
|
$
|
34,345
|
|
||||||||
The fair value of the receivables acquired, as revised, shown in the table above, approximates the gross contractual amounts deemed receivable by management. Identifiable intangible assets associated with technology and customer relationships will be amortized on a straight-line basis over their estimated useful lives of
5
and
15
years, respectively. The technology is related to source code for licensed software used to support the third-party administration platform offered to Aldera’s clients. The fair value of the intangible assets was primarily determined using the income approach. The income approach estimates fair value for an asset based on the present value of cash flows projected to be generated by the asset. Projected cash flows are discounted at a required rate of return that reflects the relative risk of achieving the cash flows and the time value of money. Goodwill is calculated as the difference between the acquisition date fair value of the total consideration and the fair value of the net assets acquired, and represents the future economic benefits that we expect to achieve as a result of the acquisition. The goodwill is attributable primarily to the acquired assembled workforce and expected cost and revenue synergies. Goodwill is considered an indefinite lived asset. The transaction was a taxable business combination for the Company and the amount of goodwill determined for tax purposes is deductible upon the beginning of the amortization period for tax purposes.
The amounts above reflect management’s estimate of the fair value of the tangible and intangible assets acquired and liabilities assumed based on a valuation performed using currently available information, inclusive of the measurement period adjustments. During the year ended December 31, 2017, the Company recorded certain measurement period adjustments that primarily impacted receivables, accrued liabilities and goodwill. These adjustments resulted in a net
$0.4 million
increase to goodwill, as reflected in the purchase price allocation table above. The purchase price allocation for Aldera was finalized during 2017.
Valence Health
On
October 3, 2016
, the Company completed its acquisition of Valence Health, including
100%
of the voting equity interests. Valence Health, based in Chicago, Illinois, was founded in 1996 and provides value-based administration, population health and advisory services. In its 20 year history, Valence Health developed particular expertise in the Medicaid and pediatric markets. The addition of Valence Health strengthens the Company’s operational capabilities and provides increased scale and client diversification.
83
The merger consideration, net of certain closing and post-closing adjustments was
$217.9 million
based on the closing price of the Company’s Class A common stock on the NYSE on
October 3, 2016
, and consisted of
6.8 million
shares of the Company’s Class A common stock and
$54.8 million
in cash. The shares issued to Valence Health stockholders represented approximately
10.5%
of the Company’s issued and outstanding Class A common stock and Class B common stock immediately following the transaction. As a result of the Class A common stock issued for the Valence Health transaction, the Company’s ownership in Evolent Health LLC increased from
74.6%
to
77.2%
, immediately after the acquisition, as the Company was issued Class A membership units in Evolent Health LLC in exchange for the contribution of Valence Health to Evolent Health LLC post acquisition. The transaction also included an earn-out of up to
$12.4 million
, fair valued at
$2.6 million
as of
October 3, 2016
, payable by January 30, 2017, in the Company’s Class A common stock, tied to new business activity contracted on or before December 31, 2016. The fair value was determined by assigning probabilities to potential business activity in the pipeline as of the acquisition date. As of December 31, 2016, Valence Health had not contracted sufficient business to be eligible for payment of the earn-out consideration. As a result, the Company recorded a gain of
$2.6 million
in accordance with the release of the contingent liability for the year ended December 31, 2016, which is recorded within “(Gain) loss on change in value of contingent consideration” on our Consolidated Statements of Operations. The Company incurred approximately
$2.7 million
of transaction costs related to the Valence Health acquisition for the year ended December 31, 2016. Approximately
$2.6 million
of these transaction costs are recorded within “Selling, general and administrative expenses” and less than
$0.1 million
are recorded within “Cost of revenue” on our Consolidated Statements of Operations. The Company accounted for the transaction as a business combination using purchase accounting.
The purchase price was allocated to the assets acquired and liabilities assumed based on their estimated fair values as of
October 3, 2016
. During the year ended December 31, 2017, the Company recorded net measurement period adjustments of approximately
$1.2 million
. The purchase price allocation, as previously determined, the measurement period adjustments and the purchase price allocation, as revised, are as follows (in thousands):
|
Measurement
|
||||||||||||||
|
As Previously
|
Period
|
|||||||||||||
|
Determined
|
Adjustments
|
As Revised
|
||||||||||||
|
Purchase consideration:
|
||||||||||||||
|
Fair value of Class A common stock issued
|
$
|
159,614
|
|
$
|
911
|
|
$
|
160,525
|
|
|||||
|
Fair value of contingent consideration
|
2,620
|
|
—
|
|
2,620
|
|
||||||||
|
Cash
|
54,799
|
|
—
|
|
54,799
|
|
||||||||
|
Total consideration
|
$
|
217,033
|
|
$
|
217,944
|
|
||||||||
|
Tangible assets acquired:
|
||||||||||||||
|
Restricted cash
|
$
|
1,829
|
|
$
|
—
|
|
$
|
1,829
|
|
|||||
|
Accounts Receivable
|
8,587
|
|
(251
|
)
|
8,336
|
|
||||||||
|
Prepaid expenses and other current assets
|
3,465
|
|
—
|
|
3,465
|
|
||||||||
|
Property and equipment
|
6,241
|
|
—
|
|
6,241
|
|
||||||||
|
Other non-current assets
|
313
|
|
—
|
|
313
|
|
||||||||
|
Favorable leases assumed (net of unfavorable leases)
|
4,323
|
|
(126
|
)
|
4,197
|
|
||||||||
|
Identifiable intangible assets acquired:
|
||||||||||||||
|
Customer relationships
|
69,000
|
|
—
|
|
69,000
|
|
||||||||
|
Technology
|
18,000
|
|
—
|
|
18,000
|
|
||||||||
|
Liabilities assumed:
|
||||||||||||||
|
Accounts payable
|
5,703
|
|
—
|
|
5,703
|
|
||||||||
|
Accrued liabilities
|
3,865
|
|
(69
|
)
|
3,796
|
|
||||||||
|
Accrued compensation and employee benefits
|
9,200
|
|
—
|
|
9,200
|
|
||||||||
|
Deferred revenue
|
2,022
|
|
640
|
|
2,662
|
|
||||||||
|
Other long-term liabilities
|
2,328
|
|
—
|
|
2,328
|
|
||||||||
|
Net deferred tax liabilities
|
13,316
|
|
(636
|
)
|
12,680
|
|
||||||||
|
Goodwill
|
141,709
|
|
1,223
|
|
142,932
|
|
||||||||
|
Net assets acquired
|
$
|
217,033
|
|
$
|
217,944
|
|
||||||||
The fair value of the receivables acquired, as revised, shown in the table above, approximates the gross contractual amounts due under contracts of
$9.1 million
, of which
$0.8 million
is expected to be uncollectible. Identifiable intangible assets associated with customer
84
relationships and technology will be amortized on a straight-line basis over their preliminary estimated useful lives of
20
and
5
years, respectively. The customer relationships are primarily attributable to existing contracts with current customers. The technology is an existing platform Valence Health uses to provide services to customers. The fair value of the intangible assets was primarily determined using the income approach. The income approach estimates fair value for an asset based on the present value of cash flows projected to be generated by the asset. Projected cash flows are discounted at a required rate of return that reflects the relative risk of achieving the cash flows and the time value of money. Goodwill is calculated as the difference between the acquisition date fair value of the total consideration and the fair value of the net assets acquired, and represents the future economic benefits that we expect to achieve as a result of the acquisition. The goodwill is attributable primarily to the acquired assembled workforce and expected cost and revenue synergies. Goodwill is considered an indefinite lived asset. The merger was structured as a tax-free reorganization and therefore the Company received carryover basis in the assets and liabilities acquired; accordingly, the Company recognized net deferred tax liabilities associated with the difference between the book basis and the tax basis for the assets and liabilities acquired, as well as the Valence Health net operating loss tax carryforward received in the merger, in the amount of
$13.3 million
, resulting in additional goodwill. The purchased and additional goodwill created due to the increase in the deferred tax liability were not deductible for tax purposes. The Company contributed the acquired assets and liabilities of Valence Health to Evolent Health LLC, resulting in a taxable gain of
$52.7 million
for the Company, not recognized for financial reporting purposes.
The amounts above reflect management’s estimate of the fair value of the tangible and intangible assets acquired and liabilities assumed based on a valuation performed using currently available information, inclusive of measurement period adjustments. The Company recorded various measurement period adjustments that resulted in a
$1.2 million
net increase to
goodwill
during the year ended December 31, 201
7, including an adjustment to increase deferred revenue and goodwill by approximately
$0.6 million
during 2017, all of which was recorded as revenue during the year. In a
ddition, during the second quarter of 2017, the Company reached an agreement to finalize the net working capital (“NWC”) settlement related to the Valence Health transaction. Per the executed settlement agreement, the Company received
0.2 million
shares of its Class A Common Stock previously held in escrow. The fair value of the NWC settlement was approximately
$0.9 million
less than the Company’s previously recorded estimate and, accordingly, the Company recorded a measurement period adjustment to increase purchase price and goodwill by approximately
$0.9 million
. The Company also recorded adjustments to accounts receivable and intangible assets, which resulted in a
$0.4 million
increase to goodwill. During 2017, the Company filed the 2016 pre-acquisition tax return for Valence Health, resulting in an adjustment to decrease deferred tax liabilities and goodwill by approximately
$0.6 million
due to updates in certain estimates that were made as of the transaction date.
The purchase price allocation for Valence Health was finalized during 2017.
Our results for the year ended December 31, 2016, included approximately
$3.9 million
in stock compensation expense related to the acceleration of unvested Valence Health equity awards that vested upon the close of the Valence Health acquisition. The expense was related to Valence Health employees that remained with the Company following the close of the acquisition.
Immediately following the Valence Health acquisition, the Company decided to abandon and sublet its rented space at 540 W. Madison Street, Suite 1400, Chicago, Illinois (the “14
th
Floor Space”). Therefore, our results from operations for the year ended December 31, 2016, included a lease abandonment expense of approximately
$6.5 million
in conjunction with a rental space acquired as part of the Valence Health acquisition, based on remaining lease payments and expected future sublease income. During the second quarter of 2017, the Company reached an agreement to terminate the lease for the 14th Floor Space, effective September 2017. The Company continued making rent payments until September 1, 2017, at which point it paid a one-time lease cancellation and related brokerage fee. Remaining cash outflows related to the 14th Floor Space were estimated to be approximately
$4.8 million
as of June 30, 2017, while the remaining balance of the initial
$6.5 million
lease abandonment liability recorded after the Valence Health acquisition was approximately
$5.3 million
as of June 30, 2017, prior to adjustments pertaining to the lease cancellation fees. As such, the Company recorded a one-time adjustment of
$0.5 million
to reduce the lease abandonment liability, from
$5.3 million
to
$4.8 million
, as of June 30, 2017. The adjustment was recorded as a reduction to our rent expense within “Selling, general and administrative expenses” on our Consolidated Statements of Operations for the year ended December 31, 2017. The Company made regular rent payments until September 1, 2017, at which point we paid a one-time lease cancellation and related brokerage fee of
$4.4 million
. There is
no
remaining lease abandonment liability related to the 14th Floor Space as of December 31, 2017.
In conjunction with our acquisition of Valence Health on October 3, 2016, we also signed a Master Service Agreement (the “MSA”), as well as a Transition Service Agreement (the “TSA”) with Cicerone Health, the surviving Valence Health, Inc. state insurance cooperative business not acquired by the Company (“CHS”). The MSA and the TSA are at market rates and, therefore, there is no allocation of purchase price to these arrangements.
The terms of the MSA stipulate that the Company will provide service information technology, system configuration and medical management services to CHS’s state insurance cooperative clients until
December 31, 2018
. Based on management’s analysis, the terms of the MSA are at fair market value.
The TSA has expired as of December 31, 2017. Under the terms of the TSA, the Company provided back office information technology support to CHS and CHS provided back office finance and human resources support to Evolent until
December 31, 2017
. Additionally, employees of both entities will have mutual employee health care claims administration through a self-funded plan. Based on management’s analysis, the terms of the TSA are at fair market value.
85
Passport
On
February 1, 2016
, the Company entered into a strategic alliance with Passport, a nonprofit community-based and provider-sponsored health plan administering Kentucky Medicaid and federal Medicare Advantage benefits to approximately
0.3 million
Kentucky Medicaid and Medicare Advantage beneficiaries. As part of the transaction, we issued
1.1 million
Class A common shares to acquire capabilities and assets from Passport to enable us to build out a Medicaid Center of Excellence based in Louisville, Kentucky. Additional equity consideration of up to
$10.0 million
may be earned by Passport should we obtain new third party Medicaid businesses in future periods. This transaction also includes a
10
-year arrangement under which we will provide various health plan management and managed care services to Passport. The Company incurred approximately
$0.3 million
in transaction costs related to the Passport acquisition for the year ended December 31, 2016. The transaction costs were recorded within “Selling, general and administrative expenses” on our Consolidated Statements of Operations. The Company has accounted for the transactions with Passport as a business combination using purchase accounting.
The fair value of the total consideration transferred in connection with the close of the transaction was
$18.2 million
, of which the Class A common shares were valued at
$10.5 million
and the contingent equity consideration was initially valued at
$7.8 million
. The fair value of the shares issued was determined based on the closing price of the Company’s Class A common stock on the NYSE as of
February 1, 2016
, and the quantity of shares issued was determined under a pricing collar set forth in the purchase agreement. The contingent equity consideration was recorded as a mark-to-market liability of
$8.7 million
and
$8.3 million
within “Other long-term liabilities” on our Consolidated Balance Sheets as of
December 31, 2017
and
2016
, respectively. We recorded a re-measurement loss of approximately
$0.4 million
and
$0.5 million
during the years ended
December 31, 2017
and
2016
, respectively, based on changes in the underlying assumptions of the fair value calculation. The fair value of the contingent equity consideration was estimated based on the real options approach, a form of the income approach, which estimated the probability of the Company achieving future revenues under the agreement. Key assumptions include the discount rate and the probability-adjusted recurring revenue forecast. A further discussion of the fair value measurement of the contingent consideration is provided in Note
16
.
The purchase price was allocated to the assets acquired based on their fair values as of
February 1, 2016
, as follows (in thousands):
|
Purchase consideration
|
|||
|
Fair value of Class A common stock issued
|
$
|
10,450
|
|
|
Fair value of contingent consideration
|
7,750
|
|
|
|
Total consideration
|
$
|
18,200
|
|
|
Tangible assets acquired
|
|||
|
Prepaid asset
|
$
|
6,900
|
|
|
Goodwill
|
11,300
|
|
|
|
Net assets acquired
|
$
|
18,200
|
|
The prepaid asset is related to an acquired facility license agreement as the Company was provided with leased facilities which house the acquired Passport employees at no future cost to the Company. The fair value of the acquired facility license agreement was determined by comparing the current market value of similar lease spaces to the facilities occupied by the acquired Passport personnel to obtain a market value of the occupied space, with the present value of the determined market value of the occupied space classified as the acquired facility license agreement prepaid asset. The goodwill is attributable partially to the acquired assembled workforce. The transaction was a taxable business combination for the Company and the amount of goodwill determined for tax purposes is deductible upon the beginning of the amortization period for tax purposes.
The Offering Reorganization
Evolent Health, Inc. was incorporated as a Delaware corporation in December 2014 for the purpose of pursuing the Company’s IPO. Immediately prior to the completion of the IPO in June 2015, we amended and restated our certificate of incorporation to, among other things, authorize
two
classes of common stock, Class A common stock and Class B common stock. Each share of our Class A common stock and Class B common stock entitles its holder to
one
vote on all matters to be voted on by stockholders, and holders of Class A common stock and holders of Class B common stock vote together as a single class on all matters presented to stockholders for their vote or approval (except as otherwise required by law). Pursuant to the Offering Reorganization:
|
•
|
Evolent Health Holdings merged with and into Evolent Health, Inc. and the surviving corporation of the merger was Evolent Health, Inc.;
|
|
•
|
An affiliate of TPG merged with and into Evolent Health, Inc. and the surviving corporation of the merger was Evolent Health, Inc.;
|
86
|
•
|
Each of the then-existing stockholders of Evolent Health Holdings received
four
shares of our Class A common stock and the right to certain payments under the TRA in exchange for each share of Class A common stock held in Evolent Health Holdings;
|
|
•
|
TPG received
2.1 million
shares of Class A common stock of Evolent Health, Inc., together with the right to certain payments under the TRA in exchange for
100%
of the equity that it held in its affiliate that was merged with Evolent Health, Inc.; and
|
|
•
|
We issued shares of our Class B common stock and the right to certain payments under the TRA to The Advisory Board, TPG and another investor each of which was a member of Evolent Health LLC prior to the Offering Reorganization.
|
The existing shareholders of Evolent Health Holdings held the same economic and voting interest before and after the merger of Evolent Health Holdings with and into Evolent Health, Inc., which represents a transaction among entities with a high degree of common ownership. As such, the merger is viewed as non-substantive and the consolidated financial statements of Evolent Health, Inc. reflect the historical accounting of Evolent Health Holdings except that the legal capital reflects the capital of Evolent Health, Inc.
In addition, in connection with the Offering Reorganization, Evolent Health LLC amended and restated its operating agreement to establish
two
classes of equity (voting Class A common units and non-voting Class B common units); after the amendment, the pre-reorganization members of Evolent Health LLC (other than Evolent Health, Inc.) hold
100%
of the Class B common units and Evolent Health, Inc. holds the Class A voting common units. Evolent Health LLC’s Class B common units can be exchanged (together with a corresponding number of shares of our Class B common stock) for one share of our Class A common stock.
As a result of the Offering Reorganization, Evolent Health, Inc. obtained voting control over Evolent Health LLC and therefore consolidated Evolent Health LLC and recognized a gain of
$414.1 million
upon obtaining control. The gain represents the excess of the fair value of our interest in Evolent Health LLC’s net assets over the carrying value of our equity method investment prior to the Offering Reorganization and is included in gain on consolidation in the Consolidated Statements of Operations.
We accounted for obtaining control of Evolent Health LLC as a step acquisition and, accordingly, recognized the fair value of Evolent Health LLC’s assets acquired, liabilities assumed, non-controlling interests recognized and the remeasurement gain recorded on the previously held equity interests. As the acquisition was the result of the Offering Reorganization and not the purchase of additional interest in Evolent Health LLC, there were no assets acquired or liabilities assumed, and there was no purchase price paid as a part of the transaction. The allocation of the value of the transaction (in thousands) is included below:
|
Goodwill
|
$
|
608,903
|
|
|
Intangible assets
|
169,000
|
|
|
|
Cash and restricted cash
|
21,930
|
|
|
|
Other assets
|
49,239
|
|
|
|
Remeasurement gain on previously held equity interest
|
(414,133
|
)
|
|
|
Liabilities and deferred revenue
|
(71,299
|
)
|
|
|
Non-controlling interests
|
(332,793
|
)
|
|
|
Carrying value of previously held equity interest
|
(30,847
|
)
|
|
|
Purchase price
|
$
|
—
|
|
The estimated fair value of Evolent Health LLC was determined using a business enterprise valuation approach that discounted Evolent Health LLC’s projected cash flows based on an estimate of its weighted average cost of capital. Evolent Health LLC’s fair value was estimated to be
$777.8 million
. In addition, we determined the fair value of Evolent Health LLC’s tangible and identifiable intangible assets, deferred revenue and other liabilities, based on various income and market approaches, including the relief from royalty method for trade name and technologies, and the discounted cash flow method for customer relationships, both of which use Level 3 inputs (see Note
16
for discussion of fair value and use of Level 3 inputs). We are amortizing the acquired identifiable intangible assets over their estimated useful lives (see Note
2
for discussion of useful lives for intangible assets). The Offering Reorganization was structured as a tax-free exchange and, therefore, did not result in tax deductible goodwill.
Our operations are conducted through Evolent Health LLC and subsequent to the Offering Reorganization the financial results of Evolent Health LLC are consolidated in the financial statements of Evolent Health, Inc. Evolent Health, Inc. is a holding company whose principal asset is all of the Class A common units it holds in Evolent Health LLC, and its only business is to act as sole managing member of Evolent Health LLC.
Evolent Health LLC Governance
The Company serves as sole managing member of Evolent Health LLC. As such, it controls Evolent Health LLC’s business and affairs and is responsible for the management of its business.
87
Coordination of Evolent Health, Inc. and Evolent Health LLC
We must, at all times, maintain a
one
-to-one ratio between the number of outstanding shares of our Class A common stock and the number of outstanding Class A common units of Evolent Health LLC.
Issuances of Common Units
Evolent Health LLC may only issue Class A common units to us, as the sole managing member of Evolent Health LLC. Class B common units may be issued only to persons or entities we permit. Such issuances of Class B common units shall be made in exchange for cash or other consideration. Class B common units may not be transferred as Class B common units except to certain permitted transferees and in accordance with the restrictions on transfer set forth in the third amended and restated operating agreement of Evolent Health LLC. Any such transfer must be accompanied by the transfer of an equal number of shares of our Class B common stock.
We entered into an exchange agreement with Evolent Health LLC, The Advisory Board, TPG and another investor. Pursuant to and subject to the terms of the exchange agreement and the third amended and restated operating agreement of Evolent Health LLC, holders of Class B common units, at any time and from time to time, may exchange one or more Class B common units, together with an equal number of shares of our Class B common stock, for shares of our Class A common stock on a one-for-one basis. The amount of Class A common stock issued or conveyed will be subject to equitable adjustments for stock splits, stock dividends and reclassifications. As holders exchange their Class B common units and Class B common stock for Class A common stock, our interest in Evolent Health LLC will increase.
Pro forma financial information (unaudited)
The unaudited pro forma Consolidated Statements of Operations presented below gives effect to (1) the Aldera transaction as if it had occurred on January 1, 2015, (2) the Valence Health transaction as if it had occurred on January 1, 2015, (3) the Passport transaction as if it had occurred on January 1, 2015, and (4) the consolidation of Evolent Health LLC as if it had occurred on January 1, 2014. The following pro forma information includes adjustments to:
|
•
|
Remove transaction costs related to the Aldera, Valence Health and Passport transactions of
$0.2 million
,
$2.7 million
and
$0.3 million
, respectively, recorded during 2016 and reclassify said amounts to 2015;
|
|
•
|
Remove one-time items, such as the gain on the release of our contingent liability related to Valence Health of
$2.6 million
, stock-based compensation of
$3.9 million
related to the acceleration of Valence Health’s unvested equity awards and the lease abandonment charge related to the 14
th
Floor Space of
$6.5 million
, recorded during 2016 and reclassify said amounts to 2015;
|
|
•
|
Record amortization expenses related to intangible assets beginning January 1, 2015, for intangibles related to Valence Health and Aldera;
|
|
•
|
Record revenue and expenses related to the MSA and TSA in 2016 and 2015;
|
|
•
|
Remove the tax benefit recorded associated with the Valence Health acquisition and reclassify said amounts to 2015;
|
|
•
|
Remove the gain recognized upon the consolidation of the previously held equity method investment in 2015 and reclassify said amount to 2014;
|
|
•
|
Remove transaction costs related to the Offering Reorganization of
$1.2 million
in 2015 and reclassify said amount to 2014;
|
|
•
|
Record amortization expenses related to intangible assets beginning January 1, 2014, for intangibles related to the Offering Reorganization;
|
|
•
|
Record rent expense related to Passport prepaid lease beginning January 1, 2015; and
|
|
•
|
Record adjustments of income taxes associated with these pro forma adjustments.
|
88
This pro forma data is presented for informational purposes only and does not purport to be indicative of the results of future operations or of the results that would have occurred had the transactions described above occurred in the specified prior periods. The pro forma adjustments are based on available information and assumptions that the Company believes are reasonable to reflect the impact of these transactions on the Company’s historical financial information on a pro forma basis (in thousands, except per share data).
|
For the Years Ended
|
|||||||
|
December 31,
|
|||||||
|
2016
|
2015
|
||||||
|
Revenue
|
$
|
361,944
|
|
$
|
311,639
|
|
|
|
Net income (loss)
|
(225,091
|
)
|
(93,906
|
)
|
|||
|
Net income (loss) attributable to
|
|||||||
|
non-controlling interests
|
(57,433
|
)
|
(28,684
|
)
|
|||
|
Net income (loss) attributable to
|
|||||||
|
Evolent Health, Inc.
|
(167,658
|
)
|
(65,222
|
)
|
|||
|
Net income (loss) available to
|
|||||||
|
common shareholders:
|
|||||||
|
Basic
|
$
|
(3.30
|
)
|
$
|
(1.50
|
)
|
|
|
Diluted
|
(3.30
|
)
|
(1.50
|
)
|
|||
Associated with the Offering Reorganization, deferred revenue was recorded only to the extent that it represented an obligation assumed by the acquirer. As a result, existing deferred revenue was reduced by
$4.9 million
to account for the deferred revenue at fair value.
Securities Offerings
August 2017 Primary Offering
In August 2017, the Company completed a primary offering of
8.8 million
shares of its Class A common stock at a price to the public of
$19.85
per share and a corresponding price to the underwriters of
$19.01
per share (the “August 2017 Primary”). This offering resulted in net cash proceeds to the Company of approximately
$166.9 million
(gross proceeds of
$175.0 million
, net of
$8.1 million
in underwriting discounts and stock issuance costs). For each share of Class A common stock issued by Evolent Health, Inc., the Company received a corresponding Class A common unit from Evolent Health LLC in exchange for contributing the issuance proceeds to Evolent Health LLC. As a result of the Class A common stock and Class A common units of Evolent Health LLC issued during the August 2017 Primary, the Company’s economic interest in Evolent Health LLC increased from
96.1%
to
96.6%
immediately following the August 2017 Primary, and, accordingly, the Company reclassified a portion of its non-controlling interests into shareholders’ equity attributable to Evolent Health, Inc.
2017 Secondary Offerings
Certain affiliates of TPG, The Advisory Board, UPMC and Ptolemy Capital, LLC (together, the “Investor Stockholders”) have an existing exchange right that allows receipt of newly-issued shares of the Company’s Class A common stock in exchange (a “Class B Exchange”) for an equal number of shares of the Company’s Class B common stock (which are subsequently canceled) and an equal number of Evolent Health LLC’s Class B common units. The Class B common units of Evolent Health LLC received by the Company from relevant Investor Stockholders are simultaneously exchanged for an equivalent number of Class A common units of Evolent Health LLC, and Evolent Health LLC cancels the Class B common units of Evolent Health LLC it receives in the Class B Exchange. The Class B Exchanges and subsequent cancellation of Class B common units of Evolent Health LLC result in an increase in the Company’s economic interest in Evolent Health LLC. The Company did not receive any proceeds from Class B Exchanges or the sale of Class A common stock in the secondary offerings described below.
The Investor Stockholders initiated several Class B Exchanges as part of various secondary offerings during 2017 and 2016, thus increasing the Company’s economic interest in Evolent Health LLC, as discussed below.
June 2017 Secondary Offering
In June 2017, the Company completed a secondary offering of
4.5 million
shares of its Class A common stock at a price to the underwriters of
$25.87
per share (the “June 2017 Secondary”).
89
The shares sold in the June 2017 Secondary consisted of
0.7 million
existing shares of the Company’s Class A common stock owned and held by certain Investor Stockholders and
3.8 million
newly issued shares of the Company’s Class A common stock received by certain Investor Stockholders pursuant to Class B Exchanges.
As a result of these Class B Exchanges and Evolent Health LLC’s cancellation of its Class B common units during the June 2017 Secondary, the Company’s economic interest in Evolent Health LLC increased from
90.5%
to
96.1%
immediately following the June 2017 Secondary, and, accordingly, the Company reclassified a portion of its non-controlling interests into shareholders’ equity attributable to Evolent Health, Inc.
May 2017 Secondary Offering
In May 2017, the Company completed a secondary offering of
7.0 million
shares of its Class A common stock at a price to the underwriters of
$24.30
per share (the “May 2017 Secondary”). The shares were sold by certain of the Selling Stockholders (as defined below).
The shares sold in the May 2017 Secondary consisted of
3.1 million
existing shares of the Company’s Class A common stock owned and held by the Selling Stockholders,
3.8 million
newly issued shares of the Company’s Class A common stock received by certain Investor Stockholders pursuant to Class B Exchanges and
0.1 million
shares issued upon the exercise of options by certain management selling stockholders.
As a result of these Class B Exchanges and Evolent Health LLC’s cancellation of its Class B common units during the May 2017 Secondary, the Company’s economic interest in Evolent Health LLC increased from
84.9%
to
90.5%
immediately following the May 2017 Secondary, and, accordingly, the Company reclassified a portion of its non-controlling interests into shareholders’ equity attributable to Evolent Health, Inc.
March 2017 Secondary Offering
In March 2017, the Company completed a secondary offering of
7.5 million
shares of its Class A common stock at a price to the underwriters of
$19.53
per share (the “March 2017 Secondary”).
The shares sold in the March 2017 Secondary consisted of
3.1 million
existing shares of the Company’s Class A common stock owned and held by the Investor Stockholders and
4.4 million
newly issued shares of the Company’s Class A common stock received by certain Investor Stockholders pursuant to Class B Exchanges.
As a result of these Class B Exchanges and Evolent Health LLC’s cancellation of its Class B common units during the March 2017 Secondary, the Company’s economic interest in Evolent Health LLC increased from
77.4%
to
83.9%
immediately following the March 2017 Secondary, and, accordingly, the Company reclassified a portion of its non-controlling interests into shareholders’ equity attributable to Evolent Health, Inc.
In connection with the March 2017 Secondary, the underwriters exercised, in full, their option to purchase an additional
1.1 million
shares of Class A common stock (the “March 2017 Option to Purchase Additional Shares”) from the Investor Stockholders at a price of
$19.53
per share. The March 2017 Option to Purchase Additional Shares closed in May 2017.
The shares sold in the March 2017 Option to Purchase Additional Shares consisted of
0.5 million
existing shares of the Company’s Class A common stock owned and held by certain Investor Stockholders. It also included
0.6 million
newly issued shares of the Company’s Class A common stock received by certain Investor Stockholders pursuant to Class B Exchanges.
As a result of the Class B Exchanges and Evolent Health LLC’s cancellation of its Class B common units during the March 2017 Option to Purchase Additional Shares, the Company’s economic interest in Evolent Health LLC increased from
83.9%
to
84.9%
immediately following the March 2017 Option to Purchase Additional Shares, and, accordingly, the Company reclassified a portion of its non-controlling interests into shareholders’ equity attributable to Evolent Health, Inc.
The June 2017 Secondary, May 2017 Secondary, March 2017 Secondary and March 2017 Option to Purchase Additional Shares are collectively referred to as the “2017 Secondary Offerings.”
September 2016 Secondary Offering
In September 2016, the Company completed a secondary offering of
8.6 million
shares of its Class A common stock at a price to the underwriters of
$21.54
per share, including the exercise in full by the underwriters of their option to purchase additional shares (the “September 2016 Secondary”).
90
The shares sold in the September 2016 Secondary consisted of
6.4 million
existing shares of the Company’s Class A common stock owned and held by the Investor Stockholders and certain management selling stockholders (together with the Investor Stockholders, the “Selling Stockholders”) and
2.2 million
newly issued shares of the Company’s Class A common stock received by certain Investor Stockholders pursuant to Class B Exchanges.
As a result of these Class B Exchanges and Evolent Health LLC’s cancellation of its Class B common units during the September 2016 Secondary, the Company’s economic interest in Evolent Health LLC increased from
71.0%
to
74.6%
immediately following the September 2016 Secondary, and, accordingly, the Company reclassified a portion of its non-controlling interests into shareholders’ equity attributable to Evolent Health, Inc.
Subsequent to the IPO, Offering Reorganization, business combinations and securities transactions described above, we owned
96.6%
and
77.4%
of the economic interests and
100%
of the voting rights in Evolent Health LLC as of
December 31, 2017
and
2016
, respectively.
Asset Acquisitions
Accordion Health, Inc.
On
June 8, 2017
, the Company entered into an agreement to acquire Accordion for
$3.2 million
(the “Accordion Purchase Agreement”). Accordion provides technology that the Company believes enhances its RAF services to its partners. In addition to technology assets, the software development team from Accordion joined Evolent as full-time employees. Under the terms of the Accordion Purchase Agreement, members of the software development team will be eligible for an additional
$0.8 million
earn-out, contingent upon the completion of specified software development targets.
The Company accounted for the transaction as an asset acquisition as substantially all of the fair value of the gross assets acquired was concentrated in a single identified asset, thus satisfying the requirements of the screen test introduced in ASU 2017-01. The assets acquired in the transaction were measured based on the amount of cash paid to Accordion, including transaction costs, as the fair value of the assets given was more readily determinable than the fair value of the assets received. The Company classified and designated the identifiable assets acquired as a
$3.3 million
technology intangible asset, inclusive of approximately
$0.1 million
of capitalized transaction costs. The Company also assessed and determined the useful life of the acquired intangible assets to be
5
years, and the intangible assets will be amortized on a straight line basis over this period. The Company will account for the contingent earn-out as a post-acquisition expense if the specified software development targets are achieved. The transaction was a taxable stock acquisition and the Company recognized deferred tax liability of approximately
$2.0 million
related to the book-tax basis difference in the acquired asset, which resulted in an income tax benefit related to the reduction in the Company’s previously established valuation allowance, the reduction of which is accounted for outside of acquisition accounting. This amount was recorded as an intangible asset. The deferred tax liability represents a future source of potential taxable income that enables the Company to release some of its previously established valuation allowance, the reduction of which is accounted for outside of acquisition accounting, resulting in income tax benefit.
Vestica
On March 1, 2016, the Company entered into an Asset Purchase Agreement between Vestica and Evolent Health LLC. As part of the transaction, the Company paid
$7.5 million
to acquire certain assets from Vestica to further align our interests with one of our existing partners. Vestica can earn an additional
$4.0 million
in consideration, based on certain future events. The amount is currently being held in escrow, and is recorded within other non-current assets on our Consolidated Balance Sheets. This transaction also includes an arrangement under which Vestica will continue to perform certain services on our behalf related to the acquired assets.
We accounted for the transaction as an asset acquisition where the assets acquired were measured based on the amount of cash paid to Vestica as well as transaction costs incurred, as the fair value of the assets given was more readily determinable than the fair value of the assets received. We classified and designated identifiable assets acquired and we assessed and determined the useful lives of the acquired intangible assets subject to amortization. As a result, we recorded a
$7.5 million
customer relationship intangible asset with a useful life of
thirteen
years, which assumes renewal of acquired customer contracts. The transaction was a taxable asset purchase.
91
5
. Investments
Our investments are classified as held-to-maturity as we have both the intent and ability to hold the investments until their individual maturities. Materially, all of our held-to-maturity investments had matured as of
December 31, 2017
.
The following table summarizes the amortized cost, gross unrealized gains and losses, and fair value of our investments as measured using Level 2 inputs as of December 31, 2016 (in thousands):
|
Gross
|
Gross
|
||||||||||||||
|
Amortized
|
Unrealized
|
Unrealized
|
Fair
|
||||||||||||
|
|
Costs
|
Gains
|
Losses
|
Value
|
|||||||||||
|
U.S. Treasury bills
|
$
|
28,119
|
|
$
|
116
|
|
$
|
27
|
|
$
|
28,208
|
|
|||
|
Corporate bonds
|
16,222
|
|
81
|
|
8
|
|
16,295
|
|
|||||||
|
Total investments
|
$
|
44,341
|
|
$
|
197
|
|
$
|
35
|
|
$
|
44,503
|
|
|||
The following table summarizes the amortized cost and fair value of our investments by contractual maturities as of December 31, 2016 (in thousands):
|
Amortized
|
Fair
|
||||||
|
|
Costs
|
Value
|
|||||
|
Due in one year or less
|
$
|
44,341
|
|
$
|
44,503
|
|
|
The following table summarizes our held-to-maturity securities that had been in a continuous unrealized loss position for less than twelve months as of December 31, 2016 (in thousands, except number of securities):
|
Number of
|
Fair
|
Unrealized
|
||||||||
|
Securities
|
Value
|
Losses
|
||||||||
|
U.S. Treasury bills
|
1
|
|
$
|
4,002
|
|
$
|
1
|
|
||
We did not hold any securities in a continuous unrealized loss position for twelve months or longer as of December 31, 2016.
When a held-to-maturity investment is in an unrealized loss position, we assess whether or not we expect to recover the entire cost basis of security, based on our best estimate of the present value of cash flows expected to be collected from the debt security. Factors considered in our analysis include the reasons for the unrealized loss position, the severity and duration of the unrealized loss position, creditworthiness and forecasted performance of the investee. In cases where the estimated present value of future cash flows is less than our cost basis, we recognize an other than temporary impairment and write the investment down to its fair value. The new cost basis would not be changed for subsequent recoveries in fair value. No investments were written down during the years ended
December 31, 2017
and
2016
.
6
. Property and Equipment, Net
The following summarizes our property and equipment (in thousands):
|
As of December 31,
|
|||||||
|
|
2017
|
2016
|
|||||
|
Computer hardware
|
$
|
5,667
|
|
$
|
4,474
|
|
|
|
Furniture and equipment
|
2,448
|
|
2,448
|
|
|||
|
Internal-use software development costs
|
48,557
|
|
21,385
|
|
|||
|
Leasehold improvements
|
8,708
|
|
8,108
|
|
|||
|
Total property and equipment
|
65,380
|
|
36,415
|
|
|||
|
Accumulated depreciation and amortization expenses
|
(14,458
|
)
|
(5,236
|
)
|
|||
|
Total property and equipment, net
|
$
|
50,922
|
|
$
|
31,179
|
|
|
We had
no
property and equipment prior to the Offering Reorganization.
92
The Company capitalized
$27.1 million
,
$15.0 million
and
$6.4 million
of internal-use software development costs for the years ended
December 31, 2017
,
2016
and
2015
, respectively. The net book value of capitalized internal-use software development costs was
$42.1 million
and
$19.9 million
as of
December 31, 2017
and
2016
, respectively.
Depreciation expense related to property and equipment was
$9.2 million
,
$2.6 million
and
$1.2 million
for the years ended
December 31, 2017
,
2016
and
2015
(subsequent to the date of the Offering Reorganization), respectively, of which amortization expense related to capitalized internal-use software development costs was
$4.9 million
,
$1.4 million
and less than
$0.1 million
, respectively.
As discussed in Note
2
, the Company changed its estimate of the useful life of internal-use software from
7
years to
5
years, effective September 1, 2017. This change in useful life has been accounted for as a change in accounting estimate and will be applied to all new internal-use software. Remaining carrying amounts of existing internal-use software will be amortized prospectively over a maximum of
5
years, or the remaining useful lives if less than
5
years. This change in estimated useful life had an immaterial impact on the Company’s operations for the year ended December 31, 2017.
7
. Goodwill and Intangible Assets, Net
Goodwill
Goodwill has an estimated indefinite life and is not amortized; rather it is reviewed for impairment at least annually or whenever events or changes in circumstances indicate that the carrying amount of the asset may not be recoverable.
In interim periods between annual goodwill reviews, we also evaluate qualitative factors that could cause us to believe our estimated fair value of our single reporting unit may be lower than the carrying value and trigger a quantitative assessment, including, but not limited to (i) macroeconomic conditions, (ii) industry and market considerations, (iii) our overall financial performance, including an analysis of our current and projected cash flows, revenue and earnings, (iv) a sustained decrease in share price and (v) other relevant entity-specific events including changes in strategy, partners, or litigation.
A description of our goodwill impairment tests during
2017
and
2016
follows below.
2017
Goodwill Impairment Tests
On October 31,
2017
, the Company performed its annual goodwill impairment review for fiscal year
2017
. Based on our qualitative assessment, we did not identify sufficient indicators of impairment that would suggest fair value of our single reporting unit was below the carrying value. As a result, a quantitative goodwill impairment analysis was not required.
Following the date of our annual goodwill review, the price of our Class A common stock declined significantly. The average closing price per share of our Class A common stock for the month of November was approximately
$12.01
, a
42.4%
decrease compared to the average closing price for the period from January to October. A sustained decline in the price of our Class A common stock and the resulting impact on our market capitalization is one of several qualitative factors we consider each quarter when evaluating whether events or changes in circumstances indicate it is more likely than not that a potential goodwill impairment exists. We concluded that the decline in the price of our Class A common stock in November did represent a sustained decline and therefore was an indicator that our goodwill might be impaired. The Company proceeded to perform a quantitative goodwill impairment test as of
December 14, 2017
.
Quantitative Assessment Results
To determine the implied fair value for our single reporting unit, we used both a market multiple valuation approach (“market approach”) and a discounted cash flow valuation approach (“income approach”). In determining the estimated fair value using the market approach, we considered the level of our Class A common stock price and assumptions that we believe market participants would make in valuing our reporting unit, including the application of a control premium. In determining the estimated fair value using the income approach, we projected future cash flows based on management’s estimates and long-term plans and applied a discount rate based on the Company’s weighted average cost of capital. This analysis required us to make judgments about revenues, expenses, fixed asset and working capital requirements, the timing of exchanges of our Class B common units, the impact of updated tax legislation, capital market assumptions and other subjective inputs. If the fair value of the reporting unit derived using one approach is significantly different from the fair value estimate using the other approach, the Company re-evaluates its assumptions used in the two models. The fair values determined by the market approach and income approach, as described above, are weighted to determine the concluded fair value for the reporting unit. For purposes of this analysis, the Company weighted the results 70% towards the market approach and 30% towards the income approach, to give greater prominence to the Level 1 inputs used in the market approach.
93
In our
December 14, 2017
, quantitative assessment, our most sensitive assumption for purposes of the market approach was our estimate of the control premium, and the most sensitive assumption related to the income approach, other than the projected cash flows, was the discount rate. A significant decrease in the control premium or a significant increase in the discount rate in isolation would result in a significantly lower fair value. The concluded fair value under the market approach exceeded carrying value by approximately
$140.4 million
, or
13.4%
. Decreasing the selected control premium of
27.5%
by
300 basis points
(approximately
10%
) would result in the concluded fair value exceeding the carrying value by approximately
$112.3 million
, or
10.7%
. The concluded fair value under the income approach exceeded carrying value by approximately
$233.2 million
, or
22.2%
. Increasing the selected discount rate of
13.0%
by
50 basis points
(approximately
5%
) would result in the concluded fair value exceeding the carrying value by approximately
$164.5 million
, or
15.7%
.
As fair value was greater than carrying value under both the market and income approaches, goodwill was not impaired as of
December 14, 2017
.
As of
December 31, 2017
, Evolent assessed whether there were events or changes in circumstances that would more likely than not reduce the fair value of its goodwill below its carrying amount and require an additional impairment test. The Company determined there had been no such indicators. Therefore, it was unnecessary to perform an interim goodwill impairment assessment as of
December 31, 2017
.
2016
Goodwill Impairment Tests
As discussed in Notes
2
and
3
, we adopted ASU 2017-04 effective January 1, 2017, thus changing our policy with regard to goodwill impairment testing. The discussion below of our goodwill impairment testing during 2016 was performed using a two-step method under our previous policy. Under our previous policy, Step 1 of the goodwill impairment test involved a quantitative calculation of the Company’s fair value, which was then compared to the carrying value. If the fair value estimate was less than the carrying value, it was an indicator that goodwill impairment may exist, and Step 2 was required. In Step 2, the implied fair value of goodwill was determined. The fair value as determined in Step 1 was assigned to all of the Company’s net assets (recognized and unrecognized) as if the entity was acquired in a business combination as of the date of the impairment test. If the implied fair value of goodwill was lower than its carrying amount, goodwill was impaired and written down to its fair value; and a charge was reported in impairment of goodwill on our Consolidated Statements of Operations.
As a result of the Offering Reorganization described in Note
4
, we revalued our Consolidated Balance Sheets to the market value of our IPO share price of
$17.00
and recorded
$608.9 million
in goodwill on our Consolidated Balance Sheets.
Subsequent to our 2015 annual impairment testing, our common stock price declined significantly, reaching our historic low in the first quarter of 2016. During the three months ended March 31, 2016, our common stock traded between
$8.48
and
$12.32
, or an average common stock price of
$10.33
compared to an average common stock price of
$19.51
and
$14.73
during the three-month periods ended September 30, 2015, and December 31, 2015, respectively. A sustained decline in our common stock price and the resulting impact on our market capitalization is one of several qualitative factors we consider each quarter when evaluating whether events or changes in circumstances indicate it is more likely than not that a potential goodwill impairment exists. We concluded that the further decline in common stock price observed during the first quarter of 2016 did represent a sustained decline and that triggering events occurred during the period requiring an interim goodwill impairment test as of March 31, 2016. As such, we performed a Step 1 impairment test of our goodwill as of March 31, 2016.
Step 1 Results
To determine the implied fair value for our single reporting unit, we used both a market approach and income approach, as described above. In our March 31, 2016, Step 1 test, our most sensitive assumption for purposes of the market approach was our estimate of the control premium, and the most sensitive assumption related to the income approach, other than the projected cash flows, was the discount rate. As of March 31, 2016, our single reporting unit failed the Step 1 analysis as we determined that its implied fair value was less than its carrying value based on the weighting of the fair values determined under both the market and income approaches. As fair value was less than carrying value, we performed a Step 2 test to determine the implied fair value of our goodwill.
Step 2 Results
In our March 31, 2016, Step 2 test, the fair value of all assets and liabilities was estimated, including our tangible assets (corporate trade name, customer relationships and technology), for the purpose of deriving an estimate of the implied fair value of goodwill. The implied fair value of goodwill was then compared to the carrying amount of goodwill, resulting in an impairment charge of
$160.6 million
on our Consolidated Statements of Operations.
The impairment was driven primarily by the sustained decline in our share price as our estimates of our future cash flows and the control premium have remained consistent, combined with an increase in the discount rate period over period. As noted above, our
94
determination of fair value used a weighting of the fair values determined under both the market and income approaches, with the market approach driving the significant reduction in overall firm value and related impairment of goodwill.
On October 31,
2016
, the Company performed its annual goodwill impairment review for fiscal year
2016
. Based on our qualitative assessment, we did not identify sufficient indicators of impairment that would suggest fair value was below carrying value. As a result, a quantitative Step 1 goodwill impairment analysis was not required.
As of
December 31, 2016
, Evolent assessed whether there were events or changes in circumstances that would more likely than not reduce the fair value of its goodwill below its carrying amount and require an additional impairment test. The Company determined there had been no such indicators. Therefore, it was unnecessary to perform an interim goodwill impairment assessment as of
December 31, 2016
.
The following table summarizes the changes in the carrying amount of goodwill (in thousands):
|
For the Years Ended
|
|||||||
|
December 31,
|
|||||||
|
2017
|
2016
|
||||||
|
Balance as of beginning-of-year
|
$
|
626,569
|
|
$
|
608,903
|
|
|
|
Goodwill Acquired
(1)
|
—
|
|
178,266
|
|
|||
|
Measurement period adjustments
(2)
|
1,617
|
|
—
|
|
|||
|
Goodwill Impairment
|
—
|
|
(160,600
|
)
|
|||
|
Balance as of end-of-year
|
$
|
628,186
|
|
$
|
626,569
|
|
|
(1)
Represents goodwill acquired as a result of the Passport, Valence Health and Aldera transactions, as discussed in Note
4
.
(2)
Represents measurement period adjustments related to Valence Health and Aldera, as discussed in Note
4
.
Intangible Assets, Net
As part of the Offering Reorganization described in Note
4
, intangible assets of
$169.0 million
were recorded on our Consolidated Balance Sheets. We recorded additional intangible assets of
$108.3 million
related to our acquisitions in 2016, as discussed in Note
4
.
Details of our intangible assets (in thousands), including their weighted-average remaining useful lives (in years), are presented below:
|
As of December 31, 2017
|
|||||||||||||
|
|
Weighted-
|
||||||||||||
|
Average
|
Gross
|
Net
|
|||||||||||
|
Remaining
|
Carrying
|
Accumulated
|
Carrying
|
||||||||||
|
|
Useful Life
|
Amount
|
Amortization
|
Value
|
|||||||||
|
Corporate trade name
|
17.4
|
$
|
19,000
|
|
$
|
2,454
|
|
$
|
16,546
|
|
|||
|
Customer relationships
|
20.5
|
203,500
|
|
18,312
|
|
185,188
|
|
||||||
|
Technology
|
3.1
|
55,802
|
|
17,810
|
|
37,992
|
|
||||||
|
Below market lease, net
|
4.8
|
4,197
|
|
2,662
|
|
1,535
|
|
||||||
|
Total
|
$
|
282,499
|
|
$
|
41,238
|
|
$
|
241,261
|
|
||||
|
As of December 31, 2016
|
|||||||||||||
|
Weighted-
|
|||||||||||||
|
Average
|
Gross
|
Net
|
|||||||||||
|
Remaining
|
Carrying
|
Accumulated
|
Carrying
|
||||||||||
|
Useful Life
|
Amount
|
Amortization
|
Value
|
||||||||||
|
Corporate trade name
|
18.4
|
$
|
19,000
|
|
$
|
1,505
|
|
$
|
17,495
|
|
|||
|
Customer relationships
|
21.5
|
203,500
|
|
9,018
|
|
194,482
|
|
||||||
|
Technology
|
5.2
|
50,500
|
|
7,753
|
|
42,747
|
|
||||||
|
Below market lease, net
|
9.4
|
4,323
|
|
124
|
|
4,199
|
|
||||||
|
Total
|
$
|
277,323
|
|
$
|
18,400
|
|
$
|
258,923
|
|
||||
Amortization expense related to intangible assets for the years ended
December 31, 2017
,
2016
and
2015
(subsequent to the date of the Offering Reorganization), was
$22.8 million
,
$12.5 million
and
$5.8 million
, respectively.
95
Future estimated amortization of intangible assets (in thousands) as of
December 31, 2017
, is as follows:
|
2018
|
$
|
23,209
|
|
|
2019
|
23,071
|
|
|
|
2020
|
18,801
|
|
|
|
2021
|
14,666
|
|
|
|
2022
|
10,931
|
|
|
|
Thereafter
|
150,583
|
|
|
|
Total
|
$
|
241,261
|
|
Intangible assets are reviewed for impairment if circumstances indicate the Company may not be able to recover the asset’s carrying value. As discussed above, we identified a triggering event and performed a quantitative analysis over the carrying value of our goodwill balance during the fourth quarter of 2017. Identification of the triggering event also triggered an impairment analysis of the carrying value of our intangible asset group. In conjunction with the impairment testing of the carrying value of our goodwill, we performed an analysis to determine whether the carrying amount of our intangible asset group was recoverable. We performed a quantitative analysis, which required management to compare the total pre-tax, undiscounted future cash flows of the intangible asset group to the current carrying amount. The total undiscounted cash flows included only the future cash flows that are directly associated with and that were expected to arise as a result of the use and eventual disposal of the asset group. Based on our quantitative analysis, we determined that the pre-tax, undiscounted cash flows exceeded the carrying value and therefore concluded that our intangible assets were recoverable.
Also as discussed above, our single reporting unit failed the Step 1 test for goodwill impairment during the first quarter of 2016, thus triggering an impairment analysis of the carrying value of our intangible asset group. Based on our Step 1 test for the intangible asset group, we concluded the carrying amount of our intangible assets were recoverable given the pre-tax, undiscounted cash flows exceeded the carrying value of the intangible asset group.
8
. Long-term Debt
In
December 2016
, the Company issued
$125.0 million
aggregate principal amount of its
2.00%
Convertible Senior Notes due
2021
in a Private Placement to qualified institutional buyers within the meaning of Rule 144A under the Securities Act of 1933, as amended. The 2021 Notes were issued at par for net proceeds of
$120.4 million
. We incurred
$4.6 million
of debt issuance costs in connection with the 2021 Notes, which we are amortizing to non-cash interest expense using the straight-line method over the contractual term of the 2021 Notes, since this method was not materially different from the effective interest method. The closing of the Private Placement of the 2021 Notes occurred on
December 5, 2016
.
Holders of the 2021 Notes are entitled to cash interest payments, which are payable semiannually in arrears on
June 1
and
December 1
of each year, beginning on
June 1, 2017
, at a rate equal to
2.00%
per annum. The 2021 Notes will mature on
December 1, 2021
, unless earlier repurchased or converted in accordance with their terms prior to such date. In addition, holders of the 2021 Notes may require the Company to repurchase their 2021 Notes upon the occurrence of a fundamental change at a price equal to
100.00%
of the principal amount of the 2021 Notes being repurchased, plus any accrued and unpaid interest. Upon maturity, and at the option of the holders of the 2021 Notes, the principal amount of the notes may be settled via shares of the Company’s Class A common stock. For the years ended
December 31, 2017
and
2016
, the Company recorded approximately
$2.5 million
and
$0.2 million
in interest expense and
$0.9 million
and less than
$0.1 million
in non-cash interest expense related to the amortization of deferred financing costs. The Company had no indebtedness for the year ended December 31, 2015.
The 2021 Notes are convertible into shares of the Company’s Class A common stock, based on an initial conversion rate of
41.6082
shares of Class A common stock per
$1,000
principal amount of the 2021 Notes, which is equivalent to an initial conversion price of approximately
$24.03
per share of the Company’s Class A common stock. In the aggregate, the 2021 Notes are initially convertible into
5.2 million
shares of the Company’s Class A common stock (excluding any shares issuable by the Company upon a conversion in connection with a make-whole provision upon a fundamental change under the Indenture).
The 2021 Notes are convertible, in multiples of
$1,000
principal amount, at the option of the holders at any time prior to the close of business on the business day immediately preceding the maturity date. Upon conversion, we will deliver for each
$1,000
principal amount of notes converted a number of shares of our Class A common stock equal to the applicable conversion rate (together with a cash payment in lieu of delivering any fractional share) on the third business day following the relevant conversion date.
96
Convertible Senior Notes Carrying Value
While the 2021 Notes are recorded on our accompanying unaudited interim consolidated balance sheets at their net carrying value of
$121.4 million
as of
December 31, 2017
, the 2021 Notes are privately traded by qualified institutional buyers (within the meaning of Rule 144A under the Securities Act of 1933, as amended) and their fair value was
$120.4 million
, based on a traded price on December 29, 2017, a Level 2 input. As of
December 31, 2016
, the estimated fair value of the 2021 Notes was
$125.0 million
, which approximated cost as there were no significant movements in interest rates between the issuance date and December 31, 2016. The 2021 Notes also have embedded conversion options and contingent interest provisions, which have not been recorded as separate financial instruments.
The following table summarizes the carrying value of the long-term debt (in thousands):
|
As of December 31,
|
|||||||
|
2017
|
2016
|
||||||
|
Carrying value
|
$
|
121,394
|
|
$
|
120,283
|
|
|
|
Unamortized discount
|
3,606
|
|
4,717
|
|
|||
|
Principal amount
|
$
|
125,000
|
|
$
|
125,000
|
|
|
|
Remaining amortization period (years)
|
3.9
|
|
4.9
|
|
|||
9
. Commitments and Contingencies
UPMC Reseller Agreement
The Company and UPMC are parties to a reseller, services and non-competition agreement, dated August 31, 2011, which was amended and restated by the parties on June 27, 2013 (as amended through the date hereof, the “UPMC Reseller Agreement”). Under the terms of the UPMC Reseller Agreement, UPMC has appointed the Company as a non-exclusive reseller of certain services, subject to certain conditions and limitations specified in the UPMC Reseller Agreement. In consideration for the Company’s obligations under the UPMC Reseller Agreement and subject to certain conditions described therein, UPMC has agreed not to sell certain products and services directly to a defined list of 20 of the Company’s customers.
The Advisory Board Company Reseller Agreement
The Company and The Advisory Board were parties to a services, reseller, and non-competition agreement, dated August 31, 2011, which was amended and restated by the parties on June 27, 2013, and May 1, 2015 (as so amended, “The Advisory Board Company Reseller Agreement”), which terminated on July 20, 2017. Under the terms of The Advisory Board Company Reseller Agreement, The Advisory Board provided certain services to the Company on an as-requested basis. In addition, The Advisory Board had a right of first offer to provide certain specified services during the term of the Agreement and had the right to collect certain fees for specified referrals. Pursuant to the Advisory Board Company Reseller Agreement, Evolent entered into a services agreement with The Advisory Board in October 2016 whereby The Advisory Board will provide certain services to the Company in conjunction with risk adjustment services provided to
one
of our customers.
Contingencies
Tax Receivables Agreement
In connection with the Offering Reorganization, the Company entered into the TRA with certain of its investors, which provides for the payment by the Company to these investors of
85%
of the amount of the tax benefits, if any, that the Company is deemed to realize as a result of increases in our tax basis related to exchanges of Class B common units as well as tax benefits attributable to the future utilization of pre-IPO NOLs. These payment obligations are obligations of the Company. For purposes of the TRA, the benefit deemed realized by the Company will be computed by comparing its actual income tax liability to the amount of such taxes that the Company would have been required to pay had there been no increase to the tax basis of the assets of the Company as a result of the exchanges or had the Company had no NOL carryforward balance. The actual amount and timing of any payments under the TRA will vary depending upon a number of factors, including:
|
•
|
the timing of the exchanges and the price of the Class A shares at the time of the transaction, triggering a tax basis increase in the Company’s asset and a corresponding benefit to be realized under the TRA; and
|
|
•
|
the amount and timing of our taxable income - the Company will be required to pay
85%
of the tax savings as and when realized, if any. If the Company does not have taxable income, it will not be required to make payments under the TRA for that taxable year because no tax savings were actually realized.
|
97
Due to the items noted above, and the fact that the Company is in a full valuation allowance position such that the deferred tax assets related to the Company’s historical pre-IPO losses and tax basis increase benefit from exchanges have not been realized, the Company has not recorded a liability pursuant to the TRA.
Litigation Matters
We are engaged from time to time in certain legal disputes arising in the ordinary course of business, including employment claims. When the likelihood of a loss contingency becomes probable and the amount of the loss can be reasonably estimated, we accrue a liability for the loss contingency. We continue to review accruals and adjust them to reflect ongoing negotiations, settlements, rulings, advice of legal counsel, and other relevant information. To the extent new information is obtained, and our views on the probable outcomes of claims, suits, assessments, investigations or legal proceedings change, changes in our accrued liabilities would be recorded in the period in which such determination is made. The Company is not aware of any legal proceedings or claims as of
December 31, 2017
and
2016
, that the Company believes will have, individually or in the aggregate, a material adverse effect on the Company’s financial position or result of operations.
Commitments
Letter of Credit
During the first quarter of 2017, the Company entered into an agreement to provide a letter of credit, for up to
$5.0 million
, to assist a customer in demonstrating adequate reserves to the customer’s state regulatory authorities. The letter of credit is effective from September 30, 2017 through June 30, 2019, and carries a quarterly facility rental fee of
0.8%
per annum on the amount of the outstanding balance. The letter of credit will terminate after June 30, 2019. The letter of credit is presented at the face amount plus accrued facility rental fee, less received payments. As of
December 31, 2017
, there was no outstanding balance related to this letter of credit.
Lease Commitments
The Company has entered into lease agreements for its primary office locations in Arlington, Virginia, Lisle, Illinois, Riverside, Illinois and Chicago, Illinois. Certain leases acquired as part of the Valence Health transaction included existing sublease agreements for office locations in Chicago, Illinois. The Company also has several smaller leases in various locations within Texas and California. Total rental expense, net of sublease income, on operating leases for the years ended
December 31, 2017
,
2016
and
2015
(subsequent to the date of the Offering Reorganization), was
$10.9 million
,
$5.9 million
and
$2.3 million
, respectively.
In connection with various lease agreements, the Company is required to maintain
$3.8 million
in letters of credit. As of
December 31, 2017
, the Company held
$3.8 million
in restricted cash and restricted investments as collateral for the letters of credit, as described below.
Arlington, Virginia Office Lease
During 2013, the Company entered into a facility lease in Arlington, Virginia. Total future minimum lease commitments over
3.0
years are approximately
$10.5 million
as of
December 31, 2017
. The future minimum lease payments associated with the Arlington, Virginia lease are included in the table below. In conjunction with this lease, the Company is required to maintain a letter of credit in the amount of
$1.6 million
. The collateral for the letter of credit is currently recorded as restricted cash.
Lisle, Illinois Office Lease
On
November 1, 2016
, the Company assumed a facility lease in Lisle, Illinois as part of the Aldera transaction. Total future minimum lease commitments over
7.5
years are approximately
$3.7 million
as of
December 31, 2017
. The future minimum lease payments associated with the Lisle, Illinois lease are included in the table below. In conjunction with this lease, the Company is required to maintain a letter of credit in the amount of
$0.5 million
. The collateral for the letter of credit is currently recorded as restricted cash.
Riverside, Illinois Office Lease
On
October 3, 2016
, the Company assumed a facility lease in Riverside, Illinois as part of the Valence Health transaction. Total future minimum lease commitments over
5.3
years are approximately
$3.5 million
as of
December 31, 2017
. The future minimum lease payments associated with the Riverside, Illinois lease are included in the table below.
Chicago, Illinois Office Lease
On
October 3, 2016
, the Company assumed a facility lease in Chicago, Illinois as part of the Valence Health transaction. This lease includes three floors. One of the floors is occupied by the Company, one is subleased to a tenant, and one was abandoned and
98
subsequently terminated. Total future minimum lease commitments over
10.0
years are approximately
$18.3 million
as of
December 31, 2017
. The future minimum lease payments associated with the Chicago, Illinois lease, less the payments associated with the terminated floor, are included in the table below. In conjunction with this lease, the Company is required to maintain a letter of credit in the amount of
$1.7 million
. The collateral for the letter of credit is currently recorded as restricted cash.
In connection with the Chicago, Illinois lease, the Company acquired a sublease tenant for one of the floors (the “13
th
Floor Sublease”). Total future sublease income over
11.0
years was approximately
$10.1 million
as of December 31, 2016. We signed an amendment to the 13
th
Floor Sublease during the fourth quarter of 2017, which reduced the term of the sublease. Total future sublease income over the remaining sublease term of
one
year is approximately
$0.1 million
as of December 31, 2017.
Immediately following the Valence Health acquisition, the Company decided to abandon and sublet its rented space at 540 W. Madison, Suite 1400, Chicago, Illinois. Therefore, our results from operations for the year ended December 31, 2016, included a lease abandonment expense of approximately
$6.5 million
in conjunction with the abandonment of the 14th Floor Space, based on remaining lease payments and expected future sublease income. During the second quarter of 2017, the Company reached an agreement to terminate the lease for the 14th Floor Space, effective September 2017. The Company continued making rent payments until September 1, 2017, at which point it paid a one-time lease cancellation and related brokerage fee. Remaining cash outflows related to the 14th Floor Space were estimated to be approximately
$4.8 million
as of June 30, 2017, while the remaining balance of the initial
$6.5 million
lease abandonment liability recorded after the Valence Health acquisition was approximately
$5.3 million
as of June 30, 2017, prior to adjustments pertaining to the lease cancellation fees. As such, the Company recorded a one-time adjustment of
$0.5 million
to reduce the lease abandonment liability, from
$5.3 million
to
$4.8 million
. The adjustment was recorded as a reduction to our rent expense within “Selling, general and administrative expenses” on our Consolidated Statements of Operations for the year ended December 31, 2017. The Company made regular rent payments until September 1, 2017, at which point it paid a one-time lease cancellation and related brokerage fee of
$4.4 million
. There is
no
remaining lease abandonment liability related to the 14th Floor Space as of December 31, 2017.
The following table presents a roll forward of the lease abandonment liability for the years ended
December 31, 2017
and
2016
(in thousands):
|
For the Years Ended
|
|||||||
|
December 31,
|
|||||||
|
2017
|
2016
|
||||||
|
Accrual as of beginning-of-period
|
$
|
6,100
|
|
$
|
—
|
|
|
|
Abandonment expense
|
—
|
|
6,460
|
|
|||
|
Impact of lease termination
|
(496
|
)
|
—
|
|
|||
|
Abandonment amortization
|
(1,239
|
)
|
(360
|
)
|
|||
|
Lease cancellation fee
|
(4,365
|
)
|
—
|
|
|||
|
Accrual as of end-of-period
|
$
|
—
|
|
$
|
6,100
|
|
|
Future minimum rental commitments (in thousands) as of
December 31, 2017
, were as follows:
|
2018
|
$
|
8,328
|
|
|
2019
|
7,101
|
|
|
|
2020
|
7,001
|
|
|
|
2021
|
2,870
|
|
|
|
2022
|
2,530
|
|
|
|
Thereafter
|
13,462
|
|
|
|
Total
|
$
|
41,292
|
|
Purchase Obligations
Our contractual obligations related to vendor contracts (in thousands) as of
December 31, 2017
, were as follows:
|
Less
|
More
|
||||||||||||||||||
|
Than
|
1 to 3
|
3 to 5
|
Than
|
||||||||||||||||
|
1 Year
|
Years
|
Years
|
5 Years
|
Total
|
|||||||||||||||
|
Purchase obligations related to vendor contracts
|
$
|
6,567
|
|
$
|
430
|
|
$
|
—
|
|
$
|
—
|
|
$
|
6,997
|
|
||||
99
Indemnifications
The Company’s customer agreements generally include a provision by which the Company agrees to defend its partners against third-party claims (a) for death, bodily injury, or damage to personal property caused by Company negligence or willful misconduct, (b) by former or current Company employees arising from such managed service agreements, (c) for intellectual property infringement under specified conditions and (d) for Company violation of applicable laws, and to indemnify them against any damages and costs awarded in connection with such claims. To date, the Company has not incurred any material costs as a result of such indemnities and has not accrued any liabilities related to such obligations in the accompanying consolidated financial statements.
Registration rights agreement
We entered into a registration rights agreement with The Advisory Board, UPMC, TPG and another investor to register for sale under the Securities Act shares of our Class A common stock, including those delivered in exchange for Class B common stock and Class B common units. Subject to certain conditions and limitations, this agreement provides these investors with certain demand, piggyback and shelf registration rights. The registration rights granted under the registration rights agreement will terminate upon the date the holders of shares that are a party thereto no longer hold any such shares that are entitled to registration rights. Pursuant to our contractual obligations under this agreement, we filed a registration statement on Form S-3 with the SEC on July 28, 2016, which was declared effective on August 12, 2016.
Pursuant to certain terms of the registration rights agreement, the Investor Stockholders sold
19.7 million
shares of the Company’s Class A common stock during the 2017 Secondary Offerings and
8.6 million
shares of the Company’s Class A common stock during the September 2016 Secondary Offering, as discussed in Note
4
.
Pursuant to the terms of the registration rights agreement, we incurred
$1.5 million
and
$1.6 million
in expenses related to secondary offerings during the years ended
December 31, 2017
and
2016
, respectively. These expenses are recorded within “Selling, general and administrative expenses” on our Consolidated Statements of Operations.
We will continue to pay all expenses relating to any demand, piggyback or shelf registration, other than underwriting discounts and commissions and any transfer taxes, subject to specified conditions and limitations. The registration rights agreement includes customary indemnification provisions, including indemnification of the participating holders of shares of Class A common stock and their directors, officers and employees by us for any losses, claims, damages or liabilities in respect thereof and expenses to which such holders may become subject under the Securities Act, state law or otherwise.
Guarantees
As part of our strategy to support certain of our partners in the Next Generation Accountable Care Program (“Next Gen”), we entered into upside and downside risk-sharing arrangements. Our downside risk-sharing arrangements are limited to our fees and are executed through our wholly-owned captive insurance company. As of
December 31, 2017
, Evolent had approximately
$24.7 million
of restricted cash and restricted investments related to risk-sharing arrangements. Approximately
$8.2 million
of this amount was required to satisfy the capital requirements of our captive insurance entity as well as state insurance regulators to secure potential losses related to insurance services for the year ended December 31, 2017. Approximately
$16.6 million
of this amount is required to satisfy the capital requirements of our captive insurance entity as well as state insurance regulators to secure potential losses related to insurance services for the year ending December 31, 2018. These amounts are in excess of our actuarial assessment of loss.
Reinsurance Agreement
During the fourth quarter of 2017, the Company entered into a
15
-month,
$10.0 million
capital-only reinsurance arrangement with NMHC, expiring on December 31, 2018. The purpose of the capital-only reinsurance is to provide balance sheet support to NMHC. There is no uncertainty to the outcome of the arrangement as there is no transfer of underwriting risk to Evolent or True Health, and neither Evolent nor True Health is at risk for any cash payments on behalf of NMHC. As a result, this arrangement does not qualify for reinsurance accounting. The Company will record a quarterly fee of approximately
$0.2 million
as non-operating income on its consolidated statements of operations and will maintain
$10.0 million
in restricted cash and restricted investments on its consolidated balance sheets for the duration of the reinsurance agreement.
Credit and Concentration Risk
The Company is subject to significant concentrations of credit risk related to cash and cash equivalents. As of
December 31, 2017
, approximately
74%
of our
$295.4 million
of cash and cash equivalents (including restricted cash) was held in bank deposits with FDIC participating banks and approximately
26%
was held in money market funds.
While the Company maintains its cash and cash equivalents with financial institutions with high credit ratings, it often maintains these deposits in federally insured financial institutions in excess of federally insured limits. The Company has not experienced any realized losses on cash and cash equivalents to date.
100
The Company is also subject to significant concentration of accounts receivable risk as a substantial portion of our trade accounts receivable is derived from a small number of our partners. The following table summarizes those partners who represented at least
10.0%
of our trade accounts receivable for the periods presented:
|
As of December 31,
|
|||||
|
|
2017
|
2016
|
|||
|
Customer G
|
32.1
|
%
|
14.3
|
%
|
|
|
Customer B
|
16.5
|
%
|
*
|
|
|
|
Customer H
|
11.8
|
%
|
*
|
|
|
* Represents less than 10.0% of the respective balance
In addition, the Company is subject to significant concentration of revenue risk as a substantial portion of our revenue is derived from a small number of contractual relationships with our operating partners.
The following table summarizes those partners who represented at least
10.0%
of our revenue for the periods presented:
|
For the Years Ended December 31,
|
||||||||
|
2017
|
2016
|
2015
|
||||||
|
Customer A
|
20.6
|
%
|
19.6
|
%
|
*
|
|
||
|
Customer B
|
*
|
|
14.5
|
%
|
15.6
|
%
|
||
|
Customer C
|
*
|
|
12.7
|
%
|
11.2
|
%
|
||
|
Customer D
|
*
|
|
*
|
|
19.6
|
%
|
||
|
Customer E
|
*
|
|
*
|
|
14.1
|
%
|
||
|
Customer F
|
*
|
|
*
|
|
11.8
|
%
|
||
* Represents less than 10.0% of the respective balance
At times our contracts may be amended to change the nature and price of the services and/or the time period over which they are provided. For example, in 2015, we signed
two
amendments to our agreement with Piedmont WellStar Health Plan, noted as customer D above, that reduced our expected revenue under that contract in 2016. In connection with the amendments, the customer also sold its
2.2%
ownership interest in us to certain of our pre-IPO investors, consisting of TPG, The Advisory Board and UPMC.
During the fourth quarter of 2015, we agreed to amend the terms of our contract with WakeMed Health and Hospitals, noted as customer E above, and changed our fee structure from a PMPM-based fee to a combination of a fixed-fee and a performance-based fee. The performance-based portion of our fee was tied to WakeMed’s participation in the Next Generation ACO Program. In 2016, WakeMed determined not to participate in the calendar year 2016 program; therefore, the portion of our fee and the corresponding expenses related to the performance-based arrangement were eliminated from our agreement.
101
10
. Earnings (Loss) Per Common Share
The following table sets forth the computation of basic and diluted earnings per share available for common stockholders (in thousands, except per share data):
|
For the Years Ended December 31,
|
|||||||||||
|
2017
|
2016
|
2015
|
|||||||||
|
Net income (loss)
|
$
|
(69,767
|
)
|
$
|
(226,778
|
)
|
$
|
319,814
|
|
||
|
Less:
|
|||||||||||
|
Net income (loss) attributable to non-controlling interests
|
(9,102
|
)
|
(67,036
|
)
|
(12,680
|
)
|
|||||
|
Undeclared cumulative preferred dividends
|
—
|
|
—
|
|
2,184
|
|
|||||
|
Net income (loss) available for common shareholders - Basic
|
(60,665
|
)
|
(159,742
|
)
|
330,310
|
|
|||||
|
Add:
|
|||||||||||
|
Net income (loss) attributable to non-controlling interests
|
—
|
|
—
|
|
(12,680
|
)
|
|||||
|
Undeclared cumulative preferred dividends converted during the period
|
—
|
|
—
|
|
2,184
|
|
|||||
|
Net income (loss) available for common shareholders - Diluted
(1)(2)
|
(60,665
|
)
|
(159,742
|
)
|
319,814
|
|
|||||
|
Weighted-average common shares outstanding - Basic
|
64,351
|
|
45,031
|
|
25,129
|
|
|||||
|
Dilutive effect of restricted stock and restricted stock units
|
—
|
|
—
|
|
17
|
|
|||||
|
Dilutive effect of options
|
—
|
|
—
|
|
1,510
|
|
|||||
|
Assumed conversion of convertible preferred stock at beginning-of-period
|
—
|
|
—
|
|
9,397
|
|
|||||
|
Assumed conversion of Class B common shares to Class A common shares
|
—
|
|
—
|
|
10,083
|
|
|||||
|
Weighted-average common shares outstanding - Diluted
(2)(3)
|
64,351
|
|
45,031
|
|
46,136
|
|
|||||
|
Earnings (Loss) per Common Share
|
|||||||||||
|
Basic
|
$
|
(0.94
|
)
|
$
|
(3.55
|
)
|
$
|
13.14
|
|
||
|
Diluted
|
(0.94
|
)
|
(3.55
|
)
|
6.93
|
|
|||||
(1)
For periods of net loss, net income (loss) available for common shareholders is the same for both basic and diluted purposes.
(2)
Each Class B common unit of Evolent Health LLC can be exchanged (together with a corresponding number of shares of our Class B common stock) for
one
share of our Class A common stock. As holders exchange their Class B common shares for Class A common shares, our interest in Evolent Health LLC will increase. Therefore, shares of our Class B common stock are not considered dilutive shares for the purposes of calculating our diluted earnings (loss) per common share as related adjustment to net income (loss) available for common shareholders would equally offset the additional shares, resulting in the same earnings (loss) per common share.
(3)
For periods of net loss, shares used in the earnings (loss) per common share calculation represent basic shares as using diluted shares would be anti-dilutive.
Anti-dilutive shares (in thousands) excluded from the calculation of weighted-average common shares presented above are presented below:
|
For the Years Ended December 31,
|
||||||||
|
2017
|
2016
|
2015
|
||||||
|
Exchangeable Class B common stock
|
7,285
|
|
16,882
|
|
—
|
|
||
|
Restricted stock and RSUs
|
525
|
|
245
|
|
—
|
|
||
|
Stock options
|
2,829
|
|
1,973
|
|
—
|
|
||
|
Convertible senior notes
|
5,201
|
|
369
|
|
—
|
|
||
|
Total
|
15,840
|
|
19,469
|
|
—
|
|
||
11
. Stock-based Compensation
2011 and 2015 Equity Incentive Plans
The Company issues awards, including stock options, performance-based stock options, restricted stock and RSUs, under the Evolent Health Holdings, Inc. 2011 Equity Incentive Plan (the “2011 Plan”) and the 2015 Evolent Health, Inc. Omnibus Incentive Compensation Plan (the “2015 Plan”). We assumed the 2011 Plan in connection with the merger of Evolent Health Holdings with and
102
into Evolent Health, Inc. The 2011 Plan allows for the grant of an array of equity-based and cash incentive awards to our directors, employees and other service providers. The 2011 Plan was amended on September 23, 2013, to increase the number of shares authorized to
9.1 million
shares of the Company’s common stock. As of
December 31, 2017
and
2016
,
4.8 million
and
4.9 million
stock options, respectively, and
3.8 million
shares of restricted stock have been issued, net of forfeitures, under the 2011 Plan.
On May 1, 2015, the Board of Directors approved and authorized the 2015 Plan which provides for the issuance of up to
6.0 million
shares of the Company’s Class A common stock to employees and non-employee directors of the Company and its consolidated subsidiaries. As of
December 31, 2017
and
2016
,
2.5 million
and
1.7 million
stock options and
1.1 million
and
0.7 million
RSUs have been issued, net of forfeitures, under the 2015 Plan.
We follow an employee model for our stock-based compensation as awards are granted in the stock of the Company to employees and non-employee directors of the Company or its consolidated subsidiaries.
Prior to the Offering Reorganization, stock-based awards were granted in the stock of the Company to employees of the equity method investee, Evolent Health, LLC. As the employees of Evolent Health LLC were not providing service to the Company, we did not record stock-based compensation during that period; however, under Evolent Health LLC’s Amended and Restated Operating Agreement, Evolent Health LLC was required to issue an identical amount of common units to the Company in exchange for the underlying stock that had been awarded. As a result, the Company recorded an increase in the equity method investment and a non-cash issuance of common equity during the noted period. Additionally, as the stock-based awards were granted in the stock of a non-consolidated entity, Evolent Health LLC followed a “non-employee” model for recording stock-based compensation which required the awards to be marked-to-market through net income at the end of each reporting period until vesting occurred.
Stock-based Compensation Expense
Total compensation expense by award type and line item in our consolidated financial statements was as follows (in thousands):
|
For the Years Ended December 31,
|
|||||||||||
|
|
2017
|
2016
|
2015
|
||||||||
|
Award Type
|
|||||||||||
|
Stock options
|
$
|
15,487
|
|
$
|
15,647
|
|
$
|
8,913
|
|
||
|
Performance-based stock options
|
447
|
|
374
|
|
—
|
|
|||||
|
Restricted stock
|
—
|
|
—
|
|
4,875
|
|
|||||
|
RSUs
|
4,503
|
|
2,583
|
|
942
|
|
|||||
|
Acceleration of unvested equity awards
|
—
|
|
3,897
|
|
—
|
|
|||||
|
Total
|
$
|
20,437
|
|
$
|
22,501
|
|
$
|
14,730
|
|
||
|
Line Item
|
|||||||||||
|
Cost of revenue
|
$
|
1,371
|
|
$
|
2,670
|
|
$
|
1,144
|
|
||
|
Selling, general and
|
|||||||||||
|
administrative expenses
|
19,066
|
|
19,831
|
|
13,586
|
|
|||||
|
Total
|
$
|
20,437
|
|
$
|
22,501
|
|
$
|
14,730
|
|
||
We recorded
$3.9 million
in stock-based compensation expense during 2016 for the acceleration of Valence Health’s unvested equity awards that vested upon the close of the Valence Health acquisition. During 2015, we recorded
$4.9 million
in stock-based compensation for the acceleration of our unvested restricted shares which vested immediately after the Offering Reorganization and prior to the IPO. We did not recognize stock compensation expense in 2015 prior to the Offering Reorganization.
No
stock-based compensation in the totals above was capitalized as software development costs for the years ended
December 31, 2017
and
2016
. Less than
$0.1 million
of stock-based compensation included in the totals above was capitalized as software development costs for the year ended
December 31, 2015
.
103
Total unrecognized compensation expense (in thousands) and expected weighted-average period (in years) by award type for all of our stock-based incentive plans were as follows:
|
As of December 31, 2017
|
||||||
|
Weighted-
|
||||||
|
Average
|
||||||
|
Expense
|
Period
|
|||||
|
Stock options
|
$
|
13,745
|
|
0.96
|
||
|
Performance-based stock options
|
968
|
|
2.17
|
|||
|
RSUs
|
9,906
|
|
2.18
|
|||
|
Total
|
$
|
24,619
|
|
|||
Stock Options
Other than the performance-based stock options described below, options awarded under the incentive compensation plans are generally subject to a
four
-year graded service vesting period where
25%
of the award vests after each year of service and have a maximum term of
10 years
. Information with respect to our options is presented in the following disclosures.
The option price assumptions used for our stock option awards were as follows:
|
For the Years Ended December 31,
|
|||||||||||
|
2017
|
2016
|
2015
|
|||||||||
|
Weighted-average fair value
|
|||||||||||
|
per option granted
|
$
|
8.38
|
|
$
|
4.69
|
|
$
|
10.41
|
|
||
|
Assumptions:
|
|||||||||||
|
Expected term (in years)
|
6.25
|
|
6.25
|
|
6.25
|
|
|||||
|
Expected volatility
|
42.8
|
%
|
45.0
|
%
|
45.0
|
%
|
|||||
|
Risk-free interest rate
|
1.9 - 2.1%
|
|
1.3 - 1.5%
|
|
1.4 - 1.8%
|
|
|||||
|
Dividend yield
|
—
|
%
|
—
|
%
|
—
|
%
|
|||||
The fair value of options is determined using a Black-Scholes options valuation model with the assumptions disclosed in the table above. The dividend rate is based on the expected dividend rate during the expected life of the option. Expected volatility is based on the historical volatility of a peer group of public companies over the most recent period commensurate with the estimated expected term of the Company’s awards due to the limited history of our own stock price. The risk-free interest rate is based on the U.S. Treasury yield curve in effect at the time of the grant. The expected term of the options granted represents the weighted-average period of time from the grant date to the date of exercise, expiration or cancellation based on the midpoint convention.
Information with respect to our stock options (in thousands), including weighted-average remaining contractual term (in years) and aggregate intrinsic value (in thousands) was as follows:
|
Weighted-
|
||||||||||||
|
Weighted-
|
Average
|
|||||||||||
|
Average
|
Remaining
|
Aggregate
|
||||||||||
|
Exercise
|
Contractual
|
Intrinsic
|
||||||||||
|
Shares
|
Price
|
Term
|
Value
|
|||||||||
|
Outstanding as of December 31, 2016
|
6,005
|
|
$
|
6.44
|
|
7.83
|
$
|
50,193
|
|
|||
|
Granted
|
961
|
|
18.64
|
|
||||||||
|
Exercised
|
(788
|
)
|
5.18
|
|
||||||||
|
Forfeited
|
(227
|
)
|
11.62
|
|
||||||||
|
Outstanding as of December 31, 2017
|
5,951
|
|
$
|
8.38
|
|
7.19
|
$
|
23,325
|
|
|||
|
Vested and expected to vest
|
||||||||||||
|
after December 31, 2017
|
5,414
|
|
$
|
8.43
|
|
7.11
|
$
|
23,379
|
|
|||
|
Exercisable at December 31, 2017
|
3,156
|
|
$
|
7.78
|
|
6.88
|
$
|
22,678
|
|
|||
104
The total fair value of options vested during the years ended December 31,
2017
,
2016
and
2015
, was
$13.0 million
,
$12.4 million
and
$11.1 million
, respectively. The total intrinsic value of options exercised during
2017
,
2016
and
2015
was
$14.2 million
,
$3.8 million
and
$0.5 million
, respectively. We issue new shares to satisfy option exercises.
Performance-based stock option awards
In March 2016, the Company granted approximately
0.3 million
performance-based options to certain employees to create incentives for continued long-term success and to more closely align executive pay with our stockholders’ interests. Each of the grants is subject to market-based vesting, as follows:
|
•
|
one-third of the shares subject to the option award will vest in the event that the average closing price of the Company’s Class A common stock on the NYSE is at least
$13.35
per share for a consecutive ninety day period;
|
|
•
|
one-third of the shares subject to the option award will vest in the event that the average closing price of the Company’s Class A common stock on the NYSE is at least
$16.43
per share for a consecutive ninety day period; and
|
|
•
|
one-third of the shares subject to the option award will vest in the event that the average closing price of the Company’s Class A common stock on the NYSE is at least
$19.51
per share for a consecutive ninety day period.
|
In addition, the percentage of options per tranche that has satisfied the market-based performance hurdle is also subject to a service completion schedule. The aggregate percentage of options eligible to vest is based upon each of the service completions dates below:
|
•
|
50%
of the shares subject to the option award will vest on March 1, 2019, and
|
|
•
|
50%
of the shares subject to the option award will vest on March 1, 2020.
|
We measured the fair value of the performance-based stock options using a Monte Carlo simulation approach with the following assumptions: risk-free interest rate of
1.83%
, volatility of
65%
, expected term of
ten
years and dividend yield of
0%
. These inputs resulted in a weighted-average fair value per option granted of
$6.68
. During 2016 all of the average stock price milestones were achieved and therefore the awards are now only subject to the service completion obligations.
Information with respect to our performance-based stock options (shares and aggregate intrinsic value shown in thousands, weighted-average remaining contractual term shown in years) was as follows:
|
Weighted-
|
||||||||||||
|
Weighted-
|
Average
|
|||||||||||
|
Average
|
Remaining
|
Aggregate
|
||||||||||
|
Exercise
|
Contractual
|
Intrinsic
|
||||||||||
|
Shares
|
Price
|
Term
|
Value
|
|||||||||
|
Outstanding as of December 31, 2016
|
268
|
|
$
|
10.27
|
|
9.17
|
$
|
1,213
|
|
|||
|
Outstanding as of December 31, 2017
|
268
|
|
10.27
|
|
8.17
|
544
|
|
|||||
|
Vested and expected to vest
|
||||||||||||
|
after December 31, 2017
|
268
|
|
$
|
10.27
|
|
8.17
|
$
|
544
|
|
|||
Restricted stock
Restricted stock awarded under the incentive compensation plans is generally subject to a graded service vesting period where
25%
of the award vests after
one year
of service and the remaining award vests quarterly thereafter. Restricted stock awards are issued to the participants for no consideration. There were no restricted stock awards granted or forfeited during the years ended
December 31, 2017
or
2016
. There were no restricted stock awards outstanding as of
December 31, 2017
or
2016
.
105
Restricted Stock Units
Other than RSUs granted to our non-employee directors which have a one year vesting period, RSUs awarded under the incentive compensation plans are generally subject to a
four
-year graded service vesting period where
25%
of the award vests after each year of service and are issued to the participants for no consideration. Information with respect to our RSUs is presented below (in thousands, except for weighted-average grant-date fair value):
|
Weighted-
|
||||||
|
Average
|
||||||
|
Grant-Date
|
||||||
|
Shares
|
Fair Value
|
|||||
|
Outstanding as of December 31, 2016
|
618
|
|
$
|
13.07
|
|
|
|
Granted
|
468
|
|
19.35
|
|
||
|
Forfeited
|
(64
|
)
|
15.35
|
|
||
|
Vested
|
(206
|
)
|
14.09
|
|
||
|
Outstanding as of December 31, 2017
|
816
|
|
$
|
16.23
|
|
|
During the years ended
December 31, 2017
,
2016
and
2015
, we granted RSUs with a weighted-average grant date fair value of
$19.35
,
$11.60
and
$16.85
, respectively.
The total fair value of RSUs vested during the years ended
December 31, 2017
and
2016
was
$2.9 million
and
$1.8 million
. There were
no
RSU vests for the year ended
December 31, 2015
.
12
.
Income Taxes
On December 22, 2017, the U.S. government enacted the Tax Act. The Tax Act establishes new U.S. tax laws impacting the Company which include a reduction of the U.S. corporate income tax rate from 35% to 21% effective for tax years beginning after December 31, 2017, an indefinite carryforward period and 80% taxable income limitation on NOLs arising after December 31, 2017, and the repeal of the corporate alternative minimum tax (“AMT”).
In accordance with SEC Staff Accounting Bulletin No. 118, which provides SEC staff guidance for the application of ASC Topic 740, Income Taxes, in the reporting period in which the Tax Act was signed into law, the Company recorded provisional amounts representing reasonable estimates of effects of the Tax Act in its 2017 financial statements. The Company did not identify items for which the income tax effects of the Tax Act have not been completed and a reasonable estimate could not be determined as of December 31, 2017. The Company may adjust provisional estimates, which may impact our current income tax expense in the period in which the adjustments are made. The Company will continue to evaluate any adjustments necessary to our initial provisional estimates throughout 2018.
The Company believes the revaluation of our deferred tax assets and liabilities as a result of the Tax Act will have the most significant impact on the Company’s income tax expense. The Company measures deferred tax assets and liabilities using enacted tax rates that will apply in the years in which the temporary differences are expected to be recovered or settled. The Company recorded provisional expense of
$27.5 million
related to the decrease in net deferred tax assets, and a corresponding
$30.2 million
provisional benefit from the decrease in valuation allowance to reflect the reduction of the statutory corporate income tax rate. The Company also recorded a
$2.8 million
provisional benefit for release of valuation allowance related to indefinite-lived intangible deferred tax liabilities now considered a source of income as support for the realization of future indefinite-lived NOL deferred tax assets, and a
$0.3 million
provisional benefit for the refundability of existing AMT credit carryforward.
The Company incurs U.S. federal, state and local income taxes on the Company’s allocable share of taxable income of Evolent Health LLC. Our income before income tax is derived exclusively from U.S. sources.
106
Components of income tax expense (benefit) (in thousands) consist of the following:
|
For the Years Ended December 31,
|
|||||||||||
|
2017
|
2016
|
2015
|
|||||||||
|
Current
|
|||||||||||
|
Federal
|
$
|
368
|
|
$
|
—
|
|
$
|
15
|
|
||
|
State and local
|
266
|
|
—
|
|
—
|
|
|||||
|
Total current tax expense
|
634
|
|
—
|
|
15
|
|
|||||
|
Deferred
|
|||||||||||
|
Federal
|
3,202
|
|
(9,708
|
)
|
7,092
|
|
|||||
|
State and local
|
(3,102
|
)
|
(1,138
|
)
|
1,166
|
|
|||||
|
Total deferred tax expense
|
100
|
|
(10,846
|
)
|
8,258
|
|
|||||
|
Change in valuation allowance
|
(7,371
|
)
|
91
|
|
15,202
|
|
|||||
|
Total tax expense (benefit)
|
$
|
(6,637
|
)
|
$
|
(10,755
|
)
|
$
|
23,475
|
|
||
A reconciliation of the U.S. statutory tax rate to our effective tax rate is presented below:
|
For the Years Ended December 31,
|
||||||||
|
2017
|
2016
|
2015
|
||||||
|
U.S. statutory tax rate
|
35.0
|
%
|
35.0
|
%
|
35.0
|
%
|
||
|
U.S. state income taxes, net of U.S. federal tax benefit
|
3.3
|
%
|
4.0
|
%
|
4.9
|
%
|
||
|
Change in valuation allowance
|
(34.0
|
)%
|
(0.1
|
)%
|
4.4
|
%
|
||
|
Change in valuation allowance, tax reform
|
43.7
|
%
|
—
|
%
|
—
|
%
|
||
|
Impact of tax reform
|
(36.0
|
)%
|
—
|
%
|
—
|
%
|
||
|
Remeasurement gain
|
—
|
%
|
—
|
%
|
(40.1
|
)%
|
||
|
Non-deductible stock-based compensation expense
|
—
|
%
|
—
|
%
|
1.0
|
%
|
||
|
Goodwill impairment
|
—
|
%
|
(18.7
|
)%
|
—
|
%
|
||
|
Gain on contribution
|
—
|
%
|
(5.0
|
)%
|
—
|
%
|
||
|
Non-controlling interest
|
(4.6
|
)%
|
(11.0
|
)%
|
1.4
|
%
|
||
|
Stock-based compensation excess tax benefits
|
3.1
|
%
|
0.1
|
%
|
—
|
%
|
||
|
Other, net
|
(1.8
|
)%
|
0.2
|
%
|
0.2
|
%
|
||
|
Effective rate
|
8.7
|
%
|
4.5
|
%
|
6.8
|
%
|
||
Deferred tax balances reflect the impact of temporary differences between the carrying amount of assets and liabilities and their tax basis and are stated at the tax rates in effect when the temporary differences are expected to be recovered or settled.
Significant components of the Company’s deferred tax assets and liabilities (in thousands) were as follows:
|
|
As of December 31,
|
||||||
|
|
2017
|
2016
|
|||||
|
Deferred Tax Assets
|
|||||||
|
Start-up and organizational costs
|
$
|
185
|
|
$
|
321
|
|
|
|
Internally developed software costs
|
3,974
|
|
7,137
|
|
|||
|
Net operating loss carryforwards
|
51,197
|
|
60,076
|
|
|||
|
Other
|
(69
|
)
|
509
|
|
|||
|
Subtotal
|
55,287
|
|
68,043
|
|
|||
|
Valuation allowance
|
(53,201
|
)
|
(26,376
|
)
|
|||
|
Total deferred tax assets
|
2,086
|
|
41,667
|
|
|||
|
Deferred Tax Liabilities
|
|||||||
|
Equity-method investment
|
4,523
|
|
62,513
|
|
|||
|
Total deferred tax liabilities
|
4,523
|
|
62,513
|
|
|||
|
Net deferred tax assets (liabilities)
|
$
|
(2,437
|
)
|
$
|
(20,846
|
)
|
|
107
Changes in our valuation allowance (in thousands) were as follows:
|
For the Years Ended December 31,
|
|||||||||||
|
2017
|
2016
|
2015
|
|||||||||
|
Balance at beginning-of-year
|
$
|
26,376
|
|
$
|
19,974
|
|
$
|
6,914
|
|
||
|
Charged to costs and expenses
|
(7,371
|
)
|
91
|
|
15,202
|
|
|||||
|
Charged to other accounts
(1)
|
34,196
|
|
6,311
|
|
(2,142
|
)
|
|||||
|
Balance at end-of-year
|
$
|
53,201
|
|
$
|
26,376
|
|
$
|
19,974
|
|
||
|
(1)
|
Amounts charged to other accounts includes an increase of
$34.2 million
,
$6.3 million
and a decrease of
$2.1 million
charged to additional paid-in-capital for the years ended
December 31, 2017
,
2016
and
2015
, respectively.
|
The Company continues to record a valuation allowance against the net deferred tax assets that are not more likely than not to be realized. This assessment is made without considering potentially offsetting deferred tax liabilities established with respect to certain indefinite lived components, or components of the deferred tax liability expected to reverse outside of the net operating loss carryover period, as these were appropriately not considered a source of future taxable income for realizing the deferred tax assets, with the exception of up to 80% of future indefinite-lived NOL deferred tax assets.
For the year ended
December 31, 2017
, the effective tax rate was
8.7%
, due to the impact of the valuation allowance recorded against the Company’s net deferred tax assets, with the exception of indefinite lived components and those expected to reverse outside of the net operating loss carryover period as part of the outside basis difference in our partnership interest in Evolent Health LLC. The benefit recorded during the year primarily relates to the effects of the Tax Act, largely due to the revaluation of our deferred tax assets and liabilities for the new statutory income tax rate, and release of valuation allowance related to indefinite-lived intangible deferred tax liabilities now considered a source of income as support for the realization of future indefinite-lived NOL deferred tax assets.
For the year ended
December 31, 2016
, the effective tax rate was
4.5%
, due to the impact of the valuation allowance recorded against the Company’s net deferred tax assets, with the exception of indefinite lived components and those expected to reverse outside of the net operating loss carryover period as part of the outside basis difference in our partnership interest in Evolent Health LLC. The benefit recorded during the year primarily relates to release of this valuation allowance as a result of the Valence Health acquisition and movement in the indefinite lived book-over-tax basis difference not considered a source of future taxable income to support realizability of the deferred tax assets.
For the year ended
December 31, 2015
, the effective tax rate was
6.8%
, due to the impact of the valuation allowance recorded against the Company’s net deferred tax assets, with the exception of indefinite lived components and those expected to reverse outside of the net operating loss carryover period as part of the outside basis difference in our partnership interest in Evolent Health LLC. Pursuant to the Offering Reorganization, the Company recorded
$23.5 million
in income tax provision, due to an increase in these components of the deferred tax liability related to the book basis as compared to the tax basis in Evolent Health LLC.
As of
December 31, 2017
, the Company had NOLs of approximately
$207.6 million
available to offset future taxable income that begin to expire in
2031
through
2038
. However, as realization of such tax benefit is not more likely than not, based on our evaluation, we have established a valuation allowance. Internal Revenue Code Section 382 imposes limitations on the utilization of NOLs in the event of certain changes in ownership of the Company, which may have occurred or could occur in the future. This could impose an annual limit on the Company’s ability to utilize NOLs and could cause U.S. federal income taxes to be paid earlier than otherwise would be paid if such limitations were not in effect.
Changes in our unrecognized tax benefits (in thousands) were as follows:
|
For the Years Ended December 31,
|
|||||||||||
|
2017
|
2016
|
2015
|
|||||||||
|
Balance at beginning-of-year
|
$
|
—
|
|
$
|
—
|
|
$
|
—
|
|
||
|
Gross increases - tax positions in prior period
|
1,108
|
|
—
|
|
—
|
|
|||||
|
Gross increases - tax positions in current period
|
74
|
|
—
|
|
—
|
|
|||||
|
Change in tax rate
|
(420
|
)
|
—
|
|
—
|
|
|||||
|
Balance at end-of-year
|
$
|
762
|
|
$
|
—
|
|
$
|
—
|
|
||
Included in the balance of unrecognized tax benefits as of
December 31, 2017
, are
$0.8 million
of tax benefits that, if recognized, would not affect the effective tax rate. The Company has not recognized interest and penalties related to uncertain tax positions due to the current NOL position.
The Company had not recognized any uncertain tax positions, penalties or interest as of December 31, 2016
108
and 2015, as we concluded that no such positions existed. The
Company is not currently subject to income tax audits in any U.S. or state jurisdictions for any tax year.
Tax Receivables Agreement
Pursuant to the Offering Reorganization, Class B Exchanges are expected to increase our tax basis in our share of Evolent Health LLC’s tangible and intangible assets. These increases in tax basis are expected to increase our depreciation and amortization deductions and create other tax benefits and, therefore, may reduce the amount of tax that we would otherwise be required to pay in the future. In addition, certain NOLs of Evolent Health Holdings (and of an affiliate of TPG) are available to us as a result of the Offering Reorganization.
In connection with the Offering Reorganization, we entered into the TRA with the holders of Class B common units. The agreement requires us to pay to such holders
85%
of the cash savings, if any, in U.S. federal, state and local and foreign income tax (as applicable) we realize as a result of any deductions attributable to future increases in tax basis following the Class B Exchanges (calculated assuming that any post-offering transfer of Class B common units had not occurred) or deductions attributable to imputed interest or future increases in tax basis following payments made under the TRA. We are accounting for these payments as contingent liabilities and will recognize them in our Consolidated Statements of Operations when their realization is probable. Additionally, pursuant to the same agreement we will pay the former stockholders of Evolent Health Holdings
85%
of the amount of the cash savings, if any, in U.S. federal, state and local and foreign income tax that we realize as a result of the utilization of the NOLs of Evolent Health Holdings (and the affiliate of TPG) attributable to periods prior to the Offering Reorganization, approximately
$79.3
million, as well as deductions attributable to imputed interest on any payments made under the agreement.
We will benefit from the remaining
15%
of any realized cash savings. The TRA was effective upon the completion of the Offering Reorganization and will remain in effect until all such tax benefits have been used or expired, or until the agreement is terminated. See Note
9
for additional discussion of the implications of the TRA.
13
. Employee Benefit Plans
We sponsor a tax-qualified 401(k) retirement plan that provides eligible U.S. employees with an opportunity to save for retirement on a tax advantaged basis. We make matching contributions to the plan in accordance with the plan documents and various limitations under Section 401(a) of the Internal Revenue Code of 1986, as amended. The Company made
$8.0 million
and
$4.3 million
in contributions to the 401(k) plan for the years ended
December 31, 2017
and
2016
, respectively. After the Offering Reorganization in
2015
we contributed
$2.4 million
to the plan.
14
. Investments In and Advances to Affiliates
Equity Method Investments
During the years ended
December 31, 2017
and
2016
, the Company entered into joint venture agreements with various entities. At the time of the transactions, our economic interests in these entities ranged from
27%
to
40%
and our voting interests ranged from
28%
to
40%
. As of
December 31, 2017
, the Company’s economic interests in these affiliates ranged between
26%
and
40%
and voting interests ranged between
27%
and
40%
. As of
December 31, 2016
, the Company’s economic and voting interests in its affiliates was
26%
and
28%
, respectively. The Company determined that it had significant influence over these affiliates but that it did not have control over any of the entities. Accordingly, the investments were accounted for under the equity method of accounting and the Company was allocated its proportional share of the entities’ earnings and losses for each reporting period. The Company’s proportional share of the losses from these investments was approximately
$1.8 million
and
$0.8 million
for the years ended
December 31, 2017
and
2016
, respectively.
The Company signed services agreements with certain of the aforementioned affiliates to provide certain management, operational and support services to help manage elements of their service offerings. Revenues related to the services agreements for the years ended
December 31, 2017
and
2016
, was
$0.4 million
and
$0.2 million
, respectively.
Evolent Health LLC
Subsequent to the Offering Reorganization in 2015 described in Note
4
, the Company consolidates the results of operations of Evolent Health LLC. Prior to the Offering Reorganization, we did not control Evolent Health LLC, but were able to exert significant influence and, accordingly, accounted for our investment in Evolent Health LLC using the equity method of accounting.
The allocation of profits and losses to the shareholders of Evolent Health LLC were based upon the second amended and restated operating agreement of Evolent Health LLC. As part of recording our equity portion of the losses of Evolent Health LLC, the Company applied the hypothetical liquidation at book value basis of accounting which allocates profits and losses to the members
109
based upon the value that would accrue to each member at each period end based upon a theoretical liquidation at book value at that time.
During the period January 1, 2015, through June 3, 2015, Evolent Health, Inc.’s proportional share of the losses of Evolent Health LLC was
$28.2 million
, which included
$0.8 million
related to the amortization of a basis differential.
The summary of the financial position of Evolent Health LLC as of
December 31, 2017
and
2016
, is not presented as the Company consolidates the results of Evolent Health LLC after the date of the Offering Reorganization.
The following is a summary of the operating results of Evolent Health LLC (in thousands) for the period in which it was accounted for as an equity method investment (January 1, 2015, through June 3, 2015):
|
Total revenue
|
$
|
61,814
|
|
|
Cost of revenue (exclusive of
|
|||
|
depreciation and amortization expenses)
|
44,839
|
|
|
|
Gross profit
|
16,975
|
|
|
|
Operating income (loss)
|
(44,119
|
)
|
|
|
Net income (loss)
|
$
|
(44,079
|
)
|
15
. Non-controlling Interests
In connection with the closing of the IPO, we used the net proceeds of the IPO to purchase
13.2 million
newly-issued Class A common units in Evolent Health LLC. Additionally we acquired
2.1 million
Class A common units in Evolent Health LLC, at
$17.00
per unit, as a result of the merger of the TPG affiliate with and into Evolent Health, Inc. as described in Note
4
. Immediately following the Offering Reorganization and IPO, the Company owned
70.3%
of Evolent Health LLC.
During the year ended December 31, 2016, the Company issued shares of its Class A common stock to acquire Passport, Valence Health and Aldera. For each share of Class A common stock issued by the Company, we received a reciprocal number of Class A common units from Evolent Health LLC in exchange for contributing the acquired entities to Evolent Health LLC. As a result, our economic interest in Evolent Health LLC increased during the year from
70.3%
to
70.8%
due to Class A common shares issued for the acquisition of Passport and from
74.6%
to
77.4%
as a result of Class A common shares issued for the acquisitions of Valence Health and Aldera. In order to account for the change in our ownership interest in Evolent Health LLC, we reclassified a portion of our non-controlling interests into shareholders’ equity attributable to Evolent Health, Inc.
In addition, the Company completed a secondary offering of
8.6 million
shares of its Class A common stock at a price to the underwriters of
$21.54
per share in September 2016. The shares sold in the September 2016 Secondary consisted of
6.4 million
existing shares of the Company’s Class A common stock owned and held by the Selling Stockholders and
2.2 million
newly-issued shares of the Company’s Class A common stock received by certain Investor Stockholders pursuant to Class B Exchanges. As a result of these Class B Exchanges and Evolent Health LLC’s cancellation of its Class B common units during the September 2016 Secondary, the Company’s economic interest in Evolent Health LLC increased from
71.0%
to
74.6%
as of September 22, 2016, and, accordingly, we reclassified a portion of our non-controlling interests into shareholders’ equity attributable to Evolent Health, Inc.
Further, the Company completed the 2017 Secondary Offerings during 2017. The shares sold in the 2017 Secondary Offerings consisted of
20.1 million
shares of the Company’s Class A common stock, consisting of
7.4 million
existing shares of the Company’s Class A common stock owned and held by certain Selling Stockholders,
12.6 million
newly-issued shares of the Company’s Class A common stock received by certain Investor Stockholders pursuant to Class B Exchanges and
0.1 million
shares issued upon the exercise of options by certain management selling stockholders. As a result of these Class B Exchanges and Evolent Health LLC’s cancellation of its Class B common units during the 2017 Secondary Offerings, the Company’s economic interest in Evolent Health LLC increased from
77.4%
to
96.1%
immediately following the June 2017 Secondary, and, accordingly, we reclassified a portion of our non-controlling interests into shareholders’ equity attributable to Evolent Health, Inc.
In addition, the Company issued
8.8 million
shares of its Class A Common Stock during the August 2017 Primary for net proceeds of
$166.9 million
. For each share of Class A common stock issued by Evolent Health, Inc., the Company received a corresponding Class A common unit from Evolent Health LLC in exchange for contributing the issuance proceeds to Evolent Health LLC. As a result of the Class A common stock and Class A common units issued in conjunction with the August 2017 Primary, the Company’s economic interest in Evolent Health LLC increased from
96.1%
to
96.6%
immediately following the August 2017 Primary, and, accordingly, we reclassified a portion of our non-controlling interests into shareholders’ equity attributable to Evolent Health, Inc.
As of
December 31, 2017
and
2016
, we owned
96.6%
and
77.4%
of the economic interests in Evolent Health LLC, respectively. See Note
4
for further discussion of our August 2017 Primary and 2017 Secondary Offerings.
110
Changes in non-controlling interests (in thousands) for the periods presented were as follows:
|
For the Years Ended
|
|||||||
|
December 31,
|
|||||||
|
2017
|
2016
|
||||||
|
Non-controlling interests as of beginning-of-year
|
$
|
209,588
|
|
$
|
285,238
|
|
|
|
Cumulative-effect adjustment from adoption of new accounting principle
|
—
|
|
(139
|
)
|
|||
|
Decrease in non-controlling interests as a result of Class B Exchanges
|
(168,883
|
)
|
(28,220
|
)
|
|||
|
Reclassification of non-controlling interests
|
3,824
|
|
19,745
|
|
|||
|
Net income (loss) attributable to non-controlling interests
|
(9,102
|
)
|
(67,036
|
)
|
|||
|
Non-controlling interests as of end-of-year
|
$
|
35,427
|
|
$
|
209,588
|
|
|
16
. Fair Value Measurement
GAAP defines fair value as the price that would be received from the sale of an asset or paid to transfer a liability (an exit price) assuming an orderly transaction in the most advantageous market at the measurement date. GAAP also establishes a hierarchical disclosure framework which prioritizes and ranks the level of observability of inputs used in measuring fair value. These tiers include:
|
•
|
Level 1 - inputs to the valuation methodology are quoted prices available in active markets for identical instruments as of the reporting date;
|
|
•
|
Level 2 - inputs to the valuation methodology are other than quoted prices in active markets, which are either directly or indirectly observable as of the reporting date and the fair value can be determined through the use of models or other valuation methodologies; and
|
|
•
|
Level 3 - inputs to the valuation methodology are unobservable inputs in situations where there is little or no market activity for the asset or liability.
|
In certain cases, the inputs used to measure fair value may fall into different levels of the fair value hierarchy. In such cases, the level within the fair value hierarchy is based on the lowest level of input that is significant to the fair value measurement. Our assessment of the significance of a particular input to the fair value measurement in its entirety requires judgment and considers factors specific to the particular asset or liability being measured.
Recurring Fair Value Measurements
In accordance with GAAP, certain assets and liabilities are required to be recorded at fair value on a recurring basis. The following table summarizes the Company’s assets and liabilities measured at fair value on a recurring basis (in thousands):
|
As of December 31, 2017
|
|||||||||||||||
|
Level 1
|
Level 2
|
Level 3
|
Total
|
||||||||||||
|
Assets
|
|||||||||||||||
|
Cash and cash equivalents
(1)
|
$
|
60,535
|
|
$
|
—
|
|
$
|
—
|
|
$
|
60,535
|
|
|||
|
Restricted cash and restricted investments
(1)
|
16,575
|
|
—
|
|
—
|
|
16,575
|
|
|||||||
|
Total
|
$
|
77,110
|
|
$
|
—
|
|
$
|
—
|
|
$
|
77,110
|
|
|||
|
Liabilities
|
|||||||||||||||
|
Contingent consideration
(2)
|
$
|
—
|
|
$
|
—
|
|
$
|
8,700
|
|
$
|
8,700
|
|
|||
|
As of December 31, 2016
|
|||||||||||||||
|
Level 1
|
Level 2
|
Level 3
|
Total
|
||||||||||||
|
Assets
|
|||||||||||||||
|
Cash and cash equivalents
(1)
|
$
|
1,128
|
|
$
|
—
|
|
$
|
—
|
|
$
|
1,128
|
|
|||
|
Liabilities
|
|||||||||||||||
|
Contingent consideration
(2)
|
$
|
—
|
|
$
|
—
|
|
$
|
8,300
|
|
$
|
8,300
|
|
|||
(1)
Represents the cash and cash equivalents and restricted cash and restricted investments that were held in money market funds as of
December 31, 2017
and
2016
, as presented in the tables above.
(2)
Represents the contingent earn-out consideration related to the Passport acquisition as described further in Note
4
.
111
The Company recognizes any transfers between levels within the hierarchy as of the beginning of the reporting period. There were no transfers between fair value levels for the years ended
December 31, 2017
and
2016
, respectively.
In the absence of observable market prices, the fair value is based on the best information available and involves a significant degree of judgment, taking into consideration a combination of internal and external factors, including the appropriate risk adjustments for non-performance and liquidity risks.
As discussed in Note
4
, the strategic alliance with Passport includes a provision for additional equity consideration contingent upon the Company obtaining new third-party Medicaid business in future periods. The significant unobservable inputs used in the fair value measurement of the Passport contingent consideration are the
five
-year risk-adjusted recurring revenue compound annual growth rate (“CAGR”) and the applicable discount rate. A significant increase in the assumed
five
-year risk-adjusted recurring revenue CAGR projection or decrease in discount rate in isolation would result in a significantly higher fair value of the contingent consideration.
The changes in our contingent consideration, measured at fair value, for which the Company uses Level 3 inputs to determine fair value are as follows (in thousands):
|
For the Years Ended
|
|||||||
|
December 31,
|
|||||||
|
2017
|
2016
|
||||||
|
Balance as of beginning of year
|
$
|
8,300
|
|
$
|
—
|
|
|
|
Additions
|
—
|
|
10,386
|
|
|||
|
Realized and unrealized (gains) losses, net
|
400
|
|
(2,086
|
)
|
|||
|
Balance as of end of year
|
$
|
8,700
|
|
$
|
8,300
|
|
|
The table above includes contingent consideration related to both the Passport and Valence Health transactions. As discussed in Note
4
, there was contingent consideration related to the Valence Health transaction, tied to Valence Health contracting new business activity on or before December 31, 2016. The Company determined the fair value of the contingent consideration was approximately
$2.6 million
as of the acquisition date. Valence Health did not contract sufficient business activity to be eligible for any contingent consideration as of December 31, 2016. Accordingly, the Company recorded a
$2.6 million
realized gain associated with the release of the liability. There is no contingent consideration obligation related to the Valence Health transaction as of December 31, 2016. The realized gain was offset by a
$0.5 million
realized loss associated with an increase in fair value of Passport’s contingent consideration, which was initially recorded at
$7.8 million
. As a result, the Company recorded a net realized gain of
$2.1 million
in fair value of contingent consideration for the year ended December 31, 2016. All of the activity in 2017 was attributable to changes in the fair value of the Passport contingent consideration.
The Company did not have any assets or liabilities with Level 3 inputs for the year ended
December 31, 2015
.
The following table summarizes the fair value (in thousands), valuation techniques and significant unobservable inputs of our Level 3 fair value measurements as of the periods presented:
|
As of December 31, 2017
|
|||||||||||
|
Fair
|
Valuation
|
Significant
|
Assumption or
|
||||||||
|
Value
|
Technique
|
Unobservable Inputs
|
Input Ranges
|
||||||||
|
Contingent consideration
(1)
|
$
|
8,700
|
|
Real options approach
|
Risk-adjusted recurring revenue CAGR
|
92.5
|
%
|
(2)
|
|||
|
Discount rate/time value
|
2.7% - 4.0%
|
|
|||||||||
(1)
Related to additional Passport earn-out consideration as described further in Note
4
.
(2)
The risk-adjusted recurring revenue CAGR is calculated over the
five
year period 2017-2021. Given that there was no recurring revenue in 2016 and 2017, the calculation of the 2017 and 2018 growth rates is based on theoretical 2016 and 2017 recurring revenues of
$1.0 million
, resulting in a higher growth rate. The risk-adjusted recurring revenue CAGR over the period 2019-2021 is
19.2%
.
112
|
As of December 31, 2016
|
|||||||||||
|
Fair
|
Valuation
|
Significant
|
Assumption or
|
||||||||
|
Value
|
Technique
|
Unobservable Inputs
|
Input Ranges
|
||||||||
|
Contingent consideration
(1)
|
$
|
8,300
|
|
Real options approach
|
Risk-adjusted recurring revenue CAGR
|
97.0
|
%
|
(2)
|
|||
|
Discount rate/time value
|
2.5% - 4.5%
|
|
|||||||||
(1)
Related to additional Passport earn-out consideration as described further in Note
4
.
(2)
The risk-adjusted recurring revenue CAGR is calculated over the
five
year period 2017-2021. Given that there was no recurring revenue in 2016, the calculation of the 2017 growth rate is based on a theoretical 2016 recurring revenue of
$1.0 million
, resulting in a higher growth rate. The risk-adjusted recurring revenue CAGR over the period 2018-2021 is
50.8%
.
Nonrecurring Fair Value Measurements
In addition to the assets and liabilities that are recorded at fair value on a recurring basis, the Company records certain assets and liabilities at fair value on a nonrecurring basis as required by GAAP. Generally, assets are recorded at fair value on a nonrecurring basis as a result of impairment charges. This includes goodwill, intangible assets, property, plant and equipment, held-to-maturity investments and equity method investments. While not carried at fair value on a recurring basis, these items are continually monitored for indicators of impairment that would indicate current carrying value is greater than fair value. In those situations, the assets are considered impaired and written down to current fair value. See Notes
4
,
5
,
6
,
7
and
14
for further discussion of assets measured at fair value on a nonrecurring basis.
Other Fair Value Disclosures
The carrying amounts of cash and cash equivalents (those not held in a money market fund), restricted cash, receivables, prepaid expenses, accounts payable, accrued liabilities and accrued compensation approximate their fair values because of the relatively short-term maturities of these items and financial instruments.
See Note
8
for information regarding the fair value of the 2021 Notes.
113
17
. Related Parties
The entities described below are considered related parties and the balances and/or transactions with them are reported in our consolidated financial statements.
As discussed in Note
14
, the Company has economic interests in several entities that are accounted for under the equity method of accounting. The Company is allocated its proportional share of the investees’ earnings and losses each reporting period. In addition, Evolent has entered into services agreements with certain of the entities to provide certain management, operational and support services to help the entities manage elements of their service offerings. Revenues related to the services agreements were approximately
$0.4 million
and
$0.2 million
for the years ended
December 31, 2017
and
2016
, respectively.
The Company also works closely with UPMC, one of its founding investors. The Company’s relationship with UPMC is a subcontractor relationship where UPMC has agreed to execute certain tasks (primarily TPA services) relating to certain customer commitments. We also conduct business with a company in which UPMC holds a significant equity interest.
Additionally, prior to the Offering Reorganization, we issued shares of our stock to certain of our partners while concurrently entering into revenue contracts with those partners. Those partners are considered related parties and the balances and/or transactions with them were reported on our consolidated financial statements for the periods in which they held a significant equity interest in Evolent Health, Inc.
18
. Quarterly Results of Operations (unaudited)
The unaudited consolidated quarterly results of operations (in thousands, except per share data) were as follows:
|
1st
Quarter |
2nd
Quarter |
3rd
Quarter |
4th
Quarter |
||||||||||||
|
2017
|
|||||||||||||||
|
Total revenue
|
$
|
106,238
|
|
$
|
107,071
|
|
$
|
107,912
|
|
$
|
113,729
|
|
|||
|
Total operating expenses
|
127,693
|
|
126,188
|
|
121,932
|
|
131,977
|
|
|||||||
|
Net income (loss)
|
(23,149
|
)
|
(19,698
|
)
|
(13,129
|
)
|
(13,791
|
)
|
|||||||
|
Net income (loss) attributable to non-controlling interests
|
(5,137
|
)
|
(2,793
|
)
|
(541
|
)
|
(631
|
)
|
|||||||
|
Net income (loss) attributable to Evolent Health, Inc.
|
(18,012
|
)
|
(16,905
|
)
|
(12,588
|
)
|
(13,160
|
)
|
|||||||
|
Earnings (loss) per common share
|
|||||||||||||||
|
Basic
|
$
|
(0.34
|
)
|
$
|
(0.28
|
)
|
$
|
(0.18
|
)
|
$
|
(0.18
|
)
|
|||
|
Diluted
|
(0.34
|
)
|
(0.28
|
)
|
(0.18
|
)
|
(0.18
|
)
|
|||||||
|
2016
|
|||||||||||||||
|
Total revenue
|
$
|
49,449
|
|
$
|
56,518
|
|
$
|
60,210
|
|
$
|
88,011
|
|
|||
|
Total operating expenses
|
224,527
|
|
69,147
|
|
76,049
|
|
121,884
|
|
|||||||
|
Net income (loss)
|
(173,811
|
)
|
(11,999
|
)
|
(15,775
|
)
|
(25,193
|
)
|
|||||||
|
Net income (loss) attributable to non-controlling interests
|
(51,071
|
)
|
(3,612
|
)
|
(4,567
|
)
|
(7,786
|
)
|
|||||||
|
Net income (loss) attributable to Evolent Health, Inc.
|
(122,740
|
)
|
(8,387
|
)
|
(11,208
|
)
|
(17,407
|
)
|
|||||||
|
Earnings (loss) per common share
|
|||||||||||||||
|
Basic
|
$
|
(2.91
|
)
|
$
|
(0.20
|
)
|
$
|
(0.26
|
)
|
$
|
(0.33
|
)
|
|||
|
Diluted
|
(2.91
|
)
|
(0.20
|
)
|
(0.26
|
)
|
(0.33
|
)
|
|||||||
The unaudited consolidated quarterly results of operations include certain unusual or infrequently occurring items that were material to the results of certain quarters as described below.
The Company recorded a goodwill impairment of
$160.6 million
during the first quarter of 2016, as described further in Note
7
.
During the fourth quarter of 2016, the Company completed the acquisition of Valence Health and Aldera. Accordingly, the 2017 quarterly results include the consolidated results of Valence Health and Aldera. As described further in Note
4
, the acquisition of Valence Health resulted in a one-time lease termination benefit of approximately
$0.5 million
during the second quarter of 2017 and a one-time lease abandonment expense of approximately
$6.5 million
during the fourth quarter of 2016. Additionally, there was approximately
$3.9 million
in one-time stock compensation expense related to the acceleration of unvested Valence Health equity awards that vested upon the close of the Valence Health acquisition during the fourth quarter of 2016.
114
Immaterial Correction of an Error in Previously Issued Financial Statements
Subsequent to the filing of the Company’s Quarterly Report on Form 10-Q for the period ended June 30, 2017, the Company identified an error related to the classification of restricted cash and restricted investments on its Consolidated Statement of Cash Flows.
Accordingly, the Company corrected this error by revising the classification of certain changes in restricted cash and restricted investments within the Consolidated Statement of Cash Flows.
The following table summarizes the impact of the correction of the error to the Company’s Consolidated Statement of Cash Flows for the six months ended June 30, 2017 (in thousands):
|
As Reported
|
Correction
|
As Revised*
|
|||||||||
|
Cash Flows from Operating Activities
|
|||||||||||
|
Changes in assets and liabilities, net of acquisitions:
|
|||||||||||
|
Accounts receivables, net
|
$
|
(5,247
|
)
|
$
|
(2,655
|
)
|
$
|
(7,902
|
)
|
||
|
Accounts payable, net of change in restricted
|
|||||||||||
|
cash and restricted investments
|
(2,514
|
)
|
9,555
|
|
7,041
|
|
|||||
|
Net cash provided by (used in) operating activities
|
(44,712
|
)
|
6,900
|
|
(37,812
|
)
|
|||||
|
Cash Flows from Investing Activities
|
|||||||||||
|
Change in restricted cash and restricted investments
|
3,200
|
|
(6,900
|
)
|
(3,700
|
)
|
|||||
|
Net cash provided by (used in) investing activities
|
7,739
|
|
(6,900
|
)
|
839
|
|
|||||
* The table above does not reflect the impact of the adoption of ASU 2016-18. The Company adopted ASU 2016-18 effective December 31, 2017. As a result, our future filings will reflect the presentation of our statement of cash flows as required under ASU 2016-18 and not as depicted in the table above. See Note
3
for further discussion of our adoption of ASU 2016-18.
The Company assessed the materiality of the misstatement both quantitatively and qualitatively and determined the correction of this error to be immaterial to all prior consolidated financial statements taken as a whole. The Company will revise its Consolidated Statements of Cash Flows for the six months ended June 30, 2017, in future filings to reflect the correction of the error.
115
19
. Supplemental Cash Flow Information
The following represents supplemental cash flow information (in thousands):
|
For the Years Ended December 31,
|
|||||||||||
|
|
2017
|
2016
|
2015
|
||||||||
|
Supplemental Disclosure of Non-cash Investing and Financing Activities
|
|||||||||||
|
Non-cash contribution of common stock to Evolent Health LLC prior to the Offering Reorganization
|
$
|
—
|
|
$
|
—
|
|
$
|
21,810
|
|
||
|
Class A common stock issued in connection with business combinations
|
—
|
|
177,795
|
|
—
|
|
|||||
|
Increase to goodwill from measurement period adjustments related to business combination
|
1,611
|
|
—
|
|
—
|
|
|||||
|
Decrease in accrued financing costs related to 2021 Notes
|
196
|
|
—
|
|
—
|
|
|||||
|
Tax benefit related to Accordion intangible technology
|
2,042
|
|
—
|
|
—
|
|
|||||
|
Non-cash deferred financing costs payable
|
—
|
|
1,036
|
|
—
|
|
|||||
|
Acquisition consideration payable
|
—
|
|
1,148
|
|
—
|
|
|||||
|
Accrued property and equipment purchases
|
229
|
|
446
|
|
—
|
|
|||||
|
Effects of the Offering Reorganization
|
|||||||||||
|
Reclassification of deferred offering costs acquired to additional paid-in capital
|
—
|
|
—
|
|
3,154
|
|
|||||
|
Conversion of existing equity as part of the Offering Reorganization
|
—
|
|
—
|
|
39,014
|
|
|||||
|
Issuance of Class B common stock
|
—
|
|
—
|
|
196
|
|
|||||
|
Assumption of non-controlling interest as a result of merger with TPG affiliate
|
—
|
|
—
|
|
34,875
|
|
|||||
|
Effects of the 2017 and 2016 Securities Offerings
|
|||||||||||
|
Decrease in non-controlling interests as a result of Class B Exchanges
|
168,883
|
|
28,220
|
|
—
|
|
|||||
|
Decrease in deferred tax liability as a result of securities offerings
|
12,857
|
|
1,606
|
|
—
|
|
|||||
|
Supplemental Disclosures
|
|||||||||||
|
Cash paid during the period for interest
|
2,472
|
|
—
|
|
—
|
|
|||||
|
Cash paid during the year for taxes, net
|
674
|
|
—
|
|
—
|
|
|||||
20
. Subsequent Events
New Mexico Health Connections
On January 2, 2018, the Company, through its wholly-owned subsidiary, True Health, completed its previously announced acquisition of assets related to NMHC’s commercial business. The assets include a health plan management services organization with a leadership team and employee base with experience working locally with providers to run NMHC’s suite of preventive, disease and care management programs. The consideration paid by the Company in connection with the acquisition consisted of
$10.3 million
in cash (subject to certain adjustments), of which
$0.3 million
was deposited in an escrow account. This acquisition is expected to allow the Company to leverage its platform to support a value-based, provider-centric model of care in New Mexico. At the time of the acquisition, the Company also entered into a managed services agreement with NMHC to support its ongoing business. The acquisition will be accounted for as a business combination and, accordingly, the total purchase price will be allocated to the tangible and intangible assets acquired based on their respective fair values on January 2, 2018. Given the timing of this acquisition, the initial accounting for this business combination has not been completed. As a result, the requisite business combination disclosures cannot be made as of the issuance date of these financial statements. The Company will begin reporting the results of True Health during the first quarter of 2018, and anticipates the results will be presented as a new reportable segment.
None.
Evaluation of Disclosure Controls and Procedures
Our management, with the participation of our principal executive officer and principal financial officer, has evaluated the effectiveness of our disclosure controls and procedures (as defined in Rules 13a-15(e) and 15d-15(e) under the Exchange Act), as of the end of the period covered by this Annual Report on Form 10-K. Based on such evaluation, and in light of the material weakness in the design and operation of our internal control over financial reporting as described below, our principal executive officer and principal financial officer have concluded that, as of
December 31, 2017
, our disclosure controls and procedures were not effective. The company has continued to take steps to address the underlying causes of the material weakness as described further in “Plan of Remediation to Address Material Weakness in Internal Control over Financial Reporting” below.
116
Management’s Report on Internal Control over Financial Reporting
Our management is responsible for establishing and maintaining adequate internal control over financial reporting (as defined in Rules 13a-15(f) and 15d-15(f) of the Exchange Act). The Company’s internal control over financial reporting is a process designed to provide reasonable assurance regarding the reliability of financial reporting and the preparation of financial statements for external reporting purposes in accordance with generally accepted accounting principles.
Under the supervision and with the participation of our principal executive officer and principal financial officer, our management conducted an evaluation of the effectiveness of our internal control over financial reporting as of
December 31, 2017
, based on the guidelines established in
Internal Control -- Integrated Framework
issued by the Committee of Sponsoring Organizations of the Treadway Commission (2013 framework). Based on such evaluation, our management has concluded that, as of
December 31, 2017
, the Company’s internal control over financial reporting was not effective because of the material weakness described below.
A material weakness is a deficiency, or a combination of deficiencies, in internal control over financial reporting such that there is a reasonable possibility that a material misstatement of our annual or interim financial statements will not be prevented or detected on a timely basis. We did not maintain a sufficient complement of resources with an appropriate level of accounting knowledge, experience and training to address accounting for complex, non-routine transactions. This material weakness resulted in the revision of the Company’s consolidated financial statements for the quarter ended June 30, 2017. Additionally, this material weakness could result in a misstatement of account balances or disclosures that would result in a material misstatement to the annual or interim consolidated financial statements that would not be prevented or detected.
The effectiveness of the Company’s internal control over financial reporting as of December 31, 2017, has been audited by PricewaterhouseCoopers LLP, an independent registered public accounting firm, as stated in their report which appears herein.
Plan of Remediation to Address Material Weakness in Internal Control over Financial Reporting
Management is actively engaged in the implementation of remediation efforts to address the underlying causes of the material weakness. Management’s remediation activities to date include the following:
|
•
|
hired additional full-time accounting resources and financial planning and analysis resources with experience to address complex, non-routine transactions:
|
|
•
|
during 2015 we hired a senior director of revenue and technical accounting, a director of financial reporting, a manager of revenue and a senior revenue accountant;
|
|
•
|
during 2016 we hired an associate director of revenue;
|
|
•
|
during 2017 we hire
d an associate director of accounting and a senior director of tax; and
|
|
•
|
from December 31, 2014, to December 31, 2017, our finance and accounting headcount increased from 9 to over 30.
|
|
•
|
expanded finance and accounting staff, including additional senior resources, to allow for the reallocation of responsibilities across our accounting department based on potential risk and complexity of transactions and/or tasks to be reviewed;
|
|
•
|
strengthened our review procedures and controls and formalized documentation of the reviews surrounding complex, non-routine transactions;
|
|
•
|
implemented additional monitoring programs, which included the formation of a disclosure committee comprised of members of our executive committee and finance and accounting leadership;
|
|
•
|
implemented training programs for various processes to train employees in respect of our established processes and controls, especially with regard to complex, non-routine transactions;
|
|
•
|
engaged our actuarial department to assist in the review of significant estimates in various areas, including incurred but not reported liabilities;
|
|
•
|
implemented a new contract management process to facilitate the documentation and review of complex contracts by appropriate accounting personnel and relevant company stakeholders;
|
|
•
|
engaged external technical accounting experts to aid with accounting for complex, non-routine transactions; and
|
|
•
|
engaged external tax accounting experts to aid with complex tax matters.
|
The process of implementing and maintaining an effective team and process over complex, non-routine transactions is a continuous effort that requires us to anticipate and react to changes in our business and the economic and regulatory environments. During 2017, we completed the hiring of further senior, technical personnel identified as part of our remediation plan and will continue to supplement resources in response to changes in our business. Responsibilities for these key personnel include the accounting for complex and non-routine transactions. While we have finalized the design effectiveness of related controls as well as established and formalized our processes and controls surrounding the complex and non-routine transactions that gave rise to the material weakness; these processes and controls have not been operating for a sufficient period of time to be considered remediated. The material weakness will not be considered remediated until the applicable remedial controls operate for a sufficient period of time and management concludes, through testing, that these controls are operating effectively. Therefore, management has concluded that the controls surrounding complex and non-routine transactions were not effective as of December 31, 2017.
117
Changes in Internal Control over Financial Reporting
There were no changes in our internal control over financial reporting during the quarter ended December 31, 2017, that have materially affected, or are reasonably likely to materially affect, our internal control over financial reporting.
Inherent Limitations of Internal Controls
Our management, including our principal executive officer and principal financial officer, does not expect that our disclosure controls and procedures or our internal control over financial reporting will prevent all errors and all fraud. A control system, no matter how well conceived and operated, can provide only reasonable, not absolute, assurance that the objectives of the control system are met. Because of the inherent limitations in all control systems, no evaluation of controls can provide absolute assurance that all control issues and instances of fraud, if any, within the Company have been detected. These inherent limitations include the realities that judgments in decision-making can be faulty, and that breakdowns can occur because of a simple error or mistake. Additionally, controls can be circumvented by the individual acts of some persons, by collusion of two or more people, or by management override of the control. The design of any system of controls also is based in part upon certain assumptions about the likelihood of future events, and there can be no assurance that any design will succeed in achieving its stated goals under all potential future conditions. Over time, controls may become inadequate because of changes in conditions, or the degree of compliance with the policies or procedures may deteriorate. Because of the inherent limitations in a cost-effective control system, misstatements due to error or fraud may occur and not be detected.
None.
118
The information called for by this Item 10 pertaining to Directors is incorporated herein by reference to Evolent Health, Inc.’s definitive proxy statement for the Annual Meeting of Shareholders to be held on
June 13, 2018
, to be filed by Evolent Health, Inc. with the SEC pursuant to Regulation 14A within 120 days after the year ended
December 31, 2017
(the “
2018
Proxy Statement”).
The information called for by this Item 10 pertaining to Executive Officers appears in “Part I - Item 1. Business - Executive Officers of the Registrant” in this Annual Report on Form 10-K and our
2018
Proxy Statement.
We have adopted a Code of Business Conduct and Ethics that applies to all of our directors, officers and employees, including our principal executive officer and principal financial officer. The Code of Business Conduct and Ethics is posted on our investor relations website.
We have adopted a written code of business conduct and ethics that applies to our directors, officers and other employees, including our principal executive officer, principal financial officer, principal accounting officer, and other persons performing similar functions. We have made a current copy of the code available on our website, www.evolenthealth.com. The code is available in print, without charge, to any person who sends a written request to our Corporate Secretary at 800 N. Glebe Road, Suite 500, Arlington, VA 22203. We intend to satisfy the SEC’s disclosure requirements regarding amendments to, or waivers of, the code of ethics by posting such information on our website.
Information required by this Item 11 is incorporated herein by reference to our
2018
Proxy Statement.
Information required by this Item 12 is incorporated herein by reference to our
2018
Proxy Statement.
Information required by this Item 13 is incorporated herein by reference to our
2018
Proxy Statement.
Information required by this Item 14 is incorporated herein by reference to our
2018
Proxy Statement.
(a) The following documents are filed as part of this report:
|
(1)
|
The following financial statements of the registrant and report of independent registered public accounting firm are included of Item 8 hereof:
|
|
(2)
|
All financial statement schedules for which provision is made in the applicable accounting regulations of the Securities and Exchange Commission either have been included in the Financial Statements, are not required under the related instructions, or are not applicable and therefore have been omitted.
|
|
(3)
|
The audited financial statements of Evolent Health LLC as of December 31, 2016 and 2015 and for the year ended December 31, 2016 and for the period from June 4, 2015 to December 31, 2015 (Successor Company) and for the period from January 1, 2015 to June 3, 2015 and for the year ended December 31, 2014 (Predecessor Company), which are incorporated herein by reference.
|
|
(4)
|
The Exhibits are listed in the Index to Exhibits beginning on page E-1, which is incorporated herein by reference.
|
119
Not Applicable.
SIGNATURES
Pursuant to the requirements of Section 13 or 15(d) of the Securities Exchange Act of 1934, the registrant has duly caused this report to be signed on its behalf by the undersigned, thereunto duly authorized.
|
Evolent Health, Inc.
|
||
|
By:
|
/s/ Nicholas McGrane
|
|
|
Name:
|
Nicholas McGrane
|
|
|
Title:
|
Chief Financial Officer
|
|
Dated:
March 1, 2018
Pursuant to the requirements of the Securities Exchange Act of 1934, this report has been signed below by the following persons on behalf of the registrant and in the capacities and on the dates indicated.
|
Signature
|
Title
|
Date
|
||
|
/s/ Frank Williams
|
Chief Executive Officer and Director
|
March 1, 2018
|
||
|
Frank Williams
|
(Principal Executive Officer)
|
|||
|
/s/ Nicholas McGrane
|
Chief Financial Officer
|
March 1, 2018
|
||
|
Nicholas McGrane
|
(Principal Financial Officer)
|
|||
|
/s/ Lydia Stone
|
Chief Accounting Officer and Corporate Controller
|
March 1, 2018
|
||
|
Lydia Stone
|
(Principal Accounting Officer)
|
|||
|
/s/ David Farner
|
Director
|
March 1, 2018
|
||
|
David Farner
|
||||
|
/s/ Bruce Felt
|
Director
|
March 1, 2018
|
||
|
Bruce Felt
|
||||
|
/s/ Matthew Hobart
|
Director
|
March 1, 2018
|
||
|
Matthew Hobart
|
||||
|
/s/ Diane Holder
|
Director
|
March 1, 2018
|
||
|
Diane Holder
|
||||
|
/s/ M. Bridget Duffy
|
Director
|
March 1, 2018
|
||
|
M. Bridget Duffy, MD
|
||||
|
/s/ Michael D’Amato
|
Director
|
March 1, 2018
|
||
|
Michael D’Amato
|
||||
|
/s/ Norman Payson
|
Director
|
March 1, 2018
|
||
|
Norman Payson, MD
|
||||
|
/s/ Kenneth Samet
|
Director
|
March 1, 2018
|
||
|
Kenneth Samet
|
||||
|
/s/ Cheryl Scott
|
Director
|
March 1, 2018
|
||
|
Cheryl Scott
|
||||
120
EVOLENT HEALTH, INC.
Exhibit Index
|
|
||
|
|
||
|
|
||
|
|
||
|
|
||
|
|
||
|
|
||
E-1
|
|
||
|
|
||
|
101.INS
|
XBRL Instance Document
|
|
|
101.SCH
|
XBRL Taxonomy Extension Schema Document
|
|
|
101.CAL
|
XBRL Taxonomy Extension Calculation Linkbase Document
|
|
|
101.LAB
|
XBRL Taxonomy Extension Label Linkbase Document
|
|
|
101.PRE
|
XBRL Taxonomy Extension Presentation Linkbase Document
|
|
|
101.DEF
|
XBRL Taxonomy Extension Definition Linkbase Document
|
|
† The Company’s request for confidential treatment with respect to certain portions of this exhibit has been accepted.
+ Constitutes a management contract or other compensatory plan or arrangement.
* The Company agrees to furnish supplementally to the SEC a copy of any omitted schedule or exhibit upon the request of the SEC in accordance with Item 601(b)(2) of Regulation S-K.
E-2
TABLE OF CONTENTS
Part IItem 1. BusinessItem 1A. Risk FactorsItem 1B. Unresolved Staff CommentsItem 2. PropertiesItem 3. Legal ProceedingsItem 4. Mine Safety DisclosuresPart IIItem 5. Market For Registrant S Common Equity, Related Stockholder Matters and Issuer Purchases Of Equity SecuritiesItem 6. Selected Financial DataItem 7. Management S Discussion and Analysis Of Financial Condition and Results Of OperationsItem 7A. Quantitative and Qualitative Disclosures About Market RiskItem 8. Financial Statements and Supplementary DataItem 9. Changes in and Disagreements with Accountants on Accounting and Financial DisclosureItem 9A. Controls and ProceduresItem 9B. Other InformationPart IIIItem 10. Directors, Executive Officers and Corporate GovernanceItem 11. Executive CompensationItem 12. Security Ownership Of Certain Beneficial Owners and Management and Related Stockholder MattersItem 13. Certain Relationships and Related Transactions, and Director IndependenceItem 14. Principal Accounting Fees and ServicesPart IVItem 15. Exhibits, Financial Statement SchedulesItem 16. Form 10-k Summary