EDWARDS LIFESCIENCES CORP
10-Ks and 10-Qs
|
|
|
|
|
|
|
|
|
|
|
|
|
|
|
|
|
|
|
|
|
|
|
|
|
|
|
|
|
|
|
|
|
|
|
|
|
|
|
|
|
|
|
|
|
|
|
|
|
|
|
|
|
|
|
|
UNITED STATES
SECURITIES AND EXCHANGE COMMISSION
Washington, D.C. 20549
FORM 10-K
(Mark One)
|
ý
|
ANNUAL REPORT PURSUANT TO SECTION 13 OR 15(d) OF THE SECURITIES EXCHANGE ACT OF 1934
|
For the Fiscal Year Ended
December 31, 2015
OR
|
o
|
TRANSITION REPORT PURSUANT TO SECTION 13 OR 15(d) OF THE SECURITIES EXCHANGE ACT OF 1934
|
For the Transition Period From to
Commission File Number 1-15525
EDWARDS LIFESCIENCES CORPORATION
(Exact name of registrant as specified in its charter)
|
Delaware
|
|
36-4316614
|
|
(State or other jurisdiction of
incorporation or organization)
|
|
(I.R.S. Employer
Identification No.)
|
|
One Edwards Way, Irvine, California 92614
(Address of principal executive offices) (ZIP Code)
|
||
|
(949) 250-2500
Registrant's telephone number, including area code
|
||
|
Securities registered pursuant to Section 12(b) of the Act:
|
|
Name of each exchange on which registered:
|
|
Common Stock, par value $1.00 per share
|
|
New York Stock Exchange
|
|
Securities registered pursuant to Section 12(g) of the Act:
None
|
||
Indicate by check mark if the registrant is a well-known seasoned issuer, as defined by Rule 405 of the Securities Act. Yes
ý
No
o
Indicate by check mark if the registrant is not required to file reports pursuant to Section 13 or 15(d) of the Exchange Act. Yes
o
No
ý
Indicate by check mark whether the registrant (1) has filed all reports required to be filed by Section 13 or 15(d) of the Securities Exchange Act of 1934 during the preceding 12 months (or for such shorter period that the registrant was required to file such reports), and (2) has been subject to such filing requirements for the past 90 days. Yes
ý
No
o
Indicate by check mark whether the registrant has submitted electronically and posted on its corporate Web site, if any, every Interactive Data File required to be submitted and posted pursuant to Rule 405 of Regulation S-T (§232.405 of this chapter) during the preceding 12 months (or for such shorter period that the registrant was required to submit and post such files). Yes
ý
No
o
Indicate by check mark if disclosure of delinquent filers pursuant to Item 405 of Regulation S-K is not contained herein, and will not be contained, to the best of the registrant's knowledge, in definitive proxy or information statements incorporated by reference in Part III of this Form 10-K or any amendment to this Form 10-K.
ý
Indicate by check mark whether the registrant is a large accelerated filer, an accelerated filer, a non-accelerated filer, or a smaller reporting company. See the definitions of "large accelerated filer," "accelerated filer," and "smaller reporting company" in Rule 12b-2 of the Exchange Act. (Check one):
|
Large accelerated filer
ý
|
|
Accelerated filer
o
|
|
Non-accelerated filer
o
(Do not check if a smaller reporting company)
|
|
Smaller Reporting Company
o
|
Indicate by check mark whether the registrant is a shell company (as defined in Rule 12b-2 of the Exchange Act). Yes
o
No
ý
The aggregate market value of the registrant's common stock held by non-affiliates as of June 30,
2015
(the last trading day of the registrant's most recently completed second quarter): $15,189,354,669 based on the closing price of the registrant's common stock on the New York Stock Exchange. This calculation does not reflect a determination that persons are affiliates for any other purpose.
The number of shares outstanding of the registrant's common stock, $1.00 par value, as of
January 31, 2016
, was 214,597,594.
Documents Incorporated by Reference
Portions of the registrant's proxy statement for the
2016
Annual Meeting of Stockholders (to be filed within 120 days of
December 31, 2015
) are incorporated by reference into Part III, as indicated herein.
EDWARDS LIFESCIENCES CORPORATION
Form 10-K Annual Report—
2015
Table of Contents
|
|
|
|
|
|
|
|
|
|
|
|
|
|
|
|
This report contains forward-looking statements within the meaning of Section 27A of the Securities Act of 1933 and Section 21E of the Securities Exchange Act of 1934. We intend the forward-looking statements contained in this report to be covered by the safe harbor provisions of such Acts. All statements other than statements of historical fact in this report or referred to or incorporated by reference into this report are "forward-looking statements" for purposes of these sections. These statements include, among other things, any predictions of earnings, revenues, expenses or other financial items, plans or expectations with respect to development activities, clinical trials or regulatory approvals, any statements of plans, strategies and objectives of management for future operations, any statements concerning our future operations, financial conditions and prospects, and any statements of assumptions underlying any of the foregoing. These statements can sometimes be identified by the use of the forward-looking words such as "may," "believe," "will," "expect," "project," "estimate," "should," "anticipate," "plan," "goal," "continue," "seek," "pro forma," "forecast," "intend," "guidance," "optimistic," "aspire," "confident," other forms of these words or similar words or expressions or the negative thereof. Investors are cautioned not to unduly rely on such forward-looking statements. These forward-looking statements are subject to substantial risks and uncertainties that could cause our results or future business, financial condition, results of operations or performance to differ materially from the our historical results or experiences or those expressed or implied in any forward-looking statements contained in this report. See "Risk Factors" in Part I, Item 1A below for a further discussion of these risks, as well as our subsequent reports on Forms 10-Q and 8-K. These forward-looking statements speak only as of the date on which they are made and we do not undertake any obligation to update any forward-looking statement to reflect events or circumstances after the date of the statement. If we do update or correct one or more of these statements, investors and others should not conclude that we will make additional updates or corrections.
Overview
Edwards Lifesciences Corporation is the global medical technology leader in patient-focused innovations for structural heart disease and critical illness. Driven by a passion for patients, we collaborate with the world’s leading clinicians and researchers to address unmet needs in heart valves and critical care, helping to improve patient outcomes and save and enhance lives. A pioneer in the development of heart valve therapies, we are the world's leading manufacturer of heart valve systems and repair products used to replace or repair a patient's diseased or defective heart valve. Our innovative work in heart valves encompasses both surgical and transcatheter therapies for heart valve replacement. We are also a global leader in hemodynamic monitoring systems used to measure a patient's cardiovascular function in the hospital setting.
Cardiovascular disease is the number-one cause of death in the world, and is the top disease in terms of health care spending in nearly every country. Cardiovascular disease is progressive in that it tends to worsen over time and often affects the structure of
an individual's heart.
Patients undergoing treatment for cardiovascular disease can be treated with a number of our medical technologies. For example, an individual with a heart valve disorder may have a faulty valve that is affecting the function of their heart or blood flow throughout their body. A clinician may elect to remove the valve and replace it with one of our bioprosthetic surgical tissue heart valves, surgically re-shape and repair the faulty valve with an Edwards Lifesciences annuloplasty ring, or implant an Edwards Lifesciences transcatheter valve via a catheter-based system that does not require traditional open-heart surgery and can be done while the heart continues to beat. Patients in the hospital setting, including high-risk patients in the operating room or intensive care unit, are candidates for having their cardiac function or fluid levels monitored by our Critical Care products. These technologies enable proactive clinical decisions and may be important for improving diagnoses and developing individualized therapeutic management plans for patients.
Segment and Geographical Information
We conduct operations worldwide and are managed in the following geographical regions: United States, Europe, Japan, and Rest of World. All regions sell products that are used to treat advanced cardiovascular disease. Additional segment and geographical information is incorporated herein by reference to Note 18 to the "
Consolidated Financial Statements.
" See also the risk factor "
Our business is subject to economic, political, and other risks associated with international sales and operations, including risks arising from currency exchange rate fluctuations
" in Part I, Item 1A, "
Risk Factors
," for information regarding risks involving our international operations.
1
Corporate Background
Edwards Lifesciences Corporation was incorporated in Delaware on September 10, 1999. Unless otherwise indicated or otherwise required by the context, the terms "we," "our," "it," "its," "Company," "Edwards," and "Edwards Lifesciences" refer to Edwards Lifesciences Corporation and its subsidiaries.
Our principal executive offices are located at One Edwards Way, Irvine, California 92614. The telephone number at that address is (949) 250-2500. We make available, free of charge on our website located at www.edwards.com, our annual report on Form 10-K, quarterly reports on Form 10-Q, current reports on Form 8-K, and any amendments to those reports, as soon as reasonably practicable after filing such reports with the Securities and Exchange Commission ("SEC"). The contents of our website are not incorporated by reference into this report.
Edwards Lifesciences' Product and Technology Offerings
The following discussion summarizes the main areas of products and technologies we offer to treat advanced cardiovascular disease. These are categorized into three main areas: Transcatheter Heart Valve Therapy, Surgical Heart Valve Therapy, and Critical Care. For more information on net sales from these three main areas, see
"Net Sales by Product Group
" in Part II, Item 7 "
Management's Discussion and Analysis of Financial Condition and Results of Operations
."
Transcatheter Heart Valve Therapy
We have leveraged the knowledge and experience from our Surgical Heart Valve Therapy portfolio to optimize transcatheter heart valve replacement technology, designed for the nonsurgical replacement of heart valves. We produce pericardial valves from biologically inert animal tissue sewn onto proprietary wireform stents. The
Edwards SAPIEN
family of valves
,
including
Edwards SAPIEN XT
and
Edwards SAPIEN 3
transcatheter aortic heart valves and their respective delivery systems, are used to treat heart valve disease using catheter-based approaches for certain patients deemed at high risk for traditional open-heart surgery. Delivered while the heart is beating, these valves can enable patients to experience a better quality of life sooner than patients receiving traditional surgical therapies. We began offering our transcatheter heart valves to patients commercially in Europe in 2007, in the United States in 2011, and in Japan in 2013. As of
December 31, 2015
, our transcatheter aortic heart valves were available in more than 65 countries. Supported by extensive customer training and service, and a growing body of compelling clinical evidence, our
SAPIEN
family of transcatheter aortic heart valves are the most widely prescribed transcatheter heart valves in the world.
Sales of our transcatheter heart valves represented
47%
,
41%
, and
35%
of our net sales in
2015
,
2014
, and
2013
, respectively.
Surgical Heart Valve Therapy
The core of our surgical tissue heart valve product line is the
Carpentier-Edwards PERIMOUNT
pericardial valve platform, including the line of
PERIMOUNT Magna Ease
valves, the newest generation pericardial valves for aortic and mitral surgical valve replacement. With more long-term clinical publications on durability and performance than any other surgical valve,
PERIMOUNT
valves are the most widely implanted surgical tissue heart valves in the world. Our
EDWARDS INTUITY Elite Valve System,
which is available in Europe and is pending United States Food and Drug Administration ("FDA") approval in the United States, is a minimally invasive aortic heart valve system designed to enable faster procedures, shorter patient times on cardiopulmonary bypass, and smaller incisions. In addition to our replacement valves, we pioneered and are the worldwide leader in surgical heart valve repair therapies, including annuloplasty rings and systems. We are also a global leader in cardiac cannula devices and offer a variety of innovative procedure-enabling platforms to advance minimally invasive surgery.
Sales of our surgical tissue heart valve products represented 28%, 31%, and 34% of our net sales in
2015
,
2014
, and
2013
, respectively.
Critical Care
We are a world leader in hemodynamic monitoring systems used to measure a patient's heart function in surgical and intensive care settings. Hemodynamic monitoring enables a clinician to balance the supply and demand of oxygen in critically ill patients, and plays an important role in enhancing surgical recovery by enabling appropriate tissue and organ perfusion, and ultimately improving patient outcomes and survival. Our hemodynamic monitoring technologies are used before, during, and
2
after surgeries, such as open-heart, major vascular, major abdominal, neurological, and orthopedic surgical procedures; as well as for acutely ill patients with conditions such as sepsis, shock, acute respiratory distress syndrome, and multi-organ failure.
Edwards’ complete hemodynamic portfolio helps clinicians make proactive clinical decisions for their patients, and includes the minimally invasive
FloTrac
system and the noninvasive
ClearSight
system. Our hemodynamic monitoring portfolio also comprises the Swan
-Ganz
line of pulmonary artery catheters and the
PreSep
continuous venous oximetry catheter for measuring central venous oxygen saturation. Our
EV1000
clinical monitoring platform displays a patient's physiological status and integrates many of our sensors and catheters into one platform, giving clinicians multiple options to meet their clinical and patient needs.
We are also the global leader in disposable pressure monitoring devices and innovative closed blood sampling systems to help protect both patients and clinicians from the risk of infection.
Sales of our core hemodynamic products represented 13%, 15%, and 17% of our net sales in
2015
,
2014
, and
2013
, respectively.
We manufacture and sell a variety of peripheral vascular products used to treat endolumenal occlusive disease, including the
Fogarty
line of embolectomy catheters, which has been an industry standard for removing blood clots from peripheral blood vessels for more than 40 years.
Competition
The medical technology industry is highly competitive. We compete with many companies, including divisions of companies much larger than us and smaller companies that compete in specific product lines or certain geographies. Furthermore, new product development and technological change characterize the areas in which we compete. Our present or future products could be rendered obsolete or uneconomical as a result of technological advances by one or more of our present or future competitors or by other therapies, including drug therapies. We must continue to develop and commercialize new products and technologies to remain competitive in the cardiovascular medical technology industry. We believe that we compete primarily on the basis of clinical superiority supported by extensive data, and innovative features that enhance patient benefit, product performance, and reliability. Customer and clinical support, and cost-effectiveness are additional aspects of competition.
The cardiovascular segment of the medical technology industry is dynamic and subject to significant change due to cost-of-care considerations, regulatory reform, industry and customer consolidation, and evolving patient needs. The ability to provide products and technologies that demonstrate value and improve clinical outcomes is becoming increasingly important for medical technology manufacturers.
We believe that we are a leading global competitor in each of our product lines. In Transcatheter Heart Valve Therapy, our primary competitors include Medtronic PLC, Boston Scientific Corporation, St. Jude Medical, Inc., and Symetis SA. In Surgical Heart Valve Therapy, our primary competitors include Medtronic PLC, St. Jude Medical, Inc., and LivaNova PLC. In Critical Care, we compete primarily with a variety of companies in specific product lines including ICU Medical, Inc., PULSION Medical Systems SE, a subsidiary of Getinge AB, and LiDCO Group PLC.
Sales and Marketing
We have a number of broad product lines that require a sales and marketing strategy tailored to our customers in order to deliver high-quality, cost-effective products and technologies to all of our customers worldwide. Our portfolio includes some of the most recognizable product brands in cardiovascular devices today. To help broaden awareness of our products and technologies, we conduct educational symposia and provide training to our customers.
Because of the diverse global needs of the population that we serve, our distribution system consists of several direct sales forces as well as independent distributors. We are not dependent on any single customer and no single customer accounted for 10% or more of our net sales in
2015
.
Where we choose to market our products is also influenced by the existence of, or potential for, adequate reimbursement to hospitals by national healthcare systems. Sales personnel work closely with the customers who purchase our products, which primarily include physicians, nurses, and other clinical personnel, but can also include decision makers such as material managers, biomedical staff, hospital administrators and executives, purchasing managers, and ministries of health. Also, for certain of our products and where appropriate, our corporate sales team actively pursues approval of Edwards Lifesciences as a
3
qualified supplier for hospital group purchasing organizations ("GPOs") that negotiate contracts with suppliers of medical products. Additionally, we have contracts with a number of United States and European national and regional buying groups.
United States.
In the United States, we sell substantially all of our products through our direct sales forces. In
2015
,
51%
of our sales were derived from sales to customers in the United States.
International.
In
2015
,
49%
of our sales were derived internationally through our direct sales forces and independent distributors. Of the total international sales,
58%
were in Europe,
20%
were in Japan, and
22%
were in Rest of World. We sell our products in approximately 100 countries, and our major international markets include Australia, Canada, China, France, Germany, Italy, Japan, Spain, and the United Kingdom. A majority of the sales and marketing approach outside the United States is direct sales, although it varies depending on each country's size and state of development.
Raw Materials and Manufacturing
We operate manufacturing facilities in various geographies around the world. Our Transcatheter Heart Valve Therapy and Surgical Heart Valve Therapy products are manufactured primarily in the United States (California and Utah), Switzerland, and Singapore. Critical Care products are manufactured primarily in our facilities located in Puerto Rico and the Dominican Republic.
We use a diverse and broad range of raw and organic materials in the design, development, and manufacture of our products. Our non-implantable products are manufactured from man-made raw materials including resins, chemicals, electronics, and metals. Most of our Transcatheter Heart Valve Therapy and Surgical Heart Valve Therapy products are manufactured from natural tissues harvested from animal tissue, as well as man-made materials. We purchase certain materials and components used in manufacturing our products from external suppliers. In addition, we purchase certain supplies from single sources for reasons of quality assurance, sole source availability, cost effectiveness, or constraints resulting from regulatory requirements.
We work closely with our suppliers to mitigate risk and seek continuity of supply while maintaining uncompromised quality and reliability. Alternative supplier options are generally considered and identified, although we do not typically pursue immediate regulatory qualification of alternative sources due to the strength of our existing supplier relationships and the time and expense associated with the regulatory validation process.
We follow rigorous sourcing and manufacturing procedures intended to safeguard humans from potential risks associated with diseases such as bovine spongiform encephalopathy ("BSE"). We comply with all current global guidelines regarding risks for products intended to be implanted in humans. We obtain bovine tissue used in our pericardial tissue valve products only from sources within the United States and Australia, where strong control measures and surveillance programs exist. In addition, bovine tissue used in our pericardial tissue valve products is from tissue types considered by global health and regulatory organizations to have shown no risk of infectibility. Our manufacturing and sterilization processes are designed to render tissue biologically safe from all known infectious agents and viruses, and exceed the worldwide standard for sterile medical products.
Quality Assurance
We are committed to providing to our customers quality products that comply with the FDA and other applicable regulations. To meet this commitment, we have implemented modern quality systems and concepts throughout the organization. The quality system starts with the initial product specification and continues through the design of the product, component specification processes, and the manufacturing, sales, and servicing of the product. The quality system is intended to design quality into products and utilizes continuous improvement concepts, including Lean/Six Sigma principles, throughout the product lifecycle.
Our operations are inspected by the FDA and are designed to comply with all applicable international quality systems standards, including the International Organization for Standardization ("ISO") 13485. These standards require, among other items, quality system controls that are applied to product design, component material, suppliers, and manufacturing operations. These regulatory approvals and ISO certifications can be obtained only after a complete audit of a company's quality system has been conducted by regulatory or independent outside auditors. Periodic reexamination by an independent outside auditor is required to maintain these certifications.
4
Environmental, Health, and Safety
We are committed to providing a safe and healthy workplace, promoting environmental excellence in our communities, and complying with all relevant regulations and medical device industry standards. Through our corporate and site level Environmental, Health, and Safety functions, we establish and monitor programs to reduce pollution, prevent injuries, and maintain compliance. In order to measure performance, we monitor and report on a number of metrics, including regulated and non-regulated waste disposal, energy usage, water consumption, air toxic emissions, and injuries from our production activities. Each of our manufacturing sites is evaluated regularly with respect to a broad range of Environmental, Health, and Safety criteria.
Research and Development
We are engaged in ongoing research and development to deliver clinically advanced new products, to enhance the effectiveness, ease of use, safety, and reliability of our current leading products, and to expand the applications of our products as appropriate. We focus on opportunities within specific areas of structural heart disease and critical care monitoring, and we are dedicated to developing novel technologies to better enable clinicians to treat patients.
We invested
$383.1 million
in research and development in
2015
,
$346.5 million
in
2014
, and
$323.0 million
in
2013
(
15.4%
,
14.9%
, and
15.8%
of net sales, respectively). The majority of our research and development investment has been applied to strengthen our leadership position in transcatheter heart valve replacement technologies, surgical tissue heart valve and heart valve repair therapies, and hemodynamic monitoring products. We have also dedicated a sizable portion of our research and development investment to developing additional advanced technologies designed to address unmet clinical needs within our areas of strategic focus. A considerable portion of our research and development investment includes clinical trials and the collection of evidence that provide data for use in regulatory submissions, and required post-market approval studies involving applications of our products.
We are also making significant investments in the development of transcatheter heart valve technologies designed to treat mitral and tricuspid valve diseases and other structural heart conditions. In 2015, we acquired CardiAQ Valve Technologies ("CardiAQ"), a developer of a transcatheter mitral valve replacement ("TMVR") system. We believe the combination of our own TMVR experience with the efforts of CardiAQ will enable us to accelerate the development of a catheter-based therapy for patients with mitral valve disease who aren't well served today. In addition, we are also developing less-invasive technologies to address degenerative mitral regurgitation, tricuspid regurgitation, and left ventricular dysfunction.
Surgical Heart Valve Therapy development programs include the
EDWARDS INTUITY Elite Valve System
, a next-generation minimally invasive aortic heart valve system, and the
INSPIRIS
RESILIA
aortic valve, which incorporates a novel tissue designed to provide patients with a durable tissue valve alternative to mechanical valves.
In our Critical Care product line, we are pursuing the development of next-generation noninvasive and minimally invasive hemodynamic monitoring systems, including a next-generation hemodynamic monitor with wireless connectivity and an integrated semi-closed loop system for standardized management of patient fluid levels.
Our research and development activities are conducted primarily in facilities located in the United States, Israel, and the Netherlands. Our experienced research and development staff is focused on product design and development, quality, clinical research, and regulatory compliance. To pursue primary research efforts, we have developed alliances with several leading research institutions and universities, and also work with leading clinicians around the world in conducting scientific studies on our existing and developing products.
Proprietary Technology
Patents and other proprietary rights are important to the success of our business. We also rely upon trade secrets, know-how, continuing innovations, and licensing opportunities to develop and maintain our competitive position.
We own more than 2,700 issued United States patents, pending United States patent applications, issued foreign patents, and pending foreign patent applications. We also have licensed various United States and foreign patents and patent applications that relate to aspects of the technology incorporated in certain of our products, including our heart valves and annuloplasty rings. We also own or have rights in United States and foreign patents and patent applications in the field of transcatheter heart valve repair and replacement. In addition, we own or have rights in United States and foreign patents and patent applications that cover catheters, systems and methods for hemodynamic monitoring, and vascular access products.
5
We are a party to several license agreements with unrelated third parties pursuant to which we have obtained, for varying terms, the exclusive or non-exclusive rights to certain patents held by such third parties in consideration for cross-licensing rights and/or royalty payments. We have also licensed certain patent rights to others.
We monitor the products of our competitors for possible infringement of our owned and licensed patents. Litigation has been necessary to enforce certain patent rights held by us, and we plan to continue to defend and prosecute our rights with respect to such patents.
We own certain United States registered trademarks used in our business. Many of our trademarks have also been registered for use in certain foreign countries where registration is available and where we have determined it is commercially advantageous to do so.
Government Regulation and Other Matters
Our products and facilities are subject to regulation by numerous government agencies, including the U.S. FDA, European Community Notified Bodies, and the Japanese Pharmaceuticals and Medical Devices Agency, to confirm compliance with the various laws and regulations governing the development, testing, manufacturing, labeling, marketing, and distribution of our products. We are also governed by federal, state, local, and international laws of general applicability, such as those regulating employee health and safety, and the protection of the environment. Overall, the amount and scope of domestic and foreign laws and regulations applicable to our business is increasing.
United States Regulation.
In the United States, the FDA has responsibility for regulating medical devices. The FDA regulates design, development, testing, clinical studies, manufacturing, labeling, promotion, and record keeping for medical devices, and reporting of adverse events, recalls, or other field actions by manufacturers and users to identify potential problems with marketed medical devices. Many of the devices that we develop and market are in a category for which the FDA has implemented stringent clinical investigation and pre-market clearance or approval requirements. The process of obtaining FDA clearance or approval to market a product is resource intensive, lengthy, and costly. FDA review may involve substantial delays that adversely affect the marketing and sale of our products. A number of our products are pending regulatory clearance or approval to begin commercial sales in various markets. Ultimately, the FDA may not authorize the commercial release of a medical device if it determines the device is not safe and effective or does not meet other standards for clearance. Additionally, even if a product is cleared or approved, the FDA may require testing and surveillance programs to monitor the effects of these products once commercialized.
The FDA has the authority to halt the distribution of certain medical devices, detain or seize adulterated or misbranded medical devices, order the repair, replacement, or refund of the costs of such devices, or preclude the importation of devices that are or appear violative. The FDA also conducts inspections to determine compliance with the quality system regulations concerning the manufacturing and design of devices and current medical device reporting regulations, recall regulations, clinical testing regulations, and other requirements. The FDA may withdraw product clearances or approvals due to failure to comply with regulatory standards, or the occurrence of unforeseen problems following initial approval, and require notification of health professionals and others with regard to medical devices that present unreasonable risks of substantial harm to the public health. Additionally, the failure to comply with FDA or comparable regulatory standards or the discovery of previously unknown product problems could result in fines, delays, or suspensions of regulatory clearances or approvals, seizures, injunctions, recalls, refunds, civil money penalties, or criminal prosecution. Our compliance with applicable regulatory requirements is subject to continual review. Moreover, the FDA and several other United States agencies administer controls over the export of medical devices from the United States and the import of devices into the United States, which could also subject us to sanctions for noncompliance.
In May 2013, we received a warning letter from the Denver District Office of the FDA resulting from an inspection of our facility in Draper, Utah. The warning letter relates specifically to the execution of our quality systems at the Utah facility, including design and process validation, corrective and preventive actions, finished device acceptance, and packaging, and indicated that we would not receive pre-market approvals for devices reasonably related to those issues until the issues are resolved. Our Utah facility manufactures devices such as cannulae and cardioplegia catheters, heart valve repair rings, and transcatheter heart valve delivery system components and accessories. We are actively implementing the necessary actions to resolve these issues identified in the letter. In June 2014, we were granted a variance from the FDA for the
SAPIEN XT
delivery systems and components that are manufactured at the Draper facility and have completed the items under our agreed upon action plan for addressing the safety and effectiveness of their intended use.
6
We are also subject to additional laws and regulations that govern our business operations, products, and technologies, including:
|
•
|
federal, state, and foreign anti-kickback laws and regulations, which generally prohibit payments to physicians or other purchasers of medical products as an inducement to purchase a product;
|
|
•
|
the Stark law, which prohibits physicians from referring Medicare or Medicaid patients to a provider that bills these programs for the provision of certain designated health services if the physician (or a member of the physician's immediate family) has a financial relationship with that provider;
|
|
•
|
federal and state laws and regulations that protect the confidentiality of certain patient health information, including patient records, and restrict the use and disclosure of such information, in particular, the Health Insurance Portability and Accountability Act of 1996;
|
|
•
|
the Physician Payments Sunshine Act, which requires public disclosure of the financial relationships of United States physicians and teaching hospitals with applicable manufacturers, including medical device, pharmaceutical, and biologics companies;
|
|
•
|
the False Claims Act, which prohibits the submission of false or otherwise improper claims for payment to a federally funded health care program, and health care fraud statutes that prohibit false statements and improper claims to any third-party payor; and
|
|
•
|
the United States Foreign Corrupt Practices Act, which can be used to prosecute companies in the United States for arrangements with foreign government officials or other parties outside the United States.
|
Failure to comply with these laws and regulations could result in criminal liability, significant fines or penalties, negative publicity, and substantial costs and expenses associated with investigation and enforcement activities. To assist in our compliance efforts, we adhere to many codes of ethics and conduct regarding our sales and marketing activities in the United States and other countries in which we operate. In addition, we have in place a dedicated team to improve our internal business compliance programs and policies.
International Regulation.
Internationally, the regulation of medical devices is complex. In Europe, our products are subject to extensive regulatory requirements. The regulatory regime in the European Union for medical devices became mandatory in June 1998. It requires that medical devices may only be placed on the market if they do not compromise safety and health when properly installed, maintained, and used in accordance with their intended purpose. National laws conforming to the European Union's legislation regulate our products under the medical devices regulatory system. Although the more variable national requirements under which medical devices were formerly regulated have been substantially replaced by the European Union Medical Devices Directive, individual nations can still impose unique requirements that may require supplemental submissions. The European Union medical device laws require manufacturers to declare that their products conform to the essential regulatory requirements after which the products may be placed on the market bearing the CE Mark. Manufacturers' quality systems for products in all but the lowest risk classification are also subject to certification and audit by an independent notified body. In Europe, particular emphasis is being placed on more sophisticated and faster procedures for the reporting of adverse events to the competent authorities.
In Japan, pre-market approval and clinical studies are required as is governmental pricing approval for medical devices. Clinical studies are subject to a stringent "Good Clinical Practices" standard. Approval time frames from the Japanese Ministry of Health, Labour and Welfare vary from simple notifications to review periods of one or more years, depending on the complexity and risk level of the device. In addition, importation of medical devices into Japan is subject to the "Good Import Practices" regulations. As with any highly regulated market, significant changes in the regulatory environment could adversely affect future sales.
7
In many of the other foreign countries in which we market our products, we may be subject to regulations affecting, among other things:
|
•
|
product standards and specifications;
|
|
•
|
packaging requirements;
|
|
•
|
labeling requirements;
|
|
•
|
product collection and disposal requirements;
|
|
•
|
quality system requirements;
|
|
•
|
import restrictions;
|
|
•
|
tariffs;
|
|
•
|
duties; and
|
|
•
|
tax requirements.
|
Many of the regulations applicable to our devices and products in these countries are similar to those of the FDA. In some regions, the level of government regulation of medical devices is increasing, which can lengthen time to market and increase registration and approval costs. In many countries, the national health or social security organizations require our products to be qualified before they can be marketed and considered eligible for reimbursement.
Health Care Initiatives.
Government and private sector initiatives to limit the growth of health care costs, including price regulation and competitive pricing, coverage and payment policies, comparative effectiveness reviews, technology assessments, and managed-care arrangements, are continuing in many countries where we do business, including the United States, Europe, and Japan. As a result of these changes, the marketplace has placed increased emphasis on the delivery of more cost-effective medical therapies. For example, government programs, private health care insurance, and managed-care plans have attempted to control costs by restricting coverage and limiting the level of reimbursement for procedures or treatments, and some third-party payors require their pre-approval before new or innovative devices or therapies are utilized by patients. These various initiatives have created increased price sensitivity over medical products generally and may impact demand for our products and technologies.
The delivery of our products is subject to regulation by the Department of Health and Human Services ("HHS") in the United States and comparable state and foreign agencies responsible for reimbursement and regulation of health care items and services. Foreign governments also impose regulations in connection with their health care reimbursement programs and the delivery of health care items and services. Reimbursement schedules regulate the amount the United States government will reimburse hospitals and doctors for the inpatient care of persons covered by Medicare. HHS' Centers for Medicare & Medicaid Services ("CMS") may also review whether and/or under what circumstances a procedure or technology is reimbursable for Medicare beneficiaries. Changes in current reimbursement levels could have an adverse effect on market demand and our pricing flexibility.
Health care cost containment efforts have also prompted domestic hospitals and other customers of medical device manufacturers to consolidate into larger purchasing groups to enhance purchasing power, and this trend is expected to continue. The medical device industry has also experienced some consolidation, partly in order to offer a broader range of products to large purchasers. As a result, transactions with customers are larger, more complex, and tend to involve more long-term contracts than in the past. These larger customers, due to their enhanced purchasing power, may attempt to increase the pressure on product pricing.
Health Care Reform.
In 2010, significant reforms to the health care system were adopted as law in the United States. The law includes provisions that, among other things, reduce or limit Medicare reimbursement, require all individuals to have health insurance (with limited exceptions), and impose increased taxes. Specifically, the law requires the medical device industry to subsidize health care reform in the form of a 2.3% excise tax on United States sales of most medical devices. The excise tax, which increased our operating expenses, was suspended for calendar years 2016 and 2017, but is scheduled to resume in 2018. The long term impact of the payment reform provisions in the 2010 health care law remains uncertain to us as these programs continue to evolve. This law or any future legislation, including deficit reduction legislation, could reduce
8
medical procedure volumes, lower reimbursement for our products, and impact the demand for our products or the prices at which we sell our products.
Seasonality
Our quarterly net sales are influenced by many factors, including new product introductions, acquisitions, regulatory approvals, patient and physician holiday schedules, and other factors. Net sales in the third quarter are typically lower than other quarters of the year due to the seasonality of the United States and European markets, where summer vacation schedules normally result in fewer medical procedures.
Employees
As of
December 31, 2015
, we had approximately 9,800 employees worldwide, the majority of whom were located in the United States, the Dominican Republic, Singapore, and Puerto Rico. Other major concentrations of employees are located in Europe and Japan. We emphasize competitive compensation, benefits, equity participation, and a positive and attractive work environment in our efforts to attract and retain qualified personnel, and employ a rigorous talent management system. None of our North American employees are represented by a labor union. In various countries outside of North America, we interact with trade unions and work councils that represent a limited number of employees.
Our business and assets are subject to varying degrees of risk and uncertainty. An investor should carefully consider the risks described below, as well as other information contained in this Annual Report on Form 10-K and in our other filings with the SEC. Additional risks not presently known to us or that we currently deem immaterial may also adversely affect our business. If any of these events or circumstances occurs, our business, financial condition, results of operations, or prospects could be materially harmed. In that case, the value of our securities could decline and an investor could lose part or all of his or her investment. In addition, forward-looking statements within the meaning of the federal securities laws that are contained in this Annual Report on Form 10-K or in our other filings or statements may be subject to the risks described below as well as other risks and uncertainties. Please read the cautionary notice regarding forward-looking statements in Item 1, "Business," above.
Business and Operating Risks
If we do not introduce new products in a timely manner, our products may become obsolete and our operating results may suffer.
The cardiovascular products industry is characterized by technological changes, frequent new product introductions, and evolving industry standards. Without the timely introduction of new and improved products, our products could become technologically obsolete or more susceptible to competition and our revenue and operating results would suffer. Even if we are able to develop new or improved products, our ability to market them could be limited by the need for regulatory clearance, restrictions imposed on approved indications, entrenched patterns of clinical practice, uncertainty over third-party reimbursement, or other factors. We devote significant financial and other resources to our research and development activities; however, the research and development process is prolonged and entails considerable uncertainty. Accordingly, products we are currently developing may not complete the development process or obtain the regulatory or other approvals required to market such products in a timely manner or at all.
Technical innovations often require substantial time and investment before we can determine their commercial viability. We may not have the financial resources necessary to fund all of these projects. In addition, even if we are able to successfully develop new or improved products, they may not produce revenue in excess of the costs of development, and they may be rendered obsolete or less competitive by changing customer preferences or the introduction by our competitors of products with newer technologies or features or other factors.
We may experience supply interruptions that could harm our ability to manufacture products.
We use a broad range of raw and organic materials and other items in the design and manufacture of our products. Our Surgical and Transcatheter Heart Valve Therapy products are manufactured from treated natural animal tissue and man-made materials. Our non-implantable products are manufactured from man-made raw materials including resins, chemicals, electronics, and metals. We purchase certain of the materials and components used in the manufacture of our products from
9
external suppliers, and we purchase certain supplies from single sources for reasons of quality assurance, cost-effectiveness, availability, or constraints resulting from regulatory requirements. We also contract with third parties for important services related to infrastructure and information technology. General economic conditions could adversely affect the financial viability of our suppliers, resulting in their inability to provide materials and components used in the manufacture of our products. While we work closely with suppliers to monitor their financial viability, assure continuity of supply, and maintain high quality and reliability, these efforts may not be successful. In addition, due to the rigorous regulations and requirements of the FDA and foreign regulatory authorities regarding the manufacture of our products (including the need for approval of any change in supply arrangements), we may have difficulty establishing additional or replacement sources on a timely basis or at all if the need arises. Certain suppliers may also elect to no longer service medical device companies due to the high amount of requirements and regulation. Although alternative supplier options are considered and identified, we typically do not pursue regulatory qualification of alternative sources due to the strength of our existing supplier relationships and the time and expense associated with the regulatory validation process. A change in suppliers could require significant effort or investment in circumstances where the items supplied are integral to product performance or incorporate unique technology, and the loss of any existing supply contract could have a material adverse effect on us.
Regulatory agencies in the United States or other international geographies from time to time have limited or banned the use of certain materials used in the manufacture of our products. In these circumstances, transition periods typically provide time to arrange for alternative materials. In addition, the SEC enacted disclosure rules regarding products that may contain certain minerals that originate from conflict areas in and around the Democratic Republic of Congo. If our suppliers cannot verify that their components do not originate from these conflict areas, we may need to source components from alternative suppliers. If we are unable to identify alternative materials or suppliers and secure approval for their use in a timely manner, our business could be harmed.
Some of our suppliers are located outside the United States. As a result, trade or regulatory embargoes imposed by foreign countries or the United States could result in delays or shortages that could harm our business.
The manufacture of many of our products is highly complex and subject to strict quality controls. If we or one of our suppliers encounters manufacturing or quality problems, including as a result of natural disasters, our business could suffer.
The manufacture of many of our products is highly complex and subject to strict quality controls, due in part to rigorous regulatory requirements. In addition, quality is extremely important due to the serious and costly consequences of a product failure. Problems can arise during the manufacturing process for a number of reasons, including equipment malfunction, failure to follow protocols and procedures, raw material problems, software problems, or human error. Although closely managed, disruptions can occur during implementation of new equipment and systems to replace aging equipment, as well as during production line transfers and expansions. As we expand into new markets, we may face unanticipated surges in demand which could strain our production capacity. If these problems arise or if we otherwise fail to meet our internal quality standards or those of the FDA or other applicable regulatory body, which include detailed record-keeping requirements, our reputation could be damaged, we could become subject to a safety alert or a recall, we could incur product liability and other costs, product approvals could be delayed, and our business could otherwise be adversely affected.
In addition, our manufacturing facilities in California, Utah, the Dominican Republic, and Puerto Rico could be materially damaged by earthquakes, hurricanes, and other natural disasters or catastrophic circumstances. While we believe that our exposure to significant losses from a catastrophic disaster could be partially mitigated by our ability to manufacture some of our products at our other manufacturing facilities, the losses could have a material adverse effect on our business for an indeterminate period of time before this manufacturing transition is complete and operates without significant disruption.
We may be required, from time to time, to recognize charges in connection with the write-down of our assets or business dispositions or for other reasons.
From time to time, we identify operations and products that are not performing at a level commensurate with the rest of our business. We may seek to dispose of these underperforming operations or products. We may also seek to dispose of other operations or products for strategic or other business reasons. If we cannot dispose of an operation or product on acceptable terms, we may voluntarily cease operations related to that product. Any of these events could result in charges, which could be substantial and which could adversely affect our results of operations.
10
We may not successfully identify and complete acquisitions or strategic alliances on favorable terms or achieve anticipated synergies relating to any acquisitions or alliances, and such acquisitions could result in unforeseen operating difficulties and expenditures, require significant management resources, and require significant charges or write-downs.
We regularly explore potential acquisitions of complementary businesses, technologies, services, or products, as well as potential strategic alliances. We may be unable to find suitable acquisition candidates or appropriate partners with which to form alliances. Even if we identify appropriate acquisition or alliance candidates, we may be unable to complete the acquisitions or alliances on favorable terms, if at all. In addition, the process of integrating an acquired business, technology, service, or product into our existing operations could result in unforeseen difficulties and expenditures. Integration of an acquired company often requires significant expenditures as well as significant management resources that otherwise would be available for ongoing development of our other businesses. Moreover, we may not realize the anticipated financial or other benefits of an acquisition or alliance.
We may be required to take charges or write-downs in connection with acquisitions. In particular, acquisitions of businesses engaged in the development of new products may give rise to in-process research and development ("IPR&D") assets. To the extent that the value of these assets declines, we may be required to write down the value of the assets. Also, in connection with certain asset acquisitions, we may be required to take an immediate charge related to acquired IPR&D. Either of these situations could result in substantial charges, which could adversely affect our results of operations.
Future acquisitions could also involve the issuance of equity securities, the incurrence of debt, contingent liabilities, or amortization of expenses related to other intangible assets, any of which could adversely impact our financial condition or results of operations. In addition, equity or debt financing required for such acquisitions may not be available.
We face intense competition, and if we do not compete effectively, our business will be harmed.
The cardiovascular medical device industry is highly competitive. We compete with many companies, some of which are larger and have longer operating histories, better brand or name recognition, and broader product offerings. Our customers consider many factors when selecting a product, including product reliability, breadth of product line, clinical outcomes, product availability, price, availability and rate of reimbursement, and services provided by the manufacturer. In addition, our ability to compete will depend in large part on our ability to develop and acquire new products and technologies, anticipate technology advances, and keep pace with other developers of cardiovascular therapies and technologies. Our sales, technical, and other key personnel play an integral role in the development, marketing, and selling of new and existing products. If we are unable to recruit, hire, develop, and retain a talented, competitive workforce, our ability to compete may be adversely affected. Our competitive position can also be adversely affected by product problems, physician advisories, and safety alerts, reflecting the importance of quality in the medical device industry. Our position can shift as a result of any of these factors. See "
Competition
" under "
Business
" included herein.
Unsuccessful clinical trials or procedures relating to products under development could have a material adverse effect on our prospects.
The regulatory approval process for new products and new indications for existing products requires extensive clinical trials and procedures, including early clinical experiences and regulatory studies. Unfavorable or inconsistent clinical data from current or future clinical trials or procedures conducted by us, our competitors, or third parties, or perceptions regarding this clinical data, could adversely affect our ability to obtain necessary approvals and the market's view of our future prospects. Such clinical trials and procedures are inherently uncertain and there can be no assurance that these trials or procedures will be completed in a timely or cost-effective manner or result in a commercially viable product. Failure to successfully complete these trials or procedures in a timely and cost-effective manner could have a material adverse effect on our prospects. Clinical trials or procedures may experience significant setbacks even after earlier trials have shown promising results. Further, preliminary results from clinical trials or procedures may be contradicted by subsequent clinical analysis. In addition, results from our clinical trials or procedures may not be supported by actual long-term studies or clinical experience. If preliminary clinical results are later contradicted, or if initial results cannot be supported by actual long-term studies or clinical experience, our business could be adversely affected. Clinical trials or procedures may be suspended or terminated by us, the FDA, or other regulatory authorities at any time if it is believed that the trial participants face unacceptable health risks.
The success of many of our products depends upon strong relationships with certain key physicians.
The development, marketing, and sale of many of our products requires us to maintain working relationships with physicians upon whom we rely to provide considerable knowledge and experience. These physicians may assist us as researchers, marketing consultants, product trainers and consultants, inventors, and as public speakers. If new laws, regulations,
11
or other developments limit our ability to maintain strong relationships with these professionals or to continue to receive their advice and input, the development and marketing of our products could suffer, which could have a material adverse effect on our business, financial condition, and results of operations.
Market and Other External Risks
General economic and political conditions could have a material adverse effect on our business.
External factors can affect our profitability and financial condition. Such external factors include general domestic and global economic conditions, such as interest rates, tax rates, and factors affecting global economic stability, and the political environment regarding health care in general. The strength and timing of the current economic recovery remains uncertain, and we cannot predict to what extent the global economic conditions may negatively impact our business. For example, negative conditions in the credit and capital markets could impair our ability to access the financial markets for working capital or other funds, and could negatively impact our ability to borrow. An increase in interest rates could result in an increase in our borrowing costs and could otherwise restrict our ability to access the capital markets. Such conditions could result in decreased liquidity and impairments in the carrying value of our investments, and could adversely affect our results of operations and financial condition. These and other conditions could also adversely affect our customers, and may impact their ability or decision to purchase our products or make payments on a timely basis.
In 2010, significant reforms to the health care system were adopted as law in the United States. The law includes provisions that, among other things, reduce or limit Medicare reimbursement, require all individuals to have health insurance (with limited exceptions), and impose increased taxes. Specifically, the law requires the medical device industry to subsidize health care reform in the form of a 2.3% excise tax on United States sales of most medical devices. The excise tax, which increased our operating expenses, was suspended for calendar years 2016 and 2017, but is scheduled to resume in 2018. The long term impact of the payment reform provisions in the 2010 health care law remains uncertain to us as these programs continue to evolve. This law or any future legislation, including deficit reduction legislation, could adversely affect our results of operations, financial condition, and prospects if they were to impact the demand for our products or pricing, or result in cuts to, or a restructuring of, entitlement programs such as Medicare and Medicaid.
Our business is subject to economic, political, and other risks associated with international sales and operations, including risks arising from currency exchange rate fluctuations.
Because we sell our products in a number of countries, our business is subject to the risks of doing business internationally, including risks associated with anti-corruption and anti-bribery laws. Our net sales originating outside the United States, as a percentage of total net sales, were
49%
in
2015
. We anticipate that sales from international operations will continue to represent a substantial portion of our total sales. In addition, many of our manufacturing facilities and suppliers are located outside of the United States. Accordingly, our future results could be harmed by a variety of factors, including:
|
•
|
changes in local medical reimbursement policies and programs;
|
|
•
|
changes in foreign regulatory requirements;
|
|
•
|
changes in a specific country's or region's political or economic conditions, including changing circumstances in emerging regions, that may reduce the number of procedures that use our products;
|
|
•
|
trade protection measures, quotas, embargoes, import or export licensing requirements, and duties, tariffs, or surcharges;
|
|
•
|
potentially negative impact of tax laws, including transfer pricing liabilities and tax costs associated with the repatriation of cash;
|
|
•
|
difficulty in staffing and managing global operations;
|
|
•
|
cultural, exchange rate, or other local factors affecting financial terms with customers;
|
|
•
|
local economic and financial conditions, including sovereign defaults and decline in sovereign credit ratings, affecting the collectability of receivables, including receivables from sovereign entities;
|
|
•
|
an outbreak of any life-threatening communicable disease;
|
12
|
•
|
economic and political instability and local economic and political conditions;
|
|
•
|
differing labor regulations; and
|
|
•
|
differing protection of intellectual property.
|
Substantially all of our sales outside of the United States are denominated in local currencies. Measured in local currency, a substantial portion of our international sales was generated in Europe (and primarily denominated in the Euro) and in Japan. The United States dollar value of our international sales varies with currency exchange rate fluctuations. Decreases in the value of the United States dollar to the Euro or the Japanese yen have the effect of increasing our reported revenues even when the volume of international sales has remained constant. Increases in the value of the United States dollar relative to the Euro or the Japanese yen, as well as other currencies, have the opposite effect and, if significant, could have a material adverse effect on our revenues, cost of sales, and results of operations. We have a hedging program for certain currencies that attempts to manage currency exchange rate risks to an acceptable level based on management's judgment of the appropriate trade-off between risk, opportunity, and cost; however, this hedging program does not completely eliminate the effects of currency exchange rate fluctuations.
The United States Foreign Corrupt Practices Act, the United Kingdom Bribery Act, and similar laws in other jurisdictions contain prohibitions against bribery and other illegal payments, and make it an offense to fail to have procedures in place that prevent such payments. Recent years have seen an increasing number of investigations and other enforcement activities under these laws. Although we have compliance programs in place with respect to these laws, which may be used as a defense to prove we had adequate procedures, no assurance can be given that a violation will not be found, and if found, the resulting penalties could adversely affect us and our business.
The stock market can be volatile and fluctuations in our quarterly sales and operating results as well as other factors could cause our financial guidance to vary from actual results and our stock price to decline.
From time to time, the stock market experiences extreme price and volume fluctuations. This volatility can have a significant effect on the market prices of securities for reasons unrelated to underlying performance. These broad market fluctuations may materially adversely affect our stock price, regardless of our operating results. In addition, the market price of our common stock could fluctuate substantially in response to any of the other risk factors set out above and below, as well as a number of other factors, including the performance of comparable companies or the medical device industry, or changes in financial estimates and recommendations of securities analysts.
Our sales and operating results may vary significantly from quarter to quarter. A high proportion of our costs are fixed, due in part to significant selling, research and development, and manufacturing costs. Thus, small declines in revenue could disproportionately affect our operating results in a quarter, and the price of our common stock could fall. Other factors that could affect our quarterly sales and operating results include:
|
•
|
announcements of innovations, new products, strategic developments, or business combinations by us or our competitors;
|
|
•
|
demand for and clinical acceptance of products;
|
|
•
|
the timing and execution of customer contracts, particularly large contracts that would materially affect our operating results in a given quarter;
|
|
•
|
the timing of sales of products and of the introduction of new products;
|
|
•
|
the timing of marketing, training, and other expenses related to the introduction of new products;
|
|
•
|
the timing of regulatory approvals;
|
|
•
|
changes in foreign currency exchange rates;
|
|
•
|
delays or problems in introducing new products, such as slower than anticipated adoption of transcatheter heart valves;
|
13
|
•
|
changes in our pricing policies or the pricing policies of our competitors;
|
|
•
|
the timing of approvals of governmental reimbursement rates or changes in reimbursement rates for our products;
|
|
•
|
increased expenses, whether related to sales and marketing, raw materials or supplies, product development, or administration;
|
|
•
|
changes in the level of economic activity in the United States or other regions in which we do business;
|
|
•
|
costs related to acquisitions of technologies or businesses; and
|
|
•
|
our ability to expand our operations and the amount and timing of expansion-related expenditures.
|
The quarterly and full-year financial guidance we provide to investors and analysts with insight to our view of our future performance is based on assumptions about our sales and operating results. Due to the nature of our business and the numerous factors that can impact our sales and operating performance, including those described above, our financial guidance may vary from actual results. If we fail to meet any financial guidance that we provide, or if we find it necessary to revise such guidance during the year, the price of our common stock could decline.
Consolidation in the health care industry could have an adverse effect on our sales and results of operations.
The health care industry has been consolidating, and organizations such as GPOs, independent delivery networks, and large single accounts, such as the United States Veterans Administration, continue to consolidate purchasing decisions for many of our health care provider customers. As a result, transactions with customers are larger and more complex, and tend to involve more long-term contracts. The purchasing power of these larger customers has increased, and may continue to increase, causing downward pressure on product pricing. If we are not one of the providers selected by one of these organizations, we may be precluded from making sales to its members or participants. Even if we are one of the selected providers, we may be at a disadvantage relative to other selected providers that are able to offer volume discounts based on purchases of a broader range of medical equipment and supplies. Further, we may be required to commit to pricing that has a material adverse effect on our revenues, profit margins, business, financial condition, and results of operations. We expect that market demand, governmental regulation, third-party reimbursement policies, and societal pressures will continue to change the worldwide health care industry, resulting in further business consolidations and alliances, which may exert further downward pressure on the prices of our products and could adversely impact our business, financial condition, and results of operations.
If third-party payors decline to reimburse our customers for our products or impose other cost containment measures to reduce reimbursement levels, our ability to profitably sell our products will be harmed.
We sell our products and technologies to hospitals and other health care providers, all of which receive reimbursement for the health care services provided to patients from third-party payors, such as government programs (both domestic and international), private insurance plans, and managed care programs. The ability of customers to obtain appropriate reimbursement for their products from private and governmental third-party payors is critical to the success of medical technology companies. The availability of reimbursement affects which products customers purchase and the prices they are willing to pay. Reimbursement varies from country to country and can significantly impact acceptance of new products.
Third-party payors are increasingly attempting to contain health care costs by limiting both coverage and the level of reimbursement for medical products and services. There can be no assurance that levels of reimbursement, if any, will not be decreased in the future, or that future legislation, regulation, or reimbursement policies of third-party payors will not otherwise adversely affect the demand for and price levels of our products. The introduction of cost containment incentives, combined with closer scrutiny of health care expenditures by both private health insurers and employers, has resulted in increased discounts and contractual adjustments to hospital charges for services performed. Hospitals or physicians may respond to such cost-containment pressures by substituting lower cost products or other therapies. In addition, the 2010 United States health care law could adversely affect reimbursement levels for our products, or otherwise adversely affect our product pricing and profitability.
Initiatives to limit the growth of health care costs, including price regulation, are underway in several countries around the world. In many countries, customers are reimbursed for our products under a government operated insurance system. Under such a system, the government periodically reviews reimbursement levels and may limit patient access. If a government were to decide to reduce reimbursement levels, our product pricing could be adversely affected.
14
Third-party payors may deny reimbursement if they determine that a device used in a procedure was not used in accordance with cost-effective treatment methods as determined by such third-party payors, or was used for an unapproved indication. Third-party payors may also deny reimbursement for experimental procedures and devices. We believe that many of our existing products are cost-effective, even though the one-time cost may be significant, because they are intended to reduce overall health care costs over a long period of time. We cannot be certain that these third-party payors will recognize these cost savings instead of merely focusing on the lower initial costs associated with competing therapies. If our products are not considered cost-effective by third-party payors, our customers may not be reimbursed for them, resulting in lower sales of our products.
Legal, Compliance, and Regulatory Risks
We may incur product liability losses that could adversely affect our operating results.
Our business exposes us to potential product liability risks that are inherent in the design, manufacture, and marketing of medical devices. Our products are often used in surgical and intensive care settings with seriously ill patients. In addition, many of the medical devices we manufacture and sell are designed to be implanted in the human body for long periods of time. Component failures, manufacturing flaws, design defects, or inadequate disclosure of product-related risks or product-related information could result in an unsafe condition or injury to, or death of, patients. Such a problem could result in product liability lawsuits and claims, safety alerts, or product recalls in the future, which, regardless of their ultimate outcome, could have a material adverse effect on our business, reputation, and ability to attract and retain customers. Product liability claims may be brought from time to time either by individuals or by groups seeking to represent a class. We may incur charges related to such matters in excess of any established reserves and such charges, including the establishment of any such reserves, could have a material adverse impact on our net income and net cash flows.
Our inability to protect our intellectual property or failure to maintain the confidentiality and integrity of data or other sensitive company information, by cyber-attack or other event, could have a material adverse effect on our business.
Our success and competitive position are dependent in part upon our proprietary intellectual property. We rely on a combination of patents and trade secrets to protect our proprietary intellectual property, and we expect to continue to do so. Although we seek to protect our proprietary rights through a variety of means, we cannot guarantee that the protective steps we have taken are adequate to protect these rights. Patents issued to or licensed by us in the past or in the future may be challenged and held invalid. In addition, as our patents expire, we may be unsuccessful in extending their protection through patent term extensions. The expiration of, or the failure to maintain or extend our patents, could have a material adverse effect on us.
We also rely on confidentiality agreements with certain employees, consultants, and other third parties to protect, in part, trade secrets and other proprietary information. These agreements could be breached, and we may not have adequate remedies for such a breach. In addition, others could independently develop substantially equivalent proprietary information or gain access to our trade secrets or proprietary information.
Our intellectual property, other proprietary technology, and other sensitive company information is dependent on sophisticated information technology systems and is potentially vulnerable to cyber-attacks, loss, damage, destruction from system malfunction, computer viruses, loss of data privacy, or misappropriation or misuse of it by those with permitted access, and other events. While we have invested to protect our intellectual property and other information, and continue to work diligently to upgrade and enhance our systems to keep pace with continuing changes in information processing technology, there can be no assurance that our precautionary measures will prevent breakdowns, breaches, cyber-attacks, or other events. Such events could have a material adverse effect on our reputation, financial condition, or results of operations.
We spend significant resources to enforce our intellectual property rights, sometimes resulting in litigation. Intellectual property litigation is complex and can be expensive and time-consuming. However, our efforts in this regard may not be successful. We may not be able to detect infringement. In addition, competitors may design around our technology or develop competing technologies. Patent litigation can result in substantial cost and diversion of effort. Intellectual property protection may also be unavailable or limited in some foreign countries, enabling our competitors to capture increased market position. The invalidation of key intellectual property rights or an unsuccessful outcome in lawsuits filed to protect our intellectual property could have a material adverse effect on our financial condition, results of operations, or prospects.
15
Third parties may claim we are infringing their intellectual property, and we could suffer significant litigation or licensing expenses or be prevented from selling products.
During recent years, we and our competitors have been involved in substantial litigation regarding patent and other intellectual property rights in the medical device industry. From time to time, we have been and may in the future be forced to defend against claims and legal actions alleging infringement of the intellectual property rights of others, and such intellectual property litigation is typically costly and time-consuming. Adverse determinations in any such litigation could result in significant liabilities to third parties or injunctions, or could require us to seek licenses from third parties and, if such licenses are not available on commercially reasonable terms, prevent us from manufacturing, selling, or using certain products, any one of which could have a material adverse effect on us. In addition, some licenses may be non-exclusive, which could provide our competitors access to the same technologies.
Third parties could also obtain patents that may require us to either redesign products or, if possible, negotiate licenses from such third parties. Such licenses may materially increase our expenses. If we are unable to redesign products or obtain a license, we might have to exit a particular product offering.
We and our customers are subject to rigorous governmental regulations and we may incur significant expenses to comply with these regulations and develop products that are compatible with these regulations. In addition, failure to comply with these regulations could subject us to substantial sanctions which could adversely affect our business, results of operations, and financial condition.
The medical technologies we manufacture and market are subject to rigorous regulation by the FDA and numerous other federal, state, and foreign governmental authorities, including regulations that cover the composition, labeling, testing, clinical study, design, sourcing, manufacturing, packaging, marketing, advertising, promotion, and distribution of our products.
We are required to register with the FDA as a device manufacturer. As a result, we are subject to periodic inspection by the FDA for compliance with the FDA's Quality System Regulation ("QSR") requirements, which require manufacturers of medical devices to adhere to certain regulations, including testing, design, quality control, and documentation procedures. The FDA may also inspect our compliance with requirements related to adverse event reporting, recalls or corrections (field actions), the conduct of clinical studies, and other requirements. In the European Union, we are required to maintain certain CE Mark and ISO certifications in order to sell our products, and are subject to periodic inspections by notified bodies to obtain and maintain these certifications. If we or our suppliers fail to adhere to QSR, CE Mark, ISO, or similar requirements, this could delay or interrupt product production or sales and/or lead to fines, difficulties in obtaining regulatory clearances, recalls, or other consequences, which in turn could have a material adverse effect on our financial condition and results of operations or prospects.
Medical devices must receive FDA clearance or approval before they can be commercially marketed in the United States. In addition, the FDA may require testing and surveillance programs to monitor the effects of approved products that have been commercialized, and can prevent or limit further marketing of a product based upon the results of post-marketing programs. In addition, the federal Medical Device Reporting regulations require us to provide information to the FDA whenever there is evidence that reasonably suggests that a device may have caused or contributed to a death or serious injury or, if a malfunction were to occur, would be likely to cause or contribute to a death or serious injury. Federal regulations also require us to report certain recalls or corrective actions to the FDA. Furthermore, most major markets for medical devices outside the United States require clearance, approval, or compliance with certain standards before a product can be commercially marketed. The process of obtaining regulatory clearances or approvals to market a medical device, particularly from the FDA and certain foreign governmental authorities, can be costly and time-consuming, and clearances or approvals may not be granted for products or product improvements on a timely basis, if at all. Delays in receipt of, or failure to obtain, clearances or approvals for products or product improvements could result in delayed realization of product revenues or in substantial additional costs, which could have a material adverse effect on our business or results of operations or prospects. At any time after approval of a product for commercial sale, the FDA may conduct periodic inspections to determine compliance with QSR requirements, and/or current Medical Device Reporting regulations, or other regulatory requirements. Noncompliance with applicable requirements may subject us or responsible individuals to sanctions including civil money penalties, product seizure, injunction, or criminal prosecution. In addition, the FDA may withhold or delay pre-market approval of our products until the noncompliance is resolved. Product approvals by the FDA can also be withdrawn due to failure to comply with regulatory standards or the occurrence of unforeseen problems following initial approval.
Regulatory agencies in the United States or other international geographies from time to time limit or ban the use of certain materials used in the manufacture of our products, require collection and disposal of products at the end of their
16
lifecycle, and require disclosure of the origin of certain raw materials in our products. Noncompliance with applicable requirements could have a material adverse effect on our business.
The United States Physician Payment Sunshine Act, and similar laws in other jurisdictions, also impose reporting and disclosure requirements on device, pharmaceutical, and biologics companies for certain financial relationships with United States health care providers and teaching hospitals. Failure to submit required information or submitting incorrect information may result in significant civil monetary penalties.
We are also subject to various United States and international laws pertaining to health care pricing, anti-corruption, and fraud and abuse, including prohibitions on kickbacks and the submission of false claims laws and restrictions on relationships with physicians and other referral sources. These laws are broad in scope and are subject to evolving interpretation, which could require us to incur substantial costs to monitor compliance or to alter our practices if we are found not to be in compliance. Violations of these laws may be punishable by criminal or civil sanctions against us and our officers and employees, including substantial fines, imprisonment, and exclusion from participation in governmental health care programs.
Despite our implementation of robust compliance processes, we may be subject, from time to time, to inspections, investigations, and other enforcement actions by governmental authorities. If we are found not to be in compliance with applicable laws or regulations, the applicable governmental authority can impose fines, delay, suspend, or revoke regulatory clearances or approvals, institute proceedings to detain or seize our products, issue a recall, impose marketing or operating restrictions, enjoin future violations and assess civil penalties against us or our officers or employees, and institute criminal prosecution. Moreover, governmental authorities can ban or request the recall, repair, replacement, or refund of the cost of any device or product we manufacture or distribute. Any of the foregoing actions could result in decreased sales as a result of negative publicity and product liability claims, and could have a material adverse effect on our financial condition, results of operations, and prospects. In addition to the sanctions for noncompliance described above, commencement of an enforcement proceeding, inspection, or investigation could divert substantial management attention from the operation of our business and have an adverse effect on our business, results of operations, and financial condition.
Our industry is experiencing greater scrutiny and regulation by governmental authorities, which may lead to greater governmental regulation in the future.
In recent years, the medical device industry has been subject to increased regulatory scrutiny, including by the FDA, numerous other federal, state, and foreign governmental authorities, as well as members of Congress. This has included increased regulation, enforcement, inspections, and governmental investigations of the medical device industry and disclosure of financial relationships with health care professionals. We anticipate that the government will continue to scrutinize our industry closely, and that additional regulation by governmental authorities, both foreign and domestic, may increase compliance costs, exposure to litigation, and other adverse effects to our operations.
We are subject to risks arising from concerns and/or regulatory actions relating to “mad cow disease.”
Certain of our products, including pericardial tissue valves, are manufactured using bovine tissue. Concerns relating to the potential transmission of BSE, commonly known as "mad cow disease," from cows to humans may result in reduced acceptance of products containing bovine materials. Certain medical device regulatory agencies have considered whether to continue to permit the sale of medical devices that incorporate bovine material. We obtain bovine tissue only from closely controlled sources within the United States and Australia. The bovine tissue used in our pericardial tissue valves is from tissue types considered by global health and regulatory organizations to have shown no risk of infectibility for the suspected BSE infectious agent. We have not experienced any significant adverse impact on our sales as a result of concerns regarding BSE, but no assurance can be given that such an impact may not occur in the future.
Use of our products in unapproved circumstances could expose us to liabilities.
The marketing approval from the FDA and other regulators of certain of our products are, or are expected to be, limited to specific indications. We are prohibited from marketing or promoting any unapproved use of our products. Physicians, however, can use these products in ways or circumstances other than those strictly within the scope of the regulatory approval. Although the product training we provide to physicians and other health care professionals is limited to approved uses or for clinical trials, no assurance can be given that claims might not be asserted against us if our products are used in ways or for procedures that are not approved.
17
Our operations are subject to environmental, health, and safety regulations that could result in substantial costs.
Our operations are subject to environmental, health, and safety laws, and regulations concerning, among other things, the generation, handling, transportation, and disposal of hazardous substances or wastes, the cleanup of hazardous substance releases, and emissions or discharges into the air or water. We have incurred and may incur expenditures in the future in connection with environmental, health and safety laws, and regulations. New laws and regulations, violations of these laws or regulations, stricter enforcement of existing requirements, or the discovery of previously unknown contamination could require us to incur costs or could become the basis for new or increased liabilities that could be material.
None.
The locations and uses of our major properties are as follows:
|
North America
|
|
|
|
|
|
Irvine, California
|
(1
|
)
|
Corporate Headquarters, Research and Development, Regulatory and Clinical Affairs, Manufacturing, Administration
|
|
|
Draper, Utah
|
(1
|
)
|
Administration, Manufacturing
|
|
|
Haina, Dominican Republic
|
(2
|
)
|
Manufacturing
|
|
|
Añasco, Puerto Rico
|
(2
|
)
|
Manufacturing
|
|
|
Europe
|
|
|
|
|
|
Horw, Switzerland
|
(2
|
)
|
Manufacturing, Administration
|
|
|
Nyon, Switzerland
|
(1
|
)
|
Administration, Marketing
|
|
|
Prague, Czech Republic
|
(2
|
)
|
Administration
|
|
|
Asia
|
|
|
|
|
|
Tokyo, Japan
|
(2
|
)
|
Administration, Marketing, Distribution
|
|
|
Shanghai, China
|
(2
|
)
|
Administration
|
|
|
Singapore
|
(1),(2)
|
|
Manufacturing, Marketing, Distribution, Administration
|
|
_______________________________________________________________________________
|
(1)
|
Owned property.
|
|
(2)
|
Leased property.
|
The Dominican Republic property has one lease that expires in 2018 and one that expires in 2022; the Puerto Rico property has one lease that expires in 2016 and one that expires in 2018; the Horw, Switzerland lease expires in 2017; the Prague, Czech Republic lease expires in 2018; the Tokyo, Japan lease expires in 2018; the Shanghai, China lease expires in 2018; and Singapore has one land lease that expires in 2036 and one that expires in 2041. We believe our properties have been well maintained, are in good operating condition, and are adequate for current needs.
For a description of our material pending legal proceedings, please see Note 17 to the "
Consolidated Financial Statements
" of this Annual Report on Form 10-K, which is incorporated by reference.
Not applicable.
18
Market Price
The principal market for our common stock is the New York Stock Exchange (the "NYSE"). The table below sets forth, for the calendar quarters indicated, the high and low closing prices, as adjusted for the two-for-one stock split paid on December 11, 2015 to shareholders of record on November 30, 2015, of our common stock, as reported by the NYSE.
|
|
2015
|
2014
|
|||||||||||||
|
|
High
|
Low
|
High
|
Low
|
|||||||||||
|
Calendar Quarter Ended:
|
|
|
|
|
|
|
|
|
|||||||
|
March 31
|
$
|
75.21
|
|
$
|
61.99
|
|
$
|
37.81
|
|
$
|
31.52
|
|
|||
|
June 30
|
73.65
|
|
61.38
|
|
44.10
|
|
36.40
|
|
|||||||
|
September 30
|
79.50
|
|
62.53
|
|
52.35
|
|
42.03
|
|
|||||||
|
December 31
|
83.43
|
|
70.32
|
|
67.14
|
|
48.54
|
|
|||||||
Number of Stockholders
On January 31,
2016
, there were 12,098 stockholders of record of our common stock.
Dividends
We have never paid any cash dividends on our capital stock and have no current plans to pay any cash dividends. Our current policy is to retain any future earnings for use in our business.
Issuer Purchases of Equity Securities
|
Period
|
Total Number
of Shares
(or Units)
Purchased (a)
|
Average
Price Paid
per Share
(or Unit) (b)
|
Total Number of
Shares (or Units)
Purchased as Part of Publicly Announced Plans or Programs
|
Maximum Number
(or Approximate
Dollar Value) of
Shares that
May Yet Be
Purchased
Under the Plans
or Programs
(in millions) (c)
|
|||||||||||||
|
October 1, 2015 through October 31, 2015
|
154
|
|
$
|
72.21
|
|
—
|
|
$
|
777.5
|
|
|||||||
|
November 1, 2015 through November 30, 2015
|
—
|
|
—
|
|
—
|
|
777.5
|
|
|||||||||
|
December 1, 2015 through December 31, 2015
|
1,240,262
|
|
80.61
|
|
1,240,262
|
|
677.5
|
|
|||||||||
|
Total
|
1,240,416
|
|
80.61
|
|
1,240,262
|
|
|||||||||||
_______________________________________________________________________________
|
(a)
|
The difference between the total number of shares (or units) purchased and the total number of shares (or units) purchased as part of publicly announced plans or programs is due to shares withheld by us to satisfy tax withholding obligations in connection with the vesting of restricted stock units issued to employees.
|
|
(b)
|
The two-for-one stock split paid on December 11, 2015 excluded treasury shares. However, because some purchases of treasury shares were at post-split prices, for consistency, we calculated the average price paid per share for all shares repurchased during the quarter based on post-split market prices.
|
|
(c)
|
On May 14, 2013, the Board of Directors approved a stock repurchase program authorizing us to purchase on the open market, including pursuant to a Rule 10b5-1 plan, and in privately negotiated transactions, up to $750.0 million of our common stock from time to time until December 31, 2016. During the fourth quarter of 2015, we exhausted the share repurchase authorization under this May 2013 program On July 10, 2014, the Board of Directors approved a new stock repurchase program without a specified end date providing for an additional $750.0 million of repurchases of our common
|
19
stock. Pursuant to our authorized share repurchase programs, we may repurchase from time to time shares of our common stock in the open market, pursuant to privately negotiated transactions, and enter into accelerated share repurchase transactions to effect repurchases of our common stock.
Performance Graph
The following graph compares the performance of our common stock with that of the S&P 500 Index and the S&P 500 Healthcare Equipment Index. The cumulative total return listed below assumes an initial investment of $100 on December 31,
2010
and reinvestment of dividends. All prices presented have been retroactively adjusted to reflect the two-for-one stock split paid on December 11, 2015 to shareholders of record on November 30, 2015.

|
Total Cumulative Return
|
2011
|
2012
|
2013
|
2014
|
2015
|
||||||||||||||
|
Edwards Lifesciences
|
$
|
87.46
|
|
$
|
111.54
|
|
$
|
81.35
|
|
$
|
157.57
|
|
$
|
195.40
|
|
||||
|
S&P 500
|
102.11
|
|
118.45
|
|
156.82
|
|
178.29
|
|
180.75
|
|
|||||||||
|
S&P 500 Healthcare Equipment Index
|
106.02
|
|
124.33
|
|
157.80
|
|
193.86
|
|
204.79
|
|
|||||||||
20
|
|
|
As of or for the Years Ended December 31,
|
||||||||||||||||||
|
|
|
2015
|
2014
|
2013
|
2012
|
2011
|
||||||||||||||
|
|
|
(in millions, except per share data)
|
||||||||||||||||||
|
OPERATING RESULTS
|
Net sales
|
$
|
2,493.7
|
|
$
|
2,322.9
|
|
$
|
2,045.5
|
|
$
|
1,899.6
|
|
$
|
1,678.6
|
|
||||
|
Gross profit
|
1,876.5
|
|
1,697.3
|
|
1,528.9
|
|
1,408.6
|
|
1,189.2
|
|
||||||||||
|
Net income(a)
|
494.9
|
|
811.1
|
|
389.1
|
|
291.5
|
|
236.6
|
|
||||||||||
|
COMMON STOCK INFORMATION
|
Net income per common share(a)(c):
|
|
|
|
|
|
|
|
|
|
|
|||||||||
|
Basic
|
$
|
2.30
|
|
$
|
3.81
|
|
$
|
1.74
|
|
$
|
1.27
|
|
$
|
1.03
|
|
|||||
|
Diluted
|
2.25
|
|
3.74
|
|
1.71
|
|
1.23
|
|
0.99
|
|
||||||||||
|
Cash dividends declared per common share
|
—
|
|
—
|
|
—
|
|
—
|
|
—
|
|
||||||||||
|
BALANCE SHEET DATA
|
Total assets
|
$
|
4,059.3
|
|
$
|
3,523.0
|
|
$
|
2,709.9
|
|
$
|
2,209.3
|
|
$
|
1,970.0
|
|
||||
|
Long-term debt(b)
|
599.9
|
|
598.1
|
|
593.1
|
|
189.3
|
|
150.4
|
|
||||||||||
_______________________________________________________________________________
|
(a)
|
The above results include special charges of
$70.7 million
and
$16.3 million
during
2014
and
2013
, respectively. In addition, the above results include $750.0 million ($487.9 million, net of tax) in 2014 for an upfront payment received under a litigation settlement agreement, and $83.6 million ($52.3 million, net of tax) received in 2013 for a litigation award. See
"Management's Discussion and Analysis of Financial Condition and Results of Operations
" and Note 3 and Note 4 to the
"Consolidated Financial Statements"
for additional information.
|
|
(b)
|
In October 2013, we issued $600.0 million of 2.875% fixed-rate unsecured senior notes due October 15, 2018 ("the Notes").
|
|
(c)
|
The per share amounts for the prior periods presented have been retroactively adjusted to reflect the two-for-one stock split effected in the fourth quarter of 2015.
|
The following discussion and analysis presents the factors that had a material effect on our results of operations during the three years ended
December 31, 2015
. Also discussed is our financial position as of
December 31, 2015
. You should read this discussion in conjunction with the historical consolidated financial statements and related notes included elsewhere in this Form 10-K.
Overview
We are the global leader in the science of heart valves and hemodynamic monitoring. Driven by a passion to help patients, we partner with clinicians to develop innovative technologies in the areas of structural heart disease and critical care monitoring, enabling them to save and enhance lives. We conduct operations worldwide and are managed in the following geographical regions: United States, Europe, Japan, and Rest of World. Our products are categorized into the following main areas: Transcatheter Heart Valve Therapy ("THV"), Surgical Heart Valve Therapy, and Critical Care.
On November 19, 2015, our Board of Directors declared a two-for-one stock split of our outstanding shares of common stock effected in the form of a stock dividend, paid on December 11, 2015 to shareholders of record on November 30, 2015. We distributed newly issued shares to effect the stock split. All applicable share and per-share amounts in this “
Management’s Discussion and Analysis of Financial Condition and Results of Operations”
have been retroactively adjusted to give effect to this stock split.
21
Financial Results
The following is a summary of our financial performance (dollars in millions, except per share data):
|
|
Years Ended December 31,
|
Change
|
|
|||||||||||||||
|
|
2015
|
2014
|
2013
|
2015
|
|
2014
|
|
|||||||||||
|
Net sales
|
$
|
2,493.7
|
|
$
|
2,322.9
|
|
$
|
2,045.5
|
|
7.4
|
%
|
13.6
|
%
|
|||||
|
Gross profit as a percentage of net sales
|
75.2
|
%
|
73.1
|
%
|
74.7
|
%
|
2.1
|
|
pts.
|
(1.6
|
)
|
pts.
|
||||||
|
Net income
|
$
|
494.9
|
|
$
|
811.1
|
|
$
|
389.1
|
|
(39.0
|
)%
|
108.5
|
%
|
|||||
|
Diluted earnings per share
|
$
|
2.25
|
|
$
|
3.74
|
|
$
|
1.71
|
|
(39.8
|
)%
|
118.7
|
%
|
|||||
Our sales growth was led by our THV products, which benefited from the launch of the
Edwards SAPIEN XT
transcatheter heart valve in the United States (June 2014), and the launches of the
Edwards SAPIEN 3
transcatheter heart valve in Europe (January 2014) and in the United States (July 2015). Our gross profit as a percentage of net sales was positively impacted in 2015 by foreign currency exchange rate fluctuations (which had a negative impact to gross profit in 2014) and an improved product mix, led by THV products. Net income in 2014 benefited from the receipt of $750.0 million ($487.9 million, net of tax) from Medtronic, Inc. ("Medtronic") for an upfront payment due under a litigation settlement agreement.
Healthcare Environment, Opportunities, and Challenges
The medical technology industry is highly competitive and continues to evolve. Our success is measured both by the development of innovative therapies and the value they bring to our stakeholders. We are committed to developing new technologies and providing innovative patient care, and we are committed to defending our intellectual property in support of those developments. To strengthen our leadership and enable future growth opportunities, in
2015
we invested
15.4%
of our net sales in research and development. In a consolidating industry, we believe our focus on innovation and a robust product pipeline of meaningful new technologies will help us continue to be a preferred partner, sustain our successes, and build long-term value for our shareholders. The following is a summary of important developments during
2015
:
|
•
|
final five-year clinical data for high-risk patients treated with the first-generation
SAPIEN
transcatheter aortic valve in The PARTNER Trial demonstrated equivalent outcomes to traditional open-heart surgery, and no structural valve deterioration requiring intervention;
|
|
•
|
30-day outcomes for intermediate-risk patients treated transfemorally with the
SAPIEN 3
transcatheter aortic valve at centers in Europe and Canada demonstrated very low mortality and stroke rates;
|
|
•
|
high-risk patients who received the advanced
Edwards SAPIEN 3
transcatheter aortic valve via transfemoral delivery had high one-year survival rates, as well as low rates of stroke and paravalvular leak;
|
|
•
|
we received FDA approval of the
Edwards SAPIEN 3
valve with the Commander Delivery System for the treatment of high-risk patients suffering from severe, symptomatic aortic stenosis;
|
|
•
|
we acquired CardiAQ, a privately-held company and developer of a transcatheter mitral valve replacement system; and
|
|
•
|
we received FDA approval for aortic valve-in-valve procedures using the
Edwards SAPIEN XT
transcatheter heart valve.
|
We are dedicated to generating robust clinical and economic evidence increasingly expected by patients, clinicians, and payors in the current healthcare environment, with the goal of encouraging the adoption of innovative new medical therapies that demonstrate superior outcomes.
22
Results of Operations
Net Sales by Major Regions
(dollars in millions)
|
|
Years Ended December 31,
|
Change
|
Percent Change
|
||||||||||||||||||||||
|
|
2015
|
2014
|
2013
|
2015
|
2014
|
2015
|
|
2014
|
|||||||||||||||||
|
United States
|
$
|
1,262.9
|
|
$
|
1,047.3
|
|
$
|
939.6
|
|
$
|
215.6
|
|
$
|
107.7
|
|
20.6
|
%
|
11.5
|
%
|
||||||
|
Europe
|
717.3
|
|
744.5
|
|
616.5
|
|
(27.2
|
)
|
128.0
|
|
(3.6
|
)%
|
20.8
|
%
|
|||||||||||
|
Japan
|
246.2
|
|
257.9
|
|
243.6
|
|
(11.7
|
)
|
14.3
|
|
(4.6
|
)%
|
5.9
|
%
|
|||||||||||
|
Rest of World
|
267.3
|
|
273.2
|
|
245.8
|
|
(5.9
|
)
|
27.4
|
|
(2.1
|
)%
|
11.2
|
%
|
|||||||||||
|
International
|
1,230.8
|
|
1,275.6
|
|
1,105.9
|
|
(44.8
|
)
|
169.7
|
|
(3.5
|
)%
|
15.3
|
%
|
|||||||||||
|
Total net sales
|
$
|
2,493.7
|
|
$
|
2,322.9
|
|
$
|
2,045.5
|
|
$
|
170.8
|
|
$
|
277.4
|
|
7.4
|
%
|
13.6
|
%
|
||||||
International net sales include the impact of foreign currency exchange rate fluctuations. The impact of foreign currency exchange rate fluctuations on net sales is not necessarily indicative of the impact on net income due to the corresponding effect of foreign currency exchange rate fluctuations on international manufacturing and operating costs and our hedging activities. For more information see
"Quantitative and Qualitative Disclosures About Market Risk."
Net Sales by Product Group
(dollars in millions)
|
|
Year Ended December 31,
|
Change
|
Percent Change
|
||||||||||||||||||||||
|
|
2015
|
|
2014
|
2013
|
2015
|
2014
|
2015
|
|
2014
|
||||||||||||||||
|
Transcatheter Heart Valve Therapy
|
$
|
1,180.3
|
|
|
$
|
943.6
|
|
|
$
|
707.7
|
|
$
|
236.7
|
|
$
|
235.9
|
|
25.1
|
%
|
33.3
|
%
|
||||
|
Surgical Heart Valve Therapy
|
785.0
|
|
|
826.1
|
|
|
801.2
|
|
(41.1
|
)
|
24.9
|
|
(5.0
|
)%
|
3.1
|
%
|
|||||||||
|
Critical Care
|
528.4
|
|
|
553.2
|
|
|
536.6
|
|
(24.8
|
)
|
16.6
|
|
(4.5
|
)%
|
3.1
|
%
|
|||||||||
|
Total net sales
|
$
|
2,493.7
|
|
|
$
|
2,322.9
|
|
|
$
|
2,045.5
|
|
$
|
170.8
|
|
$
|
277.4
|
|
7.4
|
%
|
13.6
|
%
|
||||
Transcatheter Heart Valve Therapy
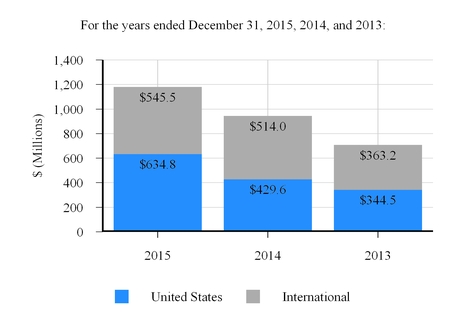
2015 Compared with 2014
The increase in net sales of THV products in the
United States
was due primarily to:
|
•
|
the
Edwards SAPIEN 3
valve, driven by its launch in July 2015; and
|
23
|
•
|
the
Edwards SAPIEN XT
valve, driven by its launch in June 2014;
|
partially offset by:
|
•
|
lower sales of the
Edwards SAPIEN
valve as customers converted to
Edwards SAPIEN XT.
|
The increase in
international
net sales of THV products was due primarily to:
|
•
|
the
Edwards SAPIEN 3
valve, driven primarily by its launch in Europe in January 2014; and
|
|
•
|
the
Edwards SAPIEN XT
valve in Japan, driven by its launch in October 2013;
|
partially offset by:
|
•
|
lower sales of the
Edwards SAPIEN XT
valve in Europe, as customers converted to
Edwards SAPIEN 3
; and
|
|
•
|
foreign currency exchange rate fluctuations, which decreased net sales by
$71.2 million
, due primarily to the weakening of the Euro against the United States dollar.
|
2014 Compared with 2013
The increase in net sales of THV products in the United States was due primarily to:
|
•
|
the
Edwards SAPIEN XT
valve, driven primarily by its launch in June 2014;
|
|
•
|
clinical sales of the
Edwards SAPIEN 3
valve; and
|
|
•
|
royalties received under a license agreement with Medtronic (see Note 3 to the "
Consolidated Financial Statements
").
|
Sales of the
Edwards SAPIEN
transcatheter heart valve decreased as customers converted to
Edwards SAPIEN XT
.
The increase in international net sales of THV products was due primarily to:
|
•
|
the
Edwards SAPIEN 3
valve, driven primarily by its launch in Europe in January 2014; and
|
|
•
|
the
Edwards SAPIEN XT
valve in Japan, driven by its launch in October 2013;
|
partially offset by:
|
•
|
lower sales of the
Edwards SAPIEN XT
valve in Europe, as customers converted to
Edwards SAPIEN 3
.
|
In June 2015, we received approval from the FDA for the
Edwards SAPIEN 3
valve with the Commander Delivery System for the treatment of high-risk patients. In January 2016, we received FDA approval for an expanded indication study of the
Edwards SAPIEN 3
valve. The investigational device exemption study will enroll elderly patients with severe, symptomatic aortic stenosis who have been determined by a heart team to be at low risk for mortality if they were to undergo surgical aortic valve replacement. The trial will also include a 400-patient sub-study using advanced imaging to evaluate leaflet motion in tissue heart valves.
24
Surgical Heart Valve Therapy
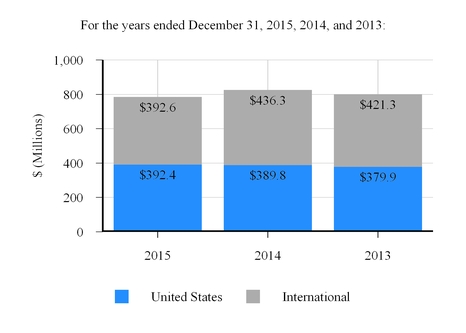
2015 Compared with 2014
The decrease in net sales of Surgical Heart Valve Therapy products was due primarily to:
|
•
|
foreign currency exchange rate fluctuations, which decreased net sales by
$59.7 million
, due primarily to the weakening of the Euro and the Japanese yen against the United States dollar;
|
partially offset by:
|
•
|
higher sales of (1) surgical heart valve products, driven by pericardial aortic tissue valves, primarily in Europe, Japan, and the United States, and (2)
EDWARDS INTUITY Elite
valves, primarily in Europe.
|
2014 Compared with 2013
The increase in net sales of Surgical Heart Valve Therapy products was due primarily to:
|
•
|
higher sales of (1) surgical heart valve products, driven by pericardial aortic tissue valves, primarily in the United States and Europe, and (2)
EDWARDS INTUITY Elite
valves, primarily in Europe;
|
partially offset by:
|
•
|
foreign currency exchange rate fluctuations, which decreased net sales by $10.5 million, due to the weakening of various currencies against the United States dollar, mainly the Japanese yen, partially offset by the strengthening of the Euro against the United States dollar.
|
25
Critical Care

2015 Compared with 2014
The decrease in net sales of Critical Care products was due primarily to:
|
•
|
foreign currency exchange rate fluctuations, which decreased net sales by
$41.3 million
due primarily to the weakening of the Euro and the Japanese yen against the United States dollar;
|
partially offset by:
|
•
|
higher sales of enhanced surgical recovery products in the United States, Europe, and Rest of World.
|
2014 Compared with 2013
The increase in net sales of Critical Care products was due primarily to enhanced surgical recovery products in the United States and Rest of World, and core hemodynamic products outside the United States, partially offset by foreign currency exchange rate fluctuations, which decreased net sales by $12.0 million due primarily to the weakening of the Japanese yen against the United States dollar.
Gross Profit
|
|
Years Ended December 31,
|
Change
|
|
|||||||||||
|
|
2015
|
2014
|
2013
|
2015
|
|
2014
|
|
|||||||
|
Gross profit as a percentage of net sales
|
75.2
|
%
|
73.1
|
%
|
74.7
|
%
|
2.1
|
pts.
|
(1.6
|
)
|
pts.
|
|||
The increase in gross profit as a percentage of net sales in
2015
was driven by:
|
•
|
a 1.9 percentage point increase due to the impact of foreign currency exchange rate fluctuations, including the settlement of foreign currency hedging contracts; and
|
|
•
|
a 0.9 percentage point increase in the United States and a 0.4 percentage point increase in international markets, due to an improved product mix, driven by THV products;
|
partially offset by:
|
•
|
multiple investments in our operations, including an increase in costs to improve our manufacturing processes.
|
26
The decrease in gross profit as a percentage of net sales in
2014
was driven by:
|
•
|
a 0.7 percentage point decrease due to the impact of foreign currency exchange rate fluctuations, including the settlement of foreign currency hedging contracts;
|
|
•
|
a 0.7 percentage point decrease due to higher performance-based incentive compensation; and
|
|
•
|
higher manufacturing costs, primarily for our operations in Utah;
|
partially offset by:
|
•
|
a 0.8 percentage point increase due to an improved product mix in the United States, driven by THV products.
|
Selling, General, and Administrative ("SG&A") Expenses
(dollars in millions)
|
|
Years Ended December 31,
|
Change
|
|
|||||||||||||||||
|
|
2015
|
2014
|
2013
|
2015
|
|
2014
|
|
|||||||||||||
|
SG&A expenses
|
$
|
850.7
|
|
$
|
858.0
|
|
$
|
733.4
|
|
$
|
(7.3
|
)
|
$
|
124.6
|
|
|||||
|
SG&A expenses as a percentage of net sales
|
34.1
|
%
|
36.9
|
%
|
35.9
|
%
|
(2.8
|
)
|
pts.
|
1.0
|
|
pts.
|
||||||||
The decrease in SG&A expenses in
2015
resulted primarily from foreign currency, which reduced expenses by $61.1 million due primarily to the weakening of the Euro and the Japanese yen against the United States dollar. This decrease was partially offset by (1) higher sales and marketing expenses in Europe, the United States, and Japan, mainly to support our THV program and (2) higher personnel-related costs. The decrease in SG&A expenses as a percentage of net sales in
2015
was due primarily to higher THV sales in the United States, Europe, and Japan.
The increase in SG&A expenses in
2014
was due primarily to (1) higher sales and marketing expenses in the United States, Europe, and Japan, mainly to support our THV program and (2) higher performance-based incentive compensation.
Research and Development ("R&D") Expenses
(dollars in millions)
|
|
Years Ended December 31,
|
Change
|
|
|||||||||||||||||
|
|
2015
|
2014
|
2013
|
2015
|
|
2014
|
|
|||||||||||||
|
R&D expenses
|
$
|
383.1
|
|
$
|
346.5
|
|
$
|
323.0
|
|
$
|
36.6
|
|
$
|
23.5
|
|
|||||
|
R&D expenses as a percentage of net sales
|
15.4
|
%
|
14.9
|
%
|
15.8
|
%
|
0.5
|
|
pts.
|
(0.9
|
)
|
pts.
|
||||||||
The increase in R&D expenses in
2015
was due primarily to new THV and Surgical Heart Valve Therapy product development efforts. These costs were partially offset by lower spending for THV clinical trials.
The increase in R&D expenses in
2014
was due primarily to new THV product development efforts, additional investments in clinical studies in our Surgical Heart Valve Therapy program, and higher performance-based incentive compensation. The decrease in R&D expenses as a percentage of net sales was due primarily to higher net sales.
Intellectual Property Litigation Expenses (Income), Net
In May 2014, we entered into an agreement with Medtronic to settle all outstanding patent litigation between the companies, and, pursuant to the agreement, we received an upfront payment from Medtronic in the amount of $750.0 million.
In February 2013, we received $83.6 million from Medtronic in satisfaction of the initial April 2010 jury award for damages for infringement of the United States Andersen transcatheter heart valve patent, including accrued interest.
We incurred external legal costs related to intellectual property litigation of
$7.0 million
, $9.6 million, and $22.1 million for the years ended December 31,
2015
,
2014
, and
2013
, respectively. Intellectual property litigation expenses decreased in 2015 and 2014 due to the May 2014 litigation settlement agreement with Medtronic.
27
Special Charges
For information on special charges, see Note 4 to the "
Consolidated Financial Statements.
"
Interest Expense
Interest expense was
$17.2 million
,
$17.2 million
, and
$9.8 million
in
2015
,
2014
, and
2013
, respectively. Interest expense for 2015 remained flat compared to 2014 as the impact of higher average interest rates was offset by a lower average debt balance compared to 2014. The increase in interest expense for 2014 as compared to 2013 resulted primarily from higher average interest rates and a higher average debt balance due to the issuance in October 2013 of $600 million of 2.875% fixed-rate unsecured senior notes.
Interest Income
Interest income was
$7.9 million
,
$6.4 million
, and
$4.6 million
in
2015
,
2014
, and
2013
, respectively. The increase in interest income for 2015 resulted primarily from higher average investment balances and higher average interest rates. The increase in interest income for 2014 resulted primarily from higher average investment balances.
Other Expense, net
(in millions)
|
|
Years Ended December 31,
|
||||||||||
|
|
2015
|
2014
|
2013
|
||||||||
|
Foreign exchange losses, net
|
$
|
4.8
|
|
$
|
2.0
|
|
$
|
1.5
|
|
||
|
(Gain) loss on investments
|
(0.1
|
)
|
4.5
|
|
0.4
|
|
|||||
|
Promissory note impairment
|
—
|
|
4.0
|
|
—
|
|
|||||
|
Insurance settlement gain
|
—
|
|
(3.7
|
)
|
—
|
|
|||||
|
Lease contract termination costs
|
—
|
|
1.0
|
|
—
|
|
|||||
|
Other
|
(0.7
|
)
|
(0.1
|
)
|
(0.6
|
)
|
|||||
|
Total other expense, net
|
$
|
4.0
|
|
$
|
7.7
|
|
$
|
1.3
|
|
||
The foreign exchange losses relate to the foreign currency fluctuations primarily in our global trade and intercompany receivable and payable balances, partially offset by the gains and losses on derivative instruments intended as an economic hedge of those exposures.
The (gain) loss on investments represents our net share of gains and losses in investments accounted for under the equity method, and realized gains and losses on our available-for-sale and cost method investments. During 2014, we recorded an other-than-temporary impairment charge of $3.5 million related to one of our cost method investments.
In December 2014, we recorded a $4.0 million impairment charge related to our promissory note receivable because it was likely that we would be unable to collect the scheduled payments of principal or interest when due according to the contractual terms of the promissory note agreement.
In March 2014, we recorded a $3.7 million insurance settlement gain related to inventory that was damaged in the fourth quarter of 2013.
In September 2014, we committed to purchase our Draper, Utah facility under a purchase option provided in the lease agreement. Under the terms of the lease agreement, we accrued $1.0 million for certain lease contract termination costs.
28
Provision for Income Taxes
Our effective income tax rates for
2015
,
2014
, and
2013
were impacted as follows (in millions):
|
|
Years Ended December 31,
|
||||||||||
|
|
2015
|
2014
|
2013
|
||||||||
|
Income tax expense at U.S. federal statutory rate
|
$
|
217.8
|
|
$
|
400.4
|
|
$
|
178.9
|
|
||
|
Foreign income taxed at different rates
|
(105.8
|
)
|
(67.1
|
)
|
(60.6
|
)
|
|||||
|
State and local taxes, net of federal tax benefit
|
3.1
|
|
19.3
|
|
5.8
|
|
|||||
|
Tax credits, federal and state
|
(15.7
|
)
|
(13.5
|
)
|
(19.8
|
)
|
|||||
|
Build (release) of reserve for uncertain tax positions for prior years
|
3.3
|
|
(4.8
|
)
|
(3.9
|
)
|
|||||
|
U.S. tax on foreign earnings, net of credits
|
20.5
|
|
(3.1
|
)
|
18.9
|
|
|||||
|
Nondeductible stock-based compensation
|
2.3
|
|
2.1
|
|
2.6
|
|
|||||
|
Other
|
2.0
|
|
(0.4
|
)
|
0.2
|
|
|||||
|
Income tax provision
|
$
|
127.5
|
|
$
|
332.9
|
|
$
|
122.1
|
|
||
Unrecognized Tax Benefits
As of December 31,
2015
and
2014
, the gross unrecognized tax benefits were
$216.1 million
and
$192.3 million
, respectively. We estimate that these liabilities would be reduced by
$40.6 million
and
$34.3 million
, respectively, from offsetting tax benefits associated with the correlative effects of potential transfer pricing adjustments, state income taxes, and timing adjustments. The net amounts of
$175.5 million
and
$158.0 million
, respectively, if not required, would favorably affect our effective tax rate.
A reconciliation of the beginning and ending amount of unrecognized tax benefits, excluding interest, penalties, and foreign exchange, is as follows (in millions):
|
|
Years Ended December 31,
|
||||||||||
|
|
2015
|
2014
|
2013
|
||||||||
|
Unrecognized tax benefits, January 1
|
$
|
192.3
|
|
$
|
127.7
|
|
$
|
113.6
|
|
||
|
Current year tax positions
|
29.6
|
|
75.9
|
|
17.8
|
|
|||||
|
Increase prior year tax positions
|
2.2
|
|
0.6
|
|
5.7
|
|
|||||
|
Decrease prior year tax positions
|
(7.4
|
)
|
(10.5
|
)
|
(9.0
|
)
|
|||||
|
Settlements
|
(0.4
|
)
|
(1.0
|
)
|
(0.1
|
)
|
|||||
|
Lapse of statutes of limitations
|
(0.2
|
)
|
(0.4
|
)
|
(0.3
|
)
|
|||||
|
Unrecognized tax benefits, December 31
|
$
|
216.1
|
|
$
|
192.3
|
|
$
|
127.7
|
|
||
We recognize interest and penalties, if any, related to unrecognized tax benefits in the provision for income taxes. As of December 31,
2015
, we had accrued
$10.7 million
(net of
$7.6 million
tax benefit) of interest related to unrecognized tax benefits, and as of December 31,
2014
, we had accrued
$6.8 million
(net of
$5.0 million
tax benefit) of interest related to unrecognized tax benefits. During
2015
,
2014
, and
2013
, we recognized interest expense, net of tax benefit, of
$3.9 million
,
$2.3 million
, and
$1.4 million
, respectively, in “
Provision for Income Taxes
” on the consolidated statements of operations.
We strive to resolve open matters with each tax authority at the examination level and could reach agreement with a tax authority at any time. While we have accrued for matters we believe are more likely than not to require settlement, the final outcome with a tax authority may result in a tax liability that is more or less than that reflected in the consolidated financial statements. Furthermore, we may later decide to challenge any assessments, if made, and may exercise our right to appeal. The uncertain tax positions are reviewed quarterly and adjusted as events occur that affect potential liabilities for additional taxes, such as lapsing of applicable statutes of limitations, proposed assessments by tax authorities, negotiations between tax authorities, identification of new issues, and issuance of new legislation, regulations, or case law. Management believes that adequate amounts of tax and related penalty and interest have been provided in income tax expense for any adjustments that may result from our uncertain tax positions.
29
At December 31,
2015
, all material state, local, and foreign income tax matters have been concluded for years through 2008. The Internal Revenue Service ("IRS") has substantially completed its fieldwork for the 2009 through 2012 tax years. However, the audits are currently in suspense pending finalization of an Advance Pricing Agreement ("APA") and Joint Committee of Taxation approval.
As noted above, we entered into an APA process between the Switzerland and United States governments for the years 2009 through 2015 covering transfer pricing matters. The transfer pricing matters are significant to our consolidated financial statements, and the final outcome and timing of the negotiations between the two governments is uncertain.
During 2014, we filed with the IRS a request for a pre-filing agreement associated with a tax return filing position on a portion of the litigation settlement payment received from Medtronic in May 2014. During the first quarter of 2015, the IRS accepted the pre-filing agreement into the pre-filing agreement program. The finalization of the pre-filing agreement is still pending. However, we made an advance payment of tax in December 2015 to prevent the further accrual of interest on any potential deficiency only and not to signify any potential agreement to a contrary position that may be taken by the IRS.
Management believes that adequate amounts of tax and related penalty and interest have been provided in income tax expense for any adjustments that may result from our uncertain tax positions. Based upon the information currently available and numerous possible outcomes, we cannot reasonably estimate what, if any, changes in our existing uncertain tax positions may occur in the next 12 months and thus have recorded the gross uncertain tax positions as a long-term liability. However, if the APA and/or pre-filing agreement is finalized in the next 12 months, it is reasonably possible that these events could result in a significant change in our uncertain tax positions within the next 12 months.
The effective income tax rate for the year ended December 31, 2015 was lower than the rate for the year ended December 31, 2014 primarily because the rate for December 31, 2014 included (1) $262.1 million of tax expense associated with a $750.0 million litigation settlement payment received from Medtronic in May 2014 (see Note 3 to the “
Consolidated Financial Statements
”) and (2) $4.8 million of tax benefits from the remeasurement of uncertain tax positions.
The effective income tax rate for the year ended December 31, 2013 included (1) an $8.4 million benefit for the full year 2012 federal research credit and (2) $31.3 million of tax expense associated with the $83.6 million litigation award received from Medtronic in February 2013 (see Note 3 to the “
Consolidated Financial Statements
”).
We have received tax incentives in Puerto Rico, the Dominican Republic, Singapore, and Switzerland. The tax reductions as compared to the local statutory rates favorably impacted earnings per diluted share for the years ended December 31,
2015
,
2014
, and
2013
by
$0.25
,
$0.31
, and
$0.22
, respectively. The Puerto Rico, Dominican Republic, and Singapore grants provide our manufacturing operations partial or full exemption from local taxes until the years 2028, 2030 (subject to review in 2015 and subsequent years), and 2024 respectively. The Switzerland grant expired December 31, 2015 and we are in the process of filing for renewal through 2018.
Liquidity and Capital Resources
Our sources of cash liquidity include cash and cash equivalents, short-term investments, amounts available under credit facilities, and cash from operations. We believe that these sources are sufficient to fund the current requirements of working capital, capital expenditures, and other financial commitments for the next twelve months. However, we periodically consider various financing alternatives and may, from time to time, seek to take advantage of favorable interest rate environments or other market conditions.
As of
December 31, 2015
, cash and cash equivalents and short-term investments held in the United States and outside the United States were $266.0 million and $958.7 million, respectively. We believe that cash held in the United States, in addition to amounts available under credit facilities and cash from operations, are sufficient to fund our United States operating requirements for the foreseeable future. Cash and cash equivalents and short-term investments held outside the United States have historically been used to fund international operations and acquire businesses and assets outside of the United States, the majority of which relates to undistributed earnings of certain of our foreign subsidiaries, which are considered by us to be indefinitely reinvested. We consider making short-term loans of cash held outside the United States to the United States from time to time based on facts and circumstances. The permanent repatriations of cash and cash equivalents and short-term investments held outside the United States are subject to restrictions in certain jurisdictions, and may be subject to withholding and other taxes. The potential tax liability related to any repatriation would be dependent on the facts and circumstances that exist at the time such repatriation is made and the complexities of the tax laws of the United States and the respective foreign jurisdictions.
30
On July 3, 2015, we entered into an agreement and plan of merger to acquire CardiAQ for an aggregate cash purchase price of $350.0 million, subject to certain adjustments, plus an additional $50.0 million if a certain European regulatory approval is obtained within 48 months of the acquisition closing date. We closed the purchase in August 2015 with available cash on hand in the United States. For further information, see Note 7 to the "
Consolidated Financial Statements.
"
We have a Five-Year Credit Agreement ("Credit Agreement") which provides up to an aggregate of $750.0 million in borrowings in multiple currencies. We may increase the amount available under the Credit Agreement, subject to agreement of the lenders, by up to an additional $250.0 million in the aggregate. As of
December 31, 2015
, there were no borrowings outstanding under the Credit Agreement. In October 2013, we issued $600.0 million of 2.875% fixed-rate unsecured senior notes due October 15, 2018. As of
December 31, 2015
, the total carrying value of our long-term debt was
$599.9 million
. For further information on our long-term debt, see Note 9 to the "
Consolidated Financial Statements
."
From time to time, we repurchase shares of our common stock under share repurchase programs authorized by the Board of Directors. We consider several factors in determining when to execute share repurchases, including, among other things, expected dilution from stock plans, cash capacity, and the market price of our common stock. During
2015
, we repurchased under the Board authorized repurchase program a total of
2.5 million
shares at an aggregate cost of
$275.0 million
, and as of
December 31, 2015
, had remaining authority to purchase
$677.5 million
of our common stock. In February 2016, Edwards entered into accelerated share repurchase agreements to repurchase
$325.0 million
of the Company's common stock. For further information, see Note 13 and Note 21 to the "
Consolidated Financial Statements
."
Net cash flows provided by
operating activities
of
$549.7 million
for
2015
decreased
$472.6 million
from
2014
due primarily to (1) the $750.0 million upfront payment received in 2014 from Medtronic under a litigation settlement agreement and (2) a higher bonus payout in 2015 associated with 2014 performance. These decreases were partially offset by (1) income tax payments of $224.5 million made in 2014 related to the Medtronic settlement, (2) improved operating performance in 2015, and (3) the $50.0 million charitable contribution made in 2014 to the Edwards Lifesciences Foundation.
Net cash flows provided by operating activities of
$1,022.3 million
for
2014
increased
$549.6 million
from
2013
due primarily to (1) the $750.0 million upfront payment received from Medtronic under a litigation settlement agreement, (2) a lower bonus payout in 2014 associated with 2013 performance, and (3) improved operating performance. These increases were partially offset by (1) income tax payments of $224.5 million related to the Medtronic settlement, (2) the prior year receipt of $83.6 million from Medtronic in satisfaction of the initial April 2010 jury award of damages for infringement of the United States Andersen transcatheter heart valve patent, and (3) the $50.0 million charitable contribution made in 2014 to the Edwards Lifesciences Foundation.
Net cash used in
investing activities
of
$316.1 million
in
2015
consisted primarily of a $320.1 million net payment associated with the acquisition of CardiAQ and capital expenditures of
$102.7 million
, partially offset by net
proceeds from
investments of
$119.6 million
.
Net cash used in investing activities of
$633.0 million
in
2014
consisted primarily of net
purchases of
investments of
$527.4 million
and capital expenditures of
$82.9 million
.
Net cash used in
financing activities
of
$158.6 million
in
2015
consisted primarily of purchases of treasury stock of
$280.1 million
, partially offset by proceeds from stock plans of
$87.2 million
, and the excess tax benefit from stock plans of
$41.3 million
.
Net cash used in financing activities of
$153.0 million
in
2014
consisted primarily of purchases of treasury stock of
$300.9 million
, partially offset by proceeds from stock plans of
$113.3 million
, and the excess tax benefit from stock plans of
$49.4 million
(including the realization of previously unrealized excess tax benefits).
31
A summary of all of our contractual obligations and commercial commitments as of
December 31, 2015
were as follows (in millions):
|
|
Payments Due by Period
|
||||||||||||||||||
|
Contractual Obligations
|
Total
|
Less Than
1 Year
|
1-3
Years
|
4-5
Years
|
After 5
Years
|
||||||||||||||
|
Debt
|
$
|
600.0
|
|
$
|
—
|
|
$
|
600.0
|
|
$
|
—
|
|
$
|
—
|
|
||||
|
Operating leases
|
72.8
|
|
20.1
|
|
24.3
|
|
9.6
|
|
18.8
|
|
|||||||||
|
Interest on debt
|
39.3
|
|
13.6
|
|
25.1
|
|
0.6
|
|
—
|
|
|||||||||
|
Pension obligations (a)
|
5.8
|
|
5.8
|
|
—
|
|
—
|
|
—
|
|
|||||||||
|
Capital commitment obligations (b)
|
2.3
|
|
2.0
|
|
0.3
|
|
—
|
|
—
|
|
|||||||||
|
Purchase and other commitments
|
2.4
|
|
2.4
|
|
—
|
|
—
|
|
—
|
|
|||||||||
|
Total contractual cash obligations (c) (d)
|
$
|
722.6
|
|
$
|
43.9
|
|
$
|
649.7
|
|
$
|
10.2
|
|
$
|
18.8
|
|
||||
_______________________________________________________________________________
|
(a)
|
The amount included in "Less Than 1 Year" reflects anticipated contributions to our various pension plans. Anticipated contributions beyond one year are not determinable. The total accrued benefit liability for our pension plans recognized as of
December 31, 2015
was
$43.0 million
. This amount is impacted by, among other items, pension expense funding levels, changes in plan demographics and assumptions, and investment return on plan assets. Therefore, we are unable to make a reasonably reliable estimate of the amount and period in which the liability might be paid, and did not include this amount in the contractual obligations table. See Note 12 to the "
Consolidated Financial Statements
" for further information.
|
|
(b)
|
Capital commitment obligations consist primarily of cash that we are obligated to pay to our limited partnership and limited liability corporation investees. These investees make equity investments in various development stage biopharmaceutical and medical device companies, and it is not certain if and/or when these payments will be made.
|
|
(c)
|
As of
December 31, 2015
, the liability for uncertain tax positions including interest was
$234.4 million
. We have entered into an APA process between the Switzerland and the United States governments for the years 2009 through 2015 covering transfer pricing matters. These transfer pricing matters are significant to our consolidated financial statements, and the final outcome of the negotiations between the two governments is uncertain. Management believes that adequate amounts of tax and related penalty and interest have been provided in income tax expense for any adjustments that may result for our uncertain tax positions. We are unable to make a reasonably reliable estimate of the amount and period in which the liability might be paid, and did not include this amount in the contractual obligations table.
|
|
(d)
|
We acquire assets still in development, enter into research and development arrangements, and sponsor certain clinical trials that often require milestone, royalty, or other future payments to third-parties, contingent upon the occurrence of certain future events. In situations where we have no ability to influence the achievement of the milestone or otherwise avoid the payment, we have included those payments in the table above. However, we have excluded from the table contingent milestone payments and other contingent liabilities for which we cannot reasonably predict future payments or for which we can avoid making payment by unilaterally deciding to stop development of a product or cease progress of a clinical trial. We estimate that these contingent payments could be up to approximately
$170.0 million
if all milestones or other contingent obligations were met.
|
Critical Accounting Policies and Estimates
Our results of operations and financial position are determined based upon the application of our accounting policies, as discussed in the notes to the "
Consolidated Financial Statements
." Certain of our accounting policies represent a selection among acceptable alternatives under Generally Accepted Accounting Principles in the United States ("GAAP"). In evaluating our transactions, management assesses all relevant GAAP and chooses the accounting policy that most accurately reflects the nature of the transactions.
The application of accounting policies requires the use of judgment and estimates. These matters that are subject to judgments and estimation are inherently uncertain, and different amounts could be reported using different assumptions and estimates. Management uses its best estimates and judgments in determining the appropriate amount to reflect in the consolidated financial statements, using historical experience and all available information. We also use outside experts where appropriate. We apply estimation methodologies consistently from year to year.
32
We believe the following are the critical accounting policies which could have the most significant effect on our reported results and require subjective or complex judgments by management.
Revenue Recognition
When we recognize revenue from the sale of our products, we record an estimate of various sales returns and allowances which reduces product sales and accounts receivable. These adjustments include estimates for rebates, returns, and other sales allowances. These provisions are estimated based upon historical payment experience, historical relationship to revenues, estimated customer inventory levels, and current contract sales terms with direct and indirect customers. Product returns are not significant because returns are generally not allowed unless the product is damaged at time of receipt. If the historical data and inventory estimates used to calculate these provisions do not approximate future activity, our financial position, results of operations, and cash flows could be impacted.
In addition, we may allow customers to return previously purchased products for next-generation product offerings. For these transactions, we defer recognition of revenue on the sale of the earlier generation product based upon an estimate of the amount to be returned when the next-generation products are shipped to the customer. Uncertain timing of next-generation product approvals, variability in product launch strategies, product recalls, and variation in product utilization all affect the estimates related to sales returns and could cause actual returns to differ from these estimates.
Our sales adjustment related to distributor rebates given to our United States distributors represents the difference between our sales price to the distributor (at our distributor "list price") and the negotiated price to be paid by the end-customer. We validate the distributor rebate accrual quarterly through either a review of the inventory reports obtained from our distributors or an estimate of the distributor's inventory. This distributor inventory information is used to verify the estimated liability for future distributor rebate claims based on historical rebates and contract rates. We periodically monitor current pricing trends and distributor inventory levels to ensure the credit for future distributor rebates is fairly stated.
Excess and Obsolete Inventory
The valuation of our inventory requires us to estimate excess, obsolete, and expired inventory. We base our provisions for excess, obsolete, and expired inventory on our estimates of forecasted net sales. A significant change in the timing or level of demand for our products as compared to forecasted amounts may result in recording additional allowances for excess, obsolete, and expired inventory in the future. In addition, our industry is characterized by rapid product development and frequent new product introductions. Uncertain timing of next-generation product approvals, variability in product launch strategies, product recalls, increasing levels of consigned inventory, and variation in product utilization all affect our estimates related to excess, obsolete, and expired inventory.
Intangible Assets and Long-lived Assets
We acquire intangible assets in connection with business combinations and asset purchases. The acquired intangible assets are recorded at fair value, which is determined based on a discounted cash flow analysis. The determination of fair value requires significant estimates, including, but not limited to, the amount and timing of projected future cash flows, the discount rate used to discount those cash flows, the assessment of the asset's life cycle, including the timing and expected costs to complete in-process projects, and the consideration of legal, technical, regulatory, economic, and competitive risks.
IPR&D acquired in business combinations is reviewed for impairment annually, or whenever an event occurs or circumstances change that would indicate the carrying amount may be impaired. Additionally, management reviews the carrying amounts of other intangible and long-lived assets whenever events or circumstances indicate that the carrying amounts of an asset may not be recoverable. The impairment reviews require significant estimates about fair value, including estimation of future cash flows, selection of an appropriate discount rate, and estimates of long-term growth rates.
Contingent Consideration
We record contingent consideration resulting from a business combination at its fair value on the acquisition date. We determine the fair value of the contingent consideration based primarily on the following factors:
|
•
|
timing and probability of success of clinical events or regulatory approvals;
|
|
•
|
timing and probability of success of meeting commercial milestones; and
|
|
•
|
discount rates.
|
33
On a quarterly basis, we revalue these obligations and record changes in their fair value as an adjustment to operating earnings. Changes to contingent consideration obligations can result from adjustments to discount rates, accretion of the discount rates due to the passage of time, changes in our estimates of the likelihood or timing of achieving development or commercial milestones, changes in the probability of certain clinical events or changes in the assumed probability associated with regulatory approval.
The assumptions related to determining the value of contingent consideration include a significant amount of judgment, and any changes in the underlying estimates could have a material impact on the amount of contingent consideration expense recorded in any given period.
Income Taxes
The determination of our provision for income taxes requires significant judgment, the use of estimates, and the interpretation and application of complex tax laws. Realization of certain deferred tax assets, primarily net operating loss and other carryforwards, is dependent upon generating sufficient taxable income in the appropriate jurisdiction prior to the expiration of the carryforward periods. Failure to achieve forecasted taxable income in the applicable taxing jurisdictions could affect the ultimate realization of deferred tax assets and could result in an increase in our effective tax rate on future earnings.
We are subject to income taxes in the United States and numerous foreign jurisdictions. Our income tax returns are periodically audited by domestic and foreign tax authorities. These audits include questions regarding our tax filing positions, including the timing and amount of deductions and the allocation of income amongst various tax jurisdictions. We evaluate our tax positions and establish liabilities in accordance with the applicable accounting guidance on uncertainty in income taxes. Significant judgment is required in evaluating our uncertain tax positions, including estimating the ultimate resolution to intercompany pricing controversies between countries when there are numerous possible outcomes. We review these tax uncertainties quarterly and adjust the liability as events occur that affect potential liabilities for additional taxes, such as the progress of tax audits, lapsing of applicable statutes of limitations, negotiations between tax authorities, identification of new issues, and issuance of new legislation, regulations, or case law.
For additional details on our income taxes, see Note 2 and Note 16 to the "
Consolidated Financial Statements
."
Stock-based Compensation
We measure and recognize compensation expense for all stock-based awards based on estimated fair values. Stock-based awards consist of stock options, service-based restricted stock units, market-based restricted stock units, performance-based restricted stock units, and employee stock purchase subscriptions. The fair value of each option award and employee stock purchase subscription is estimated on the date of grant using the Black-Scholes option valuation model. The fair value of market-based restricted stock units is determined using a Monte Carlo simulation model, which uses multiple input variables to determine the probability of satisfying the market condition requirements. The Black-Scholes and Monte Carlo models require various highly judgmental assumptions, including stock price volatility, risk-free interest rate, and expected option term. For performance-based restricted stock units, expense is recognized if and when we conclude that it is probable that the performance condition will be achieved, which requires judgment. Stock-based compensation expense is recorded net of estimated forfeitures. Judgment is required in estimating the stock awards that will ultimately be forfeited. If actual results differ significantly from these estimates, stock-based compensation expense and our results of operations could be impacted.
New Accounting Standards
Information regarding new accounting standards is included in Note 2 to the "
Consolidated Financial Statements."
Our business and financial results are affected by fluctuations in world financial markets, including changes in currency exchange rates and interest rates. We manage these risks through a combination of normal operating and financing activities and derivative financial instruments. We do not use derivative financial instruments for trading or speculative purposes.
34
Interest Rate Risk
Our exposure to market risk for changes in interest rates relates primarily to our investment portfolio and our long-term debt. Our investment strategy is focused on preserving capital and supporting our liquidity requirements, while earning a reasonable market return. We invest in a variety of fixed-rate debt securities, primarily time deposits, commercial paper, U.S. government and agency securities, municipal securities, asset-backed securities, corporate debt securities, and municipal securities. The market value of our investments may decline if current market interest rates rise. As of
December 31, 2015
, we had
$858.0 million
of investments in fixed-rate debt securities which had an average remaining term to maturity of approximately 0.8 years. Taking into consideration the average maturity of our fixed-rate debt securities, a hypothetical 0.5% to 1.0% absolute increase in interest rates at
December 31, 2015
would have resulted in a $3.5 million to $6.9 million decrease in the fair value of these investments. Such a decrease would only result in a realized loss if we choose or are forced to sell the investments before the scheduled maturity, which we currently do not anticipate.
We are also exposed to interest rate risk on our debt obligations. As of
December 31, 2015
, we had $600.0 million of Notes outstanding that carry a fixed rate, and also had available a $750.0 million Credit Agreement that carries a variable interest rate based on the London interbank offered rate ("LIBOR"). As of
December 31, 2015
, there were no borrowings outstanding under the Credit Agreement. To diversify our interest rate risk, we entered into interest rate swaps with an aggregate notional amount of $300.0 million. The critical terms of the swaps match the critical terms of $300.0 million of the aggregate principal amount of the Notes, effectively converting that portion of the fixed-rate issue to a floating variable rate based on a 6-month LIBOR benchmark. Based on our year end
2015
variable debt levels, a hypothetical 1.0% absolute increase in our floating market interest rates would increase our interest expense by approximately $3.0 million, most of which would be offset by increased returns on our short-term investments. The impact on net interest would be immaterial to our financial condition and results of operations. As of
December 31, 2015
, a hypothetical 1.0% absolute increase in market interest rates would decrease the fair value of the fixed-rate debt by approximately $16.0 million. This hypothetical change in interest rates would not impact the interest expense on the fixed-rate debt.
For more information related to outstanding debt obligations, see Note 9 to the "
Consolidated Financial Statements.
"
Currency Risk
We are exposed to foreign currency risks that arise from normal business operations. These risks include the translation of local currency balances and results of our non-United States subsidiaries into United States dollars, currency gains and losses related to intercompany and third-party transactions denominated in currencies other than a location's functional currency, and currency gains and losses associated with intercompany loans. Our principal currency exposures relate to the Euro and the Japanese yen. Our objective is to minimize the volatility of our exposure to these risks through a combination of normal operating and financing activities and the use of derivative financial instruments in the form of foreign currency forward exchange contracts and foreign currency options contracts. The total notional amount of our derivative financial instruments entered into for foreign currency management purposes at
December 31, 2015
was $1,061.6 million. A hypothetical 10% increase/decrease in the value of the United States dollar against all hedged currencies would increase/decrease the fair value of these derivative contracts by $81.2 million and $83.7 million, respectively. Any gains or losses on the fair value of derivative contracts would generally be offset by gains and losses on the underlying transactions, so the net impact would not be significant to our financial condition or results of operations.
For more information related to outstanding foreign exchange contracts, see Note 2 and Note 11 to the "
Consolidated Financial Statements.
"
Credit Risk
Derivative financial instruments involve credit risk in the event the financial institution counterparty should default. It is our policy to execute such instruments with major financial institutions that we believe to be creditworthy. At
December 31, 2015
, all derivative financial instruments were with bank counterparties assigned investment grade ratings by national rating agencies. We further diversify our derivative financial instruments among counterparties to minimize exposure to any one of these entities. We have not experienced a counterparty default and do not anticipate any non-performance by our current derivative counterparties.
Concentrations of Risk
We invest excess cash in a variety of fixed-rate debt securities, and diversify the investments between financial institutions. Our investment policy limits the amount of credit exposure to any one issuer.
35
In the normal course of business, we provide credit to customers in the health care industry, perform credit evaluations of these customers, and maintain allowances for potential credit losses, which have historically been adequate compared to actual losses. In
2015
, we had no customers that represent 10% or more of our total net sales or accounts receivable, net.
We continue to do business with foreign governments in certain European countries that have experienced a deterioration in credit and economic conditions. These conditions have resulted in, and may continue to result in, a reduction in value and an increase in the average length of time that it takes to collect accounts receivable outstanding in these countries. In addition, we may also be impacted by declines in sovereign credit ratings or sovereign defaults in these countries. As of
December 31, 2015
, our accounts receivables, net of the allowance for doubtful accounts, from customers in certain European countries where economic conditions have declined were $58.4 million.
Investment Risk
We are exposed to investment risks related to changes in the underlying financial condition and credit capacity of certain of our investments. As of
December 31, 2015
, we had
$858.0 million
of investments in fixed-rate debt securities of various companies, of which
$351.7 million
were long-term. In addition, we had
$28.2 million
of investments in equity instruments of public and private companies. Should these companies experience a decline in financial condition or credit capacity, or fail to meet certain development milestones, a decline in the investments' values may occur, resulting in unrealized or realized losses.
36
INDEX TO CONSOLIDATED FINANCIAL STATEMENTS
DECEMBER 31,
2015
|
Financial Statements:
|
|
|
For the Years Ended December 31, 2015, 2014, and 2013:
|
|
|
Other schedules are not applicable and have not been submitted
|
|
37
Report of Independent Registered Public Accounting Firm
To the Board of Directors and Stockholders of Edwards Lifesciences Corporation:
In our opinion, the consolidated financial statements listed in the accompanying index present fairly, in all material respects, the financial position of Edwards Lifesciences Corporation and its subsidiaries at December 31, 2015 and December 31, 2014, and the results of their operations and their cash flows for each of the three years in the period ended December 31, 2015 in conformity with accounting principles generally accepted in the United States of America. Also in our opinion, the Company maintained, in all material respects, effective internal control over financial reporting as of December 31, 2015, based on criteria established in Internal Control - Integrated Framework (2013) issued by the Committee of Sponsoring Organizations of the Treadway Commission (COSO). The Company's management is responsible for these financial statements, for maintaining effective internal control over financial reporting and for its assessment of the effectiveness of internal control over financial reporting, included in Management's Report on Internal Control over Financial Reporting under Item 9A. Our responsibility is to express opinions on these financial statements and on the Company's internal control over financial reporting based on our integrated audits. We conducted our audits in accordance with the standards of the Public Company Accounting Oversight Board (United States). Those standards require that we plan and perform the audits to obtain reasonable assurance about whether the financial statements are free of material misstatement and whether effective internal control over financial reporting was maintained in all material respects. Our audits of the financial statements included examining, on a test basis, evidence supporting the amounts and disclosures in the financial statements, assessing the accounting principles used and significant estimates made by management, and evaluating the overall financial statement presentation. Our audit of internal control over financial reporting included obtaining an understanding of internal control over financial reporting, assessing the risk that a material weakness exists, and testing and evaluating the design and operating effectiveness of internal control based on the assessed risk. Our audits also included performing such other procedures as we considered necessary in the circumstances. We believe that our audits provide a reasonable basis for our opinions.
As discussed in Note 2 to the consolidated financial statements, the Company changed the manner in which it presents deferred income taxes in its statement of financial position in 2015.
A company’s internal control over financial reporting is a process designed to provide reasonable assurance regarding the reliability of financial reporting and the preparation of financial statements for external purposes in accordance with generally accepted accounting principles. A company’s internal control over financial reporting includes those policies and procedures that (i) pertain to the maintenance of records that, in reasonable detail, accurately and fairly reflect the transactions and dispositions of the assets of the company; (ii) provide reasonable assurance that transactions are recorded as necessary to permit preparation of financial statements in accordance with generally accepted accounting principles, and that receipts and expenditures of the company are being made only in accordance with authorizations of management and directors of the company; and (iii) provide reasonable assurance regarding prevention or timely detection of unauthorized acquisition, use, or disposition of the company’s assets that could have a material effect on the financial statements.
Because of its inherent limitations, internal control over financial reporting may not prevent or detect misstatements. Also, projections of any evaluation of effectiveness to future periods are subject to the risk that controls may become inadequate because of changes in conditions, or that the degree of compliance with the policies or procedures may deteriorate.
/s/ PricewaterhouseCoopers LLP
Irvine, California
February 19, 2016
38
EDWARDS LIFESCIENCES CORPORATION
(in millions, except par value)
|
December 31,
|
|||||||
|
|
2015
|
2014
|
|||||
|
ASSETS
|
|||||||
|
Current assets
|
|
|
|
|
|||
|
Cash and cash equivalents
|
$
|
718.4
|
|
$
|
653.8
|
|
|
|
Short-term investments (Note 6)
|
506.3
|
|
785.0
|
|
|||
|
Accounts receivable, net (Note 5)
|
315.4
|
|
288.0
|
|
|||
|
Other receivables
|
28.7
|
|
37.0
|
|
|||
|
Inventories (Note 5)
|
339.9
|
|
296.8
|
|
|||
|
Prepaid expenses
|
45.1
|
|
48.8
|
|
|||
|
Other current assets
|
94.1
|
|
121.7
|
|
|||
|
Total current assets
|
2,047.9
|
|
2,231.1
|
|
|||
|
Long-term accounts receivable, net (Note 5)
|
3.6
|
|
5.8
|
|
|||
|
Long-term investments (Note 6)
|
379.9
|
|
240.9
|
|
|||
|
Property, plant, and equipment, net (Note 5)
|
482.5
|
|
442.9
|
|
|||
|
Goodwill (Note 8)
|
628.3
|
|
376.0
|
|
|||
|
Other intangible assets, net (Note 8)
|
205.4
|
|
23.4
|
|
|||
|
Deferred income taxes
|
180.5
|
|
153.7
|
|
|||
|
Other assets
|
131.2
|
|
49.2
|
|
|||
|
Total assets
|
$
|
4,059.3
|
|
$
|
3,523.0
|
|
|
|
LIABILITIES AND STOCKHOLDERS' EQUITY
|
|||||||
|
Current liabilities
|
|
|
|
|
|||
|
Accounts payable
|
$
|
63.9
|
|
$
|
58.2
|
|
|
|
Accrued and other liabilities (Note 5)
|
412.3
|
|
367.9
|
|
|||
|
Total current liabilities
|
476.2
|
|
426.1
|
|
|||
|
Long-term debt (Note 9)
|
599.9
|
|
598.1
|
|
|||
|
Uncertain tax positions
|
194.7
|
|
194.8
|
|
|||
|
Other long-term liabilities
|
285.4
|
|
112.6
|
|
|||
|
Commitments and contingencies (Notes 9 and 17)
|
|
|
|
|
|||
|
Stockholders' equity
(Note 13)
|
|
|
|
|
|||
|
Preferred stock, $.01 par value, authorized 50.0 shares, no shares outstanding
|
—
|
|
—
|
|
|||
|
Common stock, $1.00 par value, 350.0 shares authorized, 239.1 and 128.9 shares issued, and 215.4 and 107.8 shares outstanding, respectively
|
239.1
|
|
128.9
|
|
|||
|
Additional paid-in capital
|
946.8
|
|
878.4
|
|
|||
|
Retained earnings
|
3,336.8
|
|
2,841.9
|
|
|||
|
Accumulated other comprehensive loss
|
(182.6
|
)
|
(100.9
|
)
|
|||
|
Treasury stock, at cost, 23.7 and 21.1 shares, respectively
|
(1,837.0
|
)
|
(1,556.9
|
)
|
|||
|
Total stockholders' equity
|
2,503.1
|
|
2,191.4
|
|
|||
|
Total liabilities and stockholders' equity
|
$
|
4,059.3
|
|
$
|
3,523.0
|
|
|
The accompanying notes are an integral part of these consolidated financial statements.
39
EDWARDS LIFESCIENCES CORPORATION
(in millions, except per share information)
|
|
Years Ended December 31,
|
||||||||||
|
|
2015
|
2014
|
2013
|
||||||||
|
Net sales
|
$
|
2,493.7
|
|
$
|
2,322.9
|
|
$
|
2,045.5
|
|
||
|
Cost of sales
|
617.2
|
|
625.6
|
|
516.6
|
|
|||||
|
Gross profit
|
1,876.5
|
|
1,697.3
|
|
1,528.9
|
|
|||||
|
Selling, general, and administrative expenses
|
850.7
|
|
858.0
|
|
733.4
|
|
|||||
|
Research and development expenses
|
383.1
|
|
346.5
|
|
323.0
|
|
|||||
|
Intellectual property litigation expenses (income), net (Note 3)
|
7.0
|
|
(740.4
|
)
|
(61.5
|
)
|
|||||
|
Special charges (Note 4)
|
—
|
|
70.7
|
|
16.3
|
|
|||||
|
Interest expense
|
17.2
|
|
17.2
|
|
9.8
|
|
|||||
|
Interest income
|
(7.9
|
)
|
(6.4
|
)
|
(4.6
|
)
|
|||||
|
Other expense, net (Note 15)
|
4.0
|
|
7.7
|
|
1.3
|
|
|||||
|
Income before provision for income taxes
|
622.4
|
|
1,144.0
|
|
511.2
|
|
|||||
|
Provision for income taxes (Note 16)
|
127.5
|
|
332.9
|
|
122.1
|
|
|||||
|
Net income
|
$
|
494.9
|
|
$
|
811.1
|
|
$
|
389.1
|
|
||
|
Share information
(Note 2):
|
|
|
|
|
|
|
|||||
|
Earnings per share:
|
|
|
|
|
|
|
|||||
|
Basic
|
$
|
2.30
|
|
$
|
3.81
|
|
$
|
1.74
|
|
||
|
Diluted
|
$
|
2.25
|
|
$
|
3.74
|
|
$
|
1.71
|
|
||
|
Weighted-average number of common shares outstanding:
|
|
|
|
|
|
|
|||||
|
Basic
|
215.5
|
|
213.0
|
|
223.4
|
|
|||||
|
Diluted
|
220.3
|
|
217.0
|
|
227.6
|
|
|||||
The accompanying notes are an integral part of these consolidated financial statements.
40
EDWARDS LIFESCIENCES CORPORATION
CONSOLIDATED STATEMENTS OF COMPREHENSIVE INCOME
(in millions)
|
|
Years Ended December 31,
|
||||||||||
|
|
2015
|
2014
|
2013
|
||||||||
|
Net income
|
$
|
494.9
|
|
$
|
811.1
|
|
$
|
389.1
|
|
||
|
Other comprehensive (loss) income, net of tax (Note 14):
|
|
|
|
|
|
|
|||||
|
Foreign currency translation adjustments
|
(65.1
|
)
|
(96.2
|
)
|
5.6
|
|
|||||
|
Unrealized (loss) gain on cash flow hedges
|
(20.5
|
)
|
28.8
|
|
(3.5
|
)
|
|||||
|
Defined benefit pension plans—net actuarial gain (loss) and other
|
5.4
|
|
(5.6
|
)
|
9.3
|
|
|||||
|
Unrealized loss on available-for-sale investments for the period
|
(2.6
|
)
|
(0.3
|
)
|
(1.1
|
)
|
|||||
|
Reclassification of net realized investment loss to earnings
|
1.1
|
|
—
|
|
—
|
|
|||||
|
Other comprehensive (loss) income, net of tax
|
(81.7
|
)
|
(73.3
|
)
|
10.3
|
|
|||||
|
Comprehensive income
|
$
|
413.2
|
|
$
|
737.8
|
|
$
|
399.4
|
|
||
The accompanying notes are an integral part of these consolidated financial statements.
41
EDWARDS LIFESCIENCES CORPORATION
(in millions)
|
|
Years Ended December 31,
|
||||||||||
|
|
2015
|
2014
|
2013
|
||||||||
|
Cash flows from operating activities
|
|
|
|
|
|
|
|||||
|
Net income
|
$
|
494.9
|
|
$
|
811.1
|
|
$
|
389.1
|
|
||
|
Adjustments to reconcile net income to cash provided by operating activities:
|
|
|
|
|
|||||||
|
Depreciation and amortization
|
65.8
|
|
68.6
|
|
62.9
|
|
|||||
|
Stock-based compensation (Notes 2 and 13)
|
49.9
|
|
48.3
|
|
47.4
|
|
|||||
|
Excess tax benefit from stock plans (Notes 2 and 13)
|
(41.3
|
)
|
(49.4
|
)
|
(73.5
|
)
|
|||||
|
Deferred income taxes
|
(95.0
|
)
|
(71.1
|
)
|
(12.4
|
)
|
|||||
|
Purchased in-process research and development (Note 4)
|
—
|
|
10.6
|
|
—
|
|
|||||
|
Other
|
11.0
|
|
13.9
|
|
6.7
|
|
|||||
|
Changes in operating assets and liabilities:
|
|
|
|
|
|||||||
|
Accounts and other receivables, net
|
(38.3
|
)
|
(26.8
|
)
|
8.5
|
|
|||||
|
Inventories
|
(67.7
|
)
|
(30.5
|
)
|
(44.4
|
)
|
|||||
|
Accounts payable and accrued liabilities
|
29.4
|
|
112.9
|
|
0.2
|
|
|||||
|
Income taxes
|
134.5
|
|
128.1
|
|
80.6
|
|
|||||
|
Prepaid expenses and other current assets
|
(0.2
|
)
|
(0.9
|
)
|
(6.3
|
)
|
|||||
|
Other
|
6.7
|
|
7.5
|
|
13.9
|
|
|||||
|
Net cash provided by operating activities
|
549.7
|
|
1,022.3
|
|
472.7
|
|
|||||
|
Cash flows from investing activities
|
|
|
|
|
|||||||
|
Capital expenditures
|
(102.7
|
)
|
(82.9
|
)
|
(109.0
|
)
|
|||||
|
Purchases of held-to-maturity investments (Note 6)
|
(928.5
|
)
|
(1,956.4
|
)
|
(823.2
|
)
|
|||||
|
Proceeds from held-to-maturity investments (Note 6)
|
1,260.1
|
|
1,611.2
|
|
526.4
|
|
|||||
|
Purchases of available-for-sale investments (Note 6)
|
(380.3
|
)
|
(160.4
|
)
|
—
|
|
|||||
|
Proceeds from available-for-sale investments (Note 6)
|
179.6
|
|
1.7
|
|
—
|
|
|||||
|
Investments in unconsolidated affiliates (Note 6)
|
(5.1
|
)
|
(11.2
|
)
|
(3.0
|
)
|
|||||
|
Proceeds from unconsolidated affiliates (Note 6)
|
3.0
|
|
2.1
|
|
0.3
|
|
|||||
|
Investments in trading securities, net
|
(9.2
|
)
|
(14.4
|
)
|
(1.4
|
)
|
|||||
|
Acquisitions (Notes 7 and 8)
|
(331.6
|
)
|
(15.0
|
)
|
—
|
|
|||||
|
Investments in intangible assets and in-process research and development
|
(3.8
|
)
|
(10.8
|
)
|
(1.1
|
)
|
|||||
|
Proceeds from sale of assets
|
2.4
|
|
3.1
|
|
2.3
|
|
|||||
|
Other
|
—
|
|
—
|
|
(4.0
|
)
|
|||||
|
Net cash used in investing activities
|
(316.1
|
)
|
(633.0
|
)
|
(412.7
|
)
|
|||||
|
Cash flows from financing activities
|
|
|
|
|
|
|
|||||
|
Proceeds from issuance of debt
|
31.4
|
|
226.3
|
|
1,305.0
|
|
|||||
|
Payments on debt and capital lease obligations
|
(29.5
|
)
|
(239.0
|
)
|
(895.4
|
)
|
|||||
|
Purchases of treasury stock
|
(280.1
|
)
|
(300.9
|
)
|
(496.9
|
)
|
|||||
|
Proceeds from stock plans
|
87.2
|
|
113.3
|
|
45.5
|
|
|||||
|
Excess tax benefit from stock plans (Notes 2 and 13)
|
41.3
|
|
49.4
|
|
73.5
|
|
|||||
|
Other
|
(8.9
|
)
|
(2.1
|
)
|
3.2
|
|
|||||
|
Net cash (used in) provided by financing activities
|
(158.6
|
)
|
(153.0
|
)
|
34.9
|
|
|||||
|
Effect of currency exchange rate changes on cash and cash equivalents
|
(10.4
|
)
|
(2.9
|
)
|
14.6
|
|
|||||
|
Net increase in cash and cash equivalents
|
64.6
|
|
233.4
|
|
109.5
|
|
|||||
|
Cash and cash equivalents at beginning of year
|
653.8
|
|
420.4
|
|
310.9
|
|
|||||
|
Cash and cash equivalents at end of year
|
$
|
718.4
|
|
$
|
653.8
|
|
$
|
420.4
|
|
||
|
Supplemental disclosures:
|
|
|
|
|
|
|
|||||
|
Cash paid during the year for:
|
|
|
|
|
|
|
|||||
|
Interest
|
$
|
17.2
|
|
$
|
15.5
|
|
$
|
4.3
|
|
||
|
Income taxes
|
$
|
86.9
|
|
$
|
274.7
|
|
$
|
54.0
|
|
||
|
Non-cash investing and financing transactions:
|
|
|
|
|
|
|
|||||
|
Capital expenditures accruals
|
$
|
15.1
|
|
$
|
8.3
|
|
$
|
8.4
|
|
||
|
Capital additions transferred from inventory
|
$
|
3.0
|
|
$
|
4.0
|
|
$
|
7.8
|
|
||
|
Capital lease obligations incurred
|
$
|
—
|
|
$
|
13.3
|
|
$
|
—
|
|
||
The accompanying notes are an integral part of these consolidated financial statements.
42
EDWARDS LIFESCIENCES CORPORATION
CONSOLIDATED STATEMENTS OF STOCKHOLDERS' EQUITY
(in millions)
|
|
Common Stock
|
Treasury Stock
|
|||||||||||||||||||||||||||
|
|
Shares
|
Par Value
|
Shares
|
Amount
|
Additional Paid-in Capital
|
Retained Earnings
|
Accumulated Other Comprehensive (Loss) Income
|
Total Stockholders' Equity
|
|||||||||||||||||||||
|
BALANCE AT DECEMBER 31, 2012
|
124.2
|
|
$
|
124.2
|
|
9.9
|
|
$
|
(749.9
|
)
|
$
|
489.0
|
|
$
|
1,641.7
|
|
$
|
(37.9
|
)
|
$
|
1,467.1
|
|
|||||||
|
Net income
|
|
|
|
|
|
|
|
|
|
|
389.1
|
|
|
|
389.1
|
|
|||||||||||||
|
Other comprehensive income, net of tax
|
|
|
|
|
|
|
|
|
|
|
|
|
10.3
|
|
10.3
|
|
|||||||||||||
|
Common stock issued under equity plans, including tax benefits
|
1.8
|
|
1.8
|
|
|
|
|
|
125.7
|
|
|
|
|
|
127.5
|
|
|||||||||||||
|
Stock-based compensation expense
|
|
|
|
|
|
|
|
|
47.4
|
|
|
|
|
|
47.4
|
|
|||||||||||||
|
Purchases of treasury stock
|
|
|
|
|
6.8
|
|
(506.1
|
)
|
9.1
|
|
|
|
|
|
(497.0
|
)
|
|||||||||||||
|
BALANCE AT DECEMBER 31, 2013
|
126.0
|
|
126.0
|
|
16.7
|
|
(1,256.0
|
)
|
671.2
|
|
2,030.8
|
|
(27.6
|
)
|
1,544.4
|
|
|||||||||||||
|
Net income
|
|
|
|
|
|
|
|
|
|
|
811.1
|
|
|
|
811.1
|
|
|||||||||||||
|
Other comprehensive loss, net of tax
|
|
|
|
|
|
|
|
|
|
|
|
|
(73.3
|
)
|
(73.3
|
)
|
|||||||||||||
|
Common stock issued under equity plans, including tax benefits
|
2.9
|
|
2.9
|
|
|
|
|
|
158.9
|
|
|
|
|
|
161.8
|
|
|||||||||||||
|
Stock-based compensation expense
|
|
|
|
|
|
|
|
|
48.3
|
|
|
|
|
|
48.3
|
|
|||||||||||||
|
Purchases of treasury stock
|
|
|
|
|
4.4
|
|
(300.9
|
)
|
|
|
|
|
|
|
(300.9
|
)
|
|||||||||||||
|
BALANCE AT DECEMBER 31, 2014
|
128.9
|
|
128.9
|
|
21.1
|
|
(1,556.9
|
)
|
878.4
|
|
2,841.9
|
|
(100.9
|
)
|
2,191.4
|
|
|||||||||||||
|
Net income
|
|
|
|
|
|
|
|
|
|
|
494.9
|
|
|
|
494.9
|
|
|||||||||||||
|
Other comprehensive loss, net of tax
|
|
|
|
|
|
|
|
|
|
|
|
|
(81.7
|
)
|
(81.7
|
)
|
|||||||||||||
|
Common stock issued under equity plans, including tax benefits
|
2.0
|
|
2.0
|
|
|
|
|
|
126.7
|
|
|
|
|
|
128.7
|
|
|||||||||||||
|
Stock-based compensation expense
|
|
|
|
|
|
|
|
|
49.9
|
|
|
|
|
|
49.9
|
|
|||||||||||||
|
Purchases of treasury stock
|
|
|
|
|
2.6
|
|
(280.1
|
)
|
|
|
|
|
|
|
(280.1
|
)
|
|||||||||||||
|
Stock issued to effect stock split
|
108.2
|
|
108.2
|
|
(108.2
|
)
|
—
|
|
|||||||||||||||||||||
|
BALANCE AT DECEMBER 31, 2015
|
239.1
|
|
$
|
239.1
|
|
23.7
|
|
$
|
(1,837.0
|
)
|
$
|
946.8
|
|
$
|
3,336.8
|
|
$
|
(182.6
|
)
|
$
|
2,503.1
|
|
|||||||
The accompanying notes are an integral part of these consolidated financial statements.
43
EDWARDS LIFESCIENCES CORPORATION
NOTES TO CONSOLIDATED FINANCIAL STATEMENTS
1. DESCRIPTION OF BUSINESS
Edwards Lifesciences Corporation ("Edwards Lifesciences" or the "Company") conducts operations worldwide and is managed in the following geographical regions: United States, Europe, Japan, and Rest of World. Edwards Lifesciences is focused on technologies that treat structural heart disease and critically ill patients. The products and technologies provided by Edwards Lifesciences are categorized into the following main areas: Transcatheter Heart Valve Therapy, Surgical Heart Valve Therapy, and Critical Care.
2. SUMMARY OF SIGNIFICANT ACCOUNTING POLICIES
Principles of Consolidation
The accompanying consolidated financial statements include the accounts of Edwards Lifesciences and its majority-owned subsidiaries. All intercompany balances and transactions have been eliminated in consolidation. The Company reviews its investments in other entities to determine whether the Company is the primary beneficiary of a variable interest entity ("VIE"). The Company would be the primary beneficiary of the VIE, and would be required to consolidate the VIE, if it has the power to direct the significant activities of the entity and the obligation to absorb losses or receive benefits from the entity that may be significant to the VIE. Based on the Company's analysis, it determined it is not the primary beneficiary of any VIEs; however, future events may require VIEs to be consolidated if the Company becomes the primary beneficiary.
Stock Split
On November 19, 2015, the Company’s Board of Directors declared a
two
-for-one stock split of its outstanding shares of common stock effected in the form of a stock dividend, paid on December 11, 2015 to shareholders of record on November 30, 2015. The Company distributed newly issued shares to effect the stock split. All applicable share and per-share amounts in the consolidated financial statements and the notes to consolidated financial statements have been retroactively adjusted to reflect this stock split. The consolidated balance sheet as of December 31, 2014 and the consolidated statements of stockholders’ equity for the years ended December 31, 2014 and 2013 have not been retroactively adjusted to reflect the stock split.
Use of Estimates
The consolidated financial statements of Edwards Lifesciences have been prepared in accordance with Generally Accepted Accounting Principles in the United States of America ("GAAP") which have been applied consistently in all material respects. The preparation of financial statements in conformity with GAAP requires management to make estimates and assumptions that affect the amounts reported in the financial statements. Actual results could differ from those estimates.
Foreign Currency Translation
When the local currency of the Company's foreign entities is the functional currency, all assets and liabilities are translated into United States dollars at the rate of exchange in effect at the balance sheet date. Income and expense items are translated at the weighted-average exchange rate prevailing during the period. The effects of foreign currency translation adjustments for these entities are deferred and reported in stockholders' equity as a component of "
Accumulated Other Comprehensive Loss
." The effects of foreign currency transactions denominated in a currency other than an entity's functional currency are included in "
Other Expense, net.
"
Revenue Recognition
The Company recognizes revenue when it is realized or realizable and earned. Revenue is considered realized or realizable and earned upon delivery of the product, provided that an agreement of sale exists, the sales price is fixed or determinable, and collection is reasonably assured. In the case of certain products where the Company maintains consigned inventory at customer locations, revenue is recognized at the time the customer has used the inventory.
The Company's principal sales terms provide for title and risk of loss transferring upon delivery to the customer, limited right of return, and no unusual provisions or conditions. When the Company recognizes revenue from the sale of its products, an estimate of various sales returns and allowances is recorded which reduces product sales and accounts receivable. These
44
EDWARDS LIFESCIENCES CORPORATION
NOTES TO CONSOLIDATED FINANCIAL STATEMENTS (Continued)
2. SUMMARY OF SIGNIFICANT ACCOUNTING POLICIES (Continued)
adjustments include estimates for rebates, returns, and other sales allowances. These provisions are estimated and recorded at the time of sale based upon historical payment experience, historical relationship to revenues, estimated customer inventory levels, and current contract sales terms with direct and indirect customers. Other than in limited circumstances, product returns are not significant because returns are generally not allowed unless the product is damaged at time of receipt. In addition, the Company may allow customers to return previously purchased products for next-generation product offerings. For these transactions, the Company defers recognition of revenue on the sale of the earlier generation product based upon an estimate of the amount of product to be returned when the next-generation products are shipped to the customer.
The Company's sales adjustment related to distributor rebates given to the Company's United States distributors represents the difference between the Company's sales price to the distributor (at the Company's distributor "list price") and the negotiated price to be paid by the end-customer. This distributor rebate is recorded by the Company as a reduction to sales and a reduction to the distributor's accounts receivable at the time of sale to a distributor. The Company validates the distributor rebate accrual quarterly through either a review of the inventory reports obtained from its distributors or an estimate of its distributor's inventory. This distributor inventory information is used to verify the estimated liability for future distributor rebate claims based on historical rebates and contract rates. The Company periodically monitors current pricing trends and distributor inventory levels to ensure the credit for future distributor rebates is fairly stated.
The Company also offers volume rebates to certain group purchasing organizations ("GPOs") and customers based upon target sales levels. For volume rebates offered to GPOs, the rebates are recorded as a reduction to sales and an obligation to the GPOs, as the Company expects to pay in cash. For volume rebates offered to customers, the rebates are recorded as a reduction to sales and accounts receivable, as the Company expects a net payment from the customer. The provision for volume rebates is estimated based on customers' contracted rebate programs and historical experience of rebates paid. The Company periodically monitors its customer rebate programs to ensure that the allowance and liability for accrued rebates is fairly stated.
Shipping and Handling Costs
Shipping costs, which are costs incurred to physically move product from the Company's premises to the customer's premises, are included in "
Selling, General, and Administrative Expenses
." Handling costs, which are costs incurred to store, move, and prepare products for shipment, are included in "
Cost of Sales
." For the years ended December 31,
2015
,
2014
, and
2013
, shipping costs of
$58.8 million
,
$60.5 million
, and
$56.6 million
, respectively, were included in "
Selling, General, and Administrative Expenses
."
Cash Equivalents
The Company considers highly liquid investments with original maturities of three months or less to be cash equivalents. These investments are valued at cost, which approximates fair value.
Investments
The Company invests its excess cash in fixed-rate debt securities, including time deposits, commercial paper, U.S. government and agency securities, municipal securities, asset-backed securities, corporate debt securities, and municipal securities. Investments with maturities of one year or less are classified as short-term, and investments with maturities greater than one year are classified as long-term. Investments that the Company has the ability and intent to hold until maturity are classified as held-to-maturity and carried at amortized cost. Investments that are classified as available-for-sale are carried at fair value with unrealized gains and losses included in "
Accumulated Other Comprehensive Loss
." The Company determines the appropriate classification of its investments in fixed-rate debt securities at the time of purchase and reevaluates such designation at each balance sheet date.
The Company also has long-term equity investments in companies that are in various stages of development. Certain of these investments are designated as available-for-sale. Other investments in unconsolidated affiliates are accounted for under the cost or the equity method of accounting, as appropriate. The Company accounts for investments in limited partnerships or limited liability corporations, whereby the Company owns a minimum of
5%
of the investee's outstanding voting stock, under the equity method of accounting. These investments are recorded at the amount of the Company's investment and adjusted each period for the Company's share of the investee's income or loss and dividends paid. As investments accounted for under the cost
45
EDWARDS LIFESCIENCES CORPORATION
NOTES TO CONSOLIDATED FINANCIAL STATEMENTS (Continued)
2. SUMMARY OF SIGNIFICANT ACCOUNTING POLICIES (Continued)
method do not have readily determinable fair values, the Company only estimates fair value if there are identified events or changes in circumstances that could have a significant adverse effect on the investment's fair value.
Realized gains and losses on investments that are sold are determined using the specific identification method or the first-in, first-out method, depending on the investment type, and recorded to "
Other Expense, net
." Income relating to investments in fixed-rate debt securities is recorded to "
Interest Income.
"
The Company periodically reviews its investments for impairment. When the fair value of an investment declines below cost, management uses the following criteria to determine if such a decline should be considered other-than-temporary and result in a recognized loss:
|
•
|
the duration and extent to which the market value has been less than cost;
|
|
•
|
the financial condition and near term prospects of the investee/issuer;
|
|
•
|
the reasons for the decline in market value;
|
|
•
|
the Company's ability and intent to hold the investment for a period of time sufficient to allow for any anticipated recovery in market value; and
|
|
•
|
the investee's performance against product development milestones.
|
Allowance for Doubtful Accounts
The Company records allowances for doubtful accounts based on customer-specific analysis and general matters such as current assessments of past due balances and economic conditions. When evaluating its allowances for doubtful accounts related to receivables from customers in certain European countries that have historically paid beyond the stated terms, the Company's analysis considers a number of factors including evidence of the customer's ability to comply with credit terms, economic conditions, and procedures implemented by the Company to collect the historical receivables. Additional allowances for doubtful accounts may be required if there is deterioration in past due balances, if economic conditions are less favorable than the Company has anticipated, or for customer-specific circumstances, such as financial difficulty. The allowance for doubtful accounts was
$13.1 million
and
$11.3 million
at December 31,
2015
and
2014
, respectively.
Inventories
Inventories are stated at the lower of cost (first-in, first-out method) or market value. Market value for raw materials is based on replacement costs, and for other inventory classifications is based on net realizable value.
A write-down for excess or inactive inventory is recorded for inventory which is obsolete, nearing its expiration date (generally triggered at
six months
prior to expiration), is damaged, or slow moving (generally defined as quantities in excess of a
two
-year supply). The allowance for excess and obsolete inventory was
$30.1 million
and
$32.2 million
at December 31,
2015
and
2014
, respectively.
The Company allocates to inventory general and administrative costs that are related to the production process. These costs include insurance, manufacturing accounting personnel, human resources personnel, and information technology. During the years ended December 31,
2015
,
2014
, and
2013
, the Company allocated
$30.6 million
,
$29.1 million
, and
$25.9 million
, respectively, of general and administrative costs to inventory. General and administrative costs included in inventory at December 31,
2015
and
2014
were
$16.8 million
and
$17.5 million
, respectively.
At December 31,
2015
and
2014
, approximately
$58.8 million
and
$46.2 million
, respectively, of the Company's finished goods inventories were held on consignment.
46
EDWARDS LIFESCIENCES CORPORATION
NOTES TO CONSOLIDATED FINANCIAL STATEMENTS (Continued)
2. SUMMARY OF SIGNIFICANT ACCOUNTING POLICIES (Continued)
Property, Plant, and Equipment
Property, plant, and equipment are recorded at cost. Depreciation is principally calculated for financial reporting purposes on the straight-line method over the estimated useful lives of the related assets, which range from
10
to
40 years
for buildings and improvements, from
3
to
15 years
for machinery and equipment, and from
3
to
10 years
for software. Leasehold improvements are amortized over the life of the related facility leases or the asset, whichever is shorter. Straight-line and accelerated methods of depreciation are used for income tax purposes.
Depreciation expense for property, plant, and equipment was
$58.7 million
,
$57.5 million
, and
$53.1 million
for the years ended December 31,
2015
,
2014
, and
2013
, respectively. Repairs and maintenance expense was
$30.9 million
,
$25.9 million
, and
$21.7 million
for the years ended December 31,
2015
,
2014
, and
2013
, respectively.
Impairment of Goodwill and Long-lived Assets
Goodwill is reviewed for impairment annually in the fourth quarter of each fiscal year or whenever an event occurs or circumstances change that would indicate that the carrying amount may be impaired. The Company identifies its reporting units and determines the carrying value of each reporting unit by assigning the assets and liabilities, including existing goodwill, to those reporting units. The fair value of the reporting unit is estimated based on the Company's market capitalization and a market revenue multiple. If the carrying value of the reporting unit exceeds its estimated fair value, then the Company measures the amount of the impairment loss by comparing the implied fair value of goodwill to its carrying value. In
2015
,
2014
, and
2013
, the Company did not record any impairment loss as the fair value of each reporting unit significantly exceeded its respective carrying value.
Indefinite-lived intangible assets relate to in-process research and development ("IPR&D") acquired in business combinations. The estimated fair values of IPR&D projects acquired in a business combination which have not reached technological feasibility are capitalized and accounted for as indefinite-lived intangible assets subject to impairment testing until completion or abandonment of the projects. Upon successful completion of the project, the capitalized amount is amortized over its estimated useful life. If the project is abandoned, all remaining capitalized amounts are written off immediately. Indefinite-lived intangible assets are reviewed for impairment annually, or whenever an event occurs or circumstances change that would indicate the carrying amount may be impaired. An impairment loss is recognized when the asset's carrying value exceeds its fair value. IPR&D projects acquired in an asset acquisition are expensed unless the project has an alternative future use.
Management reviews the carrying amounts of other finite-lived intangible assets and long-lived tangible assets whenever events or circumstances indicate that the carrying amounts of an asset may not be recoverable. Impairment indicators include, among other conditions, cash flow deficits, historic or anticipated declines in revenue or operating profit, and adverse legal or regulatory developments. If it is determined that such indicators are present and the review indicates that the assets will not be fully recoverable, based on undiscounted estimated cash flows over the remaining amortization periods, their carrying values are reduced to estimated fair market value. Estimated fair market value is determined primarily using the anticipated cash flows discounted at a rate commensurate with the risk involved. For the purposes of identifying and measuring impairment, long-lived assets are grouped with other assets and liabilities at the lowest level for which identifiable cash flows are largely independent of the cash flows of other assets and liabilities.
Income Taxes
Deferred tax assets and liabilities are recognized for the expected future tax consequences of events that have been recognized in the Company's financial statements or tax returns. The Company evaluates quarterly the realizability of its deferred tax assets by assessing its valuation allowance and adjusting the amount, if necessary. The factors used to assess the likelihood of realization are both historical experience and the Company's forecast of future taxable income and available tax planning strategies that could be implemented to realize the net deferred tax assets. Failure to achieve forecasted taxable income in the applicable taxing jurisdictions could affect the ultimate realization of deferred tax assets and could result in an increase in the Company's effective tax rate on future earnings.
47
EDWARDS LIFESCIENCES CORPORATION
NOTES TO CONSOLIDATED FINANCIAL STATEMENTS (Continued)
2. SUMMARY OF SIGNIFICANT ACCOUNTING POLICIES (Continued)
When assessing whether a windfall tax benefit relating to stock-based compensation has been realized, the Company follows the with and without approach, under which the windfall benefit is recognized only if an incremental benefit is provided after considering all other tax attributes presently available to the Company. Consideration is given only to the direct impact of stock awards when calculating the amount of windfalls and shortfalls.
The Company is subject to income taxes in the United States and numerous foreign jurisdictions. Significant judgment is required in evaluating the Company's uncertain tax positions and determining its provision for income taxes. The Company recognizes the financial statement benefit of a tax position only after determining that a position would more likely than not be sustained based upon its technical merit if challenged by the relevant taxing authority and taken by management to the court of last resort. For tax positions meeting the more-likely-than-not threshold, the amount recognized in the consolidated financial statements is the largest benefit that has a greater than
50%
likelihood of being realized upon settlement with the relevant tax authority. The Company recognizes interest and penalties related to income tax matters in income tax expense.
Research and Development Costs
Research and development costs are charged to expense when incurred.
Earnings per Share
Basic earnings per share is computed by dividing net income by the weighted-average common shares outstanding during a period. Employee equity share options, nonvested shares, and similar equity instruments granted by the Company are treated as potential common shares in computing diluted earnings per share. Diluted shares outstanding include the dilutive effect of restricted stock units and in-the-money options. The dilutive impact of the restricted stock units and in-the-money options is calculated based on the average share price for each fiscal period using the treasury stock method. Under the treasury stock method, the amount that the employee must pay for exercising stock options, the amount of compensation expense for future service that the Company has not yet recognized, and the amount of tax benefits that would be recorded in "
Additional Paid-in Capital
" when the award becomes deductible are assumed to be used to repurchase shares. Potential common share equivalents have been excluded where their inclusion would be anti-dilutive.
The table below presents the computation of basic and diluted earnings per share (in millions, except for per share information):
|
|
Years Ended December 31,
|
||||||||||
|
|
2015
|
2014
|
2013
|
||||||||
|
Basic:
|
|
|
|
|
|
|
|||||
|
Net income
|
$
|
494.9
|
|
$
|
811.1
|
|
$
|
389.1
|
|
||
|
Weighted-average shares outstanding
|
215.5
|
|
213.0
|
|
223.4
|
|
|||||
|
Basic earnings per share
|
$
|
2.30
|
|
$
|
3.81
|
|
$
|
1.74
|
|
||
|
Diluted:
|
|
|
|
|
|
|
|||||
|
Net income
|
$
|
494.9
|
|
$
|
811.1
|
|
$
|
389.1
|
|
||
|
Weighted-average shares outstanding
|
215.5
|
|
213.0
|
|
223.4
|
|
|||||
|
Dilutive effect of stock plans
|
4.8
|
|
4.0
|
|
4.2
|
|
|||||
|
Dilutive weighted-average shares outstanding
|
220.3
|
|
217.0
|
|
227.6
|
|
|||||
|
Diluted earnings per share
|
$
|
2.25
|
|
$
|
3.74
|
|
$
|
1.71
|
|
||
Stock options and restricted stock units to purchase approximately
1.4 million
,
4.8 million
, and
6.5 million
shares for the years ended December 31,
2015
,
2014
, and
2013
, respectively, were outstanding, but were not included in the computation of diluted earnings per share because the effect would have been anti-dilutive.
48
EDWARDS LIFESCIENCES CORPORATION
NOTES TO CONSOLIDATED FINANCIAL STATEMENTS (Continued)
2. SUMMARY OF SIGNIFICANT ACCOUNTING POLICIES (Continued)
Stock-based Compensation
The Company measures and recognizes compensation expense for all stock-based awards based on estimated fair values. Stock-based awards consist of stock options, restricted stock units (service-based, market-based, and performance-based), and employee stock purchase subscriptions. Stock-based compensation cost is measured at the grant date based on the fair value of the award and is recognized as expense over the requisite service period (vesting period) on a straight-line basis. For performance-based restricted stock units, the Company recognizes stock-based compensation expense if and when the Company concludes that it is probable that the performance condition will be achieved, net of estimated forfeitures. The Company reassesses the probability of vesting at each quarter end and adjusts the stock-based compensation expense based on its probability assessment. Forfeitures are estimated at the time of grant and revised, if necessary, in subsequent periods if actual forfeitures differ from those estimates. Upon exercise of stock options or vesting of restricted stock units, the Company issues common stock.
Total stock-based compensation expense was as follows (in millions):
|
|
Years Ended December 31,
|
||||||||||
|
|
2015
|
2014
|
2013
|
||||||||
|
Cost of sales
|
$
|
6.8
|
|
$
|
6.1
|
|
$
|
5.9
|
|
||
|
Selling, general, and administrative expenses
|
34.3
|
|
34.9
|
|
34.7
|
|
|||||
|
Research and development expenses
|
8.8
|
|
7.3
|
|
6.8
|
|
|||||
|
Total stock-based compensation expense
|
$
|
49.9
|
|
$
|
48.3
|
|
$
|
47.4
|
|
||
Upon retirement, all unvested stock options and performance-based restricted stock units are immediately forfeited. In addition, upon retirement, a participant will immediately vest in
25%
of service-based restricted stock units for each full year of employment with the Company measured from the grant date. All remaining unvested service-based restricted stock units are immediately forfeited. For market-based restricted stock units, upon retirement and in certain other specified cases, a participant will receive a pro-rated portion of the shares that would ultimately be issued based on attainment of the performance goals as determined on the vesting date. The pro-rated portion is based on the participant's whole months of service with the Company during the performance period prior to the date of termination.
Derivatives
The Company uses derivative financial instruments to manage interest rate and foreign currency risks. It is the Company's policy not to enter into derivative financial instruments for speculative purposes. The Company uses interest rate swaps to convert a portion of its fixed-rate debt into variable-rate debt. These interest rate swaps are designated as fair value hedges and meet the shortcut method requirements under the accounting standards for derivatives and hedging. Accordingly, changes in the fair values of the interest rate swaps are considered to exactly offset changes in the fair value of the underlying long-term debt. The Company uses foreign currency forward exchange contracts to offset the changes due to currency rate movements in the amount of future cash flows associated with intercompany transactions and certain local currency expenses expected to occur within the next
13 months
. These foreign currency forward exchange contracts are designated as cash flow hedges. Certain of the Company's locations have assets and liabilities denominated in currencies other than their functional currencies resulting principally from intercompany and local currency transactions. The Company uses foreign currency forward exchange contracts and foreign currency option contracts that are not designated as hedging instruments to offset the transaction gains and losses associated with certain of these assets and liabilities. The Company also uses foreign currency forward exchange contracts to protect its net investment in certain foreign subsidiaries from adverse changes in foreign currency exchange rates. These foreign currency forward exchange contracts are designated as net investment hedges. All foreign currency forward exchange contracts and foreign currency option contracts are denominated in currencies of major industrial countries, principally the Euro and the Japanese yen.
All derivative financial instruments are recognized at fair value in the consolidated balance sheets. For each derivative instrument that is designated and effective as a fair value hedge, the gain or loss on the derivative is recognized immediately to earnings, and offsets the loss or gain on the underlying hedged item. The gain or loss on fair value hedges is classified in net interest expense, as they hedge the interest rate risk associated with the Company's fixed-rate debt. The Company reports in
49
EDWARDS LIFESCIENCES CORPORATION
NOTES TO CONSOLIDATED FINANCIAL STATEMENTS (Continued)
2. SUMMARY OF SIGNIFICANT ACCOUNTING POLICIES (Continued)
"
Accumulated Other Comprehensive Loss
" the effective portion of the gain or loss on derivative financial instruments that are designated, and that qualify, as cash flow hedges. The Company reclassifies these gains and losses into earnings in the same period in which the underlying hedged transactions affect earnings. The effective portions of net investment hedges are reported in "
Accumulated Other Comprehensive Loss
" as a part of the cumulative translation adjustment, and would be reclassified into earnings if the underlying net investment is sold or substantially liquidated. The ineffective portions of cash flow hedges and net investment hedges are recorded in current period earnings. During
2015
,
2014
, and
2013
, the Company did not record any gains or losses due to hedge ineffectiveness. The gains and losses on derivative financial instruments for which the Company does not elect hedge accounting treatment are recognized in the consolidated statements of operations in each period based upon the change in the fair value of the derivative financial instrument. Cash flows from net investment hedges are reported as investing activities in the consolidated statements of cash flows, and cash flows from all other derivative financial instruments are reported as operating activities.
Derivative financial instruments involve credit risk in the event the counterparty should default. It is the Company's policy to execute such instruments with global financial institutions that the Company believes to be creditworthy. The Company diversifies its derivative financial instruments among counterparties to minimize exposure to any one of these entities. The Company also uses International Swap Dealers Association master-netting agreements. The master-netting agreements provide for the net settlement of all contracts through a single payment in a single currency in the event of default, as defined by the agreements.
Recently Adopted Accounting Standards
In November 2015, the Financial Accounting Standards Board ("FASB") issued an amendment to the accounting guidance on income taxes impacting the presentation of deferred income taxes. The guidance requires an entity to classify
deferred tax liabilities and assets as noncurrent in a classified statement of financial position. The guidance is effective for annual reporting periods beginning after December 15, 2016 and interim periods therein, with early adoption allowed. The Company early adopted this guidance and has applied the guidance retrospectively to all periods presented. The impact on the December 31, 2014 balance sheet was a reclassification of
$63.5 million
from current "
Deferred Income Taxes
" and
$8.3 million
from "
Accrued and Other Liabilities
" to long-term
"Deferred Income Taxes
" (increase of
$62.2 million
) and "
Other Long-term Liabilities
" (increase of
$7.0 million
).
New Accounting Standards Not Yet Adopted
In January 2016, the FASB issued an amendment to the accounting guidance on financial instruments. The guidance primarily affects the accounting for equity investments, financial liabilities under the fair value option, and the presentation and disclosure requirements for financial instruments. In addition, the FASB clarified guidance related to the valuation allowance assessment when recognizing deferred tax assets resulting from unrealized losses on available-for-sale debt securities. The guidance is effective for fiscal years beginning after December 15, 2017, including interim periods within those fiscal years. The Company is currently assessing the impact this guidance will have on its consolidated financial statements.
In September 2015, the FASB issued an update to the guidance on business combinations. The new guidance requires that an acquirer recognize adjustments to provisional amounts that are identified during the measurement period in the reporting period in which the adjustment amounts are determined. The guidance is effective for fiscal years beginning after December 15, 2015, including interim periods within those fiscal years. The Company does not expect the adoption of this guidance will have a material impact on its consolidated financial statements.
In July 2015, the FASB issued an update to the accounting guidance on inventory. The new guidance requires an entity to measure inventory within the scope of the amendment at the lower of cost and net realizable value. Net realizable value is the estimated selling prices in the ordinary course of business, less reasonably predictable costs of completion, disposal, and transportation. The guidance is effective for fiscal years beginning after December 15, 2016, including interim periods within those fiscal years. The Company does not expect the adoption of this guidance will have a material impact on its consolidated financial statements.
In April 2015, the FASB issued an amendment to the accounting guidance on the presentation of debt issuance costs. The guidance requires an entity to present debt issuance costs related to a recognized debt liability as a direct deduction from the
50
EDWARDS LIFESCIENCES CORPORATION
NOTES TO CONSOLIDATED FINANCIAL STATEMENTS (Continued)
2. SUMMARY OF SIGNIFICANT ACCOUNTING POLICIES (Continued)
carrying amount of that debt, consistent with debt discounts. In August 2015, the FASB clarified that for a line-of-credit arrangement, a company can continue to defer and present debt issuance costs as an asset and subsequently amortize the debt issuance costs over the term of the line-of-credit arrangement, whether or not there are any outstanding borrowings on the line-of-credit arrangement. The guidance is effective for annual reporting periods beginning after December 31, 2015 and interim periods within those periods, and must be applied retrospectively to each prior reporting period presented. The Company does not expect the adoption of this guidance will have a material impact on its consolidated financial statements.
In May 2014, the FASB issued an update to the accounting guidance on revenue recognition. The new guidance provides a comprehensive, principles-based approach to revenue recognition, and supersedes most previous revenue recognition guidance. The core principle of the guidance is that an entity should recognize revenue to depict the transfer of promised goods or services to customers in an amount that reflects the consideration to which the entity expects to be entitled in exchange for those goods or services. The guidance also requires improved disclosures on the nature, amount, timing, and uncertainty of revenue that is recognized. In August 2015, the FASB issued an update to the accounting guidance to defer the effective date by one year, such that the new standard will be effective for annual reporting periods beginning after December 15, 2017 and interim periods therein. The new guidance can be applied retrospectively to each prior reporting period presented, or retrospectively with the cumulative effect of the change recognized at the date of the initial application. The Company is currently assessing the impact this guidance will have on its consolidated financial statements, and has not yet selected a transition method.
3. INTELLECTUAL PROPERTY LITIGATION EXPENSES (INCOME), NET
In May 2014, the Company entered into an agreement with Medtronic, Inc. and its affiliates ("Medtronic") to settle all outstanding patent litigation between the companies, including all cases related to transcatheter heart valves. Pursuant to the agreement, all pending cases or appeals in courts and patent offices worldwide have been dismissed, and the parties will not litigate patent disputes with each other in the field of transcatheter valves for the
eight
-year term of the agreement. Under the terms of a patent cross-license that is part of the agreement, Medtronic made a one-time, upfront payment to the Company in the amount of
$750.0 million
. In addition, Medtronic will pay the Company quarterly license royalty payments through April 2022. For sales in the United States, the royalty payments will be based on a percentage of Medtronic's sales of transcatheter aortic valves, subject to a minimum annual payment of
$40.0 million
and a maximum annual payment of
$60.0 million
. A separate royalty payment will be calculated based on sales of Medtronic transcatheter aortic valves manufactured in the United States but sold elsewhere.
The Company accounted for the settlement agreement as a multiple-element arrangement and allocated the total consideration to the identifiable elements based upon their relative fair value. The consideration assigned to each element was as follows (in millions):
|
Past damages
|
$
|
754.3
|
|
|
License agreement
|
238.0
|
|
|
|
Covenant not to sue
|
77.7
|
|
|
|
Total
|
$
|
1,070.0
|
|
The Company recognized the upfront payment of
$750.0 million
in "
Intellectual Property Litigation Expenses (Income), net
" during the second quarter of 2014. The accounting guidance limits the amount to be recognized upfront to the amount of cash received. The remaining fair value associated with the past damages element, as well as the license agreement and the covenant not to sue, will be recognized in "
Net Sales
" over the term of the license agreement as delivery occurs since the Company considers the future royalties to be part of its revenue-earning activities that constitute its ongoing major or central operations.
In February 2013, the Company received
$83.6 million
from Medtronic in satisfaction of the initial April 2010 jury award of damages for infringement of the United States Andersen transcatheter heart valve patent, including accrued interest.
The Company incurred external legal costs related to intellectual property litigation of
$7.0 million
,
$9.6 million
, and
$22.1 million
during
2015
,
2014
, and
2013
, respectively.
51
EDWARDS LIFESCIENCES CORPORATION
NOTES TO CONSOLIDATED FINANCIAL STATEMENTS (Continued)
4. SPECIAL CHARGES
|
|
Years Ended December 31,
|
||||||||||
|
|
2015
|
2014
|
2013
|
||||||||
|
|
(in millions)
|
||||||||||
|
Charitable foundation contribution
|
$
|
—
|
|
$
|
50.0
|
|
$
|
—
|
|
||
|
Acquisition of IPR&D
|
—
|
|
10.2
|
|
—
|
|
|||||
|
Settlement
|
—
|
|
7.5
|
|
—
|
|
|||||
|
Asset write-down
|
—
|
|
3.0
|
|
—
|
|
|||||
|
Realignment expenses
|
—
|
|
—
|
|
10.4
|
|
|||||
|
IPR&D impairment
|
—
|
|
—
|
|
5.9
|
|
|||||
|
Total special charges
|
$
|
—
|
|
$
|
70.7
|
|
$
|
16.3
|
|
||
Charitable Foundation Contribution
In June 2014, the Company contributed
$50.0 million
to the Edwards Lifesciences Foundation, a related-party not-for-profit organization intended to provide philanthropic support to health- and community-focused charitable organizations. The contribution was irrevocable and was recorded as an expense at the time of payment.
Acquisition of IPR&D
In December 2014, the Company acquired technology for use in its transcatheter mitral valve program. In connection with this acquisition, the Company recorded a
$10.2 million
IPR&D charge, including related expenses. The acquired technology has no alternative uses. Additional design developments, bench testing, pre-clinical studies, and human clinical studies must be successfully completed prior to selling any product. Under the terms of the purchase agreement, the Company must pay an additional
$10.0 million
if, within
9 years
of the acquisition closing date, the Company receives CE Mark for a transcatheter mitral valve repair or replacement product that incorporates the acquired technology.
Settlement
In March 2014, the Company recorded a
$7.5 million
charge to settle past and future obligations related to one of its intellectual property agreements.
Asset Write-down
In September 2014, due to a strategic shift of the Company's investment initiatives, the Company decided to refocus resources from its automated glucose monitoring program. As a result, the Company recorded a charge of
$3.0 million
to write down an intangible asset and fixed assets, and to record severance costs. In addition, the Company recorded a
$2.0 million
charge to "
Cost of Sales
," primarily related to the disposal of inventory and equipment held by customers.
Realignment Expenses
In December 2013, the Company recorded a
$10.4 million
charge related primarily to severance expenses associated with a global workforce realignment impacting
118
employees. As of
December 31, 2015
, the Company's remaining severance obligations of
$1.5 million
are expected to be substantially paid by the end of 2016.
IPR&D Impairment
In December 2013, the Company recorded a
$5.9 million
write-off of IPR&D assets acquired from Embrella Cardiovascular, Inc. For further information, see Note 8.
52
EDWARDS LIFESCIENCES CORPORATION
NOTES TO CONSOLIDATED FINANCIAL STATEMENTS (Continued)
5. COMPOSITION OF CERTAIN FINANCIAL STATEMENT CAPTIONS
Components of selected captions in the consolidated balance sheets are as follows:
|
|
As of December 31,
|
||||||
|
|
2015
|
2014
|
|||||
|
|
(in millions)
|
||||||
|
Accounts receivable, net (a)
|
|
|
|
|
|||
|
Trade accounts receivable
|
$
|
322.2
|
|
$
|
293.1
|
|
|
|
Allowance for doubtful accounts
|
(6.8
|
)
|
(5.1
|
)
|
|||
|
$
|
315.4
|
|
$
|
288.0
|
|
||
|
Inventories
|
|
|
|
|
|||
|
Raw materials
|
$
|
63.8
|
|
$
|
67.4
|
|
|
|
Work in process
|
64.1
|
|
59.3
|
|
|||
|
Finished products
|
212.0
|
|
170.1
|
|
|||
|
$
|
339.9
|
|
$
|
296.8
|
|
||
|
Property, plant, and equipment, net
|
|
|
|
|
|||
|
Land
|
$
|
25.1
|
|
$
|
25.4
|
|
|
|
Buildings and leasehold improvements
|
293.4
|
|
270.6
|
|
|||
|
Machinery and equipment
|
328.6
|
|
320.8
|
|
|||
|
Equipment with customers
|
34.6
|
|
41.0
|
|
|||
|
Software
|
97.4
|
|
99.6
|
|
|||
|
Construction in progress
|
75.2
|
|
50.9
|
|
|||
|
854.3
|
|
808.3
|
|
||||
|
Accumulated depreciation
|
(371.8
|
)
|
(365.4
|
)
|
|||
|
$
|
482.5
|
|
$
|
442.9
|
|
||
|
Long-term accounts receivable, net (a)
|
|
|
|
|
|||
|
Long-term trade accounts receivable
|
$
|
9.9
|
|
$
|
12.0
|
|
|
|
Allowance for doubtful accounts
|
(6.3
|
)
|
(6.2
|
)
|
|||
|
$
|
3.6
|
|
$
|
5.8
|
|
||
|
Accrued and other liabilities
|
|
|
|
|
|||
|
Employee compensation and withholdings
|
$
|
209.4
|
|
$
|
190.5
|
|
|
|
Research and development accruals
|
38.6
|
|
39.9
|
|
|||
|
Property, payroll, and other taxes
|
34.5
|
|
32.7
|
|
|||
|
Accrued rebates
|
23.9
|
|
11.7
|
|
|||
|
Taxes payable
|
14.5
|
|
9.1
|
|
|||
|
Severance and realignment reserves
|
19.1
|
|
11.8
|
|
|||
|
Litigation reserves (Note 17)
|
5.6
|
|
4.4
|
|
|||
|
Fair value of derivatives
|
4.2
|
|
2.6
|
|
|||
|
Other accrued liabilities
|
62.5
|
|
65.2
|
|
|||
|
$
|
412.3
|
|
$
|
367.9
|
|
||
_______________________________________________________________________________
|
(a)
|
As of December 31,
2015
and
2014
, the Company's accounts receivables, net of the allowance for doubtful accounts, from customers in certain European countries were
$58.4 million
and
$69.7 million
, respectively. Balances from customers located in these countries that are expected to be collected beyond one year have been discounted to present value based on the estimated collection date.
|
53
EDWARDS LIFESCIENCES CORPORATION
NOTES TO CONSOLIDATED FINANCIAL STATEMENTS (Continued)
6. INVESTMENTS
Debt Securities
Investments in debt securities at the end of each period were as follows (in millions):
|
|
December 31, 2015
|
December 31, 2014
|
|||||||||||||||||||||||||||||
|
Held-to-maturity
|
Cost
|
Gross Unrealized Gains
|
Gross Unrealized Losses
|
Fair Value
|
Cost
|
Gross Unrealized Gains
|
Gross Unrealized Losses
|
Fair Value
|
|||||||||||||||||||||||
|
Bank time deposits
|
$
|
440.1
|
|
$
|
—
|
|
$
|
—
|
|
$
|
440.1
|
|
$
|
661.5
|
|
$
|
—
|
|
$
|
—
|
|
$
|
661.5
|
|
|||||||
|
Commercial paper
|
—
|
|
—
|
|
—
|
|
—
|
|
80.0
|
|
—
|
|
—
|
|
80.0
|
|
|||||||||||||||
|
U.S. government and agency securities
|
32.5
|
|
—
|
|
(0.2
|
)
|
32.3
|
|
58.9
|
|
0.1
|
|
(0.1
|
)
|
58.9
|
|
|||||||||||||||
|
Asset-backed securities
|
1.2
|
|
—
|
|
—
|
|
1.2
|
|
8.2
|
|
—
|
|
—
|
|
8.2
|
|
|||||||||||||||
|
Corporate debt securities
|
16.4
|
|
—
|
|
—
|
|
16.4
|
|
24.7
|
|
—
|
|
—
|
|
24.7
|
|
|||||||||||||||
|
Municipal securities
|
5.2
|
|
—
|
|
—
|
|
5.2
|
|
6.1
|
|
—
|
|
—
|
|
6.1
|
|
|||||||||||||||
|
$
|
495.4
|
|
$
|
—
|
|
$
|
(0.2
|
)
|
$
|
495.2
|
|
$
|
839.4
|
|
$
|
0.1
|
|
$
|
(0.1
|
)
|
$
|
839.4
|
|
||||||||
|
Available-for-sale
|
|||||||||||||||||||||||||||||||
|
Commercial paper
|
$
|
28.1
|
|
$
|
—
|
|
$
|
—
|
|
$
|
28.1
|
|
$
|
13.0
|
|
$
|
—
|
|
$
|
—
|
|
$
|
13.0
|
|
|||||||
|
U.S. government and agency securities
|
38.7
|
|
—
|
|
(0.2
|
)
|
38.5
|
|
1.0
|
|
—
|
|
—
|
|
1.0
|
|
|||||||||||||||
|
Asset-backed securities
|
62.8
|
|
—
|
|
(0.2
|
)
|
62.6
|
|
42.9
|
|
—
|
|
—
|
|
42.9
|
|
|||||||||||||||
|
Corporate debt securities
|
230.0
|
|
—
|
|
(1.3
|
)
|
228.7
|
|
103.6
|
|
—
|
|
(0.4
|
)
|
103.2
|
|
|||||||||||||||
|
Municipal securities
|
4.7
|
|
—
|
|
—
|
|
4.7
|
|
—
|
|
—
|
|
—
|
|
—
|
|
|||||||||||||||
|
$
|
364.3
|
|
$
|
—
|
|
$
|
(1.7
|
)
|
$
|
362.6
|
|
$
|
160.5
|
|
$
|
—
|
|
$
|
(0.4
|
)
|
$
|
160.1
|
|
||||||||
The cost and fair value of investments in debt securities, by contractual maturity, as of
December 31, 2015
were as follows:
|
|
Held-to-Maturity
|
Available-for-Sale
|
|||||||||||||
|
|
Cost
|
Fair Value
|
Cost
|
Fair Value
|
|||||||||||
|
|
(in millions)
|
||||||||||||||
|
Due in 1 year or less
|
$
|
466.8
|
|
$
|
466.8
|
|
$
|
39.5
|
|
$
|
39.5
|
|
|||
|
Due after 1 year through 5 years
|
16.0
|
|
15.9
|
|
265.1
|
|
263.6
|
|
|||||||
|
Instruments not due at a single maturity date
|
12.6
|
|
12.5
|
|
59.7
|
|
59.5
|
|
|||||||
|
$
|
495.4
|
|
$
|
495.2
|
|
$
|
364.3
|
|
$
|
362.6
|
|
||||
Actual maturities may differ from the contractual maturities due to call or prepayment rights.
54
EDWARDS LIFESCIENCES CORPORATION
NOTES TO CONSOLIDATED FINANCIAL STATEMENTS (Continued)
6. INVESTMENTS (Continued)
Investments in Unconsolidated Affiliates
The Company has a number of equity investments in privately and publicly held companies. Investments in these unconsolidated affiliates are recorded in "
Long-term Investments
" on the consolidated balance sheets, and are as follows:
|
|
December 31,
|
||||||
|
|
2015
|
2014
|
|||||
|
|
(in millions)
|
||||||
|
Available-for-sale investments
|
|
|
|
|
|||
|
Cost
|
$
|
—
|
|
$
|
—
|
|
|
|
Unrealized gains
|
0.2
|
|
0.4
|
|
|||
|
Fair value of available-for-sale investments
|
0.2
|
|
0.4
|
|
|||
|
Equity method investments
|
|
|
|
|
|||
|
Cost
|
10.9
|
|
12.8
|
|
|||
|
Equity in losses
|
(4.2
|
)
|
(3.5
|
)
|
|||
|
Carrying value of equity method investments
|
6.7
|
|
9.3
|
|
|||
|
Cost method investments
|
|
|
|
|
|||
|
Carrying value of cost method investments
|
21.3
|
|
16.7
|
|
|||
|
Total investments in unconsolidated affiliates
|
$
|
28.2
|
|
$
|
26.4
|
|
|
In December 2015, the Company made a
$1.5 million
investment in Harpoon Medical, Inc. ("Harpoon Medical"). As part of the agreement, the Company also paid
$11.5 million
, included in "
Other Assets
," for an exclusive option to acquire Harpoon Medical for up to
$250.0 million
, depending upon the achievement of certain milestones and regulatory approvals. Harpoon Medical is developing a surgical device for minimally invasive mitral valve repair and the treatment of mitral valve regurgitation that is currently in the clinical testing phase, and is financed primarily through equity investments.
In December 2014, the Company made a
$10.0 million
investment in one of its existing cost method investees, CardioKinetix, Inc. ("CardioKinetix"), for a total investment carrying value of
$14.4 million
. As part of the agreement, the Company also paid
$15.0 million
, included in "
Other Assets,
" for an exclusive option to acquire CardioKinetix for up to
$375.0 million
, depending upon the achievement of certain milestones and regulatory approvals. CardioKinetix is pioneering a catheter-based treatment for heart failure that is currently in the clinical testing phase, and is financed primarily through equity investments.
Harpoon Medical and CardioKinetix are VIEs; however, the Company has determined that it is not the primary beneficiary of these VIEs since the Company does not have the power to direct the activities of the VIEs that most significantly impact their economic performance. The Company made this determination based on the development stage of the VIEs' products; the Company's inability to exercise influence over the VIEs, based on the Company's ownership percentage and voting rights, as well as its lack of involvement in day-to-day operations and management decisions; and the fact that the option to acquire each of the VIEs is currently significantly out of the money. Accordingly, the Company accounts for these investments as cost method investments. The Company's maximum exposure to loss as a result of its involvement with CardioKinetix and Harpoon Medical is limited to the carrying amount of its investment and the cost of the option to acquire each of these entities.
During
2015
,
2014
, and
2013
, the gross realized gains or losses from sales of available-for-sale investments were not material.
55
EDWARDS LIFESCIENCES CORPORATION
NOTES TO CONSOLIDATED FINANCIAL STATEMENTS (Continued)
7. ACQUISITION
On July 3, 2015, the Company entered into an agreement and plan of merger to acquire CardiAQ Valve Technologies, Inc. ("CardiAQ") for an aggregate cash purchase price of
$350.0 million
, subject to certain adjustments. The transaction closed on August 26, 2015, and the cash purchase price after the adjustments was
$348.0 million
. In addition, the Company agreed to pay an additional
$50.0 million
if a certain European regulatory approval is obtained within
48
months of the acquisition closing date. The Company recognized in "
Other Long-term Liabilities
" a
$30.3 million
liability for the estimated fair value of this contingent milestone payment. The fair value of the contingent milestone payment will be remeasured each quarter, with changes in the fair value recognized within operating expenses on the consolidated statements of operations. For further information on the fair value of the contingent milestone payment, see Note 10.
In connection with the acquisition, the Company placed
$30.0 million
of the purchase price into escrow to satisfy any claims for indemnification made in accordance with the merger agreement. Any funds remaining
15
months after the acquisition date will be disbursed to CardiAQ’s former shareholders. Acquisition-related costs of
$1.2 million
were recorded in “
Selling, General, and Administrative Expenses
” during the year ended
December 31, 2015
.
CardiAQ is a developer of a transcatheter mitral valve replacement system. The Company plans to integrate the acquired technology platform into its mitral heart valve program. The acquisition was accounted for as a business combination. Tangible and intangible assets acquired were recorded based on their estimated fair values at the acquisition date. The excess of the purchase price over the fair value of net assets acquired was recorded to goodwill. The following table summarizes the fair values of the assets acquired and liabilities assumed (in millions):
|
Current assets
|
$
|
28.1
|
|
||
|
Property and equipment, net
|
0.2
|
|
|||
|
Goodwill
|
258.9
|
|
|||
|
IPR&D
|
190.0
|
|
|||
|
Current liabilities assumed
|
(32.9
|
)
|
|||
|
Deferred income taxes
|
(66.0
|
)
|
|||
|
Contingent consideration
|
(30.3
|
)
|
|||
|
Total cash purchase price
|
348.0
|
|
|||
|
Less: cash acquired
|
(27.9
|
)
|
|||
|
Total cash purchase price, net of cash acquired
|
$
|
320.1
|
|
||
Goodwill includes expected synergies and other benefits the Company believes will result from the acquisition. Goodwill was assigned to the Company’s United States segment and is not deductible for tax purposes. IPR&D has been capitalized at fair value as an intangible asset with an indefinite life and will be assessed for impairment in subsequent periods. The fair value of the IPR&D was determined using the income approach. This approach determines fair value based on cash flow projections which are discounted to present value using a risk-adjusted rate of return. The discount rate used to determine the fair value of the IPR&D was
16.5%
. Completion of successful design developments, bench testing, pre-clinical studies and human clinical studies are required prior to selling any product. The risks and uncertainties associated with completing development within a reasonable period of time include those related to the design, development, and manufacturability of the product, the success of pre-clinical and clinical studies, and the timing of regulatory approvals. The valuation assumed
$97.7 million
of additional research and development expenditures would be incurred prior to the date of product introduction. In the valuation, net cash inflows were modeled to commence in 2018. Upon completion of development, the underlying research and development intangible asset will be amortized over its estimated useful life.
The results of operations for CardiAQ have been included in the accompanying consolidated financial statements from the date of acquisition. Pro forma results have not been presented as the results of CardiAQ are not material in relation to the consolidated financial statements of the Company.
56
EDWARDS LIFESCIENCES CORPORATION
NOTES TO CONSOLIDATED FINANCIAL STATEMENTS (Continued)
8. GOODWILL AND OTHER INTANGIBLE ASSETS
On July 3, 2015, the Company acquired CardiAQ (see Note 7). This transaction resulted in an increase to goodwill of
$258.9 million
and IPR&D of
$190.0 million
.
The changes in the carrying amount of goodwill, by segment, during the years ended
December 31, 2015
and
2014
were as follows:
|
|
United
States |
Europe
|
Total
|
||||||||
|
|
(in millions)
|
||||||||||
|
Goodwill at December 31, 2013
|
$
|
308.3
|
|
$
|
77.1
|
|
$
|
385.4
|
|
||
|
Currency translation adjustment
|
—
|
|
(9.4
|
)
|
(9.4
|
)
|
|||||
|
Goodwill at December 31, 2014
|
308.3
|
|
67.7
|
|
376.0
|
|
|||||
|
Goodwill acquired during the year
|
258.9
|
|
—
|
|
258.9
|
|
|||||
|
Currency translation adjustment
|
—
|
|
(6.6
|
)
|
(6.6
|
)
|
|||||
|
Goodwill at December 31, 2015
|
$
|
567.2
|
|
$
|
61.1
|
|
$
|
628.3
|
|
||
Other intangible assets consist of the following (in millions):
|
|
December 31,
|
||||||||||||||||||||||
|
|
2015
|
2014
|
|||||||||||||||||||||
|
|
Cost
|
Accumulated
Amortization |
Net
Carrying Value |
Cost
|
Accumulated
Amortization |
Net
Carrying Value |
|||||||||||||||||
|
Amortizable intangible assets
|
|
|
|
|
|
|
|
|
|
|
|
|
|||||||||||
|
Patents
|
$
|
180.6
|
|
$
|
(172.3
|
)
|
$
|
8.3
|
|
$
|
181.1
|
|
$
|
(168.6
|
)
|
$
|
12.5
|
|
|||||
|
Developed technology
|
43.6
|
|
(37.9
|
)
|
5.7
|
|
45.6
|
|
(36.7
|
)
|
8.9
|
|
|||||||||||
|
Other
|
10.0
|
|
(8.6
|
)
|
1.4
|
|
10.4
|
|
(8.4
|
)
|
2.0
|
|
|||||||||||
|
234.2
|
|
(218.8
|
)
|
15.4
|
|
237.1
|
|
(213.7
|
)
|
23.4
|
|
||||||||||||
|
Unamortizable intangible assets
|
|
|
|
|
|
|
|
|
|
|
|
|
|||||||||||
|
IPR&D
|
190.0
|
|
—
|
|
190.0
|
|
—
|
|
—
|
|
—
|
|
|||||||||||
|
$
|
424.2
|
|
$
|
(218.8
|
)
|
$
|
205.4
|
|
$
|
237.1
|
|
$
|
(213.7
|
)
|
$
|
23.4
|
|
||||||
Goodwill and IPR&D resulting from purchase business combinations are not subject to amortization. Other acquired intangible assets with definite lives are amortized on a straight-line basis over their expected useful lives. The Company expenses costs incurred to renew or extend the term of acquired intangible assets.
Amortization expense related to other intangible assets for the years ended December 31,
2015
,
2014
, and
2013
was
$7.1 million
,
$8.4 million
, and
$9.9 million
, respectively. Estimated amortization expense for each of the years ending December 31 is as follows (in millions):
|
2016
|
$
|
6.9
|
|
|
2017
|
6.3
|
|
|
|
2018
|
1.2
|
|
|
|
2019
|
0.7
|
|
|
|
2020
|
0.2
|
|
|
57
EDWARDS LIFESCIENCES CORPORATION
NOTES TO CONSOLIDATED FINANCIAL STATEMENTS (Continued)
In October 2013, the Company issued
$600.0 million
of fixed-rate unsecured senior notes (the "Notes"). Interest is payable semi-annually in arrears, with payment due in April and October. The Company may redeem the Notes, in whole or in part, at any time and from time to time at specified redemption prices. In addition, upon the occurrence of certain change of control triggering events, the Company may be required to repurchase all or a portion of the Notes at a price equal to
101%
of their principal amount, plus accrued and unpaid interest. The Notes also include covenants that limit the Company's ability to incur secured indebtedness, enter into sale and leaseback transactions, and consolidate, merge, or transfer all or substantially all of its assets. The following is a summary of the Notes as of December 31,
2015
and
2014
:
|
|
December 31,
|
||||||||||||
|
|
2015
|
|
2014
|
||||||||||
|
|
Amount
|
Effective
Interest Rate |
|
Amount
|
Effective
Interest Rate |
||||||||
|
(in millions)
|
(in millions)
|
||||||||||||
|
Fixed-rate 2.875% notes due October 15, 2018
|
$
|
600.0
|
|
2.983
|
%
|
$
|
600.0
|
|
2.983
|
%
|
|||
|
Unamortized discount
|
(1.7
|
)
|
|
|
|
(2.3
|
)
|
|
|
||||
|
Hedge accounting fair value adjustments (see Note 11)
|
1.6
|
|
|
|
|
0.4
|
|
|
|
||||
|
Total carrying amount
|
$
|
599.9
|
|
|
|
|
$
|
598.1
|
|
|
|
||
As of
December 31, 2015
and
2014
, the fair value of the Notes, based on Level 2 inputs, was
$607.7 million
and
$610.4 million
, respectively. Issuance costs of
$5.4 million
, as well as the issuance discount on the Notes, are being amortized to interest expense over the term of the Notes.
The Company has a
Five
-Year Credit Agreement ("the Credit Agreement") which matures on July 18, 2019. The Credit Agreement provides up to an aggregate of
$750.0 million
in borrowings in multiple currencies. The Company may increase the amount available under the Credit Agreement, subject to agreement of the lenders, by up to an additional
$250.0 million
in the aggregate. Borrowings generally bear interest at the London interbank offered rate ("LIBOR") plus a spread ranging from
1.0%
to
1.5%
, depending on the leverage ratio, as defined in the Credit Agreement. The Company also pays a facility fee ranging from
0.125%
to
0.25%
, depending on the leverage ratio, on the entire credit commitment available, whether or not drawn. The facility fee is expensed as incurred. During
2015
, there were
no
borrowings under the Credit Agreement, and the facility fee ranged from
0.125%
to
0.15%
. Issuance costs of
$3.0 million
are being amortized to interest expense over the term of the Credit Agreement. The Credit Agreement is unsecured and contains various financial and other covenants, including a maximum leverage ratio and a minimum interest coverage ratio, as defined in the Credit Agreement. The Company was in compliance with all covenants at
December 31, 2015
.
The weighted-average interest rate under all debt obligations was
2.9%
and
2.7%
at
December 31, 2015
and
2014
, respectively.
Certain facilities and equipment are leased under operating leases expiring at various dates. Most of the operating leases contain renewal options. Total expense for all operating leases was
$22.5 million
,
$22.9 million
, and
$25.9 million
for the years
2015
,
2014
, and
2013
, respectively.
58
EDWARDS LIFESCIENCES CORPORATION
NOTES TO CONSOLIDATED FINANCIAL STATEMENTS (Continued)
9. DEBT, CREDIT FACILITIES AND LEASE OBLIGATIONS (Continued)
Future minimum lease payments (including interest) under non-cancelable operating leases and aggregate debt maturities at
December 31, 2015
were as follows (in millions):
|
|
Operating
Leases |
Aggregate
Debt Maturities |
|||||
|
2016
|
$
|
20.1
|
|
$
|
—
|
|
|
|
2017
|
14.9
|
|
—
|
|
|||
|
2018
|
9.4
|
|
600.0
|
|
|||
|
2019
|
5.1
|
|
—
|
|
|||
|
2020
|
4.5
|
|
—
|
|
|||
|
Thereafter
|
18.8
|
|
—
|
|
|||
|
Total obligations and commitments
|
$
|
72.8
|
|
$
|
600.0
|
|
|
10. FAIR VALUE MEASUREMENTS
The consolidated financial statements include financial instruments for which the fair market value of such instruments may differ from amounts reflected on a historical cost basis. Financial instruments of the Company consist of cash deposits, accounts and other receivables, investments, accounts payable, certain accrued liabilities, and borrowings under a revolving credit agreement. The carrying value of these financial instruments generally approximates fair value due to their short-term nature. Financial instruments also include long-term notes payable. See Note 9 for further information on the fair value of the Notes.
Fair value is defined as the price that would be received to sell an asset or paid to transfer a liability in an orderly transaction between market participants. The Company prioritizes the inputs used to determine fair values in one of the following three categories:
Level 1—Quoted market prices in active markets for identical assets or liabilities.
Level 2—Inputs, other than quoted prices in active markets, that are observable, either directly or indirectly.
Level 3—Unobservable inputs that are not corroborated by market data.
In certain cases, the inputs used to measure fair value may fall into different levels of the fair value hierarchy. In such cases, the level in the fair value hierarchy within which the fair value measurement in its entirety falls has been determined based on the lowest level input that is significant to the fair value measurement in its entirety.
59
EDWARDS LIFESCIENCES CORPORATION
NOTES TO CONSOLIDATED FINANCIAL STATEMENTS (Continued)
10. FAIR VALUE MEASUREMENTS (Continued)
Assets and Liabilities Measured at Fair Value on a Recurring Basis
The following table summarizes the Company's financial instruments which are measured at fair value on a recurring basis as of
December 31, 2015
and
2014
(in millions):
|
December 31, 2015
|
Level 1
|
Level 2
|
Level 3
|
Total
|
|||||||||||
|
Assets
|
|
|
|
|
|
|
|
|
|||||||
|
Cash equivalents
|
$
|
3.5
|
|
$
|
8.5
|
|
$
|
—
|
|
$
|
12.0
|
|
|||
|
Available-for-sale investments:
|
|
|
|||||||||||||
|
Corporate debt securities
|
—
|
|
228.7
|
|
—
|
|
228.7
|
|
|||||||
|
Asset-backed securities
|
—
|
|
62.6
|
|
—
|
|
62.6
|
|
|||||||
|
U.S. government and agency securities
|
9.6
|
|
28.9
|
|
—
|
|
38.5
|
|
|||||||
|
Commercial paper
|
—
|
|
28.1
|
|
—
|
|
28.1
|
|
|||||||
|
Municipal securities
|
—
|
|
4.7
|
|
—
|
|
4.7
|
|
|||||||
|
Equity investments in unconsolidated affiliates
|
0.1
|
|
—
|
|
—
|
|
0.1
|
|
|||||||
|
Investments held for deferred compensation plans
|
35.3
|
|
—
|
|
—
|
|
35.3
|
|
|||||||
|
Derivatives
|
—
|
|
23.3
|
|
—
|
|
23.3
|
|
|||||||
|
$
|
48.5
|
|
$
|
384.8
|
|
$
|
—
|
|
$
|
433.3
|
|
||||
|
Liabilities
|
|
|
|
|
|
|
|
|
|||||||
|
Derivatives
|
$
|
—
|
|
$
|
4.2
|
|
$
|
—
|
|
$
|
4.2
|
|
|||
|
Deferred compensation plans
|
35.5
|
|
—
|
|
—
|
|
35.5
|
|
|||||||
|
Contingent consideration obligation
|
—
|
|
—
|
|
30.5
|
|
30.5
|
|
|||||||
|
$
|
35.5
|
|
$
|
4.2
|
|
$
|
30.5
|
|
$
|
70.2
|
|
||||
|
December 31, 2014
|
|||||||||||||||
|
Assets
|
|||||||||||||||
|
Cash equivalents
|
$
|
32.6
|
|
$
|
12.0
|
|
$
|
—
|
|
$
|
44.6
|
|
|||
|
Available-for-sale investments:
|
|
|
|
|
|
|
|
|
|||||||
|
Corporate debt securities
|
—
|
|
103.2
|
|
—
|
|
103.2
|
|
|||||||
|
Asset-backed securities
|
—
|
|
42.9
|
|
—
|
|
42.9
|
|
|||||||
|
U.S. government and agency securities
|
—
|
|
1.0
|
|
—
|
|
1.0
|
|
|||||||
|
Commercial paper
|
—
|
|
13.0
|
|
—
|
|
13.0
|
|
|||||||
|
Equity investments in unconsolidated affiliates
|
0.4
|
|
—
|
|
—
|
|
0.4
|
|
|||||||
|
Investments held for deferred compensation plans
|
28.2
|
|
—
|
|
—
|
|
28.2
|
|
|||||||
|
Derivatives
|
—
|
|
50.7
|
|
—
|
|
50.7
|
|
|||||||
|
$
|
61.2
|
|
$
|
222.8
|
|
$
|
—
|
|
$
|
284.0
|
|
||||
|
Liabilities
|
|
|
|
|
|
|
|
|
|||||||
|
Derivatives
|
$
|
—
|
|
$
|
2.6
|
|
$
|
—
|
|
$
|
2.6
|
|
|||
|
Deferred compensation plans
|
28.7
|
|
—
|
|
—
|
|
28.7
|
|
|||||||
|
$
|
28.7
|
|
$
|
2.6
|
|
$
|
—
|
|
$
|
31.3
|
|
||||
60
EDWARDS LIFESCIENCES CORPORATION
NOTES TO CONSOLIDATED FINANCIAL STATEMENTS (Continued)
10. FAIR VALUE MEASUREMENTS (Continued)
The following table summarizes the changes in fair value of the contingent consideration obligation for the year ended
December 31, 2015
(in millions):
|
Balance at December 31, 2014
|
$
|
—
|
|
|
Additions
|
30.3
|
|
|
|
Changes in fair value
|
0.2
|
|
|
|
Balance at December 31, 2015
|
$
|
30.5
|
|
Cash Equivalents and Available-for-sale Investments
The Company estimates the fair values of its money market funds based on quoted prices in active markets for identical assets. The Company estimates the fair values of its commercial paper, U.S. government and agency securities, asset-backed securities, and corporate debt securities by taking into consideration valuations obtained from third-party pricing services. The pricing services use industry standard valuation models, including both income and market-based approaches, for which all significant inputs are observable, either directly or indirectly, to estimate fair value. These inputs include reported trades and broker-dealer quotes on the same or similar securities, benchmark yields, credit spreads, prepayment and default projections based on historical data, and other observable inputs. The Company independently reviews and validates the pricing received from the third-party pricing service by comparing the prices to prices reported by a secondary pricing source. The Company’s validation procedures have not resulted in an adjustment to the pricing received from the pricing service.
Investments in unconsolidated affiliates are long-term equity investments in companies that are in various stages of development. Certain of the Company's investments in unconsolidated affiliates are designated as available-for-sale. These investments are carried at fair market value based on quoted market prices.
Deferred Compensation Plans
The Company holds investments in trading securities related to its deferred compensation plans. The investments are in a variety of stock, bond, and money market mutual funds. The fair values of these investments and the corresponding liabilities are based on quoted market prices.
Derivative Instruments
The Company uses derivative financial instruments in the form of foreign currency forward exchange contracts and foreign currency option contracts to manage foreign currency exposures, and interest rate swap agreements to manage its interest rate exposures. All derivatives contracts are recognized on the balance sheet at their fair value. The fair value of foreign currency derivative financial instruments was estimated based on quoted market foreign exchange rates and market discount rates. The fair value of the interest rate swap agreements was determined based on a discounted cash flow analysis reflecting the contractual terms of the agreements and the
6
-month LIBOR forward interest rate curve. Judgment was employed in interpreting market data to develop estimates of fair value; accordingly, the estimates presented herein are not necessarily indicative of the amounts that the Company could realize in a current market exchange. The use of different market assumptions or valuation methodologies could have a material effect on the estimated fair value amounts.
Contingent Consideration Obligation
The Company recorded a contingent consideration obligation related to its acquisition of CardiAQ. The contingent consideration obligation was recorded at its estimated fair value, which was determined using a probability weighted discounted cash flow analysis that considered significant unobservable inputs. These inputs included a
2.5%
discount rate used to present value the projected cash flows, a
65.0%
probability of milestone achievement, and a projected payment date in 2018. The use of different assumptions could have a material effect on the estimated fair value amount.
61
EDWARDS LIFESCIENCES CORPORATION
NOTES TO CONSOLIDATED FINANCIAL STATEMENTS (Continued)
11. DERIVATIVE INSTRUMENTS AND HEDGING ACTIVITIES
The Company uses derivative financial instruments to manage its currency exchange rate risk and its interest rate risk as summarized below. Notional amounts are stated in United States dollar equivalents at spot exchange rates at the respective dates. The Company does not enter into these arrangements for trading or speculation purposes.
|
|
Notional Amount
|
||||||
|
|
December 31, 2015
|
December 31, 2014
|
|||||
|
|
(in millions)
|
||||||
|
Foreign currency forward exchange contracts
|
$
|
1,061.6
|
|
$
|
761.2
|
|
|
|
Interest rate swap agreements
|
300.0
|
|
300.0
|
|
|||
|
Foreign currency option contracts
|
—
|
|
9.2
|
|
|||
The following table presents the location and fair value amounts of derivative instruments reported in the consolidated balance sheets (in millions):
|
|
|
Fair Value
|
|||||||
|
|
Balance Sheet Location
|
December 31, 2015
|
December 31, 2014
|
||||||
|
Derivatives designated as hedging instruments
|
|
|
|
|
|
||||
|
Assets
|
|
|
|
|
|
||||
|
Foreign currency contracts
|
Other current assets
|
$
|
15.0
|
|
$
|
45.2
|
|
||
|
Interest rate swap agreements
|
Other assets
|
$
|
1.6
|
|
$
|
0.4
|
|
||
|
Liabilities
|
|
|
|
|
|
||||
|
Foreign currency contracts
|
Accrued and other liabilities
|
$
|
4.2
|
|
$
|
2.6
|
|
||
|
Derivatives not designated as hedging instruments
|
|
|
|
|
|
||||
|
Assets
|
|
|
|
|
|
||||
|
Foreign currency contracts
|
Other assets
|
$
|
6.7
|
|
$
|
5.1
|
|
||
62
EDWARDS LIFESCIENCES CORPORATION
NOTES TO CONSOLIDATED FINANCIAL STATEMENTS (Continued)
11. DERIVATIVE INSTRUMENTS AND HEDGING ACTIVITIES (Continued)
The following table presents the effect of master-netting agreements and rights of offset on the consolidated balance sheets (in millions):
|
|
|
|
|
Gross Amounts Not Offset in the Consolidated Balance Sheet
|
|
||||||||||||||||||
|
|
|
Gross Amounts
Offset in the
Consolidated
Balance Sheet
|
Net Amounts
Presented in the
Consolidated
Balance Sheet
|
||||||||||||||||||||
|
December 31, 2015
|
Gross
Amounts
|
Financial
Instruments
|
Cash
Collateral
Received
|
Net
Amount
|
|||||||||||||||||||
|
Derivative Assets
|
|
|
|
|
|
|
|
|
|
|
|
|
|||||||||||
|
Foreign currency contracts
|
$
|
21.7
|
|
$
|
—
|
|
$
|
21.7
|
|
$
|
(4.0
|
)
|
$
|
—
|
|
$
|
17.7
|
|
|||||
|
Interest rate swap agreements
|
$
|
1.6
|
|
$
|
—
|
|
$
|
1.6
|
|
$
|
—
|
|
$
|
—
|
|
$
|
1.6
|
|
|||||
|
Derivative Liabilities
|
|
|
|
|
|
|
|
|
|
|
|
|
|||||||||||
|
Foreign currency contracts
|
$
|
4.2
|
|
$
|
—
|
|
$
|
4.2
|
|
$
|
(4.0
|
)
|
$
|
—
|
|
$
|
0.2
|
|
|||||
|
December 31, 2014
|
|
|
|
|
|
|
|||||||||||||||||
|
Derivative Assets
|
|
|
|
|
|
|
|
|
|
|
|
|
|||||||||||
|
Foreign currency contracts
|
$
|
50.3
|
|
$
|
—
|
|
$
|
50.3
|
|
$
|
(2.6
|
)
|
$
|
—
|
|
$
|
47.7
|
|
|||||
|
Interest rate swap agreements
|
$
|
0.4
|
|
$
|
—
|
|
$
|
0.4
|
|
$
|
—
|
|
$
|
—
|
|
$
|
0.4
|
|
|||||
|
Derivative Liabilities
|
|
|
|
|
|
|
|
|
|
|
|
|
|||||||||||
|
Foreign currency contracts
|
$
|
2.6
|
|
$
|
—
|
|
$
|
2.6
|
|
$
|
(2.6
|
)
|
$
|
—
|
|
$
|
—
|
|
|||||
The following tables present the effect of derivative instruments on the consolidated statements of operations and consolidated statements of comprehensive income:
|
|
Amount of Gain or (Loss) Recognized in OCI on Derivative (Effective Portion)
|
Location of Gain or (Loss) Reclassified from Accumulated OCI into Income
|
Amount of Gain or (Loss) Reclassified from Accumulated OCI into Income
|
||||||||||||||
|
|
|||||||||||||||||
|
|
2015
|
2014
|
2015
|
2014
|
|||||||||||||
|
(in millions)
|
|
(in millions)
|
|||||||||||||||
|
Cash flow hedges
|
|||||||||||||||||
|
Foreign currency contracts
|
$
|
35.3
|
|
$
|
54.3
|
|
Cost of sales
|
$
|
67.1
|
|
$
|
7.6
|
|
||||
|
Selling, general and administrative expenses
|
$
|
0.9
|
|
$
|
—
|
|
|||||||||||
|
Net investment hedges
|
|||||||||||||||||
|
Foreign currency contracts
|
$
|
2.9
|
|
$
|
—
|
|
Other expense, net
|
$
|
—
|
|
$
|
—
|
|
||||
|
|
|
Amount of Gain or
(Loss) Recognized in
Income on Derivative (a)
|
|||||||||||
|
|
Location of Gain or
(Loss) Recognized in
Income on Derivative
|
||||||||||||
|
|
2015
|
2014
|
2013
|
||||||||||
|
|
(in millions)
|
||||||||||||
|
Fair value hedges
|
|||||||||||||
|
Interest rate swap agreements
|
Interest expense
|
$
|
1.2
|
|
$
|
4.4
|
|
$
|
(4.0
|
)
|
|||
_______________________________________________________________________________
|
(a)
|
The gains and losses on the interest rate swap agreements are fully offset by the changes in the fair value of the fixed-rate debt being hedged.
|
63
EDWARDS LIFESCIENCES CORPORATION
NOTES TO CONSOLIDATED FINANCIAL STATEMENTS (Continued)
11. DERIVATIVE INSTRUMENTS AND HEDGING ACTIVITIES (Continued)
|
|
|
Amount of Gain or
(Loss) Recognized in
Income on Derivative
|
|||||||||||
|
|
Location of Gain or
(Loss) Recognized in
Income on Derivative
|
||||||||||||
|
|
2015
|
2014
|
2013
|
||||||||||
|
|
(in millions)
|
||||||||||||
|
Derivatives not designated as hedging instruments
|
|||||||||||||
|
Foreign currency contracts
|
Other expense, net
|
$
|
6.6
|
|
$
|
13.7
|
|
$
|
18.4
|
|
|||
The Company expects that during
2016
it will reclassify to earnings a
$11.9 million
gain currently recorded in "
Accumulated Other Comprehensive Loss
."
For the years ended December 31,
2015
,
2014
, and
2013
, the Company did not record any gains or losses due to hedge ineffectiveness.
12. EMPLOYEE BENEFIT PLANS
Defined Benefit Plans
Edwards Lifesciences maintains defined benefit pension plans in Japan and certain European countries. Information regarding the Company's defined benefit pension plans is as follows:
|
|
Years Ended
December 31, |
||||||
|
|
2015
|
2014
|
|||||
|
(in millions)
|
|||||||
|
Change in projected benefit obligation:
|
|
|
|
|
|||
|
Beginning of year
|
$
|
123.1
|
|
$
|
111.2
|
|
|
|
Service cost
|
7.0
|
|
6.3
|
|
|||
|
Interest cost
|
1.5
|
|
2.2
|
|
|||
|
Participant contributions
|
1.8
|
|
1.9
|
|
|||
|
Actuarial loss (gain)
|
(1.4
|
)
|
12.0
|
|
|||
|
Benefits paid
|
(1.3
|
)
|
0.3
|
|
|||
|
Plan amendment
|
(2.9
|
)
|
(1.0
|
)
|
|||
|
Settlements
|
(4.1
|
)
|
—
|
|
|||
|
Currency exchange rate changes and other
|
(5.6
|
)
|
(9.8
|
)
|
|||
|
End of year
|
$
|
118.1
|
|
$
|
123.1
|
|
|
|
Change in fair value of plan assets:
|
|
|
|
|
|||
|
Beginning of year
|
$
|
73.8
|
|
$
|
68.5
|
|
|
|
Actual return on plan assets
|
1.3
|
|
4.2
|
|
|||
|
Employer contributions
|
6.1
|
|
5.0
|
|
|||
|
Participant contributions
|
1.8
|
|
1.9
|
|
|||
|
Settlements
|
(4.1
|
)
|
—
|
|
|||
|
Benefits paid
|
(1.3
|
)
|
0.3
|
|
|||
|
Currency exchange rate changes and other
|
(2.5
|
)
|
(6.1
|
)
|
|||
|
End of year
|
$
|
75.1
|
|
$
|
73.8
|
|
|
64
EDWARDS LIFESCIENCES CORPORATION
NOTES TO CONSOLIDATED FINANCIAL STATEMENTS (Continued)
12. EMPLOYEE BENEFIT PLANS (Continued)
|
Years Ended
December 31, |
|||||||
|
2015
|
2014
|
||||||
|
(in millions)
|
|||||||
|
Funded Status
|
|
|
|
|
|||
|
Projected benefit obligation
|
$
|
(118.1
|
)
|
$
|
(123.1
|
)
|
|
|
Plan assets at fair value
|
75.1
|
|
73.8
|
|
|||
|
Underfunded status
|
$
|
(43.0
|
)
|
$
|
(49.3
|
)
|
|
|
Net amounts recognized on the consolidated balance sheet:
|
|
|
|
|
|||
|
Other long-term liabilities
|
$
|
43.0
|
|
$
|
49.3
|
|
|
|
Accumulated other comprehensive loss, net of tax:
|
|
|
|
|
|||
|
Net actuarial loss
|
$
|
(20.0
|
)
|
$
|
(24.1
|
)
|
|
|
Net prior service credit
|
5.1
|
|
2.6
|
|
|||
|
Deferred income tax benefit
|
3.5
|
|
4.7
|
|
|||
|
Total
|
$
|
(11.4
|
)
|
$
|
(16.8
|
)
|
|
The accumulated benefit obligation ("ABO") for all defined benefit pension plans was
$103.7 million
and
$109.3 million
as of December 31,
2015
and
2014
, respectively. The projected benefit obligation and ABO were in excess of plan assets for all pension plans as of December 31,
2015
and
2014
.
The components of net periodic benefit cost are as follows (in millions):
|
|
Years Ended
December 31, |
||||||||||
|
|
2015
|
2014
|
2013
|
||||||||
|
Service cost, net
|
$
|
7.0
|
|
$
|
6.3
|
|
$
|
7.6
|
|
||
|
Interest cost
|
1.5
|
|
2.2
|
|
2.0
|
|
|||||
|
Expected return on plan assets
|
(1.5
|
)
|
(1.6
|
)
|
(1.2
|
)
|
|||||
|
Settlement
|
0.6
|
|
—
|
|
—
|
|
|||||
|
Amortization of actuarial loss
|
1.0
|
|
0.5
|
|
1.3
|
|
|||||
|
Amortization of prior service credit
|
(0.4
|
)
|
(0.3
|
)
|
(0.3
|
)
|
|||||
|
Net periodic pension benefit cost
|
$
|
8.2
|
|
$
|
7.1
|
|
$
|
9.4
|
|
||
The net actuarial loss and prior service credit that will be amortized from "
Accumulated Other Comprehensive Loss
" into net periodic benefits cost in
2016
are expected to be
$0.7 million
and
$(0.7) million
, respectively.
Expected long-term returns for each of the plans' strategic asset classes were developed through consultation with investment advisors. Several factors were considered, including survey of investment managers' expectations, current market data, minimum guaranteed returns in certain insurance contracts, and historical market returns over long periods. Using policy target allocation percentages and the asset class expected returns, a weighted-average expected return was calculated.
To select the discount rates for the defined benefit pension plans, the Company uses a modeling process that involves matching the expected duration of its benefit plans to a yield curve constructed from a portfolio of AA-rated fixed-income debt instruments, or their equivalent. For each country, the Company uses the implied yield of this hypothetical portfolio at the appropriate duration as a discount rate benchmark.
65
EDWARDS LIFESCIENCES CORPORATION
NOTES TO CONSOLIDATED FINANCIAL STATEMENTS (Continued)
12. EMPLOYEE BENEFIT PLANS (Continued)
The weighted-average assumptions used to determine the benefit obligations are as follows:
|
|
December 31,
|
||||
|
|
2015
|
2014
|
|||
|
Discount rate
|
1.0
|
%
|
1.4
|
%
|
|
|
Rate of compensation increase
|
2.7
|
%
|
3.0
|
%
|
|
|
Social securities increase
|
1.6
|
%
|
1.6
|
%
|
|
|
Pension increase
|
2.0
|
%
|
2.0
|
%
|
|
The weighted-average assumptions used to determine the net periodic benefit cost are as follows:
|
|
Years ended
December 31,
|
|||||||
|
|
2015
|
2014
|
2013
|
|||||
|
Discount rate
|
1.4
|
%
|
2.2
|
%
|
1.9
|
%
|
||
|
Expected return on plan assets
|
1.9
|
%
|
2.6
|
%
|
2.1
|
%
|
||
|
Rate of compensation increase
|
3.0
|
%
|
3.1
|
%
|
3.1
|
%
|
||
|
Social securities increase
|
1.6
|
%
|
1.8
|
%
|
1.8
|
%
|
||
|
Pension increase
|
2.0
|
%
|
2.0
|
%
|
2.0
|
%
|
||
Plan Assets
The Company's investment strategy for plan assets is to seek a competitive rate of return relative to an appropriate level of risk and to earn performance rates of return in accordance with the benchmarks adopted for each asset class. Risk management practices include diversification across asset classes and investment styles, and periodic rebalancing toward asset allocation targets.
The Administrative and Investment Committee decides on the defined benefit plan provider in each location and that provider decides the target allocation for the Company's defined benefit plan at that location. The target asset allocation selected reflects a risk/return profile the Company feels is appropriate relative to the plans' liability structure and return goals. In certain plans, asset allocations may be governed by local requirements. Target weighted-average asset allocations at December 31,
2015
, by asset category, are as follows:
|
Insurance contracts
|
80.5
|
%
|
|
Equity securities
|
11.9
|
%
|
|
Debt securities
|
7.6
|
%
|
|
Total
|
100.0
|
%
|
66
EDWARDS LIFESCIENCES CORPORATION
NOTES TO CONSOLIDATED FINANCIAL STATEMENTS (Continued)
12. EMPLOYEE BENEFIT PLANS (Continued)
The fair values of the Company's defined benefit plan assets at December 31,
2015
and
2014
, by asset category, are as follows (in millions):
|
December 31, 2015
|
Level 1
|
Level 2
|
Level 3
|
Total
|
|||||||||||
|
Asset Category
|
|
|
|
|
|
|
|
|
|||||||
|
Cash
|
$
|
2.7
|
|
$
|
—
|
|
$
|
—
|
|
$
|
2.7
|
|
|||
|
Equity securities:
|
|
|
|
|
|
|
|
|
|||||||
|
United States equities
|
3.5
|
|
—
|
|
—
|
|
3.5
|
|
|||||||
|
International equities
|
7.3
|
|
—
|
|
—
|
|
7.3
|
|
|||||||
|
Debt securities:
|
|
|
|
|
|
|
|
|
|||||||
|
United States government bonds
|
0.7
|
|
—
|
|
—
|
|
0.7
|
|
|||||||
|
International government bonds
|
4.1
|
|
—
|
|
—
|
|
4.1
|
|
|||||||
|
Insurance contracts
|
—
|
|
—
|
|
56.8
|
|
56.8
|
|
|||||||
|
$
|
18.3
|
|
$
|
—
|
|
$
|
56.8
|
|
$
|
75.1
|
|
||||
|
December 31, 2014
|
|
|
|
|
|
|
|
|
|||||||
|
Asset Category
|
|
|
|
|
|
|
|
|
|||||||
|
Cash
|
$
|
0.5
|
|
$
|
—
|
|
$
|
—
|
|
$
|
0.5
|
|
|||
|
Equity securities:
|
|
|
|
|
|
|
|
|
|||||||
|
United States equities
|
2.8
|
|
—
|
|
—
|
|
2.8
|
|
|||||||
|
International equities
|
6.8
|
|
—
|
|
—
|
|
6.8
|
|
|||||||
|
Debt securities:
|
|
|
|
|
|
|
|
|
|||||||
|
United States government bonds
|
0.6
|
|
—
|
|
—
|
|
0.6
|
|
|||||||
|
International government bonds
|
4.7
|
|
—
|
|
—
|
|
4.7
|
|
|||||||
|
Insurance contracts
|
—
|
|
—
|
|
58.4
|
|
58.4
|
|
|||||||
|
$
|
15.4
|
|
$
|
—
|
|
$
|
58.4
|
|
$
|
73.8
|
|
||||
The following table summarizes the changes in fair value of the Company's defined benefit plan assets that have been classified as Level 3 for the years ended December 31,
2015
and
2014
(in millions):
|
|
Insurance
Contracts |
||
|
Balance at December 31, 2013
|
$
|
54.6
|
|
|
Actual return on plan assets:
|
|
|
|
|
Relating to assets still held at December 31, 2014
|
3.0
|
|
|
|
Purchases, sales and settlements
|
4.9
|
|
|
|
Currency exchange rate impact
|
(4.1
|
)
|
|
|
Balance at December 31, 2014
|
58.4
|
|
|
|
Actual return on plan assets:
|
|
|
|
|
Relating to assets still held at December 31, 2015
|
(0.3
|
)
|
|
|
Purchases, sales and settlements
|
0.7
|
|
|
|
Currency exchange rate impact
|
(2.0
|
)
|
|
|
Balance at December 31, 2015
|
$
|
56.8
|
|
67
EDWARDS LIFESCIENCES CORPORATION
NOTES TO CONSOLIDATED FINANCIAL STATEMENTS (Continued)
12. EMPLOYEE BENEFIT PLANS (Continued)
Equity and debt securities are valued at fair value based on quoted market prices reported on the active markets on which the individual securities are traded. The insurance contracts are valued at the cash surrender value of the contracts, which is deemed to approximate its fair value.
The following benefit payments, which reflect expected future service, as appropriate, at December 31,
2015
, are expected to be paid (in millions):
|
2016
|
$
|
3.9
|
|
|
2017
|
3.9
|
|
|
|
2018
|
3.7
|
|
|
|
2019
|
3.7
|
|
|
|
2020
|
4.4
|
|
|
|
2021-2025
|
33.6
|
|
|
As of December 31,
2015
, expected employer contributions for
2016
are
$5.8 million
.
Defined Contribution Plans
The Company's employees in the United States and Puerto Rico are eligible to participate in a qualified 401(k) and 1165(e) plan, respectively. In the United States, participants may contribute up to
25%
of their eligible compensation (subject to tax code limitation) to the plan. Edwards Lifesciences matches the first
3%
of the participant's annual eligible compensation contributed to the plan on a dollar-for-dollar basis. Edwards Lifesciences matches the next
2%
of the participant's annual eligible compensation to the plan on a
50%
basis. In Puerto Rico, participants may contribute up to
25%
of their annual compensation (subject to tax code limitation) to the plan. Edwards Lifesciences matches the first
4%
of participant's annual eligible compensation contributed to the plan on a
50%
basis. The Company also provides a
2%
profit sharing contribution calculated on eligible earnings for each employee. Matching contributions relating to Edwards Lifesciences employees were
$15.3 million
,
$12.8 million
, and
$12.0 million
in
2015
,
2014
, and
2013
, respectively.
The Company also has nonqualified deferred compensation plans for a select group of employees. The plans provide eligible participants the opportunity to defer eligible compensation to future dates specified by the participant with a return based on investment alternatives selected by the participant. The amount accrued under these nonqualified plans was
$35.5 million
and
$28.7 million
at December 31,
2015
and
2014
, respectively.
13. COMMON STOCK
Treasury Stock
In July 2014, the Board of Directors approved a stock repurchase program without a specified end date authorizing the Company to purchase up to
$750.0 million
of the Company's common stock. Stock repurchased under this program will be used to offset obligations under the Company's employee stock option programs and reduce the total shares outstanding.
During
2015
,
2014
, and
2013
, the Company repurchased
2.6 million
,
4.4 million
, and
6.8 million
shares, respectively, at an aggregate cost of
$280.1 million
,
$300.9 million
, and
$497.0 million
, respectively, including shares purchased under the accelerated share repurchase ("ASR") agreement described below and shares acquired to satisfy tax withholding obligations in connection with the vesting of restricted stock units issued to employees. The timing and size of any future stock repurchases are subject to a variety of factors, including market conditions, stock prices, and other cash requirements.
Accelerated Share Repurchase
During 2013, the Company entered into an ASR agreement providing for the repurchase of the Company's common stock based on the volume-weighted average price ("VWAP") of the Company's common stock during the term of the agreement, less a discount. The ASR agreement was subject to collar provisions that established minimum and maximum number of shares to
68
EDWARDS LIFESCIENCES CORPORATION
NOTES TO CONSOLIDATED FINANCIAL STATEMENTS (Continued)
13. COMMON STOCK (Continued)
be repurchased. The following table summarizes the terms of the ASR agreement (dollars and shares in millions, except per-share data):
|
|
|
Initial Delivery
|
Final Settlement
|
||||||||||||||||||||
|
Agreement Date
|
Amount
Paid
|
Shares
Received
|
Price per
Share (a)
|
Value of
Shares as %
of Contract
Value
|
Settlement
Date
|
Total Shares
Received
|
Average Price
per Share (a)
|
||||||||||||||||
|
August 2013
|
$
|
250.0
|
|
3.1
|
|
$
|
72.39
|
|
90
|
%
|
October 2013
|
3.5
|
|
$
|
71.24
|
|
|||||||
_______________________________________________________________________________
|
(a)
|
The
two
-for-one stock split paid on December 11, 2015 excluded treasury shares. The shares and per share prices in the table above are reflected at the pre-split amounts and prices at the time of the transaction.
|
The ASR agreement was accounted for as two separate transactions: (a) the value of the initial delivery of shares was recorded as shares of common stock acquired in a treasury stock transaction on the acquisition date and (b) the remaining amount of the purchase price paid was recorded as a forward contract indexed to the Company's own common stock and was recorded in "
Additional Paid-in Capital
" on the consolidated balance sheets. The initial delivery of shares resulted in an immediate reduction of the outstanding shares used to calculate the weighted-average common shares outstanding for basic and diluted earnings per share. The Company determined that the forward contract indexed to the Company's common stock met all the applicable criteria for equity classification and, therefore, was not accounted for as a derivative instrument.
Employee and Director Stock Plans
The Edwards Lifesciences Corporation Long-term Stock Incentive Compensation Program (the "Program") provides for the grant of incentive and non-qualified stock options, restricted stock, and restricted stock units for eligible employees and contractors of the Company. Under the Program, these grants are awarded at a price equal to the fair market value at the date of grant based upon the closing price on that date. Options to purchase shares of the Company's common stock granted under the Program generally vest over predetermined periods of between
three
to
four years
and expire
seven years
after the date of grant. Service-based restricted stock units of the Company's common stock granted under the Program generally vest over predetermined periods ranging from
three
to
five years
after the date of grant. Market-based restricted stock units of the Company's common stock granted under the Program vest based on a combination of certain service and market conditions. The actual number of shares issued will be determined based on the Company's total shareholder return relative to a selected industry peer group over a
three
-year performance period, and may range from
0%
to
175%
of the targeted number of shares granted. Performance-based restricted stock units vest upon achievement of specified milestones. On May 14, 2015, an amendment and restatement of the Program was approved by the Company's stockholders. Under the amended Program, the number of shares of common stock available for issuance under the Program was
105.8 million
shares. No more than
11.2 million
shares reserved for issuance may be granted in the form of restricted stock or restricted stock units.
The Company also maintains the Nonemployee Directors Stock Incentive Compensation Program (the "Nonemployee Directors Program"). Under the Nonemployee Directors Program, each nonemployee director may receive annually up to
40,000
stock options or
16,000
restricted stock units of the Company's common stock, or a combination thereof, provided that in no event may the total value of the combined annual award exceed
$0.2 million
. Each option and restricted stock unit award granted in 2011 or prior generally vests in
three
equal annual installments. Each option and restricted stock unit award granted after 2011 generally vests after
one year
. Additionally, each nonemployee director may elect to receive all or a portion of the annual cash retainer to which the director is otherwise entitled through the issuance of stock options or restricted shares. Each option received as a deferral of the cash retainer immediately vests on the grant date, and each restricted share award vests after
one year
. Upon a director's initial election to the Board, the director receives an initial grant of stock options equal to a fair market value on grant date of
$0.2 million
. These grants vest over
three years
from the date of grant. Under the Nonemployee Directors Program, an aggregate of
2.8 million
shares of the Company's common stock has been authorized for issuance.
The Company has an employee stock purchase plan for United States employees and a plan for international employees (collectively "ESPP"). Under the ESPP, eligible employees may purchase shares of the Company's common stock at
85%
of the lower of the fair market value of Edwards Lifesciences common stock on the effective date of subscription or the date of purchase. Under the ESPP, employees can authorize the Company to withhold up to
12%
of their compensation for common
69
EDWARDS LIFESCIENCES CORPORATION
NOTES TO CONSOLIDATED FINANCIAL STATEMENTS (Continued)
13. COMMON STOCK (Continued)
stock purchases, subject to certain limitations. The ESPP is available to all active employees of the Company paid from the United States payroll and to eligible employees of the Company outside the United States, to the extent permitted by local law. The ESPP for United States employees is qualified under Section 423 of the Internal Revenue Code. The number of shares of common stock authorized for issuance under the ESPP was
13.8 million
shares.
The fair value of each option award and employee stock purchase subscription is estimated on the date of grant using the Black-Scholes option valuation model that uses the assumptions noted in the following tables. The risk-free interest rate is estimated using the U.S. Treasury yield curve and is based on the expected term of the award. Expected volatility is estimated based on a blend of the weighted-average of the historical volatility of Edwards Lifesciences' stock and the implied volatility from traded options on Edwards Lifesciences' stock. The expected term of awards granted is estimated from the vesting period of the award, as well as historical exercise behavior, and represents the period of time that awards granted are expected to be outstanding. The Company uses historical data to estimate forfeitures and has estimated an annual forfeiture rate of
6.0%
.
The Black-Scholes option pricing model was used with the following weighted-average assumptions for options granted during the following periods:
Option Awards
|
2015
|
2014
|
2013
|
|||||||||
|
Average risk-free interest rate
|
1.4
|
%
|
1.5
|
%
|
0.8
|
%
|
|||||
|
Expected dividend yield
|
None
|
|
None
|
|
None
|
|
|||||
|
Expected volatility
|
30
|
%
|
31
|
%
|
31
|
%
|
|||||
|
Expected life (years)
|
4.6
|
|
4.6
|
|
4.6
|
|
|||||
|
Fair value, per share
|
$
|
18.13
|
|
$
|
11.75
|
|
$
|
9.73
|
|
||
The Black-Scholes option pricing model was used with the following weighted-average assumptions for ESPP subscriptions granted during the following periods:
ESPP
|
2015
|
2014
|
2013
|
|||||||||
|
Average risk-free interest rate
|
0.2
|
%
|
0.1
|
%
|
0.1
|
%
|
|||||
|
Expected dividend yield
|
None
|
|
None
|
|
None
|
|
|||||
|
Expected volatility
|
28
|
%
|
30
|
%
|
33
|
%
|
|||||
|
Expected life (years)
|
0.6
|
|
0.6
|
|
0.6
|
|
|||||
|
Fair value, per share
|
$
|
15.59
|
|
$
|
8.59
|
|
$
|
9.93
|
|
||
The fair value of market-based restricted stock units was determined using a Monte Carlo simulation model, which uses multiple input variables to determine the probability of satisfying the market condition requirements. The weighted-average assumptions used to determine the fair value of the market-based restricted stock units during the years ended December 31,
2015
,
2014
, and
2013
included a risk-free interest rate of
1.0%
,
0.9%
, and
0.4%
, respectively, and an expected volatility rate of
31.0%
,
31.7%
, and
33.4%
, respectively.
70
EDWARDS LIFESCIENCES CORPORATION
NOTES TO CONSOLIDATED FINANCIAL STATEMENTS (Continued)
13. COMMON STOCK (Continued)
Stock option activity during the year ended
December 31, 2015
under the Program and the Nonemployee Directors Program was as follows (in millions, except years and per-share amounts):
|
|
Shares
|
Weighted-
Average
Exercise
Price
|
Weighted-
Average
Remaining
Contractual
Term
|
Aggregate
Intrinsic Value
|
||||||||
|
Outstanding as of December 31, 2014
|
12.8
|
|
$
|
33.93
|
|
|
|
|
||||
|
Options granted
|
1.8
|
|
66.41
|
|
|
|
|
|||||
|
Options exercised
|
(2.7
|
)
|
23.31
|
|
|
|
|
|||||
|
Options forfeited
|
(0.3
|
)
|
43.39
|
|
|
|
|
|||||
|
Outstanding as of December 31, 2015
|
11.6
|
|
41.14
|
|
3.8 years
|
$
|
438.0
|
|
||||
|
Exercisable as of December 31, 2015
|
7.1
|
|
35.70
|
|
2.9 years
|
308.8
|
|
|||||
|
Vested and expected to vest as of December 31, 2015
|
11.0
|
|
40.70
|
|
3.8 years
|
422.0
|
|
|||||
The following table summarizes nonvested restricted stock unit activity during the year ended
December 31, 2015
under the Program and the Nonemployee Directors Program (in millions, except per-share amounts):
|
|
Shares
|
Weighted-
Average
Grant-Date
Fair Value
|
||||
|
Nonvested as of December 31, 2014
|
1.8
|
|
$
|
40.27
|
|
|
|
Granted (a)
|
0.5
|
|
67.40
|
|
||
|
Vested
|
(0.6
|
)
|
42.56
|
|
||
|
Forfeited
|
(0.1
|
)
|
42.76
|
|
||
|
Nonvested as of December 31, 2015
|
1.6
|
|
47.99
|
|
||
_______________________________________________________________________________
|
(a)
|
Includes
68,000
shares of market-based restricted stock units granted during
2015
, which represents the targeted number of shares to be issued. As described above, the actual number of shares ultimately issued will be determined based on the Company's total shareholder return relative to a selected industry peer group. In addition, includes
43,000
shares of performance-based restricted stock units granted during 2015 which vest upon achievement of specified milestones.
|
The intrinsic value of stock options exercised and restricted stock units vested during the years ended
December 31, 2015
,
2014
, and
2013
were
$164.4 million
,
$158.8 million
, and
$73.9 million
, respectively. The intrinsic value of stock options is calculated as the amount by which the market price of the Company's common stock exceeds the exercise price of the option. During the years ended
December 31, 2015
,
2014
, and
2013
, the Company received cash from exercises of stock options of
$63.6 million
,
$93.2 million
, and
$26.3 million
, respectively, and realized tax benefits from exercises of stock options and vesting of restricted stock units of
$53.7 million
,
$51.9 million
, and
$24.7 million
, respectively. The total grant-date fair value of stock options vested during the years ended
December 31, 2015
,
2014
, and
2013
were
$23.1 million
,
$22.6 million
, and
$21.8 million
, respectively.
As of
December 31, 2015
, the total remaining unrecognized compensation expense related to nonvested stock options, restricted stock units, and employee stock purchase subscriptions amounted to
$91.1 million
, which will be amortized over the weighted-average remaining requisite service period of
30 months
.
71
EDWARDS LIFESCIENCES CORPORATION
NOTES TO CONSOLIDATED FINANCIAL STATEMENTS (Continued)
14. ACCUMULATED OTHER COMPREHENSIVE LOSS
Presented below is a summary of activity for each component of "
Accumulated Other Comprehensive Loss
" for the years ended
December 31, 2015
,
2014
, and
2013
.
|
|
Foreign
Currency
Translation
Adjustments
|
Unrealized Gain
on Cash
Flow Hedges
|
Unrealized Gain
(Loss) on
Available-for-sale
Investments
|
Unrealized
Pension
Costs (a)
|
Total
Accumulated
Other
Comprehensive
Loss
|
||||||||||||||
|
|
(in millions)
|
||||||||||||||||||
|
December 31, 2012
|
$
|
(25.8
|
)
|
$
|
7.0
|
|
$
|
1.4
|
|
$
|
(20.5
|
)
|
$
|
(37.9
|
)
|
||||
|
Other comprehensive income (loss) before reclassifications
|
5.6
|
|
16.3
|
|
(1.2
|
)
|
9.9
|
|
30.6
|
|
|||||||||
|
Amounts reclassified from accumulated other comprehensive loss
|
—
|
|
(21.5
|
)
|
—
|
|
1.0
|
|
(20.5
|
)
|
|||||||||
|
Deferred income tax benefit (expense)
|
—
|
|
1.7
|
|
0.1
|
|
(1.6
|
)
|
0.2
|
|
|||||||||
|
December 31, 2013
|
(20.2
|
)
|
3.5
|
|
0.3
|
|
(11.2
|
)
|
(27.6
|
)
|
|||||||||
|
Other comprehensive (loss) income before reclassifications
|
(96.2
|
)
|
54.3
|
|
(0.8
|
)
|
(7.1
|
)
|
(49.8
|
)
|
|||||||||
|
Amounts reclassified from accumulated other comprehensive loss
|
—
|
|
(7.6
|
)
|
0.4
|
|
0.2
|
|
(7.0
|
)
|
|||||||||
|
Deferred income tax (expense) benefit
|
—
|
|
(17.9
|
)
|
0.1
|
|
1.3
|
|
(16.5
|
)
|
|||||||||
|
December 31, 2014
|
(116.4
|
)
|
32.3
|
|
—
|
|
(16.8
|
)
|
(100.9
|
)
|
|||||||||
|
Other comprehensive (loss) income before reclassifications
|
(64.0
|
)
|
35.3
|
|
(2.6
|
)
|
5.4
|
|
(25.9
|
)
|
|||||||||
|
Amounts reclassified from accumulated other comprehensive loss
|
—
|
|
(68.0
|
)
|
1.1
|
|
1.2
|
|
(65.7
|
)
|
|||||||||
|
Deferred income tax (expense) benefit
|
(1.1
|
)
|
12.2
|
|
—
|
|
(1.2
|
)
|
9.9
|
|
|||||||||
|
December 31, 2015
|
$
|
(181.5
|
)
|
$
|
11.8
|
|
$
|
(1.5
|
)
|
$
|
(11.4
|
)
|
$
|
(182.6
|
)
|
||||
_______________________________________________________________________________
72
EDWARDS LIFESCIENCES CORPORATION
NOTES TO CONSOLIDATED FINANCIAL STATEMENTS (Continued)
14. ACCUMULATED OTHER COMPREHENSIVE LOSS (Continued)
|
(a)
|
For the years ended
December 31, 2015
,
2014
, and
2013
, the change in unrealized pension costs consisted of the following (in millions):
|
|
|
Pre-Tax
Amount |
Tax (Expense) Benefit
|
Net of Tax
Amount |
||||||||
|
2015
|
|
|
|
|
|
|
|||||
|
Prior service credit arising during period
|
$
|
2.9
|
|
$
|
(0.3
|
)
|
$
|
2.6
|
|
||
|
Amortization of prior service credit
|
(0.4
|
)
|
0.1
|
|
(0.3
|
)
|
|||||
|
Net prior service credit arising during period
|
2.5
|
|
(0.2
|
)
|
2.3
|
|
|||||
|
Net actuarial gain arising during period
|
4.1
|
|
(1.0
|
)
|
3.1
|
|
|||||
|
Unrealized pension credits, net
|
$
|
6.6
|
|
$
|
(1.2
|
)
|
$
|
5.4
|
|
||
|
2014
|
|
|
|
|
|
|
|||||
|
Prior service credit arising during period
|
$
|
0.8
|
|
$
|
—
|
|
$
|
0.8
|
|
||
|
Amortization of prior service credit
|
(0.3
|
)
|
—
|
|
(0.3
|
)
|
|||||
|
Net prior service credit arising during period
|
0.5
|
|
—
|
|
0.5
|
|
|||||
|
Net actuarial loss arising during period
|
(7.4
|
)
|
1.3
|
|
(6.1
|
)
|
|||||
|
Unrealized pension costs, net
|
$
|
(6.9
|
)
|
$
|
1.3
|
|
$
|
(5.6
|
)
|
||
|
2013
|
|
|
|
|
|
|
|||||
|
Prior service cost arising during period
|
$
|
—
|
|
$
|
—
|
|
$
|
—
|
|
||
|
Amortization of prior service credit
|
(0.3
|
)
|
—
|
|
(0.3
|
)
|
|||||
|
Net prior service cost arising during period
|
(0.3
|
)
|
—
|
|
(0.3
|
)
|
|||||
|
Net actuarial gain arising during period
|
11.2
|
|
(1.6
|
)
|
9.6
|
|
|||||
|
Unrealized pension credits, net
|
$
|
10.9
|
|
$
|
(1.6
|
)
|
$
|
9.3
|
|
||
The following table provides information about amounts reclassified from "
Accumulated Other Comprehensive Loss
" (in millions):
|
|
Years Ended December 31,
|
|
|||||||
|
Details about Accumulated Other Comprehensive Loss
Components
|
2015
|
2014
|
Affected Line on Consolidated
Statements of Operations
|
||||||
|
Gain on cash flow hedges
|
$
|
68.0
|
|
$
|
7.6
|
|
Cost of sales
|
||
|
(25.0
|
)
|
(2.9
|
)
|
Provision for income taxes
|
|||||
|
$
|
43.0
|
|
$
|
4.7
|
|
Net of tax
|
|||
|
Loss on available-for-sale investments
|
$
|
(1.1
|
)
|
$
|
(0.4
|
)
|
Other expense, net
|
||
|
—
|
|
—
|
|
Provision for income taxes
|
|||||
|
$
|
(1.1
|
)
|
$
|
(0.4
|
)
|
Net of tax
|
|||
|
Amortization of pension adjustments
|
$
|
(1.2
|
)
|
$
|
(0.2
|
)
|
(a)
|
||
|
0.2
|
|
0.1
|
|
Provision for income taxes
|
|||||
|
$
|
(1.0
|
)
|
$
|
(0.1
|
)
|
Net of tax
|
|||
_______________________________________________________________________________
|
(a)
|
This item is included in the components of net periodic benefit costs. See Note 12 for additional information.
|
73
EDWARDS LIFESCIENCES CORPORATION
NOTES TO CONSOLIDATED FINANCIAL STATEMENTS (Continued)
15. OTHER EXPENSE, NET
|
|
Years Ended December 31,
|
||||||||||
|
|
2015
|
2014
|
2013
|
||||||||
|
(in millions)
|
|||||||||||
|
Foreign exchange losses, net
|
$
|
4.8
|
|
$
|
2.0
|
|
$
|
1.5
|
|
||
|
Loss on investments
|
(0.1
|
)
|
4.5
|
|
0.4
|
|
|||||
|
Promissory note impairment
|
—
|
|
4.0
|
|
—
|
|
|||||
|
Insurance settlement gain
|
—
|
|
(3.7
|
)
|
—
|
|
|||||
|
Lease contract termination costs
|
—
|
|
1.0
|
|
—
|
|
|||||
|
Other
|
(0.7
|
)
|
(0.1
|
)
|
(0.6
|
)
|
|||||
|
Total other expense, net
|
$
|
4.0
|
|
$
|
7.7
|
|
$
|
1.3
|
|
||
16. INCOME TAXES
The Company's income before provision for income taxes was generated from United States and international operations as follows (in millions):
|
|
Years Ended December 31,
|
||||||||||
|
|
2015
|
2014
|
2013
|
||||||||
|
United States
|
$
|
182.8
|
|
$
|
791.1
|
|
$
|
215.5
|
|
||
|
International, including Puerto Rico
|
439.6
|
|
352.9
|
|
295.7
|
|
|||||
|
$
|
622.4
|
|
$
|
1,144.0
|
|
$
|
511.2
|
|
|||
The provision for income taxes consists of the following (in millions):
|
|
Years Ended December 31,
|
||||||||||
|
|
2015
|
2014
|
2013
|
||||||||
|
Current
|
|
|
|
|
|
|
|||||
|
United States:
|
|
|
|
|
|
|
|||||
|
Federal
|
$
|
102.4
|
|
$
|
341.5
|
|
$
|
42.5
|
|
||
|
State and local
|
7.4
|
|
23.3
|
|
5.7
|
|
|||||
|
International, including Puerto Rico
|
33.5
|
|
34.8
|
|
27.9
|
|
|||||
|
Current income tax expense
|
$
|
143.3
|
|
$
|
399.6
|
|
$
|
76.1
|
|
||
|
Deferred
|
|
|
|
|
|
|
|||||
|
United States:
|
|
|
|
|
|
|
|||||
|
Federal
|
$
|
(12.5
|
)
|
$
|
(46.4
|
)
|
$
|
39.8
|
|
||
|
State and local
|
(2.6
|
)
|
(8.1
|
)
|
0.8
|
|
|||||
|
International, including Puerto Rico
|
(0.7
|
)
|
(12.2
|
)
|
5.4
|
|
|||||
|
Deferred income tax (benefit) expense
|
(15.8
|
)
|
(66.7
|
)
|
46.0
|
|
|||||
|
Total income tax provision
|
$
|
127.5
|
|
$
|
332.9
|
|
$
|
122.1
|
|
||
74
EDWARDS LIFESCIENCES CORPORATION
NOTES TO CONSOLIDATED FINANCIAL STATEMENTS (Continued)
16. INCOME TAXES (Continued)
The components of deferred tax assets and liabilities are as follows (in millions):
|
|
December 31,
|
||||||
|
|
2015
|
2014
|
|||||
|
Deferred tax assets
|
|
|
|
|
|||
|
Compensation and benefits
|
$
|
94.0
|
|
$
|
82.3
|
|
|
|
Benefits from uncertain tax positions
|
50.0
|
|
41.4
|
|
|||
|
Net tax credit carryforwards
|
39.3
|
|
32.1
|
|
|||
|
Net operating loss carryforwards
|
27.0
|
|
31.8
|
|
|||
|
Accrued liabilities
|
24.2
|
|
25.3
|
|
|||
|
Inventories
|
11.9
|
|
11.7
|
|
|||
|
State income taxes
|
0.5
|
|
6.8
|
|
|||
|
Investments
|
2.6
|
|
2.6
|
|
|||
|
Other
|
4.5
|
|
4.8
|
|
|||
|
Total deferred tax assets
|
254.0
|
|
238.8
|
|
|||
|
Deferred tax liabilities
|
|
|
|
|
|||
|
Property, plant, and equipment
|
(25.1
|
)
|
(25.8
|
)
|
|||
|
Cash flow hedges
|
(0.4
|
)
|
(11.9
|
)
|
|||
|
Deferred tax on foreign earnings
|
(10.9
|
)
|
(4.9
|
)
|
|||
|
Inventories
|
(0.9
|
)
|
(3.1
|
)
|
|||
|
Other intangible assets
|
(0.3
|
)
|
(0.5
|
)
|
|||
|
Other
|
(0.5
|
)
|
(1.7
|
)
|
|||
|
Total deferred tax liabilities
|
(38.1
|
)
|
(47.9
|
)
|
|||
|
Valuation allowance
|
(45.2
|
)
|
(47.7
|
)
|
|||
|
Net deferred tax assets
|
$
|
170.7
|
|
$
|
143.2
|
|
|
During
2015
, net deferred tax assets increased
$27.5 million
, including items that were recorded to stockholders' equity and which did not impact the Company's income tax provision.
The valuation allowance of
$45.2 million
as of December 31,
2015
reduces certain deferred tax assets to amounts that are more likely than not to be realized. This allowance primarily relates to the net operating loss carryforwards of certain United States and non-United States subsidiaries, and to the deferred tax assets established for impairment losses on certain investments and for certain non-United States credit carryforwards.
A valuation allowance of
$2.6 million
has been provided for other-than-temporary impairments and unrealized losses related to certain investments that may not be recognized due to the uncertainty of the ready marketability of certain impaired investments.
Net operating loss carryforwards and the related carryforward periods at December 31,
2015
are summarized as follows (in millions):
|
|
Carryforward
Amount |
Tax Benefit
Amount |
Valuation
Allowance |
Net Tax
Benefit |
Carryforward
Period Ends |
||||||||||||
|
United States state net operating losses
|
$
|
9.7
|
|
$
|
0.6
|
|
$
|
(0.4
|
)
|
$
|
0.2
|
|
2016-2033
|
||||
|
Non-United States net operating losses
|
53.4
|
|
13.3
|
|
(12.7
|
)
|
0.6
|
|
2016-2024
|
||||||||
|
Non-United States net operating losses
|
39.6
|
|
13.3
|
|
(13.2
|
)
|
0.1
|
|
Indefinite
|
||||||||
|
Total
|
$
|
102.7
|
|
$
|
27.2
|
|
$
|
(26.3
|
)
|
$
|
0.9
|
|
|
||||
75
EDWARDS LIFESCIENCES CORPORATION
NOTES TO CONSOLIDATED FINANCIAL STATEMENTS (Continued)
16. INCOME TAXES (Continued)
Tax credit carryforwards and the related carryforward periods at December 31,
2015
are summarized as follows (in millions):
|
|
Carryforward
Amount |
Valuation
Allowance |
Net Tax
Benefit |
Carryforward
Period Ends |
|||||||||
|
California research expenditure tax credits
|
$
|
63.6
|
|
$
|
—
|
|
$
|
63.6
|
|
Indefinite
|
|||
|
Puerto Rico purchases credit
|
14.4
|
|
(14.4
|
)
|
—
|
|
Indefinite
|
||||||
|
Total
|
$
|
78.0
|
|
$
|
(14.4
|
)
|
$
|
63.6
|
|
|
|||
The Company has
$63.6 million
of California research expenditure tax credits it expects to use in future periods. The credits may be carried forward indefinitely. Based upon anticipated future taxable income, the Company expects that it is more likely than not that all California research expenditure tax credits will be utilized, although the utilization of the full benefit is expected to occur over a number of years and into the distant future. Accordingly, no valuation allowance has been provided.
The United States state net operating loss carryforwards include
$3.5 million
of losses attributable to windfall stock option deductions. A net benefit of
$0.2 million
will be recorded to "
Additional Paid-in Capital
" when realized as a reduction to income taxes payable.
Approximately
$8.1 million
of the California research expenditure tax credit carryforwards are attributable to windfall stock option deductions and will be recorded as a benefit to "
Additional Paid-in Capital
" when realized as a reduction to income taxes payable.
Deferred income taxes have not been provided on the undistributed earnings of certain of the Company's foreign subsidiaries of approximately
$1,789.7 million
as of December 31,
2015
since these amounts are intended to be indefinitely reinvested in foreign operations. It is not practicable to calculate the deferred taxes associated with these earnings because of the variability of multiple factors that would need to be assessed at the time of any assumed repatriation; however, foreign tax credits would likely be available to reduce federal income taxes in the event of distribution. In making this assertion, the Company evaluates, among other factors, the profitability of its United States and foreign operations and the need for cash within and outside the United States, including cash requirements for capital improvement, acquisitions, market expansion, and stock repurchase programs. The Company does not expect any earnings for certain of its other foreign subsidiaries to be indefinitely reinvested and records the tax impact in net income currently.
The Company has received tax incentives in Puerto Rico, the Dominican Republic, Singapore, and Switzerland. The tax reductions as compared to the local statutory rates favorably impacted earnings per diluted share for the years ended December 31,
2015
,
2014
, and
2013
by
$0.25
,
$0.31
, and
$0.22
, respectively. The Puerto Rico, Dominican Republic, and Singapore grants provide the Company's manufacturing operations partial or full exemption from local taxes until the years 2028, 2030 (subject to review in 2015 and subsequent years), and 2024 respectively. The Switzerland grant expired December 31, 2015 and the Company is in the process of filing for renewal through 2018.
76
EDWARDS LIFESCIENCES CORPORATION
NOTES TO CONSOLIDATED FINANCIAL STATEMENTS (Continued)
16. INCOME TAXES (Continued)
A reconciliation of the United States federal statutory income tax rate to the Company's effective income tax rate is as follows (in millions):
|
|
Years Ended December 31,
|
||||||||||
|
|
2015
|
2014
|
2013
|
||||||||
|
Income tax expense at U.S. federal statutory rate
|
$
|
217.8
|
|
$
|
400.4
|
|
$
|
178.9
|
|
||
|
Foreign income taxed at different rates
|
(105.8
|
)
|
(67.1
|
)
|
(60.6
|
)
|
|||||
|
State and local taxes, net of federal tax benefit
|
3.1
|
|
19.3
|
|
5.8
|
|
|||||
|
Tax credits, federal and state
|
(15.7
|
)
|
(13.5
|
)
|
(19.8
|
)
|
|||||
|
Build (release) of reserve for uncertain tax positions for prior years
|
3.3
|
|
(4.8
|
)
|
(3.9
|
)
|
|||||
|
U.S. tax on foreign earnings, net of credits
|
20.5
|
|
(3.1
|
)
|
18.9
|
|
|||||
|
Nondeductible stock-based compensation
|
2.3
|
|
2.1
|
|
2.6
|
|
|||||
|
Other
|
2.0
|
|
(0.4
|
)
|
0.2
|
|
|||||
|
Income tax provision
|
$
|
127.5
|
|
$
|
332.9
|
|
$
|
122.1
|
|
||
The effective income tax rate for the year ended December 31, 2015 was lower than the rate for the year ended December 31, 2014 primarily because the rate for December 31, 2014 included (1)
$262.1 million
of tax expense associated with a
$750.0 million
litigation settlement payment received from Medtronic in May 2014 (see Note 3) and (2)
$4.8 million
of tax benefits from the remeasurement of uncertain tax positions.
The effective income tax rate for the year ended December 31, 2013 included (1) an
$8.4 million
benefit for the full year 2012 federal research credit and (2)
$31.3 million
of tax expense associated with the
$83.6 million
litigation award received from Medtronic in February 2013 (see Note 3).
Unrecognized Tax Benefits
As of December 31,
2015
and
2014
, the gross unrecognized tax benefits were
$216.1 million
and
$192.3 million
, respectively. The Company estimates that these liabilities would be reduced by
$40.6 million
and
$34.3 million
, respectively, from offsetting tax benefits associated with the correlative effects of potential transfer pricing adjustments, state income taxes, and timing adjustments. The net amounts of
$175.5 million
and
$158.0 million
, respectively, if not required, would favorably affect the Company's effective tax rate.
A reconciliation of the beginning and ending amount of unrecognized tax benefits, excluding interest, penalties, and foreign exchange, is as follows (in millions):
|
|
December 31,
|
||||||||||
|
|
2015
|
2014
|
2013
|
||||||||
|
Unrecognized tax benefits, January 1
|
$
|
192.3
|
|
$
|
127.7
|
|
$
|
113.6
|
|
||
|
Current year tax positions
|
29.6
|
|
75.9
|
|
17.8
|
|
|||||
|
Increase prior year tax positions
|
2.2
|
|
0.6
|
|
5.7
|
|
|||||
|
Decrease prior year tax positions
|
(7.4
|
)
|
(10.5
|
)
|
(9.0
|
)
|
|||||
|
Settlements
|
(0.4
|
)
|
(1.0
|
)
|
(0.1
|
)
|
|||||
|
Lapse of statutes of limitations
|
(0.2
|
)
|
(0.4
|
)
|
(0.3
|
)
|
|||||
|
Unrecognized tax benefits, December 31
|
$
|
216.1
|
|
$
|
192.3
|
|
$
|
127.7
|
|
||
The Company recognizes interest and penalties, if any, related to unrecognized tax benefits in the provision for income taxes. As of December 31,
2015
, the Company had accrued
$10.7 million
(net of
$7.6 million
tax benefit) of interest related to unrecognized tax benefits, and as of December 31,
2014
, the Company had accrued
$6.8 million
(net of
$5.0 million
tax benefit) of interest related to unrecognized tax benefits. During
2015
,
2014
, and
2013
, the Company recognized interest
77
EDWARDS LIFESCIENCES CORPORATION
NOTES TO CONSOLIDATED FINANCIAL STATEMENTS (Continued)
16. INCOME TAXES (Continued)
expense, net of tax benefit, of
$3.9 million
,
$2.3 million
, and
$1.4 million
, respectively, in "
Provision for Income Taxes
" on the consolidated statements of operations.
The Company strives to resolve open matters with each tax authority at the examination level and could reach agreement with a tax authority at any time. While the Company has accrued for matters it believes are more likely than not to require settlement, the final outcome with a tax authority may result in a tax liability that is more or less than that reflected in the consolidated financial statements. Furthermore, the Company may later decide to challenge any assessments, if made, and may exercise its right to appeal. The uncertain tax positions are reviewed quarterly and adjusted as events occur that affect potential liabilities for additional taxes, such as lapsing of applicable statutes of limitations, proposed assessments by tax authorities, negotiations between tax authorities, identification of new issues, and issuance of new legislation, regulations, or case law. Management believes that adequate amounts of tax and related penalty and interest have been provided in income tax expense for any adjustments that may result from these uncertain tax positions.
At December 31,
2015
, all material state, local, and foreign income tax matters have been concluded for years through 2008. The Internal Revenue Service ("IRS") has substantially completed its fieldwork for the 2009 through 2012 tax years. However, the audits are currently in suspense pending finalization of an Advance Pricing Agreement ("APA") and Joint Committee of Taxation approval.
As noted above, the Company entered into an APA process between the Switzerland and United States governments for the years 2009 through 2015 covering transfer pricing matters. The transfer pricing matters are significant to the Company's consolidated financial statements, and the final outcome and timing of the negotiations between the two governments is uncertain.
During 2014, the Company filed with the IRS a request for a pre-filing agreement associated with a tax return filing position on a portion of the litigation settlement payment received from Medtronic in May 2014 (see Note 3). During the first quarter of 2015, the IRS accepted the pre-filing agreement into the pre-filing agreement program. The finalization of the pre-filing agreement is still pending. However, the Company made an advance payment of tax in December 2015 to prevent the further accrual of interest on any potential deficiency only and not to signify any potential agreement to a contrary position that may be taken by the IRS.
Management believes that adequate amounts of tax and related penalty and interest have been provided in income tax expense for any adjustments that may result from our uncertain tax positions. Based upon the information currently available and numerous possible outcomes, we cannot reasonably estimate what, if any, changes in our existing uncertain tax positions may occur in the next 12 months and thus have recorded the gross uncertain tax positions as a long-term liability. However, if the APA and/or pre-filing agreement is finalized in the next 12 months, it is reasonably possible that these events could result in a significant change in our uncertain tax positions within the next 12 months.
17. LEGAL PROCEEDINGS
On October 30, 2015, Boston Scientific Scimed, Inc., a subsidiary of Boston Scientific Corporation (“Boston Scientific”), filed a lawsuit in the district court in Düsseldorf, Germany against Edwards Lifesciences and its German subsidiary, Edwards Lifesciences Services GmbH, alleging that Edwards Lifesciences’
SAPIEN 3
heart valve infringes certain claims of a Boston Scientific German national patent arising from EP 2 749 254 B1 (the “’254 patent”) related to paravalvular sealing technology. The complaint seeks unspecified money damages and injunctive relief. The Company intends to defend itself vigorously in this matter.
On November 2, 2015, Edwards Lifesciences LLC, a U.S. subsidiary of Edwards Lifesciences, filed a lawsuit against Sadra Medical, Inc. and Boston Scientific Scimed, Inc., two subsidiaries of Boston Scientific, in the United Kingdom in the High Court of Justice, Chancery Division, Patents Court to declare invalid and revoke the U.K. national patent corresponding to the ‘254 patent. On January 15, 2016, these subsidiaries filed a counterclaim against Edwards Lifesciences and three of its European subsidiaries alleging that the
SAPIEN 3
heart valve infringes certain claims of the same patent and seeking unspecified monetary damages and injunctive relief.
78
EDWARDS LIFESCIENCES CORPORATION
NOTES TO CONSOLIDATED FINANCIAL STATEMENTS (Continued)
On November 23, 2015, Edwards Lifesciences PVT, Inc., a U.S. subsidiary of Edwards Lifesciences, filed a lawsuit in the district court in Düsseldorf, Germany for patent infringement against Boston Scientific and a German subsidiary, Boston Scientific Medizintechnik GmbH, alleging that the Lotus heart valve infringes certain claims of Edwards Lifesciences’ German national patents EP 1 441 672 B1 and 2 255 753 B1 related to prosthetic valve and delivery system technology. The complaint seeks unspecified monetary damages and injunctive relief.
In addition, Edwards Lifesciences is or may be a party to, or may otherwise be responsible for, pending or threatened lawsuits related primarily to products and services currently or formerly manufactured or performed, as applicable, by Edwards Lifesciences. Such cases and claims raise difficult and complex factual and legal issues and are subject to many uncertainties, including, but not limited to, the facts and circumstances of each particular case or claim, the jurisdiction in which each suit is brought, and differences in applicable law. Upon resolution of any such legal matter or other claim, Edwards Lifesciences may incur charges in excess of established reserves. The Company is not able to estimate the amount or range of any loss for legal contingencies for which there is no reserve or additional loss for matters already reserved. While any such charge related to matters could have a material adverse impact on Edwards Lifesciences' net income or cash flows in the period in which it is recorded or paid, management does not believe that any such charge relating to any currently pending lawsuit would have a material adverse effect on Edwards Lifesciences' financial position, results of operations, or liquidity.
Edwards Lifesciences is subject to various environmental laws and regulations both within and outside of the United States. The operations of Edwards Lifesciences, like those of other medical device companies, involve the use of substances regulated under environmental laws, primarily in manufacturing and sterilization processes. While it is difficult to quantify the potential impact of continuing compliance with environmental protection laws, management believes that such compliance will not have a material impact on Edwards Lifesciences' financial position, results of operations, or liquidity.
18. SEGMENT INFORMATION
Edwards Lifesciences conducts operations worldwide and is managed in the following geographical regions: United States, Europe, Japan, and Rest of World. All regions sell products that are used to treat advanced cardiovascular disease.
The Company's geographic segments are reported based on the financial information provided to the Chief Operating Decision Maker (the Chief Executive Officer). The Company evaluates the performance of its geographic segments based on net sales and income before provision for income taxes ("pre-tax income"). The accounting policies of the segments are substantially the same as those described in Note 2. Segment net sales and segment pre-tax income are based on internally derived standard foreign exchange rates, which may differ from year to year, and do not include inter-segment profits. Because of the interdependence of the reportable segments, the operating profit as presented may not be representative of the geographical distribution that would occur if the segments were not interdependent. Net sales by geographic area are based on the location of the customer.
Certain items are maintained at the corporate level and are not allocated to the segments. The non-allocated items include net interest expense, global marketing expenses, corporate research and development expenses, manufacturing variances, corporate headquarters costs, special gains and charges, stock-based compensation, foreign currency hedging activities, certain litigation costs, and most of the Company's amortization expense. Although most of the Company's depreciation expense is included in segment pre-tax income, due to the Company's methodology for cost build-up, it is impractical to determine the amount of depreciation expense included in each segment, and, therefore, a portion is maintained at the corporate level. The Company neither discretely allocates assets to its operating segments, nor evaluates the operating segments using discrete asset information.
79
EDWARDS LIFESCIENCES CORPORATION
NOTES TO CONSOLIDATED FINANCIAL STATEMENTS (Continued)
18. SEGMENT INFORMATION (Continued)
The table below presents information about Edwards Lifesciences' reportable segments (in millions):
|
|
Years Ended December 31,
|
||||||||||
|
|
2015
|
2014
|
2013
|
||||||||
|
Segment Net Sales
|
|
|
|
|
|
|
|||||
|
United States
|
$
|
1,262.8
|
|
$
|
1,047.3
|
|
$
|
939.6
|
|
||
|
Europe
|
842.9
|
|
741.4
|
|
622.2
|
|
|||||
|
Japan
|
297.2
|
|
270.8
|
|
293.7
|
|
|||||
|
Rest of World
|
315.1
|
|
285.1
|
|
252.8
|
|
|||||
|
Total segment net sales
|
$
|
2,718.0
|
|
$
|
2,344.6
|
|
$
|
2,108.3
|
|
||
|
Segment Pre-tax Income
|
|
|
|
|
|
|
|||||
|
United States
|
$
|
747.8
|
|
$
|
605.6
|
|
$
|
550.5
|
|
||
|
Europe
|
409.1
|
|
328.1
|
|
287.7
|
|
|||||
|
Japan
|
139.4
|
|
125.2
|
|
145.6
|
|
|||||
|
Rest of World
|
82.2
|
|
78.6
|
|
68.3
|
|
|||||
|
Total segment pre-tax income
|
$
|
1,378.5
|
|
$
|
1,137.5
|
|
$
|
1,052.1
|
|
||
The table below presents reconciliations of segment net sales to consolidated net sales and segment pre-tax income to consolidated pre-tax income (in millions):
|
|
Years Ended December 31,
|
||||||||||
|
|
2015
|
2014
|
2013
|
||||||||
|
Net Sales Reconciliation
|
|
|
|
|
|
|
|||||
|
Segment net sales
|
$
|
2,718.0
|
|
$
|
2,344.6
|
|
$
|
2,108.3
|
|
||
|
Foreign currency
|
(224.3
|
)
|
(21.7
|
)
|
(62.8
|
)
|
|||||
|
Consolidated net sales
|
$
|
2,493.7
|
|
$
|
2,322.9
|
|
$
|
2,045.5
|
|
||
|
Pre-tax Income Reconciliation
|
|
|
|
|
|
|
|||||
|
Segment pre-tax income
|
$
|
1,378.5
|
|
$
|
1,137.5
|
|
$
|
1,052.1
|
|
||
|
Unallocated amounts:
|
|
|
|||||||||
|
Corporate items
|
(711.3
|
)
|
(659.2
|
)
|
(568.5
|
)
|
|||||
|
Special charges
|
—
|
|
(70.7
|
)
|
(16.3
|
)
|
|||||
|
Intellectual property (expenses) income, net
|
(7.0
|
)
|
740.4
|
|
61.5
|
|
|||||
|
Interest expense, net
|
(9.3
|
)
|
(10.8
|
)
|
(5.2
|
)
|
|||||
|
Foreign currency
|
(28.5
|
)
|
6.8
|
|
(12.4
|
)
|
|||||
|
Consolidated pre-tax income
|
$
|
622.4
|
|
$
|
1,144.0
|
|
$
|
511.2
|
|
||
80
EDWARDS LIFESCIENCES CORPORATION
NOTES TO CONSOLIDATED FINANCIAL STATEMENTS (Continued)
18. SEGMENT INFORMATION (Continued)
Enterprise-Wide Information
Enterprise-wide information is based on actual foreign exchange rates used in the Company's consolidated financial statements.
|
|
As of or for the Years Ended
December 31, |
||||||||||
|
|
2015
|
2014
|
2013
|
||||||||
|
(in millions)
|
|||||||||||
|
Net Sales by Geographic Area
|
|
|
|
|
|
|
|||||
|
United States
|
$
|
1,262.9
|
|
$
|
1,047.3
|
|
$
|
939.6
|
|
||
|
Europe
|
717.3
|
|
744.5
|
|
616.5
|
|
|||||
|
Japan
|
246.2
|
|
257.9
|
|
243.6
|
|
|||||
|
Rest of World
|
267.3
|
|
273.2
|
|
245.8
|
|
|||||
|
$
|
2,493.7
|
|
$
|
2,322.9
|
|
$
|
2,045.5
|
|
|||
|
Net Sales by Major Product Area
|
|
|
|
|
|
|
|||||
|
Transcatheter Heart Valve Therapy
|
$
|
1,180.3
|
|
$
|
943.6
|
|
$
|
707.7
|
|
||
|
Surgical Heart Valve Therapy
|
785.0
|
|
826.1
|
|
801.2
|
|
|||||
|
Critical Care
|
528.4
|
|
553.2
|
|
536.6
|
|
|||||
|
$
|
2,493.7
|
|
$
|
2,322.9
|
|
$
|
2,045.5
|
|
|||
|
Long-lived Tangible Assets by Geographic Area
|
|
|
|
|
|
|
|||||
|
United States
|
$
|
473.6
|
|
$
|
347.6
|
|
$
|
308.2
|
|
||
|
Europe
|
36.0
|
|
42.1
|
|
40.9
|
|
|||||
|
Japan
|
8.1
|
|
8.5
|
|
10.8
|
|
|||||
|
Rest of World
|
96.0
|
|
93.9
|
|
97.1
|
|
|||||
|
$
|
613.7
|
|
$
|
492.1
|
|
$
|
457.0
|
|
|||
81
EDWARDS LIFESCIENCES CORPORATION
NOTES TO CONSOLIDATED FINANCIAL STATEMENTS (Continued)
19. QUARTERLY FINANCIAL RESULTS AND MARKET FOR THE COMPANY'S STOCK (UNAUDITED)
|
Years Ended December 31,
|
First
Quarter
|
Second
Quarter
|
Third
Quarter
|
Fourth
Quarter
|
Total
Year
|
||||||||||||||
|
|
(in millions, except per share data)
|
||||||||||||||||||
|
2015
|
|
|
|
|
|
|
|
|
|
|
|||||||||
|
Net sales
|
$
|
590.3
|
|
$
|
616.8
|
|
$
|
615.5
|
|
$
|
671.1
|
|
$
|
2,493.7
|
|
||||
|
Gross profit
|
454.3
|
|
458.2
|
|
468.8
|
|
495.2
|
|
1,876.5
|
|
|||||||||
|
Net income
|
123.4
|
|
112.7
|
|
118.1
|
|
140.7
|
|
494.9
|
|
|||||||||
|
Earnings per common share:
|
|
|
|
|
|
|
|
|
|
|
|||||||||
|
Basic
|
0.57
|
|
0.52
|
|
0.55
|
|
0.65
|
|
2.30
|
|
|||||||||
|
Diluted
|
0.56
|
|
0.51
|
|
0.54
|
|
0.64
|
|
2.25
|
|
|||||||||
|
Market price:
|
|
|
|
|
|
|
|
|
|
|
|||||||||
|
High
|
$
|
75.21
|
|
$
|
73.65
|
|
$
|
79.50
|
|
$
|
83.43
|
|
$
|
83.43
|
|
||||
|
Low
|
61.99
|
|
61.38
|
|
62.53
|
|
70.32
|
|
61.38
|
|
|||||||||
|
2014
|
|
|
|
|
|
|
|
|
|
|
|||||||||
|
Net sales
|
$
|
522.4
|
|
$
|
575.1
|
|
$
|
607.4
|
|
$
|
618.0
|
|
$
|
2,322.9
|
|
||||
|
Gross profit
|
376.5
|
|
423.9
|
|
439.3
|
|
457.6
|
|
1,697.3
|
|
|||||||||
|
Net income (a)
|
60.3
|
|
547.0
|
|
94.6
|
|
109.2
|
|
811.1
|
|
|||||||||
|
Earnings per common share (a):
|
|
|
|
|
|
|
|
|
|
|
|||||||||
|
Basic
|
0.28
|
|
2.59
|
|
0.44
|
|
0.51
|
|
3.81
|
|
|||||||||
|
Diluted
|
0.28
|
|
2.55
|
|
0.44
|
|
0.50
|
|
3.74
|
|
|||||||||
|
Market price:
|
|
|
|
|
|
|
|
|
|
|
|||||||||
|
High
|
$
|
37.81
|
|
$
|
44.10
|
|
$
|
52.35
|
|
$
|
67.14
|
|
$
|
67.14
|
|
||||
|
Low
|
31.52
|
|
36.40
|
|
42.03
|
|
48.54
|
|
31.52
|
|
|||||||||
_______________________________________________________________________________
|
(a)
|
The second quarter of 2014 includes a
$750.0 million
gain for an upfront payment received under a litigation settlement agreement and a
$50.0 million
charge for the contribution to the Edwards Lifesciences Foundation.
|
82
20. VALUATION AND QUALIFYING ACCOUNTS
|
|
|
Additions
|
|
|
|||||||||||||||
|
|
Balance at
Beginning
of Period
|
Charged to
Costs and
Expenses
|
Charged to
Other
Accounts
|
Deductions
From
Reserves
|
Balance at
End of
Period
|
||||||||||||||
|
|
(in millions)
|
||||||||||||||||||
|
Year ended December 31, 2015
|
|
|
|
|
|
|
|
|
|
|
|||||||||
|
Allowance for doubtful accounts (a)
|
$
|
11.3
|
|
$
|
3.8
|
|
$
|
—
|
|
$
|
(2.0
|
)
|
$
|
13.1
|
|
||||
|
Tax valuation allowance (b)
|
47.7
|
|
4.8
|
|
—
|
|
(7.3
|
)
|
45.2
|
|
|||||||||
|
Year ended December 31, 2014
|
|
|
|
|
|
|
|
|
|
|
|||||||||
|
Allowance for doubtful accounts (a)
|
$
|
12.2
|
|
$
|
0.8
|
|
$
|
—
|
|
$
|
(1.7
|
)
|
$
|
11.3
|
|
||||
|
Tax valuation allowance (b)
|
46.4
|
|
2.0
|
|
—
|
|
(0.7
|
)
|
47.7
|
|
|||||||||
|
Year ended December 31, 2013
|
|
|
|
|
|
|
|
|
|
|
|||||||||
|
Allowance for doubtful accounts (a)
|
$
|
12.0
|
|
$
|
2.4
|
|
$
|
—
|
|
$
|
(2.2
|
)
|
$
|
12.2
|
|
||||
|
Tax valuation allowance (b)
|
38.6
|
|
8.2
|
|
—
|
|
(0.4
|
)
|
46.4
|
|
|||||||||
_______________________________________________________________________________
|
(a)
|
The deductions related to allowances for doubtful accounts represent accounts receivable which are written off and product which is returned from customers.
|
|
(b)
|
The tax valuation allowances are provided for other-than-temporary impairments and unrealized losses related to certain investments that may not be recognized due to the uncertainty of the ready marketability of certain impaired investments, and net operating loss and credit carryforwards that may not be recognized due to insufficient taxable income.
|
21. SUBSEQUENT EVENT
In February 2016, Edwards entered into ASR agreements to repurchase
$325.0 million
of the Company's common stock based on the volume-weighted average price ("VWAP") of the Company's common stock during the term of the agreements, less a discount. Upon entering into the agreements, Edwards received an initial delivery of
3.2 million
shares. The final share delivery is based on the VWAP over the term of the agreements and will occur at varying termination dates extending to December, 2016, subject to certain adjustments pursuant to the agreements.
83
None.
Evaluation of Disclosure Controls and Procedures.
The Company's management, including the Chief Executive Officer and Chief Financial Officer, performed an evaluation of the effectiveness of the design and operation of the Company's disclosure controls and procedures (as defined in Rules 13a-15(e) and 15d-15(e) under the Securities Exchange Act of 1934, as amended) as of
December 31, 2015
.
Based on their evaluation, the Chief Executive Officer and Chief Financial Officer have concluded as of
December 31, 2015
that the Company's disclosure controls and procedures are designed at a reasonable assurance level and are effective in providing reasonable assurance that the information required to be disclosed by the Company in the reports it files or submits under the Securities Exchange Act of 1934, as amended, is recorded, processed, summarized, and reported within the time periods specified in the SEC's rules and forms, and that such information is accumulated and communicated to the Company's management, including the Chief Executive Officer and Chief Financial Officer, as appropriate, to allow timely decisions regarding required disclosure.
Management's Report on Internal Control Over Financial Reporting.
The Company's management, including the Chief Executive Officer and Chief Financial Officer, is responsible for establishing and maintaining adequate internal control over financial reporting, as such term is defined in Rules 13a-15(f) and 15d-15(f) under the Securities Exchange Act of 1934, as amended. Under the supervision and with the participation of the Company's management, including the Chief Executive Officer and Chief Financial Officer, the Company conducted an evaluation of the effectiveness of its internal control over financial reporting based on the framework in
Internal Control—Integrated Framework (2013)
issued by the Committee of Sponsoring Organizations of the Treadway Commission (COSO). Based on that evaluation, the Company's management concluded that its internal control over financial reporting was effective as of
December 31, 2015
. The effectiveness of the Company's internal control over financial reporting as of
December 31, 2015
has been audited by PricewaterhouseCoopers LLP, an independent registered public accounting firm, as stated in their report which appears herein.
Changes in Internal Control Over Financial Reporting.
There have been no changes in the Company's internal controls over financial reporting that occurred during the Company's fourth fiscal quarter of
2015
that have materially affected, or are reasonably likely to materially affect, the Company's internal control over financial reporting.
None.
84
Certain information required by this Item is set forth under the headings "Corporate Governance," "Executive Compensation and Other Information—Executive Officers," and "Other Matters and Business—Additional Information" and "—Section 16(a) Beneficial Ownership Reporting Compliance" in the definitive proxy materials to be filed in connection with its 2015 Annual Meeting of Stockholders (the "Proxy Statement") (which Proxy Statement will be filed with the SEC within 120 days of
December 31, 2015
). The information required by this Item to be contained in the Proxy Statement is incorporated herein by reference. The Company has adopted a code of ethics that applies to all directors and employees, including the Company's principal executive officer, principal financial officer and controller or persons performing similar functions. The code of ethics (business practice standards) is posted on the Company's website, which is found at www.edwards.com under "Investors." To the extent required by applicable rules of the SEC and the New York Stock Exchange, the Company intends to disclose on its website any amendments to, or waivers from, any provision of its code of ethics that apply to the Company's directors and executive officers, including the principal executive officer, principal financial officer or controller or persons performing similar functions.
The information contained under the heading "Executive Compensation and Other Information" in the Proxy Statement is incorporated herein by reference.
The information contained under the headings "Security Ownership of Certain Beneficial Owners and Management" and "Equity Compensation Plan Information" in the Proxy Statement is incorporated herein by reference.
The information contained under the heading "Other Matters and Business—Related Party Transactions" and under the heading "Corporate Governance—Director Independence" in the Proxy Statement is incorporated herein by reference.
The information contained under the heading "Audit Matters—Fees Paid to Principal Accountants" in the Proxy Statement is incorporated herein by reference.
85
(a) The following documents are filed as part of this report:
1. Consolidated Financial Statements. See “Index to Consolidated Financial Statements” in Part II, Item 8 herein
2. Financial Statement Schedules. Other schedules are not applicable and have not been included herein.
3. Exhibits. The exhibits listed in the Exhibit Index (following the signature page of this report) are filed, furnished, or incorporated by reference as part of this report on Form 10-K.
86
SIGNATURES
Pursuant to the requirements of Section 13 or 15(d) of the Securities Exchange Act of 1934, the Registrant has duly caused this report to be signed on its behalf by the undersigned thereunto duly authorized.
|
|
EDWARDS LIFESCIENCES CORPORATION
|
||
|
February 19, 2016
|
By:
|
|
/s/ MICHAEL A. MUSSALLEM
|
|
Michael A. Mussallem
Chairman of the Board and
Chief Executive Officer
|
|||
Pursuant to the requirements of the Securities Exchange Act of 1934, this report has been signed below by the following persons on behalf of the registrant and in the capacities and on the dates indicated.
|
Signature
|
Title
|
|
Date
|
|
|
|
|
|
|
/s/ MICHAEL A. MUSSALLEM
|
Chairman of the Board and Chief Executive Officer
|
|
February 19, 2016
|
|
Michael A. Mussallem
|
(Principal Executive Officer)
|
||
|
/s/ SCOTT B. ULLEM
|
Corporate Vice President, Chief Financial Officer
|
|
February 19, 2016
|
|
Scott B. Ullem
|
(Principal Financial Officer)
|
||
|
/s/ ROBERT W.A. SELLERS
|
Vice President, Corporate Controller
|
|
February 19, 2016
|
|
Robert W.A. Sellers
|
(Principal Accounting Officer)
|
||
|
/s/ JOHN T. CARDIS
|
Director
|
|
February 18, 2016
|
|
John T. Cardis
|
|||
|
/s/ KIERAN T. GALLAHUE
|
Director
|
|
February 18, 2016
|
|
Kieran T. Gallahue
|
|||
|
/s/ WILLIAM J. LINK, PH.D.
|
Director
|
|
February 19, 2016
|
|
William J. Link, Ph.D.
|
|||
|
/s/ MARTHA H. MARSH
|
Director
|
|
February 18, 2016
|
|
Martha H. Marsh
|
|||
|
/s/ BARBARA J. MCNEIL, M.D., PH.D.
|
Director
|
|
February 18, 2016
|
|
Barbara J. McNeil, M.D., Ph.D.
|
|||
|
/s/ WESLEY W. VON SCHACK
|
Director
|
|
February 18, 2016
|
|
Wesley W. von Schack
|
|||
|
/s/ NICHOLAS J. VALERIANI
|
Director
|
|
February 18, 2016
|
|
Nicholas J. Valeriani
|
|||
87
EXHIBITS FILED WITH SECURITIES AND EXCHANGE COMMISSION
|
Exhibit No.
|
Exhibit No.
|
|
|
3.1
|
|
Amended and Restated Certificate of Incorporation of Edwards Lifesciences Corporation dated May 16, 2013 (incorporated by reference to Exhibit 3.1 in Edwards Lifesciences' report on Form 8-K dated May 17, 2013)
|
|
3.2
|
|
Bylaws of Edwards Lifesciences Corporation amended and restated as of February 20, 2014 (incorporated by reference to Exhibit 3.1 in Edwards Lifesciences' report on Form 8-K dated February 26, 2014)
|
|
4.1
|
|
Specimen form of certificate representing Edwards Lifesciences Corporation common stock (incorporated by reference to Exhibit 4.1 in Edwards Lifesciences' Registration Statement on Form 10 (File No. 001-15525) filed on March 15, 2000)
|
|
4.2
|
|
Indenture, dated as of September 6, 2013, between Edwards Lifesciences Corporation and Wells Fargo Bank, National Association, as trustee (incorporated by reference to Exhibit 4.5 in Edwards Lifesciences' Registration Statement on Form S-3 (File No. 333-191022) filed on September 6, 2013) (the "Indenture")
|
|
4.3
|
|
First Supplemental Indenture, dated as of October 3, 2013, to the Indenture (incorporated by reference to Exhibit 4.1 in Edwards Lifesciences' report on Form 8-K, filed on October 3, 2013) ("First Supplemental Indenture")
|
|
4.4
|
|
Form of Global Note for the 2.875% Senior Notes due 2018 (incorporated by reference to Exhibit A in the First Supplemental Indenture filed as Exhibit 4.1 in Edwards Lifesciences' report on Form 8-K, filed on October 3, 2013)
|
|
10.1
|
|
Five-Year Credit Agreement, dated as of July 18, 2014, among Edwards Lifesciences Corporation and certain of its subsidiaries, as Borrowers; the lenders signatory thereto, Bank of America, N.A., as Administrative Agent, Swing Line Lender and Issuing Bank; JPMorgan Chase Bank, N.A. and Wells Fargo Bank, National Association, as Co-Syndication Agents; and Deutsche Bank Securities Inc., HSBC Bank USA, National Association, PNC Bank, National Association, The Bank of Tokyo-Mitsubishi UFJ, Ltd., and U.S. Bank National Association, as Co-Documentation Agents (incorporated by reference to Exhibit 10.1 in Edwards Lifesciences' report on Form 8-K, filed on July 24, 2014)
|
|
#10.2
|
|
Settlement Agreement, dated May 19, 2014, between Edwards Lifesciences Corporation and Medtronic, Inc. (incorporated by reference to Exhibit 10.2 in Edwards Lifesciences' report on Form 10-Q for the quarterly period ended June 30, 2014)
|
|
*10.3
|
|
Edwards Lifesciences Corporation Form of Employment Agreement (incorporated by reference to Exhibit 10.8 in Edwards Lifesciences' report on Form 10-Q for the quarterly period ended March 31, 2003)
|
|
*10.4
|
|
Edwards Lifesciences Corporation Amended and Restated Employment Agreement for Michael A. Mussallem dated March 30, 2009 (incorporated by reference to Exhibit 10.2 in Edwards Lifesciences' report on Form 10-Q for the quarterly period ended March 31, 2009)
|
|
*10.5
|
|
Edwards Lifesciences Corporation Amended and Restated Chief Executive Officer Change-in-Control Severance Agreement, dated October 9, 2012 (incorporated by reference to Exhibit 10.1 in Edwards Lifesciences' report on Form 10-Q for the quarterly period ended September 30, 2012)
|
|
*10.6
|
|
Edwards Lifesciences Corporation Form of Change-in-Control Severance Agreement (incorporated by reference to Exhibit 10.2 in Edward Lifesciences' report on Form 10-Q for the quarterly period ended September 30, 2012)
|
|
*10.7
|
|
Edwards Lifesciences Corporation 2015 Edwards Incentive Plan (incorporated by reference to Appendix A in Edwards Lifesciences’ Definitive Proxy Statement filed on March 30, 2015)
|
|
*10.8
|
|
Edwards Lifesciences Corporation Long-Term Stock Incentive Compensation Program, as amended and restated as of February 19, 2015 (the "Long-Term Stock Program") (incorporated by reference to Appendix B in Edwards Lifesciences' Definitive Proxy Statement filed on March 30, 2015)
|
|
*10.9
|
|
Edwards Lifesciences Corporation Form of Participant Stock Option Statement and related Long-Term Stock Program Global Nonqualified Stock Option Award Agreement for awards granted prior to May 2015 (incorporated by reference to Exhibit 10.1 in Edwards Lifesciences' report on Form 10-Q for the quarterly period ended March 31, 2011)
|
|
*10.10
|
|
Edwards Lifesciences Corporation Form of Participant Restricted Stock Unit Statement and related Long-Term Stock Program Global Restricted Stock Unit Award Agreement for awards granted prior to May 2015 (incorporated by reference to Exhibit 10.4 in Edwards Lifesciences' report on Form 10-Q for the quarterly period ended March 31, 2011)
|
|
*10.11
|
|
Edwards Lifesciences Corporation Form of Performance-Based Restricted Stock Unit Statement and related Long-Term Stock Program Global Performance-Based Restricted Stock Unit Award Agreement for awards granted prior to May 2015 (incorporated by reference to Exhibit 10.4 in Edwards Lifesciences' report on Form 10-Q for the quarterly period ended June 30, 2012)
|
|
*10.12
|
|
Edwards Lifesciences Corporation Long-Term Stock Program Global Nonqualified Stock Option Award Agreement for awards granted beginning May 2015 (incorporated by reference to Exhibit 10.3 in Edwards Lifesciences' report on Form 10-Q for the quarterly period ended June 30, 2015)
|
88
|
Exhibit No.
|
Exhibit No.
|
|
|
*10.13
|
|
Edwards Lifesciences Corporation Long-Term Stock Program Global Restricted Stock Unit Award Agreement for awards granted beginning May 2015 (incorporated by reference to Exhibit 10.4 in Edwards Lifesciences' report on Form 10-Q for the quarterly period ended June 30, 2015)
|
|
*10.14
|
|
Edwards Lifesciences Corporation Form of Performance-Based Restricted Stock Unit Statement and related Long-Term Stock Program Global Performance-Based Restricted Stock Unit Award Agreement for awards granted beginning May 2015 (incorporated by reference to Exhibit 10.4 in Edwards Lifesciences' report on Form 10-Q for the quarterly period ended June 30, 2015)
|
|
*10.15
|
|
Edwards Lifesciences Corporation Nonemployee Directors Stock Incentive Program, as amended and restated as of May 14, 2013 (incorporated by reference to Exhibit 10.1 in Edwards Lifesciences' report on Form 10-Q for the quarterly period ended June 30, 2013)
|
|
*10.16
|
|
Edwards Lifesciences Corporation Form of Participant Stock Option Statement and related Nonemployee Directors Stock Incentive Program Nonqualified Stock Option Award Agreement (incorporated by reference to Exhibit 10.2 in Edwards Lifesciences' report on Form 10-Q for the quarterly period ended June 30, 2013)
|
|
*10.17
|
|
Edwards Lifesciences Corporation Form of Nonemployee Directors Stock Incentive Program Restricted Stock Units Agreement (incorporated by reference to Exhibit 10.4 in Edwards Lifesciences' report on Form 10-Q for the quarterly period ended March 31, 2011)
|
|
*10.18
|
|
Edwards Lifesciences Corporation Form of Nonemployee Directors Stock Incentive Program Restricted Stock Agreement (incorporated by reference to Exhibit 10.5 in Edwards Lifesciences' report on Form 10-Q for the quarterly period ended March 31, 2011)
|
|
*10.19
|
|
Edwards Lifesciences Corporation Severance Pay Plan, restated effective January 1, 2013 (incorporated by reference to Exhibit 10.1 in Edwards Lifesciences' report on Form 10-Q for the quarterly period ended March 31, 2013)
|
|
*10.20
|
|
Edwards Lifesciences Corporation Executive Deferred Compensation Plan, as amended and restated effective November 9, 2011 (incorporated by reference to Exhibit 10.7 in Edwards Lifesciences' report on Form 10-K for the fiscal year ended December 31, 2011)
|
|
*10.21
|
|
Edwards Lifesciences Corporation of Puerto Rico Savings and Investment Plan, as amended and restated January 1, 2011 (incorporated by reference to Exhibit 10.17 in Edwards Lifesciences' report on Form 10-K for the fiscal year ended December 31, 2012)
|
|
*10.22
|
|
Edwards Lifesciences Corporation 401(k) Savings and Investment Plan, as amended and restated January 1, 2009 (incorporated by reference to Exhibit 10.18 in Edwards Lifesciences' report on Form 10-K for the fiscal year ended December 31, 2012)
|
|
*10.23
|
|
Amendment #1 to the Edwards Lifesciences Corporation 401(k) Savings and Investment Plan, dated April 1, 2011 (incorporated by reference to Exhibit 10.19 in Edwards Lifesciences' report on Form 10-K for the fiscal year ended December 31, 2012)
|
|
*10.24
|
|
Amendment #2 to the Edwards Lifesciences Corporation 401(k) Savings and Investment Plan, dated September 13, 2011 (incorporated by reference to Exhibit 10.20 in Edwards Lifesciences' report on Form 10-K for the fiscal year ended December 31, 2012)
|
|
*10.25
|
|
Amendment #3 to the Edwards Lifesciences Corporation 401(k) Savings and Investment Plan, dated October 21, 2011 (incorporated by reference to Exhibit 10.21 in Edwards Lifesciences' report on Form 10-K for the fiscal year ended December 31, 2012)
|
|
*10.26
|
|
Amendment #4 to the Edwards Lifesciences Corporation 401(k) Savings and Investment Plan, dated November 12, 2014 (incorporated by reference to Exhibit 10.23 in Edwards Lifesciences’ report on Form 10-K for the fiscal year ended December 31, 2015)
|
|
*10.27
|
|
Amendment #5 to the Edwards Lifesciences Corporation 401(k) Savings and Investment Plan, dated September 1, 2015 (incorporated by reference to Exhibit 10.1 in Edwards Lifesciences’ report on Form 10-Q for the quarterly period ended September 30, 2015)
|
|
*10.28
|
|
Edwards Lifesciences Corporation 2001 Employee Stock Purchase Plan for United States Employees, as amended and restated November 10, 2009 (incorporated by reference to Appendix B in Edwards Lifesciences' Definitive Proxy Statement filed on March 29, 2013)
|
|
*10.29
|
|
Edwards Lifesciences Corporation 2001 Employee Stock Purchase Plan for International Employees, as amended and restated February 20, 2014 (incorporated by reference to Appendix B in Edwards Lifesciences' Definitive Proxy Statement filed on March 28, 2014)
|
|
*10.30
|
|
Edwards Lifesciences Corporation 2010 Edwards Incentive Plan (incorporated by reference to Appendix C in Edwards Lifesciences' Definitive Proxy Statement filed on March 31, 2010)
|
|
*10.31
|
|
Edwards Lifesciences Corporation Officer Perquisite Program Guidelines, as of February 20, 2013 (incorporated by reference to Exhibit 10.25 in Edwards Lifesciences' report on Form 10-K for the fiscal year ended December 31, 2012)
|
|
*10.32
|
|
Edwards Lifesciences Corporation Form of Indemnification Agreement (incorporated by reference to Exhibit 10.20 in Edwards Lifesciences' report on Form 10-K for the fiscal year ended December 31, 2011)
|
89
|
Exhibit No.
|
Exhibit No.
|
|
|
12.1
|
|
Ratio of Earnings to Fixed Charges
|
|
21.1
|
|
Subsidiaries of Edwards Lifesciences Corporation
|
|
23
|
|
Consent of Independent Registered Public Accounting Firm
|
|
31.1
|
|
Certification Pursuant to Section 302 of the Sarbanes-Oxley Act of 2002
|
|
31.2
|
|
Certification Pursuant to Section 302 of the Sarbanes-Oxley Act of 2002
|
|
32
|
|
Certification Pursuant to 18 U.S.C. Section 1350, as Adopted Pursuant to Section 906 of the Sarbanes-Oxley Act of 2002
|
|
101
|
|
The following financial statements from Edwards Lifesciences' Annual Report on Form 10-K for the year ended December 31, 2015, formatted in XBRL (eXtensible Business Reporting Language): (i) the Consolidated Balance Sheets, (ii) the Consolidated Statements of Operations, (iii) the Consolidated Statements of Comprehensive Income, (iv) the Consolidated Statements of Cash Flows, (v) the Consolidated Statements of Stockholders' Equity and (vi) Notes to Consolidated Financial Statements.
|
______________________________________________________________________________
# Pursuant to a request for confidential treatment, confidential portions of this exhibit have been redacted and have been filed separately with the Securities and Exchange Commission
* Represents management contract or compensatory plan
90
TABLE OF CONTENTS
Part IItem 1. BusinessItem 1A. Risk FactorsItem 1B. Unresolved Staff CommentsItem 2. PropertiesItem 3. Legal ProceedingsItem 4. Mine Safety DisclosuresPart IIItem 5. Market For Registrant's Common Equity, Related Stockholder Matters and Issuer Purchases Of Equity SecuritiesItem 6. Selected Financial DataItem 7. Management's Discussion and Analysis Of Financial Condition and Results Of OperationsItem 7A. Quantitative and Qualitative Disclosures About Market RiskItem 8. Financial Statements and Supplementary DataItem 9. Changes in and Disagreements with Accountants on Accounting and Financial DisclosureItem 9A. Controls and ProceduresItem 9B. Other InformationPart IIIItem 10. Directors, Executive Officers and Corporate GovernanceItem 11. Executive CompensationItem 12. Security Ownership Of Certain Beneficial Owners and Management and Related Stockholder MattersItem 13. Certain Relationships and Related Transactions, and Director IndependenceItem 14. Principal Accounting Fees and ServicesPart IVItem 15. Exhibits, Financial Statement Schedules