EDWARDS LIFESCIENCES CORP
10-Ks and 10-Qs
|
|
|
|
|
|
|
|
|
|
|
|
|
|
|
|
|
|
|
|
|
|
|
|
|
|
|
|
|
|
|
|
|
|
|
|
|
|
|
|
|
|
|
|
|
|
|
|
|
|
|
|
|
|
|
|
UNITED STATES
SECURITIES AND EXCHANGE COMMISSION
Washington, D.C. 20549
FORM 10-Q
(Mark One)
|
ý
|
QUARTERLY REPORT PURSUANT TO SECTION 13 OR 15(d) OF THE SECURITIES EXCHANGE ACT OF 1934
|
For the Quarterly Period Ended
September 30, 2017
or
|
o
|
TRANSITION REPORT PURSUANT TO SECTION 13 OR 15(d) OF THE SECURITIES EXCHANGE ACT OF 1934
|
For the transition period from to
Commission file number 1-15525
EDWARDS LIFESCIENCES CORPORATION
(Exact name of registrant as specified in its charter)
|
Delaware
|
|
36-4316614
|
|
(State or other jurisdiction of
incorporation or organization)
|
|
(I.R.S. Employer Identification No.)
|
|
One Edwards Way, Irvine, California
|
|
92614
|
|
(Address of principal executive offices)
|
|
(Zip Code)
|
|
(949) 250-2500
(Registrant's telephone number, including area code)
|
||
Indicate by check mark whether the registrant (1) has filed all reports required to be filed by Section 13 or 15(d) of the Securities Exchange Act of 1934 during the preceding 12 months (or for such shorter period that the registrant was required to file such reports), and (2) has been subject to such filing requirements for the past 90 days. Yes
ý
No
o
Indicate by check mark whether the registrant has submitted electronically and posted on its corporate Web site, if any, every Interactive Data File required to be submitted and posted pursuant to Rule 405 of Regulation S-T (§232.405 of this chapter) during the preceding 12 months (or for such shorter period that the registrant was required to submit and post such files). Yes
ý
No
o
Indicate by check mark whether the registrant is a large accelerated filer, an accelerated filer, a non-accelerated filer, smaller reporting company, or an emerging growth company. See the definitions of "large accelerated filer," "accelerated filer," "smaller reporting company," and "emerging growth company" in Rule 12b-2 of the Exchange Act.
|
Large accelerated filer
ý
|
|
Accelerated filer
o
|
|
Non-accelerated filer
o
(Do not check if a smaller
reporting company)
|
|
Smaller reporting company
o
|
Emerging growth company
o
|
|
If an emerging growth company, indicate by check mark if the registrant has elected not to use the extended transition period for complying with any new or revised financial accounting standards provided pursuant to Section 13(a) of the Exchange Act.
o
Indicate by check mark whether the registrant is a shell company (as defined in Rule 12b-2 of the Exchange Act). Yes
o
No
ý
The number of shares outstanding of the registrant's common stock, $1.00 par value, as of
October 23, 2017
was
211,619,891
.
EDWARDS LIFESCIENCES CORPORATION
FORM 10-Q
For the quarterly period ended
September 30, 2017
TABLE OF CONTENTS
|
|
|
Page
Number
|
|
|
||
|
|
||
|
|
||
|
|
||
|
|
||
|
|
||
|
|
||
EDWARDS LIFESCIENCES CORPORATION
(in millions, except par value; unaudited)
|
|
September 30,
2017 |
December 31,
2016 |
|||||
|
ASSETS
|
|
|
|
|
|||
|
Current assets
|
|
|
|
|
|||
|
Cash and cash equivalents
|
$
|
630.3
|
|
$
|
930.1
|
|
|
|
Short-term investments (Note 5)
|
772.5
|
|
341.0
|
|
|||
|
Accounts and other receivables, net of allowances of $9.4 and $9.0, respectively
|
475.0
|
|
414.6
|
|
|||
|
Inventories (Note 2)
|
538.4
|
|
396.6
|
|
|||
|
Prepaid expenses
|
52.8
|
|
45.9
|
|
|||
|
Other current assets
|
97.4
|
|
111.8
|
|
|||
|
Total current assets
|
2,566.4
|
|
2,240.0
|
|
|||
|
Long-term investments (Note 5)
|
567.5
|
|
532.1
|
|
|||
|
Property, plant, and equipment, net
|
649.6
|
|
580.0
|
|
|||
|
Goodwill (Note 4)
|
980.5
|
|
626.1
|
|
|||
|
Other intangible assets, net (Note 4)
|
414.9
|
|
204.8
|
|
|||
|
Deferred income taxes
|
197.1
|
|
203.8
|
|
|||
|
Other assets
|
112.4
|
|
123.2
|
|
|||
|
Total assets
|
$
|
5,488.4
|
|
$
|
4,510.0
|
|
|
|
LIABILITIES AND STOCKHOLDERS' EQUITY
|
|
|
|
|
|||
|
Current liabilities
|
|
|
|
|
|||
|
Accounts payable and accrued liabilities (Note 2)
|
$
|
693.7
|
|
$
|
532.5
|
|
|
|
Contingent consideration liabilities (Notes 4 and 6)
|
41.5
|
|
—
|
|
|||
|
Total current liabilities
|
735.2
|
|
532.5
|
|
|||
|
Long-term debt
|
1,034.0
|
|
822.3
|
|
|||
|
Contingent consideration liabilities (Notes 4 and 6)
|
140.5
|
|
31.6
|
|
|||
|
Other long-term liabilities
|
416.2
|
|
504.6
|
|
|||
|
Commitments and contingencies (Note 9)
|
|
|
|
|
|||
|
Stockholders' equity
|
|
|
|
|
|||
|
Preferred stock, $.01 par value, authorized 50.0 shares, no shares outstanding
|
—
|
|
—
|
|
|||
|
Common stock, $1.00 par value, 350.0 shares authorized, 211.6 and 242.6 shares issued, and 211.6 and 211.6 shares outstanding, respectively
|
211.6
|
|
242.6
|
|
|||
|
Additional paid-in capital
|
1,129.5
|
|
1,167.8
|
|
|||
|
Retained earnings
|
1,964.9
|
|
3,906.3
|
|
|||
|
Accumulated other comprehensive loss
|
(142.7
|
)
|
(198.4
|
)
|
|||
|
Treasury stock, at cost, 0.01 and 31.0 shares, respectively (Note 10)
|
(0.8
|
)
|
(2,499.3
|
)
|
|||
|
Total stockholders' equity
|
3,162.5
|
|
2,619.0
|
|
|||
|
Total liabilities and stockholders' equity
|
$
|
5,488.4
|
|
$
|
4,510.0
|
|
|
The accompanying notes are an integral part of these
consolidated condensed financial statements.
1
EDWARDS LIFESCIENCES CORPORATION
(in millions, except per share information; unaudited)
|
|
Three Months Ended
September 30, |
Nine Months Ended
September 30, |
|||||||||||||
|
|
2017
|
2016
|
2017
|
2016
|
|||||||||||
|
Net sales
|
$
|
821.5
|
|
$
|
739.4
|
|
$
|
2,546.8
|
|
$
|
2,196.0
|
|
|||
|
Cost of sales
|
213.3
|
|
201.4
|
|
640.0
|
|
584.2
|
|
|||||||
|
Gross profit
|
608.2
|
|
538.0
|
|
1,906.8
|
|
1,611.8
|
|
|||||||
|
Selling, general, and administrative expenses
|
244.6
|
|
229.6
|
|
718.0
|
|
671.1
|
|
|||||||
|
Research and development expenses
|
142.9
|
|
113.0
|
|
406.0
|
|
327.3
|
|
|||||||
|
Intellectual property litigation expenses
|
13.7
|
|
6.5
|
|
31.6
|
|
27.8
|
|
|||||||
|
Change in fair value of contingent consideration liabilities, net (Note 6)
|
(16.7
|
)
|
0.1
|
|
(12.5
|
)
|
1.1
|
|
|||||||
|
Special charges (Note 3)
|
10.2
|
|
—
|
|
41.4
|
|
34.5
|
|
|||||||
|
Interest expense, net
|
0.1
|
|
2.1
|
|
3.9
|
|
6.9
|
|
|||||||
|
Other expenses, net
|
1.6
|
|
1.5
|
|
7.4
|
|
5.6
|
|
|||||||
|
Income before provision for income taxes
|
211.8
|
|
185.2
|
|
711.0
|
|
537.5
|
|
|||||||
|
Provision for income taxes
|
41.7
|
|
43.8
|
|
124.6
|
|
126.5
|
|
|||||||
|
Net income
|
$
|
170.1
|
|
$
|
141.4
|
|
$
|
586.4
|
|
$
|
411.0
|
|
|||
|
Share information
(Note 12)
|
|
|
|
|
|
|
|
|
|||||||
|
Earnings per share:
|
|
|
|
|
|
|
|
|
|||||||
|
Basic
|
$
|
0.81
|
|
$
|
0.66
|
|
$
|
2.78
|
|
$
|
1.93
|
|
|||
|
Diluted
|
$
|
0.79
|
|
$
|
0.65
|
|
$
|
2.71
|
|
$
|
1.89
|
|
|||
|
Weighted-average number of common shares outstanding:
|
|
|
|
|
|
|
|
|
|||||||
|
Basic
|
211.3
|
|
213.2
|
|
211.0
|
|
212.8
|
|
|||||||
|
Diluted
|
216.2
|
|
218.1
|
|
216.1
|
|
217.7
|
|
|||||||
The accompanying notes are an integral part of these
consolidated condensed financial statements.
2
EDWARDS LIFESCIENCES CORPORATION
CONSOLIDATED CONDENSED STATEMENTS OF COMPREHENSIVE INCOME
(in millions; unaudited)
|
|
Three Months Ended
September 30, |
Nine Months Ended
September 30, |
|||||||||||||
|
|
2017
|
2016
|
2017
|
2016
|
|||||||||||
|
Net income
|
$
|
170.1
|
|
$
|
141.4
|
|
$
|
586.4
|
|
$
|
411.0
|
|
|||
|
Other comprehensive income, net of tax (Note 11):
|
|||||||||||||||
|
Foreign currency translation adjustments
|
26.2
|
|
10.6
|
|
87.1
|
|
31.5
|
|
|||||||
|
Unrealized loss on cash flow hedges
|
(10.6
|
)
|
(2.0
|
)
|
(29.2
|
)
|
(22.8
|
)
|
|||||||
|
Defined benefit pension plans
|
0.5
|
|
—
|
|
0.6
|
|
—
|
|
|||||||
|
Unrealized (loss) gain on available-for-sale investments
|
(2.1
|
)
|
(1.3
|
)
|
(4.7
|
)
|
1.9
|
|
|||||||
|
Reclassification of net realized investment loss to earnings
|
1.1
|
|
0.2
|
|
1.9
|
|
0.8
|
|
|||||||
|
Other comprehensive income
|
15.1
|
|
7.5
|
|
55.7
|
|
11.4
|
|
|||||||
|
Comprehensive income
|
$
|
185.2
|
|
$
|
148.9
|
|
$
|
642.1
|
|
$
|
422.4
|
|
|||
The accompanying notes are an integral part of these
consolidated condensed financial statements.
3
EDWARDS LIFESCIENCES CORPORATION
(in millions; unaudited)
|
|
Nine Months Ended
September 30, |
||||||
|
|
2017
|
2016
|
|||||
|
Cash flows from operating activities
|
|
|
|
|
|||
|
Net income
|
$
|
586.4
|
|
$
|
411.0
|
|
|
|
Adjustments to reconcile net income to net cash provided by operating activities:
|
|
|
|
|
|||
|
Depreciation and amortization
|
60.7
|
|
52.1
|
|
|||
|
Stock-based compensation (Note 8)
|
46.3
|
|
43.0
|
|
|||
|
Excess tax benefit from stock plans (Note 1)
|
—
|
|
(56.6
|
)
|
|||
|
Impairment charge (Note 3)
|
31.0
|
|
—
|
|
|||
|
Change in fair value of contingent consideration liabilities, net (Note 6)
|
(12.5
|
)
|
1.1
|
|
|||
|
Deferred income taxes
|
44.1
|
|
(2.6
|
)
|
|||
|
Purchased in-process research and development
|
6.7
|
|
34.5
|
|
|||
|
Other
|
(2.2
|
)
|
3.9
|
|
|||
|
Changes in operating assets and liabilities:
|
|
|
|
|
|||
|
Accounts and other receivables, net
|
(14.4
|
)
|
(54.8
|
)
|
|||
|
Inventories
|
(109.8
|
)
|
(43.1
|
)
|
|||
|
Accounts payable and accrued liabilities
|
48.6
|
|
41.4
|
|
|||
|
Income taxes
|
(55.0
|
)
|
72.9
|
|
|||
|
Prepaid expenses and other current assets
|
0.1
|
|
(14.5
|
)
|
|||
|
Other
|
6.8
|
|
15.0
|
|
|||
|
Net cash provided by operating activities
|
636.8
|
|
503.3
|
|
|||
|
Cash flows from investing activities
|
|
|
|
|
|||
|
Capital expenditures
|
(116.2
|
)
|
(112.9
|
)
|
|||
|
Purchases of held-to-maturity investments (Note 5)
|
(716.9
|
)
|
(579.6
|
)
|
|||
|
Proceeds from held-to-maturity investments (Note 5)
|
333.0
|
|
628.7
|
|
|||
|
Purchases of available-for sale investments (Note 5)
|
(477.8
|
)
|
(337.0
|
)
|
|||
|
Proceeds from available-for-sale investments (Note 5)
|
381.0
|
|
161.1
|
|
|||
|
Investments in intangible assets and in-process research and development
|
(7.4
|
)
|
(41.3
|
)
|
|||
|
Investments in trading securities, net
|
(8.0
|
)
|
(6.5
|
)
|
|||
|
Investments in unconsolidated affiliates, net (Note 5)
|
0.3
|
|
(5.1
|
)
|
|||
|
Acquisition of business, net of cash acquired (Note 4)
|
(84.9
|
)
|
—
|
|
|||
|
Other
|
0.4
|
|
0.7
|
|
|||
|
Net cash used in investing activities
|
(696.5
|
)
|
(291.9
|
)
|
|||
|
Cash flows from financing activities
|
|
|
|
|
|||
|
Proceeds from issuance of debt
|
989.3
|
|
24.6
|
|
|||
|
Payments on debt and capital lease obligations
|
(812.8
|
)
|
(25.7
|
)
|
|||
|
Purchases of treasury stock
|
(512.0
|
)
|
(380.9
|
)
|
|||
|
Equity forward contract related to accelerated share repurchase agreement
|
—
|
|
(35.0
|
)
|
|||
|
Excess tax benefit from stock plans (Note 1)
|
—
|
|
56.6
|
|
|||
|
Proceeds from stock plans
|
91.3
|
|
82.7
|
|
|||
|
Other
|
—
|
|
4.1
|
|
|||
|
Net cash used in financing activities
|
(244.2
|
)
|
(273.6
|
)
|
|||
|
Effect of currency exchange rate changes on cash and cash equivalents
|
4.1
|
|
(11.2
|
)
|
|||
|
Net decrease in cash and cash equivalents
|
(299.8
|
)
|
(73.4
|
)
|
|||
|
Cash and cash equivalents at beginning of period
|
930.1
|
|
718.4
|
|
|||
|
Cash and cash equivalents at end of period
|
$
|
630.3
|
|
$
|
645.0
|
|
|
|
Supplemental disclosures:
|
|
|
|
|
|||
|
Non-cash investing and financing transactions:
|
|
|
|
|
|||
|
Fair value of shares issued in connection with business combinations (Note 4)
|
$
|
266.5
|
|
$
|
—
|
|
|
|
Capital expenditures accruals
|
$
|
19.1
|
|
$
|
19.7
|
|
|
|
Retirement of treasury stock (Note 10)
|
$
|
2,746.2
|
|
$
|
—
|
|
|
The accompanying notes are an integral part of these
consolidated condensed financial statements.
4
1. BASIS OF PRESENTATION
The accompanying interim consolidated condensed financial statements and related disclosures have been prepared pursuant to the rules and regulations of the Securities and Exchange Commission ("SEC") and should be read in conjunction with the consolidated financial statements and notes included in Edwards Lifesciences Corporation's Annual Report on Form 10-K for the year ended
December 31, 2016
. Certain information and footnote disclosures normally included in financial statements prepared in accordance with generally accepted accounting principles ("GAAP") have been condensed or omitted.
In the opinion of management of Edwards Lifesciences Corporation ("Edwards Lifesciences" or the "Company"), the interim consolidated condensed financial statements reflect all adjustments considered necessary for a fair statement of the interim periods. All such adjustments are of a normal, recurring nature. The results of operations for the interim periods are not necessarily indicative of the results of operations to be expected for the full year.
Recently Adopted Accounting Standards
In March 2016, the Financial Accounting Standards Board ("FASB") issued an amendment to the guidance on stock compensation. The amendment simplifies several aspects of the accounting for share-based payment award transactions, including the income tax consequences, classification of awards as either equity or liabilities, and classification on the statement of cash flows. The guidance was effective for annual periods beginning after December 15, 2016, and interim periods within those annual periods. The Company adopted this standard effective January 1, 2017. The impact of the standard was as follows:
|
•
|
the Company recorded excess tax benefits of
$46.9 million
as a benefit to the "
Provision for Income Taxes
" for the
nine months ended September 30, 2017
. Previously, this amount would have been recorded to "
Additional Paid-in Capital
";
|
|
•
|
the new standard eliminates the requirement that excess tax benefits be realized through a reduction in income taxes payable before a company can recognize them. As a result, on January 1, 2017, the Company recorded, on a modified-retrospective basis, a cumulative-effect adjustment of
$9.3 million
in retained earnings for excess tax benefits not previously recognized;
|
|
•
|
in the diluted earnings per share calculation, when applying the treasury stock method for shares that could be repurchased, the assumed proceeds no longer include the amount of excess tax benefit. This did not have a material impact on the Company's diluted net earnings per share calculation;
|
|
•
|
the new standard requires that excess tax benefits be reported as operating activities in the consolidated statements of cash flows. Previously, these cash flows were included in financing activities. The Company elected to apply this change on a prospective basis;
|
|
•
|
the new standard requires that employee taxes paid when an employer withholds shares for tax-withholding purposes be reported as financing activities in the consolidated statements of cash flows. This had no impact since the Company has historically presented these amounts as a financing activity; and
|
|
•
|
the Company elected not to change its policy on accounting for forfeitures, and continued to estimate forfeitures expected to occur to determine the amount of compensation cost to be recognized each period.
|
New Accounting Standards Not Yet Adopted
In August 2017, the FASB issued an amendment to the guidance on derivatives and hedging. The amendment expands
and refines hedge accounting for both nonfinancial and financial risk components and aligns the recognition and presentation of the effects of the hedging instrument and the hedged item in the financial statements. The guidance eliminates the requirement to separately measure and report hedge ineffectiveness and generally requires the entire change in the fair value of a hedging instrument to be presented in the same income statement line as the hedged item. The guidance also eases certain documentation and assessment requirements and modifies the accounting for components excluded from the assessment of hedge effectiveness. The guidance is effective for periods beginning after December 15, 2018, including interim periods within those annual periods. Early adoption is permitted in any interim or annual period. The Company is currently evaluating the impact this guidance will have on its consolidated financial statements.
5
In March 2017, the FASB issued an amendment on the guidance on retirement benefits. The amendment requires that an employer disaggregate the service cost component from the other components of net benefit cost. The amendment also provides explicit guidance on how to present the service cost component and the other components of net benefit cost in the income statement and allows only the service cost component of net benefit cost to be eligible for capitalization. The guidance is effective for periods beginning after December 15, 2017, including interim periods within those annual periods. The guidance related to the presentation of the service cost component and the other components of net benefit cost in the income statement must be applied retrospectively, and the guidance related to the capitalization of the service cost component of net benefit cost must be applied prospectively. The Company does not expect the adoption of this guidance will have a material impact on its consolidated financial statements.
In May 2014, the FASB issued an update to the accounting guidance on revenue recognition. The new guidance provides a comprehensive, principles-based approach to revenue recognition, and supersedes most previous revenue recognition guidance. The core principle of the guidance is that an entity should recognize revenue to depict the transfer of promised goods or services to customers in an amount that reflects the consideration to which the entity expects to be entitled in exchange for those goods or services. The guidance also requires improved disclosures on the nature, amount, timing, and uncertainty of revenue that is recognized. In August 2015, the FASB issued an update to the guidance to defer the effective date by one year, such that the new standard will be effective for annual reporting periods beginning after December 15, 2017 and interim periods therein. The new guidance can be applied retrospectively to each prior reporting period presented, or retrospectively with the cumulative effect of the change recognized at the date of the initial application. The Company will apply the new guidance effective January 1, 2018 using the modified retrospective method to contracts that are not completed as of January 1, 2018. The Company does not expect the adoption of this guidance, including the cumulative effect of any adjustment to the opening balance of retained earnings, to have a material impact to its consolidated financial statements.
2. COMPOSITION OF CERTAIN FINANCIAL STATEMENT CAPTIONS
Components of selected captions in the consolidated condensed balance sheets consisted of the following (in millions):
|
September 30, 2017
|
December 31, 2016
|
||||||
|
Inventories
|
|||||||
|
Raw materials
|
$
|
83.2
|
|
$
|
60.6
|
|
|
|
Work in process
|
136.6
|
|
102.4
|
|
|||
|
Finished products
|
318.6
|
|
233.6
|
|
|||
|
$
|
538.4
|
|
$
|
396.6
|
|
||
At
September 30, 2017
and
December 31, 2016
,
$87.2 million
and
$64.2 million
, respectively, of the Company's finished products inventories were held on consignment.
|
September 30, 2017
|
December 31, 2016
|
||||||
|
Accounts payable and accrued liabilities
|
|
|
|
|
|||
|
Accounts payable
|
$
|
113.4
|
|
$
|
97.1
|
|
|
|
Employee compensation and withholdings
|
214.2
|
|
216.1
|
|
|||
|
Taxes payable (Note 13)
|
73.7
|
|
5.9
|
|
|||
|
Property, payroll, and other taxes
|
38.5
|
|
35.3
|
|
|||
|
Research and development accruals
|
41.9
|
|
40.0
|
|
|||
|
Accrued rebates
|
49.2
|
|
36.1
|
|
|||
|
Fair value of derivatives
|
25.8
|
|
3.3
|
|
|||
|
Accrued marketing expenses
|
17.3
|
|
12.6
|
|
|||
|
Accrued professional services
|
12.2
|
|
4.0
|
|
|||
|
Litigation reserves
|
8.2
|
|
7.8
|
|
|||
|
Other accrued liabilities
|
99.3
|
|
74.3
|
|
|||
|
$
|
693.7
|
|
$
|
532.5
|
|
||
6
3. SPECIAL CHARGES
Realignment Expenses
In September 2017, the Company recorded a
$10.2 million
charge related primarily to severance expenses (impacting
232
employees) and other costs associated with the planned closure of its manufacturing plant in Switzerland. As of
September 30, 2017
, the Company's remaining severance obligations of
$9.6 million
are expected to be substantially paid by September 30, 2018.
Impairment of Long-lived Assets
In June 2017, the Company recorded a
$31.2 million
charge related to the other-than-temporary impairment of one of its cost method investments and an associated long-term asset related to the Company's option to acquire this investee. The Company concluded that the impairment of these assets was other-than-temporary based upon a recent review of the investee's clinical data and trial results, which did not support continuation of the product development effort, and the financial condition and near-term prospects of the investee.
Acquisition of In-process Research and Development ("IPR&D")
In May 2016, the Company entered into
two
separate agreements to acquire technologies for use in its transcatheter heart valve programs. In connection with these agreements, the Company recorded an IPR&D charge totaling
$34.5 million
. The acquired technologies are in the early stages of development and have no alternative uses. Additional design developments, bench testing, pre-clinical studies, and human clinical studies must be successfully completed prior to selling any product using these technologies.
4. ACQUISITION
On November 26, 2016, the Company entered into an agreement and plan of merger to acquire Valtech Cardio Ltd. ("Valtech") for approximately
$340.0 million
, subject to certain adjustments, with the potential for up to an additional
$350.0 million
in pre-specified milestone-driven payments over the next
10
years. The transaction closed on January 23, 2017, and the consideration paid included the issuance of approximately
2.8 million
shares of the Company's common stock (fair value of
$266.5 million
) and cash of
$86.2 million
. The Company recognized in "
Other Long-term Liabilities
" a
$162.9 million
liability for the estimated fair value of the contingent milestone payments. The fair value of the contingent milestone payments will be remeasured each quarter, with changes in the fair value recognized within operating expenses on the consolidated statements of operations. For further information on the fair value of the contingent milestone payments, see Note 6.
In connection with the acquisition, the Company placed
$27.6 million
of the purchase price into escrow to satisfy any claims for indemnification made in accordance with the merger agreement. Any funds remaining
15 months
after the acquisition date will be disbursed to Valtech's former shareholders. Acquisition-related costs of
$0.6 million
and
$4.1 million
were recorded in “
Selling, General, and Administrative Expenses
” during the
nine months ended September 30, 2017
and the year ended December 31, 2016, respectively. Prior to the close of the transaction, Valtech spun off its early-stage transseptal mitral valve replacement technology program. Concurrent with the closing, the Company entered into an agreement for an exclusive option to acquire that program and its associated intellectual property for
$200.0 million
, subject to certain adjustments, plus an additional
$50.0 million
if a certain European regulatory approval is obtained within
10
years of the acquisition closing date. The option expires
two
years after the closing date of the transaction, but can be extended by up to
one
year depending on the results of certain clinical trials.
Valtech is a developer of a transcatheter mitral and tricuspid valve repair system. The Company plans to add this technology to its portfolio of mitral and tricuspid repair products. The acquisition was accounted for as a business combination. Tangible and intangible assets acquired were recorded based on their estimated fair values at the acquisition date. The excess of the purchase price over the fair value of net assets acquired was recorded to goodwill. The following table summarizes the fair values of the assets acquired and liabilities assumed as of the acquisition date (in millions):
7
|
Current assets
|
$
|
22.7
|
|
||
|
Property and equipment, net
|
1.2
|
|
|||
|
Goodwill
|
316.5
|
|
|||
|
Developed technology
|
109.2
|
|
|||
|
In-process research and development ("IPR&D")
|
87.9
|
|
|||
|
Other assets
|
0.8
|
|
|||
|
Current liabilities assumed
|
(5.1
|
)
|
|||
|
Deferred income taxes
|
(17.6
|
)
|
|||
|
Total purchase price
|
515.6
|
|
|||
|
Less: cash acquired
|
(4.3
|
)
|
|||
|
Total purchase price, net of cash acquired
|
$
|
511.3
|
|
||
Goodwill includes expected synergies and other benefits the Company believes will result from the acquisition. Goodwill was assigned to the Company’s Rest of World segment and is not deductible for tax purposes. IPR&D has been capitalized at fair value as an intangible asset with an indefinite life and will be assessed for impairment in subsequent periods. The fair value of the IPR&D was determined using the income approach. This approach determines fair value based on cash flow projections which are discounted to present value using a risk-adjusted rate of return. The discount rates used to determine the fair value of the IPR&D ranged from
18.0%
to
20.0%
. Completion of successful design developments, bench testing, pre-clinical studies and human clinical studies are required prior to selling any product. The risks and uncertainties associated with completing development within a reasonable period of time include those related to the design, development, and manufacturability of the product, the success of pre-clinical and clinical studies, and the timing of regulatory approvals. The valuation assumed
$87.3 million
of additional research and development expenditures would be incurred prior to the date of product introduction. In the valuation, net cash inflows were modeled to commence in 2019. Upon completion of development, the underlying IPR&D asset will be amortized over its estimated useful life. Developed technology assets are being amortized over a weighted-average useful life of
11
years.
The results of operations for Valtech have been included in the accompanying consolidated financial statements from the date of acquisition. Pro forma results have not been presented as the results of Valtech are not material in relation to the consolidated financial statements of the Company.
8
5. INVESTMENTS
Debt Securities
Investments in debt securities at the end of each period were as follows (in millions):
|
|
September 30, 2017
|
December 31, 2016
|
|||||||||||||||||||||||||||||
|
Held-to-maturity
|
Cost
|
Gross Unrealized Gains
|
Gross Unrealized Losses
|
Fair Value
|
Cost
|
Gross Unrealized Gains
|
Gross Unrealized Losses
|
Fair Value
|
|||||||||||||||||||||||
|
Bank time deposits
|
$
|
616.4
|
|
$
|
—
|
|
$
|
—
|
|
$
|
616.4
|
|
$
|
217.0
|
|
$
|
—
|
|
$
|
—
|
|
$
|
217.0
|
|
|||||||
|
Commercial paper
|
0.2
|
|
—
|
|
—
|
|
0.2
|
|
—
|
|
—
|
|
—
|
|
—
|
|
|||||||||||||||
|
U.S. government and agency securities
|
4.5
|
|
—
|
|
—
|
|
4.5
|
|
16.1
|
|
—
|
|
(0.1
|
)
|
16.0
|
|
|||||||||||||||
|
Asset-backed securities
|
—
|
|
—
|
|
—
|
|
—
|
|
0.3
|
|
—
|
|
—
|
|
0.3
|
|
|||||||||||||||
|
Corporate debt securities
|
0.9
|
|
—
|
|
—
|
|
0.9
|
|
3.0
|
|
—
|
|
—
|
|
3.0
|
|
|||||||||||||||
|
Municipal securities
|
—
|
|
—
|
|
—
|
|
—
|
|
1.9
|
|
—
|
|
—
|
|
1.9
|
|
|||||||||||||||
|
Total
|
$
|
622.0
|
|
$
|
—
|
|
$
|
—
|
|
$
|
622.0
|
|
$
|
238.3
|
|
$
|
—
|
|
$
|
(0.1
|
)
|
$
|
238.2
|
|
|||||||
|
Available-for-sale
|
|||||||||||||||||||||||||||||||
|
Bank time deposits
|
$
|
2.5
|
|
$
|
—
|
|
$
|
—
|
|
$
|
2.5
|
|
$
|
—
|
|
$
|
—
|
|
$
|
—
|
|
$
|
—
|
|
|||||||
|
Commercial paper
|
48.0
|
|
—
|
|
—
|
|
48.0
|
|
35.4
|
|
—
|
|
—
|
|
35.4
|
|
|||||||||||||||
|
U.S. government and agency securities
|
64.7
|
|
—
|
|
(0.3
|
)
|
64.4
|
|
143.4
|
|
—
|
|
(0.7
|
)
|
142.7
|
|
|||||||||||||||
|
Foreign government bonds
|
3.0
|
|
—
|
|
—
|
|
3.0
|
|
—
|
|
—
|
|
—
|
|
—
|
|
|||||||||||||||
|
Asset-backed securities
|
128.1
|
|
0.1
|
|
(0.1
|
)
|
128.1
|
|
86.0
|
|
—
|
|
(0.2
|
)
|
85.8
|
|
|||||||||||||||
|
Corporate debt securities
|
450.8
|
|
1.0
|
|
(0.7
|
)
|
451.1
|
|
333.6
|
|
0.4
|
|
(1.5
|
)
|
332.5
|
|
|||||||||||||||
|
Municipal securities
|
4.5
|
|
—
|
|
—
|
|
4.5
|
|
4.6
|
|
—
|
|
(0.1
|
)
|
4.5
|
|
|||||||||||||||
|
Total
|
$
|
701.6
|
|
$
|
1.1
|
|
$
|
(1.1
|
)
|
$
|
701.6
|
|
$
|
603.0
|
|
$
|
0.4
|
|
$
|
(2.5
|
)
|
$
|
600.9
|
|
|||||||
The cost and fair value of investments in debt securities, by contractual maturity, as of
September 30, 2017
were as follows:
|
Held-to-Maturity
|
Available-for-Sale
|
||||||||||||||
|
|
Cost
|
Fair Value
|
Cost
|
Fair Value
|
|||||||||||
|
|
(in millions)
|
||||||||||||||
|
Due in 1 year or less
|
$
|
617.5
|
|
$
|
617.5
|
|
$
|
155.0
|
|
$
|
155.0
|
|
|||
|
Due after 1 year through 5 years
|
—
|
|
—
|
|
435.2
|
|
435.2
|
|
|||||||
|
Instruments not due at a single maturity date
|
4.5
|
|
4.5
|
|
111.4
|
|
111.4
|
|
|||||||
|
$
|
622.0
|
|
$
|
622.0
|
|
$
|
701.6
|
|
$
|
701.6
|
|
||||
Actual maturities may differ from the contractual maturities due to call or prepayment rights.
9
Investments in Unconsolidated Affiliates
The Company has a number of equity investments in privately and publicly held companies. Investments in these unconsolidated affiliates are recorded in "
Long-term Investments
" on the consolidated condensed balance sheets, and are as follows:
|
|
September 30,
2017 |
December 31,
2016 |
|||||
|
|
(in millions)
|
||||||
|
Available-for-sale investments
|
|
|
|
|
|||
|
Cost
|
$
|
—
|
|
$
|
—
|
|
|
|
Unrealized gains
|
—
|
|
0.1
|
|
|||
|
Fair value of available-for-sale investments
|
—
|
|
0.1
|
|
|||
|
Equity method investments
|
|
|
|
|
|||
|
Cost
|
9.2
|
|
9.5
|
|
|||
|
Equity in losses
|
(5.0
|
)
|
(3.9
|
)
|
|||
|
Carrying value of equity method investments
|
4.2
|
|
5.6
|
|
|||
|
Cost method investments
|
|
|
|
|
|||
|
Carrying value of cost method investments
|
12.2
|
|
28.2
|
|
|||
|
Total investments in unconsolidated affiliates
|
$
|
16.4
|
|
$
|
33.9
|
|
|
During the
three and nine months ended September 30, 2017
, the gross realized gains or losses from sales of available-for-sale investments were not material. See Note 3 for information regarding the Company's impairment of one of its cost method investments.
6. FAIR VALUE MEASUREMENTS
The consolidated condensed financial statements include financial instruments for which the fair market value of such instruments may differ from amounts reflected on a historical cost basis. Financial instruments of the Company consist of cash deposits, accounts and other receivables, investments, accounts payable, certain accrued liabilities, and borrowings under a revolving credit agreement. These financial instruments are held at cost, which generally approximates fair value due to their short-term nature.
Financial instruments also include long-term notes payable. As of
September 30, 2017
, the fair value of the notes payable, based on Level 2 inputs, was
$606.0 million
, versus a carrying value of
$598.7 million
.
Fair value is defined as the price that would be received to sell an asset or paid to transfer a liability in an orderly transaction between market participants. The Company prioritizes the inputs used to determine fair values in one of the following three categories:
Level 1—Quoted market prices in active markets for identical assets or liabilities.
Level 2—Inputs, other than quoted prices in active markets, that are observable, either directly or indirectly.
Level 3—Unobservable inputs that are not corroborated by market data.
In certain cases, the inputs used to measure fair value may fall into different levels of the fair value hierarchy. In such cases, the level in the fair value hierarchy within which the fair value measurement in its entirety falls has been determined based on the lowest level input that is significant to the fair value measurement in its entirety.
10
Assets and Liabilities Measured at Fair Value on a Recurring Basis
The following table summarizes the Company's financial instruments which are measured at fair value on a recurring basis (in millions):
|
September 30, 2017
|
Level 1
|
Level 2
|
Level 3
|
Total
|
|||||||||||
|
Assets
|
|
|
|
|
|
|
|
|
|||||||
|
Cash equivalents
|
$
|
57.4
|
|
$
|
1.0
|
|
$
|
—
|
|
$
|
58.4
|
|
|||
|
Available-for-sale investments:
|
|
|
|||||||||||||
|
Bank time deposits
|
—
|
|
2.5
|
|
—
|
|
2.5
|
|
|||||||
|
Corporate debt securities
|
—
|
|
451.1
|
|
—
|
|
451.1
|
|
|||||||
|
Asset-backed securities
|
—
|
|
128.1
|
|
—
|
|
128.1
|
|
|||||||
|
U.S. government and agency securities
|
22.1
|
|
42.3
|
|
—
|
|
64.4
|
|
|||||||
|
Foreign government bonds
|
—
|
|
3.0
|
|
—
|
|
3.0
|
|
|||||||
|
Commercial paper
|
—
|
|
48.0
|
|
—
|
|
48.0
|
|
|||||||
|
Municipal securities
|
—
|
|
4.5
|
|
—
|
|
4.5
|
|
|||||||
|
Investments held for deferred compensation plans
|
59.7
|
|
—
|
|
—
|
|
59.7
|
|
|||||||
|
Derivatives
|
—
|
|
7.2
|
|
—
|
|
7.2
|
|
|||||||
|
$
|
139.2
|
|
$
|
687.7
|
|
$
|
—
|
|
$
|
826.9
|
|
||||
|
Liabilities
|
|
|
|
|
|
|
|
|
|||||||
|
Derivatives
|
$
|
—
|
|
$
|
25.8
|
|
$
|
—
|
|
$
|
25.8
|
|
|||
|
Deferred compensation plans
|
59.7
|
|
—
|
|
—
|
|
59.7
|
|
|||||||
|
Contingent consideration liabilities
|
—
|
|
—
|
|
182.0
|
|
182.0
|
|
|||||||
|
$
|
59.7
|
|
$
|
25.8
|
|
$
|
182.0
|
|
$
|
267.5
|
|
||||
|
December 31, 2016
|
|
|
|
|
|
|
|
|
|||||||
|
Assets
|
|
|
|
|
|
||||||||||
|
Cash equivalents
|
$
|
44.1
|
|
$
|
—
|
|
$
|
—
|
|
$
|
44.1
|
|
|||
|
Available-for-sale investments:
|
|||||||||||||||
|
Corporate debt securities
|
—
|
|
332.5
|
|
—
|
|
332.5
|
|
|||||||
|
Asset-backed securities
|
—
|
|
85.8
|
|
—
|
|
85.8
|
|
|||||||
|
U.S. government and agency securities
|
100.7
|
|
42.0
|
|
—
|
|
142.7
|
|
|||||||
|
Commercial paper
|
—
|
|
35.4
|
|
—
|
|
35.4
|
|
|||||||
|
Municipal securities
|
—
|
|
4.5
|
|
—
|
|
4.5
|
|
|||||||
|
Equity investments in unconsolidated affiliates
|
0.1
|
|
—
|
|
—
|
|
0.1
|
|
|||||||
|
Investments held for deferred compensation plans
|
46.0
|
|
—
|
|
—
|
|
46.0
|
|
|||||||
|
Derivatives
|
—
|
|
35.2
|
|
—
|
|
35.2
|
|
|||||||
|
$
|
190.9
|
|
$
|
535.4
|
|
$
|
—
|
|
$
|
726.3
|
|
||||
|
Liabilities
|
|
|
|
|
|
|
|
|
|||||||
|
Derivatives
|
$
|
—
|
|
$
|
3.3
|
|
$
|
—
|
|
$
|
3.3
|
|
|||
|
Deferred compensation plans
|
46.7
|
|
—
|
|
—
|
|
46.7
|
|
|||||||
|
Contingent consideration liabilities
|
—
|
|
—
|
|
31.6
|
|
31.6
|
|
|||||||
|
$
|
46.7
|
|
$
|
3.3
|
|
$
|
31.6
|
|
$
|
81.6
|
|
||||
The following table summarizes the changes in fair value of the contingent consideration liabilities for the
nine months ended September 30, 2017
(in millions):
|
Balance at December 31, 2016
|
$
|
31.6
|
|
|
|
Additions
|
162.9
|
|
||
|
Changes in fair value
|
(12.5
|
)
|
||
|
Balance at September 30, 2017
|
$
|
182.0
|
|
|
The contingent consideration liability related to one of the Company's previous business acquisitions was reduced by
$19.9 million
during the
three months ended September 30,
2017
due to delays in product development which reduced the probability of milestone achievement.
11
Cash Equivalents and Available-for-sale Investments
The Company estimates the fair values of its money market funds based on quoted prices in active markets for identical assets. The Company estimates the fair values of its time deposits, commercial paper, U.S. and foreign government and agency securities, municipal securities, asset-backed securities, and corporate debt securities by taking into consideration valuations obtained from third-party pricing services. The pricing services use industry standard valuation models, including both income and market-based approaches, for which all significant inputs are observable, either directly or indirectly, to estimate fair value. These inputs include reported trades and broker-dealer quotes on the same or similar securities, benchmark yields, credit spreads, prepayment and default projections based on historical data, and other observable inputs. The Company independently reviews and validates the pricing received from the third-party pricing service by comparing the prices to prices reported by a secondary pricing source. The Company’s validation procedures have not resulted in an adjustment to the pricing received from the pricing service.
Investments in unconsolidated affiliates are long-term equity investments in companies that are in various stages of development. Certain of the Company’s investments in unconsolidated affiliates are designated as available-for-sale. These investments are carried at fair market value based on quoted market prices.
Deferred Compensation Plans
The Company holds investments in trading securities related to its deferred compensation plans. The investments are in a variety of stock and bond mutual funds. The fair values of these investments and the corresponding liabilities are based on quoted market prices.
Derivative Instruments
The Company uses derivative financial instruments in the form of foreign currency forward exchange contracts to manage foreign currency exposures, and interest rate swap agreements to manage its interest rate exposures. All derivatives contracts are recognized on the balance sheet at their fair value. The fair value of foreign currency derivative financial instruments was estimated based on quoted market foreign exchange rates and market discount rates. The fair value of the interest rate swap agreements was determined based on a discounted cash flow analysis reflecting the contractual terms of the agreements and the 6-month LIBOR forward interest rate curve. Judgment was employed in interpreting market data to develop estimates of fair value; accordingly, the estimates presented herein are not necessarily indicative of the amounts that the Company could realize in a current market exchange. The use of different market assumptions or valuation methodologies could have a material effect on the estimated fair value amounts.
Contingent Consideration Liabilities
Certain of the Company's acquisitions involve contingent consideration arrangements. Payment of additional consideration is contingent upon the acquired company reaching certain performance milestones, such as attaining specified revenue levels, achieving product development targets, or obtaining regulatory approvals. These contingent consideration liabilities are measured at estimated fair value using either a probability weighted discounted cash flow analysis or a Monte Carlo simulation model, both of which consider significant unobservable inputs. These inputs include (1) the discount rate used to present value the projected cash flows (ranging from
1.0%
to
2.9%
), (2) the probability of milestone achievement (ranging from
25.0%
to
85.0%
), (3) the projected payment dates (ranging from 2018 to 2024), and (4) the volatility of future revenue (
50.0%
). The use of different assumptions could have a material effect on the estimated fair value amounts.
7. DERIVATIVE INSTRUMENTS AND HEDGING ACTIVITIES
The Company uses derivative financial instruments to manage interest rate and foreign currency risks, as summarized below. It is the Company's policy not to enter into derivative financial instruments for speculative purposes. Notional amounts are stated in United States dollar equivalents at spot exchange rates at the respective dates.
|
|
Notional Amount
|
||||||
|
|
September 30, 2017
|
December 31, 2016
|
|||||
|
|
(in millions)
|
||||||
|
Foreign currency forward exchange contracts
|
$
|
997.0
|
|
$
|
949.7
|
|
|
|
Interest rate swap agreements
|
300.0
|
|
300.0
|
|
|||
12
The Company uses interest rate swaps to convert a portion of its fixed-rate debt into variable-rate debt. These interest rate swaps are designated as fair value hedges and meet the shortcut method requirements under the accounting standards for derivatives and hedging. Accordingly, changes in the fair values of the interest rate swaps are considered to exactly offset changes in the fair value of the underlying long-term debt. The Company uses foreign currency forward exchange contracts to manage foreign currency risks. The contracts are denominated in currencies of major industrial countries, principally the Euro and the Japanese yen. The Company uses foreign currency forward exchange contracts to offset the changes due to currency rate movements in the amount of future cash flows associated with intercompany transactions and certain local currency expenses expected to occur within the next
13 months
. These foreign currency forward exchange contracts are designated as cash flow hedges. The Company also uses foreign currency forward exchange contracts and foreign currency denominated debt to offset changes in the value of its net investment in certain foreign subsidiaries resulting from changes in foreign currency exchange rates. The foreign currency forward exchange contracts and the foreign currency denominated debt are designated as net investment hedges. Certain of the Company's locations have assets and liabilities denominated in currencies other than their functional currencies resulting principally from intercompany and local currency transactions. The Company uses foreign currency forward exchange contracts that are not designated as hedging instruments to offset the transaction gains and losses associated with certain of these assets and liabilities.
All derivative financial instruments are recognized at fair value in the consolidated condensed balance sheets. For each derivative instrument that is designated and effective as a fair value hedge, the gain or loss on the derivative is recognized immediately to earnings, and offsets the loss or gain on the underlying hedged item. The gain or loss on the interest rate swaps (designated as fair value hedges) is classified in net interest expense, as they hedge the interest rate risk associated with the Company's fixed-rate debt. The Company reports in "
Accumulated Other Comprehensive Loss
" the effective portion of the gain or loss on derivative financial instruments that are designated, and that qualify, as cash flow hedges. The Company reclassifies these gains and losses into earnings in the same period in which the underlying hedged transactions affect earnings. The effective portions of net investment hedges are reported in "
Accumulated Other Comprehensive Loss
" as a part of the cumulative translation adjustment, and would be reclassified into earnings if the underlying net investment is sold or substantially liquidated. The ineffective portions of cash flow hedges and net investment hedges, if applicable, are recorded in current period earnings. For the
nine months ended September 30, 2017
and
2016
, the Company did not record any gains or losses due to hedge ineffectiveness. The gains and losses on derivative financial instruments for which the Company does not elect hedge accounting treatment are recognized in the consolidated condensed statements of operations in each period based upon the change in the fair value of the derivative financial instrument. Cash flows from net investment hedges are reported as investing activities in the consolidated condensed statements of cash flows, and cash flows from all other derivative financial instruments are reported as operating activities.
Derivative financial instruments involve credit risk in the event the counterparty should default. It is the Company's policy to execute such instruments with global financial institutions that the Company believes to be creditworthy. The Company diversifies its derivative financial instruments among counterparties to minimize exposure to any one of these entities. The Company also uses International Swap Dealers Association master-netting agreements. The master-netting agreements provide for the net settlement of all contracts through a single payment in a single currency in the event of default, as defined by the agreements.
The following table presents the location and fair value amounts of derivative instruments reported in the consolidated condensed balance sheets (in millions):
|
|
|
Fair Value
|
||||||||
|
Derivatives designated as hedging instruments
|
Balance Sheet
Location
|
September 30, 2017
|
December 31, 2016
|
|||||||
|
Assets
|
|
|
|
|
|
|||||
|
Foreign currency contracts
|
Other current assets
|
$
|
6.7
|
|
$
|
28.6
|
|
|||
|
Interest rate swap agreements
|
Other assets
|
$
|
0.5
|
|
$
|
0.4
|
|
|||
|
Liabilities
|
|
|
|
|
|
|||||
|
Foreign currency contracts
|
Accrued and other liabilities
|
$
|
25.8
|
|
$
|
3.3
|
|
|||
|
Derivatives not designated as hedging instruments
|
|
|
|
|
|
|||||
|
Assets
|
|
|
|
|
|
|||||
|
Foreign currency contracts
|
Other current assets
|
$
|
—
|
|
$
|
6.2
|
|
|||
13
The following table presents the effect of master-netting agreements and rights of offset on the consolidated condensed balance sheets (in millions):
|
|
|
|
|
Gross Amounts
Not Offset in
the Consolidated
Balance Sheet
|
|
||||||||||||||||||
|
|
|
Gross Amounts
Offset in the
Consolidated
Balance Sheet
|
|
||||||||||||||||||||
|
|
|
Net Amounts
Presented in the
Consolidated
Balance Sheet
|
|||||||||||||||||||||
|
September 30, 2017
|
Gross
Amounts
|
Financial
Instruments
|
Cash
Collateral
Received
|
Net
Amount
|
|||||||||||||||||||
|
Derivative assets
|
|
|
|
|
|
|
|
|
|
|
|
|
|||||||||||
|
Foreign currency contracts
|
$
|
6.7
|
|
$
|
—
|
|
$
|
6.7
|
|
$
|
(6.1
|
)
|
$
|
—
|
|
$
|
0.6
|
|
|||||
|
Interest rate swap agreements
|
$
|
0.5
|
|
$
|
—
|
|
$
|
0.5
|
|
$
|
—
|
|
$
|
—
|
|
$
|
0.5
|
|
|||||
|
Derivative liabilities
|
|
|
|
|
|
|
|
|
|
|
|
|
|||||||||||
|
Foreign currency contracts
|
$
|
25.8
|
|
$
|
—
|
|
$
|
25.8
|
|
$
|
(6.1
|
)
|
$
|
—
|
|
$
|
19.7
|
|
|||||
|
December 31, 2016
|
|
|
|
|
|
|
|
|
|
|
|
|
|||||||||||
|
Derivative assets
|
|
|
|
|
|
|
|
|
|
|
|
|
|||||||||||
|
Foreign currency contracts
|
$
|
34.8
|
|
$
|
—
|
|
$
|
34.8
|
|
$
|
(3.3
|
)
|
$
|
—
|
|
$
|
31.5
|
|
|||||
|
Interest rate swap agreements
|
$
|
0.4
|
|
$
|
—
|
|
$
|
0.4
|
|
$
|
—
|
|
$
|
—
|
|
$
|
0.4
|
|
|||||
|
Derivative liabilities
|
|
|
|
|
|
|
|
|
|
|
|
|
|||||||||||
|
Foreign currency contracts
|
$
|
3.3
|
|
$
|
—
|
|
$
|
3.3
|
|
$
|
(3.3
|
)
|
$
|
—
|
|
$
|
—
|
|
|||||
The following tables present the effect of derivative and non-derivative hedging instruments on the consolidated condensed statements of operations and consolidated condensed statements of comprehensive income (in millions):
|
|
Amount of Gain or (Loss)
Recognized in OCI
on Derivative
(Effective Portion)
|
|
Amount of Gain or (Loss)
Reclassified from
Accumulated OCI
into Income
|
|||||||||||||||
|
|
Three Months Ended
September 30, |
|
Three Months Ended
September 30, |
|||||||||||||||
|
|
Location of Gain or
(Loss) Reclassified from
Accumulated OCI
into Income
|
|||||||||||||||||
|
2017
|
2016
|
2017
|
2016
|
|||||||||||||||
|
Cash flow hedges
|
||||||||||||||||||
|
Foreign currency contracts
|
$
|
(13.6
|
)
|
$
|
(6.4
|
)
|
Cost of sales
|
$
|
3.1
|
|
$
|
(3.3
|
)
|
|||||
|
Selling, general, and administrative expenses
|
$
|
(0.4
|
)
|
$
|
(0.1
|
)
|
||||||||||||
|
Net investment hedges
|
||||||||||||||||||
|
Foreign currency contracts
|
$
|
—
|
|
$
|
(0.3
|
)
|
|
|
|
|
||||||||
|
Foreign currency denominated debt
|
$
|
(16.9
|
)
|
$
|
—
|
|
||||||||||||
|
|
Amount of Gain or (Loss)
Recognized in OCI
on Derivative
(Effective Portion)
|
|
Amount of Gain or (Loss)
Reclassified from
Accumulated OCI
into Income
|
|||||||||||||||
|
|
Nine Months Ended
September 30, |
|
Nine Months Ended
September 30, |
|||||||||||||||
|
|
Location of Gain or
(Loss) Reclassified from
Accumulated OCI
into Income
|
|||||||||||||||||
|
2017
|
2016
|
2017
|
2016
|
|||||||||||||||
|
Cash flow hedges
|
||||||||||||||||||
|
Foreign currency contracts
|
$
|
(39.7
|
)
|
$
|
(26.9
|
)
|
Cost of sales
|
$
|
7.8
|
|
$
|
11.3
|
|
|||||
|
Selling, general, and administrative expenses
|
$
|
(0.2
|
)
|
$
|
(0.4
|
)
|
||||||||||||
|
Net investment hedges
|
||||||||||||||||||
|
Foreign currency contracts
|
$
|
—
|
|
$
|
(4.1
|
)
|
|
|
|
|
||||||||
|
Foreign currency denominated debt
|
$
|
(32.5
|
)
|
$
|
—
|
|
||||||||||||
14
As of
September 30, 2017
, the Company had
€370.0 million
of outstanding long-term debt designated as a net investment hedge.
|
|
|
Amount of Gain or (Loss)
Recognized in Income on
Derivative
|
||||||||
|
|
|
Three Months Ended
September 30, |
||||||||
|
|
Location of Gain or (Loss)
Recognized in Income on
Derivative
|
|||||||||
|
Fair value hedges
|
2017
|
2016
|
||||||||
|
Interest rate swap agreements
|
Interest expense, net
|
$
|
(0.1
|
)
|
$
|
(2.3
|
)
|
|||
|
|
|
Amount of Gain or (Loss)
Recognized in Income on
Derivative
|
||||||||
|
|
|
Nine Months Ended
September 30, |
||||||||
|
|
Location of Gain or (Loss)
Recognized in Income on
Derivative
|
|||||||||
|
Fair value hedges
|
2017
|
2016
|
||||||||
|
Interest rate swap agreements
|
Interest expense, net
|
$
|
0.1
|
|
$
|
2.5
|
|
|||
The gains on the interest rate swap agreements are fully offset by the changes in the fair value of the fixed-rate debt being hedged.
|
|
|
Amount of Gain or (Loss)
Recognized in Income on
Derivative
|
||||||||
|
|
|
Three Months Ended
September 30, |
||||||||
|
|
Location of Gain or (Loss)
Recognized in Income on
Derivative
|
|||||||||
|
Derivatives not designated as hedging instruments
|
2017
|
2016
|
||||||||
|
Foreign currency contracts
|
Other expenses, net
|
$
|
(6.2
|
)
|
$
|
(2.7
|
)
|
|||
|
|
|
Amount of Gain or (Loss)
Recognized in Income on
Derivative
|
||||||||
|
|
|
Nine Months Ended
September 30, |
||||||||
|
|
Location of Gain or (Loss)
Recognized in Income on
Derivative
|
|||||||||
|
Derivatives not designated as hedging instruments
|
2017
|
2016
|
||||||||
|
Foreign currency contracts
|
Other expenses, net
|
$
|
(12.8
|
)
|
$
|
(18.5
|
)
|
|||
The Company expects that during the next twelve months it will reclassify to earnings a
$0.3 million
loss currently recorded in "
Accumulated Other Comprehensive Loss
."
8. STOCK-BASED COMPENSATION
Stock-based compensation expense related to awards issued under the Company's incentive compensation plans for the
three and nine months ended September 30, 2017
and
2016
was as follows (in millions):
|
|
Three Months Ended
September 30, |
Nine Months Ended
September 30, |
|||||||||||||
|
|
2017
|
2016
|
2017
|
2016
|
|||||||||||
|
Cost of sales
|
$
|
2.4
|
|
$
|
2.2
|
|
$
|
7.0
|
|
$
|
6.3
|
|
|||
|
Selling, general, and administrative expenses
|
10.3
|
|
9.5
|
|
30.5
|
|
28.6
|
|
|||||||
|
Research and development expenses
|
3.1
|
|
2.7
|
|
8.8
|
|
8.1
|
|
|||||||
|
Total stock-based compensation expense
|
$
|
15.8
|
|
$
|
14.4
|
|
$
|
46.3
|
|
$
|
43.0
|
|
|||
At
September 30, 2017
, the total remaining compensation cost related to nonvested stock options, restricted stock units, market-based restricted stock units, performance-based restricted stock units, and employee stock purchase plan ("ESPP")
15
subscription awards amounted to
$112.4 million
, which will be amortized on a straight-line basis over the weighted-average remaining requisite service period of
31 months
.
During the
nine months ended September 30, 2017
, the Company granted
1.0 million
stock options at a weighted-average exercise price of
$110.36
and
0.3 million
shares of restricted stock units at a weighted-average grant-date fair value of
$109.36
. The Company also granted
0.1 million
shares of market-based and performance-based restricted stock units at a weighted-average grant-date fair value of
$129.46
. In addition, the Company issued an additional
0.1 million
shares related to a previous year's grant of market-based restricted stock units since the payout percentage achieved at the end of the performance period was in excess of the targeted shares. The market-based restricted stock units vest based on a combination of certain service and market conditions. The actual number of shares issued will be determined based on the Company's total shareholder return relative to a selected industry peer group over a
three
-year performance period, and may range form
0%
to
175%
of the targeted number of shares granted. The performance-based restricted stock units vest based on the achievement of specified milestones.
Fair Value Disclosures
The fair value of the market-based restricted stock units was determined using a Monte Carlo simulation model, which uses multiple input variables to determine the probability of satisfying the market condition requirements. The weighted-average assumptions used to determine the fair value of the market-based restricted stock units granted during the
nine months ended September 30, 2017
and
2016
included a risk-free interest rate of
1.7%
and
1.0%
, respectively, and an expected volatility rate of
30.2%
and
30.0%
, respectively.
The following table includes the weighted-average grant-date fair values of stock options granted during the periods indicated and the related weighted-average assumptions used in the Black-Scholes option pricing model:
|
Option Awards
|
Three Months Ended
September 30, |
Nine Months Ended
September 30, |
|||||||||||||
|
|
2017
|
2016
|
2017
|
2016
|
|||||||||||
|
Average risk-free interest rate
|
1.8
|
%
|
1.0
|
%
|
1.8
|
%
|
1.1
|
%
|
|||||||
|
Expected dividend yield
|
None
|
|
None
|
|
None
|
|
None
|
|
|||||||
|
Expected volatility
|
33.2
|
%
|
33.2
|
%
|
33.0
|
%
|
33.1
|
%
|
|||||||
|
Expected term (years)
|
4.7
|
|
4.6
|
|
4.6
|
|
4.5
|
|
|||||||
|
Fair value, per option
|
$
|
36.26
|
|
$
|
31.23
|
|
$
|
33.74
|
|
$
|
31.02
|
|
|||
The following table includes the weighted-average grant-date fair values for ESPP subscriptions granted during the periods indicated and the related weighted-average assumptions used in the Black-Scholes option pricing model:
|
ESPP
|
Three Months Ended
September 30, |
Nine Months Ended
September 30, |
|||||||||||||
|
|
2017
|
2016
|
2017
|
2016
|
|||||||||||
|
Average risk-free interest rate
|
0.7
|
%
|
0.2
|
%
|
0.5
|
%
|
0.3
|
%
|
|||||||
|
Expected dividend yield
|
None
|
|
None
|
|
None
|
|
None
|
|
|||||||
|
Expected volatility
|
34.3
|
%
|
31.9
|
%
|
33.1
|
%
|
29.3
|
%
|
|||||||
|
Expected term (years)
|
0.7
|
|
0.8
|
|
0.6
|
|
0.6
|
|
|||||||
|
Fair value, per share
|
$
|
29.15
|
|
$
|
31.13
|
|
$
|
25.69
|
|
$
|
21.97
|
|
|||
9. COMMITMENTS AND CONTINGENCIES
On October 30, 2015, Boston Scientific Scimed, Inc., a subsidiary of Boston Scientific Corporation ("Boston Scientific"), filed a lawsuit in the district court in Düsseldorf, Germany against Edwards Lifesciences and its German subsidiary, Edwards Lifesciences Services GmbH, alleging that Edwards Lifesciences'
SAPIEN 3
heart valve infringes certain claims of a Boston Scientific German national patent arising from EP 2 749 254 B1 (the "'254 patent") related to paravalvular sealing technology. On February 26, 2016, Boston Scientific added the German national patent arising from EP 2 926 766 (the "'766 patent") to the infringement allegations. On April 8, 2016, Boston Scientific filed a similar patent infringement action in district court in Paris, France relating to these patents. The complaints seek unspecified money damages and injunctive relief. The Company intends to defend itself vigorously in these matters. The French suit has been stayed pending the outcome of validity proceedings on the '766 and '254 patents. On March 9, 2017, the German district court ruled that the
SAPIEN 3
heart
16
valve infringes the '254 and '766 patents, and that Boston Scientific is entitled to enforce an injunction against
SAPIEN 3
sales in Germany upon payment of a
€90.0
million bond for each patent, but has not yet elected to do so. Edwards Lifesciences has appealed this infringement decision. In addition, Edwards Lifesciences filed oppositions at the European Patent Office ("EPO") challenging the validity of the '254 and '766 patents. On October 19, 2017, the EPO required Boston Scientific to amend the '254 patent.
On November 2, 2015, Edwards Lifesciences LLC, a U.S. subsidiary of Edwards Lifesciences, filed a lawsuit against Sadra Medical, Inc. and Boston Scientific Scimed, Inc.,
two
subsidiaries of Boston Scientific, in the United Kingdom in the High Court of Justice, Chancery Division, Patents Court to declare invalid and revoke the U.K. national patent corresponding to the '254 patent. Edwards Lifesciences later added Boston Scientific’s U.K. national patent corresponding to the '766 patent to this invalidity lawsuit. The Boston Scientific subsidiaries filed counterclaims against Edwards Lifesciences and
three
of its European subsidiaries alleging that the
SAPIEN 3
heart valve infringes certain claims of the same patents and seeking unspecified monetary damages and injunctive relief. On March 3, 2017, the U.K. Patents Court ruled that Boston Scientific's '254 patent is invalid, and that its '766 patent is valid and infringed. The court also ruled that Boston Scientific is entitled to an injunction against
SAPIEN 3
sales in the United Kingdom, but stayed the injunction pending appeal. Both sides have appealed this decision and U.K. Patents Court Proceedings for damages are ongoing.
On June 16, 2017, Edwards Lifesciences filed a lawsuit against Boston Scientific Scimed, Inc. in Germany in the district court in Munich, seeking a court order that Edwards Lifesciences is a co-owner of the '254 patent based on rights it has acquired. On July 31, 2017, Edwards Lifesciences filed a similar lawsuit with regard to the '766 patent. Proceedings are ongoing.
On November 23, 2015, Edwards Lifesciences PVT, Inc., a U.S. subsidiary of Edwards Lifesciences, filed a lawsuit in the district court in Düsseldorf, Germany for patent infringement against Boston Scientific and a German subsidiary, Boston Scientific Medizintechnik GmbH, alleging that the Lotus heart valve infringes certain claims of Edwards Lifesciences' German national patents EP 1 441 672 B1 (the "'672 patent") and 2 255 753 B1 (the "'753 patent") related to prosthetic valve and delivery system technology. Edwards Lifesciences later added its German national patent EP 2 399 550 (the "'550 patent") to this suit. The complaint sought unspecified monetary damages and injunctive relief. On March 9, 2016, the German district court ruled that the Lotus heart valve infringes the '550 patent, but does not infringe the '672 patent. The court also ruled that Edwards Lifesciences is entitled to enforce an injunction against the sales of the Lotus valve in Germany upon the payment of a
€10.0
million bond, but has not yet elected to do so. Both sides have appealed this decision. The court did not rule on the '753 patent due to an opposition filed at the EPO by Boston Scientific. On March 28, 2017, the EPO rendered an initial decision to revoke the '753 patent. Edwards Lifesciences has appealed the EPO's initial decision.
O
n April 19, 2016, Boston Scientific filed a lawsuit against Edwards Lifesciences in the Federal District Court in the District of Delaware alleging that the
SAPIEN 3
heart valve infringes certain claims of Boston Scientific’s U.S. Patent 8,992,608 (the "'608 patent") related to paravalvular sealing technology and seeking unspecified monetary damages and injunctive relief. On June 9, 2016, Edwards Lifesciences LLC and Edwards Lifesciences PVT, Inc. filed counterclaims alleging that Boston Scientific’s Lotus heart valve infringes Edwards Lifesciences’ U.S. Patents 9,168,133; 9,339,383; and 7,510,575 related to prosthetic valve technology. Trial is scheduled for July 2018. On October 12, 2016, Edwards Lifesciences filed an Inter Partes Review ("IPR") request with the U.S. Patent and Trademark Office (the "USPTO") challenging the validity of Boston Scientific's '608 patent. On March 29, 2017, the USPTO decided to institute the IPR.
Also on April 19, 2016, Boston Scientific filed a lawsuit against Edwards Lifesciences in the Federal District Court in the Central District of California alleging that
five
of its transcatheter heart valve delivery systems and a valve crimper infringe certain claims of
eight
Boston Scientific U.S. patents. The complaints seek unspecified monetary damages and injunctive relief. Trial is scheduled for May 2018. The Company intends to defend itself vigorously in these matters and has filed IPRs challenging the validity of the Boston Scientific patents in the suit. The lawsuit has been stayed pending the outcome of these IPR proceedings. The USPTO has instituted
two
of the requested IPRs.
One
other IPR request is pending.
On October 23, 2016, Edwards Lifesciences PVT, Inc. and Edwards Lifesciences (Canada) Inc., a Canadian subsidiary of Edwards Lifesciences, filed a lawsuit against Boston Scientific and its Canadian subsidiary, Boston Scientific Ltd., as well as LivaNova PLC and LivaNova Canada Corp., its contract manufacturers, in the Federal Court in Toronto, Canada, alleging that Boston Scientific's manufacture of the Lotus valve through its contract manufacturers infringes
two
of Edwards Lifesciences' patents covering transcatheter heart valve technology. On February 17, 2017, Edwards added Neovasc, Inc. and Neovasc Medical Inc., additional contract manufacturers of Boston Scientific, to this lawsuit. On January 11, 2017, Edwards Lifesciences PVT, Inc. and Edwards Lifesciences SA(AG), a Swiss subsidiary of Edwards Lifesciences, filed a lawsuit against
17
Boston Scientific Ltd and Boston Scientific Group PLC,
two
Irish subsidiaries of Boston Scientific, in the High Court in Dublin, Ireland alleging that the Boston Scientific's manufacture of the Lotus and Lotus Edge valves infringes the '550 patent.
Because the ultimate outcome of the above matters involve judgments, estimates, and inherent uncertainties, and cannot be predicted with certainty, charges related to such matters could have a material adverse impact on Edwards Lifesciences' financial position, results of operations, and liquidity.
In addition, Edwards Lifesciences is or may be a party to, or may otherwise be responsible for, pending or threatened lawsuits related primarily to products and services currently or formerly manufactured or performed, as applicable, by Edwards Lifesciences (the "Other Lawsuits"). The Other Lawsuits raise difficult and complex factual and legal issues and are subject to many uncertainties, including, but not limited to, the facts and circumstances of each particular case or claim, the jurisdiction in which each suit is brought, and differences in applicable law. Management does not believe that any charge relating to the Other Lawsuits would have a material adverse effect on Edwards Lifesciences’ overall financial position, results of operations, or liquidity. However, the resolution of
one
or more of the Other Lawsuits in any reporting period, could have a material adverse impact on Edwards Lifesciences' net income or cash flows for that period. The Company is not able to estimate the amount or range of any loss for legal contingencies for which there is no reserve or additional loss for matters already reserved.
Edwards Lifesciences is subject to various environmental laws and regulations both within and outside of the United States. The operations of Edwards Lifesciences, like those of other medical device companies, involve the use of substances regulated under environmental laws, primarily in manufacturing and sterilization processes. While it is difficult to quantify the potential impact of continuing compliance with environmental protection laws, management believes that such compliance will not have a material impact on Edwards Lifesciences' financial position, results of operations, or liquidity.
10. STOCKHOLDERS' EQUITY
On July 13, 2017, the Company's board of directors approved the retirement of the Company's treasury stock. In August 2017, the Company retired
33.6 million
shares of treasury stock. Upon retirement, treasury stock decreased by
$2.7 billion
, with a corresponding reduction in common stock at par value, additional paid-in capital, and retained earnings of
$33.6 million
,
$175.5 million
and
$2.5 billion
, respectively. The shares were returned to the status of authorized but unissued.
11. ACCUMULATED OTHER COMPREHENSIVE LOSS
The following table is a summary of activity for each component of "
Accumulated Other Comprehensive Loss
" for the
nine months ended September 30, 2017
(in millions):
|
|
Foreign
Currency
Translation
Adjustments
|
Unrealized Gain (Loss) on Cash Flow Hedges
|
Unrealized Gain (Loss) on Available-for-sale Investments
|
Unrealized
Pension
Costs
|
Total
Accumulated
Other
Comprehensive
Loss
|
||||||||||||||
|
December 31, 2016
|
$
|
(197.6
|
)
|
$
|
16.7
|
|
$
|
0.1
|
|
$
|
(17.6
|
)
|
$
|
(198.4
|
)
|
||||
|
Other comprehensive gain (loss) before reclassifications
|
74.9
|
|
(39.7
|
)
|
(5.4
|
)
|
0.7
|
|
30.5
|
|
|||||||||
|
Amounts reclassified from accumulated other comprehensive loss
|
—
|
|
(7.6
|
)
|
1.9
|
|
—
|
|
(5.7
|
)
|
|||||||||
|
Deferred income tax benefit
|
12.2
|
|
18.1
|
|
0.7
|
|
(0.1
|
)
|
30.9
|
|
|||||||||
|
September 30, 2017
|
$
|
(110.5
|
)
|
$
|
(12.5
|
)
|
$
|
(2.7
|
)
|
$
|
(17.0
|
)
|
$
|
(142.7
|
)
|
||||
18
The following table provides information about amounts reclassified from "
Accumulated Other Comprehensive Loss
" (in millions):
|
|
Three Months Ended
September 30, |
Nine Months Ended
September 30, |
|
||||||||||||||
|
|
Affected Line on Consolidated Condensed
Statements of Operations
|
||||||||||||||||
|
Details about Accumulated Other
Comprehensive Loss Components
|
2017
|
2016
|
2017
|
2016
|
|||||||||||||
|
Gain (loss) on cash flow hedges
|
$
|
2.7
|
|
$
|
(3.4
|
)
|
$
|
7.6
|
|
$
|
10.9
|
|
Cost of sales
|
||||
|
(1.2
|
)
|
1.2
|
|
(3.0
|
)
|
(4.5
|
)
|
Provision for income taxes
|
|||||||||
|
$
|
1.5
|
|
$
|
(2.2
|
)
|
$
|
4.6
|
|
$
|
6.4
|
|
Net of tax
|
|||||
|
Gain (loss) on available-for-sale investments
|
$
|
(1.1
|
)
|
$
|
(0.2
|
)
|
$
|
(1.9
|
)
|
$
|
(0.8
|
)
|
Other expenses, net
|
||||
|
0.1
|
|
—
|
|
0.1
|
|
—
|
|
Provision for income taxes
|
|||||||||
|
$
|
(1.0
|
)
|
$
|
(0.2
|
)
|
$
|
(1.8
|
)
|
$
|
(0.8
|
)
|
Net of tax
|
|||||
12. EARNINGS PER SHARE
Basic earnings per share is computed by dividing net income by the weighted-average common shares outstanding during a period. Diluted earnings per share is computed based on the weighted-average common shares outstanding plus the effect of dilutive potential common shares outstanding during the period calculated using the treasury stock method. Dilutive potential common shares include employee equity share options, nonvested shares, and similar equity instruments granted by the Company. Potential common share equivalents have been excluded where their inclusion would be anti-dilutive.
The table below presents the computation of basic and diluted earnings per share (in millions, except for per share information):
|
|
Three Months Ended
September 30, |
Nine Months Ended
September 30, |
|||||||||||||
|
|
2017
|
2016
|
2017
|
2016
|
|||||||||||
|
Basic:
|
|
|
|
|
|
|
|
|
|||||||
|
Net income
|
$
|
170.1
|
|
$
|
141.4
|
|
$
|
586.4
|
|
$
|
411.0
|
|
|||
|
Weighted-average shares outstanding
|
211.3
|
|
213.2
|
|
211.0
|
|
212.8
|
|
|||||||
|
Basic earnings per share
|
$
|
0.81
|
|
$
|
0.66
|
|
$
|
2.78
|
|
$
|
1.93
|
|
|||
|
Diluted:
|
|
|
|
|
|
|
|
|
|||||||
|
Net income
|
$
|
170.1
|
|
$
|
141.4
|
|
$
|
586.4
|
|
$
|
411.0
|
|
|||
|
Weighted-average shares outstanding
|
211.3
|
|
213.2
|
|
211.0
|
|
212.8
|
|
|||||||
|
Dilutive effect of stock plans
|
4.9
|
|
4.9
|
|
5.1
|
|
4.9
|
|
|||||||
|
Dilutive weighted-average shares outstanding
|
216.2
|
|
218.1
|
|
216.1
|
|
217.7
|
|
|||||||
|
Diluted earnings per share
|
$
|
0.79
|
|
$
|
0.65
|
|
$
|
2.71
|
|
$
|
1.89
|
|
|||
Stock options, restricted stock units, and market-based restricted stock units to purchase
2.1 million
and
1.1 million
shares for the
three months ended September 30,
2017
and
2016
, respectively, and
1.8 million
and
0.8 million
shares for the
nine months ended September 30, 2017
and
2016
, respectively, were outstanding, but were not included in the computation of diluted earnings per share because the effect would have been anti-dilutive.
13. INCOME TAXES
The Company's effective income tax rates were
19.7%
and
23.7%
for the
three months ended September 30,
2017
and
2016
, respectively, and
17.5%
and
23.5%
for the
nine months ended September 30, 2017
and
2016
, respectively. The change in the effective rates is primarily a result of the benefit determined under the new accounting standard for employee share-based compensation (see Note 1), and fluctuations in the relative contribution of foreign operations and United States operations to worldwide pre-tax income. The adoption of the new accounting standard for the tax benefit of employee share-based compensation resulted in a decrease in the Company's effective rates of
3.5%
and
6.6%
for the
three and nine months ended September 30, 2017
, respectively.
19
The Company strives to resolve open matters with each tax authority at the examination level and could reach agreement with a tax authority at any time. While the Company has accrued for matters it believes are more likely than not to require settlement, the final outcome with a tax authority may result in a tax liability that is more or less than that reflected in the consolidated condensed financial statements. Furthermore, the Company may later decide to challenge any assessments, if made, and may exercise its right to appeal. The uncertain tax positions are reviewed quarterly and adjusted as events occur that affect potential liabilities for additional taxes, such as lapsing of applicable statutes of limitations, proposed assessments by tax authorities, negotiations between tax authorities, identification of new issues, and issuance of new legislation, regulations, or case law.
At
September 30, 2017
, all material state, local, and foreign income tax matters have been concluded for years through 2008. The Internal Revenue Service ("IRS") has substantially completed its fieldwork for the 2009 through 2013 tax years. However, the audits are currently in suspense pending a final determination with respect to a pending application for an Advanced Pricing Agreement ("APA") discussed below. The IRS began its examination of the 2014 tax year during the fourth quarter of 2016.
As of
September 30, 2017
and
December 31, 2016
, the liability for income taxes associated with uncertain tax positions was
$142.4 million
and
$245.5 million
, respectively. The Company estimates that these liabilities would be reduced by
$20.3 million
and
$44.9 million
, respectively, from offsetting tax benefits associated with the correlative effects of potential transfer pricing adjustments, state income taxes, and timing adjustments. The net amounts of
$122.1 million
and
$200.6 million
, respectively, if not required, would favorably affect the Company's effective tax rate. The significant decrease in the net amount during 2017 is a result of the Company's anticipated partial settlement of the APA discussed below.
The Company has been pursuing an APA covering certain transfer pricing matters between the Switzerland and United States governments for the years 2009 through 2013, with the possibility of a roll-forward of the results to subsequent years. During 2017, an agreement was reached with the IRS on several of the transactions covered by the APA, including a roll-forward of the results through 2020. The agreement is subject to finalization of a bilateral APA between the governments. The Company anticipates, however, that it will make tax payments related to these transactions within the next twelve months. Therefore, reclassifications were made from the long-term liability for uncertain tax positions to current taxes payable for the portion that relates to these transactions.
Resolution of other significant transaction flows, however, remain open as of September 30, 2017. Overall, transfer pricing matters continue to be significant to the Company's consolidated financial statements as the disputed amounts are material, and the final outcome is uncertain. The Company continues to believe its transfer pricing positions are supportable.
During 2014, the Company filed with the IRS a request for a pre-filing agreement associated with a tax return filing position on a portion of the litigation settlement payment received in May 2014. During the first quarter of 2015, the IRS accepted the Company's request into the pre-filing agreement program. The closing agreement for this matter was finalized during the fourth quarter of 2016. There remained a disputed issue and the Company was accepted into the Fast-Track Appeals process in July 2017. The Company met with the Fast-Track Appeals team in October 2017 and was unable to reach an agreement. The Company intends to revert to the regular Appeals process. The Company made an advance payment of tax in December 2015 to prevent the further accrual of interest on any potential deficiency.
14. SEGMENT INFORMATION
Edwards Lifesciences conducts operations worldwide and is managed in the following geographical regions: United States, Europe, Japan, and Rest of World. All regions sell products that are used to treat advanced cardiovascular disease.
The Company's geographic segments are reported based on the financial information provided to the Chief Operating Decision Maker (the Chief Executive Officer). The Company evaluates the performance of its geographic segments based on net sales and income before provision for income taxes ("pre-tax income"). The accounting policies of the segments are substantially the same as those described in Note 2 of the Company's consolidated financial statements included in its Annual Report on Form 10-K for the year ended
December 31, 2016
. Segment net sales and segment pre-tax income are based on internally derived standard foreign exchange rates, which may differ from year to year, and do not include inter-segment profits. Because of the interdependence of the reportable segments, the operating profit as presented may not be representative of the geographical distribution that would occur if the segments were not interdependent. Net sales by geographic area are based on the location of the customer.
Certain items are maintained at the corporate level and are not allocated to the segments. The non-allocated items include net interest expense, global marketing expenses, corporate research and development expenses, manufacturing variances,
20
corporate headquarters costs, special gains and charges, stock-based compensation, foreign currency hedging activities, certain litigation costs, and most of the Company's amortization expense. Although most of the Company's depreciation expense is included in segment pre-tax income, due to the Company's methodology for cost build-up, it is impractical to determine the amount of depreciation expense included in each segment, and, therefore, a portion is maintained at the corporate level. The Company neither discretely allocates assets to its operating segments, nor evaluates the operating segments using discrete asset information.
The table below presents information about Edwards Lifesciences' reportable segments (in millions):
|
|
Three Months Ended
September 30, |
Nine Months Ended
September 30, |
|||||||||||||
|
|
2017
|
2016
|
2017
|
2016
|
|||||||||||
|
Segment Net Sales
|
|
|
|
|
|
|
|
|
|||||||
|
United States
|
$
|
470.4
|
|
$
|
417.1
|
|
$
|
1,413.9
|
|
$
|
1,194.2
|
|
|||
|
Europe
|
167.8
|
|
171.2
|
|
614.3
|
|
556.3
|
|
|||||||
|
Japan
|
84.0
|
|
68.1
|
|
257.1
|
|
203.8
|
|
|||||||
|
Rest of World
|
87.1
|
|
72.4
|
|
261.4
|
|
220.9
|
|
|||||||
|
Total segment net sales
|
$
|
809.3
|
|
$
|
728.8
|
|
$
|
2,546.7
|
|
$
|
2,175.2
|
|
|||
|
Segment Pre-tax Income
|
|
|
|
|
|
|
|
|
|||||||
|
United States
|
$
|
303.2
|
|
$
|
274.2
|
|
$
|
921.4
|
|
$
|
776.0
|
|
|||
|
Europe
|
75.3
|
|
80.1
|
|
306.9
|
|
273.0
|
|
|||||||
|
Japan
|
46.4
|
|
33.4
|
|
145.2
|
|
101.5
|
|
|||||||
|
Rest of World
|
24.7
|
|
17.4
|
|
77.4
|
|
54.4
|
|
|||||||
|
Total segment pre-tax income
|
$
|
449.6
|
|
$
|
405.1
|
|
$
|
1,450.9
|
|
$
|
1,204.9
|
|
|||
The table below presents reconciliations of segment net sales to consolidated net sales and segment pre-tax income to consolidated pre-tax income (in millions):
|
|
Three Months Ended
September 30, |
Nine Months Ended
September 30, |
|||||||||||||
|
|
2017
|
2016
|
2017
|
2016
|
|||||||||||
|
Net Sales Reconciliation
|
|
|
|
|
|
|
|
|
|||||||
|
Segment net sales
|
$
|
809.3
|
|
$
|
728.8
|
|
$
|
2,546.7
|
|
$
|
2,175.2
|
|
|||
|
Foreign currency
|
12.2
|
|
10.6
|
|
0.1
|
|
20.8
|
|
|||||||
|
Consolidated net sales
|
$
|
821.5
|
|
$
|
739.4
|
|
$
|
2,546.8
|
|
$
|
2,196.0
|
|
|||
|
Pre-tax Income Reconciliation
|
|
|
|
|
|
|
|
|
|||||||
|
Segment pre-tax income
|
$
|
449.6
|
|
$
|
405.1
|
|
$
|
1,450.9
|
|
$
|
1,204.9
|
|
|||
|
Unallocated amounts:
|
|
|
|
|
|
|
|
|
|||||||
|
Corporate items
|
(217.3
|
)
|
(211.9
|
)
|
(660.6
|
)
|
(613.4
|
)
|
|||||||
|
Special charges (Note 3)
|
(10.2
|
)
|
—
|
|
(41.4
|
)
|
(34.5
|
)
|
|||||||
|
Intellectual property litigation expenses
|
(13.7
|
)
|
(6.5
|
)
|
(31.6
|
)
|
(27.8
|
)
|
|||||||
|
Interest expense, net
|
(0.1
|
)
|
(2.1
|
)
|
(3.9
|
)
|
(6.9
|
)
|
|||||||
|
Foreign currency
|
3.5
|
|
0.6
|
|
(2.4
|
)
|
15.2
|
|
|||||||
|
Consolidated pre-tax income
|
$
|
211.8
|
|
$
|
185.2
|
|
$
|
711.0
|
|
$
|
537.5
|
|
|||
21
Enterprise-wide Information
Enterprise-wide information is based on actual foreign exchange rates used in the Company's consolidated condensed financial statements.
|
|
Three Months Ended
September 30, |
Nine Months Ended
September 30, |
|||||||||||||
|
|
2017
|
2016
|
2017
|
2016
|
|||||||||||
|
|
(in millions)
|
||||||||||||||
|
Net Sales by Geographic Area
|
|
|
|
|
|
|
|
|
|||||||
|
United States
|
$
|
470.4
|
|
$
|
417.1
|
|
$
|
1,413.9
|
|
$
|
1,194.2
|
|
|||
|
Europe
|
182.3
|
|
172.3
|
|
627.0
|
|
564.4
|
|
|||||||
|
Japan
|
83.2
|
|
79.8
|
|
253.0
|
|
226.3
|
|
|||||||
|
Rest of World
|
85.6
|
|
70.2
|
|
252.9
|
|
211.1
|
|
|||||||
|
$
|
821.5
|
|
$
|
739.4
|
|
$
|
2,546.8
|
|
$
|
2,196.0
|
|
||||
|
Net Sales by Major Product and Service Area
|
|
|
|
|
|
|
|
|
|||||||
|
Transcatheter Heart Valve Therapy
|
$
|
481.2
|
|
$
|
410.1
|
|
$
|
1,507.9
|
|
$
|
1,196.5
|
|
|||
|
Surgical Heart Valve Therapy
|
195.6
|
|
190.9
|
|
602.2
|
|
585.5
|
|
|||||||
|
Critical Care
|
144.7
|
|
138.4
|
|
436.7
|
|
414.0
|
|
|||||||
|
$
|
821.5
|
|
$
|
739.4
|
|
$
|
2,546.8
|
|
$
|
2,196.0
|
|
||||
|
|
September 30, 2017
|
December 31, 2016
|
|||||
|
|
(in millions)
|
||||||
|
Long-lived Tangible Assets by Geographic Area
|
|
|
|
|
|||
|
United States
|
$
|
595.9
|
|
$
|
555.5
|
|
|
|
Europe
|
29.7
|
|
27.9
|
|
|||
|
Japan
|
7.2
|
|
8.0
|
|
|||
|
Rest of World
|
122.9
|
|
108.6
|
|
|||
|
$
|
755.7
|
|
$
|
700.0
|
|
||
22
This report contains forward-looking statements within the meaning of Section 27A of the Securities Act of 1933 and Section 21E of the Securities Exchange Act of 1934. We intend the forward-looking statements contained in this report to be covered by the safe harbor provisions of such Acts. All statements other than statements of historical fact in this report or referred to or incorporated by reference into this report are "forward-looking statements" for purposes of these sections. These statements include, among other things, any predictions of earnings, revenues, expenses or other financial items, plans or expectations with respect to development activities, clinical trials or regulatory approvals, any statements of plans, strategies and objectives of management for future operations, any statements concerning our future operations, financial conditions and prospects, and any statements of assumptions underlying any of the foregoing. These statements can sometimes be identified by the use of the forward-looking words such as "may," "believe," "will," "expect," "project," "estimate," "should," "anticipate," "plan," "goal," "continue," "seek," "pro forma," "forecast," "intend," "guidance," "optimistic," "aspire," "confident," other forms of these words or similar words or expressions or the negative thereof. Investors are cautioned not to unduly rely on such forward-looking statements. These forward-looking statements are subject to substantial risks and uncertainties that could cause our results or future business, financial condition, results of operations or performance to differ materially from our historical results or experiences or those expressed or implied in any forward-looking statements contained in this report. Investors should carefully review the information contained in, or incorporated by reference into, our annual report on Form 10-K for the year ended
December 31, 2016
and subsequent reports on Forms 10-Q and 8-K for a description of certain of these risks and uncertainties. These forward-looking statements speak only as of the date on which they are made and we do not undertake any obligation to update any forward-looking statement to reflect events or circumstances after the date of the statement. If we do update or correct one or more of these statements, investors and others should not conclude that we will make additional updates or corrections.
Overview
We are the global leader in patient-focused medical innovations for structural heart disease and critical care monitoring. Driven by a passion to help patients, we partner with the world’s leading clinicians and researchers and aggressively invest in research and development to transform care for structural heart disease and critically ill patients. We conduct operations worldwide and are managed in the following geographical regions: United States, Europe, Japan, and Rest of World. Our products are categorized into the following main areas: Transcatheter Heart Valve Therapy ("THVT"), Surgical Heart Valve Therapy ("SHVT"), and Critical Care.
Financial Highlights
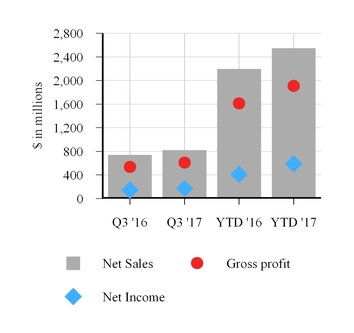
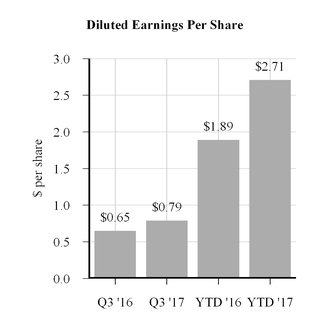
Our sales growth was led by our THVT products, primarily increased sales of the
Edwards SAPIEN 3
transcatheter heart valve in the United States, Japan, and Europe. In the first quarter of 2017, customers in Germany elected to purchase additional inventory of
SAPIEN 3
in anticipation of a potential supply interruption resulting from recent intellectual property litigation in that country. In the second and third quarters, customers consumed part, but not all, of this inventory. Our gross profit in 2017 was positively impacted by an improved product mix, led by THVT products. The increase in our net income was primarily
23
driven by our increased sales, partially offset by an impairment charge in the second quarter of 2017 related to certain long-term assets.
Healthcare Environment, Opportunities, and Challenges
The medical technology industry is highly competitive and continues to evolve. Our success is measured both by the development of innovative products and the value we bring to our stakeholders. We are committed to developing new technologies and providing innovative patient care, and we are committed to defending our intellectual property in support of those developments. In the first
nine
months of
2017
, we invested
15.9%
of our net sales in research and development.
New Accounting Standards
For information on new accounting standards, see Note 1 to the "
Consolidated Condensed Financial Statements.
"
Results of Operations
Net Sales Trends
(dollars in millions)
|
|
Three Months Ended
September 30, |
Nine Months Ended
September 30, |
|||||||||||||||||||||||||||
|
|
Percent Change
|
Percent Change
|
|||||||||||||||||||||||||||
|
|
2017
|
2016
|
Change
|
2017
|
2016
|
Change
|
|||||||||||||||||||||||
|
United States
|
$
|
470.4
|
|
$
|
417.1
|
|
$
|
53.3
|
|
12.8
|
%
|
$
|
1,413.9
|
|
$
|
1,194.2
|
|
$
|
219.7
|
|
18.4
|
%
|
|||||||
|
International
|
351.1
|
|
322.3
|
|
28.8
|
|
8.9
|
%
|
1,132.9
|
|
1,001.8
|
|
131.1
|
|
13.1
|
%
|
|||||||||||||
|
Total net sales
|
$
|
821.5
|
|
$
|
739.4
|
|
$
|
82.1
|
|
11.1
|
%
|
$
|
2,546.8
|
|
$
|
2,196.0
|
|
$
|
350.8
|
|
16.0
|
%
|
|||||||
International net sales include the impact of foreign currency exchange rate fluctuations. The impact of foreign currency exchange rate fluctuations on net sales is not necessarily indicative of the impact on net income due to the corresponding effect of foreign currency exchange rate fluctuations on international manufacturing and operating costs, and our hedging activities. For more information, see Item 3, "
Quantitative and Qualitative Disclosures About Market Risk
."
Net Sales by Product Group
(dollars in millions)
|
|
Three Months Ended
September 30, |
Nine Months Ended
September 30, |
|||||||||||||||||||||||||||
|
|
Percent Change
|
Percent Change
|
|||||||||||||||||||||||||||
|
|
2017
|
2016
|
Change
|
2017
|
2016
|
Change
|
|||||||||||||||||||||||
|
Transcatheter Heart Valve Therapy
|
$
|
481.2
|
|
$
|
410.1
|
|
$
|
71.1
|
|
17.3
|
%
|
$
|
1,507.9
|
|
$
|
1,196.5
|
|
$
|
311.4
|
|
26.0
|
%
|
|||||||
|
Surgical Heart Valve Therapy
|
195.6
|
|
190.9
|
|
4.7
|
|
2.4
|
%
|
602.2
|
|
585.5
|
|
16.7
|
|
2.9
|
%
|
|||||||||||||
|
Critical Care
|
144.7
|
|
138.4
|
|
6.3
|
|
4.5
|
%
|
436.7
|
|
414.0
|
|
22.7
|
|
5.5
|
%
|
|||||||||||||
|
Total net sales
|
$
|
821.5
|
|
$
|
739.4
|
|
$
|
82.1
|
|
11.1
|
%
|
$
|
2,546.8
|
|
$
|
2,196.0
|
|
$
|
350.8
|
|
16.0
|
%
|
|||||||
24
Transcatheter Heart Valve Therapy
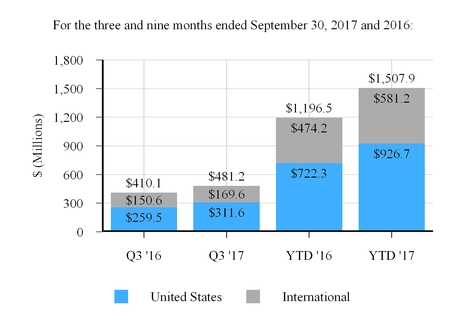
The increase in net sales of THVT products in the United States was due primarily to:
|
•
|
the
Edwards SAPIEN 3
valve, driven by strong therapy adoption;
|
The increase in international net sales of THVT products was due to:
|
•
|
the
Edwards SAPIEN 3
valve, primarily increased sales in (1) Japan, driven by its launch in March 2016, and (2) Europe, notably in Germany as customers elected to purchase additional inventory during the first quarter of 2017 in anticipation of a potential supply interruption resulting from recent intellectual property litigation in that country. In the second and third quarters, customers consumed part, but not all, of this inventory;
|
partially offset by:
|
•
|
lower sales of the
Edwards SAPIEN XT
valve in Japan as customers converted to
Edwards SAPIEN 3
.
|
In June 2017, we received United States Food and Drug Administration ("FDA") approval for aortic and mitral valve-in-valve procedures using the
Edwards SAPIEN 3
transcatheter heart valve for patients at high risk for a subsequent open-heart surgery to replace their bioprosthetic valve.
25
Surgical Heart Valve Therapy
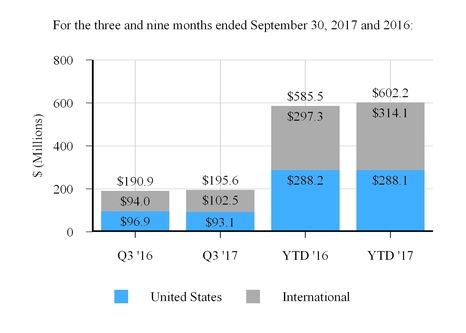
The increase in net sales of SHVT was driven by:
|
•
|
surgical aortic tissue valves in Europe, Rest of World, and the United States, primarily increased sales of the
EDWARDS INTUITY Elite Valve System
and growth in our core products, partially offset by the continuing shift from our surgical aortic tissue valves to transcatheter aortic valves; and
|
|
•
|
mitral tissue valves, which increased in the year-to-date period, due to increased sales in Rest of World, primarily China. In the quarter-to-date period, mitral tissue valves decreased, primarily in the United States. Sales were higher in the three months ended September 30, 2016 due to the recovery from the supply interruption we experienced in mid-2016.
|
In July 2017, we received FDA approval for our
INSPIRIS RESILIA
aortic valve, the first in a new class of resilient heart valves.
26
Critical Care
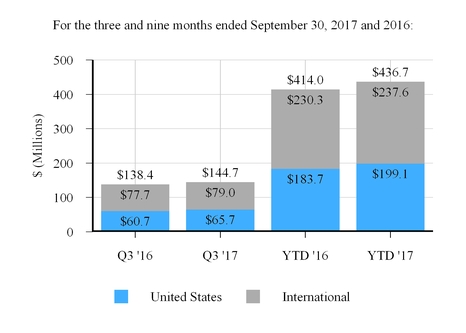
The increase in net sales of Critical Care products was driven by enhanced surgical recovery products and core hemodynamic products, primarily in the United States and Rest of World.
In April 2017, we received FDA clearance for our
HemoSphere
advanced monitoring platform. This technology provides clinicians with clarity on a patient’s hemodynamics, or the factors that manage blood flow, to help them make proactive, timely clinical decisions.
Gross Profit
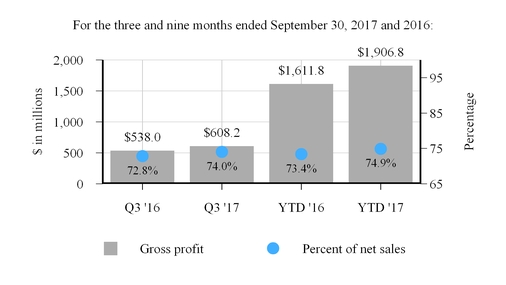
The increase in gross profit as a percentage of net sales for the
three and nine months ended September 30, 2017
was driven primarily by a 0.9 percentage point and 1.3 percentage point increase, respectively, in the United States, and a 0.5 percentage point and 0.4 percentage point increase, respectively, in international markets due to an improved product mix, driven by THVT products. In addition, during the three months ended September 30, 2017, gross profit as a percentage of net sales increased 0.5 percentage points due to foreign currency exchange rate fluctuations, including the settlement of foreign currency hedging contracts, offset by expenses associated with flooding from Hurricane Maria in Puerto Rico and the planned closure of our manufacturing plant in Switzerland.
27
Selling, General, and Administrative ("SG&A") Expenses
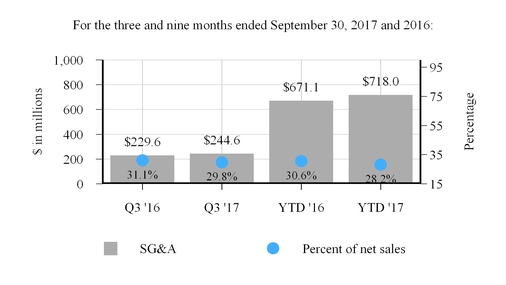
The increase in SG&A expenses for the
three and nine months ended September 30, 2017
was due primarily to higher sales and marketing expenses in the United States and Europe, mainly to support the THVT program, and higher personnel-related costs. The decrease in SG&A expenses as a percentage of net sales for the
three and nine months ended September 30, 2017
was due primarily to higher THVT sales in the United States and Japan.
Research and Development ("R&D") Expenses
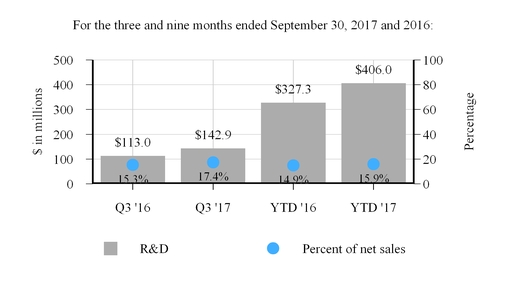
The increase in R&D expenses for the
three and nine months ended September 30, 2017
was due primarily to mitral, aortic, and tricuspid THVT product development efforts, including development expenses associated with the
Cardioband
Reconstruction System, and several small purchases during the first quarter of 2017 of transcatheter mitral valve repair technologies.
Change in Fair Value of Contingent Consideration Liabilities, net
The change in fair value of contingent consideration liabilities resulted in a gain of
$16.7 million
and
$12.5 million
for the
three and nine months ended September 30, 2017
, respectively, and a loss of
$0.1 million
and
$1.1 million
for the
three and nine months ended September 30, 2016
, respectively. The contingent consideration liability related to one of our previous business acquisitions was reduced by $19.9 million during the
three months ended September 30,
2017
due to delays in product development which reduced the probability of milestone achievement. For further information, see Note 6 to the "
Consolidated Condensed Financial Statements
."
28
Special Charges
In September 2017, we recorded a $10.2 million charge related primarily to severance expenses (impacting 232 employees) and other costs associated with the planned closure of our manufacturing plant in Switzerland. As of
September 30, 2017
, our remaining severance obligations of $9.6 million are expected to be substantially paid by September 30, 2018.
In June 2017, we recorded a $31.2 million charge related to the other-than-temporary impairment of one of our cost method investments and an associated long-term asset related to our option to acquire this investee. We concluded that the impairment of these assets was other-than-temporary based upon a recent review of the investee's clinical data and trial results, which did not support continuation of the product development effort, and the financial condition and near-term prospects of the investee.
In May 2016, we entered into two separate agreements to acquire technologies for use in our THVT programs. In connection with these agreements, we recorded an IPR&D charge totaling $34.5 million. The acquired technologies are in the early stages of development and have no alternative uses. Additional design developments, bench testing, pre-clinical studies, and human clinical studies must be successfully completed prior to selling any product using these technologies.
Other Expenses, net
(in millions)
|
|
Three Months Ended
September 30, |
Nine Months Ended
September 30, |
|||||||||||||
|
|
2017
|
2016
|
2017
|
2016
|
|||||||||||
|
Foreign exchange losses, net
|
$
|
0.8
|
|
$
|
0.7
|
|
$
|
4.8
|
|
$
|
1.1
|
|
|||
|
Loss (gain) on investments
|
0.9
|
|
0.9
|
|
1.8
|
|
(0.5
|
)
|
|||||||
|
Charitable foundation contribution
|
—
|
|
—
|
|
—
|
|
5.0
|
|
|||||||
|
Other
|
(0.1
|
)
|
(0.1
|
)
|
0.8
|
|
—
|
|
|||||||
|
Other expenses, net
|
$
|
1.6
|
|
$
|
1.5
|
|
$
|
7.4
|
|
$
|
5.6
|
|
|||
The net foreign exchange losses relate primarily to the foreign currency fluctuations in our global trade and intercompany receivable and payable balances, offset by the gains and losses on derivative instruments intended as an economic hedge of those exposures.
The loss (gain) on investments primarily represents our net share of gains and losses in investments accounted for under the equity method and realized gains and losses on our available-for-sale money market and cost method investments.
In March 2016, we contributed $5.0 million to the Edwards Lifesciences Foundation, a related-party not-for-profit organization intended to provide philanthropic support to health- and community-focused charitable organizations. The
contribution was irrevocable and was recorded as an expense at the time of payment.
Provision for Income Taxes
The provision for income taxes consists of provisions for federal, state, and foreign income taxes. We operate in an international environment with significant operations in various locations outside the United States, which have statutory tax rates lower than the United States tax rate. Accordingly, the consolidated income tax rate is a composite rate reflecting the earnings in the various locations and the applicable rates.
Our effective income tax rate was
19.7%
and
23.7%
for the
three months ended September 30,
2017
and
2016
, respectively, and
17.5%
and
23.5%
for the
nine months ended September 30, 2017
and
2016
, respectively. The change in the effective rates is primarily a result of the benefit determined under the new accounting standard for employee share-based compensation, and fluctuations in the relative contribution of foreign operations and United States operations to worldwide pre-tax income. The adoption of the new accounting standard for employee share-based compensation resulted in a decrease in our effective tax rates of
3.5%
and
6.6%
for the
three and nine months ended September 30, 2017
, respectively.
We strive to resolve open matters with each tax authority at the examination level and could reach agreement with a tax authority at any time. While we have accrued for matters we believe are more likely than not to require settlement, the final outcome with a tax authority may result in a tax liability that is more or less than that reflected in the consolidated condensed financial statements. Furthermore, we may later decide to challenge any assessments, if made, and may exercise our right to
29
appeal. The uncertain tax positions are reviewed quarterly and adjusted as events occur that affect potential liabilities for additional taxes, such as lapsing of applicable statutes of limitations, proposed assessments by tax authorities, negotiations between tax authorities, identification of new issues, and issuance of new legislation, regulations, or case law. Management believes that adequate amounts of tax and related penalty and interest have been provided in income tax expense for any adjustments that may result from our uncertain tax positions. For further information, see Note 13 to the "
Consolidated Condensed Financial Statements
."
We have been pursuing an Advance Pricing Agreement ("APA") covering certain transfer pricing matters between the Switzerland and United States governments for the years 2009 through 2013, with the possibility of a roll-forward of the results to subsequent years. During 2017, an agreement was reached with the Internal Revenue Service ("IRS") on several of the transactions covered by the APA, including a roll-forward of the results through 2020. The agreement is subject to finalization of a bilateral APA between the governments. We anticipate, however, that we will make tax payments related to these transactions within the next twelve months. Therefore, reclassifications were made from the long-term liability for uncertain tax positions to current taxes payable for the portion that relates to these transactions.
Resolution of other significant transaction flows, however, remain open as of September 30, 2017. Overall, transfer pricing matters continue to be significant to our consolidated financial statements as the disputed amounts are material, and the final outcome is uncertain. We continue to believe that our transfer pricing positions are supportable.
During 2014, we filed with the IRS a request for a pre-filing agreement associated with a tax return filing position on a portion of the litigation settlement payment received from Medtronic in May 2014. During the first quarter of 2015, the IRS accepted the pre-filing agreement into the pre-filing agreement program. The closing agreement for this matter was finalized during the fourth quarter of 2016. There remained a disputed issue and we were accepted into the Fast-Track Appeals process in July 2017. We met with the Fast-Track Appeals team in October 2017 and were unable to reach an agreement. We intend to revert to the regular Appeals process. We made an advance payment of tax in December 2015 to prevent the further accrual of interest on any potential deficiency.
Liquidity and Capital Resources
Our sources of cash liquidity include cash and cash equivalents, short-term investments, amounts available under credit facilities, and cash from operations. We believe that these sources are sufficient to fund the current requirements of working capital, capital expenditures, and other financial commitments for the next twelve months. However, we periodically consider various financing alternatives and may, from time to time, seek to take advantage of favorable interest rate environments or other market conditions.
As of
September 30, 2017
, cash and cash equivalents and short-term investments held in the United States and outside the United States were
$242.2 million
and
$1.2 billion
, respectively. We believe that cash held in the United States, in addition to amounts available under credit facilities and cash from operations, are sufficient to fund our United States operating requirements for the next twelve months. Cash and cash equivalents and short-term investments held outside the United States, the majority of which relates to undistributed earnings of certain of our foreign subsidiaries, which are considered by us to be indefinitely reinvested, have historically been used to fund international operations and acquire businesses and assets outside of the United States. We consider making short-term loans of cash held outside the United States to the United States from time to time based on facts and circumstances. The permanent repatriations of cash and cash equivalents and short-term investments held outside the United States are subject to restrictions in certain jurisdictions, and may be subject to withholding and other taxes. The potential tax liability related to any repatriation would be dependent on the facts and circumstances that exist at the time such repatriation is made and the complexities of the tax laws of the United States and the respective foreign jurisdictions.
On November 26, 2016, we entered into an agreement and plan of merger to acquire Valtech Cardio Ltd. ("Valtech") for approximately
$340.0 million
, subject to certain adjustments, in stock and cash to be paid at closing, with the potential for up to
$350.0 million
in additional pre-specified milestone-driven payments over the next 10 years. Our acquisition of Valtech closed on January 23, 2017, and we issued an aggregate of approximately
2.8 million
shares of our common stock, and paid approximately
$86.2 million
in cash to holders of Valtech securities. Prior to the close of the transaction, Valtech spun off its early-stage transseptal mitral valve replacement technology program. We have an option to acquire that program and its associated intellectual property for approximately
$200.0 million
, subject to certain adjustments, plus an additional
$50.0 million
if a certain European regulatory approval is obtained within 10 years of the acquisition closing date. For further information, see Note 4 to the "
Consolidated Condensed Financial Statements.
"
We have a Five-Year Credit Agreement ("Credit Agreement"), dated as of July 18, 2014, which provides up to an aggregate of $750.0 million in borrowings in multiple currencies. We may increase the amount available under the Credit Agreement, subject to agreement of the lenders, by up to an additional $250.0 million in the aggregate. As of
September 30, 2017
,
30
borrowings of
$435.3 million
were outstanding under the Credit Agreement, and have been classified as long-term obligations in accordance with the terms of the Credit Agreement. In October 2013, we issued $600.0 million of 2.875% fixed-rate unsecured senior notes due October 15, 2018. We expect that we will be able to pay the principal and any accrued interest on the senior notes by one or a combination of the following: refinancing such indebtedness, using available cash resources, or using amounts available under our Credit Agreement. As of
September 30, 2017
, the total carrying value of our long-term debt was $
1.0 billion
.
From time to time, we repurchase shares of our common stock under share repurchase programs authorized by the Board of Directors. We consider several factors in determining when to execute share repurchases, including, among other things, expected dilution from stock plans, cash capacity, and the market price of our common stock. During
2017
, we repurchased a total of
5.3 million
shares at an aggregate cost of $
501.0 million
, and as of
September 30, 2017
, had remaining authority to purchase $
530.1 million
of our common stock. In August 2017, the Company retired 33.6 million shares of treasury stock. For further information, see Note 10 to the "
Consolidated Condensed Financial Statements.
"
At
September 30, 2017
, there had been no material changes in our significant contractual obligations and commercial commitments as disclosed in our Annual Report on Form 10-K for the year ended
December 31, 2016
.
Consolidated Cash Flows - For the
nine months ended September 30, 2017
and
2016
:
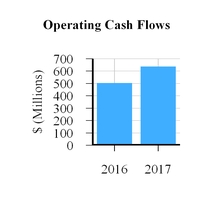
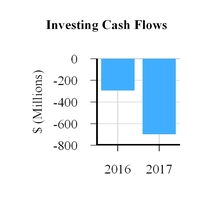
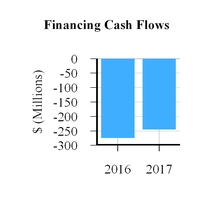
Net cash flows provided by
operating activities
of $
636.8 million
for the
nine months ended September 30, 2017
increased
$
133.5 million
over the same period last year due primarily to improved operating performance, partially offset by higher working capital needs associated with growth in the business and the timing of tax payments.
Net cash used in
investing activities
of $
696.5 million
for the
nine months ended September 30, 2017
consisted primarily of net
purchases of
investments of $
488.4 million
, an
$81.9 million
net cash payment associated with the acquisition of Valtech, and capital expenditures of $
116.2 million
.
Net cash used in investing activities of $
291.9 million
for the
nine months ended September 30, 2016
consisted primarily of net
purchases of
investments of $
138.4 million
and capital expenditures of $
112.9 million
.
Net cash used in
financing activities
of $
244.2 million
for the
nine months ended September 30, 2017
consisted primarily of purchases of treasury stock of
$512.0 million
, partially offset by net
proceeds from
debt of
$176.5 million
and proceeds from stock plans of $
91.3 million
.
Net cash used in financing activities of $
273.6 million
for the
nine months ended September 30, 2016
consisted primarily of purchases of treasury stock of $
415.9 million
, including amounts paid under accelerated repurchase agreements, partially offset by proceeds from stock plans of $
82.7 million
.
Critical Accounting Policies and Estimates
The consolidated condensed financial statements have been prepared in accordance with accounting principles generally accepted in the United States which require us to make estimates and assumptions that affect the reported amounts of assets and liabilities at the date of the consolidated condensed financial statements and revenues and expenses during the periods reported. Actual results could differ from those estimates. Information with respect to our critical accounting policies and estimates which we believe could have the most significant effect on our reported results and require subjective or complex judgments by management is contained on pages 39-42 in Item 7, "
Management's Discussion and Analysis of Financial Condition and
31
Results of Operations,
" of our Annual Report on Form 10-K for the year ended
December 31, 2016
. There have been no significant changes from the information discussed therein.
Interest Rate Risk, Foreign Currency Risk, Credit Risk, and Concentrations of Risk
For a complete discussion of our exposure to interest rate risk, foreign currency risk, credit risk, and concentrations of risk, refer to Item 7A "
Quantitative and Qualitative Disclosures About Market Risk
" on pages 42-43 of our Annual Report on Form 10-K for the year ended
December 31, 2016
. There have been no significant changes from the information discussed therein.
Investment Risk
We are exposed to investment risks related to changes in the underlying financial condition and credit capacity of certain of our investments. As of
September 30, 2017
, we had
$1.3 billion
of investments in fixed-rate debt securities of various companies, of which
$551.1 million
were long-term. In addition, we had $
16.4 million
of investments in equity instruments of public and private companies. Should these companies experience a decline in financial condition or credit capacity, or fail to meet certain development milestones, a decline in the investments' value may occur, resulting in unrealized or realized losses.
Evaluation of Disclosure Controls and Procedures.
Our management, including the Chief Executive Officer and the Chief Financial Officer, performed an evaluation of the effectiveness of the design and operation of our disclosure controls and procedures (as defined in Rules 13a-15(e) and 15d-15(e) under the Securities Exchange Act of 1934, as amended) as of
September 30, 2017
. Based on their evaluation, the Chief Executive Officer and Chief Financial Officer have concluded as of
September 30, 2017
that our disclosure controls and procedures are effective in providing reasonable assurance that the information we are required to disclose in the reports we file or submit under the Securities Exchange Act of 1934, as amended, is recorded, processed, summarized, and reported within the time periods specified in the Securities and Exchange Commission's rules and forms, and that such information is accumulated and communicated to our management, including the Chief Executive Officer and Chief Financial Officer, as appropriate, to allow timely decisions regarding required disclosure. There have been no changes in our internal controls over financial reporting during the quarter ended
September 30, 2017
that have materially affected, or are reasonably likely to materially affect, our internal control over financial reporting.
32
Please see Note 9 to the "
Consolidated Condensed Financial Statements
" of this Quarterly Report on Form 10-Q, which is incorporated by reference.
There have been no material changes to the risk factors under Part I, Item 1A "
Risk Factors
" in our Annual Report on Form 10-K for the year ended
December 31, 2016
.
Issuer Purchases of Equity Securities
|
Period
|
Total Number
of Shares
(or Units)
Purchased (a)
|
Average
Price Paid
per Share
(or Unit)
|
Total Number of
Shares (or Units)
Purchased as Part of Publicly Announced Plans or Programs
|
Maximum Number
(or Approximate
Dollar Value) of
Shares that
May Yet Be
Purchased
Under the Plans
or Programs
(in millions) (b)
|
|||||||||||||
|
July 1, 2017 through July 31, 2017
|
4,522
|
|
$
|
117.93
|
|
—
|
|
$
|
530.1
|
|
|||||||
|
August 1, 2017 through August 31, 2017
|
194
|
|
116.45
|
|
—
|
|
530.1
|
|
|||||||||
|
September 1, 2017 through September 30, 2017
|
2,268
|
|
114.02
|
|
—
|
|
530.1
|
|
|||||||||
|
Total
|
6,984
|
|
116.62
|
|
—
|
|
|||||||||||
|
(a)
|
The difference between the total number of shares (or units) purchased and the total number of shares (or units) purchased as part of publicly announced plans or programs is due to shares withheld by us to satisfy tax withholding obligations in connection with the vesting of restricted stock units issued to employees.
|
|
(b)
|
On November 10, 2016, the Board of Directors approved a stock repurchase program authorizing us to purchase on the open market, including pursuant to a Rule 10b5-1 plan and in privately negotiated transactions, up to $1.0 billion of our common stock.
|
The exhibits listed in the Exhibit Index (following the signature page of this report) are filed, furnished, or incorporated by reference as part of this report on Form 10-Q.
33
SIGNATURE
Pursuant to the requirements of the Securities Exchange Act of 1934, the registrant has duly caused this report to be signed on its behalf by the undersigned thereunto duly authorized.
|
|
EDWARDS LIFESCIENCES CORPORATION
|
||
|
|
(Registrant)
|
||
|
Date:
|
October 27, 2017
|
By:
|
/s/ SCOTT B. ULLEM
|
|
Scott B. Ullem
Chief Financial Officer
(Principal Financial Officer)
|
|||
|
Date:
|
October 27, 2017
|
By:
|
/s/ ROBERT W.A. SELLERS
|
|
Robert W.A. Sellers
Corporate Controller
(Principal Accounting Officer)
|
|||
34
EXHIBITS FILED WITH SECURITIES AND EXCHANGE COMMISSION
|
Exhibit No.
|
Description
|
|||
|
31.1
|
|
|||
|
31.2
|
|
|||
|
32
|
|
|||
|
101
|
|
The following financial statements from Edwards Lifesciences' Quarterly Report on Form 10-Q for the quarter ended September 30, 2017, formatted in XBRL (eXtensible Business Reporting Language): (i) the Consolidated Condensed Balance Sheets, (ii) the Consolidated Condensed Statements of Operations, (iii) the Consolidated Condensed Statements of Comprehensive Income, (iv) the Consolidated Condensed Statements of Cash Flows, and (v) Notes to Consolidated Condensed Financial Statements
|
||
35
TABLE OF CONTENTS
Part I. Financial InformationItem 1. Financial StatementsItem 2. Management's Discussion and Analysis Of Financial Condition and Results Of OperationsItem 3. Quantitative and Qualitative Disclosures About Market RiskItem 4. Controls and ProceduresPart II. Other InformationItem 1. Legal ProceedingsItem 1A. Risk FactorsItem 2. Unregistered Sales Of Equity Securities and Use Of ProceedsItem 6. Exhibits