EXELIXIS, INC.
10-Ks and 10-Qs
|
|
|
|
|
|
|
|
|
|
|
|
|
|
|
|
|
|
|
|
|
|
|
|
|
|
|
|
|
|
|
|
|
|
|
|
|
|
|
|
|
|
|
|
|
|
|
|
|
|
|
|
|
|
|
|
UNITED STATES
SECURITIES AND EXCHANGE COMMISSION
Washington, D.C. 20549
|
FORM 10-K
|
(Mark One)
|
ý
|
ANNUAL REPORT PURSUANT TO SECTION 13 OR 15(d) OF THE SECURITIES EXCHANGE ACT OF 1934
|
For the fiscal year ended:
December 30, 2016
, or
|
¨
|
TRANSITION REPORT PURSUANT TO SECTION 13 OR 15(d) OF THE SECURITIES EXCHANGE ACT OF 1934
For the transition period from to
|
Commission File Number:
000-30235
|
EXELIXIS, INC.
(Exact name of registrant as specified in its charter)
|
|
Delaware
|
04-3257395
|
|
(State or other jurisdiction of incorporation or organization)
|
(I.R.S. Employer Identification Number)
|
210 East Grand Ave.
South San Francisco, CA 94080
(650) 837-7000
(Address, including zip code, and telephone number, including area code, of registrant’s principal executive offices)
Securities Registered Pursuant to Section 12(b) of the Act:
|
Title of Each Class
|
Name of Each Exchange on Which Registered
|
|
Common Stock $.001 Par Value per Share
|
The Nasdaq Stock Market LLC
|
Securities Registered Pursuant to Section 12(g) of the Act:
None
Indicate by check mark if the registrant is a well-known seasoned issuer, as defined in Rule 405 of the Securities Act. Yes
ý
No
¨
Indicate by check mark if the registrant is not required to file reports pursuant to Section 13 or 15(d) of the Act. Yes
¨
No
ý
Indicate by check mark whether the registrant (1) has filed all reports required to be filed by Section 13 or 15(d) of the Securities Exchange Act of 1934 during the preceding 12 months (or for such shorter period that the registrant was required to file such reports), and (2) has been subject to such filing requirements for the past 90 days. Yes
ý
No
¨
Indicate by check mark whether the registrant has submitted electronically and posted on its corporate Web site, if any, every Interactive Data File required to be submitted and posted pursuant to Rule 405 of Regulation S-T during the preceding 12 months (or for such shorter period that the registrant was required to submit and post such files). Yes
ý
No
¨
Indicate by check mark if disclosure of delinquent filers pursuant to Item 405 of Regulation S-K is not contained herein, and will not be contained, to the best of registrant’s knowledge, in definitive proxy or information statements incorporated by reference in Part III of this Form 10-K or any amendment to this Form 10-K.
¨
Indicate by check mark whether the registrant is a large accelerated filer, an accelerated filer, a non-accelerated filer or a smaller reporting company. See the definitions of “large accelerated filer,” “accelerated filer” and “smaller reporting company” in Rule 12b-2 of the Exchange Act. (Check one):
Large accelerated filer
ý
Accelerated filer
¨
Non-accelerated filer (Do not check if a smaller reporting company)
¨
Smaller reporting company
¨
Indicate by check mark whether the registrant is a shell company (as defined in Rule 12b-2 of the Act). Yes
¨
No
ý
State the aggregate market value of the voting and non-voting common equity held by non-affiliates computed by reference to the price at which the common equity was last sold, or the average bid and asked price of such common equity, as of the last business day of the registrant’s most recently completed second fiscal quarter:
$1,361,396,920
(based on the closing sales price of the registrant’s common stock on that date. Excludes an aggregate of
63,607,456
shares of the registrant’s common stock held by persons who were directors and/or executive officers of the registrant at
July 1, 2016
on the basis that such persons may be deemed to have been affiliates of the registrant at such date. Exclusion of such shares should not be construed to indicate that any such person possesses the power, direct or indirect, to direct or cause the direction of the management or policies of the registrant or that such person is controlled by or under common control with the registrant.)
As of
February 16, 2017
, there were
290,866,613
shares of the registrant’s common stock outstanding.
DOCUMENTS INCORPORATED BY REFERENCE
Certain portions of the registrant’s definitive proxy statement to be filed with the Securities and Exchange Commission pursuant to Regulation 14A, not later than April 29, 2017, in connection with the registrant’s 2017 Annual Meeting of Stockholders are incorporated herein by reference into Part III of this Annual Report on Form 10-K.
EXELIXIS, INC.
ANNUAL REPORT ON FORM 10-K
INDEX
|
|
|
Page
|
|
Item 1.
|
||
|
Item 1A.
|
||
|
Item 1B.
|
||
|
Item 2.
|
||
|
Item 3.
|
||
|
Item 4.
|
||
|
Item 5.
|
||
|
Item 6.
|
||
|
Item 7.
|
||
|
Item 7A.
|
||
|
Item 8.
|
||
|
Item 9.
|
||
|
Item 9A.
|
||
|
Item 9B.
|
||
|
Item 10.
|
||
|
Item 11.
|
||
|
Item 12.
|
||
|
Item 13.
|
||
|
Item 14.
|
||
|
Item 15.
|
||
|
Item 16.
|
||
1
Some of the statements under the captions “Risk Factors,” “Management’s Discussion and Analysis of Financial Condition and Results of Operations” and “Business” and elsewhere in this Annual Report on Form 10-K are forward-looking statements. These statements are based on our current expectations, assumptions, estimates and projections about our business and our industry and involve known and unknown risks, uncertainties and other factors that may cause our company’s or our industry’s results, levels of activity, performance or achievements to be materially different from any future results, levels of activity, performance or achievements expressed or implied in, or contemplated by, the forward-looking statements. Words such as “believe,” “anticipate,” “expect,” “intend,” “plan,” “focus,” “goal,” “objective,” “will,” “may,” “would,” “could,” “estimate,” “predict,” “target,” “potential,” “continue,” “encouraging” or the negative of such terms or other similar expressions identify forward-looking statements. Our actual results and the timing of events may differ significantly from the results discussed in the forward-looking statements. Factors that might cause such a difference include those discussed in “Item 1A. Risk Factors” as well as those discussed elsewhere in this Annual Report on Form 10-K. These and many other factors could affect our future financial and operating results. We undertake no obligation to update any forward-looking statement to reflect events after the date of this report.
We have adopted a 52- or 53-week fiscal year policy that generally ends on the Friday closest to December 31st. Fiscal year 2014, a 53-week year, ended on January 2, 2015; fiscal year 2015, a 52-week year, ended on January 1, 2016; fiscal year 2016, a 52-week year, ended on December 30, 2016; and fiscal year 2017, a 52-week year, will end on December 29, 2017. For convenience, references in this report as of and for the fiscal years ended January 2, 2015, January 1, 2016, and December 30, 2016 are indicated as being as of and for the years ended December 31, 2014, 2015, and 2016, respectively. The quarterly period ended January 2, 2015 is a 14-week fiscal quarter; all other interim periods presented are 13-week fiscal quarters.
|
ITEM 1.
|
BUSINESS
|
Overview
Exelixis, Inc. (“Exelixis,” “we,” “our” or “us”) is
a biopharmaceutical company committed to the discovery, development and commercialization of new medicines to improve care and outcomes for people with cancer.
Since its founding in 1994, three products discovered at Exelixis have progressed through clinical development, received regulatory approval, and entered the commercial marketplace. Two are derived from cabozantinib, an inhibitor of multiple tyrosine kinases including MET, AXL, and VEGF receptors: CABOMETYX™ tablets approved for previously treated advanced kidney cancer and COMETRIQ
®
capsules approved for progressive, metastatic medullary thyroid cancer. The third product, Cotellic
®
, is a formulation of cobimetinib, a selective inhibitor of MEK, marketed under a collaboration with Genentech (a member of the Roche Group), and is approved as part of a combination regimen to treat advanced melanoma. Both cabozantinib and cobimetinib have shown potential in a variety of forms of cancer and are the subjects of broad clinical development programs.
The following is a summary of important information about our internally-discovered, marketed products:
|
•
|
CABOMETYX (cabozantinib)
was approved by the U.S. Food and Drug Administration, or FDA, on April 25, 2016, for the treatment of patients with advanced renal cell carcinoma, or RCC, who have received prior anti-angiogenic therapy. The European Commission, or EC, approved CABOMETYX on September 9, 2016 similarly for the treatment of advanced RCC in adults following prior vascular endothelial growth factor, or VEGF, targeted therapy. Outside the U.S. and Japan, CABOMETYX is being marketed by our collaboration partner Ipsen Pharma SAS, or Ipsen. Should CABOMETYX be approved in Japan, it will be marketed by our collaboration partner Takeda Pharmaceutical Company Limited, or Takeda. In 2016, we generated
$93.5 million
in net product revenue from sales of CABOMETYX in the United States.
|
|
•
|
COMETRIQ (cabozantinib)
,
our first marketed product, was approved by the FDA on November 29, 2012 for the treatment of patients with progressive, metastatic medullary thyroid carcinoma, or MTC. In March 2014, the EC granted COMETRIQ a similar, conditional marketing authorization for the treatment of adult patients with progressive, unresectable locally advanced or metastatic MTC. COMETRIQ is now commercialized in the European Union by Ipsen. In 2016, we generated
$39.4 million
in net product revenue from sales of COMETRIQ in the United States and received
$2.5 million
in product revenue from sales of COMETRIQ by our former distribution partner, Swedish Orphan Biovitrum, or Sobi. Cabozantinib has shown clinical anti-tumor activity in more than 20 forms of
|
2
cancer, so we are focused on advancing the broad cabozantinib clinical development program in order to advance commercial opportunities beyond advanced RCC and MTC. For additional information, see “Cabozantinib Development Program.”
|
•
|
Cotellic
(cobimetinib)
was approved by the FDA on November 10, 2015, in combination with vemurafenib for the treatment of patients with BRAF V600E or V600K mutation-positive advanced melanoma in the United States. It has also been approved in combination with vemurafenib in multiple other territories including the European Union, Switzerland, Canada, Australia and Brazil. In 2016, we recognized
$2.8 million
in collaboration revenue as a result of royalties on ex-U.S. sales of Cotellic and beginning in the fourth quarter of 2016, we also recognized a small net profit for our share of U.S. activities under the collaboration agreement. Genentech has an extensive clinical development program for this compound. For additional information on the cobimetinib development program, see “Cobimetinib Development Program
.
”
|
Our immediate business objective is to maximize the clinical and commercial potential of CABOMETYX, COMETRIQ and Cotellic. Over the course of 2016, the revenue generated from the sale of these products and from our collaboration agreements, coupled with disciplined expense management and reduced debt on our balance sheet, has created a capital structure upon which we believe Exelixis can grow in a sustainable manner. As a result, we believe we are increasingly well positioned to drive the expansion and depth of our product offerings through the continued development of cabozantinib
, the
measured resumption of internal drug discovery activities and the evaluation of in-licensing and acquisition opportunities that align with our oncology drug development expertise.
Recent Developments
Commercialization of CABOMETYX for Advanced RCC
The American Cancer Society’s 2016 statistics cite kidney cancer as among the ten most commonly diagnosed forms of cancer among both men and women in the United States.
The second and later-line RCC market is large and growing; published studies suggest that the drug-eligible patient population encompasses approximately 17,000 individuals in the United States and 37,000 globally.
When the FDA approved our novel tyrosine kinase inhibitor, or TKI, CABOMETYX, in April 2016, we were prepared to engage with the advanced RCC treating community and bring CABOMETYX to market for the benefit of patients. Experienced and professional oncology sales, marketing, market access, and medical affairs teams were in place and our supply chain and distribution arrangements were substantially complete. Our educational efforts began to familiarize physicians with CABOMETYX’s unique product profile, although physicians were already largely familiar with the TKI class.
CABOMETYX is distinct from other approved treatment options for previously treated patients with advanced RCC because it is the first single agent therapy to demonstrate robust and clinically meaningful improvements in all three key efficacy parameters - overall survival, or OS, progression-free survival, or PFS, and objective response rate, or ORR - in that indication. The FDA recognized this during its regulatory review, when it granted CABOMETYX Fast Track and Breakthrough Therapy designations. For additional information about METEOR (
Met
astatic RCC Phase 3 Study
E
valuating Cab
o
zantinib vs. Eve
r
olimus), the phase 3 pivotal trial upon which the approval of CABOMETYX was based, see “Cabozantinib Development Program
- Exelixis Sponsored Trials - RCC - METEOR.
”
A review of the launch to date shows that physicians are rapidly adopting CABOMETYX, demonstrated by increasing demand and patients initiating therapy, despite the large number of competing products approved to treat advanced RCC. The clinical profile and initial success of CABOMETYX in the United States has enabled us to continue to attract top talent and further build commercial and medical affairs organizations of considerable size and experience. As a result, we believe that we are well positioned to support the growth of our development pipeline.
In Europe, Ipsen has made significant progress since September 2016, when the EC approved CABOMETYX tablets for the treatment of advanced RCC in adults following prior VEGF targeted therapy. By the end of 2016, Ipsen recorded its first commercial sales in Europe and is now preparing to potentially market CABOMETYX in all 28 member states of the European Union, Norway, Iceland, and elsewhere.
3
Establishment and Expansion of Global Partnerships for Cabozantinib
On February 29, 2016, we entered into a collaboration and license agreement with Ipsen, a specialty pharmaceutical company already engaged in the global distribution of oncology medicines. Our collaboration focuses on the further development of cabozantinib and provides Ipsen exclusive rights to commercialize current and potential future cabozantinib indications outside of the United States, Canada and Japan. On December 20, 2016, we agreed to add Canada to the Ipsen territories because Ipsen also has substantial business resources in that country. The upfront payments and regulatory milestones we received from Ipsen during 2016 were essential to our commercial success because they provided us with the financial resources to successfully commercialize CABOMETYX in the United States without having to access alternative sources of capital. For additional information on our collaboration with Ipsen, see “Collaborations
- Cabozantinib Collaborations - Ipsen Collaboration.
”
On January 30, 2017, we continued to advance the global development and commercialization of cabozantinib by entering into a collaboration and license agreement with Takeda for the commercialization and further clinical development of cabozantinib in Japan. Pursuant to the terms of the collaboration agreement, Takeda has exclusive commercialization rights for currently developed and potential future cabozantinib indications in Japan. The parties have also agreed to collaborate on the future clinical development of cabozantinib. For additional information on our collaboration with Takeda, see “Collaborations
- Cabozantinib Collaborations - Takeda Collaboration.
”
Submission Planning for Supplemental New Drug Application, or sNDA, for Cabozantinib as a Treatment for First-Line Advanced RCC
On May 23, 2016, we announced that CABOSUN, a randomized phase 2 trial of cabozantinib in patients with previously untreated advanced RCC being conducted by The Alliance for Clinical Trials in Oncology, or The Alliance, as part of our Cooperative Research and Development Agreement, or CRADA, with the National Cancer Institute’s Cancer Therapy Evaluation Program, or NCI-CTEP, met its primary endpoint, demonstrating a statistically significant and clinically meaningful improvement in PFS compared with sunitinib in patients with intermediate- or poor-risk disease. Based on these results, we are working towards the submission of a sNDA in 2017 for cabozantinib as a treatment for first-line advanced RCC. For additional information on the results of CABOSUN, see “Cabozantinib Development Program
- Trials Conducted through our CRADA with NCI-CTEP and our IST Program -
RCC - CABOSUN.
”
Expanded Development and Commercialization of Cotellic
During 2016, our collaboration partner, Genentech, received additional approvals for Cotellic in combination with vemurafenib for the treatment of patients with unresectable or metastatic melanoma with a BRAF V600E mutation in multiple countries, including Australia and Brazil. Genentech also advanced the development program for cobimetinib during 2016, through the initiation and announcement of multiple phase 3 pivotal trials exploring the combination of cobimetinib with other targeted and immuno-oncology agents for the treatment of melanoma and colorectal cancer, or CRC. Cobimetinib has the potential to provide us with a meaningful second significant source of revenue. For additional information on the cobimetinib development program, see “Cobimetinib Development Program
.
”
During 2016, we retired our 4.25% Convertible Senior Subordinated Notes due 2019, or the 2019 Notes. This was accomplished by first entering into privately negotiated exchange transactions pursuant to which $239.4 million of the 2019 Notes were exchanged for an aggregate of approximately 45 million shares of our common stock and an aggregate cash payment of approximately $2.4 million. Following completion of these exchange transactions, we issued a redemption notice for the remaining $48.1 million of the outstanding 2019 Notes. As a result of the redemption, $47.5 million of the 2019 Notes were converted into shares of our common stock and the remaining $0.6 million of the 2019 Notes were redeemed in cash for 100% of the principal amount thereof, plus accrued and unpaid interest through the end of the redemption period. As a result of the successful completion of the exchange transactions and redemption of the 2019 Notes, we significantly reduced our outstanding debt and strengthened our capital structure to support potential future growth. For additional information on the exchange transactions and redemption of the 2019 Notes, see “Note 7, Debt,” to our Notes to Consolidated Financial Statements contained in Part II, Item 8 of this Annual Report on Form 10-K
.
4
Evaluation of Cabozantinib in Combination with Immune-oncology Agents in Various Indications, Including a Phase 3 Trial in First Line Advanced RCC
Cabozantinib has demonstrated clinical activity as a single agent in advanced RCC, and we are interested in further examining its potential in combination with immunotherapies to treat this serious disease. Building on the available preclinical and clinical observations that suggest treatment with cabozantinib results in a more immune-permissive tumor environment potentially resulting in cooperative activity of cabozantinib in combination with immune check point inhibitors, in collaboration with Bristol Meyers Squibb Company, or BMS, we intend to evaluate the combination of cabozantinib with nivolumab or nivolumab and ipilimumab in various tumor types, including bladder cancer, hepatocellular carcinoma, or HCC, and a phase 3 trial in first-line advanced RCC. The combination of cabozantinib with nivolumab or nivolumab and ipilimumab is being evaluated in a phase 1b trial that has demonstrated an acceptable safety profile and clinical activity in patients with heavily pre-treated genitourinary malignancies, as reported at the European Society of Medical Oncology, or ESMO, 2016 Congress and, more recently at the 2017 Genitourinary Cancers Symposium. Additionally, we are planning to initiate a phase 1b trial with various expansion cohorts evaluating cabozantinib and atezolizumab, Roche’s PD-L1 targeting antibody, in patients with advanced genitorurinary malignancies, including RCC and bladder cancer. For additional information on our clinical collaboration agreements with BMS and Roche, see “Cabozantinib Development Program
.
”
Resumption of Discovery Activities
We have recently resumed internal drug discovery efforts with the goal of identifying novel and promising therapeutic candidates to advance into clinical trials. From 2000 until 2012, we had an active Discovery group that advanced 22 compounds to Investigational New Drug, or IND stage, either independently or with collaboration partners, including cabozantinib and cobimetinib. We built a significant infrastructure, including a library of 4.6 million compounds, and gained extensive experience in the identification and optimization of drug candidates against multiple target classes for oncology, inflammation and metabolic diseases.
Our new discovery organization will leverage that history, but will be more focused and measured. We intend to concentrate our in-house work on the most sensitive and demanding aspects of lead optimization and use contract research organizations, or CROs, to support more routine activities, thereby minimizing our internal footprint while still maintaining an agile, competitive approach. We intend to be judicious in the selection of targets and focus on those with the most robust preclinical validation datasets. We anticipate that our experience and ability to identify high quality lead compounds through use of our propriety compound library will permit us to prosecute competitive and productive discovery programs in areas of high potential.
Cabozantinib Development Program
Cabozantinib inhibits the activity of tyrosine kinases, including MET, AXL, VEGF receptors, and RET. These receptor tyrosine kinases are involved in both normal cellular function and in pathologic processes such as oncogenesis, metastasis, tumor angiogenesis, and maintenance of the tumor microenvironment. Objective tumor responses have been observed in patients treated with cabozantinib in more than 20 individual tumor types investigated in phase 1 and 2 clinical trials to date, reflecting the medicine’s broad clinical potential. We are currently evaluating cabozantinib in a broad development program comprising over 45 ongoing or planned clinical trials across multiple indications. We are the sponsor of some of those trials, including CELESTIAL (
C
abozantinib Phas
e
3 Control
le
d
St
udy
I
n Hep
a
tocellu
l
ar Carcinoma), our phase 3 pivotal trial comparing cabozantinib to placebo in patients with advanced HCC who had received previous treatment with sorafenib, with the remaining trials being conducted through our CRADA with NCI-CTEP or our investigator sponsored trial, or IST program. Beginning in February 2017, we also entered into individual clinical collaboration agreements with BMS and Roche, for the purpose of conducting clinical studies combining cabozantinib with BMS’s PD-1 and CTLA-4 immune checkpoint inhibitors and Roche’s anti-PD-L1 immunotherapy compound.
5
A select summary of our cabozantinib clinical development activities is below:
|
Indication
|
Combination Regimen
|
Status Update
|
|
Progressive, Metastatic Medullary Thyroid Cancer (MTC)
|
||
|
Approved in US and EU
|
||
|
Post-marketing study (EXAMINER)
|
||
|
Renal Cell Carcinoma (RCC)
|
||
|
Second-line
|
Approved in US and EU
|
|
|
First-line (intermediate- or poor-risk classification)
|
Preparing to file sNDA in 2017 based on results from CABOSUN† trial
|
|
|
First-line
|
+ nivolumab +/- ipilimumab
|
Phase 3 pivotal trial expected to begin in 2017, co-sponsored with Bristol-Myers Squibb
|
|
Hepatocellular Carcinoma
|
||
|
Second-line
|
Phase 3 (CELESTIAL), data anticipated in 2017
|
|
|
Non-Small Cell Lung Cancer
|
||
|
EGFR wild-type
|
Phase 2†
|
|
|
Molecular alterations in RET, ROS1, MET, AXL, or NTRK1
|
Phase 2*
|
|
|
Genitourinary Tumors, including Bladder and Urothelial Cancers
|
||
|
Genitourinary tumors
|
+ nivolumab +/- ipilimumab
|
Phase 1†
|
|
Advanced solid tumors
|
+ atezolizumab
|
Phase 1B* trial to begin in 2017, planned cohorts in RCC and urothelial carcinoma
|
|
Signal Search Opportunities to Inform Potential Development
|
||
|
Pancreatic neuroendocrine and carcinoid tumors
|
Phase 2*
|
|
|
Endometrial cancer
|
Phase 2†
|
|
|
Differentiated thyroid cancer
|
Phase 2*
|
|
|
Metastatic gastrointestinal stromal tumor
|
Phase 2 (CABOGIST)§
|
|
|
Breast cancer with brain metastases
|
+/- trastuzumab
|
Phase 2*
|
|
Metastatic, hormone-receptor-positive breast cancer
|
+ fulvestrant
|
Phase 2*
|
|
Metastatic, triple negative breast cancer
|
Phase 2*
|
|
|
Soft-tissue sarcomas
|
Phase 2†
|
|
|
High-grade uterine sarcomas
|
Phase 2§
|
|
|
Relapsed osteosarcoma or Ewing sarcoma
|
Phase 2†
|
|
|
Colorectal cancer
|
+/- panitumumab
|
Phase 1*
|
|
* Trial conducted through Exelixis' Investigator-Sponsored Trial program.
|
|
† Trial conducted through collaboration with NCI’s Cancer Therapy Evaluation Program.
|
|
§ Trial sponsored by the European Organization for Research and Treatment of Cancer (EORTC).
|
6
Exelixis Sponsored Trials
MTC - EXAM
COMETRIQ’s safety and efficacy were assessed in an international, multi-center, randomized double-blinded controlled trial of 330 patients with progressive, metastatic MTC, known as EXAM (
E
fficacy of
X
L184 (Cabozantinib) in
A
dvanced
M
edullary Thyroid Cancer). Patients were required to have evidence of progressive disease within 14 months prior to study entry. This assessment was performed by an independent radiology review committee, or IRRC, in 89% of patients and by the treating physicians in 11% of patients. Patients were randomized 2:1 to receive COMETRIQ 140 mg (n = 219) or placebo (n = 111) orally, once daily until disease progression determined by the treating physician or until intolerable toxicity. Randomization was stratified by age (≤ 65 years vs. > 65 years) and prior use of a TKI. No cross-over was allowed at the time of progression. The primary endpoint was to compare PFS in patients receiving COMETRIQ versus patients receiving placebo. Secondary endpoints included ORR and OS. The main efficacy outcome measures of PFS, ORR and response duration were based on IRRC-confirmed events using modified Response Evaluation Criteria in Solid Tumors, or RECIST, which is a widely used set of rules that defines when cancer patients improve (“respond”), stay the same (“stabilize”) or worsen (“progress”) during treatments.
EXAM served as the basis for the regulatory approval of COMETRIQ in the United States and European Union. A statistically significant prolongation in PFS was demonstrated among COMETRIQ-treated patients compared to those receiving placebo [HR 0.28 (95% CI: 0.19-0.40); p<0.0001], with median PFS of 11.2 months in the COMETRIQ arm and 4.0 months in the placebo arm. Partial responses, or PRs, were observed only among patients in the COMETRIQ arm (27% vs. 0%; p<0.0001). The median duration of objective response was 14.7 months (95% CI: 11.1-19.3) for patients treated with COMETRIQ. The most commonly reported adverse drug reactions occurring in at least 25% of patients were diarrhea, stomatitis, palmar-plantar erythrodysesthesia syndrome, or PPES, decreased weight, decreased appetite, nausea, fatigue, oral pain, hair color changes, dysgeusia, hypertension, abdominal pain, and constipation. In November 2014, we announced completion of the OS analysis, the secondary endpoint of the study. Consistent with an earlier interim analysis, there was no statistically significant difference in OS between the treatment arms. The median OS was 26.6 months for the COMETRIQ arm and 21.1 months for the placebo arm (HR = 0.85; 95% CI 0.64-1.12; p = 0.2409). The subgroup analysis by RET M918T mutation status, a known negative prognostic factor in MTC, revealed a large improvement in OS of 25.4 months for COMETRIQ-treated patients positive for the RET M918T mutation; the median OS was 44.3 months for the COMETRIQ arm and 18.9 months for the placebo arm (HR = 0.60; 95% CI 0.38-0.95; p = 0.026, not adjusted for multiple subgroup testing). We presented the final results at the American Society of Clinical Oncology, or ASCO, 2015 Annual Meeting and submitted the results to regulatory authorities to satisfy post-marketing commitments.
In connection with the approval of COMETRIQ for the treatment of progressive, metastatic MTC, we were subject to post-marketing requirements, all of which have been satisfied, other than a requirement to conduct a clinical study comparing a lower dose of COMETRIQ with the labeled dose of 140 mg. This study is evaluating safety and PFS in progressive, metastatic MTC patients and is ongoing.
RCC - METEOR
In July 2015, we announced positive results of METEOR, a phase 3 pivotal trial comparing CABOMETYX to everolimus in patients with advanced RCC who have experienced disease progression following treatment with at least one prior VEGF receptor inhibitor. METEOR was initiated in May 2013. The trial was designed to enroll 650 patients at approximately 200 sites. Patients were stratified based on the number of prior VEGF receptor inhibitors received, and on commonly applied RCC risk criteria. Patients were randomized 1:1 to receive 60 mg of CABOMETYX daily or 10 mg of everolimus daily and no cross-over was allowed between the study arms. The METEOR trial was designed to provide adequate power to assess both the primary endpoint of PFS, and the secondary endpoint of OS. The trial protocol specified that the primary analysis of PFS would be conducted among the first 375 patients randomized while the secondary endpoint of OS would be conducted among all 650 patients randomized. This design was employed to ensure sufficient follow-up and a PFS profile that would not be primarily weighted toward early events. Such disproportionate weighting of events was a potential risk if the entire study population required for the secondary endpoint analysis of OS had also served as the population for the primary analysis of PFS. On September 26, 2015,
The New England Journal of Medicine
published the complete, detailed positive results from the primary analysis of METEOR, and these results were also presented during the Presidential Session I at the European Cancer Congress 2015. The trial met its primary endpoint, demonstrating a statistically significant increase in PFS for CABOMETYX, as determined by an IRRC among the first 375 patients enrolled. The median PFS was 7.4 months for the CABOMETYX arm versus 3.8 months for the everolimus arm, and the hazard ratio [HR] was
7
0.58 (95% confidence interval [CI] 0.45-0.75, p<001), corresponding to a 42% reduction in the rate of disease progression or death for CABOMETYX compared to everolimus. The trial also showed that CABOMETYX significantly improved the ORR. The most commonly reported adverse drug reactions occurring in at least 25% of patients were diarrhea, fatigue, nausea, decreased appetite, PPES, hypertension, vomiting, weight decreased, and constipation.
A review of adverse events, or AEs, demonstrated that the frequency of AEs of any grade regardless of causality was approximately balanced between study arms, and the rate of treatment discontinuation due to adverse events was 9% and 10% for CABOMETYX and everolimus, respectively. With additional follow-up for OS, the study also met its secondary endpoint of OS as presented in June 2016 at the ASCO 2016 Annual Meeting and published in Lancet Oncology. Compared with everolimus, CABOMETYX was associated with a 34% reduction in the rate of death and median OS was 21.4 months for patients receiving CABOMETYX versus 16.5 months for those receiving everolimus (HR=0.66, 95% CI 0.53-0.83, P=0.0003).
In January 2016, an analysis of PFS among all 658 patients enrolled was presented at the 2016 Genitourinary Cancers Symposium, and revealed consistent results with the primary analysis showing a median PFS of 7.4 months for the CABOMETYX arm versus 3.9 months for the everolimus arm, and a HR of 0.52 (95% CI 0.43-0.64, p<0.001), corresponding to a 48% reduction in the rate of disease progression or death for CABOMETYX as compared to everolimus. In addition, subgroup analyses for PFS showed consistent beneficial effect of CABOMETYX versus everolimus; subgroups included: ECOG performance status; commonly applied RCC risk groups as described by Motzer et al.; organ involvement, including bone and visceral metastases and overall tumor burden; extent and type of prior VEGF receptor inhibitor therapy; and prior PD-1/PD-L1 therapy. For patients without prior PD-1/PD-L1 therapy, median PFS was 7.4 months for CABOMETYX and 3.9 months for everolimus (HR = 0.54, 95% CI 0.44-0.66). For patients who had received prior PD-1/PD-L1 therapy, the median PFS for CABOMETYX was not reached, and the median PFS for everolimus was 4.1 months (HR = 0.22, 95% CI 0.07-0.65). Subgroup analyses for ORR also showed consistent benefit for CABOMETYX as compared to everolimus.
On the basis of the data from the METEOR trial, CABOMETYX was approved by the FDA for the treatment of patients with advanced RCC following prior antiangiogenic therapy, and by the EC for the treatment of advanced RCC in adults following prior VEGF targeted therapy.
HCC - CELESTIAL
Published studies indicate that an estimated 700,000 new cases of HCC present each year worldwide, with 39,000 of these cases in the United States. While patients with localized disease may be candidates for surgery or other therapies such as embolization, treatment options for advanced disease are limited. Currently, sorafenib is the only approved agent for the first line treatment of advanced, unresectable HCC. However, patients typically progress despite sorafenib treatment, at which point there is no approved therapy available to them. While a number of VEGF receptor targeting agents have been tested in phase 2/3 trials in the post-sorafenib setting, only one phase 3 trial has shown positive results. In 2016 results from a study comparing regorafenib and placebo in the second line treatment of HCC has reported positive results and data are currently under review by regulatory agencies. Thus, second-line advanced HCC still represents an area of substantial unmet medical need.
MET is the tyrosine kinase receptor for hepatocyte growth factor, and plays a crucial role in liver development and regeneration. Expression of MET is elevated in HCC, particularly in metastatic HCC, and high MET levels are associated with reduced OS and resistance to sorafenib treatment. In preclinical models, upregulation of MET has been shown to drive escape from VEGF receptor inhibition, and to promote an increase in invasion and metastasis. Consistent with this, treatment of HCC patients with sorafenib can result in increases in tumor MET expression. These findings provide a strong parallel with the RCC setting, where high levels of MET expression and activation are also associated with poor prognosis and resistance to and escape from first-line treatment with VEGF receptor inhibitors.
We believe that targeting both MET and VEGF receptors with cabozantinib in HCC may provide benefit in second-line HCC by maintaining VEGF receptor inhibition while also inhibiting MET-driven oncogenic and resistance pathways. In an initial test of this hypothesis, a cohort of HCC patients, including a subset whose disease had progressed despite prior sorafenib treatment, was enrolled in our phase 2 randomized discontinuation trial. Based on the encouraging data that emerged from this trial, we launched CELESTIAL, our phase 3 pivotal trial comparing cabozantinib to placebo in patients with advanced HCC who had received previous treatment with sorafenib. The trial is designed to enroll 760 patients at up to 200 sites. Patients are being randomized 2:1 to receive 60 mg of cabozantinib daily or placebo. The primary endpoint for CELESTIAL is OS, and the secondary endpoints include ORR and PFS. In September 2016, following the first planned
8
interim analysis for CELESTIAL, the trial’s Independent Data Monitoring Committee, or IDMC, determined that the study should continue without modifications per the study protocol. We anticipate top-line results from CELESTIAL in 2017.
Trials Conducted Under our Clinical Collaboration Agreements
Bladder Cancer, HCC and First-Line Advanced RCC - Combination Studies with BMS
Building on the available preclinical and clinical observations that cabozantinib results in a more immune-permissive tumor environment potentially resulting in cooperative activity of cabozantinib in combination with immune check point inhibitors, in February 2017, we entered into a clinical trial collaboration agreement with BMS for the purpose of evaluating the combination of cabozantinib with nivolumab or cabozantinib with nivolumab and ipilimumab in various tumor types, including, in a planned phase 3 trial in first-line advanced RCC, and in potential additional trials in bladder cancer and HCC. Pursuant to the terms of the collaboration agreement, each party will grant to the other a non-exclusive, worldwide (within the collaboration territory as defined in the collaboration agreement), non-transferable, royalty-free license to use the other party’s compounds in the conduct of each clinical trial. The parties’ efforts will be governed through a joint development committee established to guide and oversee the collaboration’s operation. Each trial will be conducted under a combination IND application, unless otherwise required by a regulatory authority. Each party will be responsible for supplying drug product for the applicable clinical trial and costs for each such trial will be shared equally between the parties, unless two BMS compounds will be utilized in such trial, in which case BMS will bear two-thirds of the costs for such study treatment arms and we will bear one-third of the costs. Unless earlier terminated, the collaboration agreement shall remain in effect until the completion of all clinical trials under the collaboration, all related trial data has been delivered to both parties and the completion of any then agreed upon analysis. The collaboration agreement may be terminated for cause by either party based on uncured material breach by the other party, bankruptcy of the other party or for safety reasons. Upon termination by either party, the licenses granted to each party to conduct a combined therapy trial will terminate.
Locally Advanced or Metastatic Solid Tumors - Combination Study with Roche
We are also planning to initiate a phase 1b dose escalation study that will evaluate the safety and tolerability of cabozantinib in combination with Roche’s atezolizumab in patients with locally advanced or metastatic solid tumors. Based on the dose-escalation results, the trial has the potential to enroll up to four expansion cohorts, including a cohort of patients with previously untreated advanced clear cell RCC and three cohorts of urothelial carcinoma, namely platinum eligible first-line patients, first or second-line platinum ineligible patients and patients previously treated with platinum-containing chemotherapy. Enrollment for this trial is scheduled to begin mid-year 2017. We will be the sponsor of the trial, and Roche will provide atezolizumab.
Trials Conducted through our CRADA with NCI-CTEP and our IST Program
In October 2011, we entered into a CRADA with NCI-CTEP for the clinical development of cabozantinib. Through our CRADA with NCI-CTEP and our IST program we have been able to expand the cabozantinib development program dramatically while avoiding over-burdening our internal development resources. Our CRADA reflects a major commitment by NCI-CTEP to support the broad exploration of cabozantinib’s potential in a wide variety of cancers, each representing a substantial unmet medical need. Through this mechanism, NCI-CTEP provides funding for as many as 20 active clinical trials of cabozantinib each year for a five-year period. The term of the CRADA was extended in October 2016 for an additional five-year period through October 2021, provided, that both parties maintain the right to terminate the CRADA for any reason upon sixty days’ notice, an uncured material breach upon thirty days’ notice and immediately for safety concerns. IND applications for trials under the CRADA are held by NCI-CTEP. NCI-CTEP also retains rights to any inventions made in whole or in part by NCI-CTEP investigators. However, for inventions that claim the use and/or the composition of cabozantinib, we have an automatic option to elect a worldwide, non-exclusive license to cabozantinib inventions for commercial purposes, with the right to sublicense to affiliates or collaborators working on our behalf, as well as an additional, separate option to negotiate an exclusive license to cabozantinib inventions. Further, before any trial proposed under the CRADA may commence, the protocol is subject to our review and approval, and the satisfaction of certain other conditions. We believe our CRADA with NCI-CTEP has and will enable us to continue to expand the cabozantinib development program broadly in a cost-efficient manner.
9
RCC - CABOSUN
In October 2016, we announced detailed results from CABOSUN, a randomized phase 2 trial of cabozantinib in patients with previously untreated advanced RCC with intermediate- or poor-risk disease conducted by The Alliance under our CRADA with NCI-CTEP. CABOSUN was a randomized, open-label, active-controlled phase 2 trial that enrolled 157 patients with advanced RCC. Patients were randomized 1:1 to receive cabozantinib (60 mg once daily) or sunitinib (50 mg once daily, 4 weeks on followed by 2 weeks off). The primary endpoint was PFS. Secondary endpoints included OS and ORR. Eligible patients were required to have locally advanced or metastatic clear-cell RCC, ECOG performance status 0-2, and had to be intermediate or poor risk per the International Metastatic Renal Cell Carcinoma Database Consortium, or IMDC, criteria (Heng,
Journal of Clinical Oncology
, 2009).
CABOSUN met its primary endpoint, demonstrating a statistically significant and clinically meaningful improvement in PFS compared with sunitinib. With a median follow-up of 21.4 months, cabozantinib demonstrated a 34 percent reduction in the rate of disease progression or death [HR 0.66, 95% CI (0.46-0.95), one-sided P=0.012]. The median PFS for cabozantinib was 8.2 months versus 5.6 months for sunitinib, corresponding to a 2.6 months (46 percent) improvement favoring cabozantinib over sunitinib. PFS benefits were independent of the IMDC risk group (intermediate or poor risk) and presence or absence of bone metastases at baseline. The results for sunitinib were in line with a previously published retrospective analysis of 1,174 intermediate- and poor-risk RCC patients from the IMDC database, which documented a median PFS of 5.6 months with a first-line targeted therapy, mainly sunitinib, in this patient population.
ORR was also significantly improved, at 46 percent (95% CI 34% - 57%) for cabozantinib versus 18 percent (95% CI 10% to 28%) for sunitinib. With a median follow-up of 22.8 months, median OS was 30.3 months for cabozantinib versus 21.8 months for sunitinib [HR 0.80, 95% CI (0.50 - 1.26)]. The most common grade 3 or 4 adverse events with cabozantinib were hypertension (28%), diarrhea (10%), palmar-plantar erythrodysesthesia (8%), and fatigue (6%); with sunitinib, they were hypertension (22%), fatigue (15%), diarrhea (11%), and thrombocytopenia (11%). Grade 5 adverse events occurred in four patients (5%) in the cabozantinib group and five patients (7%) in the sunitinib group. Treatment-related grade 5 events occurred in three patients in the cabozantinib group (acute kidney injury, sepsis, and jejunal perforation) and three patients in the sunitinib group (sepsis, respiratory failure, and vascular disorders). The rate of treatment discontinuation because of adverse events was 20% (n = 16) and 21% (n = 16) in the cabozantinib and sunitinib groups, respectively.
Based on these results, we plan to submit a sNDA for cabozantinib as a treatment of first-line advanced RCC, and are working with The Alliance so that we can develop the appropriate regulatory filings.
Advanced Genitourinary Tumors
Results from a phase 1 trial of cabozantinib in combination with nivolumab in patients with previously treated genitourinary tumors being conducted under our CRADA with NCI-CTEP were first presented at the ESMO 2016 Congress in October 2016 and recently updated at the 2017 Genitourinary Cancers Symposium in February 2017.
Between July 22, 2015 and December 31, 2016, 48 patients were accrued with previously treated metastatic urothelial carcinoma, or mUC, (n=19), urachal adenocarcinoma (n=4), squamous cell carcinoma of the bladder or urethra (n=2), germ cell tumor (n=4), castration-resistant prostate cancer (n=9), RCC (n=4), trophoblastic tumor (n=1), sertoli cell tumor (n=1) or penile squamous cell carcinoma (n=4) and treated in two parts. In Part I, 30 patients were treated with the doublet combination of cabozantinib and nivolumab at four dose levels. In Part II, 18 patients were treated with the triplet combination of cabozantinib, nivolumab and ipilimumab at three dose levels.
Among the 43 patients who were evaluable for response, the ORR for all tumor types was 30% (38% for the doublet dosing schedule and 18% for the triplet dosing schedule) with a 7% complete response, or CR, rate and a 23% PR rate. Stable disease, or SD, was reported in 56% of patients. The ORR for patients with mUC was 38%, and 2 of 16 patients achieved a CR, while 2 patients with squamous cell carcinoma of the bladder had objective responses (1 CR and 1 PR). In the mUC cohort, 15 of 16 patients had a CR, PR or SD as their best response.
Grade 3 adverse events (>5% of patients) observed in the doublet combination included neutropenia (17%), hypophosphatemia (13%), hypertension (10%), lipase increase (7%), fatigue (7%), diarrhea (7%) and dehydration (7%). Grade 3 adverse events (>5% of patients) observed in the triplet combination included hypertension (17%), hypophosphatemia (17%), fatigue (13%), hyponatremia (13%), lipase increase (13%), nausea (13%) and rash (6%). There were limited numbers of grade 4 adverse events (10% including thrombocytopenia and lipase increase in the doublet combination, and 6% (lipase increase) in the triplet combination), and no grade 5 adverse events observed in either part of the trial.
10
The recommended doses for the ongoing expansion cohorts were determined to be cabozantinib 40 mg daily plus nivolumab 3 mg/kg once every 2 weeks for the doublet and cabozantinib 40 mg daily, nivolumab 3 mg/kg plus ipilimumab 1 mg/kg every 3 weeks for 4 doses, then nivolumab 3 mg/kg every 2 weeks for the triplet.
We believe these promising early stage clinical findings support further investigation of cabozantinib in combination with nivolumab and other immune checkpoint inhibitors in a number of genitourinary tumors.
Non-Small Cell Lung Cancer (NSCLC)
In November 2014, we announced positive top-line results from a randomized phase 2 trial of cabozantinib and erlotinib alone or in combination as second- or third-line therapy in patients with stage IV EGFR wild-type NSCLC. This trial (Study E1512) was sponsored through our CRADA with NCI-CTEP and was conducted by the ECOG-ACRIN Cancer Research Group. It enrolled 125 patients with EGFR wild-type metastatic NSCLC who had received at least one or two prior chemotherapy regimens; of these, 111 patients were evaluable for efficacy and 118 patients were evaluable for safety. Patients were randomized 1:1:1 to receive erlotinib (150 mg daily), cabozantinib (60 mg daily), or the combination of erlotinib plus cabozantinib (150 mg plus 40 mg daily).
The positive results from this trial were reported at the ASCO 2015 Annual Meeting on May 31, 2015, and subsequently published online in Lancet Oncology on November 4, 2016. The study met its primary endpoint, demonstrating significant increases in PFS for cabozantinib and the combination of cabozantinib plus erlotinib when individually compared to the erlotinib arm. The median PFS for the combination of cabozantinib and erlotinib was 4.7 months versus 1.8 months for erlotinib alone, a more than two-fold increase. The HR was 0.37 (80% CI 0.25-0.53, p=0.0003), which corresponds to a 63% reduction in the rate of disease worsening. The median PFS for cabozantinib monotherapy was 4.3 months versus 1.8 months for erlotinib alone, and the HR was 0.39 (80% CI 0.27-0.55, p=0.0003), corresponding to a 61% reduction in the rate of disease worsening. OS was a secondary endpoint of the trial. Median OS was 13.3 months for the combination of cabozantinib and erlotinib, and 9.2 months for cabozantinib alone, as compared to 5.1 months for erlotinib alone. When individually compared to the erlotinib arm, HR for OS was 0.51 (p=0.011), corresponding to a 49% reduction in the rate of death for the combination of cabozantinib plus erlotinib, and 0.68 (p=0.071), corresponding to a 32% reduction in the rate of death for the cabozantinib monotherapy arm. ORR, another secondary endpoint, was 3% for the combination arm (1 PR), 11% (4 PRs) for the cabozantinib monotherapy arm, and 3% (1 PR) for the erlotinib arm. SD as a best response was observed in 46% of patients in the combination arm and 50% in the cabozantinib monotherapy arm, compared with 16% in the erlotinib arm. One hundred and nineteen patients were evaluable for safety. The most common treatment-related adverse events, or AEs, grade 3 or higher, for the combination arm (n=39) were: diarrhea (28%), fatigue (15%), and anorexia (8%). For the cabozantinib monotherapy arm, the most common AEs, grade 3 or higher, were: hypertension (25%), fatigue (15%), mucositis (10%), diarrhea (8%), and thromboembolic events (8%). The most common AEs, grade 3 or higher, for the erlotinib arm were fatigue (13%) and diarrhea (8%). Overall, the rate of grade 3 or higher adverse events was 72% in the combination arm, 70% in the cabozantinib monotherapy arm, and 33% in the erlotinib arm.
Informed by these clinical results, we are working with clinical collaborators to explore cabozantinib’s further development in NSCLC, including potential combination approaches with immuno-oncology agents.
Other Cancer Indications
Other clinical trials approved to date under the CRADA include the following:
|
•
|
Phase 2 or phase 1/2 clinical trials to help prioritize future pivotal trials of cabozantinib in disease settings where there is substantial unmet medical need and in which cabozantinib has previously demonstrated clinical activity, consisting of randomized phase 2 clinical trials in ocular melanoma, prostate cancer and second/third line EGFR-wt NSCLC;
|
|
•
|
Additional phase 2 or phase 1/2 clinical trials to explore cabozantinib’s potential utility in other tumor types, including endometrial cancer, bladder cancer, sarcomas, NSCLC (EGFR-activating mutation positive), differentiated thyroid cancer, triple-negative breast cancer, hormone-receptor-positive breast cancer, cutaneous melanoma (molecularly selected patients), pancreatic neuroendocrine and carcinoid tumors. Positive results in these indications could lead to further study in randomized phase 2 or phase 3 clinical trials; and
|
|
•
|
Additional phase 1 clinical trials to further evaluate cabozantinib, consisting of a combination trial of cabozantinib and immuno-oncology agents (nivolumab with or without ipilumumab) in genitourinary tumors,
|
11
a trial to evaluate the safety and pharmacokinetics of cabozantinib in pediatric patients, and a trial of cabozantinib in patients with advanced solid tumors and human immunodeficiency virus.
In addition to supporting the further development of cabozantinib, our medical affairs department receives and responds to unsolicited physician inquiries with appropriate scientific and medical information, supports scientific presentations and publications, and oversees the IST process. Like our CRADA with NCI-CTEP, our IST program helps us to continue to evaluate cabozantinib across a broad range of tumor types, including NSCLC, bladder cancer, melanoma, breast cancer, differentiated thyroid cancer and others, to support further prioritization of our clinical and commercial options. Currently there are 25 active IST or CTEP trials and 16 trials are in advanced planning stage.
Cobimetinib Development Program
In addition to the advances made under our cabozantinib development program, significant progress continues to be made with respect to the clinical development, regulatory status and commercial potential of cobimetinib. Cobimetinib is a potent, highly selective inhibitor of MEK, a kinase that is a component of the RAS/RAF/MEK/ERK pathway. This pathway mediates signaling downstream of growth factor receptors, and is prominently activated in a wide variety of human tumors. Cobimetinib is being evaluated in a broad development program by Genentech.
A select summary of Genentech’s ongoing cobimetinib development activities, all of which are sponsored by Roche/Genentech, is provided below:
|
Indication
|
Combination Regimen
|
Status Update
|
|
Metastatic or Unresectable Locally Advanced Melanoma
|
||
|
BRAF mutation-positive
|
+ vemurafenib
|
Approved in US, EU and other territories
|
|
First-line BRAF mutation-positive
|
+ atezolizumab + vemurafenib
|
Phase 3 (IMspire150 TRILOGY)
|
|
First-line BRAF wild-type
|
+ atezolizumab
|
Phase 3 (IMspire170) planned for 2017
|
|
Colorectal Cancer
|
||
|
Third-line advanced or metastatic disease
|
+ atezolizumab
|
Phase 3 (IMblaze370)
|
|
Second/third-line metastatic disease
|
+ atezolizumab + bevacizumab
|
Phase 1
|
|
Breast Cancer
|
||
|
First-line metastatic triple negative disease
|
+ taxane +/- atezolizumab
|
Phase 1/2
(COLET)
|
Melanoma - coBRIM
In July 2014, we announced positive top-line results from coBRIM, the phase 3 pivotal trial conducted by Genentech evaluating cobimetinib in combination with vemurafenib in previously untreated patients with unresectable locally advanced or metastatic melanoma harboring a BRAF V600E or V600K mutation. Data were subsequently presented at European Society for Medical Oncology in September 2014. The trial met its primary endpoint of demonstrating a statistically significant increase in investigator-determined PFS. The median PFS was 9.9 months for the combination of cobimetinib and vemurafenib versus 6.2 months for vemurafenib alone (HR=0.51, 95 percent CI 0.39-0.68; p<0.0001), demonstrating the combination reduced the risk of the disease worsening by half (49 percent). The median PFS as established by an IRRC, a secondary endpoint, was 11.3 months for the combination arm compared to 6.0 months for the control arm (HR=0.60, 95 percent CI 0.45-0.79; p=0.0003). ORR, another secondary endpoint, was 68% for the combination versus 45% for vemurafenib alone (p<0.0001). Updated results for PFS and ORR from coBRIM were presented at the ASCO 2015 Annual Meeting and showed a median PFS of 12.3 months for vemurafenib plus cobimetinib versus 7.2 months for vemurafenib alone (HR=0.58, 95 percent CI 0.46-0.72) and an ORR of 70% for the combination of vemurafenib and cobimetinib versus 50% for vemurafenib alone. In November 2015, we announced that the coBRIM trial also met its OS secondary endpoint, demonstrating a statistically significant increase in OS for the combination of cobimetinib and vemurafenib compared to vemurafenib monotherapy. The median OS was 22.3 months for the combination of cobimetinib and vemurafenib versus 17.4 months for vemurafenib alone, corresponding to a 30% reduction in the rate of death for the combination as compared to vemurafenib alone (HR=0.70, 95 percent CI 0.55-0.90, p= 0.005). The safety profile of the
12
combination was consistent with that observed in a previous study. The most common adverse drug reactions for COTELLIC occurring in at least 20% of patients were diarrhea, photosensitivity reaction, nausea, pyrexia, and vomiting.
CoBRIM served as the basis for the regulatory approval of Cotellic in combination with Zelboraf as a treatment for patients with BRAF V600E or V600K mutation-positive advanced melanoma in the United States, Switzerland, the European Union, Canada, Australia, Brazil and other countries.
CRC - IMblaze370
In June 2016, Genentech initiated IMblaze370, a phase 3 pivotal trial evaluating the combination of cobimetinib and atezolizumab, an anti-PD-L1 antibody, or atezolizumab alone versus regorafenib, in unresectable locally advanced or metastatic CRC patients who have received at least two lines of prior cytotoxic chemotherapy. IMblaze370 was informed by results from Genentech’s ongoing phase 1b trial of the same combination in advanced CRC.
The trial is designed to enroll 360 patients who have received at least two prior chemotherapies in the metastatic disease setting. The primary endpoint of the trial is OS.
Melanoma - IMspire150
TRILOGY and IMspire170
In January 2017, Genentech initiated IMspire150
TRILOGY, a phase 3 pivotal trial evaluating the combination of cobimetinib, vemurafenib and atezolizumab vs. cobimetinib plus vemurafenib in previously untreated BRAF V600 mutation positive patients with metastatic or unresectable locally advanced melanoma. This trial was based on the results of Genentech’s ongoing phase 1b trial in the same patient population. The trial is designed to enroll 500 patients, and the primary endpoint is PFS.
Genentech has also plans to initiate IMspire170, a phase 3 trial comparing cobimetinib plus atezolizumab to pembrolizumab in previously untreated BRAF WT patients with metastatic or unresectable locally advanced melanoma in the second quarter of 2017. IMspire170 was based on the results of Genentech’s ongoing phase 1b trial in the same patient population. The trial is designed to enroll 500 patients with primary endpoints of PFS and OS.
Other Cancer Indications
In addition to coBRIM, IMblaze370 and TRILOGY, additional clinical trials are ongoing studying the combination of cobimetinib with a variety of agents in multiple tumor types. These include:
|
•
|
The combination of cobimetinib and vemuarfenib in additional melanoma patient populations and settings;
|
|
•
|
A phase 2 trial of cobimetinib in combination with taxanes, with or without atezolizumab in first line triple negative breast cancer (COLET);
|
|
•
|
Phase 1 studies of cobimetinib in combination with atezolizumab in melanoma and NSCLC, in combination with vemurafenib and atezolizumab in melanoma, and in combination with venetoclax in relapsed or refractory acute myeloid leukemia; and
|
|
•
|
A phase 1b study evaluating the safety, tolerability and pharmacokinetics of cobimetinib in combination with atezolizumab and bevacizumab in patients with metastatic CRC.
|
A complete listing of all ongoing cobimetinib trials can be found at
www.ClinicalTrials.gov
.
XL888
XL888 is an Exelixis-discovered highly potent small molecule oral inhibitor of Heat Shock Protein 90 (HSP90), a molecular chaperone protein that affects the activity and stability of a range of key regulatory proteins, including kinases such as BRAF, MET and VEGFR2, which are implicated in cancer cell proliferation and survival. After completing phase 1 testing of the compound, we deprioritized XL888 and our other pipeline assets to focus our limited resources on our lead compound, cabozantinib. Investigators at the H. Lee Moffitt Cancer Center went on to conduct additional preclinical work showing activity of XL888 in vemurafenib-resistant melanoma models, the results of which provided the rationale for the initiation of an investigator-sponsored phase 1 trial conducted by investigators at the Moffitt Cancer Center.
In November 2014, we announced positive preliminary results from this phase 1 trial, which evaluated the safety and activity of XL888 in combination with vemurafenib in patients with unresectable stage III/IV BRAF V600 mutation-
13
positive melanoma. The primary endpoint of the trial was to determine the safety and tolerability of the combination, including determination of a maximum tolerated dose, or MTD, for XL888. Secondary endpoints included ORR (RECIST-1 criteria), estimates of PFS and OS, and analysis of pharmacodynamic biomarkers. The trial had enrolled fifteen subjects, and at the time of data cut-off, objective tumor regression was observed in 11 of 12 response-evaluable patients (two CRs and nine PRs), for an ORR of 92%. Safety data for the combination identified tolerable dose levels of XL888 with full dose vemurafenib.
Based on these results, as well as findings from coBRIM, the phase 3 pivotal trial of cobimetinib, an Exelixis-discovered MEK inhibitor, and vemurafenib in previously untreated metastatic melanoma patients with a BRAF V600E or V600K mutation, investigators at the Moffitt Cancer Center initiated a phase 1b IST of the triple combination of vemurafenib, cobimetinib, and XL888 in a similar patient population during the second quarter of 2016.
Collaborations
We have established collaborations with Ipsen and Takeda for cabozantinib, Genentech for cobimetinib, and other collaborations with leading pharmaceutical companies including, Daiichi Sankyo Company Limited, or Daiichi Sankyo, Merck (known as MSD outside of the United States and Canada), BMS, and Sanofi for compounds and programs in our portfolio. Under each of our collaborations, we are entitled to receive milestones and royalties or, in the case of cobimetinib, a share of profits (or losses) from commercialization.
Cabozantinib Collaborations
Ipsen Collaboration
In February 2016, we entered into a collaboration and license agreement with Ipsen for the commercialization and further development of cabozantinib. Pursuant to the terms of the collaboration agreement, Ipsen received exclusive commercialization rights for current and potential future cabozantinib indications outside of the United States, Canada and Japan. The collaboration agreement was subsequently amended in December 2016 to include commercialization rights in Canada. We have also agreed to collaborate with Ipsen on the development of cabozantinib for current and potential future indications. The parties’ efforts are governed through a joint steering committee and appropriate subcommittees established to guide and oversee the collaboration’s operation and strategic direction; provided, however, that we retain final decision-making authority with respect to cabozantinib’s ongoing development.
In consideration for the exclusive license and other rights contained in the collaboration agreement, Ipsen paid us an upfront payment of
$200.0 million
in March 2016. Additionally, as a result of the amendment to the collaboration agreement, we received a
$10.0 million
upfront payment from Ipsen in December 2016. As a result of the approval of cabozantinib in second-line RCC by the EC in September 2016, we received a
$60.0 million
milestone payment in November 2016. We are also eligible to receive additional development and regulatory milestone payments, totaling up to
$254.0 million
, including, milestone payments of
$10.0 million
and
$40.0 million
upon the filing and the approval of cabozantinib in second-line HCC with the European Medicines Agency, or EMA, and additional milestone payments for other future indications and/or jurisdictions. In the fourth quarter of 2016 we earned two
$10.0 million
milestone payments for the first commercial sales of CABOMETYX in Germany and the United Kingdom. The collaboration agreement also provides that we will be eligible to receive contingent payments of up to
$544.7 million
associated with the achievement of specified levels of Ipsen sales to end users. We will also receive royalties on net sales of cabozantinib outside of the United States and Japan. We will receive a
2%
royalty on the initial
$50.0 million
of net sales, and a
12%
royalty on the next
$100.0 million
of net sales. After the initial
$150.0 million
of sales, we will receive a tiered royalty of
22%
to
26%
on annual net sales; these tiers will reset each calendar year. We are primarily responsible for funding cabozantinib related development costs for existing trials; global development costs for potential future trials are shared between the parties, provided Ipsen opts in to participate in such trials, with Ipsen to reimburse us for
35%
of such costs. Ipsen has opted to participate in and co-fund in accordance with our collaboration agreement the future first line RCC phase 3 study evaluating cabozantinib in combination with the immune checkpoint inhibitors nivolumab and ipilimumab that we are planning in collaboration with BMS, as well as the phase 1b trial evaluating cabozantinib in combination with atezolizumab in genitorurinary malignancies that we are planning to initiate mid-year. We remain responsible for the manufacture and supply of cabozantinib for all development and commercialization activities under the collaboration agreement. As part of the collaboration agreement, we entered into a supply agreement that provides that through the end of the second quarter of 2018, we will supply finished, labeled product to Ipsen for distribution in the territories outside of the United States and Japan. From the end of the second quarter of 2018 forward, we will continue to manufacture cabozantinib tablets and capsules while Ipsen will be responsible for packaging and labeling the products in territories where they have been approved outside of the United States and Japan, as applicable.
14
Unless terminated earlier, the collaboration agreement has a term that continues, on a product-by-product and country-by-country basis, until the latter of (i) the expiration of patent claims related to cabozantinib, (ii) the expiration of regulatory exclusivity covering cabozantinib or (iii) ten years after the first commercial sale of cabozantinib, other than COMETRIQ. The collaboration agreement may be terminated for cause by either party based on uncured material breach by the other party, bankruptcy of the other party or for safety reasons. We may terminate the collaboration agreement if Ipsen challenges or opposes any patent covered by the collaboration agreement. Ipsen may terminate the collaboration agreement if the FDA or EMA orders or requires substantially all cabozantinib clinical trials to be terminated or if the EMA refuses to approve our marketing authorization application, or MAA, for cabozantinib in advanced RCC in such region. Ipsen also has the right to terminate the collaboration agreement on a region-by-region basis after the first commercial sale of cabozantinib in advanced RCC in the given region. Upon termination by either party, all licenses granted by us to Ipsen will automatically terminate, and, except in the event of a termination by Ipsen for our material breach, the licenses granted by Ipsen to us shall survive such termination and shall automatically become worldwide, or, if Ipsen terminated only for a particular region, then for the terminated region. Following termination by us for Ipsen’s material breach, or termination by Ipsen without cause or because we undergo a change of control by a party engaged in a competing program, Ipsen is prohibited from competing with us for a period of time.
Takeda Collaboration
In January 2017, we entered into a collaboration and license agreement with Takeda for the commercialization and further clinical development of cabozantinib in Japan. Pursuant to the terms of the collaboration agreement, Takeda has exclusive commercialization rights for currently developed and potential future cabozantinib indications in Japan. The parties have also agreed to collaborate on the future clinical development of cabozantinib in Japan. The parties’ efforts are governed through a joint executive committee and appropriate subcommittees established to guide and oversee the collaboration’s operation and strategic direction.
In consideration for the exclusive license and other rights contained in the collaboration agreement, we received a $50.0 million upfront payment from Takeda in February 2017. We are eligible to receive development, regulatory and first-sales milestone payments of up to $95.0 million related to second-line RCC, first-line RCC and second-line HCC, as well as additional development, regulatory and first-sales milestones payments for potential future indications. The collaboration agreement also provides that we are eligible to receive pre-specified payments of up to $83.0 million associated with potential sales milestones. We will also receive royalties on net sales of cabozantinib in Japan at an initial tiered rate of 15% to 24% on net sales for the first $300.0 million of cumulative net sales. Thereafter, the royalty rate will be adjusted to 20% to 30% on annual net sales.
Takeda is responsible for 20% of the costs associated with the global cabozantinib development plan, provided Takeda opts in to participate in such trials, and 100% of costs associated with the cabozantinib development activities that are exclusively for the benefit of Japan. Pursuant to the terms of the collaboration agreement, we remain responsible for the manufacture and supply of cabozantinib for all development and commercialization activities under the collaboration. As part of the collaboration, the parties intend to enter into a supply agreement covering the manufacture and supply of cabozantinib to Takeda and a quality agreement setting forth in detail the quality assurance arrangements and procedures for our manufacture of cabozantinib.
Unless earlier terminated, the collaboration agreement has a term that continues, on a product-by-product basis, until the earlier of (i) two years after first generic entry with respect to such product in Japan or (ii) the later of (A) the expiration of patent claims related to cabozantinib and (B) the expiration of regulatory exclusivity covering cabozantinib in Japan. The collaboration agreement may be terminated for cause by either party based on uncured material breach by the other party, bankruptcy of the other party or for safety reasons. For clarity, Takeda’s failure to achieve specified levels of commercial performance, based upon sales volume and/or promotional effort, during the first six years of the collaboration shall constitute a material breach of the collaboration agreement. We may terminate the agreement if Takeda challenges or opposes any patent covered by the collaboration agreement. At any time prior to August 1, 2023, the parties may mutually agree to terminate the collaboration agreement if Japan’s Pharmaceuticals and Medical Devices Agency is unlikely to grant approval of the MAA in any cancer indication in Japan. After the commercial launch of cabozantinib in Japan, Takeda may terminate the collaboration agreement upon twelve months’ prior written notice following the third anniversary of the first commercial sale of cabozantinib in Japan. Upon termination by either party, all licenses granted by us to Takeda will automatically terminate, and the licenses granted by Takeda to us shall survive such termination and shall automatically become worldwide.
15
Cobimetinib Collaboration
In December 2006, we out-licensed the development and commercialization of cobimetinib to Genentech pursuant to a worldwide collaboration agreement. Genentech paid upfront and milestone payments of $25.0 million in December 2006 and $15.0 million in January 2007 upon signing of the collaboration agreement and with the submission of the IND application for cobimetinib. Under the terms of the collaboration agreement, we were responsible for developing cobimetinib through the determination of the maximum-tolerated dose, or MTD in a phase 1 clinical trial, and Genentech had the option to co-develop cobimetinib, which Genentech could exercise after receipt of certain phase 1 data from us. In March 2008, Genentech exercised its option to co-develop cobimetinib, triggering a payment to us of $3.0 million. In March 2009, we granted to Genentech an exclusive worldwide revenue-bearing license to cobimetinib, at which point Genentech became responsible for completing the phase 1 clinical trial and subsequent clinical development. We received an additional $7.0 million payment in March 2010 and are not eligible for any additional milestone payments.
Under the terms of our collaboration agreement with Genentech for cobimetinib, we are entitled to a share of U.S. profits and losses received in connection with commercialization of cobimetinib. The profit share has multiple tiers: we are entitled to
50%
of profits and losses from the first
$200.0 million
of U.S. actual sales, decreasing to
30%
of profits and losses from U.S. actual sales in excess of
$400.0 million
. In addition, we are entitled to low double-digit royalties on ex-U.S. net sales. In November 2013, we exercised an option under the collaboration agreement to co-promote in the U.S. The FDA approved cobimetinib in the U.S. under the brand name Cotellic on November 10, 2015. Cotellic is indicated in combination with Zelboraf as a treatment for patients with BRAF V600E or V600K mutation-positive advanced melanoma. Following FDA approval of Cotellic in November 2015, we began fielding
25%
of that product sales force. Cotellic in combination with Zelboraf has also been approved in Switzerland, the European Union, Canada, Australia, Brazil and multiple additional countries for use in the same indication.
We believe that cobimetinib has the potential to provide us with a second significant source of revenue. Our objective, therefore, is and has been to work with Genentech on the execution of the U.S. Cotellic commercial plan in order to maximize the product’s revenue potential. However, we believe Genentech’s pricing of, and cost and revenue allocations for, Cotellic, as determined exclusively by Genentech, have been contrary to the applicable terms of the collaboration agreement. We raised this concern with Genentech, along with other material concerns regarding Genentech’s performance under the collaboration agreement, but were unable to come to resolution on any of these issues. Accordingly, on June 3, 2016, following a 30 day dispute resolution period, we filed a demand for arbitration asserting claims against Genentech related to its clinical development, pricing and commercialization of Cotellic, and cost and revenue allocations in connection with Cotellic’s commercialization in the United States. On July 13, 2016, Genentech asserted a counterclaim for breach of contract seeking monetary damages and interest related to the cost allocations under the collaboration agreement. On December 29, 2016, Genentech withdrew its counterclaim against us and stated that it would unilaterally change its approach to allocation of promotional expenses arising from commercialization of the Cotellic plus Zelboraf combination therapy, both retrospectively and prospectively. We believe this revised allocation approach substantially reduced our exposure to costs associated with promotion of the Cotellic plus Zelboraf combination in the United States. Notwithstanding Genentech’s change of approach, other significant issues remain in dispute between the parties. Genentech’s action does not address the claims in our demand for arbitration related to Genentech’s clinical development of cobimetinib, or pricing and promotional costs for Cotellic in the United States, nor does it fully resolve claims over revenue allocation. And, Genentech has not clarified how it intends to allocate promotional costs incurred with respect to the promotion of other combination therapies that include cobimetinib for other indications that will be developed or are in development and may be approved. As a result, we will continue to press our position for the arbitral panel to obtain a just resolution of these claims. The ultimate outcome of the arbitration is difficult to predict.
Unless earlier terminated, the collaboration agreement has a term that continues until the expiration of the last payment obligation with respect to the licensed products under the collaboration. Genentech has the right to terminate the collaboration agreement without cause at any time. If Genentech terminates the collaboration agreement without cause, all licenses that were granted to Genentech under the agreement terminate and revert to us. Additionally, if Genentech terminates the collaboration agreement without cause, or we terminate the collaboration agreement for cause, we would receive, subject to certain conditions, licenses from Genentech to research, develop and commercialize reverted product candidates. The collaboration agreement may be terminated for cause by either party based on uncured material breach by the other party.
Other Collaborations
Prior to the commercialization of our first product, COMETRIQ, our primary business strategy was focused on the development and out-license of compounds to pharmaceutical and biotechnology companies under collaboration agreements
16
that allowed us to retain economic participation in compounds and support additional development of our proprietary products. Our collaboration agreements with Daiichi Sankyo, Merck, BMS and Sanofi are representative of this historical strategy. We have since evolved and are now a fully-integrated biopharmaceutical company focused on maximizing the clinical and commercial potential of CABOMETYX, COMETRIQ and Cotellic. While our historical collaboration agreements described below have the potential to provide meaningful future revenue in the aggregate, we do not expect to receive substantial revenues from these historical collaboration agreements unless and until our partnered compounds enter late-stage clinical development and/or receive marketing approval from the FDA, if ever, when the milestone payments, royalties or other rights and benefits under our historical collaboration agreements become more substantial and material to our business.
With respect to our partnered compounds, other than cabozantinib and cobimetinib, we are eligible to receive potential contingent payments totaling approximately
$2.2 billion
in the aggregate on a non-risk adjusted basis, of which
9%
are related to clinical development milestones,
42%
are related to regulatory milestones and
49%
are related to commercial milestones, all to be achieved by the various collaborators, which may not be paid, if at all, until certain conditions are met. Since we do not control the research, development or commercialization of any of our other partnered compounds that would generate these milestones, we are not able to reasonably estimate when, if at all, any milestone payments or royalties may be payable by our collaborators. In addition, most of the collaborations for our other partnered compounds are at early stages of development. Successfully developing a product candidate, obtaining regulatory approval and ultimately commercializing it is a significantly lengthy and highly uncertain process which entails a significant risk of failure. In addition, business combinations, changes in a collaborator’s business strategy and financial difficulties or other factors could result in a collaborator abandoning or delaying development of a partnered compound. As such, the remaining potential contingent payments associated with our historical collaboration agreements involve a substantial degree of risk to achieve and may never be received. Accordingly, we do not expect, and investors should not assume, that we will receive all of the potential contingent payments described above and it is possible that we may never receive any additional significant milestone or other payments under these historical collaboration agreements.
Daiichi Sankyo
In March 2006, we entered into a collaboration agreement with Daiichi Sankyo for the discovery, development and commercialization of novel therapies targeted against the mineralocorticoid receptor, or MR, a nuclear hormone receptor implicated in a variety of cardiovascular and metabolic diseases. Under the terms of the agreement, we granted to Daiichi Sankyo an exclusive, worldwide license to certain intellectual property primarily relating to compounds that modulate MR, including CS-3150/esaxerenone (a specific rotational isomer of XL550). Daiichi Sankyo is responsible for all further preclinical and clinical development, regulatory, manufacturing and commercialization activities for the compounds and we do not have rights to reacquire such compounds, except as described below.
During the research term, which concluded in November 2007, we jointly identified drug candidates with Daiichi Sankyo for further development. For each product from the collaboration, we are entitled to receive payments upon attainment of pre-specified development, regulatory and commercialization milestones. To date, we have received an aggregate of $25.5 million in development milestone payments related to CS-3150, an oral, non-steroidal, selective mineralocorticoid receptor antagonist, including a $15.0 million milestone payment in October 2016 in connection with the initiation of a phase 3 pivotal trial to evaluate CS-3150 as a treatment for essential hypertension in Japanese patients. We are eligible to receive additional development, regulatory and commercialization milestone payments of up to
$130.0 million
. In addition, we are also entitled to receive royalties on any sales of certain products commercialized under the collaboration. Daiichi Sankyo may terminate the agreement upon ninety days’ written notice in which case Daiichi Sankyo’s payment obligations would cease, its license relating to compounds that modulate MR would terminate and revert to us and we would receive, subject to certain terms and conditions, licenses from Daiichi Sankyo to research, develop and commercialize compounds that were discovered under the collaboration.
Merck
In December 2011, we entered into an agreement with Merck pursuant to which we granted Merck an exclusive worldwide license to our phosphoinositide-3 kinase-delta, or PI3K-d, program, including XL499 and other related compounds. Pursuant to the terms of the agreement, Merck has sole responsibility to research, develop, and commercialize compounds from our PI3K-d program. In July 2015 we received a $3.0 million milestone payment from Merck in connection with Merck’s selection of a compound from our PI3K-d program to advance into clinical trials and in April 2016, we received a milestone payment of $5.0 million in connection with the initiation of a phase 1 clinical trial for the compound. We will be eligible to receive additional payments associated with the successful achievement of potential development and regulatory
17
milestones for multiple indications of up to
$231.0 million
. We will also be eligible to receive payments for combined sales performance milestones of up to
$375.0 million
and royalties on net-sales of products emerging from the agreement.
Merck may at any time, upon specified prior notice to us, terminate the license. In addition, either party may terminate the agreement for the other party’s uncured material breach. In the event of termination by Merck at will or by us for Merck’s uncured material breach, the license granted to Merck would terminate. In the event of a termination by us for Merck’s uncured material breach, we would receive a royalty-free license from Merck to develop and commercialize certain joint products. In the event of termination by Merck for our uncured material breach, Merck would retain the licenses from us, and we would receive reduced royalties from Merck on commercial sales of products.
Bristol-Myers Squibb - ROR Collaboration Agreement
In October 2010, we entered into a worldwide collaboration with BMS pursuant to which each party granted to the other certain intellectual property licenses to enable the parties to discover, optimize and characterize ROR antagonists that may subsequently be developed and commercialized by BMS. Under the terms of the collaboration agreement, we were responsible for activities related to the discovery, optimization and characterization of the ROR antagonists during the collaborative research period which began on October 8, 2010 and ended on July 8, 2013. Since the end of the collaborative research period, BMS has and will continue to have sole responsibility for any further research, development, manufacture and commercialization of products developed under the collaboration and will bear all costs and expenses associated with those activities.
For each product developed by BMS under the collaboration, we will be eligible to receive payments upon the achievement by BMS of development and regulatory milestones. In February 2017, we received a $2.5 million development milestone payment in connection with the achievement of certain preclinical milestones set forth in the collaboration agreement. We are eligible for additional development and regulatory milestone payment of up to $250.0 million in the aggregate and commercialization milestones of up to $150.0 million in the aggregate, as well as royalties on commercial sales of any such products.
The collaboration agreement was amended and restated in April 2011 in connection with an assignment of patents to a wholly-owned subsidiary. BMS may, at any time, terminate the collaboration agreement upon certain prior notice to us on a product-by-product and country-by-country basis. In addition, either party may terminate the agreement for the other party’s uncured material breach. In the event of termination by BMS at will or by us for BMS’s uncured material breach, the license granted to BMS would terminate, the right to such product would revert to us and we would receive a royalty-bearing license for late-stage reverted compounds and a royalty-free license for early-stage reverted compounds from BMS to develop and commercialize such product in the related country. In the event of termination by BMS for our uncured material breach, BMS would retain the right to such product, subject to continued payment of milestones and royalties.
Bristol-Myers Squibb - LXR Collaboration
In December 2005, we entered into a collaboration agreement with BMS for the discovery, development and commercialization of novel therapies targeted against LXR, a nuclear hormone receptor implicated in a variety of cardiovascular and metabolic disorders. The collaboration agreement became effective in January 2006, at which time we granted BMS an exclusive worldwide license with respect to certain intellectual property primarily relating to compounds that modulate LXR, including BMS-852927 (XL041). During the research term, we jointly identified drug candidates with BMS that were ready for IND-enabling studies. After the selection of a drug candidate for further clinical development by BMS, BMS agreed to be solely responsible for further preclinical development as well as clinical development, regulatory, manufacturing and sales/marketing activities for the selected drug candidate. We do not have rights to reacquire the drug candidates selected by BMS. The research term expired in January 2010 and we transferred the technology to BMS in 2011 to enable it to continue the LXR program. BMS has terminated development of XL041 and we have been advised that BMS is continuing additional preclinical research on the program. The collaboration agreement was amended and restated in April 2011 in connection with an assignment of patents to a wholly-owned subsidiary.
Under the collaboration agreement, BMS is required to pay us contingent amounts associated with development and regulatory milestones of up to
$53.0 million
per product for up to two products from the collaboration. In addition, we are also entitled to receive payments associated with sales milestones of up to
$310.0 million
and royalties on sales of any products commercialized under the collaboration.
18
Sanofi
In May 2009, we entered into a global license agreement with Sanofi for SAR245408 (XL147) and SAR245409 (XL765), leading inhibitors of phosphoinositide-3 kinase, or PI3K, and a broad collaboration for the discovery of inhibitors of PI3K for the treatment of cancer. The license agreement and collaboration agreement became effective on July 7, 2009. Under the license agreement, Sanofi received a worldwide exclusive license to SAR245408 (XL147) and SAR245409 (XL765), which entered into a series of phase 1, phase 1b/2 or phase 2 clinical trials, and has sole responsibility, including funding, for all subsequent clinical, regulatory, commercial and manufacturing activities. We were notified by Sanofi that the initial clinical trials involving XL147 or XL765 have been terminated or are in the process of concluding, and that Sanofi is still considering whether to initiate any further trials. We will be eligible to receive contingent payments associated with development, regulatory and commercial milestones under the license agreement of $745.0 million in the aggregate, as well as royalties on sales of any products commercialized under the license. Sanofi may, upon certain prior notice to us, terminate the license as to products containing SAR245408 (XL147) and SAR245409 (XL765). In the event of such termination election, Sanofi’s license relating to such product would terminate and revert to us, and we would receive, subject to certain terms, conditions and potential payment obligations, licenses from Sanofi to research, develop and commercialize such products.
In December 2011, we entered into an agreement with Sanofi pursuant to which the parties terminated the discovery collaboration agreement and released each other from any potential liabilities arising under the collaboration agreement prior to effectiveness of the termination in December 2011. Each party retains ownership of the intellectual property that it generated under the collaboration agreement, and we granted Sanofi covenants not-to-enforce with respect to certain of our intellectual property rights. If either party or its affiliate or licensee develops and commercializes a therapeutic product containing an isoform-selective PI3K inhibitor that arose from such party’s work (or was derived from such work) under the collaboration agreement, then such party will be obligated to pay royalties to the other party based upon the net sales of such products. The termination agreement provides that Sanofi will make a one-time payment to us upon the first receipt by Sanofi or its affiliate or licensee of marketing approval for the first therapeutic product containing an isoform-selective PI3K inhibitor that arose from Sanofi’s work (or was derived from such work) under the collaboration agreement.
Manufacturing and Product Supply
We do not own or operate manufacturing or distribution facilities or resources for clinical or commercial production and distribution of CABOMETYX and COMETRIQ. Instead, we have multiple contractual agreements in place with third party contract manufacturing organizations, or CMOs, who, on our behalf, manufacture clinical and commercial supplies of CABOMETYX and COMETRIQ, and will continue to do so for the foreseeable future. We have selected well-established and reputable global CMOs for our drug substance and drug product manufacturing that have good regulatory standing, large manufacturing capacities, and multiple manufacturing sites within their business footprint. We also have contracted with a third party logistics provider, with two distribution locations, to provide shipping and warehousing services for our commercial supply of both CABOMETYX and COMETRIQ in the United States. We employ highly skilled personnel with both technical and manufacturing experience to diligently manage the activities at our CMOs. Our quality department audits these suppliers on a periodic basis. Our commercial suppliers are subject to routine inspections by regulatory agencies. We work closely with our third party manufacturers to ensure compliance with current good manufacturing practices, or cGMP, and other stringent regulatory requirements enforced by the FDA or foreign regulatory agencies in other territories, as applicable.
We source raw materials that are used to manufacture our drug substance from multiple third-party suppliers in Asia and Europe. We stock sufficient quantities of these materials and provide them to our third party drug substance contract manufacturers to ensure they can manufacture adequate drug substance quantities per our requirements, for both clinical and commercial purposes. We store drug substance at third party facilities, and provide appropriate amounts to our third party drug product contract manufacturers who then manufacture, package and label our specified quantities of finished goods for COMETRIQ and CABOMETYX, respectively. Our third-party contract manufacturers also need to obtain materials such as excipients, components and reagents to manufacture our drug substance and finished drug products.
Within our supply chain, we have established safety stock amounts for both our drug substance and drug products, and store these quantities in multiple locations. The quantities that we store are based on our business needs and take into account scenarios for market demand, production lead times, potential supply interruptions and shelf life for our drug substance and drug products. In parallel, for business continuity reasons, we are in the process of evaluating and expect to establish additional suppliers for our drug substance and drug product manufacturers in the near future. We believe that our current manufacturing network has the appropriate capacity to produce sufficient commercial quantities of CABOMETYX to
19
support the current approved indication of advanced RCC, as well as potential indications of first-line RCC and second line HCC, if those indications prove to be successful and gain regulatory approval in the future.
Marketing, Sales and Distribution
We have a fully integrated commercial team consisting of sales, marketing, market access, and commercial operations functions. Our sales team promotes CABOMETYX and COMETRIQ in the United States, and we co-promote Cotellic in association with Genentech. We use customary pharmaceutical company practices to market our products and concentrate our efforts on oncologists, oncology nurses and pharmacists. While we have expanded our U.S. distribution and pharmacy channels in connection with the approval of CABOMETYX by the FDA, we still rely on a relatively limited distribution network to dispense COMETRIQ in fulfillment of prescriptions in the United States. Furthermore, we rely on Ipsen and Takeda for the commercialization and distribution of CABOMETYX and COMETRIQ in territories outside of the United States, as well as for access and distribution activities for the approved products under our named patient use, or NPU, program. We also rely on Genentech, as our collaboration partner for Cotellic, for all commercialization and marketing activities, with the exception of the limited co-promotion activities highlighted above.
To help ensure that all eligible patients in the United States have appropriate access to CABOMETYX and COMETRIQ, we have established a comprehensive reimbursement and support program called Exelixis Access Services, or EASE. Through EASE, we provide co-pay assistance to qualified, commercially insured patients to help minimize out-of-pocket costs and provide free drug to uninsured or under-insured patients who meet certain clinical and financial criteria. In addition, EASE is designed to provide comprehensive reimbursement support services, such as prior authorization support, benefits investigation and, if needed, appeals support.
Seasonal Operations and Backlog
Sales of our marketed products do not reflect any significant degree of seasonality.
The markets in which we operate are characterized by short lead times and the absence of significant backlogs. We do not believe that backlog information is material to our business as a whole.
Environment, Health and Safety
In support of the development and expansion of our product pipeline, we have resumed discovery activities. Our research and development processes involve the controlled use of certain hazardous materials and chemicals. We are subject to federal, state and local environmental, health and workplace safety laws and regulations governing the use, manufacture, storage, handling and disposal of hazardous materials and waste products. While we have incurred, and may continue to incur, expenditures to ensure we are in compliance with these laws and regulations, we do not expect the cost of complying with these laws and regulations to be material.
Government Regulation
The FDA and comparable regulatory agencies in state and local jurisdictions and in foreign countries impose substantial requirements upon the clinical development, manufacture and marketing of pharmaceutical products. These agencies and other federal, state and local entities regulate, among other things, research and development activities and the testing, manufacture, quality control, safety, effectiveness, labeling, storage, distribution, export, import, record keeping, approval, advertising and promotion of our products.
20
The process required by the FDA before product candidates may be marketed in the United States generally involves the following:
|
•
|
preclinical laboratory and animal tests that must be conducted in accordance with Good Laboratory Practices;
|
|
•
|
submission of an IND, which must become effective before clinical trials may begin;
|
|
•
|
adequate and well-controlled human clinical trials to establish the safety and efficacy of the proposed drug candidate for its intended use;
|
|
•
|
submission of a New Drug Application, or NDA, to FDA for commercial marketing, or of a sNDA, for approval of a new indication if the product is already approved for another indication;
|
|
•
|
pre-approval inspection of manufacturing facilities and selected clinical investigators for their compliance with Good Manufacturing Practices, or GMP, and Good Clinical Practices, or GCP;
|
|
•
|
if FDA convenes an advisory committee, satisfactory completion of the advisory committee review; and
|
|
•
|
FDA approval of the NDA or sNDA.
|
The testing and approval process requires substantial time, effort and financial resources. Prior to commencing the first clinical trial with a product candidate, we must submit an IND to the FDA. The IND automatically becomes effective 30 days after receipt by the FDA, unless the FDA, within the 30-day time period, raises concerns or questions about the conduct of the clinical trial. In such a case, the IND sponsor and the FDA must resolve any outstanding concerns before the clinical trial can begin. Submission of an IND may not result in FDA authorization to commence a clinical trial. A separate submission to the existing IND must be made for each successive clinical trial conducted during product development. Further, an independent institutional review board for each medical center proposing to conduct the clinical trial must review and approve the plan for any clinical trial and provide its informed consent form before the trial commences at that center. Regulatory authorities or an institutional review board or the sponsor may suspend a clinical trial at any time on various grounds, including a finding that the subjects or patients are being exposed to an unacceptable health risk.
For purposes of NDA approval, human clinical trials are typically conducted in three sequential phases that may overlap.
|
•
|
Phase 1 - Studies, which involve the initial introduction of an IND into humans, are initially conducted in a limited number of subjects to test the product candidate for safety, dosage tolerance, absorption, metabolism, distribution and excretion in healthy humans or patients.
|
|
•
|
Phase 2 - Studies are conducted with groups of patients afflicted with a specified disease in order to provide enough data to evaluate the preliminary efficacy, optimal dosages and expanded evidence of safety. Multiple phase 2 clinical trials may be conducted by the sponsor to obtain information prior to beginning larger and more expensive phase 3 clinical trials. Phase 2 studies are typically well controlled, closely monitored, and conducted in a relatively small number of patients, usually involving no more than several hundred subjects. In some cases, a sponsor may decide to run what is referred to as a “phase 2b” evaluation, which is a second, confirmatory phase 2 trial that could, if positive, serve as a pivotal trial in the approval of a product candidate.
|
|
•
|
Phase 3 - When phase 2 evaluations demonstrate that a dosage range of the product is effective and has an acceptable safety profile, phase 3 trials are performed to gather the additional information about effectiveness and safety that is needed to evaluate the overall benefit-risk relationship of the drug and to provide an adequate basis for physician labeling. Phase 3 trials are undertaken in large patient populations to further evaluate dosage, to provide replicate statistically significant evidence of clinical efficacy and to further test for safety in an expanded patient population at multiple clinical trial sites.
|
The FDA may require, or companies may pursue, additional clinical trials after a product is approved. These so-called phase 4 studies may be made a condition to be satisfied after a drug receives approval. Failure to satisfy such post-marketing commitments can result in FDA enforcement action, up to and including withdrawal of NDA approval. The results of phase 4 studies can confirm the effectiveness of a product candidate and can provide important safety information to augment the FDA’s adverse drug reaction reporting system. The results of product development, preclinical studies and clinical trials are submitted to the FDA as part of an NDA, or as part of an sNDA. The submission of an NDA or sNDA requires payment of a substantial user fee to the FDA. The FDA may convene an advisory committee to provide clinical insight on NDA review questions. Although the FDA is not required to follow the recommendations of an advisory committee, the agency usually does so. The FDA may deny approval of an NDA or sNDA by way of a Complete Response letter if the applicable regulatory criteria are not satisfied, or it may require additional clinical data and/or an additional pivotal phase 3 clinical trial. Even if such data are submitted, the FDA may ultimately decide that the NDA or sNDA does not satisfy the criteria for approval. An NDA may be approved with significant restrictions on its labeling, marketing and
21
distribution under a Risk Evaluation and Mitigation Strategy. Once issued, the FDA may withdraw product approval if ongoing regulatory standards are not met or if safety problems occur after the product reaches the market. In addition, the FDA may require testing and surveillance programs to monitor the effect of approved products that have been commercialized, and the FDA has the power to prevent or limit further marketing of a product based on the results of these post-marketing programs.
Satisfaction of FDA requirements or similar requirements of state, local and foreign regulatory agencies typically takes several years and the actual time required may vary substantially based upon the type, complexity and novelty of the product or disease. Government regulation may delay or prevent marketing of product candidates or new diseases for a considerable period of time and impose costly procedures upon our activities. The FDA or any other regulatory agency may not grant approvals for new indications for our product candidates on a timely basis, if at all. Success in early stage clinical trials does not ensure success in later stage clinical trials. Targets and pathways identified in vitro may be determined to be less relevant in clinical studies and results in animal model studies may not be predictive of human clinical results. Data obtained from clinical activities is not always conclusive and may be susceptible to varying interpretations, which could delay, limit or prevent regulatory approval. Even if a product candidate receives regulatory approval, the approval may be significantly limited to specific disease states, patient populations and dosages. Further, even after regulatory approval is obtained, later discovery of previously unknown problems with a product may result in restrictions on the product or even complete withdrawal of the product from the market.
Any products manufactured or distributed by us pursuant to FDA approvals are subject to continuing regulation by the FDA, including record-keeping requirements and reporting of adverse experiences with the drug. Drug manufacturers and their subcontractors are required to register their establishments with the FDA and certain state agencies, and are subject to periodic unannounced inspections by the FDA and certain state agencies for compliance with GMP, which impose certain procedural and documentation requirements upon us and our third-party manufacturers.
The FDA closely regulates the marketing and promotion of drugs, including restricting the promotion of uses for which a drug is not approved by the agency. Not only must a company have appropriate substantiation to support claims made about a drug, under the FDA’s current interpretation of the relevant laws, a company can make only those claims relating to safety and efficacy that are for indications for which FDA has approved the drug and that are otherwise consistent with the FDA-approved label for the drug. Failure to comply with these requirements can result in adverse publicity, warning letters, corrective advertising and potential civil and criminal penalties. Physicians may, in their independent medical judgment, prescribe legally available drugs for uses that are not described in the product’s labeling and that differ from those tested by us and approved by the FDA. Such off-label uses are common across medical specialties. Physicians may believe that such off-label uses are the best treatment for many patients in varied circumstances. The FDA does not regulate the behavior of physicians in their choice of treatments. The FDA does, however, restrict manufacturers’ communications on the subject of off-label use. Additionally, a significant number of pharmaceutical companies have been the target of inquiries and investigations by various U.S. federal and state regulatory, investigative, prosecutorial and administrative entities in connection with the promotion of products for off-label uses and other sales practices. These investigations have alleged violations of various U.S. federal and state laws and regulations, including claims asserting antitrust violations, violations of the Food, Drug and Cosmetic Act, false claims laws, the Prescription Drug Marketing Act, anti-kickback laws, and other alleged violations in connection with the promotion of products for unapproved uses, pricing and Medicare and/or Medicaid reimbursement.
In the United States, the Orphan Drug Act of 1983, as amended, is intended to incentivize the development of drugs and biological products for rare diseases or conditions that affect fewer than 200,000 people in the U.S. (or that affects more than 200,000 persons in the U.S. and for which there is no reasonable expectation that the cost of developing and making available the drug in the U.S. for such disease or condition will be recovered from sales of the drug in the U.S.). If a drug is being developed for a rare disease of condition, to be eligible for designation as an orphan drug, the FDA must not have previously approved a drug considered the “same drug” for the same orphan indication. If the FDA has previously approved another same drug for the same indication, to obtain orphan drug designation, the sponsor of the subsequent drug would be required to provide a plausible hypothesis of clinical superiority over the previously approved drug to obtain an orphan designation. Upon FDA receipt of Orphan Drug Designation, the sponsor is eligible for tax credits of up to 50% for qualified clinical trial expenses, the ability to apply for grant funding, and waiver of the Prescription Drug User Fee Act application fee. In addition, upon marketing approval, an orphan-designated drug could be eligible for seven years of market exclusivity for the approved orphan-designated indication. Such orphan drug exclusivity, if awarded, would only block the approval of any drug considered the same drug for the same orphan indication. Moreover, a subsequent same drug could break a previously approved drug’s orphan exclusivity through a demonstration of clinical superiority over the previously approved drug.
22
The FDA has various programs, including Fast Track, priority review and accelerated approval, which are intended to expedite or simplify the process for developing and reviewing promising drugs, or to provide for the approval of a drug on the basis of a surrogate endpoint. Generally, drugs that are eligible for these programs are those for serious or life-threatening conditions, those with the potential to address unmet medical needs and those that offer meaningful benefits over existing treatments. For example, Fast Track is a process designed to facilitate the development and expedite the review of drugs to treat serious or life-threatening diseases or conditions and fill unmet medical needs. Priority review is designed to give drugs that treat serious conditions and that offer major advances in treatment or provide a treatment where no adequate therapy exists an initial review within six months of NDA filing as compared to a standard review time of 10 months from NDA filing. Certain other types of drug applications are also eligible for priority review. Although Fast Track and priority review do not affect the standards for approval, the FDA will attempt to facilitate early and frequent meetings with a sponsor of a Fast Track designated drug and expedite review of the application for a drug designated for priority review. Accelerated approval provides for an earlier approval for a new drug that is intended to treat a serious or life-threatening disease or condition and that fills an unmet medical need based on a surrogate endpoint. As a condition of approval, the FDA may require that a sponsor of a product candidate receiving accelerated approval perform post-marketing clinical trials to confirm the clinically meaningful outcome as predicted by the surrogate marker trial. In addition to the Fast Track, accelerated approval and priority review programs, the FDA also designates Breakthrough Therapy status to drugs that are intended, alone or in combination with one or more other drugs, to treat a serious or life-threatening disease or condition, and preliminary clinical evidence indicates that the drug may demonstrate substantial improvement over existing therapies on one or more clinically significant endpoints, such as substantial treatment effects observed early in clinical development. Drugs designated as breakthrough therapies are also eligible for accelerated approval. The FDA will seek to ensure the sponsor of a breakthrough therapy product candidate receives: intensive guidance on an efficient drug development program; intensive involvement of senior managers and experienced staff on a proactive, collaborative and cross-disciplinary review; and rolling review.
Additional programs intended to expedite the development of drug products were included in the recently enacted 21
st
Century Cures Act, or the Cures Act. Signed into law on December 13, 2016, the Cures Act includes various provisions to accelerate the development and delivery of new treatments, such as those intended to expand the types of evidence manufacturers may bring to the FDA to support drug approval, to encourage patient-centered drug development, to liberalize the communication of healthcare economic information, or HCEI, to payers, and to create greater transparency with regard to manufacturer expanded access programs. Central to the Cures Act are provisions that enhance and accelerate the FDA’s processes for reviewing and approving new drugs and supplements to approved NDAs, including provisions that:
|
•
|
require the FDA to establish a program to evaluate the potential use of real world evidence to help to support the approval of a new indication for an approved drug and to help to support or satisfy post-approval study requirements;
|
|
•
|
provide that the FDA may rely upon qualified data summaries to support the approval of a supplemental application with respect to a qualified indication for an already approved drug;
|
|
•
|
require FDA to issue guidance for purposes of assisting sponsors in incorporating complex adaptive and other novel trial designs into proposed clinical protocols and applications for new drugs; and
|
|
•
|
require FDA to establish a process for the qualification of drug development tools for use in supporting or obtaining FDA approval for or investigational use of a drug.
|
As to dissemination of HCEI, the Cures Act amends Section 114 of the Food and Drug Administration Modernization Act of 1997 to help clarify and facilitate the dissemination of HCEI, including by broadening the definition of HCEI, expressly extending the dissemination of HCEI to payors, and clarifying that HCEI must only “relate” to an FDA-approved indication rather than “directly” relate to the indication.
The Hatch-Waxman Act
The Drug Price Competition and Patent Term Restoration Act of 1984, or the Hatch-Waxman Act, established two approval pathways for drug products in which potential competitors may rely upon the FDA’s prior approval of the same or similar drug product.
ANDA.
An abbreviated new drug application, or ANDA, may be approved by the FDA if the applicant demonstrates that the proposed product is the same as the approved drug, which is referred to as the “reference listed drug,” or RLD. Generally, an ANDA must contain data and information showing that the proposed generic product and RLD (1) have the same active ingredient, in the same strength and dosage form, to be delivered via the same route of administration, (2) are
23
intended for the same uses, and (3) are bioequivalent. This is instead of independently demonstrating the proposed product’s safety and effectiveness, which are inferred from the fact that the product is the same as the RLD, which the FDA previously found to be safe and effective. Furthermore, conducting bioequivalence testing is generally less time consuming and costly than conducting a full set of clinical trials in humans.
505(b)(2) NDAs.
A 505(b)(2) application is one for which one or more of the investigations relied upon by the applicant for approval were not conducted by or for the applicant and for which the applicant has not obtained a right of reference or use from the person by or for whom the investigations were conducted. Under Section 505(b)(2) of the Food, Drug, and Cosmetic Act, or FDCA, an applicant may rely, in part, on the FDA’s previous approval of a similar product, or published literature, in support of its application. If the 505(b)(2) applicant establishes that reliance on FDA’s prior findings of safety and efficacy for an approved product is scientifically appropriate, it may eliminate the need to conduct certain preclinical or clinical studies. The FDA may require additional studies or measurements, including comparability studies.
Unlike a full NDA for which the sponsor has conducted or obtained a right of reference to all the data essential to approval, the filing of both an ANDA application and a 505(b)(2) application may be delayed due to patent or exclusivity protections covering an approved product. The Hatch-Waxman Act provides five years of data exclusivity for the first approval of a new chemical entity, and three years of data exclusivity for supplemental applications containing clinical studies essential to the approval of the sNDA.
Orange Book Listing.
An NDA sponsor must identify to the FDA patents that claim the drug substance or drug product or approved method of using the drug. When the drug is approved, those patents are among the information about the product that is listed in the FDA publication,
Approved Drug Products with Therapeutic Equivalence Evaluations
, which is referred to as the
Orange Book
. Any applicant who files an ANDA or a 505(b)(2) NDA must certify, for each patent listed in the Orange Book for the RLD that (1) no patent information on the drug product that is the subject of the application has been submitted to the FDA, (2) such patent has expired, (3) the listed patent will expire on a particular date and approval is sought after patent expiration, or (4) such patent is invalid or will not be infringed upon by the manufacture, use or sale of the drug product for which the application is submitted. The fourth certification described above is known as a Paragraph IV certification. A notice of the Paragraph IV certification must be provided to each owner of the patent that is the subject of the certification and to the reference NDA holder. The reference NDA holder and patent owners may initiate a patent infringement lawsuit in response to the Paragraph IV notice. Filing such a lawsuit within 45 days of the receipt of the Paragraph IV certification notice prevents the FDA from approving the ANDA or 505(b)(2) NDA until the earlier of 30 months, expiration of the patent, settlement of the lawsuit, or a decision in the infringement case that is favorable to the ANDA or 505(b)(2) applicant. The ANDA or 505(b)(2) application also will not be approved until any applicable non-patent exclusivity listed in the Orange Book for the RLD has expired.
Regulation Outside of the United States
In addition to regulations in the United States, we are subject to regulations of other countries governing clinical trials and the manufacturing, commercial sales and distribution of our products outside of the United States. Whether or not we obtain FDA approval for a product, we must obtain approval by the comparable regulatory authorities of countries outside of the United States before we can commence clinical trials in such countries and approval of the regulators of such countries or economic areas, such as the European Union, before we may market products in those countries or areas. The approval process and requirements governing the conduct of clinical trials, product licensing, pricing and reimbursement vary greatly from place to place, and the time may be longer or shorter than that required for FDA approval.
Under European Union regulatory systems, a company may submit MAAs either under a centralized or decentralized procedure. Under the centralized procedure, MAAs are submitted to the EMA whose Committee for Medicinal Products for Human Use reviews the application and issues an opinion on it. The opinion is considered by the EC which is responsible for deciding applications. If the application is approved, the EC grants a single marketing authorization that is valid for all European Union member states as well as Iceland, Liechtenstein and Norway, or the EEA. The national authorization procedures, the decentralized and mutual recognition procedures, as well as national applications, are available for products for which the centralized procedure is not compulsory. The mutual recognition procedure provides for the European Union member states selected by the applicant to mutually recognize a national marketing authorization that has already been granted by the competent authority of another member state, referred to as the Reference Member State, or RMS. The decentralized procedure is used when the product in question has yet to be granted a marketing authorization in any member state. Under this procedure the applicant can select the member state that will act as the RMS. In both the mutual recognition and decentralized procedures, the RMS reviews the application and submits its assessment of the application to the member states where marketing authorizations are being sought, referred to as Concerned Member States or CMS. Within
24
90 days of receiving the application and assessment report, each CMS must decide whether to recognize the RMS assessment. If a member state does not agree with the assessment, and the disputed points cannot be resolved the matter is eventually referred to the EC, whose decision is binding on all member states. If the application is successful national marketing authorizations will be granted by the competent authorities in each of the member states chosen by the applicant.
Conditional marketing authorizations may be granted for a limited number of medicinal products for human use referenced in European Union law applicable to conditional marketing authorizations where the clinical dataset is not comprehensive, if (1) the risk-benefit balance of the product is positive, (2) it is likely that the applicant will be in a position to provide the required comprehensive clinical trial data, (3) unmet medical needs will be fulfilled and (4) the benefit to public health of the immediate availability on the market of the medicinal product outweighs the risk inherent in the fact that additional data are still required. Specific obligations, such as the completion of ongoing or new studies and obligations relating to the collection of pharmacovigilance data, may be amongst the conditions stipulated in the marketing authorization.
As in the United States, we may apply for designation of a product as an Orphan drug for the treatment of a specific indication in the European Union before the application for marketing authorization is made. In the European Union orphan designation is available for products in development which are either: (a) intended for the diagnosis, prevention or treatment of life-threatening or chronically debilitating conditions affecting not more than 5 in 10,000 persons in the European Union, or (b) intended for the diagnosis, prevention or treatment of a life-threatening, seriously debilitating or serious and chronic condition in the Community and when, without incentives, it is unlikely that sales of the drug in the European Union would be sufficient to justify the necessary investment in developing the medicinal product. Additionally, the sponsor of an application for orphan drug designation must establish that there exists no satisfactory authorized method of diagnosis, prevention, or treatment of the condition or even if such treatment exists, the product will be of significant benefit to those affected by that condition.
Orphan drugs in the European Union enjoy economic and marketing benefits, including up to ten years of market exclusivity for the approved indication unless another applicant can show that its product is safer, more effective or otherwise clinically superior to the orphan-designated product. The period of market exclusivity may be reduced to six years if at the end of the fifth year it is established that the criteria for orphan designation are no longer met, including where it is shown that the product is sufficiently profitable not to justify maintenance of market exclusivity.
Healthcare Regulation
Federal and state healthcare laws, including fraud and abuse and health information privacy and security laws, also apply to our business. If we fail to comply with those laws, we could face substantial penalties and our business, results of operations, financial condition and prospects could be adversely affected. The laws that may affect our ability to operate include, but are not limited to: the federal Anti‑Kickback Statute, which prohibits. among other things, soliciting, receiving, offering or paying remuneration, directly or indirectly, to induce, or in return for, the purchase or recommendation of an item or service reimbursable under a federal healthcare program, such as the Medicare and Medicaid programs; and federal civil and criminal false claims laws and civil monetary penalty laws, which prohibit, among other things, individuals or entities from knowingly presenting, or causing to be presented, claims for payment from Medicare, Medicaid, or other third‑party payers that are false or fraudulent. Additionally, we are subject to state law equivalents of each of the above federal laws, which may be broader in scope and apply regardless of whether the payer is a federal healthcare program, and many of which differ from each other in significant ways and may not have the same effect, further complicate compliance efforts.
Numerous federal and state laws, including state security breach notification laws, state health information privacy laws and federal and state consumer protection laws, govern the collection, use and disclosure of personal information. Other countries also have, or are developing, laws governing the collection, use and transmission of personal information. In addition, most healthcare providers who are expected to prescribe our products and from whom we obtain patient health information, are subject to privacy and security requirements under the Health Insurance Portability and Accountability Act of 1996, as amended by the Health Information Technology and Clinical Health Act, or HIPAA. Although we are not directly subject to HIPAA, we could be subject to criminal penalties if we obtain and/or disclose individually identifiable health information from a HIPAA-covered entity, including healthcare providers, in a manner that is not authorized or permitted by HIPAA. The legislative and regulatory landscape for privacy and data protection continues to evolve, and there has been an increasing amount of focus on privacy and data protection issues with the potential to affect our business, including recently enacted laws in a majority of states requiring security breach notification. These laws could create liability for us or increase our cost of doing business. International laws, such as the EU Data Privacy Directive (95/46/EC) and Swiss Federal Act on Data Protection, regulate the processing of personal data within the European Union and between countries in the European Union and countries outside of the European Union, including the United States. Failure to provide adequate privacy
25
protections and maintain compliance with safe harbor mechanisms could jeopardize business transactions across borders and result in significant penalties.
In addition, the Patient Protection and Affordable Care Act, as amended by the Health Care Education Reconciliation Act, or the PPACA, created a federal requirement under the federal Open Payments program, that requires certain manufacturers to track and report to the Centers for Medicare and Medicaid Services, or CMS, annually certain payments and other transfers of value provided to physicians and teaching hospitals made in the previous calendar year. In addition, there are also an increasing number of state laws that require manufacturers to make reports to states on pricing and marketing information. These laws may affect our sales, marketing, and other promotional activities by imposing administrative and compliance burdens on us. In addition, given the lack of clarity with respect to these laws and their implementation, our reporting actions could be subject to the penalty provisions of the pertinent state and federal authorities.
For those marketed products which are covered in the United States by the Medicaid programs, we have various obligations, including government price reporting and rebate requirements, which generally require products be offered at substantial rebates/discounts to Medicaid and certain purchasers (including “covered entities” purchasing under the 340B Drug Discount Program). We are also required to discount such products to authorized users of the Federal Supply Schedule of the General Services Administration, under which additional laws and requirements apply. These programs require submission of pricing data and calculation of discounts and rebates pursuant to complex statutory formulas, as well as the entry into government procurement contracts governed by the Federal Acquisition Regulations, and the guidance governing such calculations is not always clear. Compliance with such requirements can require significant investment in personnel, systems and resources, but failure to properly calculate prices, or offer required discounts or rebates could subject us to substantial penalties.
Subject to the application in the European Union of the Transparency Directive 89/105/EEC, which aims to ensure the transparency of measures adopted to control pricing and reimbursement, pricing and reimbursement in the EU/EEA is governed by national rules and policy and may vary from Member State to Member State.
Reimbursement
Sales of our approved products and any future products of ours will depend, in part, on the extent to which their costs will be covered by third-party payers, such as government health programs, commercial insurance and managed healthcare organizations. Patients may be less likely to use our products if coverage is not provided and reimbursement is inadequate to cover a significant portion of the cost of our products. Third-party payers may limit coverage to specific drug products on an approved list, also known as a formulary, which might not include all of the FDA-approved drugs for a particular indication. Moreover, a third-party payer’s decision to provide coverage for a drug product does not imply that an adequate reimbursement rate will be approved. Additionally, a third-party payer’s decision to cover a particular drug product does not ensure that other payers will also provide coverage for the drug product, or will provide coverage at an adequate reimbursement rate.
In the United States and other potentially significant markets for our products, government authorities and third-party payers are increasingly attempting to limit or regulate the price of medical products and services, particularly for new and innovative
products and therapies, which has resulted in lower average selling prices. Further, the increased emphasis on managed healthcare in the United States and on country-specific and national pricing and reimbursement controls in the European Union will put additional pressure on product pricing, reimbursement and usage, which may adversely affect our future product sales and results of operations. These pressures can arise from rules and practices of managed care groups, judicial decisions and governmental laws and regulations related to Medicare, Medicaid and healthcare reform, pharmaceutical reimbursement policies and pricing in general. Adoption of price controls and cost-containment measures, and adoption of more restrictive policies in jurisdictions with existing coverage and/or reimbursement controls and measures, could have a material adverse impact on our net product revenues and results of operations.
The United States and some foreign jurisdictions are considering proposals or have enacted legislative and regulatory changes the healthcare system that could affect our ability to sell our products profitably. Among policy makers and payers in the United States and elsewhere, there is significant interest in promoting changes in healthcare systems with the stated goals of containing healthcare costs, improving quality and/or expanding access. There has been particular and increasing legislative and enforcement interest in the United States with respect to drug pricing practices, particularly with respect to drugs that have been subject to relatively large price increases over relatively short time periods. There have been several U.S. Congressional inquiries and proposed bills designed to, among other things, bring more transparency to drug pricing, review the relationship between pricing and manufacturer patient programs, and reform government program reimbursement methodologies for drugs. In the United States, the pharmaceutical industry has already been significantly affected by major legislative initiatives, including, for example, the PPACA. In January 2017, Congress voted to adopt a
26
budget resolution for fiscal year 2017, or the Budget Resolution, that authorizes the implementation of legislation that would repeal portions of PPACA. The Budget Resolution is not a law, however, it is widely viewed as the first step toward the passage of legislation that would repeal certain aspects of PPACA. Further, on January 20, 2017, President Trump signed an Executive Order directing federal agencies with authorities and responsibilities under PPACA to waive, defer, grant exemptions from, or delay the implementation of any provision of PPACA that would impose a fiscal or regulatory burden on states, individuals, healthcare providers, health insurers, or manufacturers of pharmaceuticals or medical devices. Congress also could consider subsequent legislation to replace elements of PPACA that are repealed. We cannot predict what healthcare reform initiatives may be adopted in the future. Further federal, state and foreign legislative and regulatory developments are likely, and we expect ongoing initiatives to increase pressure on drug pricing, which could have a negative impact on our revenue or sales of any products or future approved products.
Other legislative changes have also been proposed and adopted since the PPACA was enacted. For example, the Budget Control Act of 2011 resulted in aggregate reductions in Medicare payments to providers of up to 2% per fiscal year, starting in 2013, and the American Taxpayer Relief Act of 2012, among other things, reduced Medicare payments to several types of providers and increased the statute of limitations period for the government to recover overpayments to providers from three to five years. Such laws, and others that may affect our business that have been recently enacted or may in the future be enacted, may result in additional reductions in Medicare and other healthcare funding. In the future, there will likely continue to be additional proposals relating to the reform of the United States healthcare system, some of which could further limit coverage and reimbursement of drug products, including our approved products and any future approved products. Any reduction in reimbursement from Medicare or other government programs may result in a similar reduction in payments from private payers. The implementation of cost containment measures or other healthcare reforms may prevent us from being able to generate revenue, attain profitability or commercialize our products.
In addition, in some non-U.S. jurisdictions, the proposed pricing for a drug must be approved before its cost may be funded within the respective national healthcare system. The requirements governing drug pricing vary widely from country to country. For example, European Union member states may restrict the range of medicinal products for which their national healthcare systems provide reimbursement and may control the prices of medicinal products for human use. A member state may approve a specific price for the medicinal product or it may instead adopt a system of direct or indirect controls on the profits the medicinal product generates for the company placing it on the market. There can be no assurance that any country that has price controls or reimbursement limitations for pharmaceutical products will allow favorable reimbursement and pricing arrangements for any of our products on cost-effectiveness grounds. Historically, products launched in countries in the European Union do not follow the price structures of the United States and they generally tend to be priced significantly lower.
Competition
There are many companies focused on the development of small molecules and antibodies for cancer. Our competitors and potential competitors include major pharmaceutical and biotechnology companies, as well as academic research institutions, clinical reference laboratories and government agencies that are pursuing research activities similar to ours. Many of our competitors and potential competitors have significantly more financial, technical and other resources than we do, which may allow them to have a competitive advantage.
Competition for Cabozantinib
We believe that our ability to successfully compete will depend on, among other things:
|
•
|
efficacy, safety and reliability of cabozantinib;
|
|
•
|
timing and scope of regulatory approval;
|
|
•
|
the speed at which we develop cabozantinib for the treatment of additional tumor types beyond its approved indications;
|
|
•
|
our ability to complete preclinical testing and clinical development and obtain regulatory approvals for cabozantinib;
|
|
•
|
our ability to manufacture and sell commercial quantities of cabozantinib product to the market;
|
|
•
|
our ability to successfully commercialize cabozantinib and secure coverage and adequate reimbursement in approved indications;
|
|
•
|
product acceptance by physicians and other health care providers;
|
27
|
•
|
the level of our collaboration partners’ investments in the resources necessary to successfully commercialize cabozantinib in territories where it is approved outside of the United States;
|
|
•
|
skills of our employees and our ability to recruit and retain skilled employees;
|
|
•
|
protection of our intellectual property; and
|
|
•
|
the availability of substantial capital resources to fund development and commercialization activities.
|
We believe that the quality and breadth of activity observed with cabozantinib, the skill of our employees and our ability to recruit and retain skilled employees, our patent portfolio and our capabilities for research and drug development are competitive strengths. However, many large pharmaceutical and biotechnology companies have significantly larger intellectual property estates than we do, more substantial capital resources than we have, and greater capabilities and experience than we do in preclinical and clinical development, sales, marketing, manufacturing and regulatory affairs.
The markets for which we intend to pursue regulatory approval of cabozantinib are highly competitive. We are aware of products in research or development by our competitors that are intended to treat all of the tumor types we are targeting, and should they demonstrate suitable clinical evidence, any of these products may compete with cabozantinib. Our future success will depend upon our ability to maintain a competitive position with respect to technological advances and the shifting landscape of therapeutic strategy following the advent of immunotherapy. Our products may become less marketable if we are unable to successfully adapt our development strategy to address the likelihood that this new approach to treating cancer with immuno-oncoloy agents will become prevalent in indications for which our products are approved, most notably advanced RCC, and in additional indications where we may seek regulatory approval.
CABOMETYX:
We believe the principal competition for CABOMETYX in advanced RCC includes: BMS’s nivolumab and ipilimumab; Pfizer’s axitinib, sunitinib and temsirolimus; Novartis’ everolimus and pazopanib; Bayer’s and Onyx Pharmaceuticals’ (a wholly-owned subsidiary of Amgen) sorafenib; Genentech’s bevacizumab and atezolizumab; and Eisai’s lenvatinib. The competition we currently face from BMS’s nivolumab is particularly significant. Nivolumab was approved for the treatment of advanced RCC on November 23, 2015, following a rapid review by the FDA. That approval was based in large part on the results of BMS’s phase 3 trial comparing nivolumab to everolimus in patients who had received previous antiangiogenic therapy for advanced RCC (Checkmate 025), in which nivolumab met its primary endpoint of showing a statistically-significant improvement in OS over everolimus, a current standard of care for the treatment of second line RCC patients. Nivolumab failed to demonstrate a statistically-significant PFS benefit over everolimus. Nivolumab also demonstrated an acceptable safety profile. Additionally, there are a variety of combination therapies being developed for RCC, including, Roche’s bevacizumab and atezolizumab, BMS’s ipilimumab and nivolumab, Merck’s pembrolizumab and Eisai’s lenvatinib, Merck’s pembrolizumab and Pfizer’s axitinib, Pfizer’s avelumab and axitinib, and Merck’s pembrolizumab and Roche’s bevacizumab.
COMETRIQ:
We believe that the principal competing anti-cancer therapy to COMETRIQ in progressive, metastatic MTC is Genzyme’s RET, VEGFR and EGFR inhibitor vandetanib, which has been approved by the FDA and the EC for the treatment of symptomatic or progressive MTC in patients with unresectable, locally advanced, or metastatic disease. In addition, we believe that COMETRIQ also faces competition as a treatment for progressive, metastatic MTC from off-label use of Bayer’s and Onyx Pharmaceuticals’ (a wholly-owned subsidiary of Amgen) multikinase inhibitor sorafenib, Pfizer’s multikinase inhibitor sunitinib, Ariad Pharmaceutical’s multikinase inhibitor ponatinib, Novartis’ multikinase inhibitor pazopanib, and Eisai’s multikinase inhibitor lenvatinib.
Potential Cabozantinib Indications Beyond RCC and MTC:
Should cabozantinib be approved for the treatment of HCC, we believe its principal competition may include Bayer’s and Onyx Pharmaceuticals’ sorafenib, Bayer’s regorafenib, Eisai’s lenvatinib, BMS’s nivolumab, Merck’s pembrolizumab and Lilly’s ramucirumab. In particular, Bayer recently announced positive results from a Phase 3 trial that compared regorafenib to placebo in the same HCC patient population that is being enrolled in our Phase 3 trial. Examples of potential competition for cabozantinib in other cancer indications include: other VEGF pathway inhibitors, including Genentech’s bevacizumab; other RET inhibitors including Eisai’s lenvatinib and Ariad’s ponatinib; and other MET inhibitors, including Amgen’s AMG 208, Pfizer’s crizotinib, ArQule’s tivantinib, and Mirati’s glesatinib; and immunotherapies such as BMS’s ipilimumab and nivolumab, Merck’s pembrolizumab and Roche’s atezolizumab.
Competition for Cobimetinib
We believe that cobimetinib’s principal competition amongst targeted agents includes Novartis’ trametinib and dabrafenib, and Array’s encorafenib and binimetinib; and within the class of immunotherapies, BMS’s ipilimumab and
28
nivolumab and Merck’s pembrolizumab. The second category, immunotherapies, are of particular competitive importance vis-a-vis cobimetinib in advanced melanoma as they are already FDA approved in melanoma patient populations that overlap with those that may be eligible for cobimetinib, they have been rapidly incorporated into the National Comprehensive Cancer Network treatment guidelines, and they are viewed with a high degree of enthusiasm by physicians and key opinion leaders. Ongoing and future trials incorporating immuno-oncology agents, including combination trials, may further impact usage of cobimetinib in melanoma and potentially in additional tumor types in which cobimetinib may ultimately gain approval.
Financial Information and Significant Customers
We operate as a single business segment and have operations solely in the United States. During the year ended
December 31, 2016
, we derived
33%
of our revenues from Diplomat Specialty Pharmacy, which is located in the United States and
17%
of our revenues in connection with our collaboration with Ipsen which is located in the European Union. Information regarding total revenues, including geographic regions in which they are earned, net loss and total assets for the years ended
December 31, 2016
,
2015
and
2014
is set forth in “Note 14. Concentrations of Credit Risk” in our “Consolidated Financial Statements” included in Item 8 of this Annual Report on Form 10-K.
Research and development expenses were
$96.0 million
or the year ended
December 31, 2016
, compared to
$96.4 million
for the year ended
December 31, 2015
and
$189.1 million
for the year ended
December 31, 2014
. Additional information about our research and development expenses in each of the last three fiscal years is set forth in Item 7, “Management’s Discussion and Analysis of Financial Condition and Results of Operations.”
Patents and Proprietary Rights
We actively seek patent protection in the United States, the European Union, and selected other foreign countries to cover our drug candidates and related technologies. Patents extend for varying periods according to the date of patent filing or grant and the legal term of patents in the various countries where patent protection is obtained. The actual protection afforded by a patent, which can vary from country to country, depends on the type of patent, the scope of its coverage and the availability of legal remedies in the country. We have numerous patents and pending patent applications that relate to methods of screening drug targets, compounds that modulate drug targets, as well as methods of making and using such compounds.
While many patent applications have been filed relating to the drug candidates that we have developed, the majority of these are not yet issued or allowed.
Cabozantinib is covered by six issued patents in the United States, including U.S. Pat. No. 7,579,473, for the composition-of-matter of cabozantinib and pharmaceutical compositions thereof. U.S. Pat. No. 7,579,473 would normally expire in September 2024, but we have been granted a patent term extension to extend the term to August 2026. The additional issued U.S. patents will expire between 2024 and 2032. We own the rights to the six issued U.S. patents. Cabozantinib is also covered by an issued patent in Europe (covering cabozantinib’s composition-of-matter and certain methods of use) and an issued patent in Japan (covering cabozantinib composition-of-matter). These issued patents would normally expire in September 2024, but we have applied for Supplementary Protection Certificates in Europe to extend the term to 2029. We intend to apply for patent term extension in Japan to extend the term to 2029. Foreign counterparts of the issued United States and European patents are issued in Australia and Canada, which are anticipated to expire in 2024. We have patent applications pending in the United States, the European Union, Australia, Japan and Canada covering certain synthetic methods related to making cabozantinib, which, if issued, are anticipated to expire in 2024. We have filed patent applications in the United States and other selected countries covering certain salts, polymorphs and formulations of cabozantinib that, if issued, are anticipated to expire in approximately 2030. We have filed several patent applications in the United States and other selected countries relating to combinations of cabozantinib with certain other anti-cancer agents that, if issued, are anticipated to expire in approximately 2030.
Cobimetinib is covered by three issued patents in the United States, including U.S. Pat. No 7,803,839 for the composition of matter of cobimetinib and pharmaceutical compositions thereof. U.S. Pat. No 7,803,839 would normally expire in February 2027, but we have applied for a patent term extension to extend the term to November 2029. We own the rights to the three issued patents. Cobimetinib is also covered an issued patent in Europe (covering cobimetinib’s composition-of-matter and certain methods of use), which would normally expire in October 2026, but we have applied for Supplementary Protection Certificates to extend the term to November 2030. Foreign counterparts of the issued United States and European patents are issued or pending in Australia, Brazil, Canada, China, Colombia, the Eurasian Patent Organization, Georgia, Hong Kong, India, Indonesia, Israel, Japan, Mexico, Malaysia, New Zealand, Philippines, Singapore, South Africa, South Korea, and Ukraine. We have filed patent applications in the United States and other selected countries covering
29
certain salts and polymorphs of cobimetinib that, if issued, are anticipated to expire in approximately 2036. We have filed patent applications in the United States and other selected countries covering certain synthetic methods related to making cobimetinib, which if, issued, are anticipated to expire in approximately 2033. Cobimetinib is licensed to Genentech in the United States and to Roche outside of the United States.
We have pending patent applications in the United States and European Union covering the composition-of-matter of our other drug candidates in clinical or preclinical development that, if issued, are anticipated to expire between 2023 and 2030.
We have obtained licenses from various parties that give us rights to technologies that we deem to be necessary or desirable for our research and development. These licenses (both exclusive and non-exclusive) may require us to pay royalties as well as upfront and milestone payments.
Employees
As of
December 31, 2016
, we had 287 full-time equivalent employees, all of which are located in the U.S. None of our employees are represented by a labor union, and we consider our employee relations to be good.
Corporate Information
We were incorporated in Delaware in November 1994 as Exelixis Pharmaceuticals, Inc. and changed our name to Exelixis, Inc. in February 2000. Our principal executive offices are located at 210 East Grand Ave., South San Francisco, California 94080. Our telephone number is (650) 837-7000. We maintain a site on the worldwide web at www.exelixis.com; however, information found on our website is not incorporated by reference into this report.
We make available free of charge on or through our website our Securities and Exchange Commission, or SEC, filings, including our annual report on Form 10-K, quarterly reports on Form 10-Q, current reports on Form 8-K and amendments to those reports filed or furnished pursuant to Section 13(a) or 15(d) of the Securities Exchange Act of 1934, as amended, as soon as reasonably practicable after we electronically file such material with, or furnish it to, the SEC. Further, copies of our filings with the SEC are available at the SEC’s Public Reference Room at 100 F Street, NE, Washington, D.C. 20549. Information on the operation of the Public Reference Room can be obtained by calling the SEC at 1-800-SEC-0330. The SEC maintains a site on the worldwide web that contains reports, proxy and information statements and other information regarding our filings at www.sec.gov.
|
ITEM 1A.
|
RISK FACTORS
|
In addition to the factors discussed elsewhere in this report, the following are important factors that could cause actual results or events to differ materially from those contained in any forward-looking statements made by us or on our behalf. The risks and uncertainties described below are not the only ones we face. Additional risks and uncertainties not currently known to us or that we deem immaterial also may impair our business operations. If any of the following risks or such other risks actually occur, our business could be harmed.
Risks Related to Our Business and Industry
Our future prospects are critically dependent upon the commercial success of CABOMETYX for advanced RCC and the further clinical development and commercial success of cabozantinib in additional indications.
Our mission is to maximize the clinical and commercial potential of cabozantinib and cobimetinib and position the Exelixis business for future growth through the resumption of our discovery efforts and the expansion of our development pipeline. We anticipate that for the foreseeable future our ability to generate meaningful revenue to fund our commercial operations and our development and discovery programs is dependent upon the successful commercialization of CABOMETYX for the treatment of advanced RCC in territories where it has been or may soon be approved. The commercial potential of CABOMETYX for the treatment of advanced RCC remains subject to a variety of factors, most importantly, CABOMETYX’s perceived benefit/risk profile as compared to the benefit/risk profiles of other treatments available or currently in development for the treatment of advanced RCC. If revenue from CABOMETYX decreases, we may need to reduce our operating expenses or raise additional funds to execute our business plan, which would have a material adverse effect on our business and financial condition, results of operations and growth prospects. Furthermore, as a consequence of our
30
exclusive collaboration agreement with Ipsen, we rely heavily upon Ipsen’s regulatory, commercial, medical affairs, and other expertise and resources for commercialization of CABOMETYX in territories outside of the United States and Japan. If Ipsen is unable to, or does not invest the resources necessary to, successfully commercialize CABOMETYX for the treatment of advanced RCC in the European Union and other international territories where it may be approved, this could reduce the amount of revenue we are due to receive under our collaboration agreement with Ipsen, thus resulting in harm to our business and operations.
We also believe that there are commercial opportunities for cabozantinib in therapeutic indications beyond advanced RCC, and we are pursuing these opportunities by dedicating substantial proprietary resources to developing cabozantinib into a broad and significant oncology franchise. Even following the approval of CABOMETYX for the treatment of advanced RCC in the United States and European Union, our success remains contingent upon, among other things, successful clinical development, regulatory approval and market acceptance of cabozantinib in additional indications, such as first-line RCC, advanced HCC, NSCLC, and other forms of cancer. With top-line results from CELESTIAL anticipated in 2017, we expect growth of the cabozantinib oncology franchise to be most immediately impacted by the clinical trial results of cabozantinib in advanced HCC. However, the historical rate of failures for product candidates in clinical development is high. Should we prove unsuccessful in the further development of cabozantinib beyond MTC or advanced RCC, we may be unable to execute our business plan and our revenues and financial condition would be materially adversely affected.
We are heavily dependent on our partner, Genentech (a member of the Roche group), for the successful development, regulatory approval and commercialization of cobimetinib.
The terms of our collaboration agreement with Genentech provide them with exclusive authority over the global development and commercialization plans for cobimetinib and the execution of those plans. We have no effective influence over those plans and are heavily dependent on Genentech’s decision making. The collaboration agreement provides that we are entitled to a share of U.S. profits and losses received in connection with commercialization of cobimetinib. We are also entitled to low double-digit royalties on ex-U.S. net sales of cobimetinib. In both cases, we are heavily dependent on Genentech’s internal accounting procedures for determining how much, if any, profit we may derive from the collaboration. In connection with the commercialization of Cotellic, we believed Genentech’s pricing of, and cost and revenue allocations for, Cotellic, as determined exclusively by Genentech, have been contrary to the applicable terms of the collaboration agreement. We raised this concern with Genentech, along with other material concerns regarding Genentech’s performance under the collaboration agreement, but were unable to come to resolution on any of these issues. Accordingly, on June 3, 2016, following a 30 day dispute resolution period, we filed a demand for arbitration asserting claims against Genentech related to its clinical development, pricing and commercialization of Cotellic, and cost and revenue allocations in connection with Cotellic’s commercialization in the United States. Soon thereafter, Genentech asserted a counterclaim for breach of contract seeking monetary damages and interest related to the cost allocations under the collaboration agreement. On December 29, 2016, Genentech withdrew its counterclaim against us and stated that it would unilaterally change its approach to allocation of promotional expenses arising from commercialization of the Cotellic plus Zelboraf combination therapy, both retrospectively and prospectively. Notwithstanding Genentech’s change of approach, other significant issues remain in dispute between the parties. Genentech’s action does not address the claims in our demand for arbitration related to Genentech’s clinical development of cobimetinib, or pricing and promotional costs for Cotellic in the United States, nor does it fully resolve claims over revenue allocation. And, Genentech has not clarified how it intends to allocate promotional costs incurred with respect to the promotion of other combination therapies that include cobimetinib for other indications that will be developed or are in development and may be approved. As a result, we will continue to press our position for the arbitral panel to obtain a just resolution of these claims. The ultimate outcome and timing of the arbitration is difficult to predict.
We are also completely dependent upon Genentech to develop cobimetinib further. Any significant changes to Genentech’s business strategy and priorities, over which we have no control, could adversely affect Genentech’s willingness or ability to complete their obligations under our collaboration agreement and result in harm to our business and operations. Subject to contractual diligence obligations, Genentech has complete control over and financial responsibility for cobimetinib’s development program and regulatory strategy and execution, and we are not able to control the amount or timing of resources that Genentech will devote to the product. Of particular significance are Genentech’s development efforts with respect to the combination of cobimetinib with immuno-oncology agents, a promising and competitive area of clinical research. Regardless of Genentech’s efforts and expenditures for the further development of cobimetinib, the results of such additional clinical investigation may not prove positive and may not produce label expansions or approval in additional indications.
31
The commercial success of cabozantinib, as CABOMETYX tablets for advanced RCC and as COMETRIQ capsules for MTC, or if approved for additional indications, will depend upon the degree of market acceptance among physicians, patients, health care payers, and the medical community.
Our ability to commercialize cabozantinib, as CABOMETYX tablets for advanced RCC and COMETRIQ capsules for MTC, or if approved for additional indications, will be highly dependent upon the extent to which cabozantinib gains market acceptance among physicians, patients, health care payers such as Medicare, Medicaid and commercial plans and the medical community. If cabozantinib does not achieve an adequate level of acceptance, we may not generate significant future product revenues. The degree of market acceptance of CABOMETYX, COMETRIQ and other cabozantinib products, if approved, will depend upon a number of factors, including:
|
•
|
the effectiveness, or perceived effectiveness, of cabozantinib in comparison to competing products;
|
|
•
|
the safety of cabozantinib, including the existence of serious side effects of cabozantinib and their severity in comparison to those of any competing products;
|
|
•
|
cabozantinib’s relative convenience and ease of administration;
|
|
•
|
unexpected results connected with analysis of data from future or ongoing clinical trials;
|
|
•
|
the timing of cabozantinib label expansions for additional indications, if any, relative to competitive treatments;
|
|
•
|
the price of cabozantinib relative to competitive therapies and any new government initiatives affecting pharmaceutical pricing;
|
|
•
|
the strength of CABOMETYX sales efforts, marketing, medical affairs and distribution support;
|
|
•
|
the sufficiency of commercial and government insurance coverage and reimbursement; and
|
|
•
|
our ability to enforce our intellectual property rights with respect to cabozantinib.
|
If we are unable to maintain or scale adequate sales, marketing, market access and distribution capabilities or enter into or maintain agreements with third parties to do so, we may be unable to commercialize cabozantinib successfully.
In connection with the FDA’s approval of CABOMETYX for the treatment of patients with advanced RCC, we substantially increased our sales, marketing, market access, medical affairs and product distribution capabilities. Establishing and maintaining these capabilities are expensive and time-consuming. Such expenses may be disproportionate compared to the revenues we may be able to generate on sales of cabozantinib, which may have an adverse impact on our results of operations. Also, to the extent that the commercial opportunities for cabozantinib grows over time, we may not properly judge the requisite size and experience of the commercialization teams or the scale of distribution necessary to market and sell cabozantinib successfully. If we are unable to scale our organization appropriately, we may not be able to maximize product revenues and our business may be adversely affected.
We currently rely on a single third party logistics provider (with two distribution locations) to handle shipping and warehousing for our commercial supply of both CABOMETYX and COMETRIQ in the U.S. While we have expanded our U.S. distribution and pharmacy channels in connection with the approval of CABOMETYX by the FDA for the treatment of patients with advanced RCC in the United States, we still rely on a relatively limited distribution network to dispense COMETRIQ in fulfillment of prescriptions in the United States. Furthermore, we rely on our collaboration partners for the commercialization and distribution of CABOMETYX and COMETRIQ in territories outside of the United States, as well as for access and distribution activities for the approved products under the NPU program.
Our current and anticipated future dependence upon the activities, and legal and regulatory compliance, of these or other third parties, may adversely affect our future profit margins and our ability to supply cabozantinib to the marketplace on a timely and competitive basis. For example, if a warehouse of our third party logistics provider suffers a fire or damage from another type of disaster, a significant portion of the commercial supply of CABOMETYX and COMETRIQ could be destroyed, resulting in a disruption in our commercialization efforts. These or other third parties may not be able to provide services in the time we require to meet our commercial timelines and objectives or to meet regulatory requirements. We may not be able to maintain or renew our arrangements with third parties, or enter into new arrangements, on acceptable terms, or at all. Third parties could terminate or decline to renew our arrangements based on their own business priorities, at a time that is costly or inconvenient for us. If we are unable to contract for logistics services or distribution of cabozantinib on acceptable terms, our commercialization efforts may be delayed or otherwise adversely affected.
32
We are subject to certain healthcare laws, regulation and enforcement; our failure to comply with those laws could have a material adverse effect on our results of operations and financial condition.
We are subject to certain healthcare laws and regulations and enforcement by the federal government and the states in which we conduct our business. The laws that may affect our ability to operate include, without limitation:
|
•
|
the federal Anti-Kickback Statute, or AKS, which governs our business activities, including our marketing practices, educational programs, pricing policies, and relationships with healthcare providers or other entities. The AKS prohibits, among other things, persons and entities from knowingly and willfully soliciting, receiving, offering or paying remuneration, directly or indirectly, in exchange for or to induce either the referral of an individual for, or the purchase, order or recommendation of, any good or service for which payment may be made under federal healthcare programs such as the Medicare and Medicaid programs. Remuneration is not defined in the AKS and has been broadly interpreted to include anything of value, including for example, gifts, discounts, coupons, the furnishing of supplies or equipment, credit arrangements, payments of cash, waivers of payments, ownership interests and providing anything at less than its fair market value. The AKS has been broadly interpreted to apply to manufacturer arrangements with prescribers, purchasers and formulary managers, among others;
|
|
•
|
the FDCA and its regulations which prohibit, among other things, the introduction or delivery for introduction into interstate commerce of any food, drug, device, or cosmetic that is adulterated or misbranded;
|
|
•
|
federal civil and criminal false claims laws and civil monetary penalty laws, which prohibit, among other things, individuals or entities from knowingly presenting, or causing to be presented, claims for payment from Medicare, Medicaid, or other third-party payers that are false or fraudulent, or making a false statement to avoid, decrease or conceal an obligation to pay money to the federal government;
|
|
•
|
federal criminal laws that prohibit executing a scheme to defraud any healthcare benefit program or making false statements relating to healthcare matters;
|
|
•
|
the Health Insurance Portability and Accountability Act of 1996, or HIPAA, as amended by the Health Information Technology for Economic and Clinical Health Act, and their implementing regulations, which impose certain requirements relating to the privacy, security and transmission of individually identifiable health information;
|
|
•
|
state law equivalents of each of the above federal laws, such as anti-kickback and false claims laws, which may apply to items or services reimbursed by any third-party payer, including commercial insurers, and state laws governing the privacy and security of health information in certain circumstances, many of which differ from each other in significant ways and may not have the same effect, thus complicating compliance efforts;
|
|
•
|
the Foreign Corrupt Practices Act, a U.S. law which regulates certain financial relationships with foreign government officials (which could include, for example, certain medical professionals);
|
|
•
|
federal and state consumer protection and unfair competition laws, which broadly regulate marketplace activities and activities that potentially harm consumers;
|
|
•
|
federal and state government price reporting laws that require us to calculate and report complex pricing metrics to government programs, where such reported prices may be used in the calculation of reimbursement and/or discounts on our marketed drugs (participation in these programs and compliance with the applicable requirements may subject us to potentially significant discounts on our products, increased infrastructure costs, and could potentially affect our ability to offer certain marketplace discounts); and
|
|
•
|
federal and state financial transparency laws, which generally require certain types of expenditures in the United States to be tracked and reported (compliance with such requirements may require investment in infrastructure to ensure that tracking is performed properly, and some of these laws result in the public disclosure of various types of payments and relationships with healthcare providers and healthcare entities, which could potentially have a negative effect on our business and/or increase enforcement scrutiny of our activities).
|
In addition, certain marketing practices, including off-label promotion, may also violate certain federal and state healthcare fraud and abuse laws, FDA rules and regulations, as well as false claims laws, including the civil False Claims Act. Suits filed under the civil False Claims Act, known as “
qui tam
” actions, can be brought by any individual on behalf of the government and such individuals, commonly known as “whistleblowers,” may share in any amounts paid by the entity to the government in fines or settlement. The filing of
qui tam
actions has caused a number of pharmaceutical, medical device and other healthcare companies to have to defend a civil False Claims Act action. When an entity is determined to have violated the civil False Claims Act, it may be required to pay up to three times the actual damages sustained by the government, plus civil penalties for each separate false claim.
33
If our operations are found to be in violation of any of the laws described above or any other governmental regulations that apply to us, we, or our officers or employees, may be subject to penalties, including administrative civil and criminal penalties, damages, fines, withdrawal of regulatory approval, the curtailment or restructuring of our operations, the exclusion from participation in Medicare, Medicaid and other federal and state healthcare programs, individual imprisonment, contractual damages, reputational harm, diminished profits and future earnings, additional reporting requirements and oversight if we become subject to a corporate integrity agreement or similar agreement to resolve allegations of non-compliance with these laws, any of which could adversely affect our ability to sell our products or operate our business and also adversely affect our financial results. Defending against any such actions can be costly, time-consuming and may require significant financial and personnel resources. Therefore, even if we are successful in defending against any such actions that may be brought against us, our business may be impaired.
Numerous federal and state laws, including state security breach notification laws, state health information privacy laws and federal and state consumer protection laws, govern the collection, use and disclosure of personal information. Other countries also have, or are developing, laws governing the collection, use and transmission of personal information. In addition, most healthcare providers who are expected to prescribe our products and from whom we obtain patient health information are subject to privacy and security requirements under HIPAA. Although we are not directly subject to HIPAA, we could be subject to criminal penalties if we knowingly obtain individually identifiable health information from a HIPAA-covered entity in a manner that is not authorized or permitted by HIPAA. The legislative and regulatory landscape for privacy and data protection continues to evolve, and there has been an increasing amount of focus on privacy and data protection issues with the potential to affect our business, including recently enacted laws in a majority of states requiring security breach notification. These laws could create liability for us or increase our cost of doing business. International laws, such as the EU Data Privacy Directive (95/46/EC) and Swiss Federal Act on Data Protection, regulate the processing of personal data within the European Union and between countries in the European Union and countries outside of the European Union, including the United States. Failure to provide adequate privacy protections and maintain compliance with safe harbor mechanisms could jeopardize business transactions across borders and result in significant penalties.
If we are unable to obtain both adequate coverage and adequate reimbursement from third-party payers for CABOMETYX or COMETRIQ, our revenues and prospects for profitability will suffer.
Our ability to successfully commercialize CABOMETYX or COMETRIQ is highly dependent on the extent to which coverage and reimbursement is, and will be, available from third-party payers, including governmental payers, such as Medicare and Medicaid, and private health insurers. Patients may not be capable of paying for CABOMETYX or COMETRIQ themselves and may rely on third-party payers to pay for, or subsidize, the costs of their medications, among other medical costs. If third-party payers do not provide coverage or reimbursement for CABOMETYX or COMETRIQ, our revenues and prospects for profitability will suffer. In addition, even if third-party payers provide some coverage or reimbursement for CABOMETYX or COMETRIQ, the availability of such coverage or reimbursement for prescription drugs under private health insurance and managed care plans often varies based on the type of contract or plan purchased. There has been negative publicity regarding, and increasing legislative ad enforcement interest in the United States with respect to, drug pricing and the use of specialty pharmacies, which may result in physicians being less willing to participate in our patient access programs and thereby limit our ability to increase patient access and adoption of cabozantinib. Specifically, there have been several recent U.S. Congressional inquiries and proposed bills designed to, among other things, bring more transparency to drug pricing, review the relationship between pricing and manufacturer patient programs, reduce the price of drugs under Medicare, and reform government program reimbursement methodologies for drugs. If future legislation were to impose direct governmental price controls and access restrictions, it could have a significant adverse impact on our business and financial results.
In addition, in some foreign countries, particularly in the European Union, the pricing of prescription pharmaceuticals is subject to governmental control. In these countries, price negotiations with governmental authorities can take six to twelve months or longer after marketing authorization is granted for a product, which has the potential to substantially delay broad availability of the product in some of those countries. To obtain reimbursement and/or pricing approval in some countries, we and our collaboration partner, Ipsen, may be required to conduct a clinical trial that compares the cost effectiveness of CABOMETYX to other available therapies. The conduct of such a clinical trial could be expensive and result in delays in the commercialization of CABOMETYX. Third-party payers are challenging the prices charged for medical products and services, and many third-party payers limit reimbursement for newly-approved health care products. In particular, third-party payers may limit the indications for which they will reimburse patients who use CABOMETYX or COMETRIQ. Cost-control initiatives could decrease the price we and our collaboration partner, Ipsen, might establish for CABOMETYX, which would result in lower product revenues to us.
34
Current healthcare laws and regulations and future legislative or regulatory reforms to the healthcare system may affect our ability to sell CABOMETYX and COMETRIQ profitably.
The United States and some foreign jurisdictions are considering or have enacted a number of legislative and regulatory proposals to change the healthcare system in ways that could affect our ability to sell CABOMETYX and COMETRIQ profitably. Among policy makers and payers in the United States and elsewhere, there is significant interest in promoting changes in healthcare systems with the stated goals of containing healthcare costs, improving quality and/or expanding access. In the United States, the pharmaceutical industry has been a particular focus of these efforts and has been significantly affected by major legislative initiatives.
In January 2017, Congress voted to adopt a budget resolution for fiscal year 2017, or the Budget Resolution, that authorizes the implementation of legislation that would repeal portions of PPACA. The Budget Resolution is not a law; however, it is widely viewed as the first step toward the passage of legislation that would repeal certain aspects of PPACA. Further, on January 20, 2017, President Trump signed an Executive Order directing federal agencies with authorities and responsibilities under PPACA to waive, defer, grant exemptions from, or delay the implementation of any provision of PPACA that would impose a fiscal or regulatory burden on states, individuals, healthcare providers, health insurers, or manufacturers of pharmaceuticals or medical devices. Congress also could consider subsequent legislation to replace elements of PPACA that are repealed. Moreover, certain politicians, including the President, have announced plans to regulate the prices of pharmaceutical products. We cannot know what form any such legislation may take or the market’s perception of how such legislation would affect us. Any reduction in reimbursement from government programs may result in a similar reduction in payments from private payers. The implementation of cost containment measures or other healthcare reforms may limit our ability to generate revenue or commercialize our current products and/or those for which we may receive regulatory approval in the future.
As a result of the overall trend towards cost-effectiveness criteria and managed healthcare in the United States, third-party payers are increasingly attempting to contain healthcare costs by limiting both coverage and the level of reimbursement of new drugs. They may use tiered reimbursement and may adversely affect demand for CABOMETYX or COMETRIQ by placing a particular product in an expensive tier. They may also refuse to provide any coverage for uses of approved products for medical indications other than those for which the FDA has granted market approvals. As a result, significant uncertainty exists as to whether and how much third-party payers will reimburse for newly approved drugs, which in turn will put pressure on the pricing of drugs. We also anticipate pricing pressures in connection with the sale of CABOMETYX and COMETRIQ due to the increasing influence of health maintenance organizations and additional legislative proposals. Due to the volatility in the current economic and market dynamics, we are unable to predict the impact of any unforeseen or unknown legislative, regulatory, third-party payer or policy actions, which may include cost containment and healthcare reform measures. Such policy actions could have a material adverse impact on our revenues and prospects for profitability.
Pricing for pharmaceutical products has come under increasing scrutiny by governments, legislative bodies and enforcement agencies. These activities may result in actions that have the effect of reducing our revenue or harming our business or reputation.
Many companies in our industry have received a governmental request for documents and information relating to drug pricing and patient support programs. We may become subject to similar requests, which would require us to incur significant expense and result in distraction for our management team. Additionally, to the extent there are findings, or even allegations, of improper conduct on the part of the company, such findings could further harm our business, reputation and/or prospects. It is possible that such inquiries could result in negative publicity or other negative actions that could harm our reputation; changes in our product pricing and distribution strategies; reduced demand for our approved products and/or reduced reimbursement of approved products, including by federal health care programs such as Medicare and Medicaid and state health care programs.
In addition, the Trump Administration has indicated an interest in taking measures pertaining to drug pricing, including potential proposals relating to Medicare price negotiations, and importation of drugs from other countries. At this time, it is unclear whether any of these proposals will be pursued and how they would impact our products or our future product candidates.
Our competitors may develop products and technologies that impair the value of cabozantinib, cobimetinib and any future product candidates.
The pharmaceutical, biopharmaceutical and biotechnology industries are highly diversified and are characterized by rapid technological change. In particular, the area of novel oncology therapies is a rapidly evolving and competitive field. Specifically, the indication of advanced RCC is highly competitive and several novel therapies and combinations of therapies are in advanced stages of clinical development in this indication, and may compete with or displace cabozantinib. We face, and will continue to face, intense competition from biotechnology, biopharmaceutical and pharmaceutical companies, as well as
35
academic research institutions, clinical reference laboratories and government agencies that are pursuing research activities similar to ours. Some of our competitors have entered into collaborations with leading companies within our target markets, including some of our existing collaborators. Some of our competitors are further along in the development of their products than we are. Delays in the development of cabozantinib or cobimetinib for the treatment of additional tumor types, for example, could allow our competitors to bring products to market before us. Our future success will depend upon our ability to maintain a competitive position with respect to technological advances and the shifting landscape of therapeutic strategy following the advent of immunotherapy. Our products may become less marketable if we are unable to successfully adapt our development strategy to address the likelihood that this new approach to treating cancer with immuno-oncology agents will become prevalent in indications for which our products are approved, most notably advanced RCC, and in additional indications where we may seek regulatory approval. Furthermore, the complexities of such a strategy may require collaboration with some of our competitors.
The markets for which we intend to pursue regulatory approval of cabozantinib and for which Roche and Genentech intend to pursue regulatory approval for cobimetinib are highly competitive. Further, our competitors may be more effective at using their technologies to develop commercial products. Many of the organizations competing with us have greater capital resources, larger research and development staff and facilities, more experience in obtaining regulatory approvals and more extensive product manufacturing and commercial capabilities than we do. As a result, our competitors may be able to more easily develop technologies and products that would render our technologies and products, and those of our collaborators, obsolete and noncompetitive. There may also be drug candidates of which we are not aware at an earlier stage of development that may compete with cabozantinib, cobimetinib, and our other product candidates.
If competitors use litigation and regulatory means to obtain approval for generic versions of cabozantinib, our business will suffer.
Under the FDCA, the FDA can approve an ANDA for a generic version of a branded drug without the applicant undertaking the human clinical testing necessary to obtain approval to market a new drug. The FDA can also approve a 505(b)(2) NDA that relies on the agency’s findings of safety and/or effectiveness for a previously approved drug. The filing of an ANDA or 505(b)(2) NDA with respect to cabozantinib could have an adverse impact on our stock price. Moreover, if any such ANDAs or 505(b)(2) NDAs were to be approved and the patents covering cabozantinib were not upheld in litigation, or if a generic competitor is found not to infringe these patents, the resulting generic competition would negatively affect our business, financial condition and results of operations. In this regard, generic equivalents, which must meet the same quality standards as the branded drugs, would be significantly less costly than ours to bring to market. Companies that produce generic equivalents are generally able to offer their products at lower prices. Thus, regardless of the regulatory approval pathway, after the introduction of a generic competitor, a significant percentage of the sales of any branded product are typically lost to the generic product.
Clinical testing of product candidates is a lengthy, costly, complex and uncertain process and may fail to demonstrate safety and efficacy.
Clinical trials are inherently risky and may reveal that a product candidate, even if it is approved for other indications, is ineffective or has an unacceptable safety profile that may significantly decrease the likelihood of regulatory approval in a new indication. For example, COMET-1 and COMET-2, our two phase 3 pivotal trials of cabozantinib in metastatic castration-resistant prostate cancer, or mCRPC, failed to meet their respective primary endpoints of demonstrating a statistically significant increase in OS for patients treated with cabozantinib as compared to prednisone and to demonstrate improvement in pain response for patients treated by cabozantinib as compared to mitoxantrone/prednisone. Based on the outcome of the COMET trials, we deprioritized the clinical development of cabozantinib in mCRPC.
The results of preliminary studies do not necessarily predict clinical or commercial success, and later-stage clinical trials may fail to confirm the results observed in earlier-stage trials or preliminary studies. Although we have established timelines for manufacturing and clinical development of our product candidates based on existing knowledge of our compounds in development and industry metrics, we may not be able to meet those timelines.
We may experience numerous unforeseen events, during or as a result of clinical testing, that could delay or prevent commercialization of our product candidates, including:
|
•
|
lack of efficacy or harmful side effects;
|
|
•
|
negative or inconclusive clinical trial results may require us to conduct further testing or to abandon projects that we had expected to be promising;
|
|
•
|
our competitors may discover or commercialize other compounds or therapies that show significantly improved safety or efficacy compared to our product candidates;
|
36
|
•
|
our inability to identify and maintain a sufficient number of trial sites, many of which may already be engaged in other clinical trial programs;
|
|
•
|
patient registration or enrollment in our clinical testing may be lower than we anticipate, resulting in the delay or cancellation of clinical testing;
|
|
•
|
failure of our third-party contract research organization or investigators to satisfy their contractual obligations, including deviating from trial protocol; and
|
|
•
|
regulators or institutional review boards may withhold authorization to commence or conduct clinical trials of a product candidate, or delay, suspend or terminate clinical research for various reasons, including noncompliance with regulatory requirements or their determination that participating patients are being exposed to unacceptable health risks.
|
If we were to have significant delays in or termination of our clinical testing of our product candidates as a result of any of the events described above or otherwise, our expenses could increase and our ability to generate revenues could be impaired, either of which could adversely impact our financial results.
We may not be able to rapidly or effectively continue the further development of our product candidates or meet current or future requirements of the FDA or regulatory authorities in other jurisdictions, including those identified based on our discussions with the FDA or such other regulatory authorities. Our planned clinical trials may not begin on time, or at all, may not be completed on schedule, or at all, may not be sufficient for registration of our product candidates or may not result in an approvable product.
Completion of clinical trials may take several years or more, but the length of time generally varies substantially according to the type, complexity, novelty and intended use of the product candidate. The duration and the cost of clinical trials may vary significantly over the life of a project as a result of factors relating to the clinical trial, including, among others:
|
•
|
the number of patients who ultimately participate in the clinical trial;
|
|
•
|
the duration of patient follow-up that is appropriate in view of the results or required by regulatory authorities;
|
|
•
|
the number of clinical sites included in the trials; and
|
|
•
|
the length of time required to enroll suitable patient subjects.
|
Any delay could limit our ability to generate revenues, cause us to incur additional expense and cause the market price of our common stock to decline significantly. Our partners under our collaboration agreements may experience similar risks with respect to the compounds we have out-licensed to them. If any of the events described above were to occur with such programs or compounds, the likelihood of receipt of milestones and royalties under such collaboration agreements could decrease.
The regulatory approval processes of the FDA and comparable foreign regulatory authorities are lengthy and uncertain, and may not result in the necessary regulatory approvals for our product candidates, which could adversely affect our business.
The activities associated with the research, development and commercialization of our products and product candidates, are subject to extensive regulation by the FDA and other regulatory agencies in the United States and by comparable authorities in other countries. We have only limited experience in preparing and filing the applications necessary to gain regulatory approvals. The process of obtaining regulatory approvals in the United States and other foreign jurisdictions is expensive, and often takes many years, if approval is obtained at all, and can vary substantially based upon the type, complexity and novelty of the product candidates involved. For example, before an NDA or sNDA can be submitted to the FDA, or MAA to the EMA or any application or submission to regulatory authorities in other jurisdictions, the product candidate must undergo extensive clinical trials, which can take many years and require substantial expenditures.
Any clinical trial may fail to produce results satisfactory to the FDA or regulatory authorities in other jurisdictions. For example, the FDA could determine that the design of a clinical trial is inadequate to produce reliable results. The regulatory process also requires preclinical testing, and data obtained from preclinical and clinical activities are susceptible to varying interpretations. The FDA has substantial discretion in the approval process and may refuse to approve any NDA or decide that our data is insufficient for approval and require additional preclinical, clinical or other studies. For example, varying interpretations of the data obtained from preclinical and clinical testing could delay, limit or prevent regulatory approval of cabozantinib for any individual, additional indications.
In addition, delays or rejections may be encountered based upon changes in regulatory policy for product approval during the period of product development and regulatory agency review, which may cause delays in the approval or rejection of an application for our product candidates.
37
Even if the FDA or a comparable authority in another jurisdiction approves cabozantinib for an indication beyond advanced RCC and MTC, or one of our other product candidates, the approval may be limited, imposing significant restrictions on the indicated uses, conditions for use, labeling, distribution, advertising, promotion, marketing and/or production of the product and could impose ongoing requirements for post-approval studies, including additional research and development and clinical trials. For example, in connection with the FDA’s approval of COMETRIQ for the treatment of progressive, metastatic MTC, we are subject to post-marketing requirement to conduct a clinical study comparing a lower dose of cabozantinib to the approved dose of 140 mg daily cabozantinib in progressive, metastatic MTC. Failure to complete any post-marketing requirements in accordance with the timelines and conditions set forth by the FDA could significantly increase costs or delay, limit or eliminate the commercialization of cabozantinib. Further, these agencies may also impose various administrative, civil or criminal sanctions for failure to comply with regulatory requirements, including withdrawal of product approval.
We may be unable to expand our development pipeline, which could limit our growth and revenue potential.
We are committed to the discovery, development and promotion of new medicines with the potential to improve care and outcomes for people with cancer. In this regard, we recently resumed internal drug discovery efforts with the goal of identifying new product candidates to advance into clinical trials. Internal discovery efforts to identify new product candidates require substantial technical, financial and human resources. These internal discovery efforts may initially show promise in identifying potential product candidates, yet fail to yield product candidates for clinical development for a number of reasons, including the research methodology used may not be successful in identifying potential product candidates, or potential product candidates may, on further study, be shown to have inadequate efficacy, harmful side effects, suboptimal pharmaceutical profile or other characteristics suggesting that they are unlikely to be effective products. Apart from our internal discovery efforts, our strategy to expand our development pipeline is also dependent on our ability to successfully identify and acquire or in-license relevant product candidates. However, the in-licensing and acquisition of product candidates is a competitive area, and many other companies are pursuing the same or similar product candidates to those that we may consider attractive. Established companies, in particular, may have a competitive advantage over us due to their size, financial resources and more extensive clinical development and commercialization capabilities. Furthermore, companies that perceive us to be a competitor may be unwilling to assign or license rights to us. We may also be unable to in-license or acquire a relevant product candidate on acceptable terms that would allow us to realize an appropriate return on our investment. If we are unable to develop suitable product candidates through internal discovery effort or if we are unable to successfully obtain rights to suitable product candidates, our business, financial condition and prospects for growth could suffer. Even if we succeed in our efforts to obtain rights to suitable product candidates, the competitive business environment may result in higher acquisition or licensing costs.
With respect to acquisitions, we may not be able to integrate the target company successfully into our existing business, maintain the key business relationships of the target, or retain key personnel of an acquired business. Furthermore, we could assume unknown or contingent liabilities or incur unanticipated expenses. Any acquisitions or investments made by us also could result in our spending significant amounts, issuing dilutive securities, assuming or incurring significant debt obligations and contingent liabilities, incurring large one-time expenses and acquiring intangible assets that could result in significant future amortization expense and significant write-offs, any of which could harm our operating results.
Risks Related to Our Capital Requirements and Financial Results
If additional capital is not available to us, we may be forced to limit the expansion of our product development programs or commercialization efforts.
As of
December 31, 2016
, we had
$479.6 million
in cash and investments, which included
$393.8 million
available for operations,
$81.6 million
of compensating balance investments that we are required to maintain on deposit with Silicon Valley Bank, and
$4.2 million
of long-term restricted investments. Our business operations grew substantially during 2016. In order to continue to grow the business and maximize the clinical and commercial opportunities for cabozantinib and cobimetinib, we plan to continue to execute on the U.S. launch of CABOMETYX, while reinvesting in our product pipeline through the continued development of cabozantinib, continued research and development efforts, as well as through in-licensing and acquisition efforts. Our ability to execute on these business objectives will depend on many factors including but not limited to:
|
•
|
the commercial success of both CABOMETYX and COMETRIQ and the revenues we generate from those approved products;
|
|
•
|
costs associated with maintaining our expanded sales, marketing, medical affairs and distribution capabilities for CABOMETYX in advanced RCC and COMETRIQ in the approved MTC indications;
|
|
•
|
the achievement of stated regulatory and commercial milestones under our collaboration with Ipsen;
|
38
|
•
|
the commercial success of Cotellic and the calculation of our share of related profits and losses for the commercialization of Cotellic in the U.S. and royalties from Cotellic sales outside the U.S. under our collaboration with Genentech;
|
|
•
|
the outcome of our arbitration against Genentech in which we have asserted claims related to Genentech’s clinical development, pricing and commercialization of Cotellic, and cost and revenue allocations arising from Cotellic’s commercialization in the United States;
|
|
•
|
the potential regulatory approval of cabozantinib as a treatment for previously untreated advanced RCC and in other indications, both in the United States and abroad;
|
|
•
|
future clinical trial results, notably the results from CELESTIAL, our phase 3 pivotal trial in patients with advanced HCC;
|
|
•
|
our future investments in the expansion of our pipeline through drug discovery and corporate development activities;
|
|
•
|
our repayment and any potential mandatory prepayment of the Secured Convertible Notes due 2018, or the Deerfield Notes, (see “Note 7. Debt” to our “Notes to Consolidated Financial Statements” contained in Part II, Item 8 of this Annual Report on Form 10-K for a description of these notes), which mature on July 1, 2018, and which we intend to repay on or about July 1, 2017;
|
|
•
|
our ability to control costs;
|
|
•
|
our ability to remain in compliance with, or amend or cause to be waived, financial covenants contained in agreements with third parties;
|
|
•
|
the cost of clinical drug supply for our clinical trials;
|
|
•
|
trends and developments in the pricing of oncologic therapeutics in the United States and abroad, especially in the European Union;
|
|
•
|
scientific developments in the market for oncologic therapeutics and the timing of regulatory approvals for competing oncologic therapies; and
|
|
•
|
the filing, maintenance, prosecution, defense and enforcement of patent claims and other intellectual property rights.
|
We have a history of net losses and may incur net losses in the future, and may be unable to achieve and maintain profitability.
We have incurred net losses since inception through
December 31, 2016
, with the exception of the 2011 fiscal year. For the
year ended
December 31, 2016
, we incurred a net loss of
$70.2 million
and as of
December 31, 2016
, we had an accumulated deficit of
$2.0 billion
. These losses have had an adverse effect on our stockholders’ equity (deficit) and working capital. Because of the numerous risks and uncertainties associated with developing and commercializing drugs, we are unable to predict the extent of any future losses. Excluding fiscal 2011, our research and development expenditures and selling, general and administrative expenses have exceeded our revenues for each fiscal year, and we expect to spend significant additional amounts to fund the continued development and commercialization of cabozantinib. In addition, we plan to expand our product pipeline through the resumption of drug discovery and product acquisition and in-licensing. As a result, we expect to continue to incur substantial operating expenses and, consequently, we will need to generate substantial revenues to achieve and maintain profitability.
Since the launch of our first commercial product in January 2013, through
December 31, 2016
, we have generated an aggregate of
$209.7 million
in net product revenues, including
$135.4 million
for the year ended
December 31, 2016
. Other than sales of CABOMETYX and COMETRIQ, we have derived substantially all of our revenues since inception from collaborative arrangements, including upfront and milestone payments and research funding we earn from any products developed from the collaborative research. The amount of our net profits or losses will depend, in part, on: the level of sales of CABOMETYX and COMETRIQ in the United States; achievement of clinical, regulatory and commercial milestones and the amount of royalties, if any, from sales of CABOMETYX and COMETRIQ under our collaboration with Ipsen; our share of the net profits and losses for the commercialization of Cotellic in the U.S. under our collaboration with Genentech; the amount of royalties from Cotellic sales outside the U.S. under our collaboration with Genentech; other license and contract revenues; and, the level of our expenses, including commercialization activities for cabozantinib and any pipeline expansion efforts.
Our significant level of indebtedness
could limit cash flow available for our operations and expose us to risks that could adversely affect our business, financial condition and results of operations.
We have significant indebtedness and substantial debt service requirements as a result of the Deerfield Notes and our loan and security agreement with Silicon Valley Bank. As of
December 31, 2016
, our total consolidated indebtedness through
39
maturity was
$205.0 million
(excluding trade payables). Our outstanding debt under our loan and security agreement with Silicon Valley Bank of $81.6 million will become due and payable in May 2018. We may also incur additional indebtedness to meet future financing needs. If we incur additional indebtedness, it would increase our interest expense, leverage and operating and financial costs.
Our current and any potential future indebtedness could have significant negative consequences for our business, results of operations and financial condition, including:
|
•
|
increasing our vulnerability to adverse economic and industry conditions;
|
|
•
|
limiting our ability to obtain additional financing;
|
|
•
|
requiring the dedication of a substantial portion of our cash flow from operations to service our indebtedness, thereby reducing the amount of our cash flow available for other purposes, including clinical trials, research and development, capital expenditures, working capital and other general corporate purposes;
|
|
•
|
limiting our flexibility in planning for, or reacting to, changes in our business;
|
|
•
|
dilution experienced by our existing stockholders as a result of a conversion of the Deerfield Notes, at our discretion, into shares of common stock; and
|
|
•
|
placing us at a possible competitive disadvantage with less leveraged competitors and competitors that may have better access to capital resources.
|
We cannot assure you that we will continue to maintain sufficient cash reserves or that our business will generate cash flow from operations at levels sufficient to permit us to pay principal, premium, if any, and interest on our indebtedness, or that our cash needs will not increase. If we are unable to generate sufficient cash flow or otherwise obtain funds necessary to make required payments or planned early repayments, or if we fail to comply with the various covenants imposed under the terms of the Deerfield Notes, or any indebtedness which we have incurred or may incur in the future, we would be in default, which would permit the holders of the Deerfield Notes or other indebtedness to accelerate the maturity of such notes or other indebtedness and could cause defaults under the Deerfield Notes, or our other indebtedness. Any default under the Deerfield Notes, or any indebtedness that we have incurred or may incur in the future could have a material adverse effect on our business, results of operations and financial condition.
We are exposed to risks related to foreign currency exchange rates.
Most of our foreign expenses incurred are associated with establishing and conducting clinical trials for cabozantinib. The amount of these expenses will be impacted by fluctuations in the currencies of those countries in which we conduct clinical trials. Our agreements with the foreign sites that conduct such clinical trials generally provide that payments for the services provided will be calculated in the currency of that country, and converted into U.S. dollars using various exchange rates based upon when services are rendered or the timing of invoices. When the U.S. dollar weakens against foreign currencies, the U.S. dollar value of the foreign-currency denominated expense increases, and when the U.S. dollar strengthens against these currencies, the U.S. dollar value of the foreign-currency denominated expense decreases. Consequently, changes in exchange rates may affect our financial position and results of operations.
Global credit and financial market conditions could negatively impact the value of our current portfolio of cash equivalents, short-term investments or long-term investments and our ability to meet our financing objectives.
Our cash and cash equivalents are maintained in highly liquid investments with remaining maturities of 90 days or less at the time of purchase. Our short-term and long-term investments consist primarily of readily marketable debt securities with remaining maturities of more than 90 days at the time of purchase. While as of the date of this report we are not aware of any downgrades, material losses, or other significant deterioration in the fair value of our cash equivalents, short-term investments or long-term investments since
December 31, 2016
, no assurance can be given that a deterioration in conditions of the global credit and financial markets would not negatively impact our current portfolio of cash equivalents or investments or our ability to meet our financing objectives.
Our financial results are impacted by management’s selection of accounting methods and certain assumptions and estimates.
Our accounting policies and methods are fundamental to how we record and report our financial condition and results of operations. Our management must exercise judgment in selecting and applying many of these accounting policies and methods so they comply with generally accepted accounting principles and reflect management’s judgment of the most appropriate manner to report our financial condition and results of operations. In some cases, management must select the accounting policy or method to apply from two or more alternatives, any of which may be reasonable under the circumstances, yet may result in our reporting materially different results than would have been reported under a different alternative.
40
Certain accounting policies are critical to the presentation of our financial condition and results of operations. The preparation of our financial statements requires us to make significant estimates, assumptions and judgments that affect the amounts of assets, liabilities, revenues and expenses and related disclosures. Significant estimates that may be made by us include assumptions used in the determination of revenue recognition, discounts and allowances from gross revenue, inventory and stock-based compensation. Although we base our estimates and judgments on historical experience, our interpretation of existing accounting literature and on various other assumptions that we believe to be reasonable under the circumstances, if our assumptions prove to be materially incorrect, actual results may differ materially from these estimates.
In addition, future changes in financial accounting standards may cause adverse, unexpected revenue fluctuations and affect our financial position or results of operations. New pronouncements and varying interpretations of pronouncements have occurred with frequency in the past and are expected to occur again in the future and as a result we may be required to make changes in our accounting policies. Those changes could adversely affect our reported revenues and expenses, prospects for profitability or financial position. For example, in May 2014, the Financial Accounting Standards Board issued an Accounting Standards Update entitled Accounting Standards Update No. 2014-09,
Revenue from Contracts with Customers (Topic 606)
, or ASU 2014-09, which will replace existing revenue recognition guidance in U.S. generally accepted accounting pronouncements when it becomes effective for us in the first quarter of fiscal year 2018. We do not expect that ASU 2014-09 will have a material impact on the recognition of revenue from product sales. We are still in the process of evaluating the effect that this guidance will have on revenue recognition from our collaboration and license agreements, such as our arrangements with Ipsen and Genentech. In any event, we will continue to evaluate the impact of the new standard on all of our revenues, including those mentioned above, and our preliminary assessments may change in the future based on our continuing evaluation. The application of existing or future financial accounting standards, particularly those relating to the way we account for revenues and costs, could have a significant impact on our reported results.
Risks Related to Our Relationships with Third Parties
We are dependent upon our collaborations with major companies, which subjects us to a number of risks.
We have established collaborations with leading pharmaceutical and biotechnology companies, including, Ipsen, Genentech, Daiichi Sankyo, Merck (known as MSD outside of the United States and Canada), BMS and Sanofi for the development and ultimate commercialization of certain compounds generated from our research and development efforts. Our dependence on our relationships with existing collaborators for the development and commercialization of compounds under the collaborations subjects us to, and our dependence on future collaborators for development and commercialization of additional compounds will subject us to, a number of risks, including:
|
•
|
we are not able to control the amount and timing of resources that our collaborators or potential future collaborators will devote to the development or commercialization of drug candidates or to their marketing and distribution;
|
|
•
|
we are not able to control the U.S. commercial resourcing decisions made and resulting costs incurred by Genentech for cobimetinib, which reasonable costs we are obligated to share, in part, under our collaboration agreement with Genentech;
|
|
•
|
collaborators may delay clinical trials, provide insufficient funding for a clinical trial program, stop a clinical trial or abandon a drug candidate, repeat or conduct new clinical trials or require a new formulation of a drug candidate for clinical testing;
|
|
•
|
disputes may arise between us and our collaborators that result in the delay or termination of the research, development or commercialization of our drug candidates, or that diminish or delay receipt of the economic benefits we are entitled to receive under the collaboration, or that result in costly litigation or arbitration that diverts management’s attention and resources;
|
|
•
|
collaborators may experience financial difficulties;
|
|
•
|
collaborators may not be successful in their efforts to obtain regulatory approvals in a timely manner, or at all;
|
|
•
|
collaborators may not properly maintain or defend our intellectual property rights or may use our proprietary information in such a way as to invite litigation that could jeopardize or invalidate our proprietary information or expose us to potential litigation;
|
|
•
|
collaborators may not comply with applicable healthcare regulatory laws;
|
|
•
|
business combinations or significant changes in a collaborator’s business strategy may adversely affect a collaborator’s willingness or ability to complete its obligations under any arrangement;
|
|
•
|
a collaborator could independently move forward with a competing drug candidate developed either independently or in collaboration with others, including our competitors;
|
41
|
•
|
we may be precluded from entering into additional collaboration arrangements with other parties in an area or field of exclusivity;
|
|
•
|
future collaborators may require us to relinquish some important rights, such as marketing and distribution rights; and
|
|
•
|
collaborations may be terminated or allowed to expire, which would delay, and may increase the cost of development of our drug candidates.
|
If any of these risks materialize, we may not receive collaboration revenue or otherwise realize anticipated benefits from such collaborations, our product development efforts could be delayed and our business, operating results and financial condition could be adversely affected.
If third parties upon which we rely do not perform as contractually required or expected, we may not be able to obtain regulatory approval for or commercialize cabozantinib for the treatment of additional indications beyond advanced RCC and MTC.
We do not have the ability to conduct clinical trials for cabozantinib independently, including our post-marketing commitments in connection with the approvals of CABOMETYX in advanced RCC and COMETRIQ in progressive, metastatic MTC, so we rely on independent third parties for the performance of these trials, such as the U.S. federal government (including NCI-CTEP, a department of the NIH, with whom we have our CRADA), third-party contract research organizations, medical institutions, clinical investigators and contract laboratories to conduct our clinical trials. If these third parties do not successfully carry out their contractual duties or regulatory obligations or meet expected deadlines, if the third parties must be replaced or if the quality or accuracy of the data they generate or provide is compromised due to their failure to adhere to our clinical protocols or regulatory requirements or for other reasons, our preclinical development activities or clinical trials may be extended, delayed, suspended or terminated, and we may not be able to obtain regulatory approval for or commercialize cabozantinib for additional indications beyond the advanced RCC and MTC.
We lack the manufacturing capabilities necessary for us to produce cabozantinib for clinical development or for commercial sale and rely on third parties to do so, which subjects us to various risks.
We do not own or operate manufacturing or distribution facilities or resources for clinical or commercial production and distribution of CABOMETYX and COMETRIQ. Instead, we have multiple contractual agreements in place with third party CMOs who, on our behalf, manufacture clinical and commercial supplies of CABOMETYX and COMETRIQ, and will continue to do so for the foreseeable future. To establish and manage this supply chain requires a significant financial commitment and the creation and maintenance of numerous third-party contractual relationships. Although we maintain significant resources to directly oversee the business activities and relationships with companies in our supply chain effectively, we do not have direct control over their operations. Our third party manufacturers may not be able to produce material on a timely basis or manufacture material with the required quality standards, or in the quantity required to meet our development and commercial needs and applicable regulatory requirements. Additionally, as part of our collaboration with Ipsen, we are responsible for the manufacturing and supply of finished, labeled cabozantinib products to Ipsen through the end of the second quarter of 2018. Failure to meet our supply obligations under the collaboration would impair Ipsen’s ability to successfully commercialize cabozantinib and reduce revenues to which we are entitled under the collaboration.
If our third party contract manufacturers and suppliers do not continue to supply us with our products or product candidates in a timely fashion and in compliance with applicable quality and regulatory requirements, or otherwise fail or refuse to comply with their obligations to us under our supply and manufacturing arrangements, we may not have adequate remedies for any breach, and their failure to supply us could impair or preclude our ability to meet our and/or Ipsen’s commercial needs, or our supply needs for clinical trials.
Risks Related to Our Intellectual Property
Data breaches and cyber-attacks could compromise our intellectual property or other sensitive information and cause significant damage to our business and reputation.
In the ordinary course of our business, we collect, maintain and transmit sensitive data on our networks and systems, including our intellectual property and proprietary or confidential business information (such as research data and personal information) and confidential information with respect to our customers, clinical trial patients and our business partners. We have also outsourced significant elements of our information technology infrastructure and, as a result, third parties may or could have access to our confidential information. The secure maintenance of this information is critical to our business and reputation. We believe that companies have been increasingly subject to a wide variety of security incidents, cyber-attacks and other attempts to gain unauthorized access. These threats can come from a variety of sources, ranging in sophistication from an
42
individual hacker to a state-sponsored attack and motive (including corporate espionage). Cyber threats may be generic, or they may be custom-crafted against our information systems. Cyber-attacks continue to become more prevalent and much harder to detect and defend against. Our network and storage applications and those of our vendors may be subject to unauthorized access by hackers or breached due to operator error, malfeasance or other system disruptions. It is often difficult to anticipate or immediately detect such incidents and the damage caused by such incidents. These data breaches and any unauthorized access or disclosure of our information or intellectual property could compromise our intellectual property and expose sensitive business information. A data security breach could also lead to public exposure of personal information of our clinical trial patients, customers and others. Cyber-attacks could cause us to incur significant remediation costs, result in product development delays, disrupt key business operations and divert attention of management and key information technology resources. Our network security and data recovery measures and those of our vendors may not be adequate to protect against such security breaches and disruptions. These incidents could also subject us to liability, expose us to significant expense and cause significant harm to our reputation and business.
If we are unable to adequately protect our intellectual property, third parties may be able to use our technology, which could adversely affect our ability to compete in the market.
Our success will depend in part upon our ability to obtain patents and maintain adequate protection of the intellectual property related to our technologies and products. The patent positions of biopharmaceutical companies, including our patent position, are generally uncertain and involve complex legal and factual questions. We will be able to protect our intellectual property rights from unauthorized use by third parties only to the extent that our technologies are covered by valid and enforceable patents or are effectively maintained as trade secrets. We will continue to apply for patents covering our technologies and products as, where and when we deem appropriate. However, these applications may be challenged or may fail to result in issued patents. Our issued patents have been and may in the future be challenged by third parties as invalid or unenforceable under U.S. or foreign laws, or they may be infringed by third parties. As a result, we are from time to time involved in the defense and enforcement of our patents or other intellectual property rights in a court of law, U.S. Patent and Trademark Office inter partes review or reexamination proceeding, foreign opposition proceeding or related legal and administrative proceeding in the United States and elsewhere. The costs of defending our patents or enforcing our proprietary rights in post-issuance administrative proceedings and litigation may be substantial and the outcome can be uncertain. An adverse outcome may allow third parties to use our intellectual property without a license and negatively impact our business.
In addition, because patent applications can take many years to issue, third parties may have pending applications, unknown to us, which may later result in issued patents that cover the production, manufacture, commercialization or use of our product candidates. Our existing patents and any future patents we obtain may not be sufficiently broad to prevent others from practicing our technologies or from developing competing products. Furthermore, others may independently develop similar or alternative technologies or design around our patents. In addition, our patents may be challenged or invalidated or may fail to provide us with any competitive advantages, if, for example, others were the first to invent or to file patent applications for closely related inventions.
The laws of some foreign countries do not protect intellectual property rights to the same extent as the laws of the United States, and many companies have encountered significant problems in protecting and defending such rights in foreign jurisdictions. Many countries, including certain countries in Europe, have compulsory licensing laws under which a patent owner may be compelled to grant licenses to third parties (for example, the patent owner has failed to “work” the invention in that country or the third party has patented improvements). In addition, many countries limit the enforceability of patents against government agencies or government contractors. In these countries, the patent owner may have limited remedies, which could materially diminish the value of the patent. Compulsory licensing of life-saving drugs is also becoming increasingly popular in developing countries either through direct legislation or international initiatives. Such compulsory licenses could be extended to include our products or product candidates, which could limit our potential revenue opportunities. Moreover, the legal systems of certain countries, particularly certain developing countries, do not favor the aggressive enforcement of patent and other intellectual property protection, which makes it difficult to stop infringement. We rely on trade secret protection for some of our confidential and proprietary information. We have taken security measures to protect our proprietary information and trade secrets, but these measures may not provide adequate protection. While we seek to protect our proprietary information by entering into confidentiality agreements with employees, collaborators and consultants, we cannot assure you that our proprietary information will not be disclosed, or that we can meaningfully protect our trade secrets. In addition, our competitors may independently develop substantially equivalent proprietary information or may otherwise gain access to our trade secrets.
Litigation or third-party claims of intellectual property infringement could require us to spend substantial time and money and adversely affect our ability to develop and commercialize products.
Our commercial success depends in part upon our ability to avoid infringing patents and proprietary rights of third parties and not to breach any licenses that we have entered into with regard to our technologies and the technologies of third parties. Other parties have filed, and in the future are likely to file, patent applications covering products and technologies that
43
we have developed or intend to develop. If patents covering technologies required by our operations are issued to others, we may have to obtain licenses from third parties, which may not be available on commercially reasonable terms, or at all, and may require us to pay substantial royalties, grant a cross-license to some of our patents to another patent holder or redesign the formulation of a product candidate so that we do not infringe third-party patents, which may be impossible to obtain or could require substantial time and expense. Third parties may accuse us of employing their proprietary technology without authorization. In addition, third parties may obtain patents that relate to our technologies and claim that use of such technologies infringes on their patents. Regardless of their merit, such claims could require us to incur substantial costs, including the diversion of management and technical personnel, in defending ourselves against any such claims or enforcing our patents. In the event that a successful claim of infringement is brought against us, we may be required to pay damages and obtain one or more licenses from third parties. We may not be able to obtain these licenses at a reasonable cost, or at all. Defense of any lawsuit or failure to obtain any of these licenses could adversely affect our ability to develop and commercialize products.
We may be subject to damages resulting from claims that we, our employees or independent contractors have wrongfully used or disclosed alleged trade secrets of their former employers.
Many of our employees and independent contractors were previously employed at universities or other biotechnology, biopharmaceutical or pharmaceutical companies, including our competitors or potential competitors. We may be subject to claims that these employees, independent contractors or we have inadvertently or otherwise used or disclosed trade secrets or other proprietary information of their former employers, or used or sought to use patent inventions belonging to their former employers. Litigation may be necessary to defend against these claims. Even if we are successful in defending against these claims, litigation could result in substantial costs and divert management’s attention. If we fail in defending such claims, in addition to paying money claims, we may lose valuable intellectual property rights or personnel. A loss of key research personnel and/or their work product could hamper or prevent our ability to commercialize certain product candidates, which could severely harm our business.
Risks Related to Employees and Location
If we are unable to manage our growth, our business, financial condition, results of operations and prospects may be adversely affected.
We have experienced and expect to continue to experience growth in the number of our employees and in the scope of our operations. This growth places significant demands on our management, operational and financial resources, and our current and planned personnel, systems, procedures and controls may not be adequate to support our growth. To effectively manage our growth, we must continue to improve existing, and implement new, operational and financial systems, procedures and controls and must expand, train and manage our growing employee base, and there can be no assurance that we will effectively manage our growth without experiencing operating inefficiencies or control deficiencies. We expect that we may need to increase our management personnel to oversee our expanding operations, and recruiting and retaining qualified individuals is difficult. In addition, the physical expansion of our operations may lead to significant costs and may divert our management and capital resources. If we are unable to manage our growth effectively, or are unsuccessful in recruiting qualified management personnel, our business, financial condition, results of operations and prospects may be adversely affected.
The loss of key personnel or the inability to retain and, where necessary, attract additional personnel could impair our ability to operate and expand our operations.
We are highly dependent upon the principal members of our management, as well as clinical, commercial and scientific staff, the loss of whose services might adversely impact the achievement of our objectives. Also, we may not have sufficient personnel to execute our business plan. Retaining and, where necessary, recruiting qualified clinical, commercial and scientific personnel will be critical to support activities related to advancing the development program for cabozantinib and our other compounds, successfully executing upon our commercialization plan for cabozantinib and our internal proprietary research and development efforts. Competition is intense for experienced clinical, commercial and scientific personnel, and we may be unable to retain or recruit such personnel with the expertise or experience necessary to allow us to successfully develop and commercialize our products. Further, all of our employees are employed “at will” and, therefore, may leave our employment at any time.
Our collaborations with outside scientists may be subject to restriction and change.
We work with scientific and clinical advisors and collaborators at academic and other institutions that assist us in our research and development efforts. These advisors and collaborators are not our employees and may have other commitments that limit their availability to us. Although these advisors and collaborators generally agree not to do competing work, if a conflict of interest between their work for us and their work for another entity arises, we may lose their services. In such a
44
circumstance, we may lose work performed by them, and our development efforts with respect to the matters on which they were working may be significantly delayed or otherwise adversely affected. In addition, although our advisors and collaborators sign agreements not to disclose our confidential information, it is possible that valuable proprietary knowledge may become publicly known through them.
Our headquarters are located near known earthquake fault zones, and the occurrence of an earthquake or other disaster could damage our facilities and equipment, which could harm our operations.
Our headquarters are located in South San Francisco, California, and therefore our facilities are vulnerable to damage from earthquakes. We do not carry earthquake insurance. We are also vulnerable to damage from other types of disasters, including fire, floods, power loss, communications failures, terrorism and similar events since any insurance we may maintain may not be adequate to cover our losses. If any disaster were to occur, our ability to operate our business at our facilities could be seriously, or potentially completely, impaired. In addition, the unique nature of our research activities could cause significant delays in our programs and make it difficult for us to recover from a disaster. Accordingly, an earthquake or other disaster could materially and adversely harm our ability to conduct business.
Facility security breaches may disrupt our operations, subject us to liability and harm our operating results.
Any break-in or trespass at our facilities that results in the misappropriation, theft, sabotage or any other type of security breach with respect to our proprietary and confidential information, including research or clinical data, or that results in damage to our research and development equipment and assets, could subject us to liability and have a material adverse impact on our business, operating results and financial condition.
Risks Related to Environmental and Product Liability
We use hazardous chemicals and radioactive and biological materials in our business. Any claims relating to improper handling, storage or disposal of these materials could be time consuming and costly.
Our research and development processes involve the controlled use of hazardous materials, including chemicals and radioactive and biological materials. Our operations produce hazardous waste products. We cannot eliminate the risk of accidental contamination or discharge and any resultant injury from these materials. Federal, state and local laws and regulations govern the use, manufacture, storage, handling and disposal of hazardous materials. We may face liability for any injury or contamination that results from our use or the use by third parties of these materials, and such liability may exceed our insurance coverage and our total assets. Compliance with environmental laws and regulations may be expensive, and current or future environmental regulations may impair our research, development and production efforts.
In addition, our collaborators may use hazardous materials in connection with our collaborative efforts. In the event of a lawsuit or investigation, we could be held responsible for any injury caused to persons or property by exposure to, or release of, these hazardous materials used by these parties. Further, we may be required to indemnify our collaborators against all damages and other liabilities arising out of our development activities or products produced in connection with these collaborations.
We face potential product liability exposure far in excess of our limited insurance coverage.
We may be held liable if any product we or our collaborators develop or commercialize causes injury or is found otherwise unsuitable during product testing, manufacturing, marketing or sale. Regardless of merit or eventual outcome, product liability claims could result in decreased demand for our products and product candidates, injury to our reputation, withdrawal of patients from our clinical trials, product recall, substantial monetary awards to third parties and the inability to commercialize any products that we may develop. These claims might be made directly by consumers, health care providers, pharmaceutical companies or others selling or testing our products. We have obtained limited product liability insurance coverage for our clinical trials and commercial activities for cabozantinib in the amount of $20.0 million per occurrence and $20.0 million in the aggregate. However, our insurance may not reimburse us or may not be sufficient to reimburse us for expenses or losses we may suffer. Moreover, if insurance coverage becomes more expensive, we may not be able to maintain insurance coverage at a reasonable cost or in sufficient amounts to protect us against losses due to liability. On occasion, juries have awarded large judgments in class action lawsuits for claims based on drugs that had unanticipated side effects. In addition, the pharmaceutical, biopharmaceutical and biotechnology industries, in general, have been subject to significant medical malpractice litigation. A successful product liability claim or series of claims brought against us could harm our reputation and business and would decrease our cash reserves.
45
Risks Related to Our Common Stock
We expect that our quarterly results of operations will fluctuate, and this fluctuation could cause our stock price to decline, causing investor losses.
Our quarterly operating results have fluctuated in the past and are likely to fluctuate in the future. A number of factors, many of which we cannot control, could subject our operating results to volatility, including:
|
•
|
the commercial success of both CABOMETYX and COMETRIQ and the revenues we generate from those approved products;
|
|
•
|
customer ordering patterns for CABOMETYX and COMETRIQ, which may vary significantly from period to period;
|
|
•
|
the overall level of demand for CABOMETYX and COMETRIQ, including the impact of any competitive products and the duration of therapy for patients receiving CABOMETYX or COMETRIQ;
|
|
•
|
costs associated with maintaining our expanded sales, marketing, medical affairs and distribution capabilities for CABOMETYX, COMETRIQ and Cotellic;
|
|
•
|
our ability to obtain regulatory approval for cabozantinib as a treatment of first-line advanced RCC;
|
|
•
|
the achievement of stated regulatory and commercial milestones, under our collaboration with Ipsen;
|
|
•
|
the outcome of our arbitration against Genentech in which we have asserted claims related to Genentech’s clinical development, pricing and commercialization of Cotellic, and cost and revenue allocations arising from Cotellic’s commercialization in the United States;
|
|
•
|
the progress and scope of other development and commercialization activities for cabozantinib and our other compounds;
|
|
•
|
future clinical trial results, notably the results from CELESTIAL, our phase 3 pivotal trial in patients with advanced HCC;
|
|
•
|
our future investments in the expansion of our pipeline through drug discovery and corporate development activities;
|
|
•
|
the inability to obtain adequate product supply for any approved drug product or inability to do so at acceptable prices;
|
|
•
|
recognition of upfront licensing or other fees or revenues;
|
|
•
|
payments of non-refundable upfront or licensing fees, or payment for cost-sharing expenses, to third parties;
|
|
•
|
the introduction of new technologies or products by our competitors;
|
|
•
|
the timing and willingness of collaborators to further develop or, if approved, commercialize our product candidates out-licensed to them;
|
|
•
|
the termination or non-renewal of existing collaborations or third party vendor relationships;
|
|
•
|
regulatory actions with respect to our product candidates and any approved products or our competitors’ products;
|
|
•
|
disputes or other developments relating to proprietary rights, including patents, litigation matters and our ability to obtain patent protection for our technologies;
|
|
•
|
the timing and amount of expenses incurred for clinical development and manufacturing of cabozantinib;
|
|
•
|
adjustments to expenses accrued in prior periods based on management’s estimates after the actual level of activity relating to such expenses becomes more certain;
|
|
•
|
the impairment of acquired goodwill and other assets;
|
|
•
|
additions and departures of key personnel;
|
|
•
|
general and industry-specific economic conditions that may affect our or our collaborators’ research and development expenditures; and
|
|
•
|
other factors described in this “Risk Factors” section.
|
Due to the possibility of fluctuations in our revenues and expenses, we believe that quarter-to-quarter comparisons of our operating results are not a good indication of our future performance. As a result, in some future quarters, our operating results may not meet the expectations of securities analysts and investors, which could result in a decline in the price of our common stock.
46
Our stock price may be extremely volatile.
The trading price of our common stock has been highly volatile, and we believe the trading price of our common stock will remain highly volatile and may fluctuate substantially due to factors such as the following, many of which we cannot control:
|
•
|
adverse results or delays in our or our collaborators’ clinical trials;
|
|
•
|
the announcement of FDA approval or non-approval, or delays in the FDA review process, of cabozantinib or our collaborators’ product candidates or those of our competitors or actions taken by regulatory agencies with respect to our, our collaborators’ or our competitors’ clinical trials;
|
|
•
|
the commercial success of both CABOMETYX and COMETRIQ and the revenues we generate from those approved products;
|
|
•
|
the timing of achievement of our clinical, regulatory, partnering and other milestones, such as the commencement of clinical development, the completion of a clinical trial, the filing for regulatory approval or the establishment of collaborative arrangements for cabozantinib or any of our other programs or compounds;
|
|
•
|
actions taken by regulatory agencies with respect to cabozantinib or our clinical trials for cabozantinib;
|
|
•
|
the announcement of new products by our competitors;
|
|
•
|
quarterly variations in our or our competitors’ results of operations;
|
|
•
|
developments in our relationships with our collaborators, including the termination or modification of our agreements;
|
|
•
|
the announcement of an in-licensed product candidate or strategic acquisition;
|
|
•
|
conflicts or litigation with our collaborators, including the outcome of our arbitration with Genentech regarding Cotellic;
|
|
•
|
litigation, including intellectual property infringement and product liability lawsuits, involving us;
|
|
•
|
failure to achieve operating results projected by securities analysts;
|
|
•
|
changes in earnings estimates or recommendations by securities analysts;
|
|
•
|
the satisfaction of outstanding debt obligations or entry into new financing arrangements;
|
|
•
|
developments in the biotechnology, biopharmaceutical or pharmaceutical industry;
|
|
•
|
sales of large blocks of our common stock or sales of our common stock by our executive officers, directors and significant stockholders;
|
|
•
|
departures of key personnel or board members;
|
|
•
|
FDA or international regulatory actions;
|
|
•
|
third-party coverage and reimbursement policies;
|
|
•
|
disposition of any of our technologies or compounds; and
|
|
•
|
general market, economic and political conditions and other factors, including factors unrelated to our operating performance or the operating performance of our competitors.
|
These factors, as well as general economic, political and market conditions, may materially adversely affect the market price of our common stock. In addition, the stock markets in general, and the markets for biotechnology and pharmaceutical stocks in particular, have historically experienced significant volatility that has often been unrelated or disproportionate to the operating performance of particular companies. For example, negative publicity regarding drug pricing and price increases by pharmaceutical companies has negatively impacted, and may continue to negatively impact, the markets for biotechnology and pharmaceutical stocks. Likewise, as a result of the United Kingdom’s pending withdrawal from the European Union and/or significant changes in U.S. social, political, regulatory and economic conditions or in laws and policies governing foreign trade and health care spending and delivery, including the potential repeal and/or replacement of all or portions of PPACA or greater restrictions on free trade stemming from Trump Administration policies, the financial markets could experience significant volatility that could also negatively impact the markets for biotechnology and pharmaceutical stocks. These broad market fluctuations have adversely affected and may in the future adversely affect the trading price of our common stock. Excessive volatility may continue for an extended period of time following the date of this report.
In the past, following periods of volatility in the market price of a company’s securities, securities class action litigation has often been instituted. A securities class action suit against us could result in substantial costs and divert management’s attention and resources, which could have a material and adverse effect on our business.
47
Future sales of our common stock or conversion of the Deerfield Notes, or the perception that such sales or conversions may occur, may depress our stock price.
A substantial number of shares of our common stock are reserved for issuance upon the exercise of stock options, upon vesting of restricted stock unit, or RSU, awards, upon a purchase under our employee stock purchase program, upon exercise of certain outstanding warrants and upon conversion of the Deerfield Notes. The issuance and sale of substantial amounts of our common stock, including upon conversion of the Deerfield Notes, or the perception that such issuances and sales may occur, could adversely affect the market price of our common stock and impair our ability to raise capital through the sale of additional equity or equity-related securities in the future at a time and price that we deem appropriate.
Certain provisions applicable to the Deerfield Notes could delay or prevent an otherwise beneficial takeover or takeover attempt.
Certain provisions applicable to the Deerfield Notes and the note purchase agreement governing the Deerfield Notes, could make it more difficult or more expensive for a third party to acquire us. For example, if an acquisition event constitutes a Major Transaction under the note purchase agreement governing the Deerfield Notes, holders of the Deerfield Notes will have the right to require us to purchase their notes in cash. In this case, and in other cases, our obligations under the Deerfield Notes and the note purchase agreement governing the Deerfield Notes, could increase the cost of acquiring us or otherwise discourage a third party from acquiring us or removing incumbent management.
Anti-takeover provisions in our charter documents and under Delaware law could make an acquisition of us, which may be beneficial to our stockholders, more difficult and may prevent or deter attempts by our stockholders to replace or remove our current management, which could cause the market price of our common stock to decline.
Provisions in our corporate charter and bylaws may discourage, delay or prevent an acquisition of us, a change in control, or attempts by our stockholders to replace or remove members of our current Board of Directors. Because our Board of Directors is responsible for appointing the members of our management team, these provisions could in turn affect any attempt by our stockholders to replace current members of our management team. These provisions include:
|
•
|
a classified Board of Directors;
|
|
•
|
a prohibition on actions by our stockholders by written consent;
|
|
•
|
the inability of our stockholders to call special meetings of stockholders;
|
|
•
|
the ability of our Board of Directors to issue preferred stock without stockholder approval, which could be used to institute a “poison pill” that would work to dilute the stock ownership of a potential hostile acquirer, effectively preventing acquisitions that have not been approved by our Board of Directors;
|
|
•
|
limitations on the removal of directors; and
|
|
•
|
advance notice requirements for director nominations and stockholder proposals.
|
Moreover, because we are incorporated in Delaware, we are governed by the provisions of Section 203 of the Delaware General Corporation Law, which prohibits a person who owns in excess of 15% of our outstanding voting stock from merging or combining with us for a period of three years after the date of the transaction in which the person acquired in excess of 15% of our outstanding voting stock, unless the merger or combination is approved in a prescribed manner.
Our ability to use net operating losses to offset future taxable income may be subject to limitations.
Under the Internal Revenue Code, or the Code, and similar state provisions, certain substantial changes in our ownership could result in an annual limitation on the amount of net operating loss carry-forwards that can be utilized in future years to offset future taxable income. The annual limitation may result in the expiration of net operating losses and credit carry-forwards before utilization. We concluded, as of December 31, 2016, that an ownership change, as defined under Section 382, had not occurred. However, if there is an ownership change under Section 382 of the Code in the future, we may not be able to utilize a material portion of our net operating losses, or NOLs. Furthermore, our ability to utilize our NOLs is conditioned upon our attaining profitability and generating United States federal taxable income. As described above, we have incurred significant net losses since our inception; thus, we do not know whether or when we will generate the United States federal taxable income necessary to utilize our NOLs. A full valuation allowance has been provided for the entire amount of our NOLs.
|
ITEM 1B.
|
UNRESOLVED STAFF COMMENTS
|
None.
48
|
ITEM 2.
|
PROPERTIES
|
We lease a total of 247,027 square feet of office and laboratory facilities in South San Francisco, California. The leased premises comprise four buildings and are covered by three lease agreements, as follows:
|
•
|
The first two leases cover two buildings for a total of 130,964 square feet and expire in May 2017. We have subleased a total of 93,243 square feet of portions of these buildings to five different subtenants. The terms of the subleases expire at the end of our lease terms.
|
|
•
|
The third lease covers two buildings for a total of 116,063 square feet and expires in June 2018. We have one five-year options to extend the term of the lease prior to expiration.
|
We believe that our leased facilities have sufficient space to accommodate our current needs.
|
ITEM 3.
|
LEGAL PROCEEDINGS
|
On June 3, 2016, we filed a Demand for Arbitration before JAMS in San Francisco, California asserting claims against Genentech (a member of the Roche Group) related to its clinical development, pricing and commercialization of Cotellic, and cost and revenue allocations arising from Cotellic’s commercialization in the United States.
In December 2006, we entered into a worldwide collaboration for the development and commercialization of cobimetinib with Genentech. The terms of the collaboration agreement provide Genentech with authority over the global development and commercialization plans for cobimetinib and the execution of those plans. The collaboration agreement further provides that we are entitled to an initial equal share of U.S. profits and losses for cobimetinib, with our share decreasing as sales increase, as well as low double-digit royalties on ex-U.S. net sales of cobimetinib. To date, cobimetinib has been approved for use exclusively in combination with Zelboraf (vemurafenib) and launched by Genentech in the United States and multiple other territories, including the European Union, Canada, Australia and Brazil as a treatment for patients with advanced melanoma harboring a BRAF V600E or V600K mutation. It is marketed as Cotellic.
Our arbitration demand asserts that Genentech has breached the parties’ contract for, amongst other breaches, failing to meet its diligence and good faith obligations. The demand seeks various forms of declaratory, monetary, and equitable relief, including without limitation that the cost and revenue allocations for Cotellic be shared equitably consistent with the collaboration agreement’s terms, along with attorneys’ fees and costs of the arbitration.
On July 13, 2016, Genentech asserted a counterclaim for breach of contract seeking monetary damages and interest related to the cost allocations under the collaboration agreement. On December 29, 2016, Genentech withdrew its counterclaim against us and stated that it would unilaterally change its approach to allocation of promotional expenses arising from commercialization of the Cotellic plus Zelboraf combination therapy, both retrospectively and prospectively. We believe this revised allocation approach substantially reduced our exposure to costs associated with promotion of the Cotellic plus Zelboraf combination in the United States. Notwithstanding Genentech’s change of approach, other significant issues remain in dispute between the parties. Genentech’s action does not address the claims in our demand for arbitration related to Genentech’s clinical development of cobimetinib, or pricing and promotional costs for Cotellic in the United States, nor does it fully resolve claims over revenue allocation. And, Genentech has not clarified how it intends to allocate promotional costs incurred with respect to the promotion of other combination therapies that include cobimetinib for other indications that will be developed or are in development and may be approved. As a result, we will continue to press our position for the arbitral panel to obtain a just resolution of these claims. The ultimate outcome and timing of the arbitration is difficult to predict.
We may from time to time become a party to other legal proceedings arising in the ordinary course of business.
|
ITEM 4.
|
MINE SAFETY DISCLOSURES
|
Not applicable.
49
|
ITEM 5.
|
MARKET FOR REGISTRANT’S COMMON EQUITY, RELATED STOCKHOLDER MATTERS AND ISSUER PURCHASES OF EQUITY SECURITIES
|
Our common stock has traded on the NASDAQ Global Select Market (formerly the NASDAQ National Market) under the symbol “EXEL” since April 11, 2000. The following table sets forth, for the periods indicated, the high and low intraday sales prices for our common stock as reported by the NASDAQ Global Select Market:
|
|
Common Stock Price
|
||||||
|
|
High
|
Low
|
|||||
|
Year ended December 30, 2016:
|
|||||||
|
Quarter ended April 1, 2016
|
$
|
5.85
|
|
$
|
3.55
|
|
|
|
Quarter ended July 1, 2016
|
$
|
8.19
|
|
$
|
4.11
|
|
|
|
Quarter ended September 30, 2016
|
$
|
15.58
|
|
$
|
7.93
|
|
|
|
Quarter ended December 30, 2016
|
$
|
18.29
|
|
$
|
10.04
|
|
|
|
Year ended January 1, 2016:
|
|||||||
|
Quarter ended April 3, 2015
|
$
|
3.16
|
|
$
|
1.54
|
|
|
|
Quarter ended July 3, 2015
|
$
|
4.18
|
|
$
|
2.51
|
|
|
|
Quarter ended October 2, 2015
|
$
|
6.81
|
|
$
|
3.31
|
|
|
|
Quarter ended January 1, 2016
|
$
|
6.42
|
|
$
|
4.70
|
|
|
On
February 16, 2017
, the last reported sale price on the NASDAQ Global Select Market for our common stock was $22.65 per share.
Holders
On
February 16, 2017
, there were 448 holders of record of our common stock.
The number of record holders is based upon the actual number of holders registered on our books at such date and does not include holders of shares in “street names” or persons, partnerships, associations, corporations or other entities identified in security position listings maintained by depository trust companies.
Dividends
Since inception, we have not paid dividends on our common stock. We currently intend to retain all future earnings, if any, for use in our business and currently do not plan to pay any cash dividends in the foreseeable future. Any future determination to pay dividends will be at the discretion of our Board of Directors. Our loan and security agreement with Silicon Valley Bank restricts our ability to pay dividends and make distributions. In addition, our note purchase agreement with Deerfield restricts our ability to make distributions.
50
Performance Graph
This performance graph shall not be deemed “filed” for purposes of Section 18 of the Securities Exchange Act of 1934, as amended, or otherwise subject to the liabilities under that Section and shall not be deemed to be incorporated by reference into any filing of ours under the Securities Act of 1933, as amended.
The following graph compares, for the five year period ended
December 31, 2016
, the cumulative total stockholder return for our common stock, the NASDAQ Stock Market (U.S. companies) Index, or the NASDAQ Market Index, and the NASDAQ Biotechnology Index. The graph assumes that $100 was invested on December 31, 2011 in each of our common stock, the NASDAQ Market Index and the NASDAQ Biotechnology Index and assumes reinvestment of any dividends. The stock price performance on the following graph is not necessarily indicative of future stock price performance.
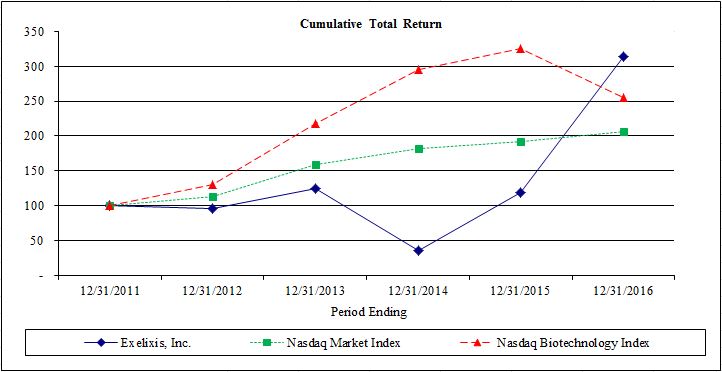
|
December 31,
|
|||||||||||||||||
|
2011
|
2012
|
2013
|
2014
|
2015
|
2016
|
||||||||||||
|
Exelixis, Inc.
|
100
|
|
95
|
|
125
|
|
35
|
|
119
|
|
315
|
|
|||||
|
NASDAQ Market Index
|
100
|
|
114
|
|
160
|
|
181
|
|
192
|
|
207
|
|
|||||
|
NASDAQ Biotechnology Index
|
100
|
|
130
|
|
218
|
|
295
|
|
326
|
|
256
|
|
|||||
51
|
ITEM 6.
|
SELECTED FINANCIAL DATA
|
The following selected consolidated financial information has been derived from our audited consolidated financial statements. The financial information as of
December 31, 2016
and
2015
and for the years ended,
December 31, 2016
,
2015
, and 2014 are derived from audited consolidated financial statements included elsewhere in this Annual Report on Form 10-K. The financial information as of December 31, 2014, 2013 and 2012, and for each of the years ended December 31, 2013 and 2012, are derived from audited consolidated financial statements not included in this Annual Report on Form 10-K, which have been revised as described below. The following Selected Financial Data should be read in conjunction with “Item 7. Management’s Discussion and Analysis of Financial Condition and Results of Operations” and “Item 8. Financial Statements and Supplementary Data” included elsewhere in this Annual Report on Form 10-K. The historical results are not necessarily indicative of the results of operations to be expected in the future.
|
|
Year Ended December 31,
|
||||||||||||||||||
|
|
2016
|
2015
|
2014
|
2013
|
2012
|
||||||||||||||
|
|
(In thousands, except per share data)
|
||||||||||||||||||
|
Consolidated Statements of Operations Data:
|
|||||||||||||||||||
|
Revenues
|
$
|
191,454
|
|
$
|
37,172
|
|
$
|
25,111
|
|
$
|
31,338
|
|
$
|
47,450
|
|
||||
|
Operating expenses:
|
|||||||||||||||||||
|
Cost of goods sold
|
6,552
|
|
3,895
|
|
2,043
|
|
1,118
|
|
—
|
|
|||||||||
|
Research and development
|
95,967
|
|
96,351
|
|
189,101
|
|
178,763
|
|
128,878
|
|
|||||||||
|
Selling, general and administrative
|
116,145
|
|
57,305
|
|
50,829
|
|
50,958
|
|
31,837
|
|
|||||||||
|
Restructuring charge
|
914
|
|
1,042
|
|
7,596
|
|
1,231
|
|
9,171
|
|
|||||||||
|
Total operating expenses
|
219,578
|
|
158,593
|
|
249,569
|
|
232,070
|
|
169,886
|
|
|||||||||
|
Loss from operations
|
(28,124
|
)
|
(121,421
|
)
|
(224,458
|
)
|
(200,732
|
)
|
(122,436
|
)
|
|||||||||
|
Other expense, net
(1)
|
(42,098
|
)
|
(40,268
|
)
|
(37,021
|
)
|
(37,556
|
)
|
(22,792
|
)
|
|||||||||
|
Loss before taxes
|
(70,222
|
)
|
(161,689
|
)
|
(261,479
|
)
|
(238,288
|
)
|
(145,228
|
)
|
|||||||||
|
Income tax provision (benefit)
|
—
|
|
55
|
|
(182
|
)
|
(96
|
)
|
107
|
|
|||||||||
|
Net loss
(1)
|
$
|
(70,222
|
)
|
$
|
(161,744
|
)
|
$
|
(261,297
|
)
|
$
|
(238,192
|
)
|
$
|
(145,335
|
)
|
||||
|
Net loss per share, basic and diluted
(1)
|
$
|
(0.28
|
)
|
$
|
(0.77
|
)
|
$
|
(1.34
|
)
|
$
|
(1.29
|
)
|
$
|
(0.91
|
)
|
||||
|
Shares used in computing basic and diluted loss per share amounts
|
250,531
|
|
209,227
|
|
194,299
|
|
184,062
|
|
160,138
|
|
|||||||||
|
|
December 31,
|
||||||||||||||||||
|
|
2016
|
2015
|
2014
|
2013
|
2012
|
||||||||||||||
|
|
(In thousands)
|
||||||||||||||||||
|
Consolidated Balance Sheet Data:
|
|||||||||||||||||||
|
Cash and investments
|
$
|
479,554
|
|
$
|
253,310
|
|
$
|
242,760
|
|
$
|
415,862
|
|
$
|
633,961
|
|
||||
|
Working capital (deficit)
|
$
|
200,215
|
|
$
|
126,414
|
|
$
|
(3,188
|
)
|
$
|
178,756
|
|
$
|
350,837
|
|
||||
|
Total assets
|
$
|
597,541
|
|
$
|
332,342
|
|
$
|
323,269
|
|
$
|
497,951
|
|
$
|
714,142
|
|
||||
|
Long-term obligations
(1)
|
$
|
237,635
|
|
$
|
420,897
|
|
$
|
312,163
|
|
$
|
395,599
|
|
$
|
394,311
|
|
||||
|
Accumulated deficit
(1)
|
$
|
(1,983,147
|
)
|
$
|
(1,912,925
|
)
|
$
|
(1,751,181
|
)
|
$
|
(1,489,884
|
)
|
$
|
(1,251,692
|
)
|
||||
|
Total stockholders’ equity (deficit)
(1)
|
$
|
89,318
|
|
$
|
(140,806
|
)
|
$
|
(159,324
|
)
|
$
|
14,498
|
|
$
|
238,127
|
|
||||
____________________
|
(1)
|
Prior periods have been revised to reflect the correction of the accounting for non-cash interest expense associated with the 2019 Notes. See “Note 1. Organization and Summary of Significant Accounting Policies - Correction of an Immaterial Error” in the “Notes to the Consolidated Financial Statements” for additional information on the correction.
|
52
|
ITEM 7.
|
MANAGEMENT’S DISCUSSION AND ANALYSIS OF FINANCIAL CONDITION AND RESULTS OF OPERATIONS
|
Some of the statements under in this “Management’s Discussion and Analysis of Financial Condition and Results of Operations” are forward-looking statements. These statements are based on our current expectations, assumptions, estimates and projections about our business and our industry and involve known and unknown risks, uncertainties and other factors that may cause our company’s or our industry’s results, levels of activity, performance or achievements to be materially different from any future results, levels of activity, performance or achievements expressed or implied in, or contemplated by, the forward-looking statements. Words such as “believe,” “anticipate,” “expect,” “intend,” “plan,” “focus,” “goal,” “objective,” “will,” “may” “would,” “could,” “estimate,” “predict,” “target,” “potential,” “continue,”
or the negative of such terms or other similar expressions identify forward-looking statements. Our actual results and the timing of events may differ significantly from the results discussed in the forward-looking statements. Factors that might cause such a difference include those discussed in “Item 1A. Risk Factors” as well as those discussed elsewhere in this Annual Report on Form 10-K. These and many other factors could affect our future financial and operating results. We undertake no obligation to update any forward-looking statement to reflect events after the date of this report.
We have adopted a 52- or 53-week fiscal year policy that generally ends on the Friday closest to December 31st. Fiscal year 2014, a 53-week year, ended on January 2, 2015; fiscal year 2015, a 52-week year, ended on January 1, 2016; fiscal year 2016, a 52-week year, ended on December 30, 2016; and fiscal year 2017, a 52-week year, will end on December 29, 2017. For convenience, references in this report as of and for the fiscal years ended January 2, 2015, January 1, 2016, and December 30, 2016 are indicated as being as of and for the years ended December 31, 2014, 2015, and 2016, respectively. The quarterly period ended January 2, 2015 is a 14-week fiscal quarter; all other interim periods presented are 13-week fiscal quarters.
Overview
We are
a biopharmaceutical company committed to the discovery, development and commercialization of new medicines to improve care and outcomes for people with cancer.
Since its founding in 1994, three products discovered at Exelixis have progressed through clinical development, received regulatory approval, and entered the commercial marketplace. Two are derived from cabozantinib, an inhibitor of multiple tyrosine kinases including MET, AXL, and VEGF receptors: CABOMETYX™ tablets approved for previously treated advanced kidney cancer and COMETRIQ
®
capsules approved for progressive, metastatic medullary thyroid cancer. The third product, Cotellic
®
, is a formulation of cobimetinib, a selective inhibitor of MEK, marketed under a collaboration with Genentech (a member of the Roche Group), and is approved as part of a combination regimen to treat advanced melanoma. Both cabozantinib and cobimetinib have shown potential in a variety of forms of cancer and are the subjects of broad clinical development programs.
While our commercialization efforts for CABOMETYX and COMETRIQ are focused in the United States, the products are marketed for their approved indications outside of the United States and Japan under our collaboration agreement with Ipsen. We are also closely working with Ipsen and our other cabozantinib collaboration partner, Takeda, on the further global development and commercialization of cabozantinib.
Beyond the FDA-approved indications of cabozantinib for second-line advanced RCC and progressive, metastatic MTC, we are engaged in a broad development program composed of over 45 ongoing or planned clinical trials in additional tumor types, many of which are conducted through our CRADA with NCI-CTEP or our IST program. The most notable studies at this time are CELESTIAL, our company-sponsored phase 3 trial of cabozantinib in advanced HCC, for which we anticipate results in 2017, and CABOSUN, a randomized phase 2 trial comparing cabozantinib to sunitinib in the first-line treatment of intermediate- or poor-risk RCC patients, being conducted by The Alliance through our CRADA with NCI-CTEP. In May 2016, The Alliance informed us that CABOSUN met its primary endpoint demonstrating a statistically significant and clinically meaningful improvement of PFS compared with sunitinib. Based on these results, we are working towards the submission of a sNDA in 2017 for cabozantinib as a treatment for first-line advanced RCC. Cabozantinib has demonstrated clinical activity as a single agent in advanced RCC, and we are interested in further examining its potential in combination with immunotherapies to treat this serious disease. Building on the available preclinical and clinical observations that cabozantinib results in a more immune-permissive tumor environment potentially resulting in cooperative activity of cabozantinib in combination with immune check point inhibitors, in collaboration with BMS, we plan to evaluate the combination of cabozantinib with nivolumab or nivolumab and ipilimumab in various tumor types, including a phase 3 trial in first-line advanced RCC, as well as studies in bladder cancer and HCC.
In addition to these advances connected with cabozantinib, significant progress continues to be made with respect to the clinical development, regulatory status and commercial potential of cobimetinib under our collaboration agreement with
53
Genentech. For additional information on the cobimetinib development program, see “Part I. Item 1. Business - Cobimetinib Development Program.”
Additional information regarding our business is included in Part I, Item 1, “Business,” included in this Annual Report on Form 10-K.
During 2016, we significantly grew our commercial organization and positioned the business to be able to drive towards and support an expanded product pipeline. Below is a summary of our significant business developments:
|
•
|
In February 2016, we entered into a collaboration and license agreement with Ipsen for the commercialization and further development of cabozantinib. Pursuant to the terms of the collaboration agreement, Ipsen received exclusive commercialization rights for current and potential future cabozantinib indications outside of the United States, Canada and Japan. The collaboration agreement was subsequently amended in December 2016 to include commercialization rights in Canada.
|
|
•
|
In April 2016, based on results of our phase 3 pivotal trial METEOR, which met its primary endpoint of improving PFS, as well as its secondary endpoints of improving OS and ORR, the FDA approved CABOMETYX for the treatment of patients with advanced RCC who have received prior anti-angiogenic therapy.
|
|
•
|
In May 2016, we announced that CABOSUN met its primary endpoint, demonstrating a statistically significant and clinically meaningful improvement in PFS compared with sunitinib in patients with advanced intermediate- or poor-risk RCC. Based on these results, we are working towards the submission of a sNDA in the third quarter of 2017 for cabozantinib as a treatment for first-line advanced RCC.
|
|
•
|
In June 2016, we presented results from our phase 3 pivotal trial METEOR at the ASCO 2016 Annual Meeting, showing that CABOMETYX demonstrated a statistically significant and clinically meaningful increase in OS. Compared with everolimus, CABOMETYX was associated with a 34% reduction in the rate of death and median OS was 21.4 months for patients receiving CABOMETYX versus 16.5 months for those receiving everolimus (HR=0.66, 95% CI 0.53-0.83, P=0.0003).
|
|
•
|
In June 2016, our collaboration partner Genentech announced preliminary results from a phase 1b trial evaluating the safety and clinical activity of the combination of cobimetinib with ateolizumab in patients with metastatic CRC, which included 23 patients with advanced CRC (22 with mutant KRAS and one with wild-type KRAS). The ORR for the combination was 17%, including four confirmed PRs; additionally five patients achieved SD. Responses were seen in tumors with the microsatellite stable, or MSS, phenotype, which comprises 95% of CRC. MSS CRC has historically been refractory to immuno-oncology agents. The median duration of response was not yet reached, with a range of 5.4 months to more than 11.1 months. No dose-limiting toxicities were observed.
|
|
•
|
In September 2016, the EC approved CABOMETYX for the treatment of adult patients with advanced RCC following prior VEGF-targeted therapy and in December 2016, Ipsen recorded its first commercial sales in Europe.
|
|
•
|
In October 2016, we announced positive results from the NCI-CTEP-sponsored phase 1 trial of cabozantinib in combination with nivolumab in patients with previously treated genitourinary tumors.
|
|
•
|
In November 2016, we announced Genentech’s efforts to advance the development program for cobimetinib, through the initiation and announcement of multiple phase 3 pivotal trials exploring the combination of cobimetinib with other targeted and immuno-oncology agents for the treatment of melanoma and CRC.
|
|
•
|
In January 2017, we entered into a collaboration and license agreement with Takeda for the commercialization and further clinical development of cabozantinib in Japan.
|
2016 Financial Highlights
|
•
|
Our total net product revenue increased by
$101.2 million
, or
296%
, in 2016 compared to 2015, primarily due to the commercial launch of CABOMETYX as a treatment for patients with advanced RCC in April 2016 and, to a lesser extent, an increase in COMETRIQ product sales.
|
|
•
|
Our collaboration revenue increased by
$53.1 million
in 2016 compared to 2015, primarily due to upfront payments and milestones received as a result of entering into our collaboration and license agreement with Ipsen.
|
|
•
|
Cash and investments increased to
$479.6 million
at
December 31, 2016
as compared to
$253.3 million
at
December 31, 2015
.
|
|
•
|
Between August and November 2016, we retired all $287.5 million of the 2019 Notes through privately negotiated exchange transactions and redemption procedures provided for by the 2019 Notes. For additional information on the retirement of the 2019 Notes, see “Note 7. Debt,” to our “Notes to Consolidated Financial Statements contained in Part II, Item 8 of this Annual Report on Form 10-K.
|
54
2017 Outlook
In 2017, our key objective is to maximize the clinical and commercial opportunities for cabozantinib and cobimetinib as oncology franchises. On the commercial front, we plan to continue to execute on the U.S. launch of CABOMETYX as a treatment for patients with advanced RCC and increase sales of COMETRIQ and Cotellic, while supporting our collaboration partners on the execution of their commercial plans. From the research and development perspective, we intend to continue to invest in our cabozantinib development program, while driving toward the expansion of our product pipeline through the measured resumption of drug discovery activities and the evaluation of potential in-licensing and acquisition opportunities that align with our oncology drug development expertise.
We anticipate that we will continue to face a number of challenges and risks to our business that may impact our ability to execute on our 2017 business objectives. In particular, we anticipate that for the foreseeable future our ability to generate meaningful revenue to fund our commercial operations and our development and discovery programs is dependent upon the successful commercialization of CABOMETYX for the treatment of advanced RCC in territories where it has been or may soon be approved. The commercial potential of CABOMETYX for the treatment of advanced RCC remains subject to a variety of factors, most importantly, CABOMETYX’s perceived benefit/risk profile as compared to the benefit/risk profiles of other treatments available or currently in development for the treatment of advanced RCC. Our ability to generate meaningful product revenue from CABOMETYX is also affected by a number of other factors, including the extent to which coverage and reimbursement for CABOMETYX is available from government and other third-party payers. Obtaining and maintaining appropriate coverage and reimbursement for CABOMETYX is increasingly challenging due to, among other things, the attention being paid to healthcare cost containment and other potential austerity measures being discussed in the U.S. and worldwide, as well as increasing policy interest in the U.S. with respect to pharmaceutical drug pricing practices. Our ability to fulfill the commercial potential of cabozantinib also depends on our ability to expand the compound’s use by generating data in clinical development that will support regulatory approval of cabozantinib in additional indications. Our immediate focus in this regard is a potential regulatory approval of our sNDA for cabozantinib for first-line advanced RCC based upon data from CABOSUN. This approval represents a greater challenge than others because CABOSUN was not originally designed as a registrational trial. However, given the positive nature of CABOSUN results, we are planning to submit a sNDA to the FDA. Achievement of our 2017 business objectives will also depend on our ability to adapt our development and commercialization strategy to navigate the increasing prevalence of immunotherapy competition, as well as the use of combination therapy to treat cancer. Furthermore, our research and development objectives may be curtailed as a result of operational challenges related to organizational growth as we resume drug discovery activities, and we may be unable to successfully identify appropriate candidates for in-licensing or acquisition.
Some of these challenges and risks are specific to our business, and others are common to companies in the pharmaceutical industry with development and commercial operations. For a complete discussion of challenges and risks we face, see in in Part I, Item 1A, “Risk Factors” of this Annual Report on Form 10-K.
55
Results of Operations – Comparison of Years Ended December 31, 2016, 2015 and 2014
Revenues
Revenues by category were as follows (dollars in thousands):
|
|
Year Ended December 31,
|
||||||||||
|
|
2016
|
2015
|
2014
|
||||||||
|
Gross product revenues
|
$
|
151,499
|
|
$
|
36,650
|
|
$
|
28,963
|
|
||
|
Discounts and allowances
|
(16,124
|
)
|
(2,492
|
)
|
(3,852
|
)
|
|||||
|
Net product revenues
|
135,375
|
|
34,158
|
|
25,111
|
|
|||||
|
Royalty and product supply revenues, net
|
2,795
|
|
14
|
|
—
|
|
|||||
|
License revenues
(1)
|
13,284
|
|
—
|
|
—
|
|
|||||
|
Contract revenues
(2)
|
40,000
|
|
3,000
|
|
—
|
|
|||||
|
Collaboration revenues
|
56,079
|
|
3,014
|
|
—
|
|
|||||
|
Total revenues
|
$
|
191,454
|
|
$
|
37,172
|
|
$
|
25,111
|
|
||
|
Dollar change
|
$
|
154,282
|
|
$
|
12,061
|
|
|||||
|
Percentage change
|
415
|
%
|
48
|
%
|
|||||||
____________________
|
(1)
|
Includes amortization of upfront payments.
|
|
(2)
|
Includes milestone payments.
|
Net product revenues by product were as follows (dollars in thousands):
|
|
Year Ended December 31,
|
||||||||||
|
|
2016
|
2015
|
2014
|
||||||||
|
CABOMETYX
|
$
|
93,481
|
|
$
|
—
|
|
$
|
—
|
|
||
|
COMETRIQ
|
41,894
|
|
34,158
|
|
25,111
|
|
|||||
|
Net product revenues
|
$
|
135,375
|
|
$
|
34,158
|
|
$
|
25,111
|
|
||
|
Dollar change
|
$
|
101,217
|
|
$
|
9,047
|
|
|||||
|
Percentage change
|
296
|
%
|
36
|
%
|
|||||||
The increase in net product revenues for the
year ended
December 31, 2016
, as compared to
2015
, was primarily due to the impact of the commercial launch of CABOMETYX in late April 2016, and, to a lesser extent, an increase in demand for COMETRIQ. CABOMETYX was approved by the FDA on April 25, 2016 as a treatment for patients with advanced RCC who have received prior anti-angiogenic therapy. Net product revenues for CABOMETYX during
2016
were also favorably impacted by the build of channel inventory by the specialty pharmacies and distributors to whom we sell CABOMETYX in connection with its initial launch. The 23% increase in net product revenues for COMETRIQ for the year ended December 31, 2016, as compared to 2015, was primarily due to a 15% increase in the number of COMETRIQ units sold and to a lesser extent, an increase in the average selling price of the product. The 36% increase in net product revenues for the
year ended
December 31, 2015
, as compared to
2014
, was primarily due to a 26% increase in the number of COMETRIQ units sold and, to a lesser extent, the impact of a change to the “sell-in” method which resulted in the one-time recognition of
$2.6 million
of deferred revenue attributable to sales to the specialty pharmacy that sells COMETRIQ in the U.S. in the first quarter of 2015. The COMETRIQ sales volume increases in both periods were driven by increased product demand.
Royalty and product supply revenues, net for the years ended
December 31, 2016
and
2015
primarily includes recognition of
$2.8 million
and
$14 thousand
, respectively, of royalties on ex-U.S. net sales of Cotellic following Genentech’s launch of the product in late 2015. There was no such royalty and product supply revenue during the comparable period in 2014.
License revenues for the
year ended
December 31, 2016
consisted of the recognition of
$13.3 million
of the upfront payments and non-substantive milestone received in 2016 in connection with our collaboration and license agreement with Ipsen. The upfront payment of
$200.0 million
, received in the first quarter of 2016, the
$60.0 million
milestone we achieved upon the approval of cabozantinib by the EMA in second-line RCC, and the
$10.0 million
upfront payment received in
56
December 2016 in consideration for the commercialization rights in Canada are being recognized ratably over the remaining term of the collaboration agreement. The collaboration agreement continues through early 2030, which is the current estimated patent expiration of cabozantinib in the European Union. There was no such license revenue during the comparable periods in 2015 and 2014.
Contract revenues for the
year ended
December 31, 2016
reflect recognition of two
$10.0 million
milestones for the first commercial sales of CABOMETYX by Ipsen in Germany and the United Kingdom,
$15.0 million
from a milestone payment earned from Daiichi Sankyo related to its worldwide license of our compounds that modulate mineralocorticoid receptor, including CS-3150/esaxerenone (a specific rotational isomer of XL550) in September 2016 and
$5.0 million
from a milestone payment earned from Merck related to its worldwide license of our PI3K-d program in July 2016. Contract revenues for the
year ended
December 31, 2015
reflect a $3.0 million contingent payment from Merck related to that same license. There was no such contract revenue during the comparable period in 2014.
Total revenues by significant customer were as follows (dollars in thousands):
|
|
Year Ended December 31,
|
||||||||||
|
|
2016
|
2015
|
2014
|
||||||||
|
Diplomat Specialty Pharmacy
|
$
|
63,826
|
|
$
|
30,856
|
|
$
|
24,832
|
|
||
|
Ipsen
|
33,252
|
|
—
|
|
—
|
|
|||||
|
Others, individually less than 10% of total revenues for all periods presented
|
94,376
|
|
6,316
|
|
279
|
|
|||||
|
Total revenues
|
$
|
191,454
|
|
$
|
37,172
|
|
$
|
25,111
|
|
||
We recognize net product revenue net of discounts and allowances that are further described in “Note 1. Organization and Summary of Significant Accounting Policies” to our “Notes to Consolidated Financial Statements” contained in Part II, Item 8 of this Annual Report on Form 10-K. The activities and ending reserve balances for each significant category of discount and allowance were as follows (dollars in thousands):
|
Customer credits and co-pay assistance
|
Rebates
|
Chargebacks
|
Returns
|
Total
|
|||||||||||||||
|
Balance at December 31, 2014
|
$
|
2,320
|
|
$
|
484
|
|
$
|
(10
|
)
|
$
|
—
|
|
$
|
2,794
|
|
||||
|
Provision related to sales made in:
|
—
|
|
|||||||||||||||||
|
Current period
|
1,014
|
|
1,539
|
|
69
|
|
38
|
|
2,660
|
|
|||||||||
|
Prior periods
|
—
|
|
(197
|
)
|
10
|
|
—
|
|
(187
|
)
|
|||||||||
|
Payments
|
(3,003
|
)
|
(935
|
)
|
(30
|
)
|
—
|
|
(3,968
|
)
|
|||||||||
|
Balance at December 31, 2015
|
331
|
|
891
|
|
39
|
|
38
|
|
1,299
|
|
|||||||||
|
Provision related to sales made in:
|
—
|
|
|||||||||||||||||
|
Current period
|
5,721
|
|
5,105
|
|
5,297
|
|
359
|
|
16,482
|
|
|||||||||
|
Prior periods
|
2
|
|
(313
|
)
|
(39
|
)
|
(8
|
)
|
(358
|
)
|
|||||||||
|
Payments
|
(4,779
|
)
|
(3,056
|
)
|
(3,976
|
)
|
(38
|
)
|
(11,849
|
)
|
|||||||||
|
Balance at December 31, 2016
|
$
|
1,275
|
|
$
|
2,627
|
|
$
|
1,321
|
|
$
|
351
|
|
$
|
5,574
|
|
||||
The balance at December 31, 2014 consisted primarily of a project management fee payable to Sobi which was paid during the year ended December 31, 2015. Other activity during 2015 was related to discounts and allowances on product sales of COMETRIQ through a single specialty pharmacy. The growth in the ending reserve balances and the activity for the year ended December 31, 2016 resulted from the increase in discounts and allowances on increased product sales through an expanded distribution network, which includes five specialty pharmacies and three specialty distributors, which we implemented following the launch of CABOMETYX and the continued distribution of COMETRIQ through one specialty pharmacy and one specialty distributor.
57
Cost of Goods Sold
The cost of goods sold and our gross margins were as follows (dollars in thousands):
|
|
Year Ended December 31,
|
||||||||||
|
|
2016
|
2015
|
2014
|
||||||||
|
Cost of goods sold
|
$
|
6,552
|
|
$
|
3,895
|
|
$
|
2,043
|
|
||
|
Gross margin
|
95
|
%
|
89
|
%
|
92
|
%
|
|||||
Cost of goods sold is related to our product revenues and consists primarily of a
3%
royalty payable to GlaxoSmithKline on net sales of any product incorporating cabozantinib, indirect labor costs, the cost of manufacturing, write-downs related to expiring and excess inventory, and other third party logistics costs of our product. Portions of the manufacturing costs for inventory were incurred prior to the regulatory approval of CABOMETYX and COMETRIQ and, therefore, were expensed as research and development costs when those costs were incurred, rather than capitalized as inventory. The sale of products containing previously expensed materials resulted in a 7%, 6% and 9% reduction in the Cost of goods sold during the years ended December 31, 2016, 2015 and 2014, respectively. As of December 31, 2016, we have $1.2 million in previously expensed materials that will not be charged to Costs of goods sold in future periods. Cost of goods sold also includes write-downs related to excess and expiring inventory. Such write-downs were
$0.5 million
for the
year ended
December 31, 2016
as compared to
$1.2 million
for
2015
and
$0.2 million
for
2014
. Gross margin percentage is net product revenues less cost of goods sold, divided by net product revenues.
The increase in Cost of goods sold was primarily related to the launch of CABOMETYX during the
year ended
December 31, 2016
and increases in the number of units of COMETRIQ sold during the years ended
December 31, 2016
and 2015, as compared to the preceding periods. The increase in gross margins for the
year ended
December 31, 2016, as compared to
2015
, was related to the change in product mix as CABOMETYX has a lower manufacturing cost than COMETRIQ. The decrease in gross margins for the
year ended
December 31, 2015, as compared to 2014, was related to the increase in write-downs related to excess and expiring inventory, described above.
Research and Development Expenses
Total research and development expenses were as follows (dollars in thousands):
|
|
Year Ended December 31,
|
||||||||||
|
|
2016
|
2015
|
2014
|
||||||||
|
Research and development expenses
|
$
|
95,967
|
|
$
|
96,351
|
|
$
|
189,101
|
|
||
|
Dollar change
|
$
|
(384
|
)
|
$
|
(92,750
|
)
|
|||||
|
Percentage change
|
less than 1%
|
|
(49
|
)%
|
|||||||
Research and development expenses consist primarily of clinical trial expenses, personnel expenses, stock-based compensation, consulting and outside services, the allocation of general corporate costs, and temporary personnel expenses.
The nominal decrease in research and development expenses for the
year ended
December 31, 2016
, as compared to
2015
, was primarily related to clinical trial costs, which includes services performed by third-party contract research organizations and other vendors who support our clinical trials. The decrease in clinical trial costs was $8.9 million for the
year ended
December 31, 2016
, as compared to
2015
. The decrease in clinical trial costs was predominantly due to decreases in costs related to METEOR, our phase 3 pivotal trial in advanced RCC and was partially offset by increases in costs related to CELESTIAL, our phase 3 pivotal trial in advanced HCC. Decreases in research and development expenses for the
year ended
December 31, 2016
, as compared to
2015
, also related to a decrease in the allocation of general corporate costs and stock-based compensation. The allocation of general corporate costs decreased by $4.2 million for the
year ended
December 31, 2016
as compared to the comparable period in
2015
, primarily due to headcount growth in the selling, general and administrative functions. Stock-based compensation decreased by $2.3 million for the
year ended
December 31, 2016
as compared to the comparable period in
2015
, primarily due to the 2015 recognition of stock-based compensation expenses for performance-based stock-options tied to the positive top-line data received from the METEOR trial and the anticipated acceptance of our NDA filing with the FDA which was partially offset by a bonus to our employees in the form of fully-vested RSU during 2016. These decreases were almost entirely offset by increases in personnel expenses and consulting and outside services. Personnel and related expenses increased by $12.8 million for the
year ended
December 31, 2016
as compared to the comparable period in
2015
primarily due to the hiring of medical science liaisons as a result of the launch of CABOMETYX and an increase in the accrual for corporate bonuses. Consulting and outside services increased by $2.1
58
million for the
year ended
December 31, 2016
as compared to the comparable period in
2015
primarily due to increases in activities related to medical affairs and drug safety.
The decrease in research and development expenses for the year ended December 31, 2015, as compared to 2014, was primarily related to a decrease in clinical trial costs, which includes services performed by third-party CROs and other vendors that support our clinical trials. The decrease in clinical trial costs was $70.3 million for the year ended December 31, 2015, as compared to 2014. The decrease in clinical trial costs was predominantly due to decreases in costs related to COMET-1 and COMET-2, our phase 3 pivotal trials in mCRPC which we terminated in September 2014, METEOR, our phase 3 pivotal trial in advanced RCC, and a reduction of general program level costs; the decrease in costs related to METEOR included the impact of a $9.8 million decrease in comparator drug purchases.
Decreases in research and development expenses for the year ended December 31, 2015, as compared to 2014, also related to personnel expenses, consulting and outside services and temporary personnel. Personnel expenses decreased by $16.6 million for the year ended December 31, 2015, as compared to 2014 primarily due to workforce reductions undertaken as a consequence of the failure of COMET-1. The allocation of general corporate costs decreased by $8.6 million for the
year ended
December 31, 2015 as compared to the comparable period in 2014, primarily due to headcount growth in the selling, general and administrative functions. Consulting and outside services decreased by $3.6 million primarily as a result of decreases in clinical development consulting activities and the use of outside medical safety liaisons. Temporary personnel decreased by $2.9 million due to a decrease in clinical trial activities performed by those personnel. Those decreases were partially offset by increases in stock-based compensation and regulatory filing fees. Stock-based compensation increased by $8.4 million primarily due to expense recognized for performance-based stock-options described above. Regulatory filing fees of $2.4 million were paid to the FDA in 2015 in connection with the filing of our NDA.
We are focusing our development and commercialization efforts primarily on cabozantinib to maximize the therapeutic and commercial potential of this compound, and as a result, we expect our near-term research and development expenses to relate to the clinical development of cabozantinib. We expect to continue to incur significant development costs for cabozantinib in future periods as we evaluate its potential in a broad development program comprising approximately 45 ongoing or planned clinical trials across multiple indications. The most notable study of this program is our company-sponsored phase 3 trial of cabozantinib in advanced HCC called CELESTIAL. In addition, postmarketing commitments in connection with the approval of COMETRIQ in progressive, metastatic MTC dictate that we conduct an additional study in that indication. As a result, we expect our research and development expenses to increase as we continue to develop cabozantinib and our pipeline.
We do not have reliable estimates regarding the timing of our clinical trials. We estimate that typical phase 1 clinical trials last approximately one year, phase 2 clinical trials last approximately one to two years and phase 3 clinical trials last approximately two to four years. However, the length of time may vary substantially according to factors relating to the particular clinical trial, such as the type and intended use of the drug candidate, the clinical trial design and the ability to enroll suitable patients.
We do not have reliable estimates of total costs for a particular drug candidate, or for cabozantinib for a particular indication, to reach the market. Our potential therapeutic products are subject to a lengthy and uncertain regulatory process that may involve unanticipated additional clinical trials and may not result in receipt of the necessary regulatory approvals. Failure to receive the necessary regulatory approvals would prevent us from commercializing the product candidates affected. In addition, clinical trials of our potential product candidates may fail to demonstrate safety and efficacy, which could prevent or significantly delay regulatory approval. A discussion of the risks and uncertainties with respect to our research and development activities, including completing the development of our product candidates, and the consequences to our business, financial position and growth prospects can be found in “Risk Factors” in Part I, Item 1A of this Annual Report on Form 10-K.
Selling, General and Administrative Expenses
Total selling, general and administrative expenses were as follows (dollars in thousands):
|
|
Year Ended December 31,
|
||||||||||
|
|
2016
|
2015
|
2014
|
||||||||
|
Selling, general and administrative expenses
|
$
|
116,145
|
|
$
|
57,305
|
|
$
|
50,829
|
|
||
|
Dollar change
|
$
|
58,840
|
|
$
|
6,476
|
|
|||||
|
Percentage change
|
103
|
%
|
13
|
%
|
|||||||
59
Selling, general and administrative expenses consist primarily of personnel expenses, consulting and outside services, stock-based compensation, travel and entertainment, facility costs, legal and accounting costs, and marketing.
The increase in selling, general and administrative expenses for the
year ended
December 31, 2016
, as compared to
2015
, was primarily related to personnel expenses, consulting and outside services, travel and entertainment, the allocation of general corporate costs, and stock-based compensation. Personnel expenses increased by $44.1 million for the
year ended
December 31, 2016
, as compared to
2015
, primarily due to an increase in headcount connected with the build-out of our U.S. commercial organization as a result of the launch of CABOMETYX as well as an increase in incentive compensation and the accrual for corporate bonuses. Consulting and outside services increased by $16.0 million for the
year ended
December 31, 2016
, as compared to
2015
, primarily due to costs incurred supporting the commercialization and launch of CABOMETYX. Travel and entertainment increased by $5.5 million for the
year ended
December 31, 2016
, as compared to
2015
, primarily due to travel incurred by our U.S. commercial organization. The allocation of general corporate costs to research and development and cost of goods sold decreased by $3.9 million for the
year ended
December 31, 2016
, as compared to
2015
, primarily due to headcount growth in the selling, general and administrative functions. Stock-based compensation increased by $3.3 million for the
year ended
December 31, 2016
, as compared to
2015
, primarily due to headcount growth and a bonus paid to our employees in the form of fully-vested RSUs which was partially offset by the 2015 recognition of expenses for performance-based stock-options described above. These increases were partially offset by a decrease in marketing expenses.
Marketing expenses includes our share of losses under our collaboration agreement with Genentech. On June 3, 2016, following a 30 day dispute resolution period, we filed a demand for arbitration asserting claims against Genentech related to its clinical development, pricing and commercialization of Cotellic, and cost and revenue allocations in connection with Cotellic’s commercialization in the United States. Soon thereafter, Genentech asserted a counterclaim for breach of contract seeking monetary damages and interest related to the cost allocations under the collaboration agreement. On December 29, 2016, Genentech withdrew its counterclaim against us in the ongoing JAMS arbitration concerning alleged breaches of the parties’ collaboration agreement. When notifying the arbitral panel and us of this unilateral action, Genentech further stated that it changed, both retroactively and prospectively, the manner in which it allocates promotional expenses of the Cotellic plus Zelboraf combination therapy. As a result of Genentech’s decision to change its cost allocation approach, we are relieved of our obligation to pay
$18.7 million
of disputed costs that had been accrued by us as of September 30, 2016. We have invoiced Genentech for certain expenses, with interest, that we had previously paid. Accordingly, during the year ended December 31, 2016, we offset selling, general and administrative expenses with a
$13.3 million
recovery for disputed losses under the collaboration agreement that had been recognized prior to 2016. During the year ended December 31, 2016, we also recognized a loss of
$4.5 million
for 2016 activities under the collaboration agreement as computed under Genentech’s revised cost allocation approach. In total, we have recorded a net cost recovery of
$8.8 million
during the year ended December 31, 2016 for the collaboration agreement. In comparison, during 2015 marketing expenses included losses of
$16.6 million
under the collaboration agreement.
The increase in selling, general and administrative expenses for the year ended December 31, 2015, as compared to 2014, was primarily related to increases in marketing costs and stock-based compensation. Marketing expenses increased by $10.2 million, which includes our share of losses under our collaboration agreement with Genentech totaling $16.6 million. Stock-based compensation, increased by $3.5 million primarily due to expense recognized for performance-based stock-options tied to the positive top-line data received from the METEOR trial and the anticipated acceptance of our NDA filing with the FDA. Those increases were partially offset by decreases in personnel costs, consulting and outside services, facilities costs and patent and other legal and accounting fees. Personnel expenses decreased by $5.7 million primarily due to workforce reductions undertaken as a consequence of the failure of COMET-1. Consulting and outside services decreased by $3.3 million as a result of decreases in marketing research activities and reductions in outside services for buildings we are no longer occupying. Facilities costs decreased by $2.8 million primarily as a result of facilities we have vacated in connection with our 2014 Restructuring (see “Note 3. Restructurings” to our “Notes to Consolidated Financial Statements” contained in Part II, Item 8 of this Annual Report on Form 10-K for a description of these costs). Patent and other legal and accounting fees decreased by $2.0 million primarily due to decreases in activities related to patent filings and defense.
We expect our Selling, general and administrative expenses will increase as we continue to support our ongoing activities related to the commercialization of CABOMETYX. Those expenses may increase further commensurate with potential expanded sales opportunities.
Total Other Expense, net
Certain historical amounts in other expense, net have been revised to reflect the correction of the accounting for non-cash interest expense associated with the 2019 Notes. See “Note 1. Organization and Summary of Significant Accounting
60
Policies - Correction of an Immaterial Error” in the “Notes to the Consolidated Financial Statements” for additional information on the correction.
Total other expense, net, were as follows (dollars in thousands):
|
|
Year Ended December 31,
|
||||||||||
|
|
2016
|
2015
|
2014
|
||||||||
|
Interest income and other, net
|
$
|
4,863
|
|
$
|
412
|
|
$
|
4,341
|
|
||
|
Interest expense
|
(33,060
|
)
|
(40,680
|
)
|
(41,362
|
)
|
|||||
|
Loss on extinguishment of debt
|
(13,901
|
)
|
—
|
|
—
|
|
|||||
|
Total other expense, net
|
$
|
(42,098
|
)
|
$
|
(40,268
|
)
|
$
|
(37,021
|
)
|
||
|
Dollar change
|
$
|
(1,830
|
)
|
$
|
(3,247
|
)
|
|||||
|
Percentage change
|
5
|
%
|
9
|
%
|
|||||||
Total other expense, net consists primarily of the loss on extinguishment of debt, interest expense incurred on our debt, gains on the sale of equity investments, unrealized gains and losses from the fair value re-measurement of a warrant, foreign exchange fluctuations and interest income earned on our cash and investments.
The increase in Total other expense, net for the
year ended
December 31, 2016
, as compared to
2015
, was primarily related to the
$13.9 million
loss associated with the conversion and redemption of
$286.9 million
in aggregate principal amount of the 2019 Notes for
54,009,279
shares of our Common Stock. See “Note 7. Debt” in our “Notes to Consolidated Financial Statements” for more information on the conversions.
Interest expense is comprised of interest accrued on the 2019 Notes, the Deerfield Notes and the Silicon Valley Bank term loan. (see “Note 7. Debt” to our “Notes to Consolidated Financial Statements” contained in Part II, Item 8 of this Annual Report on Form 10-K for a description of these debt instruments, including the conversions and redemption of the 2019 Notes). Interest expenses decreased by $7.6 million for the
year ended
December 31, 2016
, as compared to
2015
, primarily due to the conversions and redemption of the 2019 Notes. We expect our interest expense will continue to decrease as a result of the full year impact of the interest savings from the conversions and redemption of the 2019 Notes, the maturity of the Silicon Valley Bank term loan and the anticipated prepayment of the Deerfield Notes on or about July 1, 2017.
Interest income and other, net for the
year ended
December 31, 2016
includes a $2.5 million gain on the sale of our 9% interest in Akarna Therapeutics, Ltd, which we acquired in 2015 in exchange for intellectual property rights related to a compound discovered by us. During 2014, Interest income and other, net includes an $0.8 million gain for a purchase price adjustment resulting from the resolution of contingencies related to the September 2011 sale of our remaining interest in another business. There were no such gains during 2015.
Interest income and other, net for the years ended December 31, 2015 and 2014 include $0.5 million in unrealized losses and $1.8 million in unrealized gains, respectively, on the revaluation of the 2014 Warrants; there were no such gains or losses during 2016. (see “Note 7. Debt” to our “Notes to Consolidated Financial Statements” contained in Part II, Item 8 of this Annual Report on Form 10-K for a description of the 2014 Warrants).
Liquidity and Capital Resources
We have incurred net losses since inception through
December 31, 2016
, with the exception of the 2011 fiscal year. For the
year ended
December 31, 2016
, we incurred a net loss of
$70.2 million
and as of
December 31, 2016
, we had an accumulated deficit of
$2.0 billion
. These losses have had an adverse effect on our stockholders’ equity (deficit) and working capital. Because of the numerous risks and uncertainties associated with developing and commercializing drugs, we are unable to predict the extent of any future losses. Excluding fiscal 2011, our research and development expenditures and selling, general and administrative expenses have exceeded our revenues for each fiscal year, and we expect to spend significant additional amounts to fund the continued development and commercialization of cabozantinib during 2017. In addition, we intend to expand our product pipeline through the measured resumption of drug discovery and product acquisition and in-licensing. As a result, we expect to continue to incur substantial operating expenses and, consequently, we will need to generate substantial revenues to achieve and maintain profitability.
Since the launch of our first commercial product in January 2013, through
December 31, 2016
, we have generated an aggregate of
$209.7 million
in net product revenues, including
$135.4 million
for the year ended
December 31, 2016
. Other than sales of CABOMETYX and COMETRIQ, we have derived substantially all of our revenues since inception from
61
collaborative arrangements, including upfront and milestone payments and research funding and through the public sale of our common stock. The amount of our net profits or losses will depend, in large part, on: the level of sales of CABOMETYX and COMETRIQ in the U.S.; achievement of clinical, regulatory and commercial milestones and the amount of royalties, if any, from sales of CABOMETYX and COMETRIQ under our collaboration agreements with Ipsen and Takeda; our share of the net profits and losses for the commercialization of Cotellic in the U.S. under our collaboration with Genentech; the amount of royalties from Cotellic sales outside the U.S. under our collaboration with Genentech; other license and contract revenues; and, the level of our expenses, including commercialization activities for cabozantinib and any pipeline expansion efforts.
As of
December 31, 2016
, we had
$479.6 million
in cash and investments, which included
$393.8 million
available for operations,
$81.6 million
of compensating balance investments that we are required to maintain on deposit with Silicon Valley Bank, and
$4.2 million
of long-term restricted investments. We anticipate that our current cash and cash equivalents, and short-term investments available for operations, product revenues and collaboration revenues, will enable us to maintain our operations for a period of at least 12 months following the filing date of this report. The sufficiency of our cash resources depends on numerous assumptions, including assumptions related to product sales, operating expenses, the repayment of both the Deerfield Notes and our term loan from Silicon Valley Bank, as well as the other factors set forth in “Risk Factors” under the headings “Risks Related to our Capital Requirements and Financial Results,” in Part I, Item 1A of this Annual Report on Form 10-K. Our assumptions may prove to be wrong or other factors may adversely affect our business, and as a result we may not have the cash resources to fund our planned operations, which would have a material adverse effect on our business. In addition, we may choose to raise additional funds through the issuance of equity or debt due to market conditions or strategic considerations, even if we believe we have sufficient funds for our current and future operating plans. For example, we may choose to raise additional capital to fund in-licensing or product acquisition opportunities.
Sources and Uses of Cash
The following table summarizes our cash flow activities (in thousands):
|
|
Year Ended December 31,
|
||||||||||
|
|
2016
|
2015
|
2014
|
||||||||
|
Net loss
|
$
|
(70,222
|
)
|
$
|
(161,744
|
)
|
$
|
(261,297
|
)
|
||
|
Adjustments to reconcile net loss to net cash used in operating activities
|
49,251
|
|
46,004
|
|
36,169
|
|
|||||
|
Changes in operating assets and liabilities
|
227,267
|
|
(25,845
|
)
|
(10,277
|
)
|
|||||
|
Net cash provided by (used in) operating activities
|
206,296
|
|
(141,585
|
)
|
(235,405
|
)
|
|||||
|
Net cash (used in) provided by investing activities
|
(216,048
|
)
|
50,077
|
|
146,330
|
|
|||||
|
Net cash provided by financing activities
|
19,804
|
|
152,747
|
|
65,492
|
|
|||||
|
Net increase (decrease) in cash and cash equivalents
|
10,052
|
|
61,239
|
|
(23,583
|
)
|
|||||
|
Cash and cash equivalents at beginning of year
|
141,634
|
|
80,395
|
|
103,978
|
|
|||||
|
Cash and cash equivalents at end of year
|
$
|
151,686
|
|
$
|
141,634
|
|
$
|
80,395
|
|
||
Operating Activities
Our operating activities provided cash of
$206.3 million
for the year ended
December 31, 2016
, compared to
$141.6 million
cash used in
2015
and
$235.4 million
cash used in
2014
.
Cash provided by operating activities for the
year ended
December 31, 2016
was primarily a result of
$280.0 million
in upfront and milestone payments received from Ipsen under our collaboration and license agreement and cash receipts from our net product revenues of
$135.4 million
. Those proceeds were partially offset by operating expenses of
$219.6 million
for the period, less non-cash expenses for stock-based compensation totaling
$22.9 million
and the amortization of debt discount, debt issuance costs and accrual of interest paid in kind totaling
$16.4 million
. Our operating expenses were largely attributable to the development and commercialization of cabozantinib. In addition, cash provided by operating activities also increased as a result of a
$16.7 million
increase in accrued compensation and benefits and a
$6.8 million
increase in other liabilities which was partially offset by a
$37.0 million
increase in trade and other receivables, a
$10.9 million
decrease in the accrued partnership liability and a
$3.9 million
decrease in accrued clinical trial liabilities.
Cash used in operating activities for the year ended December 31, 2015 related primarily to our $158.6 million operating expenses for the period, less $37.2 million in revenues for the period and non-cash expenses for accretion of debt discount and interest paid in kind totaling $20.9 million on the Deerfield Notes and the 2019 Notes and stock-based compensation totaling $22.0 million. In addition to current period operating expenses, we made cash payments that resulted in a $23.5 million reduction in accrued clinical trial liabilities and an $8.8 million reduction in restructuring liabilities, which was partially offset by a $10.2 million increase in our accrued collaboration liability.
62
Cash used in operating activities for the year ended December 31, 2014 related primarily to our $249.6 million in operating expenses for the period, less non-cash expenses for accretion of debt discount totaling $22.3 million on the Deerfield Notes and the 2019 Notes, stock-based compensation totaling $10.0 million and depreciation and amortization totaling $2.4 million. Our operating expenses were largely attributable to the development of cabozantinib. In addition, we made cash payments that resulted in a $13.2 million reduction in accounts payable and other accrued expenses during the period and paid $10.2 million for restructuring activities, which was partially offset by a $6.6 million increase in accrued clinical trial liabilities.
Operating cash flows can differ from our consolidated net loss as a result of differences in the timing of cash receipts and earnings recognition and non-cash charges.
Investing Activities
Our investing activities resulted in a
$216.0 million
use of cash for the year ended
December 31, 2016
, as compared to providing cash of
$50.1 million
for
2015
and
$146.3 million
for
2014
.
Cash used by investing activities for the
year ended
December 31, 2016
was primarily due to investment purchases of
$377.8 million
, less cash from the maturity of unrestricted and restricted investments of
$158.6 million
.
Cash provided by investing activities for the year ended December 31, 2015 was primarily due to the maturity of unrestricted and restricted investments of $198.7 million, less investment purchases of $149.6 million.
Cash provided by investing activities for the year ended December 31, 2014 was primarily due to the maturity of unrestricted and restricted investments of $273.2 million, less investment purchases of $127.7 million.
Financing Activities
Our financing activities provided cash of
$19.8 million
for the year ended
December 31, 2016
, compared to
$152.7 million
for
2015
, and
$65.5 million
for
2014
.
Cash provided by financing activities for the
year ended
December 31, 2016
was the result of the issuance of common stock under our equity incentive plans totaling
$27.5 million
which was partially offset by cash payments from the conversion and redemption of the 2019 Notes totaling
$7.7 million
.
Cash provided by our financing activities for the year ended December 31, 2015 was primarily due to the issuance of 28,750,000 shares of common stock in July 2015 for net proceeds of $145.6 million and $10.9 million in proceeds from the exercise of stock options, which was partially offset by principal payments on debt of $4.4 million.
Cash provided by our financing activities for the year ended December 31, 2014 was primarily due to the issuance of 10,000,000 shares of common stock in January 2014 for net proceeds of $75.6 million. The cash provided by the issuance of common stock was partially offset by principal payments on debt of $11.7 million.
Proceeds from these financing activities have historically been used for general working capital purposes, such as product commercialization and research and development activities and other general corporate purposes. However, during the next two years, we will be required to make significant payments to satisfy our outstanding debt obligations. On May 31, 2017, we will be required to pay the principal balance of
$80.0 million
plus accrued and unpaid interest on our term loan with Silicon Valley Bank and on July 1, 2018 we will be required to pay the principal balance of
$125.0 million
including interest paid in kind, plus accrued and unpaid coupon interest on the Deerfield Notes. We intend to repay the Deerfield Notes early, on or about July 1, 2017, at a prepayment price equal to
105%
of the outstanding principal amount of the notes, plus accrued and unpaid interest to the date of repayment. We expect that cash and cash equivalents and short-term investments held at
December 31, 2016
will be used to repay the debt. See “Note 7. Debt” to our “Notes to Consolidated Financial Statements” contained in Part II, Item 8 of this Annual Report on Form 10-K for additional details on these debt arrangements.
Off-Balance Sheet Arrangements
As of
December 31, 2016
, we did not have any material off-balance-sheet arrangements, as defined by applicable SEC regulations.
63
Contractual Obligations
We have contractual obligations in the form of convertible notes, loans payable, operating leases and purchase obligations. The following chart details our contractual obligations, including any potential accrued or accreted interest, as of
December 31, 2016
(in thousands):
|
|
Payments Due by Period
|
|||||||||||||||
|
Contractual Obligations
|
Total
|
Less than
1 year
|
1-3
Years
|
More than 3
years
|
||||||||||||
|
Deerfield notes
(1)
|
$
|
124,972
|
|
$
|
—
|
|
$
|
124,972
|
|
$
|
—
|
|
||||
|
Loans payable
(2)
|
80,000
|
|
80,000
|
|
—
|
|
—
|
|
||||||||
|
Operating leases
(3)
|
11,481
|
|
8,474
|
|
3,007
|
|
—
|
|
||||||||
|
Purchase obligations
(4)
|
1,112
|
|
1,112
|
|
—
|
|
—
|
|
||||||||
|
Total contractual cash obligations
|
$
|
217,565
|
|
$
|
89,586
|
|
$
|
127,979
|
|
$
|
—
|
|
||||
____________________
|
(1)
|
Due date is based on our contractual obligations under the Deerfield Notes. We intend to repay the Deerfield Notes on or about July 1, 2017 and as a result, we have classified the Deerfield Notes as a current liability as of December 31, 2016. See “Note 7. Debt” of the Notes to Consolidated Financial Statements regarding the terms of the Deerfield Notes.
|
|
(2)
|
Consists of our obligations under our loan from Silicon Valley Bank. See “Note 7. Debt” of the Notes to Consolidated Financial Statements regarding the terms of our loan from Silicon Valley Bank.
|
|
(3)
|
The operating lease payments do not include
$1.2 million
to be received in 2017 in connection with the subleases of our South San Francisco buildings.
|
|
(4)
|
At December 31, 2016, we had firm purchase commitments related to manufacturing and maintenance of inventory. These commitments include a portion of our 2017 contractual minimum purchase obligation. Our actual purchases are expected to significantly exceed these amounts.
|
In connection with the sale of our plant trait business in 2007, we agreed to indemnify the purchaser and its affiliates up to a specified amount if they incur damages due to any infringement or alleged infringement of certain patents. We have certain collaboration licensing agreements, which contain standard indemnification clauses. Such clauses typically indemnify the customer or vendor for an adverse judgment in a lawsuit in the event of our misuse or negligence. We consider the likelihood of an adverse judgment related to an indemnification agreement to be remote. Furthermore, in the event of an adverse judgment, any losses under such an adverse judgment may be substantially offset by applicable corporate insurance.
Critical Accounting Estimates
The preparation of our consolidated financial statements is in conformity with accounting principles generally accepted in the U.S. which requires management to make judgments, estimates and assumptions that affect the reported amounts of assets, liabilities, revenue and expenses, and related disclosures. An accounting policy is considered to be critical if it requires an accounting estimate to be made based on assumptions about matters that are highly uncertain at the time the estimate is made, and if different estimates that reasonably could have been used, or changes in the accounting estimates that are reasonably likely to occur periodically, could materially impact our consolidated financial statements.
On an ongoing basis, management evaluates its estimates including, but not limited to, those related to revenue recognition, including deductions from revenues (such as rebates, chargebacks, sales returns and sales allowances), the period of performance, identification of deliverables and evaluation of milestones with respect to our collaborations, the amounts of revenues and expenses under our profit and loss sharing agreement, recoverability of inventory, certain accrued liabilities including the accrued clinical trial liability, the valuation of the debt and equity components of our convertible debt and stock-based compensation.
We base our estimates on historical experience and on various other market-specific and other relevant assumptions that we believe to be reasonable under the circumstances, the results of which form the basis for making judgments about the carrying values of assets and liabilities that are not readily apparent from other sources. Our senior management has discussed the development, selection and disclosure of these estimates with the Audit Committee of our Board of Directors. Actual results may differ from these estimates under different assumptions or conditions.
We believe the following critical accounting policies reflect the more significant judgments and estimates used in the preparation of our Consolidated Financial Statements. For a complete description of our significant accounting policies, see “Note 1 - Organization and Summary of Significant Accounting Policies” in the “Notes to Consolidated Financial Statements” included in this Annual Report on Form 10-K.
64
Revenue Recognition
Net Product Revenues and Discounts and Allowances
We recognize net product revenues when there is persuasive evidence that an arrangement exists, delivery has occurred, the price is fixed or determinable and collectability is reasonably assured. We calculate gross product revenues based on the price that we charge to the specialty pharmacies and distributors in the U.S. We estimate our domestic net product revenues by deducting from our gross product revenues (a) trade allowances, such as discounts for prompt payment, (b) estimated government rebates and chargebacks, (c) certain other fees paid to specialty pharmacies and distributors and (d) returns. Discounts and allowances are complex and significant judgment by management. Estimates are assessed each period and updated to reflect current information.
We initially record estimates for these deductions at the time we recognize the gross revenue. Our estimates for these deductions are based on third party market research data for competitor products for the treatment of advanced RCC, customer and payer data received from the specialty pharmacies and distributors whom sell our product and historical utilization rates. Based in part on the availability of this third party market research data and historical data for COMETRIQ, we made the determination during 2016 that we had sufficient experience and data to reasonably estimate expected future returns and the discounts and allowances due to payers at the time of shipment to the specialty pharmacy or distributor, and therefore record revenue for CABOMETYX product sales using the “sell-in” revenue recognition model. We update our estimates on a recurring basis as new information becomes available. See “Note 1. Organization and Summary of Significant Accounting Policies” to our Consolidated Financial Statements for a further description of our discounts and allowances.
Collaboration Revenues
Revenues from collaboration agreements primarily consist of upfront license fees, milestone, royalty and/or product supply payments. These arrangements have multiple elements and our deliverables may include intellectual property rights, distribution rights, delivery of manufactured product, commercial and development activities and participation on joint steering, commercial and development committees. In order to account for these arrangements, we identify the deliverables and evaluate whether the delivered elements have value to our collaboration partner on a stand-alone basis and represent separate units of accounting. Analyzing the arrangement to identify deliverables requires the use of judgment, and each deliverable may be an obligation to deliver future goods or services, a right or license to use an asset, or another performance obligation. If we determine that multiple deliverables exist, the consideration is allocated to one or more units of accounting based upon the best estimate of the selling price of each deliverable. The selling price used for each deliverable will be based on vendor-specific objective evidence, if available, third-party evidence if vendor-specific objective evidence is not available, or estimated selling price if neither vendor-specific or third-party evidence is available. A delivered item or items that do not qualify as a separate unit of accounting within the arrangement shall be combined with the other applicable undelivered items within the arrangement. The allocation of arrangement consideration and the recognition of revenue then shall be determined for those combined deliverables as a single unit of accounting. For a combined unit of accounting, non-refundable upfront fees are recognized in a manner consistent with the final deliverable, which has generally been ratably over the period of our continued involvement. Amounts received in advance of performance are recorded as deferred revenue. The determination of deliverables and the allocation of consideration using selling prices and the period of our continued involvement may involve significant judgments and estimates that will impact revenue recognition. Often, the term of our continued involvement is not contractually defined and an estimate of the term of our total obligation must be made. Therefore, any changes in the expected term of our continued involvement will impact revenue recognition for the given period.
Royalty revenues, and U.S. profits and losses under the collaboration agreement with Genentech, are based on amounts reported to us by our collaboration partners and are recorded when such information becomes available to us; for Ipsen, this occurs in the current quarter, and for Genentech, this occurs in the following quarter. We base our estimates on the best information available at the time provided to us by our collaboration partners. However, additional information may subsequently become available to us, which may allow us to make a more accurate estimate in future periods. In this event, we are required to record adjustments to collaboration revenue in future periods when the actual level of activity becomes more certain. Such increases or decreases in revenue are generally considered to be changes in estimates and will be reflected in collaboration revenues in the period they become known.
Inventory
We consider regulatory approval of product candidates to be uncertain and product manufactured prior to regulatory approval may not be sold unless regulatory approval is obtained. As such, the manufacturing costs for product candidates
65
incurred prior to regulatory approval are not capitalized as inventory, but rather are expensed as research and development costs. When regulatory approval is obtained, capitalization of inventory may begin.
We value inventory at the lower of cost or net realizable value. We determine the cost of inventory using the standard-cost method, which approximates actual cost based on a first-in, first-out method. We analyze our inventory levels quarterly and write down inventory subject to expiry in excess of expected requirements, or that has a cost basis in excess of its expected net realizable value. The related costs are recognized as cost of goods sold in the Consolidated Statements of Operations.
On a quarterly basis, we analyze our estimated production levels for the following twelve month period, which is our normal operating cycle and reclassify inventory we do not expect to use within the next twelve months into Other long-term assets in the Consolidated Balance Sheets.
Clinical Trial Accruals
All of our clinical trials have been executed with support from contract research organizations, or CROs, and other vendors. We accrue costs for clinical trial activities performed by CROs based upon the estimated amount of work completed on each trial. For clinical trial expenses, the significant factors used in estimating accruals include the number of patients enrolled, the activities to be performed for each patient, the number of active clinical sites, and the duration for which the patients will be enrolled in the trial. We monitor patient enrollment levels and related activities to the extent possible through internal reviews, correspondence with CROs and review of contractual terms. We base our estimates on the best information available at the time. However, additional information may become available to us, which may allow us to make a more accurate estimate in future periods. If we do not identify costs that we have begun to incur or if we underestimate or overestimate the level of services performed or the costs of these services, our actual expenses could differ from our estimates. There were no such significant reductions during the years ended December 31, 2016, 2015 or 2014.
Stock Option Valuation
Our estimate of compensation expense requires us to determine the appropriate fair value model and a number of complex and subjective assumptions including our stock price volatility, employee exercise patterns, future forfeitures and related tax effects. The most significant assumptions are our estimates of the expected volatility and the expected term of the stock option. In addition, we are required to estimate the expected forfeiture rate, including assessing the likelihood of achieving our goals for performance-based stock options, and recognize expense only for those shares expected to vest. If our actual forfeiture rate is materially different from our estimate, the stock-based compensation expense could be significantly different from what we have recorded in the current period. The value of a stock option is derived from its potential for appreciation. The more volatile the stock, the more valuable the option becomes because of the greater possibility of significant changes in stock price. Because there is a market for options on our common stock, we have considered implied volatilities as well as our historical realized volatilities when developing an estimate of expected volatility. The expected option term also has a significant effect on the value of the option. The longer the term, the more time the option holder has to allow the stock price to increase without a cash investment and thus, the more valuable the option. Further, lengthier option terms provide more opportunity to exploit market highs. However, empirical data show that employees, for a variety of reasons, typically do not wait until the end of the contractual term of a nontransferable option to exercise. Accordingly, companies are required to estimate the expected term of the option for input to an option-pricing model. As required under generally accepted accounting principles, we review our valuation assumptions at each grant date and, as a result, from time to time we will likely change the valuation assumptions we use to value stock options granted in future periods. The assumptions used in calculating the fair value of stock options represent management’s best estimates, but these estimates involve inherent uncertainties and the application of management judgment. As a result, if factors change and we use different assumptions, our stock-based compensation expense could be materially different in the future. As of
December 31, 2016
,
$23.9 million
of total unrecognized compensation expense related to stock options was expected to be recognized over a weighted-average period of
2.90 years
and
$13.9 million
of total unrecognized compensation expense relating to RSUs was expected to be recognized over
3.28 years
. See “Note 10. Employee Benefit Plans” of the Notes to Consolidated Financial Statements for a further discussion on stock-based compensation.
Recent Accounting Pronouncements
For a description of the expected impact of recent accounting pronouncements, see “Note 1 - Organization and Summary of Significant Accounting Policies” in the “Notes to Consolidated Financial Statements” included in this Annual Report on Form 10-K.
66
|
ITEM 7A.
|
QUANTITATIVE AND QUALITATIVE DISCLOSURES ABOUT MARKET RISK
|
Our exposure to market risk for changes in interest rates relates primarily to our investment portfolio and our long-term debt. As of
December 31, 2016
and
2015
, we had cash and investments of
$479.6 million
and
$253.3 million
, respectively. Our investments are subject to interest rate risk, and our interest income may fluctuate due to changes in U.S. interest rates. We manage market risk through diversification requirements mandated by our investment policy, which limits the amount of our portfolio that can be invested in a single issuer. We limit our credit risk by limiting purchases to high-quality issuers. At
December 31, 2016
and
2015
, we had debt outstanding of
$189.1 million
and
$417.9 million
, respectively. Our payment commitments associated with these debt instruments are primarily fixed and consist of interest payments, principal payments, or a combination of both. The fair value of our investments and our debt will fluctuate with movements of interest rates. We have estimated the effects on our interest rate sensitive assets and liabilities based on a one percentage point hypothetical adverse change in interest rates as of
December 31, 2016
and
2015
. For our investments, the estimated effects of hypothetical interest rate changes are obtained from the same third-party pricing sources we use to value our investments. For debt instruments, we determine the estimated effects of hypothetical interest rate changes using the same present value model we use to determine the fair of value of those instruments. As of
December 31, 2016
and
2015
, a decrease in the interest rates of one percentage point would have had a net adverse change in the fair value of interest rate sensitive assets and liabilities of
$0.3 million
and
$8.7 million
, respectively.
In addition, we have exposure to fluctuations in certain foreign currencies in countries in which we conduct clinical trials. Most of our foreign expenses incurred were associated with establishing and conducting clinical trials for cabozantinib at sites outside of the U.S. Our agreements with the foreign sites that conduct such clinical trials generally provide that payments for the services provided will be calculated in the currency of that country, and converted into U.S. dollars using various exchange rates based upon when services are rendered or the timing of invoices. When the U.S. dollar weakens against foreign currencies, the U.S. dollar value of the foreign-currency denominated expense increases, and when the U.S. dollar strengthens against these currencies, the U.S. dollar value of the foreign-currency denominated expense decreases. As of
December 31, 2016
and
2015
, approximately
$2.2 million
and
$3.2 million
, respectively, of our clinical accrual balance was owed in foreign currencies. An adverse change of one percentage point in the foreign currency exchange rates would not have resulted in a material impact for any periods presented. We recorded a
$0.2 million
loss, a
$0.1 million
gain and a
$0.5 million
gain relating to foreign exchange fluctuations for the years ended
December 31, 2016
,
2015
and
2014
, respectively.
|
ITEM 8.
|
FINANCIAL STATEMENTS AND SUPPLEMENTARY DATA
|
EXELIXIS, INC.
INDEX TO CONSOLIDATED FINANCIAL STATEMENTS
|
|
Page
|
67
Report of Independent Registered Public Accounting Firm
The Board of Directors and Stockholders of Exelixis, Inc.
We have audited the accompanying consolidated balance sheets of Exelixis, Inc. as of
December 30, 2016
and
January 1, 2016
, and the related consolidated statements of operations, comprehensive loss, stockholders’ equity (deficit) and cash flows for each of the three fiscal years in the period ended
December 30, 2016
. These financial statements are the responsibility of the Company’s management. Our responsibility is to express an opinion on these financial statements based on our audits.
We conducted our audits in accordance with the standards of the Public Company Accounting Oversight Board (United States). Those standards require that we plan and perform the audit to obtain reasonable assurance about whether the financial statements are free of material misstatement. An audit includes examining, on a test basis, evidence supporting the amounts and disclosures in the financial statements. An audit also includes assessing the accounting principles used and significant estimates made by management, as well as evaluating the overall financial statement presentation. We believe that our audits provide a reasonable basis for our opinion.
In our opinion, the financial statements referred to above present fairly, in all material respects, the consolidated financial position of Exelixis, Inc. at
December 30, 2016
and
January 1, 2016
, and the consolidated results of its operations and its cash flows for each of the three fiscal years in the period ended
December 30, 2016
, in conformity with U.S. generally accepted accounting principles.
We also have audited, in accordance with the standards of the Public Company Accounting Oversight Board (United States), Exelixis, Inc.’s internal control over financial reporting as of
December 30, 2016
, based on criteria established in
Internal Control – Integrated Framework
issued by the Committee of Sponsoring Organizations of the Treadway Commission (2013 framework) and our report dated
February 27, 2017
expressed an unqualified opinion thereon.
/s/ Ernst & Young LLP
Redwood City, California
February 27, 2017
68
EXELIXIS, INC.
(in thousands, except share and per share data)
|
|
December 31,
|
||||||
|
|
2016
|
2015
|
|||||
|
ASSETS
|
|||||||
|
Current assets:
|
|||||||
|
Cash and cash equivalents
|
$
|
151,686
|
|
$
|
141,634
|
|
|
|
Short-term investments
|
268,117
|
|
25,426
|
|
|||
|
Trade and other receivables
|
42,246
|
|
5,183
|
|
|||
|
Inventory
|
3,338
|
|
2,616
|
|
|||
|
Prepaid expenses and other current assets
|
5,416
|
|
3,806
|
|
|||
|
Total current assets
|
470,803
|
|
178,665
|
|
|||
|
Long-term investments
|
55,601
|
|
83,600
|
|
|||
|
Long-term restricted cash and investments
|
4,150
|
|
2,650
|
|
|||
|
Property and equipment, net
|
2,071
|
|
1,434
|
|
|||
|
Goodwill
|
63,684
|
|
63,684
|
|
|||
|
Other long-term assets
|
1,232
|
|
2,309
|
|
|||
|
Total assets
|
$
|
597,541
|
|
$
|
332,342
|
|
|
|
LIABILITIES AND STOCKHOLDERS’ EQUITY (DEFICIT)
|
|||||||
|
Current liabilities:
|
|||||||
|
Accounts payable
|
$
|
6,565
|
|
$
|
6,401
|
|
|
|
Accrued compensation and benefits
|
20,334
|
|
3,629
|
|
|||
|
Accrued clinical trial liabilities
|
14,131
|
|
18,071
|
|
|||
|
Accrued collaboration liability
|
—
|
|
10,938
|
|
|||
|
Current portion of convertible notes
|
109,122
|
|
—
|
|
|||
|
Current portion of term loan payable
|
80,000
|
|
—
|
|
|||
|
Current portion of deferred revenue
|
19,665
|
|
—
|
|
|||
|
Other current liabilities
|
20,771
|
|
13,212
|
|
|||
|
Total current liabilities
|
270,588
|
|
52,251
|
|
|||
|
Long-term portion of convertible notes
|
—
|
|
337,937
|
|
|||
|
Long-term portion of term loan payable
|
—
|
|
80,000
|
|
|||
|
Long-term portion of deferred revenue
|
237,094
|
|
—
|
|
|||
|
Other long-term liabilities
|
541
|
|
2,960
|
|
|||
|
Total liabilities
|
508,223
|
|
473,148
|
|
|||
|
Commitments (Note 13)
|
|
|
|||||
|
Stockholders’ equity (deficit):
|
|||||||
|
Preferred stock, $0.001 par value, 10,000,000 shares authorized and no shares issued
|
—
|
|
—
|
|
|||
|
Common stock, $0.001 par value; 400,000,000 shares authorized; issued and
outstanding: 289,923,798 and 227,960,943 shares at December 31, 2016 and 2015,
respectively
|
290
|
|
228
|
|
|||
|
Additional paid-in capital
|
2,072,591
|
|
1,772,123
|
|
|||
|
Accumulated other comprehensive loss
|
(416
|
)
|
(232
|
)
|
|||
|
Accumulated deficit
|
(1,983,147
|
)
|
(1,912,925
|
)
|
|||
|
Total stockholders’ equity (deficit)
|
89,318
|
|
(140,806
|
)
|
|||
|
Total liabilities and stockholders’ equity (deficit)
|
$
|
597,541
|
|
$
|
332,342
|
|
|
The accompanying notes are an integral part of these consolidated financial statements.
69
EXELIXIS, INC.
(in thousands, except per share data)
|
|
Year Ended December 31,
|
||||||||||
|
|
2016
|
2015
|
2014
|
||||||||
|
Revenues:
|
|||||||||||
|
Net product revenues
|
$
|
135,375
|
|
$
|
34,158
|
|
$
|
25,111
|
|
||
|
Collaboration revenues
|
56,079
|
|
3,014
|
|
—
|
|
|||||
|
Total revenues
|
191,454
|
|
37,172
|
|
25,111
|
|
|||||
|
Operating expenses:
|
|||||||||||
|
Cost of goods sold
|
6,552
|
|
3,895
|
|
2,043
|
|
|||||
|
Research and development
|
95,967
|
|
96,351
|
|
189,101
|
|
|||||
|
Selling, general and administrative
|
116,145
|
|
57,305
|
|
50,829
|
|
|||||
|
Restructuring charges
|
914
|
|
1,042
|
|
7,596
|
|
|||||
|
Total operating expenses
|
219,578
|
|
158,593
|
|
249,569
|
|
|||||
|
Loss from operations
|
(28,124
|
)
|
(121,421
|
)
|
(224,458
|
)
|
|||||
|
Other expense, net:
|
|||||||||||
|
Interest income and other, net
|
4,863
|
|
412
|
|
4,341
|
|
|||||
|
Interest expense
|
(33,060
|
)
|
(40,680
|
)
|
(41,362
|
)
|
|||||
|
Loss on extinguishment of debt
|
(13,901
|
)
|
—
|
|
—
|
|
|||||
|
Total other expense, net
|
(42,098
|
)
|
(40,268
|
)
|
(37,021
|
)
|
|||||
|
Loss before income taxes
|
(70,222
|
)
|
(161,689
|
)
|
(261,479
|
)
|
|||||
|
Income tax provision (benefit)
|
—
|
|
55
|
|
(182
|
)
|
|||||
|
Net loss
|
$
|
(70,222
|
)
|
$
|
(161,744
|
)
|
$
|
(261,297
|
)
|
||
|
Net loss per share, basic and diluted
|
$
|
(0.28
|
)
|
$
|
(0.77
|
)
|
$
|
(1.34
|
)
|
||
|
Shares used in computing basic and diluted net loss per share
|
250,531
|
|
209,227
|
|
194,299
|
|
|||||
The accompanying notes are an integral part of these consolidated financial statements.
EXELIXIS, INC.
CONSOLIDATED STATEMENTS OF COMPREHENSIVE LOSS
(in thousands)
|
|
Year Ended December 31,
|
||||||||||
|
|
2016
|
2015
|
2014
|
||||||||
|
Net loss
|
$
|
(70,222
|
)
|
$
|
(161,744
|
)
|
$
|
(261,297
|
)
|
||
|
Other comprehensive loss
(1)
|
(184
|
)
|
(111
|
)
|
(267
|
)
|
|||||
|
Comprehensive loss
|
$
|
(70,406
|
)
|
$
|
(161,855
|
)
|
$
|
(261,564
|
)
|
||
____________________
|
(1)
|
Other comprehensive loss consisted solely of unrealized losses, net on available-for-sale securities arising during the periods presented. There were
no
reclassification adjustments to net loss resulting from realized gains or losses on the sale of securities and there was
no
income tax expense related to other comprehensive loss during those years.
|
The accompanying notes are an integral part of these consolidated financial statements.
70
EXELIXIS, INC.
CONSOLIDATED STATEMENTS OF STOCKHOLDERS’ EQUITY (DEFICIT)
(in thousands, except share data)
|
Common
Stock
Shares
|
Common
Stock
Amount
|
Additional
Paid-in
Capital
|
Accumulated
Other
Comprehensive
(Loss) Income
|
Accumulated
Deficit
|
Total
Stockholders’
Equity (Deficit)
|
|||||||||||||||||
|
Balance at December 31, 2013
|
184,533,651
|
|
$
|
184
|
|
$
|
1,504,052
|
|
$
|
146
|
|
$
|
(1,489,884
|
)
|
$
|
14,498
|
|
|||||
|
Net loss
|
—
|
|
—
|
|
—
|
|
—
|
|
(261,297
|
)
|
(261,297
|
)
|
||||||||||
|
Other comprehensive loss
|
—
|
|
—
|
|
—
|
|
(267
|
)
|
—
|
|
(267
|
)
|
||||||||||
|
Sale of shares of common stock, net
|
10,000,000
|
|
10
|
|
75,633
|
|
—
|
|
—
|
|
75,643
|
|
||||||||||
|
Issuance of common stock under stock plans
|
1,362,118
|
|
2
|
|
2,091
|
|
—
|
|
—
|
|
2,093
|
|
||||||||||
|
Stock-based compensation expense
|
—
|
|
—
|
|
10,006
|
|
—
|
|
—
|
|
10,006
|
|
||||||||||
|
Balance at December 31, 2014
|
195,895,769
|
|
196
|
|
1,591,782
|
|
(121
|
)
|
(1,751,181
|
)
|
(159,324
|
)
|
||||||||||
|
Net loss
|
—
|
|
—
|
|
—
|
|
—
|
|
(161,744
|
)
|
(161,744
|
)
|
||||||||||
|
Other comprehensive loss
|
—
|
|
—
|
|
—
|
|
(111
|
)
|
—
|
|
(111
|
)
|
||||||||||
|
Sale of shares of common stock, net
|
28,750,000
|
|
29
|
|
145,620
|
|
—
|
|
—
|
|
145,649
|
|
||||||||||
|
Warrants transferred from other long-term liabilities
|
—
|
|
—
|
|
1,470
|
|
—
|
|
—
|
|
1,470
|
|
||||||||||
|
Issuance of common stock under stock plans
|
3,315,174
|
|
3
|
|
11,274
|
|
—
|
|
—
|
|
11,277
|
|
||||||||||
|
Stock-based compensation expense
|
—
|
|
—
|
|
21,977
|
|
—
|
|
—
|
|
21,977
|
|
||||||||||
|
Balance at December 31, 2015
|
227,960,943
|
|
228
|
|
1,772,123
|
|
(232
|
)
|
(1,912,925
|
)
|
(140,806
|
)
|
||||||||||
|
Net loss
|
—
|
|
—
|
|
—
|
|
—
|
|
(70,222
|
)
|
(70,222
|
)
|
||||||||||
|
Other comprehensive loss
|
—
|
|
—
|
|
—
|
|
(184
|
)
|
—
|
|
(184
|
)
|
||||||||||
|
Issuance of common stock in settlement of convertible notes
|
54,009,279
|
|
54
|
|
253,026
|
|
—
|
|
—
|
|
253,080
|
|
||||||||||
|
Issuance of common stock under stock plans
|
7,953,576
|
|
8
|
|
24,530
|
|
—
|
|
—
|
|
24,538
|
|
||||||||||
|
Stock-based compensation expense
|
—
|
|
—
|
|
22,912
|
|
—
|
|
—
|
|
22,912
|
|
||||||||||
|
Balance at December 31, 2016
|
289,923,798
|
|
$
|
290
|
|
$
|
2,072,591
|
|
$
|
(416
|
)
|
$
|
(1,983,147
|
)
|
$
|
89,318
|
|
|||||
The accompanying notes are an integral part of these consolidated financial statements.
71
EXELIXIS, INC.
(in thousands)
|
|
Year Ended December 31,
|
||||||||||
|
|
2016
|
2015
|
2014
|
||||||||
|
Cash flows from operating activities:
|
|||||||||||
|
Net loss
|
$
|
(70,222
|
)
|
$
|
(161,744
|
)
|
$
|
(261,297
|
)
|
||
|
Adjustments to reconcile net loss to net cash provided by (used in) operating activities:
|
|||||||||||
|
Depreciation and amortization
|
1,002
|
|
1,406
|
|
2,391
|
|
|||||
|
Stock-based compensation expense
|
22,912
|
|
21,977
|
|
10,006
|
|
|||||
|
Loss on extinguishment of debt
|
13,901
|
|
—
|
|
—
|
|
|||||
|
Amortization of debt discounts and debt issuance costs
|
8,432
|
|
17,041
|
|
22,289
|
|
|||||
|
Accrual of interest paid in kind
|
8,008
|
|
3,817
|
|
—
|
|
|||||
|
Gain on sale of business and other equity investment
|
(2,494
|
)
|
(112
|
)
|
(838
|
)
|
|||||
|
Changes in the fair value of warrants
|
—
|
|
548
|
|
(1,840
|
)
|
|||||
|
Other
|
(2,510
|
)
|
1,327
|
|
4,161
|
|
|||||
|
Changes in assets and liabilities:
|
|||||||||||
|
Trade and other receivables
|
(37,002
|
)
|
(646
|
)
|
(941
|
)
|
|||||
|
Inventory
|
(722
|
)
|
(235
|
)
|
509
|
|
|||||
|
Prepaid expenses and other current assets
|
(1,610
|
)
|
(325
|
)
|
1,526
|
|
|||||
|
Other long-term assets
|
1,077
|
|
1,340
|
|
(2,149
|
)
|
|||||
|
Accounts payable
|
164
|
|
(12
|
)
|
(2,932
|
)
|
|||||
|
Accrued compensation and benefits
|
16,705
|
|
279
|
|
(9,447
|
)
|
|||||
|
Accrued clinical trial liabilities
|
(3,940
|
)
|
(23,474
|
)
|
6,587
|
|
|||||
|
Accrued collaboration liability
|
(10,938
|
)
|
|
10,206
|
|
732
|
|
||||
|
Deferred revenue
|
256,759
|
|
(2,582
|
)
|
1,133
|
|
|||||
|
Other current and long-term liabilities
|
6,774
|
|
(10,396
|
)
|
(5,295
|
)
|
|||||
|
Net cash provided by (used in) operating activities
|
206,296
|
|
(141,585
|
)
|
(235,405
|
)
|
|||||
|
Cash flows from investing activities:
|
|||||||||||
|
Purchases of property and equipment
|
(1,703
|
)
|
(447
|
)
|
(474
|
)
|
|||||
|
Proceeds from sale of property and equipment
|
97
|
|
1,346
|
|
392
|
|
|||||
|
Proceeds from sale of business and other equity investments
|
2,494
|
|
95
|
|
838
|
|
|||||
|
Proceeds from maturities of restricted cash and investments
|
7,150
|
|
19,789
|
|
20,354
|
|
|||||
|
Purchase of restricted cash and investments
|
(8,650
|
)
|
(5,650
|
)
|
(8,143
|
)
|
|||||
|
Proceeds from sale of investments
|
2,266
|
|
—
|
|
—
|
|
|||||
|
Proceeds from maturities of investments
|
151,485
|
|
178,936
|
|
252,891
|
|
|||||
|
Purchases of investments
|
(369,187
|
)
|
(143,992
|
)
|
(119,528
|
)
|
|||||
|
Net cash (used in) provided by investing activities
|
(216,048
|
)
|
50,077
|
|
146,330
|
|
|||||
|
Cash flows from financing activities:
|
|||||||||||
|
Proceeds from issuance of common stock, net
|
—
|
|
145,649
|
|
75,643
|
|
|||||
|
Proceeds from exercise of stock options
|
25,327
|
|
10,911
|
|
120
|
|
|||||
|
Proceeds from employee stock purchase plan
|
2,187
|
|
568
|
|
1,438
|
|
|||||
|
Principal payments on debt
|
—
|
|
(4,381
|
)
|
(11,709
|
)
|
|||||
|
Redemption of convertible notes
|
(575
|
)
|
—
|
|
—
|
|
|||||
|
Payments on conversion of convertible notes
|
(7,135
|
)
|
—
|
|
—
|
|
|||||
|
Net cash provided by financing activities
|
19,804
|
|
152,747
|
|
65,492
|
|
|||||
|
Net increase (decrease) in cash and cash equivalents
|
10,052
|
|
61,239
|
|
(23,583
|
)
|
|||||
|
Cash and cash equivalents at beginning of year
|
141,634
|
|
80,395
|
|
103,978
|
|
|||||
|
Cash and cash equivalents at end of year
|
$
|
151,686
|
|
$
|
141,634
|
|
$
|
80,395
|
|
||
(Continued on next page)
72
EXELIXIS, INC.
CONSOLIDATED STATEMENTS OF CASH FLOWS
(Continued)
(in thousands)
|
|
Year Ended December 31,
|
||||||||||
|
|
2016
|
2015
|
2014
|
||||||||
|
Supplemental cash flow disclosure:
|
|||||||||||
|
Cash paid for interest
|
$
|
21,044
|
|
$
|
19,822
|
|
$
|
19,109
|
|
||
|
Cash paid for taxes
|
$
|
190
|
|
$
|
192
|
|
$
|
60
|
|
||
|
Non-cash financing activity:
|
|||||||||||
|
Issuance of common stock in settlement of convertible notes
|
$
|
286,925
|
|
$
|
—
|
|
$
|
—
|
|
||
|
Issuance of warrants in connection with amendment to convertible notes
|
$
|
—
|
|
$
|
—
|
|
$
|
2,762
|
|
||
The accompanying notes are an integral part of these consolidated financial statements
73
EXELIXIS, INC.
NOTES TO CONSOLIDATED FINANCIAL STATEMENTS
Organization
Exelixis, Inc. (“Exelixis,” “we,” “our” or “us”) is
a biopharmaceutical company committed to the discovery, development and commercialization of new medicines to improve care and outcomes for people with cancer.
Since its founding in 1994,
three
products discovered at Exelixis have progressed through clinical development, received regulatory approval, and entered the commercial marketplace.
Two
are derived from cabozantinib, an inhibitor of multiple tyrosine kinases including MET, AXL, and VEGF receptors: CABOMETYX™ tablets approved for previously treated advanced kidney cancer and COMETRIQ
®
capsules approved for progressive, metastatic medullary thyroid cancer. The third product, Cotellic
®
, is a formulation of cobimetinib, a selective inhibitor of MEK, marketed under a collaboration with Genentech (a member of the Roche Group), and is approved as part of a combination regimen to treat advanced melanoma.
Basis of Consolidation
The consolidated financial statements include the accounts of Exelixis and those of our wholly-owned subsidiaries. These entities’ functional currency is the U.S. dollar. All intercompany balances and transactions have been eliminated.
Basis of Presentation
We have adopted a 52- or 53-week fiscal year policy that generally ends on the Friday closest to December 31st. Fiscal year 2014, a 53-week year, ended on January 2, 2015; fiscal year 2015, a 52-week year, ended on January 1, 2016; fiscal year 2016, a 52-week year, ended on December 30, 2016; and fiscal year 2017, a 52-week year, will end on December 29, 2017. For convenience, references in this report as of and for the fiscal years ended January 2, 2015, January 1, 2016, and December 30, 2016 are indicated as being as of and for the years ended December 31, 2014, 2015, and 2016, respectively. The quarterly period ended January 2, 2015 is a 14-week fiscal quarter; all other interim periods presented are 13-week fiscal quarters.
Use of Estimates
The preparation of our consolidated financial statements is in conformity with accounting principles generally accepted in the United States (“U.S.”) which requires management to make judgments, estimates and assumptions that affect the reported amounts of assets, liabilities, revenue and expenses, and related disclosures.
On an ongoing basis, management evaluates its estimates including, but not limited to, those related to revenue recognition, including deductions from revenues (such as rebates, chargebacks, sales returns and sales allowances), the period of performance, identification of deliverables and evaluation of milestones with respect to our collaborations, the amounts of revenues and expenses under our profit and loss sharing agreement, recoverability of inventory, certain accrued liabilities including the accrued clinical trial liability, the valuation of the debt and equity components of our convertible debt and stock-based compensation.
We base our estimates on historical experience and on various other market-specific and other relevant assumptions that we believe to be reasonable under the circumstances, the results of which form the basis for making judgments about the carrying values of assets and liabilities that are not readily apparent from other sources. Actual results could differ materially from those estimates.
Correction of an Immaterial Error
During the third quarter of 2016, we identified errors in the Consolidated Balance Sheets and Consolidated Statements of Operations, Comprehensive Loss and Cash Flows for 2015, 2014, 2013, and 2012, and in the unaudited interim Condensed Consolidated Balance Sheets and Condensed Consolidated Statements of Operations, Comprehensive Loss and Cash Flows for all prior interim fiscal periods from September 30, 2012 through June 30, 2016. Specifically, in 2012 we incorrectly calculated 1) the allocation between Additional paid-in capital and Convertible notes of the
$287.5 million
aggregate principal amount from our
4.25%
Convertible Senior Subordinated Notes due 2019 (“2019 Notes”); and 2) the amortization of the debt discount associated with the 2019 Notes during 2012 and all subsequent periods.
Having evaluated the materiality of these errors from a quantitative and qualitative perspective, management concluded that although the accumulation of these errors was significant to the three and nine months ended September 30, 2016, the correction of these errors was not material to any individual prior period, and did not have an effect on the trend of financial results, taking into account the requirements of the Securities and Exchange Commission (“SEC”) Staff Accounting Bulletin No. 99,
Materiality
and Staff Accounting Bulletin No. 108,
Considering the Effects of Prior Year Misstatements when Quantifying Misstatements in Current Year Financial Statements
. Because management has concluded that these errors are not
74
material, we will correct them prospectively when the consolidated balance sheets, statements of operations, comprehensive loss and cash flows for such periods are included in future filings.
Following are the amounts (in thousands, except per share amounts) that should have been reported for the affected line items of the statements of operations, statements of comprehensive loss and statements of cash flows:
|
Year ended December 31,
|
|||||||||||||||
|
2015
|
2014
|
2013
|
2012
|
||||||||||||
|
Statements of Operations:
|
|||||||||||||||
|
Interest expense, overstated by $7,993, $7,245, $6,568, $2,310 for the years ended December 31, 2015, 2014, 2013 and 2012, respectively
|
$
|
(40,680
|
)
|
$
|
(41,362
|
)
|
$
|
(38,779
|
)
|
$
|
(24,778
|
)
|
|||
|
Total other expense, net, overstated by $7,993, $7,245, $6,568, $2,310 for the years ended December 31, 2015, 2014, 2013 and 2012, respectively
|
$
|
(40,268
|
)
|
$
|
(37,021
|
)
|
$
|
(37,556
|
)
|
$
|
(22,792
|
)
|
|||
|
Net loss, overstated by $7,993, $7,245, $6,568, $2,310 for the years ended December 31, 2015, 2014, 2013 and 2012, respectively
|
$
|
(161,744
|
)
|
$
|
(261,297
|
)
|
$
|
(238,192
|
)
|
$
|
(145,335
|
)
|
|||
|
Net loss per share, basic and diluted, overstated by $0.04, $0.04, $0.04, $0.01 for the years ended December 31, 2015, 2014, 2013 and 2012, respectively
|
$
|
(0.77
|
)
|
$
|
(1.34
|
)
|
$
|
(1.29
|
)
|
$
|
(0.91
|
)
|
|||
|
Statements of Comprehensive Loss:
|
|||||||||||||||
|
Comprehensive loss, overstated by $7,993, $7,245, $6,568, $2,310 for the years ended December 31, 2015, 2014, 2013 and 2012, respectively
|
$
|
(161,855
|
)
|
$
|
(261,564
|
)
|
$
|
(237,954
|
)
|
$
|
(145,289
|
)
|
|||
|
Statements of Cash Flows
(1)
:
|
|||||||||||||||
|
Net loss, overstated by $7,993, $7,245, $6,568, $2,310 for the years ended December 31, 2015, 2014, 2013 and 2012, respectively
|
$
|
(161,744
|
)
|
$
|
(261,297
|
)
|
$
|
(238,192
|
)
|
$
|
(145,335
|
)
|
|||
|
Accretion of debt discount and debt issuance costs, overstated by $7,993, $7,245, $6,568, $2,310 for the years ended December 31, 2015, 2014, 2013 and 2012, respectively
|
$
|
17,041
|
|
$
|
22,289
|
|
$
|
19,722
|
|
$
|
12,442
|
|
|||
____________________
|
(1)
|
The error did not impact our net cash provided by or used in operating activities, financing activities or investing activities for any of the periods presented.
|
75
Following are the amounts (in thousands) that should have been reported for the affected line items of the balance sheets and statements of stockholders’ (deficit) equity:
|
December 31,
|
|||||||||||||||
|
2015
|
2014
|
2013
|
2012
|
||||||||||||
|
Balance Sheets:
|
|||||||||||||||
|
Long-term portion of convertible notes, understated by $36,502, $44,494, $51,739, $58,307 as of December 31, 2015, 2014, 2013 and 2012, respectively
|
$
|
337,937
|
|
$
|
223,629
|
|
$
|
301,550
|
|
$
|
291,828
|
|
|||
|
Liabilities, understated by $36,502, $44,494, $51,739, $58,307 as of December 31, 2015, 2014, 2013 and 2012, respectively
|
$
|
473,148
|
|
$
|
482,592
|
|
$
|
483,452
|
|
$
|
476,015
|
|
|||
|
Additional paid-in capital, overstated by $60,618 as of all dates presented
|
$
|
1,772,123
|
|
$
|
1,591,782
|
|
$
|
1,504,052
|
|
$
|
1,489,727
|
|
|||
|
Accumulated deficit, overstated by $24,116, $16,124, $8,879, $2,310 as of December 31, 2015, 2014, 2013 and 2012, respectively
|
$
|
(1,912,925
|
)
|
$
|
(1,751,181
|
)
|
$
|
(1,489,884
|
)
|
$
|
(1,251,692
|
)
|
|||
|
Stockholders’ equity (deficit), misstated by $36,502, $44,494, $51,739, $58,307 as of December 31, 2015, 2014, 2013 and 2012, respectively
|
$
|
(140,806
|
)
|
$
|
(159,324
|
)
|
$
|
14,498
|
|
$
|
238,127
|
|
|||
|
Statements of Stockholders’ Equity (Deficit):
|
|||||||||||||||
|
Net loss, overstated by $7,993, $7,245, $6,568, $2,310 for the years ended December 31, 2015, 2014, 2013 and 2012, respectively
|
$
|
(161,744
|
)
|
$
|
(261,297
|
)
|
$
|
(238,192
|
)
|
$
|
(145,335
|
)
|
|||
|
Additional paid-in capital, overstated by $60,618 as of all dates presented
|
$
|
1,772,123
|
|
$
|
1,591,782
|
|
$
|
1,504,052
|
|
$
|
1,489,727
|
|
|||
|
Accumulated deficit, overstated by $24,116, $16,124, $8,879, $2,310 as of December 31, 2015, 2014, 2013 and 2012, respectively
|
$
|
(1,912,925
|
)
|
$
|
(1,751,181
|
)
|
$
|
(1,489,884
|
)
|
$
|
(1,251,692
|
)
|
|||
|
Stockholders’ equity (deficit), misstated by $36,502, $44,494, $51,739, $58,307 as of December 31, 2015, 2014, 2013 and 2012, respectively
|
$
|
(140,806
|
)
|
$
|
(159,324
|
)
|
$
|
14,498
|
|
$
|
238,127
|
|
|||
These errors did not affect any other caption or total in our annual consolidated financial statements.
Reclassifications
Certain prior period amounts in the Consolidated Financial Statements have been reclassified to conform to current period presentation. We reclassified
$3.2 million
and
$1.4 million
of Current portion of restructuring and Long-term portion of restructuring as of December 31, 2015 to Other current liabilities and Other long-term liabilities, respectively, in the accompanying Consolidated Balance Sheets. We have also reclassified balances between line items within the Changes in assets and liabilities in the accompanying Statements of Cash Flows for the years ended December 31, 2015 and 2014 to conform the presentation of those line items to the corresponding presentation of assets and liabilities in our accompanying Balance Sheets.
Segment Information
We operate as a single reportable segment.
Cash and Investments
We consider all highly liquid investments purchased with an original maturity of three months or less to be cash equivalents. Cash equivalents include investments in high-grade, short-term money market funds, commercial paper and municipal securities, which are subject to minimal credit and market risk.
We have designated all investments as available-for-sale and therefore, such investments are reported at fair value, with unrealized gains and losses recorded in accumulated other comprehensive loss. For securities sold prior to maturity, the cost of securities sold is based on the specific identification method. Realized gains and losses on the sale of investments are recorded in interest and other income, net.
76
We classify those investments we do not require for use in current operations that mature in more than 12 months as Long-term investments on our Consolidated Balance Sheets. Additionally, those investments that collateralize loan balances with terms that extend 12 months or longer were classified as long-term investments even if the investment’s remaining term to maturity was one year or less; they are not restricted to withdrawal.
All of our investments are subject to a quarterly impairment review. We recognize an impairment charge when a decline in the fair value of an investment below its cost basis is judged to be other-than-temporary. Factors considered in determining whether a loss is temporary include the length of time and extent to which the investments fair value has been less than their cost basis, the financial condition and near-term prospects of the issuer, extent of the loss related to credit of the issuer, the expected cash flows from the security, our intent to sell the security and whether or not we will be required to sell the security before we are able to recovery our carrying value. During the years ended
December 31, 2016
,
2015
and
2014
, we did
no
t record any other-than-temporary impairment charges on our available-for-sale securities.
Fair Value Measurements
Fair value reflects the amounts that would be received upon sale of an asset or paid to transfer a liability in an orderly transaction between market participants at the measurement date (exit price). We disclose the fair value of financial instruments for assets and liabilities for which the value is practicable to estimate. For those financial instruments measured and recorded at fair value on a recurring basis, we also provide fair value hierarchy information in these Notes to Consolidated Financial Statements. The fair value hierarchy has the following three levels:
Level 1 – quoted prices (unadjusted) in active markets for identical assets and liabilities that the reporting entity can access at the measurement date.
Level 2 – observable inputs, other than quoted prices in active markets for identical assets and liabilities that are observable either directly or indirectly. These inputs include using prices from independent pricing services based on quoted prices in active markets for similar instruments or on industry models using data inputs, such as interest rates and prices that can be directly observed or corroborated in active markets.
Level 3 – unobservable inputs.
A review of the fair value hierarchy classification is conducted on a quarterly basis. Changes in the observability of valuation inputs may result in a reclassification of levels for certain investments within the fair value hierarchy. During the years ended
December 31, 2016
,
2015
and
2014
, there were no such reclassifications.
Inventory
We value inventory at the lower of cost or net realizable value. We determine the cost of inventory using the standard-cost method, which approximates actual cost based on a first-in, first-out method. We analyze our inventory levels quarterly and write down inventory subject to expiry in excess of expected requirements, or that has a cost basis in excess of its expected net realizable value. The related costs are recognized as cost of goods sold in the Consolidated Statements of Operations.
On a quarterly basis, we analyze our estimated production levels for the following twelve month period, which is our normal operating cycle and reclassify inventory we do not expect to use within the next twelve months into Other long-term assets in the Consolidated Balance Sheets.
We consider regulatory approval of product candidates to be uncertain and product manufactured prior to regulatory approval may not be sold unless regulatory approval is obtained. As such, the manufacturing costs for product candidates incurred prior to regulatory approval are not capitalized as inventory but are expensed as research and development costs. When regulatory approval is obtained, we begin capitalization of inventory related costs.
Property and Equipment
Property and equipment are recorded at cost and depreciated using the straight-line method over the following estimated useful lives:
|
Equipment and furniture
|
5 years
|
|
Computer equipment and software
|
3 years
|
|
Leasehold improvements
|
Shorter of lease life or 7 years
|
Capitalized software includes certain internal use computer software costs.
77
Repairs and maintenance costs are charged to expense as incurred.
Goodwill
Goodwill amounts have been recorded as the excess purchase price over tangible assets, liabilities and intangible assets acquired based on their estimated fair value. Goodwill is not subject to amortization. We assess the recoverability of our goodwill annually, or more frequently whenever events or changes in circumstances indicate that the carrying amount of a reporting unit may exceed its fair value. The assessment of recoverability may first consider qualitative factors to determine whether the existence of events or circumstances leads to a determination that it is more likely than not that the fair value of a reporting unit is less than its carrying amount. A quantitative assessment is performed if the qualitative assessment results in a more-likely-than-not determination or if a qualitative assessment is not performed. The quantitative assessment considers whether the carrying amount of a reporting unit exceeds its fair value, in which case an impairment charge is recorded to the extent the carrying amount of the reporting unit’s goodwill exceeds its implied fair value. We continue to operate in one segment, which is also considered to be our sole reporting unit and therefore, goodwill was tested for impairment at the enterprise level as of
December 31, 2016
and
2015
. We did
no
t recognize any impairment charges in any of the periods presented.
Long-Lived Assets
Long-lived assets include property and equipment. The carrying value of our long-lived assets is reviewed for impairment whenever events or changes in circumstances indicate that the asset may not be recoverable. An impairment loss would be recognized when estimated future cash flows expected to result from the use of the asset and its eventual disposition is less than its carrying amount.
Revenue Recognition
We recognize revenue from product sales and from license fees, milestones and royalties earned on research and collaboration arrangements.
Net Product Revenues
We recognize revenue when it is both realized or realizable and earned, meaning persuasive evidence of an arrangement exists, delivery has occurred, title has transferred, the price is fixed or determinable, there are no remaining customer acceptance requirements, and collectability of the resulting receivable is reasonably assured. For product sales to specialty pharmacies and distributors in the U.S., this generally occurs upon delivery of the product. For product sales to our former distribution partner, Swedish Orphan Biovitrum (“Sobi”), this generally occurred when Sobi accepted the product.
In the U.S., we sell our products, CABOMETYX and COMETRIQ, to specialty pharmacies and distributors that benefit from customer incentives and have a right of return under certain circumstances. Prior to 2015, COMETRIQ had limited sales history and we could not reliably estimate expected future returns, discounts and rebates of the product at the time the product was sold to a single specialty pharmacy, therefore we recognized revenue when the specialty pharmacy provided the product to a patient based on the fulfillment of a prescription. This is frequently referred to as the “sell-through” revenue recognition model. In January 2015, we established that we had sufficient historical experience and data to reasonably estimate expected future returns of COMETRIQ and the discounts and rebates due to payers at the time of shipment to the specialty pharmacy. Accordingly, beginning in January 2015 we began to recognize revenue upon delivery to the specialty pharmacy. This approach is frequently referred to as the “sell-in” revenue recognition model. In connection with the change in the timing of recognition of COMETRIQ sales in the U.S., we recorded a one-time adjustment to recognize revenue that had previously been deferred under the “sell-through” revenue recognition model, resulting in the additional recognition of gross product revenues of
$2.6 million
for the year ended December 31, 2015; there were
no
such additional amounts recorded during 2016 or 2014.
In determining discounts and allowances for the initial launch and sale of CABOMETYX, in addition to using payer data received from the specialty pharmacies and distributors that sell CABOMETYX and historical data for COMETRIQ, we also utilized claims data from third party sources for competitor products for the treatment of advanced renal cell carcinoma (“RCC”). Based in part on the availability of this third party data, we made the determination that we had sufficient experience and data to reasonably estimate expected future returns and the discounts and allowances due to payers at the time of shipment to the specialty pharmacy or distributor, and therefore record revenue for the product using the “sell-in” revenue recognition model. Net product revenues during the year ended December 31, 2016 were impacted by the build of channel inventory related to the initial launch period for CABOMETYX.
78
We also utilized the “sell-in” revenue recognition model for product sales to Sobi for all periods presented. As described further in “Note 2 - Collaboration Agreements”, under the terms of our collaboration and license agreement with Ipsen for the commercialization and further development of cabozantinib, we provided Sobi with a notice of termination of our commercialization agreement for COMETRIQ which became effective November 1, 2016.
Product Sales Discounts and Allowances
We calculate gross product revenues based on the price that we charge to the specialty pharmacies and distributors in the U.S. We estimate our domestic net product revenues by deducting from our gross product revenues (a) trade allowances, such as discounts for prompt payment, (b) estimated government rebates and chargebacks, (c) certain other fees paid to specialty pharmacies and distributors and (d) returns. Discounts and allowances for foreign sales for the years ended December 31, 2015 and 2014 included portions of a one-time
$2.4 million
project management fee payable to our European distribution partner upon its achievement of a cumulative revenue goal. During 2014, we determined that the achievement of the revenue goal was probable and therefore we recorded
$2.3 million
of the
$2.4 million
project management fee, of which
$0.7 million
would have been recorded in 2013 had the cumulative revenue goal been determined to be probable in that period. During 2015 we recorded an additional
$0.1 million
of the project management fee.
We initially record estimates for these deductions at the time we recognize the gross revenue. We update our estimates on a recurring basis as new information becomes available.
Customer Credits:
The specialty pharmacies and distributors in the U.S. receive a discount of
2%
for prompt payment. We expect the specialty pharmacies and distributors will earn
100%
of its prompt payment discounts and, therefore, we deduct the full amount of these discounts from total product sales when revenues are recognized.
Mandated Rebates:
Allowances for rebates include mandated discounts under the Medicaid Drug Rebate Program and other government programs. Rebate amounts owed after the final dispensing of the product to a benefit plan participant are based upon contractual agreements or legal requirements with public sector benefit providers, such as Medicaid. The allowance for rebates is based on statutory discount rates and expected utilization. Our estimates for the expected utilization of rebates are based on third party market research data and customer and payer data received from the specialty pharmacies and distributors and historical utilization rates. Rebates are generally invoiced by the payer and paid in arrears, such that the accrual balance consists of an estimate of the amount expected to be incurred for the current quarter’s shipments to our customers, plus an accrual balance for known prior quarter’s unpaid rebates. If actual future rebates vary from estimates, we may need to adjust our accruals, which would affect net revenue in the period of adjustment.
Chargebacks:
Chargebacks are discounts that occur when contracted customers purchase directly from a specialty pharmacy or distributor. Contracted customers, which currently consist primarily of Public Health Service institutions, non-profit clinics, Federal government entities purchasing via the Federal Supply Schedule and Group Purchasing Organizations, generally purchase the product at a discounted price. The specialty pharmacy or distributor, in turn, charges back to us the difference between the price initially paid by the specialty pharmacy and the discounted price paid to the specialty pharmacy by the customer. The allowance for chargebacks is based on an estimate of sales to contracted customers.
Medicare Part D Coverage Gap:
In the U.S., the
Medicare Part D prescription drug benefit mandates manufacturers to fund 50% of the Medicare Part D insurance coverage gap for prescription drugs sold to eligible patients. Our estimates for expected Medicare Part D coverage gap are based in part on third party market research data and on customer and payer data received from specialty pharmacies and distributors. Funding of the coverage gap is invoiced and paid in arrears so that the accrual balance consists of an estimate of the amount expected to be incurred for the current quarters’ shipments to patients, plus an accrual balance for prior sales. If actual future funding varies from estimates, we may need to adjust our accruals, which would affect net revenue in the period of adjustment.
Co-payment Assistance:
Patients who have commercial insurance and meet certain eligibility requirements may receive co-payment assistance. We accrue a liability for co-payment assistance based on actual program participation and estimates of program redemption using customer data provided by the specialty pharmacies and distributors.
Collaboration Revenues
We enter into collaboration agreements under which we may obtain upfront license fees, milestone, royalty and/or product supply payments. These arrangements have multiple elements and our deliverables may include intellectual property rights, distribution rights, delivery of manufactured product, commercial and development activities and participation on joint steering, commercial and development committees. In order to account for these arrangements, we identify the deliverables and evaluate whether the delivered elements have value to our collaboration partner on a stand-alone basis and represent separate units of accounting. Analyzing the arrangement to identify deliverables requires the use of judgment, and each deliverable may
79
be an obligation to deliver future goods or services, a right or license to use an asset, or another performance obligation. If we determine that multiple deliverables exist, the consideration is allocated to one or more units of accounting based upon the best estimate of the selling price of each deliverable. The selling price used for each deliverable will be based on vendor-specific objective evidence, if available, third-party evidence if vendor-specific objective evidence is not available, or estimated selling price if neither vendor-specific or third-party evidence is available. A delivered item or items that do not qualify as a separate unit of accounting within the arrangement shall be combined with the other applicable undelivered items within the arrangement. The allocation of arrangement consideration and the recognition of revenue then shall be determined for those combined deliverables as a single unit of accounting. For a combined unit of accounting, non-refundable upfront fees are recognized in a manner consistent with the final deliverable, which has generally been ratably over the period of our continued involvement. Amounts received in advance of performance are recorded as deferred revenue. Upfront fees are classified as Collaboration revenues in our Consolidated Statements of Operations.
Royalty revenues, and U.S. profits and losses under the collaboration agreement with Genentech, are based on amounts reported to us by our collaboration partners and are recorded when such information becomes available to us; for Ipsen, this occurs in the current quarter, and for Genentech, this occurs in the following quarter. We base our estimates on the best information available at the time provided to us by our collaboration partners. However, additional information may subsequently become available to us, which may allow us to make a more accurate estimate in future periods. In this event, we are required to record adjustments to collaboration revenue in future periods when the actual level of activity becomes more certain. Such increases or decreases in revenue are generally considered to be changes in estimates and will be reflected in collaboration revenues in the period they become known. We consider sales-based contingent payments to be royalty revenue which is generally recognized at the date the contingency is achieved. Royalty revenue is included in Collaboration revenues in our Consolidated Statements of Operations.
For product supplied to Ipsen, which began during the year ended December 31, 2016, we record revenue at the time the product is delivered. Once title has transferred to Ipsen, the product is generally no longer subject to return. See “Note 2. Collaboration Agreements - Ipsen Collaboration” for a description of our product supply agreement with Ipsen.
For certain milestone payments under collaboration agreements, we have made a policy election to recognize revenue using the milestone method. Under the milestone method a payment that is contingent upon the achievement of a substantive milestone is recognized in its entirety in the period in which the milestone is achieved. A milestone is an event: (i) that can be achieved based in whole or in part on either our performance or on the occurrence of a specific outcome resulting from our performance, (ii) for which there is substantive uncertainty at the date the arrangement is entered into that the event will be achieved and (iii) that would result in additional payments being due to us. The determination that a milestone is substantive requires estimation and judgment and is made at the inception of the arrangement. Milestones are considered substantive when the consideration earned from the achievement of the milestone is: (i) commensurate with either our performance to achieve the milestone or the enhancement of value of the item delivered as a result of a specific outcome resulting from our performance to achieve the milestone, (ii) relates solely to past performance and (iii) reasonable relative to all deliverables and payment terms in the arrangement. In making the determination as to whether a milestone is substantive or not, we consider all facts and circumstances relevant to the arrangement, including factors such as the scientific, regulatory, commercial and other risks that must be overcome to achieve the respective milestone, the level of effort and investment required to achieve the respective milestone and whether any portion of the milestone consideration is related to future performance or deliverables.
Non-substantive milestone payments are recognized as revenues over the estimated period of our continued involvement. We may also receive milestone payments after the end of our continued involvement. In such circumstances, we would recognize
100%
of the milestone revenues when the contingency is achieved. Milestones payments, when recognized as revenue, are classified as Collaboration revenues in our Consolidated Statements of Operations.
Under the terms of our collaboration agreement with Genentech for cobimetinib, we are also entitled to a share of U.S. profits and losses received in connection with commercialization of cobimetinib. We are entitled to low double-digit royalties on ex-U.S. net sales. See “Note 2. Collaboration Agreements” for additional information about our collaboration agreement with Genentech. We have determined that we are an agent under the agreement and therefore revenues are recorded net of costs incurred. We record U.S. profits and losses under the collaboration agreement in the period earned based on our estimate of those amounts. As of December 31, 2016, we have not recognized a profit for any year to date period from the commercialization of cobimetinib in the U.S. Until we have recognized a profit under the agreement, losses are recognized as Selling, general and administrative expenses in our Consolidated Statements of Operations. In connection with our agreement to co-promote with Genentech, we are responsible for providing up to
25%
of the sales force necessary to assist with the promotion of cobimetinib. Genentech reimburses us for these costs which we include as a reduction of our Selling, general and administrative costs when the obligations are incurred or we become entitled to the cost recovery.
80
Patient Assistance Programs
We provide CABOMETYX and COMETRIQ at no cost to eligible patients who have no insurance and meet certain financial and clinical criteria through our patient assistance programs. We record the cost of the product as a selling, general and administrative expense at the time the product is shipped to the specialty pharmacy for patient assistance use.
Cost of Goods Sold
Cost of goods sold is related to our product revenues and consists primarily of a
3%
royalty on net sales of any product incorporating cabozantinib payable to GlaxoSmithKline, indirect labor costs, the cost of manufacturing, write-downs related to expiring and excess inventory, and other third party logistics costs of our product. A portion of the manufacturing costs for product sales were incurred prior to regulatory approval of COMETRIQ and CABOMETYX and therefore, were expensed as research and development costs when those costs were incurred, rather than capitalized as inventory.
In accordance with our product development and commercialization agreement with GlaxoSmithKline, we are required to pay GlaxoSmithKline a
3%
royalty on the Net Sales of any product incorporating cabozantinib, including COMETRIQ and CABOMETYX. Net Sales is defined in the product development and commercialization agreement as the gross invoiced sales price less customer credits, rebates, chargebacks, shipping costs, customs duties, and sales tax and other similar tax payments we are required to make.
Research and Development Expenses
Research and development costs are expensed as incurred and include costs associated with research performed pursuant to collaborative agreements. Research and development costs consist of direct and indirect internal costs related to specific projects as well as fees paid to other entities that conduct certain research activities on our behalf.
Substantial portions of our preclinical studies and all of our clinical trials have been executed with support from third-party contract research organizations (“CROs”) and other vendors. We accrue expenses for preclinical studies performed by our vendors based on certain estimates over the term of the service period and adjust our estimates as required. We accrue expenses for clinical trial activities performed by CROs based upon the estimated amount of work completed on each trial. For clinical trial expenses, the significant factors used in estimating accruals include the number of patients enrolled, the number of active clinical sites, and the duration for which the patients will be enrolled in the trial. We monitor patient enrollment levels and related activities to the extent possible through internal reviews, correspondence with CROs and review of contractual terms. We base our estimates on the best information available at the time. However, additional information may become available to us which may allow us to make a more accurate estimate in future periods. In this event, we may be required to record adjustments to research and development expenses in future periods when the actual level of activity becomes more certain. Such increases or decreases in costs will be reflected in research and development expenses in the period first known.
Net Income (Loss) Per Share
Basic net income (loss) per share is computed by dividing the net income (loss) allocated to common shares for the period by the weighted average number of shares of common stock outstanding during the period. Diluted net income (loss) per share gives effect to potential incremental common shares issuable upon the exercise of stock options and warrants, and shares issuable pursuant to restricted stock units (“RSUs”) (calculated based on the treasury stock method), and upon conversion of our convertible debt (calculated using an as-if-converted method) as long as such shares are not anti-dilutive.
Foreign Currency Translation and Remeasurement
Monetary assets and liabilities denominated in currencies other than the functional currency are remeasured using exchange rates in effect at the end of the period and related gains or losses are recorded in interest income and other, net. Gains and losses on the remeasurement of monetary assets and liabilities were not material for any of the years presented. We do not have any nonmonetary assets or liabilities denominated in currencies other than the U.S. dollar.
Stock-Based Compensation
Stock-based compensation expense is based on the grant date fair value; the grant date fair value of RSUs is estimated as the value of the underlying shares of our common stock and the grant date fair value of stock-options is estimated using the Black-Scholes Merton option pricing model. Because there is a market for options on our common stock, we have considered implied volatilities as well as our historical realized volatilities when developing an estimate of expected volatility. We estimate the term using historical data. We recognize compensation expense on a straight-line basis over the requisite service period. Compensation expense relating to awards subject to performance conditions is recognized if it is probable that the performance goals will be achieved on a straight-line basis through the anticipated achievement date of the performance objectives. The
81
probability of achievement is assessed on a quarterly basis. The total number of awards expected to vest is adjusted for estimated forfeitures. We have elected to use the simplified method to calculate the beginning pool of excess tax benefits.
Recent Accounting Pronouncements
In May 2014, the Financial Accounting Standards Board (“FASB”) issued Accounting Standards Update (“ASU”) No. 2014-09,
Revenue from Contracts with Customers (Topic 606)
, (“ASU 2014-09”). In August 2015, the FASB issued ASU No. 2015-14,
Revenue from Contracts with Customers (Topic 606): Deferral of the Effective Date
, which delays the effective date of ASU 2014-09 by one year. ASU 2014-09, as amended, becomes effective for us in the first quarter of fiscal year 2018, but allows us to adopt the standard one year earlier. We currently plan to adopt ASU 2014-09 in the first quarter of fiscal year 2018. ASU 2014-09 also permits two methods of adoption: retrospectively to each prior reporting period presented (full retrospective method), or retrospectively with the cumulative effect of initially applying the guidance recognized at the date of initial application (the modified retrospective method). We currently anticipate adopting ASU 2014-09 using the modified retrospective method.
The core principle of ASU 2014-09 is that an entity should recognize revenue when it transfers promised goods or services to customers in an amount that reflects the consideration to which the entity expects to be entitled in exchange for those goods or services. ASU 2014-09 defines a five step process to achieve this core principle and, in doing so, it is possible more judgment and estimates may be required within the revenue recognition process than required under existing U.S. generally accepted accounting pronouncements. We do not expect that ASU 2014-09 will have a material impact on the recognition of revenue from product sales. We are still in the process of evaluating the effect that this guidance will have on revenue recognition from our collaboration agreements such as our arrangements with Ipsen and Genentech. We expect our evaluation to be completed by the end of the second quarter of 2017.
In April 2015, the FASB issued ASU No. 2015-05,
Intangibles—Goodwill and Other—Internal-Use Software (Subtopic 350-40): Customer’s Accounting for Fees Paid in a Cloud Computing Arrangement,
(“ASU 2015-05”)
.
ASU 2015-05 provides guidance to customers about whether a cloud computing arrangement includes a software license. If a cloud computing arrangement includes a software license, then the customer should account for the software license element of the arrangement consistent with the acquisition of other software licenses. If a cloud computing arrangement does not include a software license, the customer should account for the arrangement as a service contract. ASU 2015-05 was effective for all interim and annual reporting periods beginning after December 15, 2015 and therefore we adopted ASU 2015-05 in 2016 on a prospective basis. The adoption of ASU 2015-05 did not have a material impact on our Consolidated Financial Statements during the period of adoption and is not expected to have a material effect on our Consolidated Financial Statements in future periods.
In July 2015, the FASB issued ASU No. 2015-11,
Inventory: Simplifying the Measurement of Inventory, (“
ASU No. 2015-11”)
.
ASU No. 2015-11 requires inventory measurement at the lower of cost and net realizable value. ASU No. 2015-11 is effective for fiscal years beginning after December 15, 2016, including interim periods within those fiscal years. Early adoption is permitted by all entities as of the beginning of an interim or annual reporting period. We are in the process of assessing the impact, if any, of ASU No. 2015-11 on our Consolidated Financial Statements.
In February 2016, the FASB issued ASU No. 2016-02,
Leases (Topic 842),
(“ASU 2016-02”)
.
Under ASU 2016-02, a lessee will be required to recognize assets and liabilities for leases with lease terms of more than 12 months. Recognition, measurement, and presentation of expenses and cash flows arising from a lease by a lessee primarily will depend on its classification as a finance or operating lease. ASU 2016-02 will require both types of leases to be recognized on the balance sheet. The ASU also will require disclosures to help investors and other financial statement users better understand the amount, timing, and uncertainty of cash flows arising from leases. These disclosures include qualitative and quantitative requirements, providing additional information about the amounts recorded in the financial statements. ASU 2016-02 is effective for us for all interim and annual reporting periods beginning after December 15, 2018. Early adoption is permitted. We are in the process of assessing the impact of ASU No. 2016-02 on our Consolidated Financial Statements.
In March 2016, the FASB issued ASU No. 2016-09,
Compensation—Stock Compensation (Topic 718): Improvements to Employee Share-Based Payment Accounting,
(“ASU 2016-09”)
.
ASU 2016-09 is aimed at the simplification of several aspects of the accounting for employee share-based payment transactions, including the income tax consequences, classification of awards as either equity or liabilities, and classification on the statement of cash flows. ASU 2016-09 is effective for all interim and annual reporting periods beginning after December 15, 2016. Early adoption is permitted. We do not expect the adoption of ASU 2016-09 to have a material impact on our Consolidated Financial Statements.
In August 2016, the FASB issued ASU No. 2016-15,
Statement of Cash Flows (Topic 230): Classification of Certain Cash Receipts and Cash Payments (a consensus of the FASB Emerging Issues Task Force),
(“ASU 2016-15”)
.
ASU 2016-15 addresses eight specific cash flow issues including debt prepayment or debt extinguishment costs, settlement of zero-coupon
82
debt instruments or other debt instruments with coupon interest rates that are insignificant in relation to the effective interest rate of the borrowing and contingent consideration payments made after a business combination. ASU 2016-15 is effective for all interim and annual reporting periods beginning after December 15, 2017. Early adoption is permitted. We do not expect the adoption of ASU 2016-15 to have a material impact on our Consolidated Statements of Cash Flows.
In November 2016, the FASB issued ASU No. 2016-18,
Statement of Cash Flows (Topic 230): Restricted Cash (a consensus of the FASB Emerging Issues Task Force),
(“ASU 2016-18”)
.
ASU 2016-18 requires that a statement of cash flows explain the change during the period in the total of cash, cash equivalents, and amounts generally described as restricted cash or restricted cash equivalents. Therefore, amounts generally described as restricted cash and restricted cash equivalents should be included with cash and cash equivalents when reconciling the beginning-of-period and end-of-period total amounts shown on the statement of cash flows. ASU 2016-18 is effective for all interim and annual reporting periods beginning after December 15, 2017. Early adoption is permitted. We do not expect the adoption of ASU 2016-18 to have a material impact on our Consolidated Statements of Cash Flows.
In January 2017, the FASB issued ASU No. 2017-04,
Intangibles—Goodwill and Other (Topic 350): Simplifying the Test for Goodwill Impairment,
(“ASU 2017-04”)
.
ASU 2017-04 eliminated Step 2 from the goodwill impairment test. Instead, under the amendments in ASU 2017-04, an entity should perform its annual, or interim, goodwill impairment test by comparing the fair value of a reporting unit with its carrying amount. An entity should recognize an impairment charge for the amount by which the carrying amount exceeds the reporting unit’s fair value; however, the loss recognized should not exceed the total amount of goodwill allocated to that reporting unit. Additionally, an entity should consider income tax effects from any tax deductible goodwill on the carrying amount of the reporting unit when measuring the goodwill impairment loss, if applicable. ASU 2017-04 is effective for all interim and annual reporting periods beginning after December 15, 2019. Early adoption is permitted. We do not expect the adoption of ASU 2017-04 to have a material impact on our Consolidated Financial Statements.
Ipsen Collaboration
In February 2016, we entered into a collaboration and license agreement with Ipsen for the commercialization and further development of cabozantinib. Pursuant to the terms of the collaboration agreement, Ipsen received exclusive commercialization rights for current and potential future cabozantinib indications outside of the U.S., Canada and Japan. The collaboration agreement was subsequently amended in December 2016 to include commercialization rights in Canada (the “Amendment”). We have also agreed to collaborate with Ipsen on the development of cabozantinib for current and potential future indications.
In consideration for the exclusive license and other rights contained in the collaboration and license agreement, Ipsen paid us an upfront nonrefundable payment of
$200.0 million
in March 2016. Additionally, as a result of the Amendment, we received a
$10.0 million
upfront nonrefundable payment from Ipsen in December 2016. As a result of the approval of cabozantinib in second-line RCC by the European Commission in September 2016, we received a
$60.0 million
milestone in November 2016. We are also eligible to receive additional development and regulatory milestones, totaling up to
$254.0 million
, including, milestone payments of
$10.0 million
and
$40.0 million
upon the filing and the approval of cabozantinib in second-line hepatocellular carcinoma (“HCC”) with the European Medicines Agency (“EMA”), and additional milestones for other future indications and/or jurisdictions. In the fourth quarter of 2016 we achieved
two
$10.0 million
milestones for the first commercial sales of CABOMETYX in Germany and the United Kingdom. The collaboration agreement also provides that we will be eligible to receive contingent payments of up to
$544.7 million
associated with the achievement of specified levels of Ipsen sales to end users. We will also receive royalties on net sales of cabozantinib outside of the U.S. and Japan. We will receive a
2%
royalty on the initial
$50.0 million
of net sales, and a
12%
royalty on the next
$100.0 million
of net sales. After the initial
$150.0 million
of sales, we will receive a tiered royalty of
22%
to
26%
on annual net sales; these tiers will reset each calendar year. We are primarily responsible for funding cabozantinib related development costs for existing trials; global development costs for potential future trials will be shared between the parties, with Ipsen to reimburse us for
35%
of such costs. Pursuant to the terms of the collaboration agreement, we will remain responsible for the manufacture and supply of cabozantinib for all development and commercialization activities under the collaboration agreement. As part of the collaboration agreement, we entered into a supply agreement which provides that through the end of the second quarter of 2018, we will supply finished, labeled product to Ipsen for distribution in the territories outside of the U.S. and Japan at our cost, as defined in the agreement, which excludes, among other items, the
3%
royalty we are required to pay GlaxoSmithKline on Ipsen’s Net Sales of any product incorporating cabozantinib. From the end of the second quarter of 2018 forward, we will continue to manufacture cabozantinib tablets and capsules while Ipsen will be responsible for packaging and labeling the products in territories where they have been approved outside of the U.S. and Japan, as applicable.
83
The collaboration agreement contains multiple elements, and the deliverables under the collaboration agreement consist of intellectual property licenses, delivery of products and/or materials containing cabozantinib to Ipsen for all development and commercial activities, research and development services, and participation on the joint steering and development committees (as defined in the collaboration agreement). These deliverables are non-contingent in nature. We determined that these deliverables do not have stand-alone value, because each one of them has value only if we meet our obligation to provide Ipsen with cabozantinib, which is deemed to be the predominant deliverable under the collaboration agreement. We also determined that the level of effort required of us to meet our obligations under the collaboration agreement is not expected to vary significantly over the life of the collaboration agreement. Accordingly, we combined these deliverables into a single unit of accounting and allocated the entire arrangement consideration to that combined unit of accounting. As a result, the upfront payment of
$200.0 million
, received in the first quarter of 2016 and the
$10.0 million
upfront payment received in December 2016 in consideration for the development and commercialization rights in Canada are being recognized ratably over the remaining term of the collaboration agreement. The collaboration agreement continues through early 2030, which is the current estimated patent expiration of cabozantinib in the European Union. At the time we entered into the agreement, we also determined that the
$60.0 million
milestone we achieved upon the approval of cabozantinib by the EC in second-line RCC was not substantive due to the relatively low degree of uncertainty and relatively low amount of effort required on our part to achieve the milestone as of the date of the collaboration agreement; the
$60.0 million
was deferred as of the date of the EMA’s approval of cabozantinib in second-line RCC in September 2016 and is being recognized ratably over the remaining term of the collaboration agreement. The two
$10.0 million
milestones for the first commercial sales of CABOMETYX in Germany and the United Kingdom were determined to be substantive at the time we entered into the collaboration agreement and were recognized as collaboration revenues in the fourth quarter of 2016. We determined that the remaining development and regulatory milestones are substantive and will be recognized as revenue in the periods in which they are achieved. We consider the contingent payments due to us upon the achievement of specified sales volumes to be similar to royalty payments. Subsequent to February 29, 2016, we transferred the intellectual property rights to Ipsen, and participated in regulatory filing activities and planning for the production, delivery and distribution of manufactured product. As a result of these activities, we began to recognize of the upfront payment under the collaboration agreement at that time.
During the
year ended
December 31, 2016
, collaboration revenues under the collaboration agreement were as follows (in thousands):
|
Year Ended December 31, 2016
|
|||
|
Milestones achieved
|
$
|
20,000
|
|
|
Amortization of upfront payments and deferred milestone
|
13,284
|
|
|
|
Royalty revenue
|
175
|
|
|
|
Product supply agreement revenue
|
1,612
|
|
|
|
Cost of supplied product
|
(1,555
|
)
|
|
|
Royalty payable to GlaxoSmithKline on net sales by Ipsen
|
(264
|
)
|
|
|
Collaboration revenues under the collaboration agreement
|
$
|
33,252
|
|
As of
December 31, 2016
, short-term and long-term deferred revenue relating to the collaboration agreement was
$19.6 million
and
$237.1 million
, respectively.
In connection with the establishment of the collaboration agreement, we provided Sobi with a notice of termination of our distribution and commercialization agreement for COMETRIQ. Effective November 1, 2016, Ipsen became responsible for the distribution and commercialization of COMETRIQ for the approved medullary thyroid carcinoma indication in territories previously supported by Sobi. Pursuant to our commercialization agreement with Sobi, we were required to pay a
$2.9 million
termination fee during the
year ended
December 31, 2016
, which was included in Selling, general and administrative expenses in the accompanying Consolidated Statements of Operations. Additionally, we were also required to issue a
$0.4 million
credit for unsold product to Sobi during the
year ended
December 31, 2016
, which is included as a reduction of Net product revenues in the accompanying Consolidated Statements of Operations.
84
Genentech Collaboration
In December 2006, we out-licensed the development and commercialization of cobimetinib to Genentech pursuant to a worldwide collaboration agreement. The FDA approved cobimetinib in the U.S. under the brand name Cotellic on November 10, 2015. It is indicated in combination with Zelboraf as a treatment for patients with BRAF V600E or V600K mutation-positive advanced melanoma. Cotellic in combination with Zelboraf has also been approved in Switzerland, the European Union, Canada, Australia and Brazil for use in the same indication. Under the terms of the agreement, we were responsible for developing cobimetinib through the determination of the maximum-tolerated dose in a phase 1 clinical trial, and Genentech had the option to co-develop cobimetinib, which Genentech could exercise after receipt of certain phase 1 data from us. In March 2008, Genentech exercised its option to co-develop cobimetinib. In March 2009, we granted to Genentech an exclusive worldwide revenue-bearing license to cobimetinib, at which point Genentech became responsible for completing the phase 1 clinical trial and subsequent clinical development.
Under the terms of our collaboration agreement with Genentech for cobimetinib, we are entitled to a share of U.S. profits and losses received in connection with commercialization of cobimetinib. The profit and loss share has multiple tiers: we are entitled to
50%
of profits and losses from the first
$200.0 million
of U.S. actual sales, decreasing to
30%
of profits and losses from U.S. actual sales in excess of
$400.0 million
. In addition, we are entitled to low double-digit royalties on ex-U.S. net sales. In November 2013, we exercised an option under the collaboration agreement to co-promote in the U.S. Following the approval of Cotellic in the U.S. in November 2015, we began fielding
25%
of the sales force promoting Cotellic in combination with Zelboraf as a treatment for patients with BRAF V600E or V600K mutation-positive advanced melanoma.
On June 3, 2016, following a 30 day dispute resolution period, we filed a demand for arbitration asserting claims against Genentech related to its clinical development, pricing and commercialization of Cotellic, and cost and revenue allocations in connection with Cotellic’s commercialization in the United States. Soon thereafter, Genentech asserted a counterclaim for breach of contract seeking monetary damages and interest related to the cost allocations under the collaboration agreement. On December 29, 2016, Genentech withdrew its counterclaim against us in the ongoing JAMS arbitration concerning alleged breaches of the parties’ collaboration agreement. When notifying the arbitral panel and us of this unilateral action, Genentech further stated that it changed, both retroactively and prospectively, the manner in which it allocates promotional expenses of the Cotellic plus Zelboraf combination therapy. As a result of Genentech’s decision to change its cost allocation approach, we are relieved of our obligation to pay
$18.7 million
of disputed costs that had been accrued by us as of September 30, 2016. We have invoiced Genentech for certain expenses, with interest, that we had previously paid. Accordingly, during the year ended December 31, 2016, we offset Selling, general and administrative expenses with a
$13.3 million
recovery for disputed losses that had been recognized prior to 2016. During the year ended December 31, 2016, we also recognized a loss under the collaboration agreement of
$4.5 million
for 2016 activities under the collaboration agreement as computed under Genentech’s revised cost allocation approach. Taken together, we have recorded a net cost recovery of
$8.8 million
during the year ended December 31, 2016 under the collaboration agreement.
During the years ended
December 31, 2016
, 2015 and 2014, collaboration revenues and (loss) net cost recovery under the collaboration agreement were as follows (in thousands):
|
|
Year Ended December 31,
|
||||||||||
|
|
2016
|
2015
|
2014
|
||||||||
|
Collaboration revenues:
|
|||||||||||
|
Royalty revenues on ex-U.S. sales of COTELLIC
|
$
|
2,827
|
|
$
|
14
|
|
$
|
—
|
|
||
|
(Loss) net cost recovery under the collaboration agreement included in Selling, general and administrative expenses
|
$
|
8,771
|
|
$
|
(16,600
|
)
|
|
$
|
(2,916
|
)
|
|
The (loss) net cost recovery under the collaboration agreement includes personnel and other costs we have incurred to co-promote Cotellic plus Zelboraf in the U.S. As of December 31, 2015, a portion of the liability for those costs, identified as Accrued collaboration liability on the accompanying Consolidated Balance Sheets, included commercialization expenses that Genentech had allocated to the collaboration but remained under discussion between us and Genentech.
Other Collaborations
We have established collaborations with other leading pharmaceutical and biotechnology companies, including Daiichi Sankyo Company Limited (“Daiichi Sankyo”), Merck (known as MSD outside of the U.S. and Canada), Bristol-Myers Squibb Company (“BMS”), Sanofi and GlaxoSmithKline, for various compounds and programs in our portfolio.
85
Pursuant to these collaborations, we have fully out-licensed compounds or programs to a partner for further development and commercialization. Under each of our collaborations, we are entitled to receive milestones and royalties.
With respect to our partnered compounds, other than cabozantinib and cobimetinib, we are eligible to receive potential contingent payments totaling approximately
$2.2 billion
in the aggregate on a non-risk adjusted basis, of which
9%
are related to clinical development milestones,
42%
are related to regulatory milestones and
49%
are related to commercial milestones, all to be achieved by the various licensees, which may not be paid, if at all, until certain conditions are met.
Daiichi Sankyo
In March 2006, we entered into a collaboration agreement with Daiichi Sankyo for the discovery, development and commercialization of novel therapies targeted against the mineralocorticoid receptor (“MR”), a nuclear hormone receptor implicated in a variety of cardiovascular and metabolic diseases. Under the terms of the agreement, we granted to Daiichi Sankyo an exclusive, worldwide license to certain intellectual property primarily relating to compounds that modulate MR, including CS-3150/esaxerenone (a specific rotational isomer of XL550). Daiichi Sankyo is responsible for all further preclinical and clinical development, regulatory, manufacturing and commercialization activities for the compounds and we do not have rights to reacquire such compounds, except as described below.
We are eligible to receive additional development, regulatory and commercialization milestone payments of up to
$130.0 million
. In addition, we are also entitled to receive royalties on any sales of certain products commercialized under the collaboration. Daiichi Sankyo may terminate the agreement upon ninety days’ written notice in which case Daiichi Sankyo’s payment obligations would cease, its license relating to compounds that modulate MR would terminate and revert to us and we would receive, subject to certain terms and conditions, licenses from Daiichi Sankyo to research, develop and commercialize compounds that were discovered under the collaboration.
We recognized contract revenues of
$15.0 million
from milestone payments during the year ended December 31, 2016 under our collaboration agreement with Daiichi Sankyo. We did
no
t recognize any such revenue during the years ended December 31, 2015 and 2014.
Merck
In December 2011, we entered into an agreement with Merck pursuant to which we granted Merck an exclusive worldwide license to our PI3K-delta (“PI3K-d”) program, including XL499 and other related compounds. Pursuant to the terms of the agreement, Merck has sole responsibility to research, develop, and commercialize compounds from our PI3K-d program. The agreement became effective in December 2011.
We will be eligible to receive payments associated with the successful achievement of potential development and regulatory milestones for multiple indications of up to
$231.0 million
. We will also be eligible to receive payments for combined sales performance milestones of up to
$375.0 million
and royalties on net-sales of products emerging from the agreement. Contingent payments associated with milestones achieved by Merck and royalties are payable on compounds emerging from our PI3K-d program or from certain compounds that arise from Merck’s internal discovery efforts targeting PI3K-d during a certain period.
We recognized contract revenues of
$5.0 million
and
$3.0 million
from milestone payments during the years ended December 31, 2016 and 2015, respectively, under our collaboration agreement with Merck. We did
no
t recognize any such revenue during the year ended December 31, 2014.
Bristol-Myers Squibb
ROR Collaboration Agreement
In October 2010, we entered into a worldwide collaboration with BMS pursuant to which each party granted to the other certain intellectual property licenses to enable the parties to discover, optimize and characterize ROR antagonists that may subsequently be developed and commercialized by BMS. Since the collaborative research period ended in July 2013, BMS has and will continue to have sole responsibility for any further research, development, manufacture and commercialization of products developed under the collaboration and will bear all costs and expenses associated with those activities.
For each product developed by BMS under the collaboration, we will be eligible to receive payments upon the achievement by BMS of development and regulatory milestones of up to
$252.5 million
in the aggregate and
86
commercialization milestones of up to
$150.0 million
in the aggregate, as well as royalties on commercial sales of any such products.
We did
no
t any recognize any revenue under our ROR collaboration agreement with BMS during the three years ended December 31, 2016.
LXR Collaboration
Agreement
In December 2005, we entered into a collaboration agreement with BMS for the discovery, development and commercialization of novel therapies targeted against LXR, a nuclear hormone receptor implicated in a variety of cardiovascular and metabolic disorders. This agreement became effective in January 2006, at which time we granted BMS an exclusive worldwide license with respect to certain intellectual property primarily relating to compounds that modulate LXR. The research term expired in January 2010 and we transferred the technology to BMS in 2011 to enable it to continue the LXR program. We have been advised that BMS is continuing additional preclinical research on the program.
Under the collaboration agreement, BMS is required to pay us contingent amounts associated with development and regulatory milestones of up to
$53.0 million
per product for up to
two
products from the collaboration. In addition, we are also entitled to receive payments associated with sales milestones of up to
$310.0 million
and royalties on sales of any products commercialized under the collaboration.
We did
no
t recognize any revenue under our LXR collaboration agreement with BMS during the three years ended December 31, 2016.
Sanofi
In May 2009, we entered into a global license agreement with Sanofi for SAR245408 (XL147) and SAR245409 (XL765), leading inhibitors of phosphoinositide-3 kinase (“PI3K”), and a broad collaboration for the discovery of inhibitors of PI3K for the treatment of cancer. The license agreement and collaboration agreement became effective on July 7, 2009.
We will be eligible to receive contingent payments associated with development, regulatory and commercial milestones under the license agreement of
$745.0 million
in the aggregate, as well as royalties on sales of any products commercialized under the license.
We did
no
t recognize any revenue under our collaboration agreement with Sanofi during the three years ended December 31, 2016.
GlaxoSmithKline
In October 2002, we established a collaboration with GlaxoSmithKline to discover and develop novel therapeutics in the areas of vascular biology, inflammatory disease and oncology. Under the terms of the product development and commercialization agreement, GlaxoSmithKline had the right to choose cabozantinib for further development and commercialization, but notified us in October 2008 that it had waived its right to select the compound for such activities. As a result, we retained the rights to develop, commercialize, and license cabozantinib, subject to payment to GlaxoSmithKline of a
3%
royalty on net sales of any product incorporating cabozantinib. The product development and commercialization agreement was terminated during 2014, although GlaxoSmithKline will continue to be entitled to a
3%
royalty on net sales of any product incorporating cabozantinib, including COMETRIQ and CABOMETYX.
In connection with the sales of COMETRIQ and CABOMETYX, during the years ended December 31, 2016, 2015 and 2014 we recorded
$4.3 million
,
$1.0 million
and
$0.7 million
, respectively, in royalties payable to GlaxoSmithKline. Royalty expense is included in Cost of goods sold for sales by us and as a reduction of Collaboration revenue for sales by Ipsen in the accompanying Consolidated Statements of Operations.
Between March 2010 and May 2013, we implemented
five
restructurings (which we refer to collectively as the “2010 Restructurings”) to manage costs and as a consequence of our decision in 2010 to focus our proprietary resources and development efforts on the development and commercialization of cabozantinib. The aggregate reduction in headcount from the 2010 Restructurings was
429
employees. Charges and credits related to the 2010 Restructurings were recorded in periods other than those in which the 2010 Restructurings were implemented as a result of sublease activities for certain of our buildings in South San Francisco, California, changes in assumptions regarding anticipated sublease activities, the effect of the passage of time on our discounted cash flow computations, previously planned employee terminations, and sales of excess equipment and other assets.
87
In September 2014, as a consequence of the failure of COMET-1, one of our two phase 3 pivotal trials of cabozantinib in metastatic castration-resistant prostate cancer, we initiated a restructuring (which we refer to as the “2014 Restructuring”) to reduce our workforce. The aggregate reduction in headcount from the 2014 Restructuring was
143
employees. The principal objective of the 2014 Restructuring was to enable us to focus our financial resources on the phase 3 pivotal trials of cabozantinib in advanced RCC and advanced HCC.
The total outstanding current and long-term restructuring liability is included in Other current liabilities and Other long-term liabilities, respectively, on the accompanying Consolidated Balance Sheets. The changes of these liabilities and the cumulative restructuring charge from inception to date are summarized in the following table (in thousands):
|
2010 Restructurings
|
2014 Restructuring
|
||||||||||||||||||||||
|
Facility
Charges |
Other
|
Employee
Severance
and Other Benefits
|
Facility
Charges |
Other
|
Total
|
||||||||||||||||||
|
Restructuring liability as of December 31, 2013
|
$
|
13,460
|
|
$
|
12
|
|
$
|
—
|
|
$
|
—
|
|
$
|
—
|
|
$
|
13,472
|
|
|||||
|
Restructuring charge (recovery)
|
1,626
|
|
(117
|
)
|
5,775
|
|
65
|
|
247
|
|
7,596
|
|
|||||||||||
|
Proceeds from sale of assets
|
—
|
|
199
|
|
—
|
|
—
|
|
100
|
|
299
|
|
|||||||||||
|
Other cash payments, net
|
(5,644
|
)
|
(8
|
)
|
(4,507
|
)
|
(65
|
)
|
(12
|
)
|
(10,236
|
)
|
|||||||||||
|
Other items
|
12
|
|
(86
|
)
|
22
|
|
—
|
|
(288
|
)
|
(340
|
)
|
|||||||||||
|
Restructuring liability as of December 31, 2014
|
9,454
|
|
—
|
|
1,290
|
|
—
|
|
47
|
|
10,791
|
|
|||||||||||
|
Restructuring charge (recovery)
|
757
|
|
—
|
|
(269
|
)
|
1,582
|
|
(1,028
|
)
|
1,042
|
|
|||||||||||
|
Proceeds from sale of assets
|
—
|
|
—
|
|
—
|
|
—
|
|
1,325
|
|
1,325
|
|
|||||||||||
|
Other cash payments, net
|
(6,449
|
)
|
—
|
|
(1,021
|
)
|
(1,357
|
)
|
—
|
|
(8,827
|
)
|
|||||||||||
|
Other items
|
325
|
|
—
|
|
—
|
|
278
|
|
(344
|
)
|
259
|
|
|||||||||||
|
Restructuring liability as of December 31, 2015
|
4,087
|
|
—
|
|
—
|
|
503
|
|
—
|
|
4,590
|
|
|||||||||||
|
Restructuring charge
|
902
|
|
—
|
|
—
|
|
12
|
|
—
|
|
914
|
|
|||||||||||
|
Other cash payments, net
|
(4,039
|
)
|
—
|
|
—
|
|
(500
|
)
|
(34
|
)
|
(4,573
|
)
|
|||||||||||
|
Other items
|
975
|
|
—
|
|
—
|
|
—
|
|
34
|
|
1,009
|
|
|||||||||||
|
Restructuring liability as of December 31, 2016
|
$
|
1,925
|
|
$
|
—
|
|
$
|
—
|
|
$
|
15
|
|
$
|
—
|
|
$
|
1,940
|
|
|||||
|
Restructuring charge (recovery) from implementation to date
|
$
|
32,517
|
|
$
|
23,933
|
|
(1)
|
$
|
5,506
|
|
$
|
1,659
|
|
$
|
(781
|
)
|
(1)
|
$
|
62,834
|
|
|||
____________________
|
(1)
|
Other restructuring charge from implementation to date for the 2010 Restructurings includes
$21.7 million
in charges related to employee severance and other benefits for periods ended prior to December 31, 2013. The remainder of Other activity for both restructurings relates primarily to the impairment and sale of property and equipment.
|
The restructuring charge for the year ended December 31, 2016 included
$0.8 million
in charges related to a tenant’s default on an existing sublease which was partially offset by a
$0.1 million
recovery related to a new sublease executed in July 2016. The restructuring charge for the year ended December 31, 2015 included
$1.6 million
in additional charges due to the partial termination of one of our building leases and additional facility-related charges related to the decommissioning and exit of certain buildings, which was partially offset by
$1.0 million
in recoveries recorded in connection with the sale of excess equipment and other assets that had previously been fully depreciated and the reversal of severance charges recorded in 2014 for employees that were recalled in 2015. The restructuring charge for the year ended December 31, 2014 includes
$5.8 million
of employee severance and other benefits and we recorded charges of
$0.3 million
for property and equipment write-downs and other charges. The charges for all periods presented include the effect of the passage of time on our discounted cash flow computations (“accretion expense”) for the exit, in prior periods, of certain of our South San Francisco buildings and changes in estimates regarding future subleases.
88
We expect to pay accrued facility charges of
$1.9 million
, net of cash received from our subtenants, through the end of the lease terms of the buildings, all of which end in May 2017.
Cash and Investments Available-for-Sale
The following tables summarize cash and cash equivalents, investments, and restricted cash and investments by balance sheet line item as of
December 31, 2016
and
2015
(in thousands):
|
December 31, 2016
|
|||||||||||||||
|
|
Amortized
Cost
|
Gross
Unrealized
Gains
|
Gross
Unrealized
Losses
|
Fair Value
|
|||||||||||
|
Cash and cash equivalents
|
$
|
151,686
|
|
$
|
—
|
|
$
|
—
|
|
$
|
151,686
|
|
|||
|
Short-term investments
|
268,234
|
|
13
|
|
(130
|
)
|
268,117
|
|
|||||||
|
Long-term investments
|
55,792
|
|
1
|
|
(192
|
)
|
55,601
|
|
|||||||
|
Long-term restricted investments
|
4,150
|
|
—
|
|
—
|
|
4,150
|
|
|||||||
|
Total cash and investments
|
$
|
479,862
|
|
$
|
14
|
|
$
|
(322
|
)
|
$
|
479,554
|
|
|||
|
December 31, 2015
|
|||||||||||||||
|
|
Amortized
Cost
|
Gross
Unrealized
Gains
|
Gross
Unrealized
Losses
|
Fair Value
|
|||||||||||
|
Cash and cash equivalents
|
$
|
141,634
|
|
$
|
—
|
|
$
|
—
|
|
$
|
141,634
|
|
|||
|
Short-term investments
|
25,484
|
|
5
|
|
(63
|
)
|
25,426
|
|
|||||||
|
Long-term investments
|
83,665
|
|
2
|
|
(67
|
)
|
83,600
|
|
|||||||
|
Long-term restricted investments
|
2,650
|
|
—
|
|
—
|
|
2,650
|
|
|||||||
|
Total cash and investments
|
$
|
253,433
|
|
$
|
7
|
|
$
|
(130
|
)
|
$
|
253,310
|
|
|||
Under our loan and security agreement with Silicon Valley Bank, we are required to maintain compensating balances on deposit in
one
or more investment accounts with Silicon Valley Bank or
one
of its affiliates. The total collateral balances were
$81.6 million
as of both
December 31, 2016
and
2015
and are reflected in our Consolidated Balance Sheets in short-term investments as of
December 31, 2016
and long-term investments as of
December 31, 2015
; the change in classification from long-term to short-term was the result of a corresponding change in the classification for our term loan payable to Silicon Valley Bank which matures in May 2017. See “Note 7. Debt” for more information regarding the collateral balance requirements under our Silicon Valley Bank loan and security agreement.
89
The following table summarizes our cash equivalents and investments by security type as of
December 31, 2016
and
2015
. The amounts presented exclude cash, but include investments classified as cash equivalents (in thousands):
|
December 31, 2016
|
|||||||||||||||
|
Amortized
Cost
|
Gross
Unrealized
Gains
|
Gross
Unrealized
Losses
|
Fair Value
|
||||||||||||
|
Money market funds
|
$
|
71,457
|
|
$
|
—
|
|
$
|
—
|
|
$
|
71,457
|
|
|||
|
Commercial paper
|
165,375
|
|
—
|
|
—
|
|
165,375
|
|
|||||||
|
Corporate bonds
|
152,712
|
|
3
|
|
(308
|
)
|
152,407
|
|
|||||||
|
U.S. Treasury and government sponsored enterprises
|
70,730
|
|
11
|
|
(14
|
)
|
70,727
|
|
|||||||
|
Total investments
|
$
|
460,274
|
|
$
|
14
|
|
$
|
(322
|
)
|
$
|
459,966
|
|
|||
|
December 31, 2015
|
|||||||||||||||
|
Amortized
Cost
|
Gross
Unrealized
Gains
|
Gross
Unrealized
Losses
|
Fair Value
|
||||||||||||
|
Money market funds
|
$
|
72,000
|
|
$
|
—
|
|
$
|
—
|
|
$
|
72,000
|
|
|||
|
Commercial paper
|
78,155
|
|
—
|
|
—
|
|
78,155
|
|
|||||||
|
Corporate bonds
|
72,205
|
|
4
|
|
(118
|
)
|
72,091
|
|
|||||||
|
U.S. Treasury and government sponsored enterprises
|
28,434
|
|
1
|
|
(12
|
)
|
28,423
|
|
|||||||
|
Marketable equity securities
|
16
|
|
2
|
|
—
|
|
18
|
|
|||||||
|
Total investments
|
$
|
250,810
|
|
$
|
7
|
|
$
|
(130
|
)
|
$
|
250,687
|
|
|||
There were
no
gains or losses on the sales of investments available-for-sale during the years ended
December 31, 2016
,
2015
and
2014
.
All of our investments are subject to a quarterly impairment review. During the years ended
December 31, 2016
,
2015
and
2014
we did
no
t record any other-than-temporary impairment charges on our available-for-sale securities. As of
December 31, 2016
, there were
86
investments in an unrealized loss position with gross unrealized losses of
$322,000
and an aggregate fair value of
$172.1 million
. The investments in an unrealized loss position comprise corporate bonds with an aggregate fair value of
$143.5 million
and the remainder comprises primarily securities issued by U.S. Treasury and government sponsored enterprises. The unrealized losses were not attributed to credit risk, but rather associated with the changes in interest rates. Based on the scheduled maturities of our investments, we concluded that the unrealized losses in our investment securities are not other-than-temporary, as it is more likely than not that we will hold these investments for a period of time sufficient for a recovery of our cost basis.
The following summarizes the fair value of securities classified as available-for-sale by contractual maturity as of
December 31, 2016
(in thousands):
|
Mature within One Year
|
After One Year through Two Years
|
Fair Value
|
|||||||||
|
Money market funds
|
$
|
71,457
|
|
$
|
—
|
|
$
|
71,457
|
|
||
|
Commercial paper
|
165,375
|
|
—
|
|
165,375
|
|
|||||
|
Corporate bonds
|
99,455
|
|
52,952
|
|
152,407
|
|
|||||
|
U.S. Treasury and government sponsored enterprises
|
68,078
|
|
2,649
|
|
70,727
|
|
|||||
|
Total
|
$
|
404,365
|
|
$
|
55,601
|
|
$
|
459,966
|
|
||
Cash is excluded from the table above.
The classification of certain compensating balances and restricted investments are dependent upon the term of the underlying restriction on the asset and not the maturity date of the investment. Therefore, certain long-term investments and long-term restricted cash and investments have contractual maturities within one year.
90
Other Cost Method Equity Investments
During the
year ended
December 31, 2016 we recognized a
$2.5 million
gain on the sale of our
9%
interest in Akarna Therapeutics, Ltd. The gain on the sale is included in Interest income and other, net in our Consolidated Statements of Operations. The gain on sale of other cost method equity investments was either nominal or
zero
during the years ended December 31, 2015 and 2014.
As of December 31, 2016 and 2015, the carrying values of such investments were
$0
.
Inventory consists of the following (in thousands):
|
|
December 31,
|
||||||
|
|
2016
|
2015
|
|||||
|
Raw materials
|
$
|
863
|
|
$
|
1,037
|
|
|
|
Work in process
|
2,343
|
|
2,251
|
|
|||
|
Finished goods
|
738
|
|
583
|
|
|||
|
Total
|
3,944
|
|
3,871
|
|
|||
|
Less: non-current portion included in Other long-term assets
|
(606
|
)
|
(1,255
|
)
|
|||
|
Inventory
|
$
|
3,338
|
|
$
|
2,616
|
|
|
We generally relieve inventory on a first-expiry, first-out basis. A portion of the manufacturing costs for inventory were incurred prior to regulatory approval of CABOMETYX and COMETRIQ and, therefore, were expensed as research and development costs when those costs were incurred, rather than capitalized as inventory. Write-downs related to expiring and excess inventory are charged to cost of goods sold. Such write-downs were
$0.5 million
and
$1.2 million
for the years ended
December 31, 2016
and
2015
, respectively. The non-current portion of inventory is recorded within Other long-term assets on the accompanying Consolidated Balance Sheets and is comprised of a portion of the active pharmaceutical ingredient that is included in raw materials and work in process inventories.
Property and equipment consisted of the following (in thousands):
|
|
December 31,
|
||||||
|
|
2016
|
2015
|
|||||
|
Laboratory equipment
|
$
|
4,310
|
|
$
|
4,749
|
|
|
|
Computer equipment and software
|
13,738
|
|
11,890
|
|
|||
|
Furniture and fixtures
|
2,240
|
|
2,253
|
|
|||
|
Leasehold improvements
|
6,646
|
|
6,395
|
|
|||
|
Construction-in-progress
|
19
|
|
456
|
|
|||
|
26,953
|
|
25,743
|
|
||||
|
Less: accumulated depreciation and amortization
|
(24,882
|
)
|
(24,309
|
)
|
|||
|
Property and equipment, net
|
$
|
2,071
|
|
$
|
1,434
|
|
|
For the years ended
December 31, 2016
,
2015
and
2014
, we recorded depreciation expense of
$1.0 million
,
$1.4 million
and
$2.4 million
, respectively.
For the year ended 2014, we recorded an asset impairment charge of
$0.7 million
in connection with the Restructurings. There were
no
such charges in 2016 or
2015
. In 2015 and 2014, the gain on the sale of excess equipment was
$1.0 million
and
$0.6 million
, respectively. There were
no
such gains in 2016. Cash proceeds on sales were
$0.1 million
,
$1.3 million
and
$0.4 million
during 2016,
2015
and
2014
, respectively. The impairment and subsequent sale of excess equipment was a result of the 2010 restructurings, as described further in “Note 3 - Restructurings”. The asset impairment charge, net of the gain on the sale of such assets was recorded as a Restructuring charge (recovery) in our Consolidated Statements of Operations.
91
The amortized carrying amount of our debt consists of the following (in thousands):
|
|
December 31,
|
||||||
|
|
2016
|
2015
|
|||||
|
Secured Convertible Notes due 2018 (“Deerfield Notes”)
|
$
|
109,122
|
|
$
|
102,727
|
|
|
|
Term loan payable
|
80,000
|
|
80,000
|
|
|||
|
2019 Notes
|
—
|
|
235,210
|
|
|||
|
Total debt
|
189,122
|
|
417,937
|
|
|||
|
Less: current portion
|
(189,122
|
)
|
—
|
|
|||
|
Long-term debt
|
$
|
—
|
|
$
|
417,937
|
|
|
Prior period balances in this Note reflect revisions due to a correction of an immaterial error with regards to the 2019 Notes. The immaterial error resulted in an overstatement of the discount on the 2019 Notes and therefore understated the amortized carrying amount of the 2019 Notes and overstated the related interest expense. See “Note 1. Organization and Summary of Significant Accounting Policies - Correction of an Immaterial Error” for additional information on the correction of the immaterial error.
Deerfield Notes
In June 2010, we entered into a note purchase agreement with Deerfield Private Design Fund, L.P. and Deerfield Private Design International, L.P., (the “Original Deerfield Purchasers”), pursuant to which, on July 1, 2010, we sold to the Original Deerfield Purchasers an aggregate of
$124.0 million
principal amount of our Secured Convertible Notes due July 1, 2015, which we refer to as the Original Deerfield Notes, for an aggregate purchase price of
$80.0 million
, less closing fees and expenses of approximately
$2.0 million
. On August 6, 2012, the parties amended the note purchase agreement to permit the issuance of the 2019 Notes and modify certain optional prepayment rights. The amendment became effective upon the issuance of the 2019 Notes and the payment to the Original Deerfield Purchasers of a
$1.5 million
consent fee. On August 1, 2013, the parties further amended the note purchase agreement to clarify certain of our other rights under the note purchase agreement. On January 22, 2014, the note purchase agreement was amended to provide us with an option to extend the maturity date of our indebtedness under the note purchase agreement to July 1, 2018. On July 10, 2014, the parties further amended the note purchase agreement to clarify certain technical provisions. On July 1, 2015, we made a
$4.0 million
principal payment and then extended the maturity date of the Original Deerfield Notes from July 1, 2015 to July 1, 2018. In connection with the extension, Deerfield Partners, L.P. and Deerfield International Master Fund, L.P. (the “New Deerfield Purchasers”) acquired the
$100.0 million
principal amount of the Original Deerfield Notes and we entered into the Restated Deerfield Notes with each of the New Deerfield Purchasers, representing the
$100.0 million
principal amount. We refer to the Original Deerfield Purchasers and the New Deerfield Purchasers collectively as Deerfield, and to the Original Deerfield Notes and Restated Deerfield Notes, collectively as the Deerfield Notes.
As of
December 31, 2016
and
2015
, the outstanding principal balance on the Deerfield Notes was
$109.8 million
and
$103.8 million
, respectively, which, subject to certain limitations, is payable in cash or in stock at our discretion. Beginning on July 2, 2015, the outstanding principal amount of the Deerfield Notes bears interest at the rate of
7.5%
per annum to be paid in cash, quarterly in arrears, and
7.5%
per annum to be paid in kind, quarterly in arrears, for a total interest rate of
15%
per annum. Through July 1, 2015, the outstanding principal amount of the Deerfield Notes bore interest in the annual amount of
$6.0 million
, payable quarterly in arrears.
We have classified the Deerfield Notes as a current liability as of December 31, 2016 because we intend to repay the Deerfield Notes on or about July 1, 2017 at a prepayment price equal to
105%
of the outstanding principal amount of the notes, plus accrued and unpaid interest to the date of repayment. We expect that cash and cash equivalents and short-term investments held at
December 31, 2016
will be used to repay the Deerfield Notes.
92
The following is a summary of interest expense for the Deerfield Notes (in thousands):
|
|
Year Ended December 31,
|
||||||||||
|
|
2016
|
2015
|
2014
|
||||||||
|
Stated coupon interest
|
$
|
8,008
|
|
$
|
6,792
|
|
$
|
6,000
|
|
||
|
Interest paid in kind
|
8,008
|
|
3,817
|
|
—
|
|
|||||
|
Amortization of debt discount and debt issuance costs
|
457
|
|
5,461
|
|
11,731
|
|
|||||
|
Total interest expense
|
$
|
16,473
|
|
$
|
16,070
|
|
$
|
17,731
|
|
||
The balance of unamortized fees and costs was
$0.4 million
and
$0.7 million
as of
December 31, 2016
and
2015
, respectively, which is recorded as a reduction of the carrying amount of the Deerfield Notes on the accompanying Consolidated Balance Sheets. Effective March 4, 2015, upon notification of our election to extend the maturity date to July 1, 2018, we began to amortize the remaining unamortized discount, fees and costs through July 1, 2018 using the effective interest method and an effective interest rate of
15.2%
.
We were required to offer to make an additional mandatory prepayment on the Deerfield Notes in January 2016 and 2015 equal to
15%
of certain revenues from collaborative arrangements, which we refer to as “Development/Commercialization Revenue”, received during the prior fiscal year, subject to a maximum prepayment amount of
$27.5 million
. The definition of Development/Commercialization Revenue expressly excludes any sale or distribution of drug or pharmaceutical products in the ordinary course of our business, and any proceeds from any Intellectual Property Sale, but would include our share of the net profits from the commercialization of cobimetinib in the U.S. and the receipt of royalties from cobimetinib sales outside the U.S. As a result of the extension of the maturity date of the Deerfield Notes to July 1, 2018, our obligation to make annual mandatory prepayments equal to
15%
of Development/Commercialization Revenue received by us during the prior fiscal year will continue to apply in January 2017 and January 2018. We are only obligated to offer to make any such annual mandatory prepayment if the note holders provide notice to us of their election to receive the prepayment. We made no such mandatory prepayments due to the fact that Deerfield elected not to receive the mandatory prepayments in January 2017 or 2016 related to Development/Commercialization Revenue received during the years ended December 31, 2016 and 2015 and we received no such revenues during the fiscal year ended December 31, 2014.
Under the note purchase agreement, we may at our sole discretion, prepay all of the principal amount of the Deerfield Notes at a prepayment price equal to
105%
of the outstanding principal amount of the Deerfield Notes, plus all accrued and unpaid interest through the date of such prepayment, plus, if prior to July 1, 2017, all interest that would have accrued on the principal amount of the Deerfield Notes between the date of such prepayment and July 1, 2017, if the outstanding principal amount of the Deerfield Notes as of such prepayment date had remained outstanding through July 1, 2017, plus all other accrued and unpaid obligations, collectively referred to as the Prepayment Price.
In lieu of making any portion of the Prepayment Price or mandatory prepayment in cash, subject to certain limitations (including a cap on the number of shares issuable under the note purchase agreement), we have the right to convert all or a portion of the principal amount of the Deerfield Notes into, or satisfy all or any portion of the Prepayment Price amounts or mandatory prepayment amounts with shares of our common stock. Additionally, in lieu of making any payment of accrued and unpaid interest in respect of the Deerfield Notes in cash, subject to certain limitations, we may elect to satisfy any such payment with shares of our common stock. The number of shares of our common stock issuable upon conversion or in settlement of principal and interest obligations will be based upon the discounted trading price of our common stock over a specified trading period. Upon certain changes of control of Exelixis, a sale or transfer of assets in one transaction or a series of related transactions for a purchase price of more than (i)
$400 million
or (ii)
50%
of our market capitalization, Deerfield may require us to prepay the Deerfield Notes at the Prepayment Price. Upon an event of default, as defined in the Deerfield Notes, Deerfield may declare all or a portion of the Prepayment Price to be immediately due and payable.
We are required to notify the applicable Deerfield entities of certain sales, assignments, grants of exclusive licenses or other transfers of our intellectual property pursuant to which we transfer all or substantially all of our legal or economic interests, defined as an Intellectual Property Sale, and the Deerfield entities may elect to require us to prepay the principal amount of the Deerfield Notes in an amount equal to (i)
100%
of the cash proceeds of any Intellectual Property Sale relating to cabozantinib and (ii)
50%
of the cash proceeds of any other Intellectual Property Sale.
In connection with the January 2014 amendment to the note purchase agreement, on January 22, 2014, we issued to the New Deerfield Purchasers
two
-year warrants, which we refer to as the 2014 Warrants, to purchase an aggregate of
1,000,000
shares of our common stock at an exercise price of
$9.70
per share. Subsequent to our election to extend the maturity date of the Deerfield Notes, the exercise price of the 2014 Warrants was reset to
$3.445
per share and the term was extended by
93
two
years to January 22, 2018. See “Note 8. Common Stock and Warrants” for more information on the valuation of the 2014 Warrants.
In connection with the note purchase agreement, we also entered into a security agreement in favor of Deerfield which provides that our obligations under the Deerfield Notes will be secured by substantially all of our assets except intellectual property. On August 1, 2013, the security agreement was amended to limit the extent to which voting equity interests in any of our foreign subsidiaries shall be secured assets.
The note purchase agreement as amended and the security agreement include customary representations and warranties and covenants made by us, including restrictions on the incurrence of additional indebtedness.
Silicon Valley Bank Loan and Security Agreement
On May 22, 2002, we entered into a loan and security agreement with Silicon Valley Bank for an equipment line of credit. On December 21, 2004, December 21, 2006 and December 21, 2007, we amended the loan and security agreement to provide for additional equipment lines of credit and on June 2, 2010, we further amended the loan and security agreement to provide for a new
seven
-year term loan in the amount of
$80.0 million
. As of both
December 31, 2016
and 2015, the outstanding principal balance due under the term loan was
$80.0 million
and the lines of credit had been repaid in full. The principal amount outstanding under the term loan accrues interest at
1.0%
per annum, which interest is due and payable monthly. We are required to repay the term loan in
one
balloon principal payment, representing
100%
of the principal balance and accrued and unpaid interest, on May 31, 2017. We have the option to prepay all, but not less than all, of the amounts advanced under the term loan, provided that we pay all unpaid accrued interest thereon that is due through the date of such prepayment and the interest on the entire principal balance of the term loan that would otherwise have been paid after such prepayment date until the maturity date of the term loan.
In accordance with the terms of the loan and security agreement, we are required to maintain an amount equal to at least
100%
, but not to exceed
107%
, of the outstanding principal balance of the term loan under the loan and security agreement on deposit in one or more investment accounts with Silicon Valley Bank or one of its affiliates as support for our obligations under the loan and security agreement (although we are entitled to retain income earned or the amounts maintained in such accounts). Any amounts outstanding under the term loan during the continuance of an event of default under the loan and security agreement will, at the election of Silicon Valley Bank, bear interest at a per annum rate equal to
6.0%
. If one or more events of default under the loan and security agreement occurs and continues beyond any applicable cure period, Silicon Valley Bank may declare all or part of the obligations under the loan and security agreement to be immediately due and payable and stop advancing money or extending credit to us under the loan and security agreement.
The total collateral balance as of both
December 31, 2016
and
2015
was
$81.6 million
and is reflected in our Consolidated Balance Sheet in Short-term investments and Long-term investments as the amounts are not restricted as to withdrawal. However, withdrawal of some or all of this amount such that the collateral balance falls below the required level could result in Silicon Valley Bank declaring the obligation immediately due and payable.
2019 Notes
In
August 2012
, we issued and sold
$287.5 million
aggregate principal amount of the 2019 Notes, for net proceeds of
$277.7 million
. The 2019 Notes bore interest at a rate of
4.25%
per annum, payable semi-annually in arrears on February 15 and August 15 of each year.
On August 9, 2016 and August 19, 2016 we entered into separate, privately negotiated exchange agreements with certain holders of the 2019 Notes. Under the terms of the exchange agreements, the holders agreed to exchange an aggregate principal amount of
$239.4 million
of 2019 Notes held by them for an aggregate of
45,064,455
shares of our common stock. In addition, the holders received inducements of
$6.0 million
which included an aggregate cash payment of
$2.4 million
and
$3.6 million
in interest payments payable on the Deerfield Notes on August 15, 2016. Under the terms of the indenture for the 2019 Notes, subject to certain exceptions, holders who convert between a record date and the related interest payment date would have been required to repay the interest payment received on the related interest payment date. The exchange transactions entered into on August 9, 2016 were structured such that the holders party to those agreements were not required to repay this interest. We have included those payments as an additional inducement and as financing activities in our Consolidated Statement of Cash Flows. Inducements are included in the loss on extinguishment of debt. Following the completion of the exchange transactions, on August 24, 2016, we provided public notice of the redemption of
$48.1 million
of the 2019 Notes, representing all remaining notes outstanding. During the redemption period, which ended on November 2, 2016, holders of the 2019 Notes had the option to convert their notes into shares of our common stock, plus cash in lieu of any fractional share, at a conversion rate of
188.2353
shares of common stock per
$1,000
principal amount of the remaining 2019 Notes at any time before close of business on October 31, 2016. On various dates in August, September, October and November of 2016,
94
subsequent to the announcement of the redemption of all remaining 2019 Notes outstanding,
$47.5 million
of additional aggregate principal amount of 2019 Notes were converted by the holders into an aggregate of
8,944,824
shares of our common stock. We recognized an additional loss on extinguishment of debt of
$7.3 million
, representing the difference between the total settlement consideration transferred to the holders that was attributed to the liability component of the 2019 Notes, based on the fair value of that component at the time of conversion, and the net carrying value of the liability. The combined issuance of
54,009,279
shares of our common stock pursuant to the conversions of the 2019 Notes resulted in an increase to common stock and additional paid-in capital of
$592.7 million
. A portion of the settlement consideration transferred was allocated to the reacquisition of the embedded conversion option, which resulted in a
$342.7 million
reduction of additional paid-in capital. In November 2016 we redeemed the remaining
$0.6 million
aggregate principal amount of the 2019 Notes in cash for
100%
of the principal amount thereof, plus accrued and unpaid interest. Transaction costs incurred with third parties related to the conversion of the 2019 Notes were allocated between the liability and equity components and resulted in an additional
$0.5 million
of loss on extinguishment of debt and a
$0.7 million
reduction of additional paid-in capital. The following is a summary of loss on extinguishment of debt for the conversion and redemption of the 2019 Notes for the year ended December 31, 2016 (in thousands):
|
Inducements included in August 9, 2016 and August 19, 2016 agreements:
|
|||
|
Cash inducements
|
$
|
2,394
|
|
|
Repayments of interest required upon a conversion under the terms of the indenture that were not repaid under the terms of the exchange agreements
|
3,572
|
|
|
|
Difference between the total settlement consideration attributed to the liability component of the 2019 Notes and the net carrying value of the liability, described above
|
7,338
|
|
|
|
Unamortized discount on redeemed notes
|
83
|
|
|
|
Third party costs
|
514
|
|
|
|
Loss on extinguishment of debt
|
$
|
13,901
|
|
The following is a summary of the interest expense for the 2019 Notes (in thousands):
|
|
Year Ended December 31,
|
||||||||||
|
|
2016
|
2015
|
2014
|
||||||||
|
Stated coupon interest
|
$
|
7,799
|
|
$
|
12,218
|
|
$
|
12,253
|
|
||
|
Amortization of debt discount and debt issuance costs
|
7,975
|
|
11,581
|
|
10,525
|
|
|||||
|
Total interest expense
|
$
|
15,774
|
|
$
|
23,799
|
|
$
|
22,778
|
|
||
The balance of unamortized fees and costs was
$4.2 million
as of
December 31, 2015
which is recorded as a reduction of the carrying amount of the 2019 Notes on the accompanying Consolidated Balance Sheets. There were
no
such unamortized fees and costs as of December 31, 2016 due to the conversion and redemption of
100%
of the 2019 Notes in 2016.
Future Principal Payments
Aggregate contractual future principal payments of our debt are as follows as of
December 31, 2016
(in thousands):
|
Year Ending December 31,
(1)
|
|
||
|
2017
|
$
|
80,000
|
|
|
2018
|
124,972
|
|
|
|
Thereafter
|
—
|
|
|
____________________
|
(1)
|
As described above, we intend to repay the Deerfield Notes, which have a contractual maturity of July 1, 2018, on or about July 1, 2017. The actual timing of payments may differ materially.
|
Conversion of Debt into Common Stock
In 2016, we issued
54,009,279
shares of our common stock pursuant to the conversion of
$286.9 million
of aggregate principal amount of 2019 Notes. The conversions resulted in a
$253.1 million
increase to shareholder’s equity and a
$13.9 million
loss on extinguishment of debt. The Deerfield Notes are, under certain circumstances, convertible into shares of our common stock. See “Note 7. Debt” for more information regarding the conversion features of these instruments.
95
Sale of Shares of Common Stock
In July 2015, we completed a registered underwritten public offering of
28,750,000
shares of our common stock, including
3,750,000
shares issued under the underwriters’ 30-day option to buy shares, at a price of
$5.40
per share pursuant to a shelf registration statement previously filed with the SEC, which was filed and automatically became effective on July 1, 2015. We received
$145.6 million
in net proceeds from the offering after deducting the underwriting discount and other estimated expenses.
In January 2014, we completed a registered underwritten public offering of
10,000,000
shares of our common stock at a price of
$8.00
per share pursuant to a shelf registration statement previously filed with the SEC, which the SEC declared effective on June 8, 2012. We received
$75.6 million
in net proceeds from the offering after deducting the underwriting discount and related offering expenses.
2014 Warrants
In connection with an amendment to the note purchase agreement for the Original Deerfield Notes, in January 2014 we issued to the New Deerfield Purchasers
two
-year warrants to purchase an aggregate of
1,000,000
shares of our common stock at an exercise price of
$9.70
per share. Subsequent to our March 2015 notification of our election to extend the maturity date of the Deerfield Notes, the exercise price of the 2014 Warrants was reset to
$3.445
per share and the term was extended by
two years
to January 22, 2018.
The 2014 Warrants contain certain limitations that prevent the holder from acquiring shares upon exercise that would result in the number of shares beneficially owned by the holder to exceed
9.98%
of the total number of shares of our common stock then issued and outstanding. In addition, upon certain changes in control of Exelixis, to the extent the 2014 Warrants are not assumed by the acquiring entity, or upon certain defaults under the 2014 Warrants, the holder has the right to net exercise the 2014 Warrants for shares of common stock, or be paid an amount in cash in certain circumstances where the current holders of our common stock would also receive cash, equal to the Black-Scholes Merton value of the 2014 Warrants.
In connection with the issuance of the 2014 Warrants, we entered into a registration rights agreement with Deerfield, pursuant to which we filed a registration statement with the SEC covering the resale of the shares of common stock issuable upon exercise of the 2014 Warrants.
Due to the potential increase in term and decrease of the exercise price, the 2014 Warrants were included in Other long-term liabilities at their current estimated fair value, which was
$1.5 million
and
$0.9 million
as of March 18, 2015 and December 31, 2014, respectively. We recorded an unrealized loss of
$0.5 million
and an unrealized gain of
$1.8 million
on the 2014 Warrants during the years ended December 31, 2015 and 2014, respectively, which is included in Interest income and other, net. Subsequent to our March 2015 notification of our election to extend the maturity date of the Deerfield Notes, the terms of the 2014 Warrants became fixed as of March 18, 2015 and the 2014 Warrants were transferred to Additional paid-in capital as of that date at their then estimated fair value of
$1.5 million
.
The warrants are participating securities however the holders do not have a contractual obligation to share in our losses; thus, they have been excluded from our net loss per share calculations.
The following table sets forth the fair value of our financial assets that were measured and recorded on a recurring basis as of
December 31, 2016
and
2015
. We did not have any Level 3 investments as of
December 31, 2016
or
2015
. The amounts presented exclude cash, but include investments classified as cash equivalents (in thousands):
|
December 31, 2016
|
|||||||||||
|
Level 1
|
Level 2
|
Total
|
|||||||||
|
Money market funds
|
$
|
71,457
|
|
$
|
—
|
|
$
|
71,457
|
|
||
|
Commercial paper
|
—
|
|
165,375
|
|
165,375
|
|
|||||
|
Corporate bonds
|
—
|
|
152,407
|
|
152,407
|
|
|||||
|
U.S. Treasury and government sponsored enterprises
|
—
|
|
70,727
|
|
70,727
|
|
|||||
|
Total financial assets
|
$
|
71,457
|
|
$
|
388,509
|
|
$
|
459,966
|
|
||
96
|
December 31, 2015
|
|||||||||||
|
Level 1
|
Level 2
|
Total
|
|||||||||
|
Money market funds
|
$
|
72,000
|
|
$
|
—
|
|
$
|
72,000
|
|
||
|
Commercial paper
|
—
|
|
78,155
|
|
78,155
|
|
|||||
|
Corporate bonds
|
—
|
|
72,091
|
|
72,091
|
|
|||||
|
U.S. Treasury and government sponsored enterprises
|
—
|
|
28,423
|
|
28,423
|
|
|||||
|
Marketable equity securities
|
18
|
|
—
|
|
18
|
|
|||||
|
Total financial assets
|
$
|
72,018
|
|
$
|
178,669
|
|
$
|
250,687
|
|
||
The following is a reconciliation of changes in the fair value of warrants which are classified as Level 3 in the fair value hierarchy (in thousands)
:
|
Balance at December 31, 2014
|
$
|
921
|
|
|
Unrealized loss at final re-measurement of warrants on March 18, 2015,
included in Interest income and other, net
|
549
|
|
|
|
Transfer of warrants from Other long-term liabilities to Additional paid-in capital at their estimated fair value upon warrant repricing on March 18, 2015
|
(1,470
|
)
|
|
|
Balance at December 31, 2015
|
$
|
—
|
|
No such activity occurred during the year ended December 31, 2016.
The estimated fair value of our financial instruments that are carried at amortized cost is as follows (in thousands)
:
|
December 31, 2016
|
December 31, 2015
|
||||||||||||||
|
Carrying
Amount
|
Fair Value
|
Carrying
Amount
|
Fair Value
|
||||||||||||
|
Deerfield Notes
|
$
|
109,122
|
|
$
|
121,220
|
|
$
|
102,727
|
|
$
|
101,096
|
|
|||
|
Term loan payable
|
$
|
80,000
|
|
$
|
79,784
|
|
$
|
80,000
|
|
$
|
79,815
|
|
|||
|
2019 Notes
|
$
|
—
|
|
$
|
—
|
|
$
|
235,210
|
|
$
|
336,260
|
|
|||
The carrying amounts of cash, trade and other receivables, accounts payable, accrued collaboration liability, accrued clinical trial liabilities, accrued compensation and benefits, and other liabilities approximate their fair values and are excluded from the tables above.
The following methods and assumptions were used to estimate the fair value of each class of financial instrument for which it is practicable to estimate a value:
|
•
|
When available, we value investments based on quoted prices for those financial instruments, which is a Level 1 input. Our remaining investments are valued using third-party pricing sources, which use observable market prices, interest rates and yield curves observable at commonly quoted intervals of similar assets as observable inputs for pricing, which is a Level 2 input.
|
|
•
|
The 2019 Notes were valued using a third-party pricing model that is based in part on average trading prices, which is a Level 2 input. The 2019 Notes were not marked-to-market and are shown at their initial fair value less the unamortized discount; the portion of the value allocated to the conversion option is included in Stockholders’ equity (deficit) on the accompanying Consolidated Balance Sheets.
|
|
•
|
We estimate the fair value of our other debt instruments, where possible, using the net present value of the payments. For the Silicon Valley Bank term loan and line of credit, we use an interest rate that is consistent with money-market rates that would have been earned on our non-interest-bearing compensating balances as our discount rate, which is a Level 2 input. For the Deerfield Notes, we used a discount rate of
9.5%
, which we estimate as our current borrowing rate for similar debt as of
December 31, 2016
, which is a Level 3 input.
|
97
Financial Assets, Liabilities and Equity Measured on a Nonrecurring Basis
In connection with the conversions for our 2019 Note during 2016, we were required to determine the fair value of the settlement consideration received by the holders and the fair value of the liability component of the 2019 Notes, as of the various settlement dates of the conversions. The following methods and assumptions were used to estimate the fair value of those financial instruments:
|
•
|
The settlement consideration comprises, in part, shares of our Common Stock. The fair value of our Common Stock was determined based on the closing market price of our Common Stock on the various settlement dates of the conversions, which are level 1 inputs;
|
|
•
|
The carrying value of the remaining settlement consideration, which includes cash and the forgiveness of the repayment of certain prior interest payments, approximates fair value;
|
|
•
|
We estimated the fair value of the liability component of the 2019 Notes using the net present value of estimated future cash flows through maturity. We used a discount rate of
9.5%
, which we estimated as our current borrowing rate for straight debt as of September 30, 2016, which is a Level 3 input.
|
Equity Incentive Plans
We have several equity incentive plans under which we have granted incentive stock options, non-qualified stock options and RSUs to employees, directors and consultants. The Board of Directors or a designated Committee of the Board is responsible for administration of our employee equity incentive plans and determines the term, exercise price and vesting terms of each option. Stock options have a
four
-year vesting term, an exercise price equal to the fair market value on the date of grant, and a
seven
year life from the date of grant. Stock options issued prior to May 2011 have a
ten
year life from the date of grant. RSUs granted to our employees vest annually over a
four
year term.
In December 2005, our Board of Directors adopted a Change in Control and Severance Benefit Plan for executives and certain non-executives. Eligible Change in Control and Severance Benefit Plan participants include our employees with the title of vice president and above. If a participant’s employment is terminated without cause during a period commencing
one month
before and ending
thirteen months
following a change in control, as defined in the plan document, then the Change in Control and Severance Benefit Plan participant is entitled to have the vesting of all of such participant’s stock options accelerated with the exercise period being extended to no more than
one year
.
Employee Stock Purchase Plan
In January 2000, we adopted the 2000 Employee Stock Purchase Plan (the “ESPP”). The ESPP allows for qualified employees (as defined in the ESPP) to purchase shares of our common stock at a price equal to the lower of
85%
of the closing price at the beginning of the offering period or
85%
of the closing price at the end of each
six
month purchase period. Compensation expense related to our ESPP was
$1.0 million
,
$0.4 million
, and
$0.8 million
for the years ended
December 31, 2016
,
2015
and
2014
, respectively. As of
December 31, 2016
, we had
5,487,023
shares available for issuance under our ESPP. We issued
559,936
shares,
324,315
shares, and
669,565
shares of common stock during the years ended
December 31, 2016
,
2015
and
2014
, respectively, pursuant to the ESPP at an average price per share of
$3.91
,
$1.75
and
$2.14
, respectively.
Stock-Based Compensation
We recorded and allocated employee stock-based compensation expense for our equity incentive plans and our ESPP as follows (in thousands):
|
|
Year Ended December 31,
|
||||||||||
|
|
2016
|
2015
|
2014
|
||||||||
|
Research and development expense
|
$
|
9,366
|
|
$
|
11,691
|
|
$
|
3,245
|
|
||
|
Selling, general and administrative expense
|
13,546
|
|
10,286
|
|
6,783
|
|
|||||
|
Restructuring related recovery
|
—
|
|
—
|
|
(22
|
)
|
|||||
|
Total employee stock-based compensation expense
|
$
|
22,912
|
|
$
|
21,977
|
|
$
|
10,006
|
|
||
98
We use the Black-Scholes Merton option pricing model to value our stock options. The weighted average grant-date fair value of our stock options and ESPP purchases was as follows:
|
|
2016
|
2015
|
2014
|
||||||||
|
Stock options
|
$
|
4.77
|
|
$
|
2.55
|
|
$
|
1.46
|
|
||
|
ESPP
|
$
|
2.17
|
|
$
|
1.20
|
|
$
|
1.28
|
|
||
The fair value of employee stock option awards and ESPP purchases was estimated using the following assumptions:
|
|
Stock Options
|
|||||||
|
|
2016
|
2015
|
2014
|
|||||
|
Risk-free interest rate
|
1.15
|
%
|
1.22
|
%
|
1.80
|
%
|
||
|
Dividend yield
|
—
|
%
|
—
|
%
|
—
|
%
|
||
|
Volatility
|
76
|
%
|
93
|
%
|
85
|
%
|
||
|
Expected life
|
4.4 years
|
|
4.5 years
|
|
5.5 years
|
|
||
|
|
ESPP
|
|||||||
|
|
2016
|
2015
|
2014
|
|||||
|
Risk-free interest rate
|
0.55
|
%
|
0.15
|
%
|
0.06
|
%
|
||
|
Dividend yield
|
—
|
%
|
—
|
%
|
—
|
%
|
||
|
Volatility
|
65
|
%
|
98
|
%
|
69
|
%
|
||
|
Expected life
|
6 months
|
|
6 months
|
|
6 months
|
|
||
The expected life computation for stock options is based on historical exercise patterns and post-vesting termination behavior. We considered implied volatility as well as our historical volatility in developing our estimate of expected volatility.
A summary of all stock option activity for the
year ended
December 31, 2016
is presented below (dollars in thousands
,
except per share amounts):
|
Shares
|
Weighted
Average
Exercise Price
|
Weighted
Average
Remaining
Contractual
Term
|
Aggregate
Intrinsic
Value
|
|||||||||
|
Options outstanding at December 31, 2015
|
27,425,854
|
|
$
|
4.22
|
|
|||||||
|
Granted
|
4,200,950
|
|
$
|
8.29
|
|
|||||||
|
Exercised
|
(6,239,022
|
)
|
$
|
4.07
|
|
|||||||
|
Forfeited
|
(307,601
|
)
|
$
|
4.67
|
|
|||||||
|
Expired
|
(80,516
|
)
|
$
|
10.49
|
|
|||||||
|
Options outstanding at December 31, 2016
|
24,999,665
|
|
$
|
4.91
|
|
4.54 years
|
$
|
250,996
|
|
|||
|
Exercisable at December 31, 2016
|
17,731,361
|
|
$
|
4.01
|
|
3.98 years
|
$
|
193,288
|
|
|||
At
December 31, 2016
, a total of
1,630,271
shares were available for grant under our stock option plans.
The aggregate intrinsic value in the table above represents the total intrinsic value (the difference between our closing stock price on the last trading day of fiscal
2016
and the exercise prices, multiplied by the number of in-the-money options) that would have been received by the option holders had all option holders exercised their options on
December 31, 2016
. The total intrinsic value of options exercised was
$50.0 million
and
$2.9 million
during the years ended
December 31, 2016
and
2015
, respectively, and was nominal in
2014
. The total estimated fair value of employee options vested and recorded as expense during the years ended December 31,
2016
,
2015
and
2014
was
$13.4 million
,
$18.9 million
and
$8.6 million
, respectively.
On April 28, 2016, as a result of the FDA’s approval of our New Drug Application “NDA” submission, on March 7, 2016, as a result of the FDA’s acceptance of our NDA submission and on July 20, 2015, as a result of positive top-line results from the primary analysis of METEOR, the Compensation Committee of the Board of Directors of Exelixis convened to
99
determine we had met certain performance objectives for performance-based stock options granted to employees in 2013, 2014 and 2015. As a result of these determinations,
5,870,303
and
6,982,613
performance-based stock options vested during the
years ended
December 31, 2016
and
2015
, respectively
. During
the years ended
December 31, 2016
and
2015
we recognized
$4.1 million
and
$13.2 million
in stock-based compensation
expense
for those
performance-based stock option grants
. Prior to 2015,
we had not considered achievement of those performance objectives to be probable and therefore, we did
no
t record any
stock-based compensation
expense
for the
performance-based stock
options during 2014.
The following table summarizes information about stock options outstanding and exercisable at
December 31, 2016
:
|
|
Options Outstanding
|
Options Outstanding and
Exercisable
|
|||||||||||||||
|
Exercise Price Range
|
Number
|
Weighted
Average
Remaining
Contractual Life
|
Weighted
Average
Exercise
Price
|
Number
Exercisable
|
Weighted
Average
Exercise
Price
|
||||||||||||
|
$1.46 - $1.90
|
8,231,617
|
|
4.64 years
|
$
|
1.77
|
|
8,088,721
|
|
$
|
1.77
|
|
||||||
|
$2.57 - $4.05
|
2,707,474
|
|
5.57 years
|
$
|
3.56
|
|
1,130,251
|
|
$
|
3.27
|
|
||||||
|
$4.16 - $5.55
|
5,957,725
|
|
3.58 years
|
3,186,063
|
|
$
|
5.18
|
|
4,520,554
|
|
$
|
5.31
|
|
||||
|
$5.61 - $6.21
|
4,076,881
|
|
6,881
|
|
5.17 years
|
$
|
6.08
|
|
1,861,457
|
|
$
|
6.00
|
|
||||
|
$6.25 - $18.25
|
4,025,968
|
|
4.42 years
|
$
|
10.67
|
|
2,130,378
|
|
$
|
8.42
|
|
||||||
|
24,999,665
|
|
4.54 years
|
$
|
4.91
|
|
17,731,361
|
|
$
|
4.01
|
|
|||||||
As of
December 31, 2016
,
$23.9 million
of total unrecognized compensation expense related to stock options is expected to be recognized over a weighted-average period of
2.90 years
.
Cash received from option exercises and purchases under the ESPP in the years ended December 31,
2016
,
2015
and 2013 was
$27.5 million
,
$11.5 million
and
$1.6 million
, respectively.
The fair value of RSUs is determined based on the value of the underlying common stock on the date of grant. The expenses relating to these RSUs will be recognized over their respective vesting periods. A summary of all RSU activity was as follows for all periods presented (dollars in thousands, except per share amounts):
|
Shares
|
Weighted
Average
Grant Date
Fair Value
|
Weighted
Average
Remaining
Contractual
Term
|
Aggregate
Intrinsic
Value
|
|||||||||
|
Awards outstanding at December 31, 2015
|
1,002,188
|
|
$
|
5.16
|
|
|||||||
|
Awarded
|
3,138,236
|
|
$
|
7.58
|
|
|||||||
|
Vested and released
|
(1,640,324
|
)
|
$
|
4.49
|
|
|||||||
|
Forfeited
|
(30,309
|
)
|
$
|
4.77
|
|
|||||||
|
Awards outstanding at December 31, 2016
|
2,469,791
|
|
$
|
8.69
|
|
1.93 years
|
$
|
36,825
|
|
|||
As of
December 31, 2016
,
$13.9 million
of total unrecognized compensation expense related to employee RSUs was expected to be recognized over a weighted-average period of
3.28 years
.
401(k) Retirement Plan
We sponsor a 401(k) Retirement Plan (the “401(k) Plan”) whereby eligible employees may elect to contribute up to the lesser of
50%
of their annual compensation or the statutorily prescribed annual limit allowable under Internal Revenue Service regulations. The 401(k) Plan permits us to make matching contributions on behalf of all participants. We matched
100%
of the first
3%
of participant contributions into the 401(k) Plan in the form of our common stock. We recorded expense of
$1.1 million
,
$0.4 million
, and
$1.1 million
related to the stock match for the years ended
December 31, 2016
,
2015
and
2014
, respectively.
As of
December 31, 2016
, we had
303,187
shares available for issuance under our
401(k) Plan
.
100
The income tax (benefit) provision is based on the following loss before income taxes (in thousands):
|
|
Year Ended December 31,
|
||||||||||
|
|
2016
|
2015
|
2014
|
||||||||
|
Domestic
|
$
|
(70,222
|
)
|
$
|
(150,846
|
)
|
$
|
(230,535
|
)
|
||
|
Foreign
|
—
|
|
(10,843
|
)
|
(30,944
|
)
|
|||||
|
Total
|
$
|
(70,222
|
)
|
$
|
(161,689
|
)
|
$
|
(261,479
|
)
|
||
Income tax expense (benefit) consists of the following for the periods shown below (in thousands):
|
|
Year Ended December 31,
|
||||||||||
|
|
2016
|
2015
|
2014
|
||||||||
|
Current:
|
|||||||||||
|
Federal
|
$
|
—
|
|
$
|
—
|
|
$
|
—
|
|
||
|
State
|
—
|
|
55
|
|
(182
|
)
|
|||||
|
Total current tax expense
|
—
|
|
55
|
|
(182
|
)
|
|||||
|
Deferred:
|
|||||||||||
|
Federal
|
—
|
|
—
|
|
—
|
|
|||||
|
State
|
—
|
|
—
|
|
—
|
|
|||||
|
Total deferred tax expense
|
—
|
|
—
|
|
—
|
|
|||||
|
Income tax provision (benefit)
|
$
|
—
|
|
$
|
55
|
|
$
|
(182
|
)
|
||
The 2016 income tax provision relates to state minimum and franchise taxes and were nominal. The 2015 income tax provision relates to state minimum and franchise tax expenses as well as true ups related to prior year tax entries. The 2014 income tax benefit resulted from the lapse of the applicable statute of limitations in California for the 2009 tax year, offset by current year state income tax expense.
A reconciliation of income taxes at the statutory federal income tax rate to our income tax (benefit) provision included in the Consolidated Statements of Operations is as follows (in thousands):
|
|
Year Ended December 31,
|
||||||||||
|
|
2016
|
2015
|
2014
|
||||||||
|
U.S. federal income tax benefit at statutory rate
|
$
|
(23,876
|
)
|
$
|
(54,974
|
)
|
$
|
(88,903
|
)
|
||
|
Unutilized net operating losses
|
6,377
|
|
51,421
|
|
84,985
|
|
|||||
|
State tax expense
|
6,520
|
|
55
|
|
(182
|
)
|
|||||
|
Debt extinguishment
|
4,726
|
|
—
|
|
—
|
|
|||||
|
Non-deductible interest
|
2,680
|
|
3,308
|
|
3,598
|
|
|||||
|
Stock-based compensation
|
3,155
|
|
195
|
|
255
|
|
|||||
|
Other
|
418
|
|
50
|
|
65
|
|
|||||
|
Income tax (benefit) provision
|
$
|
—
|
|
$
|
55
|
|
$
|
(182
|
)
|
||
Deferred tax assets and liabilities reflect the net tax effects of net operating loss and tax credit carry-forwards and temporary differences between the carrying amounts of assets and liabilities for financial reporting and the amounts used for income tax purposes.
101
Our deferred tax assets and liabilities consist of the following (in thousands):
|
|
December 31,
|
||||||
|
|
2016
|
2015
|
|||||
|
Deferred tax assets:
|
|||||||
|
Net operating loss carry-forwards
|
$
|
471,327
|
|
$
|
464,504
|
|
|
|
Book over tax depreciation and amortization
|
70,617
|
|
1,752
|
|
|||
|
Tax credit and charitable contribution carry-forwards
|
64,367
|
|
64,350
|
|
|||
|
Amortization of deferred stock compensation – non-qualified
|
14,780
|
|
14,615
|
|
|||
|
Accruals and reserves not currently deductible
|
8,117
|
|
7,775
|
|
|||
|
Other
|
106
|
|
—
|
|
|||
|
Total deferred tax assets
|
629,314
|
|
552,996
|
|
|||
|
Valuation allowance
|
(629,062
|
)
|
(536,327
|
)
|
|||
|
Net deferred tax assets
|
252
|
|
16,669
|
|
|||
|
Deferred tax liabilities:
|
|||||||
|
Unrealized gain on derivatives
|
(252
|
)
|
(497
|
)
|
|||
|
Convertible debt
|
—
|
|
(16,172
|
)
|
|||
|
Total deferred tax liabilities
|
(252
|
)
|
(16,669
|
)
|
|||
|
Net deferred taxes
|
$
|
—
|
|
$
|
—
|
|
|
Accounting Standards Codification 740 requires that the tax benefit of net operating losses, temporary differences and credit carry forwards be recorded as an asset to the extent that management assesses that realization is "more likely than not." Realization of the future tax benefits is dependent on the Company's ability to generate sufficient taxable income within the carry forward period. Because of the Company's recent history of operating losses, management believes that recognition of the deferred tax assets arising from the above-mentioned future tax benefits is currently not likely to be realized and, accordingly, has provided a valuation allowance. The valuation allowance increased by
$92.7 million
,
$7.9 million
and
$88.8 million
during 2016, 2015 and 2014, respectively.
At December 31, 2016, we had federal net operating loss carry-forwards of approximately
$1,424 million
which expire in the years
2019
through
2036
, and federal business tax credits of approximately
$75 million
which expire in the years
2020
through
2029
. We also had state net operating loss carry-forwards of approximately
$494 million
, which expire in the years
2017
through
2036
, California research and development tax credits of approximately
$25 million
which have no expiration. Included in the federal and state carry-forwards is
$56.9 million
related to deductions from the exercise of stock options and the related tax benefit that will result in an increase in additional paid-in capital if and when realized through a reduction of taxes paid in cash.
Under the Internal Revenue Code and similar state provisions, certain substantial changes in our ownership could result in an annual limitation on the amount of net operating loss and credit carry-forwards that can be utilized in future years to offset future taxable income. The annual limitation may result in the expiration of net operating losses and credit carry-forwards before utilization. We completed a Section 382 study through December 31, 2016, and concluded that an ownership change, as defined under Section 382, had not occurred.
Accounting Standards Codification Topic 740-10 clarifies the accounting for uncertainty in income taxes by prescribing the recognition threshold a tax position is required to meet before being recognized in the financial statements. It also provides guidance on derecognition, classification, interest and penalties, accounting in interim periods, disclosure and transition. The following table summarizes the activity related to our unrecognized tax benefits (in thousands):
|
|
Year Ended December 31,
|
||||||||||
|
|
2016
|
2015
|
2014
|
||||||||
|
Beginning balance
|
$
|
88,638
|
|
$
|
58,215
|
|
$
|
55,077
|
|
||
|
Decrease (increase) relating to prior year provision
|
(29,110
|
)
|
21,696
|
|
719
|
|
|||||
|
Increase relating to current year provision
|
2,304
|
|
8,727
|
|
2,706
|
|
|||||
|
Reductions based on the lapse of the applicable statutes of limitations
|
(23
|
)
|
—
|
|
(287
|
)
|
|||||
|
Ending balance
|
$
|
61,809
|
|
$
|
88,638
|
|
$
|
58,215
|
|
||
102
We do not anticipate that the amount of unrecognized tax benefits existing as of December 31, 2016 will significantly decrease over the next 12 months.
We file U.S. and state income tax returns in jurisdictions with varying statues of limitations during which such tax returns may be audited and adjusted by the relevant tax authorities. The 1999 through 2015 years generally remain subject to examination by federal and most state tax authorities to the extent of net operating losses and credits generated during these periods and are being utilized in the open tax periods.
The following table sets forth a reconciliation of basic and diluted net loss per share (in thousands, except per share amounts):
|
|
Year Ended December 31,
|
||||||||||
|
|
2016
|
2015
|
2014
|
||||||||
|
Numerator:
|
|||||||||||
|
Net loss
|
$
|
(70,222
|
)
|
$
|
(161,744
|
)
|
$
|
(261,297
|
)
|
||
|
Denominator:
|
|||||||||||
|
Shares used in computing basic and diluted net loss per share
|
250,531
|
|
209,227
|
|
194,299
|
|
|||||
|
Net loss per share, basic and diluted
|
$
|
(0.28
|
)
|
$
|
(0.77
|
)
|
$
|
(1.34
|
)
|
||
The following table sets forth outstanding potential shares of common stock outstanding as of the dates presented that are not included in the computation of diluted net loss per share because to do so would be anti-dilutive (in thousands):
|
|
December 31,
|
|||||||
|
|
2016
|
2015
|
2014
|
|||||
|
Convertible debt
|
33,890
|
|
88,008
|
|
75,734
|
|
||
|
Outstanding stock options, unvested RSUs and ESPP contributions
|
27,568
|
|
28,470
|
|
28,930
|
|
||
|
Warrants
|
1,000
|
|
1,000
|
|
1,000
|
|
||
|
Total potentially dilutive shares
|
62,458
|
|
117,478
|
|
105,664
|
|
||
Leases
We lease office and research space under operating leases that expire at various dates through the year 2018. Certain operating leases contain renewal provisions and require us to pay other expenses. Aggregate future minimum lease payments under our operating leases are as follows (in thousands):
|
Year Ending December 31,
|
Operating
Leases (1)
|
||
|
2017
|
8,474
|
|
|
|
2018
|
3,007
|
|
|
|
$
|
11,481
|
|
|
____________________
|
(1)
|
Minimum payments have not been reduced by minimum sublease rentals of
$1.2 million
due in the future under noncancelable subleases.
|
The following is a summary of aggregate future minimum lease payments under operating leases at
December 31, 2016
, by operating lease agreements (in thousands):
|
|
Original
Term
(Expiration)
|
Renewal Options
|
Future
Minimum
Lease
Payments
|
||
|
Building Lease #1 and 2
|
May 2017
|
none
|
$
|
3,425
|
|
|
Building Lease #3
|
July 2018
|
1 additional period of 5 years
|
8,056
|
|
|
|
Total
|
$
|
11,481
|
|
||
103
Rent expense under operating leases was
$6.1 million
,
$8.7 million
, and
$10.3 million
for the years ended
December 31, 2016
,
2015
and
2014
, respectively. Rent expense was recorded net of sublease rental incomes of
$3.6 million
,
$5.2 million
and
$4.9 million
for the years ended
December 31, 2016
,
2015
and
2014
, respectively.
Letters of Credit and Restricted Cash
We entered into a standby letter of credit with a bank in July 2004, which is related to a building lease, with a credit limit of
$0.5 million
at both
December 31, 2016
and
2015
. We entered into
two
standby letters of credit with a bank in May 2007, which is related to our workers compensation insurance policy, for a combined credit limit of
$0.6 million
at both
December 31, 2016
and
2015
. All
three
letters of credit are fully collateralized by long-term restricted cash and investments. As of
December 31, 2016
, the full amount of our three letters of credit was available.
As part of a purchasing card program with a bank we initiated during 2007, we were required to provide collateral in the form of a non-interest bearing certificate of deposit. The collateral at
December 31, 2016
and
2015
was
$3.0 million
and
$1.5 million
, respectively. We recorded these amounts in the Consolidated Balance Sheet as Long-term restricted cash and investments as the certificates of deposit were restricted as to withdrawal.
Indemnification Agreements
In connection with the sale of our plant trait business, we agreed to indemnify the purchaser and its affiliates up to a specified amount if they incur damages due to any infringement or alleged infringement of certain patents. We have certain collaboration licensing agreements that contain standard indemnification clauses. Such clauses typically indemnify the customer or vendor for an adverse judgment in a lawsuit in the event of our misuse or negligence. We consider the likelihood of an adverse judgment related to any of our indemnification agreements to be remote. Furthermore, in the event of an adverse judgment, any losses under such an adverse judgment may be substantially offset by applicable corporate insurance.
Financial instruments that potentially subject us to concentrations of credit risk are primarily trade and other receivables and investments. Investments consist of money market funds, taxable commercial paper, corporate bonds with high credit quality, and U.S. Treasury and government sponsored enterprises. All investments are maintained with financial institutions that management believes are creditworthy.
Trade and other receivables are unsecured and are concentrated in the pharmaceutical and biotechnology industries. Accordingly, we may be exposed to credit risk generally associated with pharmaceutical and biotechnology companies. We have incurred no bad debt expense since inception. As of
December 31, 2016
,
27%
,
19%
,
16%
and
13%
of our trade receivables are with Diplomat Specialty Pharmacy, Caremark L.L.C., affiliates of McKesson Corporation, and Accredo Health, Incorporated, respectively. All of these customers have historically paid promptly. As of
December 31, 2016
, we also had a receivable for a
$10.0 million
milestone payment from Ipsen which we received subsequent to December 31, 2016.
The following table sets forth the percentage of revenues recognized by customer that represent 10% or more of total revenues:
|
|
Year Ended December 31,
|
|||||||
|
|
2016
|
2015
|
2014
|
|||||
|
Diplomat Specialty Pharmacy
|
33
|
%
|
83
|
%
|
99
|
%
|
||
|
Ipsen
|
17
|
%
|
—
|
%
|
—
|
%
|
||
We have operations solely in the U.S., while some of our collaboration partners have headquarters outside of the U.S. and some of our clinical trials for cabozantinib are also conducted outside of the U.S. All of our long-lived assets are located in the U.S.
The following table shows the revenues earned by geographic region. Net product revenues are attributed to regions based on ship-to location. Collaboration revenues are attributed to regions based on the location of the collaboration partner (dollars in thousands):
104
|
Year Ended December 31,
|
|||||||||||
|
2016
|
2015
|
2014
|
|||||||||
|
U.S.
|
$
|
140,709
|
|
$
|
33,869
|
|
$
|
24,832
|
|
||
|
Europe
|
35,745
|
|
3,303
|
|
279
|
|
|||||
|
Rest of world
|
15,000
|
|
—
|
|
—
|
|
|||||
We recorded a
$0.2 million
loss, a
$0.1 million
gain and a
$0.5 million
gain relating to foreign exchange fluctuations for the years ended
December 31, 2016
,
2015
and
2014
, respectively.
On January 30, 2017, we entered into a collaboration and license agreement (the “Takeda Collaboration Agreement”) with Takeda Pharmaceutical Company Limited (“Takeda”) for the commercialization and further clinical development of cabozantinib in Japan. Pursuant to the terms of the Takeda Collaboration Agreement, Takeda will have exclusive commercialization rights for current and potential future cabozantinib indications in Japan. The companies have also agreed to collaborate on the future clinical development of cabozantinib in Japan. The parties’ efforts will be governed through a joint executive committee and appropriate subcommittees established to guide and oversee the collaboration’s operation and strategic direction.
In consideration for the exclusive license and other rights contained in the Takeda Collaboration Agreement, Takeda paid us an upfront payment of
$50.0 million
in February 2017. We will be eligible to receive development, regulatory and first-sales milestones of up to
$95.0 million
related to second-line RCC, first-line RCC and second-line HCC, as well as additional development, regulatory and first-sales milestone payments for potential future indications. The Takeda Collaboration Agreement also provides that we will be eligible to receive pre-specified payments of up to
$83.0 million
associated with potential sales milestones. We will also receive royalties on net sales of cabozantinib in Japan at an initial tiered rate of
15%
to
24%
on net sales for the first
$300.0 million
of cumulative net sales. Thereafter, the royalty rate will be adjusted to
20%
to
30%
on annual net sales.
Takeda will be responsible for
20%
of the costs associated with the global cabozantinib development plan, provided Takeda opts in to participate in such trials, and
100%
of costs associated with the cabozantinib development activities that are exclusively for the benefit of Japan. Pursuant to the terms of the Takeda Collaboration Agreement, we will remain responsible for the manufacture and supply of cabozantinib for all development and commercialization activities under the collaboration. As part of the collaboration, the parties will enter into a supply agreement covering the manufacture and supply of cabozantinib to Takeda and a quality agreement setting forth in detail the quality assurance arrangements and procedures for our manufacture of cabozantinib.
The Takeda Collaboration Agreement may be terminated for cause by either party based on uncured material breach by the other party, bankruptcy of the other party or for safety reasons. For clarity, Takeda’s failure to achieve specified levels of commercial performance, based upon sales volume and/or promotional effort, during the first
six years
of the collaboration shall constitute a material breach of the Collaboration Agreement. We may terminate the agreement if Takeda challenges or opposes any patent covered by the Collaboration Agreement. At any time prior to August 1, 2023, the parties may mutually agree to terminate the Collaboration Agreement if Japan’s Pharmaceuticals and Medical Devices Agency is unlikely to grant approval of the marketing authorization application in any cancer indication in Japan. After the commercial launch of cabozantinib in Japan, Takeda may terminate the Collaboration Agreement upon twelve months’ prior written notice following the third anniversary of the first commercial sale of cabozantinib in Japan. Upon termination by either party, all licenses granted by us to Takeda will automatically terminate, and the licenses granted by Takeda to us shall survive such termination and shall automatically become worldwide.
105
The following tables summarize the unaudited quarterly financial data for the last two fiscal years (in thousands, except per share data):
|
|
Quarter Ended
|
||||||||||||||
|
December 31,
|
September 30,
|
June 30,
|
March 31,
|
||||||||||||
|
2016:
|
|||||||||||||||
|
Revenues
|
$
|
77,581
|
|
$
|
62,194
|
|
$
|
36,252
|
|
$
|
15,427
|
|
|||
|
Gross profit
|
$
|
50,064
|
|
$
|
40,287
|
|
$
|
30,058
|
|
$
|
8,414
|
|
|||
|
Income (loss) from operations
|
$
|
38,883
|
|
$
|
7,264
|
|
$
|
(25,136
|
)
|
$
|
(49,135
|
)
|
|||
|
Net income (loss)
|
$
|
35,123
|
|
$
|
(11,284
|
)
|
$
|
(34,838
|
)
|
$
|
(59,223
|
)
|
|||
|
Net income (loss) per share, basic and diluted
|
$
|
0.12
|
|
$
|
(0.04
|
)
|
$
|
(0.15
|
)
|
$
|
(0.26
|
)
|
|||
|
2015:
|
|||||||||||||||
|
Revenues
|
$
|
9,938
|
|
$
|
9,854
|
|
$
|
7,992
|
|
$
|
9,388
|
|
|||
|
Gross profit
|
$
|
8,915
|
|
$
|
8,434
|
|
$
|
7,306
|
|
$
|
8,622
|
|
|||
|
Loss from operations
|
$
|
(31,600
|
)
|
$
|
(35,781
|
)
|
$
|
(31,280
|
)
|
$
|
(22,760
|
)
|
|||
|
Net loss
(1)
|
$
|
(41,568
|
)
|
$
|
(45,542
|
)
|
$
|
(41,389
|
)
|
$
|
(33,245
|
)
|
|||
|
Net loss per share, basic and diluted
(1)
|
$
|
(0.18
|
)
|
$
|
(0.21
|
)
|
$
|
(0.21
|
)
|
$
|
(0.17
|
)
|
|||
____________________
|
(1)
|
Prior period balances reflect revisions due to a correction of an immaterial error with regards to the 2019 Notes. The immaterial error resulted in an overstatement of the discount on the 2019 Notes and therefore overstated the related interest expense. Therefore, net loss was overstated by
$2.2 million
,
$2.1 million
,
$2.1 million
,
$2.0 million
,
$2.0 million
,
$1.9 million
for the quarters ended June 30 2016 and March 31, 2016, December 31, 2015, September 30, 2015, June 30 2015 and March 31, 2015, respectively, and net loss per share, basic and diluted was overstated by
$0.01
, for each of those quarters. See “Note 1. Organization and Summary of Significant Accounting Policies - Correction of an Immaterial Error” for additional information on the correction of the immaterial error.
|
The increase in revenues and gross profit for the quarters ended December 31, 2016, September 30, 2016 and June 30, 2016 reflects the impact of the commercial launch of CABOMETYX in late April 2016. Revenues during 2016 also reflect license revenue for the amortization of deferred revenue on the collaboration and license agreement with Ipsen; the deferred revenue for the agreement relates to the upfront payment of
$200.0 million
received in the first quarter of 2016, the
$60.0 million
milestone we achieved upon the approval of cabozantinib by the EC in second-line RCC, and the
$10.0 million
upfront payment received in December 2016 in consideration for the commercialization rights in Canada. Total revenues also include
two
$10.0 million
milestones achieved during the quarter ended
December 31, 2016
for the first commercial sales of CABOMETYX by Ipsen in Germany and the United Kingdom, a
$15.0 million
milestone achieved during the quarter ended September 30, 2016 under our collaboration agreement with Daiichi Sankyo and a
$5.0 million
milestone achieved during the quarter ended March 31, 2016 under our collaboration agreement with Merck. See “Note 2. Collaboration Agreements” for more information on these collaboration agreements.
As described further in “Note 2. Collaboration Agreements - Genentech Collaboration”, in December 2016 Genentech stated that it changed, both retroactively and prospectively, the manner in which it allocates promotional expenses of the Cotellic plus Zelboraf combination therapy. As a result of Genentech’s decision to change its cost allocation approach, we are relieved of our obligation to pay
$18.7 million
of disputed costs that had been accrued by us as of September 30, 2016. We have invoiced Genentech for certain expenses, with interest, that we had previously paid. Accordingly, during the quarter ended December 31, 2016, we offset Selling, general and administrative expenses for a
$23.1 million
recovery of net losses, which had been recorded from 2013 through September 30, 2016, including
$13.3 million
for losses that we had recognized and recorded prior to 2016.
106
|
ITEM 9.
|
CHANGES IN AND DISAGREEMENTS WITH ACCOUNTANTS ON ACCOUNTING AND FINANCIAL DISCLOSURE
|
Not applicable.
ITEM 9A.
CONTROLS AND PROCEDURES
Evaluation of Disclosure Controls and Procedures.
Based on the evaluation of our disclosure controls and procedures (as defined under Rules 13a-15(e) or 15d-15(e) under the Securities Exchange Act of 1934, as amended) required by Rules 13a-15(b) or 15d-15(b) under the Securities Exchange Act of 1934, as amended, our Chief Executive Officer and our Chief Financial Officer have concluded that as of the end of the period covered by this report, our disclosure controls and procedures were effective.
Limitations on the Effectiveness of Controls.
A control system, no matter how well conceived and operated, can provide only reasonable, not absolute, assurance that the objectives of the control system are met. Because of inherent limitations in all control systems, no evaluation of controls can provide absolute assurance that all control issues, if any, within an organization have been detected. Accordingly, our disclosure controls and procedures are designed to provide reasonable, not absolute, assurance that the objectives of our disclosure control system are met and, as set forth above, our principal executive officer and principal financial officer have concluded, based on their evaluation as of the end of the period covered by this report, that our disclosure controls and procedures were effective to provide reasonable assurance that the objectives of our disclosure control system were met.
Management’s Report on Internal Control Over Financial Reporting.
Our management is responsible for establishing and maintaining adequate internal control over financial reporting. Our internal control over financial reporting is a process designed under the supervision of our principal executive and principal financial officers to provide reasonable assurance regarding the reliability of financial reporting and the preparation of our financial statements for external reporting purposes in accordance with U.S. generally accepted accounting principles.
As of the end of our 2016 fiscal year, management conducted an assessment of the effectiveness of our internal control over financial reporting based on the framework established in the original
Internal Control – Integrated Framework
issued by the Committee of Sponsoring Organizations of the Treadway Commission (2013 framework) (COSO). Based on this assessment, management has determined that our internal control over financial reporting as of December 30, 2016 was effective. There were no material weaknesses in internal control over financial reporting identified by management.
Our internal control over financial reporting includes policies and procedures that pertain to the maintenance of records that, in reasonable detail, accurately and fairly reflect transactions and dispositions of assets; provide reasonable assurances that transactions are recorded as necessary to permit preparation of financial statements in accordance with U.S. generally accepted accounting principles, and that receipts and expenditures are being made only in accordance with authorizations of our management and directors; and provide reasonable assurance regarding prevention or timely detection of unauthorized acquisition, use or disposition of our assets that could have a material effect on our financial statements.
The independent registered public accounting firm Ernst & Young LLP has issued an audit report on our internal control over financial reporting, which is included on the following page.
Changes in Internal Control Over Financial Reporting.
There were no changes in our internal control over financial reporting that occurred during our most recent fiscal quarter that have materially affected, or are reasonably likely to materially affect, our internal control over financial reporting.
107
Report of Independent Registered Public Accounting Firm
The Board of Directors and Stockholders of Exelixis, Inc.
We have audited Exelixis, Inc.’s internal control over financial reporting as of
December 30, 2016
, based on criteria established in
Internal Control – Integrated Framework
issued by the Committee of Sponsoring Organizations of the Treadway Commission (2013 framework) (the COSO criteria). Exelixis, Inc.’s management is responsible for maintaining effective internal control over financial reporting, and for its assessment of the effectiveness of internal control over financial reporting included in the accompanying Management’s Report on Internal Control Over Financial Reporting. Our responsibility is to express an opinion on the company’s internal control over financial reporting based on our audit.
We conducted our audit in accordance with the standards of the Public Company Accounting Oversight Board (United States). Those standards require that we plan and perform the audit to obtain reasonable assurance about whether effective internal control over financial reporting was maintained in all material respects. Our audit included obtaining an understanding of internal control over financial reporting, assessing the risk that a material weakness exists, testing and evaluating the design and operating effectiveness of internal control based on the assessed risk, and performing such other procedures as we considered necessary in the circumstances. We believe that our audit provides a reasonable basis for our opinion.
A company’s internal control over financial reporting is a process designed to provide reasonable assurance regarding the reliability of financial reporting and the preparation of financial statements for external purposes in accordance with generally accepted accounting principles. A company’s internal control over financial reporting includes those policies and procedures that (1) pertain to the maintenance of records that, in reasonable detail, accurately and fairly reflect the transactions and dispositions of the assets of the company; (2) provide reasonable assurance that transactions are recorded as necessary to permit preparation of financial statements in accordance with generally accepted accounting principles, and that receipts and expenditures of the company are being made only in accordance with authorizations of management and directors of the company; and (3) provide reasonable assurance regarding prevention or timely detection of unauthorized acquisition, use, or disposition of the company’s assets that could have a material effect on the financial statements.
Because of its inherent limitations, internal control over financial reporting may not prevent or detect misstatements. Also, projections of any evaluation of effectiveness to future periods are subject to the risk that controls may become inadequate because of changes in conditions, or that the degree of compliance with the policies or procedures may deteriorate.
In our opinion, Exelixis, Inc. maintained, in all material respects, effective internal control over financial reporting as of
December 30, 2016
, based on the COSO criteria.
We also have audited, in accordance with the standards of the Public Company Accounting Oversight Board (United States), the consolidated balance sheets of Exelixis, Inc. as of
December 30, 2016
and January 1, 2016, and the related consolidated statements of operations, comprehensive loss, stockholders’ equity (deficit), and cash flows for each of the three fiscal years in the period ended
December 30, 2016
of Exelixis, Inc. and our report dated
February 27, 2017
expressed an unqualified opinion thereon.
/s/ Ernst & Young LLP
Redwood City, California
February 27, 2017
108
|
ITEM 9B.
|
OTHER INFORMATION
|
Not applicable
|
ITEM 10.
|
DIRECTORS, EXECUTIVE OFFICERS AND CORPORATE GOVERNANCE
|
The information required by this item relating to our directors and nominees, including information with respect to our audit committee, audit committee financial experts and procedures by which stockholders may recommend nominees to our board of directors, is incorporated by reference to the section entitled “Proposal 1 –Election of Class III Directors” appearing in our Proxy Statement for our 2017 Annual Meeting of Stockholders to be filed with the Securities and Exchange Commission, or SEC, within 120 days after
December 30, 2016
, which we refer to as our 2017 Proxy Statement. The information required by this item regarding our executive officers is incorporated by reference to the section entitled “Executive Officers” appearing in our 2017 Proxy Statement. The information required by this item regarding compliance with Section 16(a) of the Securities Exchange Act of 1934, as amended, is incorporated by reference to the section entitled “Section 16(a) Beneficial Ownership Reporting Compliance” appearing in our 2017 Proxy Statement.
Code of Ethics
We have adopted a Corporate Code of Conduct that applies to all of our directors, officers and employees, including our principal executive officer, principal financial officer and principal accounting officer. The Corporate Code of Conduct is posted on our website at www.exelixis.com under the caption “Investors & Media -- Corporate Governance.”
We intend to satisfy the disclosure requirement under Item 5.05 of Form 8-K regarding an amendment to, or waiver from, a provision of this Corporate Code of Conduct by posting such information on our website, at the address and location specified above and, to the extent required by the listing standards of the NASDAQ Stock Market, by filing a Current Report on Form 8-K with the SEC, disclosing such information.
|
ITEM 11.
|
EXECUTIVE COMPENSATION
|
The information required by this item is incorporated by reference to the sections entitled “Compensation of Executive Officers,” “Compensation of Directors,” “Compensation Committee Interlocks and Insider Participation” and “Compensation Committee Report” appearing in our 2017 Proxy Statement.
109
|
ITEM 12.
|
SECURITY OWNERSHIP OF CERTAIN BENEFICIAL OWNERS AND MANAGEMENT AND RELATED STOCKHOLDER MATTERS
|
The information required by this item relating to security ownership of certain beneficial owners and management is incorporated by reference to the section entitled “Security Ownership of Certain Beneficial Owners and Management” appearing in our 2017 Proxy Statement.
Equity Compensation Plan Information
The following table provides certain information about our common stock that may be issued upon the exercise of stock options and other rights under all of our existing equity compensation plans as of December 31, 2016, which consists of our 2000 Equity Incentive Plan, or the 2000 Plan, our 2000 Non-Employee Directors’ Stock Option Plan, or the Director Plan, our 2000 Employee Stock Purchase Plan, or the ESPP, our 2011 Equity Incentive Plan, or the 2011 Plan, our 2014 Equity Incentive Plan, or the 2014 Plan, our 2016 Inducement Award Plan, or 2016 Plan and our 401(k) Retirement Plan, or the 401(k) Plan:
|
Plan Category
|
Number of
securities to be issued upon exercise of outstanding
options, warrants and rights
|
Weighted-average exercise price of outstanding
options, warrants and
rights (1)
|
Number of securities remaining available for future issuance under equity compensation plans (excluding securities reflected in column (a))
|
|||||||
|
|
(a)
|
(b)
|
(c)
|
|||||||
|
Equity compensation plans approved by stockholders (2)
|
28,433,956
|
|
$
|
4.84
|
|
5,670,544
|
|
|||
|
Equity compensation plans not approved by stockholders (3)
|
35,500
|
|
$
|
14.91
|
|
1,749,937
|
|
|||
|
Total
|
28,469,456
|
|
$
|
4.86
|
|
7,420,481
|
|
|||
____________________
|
(1)
|
The weighted average exercise price does not take into account the shares subject to outstanding restricted stock units, or RSUs, which have no exercise price.
|
|
(2)
|
Represents shares of our common stock issuable pursuant to the 2000 Plan, the 2011 Plan, the 2014 Plan, the Director Plan and the ESPP.
|
|
(3)
|
Represents shares of our common stock issuable pursuant to the 2016 Plan and 401(k) Plan. We sponsor a 401(k) Plan whereby eligible employees may elect to contribute up to the lesser of 50% of their annual compensation or the statutorily prescribed annual limit allowable under Internal Revenue Service regulations. The 401(k) Plan permits us to make matching contributions on behalf of all participants. We match 100% of the first 3% of participant contributions into the 401(k) Plan in the form of our common stock.
|
|
ITEM 13.
|
CERTAIN RELATIONSHIPS AND RELATED TRANSACTIONS, AND DIRECTOR INDEPENDENCE
|
The information required by this item is incorporated by reference to the sections entitled “Certain Relationships and Related Party Transactions” and “Proposal 1 – Election of Class III Directors” appearing in our 2017 Proxy Statement.
|
ITEM 14.
|
PRINCIPAL ACCOUNTING FEES AND SERVICES
|
The information required by this item is incorporated by reference to the section entitled “Proposal 2 – Ratification of Selection of Independent Registered Public Accounting Firm” appearing in our 2017 Proxy Statement.
110
|
ITEM 15.
|
EXHIBITS, FINANCIAL STATEMENT SCHEDULES
|
|
(a)
|
The following documents are being filed as part of this report:
|
(1) The following financial statements and the Report of Independent Registered Public Accounting Firm are included in Part II, Item 8:
|
|
Page
|
(2) All financial statement schedules are omitted because the information is inapplicable or presented in the Notes to Consolidated Financial Statements.
(3) See Index to Exhibits at the end of this Report, which is incorporated herein by reference. The Exhibits listed in the accompanying Index to Exhibits are filed as part of this report.
|
ITEM 16.
|
FORM 10-K SUMMARY
|
None provided.
111
SIGNATURES
Pursuant to the requirements of Section 13 or 15(d) of the Securities Exchange Act of 1934, the Registrant has duly caused this report to be signed on its behalf by the undersigned, thereunto duly authorized
Date:
February 27, 2017
.
|
E
XELIXIS
, I
NC
.
|
||
|
By:
|
|
/s/ M
ICHAEL
M. M
ORRISSEY
|
|
|
Michael M. Morrissey, Ph.D.
|
|
|
|
President and Chief Executive Officer
|
|
POWER OF ATTORNEY
KNOW ALL PERSONS BY THESE PRESENTS
, that each person whose signature appears below constitutes and appoints
MICHAEL M. MORRISSEY
,
CHRISTOPHER SENNER
and
JEFFREY J. HESSEKIEL
and each or any one of them, his or her true and lawful attorney-in-fact and agent, with full power of substitution and resubstitution, for him or her and in his or her name, place and stead, in any and all capacities, to sign any and all amendments (including post-effective amendments) to this report on Form 10-K, and to file the same, with all exhibits thereto, and other documents in connection therewith, with the Securities and Exchange Commission, granting unto said attorneys-in-fact and agents, and each of them, full power and authority to do and perform each and every act and thing requisite and necessary to be done in connection therewith, as fully to all intents and purposes as he or she might or could do in person, hereby ratifying and confirming all that said attorneys-in-fact and agents, or any of them, or their or his or her substitutes or substitute, may lawfully do or cause to be done by virtue hereof.
Pursuant to the requirements of the Securities Exchange Act of 1934, this report has been signed by the following persons on behalf of the Registrant and in the capacities and on the dates indicated.
|
Signatures
|
Title
|
|
Date
|
|
|
/s/ M
ICHAEL
M. M
ORRISSEY
|
Director, President and
|
|
February 27, 2017
|
|
|
Michael M. Morrissey, Ph.D.
|
Chief Executive Officer (Principal Executive Officer)
|
|||
|
/s/ C
HRISTOPHER
S
ENNER
|
Executive Vice President and Chief Financial Officer
|
|
February 27, 2017
|
|
|
Christopher Senner
|
(Principal Financial and Accounting Officer)
|
|||
|
/s/ S
TELIOS
P
APADOPOULOS
|
Chairman of the Board
|
|
February 27, 2017
|
|
|
Stelios Papadopoulos, Ph.D.
|
||||
|
/s/ C
HARLES
C
OHEN
|
Director
|
|
February 27, 2017
|
|
|
Charles Cohen, Ph.D.
|
||||
|
/s/ C
ARL
B. F
ELDBAUM
|
Director
|
|
February 27, 2017
|
|
|
Carl B. Feldbaum, Esq.
|
||||
|
/s/ A
LAN
M. G
ARBER
|
|
Director
|
|
February 27, 2017
|
|
Alan M. Garber, M.D., Ph.D.
|
||||
112
|
Signatures
|
|
Title
|
|
Date
|
|
/s/ V
INCENT
T. M
ARCHESI
|
|
Director
|
|
February 27, 2017
|
|
Vincent T. Marchesi, M.D., Ph.D.
|
||||
|
/s/ G
EORGE
P
OSTE
|
|
Director
|
|
February 27, 2017
|
|
George Poste, D.V.M., Ph.D.
|
||||
|
/s/ G
EORGE
A. S
CANGOS
|
|
Director
|
|
February 27, 2017
|
|
George A. Scangos, Ph.D.
|
||||
|
/s/ J
ULIE
A. S
MITH
|
|
Director
|
|
February 27, 2017
|
|
Julie A. Smith
|
||||
|
/s/ L
ANCE
W
ILLSEY
|
|
Director
|
|
February 27, 2017
|
|
Lance Willsey, M.D.
|
||||
|
/s/ J
ACK
L. W
YSZOMIERSKI
|
|
Director
|
|
February 27, 2017
|
|
Jack L. Wyszomierski
|
||||
113
INDEX TO EXHIBITS
|
Exhibit
Number
|
Exhibit Description
|
Incorporation by Reference
|
Filed
Herewith
|
|||||||||
|
Form
|
File Number
|
Exhibit/
Appendix
Reference
|
Filing Date
|
|||||||||
|
3.1
|
Amended and Restated Certificate of Incorporation of Exelixis, Inc.
|
10-K
|
000-30235
|
3.1
|
3/10/2010
|
|||||||
|
3.2
|
Certificate of Amendment of Amended and Restated Certificate of Incorporation of Exelixis, Inc.
|
10-K
|
000-30235
|
3.2
|
3/10/2010
|
|||||||
|
3.3
|
Certificate of Amendment of Amended and Restated Certificate of Incorporation of Exelixis, Inc.
|
8-K
|
000-30235
|
3.1
|
5/25/2012
|
|||||||
|
3.4
|
Certificate of Ownership and Merger Merging X-Ceptor Therapeutics, Inc. with and into Exelixis, Inc.
|
8-K
|
000-30235
|
3.2
|
10/15/2014
|
|||||||
|
3.5
|
Certificate of Change of Registered Agent and/or Registered Office of Exelixis, Inc.
|
8-K
|
000-30235
|
3.1
|
10/15/2014
|
|||||||
|
3.6
|
Amended and Restated Bylaws of Exelixis, Inc.
|
8-K
|
000-30235
|
3.1
|
12/5/2011
|
|||||||
|
4.1
|
Specimen Common Stock Certificate.
|
S-1,
as amended
|
333-96335
|
4.1
|
4/7/2000
|
|||||||
|
4.2
|
Amended and Restated Secured Convertible Note dated July 1, 2015 in favor of Deerfield Partners, L.P.
|
10-Q
|
000-30235
|
4.2
|
8/11/2015
|
|||||||
|
4.3
|
Amended and Restated Secured Convertible Note dated July 1, 2015 in favor of Deerfield International Master Fund, L.P.
|
10-Q
|
000-30235
|
4.3
|
8/11/2015
|
|||||||
|
4.4
|
Registration Rights Agreement dated January 22, 2014 by and among Exelixis, Inc., Deerfield Partners, L.P. and Deerfield International Master Fund, L.P.
|
8-K
|
000-30235
|
4.2
|
1/22/2014
|
|||||||
|
4.5
|
Form of Warrant to Purchase Common Stock of Exelixis, Inc. issued to OTA LLC
|
10-Q
|
000-30235
|
4.5
|
11/10/2015
|
|||||||
|
10.1†
|
Form of Indemnity Agreement.
|
S-1,
as amended
|
333-96335
|
10.1
|
3/17/2000
|
|||||||
|
10.2
†
|
2000 Equity Incentive Plan.
|
10-Q
|
000-30235
|
10.1
|
5/3/2007
|
|||||||
|
10.3
†
|
Form of Stock Option Agreement under the 2000 Equity Incentive Plan (early exercise permissible).
|
10-Q
|
000-30235
|
10.2
|
11/8/2004
|
|||||||
|
10.4
†
|
Form of Stock Option Agreement under the 2000 Equity Incentive Plan (early exercise may be restricted).
|
8-K
|
000-30235
|
10.1
|
12/15/2004
|
|||||||
|
10.5
†
|
2000 Non-Employee Directors’ Stock Option Plan.
|
10-K
|
000-30235
|
10.6
|
2/20/2014
|
|||||||
|
10.6
†
|
Form of Stock Option Agreement under the 2000 Non-Employee Directors’ Stock Option Plan.
|
10-K
|
000-30235
|
10.7
|
2/22/2011
|
|||||||
|
10.7
†
|
2000 Employee Stock Purchase Plan.
|
Schedule 14A
|
000-30235
|
A
|
4/13/2016
|
|||||||
|
10.8
†
|
2011 Equity Incentive Plan.
|
8-K
|
000-30235
|
10.1
|
5/24/2011
|
|||||||
114
|
Exhibit
Number
|
Exhibit Description
|
Incorporation by Reference
|
Filed
Herewith
|
|||||||||
|
Form
|
File Number
|
Exhibit/
Appendix
Reference
|
Filing Date
|
|||||||||
|
10.9
†
|
Form of Stock Option Agreement under the 2011 Equity Incentive Plan
|
10-Q
|
000-30235
|
10.3
|
8/4/2011
|
|||||||
|
10.10
†
|
Form of Restricted Stock Unit Agreement under the 2011 Equity Incentive Plan
|
10-Q
|
000-30235
|
10.4
|
8/4/2011
|
|||||||
|
10.11
†
|
Exelixis, Inc. 2014 Equity Incentive Plan
|
8-K
|
000-30235
|
10.1
|
5/29/2014
|
|||||||
|
10.12
†
|
Form of Stock Option Agreement under the Exelixis, Inc. 2014 Equity Incentive Plan
|
10-Q
|
000-30235
|
10.2
|
7/31/2014
|
|||||||
|
10.13
†
|
Form of Stock Option Agreement (International) under the Exelixis, Inc. 2014 Equity Incentive Plan
|
10-Q
|
000-30235
|
10.3
|
7/31/2014
|
|||||||
|
10.14
†
|
Form of Stock Option Agreement (Non-Employee Director) under the Exelixis, Inc. 2014 Equity Incentive Plan
|
10-Q
|
000-30235
|
10.4
|
7/31/2014
|
|||||||
|
10.15
†
|
Form of Restricted Stock Unit Agreement under the Exelixis, Inc. 2014 Equity Incentive Plan
|
10-Q
|
000-30235
|
10.5
|
7/31/2014
|
|||||||
|
10.16
†
|
Form of Restricted Stock Unit Agreement (Non-Employee Director) under the Exelixis, Inc. 2014 Equity Incentive Plan
|
8-K
|
000-30235
|
10.1
|
10/16/2014
|
|||||||
|
10.17
†
|
Non-Employee Director Equity Compensation Policy under the Exelixis, Inc. 2014 Equity Incentive Plan
|
X
|
||||||||||
|
10.18
†
|
Exelixis, Inc. 2016 Inducement Award Plan
|
8-K
|
000-30235
|
10.1
|
11/22/2016
|
|||||||
|
10.19
†
|
Form of Stock Option Agreement under the 2016 Inducement Award Plan
|
8-K
|
000-30235
|
10.2
|
11/22/2016
|
|||||||
|
10.20
†
|
Form of Restricted Stock Unit Agreement under the 2016 Inducement Award Plan
|
8-K
|
000-30235
|
10.2
|
11/22/2016
|
|||||||
|
10.21
†
|
Offer Letter Agreement, dated February 3, 2000, between Michael Morrissey, Ph.D., and Exelixis, Inc.
|
10-Q
|
000-30235
|
10.43
|
8/5/2004
|
|||||||
|
10.22
†
|
Offer Letter Agreement, dated June 30, 2015, between Christopher Senner, and Exelixis, Inc.
|
10-Q
|
000-30235
|
10.5
|
11/10/2015
|
|||||||
|
10.23
†
|
Offer Letter Agreement, dated June 20, 2006, between Exelixis, Inc. and Gisela M. Schwab, M.D.
|
8-K
|
000-30235
|
10.1
|
6/26/2006
|
|||||||
|
10.24
†
|
Offer Letter Agreement, dated February 10, 2014, between Exelixis, Inc. and Jeffrey J. Hessekiel.
|
10-Q
|
000-30235
|
10.4
|
5/1/2014
|
|||||||
|
10.25
†
|
Offer Letter Agreement, dated August 11, 2000, between Exelixis, Inc. and Peter Lamb.
|
10-K
|
000-30235
|
10.24
|
2/29/2016
|
|||||||
|
10.26
†
|
Offer Letter Agreement, dated August 19, 2010, between Exelixis, Inc. and Patrick J. Haley
|
X
|
||||||||||
115
|
Exhibit
Number
|
Exhibit Description
|
Incorporation by Reference
|
Filed
Herewith
|
|||||||||
|
Form
|
File Number
|
Exhibit/
Appendix
Reference
|
Filing Date
|
|||||||||
|
10.27
†
|
Resignation Agreement dated July 22, 2010, by and between Exelixis, Inc. and George A. Scangos
|
10-Q
|
000-30235
|
10.1
|
11/4/2010
|
|||||||
|
10.28
†
|
Compensation Information for Named Executive Officers (2016 cash bonus and 2017 compensation)
|
8-K
|
000-30235
|
|
2/27/2017
|
|||||||
|
10.29
†
|
Compensation Information for Non-Employee Directors.
|
X
|
||||||||||
|
10.30
†
|
Exelixis, Inc. Change in Control and Severance Benefit Plan, as amended and restated.
|
10-Q
|
000-30235
|
10.2
|
10/27/2011
|
|||||||
|
10.31
|
Lease Agreement, dated May 27, 2005, between Exelixis, Inc. and Britannia Pointe Grand Limited Partnership.
|
8-K
|
000-30235
|
10.1
|
5/27/2005
|
|||||||
|
10.32
|
Loan and Security Agreement, dated May 22, 2002, by and between Silicon Valley Bank and Exelixis, Inc.
|
10-Q
|
000-30235
|
10.34
|
8/6/2002
|
|||||||
|
10.33
|
Loan Modification Agreement, dated December 21, 2004, between Silicon Valley Bank and Exelixis, Inc.
|
8-K
|
000-30235
|
10.1
|
12/23/2004
|
|||||||
|
10.34
|
Amendment No. 7, dated December 21, 2006, to the Loan and Security Agreement, dated May 22, 2002, between Silicon Valley Bank and Exelixis, Inc.
|
8-K
|
000-30235
|
10.1
|
12/27/2006
|
|||||||
|
10.35
|
Amendment No. 8, dated December 21, 2007, to the Loan and Security Agreement, dated May 22, 2002, between Silicon Valley Bank and Exelixis, Inc.
|
8-K
|
000-30235
|
10.1
|
12/26/2007
|
|||||||
|
10.36
|
Amendment No. 9, dated December 22, 2009, to the Loan and Security Agreement, dated May 22, 2002, between Silicon Valley Bank and Exelixis, Inc.
|
8-K
|
000-30235
|
10.1
|
12/23/2009
|
|||||||
|
10.37*
|
Amendment No. 10, dated June 2, 2010, to the Loan and Security Agreement, dated May 22, 2002, by and between Silicon Valley Bank and Exelixis, Inc.
|
10-Q
|
000-30235
|
10.3
|
8/5/2010
|
|||||||
|
10.38*
|
Amendment No. 11, dated August 18, 2011, to the Loan and Security Agreement, dated May 22, 2002, by and between Silicon Valley Bank and Exelixis, Inc.
|
10-Q
|
000-30235
|
10.7
|
10/27/2011
|
|||||||
|
10.39
|
Note Purchase Agreement, dated June 2, 2010, by and between Deerfield Private Design Fund, L.P., Deerfield Private Design International, L.P. and Exelixis, Inc.
|
10-Q
|
000-30235
|
10.1
|
8/5/2010
|
|||||||
|
10.40
|
Consent and Amendment dated as of August 6, 2012 to Note Purchase Agreement, dated as of June 2, 2010, between Exelixis, Inc., Deerfield Private Design Fund, L.P. and Deerfield Private Design International, L.P.
|
8-K
|
000-30235
|
10.1
|
8/6/2012
|
|||||||
116
|
Exhibit
Number
|
Exhibit Description
|
Incorporation by Reference
|
Filed
Herewith
|
|||||||||
|
Form
|
File Number
|
Exhibit/
Appendix
Reference
|
Filing Date
|
|||||||||
|
10.41
|
Amendment No. 2 dated as of August 1, 2013 to Note Purchase Agreement, dated as of June 2, 2010, between Exelixis, Inc., Deerfield Private Design Fund, L.P. and Deerfield Private Design International, L.P.
|
10-Q
|
000-30235
|
10.1
|
10/30/2013
|
|||||||
|
10.42
|
Amendment No. 3 dated as of January 22, 2013 to Note Purchase Agreement, dated as of June 2, 2010, by and among Exelixis, Inc., Deerfield Private Design Fund, L.P., Deerfield Private Design International, L.P., Deerfield Partners L.P. and Deerfield International Master Fund, L.P.
|
8-K
|
000-30235
|
10.1
|
1/22/2014
|
|||||||
|
10.43
|
Amendment No. 4 dated as of July 10, 2014 to Note Purchase Agreement, dated as of June 2, 2010, by and among Exelixis, Inc., Deerfield Private Design Fund, L.P., Deerfield Private Design International, L.P., Deerfield Partners L.P. and Deerfield International Master Fund, L.P.
|
10-Q
|
000-30235
|
10.1
|
11/4/2014
|
|||||||
|
10.44
|
Security Agreement, dated July 1, 2010, by and between Deerfield Private Design Fund, L.P., Deerfield Private Design International, L.P. and Exelixis, Inc.
|
10-Q
|
000-30235
|
10.2
|
8/5/2010
|
|||||||
|
10.45**
|
Cooperative Research and Development Agreement for Extramural-PHS Clinical Research by and between The U.S. Department of Health and Human Services, as represented by National Cancer Institute, an Institute, Center, or Division of the National Institutes of Health and Exelixis, Inc. dated October 5, 2011
|
X
|
||||||||||
|
10.46
|
Amendment #1 dated April 16, 2013, to Cooperative Research and Development Agreement for Extramural-PHS Clinical Research by and between The U.S. Department of Health and Human Services, as represented by National Cancer Institute, an Institute, Center, or Division of the National Institutes of Health and Exelixis, Inc. dated October 5, 2011
|
X
|
||||||||||
|
10.47
|
Amendment #2 dated July 18, 2016, to Cooperative Research and Development Agreement for Extramural-PHS Clinical Research by and between The U.S. Department of Health and Human Services, as represented by National Cancer Institute, an Institute, Center, or Division of the National Institutes of Health and Exelixis, Inc. dated October 5, 2011
|
X
|
||||||||||
117
|
Exhibit
Number
|
Exhibit Description
|
Incorporation by Reference
|
Filed
Herewith
|
|||||||||
|
Form
|
File Number
|
Exhibit/
Appendix
Reference
|
Filing Date
|
|||||||||
|
10.48*
|
Collaboration and License Agreement dated February 29, 2016 by and between Exelixis, Inc. and Ipsen Pharma SAS
|
10-Q/A
|
000-30235
|
10.3
|
9/30/2016
|
|||||||
|
10.49**
|
First Amendment dated December 20, 2016, to the Collaboration and License Agreement dated February 29, 2016, by and between Exelixis, Inc. and Ipsen Pharma SAS
|
X
|
||||||||||
|
10.50*
|
Supply Agreement dated February 29, 2016, by and between Exelixis, Inc. and Ipsen Pharma SAS
|
10-Q/A
|
000-30235
|
10.4
|
9/30/2016
|
|||||||
|
10.51**
|
Collaboration Agreement, dated December 22, 2006, between Exelixis, Inc. and Genentech, Inc.
|
X
|
||||||||||
|
10.52**
|
First Amendment, dated March 13, 2008, to the Collaboration Agreement, dated December 22, 2006, between Exelixis, Inc. and Genentech, Inc.
|
X
|
||||||||||
|
10.53
|
Second Amendment, dated April 30, 2010, to the Collaboration Agreement, dated December 22, 2006, between Exelixis, Inc. and Genentech, Inc.
|
10-Q
|
000-30235
|
10.5
|
8/5/2010
|
|||||||
|
12.1
|
Statement Re Computation of Earnings to Fixed Charges
|
X
|
||||||||||
|
21.1
|
Subsidiaries of Exelixis, Inc.
|
X
|
||||||||||
|
23.1
|
Consent of Independent Registered Public Accounting Firm.
|
X
|
||||||||||
|
24.1
|
Power of Attorney (contained on signature page).
|
X
|
||||||||||
|
31.1
|
Certification required by Rule 13a-14(a) or Rule 15d-14(a).
|
X
|
||||||||||
|
31.2
|
Certification required by Rule 13a-14(a) or Rule 15d-14(a).
|
X
|
||||||||||
|
32.1‡
|
Certification by the Chief Executive Officer and the Chief Financial Officer of Exelixis, Inc., as required by Rule 13a-14(b) or 15d-14(b) and Section 1350 of Chapter 63 of Title 18 of the United States Code (18 U.S.C. 1350).
|
X
|
||||||||||
|
101.INS
|
XBRL Instance Document
|
X
|
||||||||||
|
101.SCH
|
XBRL Taxonomy Extension Schema Document
|
X
|
||||||||||
|
101.CAL
|
XBRL Taxonomy Extension Calculation Linkbase Document
|
X
|
||||||||||
|
101.DEF
|
XBRL Taxonomy Extension Definition Linkbase
|
X
|
||||||||||
|
101.LAB
|
XBRL Taxonomy Extension Labels Linkbase Document
|
X
|
||||||||||
|
101.PRE
|
XBRL Taxonomy Extension Presentation Linkbase Document
|
X
|
||||||||||
|
†
|
Management contract or compensatory plan.
|
118
|
*
|
Confidential treatment granted for certain portions of this exhibit.
|
|
**
|
Confidential treatment requested for certain portions of this exhibit.
|
|
‡
|
This certification accompanies this Annual Report on Form 10-K, is not deemed filed with the SEC and is not to be incorporated by reference into any filing of the Company under the Securities Act of 1933, as amended, or the Securities Exchange Act of 1934, as amended (whether made before or after the date of this Annual Report on Form 10-K), irrespective of any general incorporation language contained in such filing.
|
119
TABLE OF CONTENTS
Part IItem 1. BusinessItem 1A. Risk FactorsItem 1B. Unresolved Staff CommentsItem 2. PropertiesItem 3. Legal ProceedingsItem 4. Mine Safety DisclosuresPart IIItem 5. Market For Registrant S Common Equity, Related Stockholder Matters and Issuer Purchases Of Equity SecuritiesItem 6. Selected Financial DataItem 7. Management S Discussion and Analysis Of Financial Condition and Results Of OperationsItem 7A. Quantitative and Qualitative Disclosures About Market RiskItem 8. Financial Statements and Supplementary DataNote 1. Organization and Summary Of Significant Accounting PoliciesNote 2. Collaboration AgreementsNote 3. RestructuringsNote 4. Cash and InvestmentsNote 5. InventoryNote 6. Property and EquipmentNote 7. DebtNote 8. Common Stock and WarrantsNote 9. Fair Value MeasurementsNote 10. Employee Equity and Benefit PlansNote 11. Income TaxesNote 12. Net Loss Per ShareNote 13. CommitmentsNote 14. Concentrations Of Credit RiskNote 15. Subsequent EventNote 16. Quarterly Financial Data (unaudited)Item 9. Changes in and Disagreements with Accountants on Accounting and Financial DisclosureItem 9A. Controls and ProceduresItem 9B. Other InformationPart IIIItem 10. Directors, Executive Officers and Corporate GovernanceItem 11. Executive CompensationItem 12. Security Ownership Of Certain Beneficial Owners and Management and Related Stockholder MattersItem 13. Certain Relationships and Related Transactions, and Director IndependenceItem 14. Principal Accounting Fees and ServicesPart IVItem 15. Exhibits, Financial Statement SchedulesItem 16. Form 10-k SummaryItem 5. 02 Disclosure