EXPEDITORS INTERNATIONAL OF WASHINGTON INC
10-Ks and 10-Qs
|
|
|
|
|
|
|
|
|
|
|
|
|
|
|
|
|
|
|
|
|
|
|
|
|
|
|
|
|
|
|
|
|
|
|
|
|
|
|
|
|
|
|
|
|
|
|
|
|
|
UNITED STATES
SECURITIES AND EXCHANGE COMMISSION
Washington, D.C. 20549
FORM 10-K
(Mark One)
|
Q
|
ANNUAL REPORT PURSUANT TO SECTION 13 OR 15(d) OF THE SECURITIES EXCHANGE ACT OF 1934
|
For the fiscal year ended
December 31, 2016
OR
|
¨
|
TRANSITION REPORT PURSUANT TO SECTION 13 OR 15(d) OF THE SECURITIES EXCHANGE ACT OF 1934
|
For the transition period from
to
Commission File Number: 0-13468
EXPEDITORS INTERNATIONAL OF WASHINGTON, INC.
(Exact name of registrant as specified in its charter)
|
Washington
|
91-1069248
|
|
(State or other jurisdiction of
incorporation or organization)
|
(I.R.S. Employer
Identification Number)
|
|
1015 Third Avenue, 12
th
Floor, Seattle, Washington
|
98104
|
|
(Address of principal executive offices)
|
(Zip Code)
|
(206) 674-3400
(Registrant’s telephone number, including area code)
Securities registered pursuant to Section 12(b) of the Act:
|
Title of each class
|
Name of each exchange on which registered
|
|
|
Common Stock, par value $.01 per share
|
NASDAQ Global Select Market
|
|
Securities registered pursuant to Section 12(g) of the Act: None
Indicate by check mark if the registrant is a well-known seasoned issuer, as defined in Rule 405 of the Securities Act. Yes
ý
No
o
Indicate by check mark if the registrant is not required to file reports pursuant to Section 13 or Section 15(d) of the Act. Yes
o
No
ý
Indicate by check mark whether the registrant (1) has filed all reports required to be filed by Section 13 or 15(d) of the Securities Exchange Act of 1934 during the preceding 12 months (or for such shorter period that the registrant was required to file such reports), and (2) has been subject to such filing requirements for the past 90 days. Yes
ý
No
o
Indicate by check mark whether the registrant has submitted electronically and posted on its corporate Web site, if any, every Interactive Data File required to be submitted and posted pursuant to Rule 405 of Regulation S-T (§232.405 of this chapter) during the preceding 12 months (or for such shorter period that the registrant was required to submit and post such files). Yes
ý
No
o
Indicate by check mark if disclosure of delinquent filers pursuant to Item 405 of Regulation S-K (§229.405 of this chapter) is not contained herein, and will not be contained, to the best of registrant’s knowledge, in definitive proxy or information statements incorporated by reference in Part III of this Form 10-K or any amendment to this Form 10-K.
ý
Indicate by check mark whether the registrant is a large accelerated filer, an accelerated filer, a non-accelerated filer or a smaller reporting company. See the definitions of “large accelerated filer,” “accelerated filer” and “smaller reporting company” in Rule 12b-2 of the Exchange Act. (Check one):
|
Large accelerated filer
|
x
|
|
Accelerated filer
|
o
|
|
|
Non-accelerated filer
|
o
|
(Do not check if a smaller reporting company)
|
|
Smaller reporting company
|
o
|
Indicate by check mark whether the registrant is a shell company (as defined in Rule 12b-2 of the Act). Yes
o
No
ý
The aggregate market value of the registrant’s Common Stock held by non-affiliates of the registrant, based upon the closing price as of the last business day of the most recently completed second fiscal quarter ended June 30,
2016
, was approximately $
8,814,080,920
.
At
February 20, 2017
, the number of shares outstanding of registrant’s Common Stock was
180,120,731
.
DOCUMENTS INCORPORATED BY REFERENCE
Portions of the definitive proxy statement for the Registrant’s
2017
Annual Meeting of Shareholders to be held on
May 2, 2017
are incorporated by reference into Part III of this Form 10-K.
Forward-Looking Statements
In accordance with the provisions of the Private Securities Litigation Reform Act of 1995, the Company is making readers aware that forward-looking statements, because they relate to future events, are by their very nature subject to many important risk factors which could cause actual results to differ materially from those contained in the forward-looking statements. For additional information about forward-looking statements and for an identification of risk factors and their potential significance, see “Safe Harbor for Forward-Looking Statements Under Private Securities Litigation Reform Act of 1995; Certain Cautionary Statements” immediately preceding Part II, Item 7 “Management’s Discussion and Analysis of Financial Condition and Results of Operations” and Item 1A - "Risk Factors" in this report. Forward-looking statements speak only as of the date they were made. The Company undertakes no obligation to update these statements in light of subsequent events or developments.
Overview
Expeditors International of Washington, Inc. (herein referred to as "Expeditors,” the "Company," "we," "us," "our") provides a full suite of global logistics services, offering customers a seamless international network of people and integrated information systems to support the movement and strategic positioning of goods. As a third party logistics provider, we purchase cargo space from carriers (including airlines and ocean shipping lines) on a volume basis and resell that space to our customers. We do not compete for overnight courier or small parcel business and do not own aircraft or ships.
We provide a broad range of customer solutions, such as order management, time-definite transportation, warehousing and distribution, temperature-controlled transit, cargo insurance, and customized logistics solutions. In addition, our Project Cargo unit handles special project shipments that move via a single method or combination of air, ocean, and/or ground transportation and generally require a high level of specialized attention because of the unusual size or nature of what's being shipped.
Expeditors' primary services include:
|
•
|
Airfreight Services
|
|
•
|
Ocean Freight and Ocean Services
|
|
•
|
Customs Brokerage and Other Services
|
Airfreight Services:
Within airfreight, Expeditors typically acts either as a freight consolidator or as an agent for the airline that carries the shipment. Whether acting as a consolidator or agent, we offer our customers routing expertise, familiarity with local business practices, knowledge of export and import documentation and procedures, the ability to arrange for ancillary services and assistance with space availability in periods of high demand.
Solutions within Airfreight Services include:
Air Freight Consolidation:
as an air freight consolidator, Expeditors purchases cargo space from airlines on a volume basis and resells that space to our customers at lower rates than what those customers could negotiate directly from the airlines on an individual shipment. Expeditors determines the routing, consolidates shipments bound for a particular airport distribution point, and then selects the airline for transportation to the distribution point, where either we or one of our agents then arrange for the consolidated lot to be broken down into its component shipments and for the transportation of each individual shipment to its final destination.
Air Freight Forwarding
: as a freight forwarder, Expeditors receives and forwards individual, unconsolidated shipments as the agent of the airline that carries the shipment.
Ocean Freight and Ocean Services:
Within ocean freight services, Expeditors offers three basic services: ocean freight consolidation, direct ocean forwarding, and order management:
Ocean Freight Consolidation:
as an ocean freight consolidator, Expeditors contracts with ocean shipping lines to obtain transportation for a fixed number of containers between various points during a specified time period at an agreed upon rate. We handle both full container loads as well as Less-than Container Load (LCL) freight, charging lower rates than what is available directly from the shipping lines. We also generate fees for ancillary services such as shipping and customs documentation, packing, crating, insurance services, negotiation of letters of credit, and the preparation of documentation to comply with local export laws.
Direct Ocean Forwarding
:
when a customer contracts directly with the ocean carrier, Expeditors acts as that customer’s agent and we may receive a commission from the carrier in addition to customer handling fees.
Order Management
:
Expeditors provides a range of order management services, collecting fees from the shipper in addition to generating fees for meeting specific customer needs. Through Expeditors’ order management, we consolidate cargo from many suppliers in a particular origin into the fewest possible number of containers, putting more product in larger and fewer containers to maximize space and minimize cost.
|
1
.
Customs Brokerage and Other Services:
Expeditors offers a range of custom solutions, including:
Customs Brokerage Services:
Expeditors helps importers clear shipments through customs by preparing required documentation, calculating and paying duties and other taxes on behalf of the importer, arranging for any required inspections by governmental agencies, and arranging for local pickup, storage and delivery. Such services can include review of commercial documentation, assessment of information regarding value, country of origin, special trade programs, and classification. Customs reporting, discrepancy management and other visibility tools help our customers manage their compliance responsibilities globally.
Transcon:
Expeditors Transcon consists of intra-continental ground transportation and delivery services and may be bundled together with domestic air. Transcon also includes value-added, white glove, and time-definite services.
Warehousing and Distribution Services:
Expeditors’ distribution and warehousing services include distribution center management, inventory management, order fulfillment, returns programs and order level services.
Revenues and Net Revenues
The following charts show our
2016
revenues and net revenues (a non-GAAP measure calculated as revenues less directly related operating expenses*) by service type:
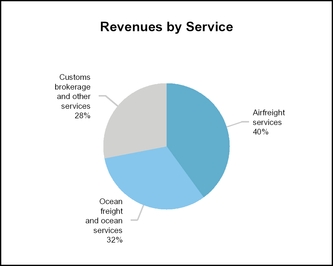
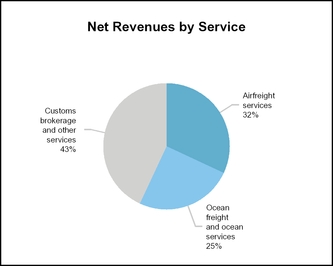
*See Management's Discussion and Analysis for a reconciliation of Net Revenues to Revenues.
The Expeditors Network
Beginning in 1981, Expeditors’ primary business focus was on airfreight shipments from Asia to the United States and related customs brokerage and other services. In the mid-1980’s, we began to expand our service capabilities in airfreight, ocean freight and distribution services. Today Expeditors has approximately 16,000 employees and provides a complete range of global logistics services to a diversified group of customers, both in terms of industry specialization and geographic location. As opportunities for profitable growth arise, we plan to create new offices. While Expeditors has historically expanded through organic growth, we have also been open to growth through acquisition of, or establishing joint ventures with existing agents or others within the industry.
At January 31, 2017, Expeditors, including its majority-owned subsidiaries, is organized functionally in geographic operating segments and operates district offices in the regions identified below. Our district offices have been established in locations where Expeditors maintains unilateral control over assets and operations and where the existence of the parent-subsidiary relationship is maintained by means other than record ownership of voting stock.
Expeditors operates 177 district offices in the following geographic areas of responsibility:
|
•
|
Americas (70)
|
|
•
|
North Asia (21)
|
|
•
|
South Asia (17)
|
|
•
|
Europe (45)
|
|
•
|
Middle East, Africa and India (24)
|
We also maintain branch offices which are aligned with and dependent on one district office. Additionally, we contract with independent agents to provide required services and have established 45 such relationships world-wide.
For information concerning the amount of revenues, net revenues, operating income, identifiable assets, capital expenditures, depreciation and amortization and equity attributable to the geographic areas in which we conduct our business, see Note 10 to the consolidated financial statements.
|
2
.
Our Strategy
In 2016, Expeditors continued executing key strategic initiatives that were developed in late 2014 by our executive team. Those operational initiatives are focused and aligned to achieve long-term earnings growth. The strategic plan is to grow business by focusing on the right markets and, within each market, on the right customers that lead to profitable business growth. Expeditors’ teams are aligned on the specific markets of its focused priorities; on the targeted accounts within those markets; and on ways that we can continue to differentiate ourselves from our competitors. We are continuing our focus on growth based on four key strategic initiatives:
|
1.
|
Ensure that every operating unit's base-line growth strategies for air, ocean and customs services grow at the rate of each unit's (i.e. district or region) relevant market growth rate, and Expeditors' Transcon and Distribution services are expected to maintain higher growth rates.
|
|
2.
|
Align and integrate our European-Asian Pacific and European-North Americas interests to the same degree that our Asian Pacific and Americas interests have historically been aligned. This alignment is expected to result in additional growth in these markets beyond our base-line growth expectations.
|
|
3.
|
Leverage our long and deeply entrenched presence in various Asian export markets - as well as the reputation that we have with the strategic carriers servicing those markets - to create a stronger Asian import presence, while concentrating and enhancing our export capabilities in key strategic lanes, particularly into and out of China and Southeast Asia. We expect this to create additional product growth opportunities in those markets, which have not historically been a particular focus for us.
|
|
4.
|
Expand market share growth and position in North America, traditionally Expeditors’ most strategic market.
|
In addition, in early 2017 we announced the appointment of Philip M. Coughlin to the newly created position of Chief Strategy Officer, effective on February 28 and reporting directly to President and Chief Executive Officer, Jeff Musser. Mr. Coughlin's role is to establish and oversee a core Strategy Group within Expeditors, comprised of current employees with a deep understanding of our products, services and technology, and external individuals with expertise in supply chain management, data and market analysis, and technology. Mr. Coughlin's team will be focused on exploring new avenues for innovation, differentiation and expansion.
Global Logistics and Supply Chain Technology
Expeditors has long believed that it is a competitive advantage to focus on organic growth and to utilize an enterprise technology platform designed and built by logistics technology professionals for logistics professionals. Our technology platform is built on principles of innovation, agility, collaboration, performance and consistency across the Expeditors global network to meet diverse and complex global logistics and supply chain needs. The platform is comprised of proprietary, third party and open source technologies. We utilize a globally consistent infrastructure supporting both centralized and distributed technology strategies that incorporate disaster recovery and high availability.
Expeditors’ technology platform is designed, coded, tested and implemented by the collaborative efforts of our logistics industry and information technology professionals. Internally developing and maintaining technology capabilities is in keeping with Expeditors' long-held belief that it not outsource core functions, with information systems being one of those core functions.
We are not dependent on third parties for developing or enhancing our core technology platforms to address our needs or those of our customers. Expeditors also believes that having a single, uniform, globally-connected platform, driving logistics operations, and providing comprehensive visibility and advanced analytics create greater efficiency and value, particularly as the value of timely data and insights into that data are increasingly important.
Organic Versus Acquired Growth
As a knowledge-based global provider of logistics services, we have often concluded over the course of our history that it is better to grow organically rather than by acquisition. When we have made acquisitions, it has generally been to obtain technology, geographic coverage and specialized industry expertise that could be leveraged to benefit our entire network. Nevertheless, despite our history of organic growth, we are not opposed to acquisitions and we will continue to identify and assess desirable acquisitions.
|
3
.
Tailored Solutions and Targeted Marketing
As a non-asset based provider, we have considerable flexibility to tailor customer-specific solutions based on a customer’s needs. By understanding a customer's logistics processes and goals, we are able to identify opportunities for improvement, and are able to deploy relevant services and solutions for that customer. These services include all modes of cargo transportation, customs brokerage, warehousing and distribution, and order management. Expeditors' core services are further supported by our expertise in providing industry-specific solutions, supply chain analysis and optimization, cargo insurance, cargo security, and solutions for oversized and heavy lift freight. We offer these services across the globe on a single technology platform, in conjunction with consistent and efficient operations and processes that adhere to the highest standards of compliance.
Because Expeditors is in the business of optimizing customer logistics and supply chains, we focus our marketing strategy and efforts on professionals in logistics and supply chain management roles. While we drive our strategic marketing at a global level, district management of each office is responsible for its own business development, operations, and service execution. All employees are responsible for customer service and retention.
Leveraging Global, Regional and Local Expertise
Expeditors defines strategy, processes, technology and compliance that are supported and executed at all levels with dedicated account management personnel coupled with regional and local expertise. We staff our districts principally with managers and other key personnel who are citizens of the nations in which they operate and who have extensive experience in global logistics. District managers and their staff are responsible for selling Expeditors' services directly to customers and prospects who may select or influence the selection of logistics service providers and for ensuring that customers receive timely and efficient services. We believe that this regional and local expertise in supply chain solutions, tailored to the needs of our customers, our emphasis on exceptional customer service along with our incentive-based compensation program that rewards employees based on the performance of the operations they control, have been important elements of our success.
We believe this balanced approach between corporate, regional, and local expertise enables us to supply solutions customized to the needs of our customers.
What Expeditors Ships
The goods that Expeditors handles are generally a function of the products that dominate international trade between any particular origin and destination. These goods include products from multiple industries, including electronics, high technology, healthcare, aerospace and aviation, manufacturing, oil and energy, automotive, retail and fashion. In order to meet customers' complex and industry specific demands, we utilize industry vertical teams throughout our network to focus on providing solutions in different industries. Industry vertical teams work closely with our regional and district resources to grow our business. No single customer accounts for five percent or more of our net revenues.
Expeditors Services in Detail
The following describes in more detail the operations of each of Expeditors’ services:
Airfreight Services
Airfreight services accounted for approximately 40, 41 and 42 percent of Expeditors' total revenues and
32
,
34
and
34
percent of total net revenues in 2016, 2015 and 2014, respectively. When performing airfreight services, we typically act either as a freight consolidator or as an agent for the airline that carries the shipment. When acting as a freight consolidator, we purchase cargo space from airlines on a volume basis and resell that space to our customers at lower rates than they could obtain directly from airlines on an individual shipment. We then issue a House Airway Bill (HAWB) to our customers as the contract of carriage and, separately, we receive a Master Airway Bill from the airline when the freight is physically tendered. When moving shipments between points where the nature or volume of business does not facilitate consolidation, we receive and forward individual shipments as the agent of the airline that carries the shipment. Whether acting as a consolidator or agent, we offer our customers expertise for optimum routing, familiarity with local business practices, knowledge of export and import documentation and procedures, the ability to arrange for ancillary services, and assistance with space availability in periods of high demand.
In our airfreight operations, we receive shipments from our customers, determine the routing, consolidate shipments bound for a particular airport distribution point, and select the airline for transportation to the distribution point. At the distribution point, either we or an Expeditors' agent arranges for the consolidated lot to be broken down into its component shipments and for the transportation of the individual shipments to their final destinations.
We estimate that our average airfreight consolidation weighs approximately 2,800 pounds and that a typical consolidation includes merchandise from several shippers. Because shipment by air is relatively expensive compared with ocean transportation, air shipments are generally characterized by a high value-to-weight ratio, the need for rapid delivery, or both.
At the origin, Expeditors typically delivers shipments from one of our warehouses to the airline after consolidating the freight into containers or onto pallets. Normally that shipment will then arrive at the destination distribution point within forty-eight hours from the point of origin. During periods of high demand, cargo space available from the scheduled air carriers can be limited and backlogs of freight shipments may occur. When these conditions exist, we may charter aircraft to meet customer demand.
Expeditors consolidates individual shipments based on weight and volume characteristics in cost-effective combinations. Typically, as the weight or volume of a shipment increases, the cost that we charge per pound/kilo or cubic inch/centimeter decreases. The rates charged by airlines also generally decrease as the weight or volume of the shipment increases. As a result, by aggregating shipments and presenting them to an airline as a single shipment, we are able to obtain a lower rate per pound/kilo or cubic inch/centimeter than what is charged for an individual shipment, while generally offering the customer a lower rate than could be obtained from the airline for an unconsolidated shipment.
Our airfreight net revenues for a consolidated shipment include the differential between the rate that the airline charges Expeditors and the rate that we, in turn, charge our customers, in addition to commissions that the airline pays us and fees that we charge for ancillary services. Such ancillary services we provide include preparation of shipping and customs documentation, packing, crating, insurance services, negotiation of letters of credit, and the preparation of documentation to comply with local export laws. When Expeditors acts as an agent for an airline handling an unconsolidated shipment, our net revenues are derived primarily from airline commissions and customer fees for ancillary services.
|
4
.
Expeditors' management believes that owning aircraft would subject us to undue business risks, including large capital outlays, increased fixed operating expenses, volatile fuel prices, problems of fully utilizing aircraft and competition with our service providers - the airlines. Because we rely on commercial airlines to transport our shipments, our business may be adversely affected by changes in carrier financial stability, policies and practices such as pricing, payment terms, scheduling, capacity and frequency of service.
Although airline profitability has improved over the last two years, many air carriers remain highly leveraged with debt. Carriers continue to merge and consolidate operations and reduce available capacity to improve financial results. Some airlines have significantly reduced their reliance on cargo-only aircraft to service their airfreight customers, as high technology consumer products companies continue to decrease the size and weight of shipments, and many Expeditors' customers are focused on improving supply-chain efficiency, reducing overall logistics costs by negotiating lower rates and utilizing ocean freight whenever possible. The reduction in capacity allows asset-based carriers to raise rates in the face of declining or stable demand. When fewer planes are flying, Expeditors has fewer shipping options from which to craft service offerings for our customers. The combination of reduced capacity, higher rates and less frequent flights could challenge our ability to maintain historical unitary profitability.
In 2015, airfreight customers continued to seek reductions in rates related to lower fuel prices. That trend persisted in 2016, along with carriers incorporating the lower fuel rates into their pricing structures. There continues to be uncertainty as to how future buy rates will be impacted by continuing volatility in fuel prices due to a number of factors. Because fuel is an integral part of carriers' costs and impacts Expeditors' buy and sell rates, we would expect our airfreight revenues and costs to be impacted as carriers adjust rates for the impact of changing fuel prices. However, other than temporary impacts as buy and sell rates adjust to changes, we would not expect an adverse effect on airfreight net revenues resulting from any future movements in fuel prices.
Ocean Freight and Ocean Services
Ocean freight services accounted for approximately 32, 33 and 33 percent of Expeditors' total revenues and
25
,
25
and
23
percent of total net revenues in 2016, 2015 and 2014, respectively. We operate Expeditors International Ocean, Inc. (EIO), an Ocean Transportation Intermediary, sometimes referred to as a Non-Vessel Operating Common Carrier (NVOCC), which specializes in ocean freight services in most major trade lanes in the world. EIO also provides service, on a smaller scale, to and from any location where we have an office or an agent. Ocean freight services are comprised of three basic services: ocean freight consolidation (EIO), direct ocean forwarding and order management.
Ocean freight consolidation
:
As an NVOCC, EIO contracts with ocean shipping lines to obtain transportation for a fixed number of containers between various points during a specified time period at an agreed rate. EIO provides full container load services to companies that need flexibility and access to vessel capacity that they may not necessarily achieve by dealing directly with the shipping lines. Additionally, EIO supports customers that prefer to supplement their carrier strategy with an NVOCC. EIO also leverages the Expeditors global gateway network for the movement of LCL freight for customers needing to ship smaller consignments via ocean. EIO issues a House Ocean Bill of Lading (HOBL) or a House Seaway Bill to customers as the contract of carriage and receives a separate Master Ocean Bill of Lading (MOBL) when freight is physically tendered. Revenues from fees charged to customers for ancillary services that EIO may provide include the preparation of shipping and customs documentation, packing, crating, insurance services, negotiation of letters of credit, and the preparation of documentation to comply with local export laws.
Direct ocean forwarding
:
When the customer contracts directly with the ocean carrier, EIO acts as an agent of the customer and derives its revenues from commissions paid by the ocean carrier and handling fees paid by the customer. In such arrangements, EIO does not issue a HOBL or House Seaway Bill. Rather, the carrier issues a MOBL directly to the customer who employs EIO to create documentation, manage shipment information and arrange various services to facilitate the shipment of goods. The MOBL shows the customer as the shipper.
Order management
:
Order management provides services that manage origin consolidation, supplier performance, carrier allocation, carrier performance, container management, document management, destination management and PO/SKU visibility through a web-based application. Customers have the ability to monitor and report against near real-time status of purchase orders from the date of creation through final delivery. Item quantities, required ship dates, commodity descriptions, estimated vs. actual ex-factory dates, container utilization, and document visibility are many of the managed functions that are visible and reportable via the web. Order management is available for various modes of transportation, including ocean, air, truck and rail. Order management revenues are derived from services provided to the shipper, as well as management fees associated with managing purchase order execution against customer specific rules. One basic function of order management involves arranging cargo from many suppliers in a particular origin and “consolidating” these shipments into the fewest possible number of containers to maximize space utilization and minimize cost. Through origin consolidation, customers can reduce the number of containers shipped by putting more product in larger and fewer containers.
Ocean carriers have incurred substantial operating losses in recent years, and many are highly leveraged with debt.
These financial challenges have resulted in the 2016 bankruptcy of one of the larger carriers in the market, as well as multiple mergers and acquisitions, as the carriers pursue scale and market share in an effort to reduce operating costs and regain their financial footing. Additionally, while the overall global volumes have increased slightly over recent years, many carriers continue to take delivery of new and larger ships, which has created excess capacity. This excess capacity is at the heart of the carriers' financial challenge as they pursue business at lower rate levels to achieve higher load factors. Consequently, when the market goes through seasonal peaks or any sort of disruption and demand exceeds supply, the carriers react by increasing their pricing as quickly as possible to offset their previous losses. This carrier behavior, along with fluctuations in demand, creates pricing volatility that could impact Expeditors' ability to maintain historical unitary profitability.
Oil prices are reflected in both the buy and sell rates for ocean freight via a surcharge known as the Bunker Adjustment Factor. This surcharge in the industry fluctuates with the cost of the bunker fuel and is added to base ocean freight charges. However, other than temporary impacts as buy and sell rates adjust to changes, Expeditors would not expect an adverse effect on ocean freight net revenues resulting from future movements in oil prices.
|
5
.
Customs Brokerage and Other Services
Customs brokerage and other services accounted for approximately 28, 26 and 25 percent of Expeditors' total revenues and
43
,
41
and
43
percent of total net revenues in 2016, 2015 and 2014, respectively. As a customs broker, we assist importers in clearing shipments through customs by preparing required documentation, calculating and providing for payment of duties and other taxes on behalf of the importer, arranging for any required inspections by governmental agencies, and arranging for delivery. Changing regulations, the commodities being cleared and the time sensitive nature of the brokerage business require that we continuously enhance our systems to provide competitive service. We provide customs clearance services in connection with many of the shipments we handle through our transportation services. However, substantial customs brokerage revenues are derived from customers that elect to use a competitor for transportation services. Conversely, shipments that we handle may be processed by another customs broker selected by the customer.
We also provide other value added services at destination, such as warehousing and distribution, Transcon and consulting services, none of which, individually, are currently significant to our total revenues and net revenues. Expeditors' distribution and warehousing services include distribution center management, inventory management, order fulfillment, returns programs and order level services. Transcon is a multi-modal product, which offers time-definite, intra-continental transportation solutions, often by ground and other specialty handling services. Expeditors' wholly-owned subsidiary, Expeditors Tradewin, L.L.C., responds to customer driven-requests for trade compliance consulting services. Fees for these non-transactional services are based upon hourly billing rates and bids for mutually agreed projects.
Competition
The global logistics services industry is intensely competitive and is expected to remain so for the foreseeable future. There are a large number of companies competing in one or more segments of the industry, but the number of firms with a global network that offer a full complement of logistics services is more limited. Further, there are new technology-based competitors entering the industry. Many of these competitors have significantly more resources than Expeditors. Depending on the location of the shipper and the importer, Expeditors must compete against both the niche players and larger entities. The industry continues to experience consolidations into larger firms striving for stronger and more complete multinational and multi-service networks. However, regional and local competitors still maintain a strong market presence in certain areas.
The primary competitive factors in the global logistics services industry continue to be price and quality of service, including reliability, responsiveness, expertise, convenience, and scope of operations. Expeditors emphasizes quality customer service and believes that our prices are competitive with the prices of others in the industry.
Larger customers utilize the services of multiple logistics providers and implement more sophisticated and efficient procedures for the management of their logistics supply chains by embracing strategies such as just-in-time delivery, network optimization, transportation flow optimization, and process improvement. Accordingly, timely and accurate information integrated into customer service capabilities are a significant factor in attracting and retaining customers. This information integrated into customer service capabilities includes customized Electronic Data Interchange (EDI), online freight tracing and tracking applications, customized reporting, data analytics, and solution modeling/simulation/optimization.
Expeditors' management believes that the ability to develop and deliver innovative solutions to meet our customers’ increasingly sophisticated information requirements is a critical factor in our ongoing success. We devote a significant amount of resources towards the maintenance and enhancement of systems in order to meet these customer demands. Management believes that our existing systems are competitive with the systems currently in use by other logistics services companies with which we compete.
Unlike many of our competitors, who have tended to grow by merger and acquisition, Expeditors operates the same transportation and accounting computer software, running on a common hardware platform, in all of our full-service locations. Small and middle-tier competitors, in general, do not have the resources available to develop these customized systems. Historically, growth through aggressive acquisition has proven to be a challenge for many of our competitors and typically involves the purchase of significant “goodwill.” As a result, Expeditors has pursued a strategy emphasizing organic growth supplemented by certain strategic acquisitions.
Our ability to attract, retain, and motivate highly qualified personnel with experience in global logistics services is an essential, if not the most important, element of Expeditors' ability to compete in the industry. To this end, we have adopted incentive compensation programs that make percentages of an operating unit's net revenues or profits available to managers for distribution among key personnel. We believe that these incentive compensation programs, combined with our experienced personnel and our ability to coordinate global marketing and business development efforts, provide a distinct competitive advantage.
Currency and Dependence on Service Providers
Our worldwide operations require that we transact in a multitude of currencies other than the U.S. dollar. That exposes us to the inherent risks of volatile international currency markets and governmental interference. Some of the countries where we maintain offices and/or have agency relationships maintain strict currency control regulations that influence our ability to hedge foreign currency exposure. We try to compensate for these exposures by accelerating international currency settlements among our offices or agents.
In addition, our ability to provide services to our customers is highly dependent on good working relationships with a variety of entities, including airlines, ocean carrier lines, ground transportation providers and governmental agencies. We use a consistent approach in selecting and managing service providers across all of our product offerings, beginning with a rigorous qualification and risk-based diligence process. We select and engage with best-in-class, compliance-focused, efficiently run, growth-oriented partners, based upon defined value elements and are intentional in our relationship and performance management activity, reinforcing success by awarding service providers who consistently achieve at the highest levels with additional business. We consider our current working relationships with these entities to be satisfactory. However, changes in the financial stability and operating capabilities and capacity of asset-based carriers, space allotments available from carriers, governmental regulation or deregulation efforts, modernization of the regulations governing customs brokerage, and/or changes in governmental restrictions, quota restrictions or trade accords could affect our business in unpredictable ways.
|
6
.
Seasonality
Historically, our operating results have been subject to seasonal trends, with the first quarter being the weakest and the third and fourth quarters being the strongest; however, there is no assurance that this seasonal trend will occur in the future. This pattern has been the result of, or influenced by, numerous factors, including weather patterns, national holidays, consumer demand, new product launches, economic conditions and a myriad of other similar and subtle forces. We cannot accurately forecast many of these factors, nor can we estimate accurately the relative influence of any particular factor and, as a result, there can be no assurance that historical patterns will continue in future periods.
Environmental
In the United States, we are subject to Federal, state and local provisions regulating the discharge of materials and emissions into the environment or otherwise for the protection of the environment. Similar laws apply in many other jurisdictions in which we operate. Although current operations have not been significantly affected by compliance with these environmental laws, governments, service providers and customers are becoming increasingly sensitive to environmental issues, and we cannot predict what impact future environmental regulations may have on our business. We do not anticipate making any material capital expenditures for environmental control purposes during
2017
.
Expeditors is committed to continual improvement in reducing the sum total impact of our operations on the environment. We have over 200 employee-led Green Teams, which cover each of our local district offices and are responsible for projects focused on reducing Expeditors' Scope 1 and Scope 2 emissions (as defined by the Greenhouse Gas Protocol, Scope 1 emissions include all direct greenhouse gas emissions; Scope 2 includes indirect greenhouse gas emission from purchased electricity, heat or steam). We have voluntarily disclosed our Scope 1 and Scope 2 emissions data to the Carbon Disclosure Project since 2010, and we are currently a member of both SmartWay and Transporte Limpio in North America. SmartWay is a voluntary public-private program sponsored by the EPA for tracking, documenting and sharing information about fuel use and freight emissions across supply chains. Transporte Limpio is a similar, voluntary program sponsored by the Mexican government.
Employees
At
December 31, 2016
, Expeditors employed approximately 16,000 people, of which approximately 10,000 were employed in international locations.
Expeditors is a party to collective bargaining agreements with a limited number of employees outside the U.S., and we do not consider these agreements to be material. We consider our employee relations to be satisfactory.
In order to retain the services of highly qualified, experienced, and motivated employees, Expeditors places considerable emphasis on our non-equity incentive compensation programs.
Other Information
Expeditors International of Washington was incorporated in the State of Washington in May 1979. Our executive offices are located at 1015 Third Avenue, 12
th
Floor, Seattle, Washington, and our telephone number is (206) 674-3400.
Our Internet address is
http://www.expeditors.com
. We make available free of charge through our Internet website Expeditors' annual report on Form 10-K, quarterly reports on Form 10-Q, current reports on Form 8-K, and all amendments to those reports as soon as reasonably practicable after such material is electronically filed with or furnished to the Securities and Exchange Commission (SEC). The information contained on or accessible through Expeditors' website is not a part of this Annual Report on Form 10-K.
|
7
.
Executive Officers of the Registrant
The following table sets forth the names, ages, and positions of current executive officers of our company.
|
Name
|
Age
|
Position
|
||
|
Jeffrey S. Musser
|
51
|
President, Chief Executive Officer and Director
|
||
|
Philip M. Coughlin
|
56
|
Senior Vice President and Chief Strategy Officer
|
||
|
Eugene K. Alger
|
56
|
President, Global Services
|
||
|
Daniel R. Wall
|
48
|
President, Global Products
|
||
|
Richard H. Rostan
|
60
|
President, Global Geographies and Operations
|
||
|
Bradley S. Powell
|
56
|
Senior Vice President and Chief Financial Officer
|
||
|
Christopher J. McClincy
|
42
|
Senior Vice President and Chief Information Officer
|
||
|
Benjamin G. Clark
|
48
|
Senior Vice President, General Counsel and Corporate Secretary
|
||
Jeffrey S. Musser joined Expeditors in February 1983 and was promoted to District Manager in October 1989. Mr. Musser was elected to Regional Vice President in September 1999, Senior Vice President-Chief Information Officer in January 2005 and to Executive Vice President and Chief Information Officer in May 2009. On December 19, 2013, Mr. Musser was appointed as President and Chief Executive Officer succeeding Peter J. Rose as Chief Executive Officer effective March 1, 2014 and was elected by the Board of Directors as a director effective March 1, 2014.
Philip M. Coughlin joined Expeditors in October 1985 and was promoted to District Manager in August 1986. Mr. Coughlin was elected Regional Manager in January 1991, Regional Vice President in January 1992, Senior Vice President of North America in September 1999 and to Executive Vice President-North America in March 2008. In June 2014, Mr. Coughlin was promoted to President, Global Geographies and Operations. In January 2017, with an effective date of February 28, 2017, Mr. Coughlin was appointed Senior Vice President and Chief Strategy Officer.
Eugene K. Alger joined Expeditors in October 1981 and was promoted to District Manager in May 1982, Mr. Alger was elected Regional Vice President in January 1992, Senior Vice President of North America in September 1999 and to Executive Vice President-North America in March 2008. In June 2014, Mr. Alger was promoted to Executive Vice President-Global Services. In August 2015, Mr. Alger was promoted to President, Global Services.
Daniel R. Wall joined Expeditors in March 1987, and was promoted to District Manager in May 1992 and Global Director-Account Management in March 2002. Mr. Wall was elected Vice President-ECMS in January 2004 and Senior Vice President-Ocean Services in September 2004. In June 2015, Mr. Wall was appointed as President, Global Products.
Richard H. Rostan joined Expeditors in August 1985 and was promoted to District Manager in March 1987, Regional Vice President in January 1993, Senior Vice President of Global Distribution in July 2012 and Senior Vice President, Americas in January 2015. Mr. Rostan was promoted to Executive Vice President, Americas in July 2015, and in January 2017, with an effective date of February 28, 2017, Mr. Rostan was promoted to President of Global Geographies and Operations.
Bradley S. Powell joined Expeditors as Chief Financial Officer in October 2008 and was elected Senior Vice President and Chief Financial Officer in February 2012. Prior to joining Expeditors, Mr. Powell served as President and Chief Financial Officer of Eden Bioscience Corporation, a publicly-traded biotechnology company, from December 2006 to September 2008 and as Vice President and Chief Financial Officer from July 1998 to December 2006.
Christopher J. McClincy joined Expeditors in July 1998 and was promoted to Vice President - Information Services in April 2009. In February 2014, Mr. McClincy was promoted to Senior Vice President and Chief Information Officer.
Benjamin G. Clark joined Expeditors in February 2015 as Senior Vice President and General Counsel and was appointed Corporate Secretary in May 2015. Preceding Expeditors, Mr. Clark served as Executive Vice President and General Counsel of the Dematic Group, a global provider of intelligent intralogistics and materials handling solutions. Prior to his experience with Dematic, Mr. Clark spent four years as the Vice President and Deputy General Counsel for the publicly traded Celanese Corporation, a global technologies and specialty materials company. From 2002 to 2009 Mr. Clark worked for Honeywell International, Inc., where he held progressively responsible roles concluding as the Vice President and General Counsel, Aerospace Global Operations.
Regulation and Security
With respect to activities in the air transportation industry in the United States, Expeditors is subject to regulation by the Transportation Security Administration (TSA) of the Department of Homeland Security as an indirect air carrier. All United States indirect air carriers are required to maintain prescribed security procedures and are subject to periodic audits by TSA. Our overseas offices and agents are licensed as airfreight forwarders in their respective countries of operation. Each Expeditors office is licensed, or, in the case of our newer offices, we have applied for a license as an airfreight forwarder from the International Air Transport Association (IATA), a voluntary association of airlines and air transport related entities that prescribes certain operating procedures for airfreight forwarders acting as agents for its members. The majority of our airfreight forwarding business is conducted with airlines that are IATA members.
Expeditors is licensed as an Ocean Transportation Intermediary (OTI) (sometimes referred to as an NVOCC) by the Federal Maritime Commission (FMC). The FMC has established certain qualifications for shipping agents, including certain surety bonding requirements. The FMC is also responsible for the economic regulation of OTI/NVOCC activity originating or terminating in the United States. To comply with these economic regulations, vessel operators and NVOCCs, such as EIO, are required to file tariffs electronically, establishing the rates to be charged for the movement of specified commodities into and out of the United States. The FMC has the power to enforce these regulations by assessing penalties.
|
8
.
Expeditors is licensed as a customs broker by the Customs and Border Protection (CBP) agency of the Department of Homeland Security, nationally and in each U.S. customs district in which we do business. All United States customs brokers are required to maintain prescribed records and are subject to periodic audits by CBP. In other jurisdictions in which Expeditors performs customs clearance services, we are licensed by the appropriate governmental authority where such license is required to perform these services. Expeditors participates in various governmental supply chain security programs, such as the Customs-Trade Partnership Against Terrorism (C-TPAT) in the United States, as well as other security initiatives, such as Authorized Economic Operator (AEO) programs, in various other countries.
We do not believe that current United States and foreign governmental regulations impose significant economic restraint upon our business operations. In general, Expeditors conducts business activities in each country through a wholly or majority-owned subsidiary corporation that is organized and existing under the laws of that country. However, the regulations of foreign governments can impose barriers to our ability to provide the full range of our business activities in a wholly or majority United States-owned subsidiary. For example, foreign ownership of a customs brokerage business is prohibited in some jurisdictions and less frequently the ownership of the licenses required for freight forwarding and/or freight consolidation is restricted to local entities. When we encounter this sort of governmental restriction, we work to establish a legal structure that meets the requirements of the local regulations, while also providing the substantive operating and economic advantages that would be available in the absence of such regulation. This can be accomplished by creating a joint venture or exclusive agency relationship with a qualified local entity that holds the required license.
The continuing global threats from terrorism, wars and governments’ overriding concern for the safety of passengers and citizens who import and/or export goods into and out of their respective countries has resulted in a proliferation of cargo security and other regulations over the past several years. Many of these regulations are complex and require varying degrees of interpretation. While these regulations have already created a marked difference in the security and other arrangements required to move shipments around the globe, regulations are expected to become more stringent in the future. As governments look for ways to minimize the exposure of their citizens to potential terror-related incidents, we and our competitors in the transportation business may be required to incorporate security and other procedures within our respective scope of services to a far greater degree than has been required in the past. We believe that increased security and other requirements may involve further investments in technology and more sophisticated screening procedures being applied to cargo, customers, vendors and employees. Expeditors' position is that any increased cost of compliance with security regulations will be passed through to those who are beneficiaries of our services.
Cargo Liability
When acting as an airfreight consolidator, Expeditors assumes a carrier’s liability for lost or damaged shipments. This legal liability is typically limited by contract to the lower of the value of the goods or the released value (19
S
pecial
D
rawing
R
ights per kilo unless the customer declares a higher value and pays a surcharge), except in the absence of an appropriate airway bill. The airline that we utilize to make the actual shipment is generally liable to us in the same manner and to the same extent. When acting solely as the agent of the airline or shipper, we do not assume any contractual liability for loss or damage to shipments tendered to the airline.
When acting as an ocean freight consolidator, Expeditors assumes a carrier’s liability for lost or damaged shipments. This liability is typically limited by contract to the lower of the value of the goods or the released value ($500 per package or customary freight unit unless the customer declares a higher value and pays a surcharge). The ocean carrier that we utilize to make the actual shipment is generally liable to us in the same manner and to the same extent. We do not assume liability for lost or damaged shipments in our ocean freight forwarding and customs clearance operations.
When providing ground transportation services as a carrier, Expeditors assumes a carrier’s liability for lost or damaged shipments. This liability is typically limited by contract to the lower of the value of the goods or the released value (generally $0.50 per pound, although the released value can vary from country to country) unless the customer declares a higher value and pays a surcharge. The ground carrier that we utilize to make the actual shipment is generally liable to us in the same manner and to the same extent.
When providing warehousing and distribution services, our legal liability is limited by contract and tariff to an amount generally equal to the lower of the value of the goods or $0.50 per pound with a maximum of $50 per “lot” — which is defined as the smallest unit that the warehouse is required to track.
In certain circumstances, Expeditors will assume additional limited liability. We maintain cargo legal liability insurance covering claims for losses attributable to missing or damaged shipments for which we are legally liable. Expeditors also maintains insurance coverage for the property of others that is stored in our warehouse facilities. This insurance coverage is provided by a Vermont, U.S.-based insurance entity wholly-owned by Expeditors. The coverage is fronted and reinsured by a global insurance company. The total risk retained by Expeditors in
2016
was $5 million. In addition, we are licensed as an insurance broker through our subsidiary, Expeditors Cargo Insurance Brokers, Inc. and place insurance coverage for other customers.
|
9
.
|
RISK FACTORS
|
|
DISCUSSION AND POTENTIAL SIGNIFICANCE
|
|
International Trade
|
|
Expeditors primarily provides services to customers engaged in international commerce. Everything that affects international trade has the potential to expand or contract our primary market and adversely impact our operating results. For example, international trade is influenced by:
|
|
|
• currency exchange rates and currency control regulations;
|
|
|
|
• interest rate fluctuations;
|
|
|
|
• changes and uncertainties in governmental policies, such as taxation, quota restrictions, other forms of trade barriers and/or restrictions and trade accords;
|
|
|
|
• changes in and application of international and domestic customs, trade and security regulations;
|
|
|
|
• wars, strikes, civil unrest, acts of terrorism, and other conflicts;
|
|
|
• changes in labor and other costs;
|
||
|
|
• natural disasters and pandemics;
|
|
|
|
• changes in consumer attitudes regarding goods made in countries other than their own;
|
|
|
|
• changes in availability of credit;
|
|
|
|
• changes in the price and readily available quantities of oil and other petroleum-related products; and
|
|
|
|
• increased global concerns regarding working conditions and environmental sustainability.
|
|
|
Service Providers
|
|
As a non-asset based provider of global logistics services, Expeditors depends on a variety of asset-based service providers, including air, ocean and ground freight carriers. The quality and profitability of our services depend upon effective selection, management and discipline of service providers. In recent years, many of our service providers have incurred significant operating losses and are highly leveraged with debt, and in 2016 one of the world's largest ocean carriers filed for bankruptcy. Additionally, several ocean carriers have consolidated, with the potential for more to occur in the future. Changes in the financial stability, operating capabilities and capacity of asset-based carriers and space allotment made available to Expeditors by asset-based carriers could affect us in unpredictable ways. Any combination of reduced carrier capacity, pricing volatility or more limited carrier transportation schedules could negatively impact our ability to maintain historical profitability.
Expeditors' carriers are subject to increasingly stringent laws, which could directly or indirectly have a material adverse effect on our business. Future regulatory developments in the U.S. and abroad could adversely affect operations and increase operating costs in transportation industries, which in turn could increase our purchased transportation costs. If we are unable to pass such costs on to our customers, our business and results of operations could be materially adversely affected. |
|
Key Personnel
|
|
Identifying, training and retaining key employees is essential to continued growth and future profitability. Effective succession planning is an important element of our programs. Failure to ensure an effective transfer of knowledge and smooth transitions involving key employees could hinder our ability to execute on our business strategies and level of service. Senior management of Expeditors includes employees with long tenures, some of whom may elect to retire. The loss of the services of one or more key personnel could have an adverse effect on our business. We must continue to develop and retain management personnel to address issues of succession planning.
We believe that our compensation programs, which have been in place since we became a publicly traded entity, are one of the unique characteristics responsible for differentiating our performance from that of many of our competitors. Significant changes to compensation programs could affect our performance and ability to attract and retain key personnel.
|
|
Technology
|
|
Expeditors relies heavily and must compete based upon the flexibility and sophistication of the technologies utilized in performing our core businesses. Future results depend on our success in developing competitive and reliable systems to address the needs of our customers and suppliers. Development and maintenance of these systems must be accomplished in a cost-effective manner and support the use of secure protocols, including integration and availability of third party technology. We are continually enhancing our systems, including significant upgrades to core operating and accounting systems. These efforts are inherently complex and if not managed properly could lead to disruptions in our operations or our ability to remain competitive.
|
|
Network Continuity and Cybersecurity
|
As Expeditors and our customers continue to increase reliance on systems and as additional features are added, the risks also increase. Any significant disruptions to our global systems or the Internet for any reason, which could include equipment or network failures; co-location facility failures; power outages; sabotage; employee error or other actions; cyber-attacks or other security breaches; reliance on third party technology; geo-political activity or natural disasters; all of which could have a material negative effect on our results. This could include loss of revenue; business disruptions (such as the inability to timely process shipments); loss of property, including trade secrets and confidential information; legal claims and proceedings; reporting delays or errors; interference with regulatory reporting; significant remediation costs; an increase in costs to protect our systems and technology; or damage to our reputation.
|
|
|
10
.
|
RISK FACTORS
|
|
DISCUSSION AND POTENTIAL SIGNIFICANCE
|
|
Foreign Operations
|
|
The majority of Expeditors' revenues and operating income comes from operations conducted outside the United States. To maintain a global service network, we may be required to operate in hostile locations and in dangerous situations. Doing business in foreign locations also subjects us to a variety of risks and considerations not normally encountered by domestic enterprises.
In addition, we operate in parts of the world where common business practices could constitute violations of the anti-corruption laws, rules, regulations and decrees of the United States and of other countries in which we conduct business, including the U.S. Foreign Corrupt Practices Act and the UK Bribery Act; as well as trade and exchange control laws, or laws, regulations and Executive Orders imposing embargoes and sanctions; and anti-boycott laws and regulations. Compliance with these laws, rules, regulations and decrees is dependent on our employees, service providers, agents, third party brokers and customers, whose individual actions could violate these laws, rules, regulations and decrees. Failure to comply could result in substantial penalties and additional expenses, damage to our reputation and restrictions on our ability to conduct business.
|
|
Growth
|
|
Expeditors has historically relied primarily upon organic growth and has tended to avoid growth through acquisition. Future results will depend upon our ability to anticipate and adapt to constantly evolving supply chain requirements and innovations. To continue to grow organically, we must gain profitable market share in a highly competitive environment and successfully develop and market new service offerings. When investment opportunities arise, our success could be dependent on our ability to evaluate and integrate acquisitions.
|
|
Regulatory Environment
|
|
Expeditors is affected by ever increasing regulations from a number of sources in the United States and in foreign locations in which we operate. Many of these regulations are complex and require varying degrees of interpretation, including those related to trade compliance, data privacy, employment and competition laws and may result in unforeseen costs.
In reaction to the continuing global terrorist threat, governments around the world are continuously enacting or updating security regulations. These regulations are multi-layered, increasingly technical in nature and characterized by a lack of harmonization of substantive requirements amongst various governmental authorities. Furthermore, the implementation of these regulations, including deadlines and substantive requirements, is driven by political urgencies rather than the industries’ realistic ability to comply.
Failure to consistently and timely comply with these regulations, or the failure, breach or compromise of our policies and procedures or those of our service providers or agents, may result in increased operating costs, damage to our reputation, restrictions on operations or fines and penalties.
|
|
Competition
|
|
The global logistics services industry is intensely competitive and is expected to remain so for the foreseeable future. There are a large number of companies competing in one or more segments of the industry, but the number of firms with a global network that offer a full complement of logistics services is more limited. Nevertheless, many of these competitors have significantly more resources than Expeditors, and are actively pursuing acquisition opportunities and are developing new technologies to gain competitive advantages. Depending on the location of the shipper and the importer, we must compete against both the niche players, larger entities including carriers, and emerging technology companies. The primary competitive factors are price and quality of service. Many larger customers utilize the services of multiple logistics providers. Customers regularly solicit bids from competitors in order to improve service, pricing and contractual terms such as seeking longer payment terms, fixed-price arrangements, higher or unlimited liability limits and performance penalties. Increased competition and competitors' acceptance of expanded contractual terms could result in reduced revenues, reduced margins, higher operating costs or loss of market share, any of which would damage our results of operations and financial condition.
|
|
Taxes
|
|
Expeditors is subject to many taxes in the United States and foreign jurisdictions. In many of these jurisdictions, the tax laws are very complex and are open to different interpretations and application. Tax authorities frequently implement new taxes and change their tax rates and rules, including interpretations of those rules. We are regularly under audit by tax authorities. Although we believe our tax estimates are reasonable, the final determination of tax audits, including transfer pricing inquiries, could be materially different from our tax provisions and accruals and negatively impact our financial results.
|
|
11
.
|
RISK FACTORS
|
|
DISCUSSION AND POTENTIAL SIGNIFICANCE
|
|
Litigation/Investigations
|
|
As a multinational corporation, Expeditors is subject to formal or informal investigations from governmental authorities or others in the countries in which we do business. In addition, we may become subject to civil litigation with our customers, service providers and other parties with whom we do business. These investigations and litigation may require significant management time and could cause us to incur substantial additional legal and related costs, which may include fines, penalties or damages that could have a materially adverse impact on our financial results.
|
|
Economic Conditions
|
|
The global economy and capital and credit markets continue to experience uncertainty and volatility. Unfavorable changes in economic conditions may result in lower freight volumes and adversely affect Expeditors' revenues and operating results, as experienced in 2009 and 2012. These conditions may adversely affect certain of our customers and services providers. Were that to occur, our revenues and net earnings could also be adversely affected. Should our customers’ ability to pay deteriorate, additional bad debts may be incurred.
|
|
Predictability of Results
|
|
Expeditors is not aware of any accurate means of forecasting short-term customer requirements. However, long-term customer satisfaction depends upon our ability to meet these unpredictable short-term customer requirements. Personnel costs, our single largest expense, are always less flexible in the very near term as we must staff to meet uncertain demand. As a result, short-term operating results could be disproportionately affected.
A significant portion of Expeditors' revenues are derived from customers in retail and technology industries whose shipping patterns are tied closely to consumer demand, and from customers in industries whose shipping patterns are dependent upon just-in-time production schedules. Therefore, the timing of our revenues are, to a large degree, impacted by factors out of our control, such as a sudden change in consumer demand for retail goods, product launches and/or manufacturing production delays. Additionally, many customers ship a significant portion of their goods at or near the end of a quarter, and therefore, we may not learn of a shortfall in revenues until late in a quarter. To the extent that a shortfall in revenues or earnings was not expected by securities analysts or investors, any such shortfall from levels predicted by securities analysts or investors could have an immediate and adverse effect on the trading price of our stock.
Volatile market conditions can create situations where rate increases charged by carriers and other service providers are implemented with little or no advance notice. We often times cannot pass these rate increases on to our customers in the same time frame, if at all. As a result, our yields and margins can be negatively impacted, as experienced in 2012 and parts of 2013, 2014 and 2016, particularly with ocean freight.
|
|
Catastrophic Events
|
|
A disruption or failure of Expeditors' systems or operations in the event of a major earthquake, weather event, cyber-attack, terrorist attack, strike, civil unrest, pandemic or other catastrophic event could cause delays in providing services or performing other mission-critical functions. Our corporate headquarters, and certain other critical business operations are in the Seattle, Washington area, which is near major earthquake faults. A catastrophic event that results in the destruction or disruption of any of our critical business or information technology systems could harm our ability to conduct normal business operations and our operating results.
|
|
12
.
Not applicable.
Expeditors owns the following properties:
|
Location
|
|
Nature of Property
|
|
United States:
|
|
|
|
Washington, Seattle
|
|
Corporate headquarters
|
|
California, Brisbane
|
|
Office and warehouse building
|
|
California, Hawthorne
|
|
Office and warehouse building
|
|
Florida, Miami
|
|
Office and warehouse building
|
|
Illinois, Bensenville
|
|
Office and warehouse building
|
|
New Jersey, Edison
|
|
Office and warehouse building
|
|
New York, Inwood
|
|
Office and warehouse building
|
|
Texas, Humble
|
|
Office and warehouse building
|
|
Washington, SeaTac
|
Office building
|
|
|
Washington, Spokane
|
|
Office building
|
|
North Asia:
|
|
|
|
China, Beijing
|
Office and warehouse building
|
|
|
China, Shanghai
|
|
Office building
|
|
China, Shenzhen
|
Offices
|
|
|
China, Tianjin
|
Offices
|
|
|
Hong Kong, Kowloon
|
|
Offices
|
|
Korea, Seoul
|
|
Office and warehouse
|
|
Taiwan, Taipei
|
Offices
|
|
|
Europe:
|
|
|
|
Belgium, Brussels
|
|
Office and warehouse building
|
|
England, London
|
|
Office and warehouse building
|
|
Ireland, Cork
|
|
Office and warehouse building
|
|
Ireland, Dublin
|
|
Office and warehouse building
|
|
Netherlands, Amsterdam
|
Land
|
|
|
Other North America:
|
||
|
Mexico, Nuevo Laredo
|
Land
|
|
|
Latin America:
|
|
|
|
Costa Rica, Alajuela
|
|
Office building
|
|
Middle East:
|
|
|
|
Egypt, Cairo
|
|
Office and warehouse building
|
We lease and maintain approximately 420 locations worldwide, of which approximately 90 are in the United States. These leased locations are primarily located close to an airport, ocean port, or on an important border crossing. The majority of these facilities contain warehouse facilities. Lease terms are either on a month-to-month basis or terminate at various times through 2028. See Note 8 to our consolidated financial statements for lease commitments. We will from time to time investigate the possibility of building or buying suitable facilities. We believe that current leases can be extended and that suitable alternative facilities are available in the vicinity of each present facility should extensions be unavailable at the conclusion of current leases.
|
13
.
Expeditors is involved in claims, lawsuits, government investigations and other legal matters that arise in the ordinary course of business and are subject to inherent uncertainties. Currently, in management's opinion and based upon advice from legal advisors, none of these matters are expected to have a significant effect on our operations, cash flows or financial position. As of
December 31, 2016
, the amounts accrued for these claims, lawsuits, government investigations and other legal matters are not significant to our operations, cash flows or financial position. At this time, we are unable to estimate any additional loss or range of reasonably possible losses, if any, beyond the amounts recorded, that might result from the resolution of these matters.
Not applicable.
Expeditors' common stock trades on The NASDAQ Global Select Market. The following table sets forth the high and low sale prices for our common stock as reported by The NASDAQ Global Select Market under the symbol EXPD.
|
|
Common Stock
|
|
Common Stock
|
|||||||||||||||
|
Quarter
|
High
|
Low
|
Quarter
|
High
|
Low
|
|||||||||||||
|
2016
|
2015
|
|||||||||||||||||
|
First
|
$
|
49.56
|
|
$
|
40.41
|
|
First
|
$
|
49.51
|
|
$
|
42.17
|
|
|||||
|
Second
|
$
|
50.63
|
|
$
|
46.48
|
|
Second
|
$
|
49.11
|
|
$
|
45.27
|
|
|||||
|
Third
|
$
|
52.58
|
|
$
|
48.41
|
|
Third
|
$
|
50.08
|
|
$
|
43.92
|
|
|||||
|
Fourth
|
$
|
56.37
|
|
$
|
47.23
|
|
Fourth
|
$
|
51.80
|
|
$
|
44.73
|
|
|||||
There were 861 shareholders of record as of
February 20, 2017
. This figure does not include a substantially greater number of beneficial holders of our common stock, whose shares are held of record by banks, brokers and other financial institutions.
The Board of Directors declared semi-annual dividends per share during the two most recent fiscal years paid as follows:
|
June 15, 2016
|
$
|
0.40
|
|
|
December 15, 2016
|
$
|
0.40
|
|
|
June 15, 2015
|
$
|
0.36
|
|
|
December 15, 2015
|
$
|
0.36
|
|
ISSUER PURCHASES OF EQUITY SECURITIES
|
Period
|
Total Number
of Shares
Purchased
|
Average Price
Paid per
Share
|
Total Number
of Shares
Purchased as
Publicly
Announced
Plans or
Programs
|
Maximum
Number
of Shares
that
May Yet Be
Purchased
Under the
Plans or
Programs
|
|||||||||
|
October 1-31, 2016
|
—
|
|
$
|
—
|
|
—
|
|
17,310,277
|
|
||||
|
November 1-30, 2016
|
320,106
|
|
$
|
49.54
|
|
320,106
|
|
16,982,782
|
|
||||
|
December 1-31, 2016
|
960,619
|
|
$
|
55.91
|
|
960,619
|
|
16,182,333
|
|
||||
|
Total
|
1,280,725
|
|
$
|
54.31
|
|
1,280,725
|
|
16,182,333
|
|
||||
In November 1993, Expeditors' Board of Directors authorized a Non-Discretionary Stock Repurchase Plan for the purpose of repurchasing our common stock in the open market with the proceeds received from the exercise of stock options. On February 9, 2009, the Plan was amended to increase the authorization to repurchase up to
40 million
shares of our common stock. This authorization has no expiration date. This plan was disclosed in our annual report on Form 10-K filed on March 31, 1995. In the fourth quarter of
2016
, we repurchased
621,240
shares of common stock under the Non-Discretionary Stock Repurchase Plan.
In November 2001, under a Discretionary Stock Repurchase Plan, Expeditors' Board of Directors authorized the repurchase of our common stock in the open market to reduce the issued and outstanding stock down to
200 million
shares. In February 2014, the Board of Directors authorized repurchases down to
190 million
shares of common stock outstanding. In February and August 2015 and May 2016, the Board of Directors further authorized repurchases down to
188 million
,
180 million
and
170 million
, respectively. The maximum number of shares available for repurchase under this plan will increase as the total number of outstanding shares increases. This authorization has no expiration date. In the fourth quarter of
2016
, we repurchased
659,485
shares of common stock under the Discretionary Stock Repurchase Plan. These discretionary repurchases included 159,485 shares that were made to limit the growth in the number of issued and outstanding shares resulting from stock option exercises and 500,000 shares to reduce the number of total shares outstanding.
|
14
.
The graph below compares Expeditors International of Washington, Inc.'s cumulative 5-Year total shareholder return on common stock with the cumulative total returns of the S&P 500 index and the NASDAQ Transportation index. The graph assumes that the value of the investment in our common stock and in each of the indexes (including reinvestment of dividends) was $100 on 12/31/2011 and tracks it through
12/31/2016
.
COMPARISON OF 5-YEAR CUMULATIVE TOTAL RETURN
Among Expeditors International of Washington, Inc., the S&P 500 Index,
and the NASDAQ Transportation Index
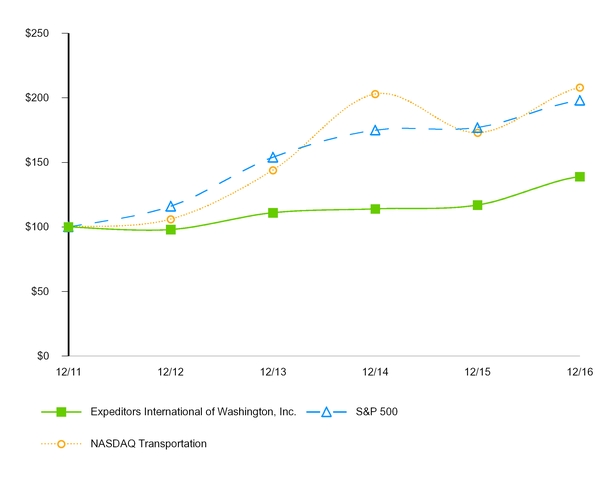
|
12/11
|
|
12/12
|
|
12/13
|
|
12/14
|
|
12/15
|
|
12/16
|
|
||||||||
|
Expeditors International of Washington, Inc.
|
$
|
100.00
|
|
$
|
98.00
|
|
$
|
111.25
|
|
$
|
113.74
|
|
$
|
116.73
|
|
$
|
139.25
|
|
|
|
Standard and Poor's 500 Index
|
100.00
|
|
116.00
|
|
153.58
|
|
174.60
|
|
177.01
|
|
198.18
|
|
|||||||
|
NASDAQ Transportation
|
100.00
|
|
106.01
|
|
143.98
|
|
202.99
|
|
173.16
|
|
207.87
|
|
|||||||
The stock price performance included in this graph is not necessarily indicative of future stock price performance.
|
15
.
Financial Highlights
In thousands, except per share data
|
2016
|
2015
|
2014
|
2013
|
2012
|
||||||||||||
|
Revenues
|
$
|
6,098,037
|
|
6,616,632
|
|
6,564,721
|
|
6,080,257
|
|
5,992,215
|
|
|||||
|
Net revenues
1
|
$
|
2,164,036
|
|
2,187,777
|
|
1,981,427
|
|
1,882,853
|
|
1,835,370
|
|
|||||
|
Net earnings attributable to shareholders
|
$
|
430,807
|
|
457,223
|
|
376,888
|
|
348,526
|
|
333,360
|
|
|||||
|
Diluted earnings attributable to shareholders per share
|
$
|
2.36
|
|
2.40
|
|
1.92
|
|
1.68
|
|
1.57
|
|
|||||
|
Basic earnings attributable to shareholders per share
|
$
|
2.38
|
|
2.42
|
|
1.92
|
|
1.69
|
|
1.58
|
|
|||||
|
Dividends declared and paid per common share
|
$
|
0.80
|
|
0.72
|
|
0.64
|
|
0.60
|
|
0.56
|
|
|||||
|
Cash used for dividends
|
$
|
145,123
|
|
135,673
|
|
124,634
|
|
123,292
|
|
117,263
|
|
|||||
|
Cash used for share repurchases
|
$
|
337,658
|
|
629,991
|
|
550,781
|
|
261,936
|
|
302,414
|
|
|||||
|
Working capital
2
|
$
|
1,288,648
|
|
1,115,136
|
|
1,285,188
|
|
1,526,673
|
|
1,502,939
|
|
|||||
|
Total assets
2
|
$
|
2,790,871
|
|
2,565,577
|
|
2,870,626
|
|
2,996,416
|
|
2,942,023
|
|
|||||
|
Shareholders’ equity
|
$
|
1,844,638
|
|
1,691,993
|
|
1,868,408
|
|
2,084,783
|
|
2,027,699
|
|
|||||
|
Weighted average diluted shares outstanding
|
182,704
|
|
190,223
|
|
196,768
|
|
206,895
|
|
211,935
|
|
||||||
|
Weighted average basic shares outstanding
|
181,282
|
|
188,941
|
|
196,147
|
|
205,995
|
|
210,423
|
|
||||||
_______________________
1
Non-GAAP measure calculated as revenues less directly related operating expenses attributable to our principal services. See Management's Discussion and Analysis for a reconciliation of Net Revenues to Revenues.
2
Adjusted for the reclassification of current deferred tax assets to a reduction of noncurrent deferred tax liabilities pursuant to the adoption of new accounting guidance in 2016.
SAFE HARBOR FOR FORWARD-LOOKING STATEMENTS UNDER PRIVATE SECURITIES LITIGATION REFORM ACT OF 1995; CERTAIN CAUTIONARY STATEMENTS
This Annual Report on Form 10-K for the fiscal year ended
December 31, 2016
contains “forward-looking statements,” as defined in Section 27A of the Securities Act of 1933, as amended, and Section 21E of the Securities Exchange Act of 1934, as amended. From time to time, Expeditors or its representatives have made or may make forward-looking statements, orally or in writing. Such forward-looking statements may be included in, but not limited to, press releases, presentations, oral statements made with the approval of an authorized executive officer or in various filings made by Expeditors with the Securities and Exchange Commission. Statements including those preceded by, followed by or that include the words or phrases “will likely result”, “are expected to”, "would expect", "would not expect", “will continue”, “is anticipated”, “estimate”, “project”, "plan", "believe", "probable", "reasonably possible", "may", "could", "should", "intends", "foreseeable future" or similar expressions are intended to identify “forward-looking statements” within the meaning of the Private Securities Litigation Reform Act of 1995. Such statements are qualified in their entirety by reference to and are accompanied by the discussion in Item 1A of certain important factors that could cause actual results to differ materially from such forward-looking statements.
The risks included in Item 1A are not exhaustive. Furthermore, reference is also made to other sections of this report which include additional factors which could adversely impact Expeditors' business and financial performance. Moreover, Expeditors operates in a very competitive and rapidly changing global environment. New risk factors emerge from time to time and it is not possible for management to predict all of such risk factors, nor can it assess the impact of all of such risk factors on Expeditors' business or the extent to which any factor, or combination of factors, may cause actual results to differ materially from those contained in any forward-looking statements. Accordingly, forward-looking statements cannot be relied upon as a guarantee of actual results.
Shareholders should be aware that while Expeditors does, from time to time, communicate with securities analysts, it is against Expeditors' policy to disclose to such analysts any material non-public information or other confidential commercial information. Accordingly, shareholders should not assume that Expeditors agrees with any statement or report issued by any analyst irrespective of the content of such statement or report. Furthermore, Expeditors has a policy against issuing financial forecasts or projections or confirming the accuracy of forecasts or projections issued by others. Accordingly, to the extent that reports issued by securities analysts contain any projections, forecasts or opinions, such reports are not the responsibility of Expeditors.
Overview
Expeditors International of Washington, Inc. is a global logistics company. Our services include air and ocean freight consolidation and forwarding, customs clearance, warehousing and distribution, purchase order management, vendor consolidation, time-definite transportation services, cargo insurance and other logistics solutions. We do not compete for overnight courier or small parcel business. As a non-asset based carrier, we do not own or operate transportation assets.
We derive our revenues from three principal sources: 1) airfreight services, 2) ocean freight and ocean services, and 3) customs brokerage and other services. These are the revenue categories presented in our financial statements.
We generate the major portion of our air and ocean freight revenues by purchasing transportation services on a wholesale basis from direct (asset-based) carriers and reselling those services to our customers on a retail basis. The difference between the rate billed to our customers (the sell rate) and the rate we pay to the carrier (the buy rate) is termed “net revenue” (a non-GAAP measure), “yield" or "margin." By consolidating shipments
|
16
.
from multiple customers and concentrating our buying power, we are able to negotiate favorable buy rates from the direct carriers, while at the same time offering lower sell rates than customers would otherwise be able to negotiate themselves. The most significant drivers of changes in gross revenues and related transportation expenses are volume, sell rates and buy rates. Volume has a similar effect on the change in both gross revenues and related transportation expenses in each of our three primary sources of revenue.
In most cases we act as an indirect carrier. When acting as an indirect carrier, we issue a House Airway Bill (HAWB), a House Ocean Bill of Lading (HOBL) or a House Seaway Bill to customers as the contract of carriage. In turn, when the freight is physically tendered to a direct carrier, we receive a contract of carriage known as a Master Airway Bill for airfreight shipments and a Master Ocean Bill of Lading for ocean shipments. In these transactions, we evaluate whether it is appropriate to record the gross or net amount as revenue. Generally, revenue is recorded on a gross basis when we are the primary obligor, are obligated to compensate direct carriers for services performed regardless of whether customers accept the service, have latitude in establishing price, have discretion in selecting the direct carrier, have credit risk or have several but not all of these indicators. Revenue is generally recorded on a net basis where we are not primarily obligated and do not have latitude in establishing prices. Such amounts earned are determined using a fixed fee, a per unit of activity fee or a combination thereof.
For revenues earned in other capacities, for instance, when we do not issue a HAWB, a HOBL, or a House Seaway Bill or otherwise act solely as an agent for the shipper, only the commissions and fees earned for such services are included in revenues. In these transactions, we are not a principal and report only commissions and fees earned in revenue.
Customs brokerage and other services involves providing services at destination, such as helping customers clear shipments through customs by preparing and filing required documentation, calculating and providing for payment of duties and other taxes on behalf of customers as well as arranging for any required inspections by governmental agencies, and arranging for delivery. These are complicated functions requiring technical knowledge of customs rules and regulations in the multitude of countries in which we have offices.
We manage our company along five geographic areas of responsibility: Americas; North Asia; South Asia; Europe; and Middle East, Africa and India (MAIR). Each area is divided into sub-regions which are composed of operating units with individual profit and loss responsibility. Our business involves shipments between operating units and typically touches more than one geographic area. The nature of the international logistics business necessitates a high degree of communication and cooperation among operating units. Because of this inter-relationship between operating units, it is very difficult to examine any one geographic area and draw meaningful conclusions as to its contribution to our overall success on a stand-alone basis. The following chart shows net revenues by geographic areas of responsibility for the years ended
December 31, 2016
,
2015
and
2014
:
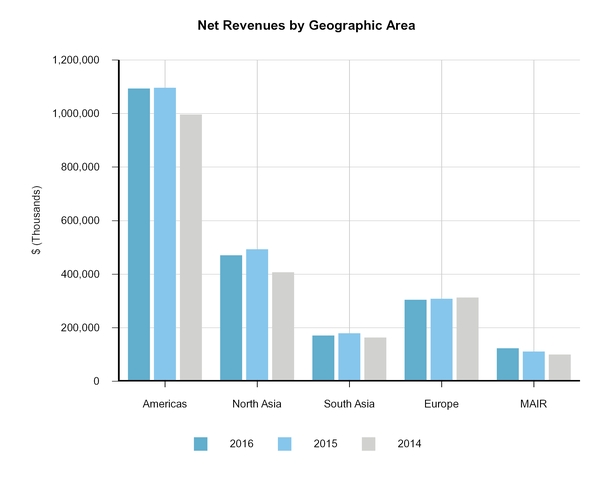
Our operating units share revenue using the same arms-length pricing methodologies that we use when our offices transact business with independent agents. Certain costs are allocated among the segments based on the relative value of the underlying services, which can include allocation based on actual costs incurred or estimated cost plus a profit margin. Our strategy closely links compensation with operating unit profitability. Individual success is closely linked to cooperation with other operating units within our network.
|
17
.
The mix of services varies by segment based primarily on the import or export orientation of local operations in each of our regions. In accordance with our revenue recognition policy (see Note 1. E to the consolidated financial statements of this report), almost all freight revenues and related expenses are recorded at origin and shipment profits are split between origin and destination offices by recording a commission fee or profit share revenue at destination and a corresponding commission or profit share expense as a component of origin consolidation costs.
North Asia is our largest export oriented region and accounted for
37%
of revenues,
22%
of net revenues and
34%
of operating income for the year ended
December 31, 2016
. North Asia's net revenues as a percentage of revenues is lower than other segments due to the largely export nature of operations in that region.
Expeditors' Culture
From the inception of our company, management has believed that the elements required for a successful global service organization can only be assured through recruiting, training, and ultimately retaining superior personnel. We believe that our greatest challenge is now and always has been perpetuating a consistent global corporate culture which demands:
|
•
|
Total dedication, first and foremost, to providing superior customer service;
|
|
•
|
Compliance with our policies and procedures and government regulations;
|
|
•
|
Aggressive marketing of all of our service offerings;
|
|
•
|
Ongoing development of key employees and management personnel via formal and informal means;
|
|
•
|
Creation of unlimited advancement opportunities for employees dedicated to hard work, personal growth and continuous improvement;
|
|
•
|
Individual commitment to the identification and mentoring of successors for every key position so that when inevitable change occurs, a qualified and well-trained internal candidate is ready to step forward; and
|
|
•
|
Continuous identification, design and implementation of system solutions and differentiated service offerings, both technological and otherwise, to meet and exceed the needs of our customers while simultaneously delivering tools to make our employees more efficient and more effective.
|
We reinforce these values with a compensation system that rewards employees for profitably managing the things they can control. This compensation system has been in place since we became a publicly traded company. There is no limit to how much a key, non-executive manager can be compensated for success. We believe in a “real world” environment where the employees of our operating units are held accountable for the profit implications of their decisions. If these decisions result in operating losses, management generally must make up these losses with future operating profits, in the aggregate, before any cash incentive compensation can be earned. Executive management, in limited circumstances, makes exceptions at the branch operating unit level. At the same time, our policies, processes and relevant training focus on such things as cargo management, risk mitigation, compliance, accounts receivable collection, cash flow and credit soundness in an attempt to help managers avoid the kinds of errors that might end a career.
We believe that failure to perpetuate our unique culture on a self-sustained basis throughout our organization quite possibly provides a greater threat to our continued success than any external force, which likely would be largely beyond our control. We strongly believe that it is nearly impossible to predict events that, individually or in the aggregate, could have a positive or a negative impact on our future operations. As a result, management's focus is on building and maintaining a global corporate culture and an environment where well-trained employees and managers are prepared to identify and react to changes as they develop and thereby help us adapt and thrive as major trends emerge.
Our ability to provide services to customers is highly dependent on good working relationships with a variety of entities including airlines, ocean carriers, ground transportation providers and governmental agencies. The significance of maintaining acceptable working relationships with these entities has gained increased importance as a result of ongoing concern over terrorism, security, changes in governmental regulation and oversight of international trade. A good reputation helps to develop practical working understandings that will assist in meeting security requirements while minimizing potential international trade obstacles, especially as governments promulgate new regulations and increase oversight and enforcement of new and existing laws. We consider our current working relationships with these entities to be satisfactory.
Our business is also highly dependent on the financial stability and operational capabilities of the carriers we utilize. Over the last two years, airline profitability has improved, although many air carriers remain highly leveraged with debt. Moreover, the ocean carrier industry has incurred substantial losses in recent years, many carriers are highly leveraged with debt and certain carriers are facing significant liquidity challenges, such as those that led to the bankruptcy filing of a large ocean carrier that occurred in August 2016. This situation requires that we be selective in determining which carriers to utilize. Further changes in the financial stability, operating capabilities and capacity of asset-based carriers, space allotments available from carriers, governmental regulations, and/or trade accords could adversely affect our business in unpredictable ways.
International Trade and Competition
We operate in over 60 countries in the competitive global logistics industry and our activities are closely tied to the global economy. International trade is influenced by many factors, including economic and political conditions in the United States and abroad, currency exchange rates, and laws and policies relating to tariffs, trade restrictions, foreign investments and taxation. Periodically, governments consider a variety of changes to current tariffs and trade restrictions and accords. We cannot predict which, if any, of these proposals may be adopted, or the effects the adoption of any such proposal will have on our business. Doing business in foreign locations also subjects us to a variety of risks and considerations not normally encountered by domestic enterprises. In addition to being influenced by governmental policies concerning international trade, our business may also be negatively affected by recent political developments and changes in government personnel or policies in the United States and other countries, as well as economic turbulence, political unrest and security concerns in the nations in which we conduct business and the future impact that these events may have on international trade and oil prices.
The global logistics services industry is intensely competitive and is expected to remain so for the foreseeable future. Consistent with continuing uncertainty in global trade and economic conditions, concerns over volatile fuel costs, disruptions in port services, political unrest and fluctuating
|
18
.
currency exchange rates, our pricing and terms continue to be pressured by customers, carriers and service providers. We expect these operating and competitive conditions to continue.
Ocean carriers have incurred substantial operating losses in recent years, and many are highly leveraged with debt.
These financial challenges have resulted in the 2016 bankruptcy of one of the larger carriers in the market, as well as multiple mergers and acquisitions, as the carriers pursue scale and market share in an effort to reduce operating costs and improve their financial results. Additionally, while the overall global volumes have increased slightly over recent years, many carriers continue to take delivery of new and larger ships, which has created excess capacity. Consequently, when the market experiences seasonal peaks or any sort of disruption, the carriers react by increasing their pricing as quickly as possible. This carrier behavior creates pricing volatility that could impact Expeditors' ability to maintain historical unitary profitability.
There is uncertainty as to how changes in oil prices will impact future buy rates. Because fuel is an integral part of carriers' costs and impacts both our cargo space buy rates and sell rates to customers, we would expect our gross revenues and costs to be impacted as carriers adjust rates for the effect of changing fuel prices. However, other than temporary impacts as buy and sell rates adjust to change, we would not expect an adverse effect on net revenues resulting from future movements in oil prices.
The global economic environment and trade growth remain uncertain. We cannot predict what impact this may have on our operating results, freight volumes, pricing, changes in consumer demand, carrier stability and capacity, customers’ abilities to pay or on changes in competitors' behavior. Additionally, we cannot predict the direct or indirect impact that changes in consumer purchasing behavior, such as on-line shopping, could have on our business.
Critical Accounting Estimates
A summary of our significant accounting policies can be found in Note 1 to the consolidated financial statements in this report.
Management believes that the nature of our business is such that there are few complex challenges in accounting for operations. While judgments and estimates are a necessary component of any system of accounting, the use of estimates is limited primarily to the following areas:
|
•
|
accounts receivable valuation;
|
|
•
|
accrual of costs related to ancillary services we provide;
|
|
•
|
accrual of insurance liabilities for the portion of the related exposure which we have self-insured;
|
|
•
|
accrual of various tax liabilities;
|
|
•
|
accrual of loss contingencies; and
|
|
•
|
calculation of stock-based compensation expense.
|
These estimates, other than the accrual of loss contingencies, tax liabilities and calculation of stock-based compensation expense, are not highly uncertain and have not historically been subject to significant change. Management believes that the methods utilized in all of these areas are non-aggressive in approach and consistent in application. Management believes that there are limited, if any, alternative accounting principles or methods which could be applied to these transactions. While the use of estimates means that actual future results may be different from those contemplated by the estimates, management believes that alternative principles and methods used for making such estimates would not produce materially different results than those reported.
The outcomes of government investigations, legal proceedings and claims brought against us are subject to significant uncertainty. An estimated loss from a contingency such as a government investigation, legal proceeding or claim is accrued by a charge to income if it is probable that an asset has been impaired or a liability has been incurred and the amount of the loss can be reasonably estimated. Disclosure of a loss contingency is required if there is at least a reasonable possibility that a significant loss has been incurred. In determining whether a loss should be accrued, management evaluates several factors, including advice from outside legal counsel, in order to estimate the degree of probability of an unfavorable outcome and to make a reasonable estimate of the amount of loss or range of reasonably possible loss. Changes in these factors could have a material impact on our financial position, results of operations and operating cash flows for any particular quarter or year.
We are subject to taxation in multiple U.S. and foreign tax jurisdictions. As discussed in Note 1.F to the consolidated financial statements in this report, the earnings of our foreign subsidiaries are not considered to be indefinitely reinvested outside of the United States and, accordingly, U.S. Federal and State income taxes are provided for all undistributed earnings net of related foreign tax credits. Accounting for income taxes involves estimates and judgments. Management believes our tax positions, including intercompany transfer pricing policies, are reasonable and consistent. As a matter of course, Expeditors is audited by various taxing authorities, and sometimes these audits result in proposed assessments where the ultimate resolution could result in additional tax payments being required. We establish liabilities when, despite our belief that the tax return positions are appropriate and consistent with tax law, we conclude that we may not be successful in realizing the tax benefit. In evaluating a tax position, we determine whether it is more likely than not that the position will be sustained upon examination, including resolution of any related appeals or litigation processes, based on the technical merits of the position and in consultation with qualified tax advisors. Our estimate of any ultimate tax liability contains assumptions based on past experiences, judgments about potential actions by taxing jurisdictions as well as judgments about the likely outcome of issues that have been raised by the taxing jurisdiction. We believe the estimates and assumptions used to support the evaluation of our tax positions are reasonable. However, final determinations of tax liabilities could be materially different from estimates.
As described in Note 1.H to the consolidated financial statements in this report, we account for stock-based compensation based on an estimate of the fair value of options granted to employees under our stock option and stock purchase rights plans. This expense, as adjusted for expected forfeitures, is recorded on a straight-line basis over the vesting period.
Determining the appropriate option pricing model to use to estimate stock compensation expense requires judgment. Any option pricing model requires assumptions that are subjective and these assumptions also require judgment. Examples include assumptions about long-term stock price volatility, employee exercise patterns, pre-vesting option forfeitures, post-vesting option terminations, and future interest rates and dividend yields. Historically, we have used the Black-Scholes model for estimating the fair value of stock options.
|
19
.
Management believes that the assumptions used are appropriate based upon our historical and currently expected future experience. Looking to future events, management has been strongly influenced by historical patterns which may not be valid predictors of future developments and any future deviation may be material.
Our expected volatility assumptions are based on the historical volatility of our stock over a period of time commensurate to the expected life. The expected life assumption is primarily based on historical employee exercise patterns and employee post-vesting termination behavior. The risk-free interest rate for the expected term of the option is based on the corresponding yield curve in effect at the time of grant for U.S. Treasury bonds having the same term as the expected life of the option. The expected dividend yield is based on our historical experience. The forfeiture assumption used to calculate compensation expense is primarily based on historical pre-vesting employee forfeiture patterns.
The fair value of an option is more significantly impacted by changes in the expected volatility and expected life assumptions. The pre-vesting forfeitures assumption is ultimately adjusted to the actual forfeiture rate. Therefore, changes in the forfeitures assumption would not impact the total amount of expense ultimately recognized over the vesting period. Different forfeiture assumptions would only impact the timing of expense recognition over the vesting period. Estimated forfeitures are reassessed in subsequent periods and may change based on new facts and circumstances.
Recent Accounting Pronouncements
In March 2016, the Financial Accounting Standards Board (FASB) issued an Accounting Standard Update (ASU) simplifying the accounting for stock compensation. The ASU requires excess tax benefits and deficiencies to be recorded as an income tax expense or benefit in our consolidated statements of earnings when our stock options are exercised or canceled and for disqualifying dispositions of shares issued to employees under our employee stock purchase plan. All tax-related cash flows are required to be reported as operating activities in our consolidated statement of cash flows. We will adopt this ASU on a prospective basis beginning on January 1, 2017. We have elected to continue to estimate forfeitures expected to occur in determining the amount of compensation cost to be recognized in each period. We believe the adoption of this ASU will result in volatility in our effective tax rate and diluted earnings per share due to the recording of all of the tax effects of share-based payments in our consolidated statements of earnings. The volatility in future periods will be dependent upon our stock price, stock option exercise and cancellation activity and the amount of disqualifying dispositions of shares purchased by our employees under our employee stock purchase plan. Had the standard been effective in 2016 and 2015, it would have resulted in $2.7 million of additional tax expense and a $1.1 million tax benefit, respectively.
In May 2014, the FASB issued an ASU amending existing revenue recognition guidance and requiring related detailed disclosures to enable users of financial statements to understand the nature, amount, timing and uncertainty of our revenues and cash flows arising from contracts with customers. This ASU is effective for us beginning on January 1, 2018. We formed a cross-functional project team that is in the process of evaluating the adoption impacts of the ASU for each of our products and services. This process, though underway, is not yet completed and our understanding of the future adoption impacts, including any potential changes related to principal and agent determinations, on our consolidated financial statements and related disclosures of the ASU have not yet been determined. Our project team is also assessing how our current processes and systems may be impacted by adoption. We have yet to decide whether we will adopt under a cumulative effect or retrospective method. At this time, based on the nature of our operations, we do not believe that the adoption of the ASU will have a material impact on the amount or timing of revenue recognized or our revenue recognition policies. However, we have not yet completed our full assessment. We expect to complete our assessment of the impact towards the end of 2017.
In February 2016, the FASB issued an ASU changing the accounting for leases and including a requirement to record all leases on the consolidated balance sheet as assets and liabilities. The ASU will be effective for us beginning on January 1, 2019 and will be adopted using a modified retrospective transition. Adoption of the ASU will impact our consolidated balance sheets as future minimum lease payments under noncancelable leases totaled
$214 million
as of December 31, 2016. We are currently evaluating the full impact that the adoption of this ASU will have on our consolidated financial statements and related disclosures.
Results of Operations
The following table shows the total net revenues (a non-GAAP measure calculated as revenues less directly related operating expenses attributable to our principal services) and our expenses for
2016
,
2015
, and
2014
expressed as percentages of net revenues. Management believes that net revenues are a better measure than total revenues when analyzing and discussing management's effectiveness in managing our principal services since total revenues earned by Expeditors as a freight consolidator include the carriers’ charges to us for carrying the shipment, whereas revenues earned by Expeditors in our other capacities include primarily the commissions and fees actually earned by us. Net revenue is one of our primary operational and financial measures and demonstrates our ability to manage sell rates to customers with our ability to concentrate and leverage our purchasing power through effective consolidation of shipments from multiple customers utilizing a variety of transportation carriers and optimal routings. Using net revenue also provides a commonality for comparison among various services.
|
20
.
The table, chart and the accompanying discussion and analysis should be read in conjunction with the consolidated financial statements and related notes thereto in this report.
|
|
2016
|
2015
|
2014
|
|||||||||||||||||||
|
In thousands
|
Amount
|
Percent
of net
revenues
|
Amount
|
Percent
of net
revenues
|
Amount
|
Percent
of net
revenues
|
||||||||||||||||
|
Airfreight services:
|
||||||||||||||||||||||
|
Revenues
|
$
|
2,453,347
|
|
$
|
2,740,583
|
|
$
|
2,780,840
|
|
|||||||||||||
|
Expenses
|
1,752,167
|
|
1,987,690
|
|
2,103,777
|
|
||||||||||||||||
|
Net revenues
|
701,180
|
|
32
|
%
|
752,893
|
|
34
|
%
|
677,063
|
|
34
|
%
|
||||||||||
|
Ocean freight and ocean services:
|
||||||||||||||||||||||
|
Revenues
|
1,917,494
|
|
2,194,004
|
|
2,174,394
|
|
||||||||||||||||
|
Expenses
|
1,378,699
|
|
1,648,993
|
|
1,712,795
|
|
||||||||||||||||
|
Net revenues
|
538,795
|
|
25
|
|
545,011
|
|
25
|
|
461,599
|
|
23
|
|
||||||||||
|
Customs brokerage and other services:
|
||||||||||||||||||||||
|
Revenues
|
1,727,196
|
|
1,682,045
|
|
1,609,487
|
|
||||||||||||||||
|
Expenses
|
803,135
|
|
792,172
|
|
766,722
|
|
||||||||||||||||
|
Net revenues
|
924,061
|
|
43
|
|
889,873
|
|
41
|
|
842,765
|
|
43
|
|
||||||||||
|
Total net revenues
|
2,164,036
|
|
100
|
|
2,187,777
|
|
100
|
|
1,981,427
|
|
100
|
|
||||||||||
|
Overhead expenses:
|
||||||||||||||||||||||
|
Salaries and related costs
|
1,157,635
|
|
53
|
|
1,143,511
|
|
52
|
|
1,065,329
|
|
54
|
|
||||||||||
|
Other
|
336,238
|
|
16
|
|
322,782
|
|
15
|
|
321,450
|
|
16
|
|
||||||||||
|
Total overhead expenses
|
1,493,873
|
|
69
|
|
1,466,293
|
|
67
|
|
1,386,779
|
|
70
|
|
||||||||||
|
Operating income
|
670,163
|
|
31
|
|
721,484
|
|
33
|
|
594,648
|
|
30
|
|
||||||||||
|
Other income, net
|
16,693
|
|
1
|
|
15,205
|
|
1
|
|
16,241
|
|
1
|
|
||||||||||
|
Earnings before income taxes
|
686,856
|
|
32
|
|
736,689
|
|
34
|
|
610,889
|
|
31
|
|
||||||||||
|
Income tax expense
|
254,323
|
|
12
|
|
277,192
|
|
13
|
|
231,429
|
|
12
|
|
||||||||||
|
Net earnings
|
432,533
|
|
20
|
|
459,497
|
|
21
|
|
379,460
|
|
19
|
|
||||||||||
|
Less net earnings attributable to the noncontrolling interest
|
1,726
|
|
—
|
|
2,274
|
|
—
|
|
2,572
|
|
—
|
|
||||||||||
|
Net earnings attributable to shareholders
|
$
|
430,807
|
|
20
|
%
|
$
|
457,223
|
|
21
|
%
|
$
|
376,888
|
|
19
|
%
|
|||||||
|
21
.
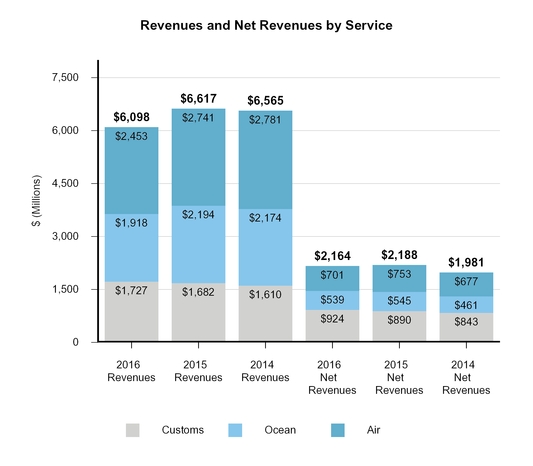
2016
compared with
2015
Airfreight services:
Airfreight services revenues decreased 10% in
2016
, as compared with
2015
, primarily as a result of lowering average sell rates in response to competitive market conditions. The decrease in average sell rates was partially offset by a 3% growth in airfreight tonnage. Airfreight services expenses decreased 12% in
2016
as compared with
2015
, as a result of favorable buying opportunities throughout most regions due primarily to excess available carrier capacity. While not possible to quantify, sell rates and tonnage were favorably impacted in 2015 by customers converting a portion of their ocean freight shipments to airfreight due to port disruptions on the U.S. West Coast.
Airfreight services net revenues in
2016
decreased 7% as compared with
2015
. The decrease was principally due to a 12% decrease in net revenue per kilo, partially offset by a 3% increase in tonnage. Average net revenue per kilo declined in most regions primarily due to competitive market conditions and rapid changes in carrier pricing caused by sporadic increases in demand. North America net revenues decreased by 6% due principally to a 3% decrease in tonnage. North Asia, South Asia and Europe net revenues decreased 10%, 9% and 2%, respectively, despite tonnage increases of 5%, 7% and 3%.
Aside from temporary disruptions such as those experienced with U.S. West Coast ports in 2015, we expect the global airfreight market to continue to be affected by carrier overcapacity and the timing of new product launches. Customers remain focused on improving supply-chain efficiency, reducing overall logistics costs by negotiating lower rates and utilizing ocean freight whenever possible. We expect these trends to continue in conjunction with carriers' efforts to manage available capacity. However, this could be affected by new product launches during periods that have historically experienced higher demands. Historically, we have experienced lower airfreight margins in the fourth quarter as seasonal volumes increase and carriers correspondingly increase buy rates. These events, should they continue to occur, could create a higher degree of volatility in volumes and ultimately buy and sell rates.
Ocean freight and ocean services:
Ocean freight consolidation, direct ocean forwarding and order management are the three basic services that constitute and are collectively referred to as ocean freight and ocean services. Ocean freight and ocean services revenues decreased 13% in
2016
as compared with
2015
, as we continued to lower average sell rates to customers in response to competitive market conditions and lower available buy rates from carriers. Although average sell rates to customers declined, container volumes increased 3%. Ocean freight and ocean services expenses decreased 16% in
2016
as compared with
2015
, due to lower average buy rates, resulting from carrier overcapacity.
Ocean freight and ocean services net revenues decreased 1% in
2016
as compared with
2015
. The largest component of our ocean freight net revenue is derived from ocean freight consolidation, which represented 48% and 50% of ocean freight net revenue in
2016
and
2015
, respectively.
|
22
.
Ocean freight consolidation net revenues decreased 6% in
2016
as compared with
2015
. This decrease was due primarily to an 8% decrease in net revenue per container, partially offset by a 3% increase in volume. During the latter part of the third quarter of 2016, we experienced a spike in average buy rates that began with the bankruptcy of a large ocean carrier on August 31, 2016. Direct ocean freight forwarding net revenues decreased 2% due to lower volumes principally in North America. Order management net revenues increased 11%, mostly resulting from higher volumes with new and existing customers, primarily in North Asia and South Asia.
North America ocean freight and ocean services net revenues decreased 3% in
2016
, as compared with
2015
, primarily due to lower direct ocean forwarding volumes and a decrease in ocean freight consolidation resulting from declining margins on imports. North Asia net revenues decreased 1% as lower margins offset the 1% growth in volume. Europe net revenues decreased 4%, as lower direct ocean forwarding volumes more than offset growth from order management and ocean freight consolidation. South Asia net revenues increased 6% due principally to 4% growth in volumes.
We expect that pricing volatility will continue as customers increasingly solicit bids and carriers react to current market conditions, including carrier liquidity challenges, such as the bankruptcy filing of a large ocean carrier that occurred in August 2016, and realignment of carrier alliances. These conditions could result in lower revenues and yields.
Customs brokerage and other services:
Customs brokerage and other services revenues and expenses increased 3% and 1%, respectively, in
2016
as compared with
2015
, primarily as a result of increased volumes from existing and new road freight customers.
Customs brokerage and other services net revenues increased 4% in
2016
as compared with
2015
, primarily as a result of an increase in road freight volumes. Customers continue to seek out customs brokers with sophisticated computerized capabilities critical to an overall logistics management program, including rapid responses to changes in the regulatory and security environment.
North America net revenues increased 5% in
2016
as compared with
2015
, primarily as a result of higher volumes from existing and new customers in road freight and lower import service costs. North Asia net revenues increased 8% due primarily to growth in import and warehouse and distribution services. Europe net revenues remained constant, as compared with
2015
.
Overhead expenses:
Salaries and related costs increased 1% in
2016
, as compared with
2015
, principally due to an increase in the number of employees, primarily in North America and Europe, partially offset by reduced bonuses from lower operating income.
Historically, the relatively consistent relationship between salaries and net revenues is the result of a compensation philosophy that has been maintained since the inception of our company: offer a modest base salary and the opportunity to share in a fixed and determinable percentage of the operating profit of the business unit controlled by each key employee. Using this compensation model, changes in individual incentive compensation will occur in proportion to changes in our operating income, creating a direct alignment between corporate performance and shareholder interests. Bonuses to field and executive management in
2016
were down 7% as compared with
2015
, primarily as a result of a 7% decrease in operating income. Our management compensation programs have always been incentive-based and performance driven and there is no built-in bias that favors or enriches management in a manner inconsistent with overall corporate performance. Salaries and related costs increased to
53%
of net revenues in 2016 as compared with
52%
in 2015.
Because our management incentive compensation programs are also cumulative, generally no management bonuses can be paid unless the relevant business unit is, from inception, cumulatively profitable. Any operating losses must have been offset in their entirety by operating profits before management is eligible for a bonus. Executive management, in limited circumstances, makes exceptions at the branch operating unit level. Since the most significant portion of management compensation comes from the incentive bonus programs, we believe that this cumulative feature is a disincentive to excessive risk taking by our managers. Due to the nature of our services, it has a short operating cycle. The outcome of any higher risk transactions, such as overriding established credit limits, would be known in a relatively short time frame. Management believes that when the potential and certain impact on the bonus is fully considered in light of this short operating cycle, the potential for short term gains that could be generated by engaging in risky business practices is sufficiently mitigated to discourage excessive and inappropriate risk taking. Management believes that both the stability and the long term growth in revenues, net revenues and net earnings are a result of the incentives inherent in our compensation programs.
Other overhead expenses increased 4% in
2016
, as compared with
2015
. The increase in expenses was primarily due to higher rent and maintenance costs and technology fees, partially offset by lower claims in the current year. Other overhead expenses increased to
16%
of net revenues in
2016
, as compared with
15%
in
2015
.
Income tax expense:
We pay income taxes in the United States and other jurisdictions. Our consolidated effective income tax rate declined slightly to
37.0%
in
2016
, as compared with
37.6%
in
2015
. The decrease in the effective tax rate is principally the result of a higher proportion of our total outstanding stock-based compensation expense being for non-qualified stock option grants. The tax benefit associated with non-qualified stock option grants is recorded when the related compensation expense is recognized while the tax benefit received for incentive stock options and employee stock purchase plan shares cannot be anticipated and are recognized if and when a disqualifying disposition occurs. Our effective tax rate is subject to variation and the effective tax rate can be more or less volatile based on the amount of pre-tax income or loss. For example, the impact of discrete items and non-deductible expenses on the effective tax rate is greater when pre-tax income is lower.
|
23
.
2015
compared with
2014
Airfreight services:
Airfreight services revenues decreased 1% in
2015
, as compared with
2014
, due primarily to lower average sell rates in response to competitive market conditions in North America, Europe and North Asia, partially offset by a 6% growth in tonnage. Airfreight services expenses decreased 6% in
2015
as compared with
2014
, as a result of favorable spot and general market buying opportunities in 2015, partially offset by costs attributable to the increase in tonnage.
Airfreight services net revenues in 2015 increased 11% as compared with 2014. The increase was principally due to a 6% improvement in airfreight tonnage and a 9% increase in net revenue per kilo. North America net revenues increased by 8% due to 4% growth in export tonnage and lower average buy rates from favorable buying opportunities. North Asia net revenues increased 24%. This was also due to favorable buying opportunities in 2015, which resulted in a 19% increase in net revenue per kilo on an 8% improvement in export tonnage. South Asia net revenues increased 27% primarily due to an 11% increase in tonnage and the same buying opportunities in the second half of 2015. Europe net revenues decreased 7% primarily due to a 7% reduction in net revenue per kilo.
Ocean freight and ocean services:
Ocean freight and ocean services revenues increased 1% in 2015 as compared with 2014, as container volumes increased 3% while average sell rates to customers were lower. In the first half of 2014, we implemented sell rate reductions to increase container volume. Beginning in September 2014 and continuing through the first quarter of 2015, we maintained higher average rates in response to overall market conditions. We decreased average sell rates during the last nine months of 2015 in response to lower overall market demand and growth in carrier capacity.
Ocean freight and ocean services expenses decreased 4% in 2015 as compared with 2014, due to favorable market buying opportunities that resulted from a decline in overall market demand coupled with growth in carrier capacity.
Ocean freight and ocean services net revenues increased 18% in 2015 as compared with 2014. In 2015 and 2014, the majority of our ocean freight net revenue was derived from ocean freight consolidation, which represented 50% and 45%, respectively, of ocean freight net revenue.
Ocean freight consolidation net revenues increased 31% in 2015 as compared with 2014. This increase was due primarily to a 27% increase in net revenue per container and a 3% growth in container volume. We changed our pricing strategies, as described above, in the third quarter of 2014, which, combined with favorable market buying opportunities in the last nine months of 2015, led to improved yields.
Direct ocean freight forwarding net revenues increased 8% in 2015, as compared with 2014, as a result of higher volumes, principally in North America, Europe and North Asia. Order management net revenues increased 7% in 2015, as compared with 2014, mostly due to higher volumes from existing customers and new business, primarily in North and South Asia.
North America ocean freight and ocean services net revenues increased 17% in 2015, as compared with 2014, primarily due to improved margins. Europe net revenues increased 16%, primarily due to a 10% improvement in volumes and an increase in direct ocean forwarding. North Asia net revenues increased 21% principally due to improved margins and growth in order management.
Customs brokerage and other services:
Customs brokerage and other services revenues and expenses increased 5% and 3%, respectively, in 2015 as compared with 2014, as a result of increased volumes from existing and new customers.
Customs brokerage and other services net revenues increased 6% in 2015 as compared with 2014, primarily as a result of higher volumes from existing and new customers in North America. Customers continued to seek out customs brokers with sophisticated computerized capabilities critical to an overall logistics management program, including rapid responses to changes in the regulatory and security environment.
North America net revenues increased 10%, in 2015, as compared with 2014, primarily as a result of higher volumes from existing and new customers. Europe net revenues decreased 4%, as compared with 2014, due to general market conditions.
Overhead expenses:
Salaries and related costs increased 7% in 2015, as compared with 2014, principally as a result of increased bonuses resulting from higher operating income and an increase in the number of employees, primarily in North America and Europe.
Bonuses to field and executive management in 2015 were up 18% as compared with 2014, primarily as a result of a 21% increase in operating income. Salaries and related costs decreased 2% as a percentage of net revenues in 2015 as compared with 2014, as the growth in net revenues outpaced salary and related cost increases from higher headcount and bonuses.
Other overhead expenses remained flat in 2015, as compared with 2014. Lower depreciation expense, recovery of legal and related costs and a reduction in indirect taxes were partially offset by higher travel related costs, technology consulting fees and claims. Other overhead expenses decreased 1% as a percentage of net revenues in 2015, as compared with 2014.
Income tax expense:
Our consolidated effective income tax rate declined slightly to
37.6%
in
2015
, as compared to
37.9%
in
2014
. The decrease in the effective tax rate is principally the result of a higher proportion of our total outstanding stock-based compensation expense being for non-qualified stock option grants.
|
24
.
Currency and Other Risk Factors
The nature of our worldwide operations necessitates dealing with a multitude of currencies other than the U.S. dollar. This results in our being exposed to the inherent risks of volatile international currency markets and governmental interference. Some of the countries where we maintain offices and/or agency relationships have strict currency control regulations which influence our ability to hedge foreign currency exposure. We try to compensate for these exposures by accelerating international currency settlements among our offices and agents. We may enter into foreign currency hedging transactions where there are regulatory or commercial limitations on our ability to move money freely around the world or the short-term financial outlook in any country is such that hedging is the most time-sensitive way to mitigate short-term exchange losses. Any such hedging activity during
2016
,
2015
and
2014
was insignificant. We had no foreign currency derivatives outstanding at
December 31, 2016
and
2015
. Net foreign currency gains were approximately
$8 million
in both
2016
and
2015
and
$2 million
in
2014
.
International air and ocean freight forwarding and customs brokerage are intensively competitive and are expected to remain so for the foreseeable future. There are a large number of entities competing in the international logistics industry, many of which have significantly more resources than us; however, our primary competition is confined to a relatively small number of companies within this group. The industry continues to experience consolidations into larger firms striving for stronger and more complete multinational and multi-service networks. However, regional and local brokers and forwarders remain a competitive force.
The primary competitive factors in the international logistics industry continue to be price and quality of service, including reliability, responsiveness, expertise, convenience, and scope of operations. We emphasize quality customer service and believe that our prices are competitive with those of others in the industry. Customers regularly solicit bids from competitors in order to improve service, pricing and contractual terms such as seeking longer payment terms, higher or unlimited liability limits and performance penalties. Increased competition and competitors' acceptance of expanded contractual terms could result in reduced revenues, reduced margins, higher operating costs or loss of market share, any of which would damage our results of operations and financial condition.
Larger customers utilize more sophisticated and efficient procedures for the management of their logistics supply chains by embracing strategies such as just-in-time inventory management. We believe that this trend has resulted in customers using fewer service providers with greater technological capacity and more consistent global coverage. Accordingly, sophisticated computerized customer service capabilities and a stable worldwide network have become significant factors in attracting and retaining customers. Developing and maintaining these systems and a worldwide network has added a considerable indirect cost to the services provided to customers. Smaller and middle-tier competitors, in general, do not have the resources available to develop customized systems and a worldwide network.
Liquidity and Capital Resources
Our principal source of liquidity is cash and cash equivalents, short-term investments and cash generated from operating activities. Net cash provided by operating activities for the year ended
December 31, 2016
was
$529 million
, as compared with
$565 million
for
2015
. This
$36 million
decrease is primarily due to lower earnings and changes in working capital. At
December 31, 2016
, working capital was
$1,289 million
, including cash and cash equivalents of
$974 million
. We had no long-term debt at
December 31, 2016
. Management believes that our current cash position and operating cash flows will be sufficient to meet our capital and liquidity requirements for at least the next 12 months and thereafter for the foreseeable future, including meeting any contingent liabilities related to standby letters of credit and other obligations.
As a customs broker, we make significant cash advances for a select group of our credit-worthy customers. These cash advances are for customer obligations such as the payment of duties and tax to customs authorities in various countries throughout the world. Cash advances are a “pass through” and are not recorded as a component of revenue and expense. The billings of such advances to customers are accounted for as a direct increase in accounts receivable from the customer and a corresponding increase in accounts payable to governmental customs authorities. As a result of these “pass through” billings, the conventional Days Sales Outstanding or DSO calculation does not directly measure collection efficiency. For customers that meet certain criteria, we have agreed to extend payment terms beyond our customary terms. Management believes that it has established effective credit control procedures, and historically has experienced relatively insignificant collection problems.
Our business historically has been subject to seasonal fluctuations and this is expected to continue in the future. Cash flows fluctuate as a result of this seasonality. Historically, the first quarter shows an excess of customer collections over customer billings. This results in positive cash flow. The increased activity associated with periods of higher demand (typically commencing late second or early third quarter and continuing well into the fourth quarter) causes an excess of customer billings over customer collections. This cyclical growth in customer receivables consumes available cash.
Cash used by investing activities for the year ended
December 31, 2016
was
$53 million
, as compared with
$7 million
for
2015
. We had minor net purchases of investments in
2016
compared to receiving net proceeds from maturity of short-term investments of $40 million in
2015
. We had capital expenditures of
$59 million
in
2016
as compared with
$44 million
in
2015
. Capital expenditures in
2016
related primarily to continuing investments in technology, office furniture and equipment and leasehold improvements. Occasionally, we elect to purchase buildings to house staff and to facilitate the staging of customers’ freight. In 2016, we completed a land acquisition in Europe, for which funds had been deposited into escrow in 2014. Additional expenditures are expected to be made in 2017 and 2018 in connection with the construction of a building on this land. Total anticipated capital expenditures in
2017
are currently estimated to be $110 million. This includes routine capital expenditures, including the construction of the building in Europe, plus additional real estate development.
Cash used in financing activities for the year ended
December 31, 2016
was
$298 million
as compared with
$635 million
in
2015
. We used the proceeds from stock option exercises, employee stock purchases and available cash to repurchase our common stock on the open market to limit the growth in issued and outstanding shares. During
2016
and
2015
, we used cash to repurchase 7 million and 13 million shares of common stock, respectively. During
2016
and
2015
, we paid dividends of
$0.80
and
$0.72
per share, respectively.
We have a Non-Discretionary Stock Repurchase Plan to repurchase shares from the proceeds of stock option exercises. During
2016
, we repurchased
3.4 million
shares at an average price of $
50.46
per share. We also have a Discretionary Stock Repurchase Plan under which management is allowed to repurchase shares to reduce the issued and outstanding stock to
170 million
shares of common stock. During
2016
, we repurchased
3.2 million
shares at an average price of
$50.61
per share. See Note 3 to the consolidated financial statements for cumulative repurchases under both repurchase plans.
|
25
.
We follow established guidelines relating to credit quality, diversification and maturities of our investments to preserve principal and maintain liquidity. Our investment portfolio has not been adversely impacted by the disruption in the credit markets. However, there can be no assurance that our investment portfolio will not be adversely affected in the future.
We cannot predict what impact ongoing uncertainties in the global economy and political uncertainty may have on our operating results, freight volumes, pricing, changes in consumer demand, carrier stability and capacity, customers’ abilities to pay or on changes in competitors' behavior.
We maintain international unsecured bank lines of credit. At
December 31, 2016
, we were contingently liable for
$64 million
from standby letters of credit and guarantees. The standby letters of credit and guarantees relate to obligations of our foreign subsidiaries for credit extended in the ordinary course of business by direct carriers, primarily airlines, and for duty and tax deferrals available from governmental entities responsible for customs and value-added-tax (VAT) taxation. The total underlying amounts due and payable for transportation and governmental excises are properly recorded as obligations in the books of the respective foreign subsidiaries, and there would be no need to record additional expense in the unlikely event the parent company is required to perform.
|
|
|
Amount of commitment expiration per period
|
||||||||||||||
|
In thousands
|
Total
amounts
committed
|
Less than 1
year
|
1 - 3
years
|
3 - 5
years
|
After
5 years
|
|||||||||||
|
Standby letters of credit and guarantees
|
$
|
63,968
|
|
56,590
|
|
5,699
|
|
155
|
|
1,524
|
|
|||||
At
December 31, 2016
, our contractual obligations are as follows:
|
|
|
Payments due by period
|
||||||||||||||
|
In thousands
|
Total
|
|
Less than
1 year
|
1 - 3
years
|
3 - 5
years
|
After
5 years
|
||||||||||
|
Contractual Obligations:
|
||||||||||||||||
|
Operating leases
|
$
|
214,257
|
|
58,502
|
|
82,628
|
|
44,903
|
|
28,224
|
|
|||||
|
Unconditional purchase obligations
|
76,306
|
|
76,306
|
|
—
|
|
—
|
|
—
|
|
||||||
|
Construction, equipment and technology purchase obligations
|
76,306
|
|
55,487
|
|
20,816
|
|
3
|
|
—
|
|
||||||
|
Total contractual cash obligations
|
$
|
366,869
|
|
190,295
|
|
103,444
|
|
44,906
|
|
28,224
|
|
|||||
We typically enter into short-term unconditional purchase obligations with asset-based providers reserving space on a guaranteed basis. The pricing of these obligations varies to some degree with market conditions. We only enter into agreements that management believes we can fulfill. Historically, we have met these obligations in the normal course of business. Management believes, in line with historical experience, committed purchase obligations outstanding as of
December 31, 2016
will be fulfilled during
2017
in the ordinary course of business. Also, in October 2016, we entered into a contractual agreement to construct a building in Europe that is currently expected to cost $51 million (€45 million).
Our foreign subsidiaries regularly remit dividends to the U.S. parent company after evaluating their working capital requirements and needs to finance local capital expenditures. In some cases, our ability to repatriate funds from foreign operations may be subject to foreign exchange controls. At
December 31, 2016
, cash and cash equivalent balances of
$504 million
were held by our non-United States subsidiaries, of which
$73 million
was held in banks in the United States. Earnings of our foreign subsidiaries are not considered to be indefinitely reinvested outside of the United States and, accordingly, a deferred tax liability has been established for all undistributed earnings, net of foreign related tax credits, that are available to be repatriated.
Impact of Inflation
To date, our business has not been adversely affected by inflation. Direct carrier rate increases could occur over the short to medium-term period. Due to the high degree of competition in the market place, these rate increases can lead to an erosion in our margins. As we are not required to purchase or maintain extensive property and equipment and have not otherwise incurred substantial interest rate-sensitive indebtedness, we currently have limited direct exposure to increased costs resulting from increases in interest rates.
Off-Balance Sheet Arrangements
As of
December 31, 2016
, we did not have any material off-balance-sheet arrangements, as defined in Item 303(a)(4)(ii) of SEC Regulation S-K.
We are exposed to market risks in the ordinary course of our business. These risks are primarily related to foreign exchange risk and changes in short-term interest rates. The potential impact of our exposure to these risks is presented below:
Foreign Exchange Risk
We conduct business in many different countries and currencies. Our business often results in revenue billings issued in a country and currency which differs from that where the expenses related to the service are incurred. In the ordinary course of business, we create numerous intercompany transactions and may have receivables, payables and currencies that are not denominated in the local functional currency. This brings foreign exchange risk to our earnings. The principal foreign exchange risks to which Expeditors is exposed include Chinese Yuan, Euro, Mexican Peso, Canadian Dollar and British Pound.
Foreign exchange rate sensitivity analysis can be quantified by estimating the impact on our earnings as a result of hypothetical changes in the value of the U.S. dollar, our functional currency, relative to the other currencies in which we transact business. All other things being equal, an
|
26
.
average 10% weakening of the U.S. dollar, throughout the year ended
December 31, 2016
, would have had the effect of raising operating income approximately $47 million. An average 10% strengthening of the U.S. dollar, for the same period, would have the effect of reducing operating income approximately $39 million. This analysis does not take into account changes in shipping patterns based upon this hypothetical currency fluctuation. For example, a weakening in the U.S. dollar would be expected to increase exports from the United States and decrease imports into the United States over some relevant period of time, but the exact effect of this change cannot be quantified without making speculative assumptions.
We currently do not use derivative financial instruments to manage foreign currency risk and only enter into foreign currency hedging transactions in limited locations where regulatory or commercial limitations restrict our ability to move money freely. Any such hedging activity throughout the year ended
December 31, 2016
, was insignificant. Net foreign currency gains were approximately
$8 million
in both
2016
and
2015
and were
$2 million
in
2014
. We had no foreign currency derivatives outstanding at
December 31, 2016
and
2015
. We instead follow a policy of accelerating international currency settlements to manage foreign exchange risk relative to intercompany billings. As of
December 31, 2016
, we had $11 million of net unsettled intercompany transactions. The majority of intercompany billings are resolved within 30 days.
Interest Rate Risk
At
December 31, 2016
, we had cash, cash equivalents and short-term investments of
$974 million
, of which $568 million was invested at various short-term market interest rates. We had no long-term debt at
December 31, 2016
. A hypothetical change in the interest rate of 10 basis points at
December 31, 2016
would not have a significant impact on our earnings.
In management’s opinion, there has been no material change in our interest rate risk exposure between
2016
and
2015
.
The following documents are filed on the pages listed below, as part of Part II, Item 8 of this report.
|
Document
|
Page
|
||||
|
1
|
|
Financial Statements and Reports of Independent Registered Public Accounting Firm:
|
|||
|
F-1 and F-2
|
|||||
|
Consolidated Financial Statements:
|
|||||
|
Balance Sheets as of December 31, 2016 and 2015
|
F-3
|
||||
|
Statements of Earnings for the Years Ended December 31, 201
6, 2015, and 2014
|
F-4
|
||||
|
Statements of Comprehensive Income for the Years Ended December 31, 201
6, 2015, and 2014
|
F-5
|
||||
|
Statements of Equity for the Years Ended December 31, 201
6, 2015, and 2014
|
F-6 and F-7
|
||||
|
Statements of Cash Flows for the Years Ended December 31, 201
6, 2015, and 2014
|
F-8
|
||||
|
F-9 through F-19
|
|||||
None.
Evaluation of Disclosure Controls and Procedures
We carried out an evaluation, under the supervision and with the participation of our management, including the Chief Executive Officer and Chief Financial Officer, of the effectiveness of the design and operation of our disclosure controls and procedures (as defined in the Exchange Act Rule 13a-15(e)) as of the end of the period covered by this report. Based upon that evaluation, the Chief Executive Officer and Chief Financial Officer concluded that our disclosure controls and procedures were effective as of the end of the period covered by this report at the reasonable assurance level.
Changes in Internal Controls
There were no changes in our internal control over financial reporting that occurred during the most recent fiscal quarter that have materially affected, or are reasonably likely to materially affect, our internal control over financial reporting.
We are developing a new accounting system which is being implemented on a worldwide basis over the next several years. This system is expected to improve the efficiency of certain financial and transactional processes and reporting. This transition affects the processes that constitute our internal control over financial reporting and requires testing for operating effectiveness.
Our management has confidence in our internal controls and procedures. Nevertheless, our management, including Expeditors’ Chief Executive Officer and Chief Financial Officer, does not expect that our disclosure controls and procedures or our internal controls will prevent all errors or intentional fraud. An internal control system, no matter how well-conceived and operated, can provide only reasonable, not absolute, assurance that the objectives of such internal controls are met. Further, the design of an internal control system must reflect the fact that there are resource constraints, and the benefits of controls must be considered relative to their costs. Because of the inherent limitations in all internal control systems, no evaluation of controls can provide absolute assurance that all of our control issues and instances of fraud, if any, have been detected.
|
27
.
Management Report on Internal Control Over Financial Reporting
Management is responsible for establishing and maintaining adequate internal control over financial reporting as required by the Sarbanes-Oxley Act of 2002 and as defined in Exchange Act Rule 13a-15(f). Our system of internal control over financial reporting is designed to provide reasonable assurance to our management and Board of Directors regarding the reliability of our financial reporting and the preparation of financial statements for external purposes in accordance with U.S. generally accepted accounting principles. Internal control over financial reporting includes those policies and procedures that (i) pertain to the maintenance of records that in reasonable detail accurately and fairly reflect the transactions and dispositions of the assets; (ii) provide reasonable assurance that transactions are recorded as necessary to permit preparation of financial statements in accordance with U.S. generally accepted accounting principles, and that receipts and expenditures are being made only in accordance with authorizations of management and our Board of Directors; and (iii) provide reasonable assurance regarding prevention or timely detection of unauthorized acquisition, use or disposition of the Company’s assets that could have a material effect on the financial statements.
A system of internal control can provide only reasonable, not absolute, assurance that the objectives of the control system are met. Management, including the Chief Executive Officer and Chief Financial Officer, conducted an assessment of the effectiveness of the Company's internal control over financial reporting, as of
December 31, 2016
, based on the framework in
Internal Control — Integrated Framework (2013)
issued by the Committee of Sponsoring Organizations of the Treadway Commission (COSO). Based on this assessment, management has concluded that, as of
December 31, 2016
, our internal control over financial reporting was effective.
KPMG LLP, an independent registered public accounting firm, has issued an attestation report on our internal control over financial reporting as of
December 31, 2016
, which is included on page F-2.
Not applicable.
The information required by this item is set forth below or incorporated by reference to information under the caption “Proposal No. 1: Election of Directors” and to the information under the captions “Section 16(a) Beneficial Ownership Reporting Compliance” and “Board Operations" in Expeditors' definitive Proxy Statement for its annual meeting of shareholders to be held on
May 2, 2017
. See also Part I - Item 1 - Executive Officers of the Registrant.
Audit Committee and Audit Committee Financial Expert
Expeditors' Board has a separately-designated standing Audit Committee established in accordance with Section 3(a)(58)(A) of the Exchange Act. The members of the Audit Committee are
Richard B. McCune, Michael J. Malone, Dan P. Kourkoumelis and James M. Dubois.
Expeditors' Board has determined that Richard B. McCune, Chairman of the Audit Committee, is an audit committee financial expert as defined by Item 407(d)(5) of Regulation S-K under the Exchange Act and that each member of the Audit Committee is independent under the NASDAQ independence standards applicable to audit committee members.
Code of Ethics and Governance Guidelines
Expeditors has adopted a
Code of Business Conduct
that applies to all Expeditors employees including, of course, its principal executive officer and principal financial and accounting officer. The
Code of Business Conduct
is posted on Expeditors' website at
http://www.investor.expeditors.com
. Expeditors will post any amendments to the
Code of Business Conduct
at that location. In the unlikely event that the Board of Directors approves any sort of waiver to the
Code of Business Conduct
for Expeditors' executive officers or directors, information concerning such waiver will also be posted at that location. No such waivers have been granted.
The information required by this item is incorporated by reference to information under the captions “Director Compensation Program” and “Compensation Committee Report” in Expeditors' definitive Proxy Statement for its annual meeting of shareholders to be held on
May 2, 2017
.
The information required by this item is incorporated by reference to information under the captions “Shareholder Engagement and Stock Ownership Information” in Expeditors' definitive Proxy Statement for its annual meeting of shareholders to be held on
May 2, 2017
.
|
28
.
Securities Authorized for Issuance under Equity Compensation Plans
The following table provides information as of
December 31, 2016
, regarding compensation plans under which equity securities of Expeditors are authorized for issuance.
|
(a)
|
(b)
|
(c)
|
||||||||
|
Plan Category
|
Number of Securities
to be Issued Upon
Exercise of
Outstanding
Options, Warrants
and Rights
|
Weighted-Average
Exercise Price of
Outstanding
Options, Warrants and Rights
|
Number of Securities
Available for Future
Issuance Under Equity Compensation Plans (Excluding Securities Reflected in Column (a)) (1)
|
|||||||
|
Equity Compensation Plans Approved by Security Holders
|
17,373,937
|
|
$
|
44.25
|
|
2,311,579
|
|
|||
|
Equity Compensation Plans Not Approved by Security Holders
|
—
|
|
—
|
|
—
|
|
||||
|
Total
|
17,373,937
|
|
$
|
44.25
|
|
2,311,579
|
|
|||
|
(1)
|
Includes
2,091,669
available for issuance under the employee stock purchase plans,
75,750
available for future grants of stock options and
144,160
available for issuance of restricted stock.
|
The information required by this item is incorporated by reference to information under the captions “Certain Relationships and Related Transactions” in Expeditors' definitive Proxy Statement for its annual meeting of shareholders to be held on
May 2, 2017
.
The information required by this item is incorporated by reference to information under the caption “Relationship with Independent Public Accountants” in Expeditors' definitive Proxy Statement for its annual meeting of shareholders to be held on
May 2, 2017
.
|
Page
|
||||
|
(a)
|
1.
|
FINANCIAL STATEMENTS
|
||
|
F-1 and F-2
|
||||
|
F-3
|
||||
|
F-4
|
||||
|
F-5
|
||||
|
F-6 and F-7
|
||||
|
F-8
|
||||
|
F-9 through F-19
|
||||
|
2.
|
FINANCIAL STATEMENT SCHEDULES
|
|||
|
Schedules are omitted because of the absence of conditions under which they are required or because the required information is given in the consolidated financial statements or notes thereto.
|
||||
|
3.
|
EXECUTIVE COMPENSATION PLANS AND ARRANGEMENTS
|
|||
The following list is a subset of the list of exhibits described below and contains all compensatory plans, contracts or arrangements in which any director or executive officer of Expeditors is a participant, unless the method of allocation of benefits thereunder is the same for management and non-management participants:
|
(1)
|
Form of Employment Agreement executed by Jeffrey S. Musser, Expeditors' President and Chief Executive Officer. See Exhibit 10.23.
|
|
(2)
|
Form of Employment Agreement executed by Expeditors' Chief Financial Officer. See Exhibit 10.25.
|
|
(3)
|
Form of Employment Agreement executed by Expeditors' President, Global Products. See Exhibit 10.27.
|
|
(4)
|
Expeditors' Amended 1993 Directors’ Non-Qualified Stock Option Plan. See Exhibit 10.39.
|
|
(5)
|
Form of Stock Option Agreement used in connection with options granted under Expeditors' 1993 Directors’ Non-Qualified Stock Option Plan. See Exhibit 10.9.
|
|
(6)
|
Expeditors' 2008 Executive Incentive Compensation Plan. See Exhibit 10.35.
|
|
(7)
|
Expeditors' 2014 Directors’ Restricted Stock Plan. See Exhibit 10.36.
|
|
(8)
|
Expeditors' 2002 Employee Stock Purchase Plan. See Exhibit 10.42.
|
|
(9)
|
Expeditors' amendment to the 2002 Employee Stock Purchase Plan. See Exhibit 10.42.1
|
|
(10)
|
Expeditors' 2006 Stock Option Plan. See Exhibit 10.47.
|
|
(11)
|
Form of Stock Option Agreement used in connection with Incentive options granted under Expeditors' 2006 Stock Option Plan. See Exhibit 10.48.
|
|
(12)
|
Expeditors' 2007 Stock Option Plan. See Exhibit 10.49.
|
|
29
.
|
(13)
|
Form of Stock Option Agreement used in connection with Incentive options granted under Expeditors' 2007 Stock Option Plan. See Exhibit 10.50.
|
|
(14)
|
Expeditors' 2008 Stock Option Plan. See Exhibit 10.51.
|
|
(15)
|
Form of Stock Option Agreement used in connection with options granted under Expeditors' 2008 Stock Option Plan. See Exhibit 10.52.
|
|
(16)
|
Expeditors' 2009 Stock Option Plan. See Exhibit 10.53.
|
|
(17)
|
Form of Stock Option Agreement used in connection with options granted under Expeditors' 2009 Stock Option Plan. See Exhibit 10.54.
|
|
(18)
|
Expeditors' 2010 Stock Option Plan. See Exhibit 10.55.
|
|
(19)
|
Form of Stock Option Agreement used in connection with options granted under Expeditors’ 2010 Stock Option Plan. See Exhibit 10.56.
|
|
(20)
|
Expeditors' 2011 Stock Option Plan. See Exhibit 10.57.
|
|
(21)
|
Form of Stock Option Agreement used in connection with options granted under Expeditors' 2011 Stock Option Plan. See Exhibit 10.58.
|
|
(22)
|
Expeditors' 2012 Stock Option Plan. See Exhibit 10.59.
|
|
(23)
|
Form of Stock Option Agreement used in connection with options granted under Expeditors' 2012 Stock Option Plan. See Exhibit 10.60.
|
|
(24)
|
Expeditors' 2013 Stock Option Plan. See Exhibit 10.61.
|
|
(25)
|
Form of Stock Option Agreement used in connection with options granted under Expeditors' 2013 Stock Option Plan. See Exhibit 10.62.
|
|
(26)
|
Expeditors' 2014 Stock Option Plan. See Exhibit 10.63.
|
|
(27)
|
Form of Stock Option Agreement used in connection with options granted under Expeditors; 2014 Stock Option Plan. See Exhibit 10.64.
|
|
(28)
|
Expeditors' 2015 Stock Option Plan. See Exhibit 10.65.
|
|
(29)
|
Form of Stock Option Agreement used in connection with options granted under Expeditors' 2015 Stock Option Plan. See Exhibit 10.66.
|
|
(30)
|
Expeditors' 2016 Stock Option Plan. See Exhibit 10.67.
|
|
(31)
|
Form of Stock Option Agreement used in connection with options granted under Expeditors' 2016 Stock Option Plan. See Exhibit 10.67.
|
(b)
EXHIBITS
|
Exhibit Number
|
|
Exhibit
|
|
|
3.1
|
|
|
Expeditors' Restated Articles of Incorporation and the Articles of Amendment thereto dated December 9, 1993. (Incorporated by reference to Exhibit 3.1 to Form 10-K, filed on or about March 31, 1995.)
|
|
3.1.1
|
|
|
Articles of Amendment to the Restated Articles of Incorporation dated November 12, 1996. (Incorporated by reference to Exhibit 3.1.1 to Form 10-K, filed on or about March 31, 1997.)
|
|
3.1.2
|
|
|
Articles of Amendment to the Restated Articles of Incorporation dated May 20, 1999. (Incorporated by reference to Exhibit 3.1.2 to Form 10-K, filed on or about March 28, 2003.)
|
|
3.1.3
|
|
|
Articles of Amendment to the Restated Articles of Incorporation dated June 12, 2002. (Incorporated by reference to Exhibit 3.1.3 to Form 10-K, filed on or about March 28, 2003.)
|
|
3.1.4
|
|
Articles of Amendment to the Restated Articles of Incorporation dated August 2, 2006. (Incorporated by reference to Exhibit 3.1.4 to Form 10-K, filed on or about February 27, 2013.)
|
|
|
3.2
|
|
|
Expeditors' Amended and Restated Bylaws. (Incorporated by reference to Exhibit 3.2 to Form 8-K, filed on or about May 6, 2016.)
|
|
10.9
|
|
|
Form of Stock Option Agreement used in connection with options granted under Expeditors' 1993 Directors’ Non-Qualified Stock Option Plan. (Incorporated by reference to Exhibit 10.9 to Form 10-K, filed on or about March 28, 1994.)
|
|
10.23
|
|
|
Form of Employment Agreement executed by Jeffrey S. Musser, Expeditors' President and Chief Executive Officer dated December 31, 2008. (Incorporated by reference to Exhibit 10.23 to Form 10-K, filed on or about February 26, 2015.)
|
|
10.25
|
|
|
Form of Employment Agreement executed by Expeditors' Chief Financial Officer dated December 31, 2008. (Incorporated by reference to Exhibit 10.25 to Form 10-K, filed on or about February 27, 2009.)
|
|
10.27
|
|
Form of Employment Agreement executed by Expeditors' President, Global Products. (Incorporated by reference to Exhibit 10.27 to Form 10-Q, filed on or about August 6, 2015.)
|
|
|
10.35
|
|
|
Expeditors' 2008 Executive Incentive Compensation Plan. (Incorporated by reference to Appendix C of Expeditors' Notice of Annual Meeting of Shareholders and Proxy Statement pursuant to Regulation 14A filed on or about March 21, 2008.)
|
|
10.36
|
|
|
Expeditors' 2014 Directors’ Restricted Stock Plan. (Incorporated by reference to Appendix D of Expeditors' Notice of Annual Meeting of Shareholders and Proxy Statement pursuant to Regulation 14A filed on or about March 21, 2014.)
|
|
10.39
|
|
|
Expeditors' Amended 1993 Directors’ Non-Qualified Stock Option Plan. (Incorporated by reference to Appendix B of Expeditors' Notice of Annual Meeting of Shareholders and Proxy Statement pursuant to Regulation 14A filed on or about March 28, 2001.)
|
|
10.39.1
|
|
|
Amendment to Amended 1993 Directors’ Non-Qualified Stock Option Plan (Incorporated by reference to Exhibit 10.39.1 to Form 10-Q filed on or about August 9, 2007.)
|
|
10.42
|
|
|
Expeditors' 2002 Employee Stock Purchase Plan. (Incorporated by reference to Appendix C of Expeditors' Notice of Annual Meeting of Shareholders and Proxy Statement pursuant to Regulation 14A filed on or about March 21, 2014.)
|
|
10.42.1
|
|
|
Expeditors' amendment to the 2002 Employee Stock Purchase Plan. (Incorporated by reference to Appendix C of Expeditors' Notice of Annual Meeting of Shareholders and Proxy Statement pursuant to Regulation 14A filed on or about March 21, 2014.)
|
|
30
.
|
10.47
|
|
|
Expeditors' 2006 Stock Option Plan. (Incorporated by reference to Appendix A of Expeditors' Notice of Annual Meeting of Shareholders and Proxy Statement pursuant to Regulation 14A filed on or about April 4, 2006.)
|
|
10.48
|
|
|
Form of Stock Option Agreement used in connection with Incentive options granted under Expeditors' 2006 Stock Option Plan. (Incorporated by reference to Exhibit 10.48 to Form 10-K filed on or about March 1, 2007.)
|
|
10.49
|
|
|
Expeditors' 2007 Stock Option Plan. (Incorporated by reference to Appendix A of Expeditors' Notice of Annual Meeting of Shareholders and Proxy Statement pursuant to Regulation 14A filed on or about March 30, 2007.)
|
|
10.50
|
|
|
Form of Stock Option Agreement used in connection with Incentive options granted under Expeditors' 2007 Stock Option Plan. (Incorporated by reference to Exhibit 10.50 to Form 10-K filed on or about February 9, 2008.)
|
|
10.51
|
|
|
Expeditors' 2008 Stock Option Plan. (Incorporated by reference to Appendix A of Expeditors' Notice of Annual Meeting of Shareholders and Proxy Statement pursuant to Regulation 14A filed on or about March 21, 2008.)
|
|
10.52
|
|
|
Form of Stock Option Agreement used in connection with options granted under Expeditors' 2008 Stock Option Plan. (Incorporated by reference to Exhibit 10.52 to Form 10-K filed on or about February 27, 2009.)
|
|
10.53
|
|
|
Expeditors' 2009 Stock Option Plan. (Incorporated by reference to Appendix A of Expeditors' Notice of Annual Meeting of Shareholders and Proxy Statement pursuant to Regulation 14A filed on or about March 20, 2009.)
|
|
10.54
|
|
|
Form of Stock Option Agreement used in connection with options granted under Expeditors' 2009 Stock Option Plan. (Incorporated by reference to Exhibit 10.2 to Form 8-K filed on or about May 11, 2009.)
|
|
10.55
|
|
Expeditors' 2010 Stock Option Plan. (Incorporated by reference to Appendix A of Expeditors' Notice of Annual Meeting of Shareholders and Proxy Statement pursuant to Regulation 14A filed on or about March 19, 2010.)
|
|
|
10.56
|
|
Form of Stock Option Agreement used in connection with options granted under Expeditors' 2010 Stock Option Plan. (Incorporated by reference to Appendix B of Expeditors' Notice of Annual Meeting of Shareholders and Proxy Statement pursuant to Regulation 14A filed on or about March 19, 2010.)
|
|
|
10.57
|
|
Expeditors' 2011 Stock Option Plan. (Incorporated by reference to Appendix A of Expeditors' Notice of Annual Meeting of Shareholders and Proxy Statement pursuant to Regulation 14A filed on or about March 18, 2011.)
|
|
|
10.58
|
|
Form of Stock Option Agreement used in connection with options granted under Expeditors' 2011 Stock Option Plan. (Incorporated by reference to Appendix B of Expeditors' Notice of Annual Meeting of Shareholders and Proxy Statement pursuant to Regulation 14A filed on or about March 18, 2011.)
|
|
|
10.59
|
|
Expeditors' 2012 Stock Option Plan. (Incorporated by reference to Appendix A of Expeditors' Notice of Annual Meeting of Shareholders and Proxy Statement pursuant to Regulation 14A filed on or about March 20, 2012.)
|
|
|
10.60
|
|
Form of Stock Option Agreement used in connection with options granted under Expeditors' 2012 Stock Option Plan. (Incorporated by reference to Appendix B of Expeditors' Notice of Annual Meeting of Shareholders and Proxy Statement pursuant to Regulation 14A filed on or about March 20, 2012.)
|
|
|
10.61
|
|
Expeditors' 2013 Stock Option Plan. (Incorporated by reference to Appendix A of Expeditors' Notice of Annual Meeting of Shareholders and Proxy Statement pursuant to Regulation 14A filed on or about March 29, 2013.)
|
|
|
10.62
|
|
Form of Stock Option Agreement used in connection with options granted under Expeditors' 2013 Stock Option Plan. (Incorporated by reference to Appendix B of Expeditors' Notice of Annual Meeting of Shareholders and Proxy Statement pursuant to Regulation 14A filed on or about March 29, 2013.)
|
|
|
10.63
|
|
Expeditors' 2014 Stock Option Plan. (Incorporated by reference to Appendix A of Expeditors' Notice of Annual Meeting of Shareholders and Proxy Statement pursuant to Regulation 14A filed on or about March 21, 2014.)
|
|
|
10.64
|
|
Form of Stock Option Agreement used in connection with options granted under Expeditors' 2014 Stock Option Plan. (Incorporated by reference to Appendix B of Expeditors' Notice of Annual Meeting of Shareholders and Proxy Statement pursuant to Regulation 14A filed on or about March 21, 2014.)
|
|
|
10.65
|
|
Expeditors' 2015 Stock Option Plan. (Incorporated by reference to Appendix A of Expeditors' Notice of Annual Meeting of Shareholders and Proxy Statement pursuant to Regulation 14A filed on or about April 9, 2015.)
|
|
|
10.66
|
|
Form of Stock Option Agreement used in connection with options granted under Expeditors' 2015 Stock Option Plan. (Incorporated by reference to Appendix B of Expeditors' Notice of Annual Meeting of Shareholders and Proxy Statement pursuant to Regulation 14A filed on or about April 9, 2015.)
|
|
|
10.67
|
|
Expeditors' 2016 Stock Option Plan. (Incorporated by reference to Appendix A of Expeditors' Notice of Annual Meeting of Shareholders and Proxy Statement pursuant to Regulation 14A filed on or about March 24, 2016.)
|
|
|
10.68
|
|
Form of Stock Option Agreement used in connection with options granted under Expeditors' 2016 Stock Option Plan. (Incorporated by reference to Appendix B of Expeditors' Notice of Annual Meeting of Shareholders and Proxy Statement pursuant to Regulation 14A filed on or about March 24, 2016.)
|
|
|
21.1
|
|
Subsidiaries of the registrant.
|
|
|
23.1
|
|
Consent of Independent Registered Public Accounting Firm.
|
|
|
31.1
|
|
Certification of Chief Executive Officer pursuant to Section 302 of the Sarbanes-Oxley Act of 2002.
|
|
|
31.2
|
|
Certification of Chief Financial Officer pursuant to Section 302 of the Sarbanes-Oxley Act of 2002.
|
|
|
32
|
|
Certification pursuant to 18 U.S.C. Section 1350, as adopted pursuant to Section 906 of the Sarbanes-Oxley Act of 2002.
|
|
|
31
.
|
101.INS
|
|
XBRL Instance Document.
|
|
|
101.SCH
|
|
XBRL Taxonomy Extension Schema Document.
|
|
|
101.CAL
|
|
XBRL Taxonomy Extension Calculation Linkbase Document.
|
|
|
101.LAB
|
|
XBRL Taxonomy Extension Label Linkbase Document.
|
|
|
101.PRE
|
|
XBRL Taxonomy Extension Presentation Linkbase Document.
|
|
|
101.DEF
|
|
XBRL Taxonomy Extension Definition Linkbase Document.
|
|
None.
|
32
.
SIGNATURES
Pursuant to the requirements of Section 13 or 15(d) of the Securities Exchange Act of 1934, the registrant has duly caused this report to be signed on its behalf by the undersigned, thereunto duly authorized.
Date:
February 23, 2017
|
EXPEDITORS INTERNATIONAL OF WASHINGTON, INC.
|
||
|
By:
|
/s/ Bradley S. Powell
|
|
|
|
Bradley S. Powell
|
|
|
|
Senior Vice President and Chief Financial Officer
|
|
|
33
.
Pursuant to the requirements of the Securities Exchange Act of 1934, this report has been signed below by the following persons on behalf of the registrant and in the capacities indicated on
February 23, 2017
.
|
Signature
|
|
Title
|
|
|
/s/ Jeffrey S. Musser
|
|
President, Chief Executive Officer and Director
|
|
|
(Jeffrey S. Musser)
|
|
(Principal Executive Officer)
|
|
|
/s/ Bradley S. Powell
|
|
Senior Vice President and Chief Financial Officer
|
|
|
(Bradley S. Powell)
|
|
(Principal Financial and Accounting Officer)
|
|
|
/s/ Robert R. Wright
|
|
Chairman of the Board and Director
|
|
|
(Robert R. Wright)
|
|
||
|
/s/ James M. DuBois
|
|
Director
|
|
|
(James M. DuBois)
|
|
||
|
/s/ Mark A. Emmert
|
|
Director
|
|
|
(Mark A. Emmert)
|
|
||
|
/s/ Diane H. Gulyas
|
|
Director
|
|
|
(Diane H. Gulyas)
|
|
||
|
/s/ Dan P. Kourkoumelis
|
|
Director
|
|
|
(Dan P. Kourkoumelis)
|
|
||
|
/s/ Michael J. Malone
|
|
Director
|
|
|
(Michael J. Malone)
|
|
||
|
/s/ Richard B. McCune
|
|
Director
|
|
|
(Richard B. McCune)
|
|
||
|
/s/ Liane J. Pelletier
|
|
Director
|
|
|
(Liane J. Pelletier)
|
|
||
|
/s/ James Li Kou Wang
|
|
Director
|
|
|
(James Li Kou Wang)
|
|
||
|
/s/ Tay Yoshitani
|
|
Director
|
|
|
(Tay Yoshitani)
|
|
||
|
34
.
EXPEDITORS INTERNATIONAL OF WASHINGTON, INC.
AND SUBSIDIARIES
CONSOLIDATED FINANCIAL STATEMENTS
COMPRISING ITEM 8
ANNUAL REPORT ON FORM 10-K
TO SECURITIES AND EXCHANGE COMMISSION FOR THE
YEARS ENDED DECEMBER 31,
2016
,
2015
, AND
2014
Report of Independent Registered Public Accounting Firm
The Board of Directors and Stockholders
Expeditors International of Washington, Inc.:
We have audited the accompanying consolidated balance sheets of Expeditors International of Washington, Inc. and subsidiaries as of December 31,
2016
and
2015
, and the related consolidated statements of earnings, comprehensive income, equity, and cash flows for each of the years in the three‑year period ended
December 31, 2016
. These consolidated financial statements are the responsibility of the Company’s management. Our responsibility is to express an opinion on these consolidated financial statements based on our audits.
We conducted our audits in accordance with the standards of the Public Company Accounting Oversight Board (United States). Those standards require that we plan and perform the audit to obtain reasonable assurance about whether the financial statements are free of material misstatement. An audit includes examining, on a test basis, evidence supporting the amounts and disclosures in the financial statements. An audit also includes assessing the accounting principles used and significant estimates made by management, as well as evaluating the overall financial statement presentation. We believe that our audits provide a reasonable basis for our opinion.
In our opinion, the consolidated financial statements referred to above present fairly, in all material respects, the financial position of Expeditors International of Washington, Inc. and subsidiaries as of
December 31, 2016
and
2015
, and the results of their operations and their cash flows for each of the years in the three‑year period ended
December 31, 2016
, in conformity with U.S. generally accepted accounting principles.
We also have audited, in accordance with the standards of the Public Company Accounting Oversight Board (United States), Expeditors International of Washington, Inc.’s internal control over financial reporting as of
December 31, 2016
, based on criteria established in
Internal Control - Integrated Framework (2013)
issued by the Committee of Sponsoring Organizations of the Treadway Commission (COSO), and our report dated
February 23, 2017
expressed an unqualified opinion on the effectiveness of the Company’s internal control over financial reporting.
|
/s/ KPMG LLP
|
|
|
|
Seattle, Washington
|
|
|
|
February 23, 2017
|
|
|
|
F-1
Report of Independent Registered Public Accounting Firm
The Board of Directors and Stockholders
Expeditors International of Washington, Inc.:
We have audited Expeditors International of Washington, Inc.’s internal control over financial reporting as of
December 31, 2016
, based on criteria established in
Internal Control - Integrated Framework (2013)
issued by the Committee of Sponsoring Organizations of the Treadway Commission (COSO). Expeditors International of Washington, Inc.’s management is responsible for maintaining effective internal control over financial reporting and for its assessment of the effectiveness of internal control over financial reporting, included in the accompanying Management Report on Internal Control Over Financial Reporting under Item 9A. Our responsibility is to express an opinion on the Company’s internal control over financial reporting based on our audit.
We conducted our audit in accordance with the standards of the Public Company Accounting Oversight Board (United States). Those standards require that we plan and perform the audit to obtain reasonable assurance about whether effective internal control over financial reporting was maintained in all material respects. Our audit included obtaining an understanding of internal control over financial reporting, assessing the risk that a material weakness exists, and testing and evaluating the design and operating effectiveness of internal control based on the assessed risk. Our audit also included performing such other procedures as we considered necessary in the circumstances. We believe that our audit provides a reasonable basis for our opinion.
A company’s internal control over financial reporting is a process designed to provide reasonable assurance regarding the reliability of financial reporting and the preparation of financial statements for external purposes in accordance with generally accepted accounting principles. A company’s internal control over financial reporting includes those policies and procedures that (1) pertain to the maintenance of records that, in reasonable detail, accurately and fairly reflect the transactions and dispositions of the assets of the company; (2) provide reasonable assurance that transactions are recorded as necessary to permit preparation of financial statements in accordance with generally accepted accounting principles, and that receipts and expenditures of the company are being made only in accordance with authorizations of management and directors of the company; and (3) provide reasonable assurance regarding prevention or timely detection of unauthorized acquisition, use, or disposition of the company’s assets that could have a material effect on the financial statements.
Because of its inherent limitations, internal control over financial reporting may not prevent or detect misstatements. Also, projections of any evaluation of effectiveness to future periods are subject to the risk that controls may become inadequate because of changes in conditions, or that the degree of compliance with the policies or procedures may deteriorate.
In our opinion, Expeditors International of Washington, Inc. maintained, in all material respects, effective internal control over financial reporting as of
December 31, 2016
, based on criteria established in
Internal Control - Integrated Framework (2013)
issued by the Committee of Sponsoring Organizations of the Treadway Commission (COSO).
We also have audited, in accordance with the standards of the Public Company Accounting Oversight Board (United States), the consolidated balance sheets of Expeditors International of Washington, Inc. and subsidiaries as of
December 31, 2016
and
2015
, and the related consolidated statements of earnings, comprehensive income, equity, and cash flows for each of the years in the three-year period ended
December 31, 2016
, and our report dated
February 23, 2017
expressed an unqualified opinion on those consolidated financial statements.
|
/s/ KPMG LLP
|
|
|
|
Seattle, Washington
|
|
|
|
February 23, 2017
|
|
|
|
F-2
Consolidated Balance Sheets
In thousands except per share data
|
December 31,
|
2016
|
2015
|
||||
|
Current Assets:
|
||||||
|
Cash and cash equivalents
|
$
|
974,435
|
|
807,796
|
|
|
|
Accounts receivable, less allowance for doubtful accounts of $9,247 in 2016 and $7,820 in 2015
|
1,190,130
|
|
1,112,260
|
|
||
|
Other
|
54,014
|
|
56,453
|
|
||
|
Total current assets
|
2,218,579
|
|
1,976,509
|
|
||
|
Property and equipment, net
|
536,572
|
|
524,724
|
|
||
|
Goodwill
|
7,927
|
|
7,927
|
|
||
|
Other assets, net
|
27,793
|
|
56,417
|
|
||
|
Total assets
|
$
|
2,790,871
|
|
2,565,577
|
|
|
|
Current Liabilities:
|
||||||
|
Accounts payable
|
$
|
726,571
|
|
645,304
|
|
|
|
Accrued expenses, primarily salaries and related costs
|
185,502
|
|
186,571
|
|
||
|
Federal, state and foreign income taxes
|
17,858
|
|
29,498
|
|
||
|
Total current liabilities
|
929,931
|
|
861,373
|
|
||
|
Deferred Federal and state income taxes, net
|
13,727
|
|
9,528
|
|
||
|
Commitments and contingencies
|
|
|
|
|
||
|
Shareholders’ Equity:
|
||||||
|
Preferred stock, par value $0.01 per share, authorized 2,000 shares; none issued
|
—
|
|
—
|
|
||
|
Common stock, par value $0.01 per share, authorized 640,000 shares;
|
||||||
|
issued and outstanding 179,857 shares at December 31, 2016
|
||||||
|
and 182,067 shares at December 31, 2015
|
1,799
|
|
1,821
|
|
||
|
Additional paid-in capital
|
2,642
|
|
31
|
|
||
|
Retained earnings
|
1,944,789
|
|
1,771,379
|
|
||
|
Accumulated other comprehensive loss
|
(104,592
|
)
|
(81,238
|
)
|
||
|
Total shareholders’ equity
|
1,844,638
|
|
1,691,993
|
|
||
|
Noncontrolling interest
|
2,575
|
|
2,683
|
|
||
|
Total equity
|
1,847,213
|
|
1,694,676
|
|
||
|
Total liabilities and equity
|
$
|
2,790,871
|
|
2,565,577
|
|
|
See accompanying notes to consolidated financial statements.
|
F-3
.
Consolidated Statements of Earnings
In thousands, except per share data
|
Years ended December 31,
|
2016
|
2015
|
2014
|
|||||||
|
Revenues:
|
||||||||||
|
Airfreight services
|
$
|
2,453,347
|
|
2,740,583
|
|
2,780,840
|
|
|||
|
Ocean freight and ocean services
|
1,917,494
|
|
2,194,004
|
|
2,174,394
|
|
||||
|
Customs brokerage and other services
|
1,727,196
|
|
1,682,045
|
|
1,609,487
|
|
||||
|
Total revenues
|
6,098,037
|
|
6,616,632
|
|
6,564,721
|
|
||||
|
Operating Expenses:
|
||||||||||
|
Airfreight services
|
1,752,167
|
|
1,987,690
|
|
2,103,777
|
|
||||
|
Ocean freight and ocean services
|
1,378,699
|
|
1,648,993
|
|
1,712,795
|
|
||||
|
Customs brokerage and other services
|
803,135
|
|
792,172
|
|
766,722
|
|
||||
|
Salaries and related costs
|
1,157,635
|
|
1,143,511
|
|
1,065,329
|
|
||||
|
Rent and occupancy costs
|
108,812
|
|
102,470
|
|
102,810
|
|
||||
|
Depreciation and amortization
|
46,796
|
|
46,012
|
|
49,292
|
|
||||
|
Selling and promotion
|
41,763
|
|
41,990
|
|
38,125
|
|
||||
|
Other
|
138,867
|
|
132,310
|
|
131,223
|
|
||||
|
Total operating expenses
|
5,427,874
|
|
5,895,148
|
|
5,970,073
|
|
||||
|
Operating income
|
670,163
|
|
721,484
|
|
594,648
|
|
||||
|
Other Income (Expense):
|
||||||||||
|
Interest income
|
11,580
|
|
10,421
|
|
10,773
|
|
||||
|
Other, net
|
5,113
|
|
4,784
|
|
5,468
|
|
||||
|
Other income, net
|
16,693
|
|
15,205
|
|
16,241
|
|
||||
|
Earnings before income taxes
|
686,856
|
|
736,689
|
|
610,889
|
|
||||
|
Income tax expense
|
254,323
|
|
277,192
|
|
231,429
|
|
||||
|
Net earnings
|
432,533
|
|
459,497
|
|
379,460
|
|
||||
|
Less net earnings attributable to the noncontrolling interest
|
1,726
|
|
2,274
|
|
2,572
|
|
||||
|
Net earnings attributable to shareholders
|
$
|
430,807
|
|
457,223
|
|
376,888
|
|
|||
|
Diluted earnings attributable to shareholders per share
|
$
|
2.36
|
|
2.40
|
|
1.92
|
|
|||
|
Basic earnings attributable to shareholders per share
|
$
|
2.38
|
|
2.42
|
|
1.92
|
|
|||
|
Weighted average diluted shares outstanding
|
182,704
|
|
190,223
|
|
196,768
|
|
||||
|
Weighted average basic shares outstanding
|
181,282
|
|
188,941
|
|
196,147
|
|
||||
See accompanying notes to consolidated financial statements.
|
F-4
.
Consolidated Statements of Comprehensive Income
In thousands
|
Years ended December 31,
|
2016
|
2015
|
2014
|
|||||||
|
Net earnings
|
$
|
432,533
|
|
459,497
|
|
379,460
|
|
|||
|
Other comprehensive loss, net of tax:
|
||||||||||
|
Foreign currency translation adjustments, net of tax of $12,687 in 2016, $23,801 in 2015 and $17,348 in 2014
|
(23,743
|
)
|
(44,090
|
)
|
(32,080
|
)
|
||||
|
Reclassification adjustments for foreign currency realized losses, net of tax of $61 in 2014
|
—
|
|
—
|
|
111
|
|
||||
|
Other comprehensive loss
|
(23,743
|
)
|
(44,090
|
)
|
(31,969
|
)
|
||||
|
Comprehensive income
|
408,790
|
|
415,407
|
|
347,491
|
|
||||
|
Less comprehensive income attributable to the noncontrolling interest
|
1,337
|
|
1,605
|
|
2,155
|
|
||||
|
Comprehensive income attributable to shareholders
|
$
|
407,453
|
|
413,802
|
|
345,336
|
|
|||
See accompanying notes to consolidated financial statements.
|
F-5
.
Consolidated Statements of Equity
In thousands except per share data
Years ended December 31,
2016
,
2015
and
2014
|
|
Common Stock
|
|||||
|
Shares
|
Par Value
|
|||||
|
Balance at December 31, 2013
|
202,553
|
|
$
|
2,025
|
|
|
|
Exercise of stock options and release of restricted shares
|
1,529
|
|
15
|
|
||
|
Issuance of shares under stock purchase plan
|
672
|
|
7
|
|
||
|
Shares repurchased under provisions of stock repurchase plans
|
(13,098
|
)
|
(131
|
)
|
||
|
Stock compensation expense
|
—
|
|
—
|
|
||
|
Tax benefits from stock plans, net
|
—
|
|
—
|
|
||
|
Net earnings
|
—
|
|
—
|
|
||
|
Other comprehensive loss
|
—
|
|
—
|
|
||
|
Dividends paid ($0.64 per share)
|
—
|
|
—
|
|
||
|
Purchase of noncontrolling interest
|
—
|
|
—
|
|
||
|
Distributions of dividends to noncontrolling interest
|
—
|
|
—
|
|
||
|
Balance at December 31, 2014
|
191,656
|
|
1,916
|
|
||
|
Exercise of stock options and release of restricted shares
|
2,851
|
|
29
|
|
||
|
Issuance of shares under stock purchase plan
|
699
|
|
7
|
|
||
|
Shares repurchased under provisions of stock repurchase plans
|
(13,139
|
)
|
(131
|
)
|
||
|
Stock compensation expense
|
—
|
|
—
|
|
||
|
Tax benefits from stock plans, net
|
—
|
|
—
|
|
||
|
Net earnings
|
—
|
|
—
|
|
||
|
Other comprehensive loss
|
—
|
|
—
|
|
||
|
Dividends paid ($0.72 per share)
|
—
|
|
—
|
|
||
|
Distributions of dividends to noncontrolling interest
|
—
|
|
—
|
|
||
|
Balance at December 31, 2015
|
182,067
|
|
1,821
|
|
||
|
Exercise of stock options and release of restricted shares
|
3,769
|
|
38
|
|
||
|
Issuance of shares under stock purchase plan
|
703
|
|
7
|
|
||
|
Shares repurchased under provisions of stock repurchase plans
|
(6,682
|
)
|
(67
|
)
|
||
|
Stock compensation expense
|
—
|
|
—
|
|
||
|
Tax benefits from stock plans, net
|
—
|
|
—
|
|
||
|
Net earnings
|
—
|
|
—
|
|
||
|
Other comprehensive loss
|
—
|
|
—
|
|
||
|
Dividends paid ($0.80 per share)
|
—
|
|
—
|
|
||
|
Purchase of noncontrolling interest
|
—
|
|
—
|
|
||
|
Distributions of dividends to noncontrolling interest
|
—
|
|
—
|
|
||
|
Balance at December 31, 2016
|
179,857
|
|
$
|
1,799
|
|
|
|
F-6
.
|
Additional
paid-in
capital
|
Retained
earnings
|
Accumulated other
comprehensive loss
|
Total
shareholders’
equity
|
Noncontrolling
interest
|
Total
equity
|
|||||||||||||
|
Balance at December 31, 2013
|
$
|
1,647
|
|
2,087,376
|
|
(6,265
|
)
|
2,084,783
|
|
1,548
|
|
2,086,331
|
|
|||||
|
Exercise of stock options and release of restricted shares
|
45,454
|
|
—
|
|
—
|
|
45,469
|
|
—
|
|
45,469
|
|
||||||
|
Issuance of shares under stock purchase plan
|
23,793
|
|
—
|
|
—
|
|
23,800
|
|
—
|
|
23,800
|
|
||||||
|
Shares repurchased under provisions of stock repurchase plans
|
(114,216
|
)
|
(436,434
|
)
|
—
|
|
(550,781
|
)
|
—
|
|
(550,781
|
)
|
||||||
|
Stock compensation expense
|
42,533
|
|
—
|
|
—
|
|
42,533
|
|
—
|
|
42,533
|
|
||||||
|
Tax benefits from stock plans, net
|
1,061
|
|
—
|
|
—
|
|
1,061
|
|
—
|
|
1,061
|
|
||||||
|
Net earnings
|
—
|
|
376,888
|
|
—
|
|
376,888
|
|
2,572
|
|
379,460
|
|
||||||
|
Other comprehensive loss
|
—
|
|
—
|
|
(31,552
|
)
|
(31,552
|
)
|
(417
|
)
|
(31,969
|
)
|
||||||
|
Dividends paid ($0.64 per share)
|
—
|
|
(124,634
|
)
|
—
|
|
(124,634
|
)
|
—
|
|
(124,634
|
)
|
||||||
|
Purchase of noncontrolling interest
|
841
|
|
—
|
|
—
|
|
841
|
|
—
|
|
841
|
|
||||||
|
Distributions of dividends to noncontrolling interest
|
—
|
|
—
|
|
—
|
|
—
|
|
(503
|
)
|
(503
|
)
|
||||||
|
Balance at December 31, 2014
|
1,113
|
|
1,903,196
|
|
(37,817
|
)
|
1,868,408
|
|
3,200
|
|
1,871,608
|
|
||||||
|
Exercise of stock options and release of restricted shares
|
105,085
|
|
—
|
|
—
|
|
105,114
|
|
—
|
|
105,114
|
|
||||||
|
Issuance of shares under stock purchase plan
|
25,843
|
|
—
|
|
—
|
|
25,850
|
|
—
|
|
25,850
|
|
||||||
|
Shares repurchased under provisions of stock repurchase plans
|
(176,493
|
)
|
(453,367
|
)
|
—
|
|
(629,991
|
)
|
—
|
|
(629,991
|
)
|
||||||
|
Stock compensation expense
|
43,415
|
|
—
|
|
—
|
|
43,415
|
|
—
|
|
43,415
|
|
||||||
|
Tax benefits from stock plans, net
|
1,068
|
|
—
|
|
—
|
|
1,068
|
|
—
|
|
1,068
|
|
||||||
|
Net earnings
|
—
|
|
457,223
|
|
—
|
|
457,223
|
|
2,274
|
|
459,497
|
|
||||||
|
Other comprehensive loss
|
—
|
|
—
|
|
(43,421
|
)
|
(43,421
|
)
|
(669
|
)
|
(44,090
|
)
|
||||||
|
Dividends paid ($0.72 per share)
|
—
|
|
(135,673
|
)
|
—
|
|
(135,673
|
)
|
—
|
|
(135,673
|
)
|
||||||
|
Distributions of dividends to noncontrolling interest
|
—
|
|
—
|
|
—
|
|
—
|
|
(2,122
|
)
|
(2,122
|
)
|
||||||
|
Balance at December 31, 2015
|
31
|
|
1,771,379
|
|
(81,238
|
)
|
1,691,993
|
|
2,683
|
|
1,694,676
|
|
||||||
|
Exercise of stock options and release of restricted shares
|
157,139
|
|
—
|
|
—
|
|
157,177
|
|
—
|
|
157,177
|
|
||||||
|
Issuance of shares under stock purchase plan
|
28,129
|
|
—
|
|
—
|
|
28,136
|
|
—
|
|
28,136
|
|
||||||
|
Shares repurchased under provisions of stock repurchase plans
|
(225,317
|
)
|
(112,274
|
)
|
—
|
|
(337,658
|
)
|
—
|
|
(337,658
|
)
|
||||||
|
Stock compensation expense
|
45,217
|
|
—
|
|
—
|
|
45,217
|
|
—
|
|
45,217
|
|
||||||
|
Tax benefits from stock plans, net
|
(2,664
|
)
|
—
|
|
—
|
|
(2,664
|
)
|
—
|
|
(2,664
|
)
|
||||||
|
Net earnings
|
—
|
|
430,807
|
|
—
|
|
430,807
|
|
1,726
|
|
432,533
|
|
||||||
|
Other comprehensive loss
|
—
|
|
—
|
|
(23,354
|
)
|
(23,354
|
)
|
(389
|
)
|
(23,743
|
)
|
||||||
|
Dividends paid ($0.80 per share)
|
—
|
|
(145,123
|
)
|
—
|
|
(145,123
|
)
|
—
|
|
(145,123
|
)
|
||||||
|
Purchase of noncontrolling interest
|
107
|
|
—
|
|
—
|
|
107
|
|
(110
|
)
|
(3
|
)
|
||||||
|
Distributions of dividends to noncontrolling interest
|
—
|
|
—
|
|
—
|
|
—
|
|
(1,335
|
)
|
(1,335
|
)
|
||||||
|
Balance at December 31, 2016
|
$
|
2,642
|
|
1,944,789
|
|
(104,592
|
)
|
1,844,638
|
|
2,575
|
|
1,847,213
|
|
|||||
See accompanying notes to consolidated financial statements.
|
F-7
.
Consolidated Statements of Cash Flows
In thousands
|
Years ended December 31,
|
2016
|
2015
|
2014
|
|||||||
|
Operating Activities:
|
||||||||||
|
Net earnings
|
$
|
432,533
|
|
459,497
|
|
379,460
|
|
|||
|
Adjustments to reconcile net earnings to net cash from operating activities:
|
||||||||||
|
Provision for losses on accounts receivable
|
2,607
|
|
2,173
|
|
763
|
|
||||
|
Deferred income tax expense (benefit)
|
15,835
|
|
17,999
|
|
(6,576
|
)
|
||||
|
Excess tax benefits from stock plans
|
(386
|
)
|
(1,850
|
)
|
(1,115
|
)
|
||||
|
Stock compensation expense
|
45,217
|
|
43,415
|
|
42,533
|
|
||||
|
Depreciation and amortization
|
46,796
|
|
46,012
|
|
49,292
|
|
||||
|
Other
|
(3,540
|
)
|
(24
|
)
|
340
|
|
||||
|
Changes in operating assets and liabilities:
|
||||||||||
|
(Increase) decrease in accounts receivable
|
(102,297
|
)
|
62,619
|
|
(206,887
|
)
|
||||
|
Increase (decrease) in accounts payable and accrued expenses
|
102,716
|
|
(84,164
|
)
|
153,424
|
|
||||
|
(Decrease) increase in income taxes payable, net
|
(12,370
|
)
|
18,382
|
|
(12,998
|
)
|
||||
|
Decrease (increase) in other current assets
|
1,988
|
|
653
|
|
(3,270
|
)
|
||||
|
Net cash from operating activities
|
529,099
|
|
564,712
|
|
394,966
|
|
||||
|
Investing Activities:
|
||||||||||
|
Purchase of short-term investments
|
(54
|
)
|
(47,026
|
)
|
(136,726
|
)
|
||||
|
Proceeds from maturities of short-term investments
|
17
|
|
87,320
|
|
122,726
|
|
||||
|
Purchase of property and equipment
|
(59,316
|
)
|
(44,383
|
)
|
(37,472
|
)
|
||||
|
Escrow deposit for land acquisition
|
—
|
|
—
|
|
(27,101
|
)
|
||||
|
Other, net
|
6,157
|
|
(3,337
|
)
|
(338
|
)
|
||||
|
Net cash from investing activities
|
(53,196
|
)
|
(7,426
|
)
|
(78,911
|
)
|
||||
|
Financing Activities:
|
||||||||||
|
Proceeds from issuance of common stock
|
185,313
|
|
130,964
|
|
69,269
|
|
||||
|
Repurchases of common stock
|
(337,658
|
)
|
(629,991
|
)
|
(550,781
|
)
|
||||
|
Excess tax benefits from stock plans
|
386
|
|
1,850
|
|
1,115
|
|
||||
|
Dividends paid
|
(145,123
|
)
|
(135,673
|
)
|
(124,634
|
)
|
||||
|
Distributions to noncontrolling interest
|
(1,335
|
)
|
(2,122
|
)
|
(503
|
)
|
||||
|
Net cash from financing activities
|
(298,417
|
)
|
(634,972
|
)
|
(605,534
|
)
|
||||
|
Effect of exchange rate changes on cash and cash equivalents
|
(10,847
|
)
|
(41,625
|
)
|
(31,066
|
)
|
||||
|
Increase (decrease) in cash and cash equivalents
|
166,639
|
|
(119,311
|
)
|
(320,545
|
)
|
||||
|
Cash and cash equivalents at beginning of year
|
807,796
|
|
927,107
|
|
1,247,652
|
|
||||
|
Cash and cash equivalents at end of year
|
$
|
974,435
|
|
807,796
|
|
927,107
|
|
|||
|
Taxes Paid:
|
||||||||||
|
Income taxes
|
$
|
254,312
|
|
239,367
|
|
254,439
|
|
|||
See accompanying notes to consolidated financial statements
|
F-8
.
NOTES TO CONSOLIDATED FINANCIAL STATEMENTS
|
NOTE 1.
|
SUMMARY OF SIGNIFICANT ACCOUNTING POLICIES
|
A. | Basis of Presentation
Expeditors International of Washington, Inc. (“the Company”) is a non-asset based provider of global logistics services operating through a worldwide network of offices and exclusive or non-exclusive agents. The Company’s customers include retailing and wholesaling, electronics, industrial and manufacturing companies around the world.
International trade is influenced by many factors, including economic and political conditions in the United States and abroad, currency exchange rates and currency control regulations, regulatory environments, cargo and other security concerns, laws and policies relating to tariffs, trade and quota restrictions, foreign investments and taxation. Periodically, governments consider a variety of changes to current tariffs and trade restrictions and accords. The Company cannot predict which, if any, of these proposals may be adopted, nor can the Company predict the effects adoption of any such proposal will have on the Company’s business. Doing business in foreign locations also subjects the Company to a variety of risks and considerations not normally encountered by domestic enterprises. In addition to being influenced by governmental policies concerning international trade and commerce, the Company’s business may also be affected by political developments and changes in government personnel or policies as well as economic turbulence, political unrest and security concerns in the nations in which it does business and the future impact that these events may have on international trade including impact on oil prices.
The consolidated financial statements have been prepared pursuant to the rules and regulations of the Securities and Exchange Commission in accordance with accounting principles generally accepted in the United States (U.S. GAAP). The consolidated financial statements include the accounts of the Company and its subsidiaries stated in U.S. dollars, the Company’s reporting currency. In addition, the consolidated financial statements also include the accounts of operating entities where the Company maintains a parent-subsidiary relationship through unilateral control over assets and operations together with responsibility for payment of all liabilities, notwithstanding a lack of technical majority ownership of the subsidiary's common stock.
All significant intercompany accounts and transactions have been eliminated in consolidation. All dollar amounts in the notes are presented in thousands except for per share data or unless otherwise specified. Certain prior year amounts have been reclassified to conform to the 2016 presentation. See Note 1.F below for further information.
B. | Cash Equivalents and Short-term Investments
All highly liquid investments with a maturity of three months or less at date of purchase are considered to be cash equivalents. Short-term investments have a maturity of greater than three months at the date of purchase.
C. | Accounts Receivable
The Company maintains an allowance for doubtful accounts, which is reviewed at least monthly for estimated losses resulting from the inability of its customers to make required payments for services and advances. Additional allowances may be necessary in the future if the ability of its customers to pay deteriorates. The Company has recorded an allowance for doubtful accounts in the amounts of
$9,247
,
$7,820
and
$7,119
as of
December 31, 2016
,
2015
and
2014
, respectively. Additions and write-offs have not been significant in any of these years.
D. | Long-Lived Assets, Depreciation and Amortization
Property and equipment are recorded at cost and are depreciated or amortized on the straight-line method over the shorter of the assets’ estimated useful lives or lease terms. Useful lives for major categories of property and equipment are as follows:
|
Land improvements
|
50 years
|
|
Buildings
|
28 to 40 years
|
|
Building improvements and fixtures
|
3 to 10 years
|
|
Furniture, equipment and purchased software
|
3 to 5 years
|
Expenditures for maintenance, repairs, and replacements of minor items are charged to earnings as incurred. Major upgrades and improvements that extend the life of the asset are capitalized. Upon disposition, the cost and related accumulated depreciation are removed from the accounts and the resulting gain or loss is included in income for the period.
For the years ended
December 31, 2016
and
2015
, the Company performed the required goodwill annual impairment test during the fourth quarter and determined that no impairment had occurred.
E. | Revenues and Revenue Recognition
The Company derives its revenues from three principal sources: 1) airfreight services, 2) ocean freight and ocean services, and 3) customs brokerage and other services. These are the revenue categories presented in the financial statements.
As a non-asset based carrier, the Company does not own transportation assets. Rather, the Company generates the major portion of its air and ocean freight revenues by purchasing transportation services from direct (asset-based) carriers and reselling those services to its customers. The difference between the rate billed to customers (the sell rate), and the rate paid to the carrier (the buy rate) is termed “net revenue” (a non-GAAP measure), “yield” or "margin." By consolidating shipments from multiple customers and concentrating its buying power, the Company is able to negotiate favorable buy rates from the direct carriers, while at the same time offering lower sell rates than customers would otherwise be able to negotiate themselves.
|
F-9
.
Airfreight services revenues include the charges to the Company for carrying the shipments when the Company acts as a freight consolidator. Ocean freight services revenues include the charges to the Company for carrying the shipments when the Company acts as a Non-Vessel Operating Common Carrier (NVOCC). In each case the Company is acting as an indirect carrier. When acting as an indirect carrier, the Company will issue a House Airway Bill (HAWB), a House Ocean Bill of Lading (HOBL) or a House Seaway Bill to customers as the contract of carriage. In turn, when the freight is physically tendered to a direct carrier, the Company receives a contract of carriage known as a Master Airway Bill for airfreight shipments and a Master Ocean Bill of Lading for ocean shipments. At this point, the risk of loss passes to the carrier, however, in order to claim for any such loss, the customer is first obligated to pay the freight charges. In these transactions, the Company evaluates whether it is appropriate to record the gross or net amount as revenue. Generally, when the Company is the primary obligor, it is obligated to compensate direct carriers for services performed regardless of whether customers accept the service, has latitude in establishing price, has discretion in selecting the direct carrier, has credit risk or has several but not all of these indicators, revenue is recorded on a gross basis. Revenue is generally recorded on a net basis where the Company is not primarily obligated and does not have latitude in establishing prices. Such amounts earned are determined using a fixed fee, a per unit of activity fee or a combination thereof.
Based upon the terms in the contract of carriage, revenues related to shipments where the Company issues a HAWB, a HOBL or a House Seaway Bill are recognized at the time the freight is tendered to the direct carrier at origin. Costs related to the shipments are also recognized at this same time.
Revenues earned in other capacities, for instance, when the Company acts as an agent for the shipper, and does not issue a HAWB, a HOBL or a House Seaway Bill, include only the commissions and fees earned for the services performed. In these transactions, the Company is not a principal and reports only commissions and fees earned in revenue. These revenues are recognized upon completion of the services.
Customs brokerage and other services involves providing services at destination, such as helping customers clear shipments through customs by preparing required documentation, calculating and providing for payment of duties and other taxes on behalf of the customers as well as arranging for any required inspections by governmental agencies, and arranging for delivery. This is a complicated function requiring technical knowledge of customs rules and regulations in the multitude of countries in which the Company has offices. Revenues related to customs brokerage and other services are recognized upon completion of the services. Arranging international shipments is a complex task. Each actual movement can require multiple services. In some instances, the Company is asked to perform only one of these services. However, in most instances, the Company performs multiple services. These services include ancillary services such as local transportation, export customs formalities, distribution services and logistics management. Each of these services has an associated fee which is recognized as revenue upon completion of the service.
Typically, the fees for each of these services are quoted as separate components, however, customers on occasion will request an all-inclusive rate for a set of services known in the industry as “door-to-door service.” This means that the customer is billed a single rate for all services from pickup at origin to delivery at destination. In these instances, the revenue for origin and destination services, as well as revenue that will be characterized as freight charges, is allocated to branches as set by preexisting Company policy modified as agreed upon by customer specific negotiations between the offices involved. Each of the Company’s branches are separate profit centers and the primary compensation for the branch management group comes in the form of incentive-based compensation calculated directly from the operating income of that branch. This compensation structure ensures that the allocation of revenue and expense among components of services, when provided under an all-inclusive rate, is done in an objective manner on a relative selling price basis.
The Company presents revenues net of sales and value-added taxes.
F. | Income Taxes
Income taxes are accounted for under the asset and liability method of accounting. Under this method, deferred tax assets and liabilities are recognized for the future tax consequences attributed to differences between the financial statement carrying amounts of existing assets and liabilities and their respective tax bases, the tax effect of loss carryforwards and tax credit carryforwards. Deferred tax assets and liabilities are measured using enacted tax rates expected to apply to taxable income in the years in which those temporary differences are expected to be recovered or settled. The effect on deferred tax assets and liabilities of a change in tax rates is recognized in income in the period that includes the enactment date. Earnings of the Company's foreign subsidiaries are not considered to be indefinitely reinvested outside of the United States and, accordingly, U.S. Federal and State income taxes have been provided for all undistributed earnings net of related foreign tax credits. A valuation allowance is established when necessary to reduce deferred tax assets to amounts expected to be realized. The Company recognizes interest expense related to unrecognized tax benefits or underpayment of income taxes in interest expense and recognizes penalties in operating expenses. In the fourth quarter of 2016, the Company adopted accounting guidance that retroactively changed the presentation of deferred tax assets and liabilities to be classified as non-current. As a result, the Company retrospectively reclassified previously reported current deferred income tax assets totaling
$16,861
at December 31, 2015 to a reduction of noncurrent deferred tax liabilities, presented as Deferred Federal and state income taxes, net on the Consolidated Balance Sheets.
G | Net Earnings Attributable to Shareholders per Common Share
Diluted earnings attributable to shareholders per share is computed using the weighted average number of common shares and dilutive potential common shares outstanding. Dilutive potential common shares represent outstanding stock options, stock purchase rights and unvested restricted shares. Basic earnings attributable to shareholders per share is calculated using the weighted average number of common shares outstanding without taking into consideration dilutive potential common shares outstanding.
|
F-10
.
H. | Stock Plans
The Company recognizes stock compensation expense based on an estimate of the fair value of awards granted to employees and directors under the Company’s stock option, director restricted stock and employee stock purchase rights plans. This expense, adjusted for expected forfeitures, is recognized in net earnings on a straight-line basis over the stock awards' vesting periods as salaries and related costs.
I. | Foreign Currency
Foreign currency amounts attributable to foreign operations have been translated into U.S. dollars using year-end exchange rates for assets and liabilities, historical rates for equity, and weighted average rates for revenues and expenses. Translation adjustments resulting from this process are recorded as components of other comprehensive income until complete or substantially complete liquidation by the Company of its investment in a foreign entity. Currency fluctuations are a normal operating factor in the conduct of the Company’s business and foreign exchange transaction gains and losses are included in revenues and operating expenses. Also, the Company is exposed to foreign currency exchange fluctuations on monetary assets and liabilities denominated in currencies that are not the local functional currency. Foreign exchange gains and losses on such balances are recognized in net earnings within airfreight services costs, customs brokerage and other services costs and other income, net. Net foreign currency gains in
2016
,
2015
and
2014
were
$7,955
,
$7,820
, and
$1,517
, respectively.
The Company follows a policy of accelerating international currency settlements to manage its foreign exchange exposure. Accordingly, the Company enters into foreign currency hedging transactions only in limited locations where there are regulatory or commercial limitations on the Company’s ability to move money freely. Such hedging activity during
2016
,
2015
, and
2014
was insignificant. The Company had no foreign currency derivatives outstanding at
December 31, 2016
and
2015
.
J. | Comprehensive Income
Comprehensive income consists of net earnings and other gains and losses affecting equity that, under U.S. GAAP, are excluded from net earnings. For the Company, these consist of foreign currency translation gains and losses, net of related income tax effects and comprehensive income or loss attributable to the noncontrolling interests. Upon the complete or substantially complete liquidation of the Company's investment in a foreign entity, cumulative translation adjustments are recorded as reclassification adjustments in other comprehensive income and recognized in net earnings as other income, net.
Accumulated other comprehensive loss consisted entirely of foreign currency translation adjustments, net of related income tax effects, as of
December 31, 2016
and
2015
.
K. | Segment Reporting
The Company is organized functionally in geographic operating segments. Accordingly, management focuses its attention on revenues, net revenues, operating income, identifiable assets, capital expenditures, depreciation and amortization and equity generated in each of these geographical areas when evaluating the effectiveness of geographic management. Transactions among the Company’s various offices are conducted using the same arms-length pricing methodologies the Company uses when its offices transact business with independent agents. Certain costs are allocated among the segments based on the relative value of the underlying services, which can include allocation based on actual costs incurred or estimated cost plus a profit margin.
L. | Use of Estimates
The preparation of financial statements in conformity with U.S. GAAP requires management to make estimates and assumptions that affect the reported amounts of the assets and liabilities and disclosure of contingent assets and liabilities at the date of the financial statements and the reported amounts of revenues and expenses during the period. The Company uses estimates primarily in the following areas: accounts receivable valuation, accrual of costs related to ancillary services the Company provides, accrual of liabilities for the portion of the related exposure which the Company has self-insured, accrual of various tax liabilities, accrual of loss contingencies and calculation of share-based compensation expense. Actual results could differ from those estimates.
|
NOTE 2.
|
PROPERTY AND EQUIPMENT
|
The components of property and equipment are as follows:
|
|
Years ended December 31,
|
||||||
|
2016
|
2015
|
||||||
|
Land
|
$
|
172,310
|
|
162,923
|
|
||
|
Buildings and leasehold improvements
|
467,096
|
|
468,607
|
|
|||
|
Furniture, fixtures, equipment and purchased software
|
296,214
|
|
274,723
|
|
|||
|
Construction in progress
|
7,604
|
|
3,494
|
|
|||
|
Property and equipment, at cost
|
943,224
|
|
909,747
|
|
|||
|
Less accumulated depreciation and amortization
|
406,652
|
|
385,023
|
|
|||
|
Property and equipment, net
|
$
|
536,572
|
|
524,724
|
|
||
In 2016, the Company completed a land acquisition in Europe, utilizing funds that had been placed in escrow in 2014. In January 2017, the Company formally approved a plan to sell land and buildings in Miami, Florida. The sale of the property is anticipated to occur in 2017 and the Company believes that the estimated selling price, less selling costs, will exceed the net book value of
$80 million
.
|
F-11
.
|
NOTE 3.
|
SHAREHOLDERS’ EQUITY
|
A. | Stock Repurchase Plans
The Company has a Non-Discretionary Stock Repurchase Plan, originally approved by the Board of Directors in November 1993, under which management is authorized to repurchase up to
40,000
shares of the Company’s common stock in the open market with the proceeds received from the exercise of employee and director stock options.
The Company has a Discretionary Stock Repurchase Plan originally approved by the Board of Directors in November 2001, and amended from time to time under which management as of
December 31, 2016
is authorized to repurchase shares down to
170,000
shares of common stock outstanding.
The following table summarizes by repurchase plan the Company’s repurchasing activity:
|
Cumulative shares
repurchased
|
Average price
per share
|
||||||
|
Non-Discretionary Plan (1994 through 2016)
|
33,674
|
|
$
|
29.92
|
|
||
|
Discretionary Plan (2001 through 2016)
|
57,710
|
|
$
|
40.57
|
|
||
B. | Stock Option Plans
At
December 31, 2016
, the Company had one stock option plan (the
2016
Plan) under which the Board of Directors may grant officers and employees options to purchase common stock at prices equal to or greater than market value on the date of grant. On
May 3, 2016
, the shareholders approved the Company’s
2016
Plan, which made available a total of
3 million
shares of the Company’s common stock for purchase upon exercise of options granted. The
2016
Plan provides for qualified and non-qualified grants, which are limited to
100
shares per person. As of
December 31, 2016
, there are
76
shares available for grant under the
2016
Plan. No additional shares can be granted under the
2016
Plan after April 30,
2017
. Stock options granted under the
2016
Plan vest over
three years
from the date of grant as compared to
five years
for options granted in prior years. Outstanding options expire no more than
ten
years from the date of grant.
Upon the exercise of non-qualified stock options and disqualifying dispositions of incentive stock options, the Company derives a tax deduction measured by the excess of the market value over the option price at the date of exercise or disqualifying disposition. The portion of the benefit from the deduction which equals the estimated fair value of the options (previously recognized as compensation expense) is recorded as a credit to the deferred tax asset for non-qualified stock options and is recorded as a credit to current tax expense for any disqualified dispositions of incentive stock options. For disqualifying dispositions, when the amount of the tax deduction is less than the cumulative amount of compensation expense recognized for the award, the amount credited to current tax expense is limited to the tax benefit associated with the tax deduction. All of the tax benefit received upon option exercise for the tax deduction in excess of the estimated fair value of the options is credited to additional paid-in capital. Commencing in 2017, in connection with the new requirements and adoption of accounting guidance issued in March 2016, these tax amounts will no longer be recorded in additional paid-in capital and instead will be reflected as components of income tax expense.
C. | Stock Purchase Plan
In May 2002, the shareholders approved the Company’s 2002 Employee Stock Purchase Plan (the 2002 Plan), which became effective August 1, 2002. On
May 7, 2014
, the shareholders approved an amendment to the 2002 Plan to increase the Company's common stock available for purchase under that plan by
3 million
shares. The Company’s amended 2002 Plan provides for
12,305
shares of the Company’s common stock to be reserved for issuance upon exercise of purchase rights granted to employees who elect to participate through regular payroll deductions beginning August 1 of each year. The purchase rights are exercisable on July 31 of the following year at a price equal to the lesser of (1)
85%
of the fair market value of the Company’s stock on the last trading day in July or (2)
85%
of the fair market value of the Company’s stock on the first trading day in August of the preceding year. A total of
10,214
shares have been issued under the 2002 Plan and
$14,000
has been withheld from employees at
December 31, 2016
in connection with the plan year ending July 31, 2017.
D. | Director Restricted Stock Plan
On
May 7, 2014
, the shareholders approved the Company’s 2014 Directors’ Restricted Stock Plan (the 2014 Directors’ Plan), which provides for annual awards of restricted stock to non-employee directors and makes
250
shares of the Company’s common stock available for grant. The plan provides for an annual grant of restricted stock awards with a fair market value equal to
$200
to each participant on June 1 of each year. There are
144
shares available for grant under this plan as of
December 31, 2016
. Each restricted stock award under the 2014 Directors’ Plan vests either at the time of grant or with a vesting schedule, as determined by the Compensation Committee of the Board of Directors. Restricted shares granted in
2015
and
2016
vested at the time of grant and there were
no
unvested restricted shares as of
December 31, 2016
. Restricted shares entitle the grantees to all shareholder rights, including cash dividends and transfer rights once vested. If a non-employee director’s service is terminated, any unvested portion of an award would be forfeited.
|
F-12
.
E. | Stock Option Activity
The following table summarizes information about stock options:
|
Number of
shares
|
Weighted
average
exercise price
per share
|
Weighted
average
remaining
contractual life
|
Aggregate
intrinsic value
|
||||||||||
|
Outstanding at December 31, 2015
|
18,732
|
|
$
|
43.39
|
|
||||||||
|
Options granted
|
2,973
|
|
$
|
47.39
|
|
||||||||
|
Options exercised
|
(3,732
|
)
|
$
|
42.17
|
|
||||||||
|
Options forfeited
|
(351
|
)
|
$
|
43.48
|
|
||||||||
|
Options canceled
|
(248
|
)
|
$
|
49.38
|
|
||||||||
|
Outstanding at December 31, 2016
|
17,374
|
|
$
|
44.25
|
|
6.19
|
$
|
151,274
|
|
||||
|
Exercisable at December 31, 2016
|
7,334
|
|
$
|
44.21
|
|
3.69
|
$
|
64,181
|
|
||||
F. | Share-Based Compensation Expense
The fair value of each option grant is estimated on the date of grant using the Black-Scholes option pricing model with the following assumptions:
|
|
For the years ended December 31,
|
|||||||||||
|
2016
|
2015
|
2014
|
||||||||||
|
Dividend yield
|
1.70
|
%
|
1.60
|
%
|
1.50 - 1.51%
|
|
||||||
|
Volatility – stock option plans
|
24 - 25%
|
|
29 - 34%
|
|
35 - 36%
|
|
||||||
|
Volatility – stock purchase rights plans
|
20
|
%
|
20
|
%
|
20
|
%
|
||||||
|
Risk-free interest rates
|
0.51 - 1.42%
|
|
0.30 - 2.04%
|
|
0.11 - 2.27%
|
|
||||||
|
Expected life (years) – stock option plans
|
5.5 - 6.5
|
|
6.41 - 7.47
|
|
6.52 - 7.43
|
|
||||||
|
Expected life (years) – stock purchase rights plans
|
1
|
|
1
|
|
1
|
|
||||||
|
Weighted average fair value of stock options granted during the period
|
$
|
9.57
|
|
$
|
13.44
|
|
$
|
14.44
|
|
|||
|
Weighted average fair value of stock purchase rights granted during the period
|
$
|
10.99
|
|
$
|
10.45
|
|
$
|
9.60
|
|
|||
The Company’s expected volatility assumptions are based on the historical volatility of the Company’s stock over a period of time commensurate to the expected life. The expected life assumption is primarily based on historical employee exercise patterns and employee post-vesting termination behavior. The risk-free interest rate for the expected term of the option is based on the corresponding yield curve in effect at the time of grant for U.S. Treasury bonds having the same term as the expected life of the option. The expected dividend yield is based on the Company’s historical experience. The forfeiture assumption used to calculate compensation expense is primarily based on historical pre-vesting employee forfeiture patterns.
The compensation for restricted stock awards is based on the fair market value of the Company’s share of common stock on the date of grant. In
2016
, restricted shares totaling
41
were granted with a fair value per share of
$48.43
.
The total intrinsic value of options exercised during the years ended
December 31, 2016
,
2015
and
2014
was approximately
$29 million
,
$31 million
and
$18 million
, respectively.
As of
December 31, 2016
, the total unrecognized compensation cost related to unvested stock options and stock purchase rights is
$81 million
and the weighted average period over which that cost is expected to be recognized is
2.5
years.
Total stock compensation expense and the total related tax benefit recognized are as follows:
|
|
For the years ended December 31,
|
|||||||||
|
2016
|
2015
|
2014
|
||||||||
|
Stock compensation expense
|
$
|
45,217
|
|
43,415
|
|
42,533
|
|
|||
|
Recognized tax benefit
|
$
|
8,178
|
|
6,010
|
|
4,356
|
|
|||
Shares issued as a result of stock option exercises, restricted stock awards and employee stock plan purchases are issued as new shares outstanding by the Company.
|
F-13
.
|
NOTE 4.
|
BASIC AND DILUTED EARNINGS PER SHARE
|
The following table reconciles the numerator and the denominator of the basic and diluted per share computations for earnings attributable to shareholders.
|
Net earnings
attributable to
shareholders
|
Weighted
average
shares
|
Earnings
per share
|
|||||||||
|
2016
|
|||||||||||
|
Basic earnings attributable to shareholders
|
$
|
430,807
|
|
181,282
|
|
$
|
2.38
|
|
|||
|
Effect of dilutive potential common shares
|
—
|
|
1,422
|
|
—
|
|
|||||
|
Diluted earnings attributable to shareholders
|
$
|
430,807
|
|
182,704
|
|
$
|
2.36
|
|
|||
|
2015
|
|||||||||||
|
Basic earnings attributable to shareholders
|
$
|
457,223
|
|
188,941
|
|
$
|
2.42
|
|
|||
|
Effect of dilutive potential common shares
|
—
|
|
1,282
|
|
—
|
|
|||||
|
Diluted earnings attributable to shareholders
|
$
|
457,223
|
|
190,223
|
|
$
|
2.40
|
|
|||
|
2014
|
|||||||||||
|
Basic earnings attributable to shareholders
|
$
|
376,888
|
|
196,147
|
|
$
|
1.92
|
|
|||
|
Effect of dilutive potential common shares
|
—
|
|
621
|
|
—
|
|
|||||
|
Diluted earnings attributable to shareholders
|
$
|
376,888
|
|
196,768
|
|
$
|
1.92
|
|
|||
The following potential common shares have been excluded from the computation of diluted earnings per share because the effect would have been antidilutive:
|
Years ended December 31,
|
2016
|
2015
|
2014
|
||||||
|
Shares
|
9,211
|
|
8,330
|
|
16,952
|
|
|||
|
NOTE 5.
|
INCOME TAXES
|
Income tax expense (benefit) includes the following components:
|
Federal
|
State
|
Foreign
|
Total
|
||||||||||
|
2016
|
|||||||||||||
|
Current
|
$
|
85,330
|
|
16,082
|
|
137,076
|
|
238,488
|
|
||||
|
Deferred
|
16,903
|
|
(1,068
|
)
|
—
|
|
15,835
|
|
|||||
|
$
|
102,233
|
|
15,014
|
|
137,076
|
|
254,323
|
|
|||||
|
2015
|
|||||||||||||
|
Current
|
$
|
95,046
|
|
16,973
|
|
147,174
|
|
259,193
|
|
||||
|
Deferred
|
17,631
|
|
368
|
|
—
|
|
17,999
|
|
|||||
|
$
|
112,677
|
|
17,341
|
|
147,174
|
|
277,192
|
|
|||||
|
2014
|
|||||||||||||
|
Current
|
$
|
93,345
|
|
17,093
|
|
127,567
|
|
238,005
|
|
||||
|
Deferred
|
(6,023
|
)
|
(553
|
)
|
—
|
|
(6,576
|
)
|
|||||
|
$
|
87,322
|
|
16,540
|
|
127,567
|
|
231,429
|
|
|||||
Income tax expense differs from amounts computed by applying the United States Federal income tax rate of
35%
to earnings before income taxes as a result of the following:
|
2016
|
2015
|
2014
|
||||||||
|
Computed “expected” tax expense
|
$
|
240,400
|
|
257,841
|
|
213,811
|
|
|||
|
Increase in income taxes resulting from:
|
||||||||||
|
State income taxes, net of Federal income tax benefit
|
9,759
|
|
11,272
|
|
10,751
|
|
||||
|
Nondeductible stock compensation expense, net
|
3,629
|
|
5,241
|
|
8,069
|
|
||||
|
Other, net
|
535
|
|
2,838
|
|
(1,202
|
)
|
||||
|
$
|
254,323
|
|
277,192
|
|
231,429
|
|
||||
The components of earnings before income taxes are as follows:
|
2016
|
2015
|
2014
|
||||||||
|
United States
|
$
|
243,754
|
|
236,932
|
|
211,588
|
|
|||
|
Foreign
|
443,102
|
|
499,757
|
|
399,301
|
|
||||
|
$
|
686,856
|
|
736,689
|
|
610,889
|
|
||||
|
F-14
.
The tax effects of temporary differences and tax credits that give rise to significant portions of deferred tax assets and deferred tax liabilities are as follows:
|
Years ended December 31,
|
2016
|
2015
|
|||||
|
Deferred Tax Assets:
|
|||||||
|
Accrued third party obligations, deductible for taxes upon economic performance
|
$
|
15,153
|
|
14,473
|
|
||
|
Provision for doubtful accounts receivable
|
497
|
|
1,041
|
|
|||
|
Excess of financial statement over tax depreciation
|
10,650
|
|
10,349
|
|
|||
|
Deductible stock compensation expense, net
|
21,758
|
|
18,910
|
|
|||
|
Foreign currency translation adjustment
|
57,207
|
|
44,519
|
|
|||
|
Retained liability for cargo claims
|
1,178
|
|
1,350
|
|
|||
|
Total gross deferred tax assets
|
106,443
|
|
90,642
|
|
|||
|
Deferred Tax Liabilities:
|
|||||||
|
Unremitted foreign earnings, net of related foreign tax credits
|
120,170
|
|
100,170
|
|
|||
|
Total gross deferred tax liabilities
|
$
|
120,170
|
|
100,170
|
|
||
|
Net deferred tax liabilities
|
$
|
13,727
|
|
9,528
|
|
||
Based on management’s review of the Company’s tax positions, the Company had no significant unrecognized tax benefits as of
December 31, 2016
and
2015
.
The Company or one of its subsidiaries files income tax returns in the U.S. federal jurisdiction and various state, local and foreign jurisdictions. The Company is no longer subject to U.S. federal income tax examinations by tax authorities for years prior to 2013. With respect to state and local jurisdictions and countries outside of the United States, with limited exceptions, the Company and its subsidiaries are no longer subject to income tax audits for years prior to 2001. In the normal course of business, the Company is subject to examination by taxing authorities throughout the world. Although the outcome of tax audits is always uncertain, the Company believes that adequate amounts of tax, interest and penalties have been provided for any adjustments that may result from these open tax years. Any interest and penalties expensed in relation to the underpayment of income taxes were insignificant for the years ended
December 31, 2016
,
2015
and
2014
.
|
NOTE 6.
|
FAIR VALUE OF FINANCIAL INSTRUMENTS
|
The Company’s financial instruments, other than cash, consist primarily of cash equivalents, short-term investments, accounts receivable, accounts payable and accrued expenses. The carrying value of these financial instruments approximates their fair value. Cash, cash equivalents and short-term investments consist of the following:
|
|
December 31, 2016
|
December 31, 2015
|
||||||||||||||
|
|
Cost
|
Fair Value
|
Cost
|
Fair Value
|
||||||||||||
|
Cash and cash equivalents:
|
||||||||||||||||
|
Cash and overnight deposits
|
$
|
406,787
|
|
406,787
|
|
445,582
|
|
445,582
|
|
|||||||
|
Corporate commercial paper
|
507,777
|
|
507,889
|
|
302,433
|
|
302,480
|
|
||||||||
|
Time deposits
|
59,871
|
|
59,871
|
|
59,781
|
|
59,781
|
|
||||||||
|
Total cash and cash equivalents
|
974,435
|
|
974,547
|
|
807,796
|
|
807,843
|
|
||||||||
|
Short-term investments:
|
||||||||||||||||
|
Time deposits
|
35
|
|
35
|
|
40
|
|
40
|
|
||||||||
|
Total
|
$
|
974,470
|
|
$
|
974,582
|
|
$
|
807,836
|
|
$
|
807,883
|
|
||||
The fair value of corporate commercial paper and time deposits is based on the use of market interest rates for identical or similar assets (Level 2 fair value measurement).
|
NOTE 7.
|
CREDIT ARRANGEMENTS
|
Certain of the Company’s foreign subsidiaries maintain bank lines of credit for short-term working capital purposes. These credit lines are supported by standby letters of credit issued by a United States bank, or guarantees issued by the Company to the foreign banks issuing the credit line. At
December 31, 2016
, the Company was contingently liable for approximately
$63,968
under outstanding standby letters of credit and guarantees. At
December 31, 2016
, the Company was in compliance with all restrictive covenants of these credit lines and the associated credit facilities.
The standby letters of credit and guarantees relate to obligations of the Company’s foreign subsidiaries for credit extended in the ordinary course of business by direct carriers, primarily airlines, and for duty and tax deferrals available from governmental entities responsible for customs and value-added-tax (VAT) taxation. The total underlying amounts due and payable for transportation and governmental excise taxes are properly recorded as obligations in the books of the respective foreign subsidiaries, and there would be no need to record additional expense in the unlikely event the parent company were to be required to perform.
|
F-15
.
|
NOTE 8.
|
COMMITMENTS
|
A. | Leases
The Company occupies office and warehouse facilities under terms of operating leases expiring up to
2028
. The Company also has
two
long term operating lease arrangements to use land, for which the usage rights were entirely prepaid. Usage rights for those arrangements are recognized in rent expense over the lease terms up to
2057
. Total rent expense for all operating leases in
2016
,
2015
and
2014
was
$62,294
,
$58,133
and
$58,050
, respectively.
At
December 31, 2016
, future minimum annual lease payments under all noncancelable leases are as follows:
|
2017
|
$
|
58,502
|
|
|
2018
|
46,642
|
|
|
|
2019
|
35,986
|
|
|
|
2020
|
28,056
|
|
|
|
2021
|
16,847
|
|
|
|
Thereafter
|
28,224
|
|
|
|
$
|
214,257
|
|
|
B. | Unconditional Purchase Obligations
The Company enters into short-term unconditional purchase obligations with asset-based providers reserving space on a guaranteed basis. The pricing of these obligations varies to some degree with market conditions. Historically, the Company has met these obligations in the normal course of business within one year. Purchase obligations outstanding as of
December 31, 2016
totaled
$76,306
.
C. | Employee Benefits
The Company has employee savings plans under which the Company provides a discretionary matching contribution. In
2016
,
2015
and
2014
, the Company’s contributions under the plans were
$9,681
,
$8,658
, and
$8,262
, respectively.
|
NOTE 9.
|
CONTINGENCIES
|
The Company is involved in claims, lawsuits, government investigations and other legal matters that arise in the ordinary course of business and are subject to inherent uncertainties. Currently, in management's opinion and based upon advice from legal advisors, none of these matters are expected to have a significant effect on the Company's operations, cash flows or financial position. As of
December 31, 2016
, the amounts accrued for these claims, lawsuits, government investigations and other legal matters are not significant to the Company's operations, cash flows or financial position. At this time, the Company is unable to estimate any additional loss or range of reasonably possible losses, if any, beyond the amounts recorded, that might result from the resolution of these matters.
|
F-16
.
|
NOTE 10.
|
BUSINESS SEGMENT INFORMATION
|
Financial information regarding
2016
,
2015
and
2014
operations by the Company’s designated geographic areas is as follows:
|
United States
|
Other
North
America
|
|||||
|
2016
|
||||||
|
Revenues from unaffiliated customers
|
$
|
1,683,006
|
|
226,561
|
|
|
|
Transfers between geographic areas
|
106,076
|
|
10,778
|
|
||
|
Total revenues
|
$
|
1,789,082
|
|
237,339
|
|
|
|
Net revenues
1
|
$
|
918,110
|
|
119,492
|
|
|
|
Operating income
|
$
|
250,715
|
|
32,530
|
|
|
|
Identifiable assets at year end
|
$
|
1,455,722
|
|
104,804
|
|
|
|
Capital expenditures
|
$
|
39,531
|
|
1,727
|
|
|
|
Depreciation and amortization
|
$
|
29,939
|
|
1,479
|
|
|
|
Equity
|
$
|
1,166,582
|
|
46,448
|
|
|
|
2015
|
||||||
|
Revenues from unaffiliated customers
|
$
|
1,763,361
|
|
226,284
|
|
|
|
Transfers between geographic areas
|
118,884
|
|
13,383
|
|
||
|
Total revenues
|
$
|
1,882,245
|
|
239,667
|
|
|
|
Net revenues
1
|
$
|
906,780
|
|
124,381
|
|
|
|
Operating income
|
$
|
245,257
|
|
46,846
|
|
|
|
Identifiable assets at year end
|
$
|
1,185,671
|
|
111,549
|
|
|
|
Capital expenditures
|
$
|
26,807
|
|
3,915
|
|
|
|
Depreciation and amortization
|
$
|
29,532
|
|
1,331
|
|
|
|
Equity
|
$
|
986,330
|
|
70,932
|
|
|
|
2014
|
||||||
|
Revenues from unaffiliated customers
|
$
|
1,694,819
|
|
218,735
|
|
|
|
Transfers between geographic areas
|
97,028
|
|
10,891
|
|
||
|
Total revenues
|
$
|
1,791,847
|
|
229,626
|
|
|
|
Net revenues
1
|
$
|
823,111
|
|
108,631
|
|
|
|
Operating income
|
$
|
221,166
|
|
36,475
|
|
|
|
Identifiable assets at year end
|
$
|
1,388,319
|
|
111,324
|
|
|
|
Capital expenditures
|
$
|
19,610
|
|
1,439
|
|
|
|
Depreciation and amortization
|
$
|
31,553
|
|
1,170
|
|
|
|
Equity
|
$
|
1,165,488
|
|
54,338
|
|
|
|
F-17
.
|
Latin
America
|
North Asia
|
South Asia
|
Europe
|
Middle
East, Africa and
India
|
Elimi-nations
|
Consoli-dated
|
|||||||||||||||
|
2016
|
|||||||||||||||||||||
|
Revenues from unaffiliated customers
|
84,665
|
|
2,242,670
|
|
603,980
|
|
918,561
|
|
338,594
|
|
—
|
|
6,098,037
|
|
|||||||
|
Transfers between geographic areas
|
15,037
|
|
21,212
|
|
24,251
|
|
41,102
|
|
21,876
|
|
(240,332
|
)
|
—
|
|
|||||||
|
Total revenues
|
99,702
|
|
2,263,882
|
|
628,231
|
|
959,663
|
|
360,470
|
|
(240,332
|
)
|
6,098,037
|
|
|||||||
|
Net revenues
1
|
56,066
|
|
471,275
|
|
171,033
|
|
304,429
|
|
123,335
|
|
296
|
|
2,164,036
|
|
|||||||
|
Operating income
|
13,321
|
|
230,777
|
|
64,967
|
|
42,195
|
|
35,672
|
|
(14
|
)
|
670,163
|
|
|||||||
|
Identifiable assets at year end
|
49,231
|
|
511,851
|
|
120,300
|
|
351,960
|
|
190,902
|
|
6,101
|
|
2,790,871
|
|
|||||||
|
Capital expenditures
|
1,038
|
|
3,889
|
|
3,038
|
|
7,554
|
|
2,539
|
|
—
|
|
59,316
|
|
|||||||
|
Depreciation and amortization
|
1,187
|
|
5,455
|
|
2,177
|
|
4,576
|
|
1,983
|
|
—
|
|
46,796
|
|
|||||||
|
Equity
|
27,164
|
|
327,672
|
|
91,983
|
|
108,430
|
|
112,633
|
|
(33,699
|
)
|
1,847,213
|
|
|||||||
|
2015
|
|||||||||||||||||||||
|
Revenues from unaffiliated customers
|
94,229
|
|
2,557,398
|
|
677,628
|
|
958,827
|
|
338,905
|
|
—
|
|
6,616,632
|
|
|||||||
|
Transfers between geographic areas
|
19,158
|
|
21,722
|
|
25,018
|
|
42,787
|
|
21,322
|
|
(262,274
|
)
|
—
|
|
|||||||
|
Total revenues
|
113,387
|
|
2,579,120
|
|
702,646
|
|
1,001,614
|
|
360,227
|
|
(262,274
|
)
|
6,616,632
|
|
|||||||
|
Net revenues
1
|
65,017
|
|
493,235
|
|
179,110
|
|
308,301
|
|
110,953
|
|
—
|
|
2,187,777
|
|
|||||||
|
Operating income
|
19,656
|
|
245,854
|
|
69,643
|
|
65,024
|
|
29,204
|
|
—
|
|
721,484
|
|
|||||||
|
Identifiable assets at year end
|
48,678
|
|
446,914
|
|
127,014
|
|
421,590
|
|
221,835
|
|
2,326
|
|
2,565,577
|
|
|||||||
|
Capital expenditures
|
1,756
|
|
2,203
|
|
2,383
|
|
5,222
|
|
2,097
|
|
—
|
|
44,383
|
|
|||||||
|
Depreciation and amortization
|
1,041
|
|
5,425
|
|
2,110
|
|
4,931
|
|
1,642
|
|
—
|
|
46,012
|
|
|||||||
|
Equity
|
33,161
|
|
253,097
|
|
99,220
|
|
154,174
|
|
130,105
|
|
(32,343
|
)
|
1,694,676
|
|
|||||||
|
2014
|
|||||||||||||||||||||
|
Revenues from unaffiliated customers
|
89,058
|
|
2,576,350
|
|
657,189
|
|
1,012,389
|
|
316,181
|
|
—
|
|
6,564,721
|
|
|||||||
|
Transfers between geographic areas
|
20,634
|
|
23,020
|
|
26,579
|
|
39,541
|
|
19,654
|
|
(237,347
|
)
|
—
|
|
|||||||
|
Total revenues
|
109,692
|
|
2,599,370
|
|
683,768
|
|
1,051,930
|
|
335,835
|
|
(237,347
|
)
|
6,564,721
|
|
|||||||
|
Net revenues
1
|
65,016
|
|
407,410
|
|
163,383
|
|
313,325
|
|
100,551
|
|
—
|
|
1,981,427
|
|
|||||||
|
Operating income
|
19,855
|
|
177,496
|
|
52,596
|
|
62,101
|
|
24,959
|
|
—
|
|
594,648
|
|
|||||||
|
Identifiable assets at year end
|
53,815
|
|
513,649
|
|
141,499
|
|
447,349
|
|
208,684
|
|
5,987
|
|
2,870,626
|
|
|||||||
|
Capital expenditures
|
1,574
|
|
5,955
|
|
3,118
|
|
4,246
|
|
1,530
|
|
—
|
|
37,472
|
|
|||||||
|
Depreciation and amortization
|
911
|
|
5,938
|
|
2,295
|
|
5,690
|
|
1,735
|
|
—
|
|
49,292
|
|
|||||||
|
Equity
|
34,386
|
|
262,295
|
|
99,234
|
|
169,117
|
|
121,520
|
|
(34,770
|
)
|
1,871,608
|
|
|||||||
_______________________
1
Net revenues are a non-GAAP measure calculated as revenues less directly related operating expenses attributable to the Company's principal services. The Company's management believes that net revenues are a better measure than total revenues when evaluating the Company's operating segment performance since total revenues earned as a freight consolidator include the carriers' charges for carrying the shipment, whereas revenues earned in other capacities include primarily the commissions and fees earned by the Company. Net revenue is one of the Company's primary operational and financial measures and demonstrates the Company's ability to concentrate and leverage purchasing power through effective consolidation of shipments from customers utilizing a variety of transportation carriers and optimal routings.
The following table presents the calculation of net revenues:
|
Years ended December 31,
|
2016
|
2015
|
2014
|
|||||||
|
Revenues:
|
||||||||||
|
Total revenues
|
$
|
6,098,037
|
|
6,616,632
|
|
6,564,721
|
|
|||
|
Expenses:
|
||||||||||
|
Airfreight services
|
1,752,167
|
|
1,987,690
|
|
2,103,777
|
|
||||
|
Ocean freight and ocean services
|
1,378,699
|
|
1,648,993
|
|
1,712,795
|
|
||||
|
Customs brokerage and other services
|
803,135
|
|
792,172
|
|
766,722
|
|
||||
|
Net revenues
|
$
|
2,164,036
|
|
2,187,777
|
|
1,981,427
|
|
|||
|
F-18
.
Other than the United States, only the People’s Republic of China, including Hong Kong, represented more than
10%
of the Company’s total revenue, net revenue, total identifiable assets or equity in any period presented as noted in the table below.
|
2016
|
2015
|
2014
|
|||||||
|
Total revenues
|
31
|
%
|
32
|
%
|
33
|
%
|
|||
|
Net revenues
|
18
|
%
|
19
|
%
|
16
|
%
|
|||
|
Identifiable assets at year end
|
15
|
%
|
13
|
%
|
14
|
%
|
|||
|
Equity
|
13
|
%
|
10
|
%
|
9
|
%
|
|||
|
NOTE 11.
|
QUARTERLY RESULTS (UNAUDITED)
|
|
1st
|
2nd
|
3rd
|
4th
|
||||||||||
|
2016
|
|||||||||||||
|
Revenues
|
$
|
1,418,472
|
|
1,475,164
|
|
1,562,394
|
|
1,642,007
|
|
||||
|
Net revenues
|
517,069
|
|
553,117
|
|
545,259
|
|
548,591
|
|
|||||
|
Net earnings
|
97,047
|
|
116,439
|
|
107,949
|
|
111,098
|
|
|||||
|
Net earnings attributable to shareholders
|
96,584
|
|
116,052
|
|
107,581
|
|
110,590
|
|
|||||
|
Diluted earnings attributable to shareholders per share
|
0.53
|
|
0.63
|
|
0.59
|
|
0.61
|
|
|||||
|
Basic earnings attributable to shareholders per share
|
0.53
|
|
0.64
|
|
0.59
|
|
0.61
|
|
|||||
|
2015
|
|||||||||||||
|
Revenues
|
$
|
1,677,526
|
|
1,691,553
|
|
1,651,332
|
|
1,596,221
|
|
||||
|
Net revenues
|
529,486
|
|
552,141
|
|
569,981
|
|
536,169
|
|
|||||
|
Net earnings
|
107,332
|
|
118,329
|
|
118,736
|
|
115,100
|
|
|||||
|
Net earnings attributable to shareholders
|
106,704
|
|
117,760
|
|
118,310
|
|
114,449
|
|
|||||
|
Diluted earnings attributable to shareholders per share
|
0.55
|
|
0.61
|
|
0.62
|
|
0.61
|
|
|||||
|
Basic earnings attributable to shareholders per share
|
0.56
|
|
0.62
|
|
0.63
|
|
0.62
|
|
|||||
Net earnings in the fourth quarter of 2016 include a
$6 million
foreign exchange gain recorded in customs brokerage and other services expenses that resulted from the devaluation of the Egyptian pound. Net earnings in the fourth quarter of 2015 include a
$6 million
recovery of legal and related fees. The sum of quarterly per share data may not equal the per share total reported for the year.
|
F-19
.
SECURITIES AND EXCHANGE COMMISSION
WASHINGTON, D.C.
ANNUAL REPORT
ON
FORM 10-K
FOR FISCAL YEAR ENDED
December 31, 2016
EXPEDITORS INTERNATIONAL OF WASHINGTON, INC.
EXHIBITS
|
Exhibit Number
|
Description
|
|
|
21.1
|
Subsidiaries of the Registrant
|
|
|
23.1
|
Consent of Independent Registered Public Accounting Firm
|
|
|
31.1
|
Certification of Chief Executive Officer pursuant to Section 302 of the Sarbanes-Oxley Act of 2002
|
|
|
31.2
|
Certification of Chief Financial Officer pursuant to Section 302 of the Sarbanes-Oxley Act of 2002
|
|
|
32
|
Certification pursuant to 18 U.S.C. Section 1350, as adopted pursuant to Section 906 of the Sarbanes-Oxley Act of 2002
|
|
|
101.INS
|
XBRL Instance Document
|
|
|
101.SCH
|
XBRL Taxonomy Extension Schema Document
|
|
|
101.CAL
|
XBRL Taxonomy Extension Calculation Linkbase Document
|
|
|
101.LAB
|
XBRL Taxonomy Extension Label Linkbase Document
|
|
|
101.PRE
|
XBRL Taxonomy Extension Presentation Linkbase Document
|
|
|
101.DEF
|
XBRL Taxonomy Extension Definition Linkbase Document
|
|
TABLE OF CONTENTS
Part IItem 1 BusinessItem 1A Risk FactorsItem 1B Unresolved Staff CommentsItem 2 PropertiesItem 3 Legal ProceedingsItem 4 Mine Safety DisclosuresPart IIItem 5 Market For Registrant S Common Equity, Related Stockholder Matters and Issuer Purchases Of Equity SecuritiesPart OfItem 6 Selected Financial DataItem 7 Management S Discussion and Analysis Of Financial Condition and Results Of OperationsItem 7A Quantitative and Qualitative Disclosures About Market RiskItem 8 Financial Statements and Supplementary DataItem 9 Changes in and Disagreements with Accountants on Accounting and Financial DisclosureItem 9A Controls and ProceduresItem 9B Other InformationPart IIIItem 10 Directors, Executive Officers and Corporate GovernanceItem 11 Executive CompensationItem 12 Security Ownership Of Certain Beneficial Owners and Management and Related Stockholder MattersItem 13 Certain Relationships and Related Transactions, and Director IndependenceItem 14 Principal Accounting Fees and ServicesPart IVItem 15 Exhibits, Financial Statement SchedulesItem 16 Form 10-k SummaryNote 1. Summary Of Significant Accounting PoliciesNote 2. Property and EquipmentNote 3. Shareholders EquityNote 4. Basic and Diluted Earnings Per ShareNote 5. Income TaxesNote 6. Fair Value Of Financial InstrumentsNote 7. Credit ArrangementsNote 8. CommitmentsNote 9. ContingenciesNote 10. Business Segment InformationNote 11. Quarterly Results (unaudited)