EXPEDIA GROUP, INC.
10-Ks and 10-Qs
|
|
|
|
|
|
|
|
|
|
|
|
|
|
|
|
|
|
|
|
|
|
|
|
|
|
|
|
|
|
|
|
|
|
|
|
|
|
|
|
|
|
|
|
|
|
|
|
|
|
|
|
|
UNITED STATES
SECURITIES AND EXCHANGE COMMISSION
Washington, D.C. 20549
_______________________________________________
Form 10-K
|
þ
|
ANNUAL REPORT PURSUANT TO SECTION 13 OR 15(d) OF THE SECURITIES EXCHANGE ACT OF 1934
|
For the fiscal year ended
December 31, 2017
OR
|
¨
|
TRANSITION REPORT PURSUANT TO SECTION 13 OR 15(d) OF THE SECURITIES EXCHANGE ACT OF 1934
|
For the transition period from to
Commission file number: 001-37429
_______________________________________________
EXPEDIA, INC.
(Exact name of registrant as specified in its charter)
|
Delaware
|
|
20-2705720
|
|
(State or other jurisdiction of
incorporation or organization)
|
|
(I.R.S. Employer
Identification No.)
|
333 108th Avenue NE
Bellevue, WA 98004
(Address of principal executive office) (Zip Code)
Registrant’s telephone number, including area code:
(425) 679-7200
_______________________________________________
Securities registered pursuant to Section 12(b) of the Act:
|
Title of each class:
|
|
Name of each exchange on which registered:
|
|
Common stock, $0.0001 par value
|
|
The Nasdaq Global Select Market
|
|
Expedia, Inc. 2.500% Senior Notes due 2022
|
New York Stock Exchange
|
|
Securities registered pursuant to Section 12(g) of the Act:
None
_______________________________________________
Indicate by check mark if the registrant is a well-known seasoned issuer, as defined in Rule 405 of the Securities Act. Yes
þ
No
¨
Indicate by check mark if the registrant is not required to file reports pursuant to Section 13 or Section 15(d) of the Act. Yes
¨
No
þ
Indicate by check mark whether the registrant (1) has filed all reports required to be filed by Section 13 or 15(d) of the Securities Exchange Act of 1934 during the preceding 12 months (or for such shorter period that the registrant was required to file such reports), and (2) has been subject to such filing requirements for the past 90 days. Yes
þ
No
¨
Indicate by check mark whether the registrant has submitted electronically and posted on its corporate Web site, if any, every Interactive Data File required to be submitted and posted pursuant to Rule 405 of Regulation S-T (§ 232.405 of this chapter) during the preceding 12 months (or for such shorter period that the registrant was required to submit and post such files). Yes
þ
No
¨
Indicate by check mark if disclosure of delinquent filers pursuant to Item 405 of Regulation S-K is not contained herein, and will not be contained, to the best of registrant’s knowledge, in definitive proxy or information statements incorporated by reference in Part III of this Form 10-K or any amendment to this Form 10-K.
þ
Indicate by check mark whether the registrant is a large accelerated filer, an accelerated filer, a non-accelerated filer, a smaller reporting company, or an emerging growth company. See the definitions of “large accelerated filer,” “accelerated filer,” “smaller reporting company,” and “emerging growth company” in Rule 12b-2 of the Exchange Act. (Check one):
|
Large accelerated filer
|
|
þ
|
|
Accelerated filer
|
|
¨
|
|
Non-accelerated filer
|
|
¨
(Do not check if a smaller reporting company)
|
|
Smaller reporting company
|
|
¨
|
|
Emerging growth company
|
¨
|
|||||
If an emerging growth company, indicate by check mark if the registrant has elected not to use the extended transition period for complying with any new or revised financial accounting standards provided pursuant to Section 13(a) of the Exchange Act.
o
Indicate by check mark whether the registrant is a shell company (as defined in Rule 12b-2 of the Exchange Act). Yes
¨
No
þ
As of June 30, 2017, the aggregate market value of the registrant’s common equity held by non-affiliates was approximately $18,137,071,000. For the purpose of the foregoing calculation only, all directors and executive officers of the registrant are assumed to be affiliates of the registrant.
|
Class
|
|
Outstanding Shares at January 26, 2018 were approximately,
|
|
Common stock, $0.0001 par value per share
|
|
139,033,403 shares
|
|
Class B common stock, $0.0001 par value per share
|
|
12,799,999 shares
|
Documents Incorporated by Reference
|
Document
|
|
Parts Into Which Incorporated
|
|
Portions of the definitive Proxy Statement for the 2018 Annual Meeting of Stockholders (Proxy Statement)
|
|
Part III
|
Expedia, Inc.
Form 10-K
For the Year Ended
December 31, 2017
Contents
|
Part I
|
||
|
Item 1
|
||
|
Item 1A
|
||
|
Item 1B
|
||
|
Item 2
|
||
|
Item 3
|
||
|
Item 4
|
||
|
Part II
|
||
|
Item 5
|
||
|
Item 6
|
||
|
Item 7
|
||
|
Item 7A
|
||
|
Item 8
|
||
|
Item 9
|
||
|
Item 9A
|
||
|
Item 9B
|
||
|
Part III
|
||
|
Item 10
|
||
|
Item 11
|
||
|
Item 12
|
||
|
Item 13
|
||
|
Item 14
|
||
|
Part IV
|
||
|
Item 15
|
||
Expedia, Inc.
Form 10-K
For the Year Ended
December 31, 2017
Part I. Item 1.
Business
We refer to Expedia, Inc. and its subsidiaries collectively as “Expedia,” the “Company,” “us,” “we” and “our” in this Annual Report on Form 10-K.
Forward-Looking Statements
This Annual Report on Form 10-K contains “forward-looking statements” within the meaning of the Private Securities Litigation Reform Act of 1995. These forward-looking statements reflect the views of our management regarding current expectations and projections about future events and are based on currently available information. Actual results could differ materially from those contained in these forward-looking statements for a variety of reasons, including, but not limited to, those discussed in the section entitled “Risk Factors” as well as those discussed elsewhere in this report. Other unknown or unpredictable factors also could have a material adverse effect on our business, financial condition and results of operations. Accordingly, readers should not place undue reliance on these forward-looking statements. The use of words such as “anticipates,” “estimates,” “expects,” “intends,” “plans” and “believes,” among others, generally identify forward-looking statements; however, these words are not the exclusive means of identifying such statements. In addition, any statements that refer to expectations, projections or other characterizations of future events or circumstances are forward-looking statements. These forward-looking statements are inherently subject to uncertainties, risks and changes in circumstances that are difficult to predict. We are not under any obligation and do not intend to publicly update or review any of these forward-looking statements, whether as a result of new information, future events or otherwise, even if experience or future events make it clear that any expected results expressed or implied by those forward-looking statements will not be realized. Please carefully review and consider the various disclosures made in this report and in our other reports filed with the Securities and Exchange Commission (“SEC”) that attempt to advise interested parties of the risks and factors that may affect our business, prospects and results of operations.
Management Overview
General Description of our Business
Expedia, Inc. is an online travel company, empowering business and leisure travelers through technology with the tools and information they need to efficiently research, plan, book and experience travel. We seek to grow our business through a dynamic portfolio of travel brands, including our majority-owned subsidiaries that feature the world’s broadest supply portfolio — with more than 590,000 properties, including more than 150,000 of HomeAway's nearly 1.5 million online bookable vacation rental listings, in 200 countries and territories, over 550 airlines, packages, rental cars, cruises, insurance, as well as destination services and activities. Travel suppliers distribute and market products via our desktop and mobile offerings, as well as through alternative distribution channels, our private label business and our call centers in order to reach our extensive, global audience. In addition, our advertising and media businesses help other businesses, primarily travel providers, reach a large audience of travelers around the globe.
Our portfolio of brands includes:
|
•
|
Expedia.com®, a leading full service online travel company with localized websites in 33 countries;
|
|
•
|
Hotels.com®, a leading global lodging expert operating 90 localized websites in 41 languages with its award winning Hotels.com® Rewards loyalty program;
|
|
•
|
Expedia® Affiliate Network ("EAN"), a global business-to-business ("B2B") brand that powers the hotel business of hundreds of leading airlines, travel agencies, loyalty and corporate travel companies plus several top consumer brands through its API and template solutions;
|
|
•
|
trivago®, a leading online hotel metasearch platform with websites in 55 countries worldwide;
|
|
•
|
HomeAway®, a global online marketplace for the vacation rental industry, which also includes the VRBO, VacationRentals.com and BedandBreakfast.com brands, among others;
|
|
•
|
Egencia®, a leading corporate travel management company;
|
|
•
|
Orbitz® and CheapTickets®, leading U.S. travel websites, as well as ebookers®, a full-service travel brand with websites in seven European countries;
|
|
•
|
Travelocity®, a leading online travel brand in the United States and Canada;
|
1
|
•
|
Hotwire®, a leading online travel website offering spontaneous travel through Hot Rate® deals;
|
|
•
|
Wotif Group, a leading portfolio of travel brands including Wotif.com®, Wotif.co.nz, lastminute.com.au®, lastminute.co.nz and travel.com.au®;
|
|
•
|
Expedia® Media Solutions, the advertising sales division of Expedia, Inc. that builds creative media partnerships and enables brand advertisers to target a highly-qualified audience of travel consumers;
|
|
•
|
CarRentals.com
™
, a premier online car rental booking company with localized websites in four countries;
|
|
•
|
Classic Vacations®, a top luxury travel specialist;
|
|
•
|
Expedia Local Expert®, a provider of online and in-market concierge services, activities, experiences and ground transportation in over a thousand destinations worldwide;
|
|
•
|
Expedia® CruiseShipCenters®, a provider of exceptional value and expert advice for travelers booking cruises and vacations through its network of over 250 retail travel agency franchises across North America; and
|
|
•
|
SilverRail Technologies, Inc., provider of a global rail retail and distribution platform connecting rail carriers and suppliers to both online and offline travel distributors.
|
Equity Ownership and Voting Control
As of
December 31, 2017
, there were
138,939,100
shares of Expedia common stock and 12,799,999 shares of Expedia Class B common stock outstanding. Expedia stockholders are entitled to one vote for each share of common stock and ten votes for each share of Class B common stock outstanding. As of
December 31, 2017
, Liberty Expedia Holdings, Inc. (“Liberty Expedia Holdings”), through its wholly-owned subsidiaries, held approximately 8% of Expedia’s outstanding common stock and 100% of Expedia’s outstanding Class B common stock (or, assuming conversion of all shares of Class B common stock into shares of common stock, held 16% of Expedia’s outstanding common stock). Barry Diller, Chairman and Senior Executive of Expedia holds an irrevocable proxy granted by Liberty Expedia Holdings, pursuant to which Mr. Diller has the right to vote the Expedia securities held by Liberty Expedia Holdings and its subsidiaries (the “Diller Proxy”), which proxy has been assigned by Mr. Diller to Liberty Expedia Holdings until the earlier of May 4, 2018 or the occurrence of certain termination events. As of
December 31, 2017
, as a result of their agreements and respective holdings in Expedia, Mr. Diller and Liberty Expedia Holdings may be deemed to share voting power over securities representing approximately
54%
of the combined voting power of the outstanding Expedia capital stock.
By virtue of the voting power of an irrevocable proxy granted to Mr. Diller by John C. Malone and Leslie Malone over their shares in Liberty Expedia Holdings and the governance arrangements at Liberty Expedia Holdings, during the period the assignment of the Diller Proxy and the proxy granted him by the Malones are in effect, Mr. Diller is effectively able to control the outcome of nearly all matters submitted to a vote or for the consent of Expedia’s stockholders (other than with respect to the election by the Expedia common stockholders of 25% of the members of Expedia’s Board of Directors and certain matters as to which a separate class vote of the holders of Expedia common stock or Expedia preferred stock is required under Delaware law). Upon the termination or expiration of the assignment of the Diller Proxy (unless the Diller Proxy itself has terminated), Mr. Diller will continue to be able to control the outcome of such matters. In addition, pursuant to the Amended and Restated Governance Agreement, dated as of December 20, 2011, as amended, among Expedia, Liberty Expedia Holdings and Mr. Diller, each of Mr. Diller and Liberty Expedia Holdings generally has the right to consent to certain significant corporate actions in the event that Expedia or any of its subsidiaries incurs any new obligations for borrowed money within the definition of “total debt” set forth in the Governance Agreement for as long as Expedia’s ratio of total debt to EBITDA, as defined therein, equals or exceeds eight to one.
Market Opportunity & Business Strategy
Expedia is the world’s largest online travel company, yet our gross bookings represent only about 6% of total worldwide travel spending. Phocuswright estimates global travel spending at approximately $1.6 trillion in 2018, with an increasing share booked through online channels each year. We have built, and continue to build, a broad and deep supply portfolio which today includes more than 590,000 properties, including over 150,000 of HomeAway's nearly 1.5 million online bookable vacation rental listings, over 550 airlines and numerous car rental companies, cruise companies and other travel suppliers.
We believe the strength of our brand portfolio as well as our enhanced product offerings and new channel penetration drives customer demand, which when combined with our global scale and broad based supply, give us a unique advantage in addressing the ongoing migration of travel bookings from offline to online around the world. With our unmatched global audience of travelers, and our deep and broad selection of travel products, there is a rich interplay between supply and demand in our global marketplace that helps us provide value to both travelers planning trips and supply partners wanting to grow their business through a better understanding of travel retailing and consumer demand in addition to reaching consumers in markets
2
beyond their reach. Our primary growth drivers are global expansion, including of our supply portfolio, technology and product innovation, and new channel penetration and expansion.
Portfolio of Brands
Expedia operates a strong brand portfolio with global reach, targeting a broad range of travelers, travel suppliers and advertisers. We know that consumers typically visit multiple travel websites prior to booking travel, and having a multi-brand strategy increases the likelihood that those consumers will visit one or more of our websites. We also market to consumers through a variety of channels, including internet search and metasearch and social media websites, and having multiple brands appear in search results also increases the likelihood of attracting visitors. Our brands tailor their product offerings and websites to particular traveler demographics. For example, Hotwire finds deep discount deals for the budget-minded travel shopper while our Classic Vacations brand targets high-end, luxury travelers. Brand Expedia spans the widest swath of potential customers with multi-product travel options across a broad value spectrum, while our Hotels.com brand focuses specifically on a hotel only product offering.
Brand Expedia.
A leading full-service online travel brand with localized websites in 33 countries offering a wide selection of travel products and services. Through an award-winning mobile app and Expedia-branded websites, travelers have access to the latest technology that delivers airline tickets, lodging, car rentals, rail, cruises, insurance and many things to do - such as airport transfers, activities and tours - from hundreds of thousands of suppliers, on both a standalone and package basis. Across the more than 20 years that Expedia has been helping people travel with confidence and ease, the company has learned that travelers benefit when Expedia continually improves and optimizes its offering, to ensure that travelers the world over can book the trip they need, in the manner they choose, at any point and save. That commitment has propelled Expedia to a leadership position within travel, and ensures that Expedia can continue to help millions of travelers experience the world.
Hotels.com.
Hotels.com focuses entirely on marketing and distributing lodging accommodations. Hotels.com, with 90 localized websites worldwide in 41 languages worldwide and market leading mobile apps on all major platforms, offers travelers a broad selection of lodging options. Because of its single product offering, Hotels.com is often our first entry point into a region allowing us to evaluate the market opportunity prior to adding additional brands and product offerings. Hotels.com Rewards
®
, the loyalty program established in 2008, offers travelers the ability to earn one free night for every ten nights stayed.
Expedia Affiliate Network.
EAN is the purely partner-focused arm of Expedia, Inc. EAN partners with businesses across a wide range of verticals including loyalty programs, airlines, travel agents and online retailers who remarket EAN’s accommodation rates and availabilities to their travelers. Partners can access EAN accommodations in the way that best suits their business, whether that is a fully customizable environment through EAN’s API or an ‘off-the-shelf,’ white-label or co-branded template solution offering.
trivago.
trivago is our majority-owned hotel metasearch company, based in Dusseldorf, Germany. The online platform gives travelers access to price comparisons from more than 400 booking websites for over 1.8 million hotels in over 190 countries. Officially launched in 2005, trivago is a leading global brand in hotel search and can be accessed worldwide via 55 localized websites and apps in 33 languages. Subsequent to its initial public offering ("IPO") in December 2016, the company is listed on the Nasdaq Global Select Market and trades under the symbol "TRVG."
HomeAway.
In December 2015, we acquired HomeAway, which operates an online marketplace for the vacation rental industry. The HomeAway portfolio includes the vacation rental websites HomeAway, VRBO and VacationRentals.com in the United States; OwnersDirect.co.uk in the United Kingdom; Abritel.fr and Homelidays.com in France; Toprural.es in Spain; AlugueTemporada.com.br in Brazil; Stayz.com.au in Australia; and Bookabach.co.nz in New Zealand. HomeAway also operates BedandBreakfast.com, a comprehensive global website for finding bed-and-breakfast properties. In addition to its online marketplace, HomeAway also offers software solutions to property managers through its HomeAway Software and Glad to Have You products.
Egencia.
Our full-service travel management company offers travel products and services to businesses and their corporate travelers. Egencia maintains a global presence in more than 65 countries across North America, Europe and Asia Pacific. Egencia provides, among other things, a global technology platform coupled with local telephone assistance with expert travel consultants, unique supply targeted at business travelers, and consolidated reporting for its clients. Egencia charges its corporate clients account management fees, as well as transactional fees for various contacts made as part of the travel process. In addition, Egencia provides on-site agents to some corporate clients to provide in-house, seamless support. Egencia also offers consulting and meeting management services as well as advertising opportunities. We believe the corporate travel sector represents a significant opportunity for Expedia through Egencia’s compelling technology solution for businesses seeking to improve employees’ travel experiences and optimize travel costs by moving the focus of the corporate travel program to online and mobile services versus the traditional call center approach.
3
Orbitz, CheapTickets, ebookers.
In September 2015, we acquired Orbitz Worldwide, Inc., including all of its brands and assets. Orbitz Worldwide was a travel portfolio including Orbitz, CheapTickets and ebookers.
Travelocity.
After entering into an exclusive, long-term strategic marketing agreement with Travelocity during the third quarter of 2013, under which Brand Expedia powered the technology platform, supply and customer service for Travelocity’s existing websites in the United States and Canada, we announced in January 2015 that we acquired the Travelocity brand and associated assets from Sabre Corporation (“Sabre”) and terminated the strategic marketing and other related agreements. A pioneer in the online travel industry, Travelocity celebrated its 20
th
anniversary in 2016. Travelocity and its famous Roaming Gnome encourage travelers in the United States and Canada to “Wander Wisely™”.
Hotwire.
Hotwire offers a travel booking service that matches flexible, value-oriented travelers with suppliers who have excess seats, rooms and cars they offer at lower rates than retail. Hotwire’s Hot Rate
®
Hotels, Hot Rate
®
Cars and Hot Rate
®
Flights offer travelers an extra low price as the supplier name is not revealed until after the traveler books and pays. With Hotwire’s unique model, suppliers create value from excess availability without diluting their core, brand-loyal traveler base. Hotwire partners with leading hotel companies worldwide, brand-name domestic and international airlines, and major car rental companies in the United States.
Wotif Group.
In November 2014, we completed the acquisition of Wotif Group, a leading Australian online travel company, comprised of the Wotif.com, lastminute.com.au and travel.com.au brands in Australia, and Wotif.co.nz and lastminute.co.nz in New Zealand. Wotif.com launched in 2000, and was listed on the Australian Securities Exchange in June 2006 as Wotif.com Holdings Limited, under the ASX code “WTF,” prior to being acquired by Expedia.
CarRentals.com.
CarRentals.com is an online car rental marketing and retail firm offering a diverse selection of car rentals direct to consumers. Following our July 2014 acquisition of Auto Escape Group, one of Europe’s leading online car rental reservation companies, the Auto Escape Group joined with the CarRentals.com brand. With CarRentals.com’s international expansion, it is able to provide our customers more choices across the globe and help our supply partners expand their marketing reach.
Classic Vacations.
Classic Vacations offers individually tailored vacations primarily through a national network of third-party retail travel agents. Classic delivers a full line of premium vacation packages — air, hotels, car rentals, activities, cruises and private transportation — to create customized luxury vacations in Hawaii, the Caribbean, Mexico, Costa Rica, Europe, Australia, New Zealand, Fiji, Maldives, Dubai, Seychelles and Tahiti. Travel agents and travelers can preview our product offering through our website www.classicvacations.com.
Expedia Local Expert.
Our Expedia Local Expert network offers online and in-market concierge services, activities, experiences, attractions and ground transportation. With access to a rich portfolio of over 25,000 tours and adventures, LX can be found on more than 60 Expedia, Inc. websites, and operates more than 100 concierge and activity desks in major resort destinations.
Expedia CruiseShipCenters
. Expedia CruiseShipCenters is a leading seller of cruises and vacations. The franchise company has over 250 retail locations across North America, a team of over 4,500 professionally-trained vacation consultants and inventory of more than 200,000 staterooms available on the most popular ships and destinations to book online or in store.
SilverRail Technologies, Inc.
SilverRail technology is built for rail, uniting the ecosystem of rail carriers and travel distributors around the world’s most comprehensive search and booking platform for rail content. The product suite spans the full customer experience: journey planning, inventory management, scheduling, pricing, booking, payment, ticketing, reporting and administration. SilverCore, SilverRail's technology platform, is the world’s first unified platform for global rail distribution, as it connects carriers and suppliers to both online and offline travel distributors.
Growth Strategy
Global Expansion.
Our Expedia, Hotels.com, Egencia, and EAN brands operate both domestically and through international points of sale, including in Europe, Asia Pacific, Canada and Latin America. In addition, ebookers offers multi-product online travel reservations in Europe and Wotif Group has a leading portfolio of travel brands, including Wotif.com, Wotif.co.nz, lastminute.com.au, lastminute.com.nz and travel.com.au, focused principally on the Australia and New Zealand markets. Egencia, our corporate travel business, operates in over 65 countries around the world and continues to expand. The HomeAway portfolio has 60 vacation rental websites all around the world. We own a majority share of trivago, a leading hotel metasearch company. Officially launched in 2005, trivago is one of the best known travel brands in Europe and North America. trivago continues to operate independently and grow revenue through global expansion, including aggressive expansion in new countries. In December 2016, trivago successfully completed its initial public offering and trades on the Nasdaq Global Select Market under the symbol "TRVG." In addition, we have commercial agreements in place with Ctrip and eLong in China,
4
Traveloka in Southeast Asia, as well as Decolar.com, Inc. in Latin America, among many others. In conjunction with the commercial arrangements with Traveloka and Decolar, we have also made strategic investments of over $600 million combined in Traveloka in 2017 and Decolar in 2015. In 2017, approximately 38% of our worldwide gross bookings and 45% of worldwide revenue were through international points of sale compared to just 21% for both worldwide gross bookings and revenue in 2005. We have a goal of generating more than two-thirds of our revenue through businesses and points of sale outside of the United States.
In expanding our global reach, we leverage significant investments in technology, operations, brand building, supplier relationships and other initiatives that we have made since the launch of Expedia.com in 1996. Our scale of operations enhances the value of technology innovations we introduce on behalf of our travelers and suppliers. We believe that our size and scale afford the company the ability to negotiate competitive rates with our supply partners, provide breadth of choice and travel deals to our traveling customers through an expanding supply portfolio and create opportunities for new value added offers for our customers such as our loyalty programs. The size of Expedia’s worldwide traveler base makes our websites an increasingly appealing channel for travel suppliers to reach customers. In addition, the sheer size of our user base and search query volume allows us to test new technologies very quickly in order to determine which innovations are most likely to improve the travel research and booking process, and then roll those features out to our worldwide audience in order to drive improvements in conversion.
Product Innovation.
Each of our leading brands was a pioneer in online travel and has been responsible for driving key innovations in the space for more than two decades. Each Expedia technology platform is operated by a dedicated technology team, which drives innovations that make researching and shopping for travel increasingly easier and helps customers find and book the best possible travel options. We have made key investments in technology, including significant development of our technical platforms that makes it possible for us to deliver innovations at a faster pace. Improvements in our global platforms for Hotels.com and Brand Expedia continue to enable us to increase the innovation cycle, thereby improving conversion and driving faster growth rates for those brands. In 2013, Expedia signed an agreement to power the technology, supply and customer service platforms for Travelocity-branded websites in the United States and Canada, enabling Expedia to leverage its investments in each of these key areas. During 2014, the Travelocity-branded websites were successfully migrated to the Expedia technology platform. In November 2014, Expedia completed the acquisition of Wotif Group and subsequently converted the Wotif.com website to the Expedia technology platform. In January 2015, we acquired the Travelocity brand and other associated assets from Sabre. The strategic marketing and other related agreements previously entered into were terminated. In September 2015, Expedia acquired Orbitz Worldwide, including all of its brands. The Orbitz, CheapTickets and ebookers websites were migrated to the Expedia technology platform in the first half of 2016, and Orbitz for Business customers were migrated to the Egencia technology platform by July 2016. In December 2015, Expedia acquired HomeAway, Inc., including all of its brands. Additionally, in June 2017, Expedia acquired a majority stake in SilverRail, a leading rail technology distributor. We intend to continue leveraging these investments when launching additional points of sale in new countries, introducing new website features, adding supplier products and services including new business model offerings, as well as proprietary and user-generated content for travelers.
Channel Expansion
. Technological innovations and developments continue to create new opportunities for travel bookings. In the past few years, each of our brands made significant progress creating new mobile websites and mobile applications that are receiving strong reviews and solid download trends, and some of our brands now see more traffic via mobile devices than via traditional PCs. Mobile bookings continue to present an opportunity for incremental growth as they are often completed within one or two days of the travel or stay, which is a much shorter booking window than we historically experienced via more traditional online booking methods. Additionally, our brands implemented new technologies like voice-based search, chatbots and messaging apps as mobile-based options for travelers. In addition, we are seeing significant cross-device usage among our customers, who connect to our websites and apps across multiple devices and platforms throughout their travel planning process. We also believe mobile represents an efficient marketing channel given the opportunity for direct traffic acquisition, increase in share of wallet and in repeat customers, particularly through mobile applications. During 2017, approximately one in three Expedia, Inc. transactions were booked globally on a mobile device.
Business Models
We make travel products and services available both on a stand-alone and package basis, primarily through the following business models: the merchant model, the agency model and the advertising model. In addition, upon our acquisition of HomeAway in December 2015, we also earn revenue related to subscription-based vacation rental listing and other ancillary services provided to property owners and managers as well as from the traveler service fee that was rolled out in the United States and Europe in the first half of 2016.
Under the merchant model, we facilitate the booking of hotel rooms, airline seats, car rentals and destination services from our travel suppliers and we are the merchant of record for such bookings. The majority of our merchant transactions relate to hotel bookings. Under the agency model, we facilitate travel bookings and act as the agent in the transaction, passing
5
reservations booked by the traveler to the relevant travel provider. We receive commissions or ticketing fees from the travel supplier and/or traveler.
We continue to see closer integration of the agency hotel product with our core merchant product through our Expedia Traveler Preference (ETP) program by offering, for participating hotels, customers the choice of whether to pay Expedia in advance under our merchant contract (Expedia Collect) or pay at the hotel at the time of the stay (Hotel Collect). Growth in our ETP contracts has generally resulted in reduced negotiated economics to compensate for hotel supply partners absorbing expenses such as credit card fees and customer service costs, and as we continue to expand the breadth and depth of our global hotel offering, we have made adjustments to our economics in various geographies including changes based on local market conditions. Based on these dynamics, we expect our revenue per room night to remain under pressure in the future.
Through various of our Expedia-branded and other multi-product websites, travelers can dynamically assemble multiple component travel packages for a specified period at a lower price as compared to booking each component separately. Packages assembled by travelers through the packaging model on these websites primarily include a merchant hotel component and an air or car component. Travelers typically select packages based on the total package price, without being provided component pricing, and we have started to introduce a "shopping cart" style feature that incorporates an overall package discount after a traveler selects multiple products. The use of the merchant travel components in packages enables us to make certain travel products available at prices lower than those charged on an individual component basis by travel suppliers without impacting their other pricing models. In addition, we also offer third-party pre-assembled package offerings, primarily through our international points of sale, further broadening our scope of products and services to travelers. We expect the package product to continue to be marketed primarily using the merchant model.
Under the advertising model, we offer travel and non-travel advertisers access to a potential source of incremental traffic and transactions through our various media and advertising offerings on trivago and our transaction-based websites.
With our acquisition of HomeAway and all of its brands in December 2015, we expanded into the fast growing $100 billion alternative accommodations market. HomeAway is a leader in this market and represents an attractive growth opportunity for Expedia. HomeAway has been undergoing a transition from a listings-based classified advertising model to an online transactional model that optimizes for both travelers and homeowner and property manager partners, with a goal of increasing monetization and driving growth through investments in marketing as well as in product and technology. In addition, HomeAway rolled out a traveler service fee in the United States and Europe during the first half of 2016, consistent with market practice. The fee is expected to continue to contribute to HomeAway’s revenue growth and help fund marketing investments, programs to better protect travelers and future growth initiatives. Furthermore, HomeAway moved to a single subscription option globally in July 2016.
Relationships with Travel Partners
Overview.
We make travel products and services available from a variety of hotel companies, large and small commercial airlines, car rental companies, cruise lines, destination service providers, HomeAway property owners and managers and other travel partners. We seek to build and maintain long-term, strategic relationships with travel suppliers and global distribution system (“GDS”) partners. An important component of the success of our business depends on our ability to maintain our existing, as well as build new, relationships with travel suppliers and GDS partners.
Travel Suppliers.
We strive to deliver value to our travel supply partners through a wide range of innovative, targeted merchandising and promotional strategies designed to generate consumer demand and increase their revenue, while simultaneously reducing their overall marketing transaction and customer service costs. Our strategic account managers and local hotel market managers work directly with travel suppliers to optimize the exposure of their travel products and brands through our points of sale, including participation in need-based, seasonal and event-driven promotions and experimentation within the new channels we are building.
We developed proprietary technology to assist hotel suppliers in managing, pricing and marketing their supply. Our “direct connect” technology allows hotels to upload information about available products and services and rates directly from their central reservation systems and to automatically confirm hotel reservations made by our travelers. Proprietary marketing tools assist hotels in tailoring demand to their requirements and our revenue management product provides pricing insight based on Expedia data and analytics. Our suite of white label website offerings power hotel, package and meeting space booking on suppliers' own websites.
In addition, HomeAway’s vacation rental listing services includes a set of tools for property owners or managers, which enables them to manage an availability calendar, reservations, inquiries and the content of the listing, as well as provide various other services for property owners or managers to manage reservations or drive incremental sales volume.
6
Distribution Partners.
GDSs, also referred to as computer reservation services, provide a centralized, comprehensive repository of travel suppliers’ ‘content’ — such as availability and pricing of seats on various airline point-to-point flights, or ‘segments.’ The GDSs act as intermediaries between the travel suppliers and travel agencies, allowing agents to reserve and book flights, rooms or other travel products. Our relationships with GDSs primarily relate to our air business. We use Sabre, Amadeus and Travelport as our GDS segment providers in order to ensure the widest possible supply of content for our travelers.
Marketing and Promotions
Our marketing programs are intended to build and maintain the value of our various brands, drive traffic and ultimately bookings through our various brands and businesses, optimize ongoing traveler acquisition costs and strategically position our brands in relation to one another. Our long-term success and profitability depends on our continued ability to maintain and increase the overall number of traveler transactions flowing through our brand and shared global platforms in a cost-effective manner, as well as our ability to attract repeat customers to our websites.
Our marketing channels primarily include online advertising, including search engine marketing and optimization as well as metasearch, social media websites, offline advertising, loyalty programs, mobile apps and direct and/or personalized traveler communications on our websites as well as through direct e-mail communication with our travelers. Our marketing programs and initiatives include promotional offers such as coupons as well as seasonal or periodic special offers from our travel suppliers based on our supplier relationships. Our traveler loyalty programs include Hotels.com Rewards on Hotels.com global websites and Expedia
®
+ rewards on over 30 Brand Expedia points of sale, as well as Orbitz Rewards on Orbitz.com. The cost of these loyalty programs is recorded as a reduction of revenue in our consolidated financial statements.
We also make use of affiliate marketing. The Brand Expedia, Hotels.com, Hotwire, Travelocity, Orbitz, CheapTickets, HomeAway, Wotif and lastminute.com.au branded websites receive bookings from consumers who have clicked-through to the respective websites through links posted on affiliate partner websites. Affiliate partners can also make travel products and services available on their own websites through a Brand Expedia, Hotels.com or HomeAway co-branded offering or a private label website. Our EAN business provides our affiliates with technology and access to a wide range of products and services. We manage agreements with thousands of third-party affiliate partners, including a number of leading travel companies, pursuant to which we pay a commission for bookings originated from their websites.
Operations and Technology
We operate several technology platforms that support our brands. The Brand Expedia technology platform supports our full-service and multi-product brands, including Brand Expedia, Orbitz, Travelocity, Wotif Group, CheapTickets, ebookers and Expedia Local Expert, as well as certain parts of the Hotwire brand. The Hotels.com technology platform supports our hotel-only offering, including Hotels.com and EAN. In addition, we operate Egencia, our corporate travel platform; HomeAway, our vacation rentals platform; and trivago, the metasearch platform.
All of our transaction-based brands share and benefit from our eCommerce platform infrastructure, including customer support, data centers and transaction processing capabilities.
We provide 24-hour-a-day, seven-day-a-week traveler sales and support by telephone or via e-mail. For purposes of operational flexibility, we use a combination of outsourced and in-house call centers. Our call centers are located throughout the world, including outsourced operations in the Philippines, El Salvador, Egypt and India. We invested significantly in our call center technologies, with the goal of improving customer experience and increasing the efficiency of our call center agents, and have plans to continue reaping the benefits of these investments going forward.
Our systems infrastructure and web and database servers are housed in various locations, mainly in the United States, which have 24-hour monitoring and engineering support. These data centers have their own generators and multiple back-up systems. Significant amounts of our owned computer hardware for operating the websites are located at these facilities. Additionally, we are in the midst of a multi-year project to migrate products, data storage and functionality and significantly increase our utilization of public cloud computing services, such as Amazon Web Services. For some critical systems, we have both production and disaster-recovery facilities. Our technology systems are subject to certain risks, which are described below in Part I, Item 1A — Risk Factors.
7
Competition
Our brands compete in rapidly evolving and intensely competitive markets. We believe international markets represent especially large opportunities for Expedia and those of our competitors that wish to expand their brands and businesses abroad to achieve global scale. We also believe that Expedia is one of only a few companies that are focused on building a truly global, travel marketplace.
Our competition, which is strong and increasing, includes online and offline travel companies that target leisure and corporate travelers, including travel agencies, tour operators, travel supplier direct websites and their call centers, consolidators and wholesalers of travel products and services, large online portals and search websites, certain travel metasearch websites, mobile travel applications, social media websites, as well as traditional consumer eCommerce and group buying websites. We face these competitors in local, regional, national and/or international markets. In some cases, competitors are offering more favorable terms and improved interfaces to suppliers and travelers which make competition increasingly difficult. We also face competition for customer traffic on internet search engines and metasearch websites, which impacts our customer acquisition and marketing costs.
We believe that maintaining and enhancing our brands is a critical component of our effort to compete. We differentiate our brands from our competitors primarily based on the multiple channels we use to generate demand, quality and breadth of travel products, channel features and usability, price or promotional offers, traveler service and quality of travel planning content and advice as well as offline brand efforts. The emphasis on one or more of these factors varies, depending on the brand or business and the related target demographic. Our brands face increasing competition from travel supplier direct websites. In some cases, supplier direct channels offer advantages to travelers, such as long standing loyalty programs, complimentary services such as Wi-Fi, and better pricing. Our websites feature travel products and services from numerous travel suppliers, and allow travelers to combine products and services from multiple providers in one transaction. We face competition from airlines, hotels, alternative accommodation websites, rental car companies, cruise operators and other travel service providers, whether working individually or collectively, some of which are suppliers to our websites. Our business is generally sensitive to changes in the competitive landscape, including the emergence of new competitors or business models, and supplier consolidation.
Intellectual Property Rights
Our intellectual property rights, including our patents, trademarks, copyright, domain names, trade dress, proprietary technology, and trade secrets, are an important component of our business. For example, we rely heavily upon our intellectual property and proprietary information in our content, brands, domain names and website URLs, software code, proprietary technology, ratings indexes, informational databases, images, graphics and other components that make up our services. We have acquired some of our intellectual property rights and proprietary information through acquisitions, as well as licenses and content agreements with third parties.
We protect our intellectual property and proprietary information through registration and by relying on our terms of use, confidentiality procedures and contractual provisions, as well as international, national, state and common law rights. In addition, we enter into confidentiality and invention assignment agreements with employees and contractors, and license and confidentiality agreements with other third parties. Despite these precautions, it may be possible for a third party to copy or otherwise obtain and use our trade secrets or our intellectual property and proprietary information without authorization which, if discovered, might require the uncertainty of legal action to correct. In addition, there can be no assurance that others will not independently and lawfully develop substantially similar properties.
We maintain our trademark portfolio by filing trademark applications with national trademark offices, maintaining appropriate registrations, securing contractual trademark rights when appropriate, and relying on common law trademark rights when appropriate. We also register copyrights and domain names as we deem appropriate. We protect our trademarks, copyrights and domain names with an enforcement program and use of intellectual property licenses. Trademark and intellectual property protection may not be available or may not be sought, sufficient or effective in every jurisdiction where we operate. Contractual disputes or limitations may affect the use of trademarks and domain names governed by private contract.
We have considered, and will continue to consider, the appropriateness of filing for patents to protect inventions, as circumstances may warrant. However, patents protect only specific inventions and there can be no assurance that others may not create new products or methods that achieve similar results without infringing upon patents owned by us.
In connection with our copyrightable content, we post and institute procedures under the Digital Millennium Copyright Act and similar Host Privilege statutes worldwide to gain immunity from copyright liability for photographs, text and other content uploaded by users. However, differences between statutes, limitations on immunity, and moderation efforts may affect our ability to claim immunity.
8
From time to time, we may be subject to legal proceedings and claims in the ordinary course of our business, including claims of alleged infringement or infringement by us of the trademarks, copyrights, patents and other intellectual property rights of third parties. In addition, litigation may be necessary in the future to enforce our intellectual property rights, protect our trade secrets or determine the validity and scope of proprietary rights claimed by others. Any such litigation, regardless of outcome or merit, could result in substantial costs and diversion of management and technical resources, any of which could materially harm our business.
Regulation
We must comply with laws and regulations relating to the travel industry, the vacation rental industry and the provision of travel services, including registration in various states as “sellers of travel” and compliance with certain disclosure requirements and participation in state restitution funds In addition, our businesses are subject to regulation by the U.S. Department of Transportation and must comply with various rules and regulations governing the provision of air transportation, including those relating to advertising and accessibility.
As we continue to expand the reach of our brands into the European, Asia-Pacific and other international markets, we are increasingly subject to laws and regulations applicable to travel agents or tour operators in those markets, including, in some countries, pricing display requirements, licensing and registration requirements, mandatory bonding and travel indemnity fund contributions, industry specific value-added tax regimes and laws regulating the provision of travel packages. For example, the European Economic Community Council Directive on Package Travel, Package Holidays and Package Tours imposes various obligations upon marketers of travel packages, such as disclosure obligations to consumers and liability to consumers for improper performance of the package, including supplier failure.
We are also subject to consumer protection, privacy and consumer data, labor, economic and trade sanction programs, tax, and anti-trust and competition laws and regulations around the world that are not specific to the travel industry. For example, the European Union adopted a new regulation that will become effective in May 2018, called the General Data Protection Regulation (“GDPR”). The GDPR will require companies, including ours, to meet new requirements regarding the handling of personal data. In addition, certain laws and regulations have not historically been applied in the context of online travel companies, so there can be uncertainty regarding how these requirements relate to our business.
Financial Information about Segments and Geographic Areas
We generate our revenue through a diverse customer base, and there is no reliance on a single customer or small group of customers; no customer represented 10% or more of our total revenue in the periods presented in this Annual Report on Form 10-K.
We have four reportable segments: Core Online Travel Agencies ("Core OTA"), trivago, HomeAway, upon its acquisition in December 2015, and Egencia. In addition, eLong was a reportable segment through its disposal on May 22, 2015. The segment and geographic information required herein is contained in
NOTE 19 — Segment Information
, in the notes to our consolidated financial statements.
Additional Information
Company Website and Public Filings.
We maintain a corporate website at www.expediainc.com. Except as explicitly noted, the information on our website, as well as the websites of our various brands and businesses, is not incorporated by reference in this Annual Report on Form 10-K, or in any other filings with, or in any information furnished or submitted to, the SEC.
We make available, free of charge through our website, our Annual Reports on Form 10-K, Quarterly Reports on Form 10-Q and Current Reports on Form 8-K, and amendments to those reports, filed or furnished pursuant to Sections 13(a) or Section 15(d) of the Securities Exchange Act of 1934, as amended, as soon as reasonably practicable after they have been electronically filed with, or furnished to, the SEC.
Code of Ethics.
We have adopted a Code of Business Conduct and Ethics for Directors and Senior Financial Officers (the “Code of Ethics”) that applies to our Chief Executive officer, Chief Financial Officer, Chief Accounting Officer and Controller, and is a “code of ethics” as defined by applicable rules of the SEC. The Code of Ethics is posted on our corporate website at www.expediainc.com/Investors under the “Corporate Governance” tab. If we make any substantive amendments to the Code of Ethics or grant any waiver, including any implicit waiver, from a provision of the Code of Ethics to our Chief Executive Officer, Chief Financial Officer, or Chief Accounting Officer and Controller, we will disclose the nature of the amendment or waiver on that website or in a report on Form 8-K filed with the SEC.
9
Employees
As of
December 31, 2017
, we employed approximately 22,615 full-time and part-time employees. We believe we have good relationships with our employees, including relationships with employees represented by works councils or other similar organizations.
Part I. Item 1A.
Risk Factors
You should carefully consider each of the following risks and uncertainties associated with our company and the ownership of our securities. If any of the following risks occur, our business and/or financial performance could be materially adversely affected. Additional risks and uncertainties not presently known to us or that we currently deem immaterial may also impair our business and/or financial performance.
We operate in an increasingly competitive global environment.
The market for the services we offer is increasingly and intensely competitive. We compete with both established and emerging online and traditional sellers of travel-related services, including:
|
•
|
Online and traditional travel agencies, wholesalers and tour operators;
|
|
•
|
Travel suppliers, including hotels, airlines and car rental companies;
|
|
•
|
Search engines and large online portal websites;
|
|
•
|
Travel metasearch websites;
|
|
•
|
Corporate travel management service providers;
|
|
•
|
Mobile platform travel applications;
|
|
•
|
Social media websites;
|
|
•
|
eCommerce and group buying websites;
|
|
•
|
Alternative accommodation websites; and
|
|
•
|
Other participants in the travel industry.
|
Online and traditional travel agencies:
We face increasing competition from other online travel agencies (“OTAs”) in many regions, such as The Priceline Group and its subsidiaries Booking.com and Agoda.com, as well as regional competitors such as Ctrip, which in some cases may have more favorable offerings for travelers or suppliers, including pricing and supply breadth. In addition, the global OTA segment continues to consolidate, with certain competitors merging or forming strategic partnerships. We also compete with traditional travel agencies (operating both offline and online), wholesalers and tour operators for both travelers and the acquisition and retention of supply.
Travel suppliers:
Travel suppliers may offer products and services on more favorable terms to consumers who transact directly with them. Many of these competitors, such as airlines, hotels and rental car companies, have been steadily focusing on increasing online demand on their own websites and mobile applications in lieu of third-party distributors such as the various Expedia sites. For instance, several large hotel chains have combined to establish a single online hotel search platform with links directly to their own websites and mobile applications and some low-cost airlines, which are having increasing success in the marketplace, distribute their online supply exclusively through their own websites. In recent years, certain hotel chains have launched advertising campaigns expressly designed to drive consumer traffic directly to their websites. Suppliers who sell on their own websites, in some instances, offer advantages such as favorable rates, increased or exclusive product availability, complimentary Wi-Fi, and their own bonus miles or loyalty points, or in the case of airlines promote hotel supply at their websites, which could make their offerings more attractive to consumers than ours.
Search engines and large online portal websites:
We also face increasing competition from search engines, including Google. To the extent that leading search engines that have a significant presence in our key markets disintermediate online travel agencies or travel content providers by offering comprehensive travel planning, shopping or booking capabilities, or increasingly refer those leads directly to suppliers or other favored partners, increase the cost of traffic directed to our websites, or offer the ability to transact on their own website, there could be a material adverse impact on our business and financial performance. In recent years search engines have increased their focus on acquiring or launching flight and hotel search products that provide increasingly comprehensive travel planning content and direct booking capabilities, comparable to OTAs. For example, Google has entered various aspects of the online travel market, including by establishing a flight metasearch product (“Google Flights”) and a hotel metasearch product (“Hotel Ads”) that are growing rapidly, as well as its “Book on Google” reservation functionality. In addition, these search engines continue to expand their voice and artificial intelligence
10
capabilities. To the extent these actions have a negative effect on our search traffic or the cost of acquiring such traffic, our business and financial performance could be adversely affected.
In addition, our websites, or websites in which we hold a significant ownership position, including trivago-branded websites, compete for advertising revenue with these search engines, as well as with large internet portal sites that offer advertising opportunities for travel-related companies. Several of these competitors have significantly greater financial, technical, marketing and other resources and larger client bases than we do. We expect to face additional competition as other established and emerging companies enter the online advertising market. Competition could result in higher traffic acquisition costs, reduced margins on our advertising services, loss of market share, reduced customer traffic to our websites and reduced advertising by travel companies on our websites.
Travel metasearch websites:
Travel metasearch websites, including Kayak.com (a subsidiary of Priceline), trivago (a majority-owned subsidiary of Expedia), TripAdvisor, Skyscanner and Qunar (both are subsidiaries of Ctrip), aggregate travel search results for a specific itinerary across supplier, travel agent and other websites. In addition, some metasearch websites have added or intend to add various forms of direct or assisted booking functionality to their sites in direct competition with certain of our brands. To the extent metasearch websites limit our participation within their search results, or consumers utilize a metasearch website for travel services and bookings instead of ours, our traffic-generating arrangements could be affected in a negative manner, or we may be required to increase our marketing costs to maintain market share, either of which could have an adverse effect on our business and results of operations. In addition, as a result of our majority ownership interest in trivago, we also now compete more directly with other metasearch engines and content aggregators for advertising revenue. To the extent that trivago’s ability to aggregate travel search results for a specific itinerary across supplier, travel agent and other websites is hampered, whether due to its affiliation with us or otherwise, or if OTA advertisers or suppliers choose to limit their participation in trivago’s metasearch marketplace, trivago’s business and therefore our results of operations could be adversely affected and the value of our investment in trivago could be negatively impacted.
Corporate travel management service providers:
Egencia, our full-service corporate travel management company, competes with online and traditional corporate travel providers, including Carlson Wagonlit and American Express Global Business Travel (GBT), as well as vendors of corporate travel and expense management software and services, including Concur. Some of these competitors may have more financial resources, greater name recognition, well-established client bases, differentiated business models or a broader global presence, which may make it difficult for us to retain or attract new corporate travel clients.
Mobile and other platform travel applications:
The demand for and functionality of smartphones, tablet computers and home assistants continue to grow and improve significantly. If we are unable to offer innovative, user-friendly, feature-rich mobile applications and mobile-responsive websites for our travel services, along with effective marketing and advertising, or if our mobile applications and mobile-responsive websites are not used by consumers, we could lose market share to existing competitors or new entrants and our future growth and results of operations could be adversely affected.
Social media websites:
Social media websites, including Facebook, continue to develop search functionality for data included within their websites and mobile applications, which may in the future develop into an alternative research and booking resource for travelers, resulting in additional competition. Notably, Facebook has launched Dynamic Ads for Travel product, expanding its reach into the travel market.
eCommerce and group buying websites:
Traditional consumer eCommerce and group buying websites have periodically undertaken efforts to expand their local offerings into the travel market. For example, traditional consumer eCommerce and group buying websites may add hotel offers or other travel services to their sites. To the extent our travelers uses these websites, these websites may create additional competition and could negatively affect our businesses.
Alternative accommodations:
Airbnb and similar websites that facilitate the short-term rental of homes and apartments from owners provide an alternative to hotel rooms and vacation rental properties available through Expedia websites, including HomeAway. The continued growth of alternative accommodation sources could affect overall travel patterns generally and the demand for our services specifically in facilitating reservations at hotels and vacation rentals. Furthermore, Airbnb and similar websites have added other travel services, such as tours, activities, hotel and flight bookings, any of which could further extend their reach into the travel market as they seek to compete with the traditional OTAs.
Other participants in the travel industry:
Other participants or existing competitors may begin to offer or expand other services to the travel industry that compete with the services we offer to our travelers, our travel industry affiliates and partners, or our corporate clients. For example, ride-sharing apps increasingly compete with traditional car rental services and travel services continue to proliferate. To the extent any of these services gain market share over time, it may create additional competition and could negatively affect our businesses.
11
We cannot assure you that we will be able to compete successfully against any current, emerging and future competitors or on platforms that may emerge, or provide differentiated products and services to our traveler base. Increasing competition from current and emerging competitors, the introduction of new technologies and the continued expansion of existing technologies, such as metasearch and other search engine technologies, may force us to make changes to our business models, which could affect our financial performance and liquidity.
In general, increased competition has resulted in and may continue to result in reduced margins, as well as loss of travelers, transactions and brand recognition.
The industry in which we operate is dynamic.
We continue to adapt our business to remain competitive, including investing in evolving channels, such as metasearch, and mobile, as well as voice search capabilities and offering new consumer choices, including inventory types and transactional models, and increasing supplier inventory on our existing platforms through acquisitions and partnerships. If we fail to appropriately adapt to competitive or consumer preference developments, our business could be adversely affected. Our attempts to adapt our current business models or practices or adopt new business models and practices in order to compete may involve significant risks and uncertainties, including distraction of management from current operations, expenses associated with the initiatives, different legal or tax requirements, inadequate return on investments, difficulties and expenses associated with the integration of acquired brands and their inventory onto our platforms, as well as limiting our ability to develop new site features. In addition, adaptations to our business may require significant investments, including changes to our financial systems and processes, which could significantly increase our costs and increase the risk of payment delays and/or non-payments of amounts owed to us from our supplier partners and customers. In addition, these new initiatives may not be successful and may harm our financial condition and operating results.
Our business could be negatively affected by changes in search engine algorithms and dynamics or other traffic-generating arrangements.
We increasingly utilize internet search engines such as Google, principally through the purchase of travel-related keywords, to generate a significant portion of the traffic to our websites and the websites of our affiliates. Search engines frequently update and change the logic that determines the placement and display of results of a user’s search, such that the purchased or algorithmic placement of links to our websites and those of our affiliates can be negatively affected. In addition, a significant amount of traffic is directed to our websites and those of our affiliates through participation in pay-per-click and display advertising campaigns on search engines, including Google, and travel metasearch websites, including Kayak, TripAdvisor and trivago. Pricing and operating dynamics for these traffic sources can change rapidly, both technically and competitively. Moreover, a search or metasearch engine could, for competitive or other purposes, adopt emerging technologies such as voice, alter its search algorithms or results which could cause a website to place lower in search query results or inhibit participation in the search query results. If a major search engine changes its algorithms or results in a manner that negatively affects the search engine ranking, paid or unpaid, of our websites and the websites of our affiliates, or those of our third-party distribution partners, or if competitive dynamics impact the costs or effectiveness of search engine optimization, search engine marketing or other traffic-generating arrangements in a negative manner, our business and financial performance would be adversely affected, potentially to a material extent. In addition, certain metasearch companies have added various forms of direct or assisted booking functionality to their sites. To the extent such functionality is promoted at the expense of traditional paid listings, this may reduce the amount of traffic to our websites or those of our affiliates.
Our business depends on our relationships with travel suppliers and travel distribution partners.
An important component of our business success depends on our ability to maintain and expand relationships with travel suppliers (including owners and managers of vacation rental properties) and GDS partners. A substantial portion of our revenue is derived from compensation negotiated with travel suppliers, in particular hotel suppliers, airlines and GDS partners for bookings made through our websites. Each year we typically negotiate or renegotiate numerous supplier contracts.
No assurances can be given that our compensation, access to inventory or access to inventory at competitive rates will not be further reduced or eliminated in the future, or that travel suppliers will not reduce the cost of their products or services (for example, average daily rates (“ADRs”) or ticket prices); attempt to implement costly direct connections; charge us for or otherwise restrict access to content; increase credit card fees or fees for other services; fail to provide us with accurate booking information or otherwise take actions that would increase our operating expenses. Any of these actions, or other similar actions, could reduce our revenue and margins thereby adversely affecting our business and financial performance.
12
Declines or disruptions in the travel industry could adversely affect our business and financial performance.
Our business and financial performance are affected by the health of the worldwide travel industry. Travel expenditures are sensitive to personal and business-related discretionary spending levels and tend to decline or grow more slowly during economic downturns. Decreased travel expenditures could reduce the demand for our services, thereby causing a reduction in revenue.
For example, during regional or global recessions domestic and global economic conditions can deteriorate rapidly, resulting in increased unemployment and a reduction in available budgets for both business and leisure travelers, which slow spending on the services we provide and have a negative impact on our revenue growth. Additionally, if individual countries or regions experience deteriorating credit and economic conditions and/or significant fluctuations of currency values relative to other currencies such as the U.S. dollar, it can lead to a negative impact on our foreign denominated net assets, gross bookings, revenues, operating expenses, and net income as expressed in U.S. dollars. Further economic weakness and uncertainty may result in significantly decreased spending on our services by both business and leisure travelers, which may have a material adverse impact on our business and financial performance. Political instability, including the United Kingdom withdrawal from the European Union, bans on travel from certain countries to the United States, geopolitical conflicts, significant fluctuations in currency values, sovereign debt issues and macroeconomic concerns are examples of events that contribute to a somewhat uncertain economic environment, which could have a negative impact on the travel industry in the future.
Our business is also sensitive to fluctuations in hotel supply, occupancy and ADRs, decreases in airline capacity, periodically rising airline ticket prices and the imposition of taxes or surcharges by regulatory authorities, all of which we have experienced historically.
Other factors that could negatively affect our business include:
|
•
|
Significant changes in oil prices;
|
|
•
|
Continued air carrier and hotel chain consolidation;
|
|
•
|
Reduced access to discount airfares;
|
|
•
|
Travel-related strikes or labor unrest, bankruptcies or liquidations;
|
|
•
|
Increased incidents of actual or threatened terrorism;
|
|
•
|
Periods of political instability, geopolitical conflict or heightened local or regional crime activity, resulting in additional restrictions on travel or travelers becoming concerned about safety issues;
|
|
•
|
Natural disasters or events such as severe weather conditions, volcanic eruptions, hurricanes or earthquakes;
|
|
•
|
Travel-related accidents or the grounding of aircraft due to safety concerns; and
|
|
•
|
Health-related risks, such as the Ebola, H1N1, MERS-CoV, SARs and avian flu outbreaks.
|
Such concerns could result in a protracted decrease in demand for our travel services. This decrease in demand, depending on its scope and duration, together with any future issues affecting travel safety, could significantly and adversely affect our business, working capital and financial performance over the short and long-term. In addition, the disruption of the existing travel plans of a significant number of travelers upon the occurrence of certain events, such as severe weather conditions, actual or threatened terrorist activity or war, could result in the incurrence of significant additional costs and decrease our revenues leading to constrained liquidity if we, as we have done historically in the case of severe weather conditions, provide relief to affected travelers by refunding the price or fees associated with airline tickets, hotel reservations and other travel products and services.
We rely on the value of our brands, and the costs of maintaining and enhancing our brand awareness are increasing.
We invest considerable financial and human resources in our brands in order to retain and expand our customer base in existing and emerging markets. We expect that the cost of maintaining and enhancing our brands will continue to increase due to a variety of factors, including:
|
•
|
Increased spending from our competitors;
|
|
•
|
Promotional and discounting activities;
|
|
•
|
Our growing customer loyalty programs;
|
|
•
|
Supporting multiple brands and the impact of competition among our multiple brands;
|
|
•
|
Expanding our marketing efforts in certain geographies and developing new products;
|
13
|
•
|
Inflation in media pricing, including search engine keywords; and
|
|
•
|
Continued emergence and share growth of travel-related traffic from search and metasearch engines.
|
During 2017, certain online travel companies and metasearch websites continued to expand their offline and digital advertising campaigns globally, increasing competition for share of voice, and we expect this activity to continue in the future. We are also pursuing and expect to continue to pursue long-term growth opportunities, particularly in emerging markets, which have had and may continue to have a negative impact on our overall marketing efficiency.
Our efforts to preserve and enhance consumer awareness of our brands may not be successful, and, even if we are successful in our branding efforts, such efforts may not be cost-effective, or as efficient as they have been historically. Moreover, branding efforts with respect to some brands within the Expedia portfolio have in the past and may in the future result in marketing inefficiencies and negatively impact growth rates of other brands within our portfolio. In addition, our decisions over allocation of resources and choosing to invest in branding efforts for certain brands in our portfolio at the expense of not investing in, or reducing our investments in, other brands in our portfolio could have an overall negative financial impact. If we are unable to maintain or enhance consumer awareness of our brands and generate demand in a cost-effective manner, it would have a material adverse effect on our business and financial performance.
We rely on information technology to operate our businesses and maintain our competitiveness, and any failure to invest in and adapt to technological developments and industry trends could harm our business.
We depend on the use of sophisticated information technologies and systems, including technology and systems used for website and mobile applications, reservations, customer service, supplier connectivity, communications, procurement, payments, fraud detection and administration. As our operations grow in size, scope and complexity, we must continuously improve and upgrade our systems and infrastructure to offer an increasing number of travelers enhanced products, services, features and functionality, while maintaining or improving the reliability and integrity of our systems and infrastructure.
Our future success also depends on our ability to adapt our services and infrastructure to meet rapidly evolving consumer trends and demands while continuing to improve the performance, features and reliability of our service in response to competitive service and product offerings. Cloud computing, the continued growth of alternative platforms and mobile computing devices, the emergence of niche competitors who may be able to optimize products, services or strategies that use cloud computing or for such platforms, as well as other technological changes, including new devices, services and home assistants, such as Amazon’s Echo and Alexa Voice and Google Home, and developing technologies, such as machine learning, artificial intelligence, chatbot and virtual reality technologies, have, and will continue to require, new and costly investments. Transitioning to these new technologies may be disruptive to resources and the services we provide, and may increase our reliance on third party service providers. For example, we are in the midst of a multi-year project to migrate products, data storage and functionality and significantly increase our utilization of public cloud computing services, such as Amazon Web Services. In addition, we may not be successful, or may be less successful than our current or new competitors, in developing technology that operates effectively across multiple devices and platforms and that is appealing to consumers, either of which would negatively impact our business and financial performance. New developments in other areas, such as cloud computing and software as a service provider, could also make it easier for competition to enter our markets due to lower up-front technology costs. In addition, we may not be able to maintain our existing systems or replace or introduce new technologies and systems as quickly as we would like or in a cost-effective manner. We have been engaged in a multi-year effort to migrate key portions of our consumer, affiliate and corporate travel sites, and back office application functionality, to new technology platforms to enable us to improve conversion, innovate more rapidly, achieve better search engine optimization and improve our site merchandising and transaction processing capabilities, among other anticipated benefits. Implementations and system enhancements such as these have been in the past, and may continue to be in the future, more time consuming and expensive than originally anticipated, and the resources devoted to those efforts have adversely affected, and may continue to adversely affect, our ability to develop new site features. In addition, during the migration process the sites have in the past, and may continue in the future, to experience reduced functionality, decreases in conversion rates, and increased costs relating to maintaining redundant systems. Also, we may be unable to devote financial resources to new technologies and systems, or enhancements to existing infrastructure, technologies and systems, in the future. Overall, these implementations and systems enhancements may not achieve the desired results in a timely manner, to the extent anticipated, or at all. If any of these events occur, our business and financial performance could suffer.
Acquisitions, investments or significant commercial arrangements could result in operating and financial difficulties.
We have acquired, invested in or entered into significant commercial arrangements with a number of businesses in the past, and our future growth may depend, in part, on future acquisitions, investments or significant commercial arrangements, any of which could be material to our financial condition and results of operations. Certain financial and operational risks
14
related to acquisitions, investments or significant commercial arrangements that may have a material impact on our business are:
|
•
|
Diversion of management’s attention or other resources from our existing businesses, for example during 2016, we expended significant resources in the integration of Orbitz Worldwide, Inc.;
|
|
•
|
Difficulties and expenses in assimilating the operations, products, technology, privacy protection systems, information systems or personnel of the acquired company;
|
|
•
|
Use of cash resources and incurrence of debt and contingent liabilities in funding and after consummating acquisitions, including with regard to future payment obligations in connection with put/call rights, may limit other potential uses of our cash, including stock repurchases, dividend payments and retirement of outstanding indebtedness;
|
|
•
|
Amortization expenses related to acquired intangible assets and other adverse accounting consequences, including changes in fair value of contingent consideration;
|
|
•
|
Expected and unexpected costs incurred in pursuing acquisitions, including identifying and performing due diligence on potential acquisition targets that may or may not be successful, if unsuccessful could result in unexpected litigation or regulatory exposure, unfavorable accounting treatment, unexpected increases in taxes due, a loss of anticipated tax benefits or other adverse effects on our business, operating results or financial condition;
|
|
•
|
Impairment of relationships with employees, suppliers, customers, vendors and affiliates of our business and the acquired business;
|
|
•
|
The assumption of known and unknown debt and other liabilities and obligations of the acquired company;
|
|
•
|
Failure of the acquired company to achieve anticipated integration synergies, traffic, transactions, revenues, earnings or cash flows or to retain key management or employees;
|
|
•
|
Failure to generate adequate returns on our acquisitions and investments, or returns in excess of alternative uses of capital;
|
|
•
|
Failure to properly and timely integrate acquired companies and their operations, reducing our ability to achieve, among other things, anticipated returns on our acquisitions through cost savings and other synergies;
|
|
•
|
Entrance into markets in which we have no direct prior experience resulting in increased complexity in our business;
|
|
•
|
Challenges relating to the structure of an investment, such as governance, accountability and decision-making conflicts that may arise in the context of a joint venture or other majority ownership investments;
|
|
•
|
Impairment of goodwill or other intangible assets such as trademarks or other intellectual property arising from our acquisitions;
|
|
•
|
Costs associated with litigation or other claims arising in connection with the acquired company;
|
|
•
|
Increased or unexpected costs or delays to obtain governmental or regulatory approvals for acquisitions;
|
|
•
|
Increased competition amongst potential acquirers for acquisition targets could result in a material increase in the purchase price for such targets or otherwise limit our ability to consummate acquisitions; and
|
|
•
|
Adverse market reaction to acquisitions or investments or failure to consummate such transactions.
|
Moreover, we rely heavily on the representations and warranties and related indemnities provided to us by the sellers of acquired private companies, including as they relate to creation, ownership and rights in intellectual property and compliance with laws and contractual requirements. Our failure to address these risks or other problems encountered in connection with past or future acquisitions and investments could cause us to fail to realize the anticipated benefits of such acquisitions or investments, incur unanticipated liabilities and harm our business generally.
Our HomeAway business is subject to regulatory risks and continues its transition to a primarily transaction-based business, either of which could have a material adverse effect on our operations and financial results.
HomeAway has been, and continues to be, subject to regulatory development that affects the vacation rental industry and the ability of companies like us to list those vacation rentals online. For example, some states and local jurisdictions have adopted or are considering statutes or ordinances that prohibit property owners and managers from renting certain properties for fewer than 30 consecutive days or otherwise limit their ability to do so, and other states and local jurisdictions may introduce similar regulations. Many homeowners, condominium and neighborhood associations have adopted rules that prohibit or restrict short-term vacation rentals. In addition, many of the laws that impose taxes or other obligations on travel and lodging
15
companies were established before the growth of the internet and the vacation rental industry, which creates a risk of those laws being interpreted in ways not originally intended that could burden property owners and managers or otherwise harm our business.
We are subject to legal, financial and competitive risk associated with HomeAway’s transition to a primarily transaction-based business. HomeAway historically generated the majority of its revenues when owners or managers of vacation rentals paid HomeAway subscription fees for the listing of their properties on the HomeAway family of websites. While subscription fees were previously the predominant source of revenue for HomeAway, a growing share of HomeAway’s revenue is now generated from a commission-based business model, where the traveler pays a service fee for the use of the HomeAway platform and the owner or manager of the property pays HomeAway a fee or a commission on a transactional basis for each booking of the property by a traveler. HomeAway launched the traveler service fee and introduced its Book with Confidence Guarantee in the United States beginning in February 2016, followed by a rollout in Europe beginning in June 2016. In addition, HomeAway moved to a single subscription option for its homeowners and property manager partners in July 2016. HomeAway’s business model transition involves significant additional risks and potential costs for HomeAway, including:
|
•
|
Delays or unanticipated costs in completing the transition, which may delay or negate any expected benefits;
|
|
•
|
Suppliers and travelers may not adopt HomeAway’s new marketplace or payment structures and may choose to transact with competitors;
|
|
•
|
Failure to implement or expand HomeAway’s technology, systems and network infrastructure in light of additional payment processing and reporting complexity, or failure to do so at a reasonable cost;
|
|
•
|
New efforts in search engine marketing and participation in metasearch may be ineffective and reduce HomeAway’s ability to spend at the desired return on investment;
|
|
•
|
Increased risk of fraud; and
|
|
•
|
Additional potential tax exposures.
|
These risks could have a material adverse effect on HomeAway’s business and results of operations, which in turn could have a material adverse effect on Expedia’s operations and financial results.
Our international operations involve additional risks and our exposure to these risks will increase as our business expands globally.
We operate in a number of jurisdictions outside of the United States and intend to continue to expand our international presence. As we have expanded globally, our international (non-U.S.) revenue has increased from 39% in 2010 to 45% in 2017. In foreign jurisdictions, we face complex, dynamic and varied risk landscapes. As we begin to operate in new markets and countries, we must tailor our services, business models and functional compliance structures to the unique circumstances of such countries and markets, which can be complex, difficult, costly and divert management and personnel resources. Laws and business practices that favor local competitors or prohibit or limit foreign ownership of certain businesses or our failure to adapt our practices, systems, processes and business models effectively to the traveler and supplier preferences (as well as the regulatory and tax landscapes) of each country into which we expand, could slow our growth. For example, to compete in certain international markets we have in the past, and may in the future, adopt locally-preferred payment methods, which has increased our costs and instances of fraud. Certain international markets in which we operate have lower margins than more mature markets, which could have a negative impact on our overall margins as our revenues from these markets grow over time.
In addition to the risks outlined elsewhere in this section, our international operations are also subject to a number of other risks, including:
|
•
|
Currency exchange restrictions or costs and exchange rate fluctuations, and the risks and costs inherent in hedging such exposures;
|
|
•
|
Exposure to local economic or political instability and threatened or actual acts of terrorism;
|
|
•
|
Compliance with U.S. and Non-U.S. regulatory laws and requirements relating to anti-corruption, antitrust or competition, economic sanctions, data content and privacy, consumer protection, employment and labor laws, health and safety, information reporting and advertising and promotions;
|
|
•
|
Compliance with additional U.S. laws applicable to U.S. companies operating internationally;
|
|
•
|
Differences, inconsistent interpretations and changes in U.S. and non-U.S. laws and regulations, including tax laws enacted pursuant to the 2017 Tax Cuts and Jobs Act in the United States;
|
|
•
|
Weaker enforcement of our contractual and intellectual property rights;
|
16
|
•
|
Lower levels of credit card usage and increased payment and fraud risk;
|
|
•
|
Longer payment cycles, and difficulties in collecting accounts receivable;
|
|
•
|
Preferences by local populations for local providers;
|
|
•
|
Restrictions on, or adverse tax and other consequences related to the repatriation of cash, the withdrawal of non-U.S. investments, cash balances and earnings, as well as restrictions on our ability to invest in our operations in certain countries;
|
|
•
|
Financial risk arising from transactions in multiple currencies;
|
|
•
|
Slower adoption of the internet as an advertising, broadcast and commerce medium in those markets as compared to the United States;
|
|
•
|
Our ability to support new technologies, including mobile devices or block chain technologies, that may be more prevalent in international markets;
|
|
•
|
Difficulties in attracting and retaining qualified employees in international markets, as well as managing staffing and operations due to increased complexity, unionization, distance, time zones, language and cultural differences; and
|
|
•
|
Uncertainty regarding liability for services and content, including uncertainty as a result of local laws and lack of precedent.
|
The China travel market in particular is significant and has grown significantly in recent years. Prior to May 2015, we conducted our operations in China primarily through our majority ownership interest in eLong, Inc., an online travel service provider in China. Following the sale of our eLong ownership stake in May 2015 to a group of China-based purchasers, including to a subsidiary of Ctrip International, Ltd., we have conducted our business in China through localized websites and commercial arrangements with local partners, including Ctrip. There can be no guarantee that we will be able to grow or even maintain market share and brand awareness in the highly dynamic and intensely competitive market in China and our failure to do so could significantly impact our ability to grow our overall business.
A failure to comply with current laws, rules and regulations or changes to such laws, rules and regulations and other legal uncertainties may adversely affect our business, financial performance, results of operations or business growth.
Our business and financial performance could be adversely affected by unfavorable changes in or interpretations of existing laws, rules and regulations or the promulgation of new laws, rules and regulations applicable to us and our businesses, including those relating to travel and vacation rental licensing and listing requirements, the internet and online commerce, internet advertising and price display, consumer protection, anti-corruption, anti-trust and competition, economic and trade sanctions, tax, banking, data security, the provision of payment services and privacy. As a result, regulatory authorities could prevent or temporarily suspend us from carrying on some or all of our activities or otherwise penalize us if our practices were found not to comply with applicable regulatory or licensing requirements or any binding interpretation of such requirements. Unfavorable changes or interpretations could decrease demand for our products and services, limit marketing methods and capabilities, affect our margins, increase costs and/or subject us to additional liabilities.
For example, there are, and will likely continue to be, an increasing number of laws and regulations pertaining to the internet and online commerce that may relate to liability for information retrieved from or transmitted over the internet, display of certain taxes and fees, online editorial and user-generated content, user privacy, behavioral targeting and online advertising, taxation, liability for third-party activities and the quality of products and services. Furthermore, the growth and development of online commerce may prompt calls for more stringent consumer protection laws and more aggressive enforcement efforts, which may impose additional burdens on online businesses generally.
Likewise, the SEC, Department of Justice (“DOJ”) and Office of Foreign Assets Controls (“OFAC”), as well as foreign regulatory authorities, have continued to increase the enforcement of economic sanctions and trade regulations and anti-corruption laws, across industries. U.S. economic sanctions relate to transactions with designated foreign countries, including Cuba, Iran, North Korea, Sudan, Syria and the Crimea region of the Ukraine, and nationals and others of those countries, as well as certain specifically targeted individuals and entities. We believe that our activities comply with OFAC, European Union, United Kingdom and other regulatory authorities’ economic sanction and trade regulations and anti-corruption regulations, including the Foreign Corrupt Practices Act (“FCPA”), the UK Bribery Act and the UK Criminal Finances Act. As regulations continue to evolve and regulatory oversight continues to increase, we cannot guarantee that our programs and policies will be deemed compliant by all applicable regulatory authorities. In the event our controls should fail or are found to be out of compliance for other reasons, we could be subject to monetary damages, civil and criminal money penalties, litigation and damage to our reputation and the value of our brands.
17
We also have been subject, and we will likely be subject in the future, to inquiries or legal proceedings from time to time from regulatory bodies concerning compliance with consumer protection, competition, tax and travel industry-specific laws and regulations, including but not limited to investigations and legal proceedings relating to the travel industry and, in particular, parity provisions in contracts between hotels and online travel companies, including Expedia and the presentation of information to consumers, as described in Part I, Item 3,
Legal Proceedings - Competition and Regulatory Matters
. The failure of our businesses to comply with these laws and regulations could result in fines and/or proceedings against us by governmental agencies and/or consumers, which if material, could adversely affect our business, financial condition and results of operations. Further, if such laws and regulations are not enforced equally against other competitors in a particular market, our compliance with such laws may put us a competitive disadvantage vis-à-vis competitors who do not comply with such requirements. We are unable at this time to predict the timing or outcome of these various investigations and lawsuits or similar future investigations or lawsuits, and their impact, if any, on our business and results of operations.
The promulgation of new laws, rules and regulations, or the new interpretation of existing laws, rules and regulations, in each case that restrict or otherwise unfavorably impact the ability or manner in which we provide travel services could require us to change certain aspects of our business, operations and commercial relationships to ensure compliance, which could decrease demand for services, reduce revenues, increase costs and/or subject the company to additional liabilities.
Furthermore, our future growth may be limited by anti-trust or competition laws. For example, our business has grown and continues to expand, and, as a consequence, increases in our size and market share may negatively affect our ability to obtain regulatory approval of proposed acquisitions, investments or significant commercial arrangements, any of which could adversely affect our ability to grow and compete.
Application of existing tax laws, rules or regulations are subject to interpretation by taxing authorities.
The application of various domestic and international income and non-income tax laws, rules and regulations to our historical and new products and services is subject to interpretation by the applicable taxing authorities. These taxing authorities have become more aggressive in their interpretation and/or enforcement of such laws, rules and regulations over time, as governments are increasingly focused on ways to increase revenues. This has contributed to an increase in audit activity and harsher stances by tax authorities. As such, additional taxes or other assessments may be in excess of our current tax reserves or may require us to modify our business practices, any of which could have a material adverse effect on our business, results of operations and financial condition.
A number of taxing authorities have made inquiries, filed lawsuits and/or levied assessments asserting we are required to collect and remit hotel occupancy, state and local sales or use taxes or other taxes, including, but not limited to, the legal proceedings described in Part I, Item 3, Legal Proceedings. We are also in various stages of inquiry or audit with multiple jurisdictions regarding the application of value added/goods and services tax to our transactions. While we believe we comply with applicable tax laws in the jurisdictions in which we facilitate travel reservations, tax authorities may conclude we owe additional taxes and issue tax assessments.
We have in the past been required, and may in the future be required
,
in certain domestic and foreign jurisdictions to pay any such tax assessments prior to contesting their validity, which payments may be substantial. This requirement is commonly referred to as “pay-to-play.” Payment of these amounts is not an admission that the taxpayer believes it is subject to such taxes. For example, as a pre-condition to challenging the assessments, during 2009, we paid $48 million under protest to the city of San Francisco and an additional $25.5 million under protest on May 26, 2014 in connection with additional assessments; and during 2013, we paid $171 million to the state of Hawaii. In September 2015, following a ruling by the Hawaii Supreme Court, the State of Hawaii refunded the Expedia companies $132 million of the original “pay-to-play” amount, and Orbitz also received a similar refund of $22 million. On May 15, 2017, the Expedia companies paid under protest the full amount claimed due, or approximately $16.7 million, as a condition of appealing the August 5, 2016 decision by the Hawaii tax court holding that taxes are due on the online travel companies’ services to facilitate merchant model car rental transactions.
Significant judgment and estimation is required in determining our worldwide tax liabilities. In the ordinary course of our business, there are transactions and calculations, including intercompany transactions and cross-jurisdictional transfer pricing, for which the ultimate tax determination is uncertain or otherwise subject to interpretation. Tax authorities may disagree with our intercompany charges, including the amount of or basis for such charges, cross-jurisdictional transfer pricing or other matters and assess additional taxes. For example, the IRS recently notified us of a proposed adjustment relating to transfer pricing with our foreign subsidiaries in connection with the examination of the 2009-2010 tax years, and although we disagree with the IRS’ position and are challenging the adjustments, the ultimate resolution is uncertain and, if resolved in a manner unfavorable to us, may adversely affect our financial results. We believe our tax estimates are reasonable, however, the final determination of tax audits could be materially different from our historical tax provisions and accruals in which case we may
18
be subject to additional tax liabilities, possibly including interest and penalties, which could have a material adverse effect on our cash flows, financial condition and results of operations.
The enactment of legislation implementing changes in taxation of international business activities, the adoption of other corporate tax reform policies, or changes in tax legislation or policies could materially affect our financial position and results of operations.
While many of the underlying laws, rules or regulations imposing taxes and other obligations were established before the growth of the digital economy, some jurisdictions have enacted new tax laws, rules and regulations directed at the digital economy and multi-national businesses. If existing tax laws, rules or regulations are amended, or if new unfavorable tax laws, rules or regulations are enacted, particularly with respect to occupancy, sales, value-added taxes, or unclaimed property, or other tax laws applicable to the digital economy or multi-national businesses, the results could increase our tax payments, including the possibility of double taxation, or other obligations, prospectively or retrospectively, subject us to interest and penalties, decrease the demand for our products and services if we pass on such costs to the consumer, result in increased costs to update or expand our technical or administrative infrastructure or effectively limit the scope of our business activities if we decided not to conduct business in particular jurisdictions. As a result, these changes could have an adverse effect on our business or financial performance.
Corporate tax reform, base-erosion efforts and tax transparency continue to be high priorities in many tax jurisdictions where we have business operations. As a result, policies regarding corporate income and other taxes in numerous jurisdictions are under heightened scrutiny and tax reform legislation is being proposed or enacted in several jurisdictions. For example, the 2017 Tax Cuts and Jobs Act reforms U.S. corporate income taxes and, among other things, reduces the U.S. corporate income tax rate from 35% to 21%, but imposes base-erosion prevention measures as well as a one-time mandatory deemed repatriation tax on accumulated foreign earnings. Our initial estimates of the financial impact of the 2017 Tax Cuts and Jobs Act may change as we review our analysis and as additional guidance becomes available. In general, changes in tax laws may affect our tax rate, increase our tax liabilities, carrying value of deferred tax assets, or our deferred tax liabilities.
In addition, in October 2015, the Organization for Economic Co-Operation and Development (“OECD”) released a final package of suggested measures to be implemented by member nations in response to a 2013 action plan calling for a coordinated multi-jurisdictional approach to “base erosion and profit shifting” (“BEPS”) by multinational companies. Multiple member jurisdictions, including countries in which we operate, have begun implementing recommended changes such as country by country reporting (“CBCR”). The CBCR standards require multinationals to disclose certain financial and economic indicators across geographies. The CBCR disclosure is expected to result in increased global tax audit activity. Additional legislative changes are anticipated in upcoming years. Certain countries have adopted unilateral changes increasing the risk of double taxation. Any changes to U.S. or international tax laws or interpretation of current or existing law could impact the tax treatment of our earnings and adversely affect our profitability. Our tax liabilities in the future could also be adversely affected by changes to our operating structure, changes in the mix of earnings in countries with differing statutory tax rates, changes in the valuation of deferred tax assets and liabilities, or the discontinuance of beneficial tax arrangements in certain jurisdictions.
We continue to work with, as appropriate, relevant governmental authorities and legislators to clarify our obligations under existing, new and emerging tax laws, rules and regulations. However, due to the large scale of our international business activities any substantial changes in international corporate tax policies, enforcement activities or legislative initiatives may materially and adversely affect our business, the amount of taxes we are required to pay and our financial condition and results of operations generally.
We are involved in various legal proceedings and may experience unfavorable outcomes, which could adversely affect our business and financial condition.
We are involved in various legal proceedings and claims involving taxes, property, personal injury, contract, alleged infringement of third-party intellectual property rights, antitrust, consumer protection, securities laws, and other claims, including, but not limited to, the legal proceedings described in Part I, Item 3, Legal Proceedings. These matters may involve claims for substantial amounts of money or for other relief that might necessitate changes to our business or operations. The defense of these actions is and will likely continue to be both time consuming and expensive and their outcomes cannot be predicted with certainty. Determining reserves for pending litigation is a complex, fact-intensive process that requires significant legal judgment. It is possible that unfavorable outcomes in one or more such proceedings could result in substantial payments that could adversely affect our business, consolidated financial position, results of operations, or cash flows in a particular period.
19
System interruption, security breaches and the lack of redundancy in our information systems may harm our businesses.
We rely on information technology systems, including the internet and third-party hosted services, to support a variety of business processes and activities and to transmit and store data, including booking transactions, intellectual property, our proprietary business information and that of our suppliers and business partners, personally identifiable information of our customers and employees, and invoicing information and the collection of payments, accounting, procurement, and supply chain activities. In addition, we rely on our information technology systems to process financial information and results of operations for internal reporting purposes and to comply with financial reporting, legal, and tax requirements. The risk of a cybersecurity-related attack, intrusion, or disruption, including through spyware, viruses, phishing, denial of service and similar attacks by criminal organizations, hacktivists, foreign governments, and terrorists, is persistent. In addition, as we continue to integrate legacy systems from our acquired companies, such as Orbitz and HomeAway, into our information technology systems, we increase the risk of these system interruptions. We have experienced and may in the future experience system interruptions that make some or all of these systems unavailable or prevent us from efficiently fulfilling orders or providing services to third parties. These interruptions could include security intrusions and attacks on our systems for fraud or service interruption. Significant interruptions, outages or delays in our internal systems, or systems of third parties that we rely upon - including multiple co-location providers for data centers, cloud computing providers for application hosting, and network access providers - and network access, or deterioration in the performance of such systems, would impair our ability to process transactions, decrease our quality of service that we can offer to our customers, damage our reputation and brands, increase our costs and/or cause losses.
Potential security breaches to our systems or the systems of our service providers, whether resulting from internal or external sources, could significantly harm our business. We devote significant resources to network security, monitoring and testing, employee training, and other security measures, but there can be no guarantee that these measures will prevent all possible security breaches or attacks. A party, whether internal or external, that is able to circumvent our security systems could misappropriate customer or employee information, intellectual property, proprietary information or other business and financial data or cause significant interruptions in our operations. We may need to expend additional significant resources to protect against security breaches or to address problems caused by breaches, and a security breach resulting in the reduction of website availability could cause a loss of substantial business volume during the occurrence of any such incident. Because the techniques used to sabotage security change frequently, are often not recognized until launched against a target, and may originate from less regulated or remote areas around the world, we may be unable to proactively address these techniques or to implement adequate preventive measures. Security breaches could result in negative publicity, damage to reputation, exposure to risk of loss or litigation and possible liability due to regulatory penalties and sanctions or pursuant to our contractual arrangements with payment card processors for associated expenses and penalties. Security breaches could also cause travelers and potential users and our business partners to lose confidence in our security, which would have a negative effect on the value of our brands. Our failure to quickly respond to or adequately protect against attacks or intrusions, whether for our own systems or systems of vendors, could expose us to security breaches that could have an adverse impact on financial performance.
In addition, no assurance can be given that our backup systems or contingency plans will sustain critical aspects of our operations or business processes in all circumstances, many other systems are not fully redundant and our disaster recovery or business continuity planning may not be sufficient. Fire, flood, power loss, telecommunications failure, break-ins, earthquakes, acts of war or terrorism, acts of God, computer viruses, electronic intrusion attempts from both external and internal sources and similar events or disruptions may damage or impact or interrupt computer or communications systems or business processes at any time. Although we have put measures in place to protect certain portions of our facilities and assets, any of these events could cause system interruption, delays and loss of critical data, and could prevent us from providing services to our travelers and/or third parties for a significant period of time. In addition, any remediation efforts may be costly for which we may not have adequate insurance to cover such losses or costs. Moreover, the costs of enhancing infrastructure to attain improved stability and redundancy may be time consuming and expensive and may require resources and expertise that are difficult to obtain.
We process, store and use customer and employee personal, financial and other data, which subjects us to risks stemming from possible failure to comply with governmental regulation and other legal obligations, as well as litigation and reputational risks associated with the failure to protect such data from unauthorized use, theft or destruction.
We process, store and use customer and employee personal, financial and other data obtained from users of our websites and mobile applications and from our administrative functions. There are numerous laws regarding the storing, sharing, use, processing, disclosure and protection of customer and employee personal, financial and other data, the scope of which is changing, subject to differing interpretations, and may be inconsistent between countries or conflict with other rules. We strive to comply with all applicable laws, policies, legal obligations and industry codes of conduct relating to privacy and data
20
protection. It is possible, however, that these obligations may be interpreted and applied in a manner that is inconsistent from one jurisdiction to another and may conflict with other rules or the practices of the companies.
Any failure or perceived failure by us, or our service providers, to comply with the privacy policies, privacy-related obligations to users or other third parties, or privacy related legal obligations, or any compromise of security that results in the unauthorized use, theft or destruction of such data, may result in a material loss of revenues from the potential adverse impact to our reputation and brand, our ability to retain customers or attract new customers and the potential disruption to our business and plans. In addition, such an event could result in violations of applicable U.S. and international laws, governmental enforcement actions and consumer or securities litigation. Such events could also subject us to bank fines, penalties or increased transaction costs, damage our reputation and brands, impair our relationships with current and potential business partners and key service providers, all of which could have an adverse effect on our business.
We are subject to international privacy regulations, compliance with these regulations could impose significant compliance burdens.
The regulatory framework for privacy issues worldwide is currently in flux and is likely to remain so for the foreseeable future. Practices regarding the collection, use, storage, transmission and security of personal information by companies operating over the internet have recently come under increased public scrutiny. The U.S. Congress and federal agencies, including the Federal Trade Commission and the Department of Commerce, are reviewing the need for greater regulation for the collection and use of information concerning consumer behavior on the internet, including regulation aimed at restricting certain targeted advertising practices. U.S. courts are also considering the applicability of existing federal and state statutes, including computer trespass and wiretapping laws, to the collection and exchange of information online.
In addition, the European Court of Justice’s invalidation of the U.S.-EU Safe Harbor Framework could make it more difficult for us to transfer data outside of the European Union for processing and the European Union’s reforms to its existing data protection legal framework, which may result in a greater compliance burden for companies, including Expedia, with users in Europe and increased costs of compliance. For example, the European Union adopted a new regulation that becomes effective in May 2018, called the General Data Protection Regulation, which requires companies to meet new requirements regarding the handling of personal data, including its use, protection and the ability of persons whose data is stored to correct or delete such data about themselves. Failure to meet these requirements could result in significant penalties. Finally, countries in other regions, most notably Asia, Eastern Europe and Latin America, are increasingly implementing new privacy regulations, resulting in additional compliance burdens and uncertainty as to how some of these laws will be interpreted.
We are subject to payments-related and fraud risks.
We have agreements with companies that process customer credit and debit card transactions, the volume of which are very large and continue to grow, for the facilitation of customer bookings of travel services from our travel suppliers. These agreements allow these processing companies, under certain conditions, to hold an amount of our cash (referred to as a “holdback”) or require us to otherwise post security equal to a portion of bookings that have been processed by that company. These processing companies may be entitled to a holdback or suspension of processing services upon the occurrence of specified events, including material adverse changes in our financial condition. An imposition of a holdback or suspension of processing services by one or more of our processing companies could materially reduce our liquidity. Moreover, there can be no assurances that the interchange rates or the fees we pay for the processing of customer credit and debit card transactions will not increase which could reduce our revenue thereby adversely affecting our business and financial performance.
In addition, credit card networks, such as Visa, MasterCard and American Express, have adopted rules and regulations that apply to all merchants who process and accept credit cards and include payment card association operating rules, the Payment Card Industry Data Security Standards, or the PCI DSS. Under these rules, we are required to adopt and implement internal controls over the use, storage and security of card data. We assess our compliance with the PCI DSS rules on a periodic basis and make necessary improvements to our internal controls. If we fail to comply with these rules or requirements, or if our data security systems are breached or compromised, we may be liable for card issuing banks’ costs, subject to fines and higher transaction fees, and lose our ability to accept credit and debit card payments from our customers, or facilitate other types of online payments, and our business and operating results could be adversely affected.
Our results of operations and financial positions have been negatively affected by our acceptance of fraudulent bookings made using credit and debit cards or fraudulently obtained loyalty points. We are sometimes held liable for accepting fraudulent bookings on our websites or other bookings for which payment is subsequently disputed by our customers both of which lead to the reversal of payments received by us for such bookings (referred to as a “charge back”). Accordingly, we calculate and record an allowance for the resulting credit and debit card charge backs. Our ability to detect and combat fraudulent schemes, which have become increasingly common and sophisticated, may be negatively impacted by the adoption of new payment methods, the emergence and innovation of new technology platforms, including smartphones, tablet computers and in-home
21
assistants, and our global expansion, including into markets with a history of elevated fraudulent activity. In addition, for existing and future payment options we offer to our customers, we may become subject to additional regulations and compliance requirements (including obligations to implement enhanced authentication processes that could result in significant costs and reduce the ease of use of our payments products), as well as fraud. If we are unable to effectively combat fraudulent bookings on our websites or mobile applications or if we otherwise experience increased levels of charge backs, our results of operations and financial positions could be materially adversely affected.
In addition, when onboarding suppliers to our websites, we may fail to identify falsified or stolen supplier credentials, which may result in fraudulent bookings or unauthorized access to personal or confidential information of users of our websites and mobile applications. A fraudulent supplier scheme could also result in negative publicity, damage to our reputation, and could cause users of our websites and mobile applications to lose confidence in the quality of our services. Any of these events would have a negative effect on the value of our brands, which could have an adverse impact on our financial performance.
We have foreign exchange risk.
We conduct a significant and growing portion of our business outside the United States. As a result, we face exposure to movements in currency exchange rates, particularly those related to the British pound sterling, euro, Canadian dollar, Australian dollar, Thai baht, Brazilian real, and Nordic currencies.
These exposures include but are not limited to re-measurement gains and losses from changes in the value of foreign denominated monetary assets and liabilities; translation gains and losses on foreign subsidiary financial results that are translated into U.S. dollars upon consolidation; fluctuations in hotel revenue due to relative currency movements from the time of booking to the time of stay; planning risk related to changes in exchange rates between the time we prepare our annual and quarterly forecasts and when actual results occur; and the impact of relative exchange rate movements on cross-border travel such as from Europe to the United States and the United States to Europe.
Depending on the size of the exposures and the relative movements of exchange rates, if we choose not to hedge or fail to hedge effectively our exposure, we could experience a material adverse effect on our financial statements and financial condition. As we have seen in some recent periods, in the event of severe volatility in exchange rates these exposures can increase, and the impact on our results of operations can be more pronounced. In addition, the current environment and the increasingly global nature of our business have made hedging these exposures more complex. We have increased and plan to continue increasing the scope and complexity of our foreign exchange risk management. We make a number of estimates in conducting hedging activities including in some cases cancellations and payments in foreign currencies. In addition, an effective exchange rate hedging program is dependent upon effective systems, accurate and reliable data sources, controls and change management procedures. In the event our estimates differ significantly from actual results or if we fail to adopt effective hedging processes, we could experience greater volatility as a result of our hedging activities.
Our stock price is highly volatile.
The market price of our common stock is highly volatile and could continue to be subject to wide fluctuations in response to factors such as the following, some of which are beyond our control:
|
•
|
Quarterly variations in our operating and financial results;
|
|
•
|
Operating and financial results that vary from the expectations of securities analysts and investors, including failure to deliver returns on technology, supply or emerging market marketing investments;
|
|
•
|
Changes in expectations as to our future financial performance, including financial estimates by securities analysts and investors;
|
|
•
|
Rating agency credit rating actions or pronouncements;
|
|
•
|
Reaction to our earnings releases and conference calls, or presentations by executives at investor and industry conferences;
|
|
•
|
Worldwide macro-economic conditions and fluctuations in currency exchange rates;
|
|
•
|
Changes in our capital or governance structure;
|
|
•
|
Changes in the stock price or market valuations of trivago, our majority-owned, publicly traded subsidiary, whose stock price is also highly volatile;
|
|
•
|
Changes in market valuations of other internet or online service companies;
|
|
•
|
Changes in device and platform technologies and search industry dynamics, such as key word pricing and traffic, or other changes that negatively affect our ability to generate traffic to our websites;
|
22
|
•
|
Announcements of dividends or changes in the amount or frequency of our dividends;
|
|
•
|
Announcements by us or our competitors of technological innovations, new services or promotional and discounting activities;
|
|
•
|
Announcements by us or our competitors of significant contracts, acquisitions, strategic partnerships, joint ventures or capital commitments;
|
|
•
|
Loss of a major travel supplier, such as an airline, hotel or car rental chain;
|
|
•
|
Changes in the status of our intellectual property rights;
|
|
•
|
Lack of success in the expansion of our business model geographically;
|
|
•
|
Claims or proceedings against us or adverse developments or decisions in pending proceedings;
|
|
•
|
Significant security breaches;
|
|
•
|
Additions or departures of key personnel;
|
|
•
|
Rumors or public speculation about any of the above factors; and
|
|
•
|
Price and volume fluctuations in the stock markets in general.
|
Volatility in our stock price could also make us less attractive to certain investors, and/or invite speculative trading in our common stock or debt instruments.
We may experience constraints in our liquidity and may be unable to access capital when necessary or desirable, either of which could harm our financial position.
We have experienced, and may experience in the future, declines in seasonal liquidity and capital provided by our merchant hotel business, which has historically provided a meaningful portion of our operating cash flow and is dependent on several factors, including the rate of growth of our merchant hotel business and the relative growth of businesses which consume rather than generate working capital, such as our agency hotel, advertising and managed corporate travel businesses and payment terms with suppliers. We also continued to see growth in both our merchant (Expedia Collect) and our agency (Hotel Collect) hotel products. To the extent our merchant hotel business stopped growing or began to decline, it would likely result in pressure on our working capital cash balances, cash flow over time and liquidity.
The availability of funds depends in significant measure on capital markets and liquidity factors over which we exert no control. In light of periodic uncertainty in the capital and credit markets, we can provide no assurance that sufficient financing will be available on desirable or even any terms to fund investments, acquisitions, stock repurchases, dividends, debt refinancing or extraordinary actions or that our counterparties in any such financings would honor their contractual commitments. In addition, any downgrade of our debt ratings by Standard & Poor’s, Moody’s Investor Service, Fitch or similar ratings agencies, increases in general interest rate levels and credit spreads or overall weakening in the credit markets could increase our cost of capital.
We rely on the performance of highly skilled personnel and, if we are unable to retain or motivate key personnel or hire, retain and motivate qualified personnel, our business would be harmed.
Our performance is largely dependent on the talents and efforts of highly skilled individuals. Our future success depends on our continuing ability to identify, hire, develop, motivate and retain highly skilled personnel for all areas of our organization. In particular, the contributions of Barry Diller, our Chairman and Senior Executive, and Mark Okerstrom, our Chief Executive Officer, are critical to the overall management of the company. Our future success will depend on the performance of our senior management and key employees. Expedia cannot ensure that it will be able to retain the services of Mr. Diller, Mr. Okerstrom or any other member of our senior management or key employees, the loss of whom could seriously harm our business. We do not maintain any key person life insurance policies.
Competition for well-qualified employees in certain aspects of our business, including software engineers, developers, product management personnel, development personnel, and other technology professionals, also remains intense. Our continued ability to compete effectively depends on our ability to attract new employees and to retain and motivate our existing employees. For example, additional barriers to or restricts on travel for professional or personal purposes, such as those in the United States in early 2017, may cause significant disruption to our businesses or negatively affect our ability to attract and retain employees on a global basis. If we do not succeed in attracting well-qualified employees or retaining or motivating existing employees, our business would be adversely affected.
In addition, we have in the past and may again in the future, restructure portions of our global workforce to simplify and streamline our organization, improve our cost structure and strengthen our overall businesses. These changes could affect employee morale and productivity and be disruptive to our business and financial performance.
23
Mr. Diller currently effectively controls Expedia. If Mr. Diller ceases to control the company, Liberty Expedia Holdings, Inc. may effectively control the company.
Subject to the terms of a Stockholders Agreement between Mr. Diller and Liberty Expedia Holdings, Mr. Diller holds an irrevocable proxy to vote shares of Expedia stock held by Liberty Expedia Holdings, which proxy has been assigned by Mr. Diller to Liberty Expedia Holdings until the earlier of May 4, 2018 or the occurrence of certain termination events. By virtue of the agreements between Mr. Diller and Liberty Expedia Holdings and their respective holdings in Expedia, the voting power of an irrevocable proxy granted to Mr. Diller by John C. Malone and Leslie Malone over their shares in Liberty Expedia Holdings and the governance arrangements at Liberty Expedia Holdings, during the period the assignment of the Diller Proxy and the proxy granted him by the Malones are in effect, Mr. Diller is effectively able to control the outcome of nearly all matters submitted to a vote or for the consent of our stockholders (other than with respect to the election by the holders of common stock of 25% of the members of our Board of Directors and matters as to which Delaware law requires a separate class vote). Upon Mr. Diller’s permanent departure from Expedia, the irrevocable proxy would terminate and depending on the capitalization of Expedia at such time, Liberty Expedia Holdings could effectively control the voting power of our capital stock. As a result of their agreements and respective holdings in Expedia, Mr. Diller and Liberty Expedia Holdings may be deemed to share voting power over securities representing approximately
54%
of the combined voting power of the outstanding Expedia capital stock as of December 31, 2017.
In addition, under a Governance Agreement among Mr. Diller, Liberty Expedia Holdings, Inc. and Expedia, Inc., as amended, each of Mr. Diller and Liberty Expedia Holdings generally has the right to consent to limited matters in the event that we incur debt such that our ratio of total debt to EBITDA, as defined in the Governance Agreement, equals or exceeds 8:1 over a continuous 12-month period. We cannot assure you that Mr. Diller and Liberty Expedia Holdings will consent to any such matter at a time when we are highly leveraged, in which case we would not be able to engage in such transactions or take such actions.
As a result of Mr. Diller’s and Liberty Expedia Holdings’ ownership interests and voting power, the agreements between Mr. Diller and Liberty Expedia Holdings and between Mr. Diller and the Malones, and the governance structure at Liberty Expedia Holdings, Mr. Diller is currently in a position to control or influence, and Liberty Expedia Holdings is in a position to influence, significant corporate actions, including, corporate transactions such as mergers, business combinations or dispositions of assets. As a result of Liberty Expedia Holdings’ ownership interests and voting power upon Mr. Diller’s permanent departure from Expedia, in the future Liberty Expedia Holdings may be in a position to control or influence such corporate actions. This concentrated control could discourage others from initiating any potential merger, takeover or other change of control transaction that may otherwise be beneficial to us.
Actual or potential conflicts of interest may develop between Expedia management and directors, on the one hand, and the management and directors of IAC, on the other.
Mr. Diller serves as our Chairman of the Board of Directors and Senior Executive, while retaining his role as Chairman of the Board of Directors and Senior Executive of IAC, and Mr. Kaufman serves as Vice Chairman of both Expedia and IAC. The fact that Mr. Diller and Mr. Kaufman hold positions with and securities of both companies could create, or appear to create, potential conflicts of interest for them when facing decisions that may affect both IAC and Expedia. They may also face conflicts of interest with regard to the allocation of their time between the companies.
Our certificate of incorporation provides that no officer or director of Expedia who is also an officer or director of IAC be liable to Expedia or its stockholders for breach of any fiduciary duty by reason of the fact that any such individual directs a corporate opportunity to IAC instead of Expedia, or does not communicate information regarding a corporate opportunity to Expedia because the officer or director has directed the corporate opportunity to IAC. This corporate opportunity provision may have the effect of exacerbating the risk of conflicts of interest between the companies because the provision effectively shields an overlapping director/executive officer from liability for breach of fiduciary duty in the event that such director or officer chooses to direct a corporate opportunity to IAC instead of Expedia.
We work closely with various business partners and rely on third-parties for many systems and services, and therefore could be harmed by their activities.
We could be harmed by the activities of third parties that we do not control. We work closely with business partners, including in connection with significant commercial arrangements and joint ventures, and through our Expedia Affiliate Network business. We also rely on third-party service providers for certain customer care, fulfillment, processing, systems development, technology and other services, including, increasingly, travel care and information technology services. If these partners or third-party service providers experience difficulty or fail to meet our requirements or standards or the requirements or standards of applicable laws or governmental authorities, it could damage our reputation, make it difficult for us to operate
24
some aspects of our business, or expose us to liability for their actions which could have an adverse impact on our business and financial performance. Likewise, if the third-party service providers on which we rely were to cease operations, temporarily or permanently, face financial distress or other business disruption, we could suffer increased costs and delays in our ability to provide similar services until an equivalent service provider could be found or we could develop replacement technology or operations, any of which could also have an adverse impact on our business and financial performance.
We are exposed to various counterparty risks.
We are exposed to the risk that various counterparties, including financial entities, will fail to perform. This creates risk in a number of areas, including with respect to our bank deposits and investments, foreign exchange risk management, insurance coverages, and letters of credit. As it relates to deposits, as of December 31, 2017, we held cash in bank depository accounts of approximately $2.1 billion
(primarily in Bank of America, Bank of Tokyo-Mitsubishi UFJ, BNP Paribas, HSBC, and JPMorgan Chase) and held term deposits of approximately $852 million at financial institutions including, BNP Paribas, JPMorgan Chase, Mizuho Bank Ltd., National Australia Bank, The Bank of Nova Scotia, Sumitomo Mitsui Bank, and Standard Chartered Bank. Additionally, majority-owned subsidiaries held cash of approximately $163 million (primarily in Deutsche Bank, HSBC and National Australia Bank) and held term deposits of approximately $169 million at financial institutions including CitiBank and Deutsche Bank. As it relates to foreign exchange, as of December 31, 2017, we were party to forward contracts with a notional value of approximately $2.6 billion, the fair value of which was an asset of approximately $6 million. The counterparties to these contracts were Barclays Bank, BNP Paribas, Bank of America, The Bank of Tokyo-Mitsubishi UFJ, Citibank, Credit Suisse International, Goldman Sachs, HSBC, JPMorgan Chase, Mizuho, Royal Bank of Canada, Standard Chartered Bank, The Bank of Nova Scotia, Societe Generale, US Bank and Wells Fargo. We employ forward contracts to hedge a portion of our exposure to foreign currency exchange rate fluctuations. At the end of the deposit term or upon the maturity of the forward contracts, the counterparties are obligated, or potentially obligated in the case of forward contracts, to return our funds or pay us net settlement values. If any of these counterparties were to liquidate, declare bankruptcy or otherwise cease operations, it may not be able to satisfy its obligations under these time deposits or forward contracts.
In addition, due to instability in the economy we also face increased credit risk and payment delays from our non-financial contract counterparties.
We have significant indebtedness, which could adversely affect our business and financial condition.
We have outstanding long-term indebtedness, excluding current maturities, with a face value of $3.7 billion and we have a $1.5 billion unsecured revolving credit facility. Risks relating to our indebtedness include:
|
•
|
Increasing our vulnerability to general adverse economic and industry conditions;
|
|
•
|
Requiring us to dedicate a portion of our cash flow from operations to payments on our indebtedness, thereby reducing the availability of cash flow to fund working capital, capital expenditures, acquisitions and investments and other general corporate purposes;
|
|
•
|
Making it difficult for us to optimally capitalize and manage the cash flow for our businesses;
|
|
•
|
Limiting our flexibility in planning for, or reacting to, changes in our businesses and the markets in which we operate;
|
|
•
|
Placing us at a competitive disadvantage compared to our competitors that have less debt; and
|
|
•
|
Limiting our ability to borrow additional funds or to borrow funds at rates or on other terms we find acceptable.
|
The agreements governing our indebtedness contain various covenants that may limit our ability to effectively operate our businesses, including those that restrict our ability to, among other things:
|
•
|
Borrow money, and guarantee or provide other support for indebtedness of third parties including guarantees;
|
|
•
|
Pay dividends on, redeem or repurchase our capital stock;
|
|
•
|
Enter into certain asset sale transactions, including partial or full spin-off transactions;
|
|
•
|
Enter into secured financing arrangements;
|
|
•
|
Enter into sale and leaseback transactions; and
|
|
•
|
Enter into unrelated businesses.
|
In addition, our credit facility requires that we meet certain financial tests, including an interest coverage test and a leverage ratio test.
25
Any failure to comply with the restrictions of our credit facility or any agreement governing our other indebtedness may result in an event of default under those agreements. Such default may allow the creditors to accelerate the related debt, which acceleration may trigger cross-acceleration or cross-default provisions in other debt. In addition, lenders may be able to terminate any commitments they had made to supply us with further funds (including periodic rollovers of existing borrowings). In addition, it is possible that we may need to incur additional indebtedness in the future in the ordinary course of business. The terms of our credit facility and the indentures governing our outstanding senior notes allow us to incur additional debt subject to certain limitations. If new debt is added to current debt levels, the risks described above could intensify.
We cannot be sure that our intellectual property and proprietary information is protected from copying or use by others, including potential competitors.
Our websites and mobile applications rely on content, brands, domain names and technology, much of which is proprietary. We establish and protect our intellectual property by relying on a combination of trademark, domain name, copyright, trade secret and patent laws in the U.S. and other jurisdictions, license and confidentiality agreements, and internal policies and procedures. In connection with our license agreements with third parties, we seek to control access to, and the use and distribution of, our proprietary information and intellectual property. Even with these precautions, however, it may be possible for another party to copy or otherwise obtain and use our intellectual property without our authorization or to develop similar intellectual property independently. Effective trademark, domain name, copyright, patent and trade secret protection may not be available in every jurisdiction in which our services are made available, and policing unauthorized use of our intellectual property is difficult and expensive. We cannot be sure that the steps we have taken will prevent misappropriation or infringement of intellectual property. Any misappropriation or violation of our rights could have a material adverse effect on our business. Furthermore, we may need to go to court or other tribunals to enforce our intellectual property rights, to protect our trade secrets or to determine the validity and scope of the proprietary rights of others. These proceedings might result in substantial costs and diversion of resources and management attention.
We currently license from third parties some of the technologies, content and brands incorporated into our websites. As we continue to introduce new services that incorporate new technologies, content and brands, we may be required to license additional technology, content or brands. We cannot be sure that such technology, content and brand licenses will be available on commercially reasonable terms, if at all.
Part I. Item 1B.
Unresolved Staff Comments
None.
Part I. Item 2.
Properties
We lease approximately 3.9 million square feet of office space worldwide, pursuant to leases with expiration dates through March 2031.
We lease approximately 565,000 square feet for our headquarters in Bellevue, Washington, pursuant to leases with expiration dates through December 2019. We also lease approximately 1.4 million square feet of office space for our domestic operations in various other cities and locations pursuant to leases with expiration dates through March 2031.
We also lease approximately 2.0 million square feet of office space for our international operations in various cities and locations pursuant to leases with expiration dates through June 2030.
In addition to our leased space, on April 30, 2015, we acquired our future corporate headquarters, consisting of multiple office and lab buildings located in Seattle, Washington. The build out of the headquarters is significant as we convert lab facilities into office space. We expect employees to begin to move into the new campus at the end of 2019.
Part I. Item 3.
Legal Proceedings
In the ordinary course of business, Expedia and its subsidiaries are parties to legal proceedings and claims involving property, personal injury, contract, alleged infringement of third-party intellectual property rights and other claims. The amounts that may be recovered in such matters may be subject to insurance coverage.
Rules of the SEC require the description of material pending legal proceedings, other than ordinary, routine litigation incident to the registrant’s business, and advise that proceedings ordinarily need not be described if they primarily involve damages claims for amounts (exclusive of interest and costs) not individually exceeding 10% of the current assets of the registrant and its subsidiaries on a consolidated basis. In the judgment of management, none of the pending litigation matters that the Company and its subsidiaries are defending, including those described below, involves or is likely to involve amounts
26
of that magnitude. The litigation matters described below involve issues or claims that may be of particular interest to our stockholders, regardless of whether any of these matters may be material to our financial position or results of operations based upon the standard set forth in the SEC’s rules.
Litigation Relating to Occupancy and Other Taxes
A number of jurisdictions in the United States have filed lawsuits against online travel companies, including Expedia companies, such as Hotels.com, Expedia, Hotwire, Orbitz and HomeAway, claiming that such travel companies have failed to collect and/or pay taxes (e.g., occupancy taxes, excise taxes, sales taxes, etc.), as well as related claims such as unjust enrichment, restitution, interest, and penalties. In addition, we may file complaints contesting tax assessments made by states, counties and municipalities seeking to obligate online travel companies, including certain Expedia companies, to collect and remit certain taxes, either retroactively or prospectively, or both. Moreover, certain jurisdictions may require us to pay tax assessments prior to contesting any such assessments. This requirement is commonly referred to as “pay-to-play.” Payment of these amounts is not an admission that we believe we are subject to such taxes and, even when such payments are made, we continue to defend our position vigorously.
Actions Filed by Individual States, Cities and Counties
City of Los Angeles Litigation.
On December 30, 2004, the city of Los Angeles filed a purported class action in California state court against a number of online travel companies, including Hotels.com, Expedia, Hotwire and Orbitz.
City of Los Angeles, California, on Behalf of Itself and All Others Similarly Situated v. Hotels.com, L.P. et al.,
No. BC326693 (Superior Court, Los Angeles County). The complaint alleged that the defendants failed to pay hotel occupancy taxes, and sought certification of a statewide class of all California cities and counties that have enacted uniform transient occupancy-tax ordinances effective on or after December 30, 1990. The complaint alleged violation of those ordinances, violation of Section 17200 of the California Business and Professions Code, and common-law conversion; it also sought a declaratory judgment that the defendants are subject to hotel occupancy taxes on the hotel rate charged to consumers and imposition of a constructive trust, disgorgement, restitution, interest and penalties. In the administrative process preceding the litigation, the City of Los Angeles had issued assessments in September 2009 totaling $29.5 million against certain Expedia companies (Expedia, Hotels.com and Hotwire). On April 18, 2013, the trial court held that the online travel companies are not liable to remit hotel occupancy taxes to the city of Los Angeles. On January 8, 2014, the court entered final judgment in favor of the online travel companies. On March 21, 2014, the city of Los Angeles filed a notice of appeal. The California Court of Appeals stayed this case pending review and decision by the California Supreme Court in the
San Diego
litigation. The stay is now lifted and the appeal is proceeding.
City of San Antonio, Texas Litigation.
On May 8, 2006, the city of San Antonio filed a putative statewide class action in federal court against a number of online travel companies, including Expedia, Hotels.com, Hotwire, and Orbitz. See
City of San Antonio, et al. v. Hotels.com, L.P., et al.,
SA06CA0381 (United States District Court, Western District of Texas, San Antonio Division). The complaint alleged that the defendants failed to pay hotel accommodations taxes as required by municipal ordinance. The complaint asserted claims for violation of that ordinance, common-law conversion, and declaratory judgment, and sought damages in an unspecified amount, restitution and disgorgement. On October 30, 2009, a jury verdict was entered finding that defendant online travel companies "control hotels," and awarding approximately $15 million for historical damages against the Expedia companies. The jury also found that defendants were not liable for conversion or punitive damages. On April 4, 2013, the court entered a final judgment holding the online travel companies liable for hotel occupancy taxes to counties and cities in the statewide class action. The online travel companies filed a motion for judgment as a matter of law or, in the alternative, for a new trial. The cities filed a motion to amend the judgment regarding calculation of penalties. On February 20, 2014, the court denied the online travel companies' motion. On January 22, 2015, the court granted in part and denied in part the cities' motion regarding penalties. On April 11, 2016, the court entered an amended judgment including approximately $68 million in tax, interest and penalty amounts for the Expedia companies, including Orbitz. The online travel companies filed a notice of appeal to the U.S. Fifth Circuit Court of Appeals on May 6, 2016. Plaintiffs filed a notice of cross appeal on May 12, 2016. The Fifth Circuit heard argument on the parties’ cross appeals on September 26, 2017. On November 29, 2017, the Fifth Circuit issued an opinion reversing the district court and rendering judgment for the defendant online travel companies, finding that the amounts charged by the defendants for their services are not subject to the hotel accommodations taxes at issue. The plaintiff municipalities filed petitions for rehearing and
en banc
review, which were denied by the Fifth Circuit Court on February 6, 2018. On July 25, 2016, plaintiffs filed a request for attorneys’ fees and costs in the trial court; the defendant online travel companies opposed that request. On February 16, 2017, the court referred the matter to a magistrate judge for review and recommendation. On April 10, 2017, the defendant online travel companies filed a motion to stay further proceedings on plaintiffs’ fee request pending resolution of their substantive appeal to the United States Fifth Circuit Court of Appeals. On April 17, 2017, the magistrate judge issued a report and recommendation as to attorneys' fees. On April 20, 2017, the district court stayed further
27
proceedings on plaintiff's fee petition pending resolution of the parties' appeal to the Fifth Circuit Court of Appeals. On December 8, 2017, the district court dismissed plaintiff’s fee petition as moot in light of the Fifth Circuit’s decision.
Nassau County, New York Litigation.
On October 24, 2006, the county of Nassau, New York filed a putative statewide class action in federal court against a number of online travel companies, including Expedia, Hotels.com, Hotwire, and Orbitz.
Nassau County, New York, et al. v. Hotels.com, L.P., et al.,
(United States District Court, Eastern District of New York). The complaint alleged that the defendants failed to pay hotel accommodation taxes as required by local ordinances to certain New York cities, counties and local governments in New York. The complaint asserted claims for violations of those ordinances, as well as claims for conversion, unjust enrichment, and imposition of a constructive trust, and sought unspecified damages. The county subsequently dismissed its case on May 13, 2011 on the basis that the court lacked jurisdiction and refiled in state court.
County of Nassau v. Expedia, Inc., et al.,
(In the Supreme Court of the State of New York, County of Nassau). The defendants filed a motion to dismiss the refiled state court case. On June 13, 2012, the court denied the online travel companies' motion to dismiss. On November 27, 2012, plaintiff filed a motion for class certification. On April 11, 2013, the court granted plaintiff s motion for class certification. The online travel company defendants appealed both the court's certification order and its prior order denying their motion to dismiss. On September 10, 2014, the New York Supreme Court Appellate Division reversed the trial court's order granting the plaintiff s motion for class certification. In a separate opinion, the Appellate Division also affirmed in part and reversed in part the trial court's denial of the online travel companies' motion to dismiss. On September 11, 2015, the parties filed cross motions for summary judgment. On September 25, 2015, Erie County, Orange County, Rensselaer County and Saratoga County, New York (the “first group of intervenors”) filed a motion seeking leave to intervene as plaintiffs in the lawsuit; the defendant online travel companies opposed the motion. On February 23, 2016, the court granted the counties' motion to intervene. The defendants filed their notice of appeal from the February 23, 2016 Order on April 26, 2016. On July 20, 2016, the court entered a stipulated order permitting the addition of another group of taxing jurisdictions - the Counties of Chautauqua, Oswego, Steuben, Westchester, and the City of Saratoga Springs (the “second group of intervenors”) - as Intervenor-Plaintiffs in the lawsuit and agreeing that these Intervenor-Plaintiffs will be bound by the disposition of the defendants' appeal from the Supreme Court's February 23, 2016 Order granting intervention. On December 2, 2016, the court granted defendants’ motion for summary judgment and denied plaintiff Nassau County’s motion for summary judgment. The court concluded that the enabling statute for plaintiff’s tax ordinance did not impose a tax on defendants’ fees. The court further invited defendants to file a successive motion for summary judgment against the first group of intervenors on similar grounds. The court also vacated its prior order granting the second group of intervenors permission to intervene. On December 23, 2016, defendants filed a motion for summary judgment against the first group of intervenors. On March 15, 2017, the parties filed a stipulation and proposed order which would permit the second group of intervenors to re-enter the case and be subject to the pending motion for summary judgment against the first group of intervenors. On March 22, 2017, the court granted defendants’ motion for summary judgment against the first and second group of intervenors. Nassau County and the Intervenor-Plaintiffs have appealed the court’s dismissal of their claims. That appeal remains pending.
City and County of San Francisco, California Litigation.
On May 13, 2008, San Francisco instituted an audit of a number of online travel companies, including Expedia, Hotels.com, Hotwire and Orbitz, for hotel occupancy taxes claimed to be due from 2000 through the third quarter of 2007. During an administrative hearing process, the hearing examiner upheld the tax assessments. Thereafter, the online travel companies proceeded to the California superior court to vacate the decision of the hearing examiner and for a declaratory judgment that the online travel companies are not subject to San Francisco's hotel occupancy tax.
Expedia, Inc. v. City and County of San Francisco, ET. al.; Hotels.com, Inc. v. City and County of San Francisco, ET. al.; Hotwire, Inc. v. City and County of San Francisco, ET. al., (Superior Court of the State of California, County of San Francisco).
San Francisco also filed a lawsuit against hotels in the city for the recovery of hotel occupancy taxes on the online travel companies' services. The hotel suit was consolidated with the case relating to the online travel companies. On June 19, 2009, the court granted the city's demurrer on the "pay first" issue relating to pay-to-play provisions. Expedia’s and Hotwire's appeal of the "pay first" decision was denied, as was Hotels.com's appeal. The total assessed amount paid by the Expedia companies was approximately $48 million. On February 6, 2013, the court held that the online travel companies are not liable to remit hotel occupancy taxes to San Francisco. On October 10, 2013, the court entered judgment in favor of the online travel companies. On December 9, 2013, San Francisco filed a notice of appeal. San Francisco also has issued additional tax assessments against the Expedia companies in the amount of $22 million for the time period from the fourth quarter of 2007 through the fourth quarter of 2011. These subsequent tax assessments are pending before the court, and on August 24, 2013, the court held that these subsequent assessments against the online travel companies as well as the lawsuit against the hotels should be stayed pending the appeal of San Francisco's first assessment. On January 21, 2014, the city notified the Expedia companies that despite proceeding in court on its assessments that it now intended to proceed against the Expedia companies in the administrative process to recover the assessment amount of $22 million. On May 14, 2014, the court heard oral argument on the Expedia companies' contest of the prepayment requirement for the additional assessments and held that the Expedia companies were required to prepay in order to litigate the legality of the assessments. On May 26, 2014, the Expedia companies paid $25.5 million under protest in order to contest the additional
28
assessments. In addition, Orbitz in total has paid $4.6 million to the city of San Francisco in prepayment of taxes to contest these assessments issued against it by the city. The California Court of Appeals stayed this case pending review and decision by the California Supreme Court in the
San Diego
litigation. The stay is now lifted and the appeal is proceeding.
Pine Bluff, Arkansas Litigation.
On September 25, 2009, Pine Bluff Advertising and Promotion Commission and Jefferson County filed a class action against a number of online travel companies, including Expedia, Inc., Hotels.com, Hotwire and Orbitz.
Pine Bluff Advertising and Promotion Commission, Jefferson County, Arkansas, and others similarly situated v. Hotels.com LP, et al.
CV-2009- 946-5 (In the Circuit Court of Jefferson, Arkansas). The complaint alleged that defendants have failed to collect and/or pay taxes under hotel tax occupancy ordinances. The court denied defendants' motion to dismiss. Plaintiffs filed a motion for class certification, which the court granted on February 19, 2013. Defendants appealed the class certification decision, and on October 10, 2013 the Arkansas Supreme Court affirmed that decision. On October 10, 2017, plaintiffs filed a motion for partial summary judgment on the issue of liability. Defendants opposed that motion and filed a cross motion for partial summary judgment on November 22, 2017. On January 31, 2018, the court heard argument on the parties’ cross motions. On February 1, 2018, the trial court granted plaintiffs’ motion for summary judgment and denied defendants’ motion for summary judgment on the issue of tax liability.
Town of Breckenridge, Colorado Litigation.
On July 25, 2011, the Town of Breckenridge, Colorado brought suit on behalf of itself and other home rule municipalities against a number of online travel companies, including Expedia, Hotels.com, Hotwire and Orbitz.
Town of Breckenridge, Colorado v. Colorado Travel Company, LLC,
Case No. 2011CV420 (District Court, Summit County, Colorado). The complaint included claims for declaratory judgment, violations of municipal ordinances, conversion, civil conspiracy and unjust enrichment. The online travel companies filed a motion to dismiss. On June 8, 2012, the court granted in part and denied in part the online travel companies' motion to dismiss. On March 26, 2014, the court denied the plaintiffs' motion for class certification. The parties filed cross-motions for summary judgment and, on April 20, 2016, the court granted the online travel companies' motion for summary judgment, and denied the town's motion for summary judgment, holding that the Breckenridge Accommodations Tax does not apply to the online travel companies or the amounts they charge for their services. On June 8, 2016, the Town of Breckenridge filed a notice of appeal from the court's order on the parties' cross motions for summary judgment, as well as the court's prior rulings denying class certification and dismissing claims for state sales tax. On June 8, 2016, the Town of Breckenridge filed a notice of appeal from the trial court’s order on the parties’ cross motions for summary judgment, as well as the trial court’s prior rulings denying class certification and dismissing claims for state sales tax. On September 8, 2016, the Colorado Court of Appeals dismissed the Town of Breckenridge’s appeal without prejudice for lack of a final appealable judgment on the ground that the Town had failed to demonstrate that the trial court had disposed of claims against two non-online travel company defendants. On September 22, 2016, the trial court granted the Town’s motion to dismiss one of the non-online travel company defendants and entered final judgment for all other remaining defendants. On November 7, 2016, the Town again filed notice of appeal. The Colorado Court of Appeals heard argument on the Town’s appeal on January 11, 2018 and on January 25, 2018 affirmed the trial court’s decision on all grounds, finding that the defendant online travel companies are not liable for accommodations taxes, that the Town’s sales tax claims were properly dismissed for lack of subject matter jurisdiction and that class certification was properly denied.
State of Mississippi Litigation.
On December 29, 2011, the State of Mississippi brought suit against a number of online travel companies, including Expedia, Hotels.com, Hotwire and Orbitz.
State of Mississippi v. Priceline.com, et al.,
Case No. G-2011-002211 (Chancery Court, Hinds County, Mississippi). The complaint included claims for declaratory judgment, injunctive relief, violations of state sales tax statute and local ordinances, violation of Consumer Protection Act, conversion, unjust enrichment, constructive trust, money had and received and joint venture liability. On March 23, 2012, the defendant online travel companies filed a motion to dismiss. On September 20, 2012, the court denied the defendants' motion to dismiss.
Village of Bedford Park, Illinois Litigation.
On April 5, 2013, a group of Illinois municipalities (City of Warrenville, Village of Bedford Park, City of Oakbrook Terrace, Village of Oak Lawn, Village of Orland Hills, City of Rockford and Village of Willowbrook) filed a putative class action in Illinois federal court against a number of online travel companies, including Expedia, Hotels.com, Hotwire and Orbitz.
City of Warrenville, et al. v. Priceline.com, Incorporated, et al.,
Case No. 1:13-cv-02586 (USDC, D. Ill., Eastern Division). The complaint sought certification of a class of all Illinois municipalities (broken into four alleged subclasses) that have enacted and collect a tax on the percentage of the retail rate that each consumer occupant pays for lodging, including service costs, denominated in any manner, including but not limited to occupancy tax, a hotel or motel room tax, a use tax, a privilege tax, a hotel or motel tax, a licensing tax, an accommodations tax, a rental receipts tax, a hotel operator's tax, a hotel operator's occupation tax, or a room rental, lease or letting tax. The complaint alleged claims for relief for declaratory judgment, violations of municipal ordinances, conversion, civil conspiracy, unjust enrichment, imposition of a constructive trust, damages and punitive damages. On July 8, 2013, the plaintiff municipalities voluntarily dismissed their federal court lawsuit and filed a similar putative class action lawsuit in
29
Illinois state court.
City of Bedford Park, et al. v. Expedia, Inc., et al.
(Circuit Court of Cook County, Illinois, Chancery Division). The online travel companies removed the case to federal district court. On September 13, 2013, the online travel companies filed a motion to dismiss plaintiffs' common law claims. On March 13, 2014, the court granted the defendant online travel companies' motion and dismissed the plaintiffs' common law claims. On October 3, 2014, plaintiffs filed a motion for class certification, which the court denied without prejudice on January 6, 2015. Plaintiffs filed a renewed motion for class certification, which the court denied on September 28, 2015. The case proceeded only on the claims brought by the individual plaintiff municipalities named in the suit. On February 1, 2016, the plaintiffs filed a motion for summary judgment. On February 29, 2016, the defendant online travel companies filed a cross motion for summary judgment. The Expedia and Orbitz defendants reached a settlement with one of the plaintiff municipalities -the city of Oakbrook Terrace, Illinois and on March 4, 2016, those parties filed a stipulation for voluntary dismissal of the city's claims. On June 20, 2016, the court granted the defendant online travel companies' motion for summary judgment as to 12 of the 13 plaintiff municipalities, finding no liability for occupancy taxes in those jurisdictions. The court granted the plaintiffs' motion for summary judgment, and denied the defendants' motion, as to the Village of Lombard. On October 19, 2016, the trial court entered a stipulated judgment on plaintiff Village of Lombard’s claims. The parties filed cross notices of appeal from the trial court’s summary judgment ruling in November 2016. The U.S. Seventh Circuit Court of Appeals heard argument on the cross appeals on October 23, 2017. On November 22, 2017, the Seventh Circuit denied the plaintiffs’ appeal, affirming the district court’s decision finding no liability for occupancy taxes in 12 of the 13 plaintiff municipalities, and granted the defendants’ appeal, reversing the district court’s finding of liability for occupancy taxes in the Village of Lombard.
State of New Hampshire Litigation.
On October 16, 2013, the State of New Hampshire filed a lawsuit against a number of online travel companies, including Expedia, Hotels.com, Hotwire, Orbitz and Egencia.
State of New Hampshire v. Priceline.com, et al.,
Case No. 217-2013-CV-00613 (Merrimack Superior Court, New Hampshire). The complaint alleged claims for declaratory judgment, injunctive relief, violation of state meals and room tax law, violation of Consumer Protection Act, breach of fiduciary duty, accounting, conversion, unjust enrichment, assumpsit for money had and received, civil conspiracy, and constructive trust. On December 23, 2013, the defendant online travel companies filed a motion to dismiss, which the court granted in part and denied in part on June 30, 2014. On February 19, 2015, the plaintiff filed a motion to amend its complaint. On May 5, 2015, the court issued an order denying the motion to amend except as to "housekeeping changes." On May 27, 2015, plaintiff filed its amended complaint, which the Expedia defendants answered on June 26, 2015. On December 21, 2015, the parties filed cross motions for summary judgment. The court heard oral argument on the parties' motions on May 5, 2016. At the request of the Court, the Parties subsequently embarked on a process designed to explore the possibility of agreement upon a Statement of Facts and, if there can be an agreement, to prepare an Agreed Statement of Facts for submission to the Court on or before August 1, 2016. The court indicated that if the parties were unable to agree, it would deny all pending motions and set the case for trial. The parties were unable to agree on an Agreed Statement of Facts for submission to the Court by August 1, 2016. On August 1, 2016, the defendants filed a motion for leave of court to submit a renewed motion for summary judgment as to the plaintiffs’ consumer protection act claims. On October 3, 2016, the court denied the motion. The case went to trial from May 1 to May 12, 2017. On October 18, 2017, the trial court issued its post-trial order finding that the defendant online travel companies are not subject to the New Hampshire meals and room tax and that their business practices do not violate the state consumer protection act. On November 17, 2017, the plaintiff filed a notice of appeal to the New Hampshire Supreme Court. That appeal remains pending.
Arizona Cities Litigation.
Tax assessments were issued in 2013 by 12 Arizona cities (Apache Junction, Chandler, Flagstaff, Glendale, Mesa, Nogales, Peoria, Phoenix, Prescott, Scottsdale, Tempe and Tucson) against a group of online travel companies including Expedia, Hotels.com, Hotwire and Orbitz. The OTCs petitioned for redetermination of the assessments. On May 28, 2014, the Municipal Tax Hearing Officer granted the online travel companies' protests to the assessments and ordered the cities to abate the assessments. On August 26, 2014, the cities appealed the Hearing Officer's decision by filing complaints and notices of appeal against the online travel companies in Arizona Tax Court.
(See, City of Phoenix, et al. v. Expedia, Inc.,
Case No. TX2014-00471). On August 31, 2015, the cities filed a motion for summary judgment. On September 30, 2015, the online travel companies filed a response to the cities' motion and their own cross motion for summary judgment. On April 20, 2016, the Arizona Tax Court granted the plaintiff cities' motion for summary judgment in part and denied it in part; the court also denied the defendant online travel companies' motion for summary judgment. On June 6, 2016, the Arizona Tax Court entered judgment. On June 21, 2016, the plaintiff cities filed a motion to amend or alter that judgment on the grounds that the court's ruling that the online travel companies do not owe past taxes based upon prior administrative guidance should be reversed. The defendant online travel companies opposed the motion. On October 17, 2016, the court denied the motion. The plaintiffs and the defendants each filed a notice of appeal. Argument on the appeals is scheduled for February 15, 2018.
Village of Matteson, Illinois Litigation.
On December 3, 2015, the Villages of Matteson, Bloomington and Oakbrook, Illinois filed a lawsuit in Illinois state court against a number of online travel companies, including Expedia, Hotels.com,
30
Hotwire, Egencia and Orbitz.
Village of Matteson, et al. v.
Expedia, Inc. (WA), et al.,
Case No. 2015CHI7598 (Cook County Chancery Court, State of Illinois). The complaint alleged claims for declaratory judgment, violation of municipal tax ordinances, fraud, conversion, civil conspiracy, unjust enrichment, imposition of a constructive trust, breach of fiduciary duty requiring an accounting, damages and punitive damages. On April 4, 2016, the defendant online travel companies filed a motion to dismiss plaintiffs' common law claims. On July 29, 2016, the court granted the motion and dismissed plaintiffs’ common law claims.
State of Louisiana/City of New Orleans Litigation
. On August 24, 2016, the State of Louisiana Department of Revenue and the City of New Orleans filed a lawsuit in Louisiana state court against a number of online travel companies, including Expedia, Hotels.com, Hotwire, Orbitz and Egencia.
See Kimberly L. Robinson, Secretary of the Department of Revenue for the State of Louisiana and City of New Orleans Department of Finance v. Priceline.com, Inc. et al.
, Case No. 650894 (19
th
Judicial District Court, Parish of East Baton Rouge, Louisiana). The complaint alleged claims for declaratory judgment, violation of state and city tax laws, unfair trade practices, breach of fiduciary duty, and imposition of a constructive trust. On November 30, 2016, the defendant online travel companies filed a motion for judgment on the pleadings seeking dismissal of plaintiffs’ common law and unfair trade practices claims. On March 6, 2017, the court denied the motion. On April 5, 2017, Defendants filed an application for supervisory writ to the Louisiana Court of Appeals seeking to reverse the trial court’s denial of the motion. On July 24, 2017, the Louisiana Court of Appeals denied the application. On August 10, 2017, defendants filed an application for supervisory writ to the Louisiana Supreme Court seeking to reverse the trial court’s denial of the motion. On November 6, 2017, the court denied the writ application.
In addition, HomeAway is a party in the following proceedings:
Palm Beach, Florida Litigation.
On January 13, 2014, Palm Beach County, Florida filed a lawsuit in Florida state court against HomeAway and other vacation rental listing businesses seeking tourist development taxes imposed by Palm Beach County.
Palm Beach County v. AirBnb, Inc., et al.,
Case No. 502014CA000428XXXXMBAO (15th Judicial Circuit Court, Palm Beach County, Florida). On July 1, 2014, plaintiff filed an amended complaint. On September 16, 2014, the defendants filed a motion to dismiss the complaint. On December 12, 2014, the court denied the motion. On December 22, 2015, plaintiff filed its second amended complaint. On July 20, 2015, the defendants filed a motion for judgment on the pleadings. On November 5, 2015, the court denied defendants' motion. The court has set the matter on the trial calendar that begins on May 28, 2018.
Portland, Oregon Litigation.
On October 21, 2015, the City of Portland, Oregon filed a lawsuit in federal district court against HomeAway.
City of Portland, Oregon v. Homeaway.com, Inc., et al.,
Case No. 3:15-cv-01984-MO (D. Or.). The complaint alleges claims for declaratory judgment, injunctive relief, taxes and fines for alleged violations of the Portland Transient Lodgings Tax ordinance, including alleged failures to register, collect and remit tax and display certain information in advertisements and websites. On November 13, 2015, HomeAway filed a motion to dismiss the complaint. The court heard oral argument on the motion on May 17, 2016. The court granted the defendants' motion to dismiss plaintiffs' claims, some with prejudice and some without. On July 11, 2016, the City of Portland filed an amended complaint. HomeAway responded by filing a motion to dismiss the amended complaint on August 5, 2016. The City of Portland opposed the motion. The court heard argument on the motion on December 16, 2016 and, on March 10, 2017, granted the motion in part and denied the motion in part. The City of Portland amended its ordinance on short-term rentals, which took effect on January 20, 2017. On January 19, 2017, HomeAway filed two lawsuits challenging the amended ordinance. The first was filed in federal district court and sought a declaration that certain of the amendments violated the Communications Decency Act of 1996, the First, Fourth, Fifth, and Fourteenth Amendments of the U.S. Constitution, the dormant commerce clause, and the Stored Communications Act.
HomeAway.com, Inc. v. City of Portland
, Case No. 3:17-cv-00091 (U.S. District Court, District of Oregon). HomeAway also sought to enjoin enforcement of the amended ordinance. In response to the lawsuit, the city agreed to stay enforcement of the ordinance against HomeAway pending the court’s decision on HomeAway’s preliminary injunction motion. The hearing on that motion took place on March 20, 2017. The court issued a ruling from the bench granting the motion in part, denying it in part based on the city’s representation as to how it would enforce a portion of its ordinance, and ordering supplemental briefing on an additional issue involving the scope of an audit provision. On May 11, 2017, the court ruled that the audit provision could not be used to obtain information protected by the Stored Communications Act. The court has set the case for trial on April 24, 2018. The second lawsuit was filed in state court and sought an injunction and declaration that the amended ordinance improperly seeks to impose transient lodging taxes on HomeAway even though the imposition of such taxes is not authorized by the City Charter or the state transient lodging statute applicable to localities.
HomeAway.com, Inc. v. City of Portland
, MCCC No. 17cv01894 (Multnomah County Circuit Court). The state court has set the case for trial on April 16, 2018.
Clackamas County, Oregon Litigation
. On September 7, 2017, Clackamas County, Oregon filed a lawsuit in state circuit court against HomeAway, Expedia, Inc. and other vacation rental listing companies.
Clackamas County v. Homeaway.com
, Inc., et al., Case No. 17-CV-38408 (Clackamas County Circuit Court). The complaint alleges the defendants failed to register
31
with, and remit taxes to, the county as persons “engaging…in business as an…intermediary of transient lodging” as allegedly required by a new ordinance that became effective June 15, 2017. The complaint purports to seek enforcement of the ordinance and injunctive relief. On October 12, 2017, the defendants removed the case to the U.S. District Court for the District of Oregon. On November 16, 2017, HomeAway, Expedia and Airbnb filed a motion to dismiss the complaint. On December 7, 2017, the County filed a motion to strike defendants’ challenge to the legality of the amended tax ordinance. These motions were assigned to a magistrate judge, who heard argument on the motions on January 3, 2018. The parties await issuance of the magistrate’s report and recommendation to the district court judge.
Notices of Audit or Tax Assessments
At various times, the Company has also received notices of audit, or tax assessments from over 15 states or counties and over 80 municipalities concerning its possible obligations with respect to state and local occupancy or other taxes.
Actions Filed by Expedia
Hawaii Tax Court Litigation (General Excise Tax)
. During 2013, the Expedia companies were required to “pay-to-play” and paid a total of $171 million in advance of litigation relating to general excise taxes for merchant model hotel reservations in the State of Hawaii. In September 2015, following a ruling by the Hawaii Supreme Court, the State of Hawaii refunded the Expedia companies $132 million of the original “pay-to-play” amount. Orbitz also received a similar refund of $22 million from the State of Hawaii in September 2015. The amount paid, net of refunds, by the Expedia companies and Orbitz to the State of Hawaii in satisfaction of past general excise taxes on their services for merchant model hotel reservations was $44 million. The parties reached a settlement relating to Orbitz merchant model hotel tax liabilities, and on October 5, 2016, the Expedia companies paid the State of Hawaii for the tax years 2012 through 2015. The Expedia companies and Orbitz have now resolved all assessments by the State of Hawaii for merchant model hotel taxes through 2015.
The Department of Taxation also issued final assessments for general excise taxes against the Expedia companies, including Orbitz, dated December 23, 2015 for the time period 2000 to 2014 for hotel and car rental revenue for “agency model” transactions. Those assessments are currently under review in the Hawaii tax courts. The Hawaii tax court has scheduled trial on the agency hotel and car rental matters for February 4, 2019. On December 29, 2017, the defendant online travel companies filed a motion for partial summary judgment. The Department of Taxation has asked the tax court to stay further proceedings in the agency hotel and car rental case pending a decision by the Hawaii Supreme Court in the merchant model car rental case addressed below. The defendants have opposed the request. On February 5, 2018, the tax court granted the motion to stay.
Final assessments by the Hawaii Department of Taxation for general exercise taxes against the Expedia companies, including Orbitz, relating to merchant car rental transactions during the years 2000 to 2014 are also under review in the Hawaii tax courts. With respect to merchant model car rental transactions at issue for the tax years 2000 through 2013, the Hawaii tax court held on August 5, 2016 that general excise tax is due on the online travel companies’ services to facilitate car rentals. The court further ruled that for merchant model car rentals in Hawaii, the online travel companies are required to pay general excise tax on the total amount paid by consumers, with no credit for tax amounts already remitted by car rental companies to the State of Hawaii for tax years 2000 through 2013, thus resulting in a double tax on the amount paid by consumers to car rental companies for the rental of the vehicle. The court, however, ruled that when car rentals are paid for as part of a vacation package, tax is only due once on the amount paid by consumers to the car rental company for the rental of the vehicle. In addition, the court ruled that the online travel companies are required to pay interest and certain penalties on the amounts due. On April 25, 2017, the court entered a stipulated order and final judgment. On May 15, 2017, the Expedia companies paid under protest the full amount claimed due, or approximately $16.7 million, as a condition of appeal. The parties filed notices of cross-appeal from the order. The appeals have been transferred to the Hawaii Supreme Court and oral argument on the merchant car appeals is scheduled for April 5, 2018. The Hawaii tax court’s decision did not resolve “merchant model” car rental transactions for the tax year 2014, which also remain under review.
Non-Tax Litigation and Other Legal Proceedings
Putative Class Action Litigation
Buckeye Tree Lodge Lawsuit.
On August 17, 2016, a putative class action suit was filed in federal district court in the Northern District of California against Expedia, Hotels.com, Orbitz, Expedia Australia Investments Pty Ltd. and Trivago relating to alleged false advertising.
Buckeye Tree Lodge and Sequoia Village Inn, LLC v. Expedia, Inc., et al
, Case No. 3:16-cv-04721-SK (U.S. District Court, Norther District of California). Plaintiff has not effected service of process as to trivago. The putative class is comprised of hotels and other providers of overnight accommodations whose names appeared on the Expedia defendants’ websites with whom the Expedia defendants did not have a booking agreement during the relevant time period. The complaint asserts claims against the Expedia defendants for violations of the Lanham Act, the California Business & Professions Code, intentional and negligent interference with prospective economic advantage, unjust enrichment and
32
restitution. On January 12, 2017, the court granted the Expedia defendants’ motion to dismiss plaintiff’s claims for intentional and negligent interference with prospective economic advantage without prejudice. On March 7, 2017, a related putative class action was filed in the same court,
2020 O Street Corporation, Inc. v. Expedia, Inc.
, et al, Case No. 3:17-cv-01186-JSC, asserting similar Lanham Act claims, and claims for Unfair Competition, and Unjust Enrichment and Restitution. The court determined that the cases were related and assigned them to the same judge. Expedia accepted service of the Complaint on March 13, 2017. On May 5, 2017, Plaintiffs filed a Consolidated Class Action Complaint.
Israeli Putative Class Action Lawsuit (Silis)
. In or around September 2016, a putative class action lawsuit was filed in the District Court in Tel Aviv, Israel against Hotels.com.
Silis v. Hotels.com
, (Case No. 23241-09-16CA). The plaintiff generally alleges that Hotels.com violated Israeli consumer protection laws in various ways by failing to calculate and display VAT charges in pricing displays shown to Israeli consumers. On March 15, 2017, Hotels.com filed an application with the District Court challenging service. On June 22, 2017, the court registrar rejected Hotels.com’s application. Hotels.com appealed this decision. On November 7, 2017, the court denied the appeal. Hotels.com has sought leave to appeal to the Supreme Court of Israel. The Supreme Court has ordered the parties to send the pleadings to the General Attorney of the Israeli Government and has asked the General Attorney to provide a written opinion with respect to the subjects addressed in Hotels.com’s appeal.
Israeli Putative Class Action Lawsuit (Ze’ev)
. In or around January 2018, a putative class action lawsuit was filed in the District Court in Lod, Israel against a number of online travel companies including Expedia, Inc. and Hotels.com.
Ze’ev v. Expedia, Inc., et al
(Case No.
CA 6771-01-18
). The plaintiff generally alleges that the defendants violated Israeli consumer laws by limiting hotel price competition. The Expedia defendants have not yet been served.
Cases against HomeAway.com, Inc.
On March 15, 2016, a putative class action suit was filed in federal district court in Texas against HomeAway.com, Inc. related to its recent implementation of a service fee.
Arnold v. HomeAway.com, Inc.,
Case No. l-16-cv-00374 (U.S. District Court, Western District of Texas). The putative class is comprised of homeowners that list their properties on HomeAway’s websites for rent. The complaint asserts claims against HomeAway for breach of contract, breach of the duty of good faith and fair dealing, fraud, fraudulent concealment, and violations of the Texas Deceptive Trade Practices Act, the California Consumer Legal Remedies Act, and the California Unfair Competition Law. On April 15, 2016, another putative class action suit was filed against HomeAway, also related to the implementation of a service fee.
Seim v. HomeAway, Inc.,
Case No. 1:16- cv-00479 (U.S. District Court, Western District of Texas). The putative class is comprised of homeowners that list their properties on HomeAway’s websites. The complaint asserts claims against HomeAway for breach of contract, breach of the duty of good faith and fair dealing, fraud, fraudulent concealment, unjust enrichment, and violations of the Texas Deceptive Trade Practices Act, the Kentucky Consumer Protection Act, and other state consumer protection statutes. HomeAway moved to compel arbitration and dismissal in both of these cases on July 11, 2016; a hearing on both motions to compel took place on August 24, 2016. On January 10, 2017, the court denied HomeAway’s motion in
Arnold
. On January 31, 2017, HomeAway filed a notice of appeal. On March 10, 2017, HomeAway filed a motion to dismiss the complaint in
Arnold
. On August 1, 2017, the Magistrate Judge issued his report and recommendation to the court, recommending the court grant HomeAway's motion to dismiss the complaint in part, and deny the motion in part. On September 25, 2017, the court adopted the magistrate’s report in
Arnold
. On October 13, 2017, plaintiffs filed their third amended complaint. On November 10, 2017, HomeAway filed a motion to dismiss the third amended complaint and/or to strike the class allegations. On January 10, 2018, the district court referred the motion to the Magistrate Judge. On January 18, 2017, the court granted HomeAway’s motion in
Seim
and entered final judgment dismissing the case. On February 2, 2017, Seim filed a notice of appeal. On December 7, 2017, the United States Fifth Circuit Court of Appeals heard argument in the
Arnold
and
Seim
matters on the parties’ appeals from the trial court’s decisions on HomeAway’s motions to compel arbitration. The parties await a ruling.
On June 23, 2016, another putative class action was filed against HomeAway.com, Inc., also related to the implementation of a service fee.
Brickman v. HomeAway, Inc.,
Case No. 1:16-cv-00733 (U.S. District Court, Western District of Texas). This putative class is comprised of homeowners from nine different states that list their properties on HomeAway's websites. The complaint asserts claims against HomeAway for breach of contract, breach of the duty of good faith and fair dealing, fraud, fraudulent concealment, unjust enrichment, restitution, and violations of various state consumer protection statutes. On October 26, Plaintiffs filed an amended complaint, dismissing certain named Plaintiffs and adding two new Plaintiffs. On December 6, 2016, HomeAway filed a motion to dismiss the amended complaint, which plaintiffs opposed. On August 1, 2017, the Magistrate Judge issued his report and recommendation to the court, recommending the court grant HomeAway's motion to dismiss the complaint in part, and deny the motion in part. On August 25, 2017, the district court adopted the Magistrate Judge’s report and recommendation and ordered plaintiffs to file an amended complaint by September 8, 2017. On September 7, 2017, plaintiffs filed their third amended complaint.
On November 10, 2017, HomeAway filed a motion to dismiss the third amended complaint and/or to strike the class allegations. On January 10, 2018, the district court referred the motion to the Magistrate Judge. On November 7, 2016, another putative class action was filed against HomeAway.com, Inc., also related to the implementation of a service fee.
May v. Expedia, Inc., et al
., Case No. 1:16-cv-01211 (U.S. District Court, Western District of Texas). The complaint asserts claims against HomeAway for breach of contract, fraud, fraudulent concealment, and violation of the Oregon Unlawful Trade Practices Act. It also names Expedia as a defendant. HomeAway and
33
Expedia moved to compel arbitration and dismissal in this case on May 1, 2017. On July 6, 2017, the court held a hearing on the motion. On July 10, 2017, the court entered an order directing the parties to advise it when the Fifth Circuit Court of Appeals issues decisions in the
Arnold
and
Seim
appeals.
Other Legal Proceedings
Santa Monica, California Litigation.
On September 2, 2016, HomeAway filed a lawsuit against the City of Santa Monica requesting a declaration that certain sections of a Santa Monica ordinance violate the Communications Decency Act of 1996, the Storage Communications Act, and the First, Fourth, and Fourteenth Amendments of the U.S. Constitution.
HomeAway.com, Inc. v. City of Santa Monica
, Case Nos. 2:16-cv-6645-ODW-AFM; 2:16-cv-06641-ODW-AFM (U.S. District Court, Central District of California). On the same day, HomeAway filed a motion for preliminary injunction, seeking to enjoin enforcement of the ordinance. In response, the city requested a stay of proceedings to prepare and consider amendments to the Ordinance to address the legal challenges raised by Plaintiffs’ actions. The court granted the city's motion to stay the case until the effective date of any new Santa Monica ordinance. The city passed an amended ordinance that took effect February 23, 2017, although enforcement of that ordinance has been stayed by agreement of the parties. HomeAway filed an amended complaint and preliminary injunction motion on December 13, 2017. The motion is scheduled for hearing on February 26, 2018.
Chicago, Illinois Litigation
. On May 22, 2017, HomeAway filed a lawsuit against the City of Chicago requesting a declaration that certain sections of the city’s ordinance violate the Communications Decency Act of 1996, the Storage Communications Act, and the First, Fourth, and Fourteenth Amendments of the U.S. Constitution.
HomeAway.com, Inc. v. City of Chicago
, Case No. 1:17-cv-03784 (U.S. District Court, Northern District of Illinois). Enforcement of the ordinance has been stayed by agreement of the parties.
Ryanair Lawsuit (Ireland).
On or around February 15, 2017, Ryanair D.A.C. filed a lawsuit against Expedia, Inc. in the Irish High Court. The case involves claims over alleged bookings of Ryanair flight reservations with data that has been scraped from Ryanair’s website.
Ryanair D.A.C. v. Expedia, Inc.
, (Case No. 2017/11 IA).
Ryanair Lawsuit (United States).
On November 29, 2017, Ryanair D.A.C. filed a lawsuit against Expedia, Inc. in federal court in Washington alleging violation of the Computer Fraud and Abuse Act.
Ryanair DAC v. Expedia, Inc.
, Case No. 2:17-cv-01789 (U.S. District Court, Western District of Washington). The case involves claims relating to alleged bookings of Ryanair flight reservations with data that has been scraped from Ryanair’s website. On February 5, 2018, Expedia filed a motion to dismiss.
IBM Lawsuit.
On December 29, 2017, IBM filed a complaint against Expedia, Inc. (DE), Expedia, Inc. (WA), Travelscape, Hotels.com, Hotwire, Orbitz, and HomeAway in federal court in Delaware.
International Business Machines Corporation v. Expedia, Inc. et al.,
Case No. 1:17-cv-01875-LPS-CJB (U.S. District Court, District of Delaware). The Complaint alleges that the defendants infringe four patents held by IBM.
Derivative Litigation
In Re Orbitz Worldwide, Inc. Consolidated Stockholder Litigation, Case No. 10711-VCP (Court of Chancery of the State of Delaware).
On April 8, 2015, an amended class action complaint was brought against Expedia, Inc. and Orbitz Worldwide, Inc. relating to the merger agreement signed by the parties. Plaintiffs assert claims for breach of fiduciary duty by the Orbitz Board of Directors and claims against Expedia for aiding and abetting in the Orbitz directors’ breach of their duties. Plaintiffs specifically claim that the Orbitz Board breached their fiduciary duties by agreeing to an inadequate price for the transaction and unreasonable deal protection devices. On May 20, 2015, Orbitz, its Board of Directors, and the plaintiffs entered into an agreement in principle to settle the lawsuit. On August 29, 2016, plaintiffs filed a notice of dismissal and reserved their rights to seek an award of attorneys’ fees.
Competition and Consumer Matters
Over the last several years, the online travel industry has become the subject of investigations by various national competition authorities ("NCAs"), particularly in Europe. Expedia is or has been involved in investigations predominately related to whether certain parity clauses in contracts between Expedia entities and accommodation providers, sometimes also referred to as "most favored nation" or "MFN" provisions, are anti-competitive.
In Europe, investigations or inquiries into contractual parity provisions between hotels and online travel companies, including Expedia, were initiated in 2012, 2013 and 2014 by NCAs in Austria, Belgium, Czech Republic, Denmark, France, Germany, Greece, Hungary, Ireland, Italy, Poland, Sweden and Switzerland. While the ultimate outcome of some of these investigations or inquiries remains uncertain, and Expedia’s circumstances are distinguishable from other online travel companies subject to similar investigations and inquiries, we note in this context that on April 21, 2015, the French, Italian and Swedish NCAs, working in close cooperation with the European Commission, announced that they had accepted formal commitments offered by Booking.com to resolve and close the investigations against Booking.com in France, Italy and Sweden
34
by Booking.com removing and/or modifying certain rate, conditions and availability parity provisions in its contracts with accommodation providers in France, Italy and Sweden as of July 1, 2015, among other commitments. Booking.com voluntarily extended the geographic scope of these commitments to accommodation providers throughout Europe as of the same date.
With effect from August 1, 2015, Expedia waived certain rate, conditions and availability parity clauses in its agreements with its European hotel partners for a period of five years. While Expedia maintains that its parity clauses have always been lawful and in compliance with competition law, these waivers were nevertheless implemented as a positive step towards facilitating the closure of the open investigations into such clauses on a harmonized pan-European basis. Following the implementation of Expedia's waivers, nearly all NCAs in Europe have announced either the closure of their investigation or inquiries involving Expedia or a decision not to open an investigation or inquiry involving Expedia. Below are descriptions of additional rate parity-related matters of note in Europe.
The German Federal Cartel Office ("FCO") has required another online travel company, Hotel Reservation Service ("HRS"), to remove certain clauses from its contracts with hotels. HRS’ appeal of this decision was rejected by the Higher Regional Court Düsseldorf on January 9, 2015. On December 23, 2015, the FCO announced that it had also required Booking.com by way of an infringement decision to remove certain clauses from its contracts with German hotels. Booking.com has appealed the decision and the appeal was heard by the Higher Regional Court Düsseldorf on February 8, 2017. Those proceedings remain ongoing.
The Italian competition authority's case closure decision against Booking.com and Expedia has subsequently been appealed by two Italian hotel trade associations, i.e. Federalberghi and AICA. These appeals remain at an early stage and no hearing date has been fixed.
On November 6, 2015, the Swiss competition authority announced that it had issued a final decision finding certain parity terms existing in previous versions of agreements between Swiss hotels and each of Expedia, Booking.com and HRS to be prohibited under Swiss law. The decision explicitly notes that Expedia's current contract terms with Swiss hotels are not subject to this prohibition. The Swiss competition authority imposed no fines or other sanctions against Expedia and did not find an abuse of a dominant market position by Expedia. The FCO’s case against Expedia’s contractual parity provisions with accommodation providers in Germany remains open but is still at a preliminary stage with no formal allegations of wrong-doing having been communicated to Expedia to date.
The Directorate General for Competition, Consumer Affairs and Repression of Fraud (the “DGCCRF”), a directorate of the French Ministry of Economy and Finance with authority over unfair trading practices, brought a lawsuit in France against Expedia entities objecting to certain parity clauses in contracts between Expedia entities and French hotels. In May 2015, the French court ruled that certain of the parity provisions in certain contracts that were the subject of the lawsuit were not in compliance with French commercial law, but imposed no fine and no injunction. The DGCCRF appealed the decision and, on June 21, 2017, the Paris Court of Appeal published a judgment overturning the decision. The court annulled parity clauses contained in the agreements at issue, ordered Expedia to amend its contracts, and imposed a fine. Expedia has appealed the decision. The appeal will not stay payment of the fine.
Hotelverband Deutschland (“IHA”) e.V. (a German hotel association) brought proceedings before the Cologne regional court against Expedia, Inc., Expedia.com GmbH and Expedia Lodging Partner Services Sàrl. IHA applied for a ‘cease and desist’ order against these companies in relation to the enforcement of certain rate and availability parity clauses contained in contracts with hotels in Germany. On or around February 16, 2017, the court dismissed IHA’s action and declared the claimant liable for the Expedia defendants’ statutory costs. IHA appealed the decision and, on December 4, 2017, the Court of Appeals rejected IHA’s appeal. The Court of Appeals expressly confirmed that Expedia’s MFNs are in compliance both with European and German competition law. While IHA had indicated an intention to appeal the decision to the Federal Supreme Court, it has not lodged an appeal within the applicable deadline, with the consequence that the Court of Appeals judgment has now become final.
A working group of 10 European NCAs (Belgium, Czech Republic, Denmark, France, Hungary, Ireland, Italy, Netherlands, Sweden and the United Kingdom) and the European Commission has been established by the European Competition Network (“ECN”) at the end of 2015 to monitor the functioning of the online hotel booking sector, following amendments made by a number of online travel companies (including Booking.com and Expedia) in relation to certain parity provisions in their contracts with hotels. The working group issued questionnaires to online travel agencies including Expedia, metasearch sites and hotels in 2016. The underlying results of the ECN monitoring exercise were published on April 6, 2017.
Legislative bodies in France (July 2015), Austria (December 2016) and Italy (August 2017) have also adopted new domestic anti-parity clause legislation. Expedia believes each of these pieces of legislation violates both EU and national legal principles and therefore, Expedia has challenged these laws at the European Commission.
A motion requesting the Swiss government to take action on narrow price parity has been adopted in the Swiss parliament. Moreover, in Belgium, the government is also reviewing narrow parity provisions. The Company is unable to
35
predict whether these proposals in their current form or in another form will ultimately be adopted and, if so, when this might be the case. It is not yet clear how any adopted domestic anti-parity clause legislations and/or any possible future legislation in this area may affect Expedia’s business.
Outside of Europe, a number of NCAs have also opened investigations or inquired about contractual parity provisions in contracts between hotels and online travel companies in their respective territories, including Expedia. A Brazilian hotel sector association -- Forum de Operadores Hoteleiros do Brasil -- filed a complaint with the Brazilian Administrative Council for Economic Defence (“CADE”) against a number of online travel companies, including Booking.com, Decolar.com and Expedia, on July 27, 2016 with respect to parity provisions in contracts between hotels and online travel companies. On September 13, 2016, Expedia submitted its response to the complaint to CADE. In late 2016, Expedia resolved the concerns of the Australia and New Zealand NCAs based on implementation of the waivers substantially similar to those provided to accommodation providers in Europe (on September 1, 2016 in Australia and on October 28, 2016 in New Zealand). More recently, however, the Australian NCA indicated that it has reopened its investigation. Expedia is in ongoing discussions with a limited number of NCAs in other countries in relation to its contracts with hotels. Expedia is currently unable to predict the impact the implementation of the waivers both in Europe and elsewhere will have on Expedia's business, on investigations or inquiries by NCAs in other countries, or on industry practice more generally.
In addition, regulatory authorities in Europe, Australia, and elsewhere have recently initiated market studies, inquiries and investigations into online marketplaces and how information is presented to consumers using those marketplaces, investigating practices such as search results rankings and algorithms, discount claims, disclosure of charges, and availability and similar messaging. We are unable to predict the implications of these market studies, inquiries and investigations on Expedia’s business.
Not applicable.
Market Information
Our common stock is quoted on the Nasdaq Global Select Market under the ticker symbol “EXPE.” Our Class B common stock is not listed and there is no established public trading market. As of
January 26, 2018
, there were approximately 2,110 holders of record of our common stock and the closing price of our common stock was $131.76 on Nasdaq. As of
January 26, 2018
, all of our Class B common stock was held by a subsidiary of Liberty Expedia Holdings.
The following table sets forth the intra-day high and low prices per share for our common stock during the periods indicated:
|
High
|
Low
|
||||||
|
Year ended December 31, 2017
|
|||||||
|
Fourth Quarter
|
$
|
154.24
|
|
$
|
115.55
|
|
|
|
Third Quarter
|
161.00
|
|
138.35
|
|
|||
|
Second Quarter
|
156.39
|
|
124.33
|
|
|||
|
First Quarter
|
132.17
|
|
111.88
|
|
|||
|
High
|
Low
|
||||||
|
Year ended December 31, 2016
|
|||||||
|
Fourth Quarter
|
$
|
133.55
|
|
$
|
112.63
|
|
|
|
Third Quarter
|
119.77
|
|
104.44
|
|
|||
|
Second Quarter
|
118.00
|
|
96.58
|
|
|||
|
First Quarter
|
122.13
|
|
88.40
|
|
|||
36
Dividend Policy
In
2017
and
2016
, the Executive Committee, acting on behalf of the Board of Directors, declared the following dividends:
|
Declaration Date
|
Dividend
Per Share
|
Record Date
|
Total Amount
(in thousands)
|
Payment Date
|
|||||||||
|
Year ended December 31, 2017:
|
|||||||||||||
|
February 7, 2017
|
$
|
0.28
|
|
March 9, 2017
|
$
|
42,247
|
|
March 30, 2017
|
|||||
|
April 26, 2017
|
0.28
|
|
May 25, 2017
|
42,438
|
|
June 15, 2017
|
|||||||
|
July 26, 2017
|
0.30
|
|
August 24, 2017
|
45,578
|
|
September 14, 2017
|
|||||||
|
October 25, 2017
|
0.30
|
|
November 16, 2017
|
45,512
|
|
December 7, 2017
|
|||||||
|
Year ended December 31, 2016
|
|||||||||||||
|
February 8, 2016
|
$
|
0.24
|
|
March 10, 2016
|
$
|
36,174
|
|
March 30, 2016
|
|||||
|
April 26, 2016
|
0.24
|
|
May 26, 2016
|
35,773
|
|
June 16, 2016
|
|||||||
|
July 27, 2016
|
0.26
|
|
August 25, 2016
|
39,062
|
|
September 15, 2016
|
|||||||
|
October 24, 2016
|
0.26
|
|
November 17, 2016
|
39,150
|
|
December 8, 2016
|
|||||||
In February 2018, the Executive Committee, acting on behalf of the Board of Directors, declared a quarterly cash dividend of
$0.30
per share of outstanding common stock payable on
March 28, 2018
to the stockholders of record as of the close of business on
March 8, 2018
.
Declaration and payment of future dividends, if any, is at the discretion of the Board of Directors and will depend on, among other things, our results of operations, cash requirements and surplus, financial condition, share dilution management, legal risks, tax policies, capital requirements relating to research and development, investments and acquisitions, challenges to our business model and other factors that the Board of Directors may deem relevant. In addition, our credit agreement limits our ability to pay cash dividends under certain circumstances.
Unregistered Sales of Equity Securities
During the quarter ended
December 31, 2017
, we did not issue or sell any shares of our common stock or other equity securities pursuant to unregistered transactions in reliance upon an exemption from the registration requirements of the Securities Act of 1933, as amended.
Issuer Purchases of Equity Securities
A summary of the repurchase activity for the fourth quarter of
2017
is as follows:
|
Period
|
Total Number of
Shares Purchased
|
Average Price
Paid Per Share
|
Total Number of
Shares
Purchased as
Part of Publicly
Announced
Plans or
Programs
|
Maximum
Number of
Shares that
May Yet Be
Purchased
Under Plans or
Programs
|
|||||||||
|
|
(In thousands, expect per share data)
|
||||||||||||
|
October 1-31, 2017
|
—
|
|
$
|
—
|
|
—
|
|
6,237
|
|
||||
|
November 1-30, 2017
|
1,294
|
|
120.35
|
|
1,294
|
|
4,943
|
|
|||||
|
December 1-31, 2017
|
—
|
|
—
|
|
—
|
|
4,943
|
|
|||||
|
Total
|
1,294
|
|
1,294
|
|
|||||||||
In 2015, the Executive Committee, acting on behalf of the Board of Directors, authorized a repurchase of up to 10 million outstanding shares of our common stock. As of
December 31, 2017
,
4.9 million
shares remain authorized for repurchase under the 2015 authorization. There is no fixed termination date for the repurchases.
37
Performance Comparison Graph
The graph shows a five-year comparison of cumulative total return, calculated on a dividend reinvested basis, for Expedia common stock, the NASDAQ Composite Index, the RDG (Research Data Group) Internet Composite Index and the S&P 500. The graph assumes an investment of $100 in each of the above on December 31, 2012. The stock price performance shown in the graph is not necessarily indicative of future price performance.
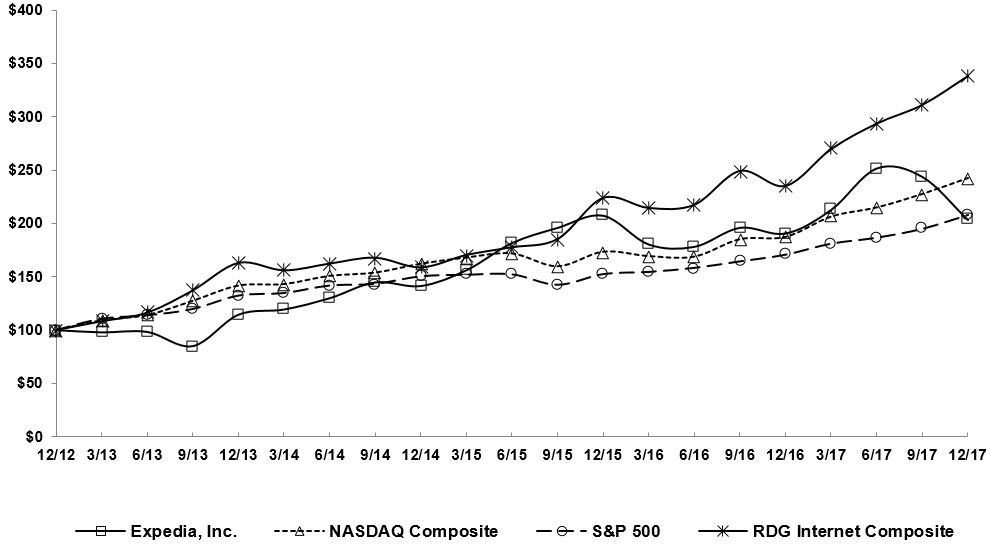
38
We have derived the following selected financial data presented below from the consolidated financial statements and related notes. The information set forth below is not necessarily indicative of future results and should be read in conjunction with the consolidated financial statements and related notes and Part II, Item 7, Management’s Discussion and Analysis of Financial Condition and Results of Operations.
SELECTED FINANCIAL DATA
|
|
Year Ended December 31,
|
||||||||||||||||||
|
|
2017
|
2016
|
2015
|
2014
|
2013
|
||||||||||||||
|
|
(in thousands, except per share data)
|
||||||||||||||||||
|
Consolidated Statements of Operations Data:
|
|||||||||||||||||||
|
Revenue
|
$
|
10,059,844
|
|
$
|
8,773,564
|
|
$
|
6,672,317
|
|
$
|
5,763,485
|
|
$
|
4,771,259
|
|
||||
|
Operating income
|
625,138
|
|
461,702
|
|
413,566
|
|
517,764
|
|
366,060
|
|
|||||||||
|
Net income attributable to Expedia, Inc.
(1)
|
377,964
|
|
281,848
|
|
764,465
|
|
398,097
|
|
232,850
|
|
|||||||||
|
Earnings per share attributable to Expedia, Inc. available to common stockholders:
|
|||||||||||||||||||
|
Basic
|
$
|
2.49
|
|
$
|
1.87
|
|
$
|
5.87
|
|
$
|
3.09
|
|
$
|
1.73
|
|
||||
|
Diluted
|
2.42
|
|
1.82
|
|
5.70
|
|
2.99
|
|
1.67
|
|
|||||||||
|
Shares used in computing earnings per share:
|
|||||||||||||||||||
|
Basic
|
151,619
|
|
150,367
|
|
130,159
|
|
128,912
|
|
134,912
|
|
|||||||||
|
Diluted
|
156,385
|
|
154,517
|
|
134,018
|
|
133,168
|
|
139,593
|
|
|||||||||
|
Dividends declared per common share
|
$
|
1.16
|
|
$
|
1.00
|
|
$
|
0.84
|
|
$
|
0.66
|
|
$
|
0.56
|
|
||||
|
|
December 31,
|
||||||||||||||||||
|
|
2017
|
2016
|
2015
|
2014
|
2013
|
||||||||||||||
|
Consolidated Balance Sheet Data:
|
|||||||||||||||||||
|
Working deficit
|
$
|
(2,339,101
|
)
|
$
|
(2,676,947
|
)
|
$
|
(2,949,756
|
)
|
$
|
(1,263,283
|
)
|
$
|
(1,075,817
|
)
|
||||
|
Total assets
|
18,515,628
|
|
15,777,546
|
|
15,485,675
|
|
9,012,299
|
|
7,734,689
|
|
|||||||||
|
Senior notes debt
(2)
|
4,249,054
|
|
3,159,336
|
|
3,183,140
|
|
1,738,548
|
|
1,244,620
|
|
|||||||||
|
Non-redeemable non-controlling interest
(3)
|
1,606,233
|
|
1,560,802
|
|
65,373
|
|
109,462
|
|
113,521
|
|
|||||||||
|
Total stockholders’ equity
|
6,128,568
|
|
5,693,103
|
|
4,929,767
|
|
1,893,729
|
|
2,258,985
|
|
|||||||||
___________________________________
|
(1)
|
On May 22, 2015, we completed the sale of our 62.4% ownership stake in eLong, Inc. We recognized an after tax gain of $395 million (or $509 million pre-tax gain) during 2015.
|
|
(2)
|
Includes current and long-term portion of senior notes.
|
|
(3)
|
On December 16, 2016, our majority-owned subsidiary, trivago, completed its IPO. In conjunction with the IPO, Expedia and trivago's founders entered into an Amended and Restated Shareholders' Agreement under which the original put/call rights were no longer effective and, as such, we reclassified the redeemable non-controlling interest into non-redeemable non-controlling interest on the consolidated balance sheet. See
NOTE 12 — Redeemable Non-controlling Interests
in the notes to consolidated financial statements for further information.
|
39
Overview
Expedia, Inc. is an online travel company, empowering business and leisure travelers with the tools and information they need to efficiently research, plan, book and experience travel. We created a global travel marketplace used by a broad range of leisure and corporate travelers, offline retail travel agents and travel service providers. We make available, on a stand-alone and package basis, travel products and services provided by numerous lodging properties, airlines, car rental companies, destination service providers, cruise lines, vacation rental property owners and managers, and other travel product and service companies. We also offer travel and non-travel advertisers access to a potential source of incremental traffic and transactions through our various media and advertising offerings on our transaction-based websites. For additional information about our portfolio of brands, see the disclosure set forth in Part I, Item 1, Business, under the caption “Management Overview.”
All percentages within this section are calculated on actual, unrounded numbers.
Trends
The travel industry, including offline agencies, online agencies and other suppliers of travel products and services, has historically been characterized by intense competition, as well as rapid and significant change. Generally, 2016 and 2017 represented years of continuing improvement for the travel industry. However, political instability, geopolitical conflicts, acts of terrorism, significant fluctuations in currency values, sovereign debt issues, natural disasters and macroeconomic concerns are examples of events that contribute to a somewhat uncertain environment, which could have a negative impact on the travel industry in the future.
Online Travel
Increased usage and familiarity with the internet drove rapid growth in online penetration of travel expenditures. According to Phocuswright, an independent travel, tourism and hospitality research firm, in 2018, over 45% of U.S. and European leisure and unmanaged corporate travel expenditures are expected to occur online. Online penetration rates in the emerging markets, such as Asia Pacific and Latin American regions, are lagging behind that of the United States and Europe, and are estimated to be in the range of 30% to 40%. These penetration rates increased over the past few years, and are expected to continue growing, which has attracted many competitors to online travel. This competition intensified in recent years, and the industry is expected to remain highly competitive for the foreseeable future. In addition to the growth of online travel agencies, airlines and lodging companies aggressively pursued direct online distribution of their products and services. Competitive entrants such as “metasearch” companies, including Kayak.com (owned by The Priceline Group), trivago (in which Expedia owns a majority interest) as well as TripAdvisor, introduced differentiated features, pricing and content compared with the legacy online travel agency companies, as well as various forms of direct or assisted booking tools, the impact of which is currently uncertain. In addition, the increasing popularity of the “sharing economy,” accelerated by online penetration, has had a direct impact on the travel and lodging industry. Players such as Airbnb, HomeAway (which Expedia acquired in December 2015) and Booking.com (owned by The Priceline Group) emerged as the leaders, bringing incremental alternative accommodation and vacation rental inventory to the market. Many other competitors, including vacation rental metasearch players, continue to emerge in this space, which is estimated by analysts to account for approximately $100 billion of annual travel spend and expected to continue to grow as a percentage of the global accommodation market. Furthermore, we saw increased interest in the online travel industry from search engine companies as evidenced by recent innovations including direct booking functionality, as well as licensing deals and proposed and actual acquisitions by companies such as Google. Finally, traditional consumer eCommerce and group buying websites expanded their local offerings into the travel market by adding hotel offers to their websites.
The online travel industry also saw the development of alternative business models and variations in the timing of payment by travelers and to suppliers, which in some cases place pressure on historical business models. In particular, the agency hotel model saw rapid adoption in Europe. Expedia distributes both merchant (Expedia Collect) and agency (Hotel Collect) hotel offerings for our hotel supply partners through both agency-only contracts as well as our hybrid ETP program, which offers travelers the choice of whether to pay Expedia at the time of booking or pay the hotel at the time of stay.
Intense competition also historically led to aggressive marketing efforts by the travel suppliers and intermediaries, and a meaningful unfavorable impact on our overall marketing efficiencies and operating margins. We manage our selling and marketing spending on a brand basis, making decisions in each applicable market that we think are appropriate based on the relative growth opportunity, the expected returns and the competitive environment. In certain cases, particularly in emerging markets, we are pursuing and expect to continue to pursue long-term growth opportunities for which our marketing efficiency is less favorable than that for our consolidated business, but for which we still believe the opportunity to be attractive. The crowded online travel environment is now driving certain secondary and tertiary online travel companies to establish marketing
40
agreements with global players in order to leverage distribution and technology capabilities while focusing resources on capturing traveler mind share.
In May 2015, Expedia sold its 62.4% equity stake in eLong for approximately $671 million to several purchasers including Ctrip.com International, Ltd (“Ctrip”). Expedia and Ctrip also reached agreement on cooperation for certain travel products in specified geographic markets. The transaction closed on May 22, 2015. Unless otherwise noted, all discussion in the “Trends” and “Growth Strategy” sections refers to results for Expedia, Inc. excluding eLong.
Lodging
Lodging includes hotel accommodations as well as alternative accommodations primarily made available through HomeAway. As a percentage of our total worldwide revenue in 2017, lodging accounted for 68%. Our room night growth has been healthy, with room nights excluding eLong growing 36% in 2015, 32% in 2016, and 16% in 2017. ADRs for rooms booked on Expedia and HomeAway websites excluding eLong declined 5% in 2015, increased 5% in 2016 due to the acquisition of HomeAway, and increased 3% in 2017.
Hotel.
We generate the majority of our revenue through the facilitation of hotel reservations (stand-alone and package bookings). Although our relationships with our hotel supply partners remained broadly stable in the past few years, as part of the global rollout of ETP, we reduced negotiated economics in certain instances to compensate for hotel supply partners absorbing expenses such as credit card fees and customer service costs, which has negatively impacted the margin of revenue we earn per booking. In addition, as we continue to expand the breadth and depth of our global hotel offering, in some cases we have reduced our economics in various geographies based on local market conditions. These impacts are due to specific initiatives intended to drive greater global size and scale through faster overall room night growth. Additionally, increased promotional activities such as growing loyalty programs contribute to declines in revenue per room night and profitability.
Since our hotel supplier agreements are generally negotiated on a percentage basis, any increase or decrease in ADRs has an impact on the revenue we earn per room night. Over the course of the last several years, occupancies and ADRs in the lodging industry generally increased on a currency-neutral basis in a gradually improving overall travel environment. However, U.S. dollar-denominated hotel ADRs declined in 2015 and 2016, due to the currency translation impact, and increased in 2017. Current occupancy rates for hotels in the United States remain high; however, U.S. hotel supply growth has been accelerating, which may put additional pressure on ADRs. In international markets, hotel supply is being added at a faster rate as hotel owners and operators try to take advantage of opportunities in faster growing regions such as Asia and certain Latin American markets. Companies like Airbnb, HomeAway and Booking.com also added incremental global supply in the alternative accommodations space. In addition, while the global lodging industry remains very fragmented, there has been consolidation in the hotel space among chains as well as ownership groups. In the meantime, certain hotel chains have been focusing on driving direct bookings on their own websites and mobile applications by advertising lower rates than those available on third-party websites as well as incentives such as loyalty points, increased or exclusive product availability and complimentary Wi-Fi. We have had success adding supply to our marketplace with more than 590,000 properties on our global websites as of December 31, 2017, including more than 150,000 HomeAway vacation rental properties now available on select Brand Expedia, Orbitz, Travelocity, CheapTickets and ebookers websites.
Alternative Accommodations.
With our acquisition of HomeAway and all of its brands in December 2015, we expanded into the fast growing $100 billion alternative accommodations market. HomeAway is a leader in this market and represents an attractive growth opportunity for Expedia. HomeAway has been undergoing a transition from a listings-based classified advertising model to an online transactional model that optimizes for both travelers and homeowner and property manager partners, with a goal of increasing monetization and driving growth through investments in marketing as well as in product and technology. In addition, HomeAway rolled out a traveler service fee in the United States and Europe during the first half of 2016, consistent with market practice. The fee is expected to continue to contribute to HomeAway’s revenue growth and help fund marketing investment, programs to better protect travelers and future growth initiatives. Furthermore, HomeAway moved to a single subscription option globally in July 2016. In the first quarter of 2017, HomeAway began integrating Expedia vacation rental properties onto its websites. As of December 31, 2017, there are nearly 1.5 million online bookable listings available on HomeAway.
Air
Significant airline sector consolidation in the United States in recent years generally resulted in lower overall capacity and higher fares, which combined with the significant declines in fuel prices led to record levels of profitability for the U.S. air carriers, further strengthening their position. However, in 2015, 2016 and 2017, there has been evidence of discounting by the U.S. carriers while currency headwinds and weaker macroeconomic trends put pressure on international results. Ticket prices on Expedia websites excluding eLong declined 11% in 2015, 6% in 2016, and 1% in 2017 as short-haul traffic and low cost carriers grew alongside increasingly competitive airline pricing and more recently a volatile fuel pricing environment. We can
41
encounter pressure on air remuneration as air carriers combine and as certain supply agreements renew, and continue to add airlines to ensure local coverage in new markets.
Air ticket volumes excluding eLong increased 35% in 2015 and 32% in 2016, primarily due to the acquisition of Orbitz, and 4% in 2017. As a percentage of our total worldwide revenue in 2017, air accounted for 8%.
Advertising & Media
Our advertising and media business is principally driven by revenue generated by trivago, a leading hotel metasearch website, in addition to Expedia Media Solutions, which is responsible for generating advertising revenue on our global online travel brands. In 2017, we generated a total of $1.1 billion of advertising and media revenue representing 11% of our total worldwide revenue, up from $807 million in 2016.
Growth Strategy
Global Expansion.
Our Brand Expedia, Hotels.com, Egencia, and EAN brands operate both domestically and through international points of sale, including in Europe, Asia Pacific, Canada and Latin America. In addition, ebookers offers multi-product online travel reservations in Europe and Wotif Group has a leading portfolio of travel brands, including Wotif.com, Wotif.co.nz, lastminute.com.au, lastminute.com.nz and travel.com.au, focused principally on the Australia and New Zealand markets. Egencia, our corporate travel business, operates in over 65 countries around the world and continues to expand. The HomeAway portfolio has 60 vacation rental websites all around the world. We own a majority share of trivago, a leading metasearch company. Officially launched in 2005, trivago is one of the best known travel brands in Europe and North America. trivago continues to operate independently and grow revenue through global expansion, including aggressive expansion in new countries. In December 2016, trivago successfully completed its initial public offering and trades on the Nasdaq Global Select Market under the symbol "TRVG." In addition, we have commercial agreements in place with Ctrip and eLong in China, Traveloka in Southeast Asia, as well as Decolar.com, Inc. in Latin America, among many others. In conjunction with the commercial arrangements with Traveloka and Decolar, we have also made strategic investments of over $600 million combined in Traveloka in 2017 and Decolar in 2015. In 2017, approximately 38% of our worldwide gross bookings and 45% of worldwide revenue were through international points of sale compared to just 21% for both worldwide gross bookings and revenue in 2005. We have a goal of generating more than two-thirds of our revenue through businesses and points of sale outside of the United States.
In expanding our global reach, we leverage significant investments in technology, operations, brand building, supplier relationships and other initiatives that we have made since the launch of Expedia.com in 1996. Our scale of operations enhances the value of technology innovations we introduce on behalf of our travelers and suppliers. We believe that our size and scale afford the company the ability to negotiate competitive rates with our supply partners, provide breadth of choice and travel deals to our traveling customers through an expanding supply portfolio and create opportunities for new value added offers for our customers such as our loyalty programs. The size of Expedia’s worldwide traveler base makes our websites an increasingly appealing channel for travel suppliers to reach customers. In addition, the sheer size of our user base and search query volume allows us to test new technologies very quickly in order to determine which innovations are most likely to improve the travel research and booking process, and then roll those features out to our worldwide audience in order to drive improvements in conversion.
Product Innovation.
Each of our leading brands was a pioneer in online travel and has been responsible for driving key innovations in the space for more than two decades. Each Expedia technology platform is operated by a dedicated technology team, which drives innovations that make researching and shopping for travel increasingly easier and helps customers find and book the best possible travel options. We have made key investments in technology, including significant development of our technical platforms that makes it possible for us to deliver innovations at a faster pace. Improvements in our global platforms for Hotels.com and Brand Expedia continue to enable us to significantly increase the innovation cycle, thereby improving conversion and driving faster growth rates for those brands. In 2013, Expedia signed an agreement to power the technology, supply and customer service platforms for Travelocity-branded websites in the United States and Canada, enabling Expedia to leverage its investments in each of these key areas. During 2014, the Travelocity-branded websites were successfully migrated to the Expedia technology platform. In November 2014, Expedia completed the acquisition of Wotif Group and subsequently converted the Wotif.com website to the Expedia technology platform. In January 2015, we acquired the Travelocity brand and other associated assets from Sabre. The strategic marketing and other related agreements previously entered into were terminated. In September 2015, Expedia acquired Orbitz Worldwide, including all of its brands. The Orbitz, CheapTickets and ebookers websites were migrated to the Expedia technology platform in the first half of 2016, and Orbitz for Business customers were migrated to the Egencia technology platform by July 2016. In December 2015, Expedia acquired HomeAway, Inc., including all of its brands. Additionally, in June 2017, Expedia acquired a majority stake in SilverRail, a leading rail technology distributor. We intend to continue leveraging these investments when launching additional points of sale in new
42
countries, introducing new website features, adding supplier products and services including new business model offerings, as well as proprietary and user-generated content for travelers.
Channel Expansion.
Technological innovations and developments continue to create new opportunities for travel bookings. In the past few years, each of our brands made significant progress creating new mobile websites and mobile applications that are receiving strong reviews and solid download trends, and some of our brands now see more traffic via mobile devices than via traditional PCs. Mobile bookings continue to present an opportunity for incremental growth as they are often completed within one or two days of the travel or stay, which is a much shorter booking window than we historically experienced via more traditional online booking methods. Additionally, our brands implemented new technologies like voice-based search, chatbots and messaging apps as mobile-based options for travelers. In addition, we are seeing significant cross-device usage among our customers, who connect to our websites and apps across multiple devices and platforms throughout their travel planning process. We also believe mobile represents an efficient marketing channel given the opportunity for direct traffic acquisition, increase in share of wallet and in repeat customers, particularly through mobile applications. During 2017, approximately one in three Expedia, Inc. transactions were booked globally on a mobile device.
Seasonality
We generally experience seasonal fluctuations in the demand for our travel products and services. For example, traditional leisure travel bookings are generally the highest in the first three quarters as travelers plan and book their spring, summer and winter holiday travel. The number of bookings typically decreases in the fourth quarter. Because revenue for most of our travel products, including merchant and agency hotel, is recognized when the travel takes place rather than when it is booked, revenue typically lags bookings by several weeks for our hotel business and can be several months for our vacation rental business. Historically, HomeAway has seen seasonally stronger bookings in the first quarter of the year, with the relevant stays occurring during the peak summer travel months. The seasonal revenue impact is exacerbated with respect to income by the nature of our variable cost of revenue and direct sales and marketing costs, which we typically realize in closer alignment to booking volumes, and the more stable nature of our fixed costs. Furthermore, operating profits for our primary advertising business, trivago, have typically been experienced in the second half of the year, particularly the fourth quarter, as selling and marketing costs offset revenue in the first half of the year as we aggressively market during the busy booking period for spring, summer and winter holiday travel. As a result on a consolidated basis, revenue and income are typically the lowest in the first quarter and highest in the third quarter. The continued growth of our international operations, advertising business or a change in our product mix, including the growth of HomeAway, may influence the typical trend of the seasonality in the future, and there may also be business or market driven dynamics that result in short-term impacts to revenue or profitability that differ from the typical seasonal trends. We expect that as HomeAway continues its shift to more of a transaction-based business model for vacation rental listings its seasonal trends will be more pronounced than our other traditional leisure businesses.
Critical Accounting Policies and Estimates
Critical accounting policies and estimates are those that we believe are important in the preparation of our consolidated financial statements because they require that we use judgment and estimates in applying those policies. We prepare our consolidated financial statements and accompanying notes in accordance with generally accepted accounting principles in the United States (“GAAP”). Preparation of the consolidated financial statements and accompanying notes requires that we make estimates and assumptions that affect the reported amounts of assets and liabilities and the disclosure of contingent assets and liabilities as of the date of the consolidated financial statements as well as revenue and expenses during the periods reported. We base our estimates on historical experience, where applicable, and other assumptions that we believe are reasonable under the circumstances. Actual results may differ from our estimates under different assumptions or conditions.
There are certain critical estimates that we believe require significant judgment in the preparation of our consolidated financial statements. We consider an accounting estimate to be critical if:
|
•
|
It requires us to make an assumption because information was not available at the time or it included matters that were highly uncertain at the time we were making the estimate; and
|
|
•
|
Changes in the estimate or different estimates that we could have selected may have had a material impact on our financial condition or results of operations.
|
For more information on each of these policies, see
NOTE 2 — Significant Accounting Policies
, in the notes to consolidated financial statements. We discuss information about the nature and rationale for our critical accounting estimates below.
43
Accounting for Certain Merchant Revenue
We accrue the cost of certain merchant revenue based on the amount we expect to be billed by suppliers. In certain instances when a supplier invoices us for less than the cost we accrued, we generally recognize those amounts as revenue six months in arrears, net of an allowance, when we determine it is not probable that we will be required to pay the supplier, based on historical experience and contract terms. Actual revenue could be greater or less than the amounts estimated due to changes in hotel billing practices or changes in traveler behavior.
Loyalty Program Accruals
We offer certain internally administered traveler loyalty programs to our customers, such as our Hotels.com Rewards program, our Brand Expedia Expedia+ rewards program and our Orbitz rewards program. Hotels.com Rewards offers travelers one free night at any Hotels.com partner property after that traveler stays 10 nights, subject to certain restrictions. Expedia+ rewards enables participating travelers to earn points on all hotel, flight, package and activities made on over 30 Brand Expedia websites. Orbitz Rewards allows travelers to earn Orbucks
SM
, the currency of Orbitz Rewards, on flights, hotels and vacation packages and instantly redeem those Orbucks on future bookings at various hotels worldwide. As travelers accumulate points towards free travel products, we record a liability for the estimated future cost of redemptions. The cost of these loyalty points is recorded as a reduction to revenue in our consolidated financial statements. We determine the future redemption obligation based on judgment factors including: (i) the estimated cost of travel products to be redeemed, and (ii) an estimated redemption rate based on the overall accumulation and usage of points towards free travel products, which is determined through current and historical trends as well as statistical modeling techniques. The actual future cost and rate of redemptions could differ materially from our estimates.
Business Combinations
We assign the value of the consideration transferred to acquire a business to the tangible assets and identifiable intangible assets acquired and liabilities assumed on the basis of their fair values at the date of acquisition. Any excess purchase price over the fair value of the net tangible and intangible assets acquired is allocated to goodwill. When determining the fair values of assets acquired and liabilities assumed, management makes significant estimates and assumptions, especially with respect to intangible assets. Critical estimates in valuing certain intangible assets include but are not limited to future expected cash flows from customer relationships and trade names, and discount rates. Management’s estimates of fair value are based upon assumptions believed to be reasonable, but which are inherently uncertain and unpredictable and, as a result, actual results may differ from estimates.
Recoverability of Goodwill and Indefinite and Definite-Lived Intangible Assets
Goodwill
. We assess goodwill for impairment annually as of October 1, or more frequently, if events and circumstances indicate impairment may have occurred. In the evaluation of goodwill for impairment, we typically perform a quantitative assessment and compare the fair value of the reporting unit to the carrying value and, if applicable, record an impairment charge based on the excess of the reporting unit's carrying amount over its fair value. Periodically, we may choose to perform a qualitative assessment, prior to performing the quantitative analysis, to determine whether the fair value of the goodwill is more likely than not impaired.
We generally base our measurement of fair value of reporting units on a blended analysis of the present value of future discounted cash flows and market valuation approach with the exception of our standalone publicly traded subsidiary, which is based on market valuation. The discounted cash flows model indicates the fair value of the reporting units based on the present value of the cash flows that we expect the reporting units to generate in the future. Our significant estimates in the discounted cash flows model include: our weighted average cost of capital; long-term rate of growth and profitability of our business; and working capital effects. The market valuation approach indicates the fair value of the business based on a comparison of the Company to comparable publicly traded firms in similar lines of business. Our significant estimates in the market approach model include identifying similar companies with comparable business factors such as size, growth, profitability, risk and return on investment and assessing comparable revenue and operating income multiples in estimating the fair value of the reporting units.
We believe the weighted use of discounted cash flows and market approach is the best method for determining the fair value of our reporting units because these are the most common valuation methodologies used within the travel and internet industries; and the blended use of both models compensates for the inherent risks associated with either model if used on a stand-alone basis.
In addition to measuring the fair value of our reporting units as described above, we consider the combined carrying and fair values of our reporting units in relation to the Company’s total fair value of equity plus debt as of the assessment date. Our
44
equity value assumes our fully diluted market capitalization, using either the stock price on the valuation date or the average stock price over a range of dates around the valuation date, plus an estimated acquisition premium which is based on observable transactions of comparable companies. The debt value is based on the highest value expected to be paid to repurchase the debt, which can be fair value, principal or principal plus a premium depending on the terms of each debt instrument.
Indefinite-Lived Intangible Assets
. We base our measurement of fair value of indefinite-lived intangible assets, which primarily consist of trade name and trademarks, using the relief-from-royalty method. This method assumes that the trade name and trademarks have value to the extent that their owner is relieved of the obligation to pay royalties for the benefits received from them. This method requires us to estimate the future revenue for the related brands, the appropriate royalty rate and the weighted average cost of capital.
Definite-Lived Intangible Assets.
We review the carrying value of long-lived assets or asset groups to be used in operations whenever events or changes in circumstances indicate that the carrying amount of the assets might not be recoverable. Factors that would necessitate an impairment assessment include a significant adverse change in the extent or manner in which an asset is used, a significant adverse change in legal factors or the business climate that could affect the value of the asset, or a significant decline in the observable market value of an asset, among others. If such facts indicate a potential impairment, we would assess the recoverability of an asset group by determining if the carrying value of the asset group exceeds the sum of the projected undiscounted cash flows expected to result from the use and eventual disposition of the assets over the remaining economic life of the primary asset in the asset group. If the recoverability test indicates that the carrying value of the asset group is not recoverable, we will estimate the fair value of the asset group using appropriate valuation methodologies, which would typically include an estimate of discounted cash flows. Any impairment would be measured as the difference between the asset groups carrying amount and its estimated fair value.
The use of different estimates or assumptions in determining the fair value of our goodwill, indefinite-lived and definite-lived intangible assets may result in different values for these assets, which could result in an impairment or, in the period in which an impairment is recognized, could result in a materially different impairment charge.
Income Taxes
We record income taxes under the liability method. Deferred tax assets and liabilities reflect our estimation of the future tax consequences of temporary differences between the carrying amounts of assets and liabilities for book and tax purposes. We determine deferred income taxes based on the differences in accounting methods and timing between financial statement and income tax reporting. Accordingly, we determine the deferred tax asset or liability for each temporary difference based on the enacted tax rates expected to be in effect when we realize the underlying items of income and expense. We consider many factors when assessing the likelihood of future realization of our deferred tax assets, including our recent earnings experience by jurisdiction, expectations of future taxable income, and the carryforward periods available to us for tax reporting purposes, as well as other relevant factors. We may establish a valuation allowance to reduce deferred tax assets to the amount we believe is more likely than not to be realized. Due to inherent complexities arising from the nature of our businesses, future changes in income tax law, tax sharing agreements or variances between our actual and anticipated operating results, we make certain judgments and estimates. Therefore, actual income taxes could materially vary from these estimates.
We record liabilities to address uncertain tax positions we have taken in previously filed tax returns or that we expect to take in a future tax return. The determination for required liabilities is based upon an analysis of each individual tax position, taking into consideration whether it is more likely than not that our tax position, based on technical merits, will be sustained upon examination. For those positions for which we conclude it is more likely than not it will be sustained, we recognize the largest amount of tax benefit that is greater than 50 percent likely of being realized upon ultimate settlement with the taxing authority. The difference between the amount recognized and the total tax position is recorded as a liability. The ultimate resolution of these tax positions may be greater or less than the liabilities recorded.
The Tax Cuts and Jobs Act ("the Tax Act") was enacted in December 2017. The Tax Act significantly changes U.S. tax law by, among other things, lowering U.S. corporate income tax rates, implementing a territorial tax system and imposing a one-time transition tax on deemed repatriated earnings of foreign subsidiaries. The Tax Act reduces the U.S. corporate income tax rate from 35% to 21%, effective January 1, 2018. The SEC staff issued Staff Accounting Bulletin No. 118 (“SAB 118”) to address the application of U.S. GAAP in situations when a registrant does not have the necessary information available, prepared, or analyzed (including computations) in reasonable detail to complete the accounting for certain income tax effects of the Tax Act and allows the registrant to record provisional amounts during a measurement period not to extend beyond one year of the enactment date. We have recognized the provisional impacts related to the one-time transition tax and revaluation of deferred tax balances and included these estimates in our consolidated financial statements for the year ended December 31, 2017. The ultimate impact may materially differ from these provisional amounts, due to, among other things, additional
45
analysis, changes in interpretations and assumptions we have made, additional regulatory guidance that may be issued, and actions we may take as a result of the Tax Act. In addition, foreign governments may enact tax laws in response to the Tax Act that could result in further changes to global taxation and materially affect our financial position and results of operations. We expect to complete our analysis within the measurement period in accordance with SAB 118.
Other Long-Term Liabilities
Various Legal and Tax Contingencies
. We record liabilities to address potential exposures related to business and tax positions we have taken that have been or could be challenged by taxing authorities. In addition, we record liabilities associated with legal proceedings and lawsuits. These liabilities are recorded when the likelihood of payment is probable and the amounts can be reasonably estimated. The determination for required liabilities is based upon analysis of each individual tax issue, or legal proceeding, taking into consideration the likelihood of adverse judgments and the range of possible loss. In addition, our analysis may be based on discussions with outside legal counsel. The ultimate resolution of these potential tax exposures and legal proceedings may be greater or less than the liabilities recorded.
Occupancy Tax
. Some states and localities impose a transient occupancy or accommodation tax on the use or occupancy of hotel accommodations. Generally, hotels collect taxes based on the rate paid to the hotel and remit these taxes to the various tax authorities. When a customer books a room through one of our travel services, we collect a tax recovery charge from the customer which we pay to the hotel. We calculate the tax recovery charge by applying the occupancy tax rate supplied to us by the hotels to the amount that the hotel has agreed to receive for the rental of the room by the consumer. In all but a limited number of jurisdictions, we do not collect or remit occupancy taxes, nor do we pay occupancy taxes to the hotel operator, on the portion of the customer payment we retain. Some jurisdictions have questioned our practice in this regard. While the applicable tax provisions vary among the jurisdictions, we generally believe that we are not required to pay such occupancy taxes. We are engaged in discussions with tax authorities in various jurisdictions to resolve this issue. Some tax authorities have brought lawsuits or have levied assessments asserting that we are required to collect and remit occupancy tax. The ultimate resolution in all jurisdictions cannot be determined at this time. Certain jurisdictions may require us to pay tax assessments, including occupancy and other transactional tax assessments, prior to contesting any such assessments.
We have established a reserve for the potential settlement of issues related to hotel occupancy taxes for prior and current periods, consistent with applicable accounting principles and in light of all current facts and circumstances. A variety of factors could affect the amount of the liability (both past and future), which factors include, but are not limited to, the number of, and amount of revenue represented by, jurisdictions that ultimately assert a claim and prevail in assessing such additional tax or negotiate a settlement and changes in relevant statutes.
We note that there are more than 7,000 taxing jurisdictions in the United States, and it is not feasible to analyze the statutes, regulations and judicial and administrative rulings in every jurisdiction. Rather, we have obtained the advice of state and local tax experts with respect to tax laws of certain states and local jurisdictions that represent a large portion of our hotel revenue. Many of the statutes and regulations that impose hotel occupancy taxes were established before the emergence of the internet and eCommerce. Certain jurisdictions have enacted, and others may enact, legislation regarding the imposition of occupancy taxes on businesses that arrange the booking of hotel accommodations. We continue to work with the relevant tax authorities and legislators to clarify our obligations under new and emerging laws and regulations. We will continue to monitor the issue closely and provide additional disclosure, as well as adjust the level of reserves, as developments warrant. Additionally, certain of our businesses are involved in occupancy tax related litigation, which is discussed in Part I, Item 3, Legal Proceedings. Recent occupancy tax developments are also discussed below under the caption “Occupancy and Other Taxes.”
Stock-Based Compensation
Our primary form of employee stock-based compensation is stock option awards. We measure the value of stock option awards on the date of grant at fair value using the appropriate valuation techniques, including the Black-Scholes and Monte Carlo option-pricing models. We amortize the fair value over the remaining term on a straight-line basis. We account for forfeitures as they occur. The pricing models require various highly judgmental assumptions including volatility and expected option term. If any of the assumptions used in the models change significantly, stock-based compensation expense may differ materially in the future from that recorded in the current period.
In addition, we classify certain employee option awards as liabilities when we deem it not probable that the employees holding the awards will bear the risk and rewards of stock ownership for a reasonable period of time. Such options are revalued at the end of each reporting period and upon settlement our total compensation expense recorded from grant date to settlement date will equal the settlement amount.
46
New Accounting Pronouncements
For a discussion of new accounting pronouncements, see
NOTE 2 — Significant Accounting Policies
in the notes to consolidated financial statements.
Occupancy and Other Taxes
We are currently involved in sixteen lawsuits brought by or against states, cities and counties over issues involving the payment of hotel occupancy and other taxes. We continue to defend these lawsuits vigorously. With respect to the principal claims in these matters, we believe that the statutes and ordinances at issue do not apply to the services we provide, namely the facilitation of hotel reservations, and, therefore, that we do not owe the taxes that are claimed to be owed. We believe that the statutes and ordinances at issue generally impose occupancy and other taxes on entities that own, operate or control hotels (or similar businesses) or furnish or provide hotel rooms or similar accommodations.
Recent developments include:
|
•
|
City of San Antonio, Texas Litigation.
On November 29, 2017, the United States Fifth Circuit Court of Appeals reversed the decision of the district court and held that the amounts charged by the defendants for their services are not subject to tax. The plaintiff municipalities filed petitions for rehearing and en banc review. On February 6, 2018, the Fifth Circuit Court denied those petitions.
|
|
•
|
Town of Breckenridge, Colorado Litigation.
On January 25, 2018, the Colorado Court of Appeals affirmed the trial court’s decision on all grounds, finding that the defendant online travel companies are not liable for accommodations taxes, that the Town’s sales tax claims were properly dismissed for lack of subject matter jurisdiction and that class certification was properly denied.
|
|
•
|
Village of Bedford Park, Illinois Litigation.
On November 22, 2017, the United States Seventh Circuit Court of Appeals denied the plaintiffs’ appeal, affirming the district court’s finding of no liability for occupancy taxes in 12 of the 13 plaintiff municipalities, and granted the defendant online travel companies’ appeal, reversing the district court’s finding of liability for occupancy taxes in the Village of Lombard.
|
|
•
|
State of New Hampshire Litigation.
On November 17, 2017, the plaintiff filed a notice of appeal to the New Hampshire Supreme Court from the trial court’s October 18, 2017 ruling that the defendant online travel companies are not subject to the New Hampshire meals and room tax and that their business practices do not violate the state consumer protection act.
|
For additional information on these and other legal proceedings, see Part I, Item 3, Legal Proceedings.
We have established a reserve for the potential settlement of issues related to hotel occupancy and other tax litigation, consistent with applicable accounting principles and in light of all current facts and circumstances, in the amount of
$43 million
as of
December 31, 2017
and
$71 million
as of
December 31, 2016
.
Certain jurisdictions, including the states of New York, North Carolina, Minnesota, Oregon, Rhode Island, and Maryland, the city of New York, and the District of Columbia, have enacted legislation seeking to tax online travel company services as part of sales taxes for hotel occupancy. We are currently remitting taxes to a number of jurisdictions, including to the states of New York, South Carolina, North Carolina, Minnesota, Georgia, Wyoming, Oregon, Rhode Island, Montana, Maryland, Kentucky and Maine, the District of Columbia and the city of New York, as well as certain other county and local jurisdictions.
Pay-to-Play
Certain jurisdictions may assert that we are required to pay any assessed taxes prior to being allowed to contest or litigate the applicability of the ordinances. This prepayment of contested taxes is referred to as “pay-to-play.” Payment of these amounts is not an admission that we believe we are subject to such taxes and, even when such payments are made, we continue to defend our position vigorously. If we prevail in the litigation, for which a pay-to-play payment was made, the jurisdiction collecting the payment will be required to repay such amounts and also may be required to pay interest. However, any significant pay-to-play payment or litigation loss could negatively impact our liquidity. For additional information, including significant pay-to-play payments made by Expedia companies, see
NOTE 17 — Commitments and Contingencies
- Legal Proceedings - Pay-to-Play in the notes to the consolidated financial statements.
Other Jurisdictions.
We are also in various stages of inquiry or audit with domestic and foreign tax authorities, some of which, including in the United Kingdom regarding the application of value added tax (“VAT”) to our European Union related transactions, impose a pay-to-play requirement to challenge an adverse inquiry or audit result in court.
47
Segments
We have four reportable segments: Core OTA, trivago, HomeAway upon its acquisition on December 15, 2015 and Egencia. In addition, eLong was a reportable segment through its disposal on May 22, 2015. Our Core OTA segment provides a full range of travel and advertising services to our worldwide customers through a variety of brands including: Expedia.com and Hotels.com in the United States and localized Expedia and Hotels.com websites throughout the world, Orbitz, CheapTickets, ebookers, EAN, Hotwire.com, Travelocity, Wotif Group, CarRentals.com, Classic Vacations and SilverRail Technologies, Inc. Our trivago segment generates advertising revenue primarily from sending referrals to online travel companies and travel service providers from its hotel metasearch websites. Our HomeAway segment operates an online marketplace for the vacation rental industry. Our Egencia segment provides managed travel services to corporate customers worldwide.
Operating Metrics
Our operating results are affected by certain metrics, such as gross bookings and revenue margin, which we believe are necessary for understanding and evaluating us. Gross bookings represent the total retail value of transactions booked for both agency and merchant transactions, recorded at the time of booking reflecting the total price due for travel by travelers, including taxes, fees and other charges, and are generally reduced for cancellations and refunds. As travelers have increased their use of the internet to book travel arrangements, we have generally seen our gross bookings increase, reflecting the growth in the online travel industry, our organic market share gains and our business acquisitions. Revenue margin is defined as revenue as a percentage of gross bookings.
When HomeAway properties are booked through our Core OTA websites and vice versa, the segments split the third-party revenue for management and segment reporting purposes with the majority of the third-party revenue residing with the website marketing the property or room. The operating metrics, including gross bookings and room nights, are not split but instead generally reside entirely with the website marketing the property or room.
Gross Bookings and Revenue Margin
|
|
Year ended December 31,
|
% Change
|
|||||||||||||||
|
|
2017
|
2016
|
2015
|
2017 vs 2016
|
2016 vs 2015
|
||||||||||||
|
|
($ in millions)
|
|
|
||||||||||||||
|
Gross Bookings
|
|||||||||||||||||
|
Core OTA
|
$
|
72,701
|
|
$
|
66,063
|
|
$
|
54,252
|
|
10
|
%
|
22
|
%
|
||||
|
trivago
(1)
|
—
|
|
—
|
|
—
|
|
N/A
|
|
N/A
|
|
|||||||
|
HomeAway
(2)
|
8,746
|
|
5,980
|
|
—
|
|
46
|
%
|
N/A
|
|
|||||||
|
Egencia
|
6,963
|
|
6,368
|
|
5,427
|
|
9
|
%
|
17
|
%
|
|||||||
|
eLong
(3)
|
—
|
|
—
|
|
1,151
|
|
N/A
|
|
N/A
|
|
|||||||
|
Total gross bookings
|
$
|
88,410
|
|
$
|
78,411
|
|
$
|
60,830
|
|
13
|
%
|
29
|
%
|
||||
|
Revenue Margin
|
|||||||||||||||||
|
Core OTA
|
10.8
|
%
|
10.7
|
%
|
10.8
|
%
|
|||||||||||
|
trivago
(1)
|
N/A
|
|
N/A
|
|
N/A
|
|
|||||||||||
|
HomeAway
(2)
|
10.4
|
%
|
11.5
|
%
|
N/A
|
|
|||||||||||
|
Egencia
|
7.5
|
%
|
7.3
|
%
|
7.4
|
%
|
|||||||||||
|
eLong
(3)
|
N/A
|
|
N/A
|
|
3.6
|
%
|
|||||||||||
|
Total revenue margin
|
11.4
|
%
|
11.2
|
%
|
11.0
|
%
|
|||||||||||
___________________________________
|
(1)
|
trivago, which is comprised of a hotel metasearch business that differs from our transaction-based websites, does not have associated gross bookings or revenue margin. However, third-party revenue from trivago is included in revenue used to calculate total revenue margin.
|
|
(2)
|
In 2017, we began reporting HomeAway gross bookings along with the historical comparable information for 2016. As we acquired HomeAway on December 15, 2015, we did not report HomeAway gross bookings for 2015. HomeAway gross bookings include on-platform transactions from all HomeAway brands, with the exception of BedandBreakfast.com and TopRural (which, if included would collectively add less than an estimated 2% to gross bookings). On-platform gross bookings for Stayz, Bookabach and Travelmob (which collectively represent less than 10% of total on-platform transactions) represent our best estimates.
|
|
(3)
|
Includes results for eLong through its disposal on May 22, 2015.
|
48
The increase in worldwide gross bookings in
2017
as compared to
2016
was primarily due to growth in the Core OTA segment, including growth at Brand Expedia, Hotels.com and EAN, as well as growth at HomeAway. The increase in worldwide gross bookings in
2016
as compared to
2015
was primarily driven by the inorganic impact from acquisitions of 22%, growth in the Core OTA segment, including growth at Brand Expedia and Hotels.com, as well as growth at Egencia.
Revenue margin increased in
2017
as compared to
2016
primarily due to a mix shift to higher margin products, including growth in advertising and media revenue, and the favorable impact of lower air ticket prices, partially offset by lower revenue per room night and lower HomeAway revenue margins. Revenue margin increased in
2016
compared to
2015
primarily due to the favorable impact of lower air ticket prices and a mix shift to higher margin products, including advertising and media revenue. These impacts were partially offset by the inclusion of a higher share of lower margin air gross bookings with the acquisition of Orbitz and lower revenue per room night
Results of Operations
On May 22, 2015, we completed the sale of our 62.4% ownership stake in eLong. The below discussion of the results of operations for 2015 include results for eLong through its disposal on May 22, 2015. Operating expense tables below present total expenses including eLong for 2015 as well as eLong specific amounts included within the consolidated total.
On September 17, 2015, we completed our acquisition of Orbitz. Orbitz was consolidated into our results of operations starting on the acquisition date and we recognized $196 million in revenue and $163 million in operating losses, including restructuring charges of $92 million as well as fees related to the acquisition, from the acquisition date to December 31, 2015.
On December 15, 2015, we completed our acquisition of HomeAway. HomeAway was consolidated into our results of operations starting on the acquisition date and we recognized $20 million in revenue and $14 million in operating loss, including fees related to the acquisition, from the acquisition date to December 31, 2015.
Revenue
|
|
Year ended December 31,
|
% Change
|
|||||||||||||||
|
|
2017
|
2016
|
2015
|
2017 vs 2016
|
2016 vs 2015
|
||||||||||||
|
|
($ in millions)
|
|
|
||||||||||||||
|
Revenue by Segment
|
|||||||||||||||||
|
Core OTA
|
$
|
7,881
|
|
$
|
7,084
|
|
$
|
5,877
|
|
11
|
%
|
21
|
%
|
||||
|
trivago (Third-party revenue)
|
752
|
|
539
|
|
333
|
|
40
|
%
|
62
|
%
|
|||||||
|
HomeAway
|
906
|
|
689
|
|
20
|
|
32
|
%
|
N/A
|
|
|||||||
|
Egencia
|
521
|
|
462
|
|
400
|
|
13
|
%
|
16
|
%
|
|||||||
|
eLong
|
—
|
|
—
|
|
42
|
|
N/A
|
|
N/A
|
|
|||||||
|
Total revenue
|
$
|
10,060
|
|
$
|
8,774
|
|
$
|
6,672
|
|
15
|
%
|
31
|
%
|
||||
In 2017, revenue increased primarily driven by growth in the Core OTA segment, including growth at Brand Expedia and EAN, as well as growth at HomeAway and trivago. In 2016, revenue increased primarily driven by 19% of inorganic impact from acquisitions, growth in the Core OTA segment, including growth at Brand Expedia and Hotels.com, as well as growth at trivago.
Lodging revenue, which includes hotel and HomeAway revenue, increased 14% in 2017 primarily due to a 16% increase in room nights stayed driven by growth in Brand Expedia, HomeAway and EAN, partially offset by a 2% decline in revenue per room night. Lodging revenue increased 30% in 2016 primarily due to a 22% (32% excluding eLong) increase in room nights stayed driven by the inorganic impact of acquisitions of HomeAway and Orbitz as well as organic growth in Hotels.com, Brand Expedia and EAN, and a 6% increase (1% decrease excluding eLong) in revenue per room night in 2016. Acquisitions added approximately 21% of inorganic lodging revenue growth in 2016 and 16% of room night growth in 2016.
Worldwide air revenue increased 1% in 2017 due to 4% increase in air tickets sold, partially offset by a 3% decrease in revenue per ticket. Worldwide air revenue increased 37% (39% excluding eLong) in 2016 due to a 29% (32% excluding eLong) increase in air tickets sold and a 6% (5% excluding eLong) increase in revenue per air ticket, driven by new contractual agreements and the addition of Orbitz. Acquisitions added approximately 28% of inorganic air revenue growth in 2016 and 21% of air ticket growth in 2016.
The remaining worldwide revenue, other than lodging and air discussed above, which includes advertising and media, car rental, destination services and fees related to our corporate travel business, increased by 23% in 2017 and 35% in 2016
49
primarily due to growth in advertising and media revenue as well as growth in our travel insurance and car rental products, including an inorganic contribution from Orbitz in 2016.
In addition to the above segment and product revenue discussion, our revenue by business model is as follows:
|
|
Year ended December 31,
|
% Change
|
|||||||||||||||
|
|
2017
|
2016
|
2015
|
2017 vs 2016
|
2016 vs 2015
|
||||||||||||
|
|
($ in millions)
|
|
|
||||||||||||||
|
Revenue by Business Model
|
|||||||||||||||||
|
Merchant
|
$
|
5,394
|
|
$
|
4,852
|
|
$
|
4,204
|
|
11
|
%
|
15
|
%
|
||||
|
Agency
|
2,687
|
|
2,425
|
|
1,882
|
|
11
|
%
|
29
|
%
|
|||||||
|
Advertising and media
(1)
|
1,073
|
|
807
|
|
566
|
|
33
|
%
|
43
|
%
|
|||||||
|
HomeAway
|
906
|
|
689
|
|
20
|
|
32
|
%
|
N/A
|
|
|||||||
|
Total revenue
|
$
|
10,060
|
|
$
|
8,774
|
|
$
|
6,672
|
|
15
|
%
|
31
|
%
|
||||
___________________________________
|
(1)
|
Includes third-party revenue from trivago as well as our transaction-based websites.
|
The increase in merchant revenue in
2017
and
2016
was primarily due to the increase in merchant hotel revenue driven by an increase in room nights stayed.
The increase in agency revenue in
2017
and
2016
was primarily due to the growth in agency hotel for both periods as well as agency air in 2016.
The increase in advertising and media revenue in
2017
and
2016
was primarily due to continued growth in trivago and Expedia Media Solutions.
HomeAway revenue increased 32% in 2017 compared to 2016 primarily due to growth in transactional revenue of 115% driven by a benefit from the traveler service fee, partially offset by subscription revenue decreasing approximately 30%. The large increase in 2016 compared to 2015 was due to our acquisition of HomeAway in December 2015.
Cost of Revenue
|
|
Year ended December 31,
|
% Change
|
|||||||||||||||
|
|
2017
|
2016
|
2015
|
2017 vs 2016
|
2016 vs 2015
|
||||||||||||
|
|
($ in millions)
|
|
|
||||||||||||||
|
Customer operations
|
$
|
767
|
|
$
|
727
|
|
$
|
569
|
|
5
|
%
|
28
|
%
|
||||
|
Credit card processing
|
506
|
|
508
|
|
451
|
|
—
|
%
|
13
|
%
|
|||||||
|
Data center, cloud and other
|
484
|
|
362
|
|
290
|
|
34
|
%
|
25
|
%
|
|||||||
|
Total cost of revenue
(1)
|
$
|
1,757
|
|
$
|
1,597
|
|
$
|
1,310
|
|
10
|
%
|
22
|
%
|
||||
|
% of revenue
|
17.5
|
%
|
18.2
|
%
|
19.6
|
%
|
|||||||||||
|
(1) Includes the following eLong amounts:
|
$
|
—
|
|
$
|
—
|
|
$
|
37
|
|
N/A
|
|
N/A
|
|
||||
Cost of revenue primarily consists of (1) customer operations, including our customer support and telesales as well as fees to air ticket fulfillment vendors, (2) credit card processing, including merchant fees, fraud and chargebacks, and (3) other costs, primarily including data center and cloud costs to support our websites, supplier operations, destination supply, and stock-based compensation.
In
2017
, the increase in cost of revenue expense was driven by
$122 million
of higher data center, cloud and other costs, including a $37 million increase in depreciation expense primarily data center related, as well as
$40 million
of increased customer operations expenses. Cloud expense in cost of revenue during 2017 was $57 million compared to $4 million in 2016.
In 2016, the increase in cost of revenue expense was driven by
$158 million
of increased customer operations expenses,
$72 million
of higher data center, cloud and other costs, as well as
$57 million
of higher net credit card processing costs related to growth of our merchant bookings. Acquisitions added approximately 18% of year-on-year cost of revenue growth for 2016.
50
Selling and Marketing
|
|
Year ended December 31,
|
% Change
|
|||||||||||||||
|
|
2017
|
2016
|
2015
|
2017 vs 2016
|
2016 vs 2015
|
||||||||||||
|
|
($ in millions)
|
|
|
||||||||||||||
|
Direct costs
|
$
|
4,360
|
|
$
|
3,530
|
|
$
|
2,718
|
|
24
|
%
|
30
|
%
|
||||
|
Indirect costs
|
938
|
|
837
|
|
663
|
|
12
|
%
|
26
|
%
|
|||||||
|
Total selling and marketing
(1)
|
$
|
5,298
|
|
$
|
4,367
|
|
$
|
3,381
|
|
21
|
%
|
29
|
%
|
||||
|
% of revenue
|
52.7
|
%
|
49.8
|
%
|
50.7
|
%
|
|||||||||||
|
(1) Includes the following eLong amounts:
|
$
|
—
|
|
$
|
—
|
|
$
|
54
|
|
N/A
|
|
N/A
|
|
||||
Selling and marketing expense primarily relates to direct costs, including traffic generation costs from search engines and internet portals, television, radio and print spending, private label and affiliate program commissions, public relations and other costs. The remainder of the expense relates to indirect costs, including personnel and related overhead in our various brands and global supply organization as well as stock-based compensation costs.
Selling and marketing expenses increased
$931 million
during
2017
compared to
2016
driven by an increase of $
830 million
of direct costs, including online and offline marketing expenses. trivago, Brand Expedia, EAN and Hotels.com
accounted for the majority of the total direct cost increases. In addition, higher indirect costs of
$101 million
also contributed to the increase and were primarily driven by growth in personnel at Egencia as well as in the lodging supply organization.
Selling and marketing expenses increased
$986 million
during
2016
compared to 2015 driven by an increase of
$812 million
of direct costs, including online and offline marketing expenses. trivago, Brand Expedia and Hotels.com as well as the added costs from our acquisitions of HomeAway and Orbitz accounted for the majority of the total direct cost increase. In addition, higher indirect costs of
$174 million
also contributed to the increase and were driven by additional personnel due to an accelerated pace of hiring in the lodging supply organization in the first half of the year and additional headcount at HomeAway and Orbitz. Acquisitions added approximately 14% of year-on-year selling and marketing growth for 2016.
Technology and Content
|
|
Year ended December 31,
|
% Change
|
|||||||||||||||
|
|
2017
|
2016
|
2015
|
2017 vs 2016
|
2016 vs 2015
|
||||||||||||
|
|
($ in millions)
|
|
|
||||||||||||||
|
Personnel and overhead
|
$
|
667
|
|
$
|
600
|
|
$
|
415
|
|
11
|
%
|
45
|
%
|
||||
|
Depreciation and amortization of technology assets
|
445
|
|
362
|
|
265
|
|
23
|
%
|
36
|
%
|
|||||||
|
Other
|
275
|
|
273
|
|
150
|
|
1
|
%
|
82
|
%
|
|||||||
|
Total technology and content
(1)
|
$
|
1,387
|
|
$
|
1,235
|
|
$
|
830
|
|
12
|
%
|
49
|
%
|
||||
|
% of revenue
|
13.8
|
%
|
14.1
|
%
|
12.4
|
%
|
|||||||||||
|
(1) Includes the following eLong amounts:
|
$
|
—
|
|
$
|
—
|
|
$
|
11
|
|
N/A
|
|
N/A
|
|
||||
Technology and content expense includes product development and content expense, as well as information technology costs to support our infrastructure, back-office applications and overall monitoring and security of our networks, and is principally comprised of personnel and overhead, depreciation and amortization of technology assets including hardware, and purchased and internally developed software, and other costs including cloud expense, licensing and maintenance expense and stock-based compensation.
Technology and content expense increased
$152 million
for
2017
compared to
2016
primarily due to increased depreciation and amortization of technology assets of
$83 million
year-over-year. Personnel and overhead costs also increased
$67 million
on higher headcount. Other costs increased
$2 million
year-over-year primarily due to higher licensing and maintenance to support the growth of our technology platforms, partially offset by lower stock-based compensation of $9 million, including the impact of prior year amounts related to the trivago employee stock option plan as described in
NOTE 10 — Stock-Based Awards and Other Equity Instruments
. Cloud expense in technology and content during 2017 was $38 million, compared to $35 million in 2016.
Technology and content expense increased
$405 million
for
2016
compared to
2015
primarily due to increased personnel and overhead costs of
$185 million
to support key technology projects primarily in Brand Expedia Group, the corporate
51
technology function and trivago, as well as the addition of HomeAway personnel and overhead costs. Depreciation and amortization of technology assets also increased
$97 million
year-over-year. Other costs increased
$123 million
year-over-year primarily due to expansion into the cloud computing environment and higher licensing and maintenance to support the growth of our technology platforms as well as higher stock-based compensation of $37 million, including amounts related to the trivago employee stock option plan. Acquisitions added approximately 20% to year-on-year technology and content growth for 2016.
General and Administrative
|
|
Year ended December 31,
|
% Change
|
|||||||||||||||
|
|
2017
|
2016
|
2015
|
2017 vs 2016
|
2016 vs 2015
|
||||||||||||
|
|
($ in millions)
|
|
|
||||||||||||||
|
Personnel and overhead
|
$
|
453
|
|
$
|
411
|
|
$
|
330
|
|
10
|
%
|
24
|
%
|
||||
|
Professional fees and other
|
223
|
|
267
|
|
244
|
|
(17
|
)%
|
10
|
%
|
|||||||
|
Total general and administrative
(1)
|
$
|
676
|
|
$
|
678
|
|
$
|
574
|
|
—
|
%
|
18
|
%
|
||||
|
% of revenue
|
6.7
|
%
|
7.7
|
%
|
8.6
|
%
|
|||||||||||
|
(1) Includes the following eLong amounts:
|
$
|
—
|
|
$
|
—
|
|
$
|
23
|
|
N/A
|
|
N/A
|
|
||||
General and administrative expense consists primarily of personnel-related costs, including our executive leadership, finance, legal and human resource functions as well as fees for external professional services including legal, tax and accounting, and other costs including stock-based compensation.
General and administrative expense decreased
$2 million
in
2017
compared to
2016
primarily related to a decrease in professional fees and other on lower stock-based compensation of $
63 million
year-over-year, resulting from the current year reversal of approximately $41 million of previously recognized stock-based compensation expense related to the departure of our former CEO as well as the absence of certain 2016 stock-based compensation charges related to trivago, partially offset by an increase in professional fees. In addition, personnel and overhead expenses also increased
$42 million
primarily driven by the organic growth of the business.
General and administrative expense increased
$104 million
in 2016 compared to 2015 due primarily to higher personnel and overhead expenses of
$81 million
driven by the organic growth of the business and the inorganic addition of HomeAway and Orbitz. In addition, stock-based compensation increased $28 million year-over-year, which included increases related to trivago as well as in general employee stock-based compensation that were partially offset by the absence of eLong related stock-based compensation in 2016. Acquisitions added approximately 7% of year-on-year general and administrative growth for 2016, which reflects the addition of a full year of expenses for HomeAway and Orbitz, partially offset by higher acquisition-related expenses in 2015.
Amortization and Impairment of Intangible Assets
|
|
Year ended December 31,
|
% Change
|
|||||||||||||||
|
|
2017
|
2016
|
2015
|
2017 vs 2016
|
2016 vs 2015
|
||||||||||||
|
|
($ in millions)
|
|
|
||||||||||||||
|
Amortization of intangible assets
|
$
|
275
|
|
$
|
317
|
|
$
|
156
|
|
(13
|
)%
|
103
|
%
|
||||
|
Impairment of intangible assets
|
—
|
|
35
|
|
7
|
|
N/A
|
|
N/A
|
|
|||||||
Amortization of intangible assets decreased
$42 million
in
2017
compared to
2016
primarily due to the completion of amortization related to certain intangible assets, partially offset by $11 million of amortization related to new business acquisitions in the current year. In
2016
, amortization increased $161 million primarily due to amortization related to new business acquisitions in the prior year, partially offset by the completion of amortization related to certain intangible assets.
In
2016
and
2015
, we recorded impairment losses of
$35 million
and
$7 million
related to indefinite-lived trade names within our Core OTA segment due to changes in estimated future revenues of the related brands.
52
Legal Reserves, Occupancy Tax and Other
|
|
Year ended December 31,
|
% Change
|
||||||||||||||
|
|
2017
|
2016
|
2015
|
2017 vs 2016
|
2016 vs 2015
|
|||||||||||
|
|
($ in millions)
|
|
|
|||||||||||||
|
Legal reserves, occupancy tax and other
|
$
|
25
|
|
$
|
26
|
|
$
|
(105
|
)
|
(4
|
)%
|
N/A
|
||||
Legal reserves, occupancy tax and other consists of increases in our reserves for court decisions and the potential and final settlement of issues related to hotel occupancy taxes, expenses recognized related to monies paid in advance of occupancy and other tax proceedings (“pay-to-play”) as well as certain other legal reserves.
During
2017
, the expense primarily related to changes in our reserve related to hotel occupancy and other taxes.
During
2016
, we recognized approximately $12 million for amounts expected to be paid in advance of litigation related to merchant car rental transactions in connection with Hawaii's general excise tax litigation. The remaining expense in 2016 related to changes in our reserve related to hotel occupancy and other taxes.
During
2015
, we received a refund of prepaid pay-to-play payments of $132 million from the State of Hawaii in connection with the general excise tax litigation. In addition, during
2015
, we recorded a $24 million benefit in legal reserves, occupancy tax and other for the recovery of costs related to occupancy tax litigation matters. These gains were partially offset by charges for changes in our reserve related to hotel occupancy and other taxes.
For additional information, see
NOTE 17 — Commitments and Contingencies
in the notes to the consolidated financial statements.
Restructuring and Related Reorganization Charges
In connection with activities to centralize and optimize certain operations as well as migrate technology platforms in the prior years, primarily related to previously disclosed acquisitions, we recognized
$17 million
,
$56 million
and
$105 million
in restructuring and related reorganization charges during
2017
,
2016
and
2015
. The charges were primarily related to employee severance and benefits, including severance amounts under pre-existing written plans and contracts Orbitz had with its employees and incremental retention compensation for existing employees as well as stock-compensation charges for acceleration of replacement awards pursuant to certain employee agreements. Based on current plans, which are subject to change, and excluding any possible future acquisition integrations, we do not expect to incur material restructuring charges in 2018.
For additional information, see
NOTE 15 — Restructuring and Related Reorganization Charges
in the notes to the consolidated financial statements.
Operating Income
|
|
Year ended December 31,
|
% Change
|
|||||||||||||||
|
|
2017
|
2016
|
2015
|
2017 vs 2016
|
2016 vs 2015
|
||||||||||||
|
|
($ in millions)
|
|
|
||||||||||||||
|
Operating income
|
$
|
625
|
|
$
|
462
|
|
$
|
414
|
|
35
|
%
|
12
|
%
|
||||
|
% of revenue
|
6.2
|
%
|
5.3
|
%
|
6.2
|
%
|
|||||||||||
In
2017
, operating income increased primarily due to growth in revenue and a decrease in most major expense categories as a percentage of revenue, partially offset by growth in sales and marketing as a percentage of revenue in 2017.
In
2016
, operating income increased primarily due to higher growth in revenue and the absence of eLong operating losses, partially offset by increased costs and expenses, including growth in technology and content expense in excess of revenue growth, higher amortization of intangible assets as well as the comparative impact of the 2015 Hawaii pay-to-play gain of $132 million.
Included in our consolidated operating income for 2015 are operating losses for eLong through its disposition date of May 22, 2015 of $86 million.
53
Adjusted EBITDA by Segment
|
Year ended December 31,
|
% Change
|
||||||||||||||||
|
2017
|
2016
|
2015
|
2017 vs 2016
|
2016 vs 2015
|
|||||||||||||
|
($ in millions)
|
|||||||||||||||||
|
Core OTA
|
$
|
2,069
|
|
$
|
1,966
|
|
$
|
1,600
|
|
5
|
%
|
23
|
%
|
||||
|
trivago
|
5
|
|
35
|
|
3
|
|
(84
|
)%
|
N/A
|
|
|||||||
|
HomeAway
|
202
|
|
175
|
|
4
|
|
15
|
%
|
N/A
|
|
|||||||
|
Egencia
|
94
|
|
81
|
|
68
|
|
17
|
%
|
18
|
%
|
|||||||
|
eLong
|
—
|
|
—
|
|
(62
|
)
|
N/A
|
|
N/A
|
|
|||||||
|
Unallocated overhead costs (Corporate)
|
(657
|
)
|
(641
|
)
|
(510
|
)
|
(3
|
)%
|
(26
|
)%
|
|||||||
|
Total Adjusted EBITDA
(1)
|
$
|
1,713
|
|
$
|
1,616
|
|
$
|
1,103
|
|
6
|
%
|
46
|
%
|
||||
______________________________________
(1) Adjusted EBITDA is a non-GAAP measure. See "Definition and Reconciliation of Adjusted EBITDA" below for more information.
Adjusted EBITDA is our primary segment operating metric. See
NOTE 19 — Segment Information
in the notes to the consolidated financial statements for additional information on intersegment transactions, unallocated overhead costs and for a reconciliation of Adjusted EBITDA by segment to net income (loss) attributable to Expedia, Inc. for the periods presented above.
Core OTA Adjusted EBITDA increased
$103 million
and
$366 million
during 2017 and 2016, primarily due to an increase of
$797 million
and
$1.2 billion
in revenue, partially offset by an increase in online marketing expense mostly at Brand Expedia, EAN and Hotels.com, and including an increase in online spend at trivago. The acquisition of Orbitz contributed to $264 million to the increase in Core OTA Adjusted EBITDA for 2016.
trivago Adjusted EBITDA declined
$30 million
during 2017. The deterioration was largely driven by a sudden change in advertising bidding at the end of the second quarter of 2017 resulting in a sharp decline in revenue growth. Marketing spend, in particular pre-committed television spend, could not be adjusted to an optimal level timely enough and resulted in the declining profitability. trivago Adjusted EBITDA increased
$32 million
during 2016, primarily due to an increase of $288 million in revenue driven by continued global expansion and market share gains, including $83 million in intersegment revenue growth from Core OTA. Revenue growth during 2016 was partially offset by higher online and offline marketing expense.
HomeAway Adjusted EBITDA increased
$27 million
during 2017 due to an increase of
$217 million
in revenue, partially offset by higher selling and marketing and technology and content expense. During the current year, HomeAway has continued to invest in offline and online brand marketing to bring more demand to its supply base and in growing its product and technology teams. The increase during 2016 was due to our acquisition of the company in December 2015.
Egencia Adjusted EBITDA increased
$13 million
during 2017 primarily due to an increase in revenue of
$59 million
as a result of adding new corporate clients and room night growth as well as scale efficiencies, partially offset by investments in sales, product and technology. Egencia Adjusted EBITDA increased
$13 million
in 2016 primarily due to the addition of Orbitz for Business.
Unallocated overhead costs increased
$16 million
during 2017 primarily due to higher general and administrative professional fees as well as personnel and overhead costs, partially offset by lower technology and content expense as we lap over an accelerated pace of technology hiring in the prior year. Unallocated overhead costs increased
$131 million
during 2016 primarily due to increased technology and content expense to support key corporate technology projects as well as higher general and administrative personnel and overhead costs. The acquisition of Orbitz contributed $27 million to the increase in unallocated overhead costs for 2016.
54
Interest Income and Expense
|
|
Year ended December 31,
|
% Change
|
|||||||||||||||
|
|
2017
|
2016
|
2015
|
2017 vs 2016
|
2016 vs 2015
|
||||||||||||
|
|
($ in millions)
|
|
|
||||||||||||||
|
Interest income
|
$
|
34
|
|
$
|
20
|
|
$
|
17
|
|
73
|
%
|
18
|
%
|
||||
|
Interest expense
|
(182
|
)
|
(173
|
)
|
(126
|
)
|
5
|
%
|
37
|
%
|
|||||||
Interest income increased in
2017
compared to
2016
primarily due to higher invested balances and to a lesser extent higher rates of return. Interest income increased in
2016
compared to
2015
primarily due to higher rates of return, partially offset by lower invested balances.
Interest expense increased in
2017
compared to
2016
primarily as a result of additional interest on the $1 billion senior unsecured notes issued in September 2017. Interest expense increased in
2016
compared to
2015
primarily as a result of additional interest on the Euro 650 million of senior unsecured notes issued in June 2015 and the $750 million senior unsecured notes issued in December 2015.
As of
December 31, 2017
, our senior unsecured notes indebtedness totaled
$4.2 billion
. As of December 31, 2016 and
2015
, our indebtedness totaled $3.2 billion.
Gain on Sale of Business
On May 22, 2015, we completed the sale of our 62.4% ownership stake in eLong, Inc. for approximately $671 million (or $666 million net of costs to sell and other transaction expenses) to several purchasers, including Ctrip.com International, Ltd. As a result of the sale, we recognized a pre-tax gain of $509 million ($395 million after tax) during 2015 included in gain on sale of business in our consolidated statement of operations.
Other, Net
Other, net is comprised of the following:
|
|
Year ended December 31,
|
||||||||||
|
|
2017
|
2016
|
2015
|
||||||||
|
|
($ in millions)
|
||||||||||
|
Foreign exchange rate gains (losses), net
|
$
|
(46
|
)
|
$
|
(15
|
)
|
$
|
25
|
|
||
|
Non-controlling interest basis adjustment
|
2
|
|
—
|
|
77
|
|
|||||
|
Loss on investments, net
|
(14
|
)
|
(12
|
)
|
—
|
|
|||||
|
Other
|
(3
|
)
|
(5
|
)
|
11
|
|
|||||
|
Total other, net
|
$
|
(61
|
)
|
$
|
(32
|
)
|
$
|
113
|
|
||
Provision for Income Taxes
|
|
Year ended December 31,
|
% Change
|
|||||||||||||||
|
|
2017
|
2016
|
2015
|
2017 vs 2016
|
2016 vs 2015
|
||||||||||||
|
|
($ in millions)
|
|
|
||||||||||||||
|
Provision for income taxes
|
$
|
45
|
|
$
|
15
|
|
$
|
203
|
|
196
|
%
|
(92
|
)%
|
||||
|
Effective tax rate
|
10.9
|
%
|
5.5
|
%
|
21.9
|
%
|
|||||||||||
Our effective tax rate for
2017
was lower than the 35% federal statutory rate due to earnings in foreign jurisdictions outside of the United States, predominately Switzerland, where our statutory income tax rate is lower, as well as excess tax benefits related to share-based payments. The net increase in our effective rate for
2017
compared to
2016
was primarily due to one-time tax benefits in the prior year period including release of a valuation allowance and return to provision true-ups, as well as an increase in losses generated in foreign jurisdictions at tax rates below the 35% federal statutory rate. The effects of the provisional income inclusion for the deemed repatriation transition tax pursuant to the Tax Act were negated by the benefit of the provisional remeasurement of our net deferred tax liability.
The decrease in the effective rate for
2016
compared to
2015
was primarily due to tax benefits from the adoption of new accounting guidance relating to stock-based compensation and the release of valuation allowances in the United Kingdom and Germany on cumulative foreign net operating losses for which it is more likely than not the tax benefit will be realized. As a
55
result of lower pre-tax earnings in 2016, the impacts of these benefits create a significant effect on our effective tax rate.
Our effective tax rate for
2016
was lower than the 35% federal statutory rate due to earnings in foreign jurisdictions outside of the United States as well as the same factors impacting the year-over-year effective tax rate comparison.
Our effective rate for 2015 was lower than the 35% federal statutory rate due to earnings in foreign jurisdictions outside of the United States as well as the sale of eLong, which had a U.S. effective rate of less than 35%.
For additional information including additional information on the impacts of the Tax Act, see
NOTE 11 — Income Taxes
in the notes to the consolidated financial statements.
Definition and Reconciliation of Adjusted EBITDA
We report Adjusted EBITDA as a supplemental measure to U.S. generally accepted accounting principles ("GAAP"). Adjusted EBITDA is among the primary metrics by which management evaluates the performance of the business and on which internal budgets are based. Management believes that investors should have access to the same set of tools that management uses to analyze our results. This non-GAAP measure should be considered in addition to results prepared in accordance with GAAP, but should not be considered a substitute for or superior to GAAP. Adjusted EBITDA has certain limitations in that it does not take into account the impact of certain expenses to our consolidated statements of operations. We endeavor to compensate for the limitation of the non-GAAP measure presented by also providing the most directly comparable GAAP measure and a description of the reconciling items and adjustments to derive the non-GAAP measure. Adjusted EBITDA also excludes certain items related to transactional tax matters, which may ultimately be settled in cash, and we urge investors to review the detailed disclosure regarding these matters included above, in the Legal Proceedings section, as well as the notes to the financial statements. The non-GAAP financial measure used by the Company may be calculated differently from, and therefore may not be comparable to, similarly titled measures used by other companies.
Adjusted EBITDA is defined as net income (loss) attributable to Expedia adjusted for (1) net income (loss) attributable to non-controlling interests; (2) provision for income taxes; (3) total other expenses, net; (4) stock-based compensation expense, including compensation expense related to certain subsidiary equity plans; (5) acquisition-related impacts, including (i) amortization of intangible assets and goodwill and intangible asset impairment, (ii) gains (losses) recognized on changes in the value of contingent consideration arrangements, if any, and (iii) upfront consideration paid to settle employee compensation plans of the acquiree, if any; (6) certain other items, including restructuring; (7) items included in legal reserves, occupancy tax and other; (8) that portion of gains (losses) on revenue hedging activities that are included in other, net that relate to revenue recognized in the period; and (9) depreciation.
The above items are excluded from our Adjusted EBITDA measure because these items are noncash in nature, or because the amount and timing of these items is unpredictable, not driven by core operating results and renders comparisons with prior periods and competitors less meaningful. We believe Adjusted EBITDA is a useful measure for analysts and investors to evaluate our future on-going performance as this measure allows a more meaningful comparison of our performance and projected cash earnings with our historical results from prior periods and to the results of our competitors. Moreover, our management uses this measure internally to evaluate the performance of our business as a whole and our individual business segments. In addition, we believe that by excluding certain items, such as stock-based compensation and acquisition-related impacts, Adjusted EBITDA corresponds more closely to the cash operating income generated from our business and allows investors to gain an understanding of the factors and trends affecting the ongoing cash earnings capabilities of our business, from which capital investments are made and debt is serviced.
56
The reconciliation of net income attributable to Expedia, Inc. to Adjusted EBITDA is as follows:
|
Year ended December 31,
|
|||||||||||
|
2017
|
2016
|
2015
|
|||||||||
|
(In thousands)
|
|||||||||||
|
Net income attributable to Expedia, Inc.
|
$
|
377,964
|
|
$
|
281,848
|
|
$
|
764,465
|
|
||
|
Net loss attributable to non-controlling interests
|
(6,605
|
)
|
(20,563
|
)
|
(41,717
|
)
|
|||||
|
Provision for income taxes
|
45,405
|
|
15,315
|
|
203,214
|
|
|||||
|
Total other expense, net
|
208,374
|
|
185,102
|
|
(512,396
|
)
|
|||||
|
Operating income
|
625,138
|
|
461,702
|
|
413,566
|
|
|||||
|
Gain (loss) on revenue hedges related to revenue recognized
|
6,323
|
|
12,746
|
|
43,597
|
|
|||||
|
Restructuring and related reorganization charges, excluding stock-based compensation
|
16,738
|
|
43,217
|
|
72,122
|
|
|||||
|
Legal reserves, occupancy tax and other
|
25,412
|
|
26,498
|
|
(104,587
|
)
|
|||||
|
Stock-based compensation
|
149,350
|
|
242,417
|
|
178,068
|
|
|||||
|
Amortization of intangible assets
|
275,445
|
|
317,141
|
|
156,458
|
|
|||||
|
Impairment of intangible assets
|
—
|
|
34,890
|
|
7,207
|
|
|||||
|
Depreciation
|
614,099
|
|
477,061
|
|
336,680
|
|
|||||
|
Adjusted EBITDA
|
$
|
1,712,505
|
|
$
|
1,615,672
|
|
$
|
1,103,111
|
|
||
Financial Position, Liquidity and Capital Resources
Our principal sources of liquidity are cash flows generated from operations; our cash and cash equivalents and short-term investment balances, which were
$3.3 billion
and
$1.9 billion
at
December 31, 2017
and
2016
, and our $1.5 billion revolving credit facility, which is essentially untapped. As of December 31, 2017, the total cash and cash equivalents and short-term investments held outside the United States was $1.6 billion ($1.3 billion in wholly-owned foreign subsidiaries and $315 million in majority-owned subsidiaries), for which the amount available to be repatriated is still being determined. We believe any amount repatriated would not incur significant additional taxes. Additionally, we expect to pay minimal taxes for the 2017 mandatory repatriation required by the Tax Act due to the use of our existing net operating loss and tax credit carryforwards.
In September 2017, we privately placed $1 billion of senior unsecured notes that are due in February 2028 and bear interest at 3.8%. In January 2018, we completed an offer to exchange these notes for registered notes having substantially the same financial terms and covenants as the original notes (the unregistered and registered notes collectively, the "3.8% Notes"). The 3.8% Notes were issued at 99.747% of par resulting in a discount, which is being amortized over their life. Interest is payable semi-annually in arrears in February and August of each year, beginning February 15, 2018. We used or expect to use the net proceeds of this offering for general corporate purposes, which may include, but are not limited to, the repayment, prepayment, redemption or repurchase of our indebtedness (including, but not limited to, our 7.456% senior notes due 2018) as well as working capital, capital expenditures and acquisitions.
As of
December 31, 2017
, we maintained a $1.5 billion revolving credit facility with a February 2021 maturity date. The facility contains various restrictive covenants, including a maximum permissible leverage ratio and a minimum permissible interest coverage ratio, and interest payable under the facility is based on the Company’s credit ratings. As of
December 31, 2017
, the maximum permissible leverage ratio and the minimum interest coverage were both 3.25 to 1.00, the applicable interest rate on drawn amounts was LIBOR plus 137.5 basis points and the commitment fee on undrawn amounts was 17.5 basis points.
Our credit ratings are periodically reviewed by rating agencies. As of
December 31, 2017
, Moody’s rating was Ba1 with an outlook of “stable,” S&P’s rating was BBB- with an outlook of “stable” and Fitch’s rating was BBB- with an outlook of “stable.” Changes in our operating results, cash flows, financial position, capital structure, financial policy or capital allocations to share repurchase, dividends, investments and acquisitions could impact the ratings assigned by the various rating agencies. Should our credit ratings be adjusted downward, we may incur higher costs to borrow and/or limited to access to capital markets, which could have a material impact on our financial condition and results of operations.
As of
December 31, 2017
, we were in compliance with the covenants and conditions in our revolving credit facility and outstanding debt, which was comprised of $500 million in registered senior unsecured notes due in August 2018 that bear
57
interest at 7.456% (the “7.456% Notes”), $750 million in registered senior unsecured notes due in August 2020 that bear interest at 5.95% (the “5.95% Notes”), $500 million in registered senior unsecured notes due in August 2024 that bear interest at 4.5% (the “4.5% Notes”), Euro 650 million of registered senior unsecured notes due in June 2022 that bear interest at 2.5% (the "2.5% Notes"), $750 million of registered senior unsecured notes due in February 2026 that bear interest at 5.0% ("the 5.0% Notes") and the 3.8% Notes.
Under the merchant model, we receive cash from travelers at the time of booking and we record these amounts on our consolidated balance sheets as deferred merchant bookings. We pay our airline suppliers related to these merchant model bookings generally within a few weeks after completing the transaction, but we are liable for the full value of such transactions until the flights are completed. For most other merchant bookings, which is primarily our merchant hotel business, we generally pay after the travelers’ use and, in some cases, subsequent billing from the hotel suppliers. Therefore, generally we receive cash from the traveler prior to paying our supplier, and this operating cycle represents a working capital source of cash to us. As long as the merchant hotel business grows, we expect that changes in working capital related to merchant hotel transactions will positively impact operating cash flows. However, we are using both the merchant model and the agency model in many of our markets. If the merchant hotel model declines relative to our other business models that generally consume working capital such as agency hotel, managed corporate travel, advertising or certain Expedia Affiliate Network relationships, or if there are changes to the merchant model, supplier payment terms, or booking patterns that compress the time period between our receipt of cash from travelers and our payment to suppliers, such as with mobile bookings via smartphones, our overall working capital benefits could be reduced, eliminated or even reversed. Our future working capital benefits could also be impacted by HomeAway's continued shift to more of a transactional model from a subscription model.
As our ETP program continues to expand, and depending on relative traveler and supplier adoption rates and customer payment preferences, among other things, the scaling up of ETP has and will continue to negatively impact near term working capital cash balances, cash flow, relative liquidity during the transition, and hotel revenue margins.
Seasonal fluctuations in our merchant hotel bookings affect the timing of our annual cash flows. During the first half of the year, hotel bookings have traditionally exceeded stays, resulting in much higher cash flow related to working capital. During the second half of the year, this pattern reverses and cash flows are typically negative. While we expect the impact of seasonal fluctuations to continue, merchant hotel growth rates, changes to the model or booking patterns, changes in the relative mix of merchant hotel transactions compared with transactions in our working capital consuming businesses, including ETP, as well as the transformation of the HomeAway vacation rental listing business, may counteract or intensify the anticipated seasonal fluctuations.
As of
December 31, 2017
, we had a deficit in our working capital of
$2.3 billion
, compared to a deficit of $2.7 billion as of December 31, 2016. The change in the deficit was primarily due to operating cash flows as well as proceeds from the 3.8% Notes issued in September 2017, partially offset by investing activities, including capital expenditures and cash paid for acquisitions.
We continue to invest in the development and expansion of our operations. Ongoing investments include but are not limited to improvements in infrastructure, which include our servers, networking equipment and software, release improvements to our software code, platform migrations and consolidation and search engine marketing and optimization efforts. In addition, in 2016, we began our expansion into the cloud computing environment. While we expect our cloud computing expenses to increase significantly over the next few years they are expected to result in lower overall capital expenditures related to our data centers over time. Our future capital requirements may include capital needs for acquisitions (including purchases of non-controlling interest), share repurchases, dividend payments or expenditures in support of our business strategy; thus reducing our cash balance and/or increasing our debt. Excluding capital expenditures associated with the build out of our new corporate headquarters, we expect total capital expenditures for 2018 to increase over 2017 spending levels. Our current estimates for the new headquarters total approximately $700 to $900 million, with final estimates contingent on completion of design plans and final determination of completed office space required in the initial build out. Of the total approximately $30 million was spent in 2016 and approximately $70 million in 2017. We plan to make significant progress on our corporate headquarters building in the coming year, spending approximately $230 million in 2018 followed by nearly $450 million in 2019, when we expect to begin to move into the campus.
58
Our cash flows are as follows:
|
|
Year ended December 31,
|
$ Change
|
|||||||||||||||||
|
|
2017
|
2016
|
2015
|
2017 vs 2016
|
2016 vs 2015
|
||||||||||||||
|
|
(In millions)
|
||||||||||||||||||
|
Cash provided by (used in) operations:
|
|||||||||||||||||||
|
Operating activities
|
$
|
1,799
|
|
$
|
1,564
|
|
$
|
1,368
|
|
$
|
235
|
|
$
|
196
|
|
||||
|
Investing activities
|
(1,582
|
)
|
(718
|
)
|
(2,371
|
)
|
(864
|
)
|
1,653
|
|
|||||||||
|
Financing activities
|
688
|
|
(691
|
)
|
1,404
|
|
1,379
|
|
(2,095
|
)
|
|||||||||
|
Effect of foreign exchange rate changes on cash and cash equivalents
|
146
|
|
(35
|
)
|
(127
|
)
|
181
|
|
92
|
|
|||||||||
In
2017
, net cash provided by operating activities increased by
$235 million
primarily due to increased benefits from working capital changes driven mostly from a change in deferred merchant bookings. In 2016, net cash provided by operating activities increased by $196 million primarily due to higher operating income after adjusting for impacts of depreciation and amortization, partially offset by a decrease in benefits from working capital adjustments and a net refund of hotel occupancy and other taxes in 2015.
In
2017
, cash used in investing activities increased by
$864 million
due to net purchase of investments of $715 million in the current year compared to cash provided by net sales of investments of $16 million in the prior year and an increase of cash used for acquisitions of $170 million in 2017. These increases were partially offset by $6 million cash inflow in the 2017 due to the net settlement of foreign currency forwards compared to $53 million cash outflow in 2016 as well as lower capital expenditures of $39 million in the current year. In 2016, cash used in investing activities decreased by $1.7 billion primarily due to a decrease of cash used for acquisitions of $2.1 billion, partially offset by a decrease in net proceeds related to the sale of eLong of $457 million in 2015.
Cash provided by financing activities in
2017
primarily included
$990 million
of net proceeds from the issuance of 3.8% Notes in September 2017 as well as
$229 million
of proceeds from the exercise of options and employee stock purchase plans, partially offset by cash paid to acquire shares of
$312 million
, including the repurchased shares under the authorizations discussed below, and a
$176 million
cash dividend payment. Cash used in financing activities in 2016 primarily included cash paid to acquire shares of $456 million, the repayment of $401 million of HomeAway Convertible Notes and $150 million cash dividend payment, partially offset by $215 million of net proceeds from the initial public offering of trivago as well as $141 million of proceeds from the exercise of options and employee stock purchase plans. Cash provided by financing activities in 2015 primarily included $700 million of net proceeds from the issuance of 2.5% Notes in June 2015, $741 million in net proceeds from the issuance of the 5.0% Notes in December 2015, $120 million of proceeds from the exercise of options and employee stock purchase plans as well as the issuance of treasury stock, and $91 million in excess tax benefit on equity awards, of which approximately $47 million related to the excess tax benefit associated with the stock options exercised by our Chairman and Senior Executive. These financing inflows were offset in part by $85 million of withholding taxes for stock option exercises paid on behalf of our Chairman and Senior Executive in exchange for surrendering a portion of his vested shares, which were concurrently cancelled, as well as cash paid to acquire shares of $61 million primarily under the repurchase authorizations discussed below, and $109 million cash dividend payments.
During 2012, 2010, and 2006, our Board of Directors, or the Executive Committee, acting on behalf of the Board of Directors, authorized a repurchase of up to 20 million outstanding shares of our common stock during each of the respective years and during 2015 authorized a repurchase of up to 10 million shares of our common stock for a total of 70 million shares. Shares repurchased under the authorized programs were as follows:
|
|
Year ended December 31,
|
||||||||||
|
|
2017
|
2016
|
2015
|
||||||||
|
Number of shares repurchased
|
2.3 million
|
|
4.0 million
|
|
0.5 million
|
|
|||||
|
Average price per share
|
$
|
127.04
|
|
$
|
109.64
|
|
$
|
85.27
|
|
||
|
Total cost of repurchases (in millions)
(1)
|
$
|
294
|
|
$
|
436
|
|
$
|
45
|
|
||
|
(1)
|
Amount excludes transaction costs.
|
As of
December 31, 2017
,
4.9 million
shares remain authorized for repurchase under the 2015 authorization with no fixed termination date for the repurchases.
59
Our common stock dividend was
$1.16
per share for
2017
,
$1.00
per share for
2016
and
$0.84
per share for
2015
. See
NOTE 13 — Stockholders’ Equity
in the notes to consolidated financial statements for a detail of the quarterly dividend payments by year. In addition, in February 2018, the Executive Committee, acting on behalf of the Board of Directors, declared a quarterly cash dividend of
$0.30
per share of outstanding common stock payable on
March 28, 2018
to the stockholders of record as of the close of business on
March 8, 2018
. Future declarations of dividends are subject to final determination by our Board of Directors.
The effect of foreign exchange on our cash balances denominated in foreign currency in
2017
showed a net change of
$181 million
reflecting net appreciations in foreign currencies in
2017
compared to net depreciations in
2016
. The effect of foreign exchange on our cash balances denominated in foreign currency in 2016 showed a net change of $92 million reflecting lower depreciations in foreign currencies in 2016 compared to 2015.
In our opinion, available cash, funds from operations and available borrowings will provide sufficient capital resources to meet our foreseeable liquidity needs. There can be no assurance, however, that the cost of availability of future borrowings, including refinancing, if any, will be available on terms acceptable to us.
Contractual Obligations and Commercial Commitments
The following table presents our material contractual obligations and commercial commitments as of
December 31, 2017
:
|
|
|
By Period
|
|||||||||||||||||
|
|
Total
|
Less than
1 year
|
1 to 3 years
|
3 to 5 years
|
More than
5 years
|
||||||||||||||
|
|
(In millions)
|
||||||||||||||||||
|
Senior notes debt
(1)
|
$
|
5,462
|
|
$
|
699
|
|
$
|
1,074
|
|
$
|
1,015
|
|
$
|
2,674
|
|
||||
|
Operating leases
(2)
|
850
|
|
139
|
|
225
|
|
152
|
|
334
|
|
|||||||||
|
Purchase obligations
(3)
|
410
|
|
257
|
|
153
|
|
—
|
|
—
|
|
|||||||||
|
Guarantees
(4)
|
135
|
|
120
|
|
15
|
|
—
|
|
—
|
|
|||||||||
|
Letters of credit
(4)
|
42
|
|
26
|
|
11
|
|
—
|
|
5
|
|
|||||||||
|
Total
(5)
|
$
|
6,899
|
|
$
|
1,241
|
|
$
|
1,478
|
|
$
|
1,167
|
|
$
|
3,013
|
|
||||
____________________
|
(1)
|
Our 7.456% Notes, 5.95% Notes, 2.5% Notes, 4.5% Notes, 5.0% and 3.8% Notes include interest payments through maturity in 2018, 2020, 2022, 2024, 2026 and 2028 respectively, based on the stated fixed rates. For the 2.5% Notes, the
December 31, 2017
Euro exchange rate was used to convert the Euro 650 million to U.S. Dollars and calculate the related U.S. Dollar interest payments.
|
|
(2)
|
The operating leases are for office space and related office equipment. We account for these leases on a monthly basis. Certain leases contain periodic rent escalation adjustments and renewal options. Operating lease obligations expire at various dates with the latest maturity in
2031
.
|
|
(3)
|
Our purchase obligations represent the minimum obligations we have under agreements with certain of our vendors and marketing partners. These minimum obligations are less than our projected use for those periods. Payments may be more than the minimum obligations based on actual use.
|
|
(4)
|
Guarantees and LOCs are commitments that represent funding responsibilities that may require our performance in the event of third-party demands or contingent events. We use our stand-by LOCs primarily for certain regulatory purposes as well as to secure payment for hotel room transactions to particular hotel properties. Of the outstanding balance of our stand-by LOCs,
$14 million
directly reduces the amount available to us from our revolving credit facility. The LOC amounts in the above table represent the amount of commitment expiration per period. In addition, we provide a guarantee to the aviation authorities of certain foreign countries to protect against potential non-delivery of our packaged travel services sold within those countries. These countries hold all travel agents and tour companies to the same standard. Our guarantees also include bonds relating to tax assessments that we are contesting and certain surety bonds related to various company performance obligations.
|
|
(5)
|
Excludes $160 million of net unrecognized tax benefits for which we cannot make a reasonably reliable estimate of the amount and period of payment.
|
Other than the items described above, we do not have any off-balance sheet arrangements as of
December 31, 2017
.
Certain Relationships and Related Party Transactions
For a discussion of certain relationships and related party transactions, see
NOTE 18 — Related Party Transactions
in the notes to the consolidated financial statements.
60
Market Risk Management
Market risk is the potential loss from adverse changes in interest rates, foreign exchange rates and market prices. Our exposure to market risk includes our long-term debt, our revolving credit facility, derivative instruments and cash and cash equivalents, accounts receivable, intercompany receivables, investments, merchant accounts payable and deferred merchant bookings denominated in foreign currencies. We manage our exposure to these risks through established policies and procedures. Our objective is to mitigate potential income statement, cash flow and market exposures from changes in interest and foreign exchange rates.
Interest Rate Risk
In August 2006, we issued $500 million senior unsecured notes with a fixed rate of 7.456%. In August 2010, we issued $750 million senior unsecured notes with a fixed rate of 5.95%. In August 2014, we issued $500 million senior unsecured notes with a fixed rate of 4.5%. In June 2015, we issued Euro 650 million of senior unsecured notes with a fixed rate of 2.5%. (See “Foreign Exchange Risk” below for further discussion or our 2.5% Notes.) In December 2015, we issued $750 million of senior unsecured notes with a fixed rate of 5.0%. In September 2017, we issued $1 billion of senior unsecured notes with a fixed rate of 3.8%. As a result, if market interest rates decline, our required payments will exceed those based on market rates. The fair values of our 7.456% Notes, 5.95% Notes, 2.5% Notes, 4.5% Notes, 5.0% Notes and 3.8% Notes were approximately
$516 million
,
$810 million
,
$828 million
,
$528 million
,
$807 million
and
$969 million
as of
December 31, 2017
as calculated based on quoted market prices in less active markets at year end. A 50 basis point increase or decrease in interest rates would decrease or increase the fair value of our 7.456% Notes by approximately $2 million, our 5.95% Notes by approximately $10 million, our 2.5% Notes by approximately $17 million, our 4.5% Notes by approximately $15 million, our 5.0% Notes by approximately $27 million and our 3.8% Notes by approximately $41 million.
We maintain a $1.5 billion revolving credit facility, which bears interest based on market rates plus a spread determined by our credit ratings. Because our interest rate is tied to a market rate, we will be susceptible to fluctuations in interest rates if, consistent with our practice to date, we do not hedge the interest rate exposure arising from any borrowings under our revolving credit facility. As of
December 31, 2017
and
2016
, we had no revolving credit facility borrowings outstanding.
We did not experience any significant impact from changes in interest rates for the years ended
December 31, 2017
,
2016
or
2015
.
Foreign Exchange Risk
We conduct business in certain international markets, primarily in Australia, Canada, China and the European Union. Because we operate in international markets, we have exposure to different economic climates, political arenas, tax systems and regulations that could affect foreign exchange rates. Our primary exposure to foreign currency risk relates to transacting in foreign currency and recording the activity in U.S. dollars. Changes in exchange rates between the U.S. dollar and these other currencies will result in transaction gains or losses, which we recognize in our consolidated statements of operations.
To the extent practicable, we minimize our foreign currency exposures by maintaining natural hedges between our current assets and current liabilities in similarly denominated foreign currencies. Additionally, we use foreign currency forward contracts to economically hedge certain merchant revenue exposures, foreign denominated liabilities related to certain of our loyalty programs and our other foreign currency-denominated operating liabilities. These instruments are typically short-term and are recorded at fair value with gains and losses recorded in other, net. As of
December 31, 2017
, we had a net forward asset of
$6 million
included in prepaid expenses and other current assets As of December 31,
2016
, we had a net forward liability of
$4 million
included in accrued expenses and other current liabilities. We may enter into additional foreign exchange derivative contracts or other economic hedges in the future. Our goal in managing our foreign exchange risk is to reduce to the extent practicable our potential exposure to the changes that exchange rates might have on our earnings, cash flows and financial position. We make a number of estimates in conducting hedging activities including in some cases the level of future bookings, cancellations, refunds, customer stay patterns and payments in foreign currencies. In the event those estimates differ significantly from actual results, we could experience greater volatility as a result of our hedges.
In June 2015, we issued Euro 650 million of registered senior unsecured notes that are due in June 2022 and bear interest at 2.5%. The aggregate principal value of the 2.5% Notes is designated as a hedge of our net investment in certain Euro functional currency subsidiaries. The notes are measured at Euro to U.S. Dollar exchange rates at each balance sheet date and transaction gains or losses due to changes in rates are recorded in accumulated other comprehensive income (loss). The Euro-denominated net assets of these subsidiaries are translated into U.S. Dollars at each balance sheet date, with effects of foreign currency changes also reported in accumulated other comprehensive income (loss). Since the notional amount of the recorded
61
Euro-denominated debt is less than the notional amount of our net investment, we do not expect to incur any ineffectiveness on this hedge.
Future net transaction gains and losses are inherently difficult to predict as they are reliant on how the multiple currencies in which we transact fluctuate in relation to the U.S. dollar, the relative composition and denomination of current assets and liabilities each period, and our effectiveness at forecasting and managing, through balance sheet netting or the use of derivative contracts, such exposures. As an example, if the foreign currencies in which we hold net asset balances were to all weaken 10% against the U.S. dollar and foreign currencies in which we hold net liability balances were to all strengthen 10% against the U.S. dollar, we would recognize foreign exchange losses of approximately $26 million based on our foreign currency forward positions (including the impact of forward positions economically hedging our merchant revenue exposures) and the net asset or liability balances of our foreign denominated cash and cash equivalents, accounts receivable, deferred merchant bookings and merchant accounts payable balances as of
December 31, 2017
. As the net composition of these balances fluctuate frequently, even daily, as do foreign exchange rates, the example loss could be compounded or reduced significantly within a given period.
During
2017
,
2016
and
2015
, we recorded net foreign exchange rate losses of approximately $46 million ($40 million loss excluding the contracts economically hedging our forecasted merchant revenue), net foreign exchange rate losses of approximately $15 million ($30 million loss excluding the contracts economically hedging our forecasted merchant revenue) and net foreign exchange rate gains of approximately $25 million ($15 million loss excluding the contracts economically hedging our forecasted merchant revenue). As we increase our operations in international markets, our exposure to fluctuations in foreign currency exchange rates increases. The economic impact to us of foreign currency exchange rate movements is linked to variability in real growth, inflation, interest rates, governmental actions and other factors. These changes, if material, could cause us to adjust our financing and operating strategies.
The Consolidated Financial Statements and Schedule listed in the Index to Financial Statements, Schedules and Exhibits on page F-1 are filed as part of this report.
None.
Changes in Internal Control over Financial Reporting.
There were no changes to our internal control over financial reporting that occurred during the quarter ended
December 31, 2017
that have materially affected, or are reasonably likely to materially affect, our internal control over financial reporting.
Evaluation of Disclosure Controls and Procedures.
As required by Rule 13a-15(b) under the Securities Exchange Act of 1934, as amended (the “Exchange Act”), our management, including our Chairman and Senior Executive, Chief Executive Officer and Chief Financial Officer, evaluated the effectiveness of the design and operation of our disclosure controls and procedures (as defined in Rule 13a-15(e) under the Exchange Act). Based upon that evaluation, our Chairman and Senior Executive, Chief Executive Officer and Chief Financial Officer concluded that, as of the end of the period covered by this report, our disclosure controls and procedures were effective.
Management’s Report on Internal Control over Financial Reporting.
Our management is responsible for establishing and maintaining adequate internal control over financial reporting, as defined in Rule 13a-15(f) of the Exchange Act. Internal control over financial reporting is a process to provide reasonable assurance regarding the reliability of our financial reporting for external purposes in accordance with accounting principles generally accepted in the United States of America. Management conducted an evaluation of the effectiveness of our internal control over financial reporting based on the criteria for effective control over financial reporting described in
Internal Control — Integrated Framework
(2013) issued by the Committee of Sponsoring Organizations of the Treadway Commission. Based on this evaluation, management has concluded that, as of
December 31, 2017
, the Company’s internal control over financial reporting was effective. Management has reviewed its assessment with the Audit Committee. Ernst & Young, LLP, an independent registered public accounting firm, has audited the effectiveness of our internal control over financial reporting as of
December 31, 2017
, as stated in their report which is included below.
62
Limitations on Controls.
Management does not expect that our disclosure controls and procedures or our internal control over financial reporting will prevent or detect all error and fraud. Any control system, no matter how well designed and operated, is based upon certain assumptions and can provide only reasonable, not absolute, assurance that its objectives will be met. Further, no evaluation of controls can provide absolute assurance that misstatements due to error or fraud will not occur or that all control issues and instances of fraud, if any, within the Company have been detected.
63
Report of Independent Registered Public Accounting Firm
The Board of Directors and Stockholders
Expedia, Inc.
We have audited Expedia, Inc.’s internal control over financial reporting as of December 31, 2017, based on criteria established in Internal Control - Integrated Framework issued by the Committee of Sponsoring Organizations of the Treadway Commission (2013 framework), (the COSO criteria). Expedia, Inc.’s management is responsible for maintaining effective internal control over financial reporting, and for its assessment of the effectiveness of internal control over financial reporting included in the accompanying Management’s Report on Internal Control over Financial Reporting. Our responsibility is to express an opinion on the Company’s internal control over financial reporting based on our audit.
We conducted our audit in accordance with the standards of the Public Company Accounting Oversight Board (United States). Those standards require that we plan and perform the audit to obtain reasonable assurance about whether effective internal control over financial reporting was maintained in all material respects. Our audit included obtaining an understanding of internal control over financial reporting, assessing the risk that a material weakness exists, testing and evaluating the design and operating effectiveness of internal control based on the assessed risk, and performing such other procedures as we considered necessary in the circumstances. We believe that our audit provides a reasonable basis for our opinion.
A company’s internal control over financial reporting is a process designed to provide reasonable assurance regarding the reliability of financial reporting and the preparation of financial statements for external purposes in accordance with generally accepted accounting principles. A company’s internal control over financial reporting includes those policies and procedures that (1) pertain to the maintenance of records that, in reasonable detail, accurately and fairly reflect the transactions and dispositions of the assets of the company; (2) provide reasonable assurance that transactions are recorded as necessary to permit preparation of financial statements in accordance with generally accepted accounting principles, and that receipts and expenditures of the company are being made only in accordance with authorizations of management and directors of the company; and (3) provide reasonable assurance regarding prevention or timely detection of unauthorized acquisition, use, or disposition of the company’s assets that could have a material effect on the financial statements.
Because of its inherent limitations, internal control over financial reporting may not prevent or detect misstatements. Also, projections of any evaluation of effectiveness to future periods are subject to the risk that controls may become inadequate because of changes in conditions, or that the degree of compliance with the policies or procedures may deteriorate.
In our opinion, Expedia, Inc. maintained, in all material respects, effective internal control over financial reporting as of December 31, 2017, based on the COSO criteria.
We also have audited, in accordance with the standards of the Public Company Accounting Oversight Board (United States), the 2017 consolidated financial statements of Expedia, Inc. and our report dated February 8, 2018 expressed an unqualified opinion thereon.
/s/Ernst & Young LLP
Seattle, Washington
February 8, 2018
64
None.
We are incorporating by reference the information required by Part III of this report on Form 10-K from our proxy statement relating to our 2018 annual meeting of stockholders (the “2018 Proxy Statement”), which will be filed with the Securities and Exchange Commission within 120 days after the end of our fiscal year ended
December 31, 2017
.
The information required by this item is included under the captions “Election of Directors — Nominees,” “Election of Directors — Board Meetings and Committees,” “Information Concerning Executive Officers” and “Section 16(a) Beneficial Ownership Reporting Compliance” in the 2018 Proxy Statement and incorporated herein by reference.
The information required by this item is included under the captions “Election of Directors —Compensation of Non-Employee Directors,” “Election of Directors — Compensation Committee Interlocks and Insider Participation,” “Compensation Discussion and Analysis,” “Compensation Committee Report” and “Executive Compensation” in the 2018 Proxy Statement and incorporated herein by reference.
The information required by this item is included under the captions “Security Ownership of Certain Beneficial Owners and Management” and “Equity Compensation Plan Information” in the 2018 Proxy Statement and incorporated herein by reference.
The information required by this item is included under the captions “Certain Relationships and Related Person Transactions” and “Election of Directors — Board Meetings and Committees” in the 2018 Proxy Statement and incorporated herein by reference.
The information required by this item is included under the caption “Audit Committee Report” in the 2018 Proxy Statement and incorporated herein by reference.
(a)(1)
Consolidated Financial Statements
We have filed the consolidated financial statements listed in the Index to Consolidated Financial Statements, Schedules and Exhibits on page F-1 as a part of this report.
(a)(2)
Financial Statement Schedules
All financial statement schedules have been omitted because they are not applicable, not material or the required information is shown in the consolidated financial statements or the notes thereto.
(a)(3)
Exhibits
The exhibits listed below are filed as part of this Annual Report on Form 10-K.
|
Exhibit
No.
|
Filed
Herewith
|
Incorporated by Reference
|
||||||||||
|
Exhibit Description
|
Form
|
SEC File No.
|
Exhibit
|
Filing Date
|
||||||||
|
1.1
|
8-K
|
000-51447
|
1.1
|
6/3/2015
|
||||||||
65
|
2.1
|
8-K
|
000-51447
|
2.1
|
12/21/2012
|
||||||||
|
2.2
|
8-K
|
000-51447
|
2.2
|
12/21/2012
|
||||||||
|
2.3
|
8-K
|
000-51447
|
10.1
|
4/2/2015
|
||||||||
|
2.4
|
8-K
|
000-51447
|
10.2
|
4/2/2015
|
||||||||
|
2.5
|
8-K
|
000-51447
|
2.1
|
5/22/2015
|
||||||||
|
3.1
|
8-K
|
000-51447
|
3.1
|
12/27/2011
|
||||||||
|
3.2
|
8-K
|
000-51447
|
3.3
|
8/15/2005
|
||||||||
|
4.1
|
10-Q
|
000-51447
|
4.1
|
11/14/2006
|
||||||||
|
4.2
|
S-4
|
333-140195
|
4.2
|
1/25/2007
|
||||||||
|
4.3
|
8-K
|
000-51447
|
4.1
|
8/10/2010
|
||||||||
|
4.4
|
8-K
|
001-37429
|
4.1
|
10/3/2016
|
||||||||
|
4.5
|
8-K
|
000-51447
|
4.1
|
8/18/2014
|
||||||||
|
4.6
|
8-K
|
000-51447
|
4.2
|
8/18/2014
|
||||||||
|
4.7
|
8-K
|
000-51447
|
4.2
|
6/3/2015
|
||||||||
66
|
4.8
|
8-K
|
001-37429
|
4.1
|
12/8/2015
|
||||||||
|
4.9
|
8-K
|
001-37429
|
4.1
|
9/21/2017
|
||||||||
|
10.1
|
8-K
|
000-51447
|
10.1
|
12/27/2011
|
||||||||
|
10.2
|
8-K*†
|
001-37938
|
10.6
|
11/7/2016
|
||||||||
|
10.3
|
10-K
|
000-51447
|
10.11
|
2/10/2012
|
||||||||
|
10.4
|
8-K*†
|
001-37938
|
10.7
|
11/7/2016
|
||||||||
|
10.5
|
8-K*†
|
001-37938
|
10.8
|
11/7/2016
|
||||||||
|
10.6
|
S-4/A*†
|
333-210377
|
10.13
|
9/23/2016
|
||||||||
|
10.7
|
8-K*†
|
001-37938
|
10.10
|
11/7/2016
|
||||||||
|
10.8
|
8-K
|
000-51447
|
10.2
|
12/27/2011
|
||||||||
|
10.9
|
10-Q
|
001-37429
|
10.1
|
7/28/2017
|
||||||||
|
10.10
|
8-K
|
000-51447
|
10.1
|
9/11/2014
|
||||||||
|
10.11
|
8-K
|
001-37429
|
10.1
|
2/8/2016
|
||||||||
67
|
10.12
|
10-K
|
001-37429
|
10.14
|
2/10/2017
|
||||||||
|
10.13
|
10-Q
|
000-51447
|
10.1
|
8/3/2007
|
||||||||
|
10.14*
|
DEF 14A
|
001-37429
|
App. A
|
8/23/2016
|
||||||||
|
10.15*
|
S-8
|
333-206990
|
99.1
|
9/17/2015
|
||||||||
|
10.16*
|
S-8
|
333-208548
|
99.10
|
12/15/2015
|
||||||||
|
10.17*
|
DEF14A
|
000-51447
|
App. B
|
4/30/2013
|
||||||||
|
10.18*
|
DEF 14A
|
000-51447
|
App. C
|
4/30/2013
|
||||||||
|
10.19*
|
10-Q
|
000-51447
|
10.1
|
8/1/2014
|
||||||||
|
10.20*
|
10-K
|
001-37429
|
10.22
|
2/10/2017
|
||||||||
|
10.21*
|
10-K
|
001-37429
|
10.23
|
2/10/2017
|
||||||||
|
10.22*
|
10-K
|
000-51447
|
10.13
|
2/19/2009
|
||||||||
|
10.23*
|
10-K
|
000-51447
|
10.17
|
2/19/2009
|
||||||||
|
10.24*
|
10-K
|
000-51447
|
10.20
|
2/6/2015
|
||||||||
|
10.25*
|
8-K/A
|
001-37429
|
10.1
|
9/21/2017
|
||||||||
|
10.26*
|
8-K
|
001-37429
|
10.2
|
3/9/2016
|
||||||||
|
10.27*
|
8-K
|
001-37429
|
10.3
|
3/9/2016
|
||||||||
|
10.28*
|
8-K/A
|
001-37429
|
10.2
|
9/21/2017
|
||||||||
|
10.29*
|
8-K/A
|
001-37429
|
10.3
|
9/21/2017
|
||||||||
|
10.30*
|
8-K
|
000-51447
|
10.1
|
3/4/2015
|
||||||||
|
10.31*
|
8-K/A
|
001-37429
|
10.4
|
9/21/2017
|
||||||||
|
10.32*
|
8-K
|
000-51447
|
10.3
|
4/1/2015
|
||||||||
|
21
|
X
|
|||||||||||
|
23.1
|
X
|
|||||||||||
68
|
31.1
|
X
|
|||||||||||
|
31.2
|
X
|
|||||||||||
|
31.3
|
X
|
|||||||||||
|
32.1***
|
||||||||||||
|
32.2***
|
||||||||||||
|
32.3***
|
||||||||||||
|
101
|
The following financial statements from the Company’s Annual Report on Form 10-K for the year ended December 31, 2017, formatted in XBRL: (i) Consolidated Statements of Operations, (ii) Consolidated Statements of Comprehensive Income, (iii) Consolidated Balance Sheets, (iv) Consolidated Statements of Changes in Stockholders’ Equity, (v) Consolidated Statements of Cash Flows, and (vi) Notes to Consolidated Financial Statements.
|
X
|
||||||||||
|
*
|
Indicates a management contract or compensatory plan or arrangement.
|
|
*†
|
Indicates reference to filing of Liberty Expedia Holdings, Inc.
|
|
***
|
Furnished herewith
|
69
Signatures
Pursuant to the requirements of the Section 13 or 15(d) Securities Exchange Act of 1934, the Registrant has duly caused this report to be signed on its behalf by the undersigned hereunto duly authorized.
|
Expedia, Inc.
|
||
|
By:
|
/s/ MARK D. OKERSTROM
|
|
|
|
Mark D. Okerstrom
Chief Executive Officer
|
|
February 8, 2018
Pursuant to the requirements of the Securities Exchange Act of 1934, this report has been signed below by the following persons on behalf of the Registrant and in the capacities indicated on
February 8, 2018
.
|
Signature
|
|
Title
|
|
/s/ MARK D. OKERSTROM
|
|
Chief Executive Officer, President and Director
|
|
Mark D. Okerstrom
|
|
(Principal Executive Officer)
|
|
/s/ ALAN PICKERILL
|
|
Chief Financial Officer
|
|
Alan Pickerill
|
|
(Principal Financial Officer)
|
|
/s/ LANCE A. SOLIDAY
|
|
Chief Accounting Officer and Controller
|
|
Lance A. Soliday
|
|
(Principal Accounting Officer)
|
|
/s/ BARRY DILLER
|
|
Director (Chairman of the Board)
|
|
Barry Diller
|
|
|
|
/s/ VICTOR A. KAUFMAN
|
|
Director (Vice Chairman)
|
|
Victor A. Kaufman
|
|
|
|
/s/ SUSAN C. ATHEY
|
|
Director
|
|
Susan C. Athey
|
|
|
|
/s/ A. GEORGE BATTLE
|
|
Director
|
|
A. George Battle
|
|
|
|
/s/ COURTNEE A. CHUN
|
Director
|
|
|
Courtnee A. Chun
|
||
|
/s/ CHELSEA CLINTON
|
Director
|
|
|
Chelsea Clinton
|
||
|
/s/ PAMELA L. COE
|
|
Director
|
|
Pamela L. Coe
|
|
|
|
/s/ JONATHAN L. DOLGEN
|
|
Director
|
|
Jonathan L. Dolgen
|
|
|
|
/s/ CRAIG A. JACOBSON
|
|
Director
|
|
Craig A. Jacobson
|
|
|
|
/s/ PETER M. KERN
|
Director
|
|
|
Peter M. Kern
|
||
|
/s/ DARA KHOSROWSHAHI
|
|
Director
|
|
Dara Khosrowshahi
|
|
|
|
/s/ SCOTT RUDIN
|
|
Director
|
|
Scott Rudin
|
|
|
|
/s/ CHRISTOPHER W. SHEAN
|
|
Director
|
|
Christopher W. Shean
|
|
|
|
/s/ ALEXANDER VON FURSTENBERG
|
|
Director
|
|
Alexander von Furstenberg
|
|
|
70
INDEX TO CONSOLIDATED FINANCIAL STATEMENTS, SCHEDULES AND EXHIBITS
F- 1
Report of Independent Registered Public Accounting Firm
The Board of Directors and Stockholders
Expedia, Inc.
Opinion on the Financial Statements
We have audited the accompanying consolidated balance sheets of Expedia, Inc. (the Company) as of December 31, 2017 and 2016, and the related consolidated statements of operations, comprehensive income, changes in stockholders' equity and cash flows for each of the three years in the period ended December 31, 2017, and the related notes (collectively referred to as the “financial statements”). In our opinion, the financial statements present fairly, in all material respects, the consolidated financial position of the Company at December 31, 2017 and 2016, and the consolidated results of its operations and its cash flows for each of the three years in the period ended December 31, 2017, in conformity with U.S. generally accepted accounting principles.
We also have audited, in accordance with the standards of the Public Company Accounting Oversight Board (United States) (PCAOB), the Company's internal control over financial reporting as of December 31, 2017, based on criteria established in Internal Control-Integrated Framework issued by the Committee of Sponsoring Organizations of the Treadway Commission (2013 framework), and our report dated February 8, 2018 expressed an unqualified opinion thereon.
Basis for Opinion
These financial statements are the responsibility of the Company's management. Our responsibility is to express an opinion on the Company’s financial statements based on our audits. We are a public accounting firm registered with the PCAOB and are required to be independent with respect to the Company in accordance with the U.S. federal securities laws and the applicable rules and regulations of the Securities and Exchange Commission and the PCAOB.
We conducted our audits in accordance with the standards of the PCAOB. Those standards require that we plan and perform the audit to obtain reasonable assurance about whether the financial statements are free of material misstatement, whether due to error or fraud. Our audits included performing procedures to assess the risks of material misstatement of the financial statements, whether due to error or fraud, and performing procedures that respond to those risks. Such procedures included examining, on a test basis, evidence regarding the amounts and disclosures in the financial statements. Our audits also included evaluating the accounting principles used and significant estimates made by management, as well as evaluating the overall presentation of the financial statements. We believe that our audits provide a reasonable basis for our opinion.
/s/ Ernst & Young LLP
We have served as the Company’s auditor since 2004.
Seattle, Washington
February 8, 2018
F- 2
Consolidated Financial Statements
EXPEDIA, INC.
|
|
Year ended December 31,
|
||||||||||
|
|
2017
|
2016
|
2015
|
||||||||
|
|
(In thousands, except for per share data)
|
||||||||||
|
Revenue
|
$
|
10,059,844
|
|
$
|
8,773,564
|
|
$
|
6,672,317
|
|
||
|
Costs and expenses:
|
|||||||||||
|
Cost of revenue
(1)
|
1,756,531
|
|
1,596,698
|
|
1,309,559
|
|
|||||
|
Selling and marketing
(1)
|
5,297,832
|
|
4,367,417
|
|
3,381,086
|
|
|||||
|
Technology and content
(1)
|
1,386,787
|
|
1,235,019
|
|
830,244
|
|
|||||
|
General and administrative
(1)
|
675,961
|
|
678,292
|
|
573,913
|
|
|||||
|
Amortization of intangible assets
|
275,445
|
|
317,141
|
|
156,458
|
|
|||||
|
Impairment of intangible assets
|
—
|
|
34,890
|
|
7,207
|
|
|||||
|
Legal reserves, occupancy tax and other
|
25,412
|
|
26,498
|
|
(104,587
|
)
|
|||||
|
Restructuring and related reorganization charges
(1)
|
16,738
|
|
55,907
|
|
104,871
|
|
|||||
|
Operating income
|
625,138
|
|
461,702
|
|
413,566
|
|
|||||
|
Other income (expense):
|
|||||||||||
|
Interest income
|
34,137
|
|
19,726
|
|
16,695
|
|
|||||
|
Interest expense
|
(181,712
|
)
|
(173,148
|
)
|
(126,195
|
)
|
|||||
|
Gain on sale of business
|
—
|
|
—
|
|
508,810
|
|
|||||
|
Other, net
|
(60,799
|
)
|
(31,680
|
)
|
113,086
|
|
|||||
|
Total other income (expense), net
|
(208,374
|
)
|
(185,102
|
)
|
512,396
|
|
|||||
|
Income before income taxes
|
416,764
|
|
276,600
|
|
925,962
|
|
|||||
|
Provision for income taxes
|
(45,405
|
)
|
(15,315
|
)
|
(203,214
|
)
|
|||||
|
Net income
|
371,359
|
|
261,285
|
|
722,748
|
|
|||||
|
Net loss attributable to non-controlling interests
|
6,605
|
|
20,563
|
|
41,717
|
|
|||||
|
Net income attributable to Expedia, Inc.
|
$
|
377,964
|
|
$
|
281,848
|
|
$
|
764,465
|
|
||
|
Earnings per share attributable to Expedia, Inc. available to common stockholders:
|
|||||||||||
|
Basic
|
$
|
2.49
|
|
$
|
1.87
|
|
$
|
5.87
|
|
||
|
Diluted
|
2.42
|
|
1.82
|
|
5.70
|
|
|||||
|
Shares used in computing earnings per share:
|
|||||||||||
|
Basic
|
151,619
|
|
150,367
|
|
130,159
|
|
|||||
|
Diluted
|
156,385
|
|
154,517
|
|
134,018
|
|
|||||
|
Dividends declared per common share
|
$
|
1.16
|
|
$
|
1.00
|
|
$
|
0.84
|
|
||
|
(1) Includes stock-based compensation as follows:
|
|||||||||||
|
Cost of revenue
|
$
|
10,173
|
|
$
|
11,388
|
|
$
|
5,307
|
|
||
|
Selling and marketing
|
39,855
|
|
46,654
|
|
33,164
|
|
|||||
|
Technology and content
|
54,633
|
|
63,536
|
|
26,766
|
|
|||||
|
General and administrative
|
44,689
|
|
108,149
|
|
80,082
|
|
|||||
|
Restructuring and related reorganization charges
|
—
|
|
12,690
|
|
32,749
|
|
|||||
See notes to consolidated financial statements.
F- 3
EXPEDIA, INC.
CONSOLIDATED STATEMENTS OF COMPREHENSIVE INCOME
|
|
Year ended December 31,
|
||||||||||
|
|
2017
|
2016
|
2015
|
||||||||
|
|
(In thousands)
|
||||||||||
|
Net income
|
$
|
371,359
|
|
$
|
261,285
|
|
$
|
722,748
|
|
||
|
Other comprehensive income (loss), net of tax
|
|||||||||||
|
Currency translation adjustments, net of taxes
|
189,580
|
|
(10,217
|
)
|
(147,815
|
)
|
|||||
|
Net reclassification of foreign currency translation adjustments into total other income (expenses), net
|
—
|
|
—
|
|
(43,183
|
)
|
|||||
|
Unrealized gains (losses) on available for sale securities, net of taxes
|
(6,705
|
)
|
154
|
|
(67
|
)
|
|||||
|
Other comprehensive income (loss), net of tax
|
182,875
|
|
(10,063
|
)
|
(191,065
|
)
|
|||||
|
Comprehensive income
|
554,234
|
|
251,222
|
|
531,683
|
|
|||||
|
Less: Comprehensive income (loss) attributable to non-controlling interests
|
44,804
|
|
(29,075
|
)
|
(86,662
|
)
|
|||||
|
Comprehensive income attributable to Expedia, Inc.
|
$
|
509,430
|
|
$
|
280,297
|
|
$
|
618,345
|
|
||
See notes to consolidated financial statements.
F- 4
EXPEDIA, INC.
|
|
December 31,
|
||||||
|
|
2017
|
2016
|
|||||
|
|
(In thousands, except per share data)
|
||||||
|
ASSETS
|
|||||||
|
Current assets:
|
|||||||
|
Cash and cash equivalents
|
$
|
2,846,729
|
|
$
|
1,796,811
|
|
|
|
Restricted cash and cash equivalents
|
69,055
|
|
18,733
|
|
|||
|
Short-term investments
|
468,508
|
|
72,313
|
|
|||
|
Accounts receivable, net of allowance of $30,696 and $25,278
|
1,865,995
|
|
1,343,247
|
|
|||
|
Income taxes receivable
|
20,633
|
|
19,402
|
|
|||
|
Prepaid expenses and other current assets
|
268,669
|
|
199,745
|
|
|||
|
Total current assets
|
5,539,589
|
|
3,450,251
|
|
|||
|
Property and equipment, net
|
1,575,258
|
|
1,394,904
|
|
|||
|
Long-term investments and other assets
|
845,450
|
|
520,058
|
|
|||
|
Deferred income taxes
|
17,930
|
|
23,658
|
|
|||
|
Intangible assets, net
|
2,308,536
|
|
2,446,652
|
|
|||
|
Goodwill
|
8,228,865
|
|
7,942,023
|
|
|||
|
TOTAL ASSETS
|
$
|
18,515,628
|
|
$
|
15,777,546
|
|
|
|
LIABILITIES AND STOCKHOLDERS’ EQUITY
|
|||||||
|
Current liabilities:
|
|||||||
|
Accounts payable, merchant
|
$
|
1,837,936
|
|
$
|
1,509,313
|
|
|
|
Accounts payable, other
|
697,560
|
|
577,012
|
|
|||
|
Deferred merchant bookings
|
3,219,279
|
|
2,617,791
|
|
|||
|
Deferred revenue
|
325,722
|
|
282,517
|
|
|||
|
Income taxes payable
|
33,374
|
|
49,739
|
|
|||
|
Accrued expenses and other current liabilities
|
1,264,819
|
|
1,090,826
|
|
|||
|
Current maturities of long-term debt
|
500,000
|
|
—
|
|
|||
|
Total current liabilities
|
7,878,690
|
|
6,127,198
|
|
|||
|
Long-term debt, excluding current maturities
|
3,749,054
|
|
|
3,159,336
|
|
||
|
Deferred income taxes
|
328,602
|
|
484,970
|
|
|||
|
Other long-term liabilities
|
408,380
|
|
312,939
|
|
|||
|
Commitments and contingencies
|
|
|
|||||
|
Redeemable non-controlling interests
|
22,334
|
|
—
|
|
|||
|
Stockholders’ equity:
|
|||||||
|
Common stock $.0001 par value
|
23
|
|
22
|
|
|||
|
Authorized shares: 1,600,000
|
|||||||
|
Shares issued: 228,467 and 224,310
|
|||||||
|
Shares outstanding: 138,939 and 137,232
|
|||||||
|
Class B common stock $.0001 par value
|
1
|
|
1
|
|
|||
|
Authorized shares: 400,000
|
|||||||
|
Shares issued and outstanding: 12,800 and 12,800
|
|||||||
|
Additional paid-in capital
|
9,162,909
|
|
8,794,298
|
|
|||
|
Treasury stock — Common stock, at cost
|
(4,822,743
|
)
|
(4,510,655
|
)
|
|||
|
Shares: 89,528 and 87,077
|
|||||||
|
Retained earnings
|
331,078
|
|
129,034
|
|
|||
|
Accumulated other comprehensive income (loss)
|
(148,933
|
)
|
(280,399
|
)
|
|||
|
Total Expedia, Inc. stockholders’ equity
|
4,522,335
|
|
4,132,301
|
|
|||
|
Non-redeemable non-controlling interests
|
1,606,233
|
|
1,560,802
|
|
|||
|
Total stockholders’ equity
|
6,128,568
|
|
5,693,103
|
|
|||
|
TOTAL LIABILITIES AND STOCKHOLDERS’ EQUITY
|
$
|
18,515,628
|
|
$
|
15,777,546
|
|
|
See notes to consolidated financial statements.
F- 5
EXPEDIA, INC.
CONSOLIDATED STATEMENTS OF CHANGES IN STOCKHOLDERS’ EQUITY
(In thousands, except share data)
|
|
Common stock
|
Class B
common stock
|
Additional
paid-in
capital
|
Treasury stock
|
Retained
earnings
(deficit)
|
Accumulated
other
comprehensive
income (loss)
|
Non-redeemable
non-controlling
interest
|
Total
|
|||||||||||||||||||||||||||||||||
|
|
Shares
|
Amount
|
Shares
|
Amount
|
Shares
|
Amount
|
|||||||||||||||||||||||||||||||||||
|
Balance as of December 31, 2014
|
196,802,236
|
|
$
|
20
|
|
12,799,999
|
|
$
|
1
|
|
$
|
5,921,140
|
|
82,535,396
|
|
$
|
(3,998,120
|
)
|
$
|
—
|
|
$
|
(138,774
|
)
|
$
|
109,462
|
|
$
|
1,893,729
|
|
|||||||||||
|
Net income (excludes $15,417 of net loss attributable to redeemable non-controlling interest)
|
764,465
|
|
(26,300
|
)
|
738,165
|
|
|||||||||||||||||||||||||||||||||||
|
Other comprehensive income (loss), net of taxes
|
(146,120
|
)
|
641
|
|
(145,479
|
)
|
|||||||||||||||||||||||||||||||||||
|
Proceeds from exercise of equity instruments and employee stock purchase plans
|
3,385,749
|
|
—
|
|
96,534
|
|
96,534
|
|
|||||||||||||||||||||||||||||||||
|
Withholding taxes for stock options
|
(85,033
|
)
|
(85,033
|
)
|
|||||||||||||||||||||||||||||||||||||
|
Tax benefits on equity awards
|
89,128
|
|
89,128
|
|
|||||||||||||||||||||||||||||||||||||
|
Issuance of common stock in connection with acquisitions
|
20,195,139
|
|
2
|
|
2,552,340
|
|
2,552,342
|
|
|||||||||||||||||||||||||||||||||
|
Treasury stock activity related to vesting of equity instruments
|
127,712
|
|
(15,763
|
)
|
(15,763
|
)
|
|||||||||||||||||||||||||||||||||||
|
Common stock repurchases
|
525,504
|
|
(44,822
|
)
|
(44,822
|
)
|
|||||||||||||||||||||||||||||||||||
|
Proceeds from issuance of treasury stock
|
18,779
|
|
(264,841
|
)
|
3,796
|
|
22,575
|
|
|||||||||||||||||||||||||||||||||
|
Cash dividends
|
—
|
|
(108,778
|
)
|
(108,778
|
)
|
|||||||||||||||||||||||||||||||||||
|
Adjustment to the fair value of redeemable non-controlling interests
|
(40,558
|
)
|
(148,021
|
)
|
(188,579
|
)
|
|||||||||||||||||||||||||||||||||||
|
Sale of controlling interest in eLong
|
—
|
|
(92,550
|
)
|
(92,550
|
)
|
|||||||||||||||||||||||||||||||||||
|
Acquisition of non-controlling interest
|
—
|
|
64,115
|
|
64,115
|
|
|||||||||||||||||||||||||||||||||||
|
Other changes in ownership of non-controlling interests
|
(4,198
|
)
|
10,005
|
|
5,807
|
|
|||||||||||||||||||||||||||||||||||
|
Stock-based compensation expense
|
147,988
|
|
147,988
|
|
|||||||||||||||||||||||||||||||||||||
|
Other
|
388
|
|
388
|
|
|||||||||||||||||||||||||||||||||||||
|
Balance as of December 31, 2015
|
220,383,124
|
|
22
|
|
12,799,999
|
|
1
|
|
8,696,508
|
|
82,923,771
|
|
(4,054,909
|
)
|
507,666
|
|
(284,894
|
)
|
65,373
|
|
4,929,767
|
|
|||||||||||||||||||
|
Net income (excludes $22,286 of net loss attributable to redeemable non-controlling interest)
|
281,848
|
|
1,723
|
|
283,571
|
|
|||||||||||||||||||||||||||||||||||
|
Other comprehensive income (loss), net of taxes
|
(1,551
|
)
|
—
|
|
(1,551
|
)
|
|||||||||||||||||||||||||||||||||||
|
Proceeds from exercise of equity instruments and employee stock purchase plans
|
3,413,505
|
|
—
|
|
141,043
|
|
141,043
|
|
|||||||||||||||||||||||||||||||||
|
Withholding taxes for stock options
|
(1,282
|
)
|
(1,282
|
)
|
|||||||||||||||||||||||||||||||||||||
|
Issuance of common stock in connection with acquisitions
|
513,140
|
|
—
|
|
—
|
|
—
|
|
|||||||||||||||||||||||||||||||||
|
Treasury stock activity related to vesting of equity instruments
|
174,378
|
|
(19,377
|
)
|
(19,377
|
)
|
|||||||||||||||||||||||||||||||||||
|
Common stock repurchases
|
3,979,170
|
|
(436,369
|
)
|
(436,369
|
)
|
|||||||||||||||||||||||||||||||||||
|
Impact of adoption of new accounting guidance related to stock-based compensation
|
10,048
|
|
(7,037
|
)
|
3,011
|
|
|||||||||||||||||||||||||||||||||||
|
Cash dividends
|
—
|
|
(149,906
|
)
|
(149,906
|
)
|
|||||||||||||||||||||||||||||||||||
|
Adjustment to the fair value of redeemable non-controlling interests
|
(344,064
|
)
|
(503,537
|
)
|
(847,601
|
)
|
|||||||||||||||||||||||||||||||||||
|
Change in ownership of non-controlling interest related to trivago initial public offering ("IPO")
|
(32,141
|
)
|
6,046
|
|
26,095
|
|
—
|
|
|||||||||||||||||||||||||||||||||
|
Transfer from redeemable non-controlling interests
|
—
|
|
1,380,976
|
|
1,380,976
|
|
|||||||||||||||||||||||||||||||||||
F- 6
|
|
Common stock
|
Class B
common stock
|
Additional
paid-in
capital
|
Treasury stock
|
Retained
earnings
(deficit)
|
Accumulated
other
comprehensive
income (loss)
|
Non-redeemable
non-controlling
interest
|
Total
|
|||||||||||||||||||||||||||||||||
|
|
Shares
|
Amount
|
Shares
|
Amount
|
Shares
|
Amount
|
|||||||||||||||||||||||||||||||||||
|
Proceeds related to trivago IPO, net of fees and expenses
|
124,616
|
|
85,287
|
|
209,903
|
|
|||||||||||||||||||||||||||||||||||
|
Other changes in ownership of non-controlling interests
|
—
|
|
274
|
|
274
|
|
|||||||||||||||||||||||||||||||||||
|
Stock-based compensation expense
|
196,358
|
|
196,358
|
|
|||||||||||||||||||||||||||||||||||||
|
Other
|
3,212
|
|
1,074
|
|
4,286
|
|
|||||||||||||||||||||||||||||||||||
|
Balance as of December 31, 2016
|
224,309,769
|
|
$
|
22
|
|
12,799,999
|
|
1
|
|
8,794,298
|
|
87,077,319
|
|
(4,510,655
|
)
|
129,034
|
|
(280,399
|
)
|
1,560,802
|
|
5,693,103
|
|
||||||||||||||||||
|
Net income (excludes $2,535 of net income attributable to redeemable non-controlling interest)
|
377,964
|
|
(9,140
|
)
|
368,824
|
|
|||||||||||||||||||||||||||||||||||
|
Other comprehensive income (loss), net of taxes
|
131,466
|
|
51,409
|
|
182,875
|
|
|||||||||||||||||||||||||||||||||||
|
Proceeds from exercise of equity instruments and employee stock purchase plans
|
3,982,546
|
|
1
|
|
228,188
|
|
228,189
|
|
|||||||||||||||||||||||||||||||||
|
Withholding taxes for stock options
|
(9,063
|
)
|
(9,063
|
)
|
|||||||||||||||||||||||||||||||||||||
|
Issuance of common stock in connection with acquisitions
|
175,040
|
|
—
|
|
—
|
|
—
|
|
|||||||||||||||||||||||||||||||||
|
Treasury stock activity related to vesting of equity instruments
|
133,319
|
|
(17,621
|
)
|
(17,621
|
)
|
|||||||||||||||||||||||||||||||||||
|
Common stock repurchases
|
2,317,617
|
|
(294,467
|
)
|
(294,467
|
)
|
|||||||||||||||||||||||||||||||||||
|
Cash dividends
|
—
|
|
(175,920
|
)
|
|
(175,920
|
)
|
||||||||||||||||||||||||||||||||||
|
Other changes in non-controlling interests
|
2,649
|
|
3,162
|
|
5,811
|
|
|||||||||||||||||||||||||||||||||||
|
Stock-based compensation expense
|
147,843
|
|
147,843
|
|
|||||||||||||||||||||||||||||||||||||
|
Other
|
(1,006
|
)
|
|
(1,006
|
)
|
||||||||||||||||||||||||||||||||||||
|
Balance as of December 31, 2017
|
228,467,355
|
|
$
|
23
|
|
12,799,999
|
|
$
|
1
|
|
$
|
9,162,909
|
|
89,528,255
|
|
$
|
(4,822,743
|
)
|
$
|
331,078
|
|
$
|
(148,933
|
)
|
$
|
1,606,233
|
|
$
|
6,128,568
|
|
|||||||||||
See notes to consolidated financial statements.
F- 7
EXPEDIA, INC.
|
|
December 31,
|
||||||||||
|
|
2017
|
2016
|
2015
|
||||||||
|
|
(In thousands)
|
||||||||||
|
Operating activities:
|
|||||||||||
|
Net income
|
$
|
371,359
|
|
$
|
261,285
|
|
$
|
722,748
|
|
||
|
Adjustments to reconcile net income to net cash provided by operating activities:
|
|||||||||||
|
Depreciation of property and equipment, including internal-use software and website development
|
614,099
|
|
477,061
|
|
336,680
|
|
|||||
|
Amortization of stock-based compensation
|
149,350
|
|
242,417
|
|
178,068
|
|
|||||
|
Amortization of intangible assets
|
275,445
|
|
317,141
|
|
156,458
|
|
|||||
|
Impairment of intangible assets
|
—
|
|
34,890
|
|
7,207
|
|
|||||
|
Deferred income taxes
|
(103,308
|
)
|
(14,088
|
)
|
(21,635
|
)
|
|||||
|
Foreign exchange (gain) loss on cash, cash equivalents and short-term investments, net
|
(78,819
|
)
|
16,253
|
|
88,528
|
|
|||||
|
Realized (gain) loss on foreign currency forwards
|
(6,335
|
)
|
53,089
|
|
(54,226
|
)
|
|||||
|
Gain on sale of business
|
—
|
|
—
|
|
(508,810
|
)
|
|||||
|
Non-controlling interest basis adjustment
|
(1,678
|
)
|
—
|
|
(77,400
|
)
|
|||||
|
Other
|
(13,660
|
)
|
7,555
|
|
15,865
|
|
|||||
|
Changes in operating assets and liabilities, net of effects from acquisitions and disposals:
|
|||||||||||
|
Accounts receivable
|
(455,668
|
)
|
(276,154
|
)
|
(198,262
|
)
|
|||||
|
Prepaid expenses and other assets
|
(116,768
|
)
|
(30,198
|
)
|
97,701
|
|
|||||
|
Accounts payable, merchant
|
315,989
|
|
184,398
|
|
97,248
|
|
|||||
|
Accounts payable, other, accrued expenses and other current liabilities
|
256,728
|
|
79,202
|
|
194,458
|
|
|||||
|
Tax payable/receivable, net
|
(30,577
|
)
|
(100,525
|
)
|
39,776
|
|
|||||
|
Deferred merchant bookings
|
592,912
|
|
261,402
|
|
299,534
|
|
|||||
|
Deferred revenue
|
30,085
|
|
50,606
|
|
(5,893
|
)
|
|||||
|
Net cash provided by operating activities
|
1,799,154
|
|
1,564,334
|
|
1,368,045
|
|
|||||
|
Investing activities:
|
|||||||||||
|
Capital expenditures, including internal-use software and website development
|
(710,330
|
)
|
(749,348
|
)
|
(787,041
|
)
|
|||||
|
Purchases of investments
|
(1,811,355
|
)
|
(45,352
|
)
|
(521,329
|
)
|
|||||
|
Sales and maturities of investments
|
1,096,404
|
|
60,935
|
|
410,923
|
|
|||||
|
Acquisitions, net of cash acquired
|
(170,639
|
)
|
(777
|
)
|
(2,063,649
|
)
|
|||||
|
Proceeds from sale of business, net of cash divested and disposal costs
|
—
|
|
67,088
|
|
523,882
|
|
|||||
|
Net settlement of foreign currency forwards
|
6,335
|
|
(53,089
|
)
|
54,226
|
|
|||||
|
Other, net
|
7,195
|
|
2,222
|
|
11,728
|
|
|||||
|
Net cash used in investing activities
|
(1,582,390
|
)
|
(718,321
|
)
|
(2,371,260
|
)
|
|||||
|
Financing activities:
|
|||||||||||
|
Proceeds from issuance of long-term debt, net of issuance costs
|
989,600
|
|
(2,093
|
)
|
1,441,860
|
|
|||||
|
Payment of HomeAway Convertible Notes
|
—
|
|
(401,424
|
)
|
—
|
|
|||||
|
Purchases of treasury stock
|
(312,089
|
)
|
(455,746
|
)
|
(60,546
|
)
|
|||||
|
Proceeds from issuance of treasury stock
|
—
|
|
—
|
|
22,575
|
|
|||||
|
Payment of dividends to stockholders
|
(175,775
|
)
|
(150,159
|
)
|
(108,527
|
)
|
|||||
|
Proceeds from exercise of equity awards and employee stock purchase plan
|
229,081
|
|
141,043
|
|
97,716
|
|
|||||
|
Changes in controlled subsidiaries, net
|
(18,137
|
)
|
208,016
|
|
(8,518
|
)
|
|||||
|
Excess tax benefit on equity awards
|
—
|
|
—
|
|
90,855
|
|
|||||
|
Withholding taxes for stock option exercises
|
(9,063
|
)
|
(1,282
|
)
|
(85,033
|
)
|
|||||
|
Other, net
|
(16,103
|
)
|
(28,974
|
)
|
13,817
|
|
|||||
|
Net cash provided by (used in) financing activities
|
687,514
|
|
(690,619
|
)
|
1,404,199
|
|
|||||
|
Effect of exchange rate changes on cash and cash equivalents
|
145,640
|
|
(34,882
|
)
|
(127,385
|
)
|
|||||
|
Net increase in cash and cash equivalents
|
1,049,918
|
|
120,512
|
|
273,599
|
|
|||||
|
Cash and cash equivalents at beginning of year
|
1,796,811
|
|
1,676,299
|
|
1,402,700
|
|
|||||
|
Cash and cash equivalents at end of year
|
$
|
2,846,729
|
|
$
|
1,796,811
|
|
$
|
1,676,299
|
|
||
|
Supplemental cash flow information
|
|||||||||||
|
Cash paid for interest
|
$
|
162,932
|
|
$
|
153,755
|
|
$
|
109,507
|
|
||
|
Income tax payments, net
|
174,180
|
|
124,291
|
|
96,834
|
|
|||||
F- 8
Expedia, Inc.
Notes to Consolidated Financial Statements
Description of Business
Expedia, Inc. and its subsidiaries provide travel products and services to leisure and corporate travelers in the United States and abroad as well as various media and advertising offerings to travel and non-travel advertisers. These travel products and services are offered through a diversified portfolio of brands including: Expedia.com
®
, Hotels.com
®
, Hotwire.com
TM
, Travelocity
®
, Expedia
®
Affiliate Network, Classic Vacations
®
, Expedia Local Expert
®
, Expedia
®
CruiseShipCenters
®
, CarRentals.com
TM
, Wotif Group, Orbitz
®
, CheapTickets
®
, ebookers
®
, SilverRail Technologies, Inc., Egencia
®
, trivago
®
, HomeAway
®
and eLong
TM
through its sale on May 22, 2015. In addition, many of these brands have related international points of sale, including those as part of AirAsia-Expedia. We refer to Expedia, Inc. and its subsidiaries collectively as “Expedia,” the “Company,” “us,” “we” and “our” in these consolidated financial statements.
Basis of Presentation
The accompanying consolidated financial statements include Expedia, Inc., our wholly-owned subsidiaries, and entities we control, or in which we have a variable interest and are the primary beneficiary of expected cash profits or losses. We record our investments in entities that we do not control, but over which we have the ability to exercise significant influence, using the equity method. We have eliminated significant intercompany transactions and accounts.
We believe that the assumptions underlying our consolidated financial statements are reasonable. However, these consolidated financial statements do not present our future financial position, the results of our future operations and cash flows.
Seasonality
We generally experience seasonal fluctuations in the demand for our travel products and services. For example, traditional leisure travel bookings are generally the highest in the first three quarters as travelers plan and book their spring, summer and winter holiday travel. The number of bookings typically decreases in the fourth quarter. Because revenue for most of our travel products, including merchant and agency hotel, is recognized when the travel takes place rather than when it is booked, revenue typically lags bookings by several weeks for our hotel business and can be several months for our vacation rental business. Historically, HomeAway has seen seasonally stronger bookings in the first quarter of the year, with the relevant stays occurring during the peak summer travel months. The seasonal revenue impact is exacerbated with respect to income by the nature of our variable cost of revenue and direct sales and marketing costs, which we typically realize in closer alignment to booking volumes, and the more stable nature of our fixed costs. Furthermore, operating profits for our primary advertising business, trivago, have typically been experienced in the second half of the year, particularly the fourth quarter, as selling and marketing costs offset revenue in the first half of the year as we aggressively market during the busy booking period for spring, summer and winter holiday travel. As a result on a consolidated basis, revenue and income are typically the lowest in the first quarter and highest in the third quarter. The continued growth of our international operations, advertising business or a change in our product mix, including the growth of HomeAway, may influence the typical trend of the seasonality in the future, and there may also be business or market driven dynamics that result in short-term impacts to revenue or profitability that differ from the typical seasonal trends.
NOTE 2 — Significant Accounting Policies
Consolidation
Our consolidated financial statements include the accounts of Expedia, Inc., our wholly-owned subsidiaries, and entities for which we control a majority of the entity’s outstanding common stock. We record non-controlling interest in our consolidated financial statements to recognize the minority ownership interest in our consolidated subsidiaries. Non-controlling interest in the earnings and losses of consolidated subsidiaries represent the share of net income or loss allocated to members or partners in our consolidated entities, which includes the non-controlling interest share of net income or loss from our redeemable and non-redeemable non-controlling interest entities. Upon closing of its initial public offering ("IPO") on December 16, 2016, trivago became a separately listed company on the Nasdaq Global Select Market and, therefore, is subject to its own reporting and filing requirements, which could result in possible differences that are not expected to be material to Expedia, Inc.
We characterize our minority interest in AirAsia-Expedia and trivago, subsequent to its IPO, as a non-redeemable non-controlling interest and classify it as a component of stockholders’ equity in our consolidated financial statements. Non-
F- 9
controlling interests with shares redeemable at the option of the minority holders, such as trivago prior to its IPO, have been included in redeemable non-controlling interests. See “Redeemable Non-controlling Interest” below for further information.
We have eliminated significant intercompany transactions and accounts in our consolidated financial statements.
Accounting Estimates
We use estimates and assumptions in the preparation of our consolidated financial statements in accordance with accounting principles generally accepted in the United States (“GAAP”). Our estimates and assumptions affect the reported amounts of assets and liabilities and disclosure of contingent assets and liabilities as of the date of our consolidated financial statements. These estimates and assumptions also affect the reported amount of net income or loss during any period. Our actual financial results could differ significantly from these estimates. The significant estimates underlying our consolidated financial statements include revenue recognition; recoverability of current and long-lived assets, intangible assets and goodwill; income and transactional taxes, such as potential settlements related to occupancy and excise taxes; loss contingencies; loyalty program liabilities; acquisition purchase price allocations; stock-based compensation and accounting for derivative instruments.
Reclassifications
We have reclassified certain amounts related to our prior period results to conform to our current period presentation.
Revenue Recognition
We recognize revenue when it is earned and realizable based on the following criteria: persuasive evidence that an arrangement exists, services have been rendered, the price is fixed or determinable and collectability is reasonably assured.
We also evaluate the presentation of revenue on a gross versus a net basis. The consensus of the authoritative accounting literature is that the presentation of revenue as “the gross amount billed to a customer because it has earned revenue from the sale of goods or services or the net amount retained (that is, the amount billed to a customer less the amount paid to a supplier) because it has earned a commission or fee” is a matter of judgment that depends on the relevant facts and circumstances. In making an evaluation of this issue, some of the factors that should be considered are: whether we are the primary obligor in the arrangement (strong indicator); whether we have general supply risk (before customer order is placed or upon customer return) (strong indicator); and whether we have latitude in establishing price. The guidance clearly indicates that the evaluations of these factors, which at times can be contradictory, are subject to significant judgment and subjectivity. If the conclusion drawn is that we perform as an agent or a broker without assuming the risks and rewards of ownership of goods, revenue should be reported on a net basis. For our primary transaction-based revenue models, discussed below, we have determined net presentation is appropriate for the majority of revenue transactions.
We offer traditional travel products and services on a stand-alone and package basis primarily through the following business models: the merchant model, the agency model and the advertising model.
Under the merchant model, we facilitate the booking of hotel rooms, airline seats, car rentals and destination services from our travel suppliers and we are the merchant of record for such bookings. The majority of our merchant transactions relate to hotel bookings.
Under the agency model, we act as the agent in the transaction, passing reservations booked by the traveler to the relevant travel provider. We receive commissions or ticketing fees from the travel supplier and/or traveler. For certain agency airline, hotel and car transactions, we also receive fees from global distribution systems partners that control the computer systems through which these reservations are booked.
Under the advertising model, we offer travel and non-travel advertisers access to a potential source of incremental traffic and transactions through our various media and advertising offerings on trivago and our transaction-based websites.
In addition, our HomeAway business facilitates vacation rental bookings and provides listing and other ancillary services to property owners and managers.
Merchant Hotel.
Our travelers pay us for merchant hotel transactions prior to departing on their trip, generally when they book the reservation. We record the payment in deferred merchant bookings until the stay occurs, at which point we record the revenue. In certain nonrefundable, nonchangeable transactions where we have no significant post-delivery obligations, we record revenue when the traveler completes the transaction on our website, less a reserve for chargebacks and cancellations based on historical experience. Amounts received from customers are presented net of amounts paid to suppliers. In certain instances when a supplier invoices us for less than the cost we accrued, we generally recognize those amounts as revenue six months in arrears, net of an allowance, when we determine it is not probable that we will be required to pay the supplier, based
F- 10
on historical experience and contract terms. We generally contract in advance with lodging providers to obtain access to rooms at negotiated rates. Certain contracts specifically identify the number of potential rooms and the negotiated rate of the rooms to which we may have access over the terms of the contracts, which generally range from one to three years. Other contracts are not specific with respect to the number of rooms and the rates of the rooms to which we may have access over the terms of the contracts. In either case we may return unbooked hotel rooms with no obligation to the lodging providers within a period specified in each contract. For hotel rooms that are cancelled by the traveler after the specified period of time, we charge the traveler a cancellation fee or penalty that approximates the amount a hotel may invoice us for the cancellation.
Agency and Merchant Air.
We record revenue on air transactions when the traveler books the transaction, as we have no significant post-delivery obligations. We record a reserve for chargebacks and cancellations at the time of the transaction based on historical experience.
Agency Hotel, Car and Cruise.
In addition to air tickets, our agency revenue comes from certain hotel transactions as well as cruise and car rental reservations. We generally record agency revenue from hotel, cruise and car reservations on an accrual basis when the travel occurs. We record an allowance for cancellations on this revenue based on historical experience.
Packages.
Packages assembled by travelers through the packaging model on our websites generally include a merchant hotel component and some combination of an air, car or destination services component. The individual package components are recognized in accordance with our revenue recognition policies stated above.
Advertising
. We record advertising revenue ratably over the advertising period or upon delivery of advertising impressions, depending on the terms of the advertising contract. We record revenue from click-through fees charged to our travel partners for traveler leads sent to the travel partners’ websites. We record revenue from click-through fees after the traveler makes the click-through to the related travel partners’ websites.
Vacation Rental Products and Services.
Vacation rental revenue is earned on a transactional or subscription basis, where property owners or managers purchase in advance online advertising services related to the listing of their properties for rent over a fixed term (typically one year). Listing revenue is also generated on a commission basis, when traveler bookings are completed on our websites. During 2016, HomeAway began transitioning from a subscription-based model to an online transaction model, and in 2016, HomeAway launched a traveler service fee paid by the traveler, which is recorded as deferred revenue and recognized as revenue at the time of check-in. Payments for term-based paid subscriptions received in advance of services being rendered are recorded as deferred revenue and recognized ratably on a straight-line basis over the listing period. Revenue for performance-based listings is calculated as a percentage of the traveler booking or a fixed fee-per-inquiry stated in the arrangement and recognized when the service has been performed or as the customers’ refund privileges lapse, which is typically at check-in. Revenue from other ancillary vacation rental services or products are recorded either upon delivery or when we provide the service.
Other
. We record revenue from all other sources either upon delivery or when we provide the service.
Cash and Cash Equivalents
Our cash and cash equivalents include cash and liquid financial instruments, including money market funds and time deposit investments, with maturities of three months or less when purchased.
Short-term and Long-term Investments
We determine the appropriate classification of our investments in marketable securities at the time of purchase and reevaluate such designation at each balance sheet date. Based on our intent and ability to hold certain assets until maturity, we may classify certain debt securities as held to maturity and measure them at amortized cost. Investments classified as available for sale are recorded at fair value with unrealized holding gains and losses recorded, net of tax, as a component of accumulated other comprehensive income. Realized gains and losses from the sale of available for sale investments, if any, are determined on a specific identification basis. Investments with remaining maturities of less than one year are classified within short-term investments. All other investments with remaining maturities ranging from one year to five years are classified within long-term investments and other assets.
We record investments using the equity method when we have the ability to exercise significant influence over the investee. Equity investments without readily determinable fair values for which we do not have the ability to exercise significant influence are accounted for using the cost method of accounting and classified within long-term investments and other assets. Under the cost method, investments are carried at cost and are adjusted only for other-than-temporary declines in fair value, certain distributions, and additional investments.
F- 11
We periodically evaluate the recoverability of investments and record a write-down to fair value if a decline in value is determined to be other-than-temporary.
Accounts Receivable
Accounts receivable are generally due within thirty days and are recorded net of an allowance for doubtful accounts. We consider accounts outstanding longer than the contractual payment terms as past due. We determine our allowance by considering a number of factors, including the length of time trade accounts receivable are past due, previous loss history, a specific customer’s ability to pay its obligations to us, and the condition of the general economy and industry as a whole.
Property and Equipment
We record property and equipment at cost, net of accumulated depreciation and amortization. We also capitalize certain costs incurred related to the development of internal use software. We capitalize costs incurred during the application development stage related to the development of internal use software. We expense costs incurred related to the planning and post-implementation phases of development as incurred.
We compute depreciation using the straight-line method over the estimated useful lives of the assets, which is
three
to
five years
for computer equipment, capitalized software development and furniture and other equipment. We amortize leasehold improvement using the straight-line method, over the shorter of the estimated useful life of the improvement or the remaining term of the lease.
We establish assets and liabilities for the present value of estimated future costs to return certain of our leased facilities to their original condition under the authoritative accounting guidance for asset retirement obligations. Such assets are depreciated over the lease period into operating expense, and the recorded liabilities are accreted to the future value of the estimated restoration costs.
We establish assets and liabilities for the estimated construction costs incurred under lease arrangements where we are considered the owner for accounting purposes, pursuant to build-to-suit lease guidance, to the extent that we are involved in the construction of structural improvements or take construction risk prior to commencement of a lease. As a result of our involvement in the construction project for a new office space of our trivago subsidiary, we are recording that lease under build-to-suit guidance. We record project construction costs during the construction period incurred by the landlord as a construction-in-progress asset and a related construction financing obligation on our consolidated balance sheets.
Business Combinations
We assign the value of the consideration transferred to acquire a business to the tangible assets and identifiable intangible assets acquired and liabilities assumed on the basis of their fair values at the date of acquisition. Any excess purchase price over the fair value of the net tangible and intangible assets acquired is allocated to goodwill. When determining the fair values of assets acquired and liabilities assumed, management makes significant estimates and assumptions, especially with respect to intangible assets. Critical estimates in valuing certain intangible assets include but are not limited to future expected cash flows from customer relationships and trade names, and discount rates. Management’s estimates of fair value are based upon assumptions believed to be reasonable, but which are inherently uncertain and unpredictable and, as a result, actual results may differ from estimates. Any changes to provisional amounts identified during the measurement period are recognized in the reporting period in which the adjustment amounts are determined.
Recoverability of Goodwill and Indefinite-Lived Intangible Assets
Goodwill is assigned to reporting units that are expected to benefit from the synergies of the business combination as of the acquisition date. We assess goodwill and indefinite-lived intangible assets, neither of which is amortized, for impairment annually as of October 1, or more frequently, if events and circumstances indicate impairment may have occurred. In the evaluation of goodwill for impairment, we typically perform a quantitative assessment and compare the fair value of the reporting unit to the carrying value. Effective October 1, 2017, we prospectively adopted accounting guidance that simplified our goodwill impairment testing by eliminating the requirement to calculate the implied fair value of goodwill (formerly "Step 2") in the event an impairment is identified. Instead, an impairment charge is recorded based on the excess of the reporting unit's carrying amount over its fair value. Periodically, we may choose to perform a qualitative assessment, prior to performing the quantitative analysis, to determine whether the fair value of the goodwill is more likely than not impaired.
We generally base our measurement of fair value of reporting units on a blended analysis of the present value of future discounted cash flows and market valuation approach with the exception of our standalone publicly traded subsidiary, which is based on market valuation. The discounted cash flows model indicates the fair value of the reporting units based on the present
F- 12
value of the cash flows that we expect the reporting units to generate in the future. Our significant estimates in the discounted cash flows model include: our weighted average cost of capital; long-term rate of growth and profitability of our business; and working capital effects. The market valuation approach indicates the fair value of the business based on a comparison of the Company to comparable publicly traded firms in similar lines of business. Our significant estimates in the market approach model include identifying similar companies with comparable business factors such as size, growth, profitability, risk and return on investment and assessing comparable revenue and operating income multiples in estimating the fair value of the reporting units.
We believe the weighted use of discounted cash flows and market approach is the best method for determining the fair value of our reporting units because these are the most common valuation methodologies used within the travel and internet industries; and the blended use of both models compensates for the inherent risks associated with either model if used on a stand-alone basis.
In addition to measuring the fair value of our reporting units as described above, we consider the combined carrying and fair values of our reporting units in relation to the Company’s total fair value of equity plus debt as of the assessment date. Our equity value assumes our fully diluted market capitalization, using either the stock price on the valuation date or the average stock price over a range of dates around the valuation date, plus an estimated acquisition premium which is based on observable transactions of comparable companies. The debt value is based on the highest value expected to be paid to repurchase the debt, which can be fair value, principal or principal plus a premium depending on the terms of each debt instrument.
In our evaluation of our indefinite-lived intangible assets, we typically first perform a quantitative assessment and an impairment charge is recorded for the excess of the carrying value of indefinite-lived intangible assets over their fair value, if necessary. We base our measurement of fair value of indefinite-lived intangible assets, which primarily consist of trade name and trademarks, using the relief-from-royalty method. This method assumes that the trade name and trademarks have value to the extent that their owner is relieved of the obligation to pay royalties for the benefits received from them. As with goodwill, periodically, we may choose to perform a qualitative assessment, prior to performing the quantitative analysis, to determine whether the fair value of the indefinite-lived intangible asset is more likely than not impaired.
Recoverability of Intangible Assets with Definite Lives and Other Long-Lived Assets
Intangible assets with definite lives and other long-lived assets are carried at cost and are amortized on a straight-line basis over their estimated useful lives of less than
one
to
twelve years
. We review the carrying value of long-lived assets or asset groups, including property and equipment, to be used in operations whenever events or changes in circumstances indicate that the carrying amount of the assets might not be recoverable. Factors that would necessitate an impairment assessment include a significant adverse change in the extent or manner in which an asset is used, a significant adverse change in legal factors or the business climate that could affect the value of the asset, or a significant decline in the observable market value of an asset, among others. If such facts indicate a potential impairment, we would assess the recoverability of an asset group by determining if the carrying value of the asset group exceeds the sum of the projected undiscounted cash flows expected to result from the use and eventual disposition of the assets over the remaining economic life of the primary asset in the asset group. If the recoverability test indicates that the carrying value of the asset group is not recoverable, we will estimate the fair value of the asset group using appropriate valuation methodologies which would typically include an estimate of discounted cash flows. Any impairment would be measured as the difference between the asset groups carrying amount and its estimated fair value.
Assets held for sale, to the extent we have any, are reported at the lower of cost or fair value less costs to sell.
Redeemable Non-controlling Interests
We have non-controlling interests in majority owned entities, which were carried at fair value as the non-controlling interests contained certain rights, whereby we could acquire and the minority shareholders could sell to us the additional shares of the company. If the redeemable non-controlling interest is redeemable at an amount other than fair value, we adjust the non-controlling interest to redemption value through earnings each period. In circumstances where the non-controlling interest is redeemable at fair value, which included trivago prior to its IPO in December 2016, changes in fair value of the shares for which the minority holders could sell to us were recorded to the non-controlling interest and as charges or credits to retained earnings (or additional paid-in capital in the absence of retained earnings). Fair value determinations required high levels of judgment (“Level 3” on the fair value hierarchy) and were based on various valuation techniques, including market comparables and discounted cash flow projections.
F- 13
Income Taxes
We record income taxes under the liability method. Deferred tax assets and liabilities reflect our estimation of the future tax consequences of temporary differences between the carrying amounts of assets and liabilities for book and tax purposes. We determine deferred income taxes based on the differences in accounting methods and timing between financial statement and income tax reporting. Accordingly, we determine the deferred tax asset or liability for each temporary difference based on the enacted tax rates expected to be in effect when we realize the underlying items of income and expense. The Tax Cuts and Jobs Act ("the Tax Act") enacted in December 2017 reduced the U.S. Corporate income tax rate from 35% to 21%, effective January 1, 2018. See
NOTE 11 — Income Taxes
for further information on the tax impacts of the Tax Act.
We consider many factors when assessing the likelihood of future realization of our deferred tax assets, including our recent earnings experience by jurisdiction, expectations of future taxable income, and the carryforward periods available to us for tax reporting purposes, as well as other relevant factors. We may establish a valuation allowance to reduce deferred tax assets to the amount we believe is more likely than not to be realized. Due to inherent complexities arising from the nature of our businesses, future changes in income tax law, tax sharing agreements or variances between our actual and anticipated operating results, we make certain judgments and estimates. Therefore, actual income taxes could materially vary from these estimates. All deferred income taxes are classified as long-term on our consolidated balance sheets.
We account for uncertain tax positions based on a two-step process of evaluating recognition and measurement criteria. The first step assesses whether the tax position is more likely than not to be sustained upon examination by the tax authority, including resolution of any appeals or litigation, based on the technical merits of the position. If the tax position meets the more likely than not criteria, the portion of the tax benefit greater than 50% likely to be realized upon settlement with the tax authority is recognized in the financial statements.
We recognize interest and penalties related to unrecognized tax benefits in the income tax expense line in our consolidated statement of operations. Accrued interest and penalties are included in other long-term liabilities on the consolidated balance sheet.
Presentation of Taxes in the Income Statement
We present taxes that we collect from customers and remit to government authorities on a net basis in our consolidated statements of operations.
Derivative Instruments
Derivative instruments are carried at fair value on our consolidated balance sheets. The fair values of the derivative financial instruments generally represent the estimated amounts we would expect to receive or pay upon termination of the contracts as of the reporting date.
At
December 31, 2017
and
2016
, our derivative instruments primarily consisted of foreign currency forward contracts. We use foreign currency forward contracts to economically hedge certain merchant revenue exposures, foreign denominated liabilities related to certain of our loyalty programs and our other foreign currency-denominated operating liabilities. Our goal in managing our foreign exchange risk is to reduce, to the extent practicable, our potential exposure to the changes that exchange rates might have on our earnings, cash flows and financial position. Our foreign currency forward contracts are typically short-term and, as they do not qualify for hedge accounting treatment, we classify the changes in their fair value in other, net. We do not hold or issue financial instruments for speculative or trading purposes.
In June 2015, we issued Euro
650 million
of registered senior unsecured notes that are due in
June 2022
and bear interest at
2.5%
(the “
2.5%
Notes”). The aggregate principal value of the
2.5%
Notes is designated as a hedge of our net investment in certain Euro functional currency subsidiaries. The notes are measured at Euro to U.S. Dollar exchange rates at each balance sheet date and transaction gains or losses due to changes in rates are recorded in accumulated other comprehensive income (loss) (“OCI”). The Euro-denominated net assets of these subsidiaries are translated into U.S. Dollars at each balance sheet date, with effects of foreign currency changes also reported in accumulated OCI. Since the notional amount of the recorded Euro-denominated debt is less than the notional amount of our net investment, we do not expect to incur any ineffectiveness on this hedge.
F- 14
Foreign Currency Translation and Transaction Gains and Losses
Certain of our operations outside of the United States use the related local currency as their functional currency. We translate revenue and expense at average rates of exchange during the period. We translate assets and liabilities at the rates of exchange as of the consolidated balance sheet dates and include foreign currency translation gains and losses as a component of accumulated OCI. Due to the nature of our operations and our corporate structure, we also have subsidiaries that have significant transactions in foreign currencies other than their functional currency. We record transaction gains and losses in our consolidated statements of operations related to the recurring remeasurement and settlement of such transactions.
To the extent practicable, we attempt to minimize this exposure by maintaining natural hedges between our current assets and current liabilities of similarly denominated foreign currencies. Additionally, as discussed above, we use foreign currency forward contracts to economically hedge certain merchant revenue exposures and in lieu of holding certain foreign currency cash for the purpose of economically hedging our foreign currency-denominated operating liabilities.
Debt Issuance Costs
We defer costs we incur to issue debt, which are presented in the balance sheet as a direct deduction from the carrying amount of the related debt liability, and amortize these costs to interest expense over the term of the debt or, in circumstances where the debt can be redeemed at the option of the holders, over the term of the redemption option.
Marketing Promotions
We periodically provide incentive offers to our customers to encourage booking of travel products and services. Generally, our incentive offers are as follows:
Current Discount Offers.
These promotions include dollar off discounts to be applied against current purchases. We record the discounts as reduction in revenue at the date we record the corresponding revenue transaction.
Inducement Offers.
These promotions include discounts granted at the time of a current purchase to be applied against a future qualifying purchase. We treat inducement offers as a reduction to revenue based on estimated future redemption rates. We allocate the discount amount at the time of the offer between the current purchase and the potential future purchase based on our expected relative value of the transactions. We estimate our redemption rates using our historical experience for similar inducement offers.
Concession Offers.
These promotions include discounts to be applied against a future purchase to maintain customer satisfaction. Upon issuance, we record these concession offers as a reduction to revenue based on estimated future redemption rates. We estimate our redemption rates using our historical experience for concession offers.
Loyalty and Points Based Offers.
We offer certain internally administered traveler loyalty programs to our customers, such as our Hotels.com Rewards
®
program, our Brand Expedia Expedia
®
+ rewards program and our Orbitz rewards program. Hotels.com Rewards offers travelers one free night at any Hotels.com partner property after that traveler stays 10 nights, subject to certain restrictions. Expedia+ rewards enables participating travelers to earn points on all hotel, flight, package and activities made on over 30 Brand Expedia points of sale. Orbitz Rewards allows travelers to earn Orbucks
SM
, the currency of Orbitz Rewards, on flights, hotels and vacation packages and instantly redeem those Orbucks on future bookings at various hotels worldwide. As travelers accumulate points towards free travel products, we record a liability for the estimated future cost of redemptions. The cost of these loyalty points is recorded as a reduction to revenue in our consolidated financial statements. We determine the future redemption obligation based on factors that require significant judgment including: (i) the estimated cost of travel products to be redeemed, and (ii) an estimated redemption rate based on the overall accumulation and usage of points towards free travel products, which is determined through current and historical trends as well as statistical modeling techniques. As of
December 31, 2017
and
2016
, we had a liability related to our loyalty programs of
$562 million
and
$442 million
included in accrued expenses and other current liabilities.
Advertising Expense
We incur advertising expense consisting of offline costs, including television and radio advertising, and online advertising expense to promote our brands. We expense the production costs associated with advertisements in the period in which the advertisement first takes place. We expense the costs of communicating the advertisement (e.g., television airtime) as incurred each time the advertisement is shown. For the years ended
December 31, 2017
,
2016
and
2015
, our advertising expense was
$3.3 billion
,
$2.7 billion
and
$2.1 billion
. As of
December 31, 2017
and
2016
, we had
$38 million
and
$23 million
of prepaid marketing expenses included in prepaid expenses and other current assets.
F- 15
Stock-Based Compensation
We measure and amortize the fair value of stock options and restricted stock units (“RSUs”) as follows:
Stock Options.
We measure the value of stock options issued or modified, including unvested options assumed in acquisitions, on the grant date (or modification or acquisition dates, if applicable) at fair value, using appropriate valuation techniques, including the Black-Scholes and Monte Carlo option pricing models. The valuation models incorporate various assumptions including expected volatility, expected term and risk-free interest rates. The expected volatility is based on historical volatility of our common stock and other relevant factors. We base our expected term assumptions on our historical experience and on the terms and conditions of the stock awards granted to employees. We amortize the fair value, net of actual forfeitures, over the remaining vesting term on a straight-line basis. In addition, we classify certain employee option awards as liabilities when we deem it not probable that the employees holding the awards will bear the risk and rewards of stock ownership for a reasonable period of time. Such options are revalued at the end of each reporting period and upon settlement our total compensation expense recorded from grant date to settlement date will equal the settlement amount. The majority of our stock options vest over
four years
.
Restricted Stock Units.
RSUs are stock awards that are granted to employees entitling the holder to shares of common stock as the award vests, typically over a
three
or
four
-year period. We measure the value of RSUs at fair value based on the number of shares granted and the quoted price of our common stock at the date of grant. We amortize the fair value, net of actual forfeitures, as stock-based compensation expense over the vesting term on a straight-line basis. We record RSUs that may be settled by the holder in cash, rather than shares, as a liability and we remeasure these instruments at fair value at the end of each reporting period. Upon settlement of these awards, our total compensation expense recorded over the vesting period of the awards will equal the settlement amount, which is based on our stock price on the settlement date. Performance-based RSUs vest upon achievement of certain company-based performance conditions. On the date of grant, we determine the fair value of the performance-based award based on the fair value of our common stock at that time and we assess whether it is probable that the performance targets will be achieved. If assessed as probable, we record compensation expense for these awards over the estimated performance period using the accelerated method. At each reporting period, we reassess the probability of achieving the performance targets and the performance period required to meet those targets. The estimation of whether the performance targets will be achieved and of the performance period required to achieve the targets requires judgment, and to the extent actual results or updated estimates differ from our current estimates, the cumulative effect on current and prior periods of those changes will be recorded in the period estimates are revised, or the change in estimate will be applied prospectively depending on whether the change affects the estimate of total compensation cost to be recognized or merely affects the period over which compensation cost is to be recognized. The ultimate number of shares issued and the related compensation expense recognized will be based on a comparison of the final performance metrics to the specified targets.
Estimates of fair value are not intended to predict actual future events or the value ultimately realized by employees who receive these awards, and subsequent events are not indicative of the reasonableness of our original estimates of fair value.
During the second quarter of 2016, we elected to early adopt new guidance the Financial Accounting Standards Board (“FASB”) issued in March 2016 related to accounting for share-based payments, which required us to reflect any adjustments as of January 1, 2016, the beginning of the annual period that includes the interim period of adoption. The primary impact of adoption was the recognition of excess tax benefits in our provision for income taxes rather than additional paid-in capital for all periods in 2016. Additionally, our consolidated statement of cash flows now present excess tax benefits as an operating activity on a prospective basis. Finally, we have elected to account for forfeitures as they occur, rather than estimate expected forfeitures. The net cumulative effect of this change was recognized as a
$7 million
reduction to retained earnings as of January 1, 2016. The adoption of the new guidance resulted in the recognition of
$40 million
and
$60 million
of excess tax benefits in our provision for income taxes rate rather than additional paid-in capital for 2016 and 2017.
Earnings Per Share
We compute basic earnings per share by taking net income attributable to Expedia, Inc. available to common stockholders divided by the weighted average number of common and Class B common shares outstanding during the period excluding restricted stock and stock held in escrow. Diluted earnings per share include the potential dilution that could occur from stock-based awards and other stock-based commitments using the treasury stock or the as if converted methods, as applicable. For additional information on how we compute earnings per share, see
NOTE 14 — Earnings Per Share
.
F- 16
Fair Value Recognition, Measurement and Disclosure
The carrying amounts of cash and cash equivalents and restricted cash and cash equivalents reported on our consolidated balance sheets approximate fair value as we maintain them with various high-quality financial institutions. The accounts receivable are short-term in nature and are generally settled shortly after the sale.
We disclose the fair value of our financial instruments based on the fair value hierarchy using the following three categories:
Level 1 — Valuations based on quoted prices for identical assets and liabilities in active markets.
Level 2 — Valuations based on observable inputs other than quoted prices included in Level 1, such as quoted prices for similar assets and liabilities in active markets, quoted prices for identical or similar assets and liabilities in markets that are not active, or other inputs that are observable or can be corroborated by observable market data.
Level 3 — Valuations based on unobservable inputs reflecting the Company’s own assumptions, consistent with reasonably available assumptions made by other market participants. These valuations require significant judgment.
Certain Risks and Concentrations
Our business is subject to certain risks and concentrations including dependence on relationships with travel suppliers, primarily airlines and hotels, dependence on third-party technology providers, exposure to risks associated with online commerce security and payment related fraud. We also rely on global distribution system partners and third-party service providers for certain fulfillment services
.
Financial instruments, which potentially subject us to concentration of credit risk, consist primarily of cash and cash equivalents and corporate debt securities. We maintain some cash and cash equivalents balances with financial institutions that are in excess of Federal Deposit Insurance Corporation insurance limits. Our cash and cash equivalents are primarily composed of time deposits as well as bank (both interest and non-interest bearing) account balances denominated in U.S. dollars, Euros, British pound sterling, Canadian dollar, Australian dollar, Japanese yen and Brazilian real.
Contingent Liabilities
We have a number of regulatory and legal matters outstanding, as discussed further in
NOTE 17 — Commitments and Contingencies
. Periodically, we review the status of all significant outstanding matters to assess the potential financial exposure. When (i) it is probable that an asset has been impaired or a liability has been incurred and (ii) the amount of the loss can be reasonably estimated, we record the estimated loss in our consolidated statements of operations. We provide disclosure in the notes to the consolidated financial statements for loss contingencies that do not meet both of these conditions if there is a reasonable possibility that a loss may have been incurred that would be material to the financial statements. Significant judgment is required to determine the probability that a liability has been incurred and whether such liability is reasonably estimable. We base accruals made on the best information available at the time which can be highly subjective. The final outcome of these matters could vary significantly from the amounts included in the accompanying consolidated financial statements.
Occupancy Tax
Some states and localities impose a transient occupancy or accommodation tax on the use or occupancy of hotel accommodations. Generally, hotels collect taxes based on the room rate paid to the hotel and remit these taxes to the various tax authorities. When a customer books a room through one of our travel services, we collect a tax recovery charge from the customer which we pay to the hotel. We calculate the tax recovery charge by applying the occupancy tax rate supplied to us by the hotels to the amount that the hotel has agreed to receive for the rental of the room by the consumer. In all but a limited number of jurisdictions, we do not collect or remit occupancy taxes, nor do we pay occupancy taxes to the hotel operator on the portion of the customer payment we retain. Some jurisdictions have questioned our practice in this regard. While the applicable tax provisions vary among the jurisdictions, we generally believe that we are not required to collect and remit such occupancy taxes. We are engaged in discussions with tax authorities in various jurisdictions to resolve this issue. Some tax authorities have brought lawsuits or have levied assessments asserting that we are required to collect and remit occupancy tax. The ultimate resolution in all jurisdictions cannot be determined at this time. We have established a reserve for the potential settlement of issues related to hotel occupancy taxes when determined to be probable and estimable. See
NOTE 17 — Commitments and Contingencies
for further discussion.
F- 17
Recent Accounting Policies Not Yet Adopted
Revenue from Contracts with Customers.
In May 2014, the FASB issued an Accounting Standards Update ("ASU") amending revenue recognition guidance and requiring more detailed disclosures to enable users of financial statements to understand the nature, amount, timing and uncertainty of revenue and cash flows arising from contracts with customers. In August 2015, the FASB issued an ASU deferring the effective date of the revenue standard so it would be effective for annual and interim reporting periods beginning after December 15, 2017. In addition, the FASB has also issued several amendments to the standard which clarify certain aspects of the guidance, including principal versus agent considerations and identifying performance obligations.
The guidance permits two methods of adoption: retrospectively to each prior reporting period presented (full retrospective), or retrospectively with the cumulative effect of initially applying the guidance recognized at the date of initial application (modified retrospective). We will adopt this new guidance in the first quarter of 2018 and apply the modified retrospective method.
We have determined the new guidance will not change our previous conclusions on net presentation. We have also determined that the standard will impact our loyalty program accounting as we will no longer be permitted to use the incremental cost method when recording the financial impact of rewards earned in conjunction with our traveler loyalty programs. Instead, we will be required to re-value our liability using a relative fair value approach. Additionally, due to the new definition of variable consideration, we will be required to estimate and record certain variable payments earlier than currently recorded. Both modifications will result in cumulative-effect adjustments to opening retained earnings, with an insignificant change to revenue on a go-forward basis. Upon adoption, we expect a net reduction to the opening balance of retained earnings of approximately
$15
to
$25 million
, on a pre-tax basis, of which approximately
$45
to
$55 million
is related to changes in the accounting for our loyalty program
,
partially offset by the impact of estimating variable consideration of approximately
$30
to
$40 million
. The new guidance will likely also result in insignificant changes in the timing and classification of certain other revenue streams, and an insignificant amount of capitalization of costs to obtain contracts.
We have completed our overall assessment and are finalizing the quantification of the retained earnings impact. Additionally, we have identified and implemented changes to our accounting policies and practices, business processes, and controls to support the new revenue recognition standard. We are continuing our assessment of potential changes to our disclosures under the new guidance.
Recognition and Measurement of Financial Instruments.
In January 2016, the FASB issued new guidance related to accounting for equity investments, financial liabilities under the fair value option, and the presentation and disclosure requirements for financial instruments. The new standard is effective for annual periods, and interim periods within those annual periods, beginning after December 15, 2017. The most significant impact for the Company is with respect to the requirement that equity investments with readily determinable fair values, such as our investment in Despegar.com, Corp ("Despegar"), must be carried at fair value with changes in fair value recorded through net income. Today, such investment is designated as available for sale and is recorded at fair value with changes in fair value recorded through other comprehensive income. Upon adoption in the first quarter of 2018, we will record a cumulative-effect adjustment to the consolidated balance sheet as of the beginning of the annual period of adoption related to unrealized gains/losses, net of tax, previously classified within other comprehensive income and will begin recording fair value changes within other, net on our consolidated statements of operations. See
NOTE 5 — Fair Value Measurements
for the carrying value and fair value of the Despegar equity investment. In addition, we intend to elect to measure minority equity investments that do not have a readily determinable fair value at cost less impairment, adjusted by observable price changes as permitted by the new guidance with changes recorded within other, net on our consolidated statements of operations. Fair value changes for our investments could vary significantly period to period.
Definition of a Business.
In January 2017, the FASB issued new guidance clarifying the definition of a business for determining whether transactions should be accounted for as acquisitions (or disposals) of assets or businesses. The new standard is effective for annual periods, and interim periods within those annual periods, beginning after December 15, 2017 with early adoption permitted for transactions that occurred before the issuance date or effective date of the standard if the transactions were not reported in financial statements that have been issued or made available for issuance. The standard must be applied prospectively. Upon adoption, the standard will impact how we assess acquisitions (or disposals) of assets or businesses.
Statement of Cash Flows.
In August and November 2016, the FASB issued new guidance related to the statement of cash flows which clarifies how companies present and classify certain cash receipts and cash payments as well as amends current guidance to address the classification and presentation of changes in restricted cash in the statement of cash flows. The new guidance is effective for annual periods, and interim periods within those annual periods, beginning after December 15, 2017 with early adoption permitted. We plan to adopt this new guidance on January 1, 2018 retrospectively and currently anticipate
F- 18
the most significant impact will be to include in our cash and cash-equivalent balances in the consolidated statement of cash flow those amounts that are deemed to be restricted cash and restricted cash equivalents.
Intra-entity Transfers of Assets Other Than Inventory.
In October 2016, the FASB issued new guidance amending the accounting for income taxes associated with intra-entity transfers of assets other than inventory. This accounting update, which is part of the FASB's simplification initiative, is intended to reduce diversity in practice and the complexity of tax accounting, particularly for those transfers involving intellectual property. This new guidance requires an entity to recognize the income tax consequences of an intra-entity transfer of an asset other than inventory when the transfer occurs. The new standard is effective for annual periods, and interim periods within those annual periods, beginning after December 15, 2017 with early adoption permitted. We anticipate a retained earnings decrease of approximately
$25 million
upon adoption related to the unrecognized income tax effects of asset transfers that occurred prior to adoption.
Leases.
In February 2016, the FASB issued new guidance related to accounting and reporting guidelines for leasing arrangements. The new guidance requires entities that lease assets to recognize assets and liabilities on the balance sheet related to the rights and obligations created by those leases regardless of whether they are classified as finance or operating leases. Consistent with current guidance, the recognition, measurement, and presentation of expenses and cash flows arising from a lease primarily will depend on its classification as a finance or operating lease. The guidance also requires new disclosures to help financial statement users better understand the amount, timing and uncertainty of cash flows arising from leases. This guidance is effective for annual and interim reporting periods beginning after December 15, 2018. Early adoption is permitted and should be applied using a modified retrospective approach. We are in the process of evaluating the impact of adopting this new guidance on our consolidated financial statements.
Hedge Accounting.
In August 2017, the FASB amended the existing accounting guidance for hedge accounting. The amendments require expanded hedge accounting for both non-financial and financial risk components and refine the measurement of hedge results to better reflect an entity's hedging strategies. The new guidance also amends the presentation and disclosure requirements and changes how entities assess hedge effectiveness. The new guidance is effective for annual periods, and interim periods within those annual periods, beginning after December 15, 2018 with early adoption permitted. The new guidance must be adopted using a modified retrospective transition with a cumulative effect adjustment recorded to opening retained earnings as of the initial adoption date. We are in the process of evaluating the impact of adopting this new guidance on our consolidated financial statements.
Measurement of Credit Losses on Financial Instruments.
In June 2016, the FASB issued new guidance on the measurement of credit losses for financial assets measured at amortized cost, which includes accounts receivable, and available-for-sale debt securities. The new guidance replaces the existing incurred loss impairment model with an expected loss methodology, which will result in more timely recognition of credit losses. This update is effective for annual periods beginning after December 15, 2019, including interim periods within those annual periods. Early adoption is permitted for annual periods beginning after December 15, 2018, including interim periods within those annual periods. We are in the process of evaluating the impact of adopting this new guidance on our consolidated financial statements.
NOTE 3 — Acquisitions and Other Investments
2017 Acquisition and Other Investment Activity
During 2017, we completed several business combinations, one of which we made an initial investment in during 2015. The following summarizes the preliminary aggregate purchase price allocation for these acquisitions, in thousands:
|
Goodwill
|
$
|
123,915
|
|
|
Intangibles with definite lives
(1)
|
75,894
|
|
|
|
Net assets and non-controlling interests acquired
(2)
|
14,595
|
|
|
|
Deferred tax liabilities
|
(20,834
|
)
|
|
|
Total
(3)
|
$
|
193,570
|
|
___________________________________
|
(1)
|
Acquired intangible assets with definite lives have a weighted average useful life of
3.8 years
.
|
|
(2)
|
Includes cash acquired of
$5 million
.
|
|
(3)
|
The total purchase price includes noncash consideration of
$10 million
related to the removal of a cost method investment upon our acquisition of a controlling interest as well as
$8 million
related to replacement stock awards attributable to pre-acquisition service, with the remainder paid in cash during the period.
|
The redeemable non-controlling interest in one of our acquisitions is redeemable at an amount other than fair value requiring that each period we adjust the non-controlling interest to redemption value through earnings. In addition, another of our acquisitions made during the period includes redeemable non-controlling interests, which are redeemable at fair value
F- 19
requiring that each period we adjust the changes in the fair value of the non-controlling interest through retained earnings (or additional paid-in capital if there is no retained earnings). Fair value determinations are based on various valuation techniques, including market comparables and discounted cash flow projections.
Of the goodwill recorded for the business combinations,
$12 million
is expected to be deductible for tax purposes with the remainder not expected to be deductible. The purchase price allocations were based on preliminary valuations of the assets acquired and liabilities assumed and are subject to revision. The results of operations were immaterial from the transaction close dates through December 31, 2017. Pro forma results have not been presented as such pro forma financial information would not be materially different from historical results.
Other Investments.
On July 27, 2017, we announced that Expedia and Traveloka Holding Limited ("Traveloka"), a Southeast Asian online travel company, have expanded our partnership to include deeper cooperation on hotel supply and that we made a
$350 million
investment in Traveloka, the majority of which is accounted for as a cost method investment and included within long-term investment and other assets on the consolidated balance sheet with a small portion allocated to intangible assets.
2016 Acquisition and Other Investment Activity
We had nominal acquisition activity during the year ended December 31, 2016.
2015 Acquisition and Other Investment Activity
HomeAway Acquisition.
On December 15, 2015, we completed our acquisition of HomeAway, Inc., including all of its brands, for total purchase consideration of
$3.6 billion
primarily in cash and Expedia common stock. With Expedia’s expertise in powering global transactional platforms and our industry-leading technology capabilities, we are partnering with HomeAway to accelerate their shift from a classified marketplace to an online, transactional model to create even better experiences for HomeAway’s global traveler audience and the owners and managers of its properties around the world.
Each outstanding share of common stock of HomeAway immediately prior to the acquisition was exchanged for
$10.15
in cash and
0.2065
of a share of Expedia common stock, with cash paid in lieu of fractional shares. The aggregate purchase consideration for HomeAway is as follows, in thousands:
|
Fair value of shares of Expedia common stock issued to HomeAway stockholders and equity award holders
|
$
|
2,515,755
|
|
|
Cash consideration paid to HomeAway stockholders and equity award holders
|
1,027,061
|
|
|
|
Replacement restricted stock units and stock options attributable to pre-acquisition service
|
19,513
|
|
|
|
Total purchase consideration
|
$
|
3,562,329
|
|
The fair value of common stock shares issued was based on the closing price of Expedia’s common stock at December 14, 2015 and included the fair value of shares of Expedia common stock issued to (i) HomeAway stockholders based on approximately
97 million
HomeAway shares outstanding as of December 14, 2015 and (ii) holders of equity awards vested as of December 14, 2015. Approximately
20 million
shares of Expedia common stock were issued in connection with the acquisition of HomeAway. Purchase consideration also included
$20 million
for the portion of certain unvested employee options and restricted stock unit awards of HomeAway attributable to pre-combination service, which were replaced with Expedia awards in conjunction with the acquisition and measured at fair value on the acquisition date. The fair value for the portion of the awards attributable to post-combination service was
$106 million
, net of estimated forfeitures.
F- 20
The following summarizes the final allocation of the purchase price for HomeAway, in thousands:
|
Cash
|
$
|
900,281
|
|
|
Other current assets
(1)
|
54,372
|
|
|
|
Long-term assets
|
90,890
|
|
|
|
Intangible assets with definite lives
(2)
|
533,279
|
|
|
|
Intangible assets with indefinite lives
(3)
|
239,200
|
|
|
|
Goodwill
|
2,613,151
|
|
|
|
Deferred revenue
|
(181,837
|
)
|
|
|
Other current liabilities
|
(109,581
|
)
|
|
|
Debt
|
(401,580
|
)
|
|
|
Other long-term liabilities
|
(30,989
|
)
|
|
|
Deferred tax liabilities, net
|
(144,857
|
)
|
|
|
Total
|
$
|
3,562,329
|
|
___________________________________
|
(1)
|
Gross accounts receivable was
$24 million
, of which
$1 million
was estimated to be uncollectible.
|
|
(2)
|
Acquired definite-lived intangible assets primarily consist of supplier relationships, customer relationships and developed technology assets with average lives ranging from less than
one
to
ten years
and a weighted average useful life of
5.2
years.
|
|
(3)
|
Acquired indefinite-lived intangible assets primarily consist of trade names and trademarks.
|
The goodwill of
$2.6 billion
was primarily attributable to assembled workforce and operating synergies as it relates to the shift to a transaction model. The goodwill was allocated to the new HomeAway reportable segment and is not expected to be deductible for tax purposes.
We assumed approximately
$402 million
of
0.125%
Convertible Senior Notes due
2019
(the “Convertible Notes”) in connection with the HomeAway acquisition. However, following the consummation of the HomeAway acquisition, we subsequently delivered a notice to holders of the Convertible Notes, as required per the terms of the Convertible Notes indenture, to which each holder of the Convertible Notes had the right to (i) require the Company to repurchase its Convertible Notes for cash at a price equal to
100%
of the principal amount of such notes plus accrued and unpaid interest or (ii) convert its Convertible Notes, at a specified conversion rate into HomeAway common stock (which, following consummation of the HomeAway acquisition, represented the right to receive the transaction consideration) or (iii) allow the Convertible Notes to remain outstanding for the remaining term. As a result, the majority of the Convertible Notes, or
$401 million
, were repurchased during 2016.
In connection with the issuance of the Convertible Notes, HomeAway also sold warrants (the “Warrants”) to acquire approximately
7.7 million
shares of HomeAway common stock. As a result of the merger, the Warrant holders had the right to terminate the Warrants at fair value as determined in a commercially reasonable manner. A portion of such Warrants were settled on December 16, 2015 for
$23 million
in cash, with the
$8 million
remainder settled in January 2016.
HomeAway was consolidated into our financial statements starting on the acquisition date and we recognized a related
$20 million
in revenue and
$14 million
in operating losses, including fees related to the acquisition that are not allocated to the segment, for 2015.
In connection with the acquisition, HomeAway incurred fees paid to financial advisors totaling approximately
$33 million
, which were contingent upon closing and were excluded from both Expedia’s consolidated statement of operations and the pre-combination financial statements of HomeAway.
Orbitz Acquisition.
On September 17, 2015, we completed our acquisition of Orbitz Worldwide, including all of its brands, including Orbitz, ebookers, HotelClub, CheapTickets, Orbitz Partner Network and Orbitz for Business, for a total purchase consideration of
$1.8 billion
. The acquisition provides Expedia the opportunity to deliver a better customer experience to Orbitz’ loyal customer base and to further enhance the marketing and distribution capabilities we offer to our global supply partners.
The purchase consideration consisted primarily of
$1.4 billion
in cash, or
$12
per share for all shares of Orbitz common stock outstanding as of the purchase date, as well as the settlement of
$432 million
of pre-existing Orbitz debt at the closing of the acquisition. Purchase consideration also included
$17 million
for the portion of certain unvested employee restricted stock unit awards of Orbitz attributable to pre-combination service, which were replaced with Expedia awards in conjunction with
F- 21
the acquisition and measured at fair value on the acquisition date. The fair value for the portion of the awards attributable to post-combination service was
$49 million
, net of estimated forfeitures, of which
$34 million
was recognized during 2015.
The following summarizes the final allocation of the purchase price for Orbitz, in thousands:
|
Cash consideration for shares
|
$
|
1,362,362
|
|
|
Settlement of Orbitz debt
|
432,231
|
|
|
|
Replacement restricted stock units attributable to pre-acquisition service
|
16,717
|
|
|
|
Other consideration
|
2,214
|
|
|
|
Total purchase consideration
|
$
|
1,813,524
|
|
|
Cash
|
$
|
194,515
|
|
|
Accounts receivable, net
(1)
|
150,187
|
|
|
|
Other current assets
|
33,727
|
|
|
|
Long-term assets
|
114,800
|
|
|
|
Intangible assets with definite lives
(2)
|
515,003
|
|
|
|
Intangible assets with indefinite lives
(3)
|
166,800
|
|
|
|
Goodwill
|
1,444,307
|
|
|
|
Current liabilities
|
(636,169
|
)
|
|
|
Other long-term liabilities
|
(54,599
|
)
|
|
|
Deferred tax liabilities, net
|
(115,047
|
)
|
|
|
Total
|
$
|
1,813,524
|
|
___________________________________
|
(1)
|
Gross accounts receivable was
$157 million
, of which
$7 million
was estimated to be uncollectible.
|
|
(2)
|
Acquired definite-lived intangible assets primarily consist of customer relationship assets, developed technology assets and partner relationship assets with estimated useful lives ranging from less than
one
to
ten years
with a weighted average life of
6.0
years.
|
|
(3)
|
Acquired indefinite-lived intangible assets primarily consist of trade names and trademarks.
|
The goodwill of
$1.4 billion
is primarily attributable to operating synergies. The goodwill was allocated to the Core Online Travel Agencies (“Core OTA”) segment and is not expected to be deductible for tax purposes.
Orbitz was consolidated into our financial statements starting on the acquisition date and we recognized a related
$196 million
in revenue and
$163 million
in operating losses, including restructuring charges of
$92 million
as well as fees related to the acquisition that are not allocated to the Core OTA segment, for 2015.
In connection with the merger, Orbitz incurred fees paid to financial advisers totaling approximately
$25 million
, which were contingent upon closing and were excluded from both Expedia’s consolidated statement of operations and the pre-combination financial statements of Orbitz. In addition, Orbitz offered certain employees a continuity incentive of approximately
$30 million
for continuing employment through the closing date and beyond. The first half of the incentives were contingent and paid upon the closing of the acquisition and related to service provided in the pre-acquisition period. The second half of the incentive was payable
180 days
after the closing (or upon involuntary termination, if applicable) and was expensed to restructuring and related reorganization charges over the applicable service period.
Combined Pro forma Information (Unaudited).
Supplemental information on an unaudited combined pro forma basis, as if the HomeAway and Orbitz acquisitions had been consummated on January 1, 2014, is presented as follows, in thousands:
|
|
Year Ended December 31, 2015
|
||
|
Revenue
|
$
|
7,838,863
|
|
|
Net income attributable to Expedia, Inc.
|
816,634
|
|
|
The pro forma results include adjustments primarily related to amortization of acquired intangibles, depreciation of fixed assets, certain accounting policy alignments as well as direct and incremental acquisition related costs reflected in the historical financial statements.
Other 2015 Acquisitions.
On March 10, 2015, we completed the acquisition of an additional
25%
equity interest of AAE Travel Pte. Ltd., the joint venture formed between Expedia and AirAsia Berhad in 2011, for cash consideration of
F- 22
approximately
$94 million
. This investment increased our total ownership in the venture from
50%
to
75%
and resulted in the consolidation of the entity. In conjunction with the acquisition of the additional interest, we remeasured our previously held equity interest to fair value, excluding any acquisition premium, and recognized a gain of
$77 million
in other, net during the period. The fair value of the
25%
noncontrolling interest, including an acquisition premium, was estimated to be
$64 million
at the time of the acquisition. Both fair values were determined based on various valuation techniques, including market comparables and discounted cash flow projections (Level 3 inputs).
On January 23, 2015, we acquired the Travelocity brand and other associated assets from Sabre for
$280 million
in cash consideration. As a result of the asset acquisition, the strategic marketing and other related agreements entered into in 2013 were terminated. Under the terms of the strategic marketing agreement, Travelocity was compensated through a performance-based marketing fee related to bookings powered by Expedia made through Travelocity-branded websites in the United States and Canada. Revenue earned on the Travelocity websites was recorded as a component of Expedia’s net revenue in accordance with our revenue recognition policies and the related marketing fee paid to Travelocity was recorded as selling and marketing expense. In conjunction with the acquisition, we did not acquire any cash or working capital assets or assume any liabilities.
In addition, we completed
three
other acquisitions during 2015 for a total purchase price of
$9 million
.
The following summarizes the allocation of the purchase price for the 2015 acquisitions, excluding HomeAway and Orbitz, in thousands:
|
Goodwill
|
$
|
196,431
|
|
|
Intangible assets with indefinite lives
|
163,400
|
|
|
|
Intangible assets with definite lives
(1)
|
146,126
|
|
|
|
Net assets and non-controlling interests acquired
(2)
|
(23,366
|
)
|
|
|
Deferred tax liabilities
|
(7,910
|
)
|
|
|
Total
(3)
|
$
|
474,681
|
|
___________________________________
|
(1)
|
Acquired definite-lived intangible assets primarily consist of customer relationship, reacquired right and supplier relationship assets and have estimated useful lives of between
four
and
ten years
with a weighted average life of
5.8
years.
|
|
(2)
|
Includes cash acquired of
$41 million
.
|
|
(3)
|
The total purchase price includes noncash consideration of
$99 million
related to an equity method investment, which is currently consolidated upon our acquisition of a controlling interest, as discussed above, with the remainder paid in cash during the period.
|
The goodwill of
$196 million
is primarily attributable to operating synergies and
$82 million
is expected to be deductible for tax purposes with the remainder not expected to be deductible.
The results of operations of the other acquired companies have been included in our consolidated results from the transaction closing dates forward. Pro forma results of operations have not been presented as such pro forma financial information would not be materially different from historical results.
Other Investments.
On March 10, 2015, we announced that Expedia and Decolar.com, Inc. (“Decolar”), the Latin American online travel company that operates the Decolar.com and Despegar.com branded websites, expanded our partnership to include deeper cooperation on hotel supply and we made a
$273 million
cost method investment in Decolar, including acquisition-related costs, which was included within long-term investments and other assets on our consolidated balance sheet.
Acquisition-related Costs.
Other than costs mentioned above related to Orbitz and HomeAway that were contingent upon closing and those costs related to cost method investments, total acquisition-related costs incurred by Expedia in 2015, which included legal, finance, consulting and other professional fees, were expensed as incurred within general and administrative expenses and were approximately
$47 million
.
On May 22, 2015, we completed the sale of our
62.4%
ownership stake in eLong, Inc., which was a separate reportable segment, for approximately
$671 million
(or
$666 million
net of costs to sell and other transaction expenses) to several purchasers, including Ctrip.com International, Ltd. Of the total sales price, approximately
$67 million
was remitted directly to escrow for estimated tax obligations, and represented a noncash item in our consolidated statement of cash flows for 2015. In November 2016, we received the escrow deposit, which was included as an investing inflow in our consolidated statement of
F- 23
cash flows for 2016. As a result of the sale, we recognized a pre-tax gain of
$509 million
(
$395 million
after tax) during 2015 included in gain on sale of business in our consolidated statement of operations.
The following table presents the carrying amounts of our eLong business immediately preceding the disposition on May 22, 2015, in thousands:
|
Total current assets
(1)
|
$
|
350,196
|
|
|
Total long-term assets
|
137,709
|
|
|
|
Total assets divested
|
$
|
487,905
|
|
|
Total current liabilities
|
$
|
187,296
|
|
|
Total long-term liabilities
|
5,782
|
|
|
|
Total liabilities divested
|
$
|
193,078
|
|
|
Components of accumulated other comprehensive income divested
|
45,259
|
|
|
|
Non-redeemable non-controlling interest divested
|
92,550
|
|
|
|
Net carrying value divested
|
$
|
157,018
|
|
___________________________________
|
(1)
|
Includes cash and cash equivalents of approximately
$74 million
.
|
We evaluated the disposition of eLong and determined it did not meet the “major effect” criteria for classification as a discontinued operation largely due to how recently it began having material impacts to our quarterly consolidated operating and net income at the time of the determination. However, we determined that the disposition did represent an individually significant component of our business. The following table presents certain amounts related to eLong in our consolidated results of operations for the year ended December 31, 2015 through its disposal on May 22, 2015, in thousands:
|
Operating loss
(1)
|
$
|
(85,536
|
)
|
|
Income before taxes
(2)
|
438,843
|
|
|
|
Income before taxes attributable to Expedia, Inc.
(2)
|
465,400
|
|
|
|
Net income attributable to Expedia, Inc.
(3)
|
349,183
|
|
|
___________________________________
|
(1)
|
Includes stock-based compensation and amortization of intangible assets of approximately
$20 million
, which was included within Corporate & Eliminations in
NOTE 19 — Segment Information
.
|
|
(2)
|
Includes the pre-tax gain of
$509 million
related to the gain on sale.
|
|
(3)
|
Includes the after-tax gain of
$395 million
related to the gain on sale.
|
Financial assets measured at fair value on a recurring basis as of
December 31, 2017
are classified using the fair value hierarchy in the table below:
|
Total
|
Level 1
|
Level 2
|
|||||||||
|
|
(In thousands)
|
||||||||||
|
Assets
|
|||||||||||
|
Cash equivalents:
|
|||||||||||
|
Money market funds
|
$
|
15,873
|
|
$
|
15,873
|
|
$
|
—
|
|
||
|
Time deposits
|
552,297
|
|
—
|
|
552,297
|
|
|||||
|
Derivatives:
|
|||||||||||
|
Foreign currency forward contracts
|
6,141
|
|
—
|
|
6,141
|
|
|||||
|
Investments:
|
|||||||||||
|
Time deposits
|
468,508
|
|
—
|
|
468,508
|
|
|||||
|
Marketable equity securities
|
263,550
|
|
263,550
|
|
—
|
|
|||||
|
Total assets
|
$
|
1,306,369
|
|
$
|
279,423
|
|
$
|
1,026,946
|
|
||
F- 24
Financial assets measured at fair value on a recurring basis as of
December 31, 2016
are classified using the fair value hierarchy in the table below:
|
Total
|
Level 1
|
Level 2
|
|||||||||
|
|
(In thousands)
|
||||||||||
|
Assets
|
|||||||||||
|
Cash equivalents:
|
|||||||||||
|
Money market funds
|
$
|
113,955
|
|
$
|
113,955
|
|
$
|
—
|
|
||
|
Time deposits
|
299,585
|
|
—
|
|
299,585
|
|
|||||
|
Investments:
|
|||||||||||
|
Time deposits
|
24,576
|
|
—
|
|
24,576
|
|
|||||
|
Corporate debt securities
|
64,227
|
|
—
|
|
64,227
|
|
|||||
|
Total assets
|
$
|
502,343
|
|
$
|
113,955
|
|
$
|
388,388
|
|
||
|
Liabilities
|
|||||||||||
|
Derivatives:
|
|||||||||||
|
Foreign currency forward contracts
|
$
|
4,402
|
|
$
|
—
|
|
$
|
4,402
|
|
||
We classify our cash equivalents and investments within Level 1 and Level 2 as we value our cash equivalents and investments using quoted market prices or alternative pricing sources and models utilizing market observable inputs. Valuation of the foreign currency forward contracts is based on foreign currency exchange rates in active markets, a Level 2 input.
As of
December 31, 2017
and
2016
, our cash and cash equivalents consisted primarily of prime institutional money market funds with maturities of three months or less, time deposits as well as bank account balances.
We periodically invest in investment grade corporate debt securities, all of which are classified as available for sale. As of
December 31, 2017
, we had
no
short-term or long-term available for sale investments. As of
December 31, 2016
, we had
$48 million
of short-term and
$16 million
of long-term available for sale investments and the amortized cost basis of the investments approximated their fair value with both gross unrealized gains and gross unrealized losses of less than
$1 million
.
On September 20, 2017, Despegar completed its initial public offering and, therefore we designated our previous cost method investment in Despegar as available for sale. As of December 31, 2017, the cost basis was
$273 million
and related gross unrealized loss was
$9 million
.
We also hold time deposit investments with financial institutions. Time deposits with original maturities of less than three months are classified as cash equivalents and those with remaining maturities of less than one year are classified within short-term investments.
We use foreign currency forward contracts to economically hedge certain merchant revenue exposures, foreign denominated liabilities related to certain of our loyalty programs and our other foreign currency-denominated operating liabilities. As of
December 31, 2017
, we were party to outstanding forward contracts hedging our liability exposures with a total net notional value of
$2.6 billion
. We had a net forward asset of
$6 million
recorded in prepaid expenses and other current assets as of
December 31, 2017
and a net forward liability of
$4 million
recorded in accrued expenses and other current liabilities as of December 31,
2016
. We recorded
$17 million
,
$(66) million
and
$46 million
in net gains (losses) from foreign currency forward contracts in
2017
,
2016
and
2015
.
Assets Measured at Fair Value on a Non-recurring Basis
Our non-financial assets, such as goodwill, intangible assets and property and equipment, as well as equity and cost method investments, are adjusted to fair value only when an impairment charge is recognized or the underlying investment is sold. Such fair value measurements are based predominately on Level 3 inputs.
Intangible Assets.
During 2016, we recognized intangible impairment charges of
$35 million
, of which
$2 million
was recorded during the third quarter of 2016 and
$33 million
was recorded in conjunction with the annual impairment of goodwill and intangible assets on October 1, 2016. These impairment charges were related to indefinite-lived trade names within our Core OTA segment and resulted from changes in estimated future revenues of the related brands. The assets, classified as Level 3 measurements, were written down to
$76 million
based on a valuation using the relief-from-royalty method, which includes unobservable inputs, including royalty rates and projected revenues. In addition, we recognized impairment charges of
$7 million
during 2015.
F- 25
Cost Method Investments.
As of
December 31, 2017
and
2016
, we had
$371 million
and
$323 million
of cost method investments. During 2017, we recorded
$14 million
in net losses related to certain cost method investments, which included
$6 million
in other-than-temporary impairments as well as a loss recognized on the liquidation of an investment of
$9 million
. As a result of these impairments and subsequent liquidation, we have no remaining fair value related to these cost investments as of December 31, 2017. In addition, during 2016, we recognized other-than-temporary investment impairments of
$12 million
related to two cost investments, the remaining fair value of which was less than
$1 million
as of December 31, 2016.
Our property and equipment consists of the following:
|
|
December 31,
|
||||||
|
|
2017
|
2016
|
|||||
|
|
(In thousands)
|
||||||
|
Capitalized software development
|
$
|
2,111,262
|
|
$
|
1,606,960
|
|
|
|
Computer equipment
|
658,031
|
|
665,652
|
|
|||
|
Furniture and other equipment
|
84,509
|
|
72,811
|
|
|||
|
Buildings and leasehold improvements
|
282,865
|
|
241,713
|
|
|||
|
Land
|
129,049
|
|
130,812
|
|
|||
|
3,265,716
|
|
2,717,948
|
|
||||
|
Less: accumulated depreciation
|
(2,055,720
|
)
|
(1,575,879
|
)
|
|||
|
Projects in progress
(1)
|
365,262
|
|
252,835
|
|
|||
|
Property and equipment, net
|
$
|
1,575,258
|
|
$
|
1,394,904
|
|
|
___________________________________
|
(1)
|
At December 31, 2017 and 2016, projects in progress included approximately
$111 million
and
$38 million
of project construction costs capitalized pursuant to build-to-suit lease guidance, which were incurred by the landlord, as property and equipment, net with a related construction financing obligation in other long-term liabilities. The building assets will begin depreciating when the costs incurred related to the build out of the office space are complete and ready for their intended use, which is expected to be in 2018.
|
As of
December 31, 2017
and
2016
, our recorded capitalized software development costs, net of accumulated amortization, were
$735 million
and
$639 million
. For the years ended
December 31, 2017
,
2016
and
2015
, we recorded amortization of capitalized software development costs of
$398 million
,
$300 million
and
$230 million
, most of which is included in technology and content expenses.
During 2015, we acquired our future corporate headquarters for
$229 million
, consisting of multiple office and lab buildings located in Seattle, Washington. We have subsequently spent approximately
$30 million
in 2016 and approximately
$70 million
in 2017 relating to the build out of our headquarters. The acquired building assets and related expenditures are included in construction in process and will begin depreciating when the costs incurred related to the build out of the headquarters are complete and the building assets are ready for their intended use, which we estimate to start at the end of 2019.
The following table presents our goodwill and intangible assets as of
December 31, 2017
and
2016
:
|
|
December 31,
|
||||||
|
|
2017
|
2016
|
|||||
|
|
(In thousands)
|
||||||
|
Goodwill
|
$
|
8,228,865
|
|
$
|
7,942,023
|
|
|
|
Intangible assets with indefinite lives
|
1,478,729
|
|
1,457,072
|
|
|||
|
Intangible assets with definite lives, net
|
829,807
|
|
989,580
|
|
|||
|
$
|
10,537,401
|
|
$
|
10,388,675
|
|
||
Impairment Assessments.
We perform our annual assessment of possible impairment of goodwill and indefinite-lived intangible assets as of October 1, or more frequently if events and circumstances indicate that impairment may have occurred. As of October 1, 2017, we had no impairments of goodwill or intangible assets with indefinite-lives. As of October 1, 2016, we
F- 26
had
no
impairments to goodwill but recorded a
$35 million
impairment charge related to indefinite-lived trade names within our Core OTA segment.
Goodwill.
The following table presents the changes in goodwill by reportable segment:
|
Core OTA
|
trivago
|
HomeAway
|
Egencia
|
Total
|
|||||||||||||||
|
|
(In thousands)
|
||||||||||||||||||
|
Balance as of January 1, 2016
|
$
|
4,717,371
|
|
$
|
539,577
|
|
$
|
2,602,712
|
|
$
|
133,281
|
|
$
|
7,992,941
|
|
||||
|
Additions
|
128
|
|
—
|
|
—
|
|
—
|
|
128
|
|
|||||||||
|
Foreign exchange translation and other
|
(14,028
|
)
|
(23,339
|
)
|
(12,127
|
)
|
(1,552
|
)
|
(51,046
|
)
|
|||||||||
|
Balance as of December 31, 2016
|
4,703,471
|
|
516,238
|
|
2,590,585
|
|
131,729
|
|
7,942,023
|
|
|||||||||
|
Additions
|
123,617
|
|
298
|
|
—
|
|
—
|
|
123,915
|
|
|||||||||
|
Foreign exchange translation and other
|
12,949
|
|
72,113
|
|
64,649
|
|
13,216
|
|
162,927
|
|
|||||||||
|
Balance as of December 31, 2017
|
$
|
4,840,037
|
|
$
|
588,649
|
|
$
|
2,655,234
|
|
$
|
144,945
|
|
$
|
8,228,865
|
|
||||
Any change in goodwill amounts resulting from purchase accounting adjustments are presented as "Foreign exchange translation and other" in the above table. In
2017
, the additions to goodwill relate to our acquisitions as described in
NOTE 3 — Acquisitions and Other Investments
.
As of
December 31, 2017
and
2016
, accumulated goodwill impairment losses in total were
$2.5 billion
, which was associated with our Core OTA segment.
Indefinite-lived Intangible Assets.
Our indefinite-lived intangible assets relate principally to trade names and trademarks acquired in various acquisitions.
Intangible Assets with Definite Lives.
The following table presents the components of our intangible assets with definite lives as of
December 31, 2017
and
2016
:
|
|
December 31, 2017
|
December 31, 2016
|
|||||||||||||||||||||
|
|
Cost
|
Accumulated
Amortization
|
Net
|
Cost
|
Accumulated
Amortization
|
Net
|
|||||||||||||||||
|
|
(In thousands)
|
||||||||||||||||||||||
|
Customer relationships
|
$
|
665,027
|
|
$
|
(304,130
|
)
|
$
|
360,897
|
|
$
|
622,117
|
|
$
|
(185,468
|
)
|
$
|
436,649
|
|
|||||
|
Supplier relationships
|
655,467
|
|
(367,609
|
)
|
287,858
|
|
618,543
|
|
(289,834
|
)
|
328,709
|
|
|||||||||||
|
Technology
|
531,735
|
|
(440,852
|
)
|
90,883
|
|
480,823
|
|
(355,471
|
)
|
125,352
|
|
|||||||||||
|
Domain names
|
131,944
|
|
(70,203
|
)
|
61,741
|
|
117,109
|
|
(53,607
|
)
|
63,502
|
|
|||||||||||
|
Other
|
451,915
|
|
(423,487
|
)
|
28,428
|
|
446,617
|
|
(411,249
|
)
|
35,368
|
|
|||||||||||
|
Total
|
$
|
2,436,088
|
|
$
|
(1,606,281
|
)
|
$
|
829,807
|
|
$
|
2,285,209
|
|
$
|
(1,295,629
|
)
|
$
|
989,580
|
|
|||||
Amortization expense was
$275 million
,
$317 million
and
$156 million
for the years ended
December 31, 2017
,
2016
and
2015
. The estimated future amortization expense related to intangible assets with definite lives as of
December 31, 2017
, assuming no subsequent impairment of the underlying assets, is as follows, in thousands:
|
2018
|
$
|
279,126
|
|
|
2019
|
172,834
|
|
|
|
2020
|
133,859
|
|
|
|
2021
|
88,895
|
|
|
|
2022
|
72,411
|
|
|
|
2023 and thereafter
|
82,682
|
|
|
|
Total
|
$
|
829,807
|
|
F- 27
The following table sets forth our outstanding debt:
|
|
December 31,
|
||||||
|
|
2017
|
2016
|
|||||
|
|
(In thousands)
|
||||||
|
7.456% senior notes due 2018
|
$
|
500,000
|
|
$
|
500,000
|
|
|
|
5.95% senior notes due 2020
|
747,829
|
|
747,020
|
|
|||
|
2.5% (€650 million) senior notes due 2022
|
774,882
|
|
677,503
|
|
|||
|
4.5% senior notes due 2024
|
495,159
|
|
494,472
|
|
|||
|
5.0% senior notes due 2026
|
741,319
|
|
740,341
|
|
|||
|
3.8% senior notes due 2028
|
989,865
|
|
—
|
|
|||
|
Total debt
(1)
|
4,249,054
|
|
3,159,336
|
|
|||
|
Current maturities of long-term debt
|
(500,000
|
)
|
—
|
|
|||
|
Long-term debt,
excluding current maturities
|
$
|
3,749,054
|
|
$
|
3,159,336
|
|
|
___________________________________
|
(1)
|
Net of discounts and debt issuance costs.
|
Our
$500 million
in registered senior unsecured notes outstanding at
December 31, 2017
are due in
August 2018
and bear interest at
7.456%
(the “
7.456%
Notes”). Interest is payable semi-annually in February and August of each year. At any time Expedia may redeem the
7.456%
Notes at a redemption price of
100%
of the principal plus accrued interest, plus a “make-whole” premium, in whole or in part.
Our
$750 million
in registered senior unsecured notes outstanding at
December 31, 2017
are due in
August 2020
and bear interest at
5.95%
(the “
5.95%
Notes”). The
5.95%
Notes were issued at
99.893%
of par resulting in a discount, which is being amortized over their life. Interest is payable semi-annually in February and August of each year. We may redeem the
5.95%
Notes at a redemption price of
100%
of the principal plus accrued interest, plus a “make-whole” premium, in whole or in part.
Our Euro
650 million
of registered senior unsecured notes outstanding at
December 31, 2017
are due in
June 2022
and bear interest at
2.5%
(the “
2.5%
Notes”). The
2.5%
Notes were issued at
99.525%
of par resulting in a discount, which is being amortized over their life. Interest is payable annually in arrears in June of each year, beginning June 3, 2016. We may redeem the
2.5%
Notes at our option, at whole or in part, at any time or from time to time. If we elect to redeem the
2.5%
Notes prior to March 3, 2022, we may redeem them at a specified “make-whole” premium. If we elect to redeem the
2.5%
Notes on or after March 3, 2022, we may redeem them at a redemption price of
100%
of the principal plus accrued and unpaid interest. Subject to certain limited exceptions, all payments of interest and principal for the
2.5%
Notes will be made in Euros.
Our
$500 million
in registered senior unsecured notes outstanding at
December 31, 2017
are due in
August 2024
and bear interest at
4.5%
(the “
4.5%
Notes”). The
4.5%
Notes were issued at
99.444%
of par resulting in a discount, which is being amortized over their life. Interest is payable semi-annually in February and August of each year. We may redeem the
4.5%
Notes at our option at any time in whole or from time to time in part. If we elect to redeem the
4.5%
Notes prior to May 15, 2024, we may redeem them at a redemption price of
100%
of the principal plus accrued interest, plus a “make-whole” premium. If we elect to redeem the
4.5%
Notes on or after May 15, 2024, we may redeem them at a redemption price of
100%
of the principal plus accrued interest.
Our
$750 million
in registered senior unsecured notes outstanding at
December 31, 2017
are due in
February 2026
and bear interest at
5.0%
(the “
5.0%
Notes”). The
5.0%
Notes were issued at
99.535%
of par resulting in a discount, which is being amortized over their life. Interest is payable semi-annually in arrears in February and August of each year. We may redeem the
5.0%
Notes at our option at any time in whole or from time to time in part. If we elect to redeem the
5.0%
Notes prior to November 12, 2025, we may redeem them at a redemption price of
100%
of the principal plus accrued interest, plus a “make-whole” premium. If we elect to redeem the
5.0%
Notes on or after November 12, 2025, we may redeem them at a redemption price of
100%
of the principal plus accrued interest.
In September 2017, we privately placed
$1 billion
of senior unsecured notes that are due in February 2028 and bear interest at
3.8%
. In January 2018, we completed an offer to exchange these notes for registered notes having substantially the same financial terms and covenants as the original notes (the unregistered and registered notes collectively, the "
3.8%
Notes"). The
3.8%
Notes were issued at
99.747%
of par resulting in a discount, which is being amortized over their life. Interest is payable semi-annually in arrears in February and August of each year, beginning February 15, 2018. We may redeem the
3.8%
F- 28
Notes at our option at any time in whole or from time to time in part. If we elect to redeem the
3.8%
Notes prior to November 15, 2027, we may redeem them at a redemption price of
100%
of the principal plus accrued interest, plus a “make-whole” premium. If we elect to redeem the
3.8%
Notes on or after November 15, 2027, we may redeem them at a redemption price of
100%
of the principal plus accrued interest.
The
7.456%
,
5.95%
,
2.5%
4.5%
,
5.0%
and
3.8%
Notes (collectively the “Notes”) are senior unsecured obligations issued by Expedia and guaranteed by certain domestic Expedia subsidiaries. The Notes rank equally in right of payment with all of our existing and future unsecured and unsubordinated obligations of Expedia and the guarantor subsidiaries. For further information, see
NOTE 22 — Guarantor and Non-Guarantor Supplemental Financial Information
. In addition, the Notes include covenants that limit our ability to (i) create certain liens, (ii) enter into sale/leaseback transactions and (iii) merge or consolidate with or into another entity or transfer substantially all of our assets. Accrued interest related to the Notes was
$75 million
and
$63 million
as of
December 31, 2017
and
2016
. The
5.95%
,
2.5%
,
4.5%
,
5.0%
and
3.8%
Notes are redeemable in whole or in part, at the option of the holders thereof, upon the occurrence of certain change of control triggering events at a purchase price in cash equal to
101%
of the principal plus accrued and unpaid interest.
The following table sets forth the approximate fair value of our outstanding debt, which is based on quoted market prices in less active markets (Level 2 inputs):
___________________________________
|
|
December 31,
|
||||||
|
|
2017
|
2016
|
|||||
|
|
(In thousands)
|
||||||
|
7.456% senior notes due 2018
|
$
|
516,000
|
|
$
|
541,000
|
|
|
|
5.95% senior notes due 2020
|
810,000
|
|
823,000
|
|
|||
|
2.5% (€650 million) senior notes due 2022
(1)
|
828,000
|
|
718,000
|
|
|||
|
4.5% senior notes due 2024
|
528,000
|
|
511,000
|
|
|||
|
5.0% senior notes due 2026
|
807,000
|
|
782,000
|
|
|||
|
3.8% senior notes due 2028
|
969,000
|
|
—
|
|
|||
|
(1)
|
Approximately
690 million
Euro as of
December 31, 2017
and
682 million
Euro as of
December 31, 2016
.
|
Credit Facility
As of
December 31, 2017
, Expedia, Inc. maintained a
$1.5 billion
unsecured revolving credit facility with a group of lenders, which is unconditionally guaranteed by certain domestic Expedia subsidiaries that are the same as under the Notes and expires in February 2021. As of
December 31, 2017
and 2016, we had no revolving credit facility borrowings outstanding. The facility bears interest based on the Company’s credit ratings, with drawn amounts bearing interest at LIBOR plus
137.5
basis points and the commitment fee on undrawn amounts at
17.5
basis points as of
December 31, 2017
. The facility contains covenants including maximum leverage and minimum interest coverage ratios.
The amount of stand-by letters of credit (“LOCs”) issued under the facility reduces the credit amount available. As of
December 31, 2017
and 2016, there was
$14 million
and
$19 million
of outstanding stand-by LOCs issued under the facility.
In addition, one of our international subsidiaries maintains a Euro
50 million
uncommitted credit facility, which is guaranteed by Expedia, Inc. and may be terminated at any time by the lender. As of
December 31, 2017
and 2016, we had
no
borrowings outstanding under this facility.
Our U.S. employees are generally eligible to participate in a retirement and savings plan that qualifies under Section 401(k) of the Internal Revenue Code. Participating employees may contribute up to
50%
of their pretax salary, but not more than statutory limits. We contribute fifty cents for each dollar a participant contributes in this plan, with a maximum contribution of
3%
of a participant’s earnings. Our contribution vests with the employee after the employee completes
two years of service
. Participating employees have the option to invest in our common stock, but there is no requirement for participating employees to invest their contribution or our matching contribution in our common stock. We also have various defined contribution plans for our international employees. Our contributions to these benefit plans were
$60 million
,
$53 million
and
$41 million
for the years ended
December 31, 2017
,
2016
and
2015
.
F- 29
Pursuant to the Amended and Restated Expedia, Inc. 2005 Stock and Annual Incentive Plan, we may grant restricted stock, restricted stock awards, RSUs, stock options and other stock-based awards to directors, officers, employees and consultants. As of
December 31, 2017
, we had approximately
13 million
shares of common stock reserved for new stock-based awards under the 2005 Stock and Annual Incentive Plan. We issue new shares to satisfy the exercise or release of stock-based awards. In 2017, we introduced an equity choice program for annual awards that allows for the choice of stock options or RSUs with certain limitations. During 2016 and 2015, we awarded stock options as our primary form of stock-based compensation.
The following table presents a summary of our stock option activity:
|
Options
|
Weighted Average
Exercise Price
|
Remaining
Contractual Life
|
Aggregate
Intrinsic Value
|
|||||||||
|
|
(In thousands)
|
|
(In years)
|
(In thousands)
|
||||||||
|
Balance as of January 1, 2015
|
14,435
|
|
$
|
49.33
|
|
|||||||
|
Granted
|
7,572
|
|
94.13
|
|
||||||||
|
Exercised
|
(4,201
|
)
|
34.57
|
|
||||||||
|
Cancelled
|
(751
|
)
|
74.06
|
|
||||||||
|
Balance as of December 31, 2015
|
17,055
|
|
71.77
|
|
||||||||
|
Granted
|
5,670
|
|
105.37
|
|
||||||||
|
Exercised
|
(2,686
|
)
|
47.57
|
|
||||||||
|
Cancelled
|
(1,198
|
)
|
91.62
|
|
||||||||
|
Balance as of December 31, 2016
|
18,841
|
|
84.07
|
|
||||||||
|
Granted
|
3,618
|
|
124.08
|
|
||||||||
|
Exercised
|
(3,422
|
)
|
62.67
|
|
||||||||
|
Cancelled
|
(3,384
|
)
|
96.86
|
|
||||||||
|
Balance as of December 31, 2017
|
15,653
|
|
95.23
|
|
4.4
|
$
|
402,509
|
|
||||
|
Exercisable as of December 31, 2017
|
5,903
|
|
74.64
|
|
3.1
|
266,849
|
|
|||||
|
Vested and expected to vest after December 31, 2017
|
15,653
|
|
95.23
|
|
4.4
|
402,509
|
|
|||||
The aggregate intrinsic value of outstanding options shown in the stock option activity table above represents the total pretax intrinsic value at
December 31, 2017
, based on our closing stock price of
$119.77
as of the last trading date in
2017
. The total intrinsic value of stock options exercised was
$249 million
,
$181 million
and
$314 million
for the years ended
December 31, 2017
,
2016
and
2015
.
The fair value of stock options granted during the years ended
December 31, 2017
,
2016
and
2015
were estimated at the date of grant using appropriate valuation techniques, including the Black-Scholes and Monte Carlo option-pricing models, assuming the following weighted average assumptions:
|
2017
|
2016
|
2015
|
|||||||||
|
Risk-free interest rate
|
1.58
|
%
|
0.97
|
%
|
1.19
|
%
|
|||||
|
Expected volatility
|
32.47
|
%
|
39.06
|
%
|
41.48
|
%
|
|||||
|
Expected life (in years)
|
3.65
|
|
3.59
|
|
4.06
|
|
|||||
|
Dividend yield
|
0.92
|
%
|
0.91
|
%
|
0.78
|
%
|
|||||
|
Weighted-average estimated fair value of options granted during the year
|
$
|
30.17
|
|
$
|
29.48
|
|
$
|
30.56
|
|
||
In addition to the Expedia, Inc. stock plan, there were certain shares held by trivago employees, which were originally awarded in the form of stock options pursuant to the trivago employee stock option plan and subsequently exercised by such employees. During 2016, we exercised our call right on these shares and elected to do so at a premium to fair value, which resulted in an incremental stock-based compensation charge of approximately
$49 million
pursuant to liability award treatment.
F- 30
The following table presents a summary of RSU activity:
|
RSUs
|
Weighted Average
Grant-Date Fair
Value
|
|||||
|
|
(In thousands)
|
|
||||
|
Balance as of January 1, 2015
|
337
|
|
$
|
61.97
|
|
|
|
Granted
|
1,643
|
|
123.42
|
|
||
|
Vested
|
(493
|
)
|
103.73
|
|
||
|
Cancelled
|
(91
|
)
|
67.11
|
|
||
|
Balance as of December 31, 2015
|
1,396
|
|
119.20
|
|
||
|
Granted
|
691
|
|
109.38
|
|
||
|
Vested
|
(516
|
)
|
118.71
|
|
||
|
Cancelled
|
(222
|
)
|
117.84
|
|
||
|
Balance as of December 31, 2016
|
1,349
|
|
114.58
|
|
||
|
Granted
|
1,350
|
|
123.24
|
|
||
|
Vested
|
(492
|
)
|
115.29
|
|
||
|
Cancelled
|
(266
|
)
|
116.26
|
|
||
|
Balance as of December 31, 2017
|
1,941
|
|
120.19
|
|
||
RSUs, which are stock awards that are granted to employees entitling the holder to shares of our common stock as the award vests, were our primary form of stock-based award prior to 2009. Our RSUs generally vest over
three
or
four
-years, but may accelerate in certain circumstances, including certain changes in control. During 2015, in connection with the acquisitions disclosed in
NOTE 3 — Acquisitions and Other Investments
, we replaced certain unvested employee RSUs of the acquiree with Expedia awards the amount of which is included within granted in the above table.
The total market value of shares vested during the years ended
December 31, 2017
,
2016
and
2015
was
$65 million
,
$57 million
and
$60 million
.
In
2017
, we recognized total stock-based compensation expense of
$149 million
, which included the reversal of
$41 million
of previously recognized stock-based compensation as a result of the departure of our former CEO and the related forfeiture of certain of his stock-based awards within general and administrative expense. In
2016
and
2015
, we recognized total stock-based compensation expense of
$242 million
, including amounts related to trivago discussed above, and
$178 million
. The total income tax benefit related to stock-based compensation expense was
$38 million
,
$56 million
and
$45 million
for
2017
,
2016
and
2015
.
Cash received from stock-based award exercises for the years ended
December 31, 2017
and
2016
was
$213 million
and
$128 million
. Total current income tax benefits during the years ended
December 31, 2017
and
2016
associated with the exercise of stock-based awards held by our employees were
$100 million
and
$76 million
.
During 2015, our Chairman and Senior Executive exercised options to purchase
1.9 million
shares.
0.5 million
shares were withheld and concurrently cancelled by the Company to cover the weighted average exercise price of
$30.38
per share and
0.8 million
shares were withheld and concurrently cancelled to cover tax obligations, with a net delivery of
0.6 million
shares.
As of
December 31, 2017
, there was approximately
$410 million
of unrecognized stock-based compensation expense related to unvested stock-based awards, which is expected to be recognized in expense over a weighted-average period of
2.6 years
.
Employee Stock Purchase Plan
We have an Employee Stock Purchase Plan (“ESPP”), which allows shares of our common stock to be purchased by eligible employees at three-month intervals at
85%
of the fair market value of the stock on the last day of each three-month period. Eligible employees are allowed to contribute up to
10%
of their base compensation. During
2017
,
2016
and
2015
, approximately
141,000
,
139,000
, and
95,000
shares were purchased under this plan for an average price of
$112.31
,
$95.63
and
$93.30
per share. As of
December 31, 2017
, we have reserved approximately
1 million
shares of our common stock for issuance under the ESPP.
F- 31
The Tax Act was enacted in December 2017. The Tax Act significantly changes U.S. tax law by, among other things, lowering U.S. corporate income tax rates, implementing a territorial tax system and imposing a one-time transition tax on deemed repatriated earnings of foreign subsidiaries. The Tax Act reduces the U.S. corporate income tax rate from 35% to 21%, effective January 1, 2018.
Deferred tax assets and liabilities are measured using enacted tax rates expected to apply to taxable income in the years in which those temporary differences are expected to reverse. As a result of the reduction in the U.S. corporate income tax rate from 35% to 21% under the Tax Act, we revalued our ending net deferred tax liabilities at December 31, 2017 and recognized a provisional
$158 million
tax benefit.
The Tax Act provided for a one-time transition tax on the deemed repatriation of post-1986 undistributed foreign subsidiary earnings and profits (“E&P”). We have recognized a provisional
$144 million
of income tax expense related to the transition tax. After utilization of existing net operating loss and tax credits carryforwards, we expect to pay minimal U.S. federal cash taxes on the deemed repatriation.
While the Tax Act provides for a modified territorial tax system, beginning in 2018, global intangible low-taxed income (“GILTI”) provisions will be applied providing an incremental tax on low taxed foreign income. The GILTI provisions require us to include in our U.S. income tax return foreign subsidiary earnings in excess of an allowable return on the foreign subsidiary’s tangible assets. Under U.S. GAAP, we are required to make an accounting policy election to either (1) treat taxes due related to GILTI as a current-period expense when incurred (the “period cost method”) or (2) factor such amounts into our measurement of our deferred taxes (the “deferred method”). We are continuing to evaluate the GILTI tax rules and have not yet adopted our policy to account for the related impacts.
The SEC staff issued Staff Accounting Bulletin No. 118 (“SAB 118”) to address the application of U.S. GAAP in situations when a registrant does not have the necessary information available, prepared, or analyzed (including computations) in reasonable detail to complete the accounting for certain income tax effects of the Tax Act and allows the registrant to record provisional amounts during a measurement period not to extend beyond one year of the enactment date. We have recognized a net tax benefit of
$14 million
for the provisional tax impacts related to the one-time transition tax and the revaluation of deferred tax balances and included these estimates in our consolidated financial statements for the year ended December 31, 2017. We are in the process of analyzing the impact of the various provisions of the Tax Act. The ultimate impact may materially differ from these provisional amounts due to, among other things, additional analysis, changes in interpretations and assumptions we have made, additional regulatory guidance that may be issued, and actions we may take as a result of the Tax Act.
We expect to complete our analysis within the measurement period in accordance with SAB 118.
The following table summarizes our U.S. and foreign income (loss) before income taxes:
|
|
Year Ended December 31,
|
||||||||||
|
|
2017
|
2016
|
2015
|
||||||||
|
|
(In thousands)
|
||||||||||
|
U.S.
|
$
|
(44,867
|
)
|
$
|
(47,205
|
)
|
$
|
24,397
|
|
||
|
Foreign
|
461,631
|
|
323,805
|
|
901,565
|
|
|||||
|
Total
|
$
|
416,764
|
|
$
|
276,600
|
|
$
|
925,962
|
|
||
F- 32
Provision for Income Taxes
The following table summarizes our provision for income taxes:
|
|
Year Ended December 31,
|
||||||||||
|
|
2017
|
2016
|
2015
|
||||||||
|
|
|
(In thousands)
|
|
||||||||
|
Current income tax expense:
|
|||||||||||
|
Federal
|
$
|
12,671
|
|
$
|
(41,418
|
)
|
$
|
154,050
|
|
||
|
State
|
5,862
|
|
5,875
|
|
1,440
|
|
|||||
|
Foreign
|
130,180
|
|
64,946
|
|
69,359
|
|
|||||
|
Current income tax expense
|
148,713
|
|
29,403
|
|
224,849
|
|
|||||
|
Deferred income tax (benefit) expense:
|
|||||||||||
|
Federal
|
(93,842
|
)
|
(5,166
|
)
|
(6,865
|
)
|
|||||
|
State
|
(891
|
)
|
(2,863
|
)
|
2,156
|
|
|||||
|
Foreign
|
(8,575
|
)
|
(6,059
|
)
|
(16,926
|
)
|
|||||
|
Deferred income tax (benefit) expense:
|
(103,308
|
)
|
(14,088
|
)
|
(21,635
|
)
|
|||||
|
Income tax expense
|
$
|
45,405
|
|
$
|
15,315
|
|
$
|
203,214
|
|
||
We reduced our current income tax payable by
$100 million
,
$76 million
and
$130 million
for the years ended
December 31, 2017
,
2016
and
2015
for tax deductions attributable to stock-based compensation.
Deferred Income Taxes
As of
December 31, 2017
and
2016
, the significant components of our deferred tax assets and deferred tax liabilities were as follows:
|
|
December 31,
|
||||||
|
|
2017
|
2016
|
|||||
|
|
(In thousands)
|
||||||
|
Deferred tax assets:
|
|||||||
|
Provision for accrued expenses
|
$
|
49,526
|
|
$
|
94,031
|
|
|
|
Loyalty rewards reserve
|
131,248
|
|
163,410
|
|
|||
|
Occupancy tax reserve
|
11,017
|
|
27,814
|
|
|||
|
Net operating loss and tax credit carryforwards
|
121,896
|
|
114,470
|
|
|||
|
Stock-based compensation
|
51,706
|
|
81,221
|
|
|||
|
Other
|
36,187
|
|
31,569
|
|
|||
|
Total deferred tax assets
|
401,580
|
|
512,515
|
|
|||
|
Less valuation allowance
|
(76,280
|
)
|
(65,516
|
)
|
|||
|
Net deferred tax assets
|
$
|
325,300
|
|
$
|
446,999
|
|
|
|
Deferred tax liabilities:
|
|||||||
|
Prepaid merchant bookings and prepaid expenses
|
$
|
(1,372
|
)
|
$
|
(20,289
|
)
|
|
|
Goodwill and intangible assets
|
(499,190
|
)
|
(718,810
|
)
|
|||
|
Property and equipment
|
(130,736
|
)
|
(152,550
|
)
|
|||
|
Other
|
(4,674
|
)
|
(16,662
|
)
|
|||
|
Total deferred tax liabilities
|
$
|
(635,972
|
)
|
$
|
(908,311
|
)
|
|
|
Net deferred tax liability
|
$
|
(310,672
|
)
|
$
|
(461,312
|
)
|
|
As of
December 31, 2017
, we had federal, state, and foreign net operating loss carryforwards (“NOLs”) of approximately
$65 million
,
$210 million
and
$370 million
. If not utilized, the federal and state NOLs will expire at various times between
2018
and
2037
. Foreign NOLs of
$253 million
may be carried forward indefinitely, and foreign NOLs of
$117 million
will expire at various times between
2018
and
2024
.
As of
December 31, 2017
, we had a valuation allowance of approximately
$76 million
related to certain NOL carryforwards for which it is more likely than not the tax benefit will not be realized. The valuation allowance increased by
$10 million
from the amount recorded as of
December 31, 2016
primarily due to the historic NOL carryforwards of acquired
F- 33
entities in 2017 as well as foreign net operating losses for which realization is not certain. The amount of the deferred tax asset considered realizable, however, could be adjusted if estimates of future taxable income during the carryforward period change, or if objective negative evidence in the form of cumulative losses is no longer present and additional weight may be given to subjective evidence such as our projections for growth.
Due to the one-time transition tax on the deemed repatriation of post-1986 undistributed foreign subsidiary earnings and profits, all previously unremitted earnings for which no U.S. deferred tax liability had been accrued have now been subjected to U.S. federal income tax. To the extent we repatriate these earnings to the United States, we estimate we will not incur significant additional taxes related to such amounts, however our estimates are provisional and subject to further analysis.
Reconciliation of U.S. Federal Statutory Income Tax Rate to Effective Income Tax Rate
A reconciliation of amounts computed by applying the federal statutory income tax rate to income before income taxes to total income tax expense is as follows:
|
|
Year Ended December 31,
|
||||||||||
|
|
2017
|
2016
|
2015
|
||||||||
|
|
|
(In thousands)
|
|
||||||||
|
Income tax expense at the federal statutory rate of 35%
|
$
|
145,867
|
|
$
|
96,810
|
|
$
|
324,087
|
|
||
|
Foreign tax rate differential
|
(81,509
|
)
|
(66,947
|
)
|
(162,784
|
)
|
|||||
|
Unrecognized tax benefits and related interest
|
27,690
|
|
33,170
|
|
33,362
|
|
|||||
|
Change in valuation allowance
|
3,686
|
|
(13,924
|
)
|
27,320
|
|
|||||
|
Return to provision true-ups
|
686
|
|
(14,420
|
)
|
(8,875
|
)
|
|||||
|
Pay-to-play penalties
|
—
|
|
—
|
|
(11,222
|
)
|
|||||
|
Acquisition related costs
|
1,554
|
|
1,611
|
|
12,545
|
|
|||||
|
Federal research and development credit
|
(16,000
|
)
|
(15,000
|
)
|
(11,500
|
)
|
|||||
|
trivago stock-based-compensation
|
5,011
|
|
16,956
|
|
—
|
|
|||||
|
Excess tax benefits related to stock-based compensation
|
(59,668
|
)
|
(39,751
|
)
|
—
|
|
|||||
|
Tax Act transition tax
|
144,167
|
|
—
|
|
—
|
|
|||||
|
U.S. statutory tax rate change
|
(158,286
|
)
|
—
|
|
—
|
|
|||||
|
Other, net
|
32,207
|
|
16,810
|
|
281
|
|
|||||
|
Income tax expense
|
$
|
45,405
|
|
$
|
15,315
|
|
$
|
203,214
|
|
||
Our effective tax rate in 2017, 2016 and 2015 was lower than the 35% federal statutory income tax rate due to earnings in foreign jurisdictions outside of the United States, primarily Switzerland, where the statutory income tax rate is lower. In addition, excess tax benefits relating to share-based payments also decrease our effective tax rate in 2017 and 2016.
The increase in our effective tax rate for 2017 compared to 2016 was primarily due to one-time tax benefits in the prior year period including release of a valuation allowance and return to provision true-ups, as well as an increase in losses generated in foreign jurisdictions at tax rates below the 35% federal statutory rate. The effects of the provisional income inclusion for the deemed repatriation transition tax pursuant to the Tax Act were negated by the benefit of the provisional remeasurement of our net deferred tax liability.
Uncertain Tax Positions
A reconciliation of the beginning and ending amount of gross unrecognized tax benefits is as follows:
|
2017
|
2016
|
2015
|
|||||||||
|
|
|
(In thousands)
|
|
||||||||
|
Balance, beginning of year
|
$
|
220,532
|
|
$
|
171,177
|
|
$
|
110,561
|
|
||
|
Increases to tax positions related to the current year
|
35,211
|
|
42,877
|
|
33,880
|
|
|||||
|
Increases to tax positions related to prior years
|
3,544
|
|
8,124
|
|
26,219
|
|
|||||
|
Decreases to tax positions related to prior years
|
(1,069
|
)
|
(2,262
|
)
|
—
|
|
|||||
|
Reductions due to lapsed statute of limitations
|
(2,783
|
)
|
(4,688
|
)
|
(2,525
|
)
|
|||||
|
Settlements during current year
|
(1,213
|
)
|
—
|
|
(100
|
)
|
|||||
|
Interest and penalties
|
6,697
|
|
5,304
|
|
3,142
|
|
|||||
|
Balance, end of year
|
$
|
260,919
|
|
$
|
220,532
|
|
$
|
171,177
|
|
||
F- 34
As of
December 31, 2017
, we had
$261 million
of gross unrecognized tax benefits,
$155 million
of which, if recognized, would affect the effective tax rate. As of
December 31, 2016
, we had
$221 million
of gross unrecognized tax benefits,
$181 million
of which, if recognized, would affect the effective tax rate.
As of
December 31, 2017
and
2016
, total gross interest and penalties accrued was
$22 million
and
$15 million
, respectively. We recognized interest (benefit) expense in
2017
,
2016
and
2015
of
$7 million
,
$5 million
and $
3 million
in connection with our unrecognized tax benefits.
The Company is routinely under audit by federal, state, local and foreign income tax authorities. These audits include questioning the timing and the amount of income and deductions, and the allocation of income and deductions among various tax jurisdictions. The Internal Revenue Service ("IRS") is currently examining Expedia’s U.S. consolidated federal income tax returns for the periods ended December 31, 2009 through December 31, 2013. As of December 31, 2017, for the Expedia, Inc. & Subsidiaries group, statute of limitations for tax years 2009 through 2016 remain open to examination in the federal jurisdiction and most state jurisdictions. For the HomeAway and Orbitz groups, statutes of limitations for tax years 2001 through 2015 remain open to examination in the federal and most state jurisdictions due to net operating loss carryforwards.
During first quarter of 2017, the IRS issued proposed adjustments related to transfer pricing with our foreign subsidiaries for our 2009 to 2010 audit cycle. The proposed adjustments would increase our U.S. taxable income by
$105 million
, which would result in federal tax expense of approximately
$37 million
, subject to interest. We do not agree with the position of the IRS and are formally protesting the IRS position.
We have non-controlling interests in majority owned entities, which are carried at fair value as the non-controlling interests contained certain rights, whereby we could acquire and the minority shareholders could sell to us the additional shares of the companies. A reconciliation of redeemable non-controlling interest for the years ended
December 31, 2017
,
2016
and
2015
is as follows:
|
|
Year Ended December 31,
|
||||||||||
|
|
2017
|
2016
|
2015
|
||||||||
|
(In thousands)
|
|||||||||||
|
Balance, beginning of the period
|
$
|
—
|
|
$
|
658,478
|
|
$
|
560,073
|
|
||
|
Acquisition of redeemable non-controlling interest
|
19,618
|
|
—
|
|
6,829
|
|
|||||
|
Purchase of subsidiary shares at fair value
|
—
|
|
(7,054
|
)
|
—
|
|
|||||
|
Net income (loss) attributable to non-controlling interests
|
2,535
|
|
(22,286
|
)
|
(15,417
|
)
|
|||||
|
Fair value adjustments
|
—
|
|
848,885
|
|
188,579
|
|
|||||
|
Currency translation adjustments
|
—
|
|
(89,436
|
)
|
(90,244
|
)
|
|||||
|
Other
|
181
|
|
(7,611
|
)
|
8,658
|
|
|||||
|
Transfer to non-redeemable non-controlling interest
|
—
|
|
(1,380,976
|
)
|
—
|
|
|||||
|
Balance, end of period
|
$
|
22,334
|
|
$
|
—
|
|
$
|
658,478
|
|
||
The fair value of the redeemable non-controlling interest was determined based on a blended analysis of the present value of future discounted cash flows and market value approach (“Level 3” on the fair value hierarchy). Our significant estimates in the discounted cash flow model included our weighted average cost of capital as well as long-term growth and profitability of the business. Our significant estimates in the market value approach included identifying similar companies with comparable business factors and assessing comparable revenue and operating multiples in estimating the fair value of the business.
In connection with the acquisition of our majority ownership interests in trivago in 2013, we entered into a shareholders agreement with trivago’s founders that contains certain put/call rights whereby we could cause the founders to sell to us, and the founders could cause us to acquire from them, up to
50%
and
100%
of the trivago shares held by them at fair value during two windows. The first window would have closed during the first half of 2016. However, during the second quarter of 2016, we and the founders agreed not to exercise our respective put/call rights during that window and instead to postpone the window while the parties explored the feasibility of an IPO of trivago shares. On December 16, 2016, trivago completed its IPO for proceeds of approximately
$210 million
after deducting discounts, commissions and offering expenses and became a separately listed company on the NASDAQ. Prior to the initial public offering, we owned
63.5%
of trivago. In conjunction with the initial public offering, Expedia and trivago’s founders entered into an Amended and Restated Shareholders’ Agreement under which the original put/call rights were no longer effective and were replaced with a contingent founder held put right whereby Expedia would be obligated to buy all, but not less than all, of a founder’s shares in the event a founder is removed from trivago’s management board under certain circumstances which are within the control of Expedia. Immediately prior to
F- 35
the offering and the effective date of the newly Amended and Restated Shareholders’ Agreement, we adjusted the fair value of our redeemable non-controlling interest to reflect the estimated fair value immediately prior to the offering. We then subsequently reclassified the redeemable non-controlling interest into non-redeemable non-controlling interest on the consolidated balance sheet as the non-controlling interest was no longer redeemable pursuant to the Amended and Restated Shareholders’ Agreement. Post offering, and as of December 31, 2016, our ownership interest and voting interest was approximately
59.7%
and
64.7%
of trivago N.V. and its subsidiaries.
Common Stock and Class B Common Stock
Our authorized common stock consists of
1.6 billion
shares of common stock with par value of
$0.0001
per share, and
400 million
shares of Class B common stock with par value of
$0.0001
per share. Both classes of common stock qualify for and share equally in dividends, if declared by our Board of Directors, and generally vote together on all matters. Common stock is entitled to
1
vote per share and Class B common stock is entitled to
10
votes per share. Holders of common stock, voting as a single, separate class are entitled to elect
25%
of the total number of directors. Class B common stockholders may, at any time, convert their shares into common stock, on a one for one share basis. Upon conversion, the Class B common stock is retired and is not available for reissue. In the event of liquidation, dissolution, distribution of assets or winding-up of Expedia, Inc., the holders of both classes of common stock have equal rights to receive all the assets of Expedia, Inc. after the rights of the holders of the preferred stock, if any, have been satisfied.
Preferred Stock
As of
December 31, 2017
and
2016
, we have
no
preferred stock outstanding.
Share Repurchases
During 2012, 2010, and 2006, our Board of Directors, or the Executive Committee, acting on behalf of the Board of Directors, authorized a repurchase of up to
20 million
outstanding shares of our common stock during each of the respective years and during 2015 authorized a repurchase of up to
10 million
shares of our common stock for a total of
70 million
shares. Shares repurchased under the authorized programs were as follows:
|
|
Year Ended December 31,
|
||||||||||
|
|
2017
|
2016
|
2015
|
||||||||
|
Number of shares repurchased
|
2.3 million
|
|
4.0 million
|
|
0.5 million
|
|
|||||
|
Average price per share
|
$
|
127.04
|
|
$
|
109.64
|
|
$
|
85.27
|
|
||
|
Total cost of repurchases (in millions)
(1)
|
$
|
294
|
|
$
|
436
|
|
$
|
45
|
|
||
___________________________________
|
(1)
|
Amount excludes transaction costs.
|
As of
December 31, 2017
,
4.9 million
shares remain authorized for repurchase under the 2015 authorization with no fixed termination date for the repurchases.
F- 36
Dividends on our Common Stock
In
2017
,
2016
and
2015
, the Executive Committee, acting on behalf of the Board of Directors, declared and paid the following dividends:
|
Declaration Date
|
Dividend
Per Share
|
Record Date
|
Total Amount
(in thousands)
|
Payment Date
|
|||||||||
|
Year ended December 31, 2017:
|
|||||||||||||
|
February 7, 2017
|
$
|
0.28
|
|
March 9, 2017
|
$
|
42,247
|
|
March 30, 2017
|
|||||
|
April 26, 2017
|
0.28
|
|
May 25, 2017
|
42,438
|
|
June 15, 2017
|
|||||||
|
July 26, 2017
|
0.30
|
|
August 24, 2017
|
45,578
|
|
September 14, 2017
|
|||||||
|
October 25, 2017
|
0.30
|
|
November 16, 2017
|
45,512
|
|
December 7, 2017
|
|||||||
|
Year ended December 31, 2016:
|
|||||||||||||
|
February 8, 2016
|
$
|
0.24
|
|
March 10, 2016
|
$
|
36,174
|
|
March 30, 2016
|
|||||
|
April 26, 2016
|
0.24
|
|
May 26, 2016
|
35,773
|
|
June 16, 2016
|
|||||||
|
July 27, 2016
|
0.26
|
|
August 25, 2016
|
39,062
|
|
September 15, 2016
|
|||||||
|
October 24, 2016
|
0.26
|
|
November 17, 2016
|
39,150
|
|
December 8, 2016
|
|||||||
|
Year ended December 31, 2015:
|
|||||||||||||
|
February 4, 2015
|
$
|
0.18
|
|
March 10, 2015
|
$
|
22,895
|
|
March 26, 2015
|
|||||
|
April 29, 2015
|
0.18
|
|
May 28, 2015
|
23,096
|
|
June 18, 2015
|
|||||||
|
July 29, 2015
|
0.24
|
|
August 27, 2015
|
31,182
|
|
September 17, 2015
|
|||||||
|
October 29, 2015
|
0.24
|
|
November 19, 2015
|
31,354
|
|
December 10, 2015
|
|||||||
In addition, in February 2018, the Executive Committee, acting on behalf of the Board of Directors, declared a quarterly cash dividend of
$0.30
per share of outstanding common stock payable on
March 28, 2018
to the stockholders of record as of the close of business on
March 8, 2018
. Future declarations of dividends are subject to final determination by our Board of Directors.
Accumulated Other Comprehensive Income (Loss)
The balance for each class of accumulated other comprehensive loss as of
December 31, 2017
and
2016
is as follows:
|
|
December 31,
|
||||||
|
|
2017
|
2016
|
|||||
|
|
(In thousands)
|
||||||
|
Foreign currency translation adjustments, net of tax
(1)
|
$
|
(142,255
|
)
|
$
|
(280,426
|
)
|
|
|
Net unrealized gain (loss) on available for sale securities, net of tax
(2)
|
(6,678
|
)
|
27
|
|
|||
|
Accumulated other comprehensive loss
|
$
|
(148,933
|
)
|
$
|
(280,399
|
)
|
|
___________________________________
|
(1)
|
Foreign currency translation adjustments, net of tax, includes foreign currency transaction losses at
December 31, 2017
of
$45 million
(
$71 million
before tax) and foreign currency transaction gains at
December 31, 2016
of
$16 million
(
$25 million
before tax) associated with our
2.5%
Notes. The 2.5% Notes are Euro-denominated debt designated as hedges of certain of our Euro-denominated net assets. See
|
|
(2)
|
The net unrealized loss on available for sale securities before tax at
December 31, 2017
was
$9 million
.
|
F- 37
Non-redeemable Non-controlling Interests
As of
December 31, 2017
,
2016
and 2015, our ownership interest in AirAsia-Expedia was approximately
75%
. As of
December 31, 2017
and
2016
, our ownership interest in trivago was approximately
59.6%
and
59.7%
. Prior to our sale of eLong on May 22, 2015, our ownership interest in eLong was approximately
62.4%
. Amounts paid in excess of the respective non-controlling interest were recorded to additional paid-in capital. The following table shows the effects of the changes in non-controlling interest on our equity for the respective periods, in thousands:
|
2017
|
2016
|
2015
|
|||||||||
|
Net income attributable to Expedia, Inc.
|
$
|
377,964
|
|
$
|
281,848
|
|
$
|
764,465
|
|
||
|
Transfers (to) from the non-controlling interest due to:
|
|||||||||||
|
Net decrease in Expedia, Inc.’s paid-in capital related to trivago IPO
|
—
|
|
(32,141
|
)
|
—
|
|
|||||
|
Net increase (decrease) in Expedia, Inc.’s paid-in capital for newly issued eLong shares and other equity activity
|
—
|
|
—
|
|
(4,198
|
)
|
|||||
|
Other
|
2,649
|
|
—
|
|
—
|
|
|||||
|
Net transfers from non-controlling interest
|
2,649
|
|
(32,141
|
)
|
(4,198
|
)
|
|||||
|
Change from net income attributable to Expedia, Inc. and transfers from non-controlling interest
|
$
|
380,613
|
|
$
|
249,707
|
|
$
|
760,267
|
|
||
Basic Earnings Per Share
Basic earnings per share was calculated for the years ended
December 31, 2017
,
2016
and
2015
using the weighted average number of common and Class B common shares outstanding during the period excluding restricted stock and stock held in escrow.
Diluted Earnings Per Share
For the years ended
December 31, 2017
,
2016
and
2015
, we computed diluted earnings per share using (i) the number of shares of common stock and Class B common stock used in the basic earnings per share calculation as indicated above (ii) if dilutive, the incremental common stock that we would issue upon the assumed exercise of stock options and stock warrants and the vesting of RSUs using the treasury stock method, and (iii) other stock-based commitments.
The following table presents our basic and diluted earnings per share:
|
|
Year Ended December 31,
|
||||||||||
|
|
2017
|
2016
|
2015
|
||||||||
|
|
(In thousands, except per share data)
|
||||||||||
|
Net income attributable to Expedia, Inc.
|
$
|
377,964
|
|
$
|
281,848
|
|
$
|
764,465
|
|
||
|
Earnings per share attributable to Expedia, Inc. available to common stockholders:
|
|||||||||||
|
Basic
|
$
|
2.49
|
|
$
|
1.87
|
|
$
|
5.87
|
|
||
|
Diluted
|
2.42
|
|
1.82
|
|
5.70
|
|
|||||
|
Weighted average number of shares outstanding:
|
|||||||||||
|
Basic
|
151,619
|
|
150,367
|
|
130,159
|
|
|||||
|
Dilutive effect of:
|
|||||||||||
|
Options to purchase common stock
|
4,218
|
|
3,874
|
|
3,685
|
|
|||||
|
Other dilutive securities
|
548
|
|
276
|
|
174
|
|
|||||
|
Diluted
|
156,385
|
|
154,517
|
|
134,018
|
|
|||||
Outstanding stock awards that have been excluded from the calculations of diluted earnings per share attributable to common stockholders because their effect would have been antidilutive were approximately
four million
for 2017,
seven million
for
2016
, and
two million
for
2015
.
The earnings per share amounts are the same for common stock and Class B common stock because the holders of each class are legally entitled to equal per share distributions whether through dividends or in liquidation.
F- 38
In connection with activities to centralize and optimize certain operations as well as migrate technology platforms in the prior years, primarily related to previously disclosed acquisitions, we recognized
$17 million
,
$56 million
and
$105 million
in restructuring and related reorganization charges during 2017, 2016 and 2015. The charges were primarily related to employee severance and benefits, including severance amounts under pre-existing written plans and contracts Orbitz had with its employees and incremental retention compensation for exiting employees as well as stock-compensation charges for acceleration of replacement awards pursuant to certain employment agreements. Based on current plans, which are subject to change, and excluding any possible future acquisition integrations, we do not expect material restructuring charges in 2018.
The following table summarizes the restructuring and related reorganization activity for 2015,
2016
and
2017
:
|
Employee Severance
and Benefits
|
Stock-based
Compensation
|
Other
|
Total
|
||||||||||||
|
|
(In thousands)
|
||||||||||||||
|
Accrued liability as of January 1, 2015
|
$
|
10,117
|
|
$
|
—
|
|
$
|
13,658
|
|
$
|
23,775
|
|
|||
|
Charges
|
66,255
|
|
32,749
|
|
5,867
|
|
104,871
|
|
|||||||
|
Payments
|
(29,388
|
)
|
—
|
|
(18,408
|
)
|
(47,796
|
)
|
|||||||
|
Non-cash items
|
(1,095
|
)
|
(32,749
|
)
|
6
|
|
(33,838
|
)
|
|||||||
|
Accrued liability as of December 31, 2015
|
45,889
|
|
—
|
|
1,123
|
|
47,012
|
|
|||||||
|
Charges
|
39,477
|
|
12,690
|
|
3,740
|
|
55,907
|
|
|||||||
|
Payments
|
(66,442
|
)
|
—
|
|
(4,932
|
)
|
(71,374
|
)
|
|||||||
|
Non-cash items
|
(774
|
)
|
(12,690
|
)
|
343
|
|
(13,121
|
)
|
|||||||
|
Accrued liability as of December 31, 2016
|
18,150
|
|
—
|
|
274
|
|
18,424
|
|
|||||||
|
Charges
|
8,380
|
|
—
|
|
8,358
|
|
16,738
|
|
|||||||
|
Payments
|
(19,005
|
)
|
—
|
|
(7,722
|
)
|
(26,727
|
)
|
|||||||
|
Non-cash items
|
810
|
|
—
|
|
69
|
|
879
|
|
|||||||
|
Accrued liability as of December 31, 2017
|
$
|
8,335
|
|
$
|
—
|
|
$
|
979
|
|
$
|
9,314
|
|
|||
Other, net
The following table presents the components of other, net:
|
|
For the Year Ended December 31,
|
||||||||||
|
|
2017
|
2016
|
2015
|
||||||||
|
|
(In thousands)
|
||||||||||
|
Foreign exchange rate gains
(
losses), net
|
$
|
(45,614
|
)
|
$
|
(15,244
|
)
|
$
|
24,787
|
|
||
|
Non-controlling interest basis adjustment
|
1,678
|
|
—
|
|
77,400
|
|
|||||
|
Loss on investments, net
|
(14,318
|
)
|
(12,117
|
)
|
—
|
|
|||||
|
Equity gains (losses) in unconsolidated affiliates
|
232
|
|
(1,490
|
)
|
(13
|
)
|
|||||
|
Other
|
(2,777
|
)
|
(2,829
|
)
|
10,912
|
|
|||||
|
Total
|
$
|
(60,799
|
)
|
$
|
(31,680
|
)
|
$
|
113,086
|
|
||
F- 39
Letters of Credit, Purchase Obligations and Guarantees
We have commitments and obligations that include purchase obligations, guarantees and LOCs, which could potentially require our payment in the event of demands by third parties or contingent events. The following table presents these commitments and obligations as of
December 31, 2017
:
|
|
|
By Period
|
|||||||||||||||||
|
|
Total
|
Less than
1 year
|
1 to 3
years
|
3 to 5
years
|
More than
5 years
|
||||||||||||||
|
|
(In thousands)
|
||||||||||||||||||
|
Purchase obligations
|
$
|
409,802
|
|
$
|
256,834
|
|
$
|
152,968
|
|
$
|
—
|
|
$
|
—
|
|
||||
|
Guarantees
|
135,053
|
|
120,278
|
|
14,775
|
|
—
|
|
—
|
|
|||||||||
|
Letters of credit
|
42,419
|
|
25,653
|
|
11,103
|
|
169
|
|
5,494
|
|
|||||||||
|
$
|
587,274
|
|
$
|
402,765
|
|
$
|
178,846
|
|
$
|
169
|
|
$
|
5,494
|
|
|||||
Our purchase obligations represent the minimum obligations we have under agreements with certain of our vendors. These minimum obligations are less than our projected use for those periods. Payments may be more than the minimum obligations based on actual use.
We have guarantees which consist primarily of bonds relating to tax assessments that we are contesting as well as bonds required by certain foreign countries’ aviation authorities for the potential non-delivery, by us, of packaged travel sold in those countries. The authorities also require that a portion of the total amount of packaged travel sold be bonded. Our guarantees also include certain surety bonds related to various company performance obligations.
Our LOCs consist of stand-by LOCs, underwritten by a group of lenders, which we primarily issue for certain regulatory purposes as well as to certain hotel properties to secure our payment for hotel room transactions. The contractual expiration dates of these LOCs are shown in the table above. There were no material claims made against any stand-by LOCs during the years ended
December 31, 2017
,
2016
and
2015
.
Lease Commitments
We have contractual obligations in the form of operating leases for office space and related office equipment for which we record the related expense on a monthly basis. Certain leases contain periodic rent escalation adjustments and renewal options. Rent expense related to such leases is recorded on a straight-line basis. Operating lease obligations expire at various dates with the latest maturity in
2031
. For the years ended
December 31, 2017
,
2016
and
2015
, we recorded rental expense of
$168 million
,
$147 million
and
$109 million
.
The following table presents our estimated future minimum rental payments under operating leases with noncancelable lease terms that expire after
December 31, 2017
, in thousands:
|
Year ending December 31,
|
|
||
|
2018
|
$
|
138,785
|
|
|
2019
|
121,017
|
|
|
|
2020
|
103,695
|
|
|
|
2021
|
79,192
|
|
|
|
2022
|
72,901
|
|
|
|
2023 and thereafter
|
333,792
|
|
|
|
$
|
849,382
|
|
|
Legal Proceedings
In the ordinary course of business, we are a party to various lawsuits. Management does not expect these lawsuits to have a material impact on the liquidity, results of operations, or financial condition of Expedia. We also evaluate other potential contingent matters, including value-added tax, excise tax, sales tax, transient occupancy or accommodation tax and similar matters. We do not believe that the aggregate amount of liability that could be reasonably possible with respect to these matters would have a material adverse effect on our financial results; however, litigation is inherently uncertain and the actual losses incurred in the event that our legal proceedings were to result in unfavorable outcomes could have a material adverse effect on our business and financial performance.
F- 40
Litigation Relating to Occupancy Taxes.
Ninety-six
lawsuits have been filed by cities, counties and states involving hotel occupancy and other taxes.
Sixteen
lawsuits are currently active. These lawsuits are in various stages and we continue to defend against the claims made in them vigorously. With respect to the principal claims in these matters, we believe that the statutes or ordinances at issue do not apply to the services we provide and, therefore, that we do not owe the taxes that are claimed to be owed. We believe that the statutes or ordinances at issue generally impose occupancy and other taxes on entities that own, operate or control hotels (or similar businesses) or furnish or provide hotel rooms or similar accommodations. To date,
forty-two
of these lawsuits have been dismissed. Some of these dismissals have been without prejudice and, generally, allow the governmental entity or entities to seek administrative remedies prior to pursuing further litigation.
Twenty-eight
dismissals were based on a finding that we and the other defendants were not subject to the local hotel occupancy tax ordinance or that the local government lacked standing to pursue their claims. As a result of this litigation and other attempts by certain jurisdictions to levy such taxes, we have established a reserve for the potential settlement of issues related to hotel occupancy and other taxes, consistent with applicable accounting principles and in light of all current facts and circumstances, in the amount of
$43 million
and
$71 million
as of
December 31, 2017
and
2016
, respectively. It is also reasonably possible that amounts paid in connection with these issues could include up to an additional
$56 million
related to tax, interest and penalties in one jurisdiction. Our settlement reserve is based on our best estimate of probable losses and the ultimate resolution of these contingencies may be greater or less than the liabilities recorded. An estimate for a reasonably possible loss or range of loss in excess of the amount reserved or disclosed cannot be made. Changes to the settlement reserve are included within legal reserves, occupancy tax and other in the consolidated statements of operations.
In addition, we have been audited by the state of Colorado. The state has issued assessments for claimed tax, interest and penalty in the approximate amount of
$23 million
for the periods December 1, 1999 through December 31, 2005 and January 1, 2009 through December 31, 2011. We do not agree with these assessments and have filed protests.
Pay-to-Play.
Certain jurisdictions may assert that we are required to pay any assessed taxes prior to being allowed to contest or litigate the applicability of the ordinances. This prepayment of contested taxes is referred to as “pay-to-play.” Payment of these amounts is not an admission that we believe we are subject to such taxes and, even when such payments are made, we continue to defend our position vigorously. If we prevail in the litigation, for which a pay-to-play payment was made, the jurisdiction collecting the payment will be required to repay such amounts and also may be required to pay interest.
Hawaii (General Excise Tax).
During 2013, the Expedia companies were required to “pay-to-play” and paid a total of
$171 million
in advance of litigation relating to general excise taxes for merchant model hotel reservations in the State of Hawaii. In September 2015, following a ruling by the Hawaii Supreme Court, the State of Hawaii refunded the Expedia companies
$132 million
of the original “pay-to-play” amount. As we had previously expensed the pay-to-play payments in prior periods, we recognized a gain in legal reserves, occupancy tax and other during the third quarter of 2015 related to this matter. Orbitz also received a similar refund of
$22 million
from the State of Hawaii in September 2015. The amount paid, net of refunds, by the Expedia companies and Orbitz to the State of Hawaii in satisfaction of past general excise taxes on their services for merchant model hotel reservations was
$44 million
. The parties reached a settlement relating to Orbitz merchant model hotel tax liabilities, and on October 5, 2016, the Expedia companies paid the State of Hawaii for the tax years 2012 through 2015. The Expedia companies and Orbitz have now resolved all assessments by the State of Hawaii for merchant model hotel taxes through 2015.
The Department of Taxation also issued final assessments for general excise taxes against the Expedia companies, including Orbitz, dated December 23, 2015 for the time period 2000 to 2014 for hotel and car rental revenue for “agency model” transactions. Those assessments are currently under review in the Hawaii tax courts. The Hawaii tax court has scheduled trial on the agency hotel and car rental matters for February 4, 2019. On December 29, 2017, the defendant online travel companies filed a motion for partial summary judgment. The Department of Taxation has asked the tax court to stay proceedings in the agency hotel and car rental case pending a decision by the Hawaii Supreme Court in the merchant model car rental case addressed below. The defendants have opposed that request. On February 5, 2018, the tax court granted the motion to stay.
Final assessments by the Hawaii Department of Taxation for general exercise taxes against the Expedia companies, including Orbitz, relating to merchant car rental transactions during the years 2000 to 2014 are also under review in the Hawaii tax courts. With respect to merchant model car rental transactions at issue for the tax years 2000 through 2013, the Hawaii tax court held on August 5, 2016 that general excise tax is due on the online travel companies’ services to facilitate car rentals. The court further ruled that for merchant model car rentals in Hawaii, the online travel companies are required to pay general excise tax on the total amount paid by consumers, with no credit for tax amounts already remitted by car rental companies to the State of Hawaii for tax years 2000 through 2013, thus resulting in a double tax on the amount paid by consumers to car rental companies for the rental of the vehicle. The court, however, ruled that when car rentals are paid for as part of a vacation package, tax is only due once on the amount paid by consumers to the car rental company for the rental of the vehicle. In addition, the court ruled that the online travel companies are required to pay interest and certain penalties on the amounts due. On April 25, 2017, the court entered a stipulated order and final judgment. On May 15, 2017, the Expedia companies paid
F- 41
under protest the full amount claimed due, or approximately
$16.7 million
, as a condition of appeal. The parties filed notices of cross-appeal from the order. The appeals have been transferred to the Hawaii Supreme Court and oral argument on the merchant car appeals is scheduled for April 5, 2018. The Hawaii tax court’s decision did not resolve “merchant model” car rental transactions for the tax year 2014, which also remain under review.
San Francisco.
During 2009, we were required to “pay-to-play” and paid
$48 million
in advance of litigation relating to occupancy tax proceedings with the city of San Francisco. The city of San Francisco subsequently issued additional assessments of tax, penalties and interest for the time period from the fourth quarter of 2007 through the fourth quarter of 2011 against the online travel companies, including against certain Expedia companies. The additional assessments, including the prepayment of such assessments, were contested by the Expedia companies on the basis that the court has already ruled that taxes are not due from the online travel companies and that binding precedent by the California Court of Appeals precludes the city’s claim for taxes. On May 14, 2014, the court heard oral argument on the Expedia companies’ contest of the prepayment requirement for the additional assessments and held that the Expedia companies were required to prepay in order to litigate the legality of the assessments. On May 26, 2014, the Expedia companies paid
$25.5 million
under protest in order to contest the additional assessments. The additional assessments were expensed during the second quarter of 2014. In addition, Orbitz in total has paid
$4.6 million
to the city of San Francisco to contest these assessments issued against it by the city. On August 6, 2014, the California Court of Appeals stayed this case pending review and decision by the California Supreme Court of the
City of San Diego, California Litigation.
The stay is now lifted and the appeal is proceeding.
Other Jurisdictions.
We are also in various stages of inquiry or audit with domestic and foreign tax authorities, some of which, including in the United Kingdom regarding the application of value added tax (“VAT”) to our European Union related transactions as discussed below, impose a pay-to-play requirement to challenge an adverse inquiry or audit result in court.
The ultimate resolution of these contingencies may be greater or less than the pay-to-play payments made and our estimates of additional assessments mentioned above.
Matters Relating to International VAT
. We are in various stages of inquiry or audit in multiple European Union jurisdictions, including in the United Kingdom, regarding the application of VAT to our European Union related transactions. While we believe we comply with applicable VAT laws, rules and regulations in the relevant jurisdictions, the tax authorities may determine that we owe additional taxes. In certain jurisdictions, including the United Kingdom, we may be required to “pay-to-play” any VAT assessment prior to contesting its validity. While we believe that we will be successful based on the merits of our positions with regard to the United Kingdom and other VAT audits in pay-to-play jurisdictions, it is nevertheless reasonably possible that we could be required to pay any assessed amounts in order to contest or litigate the applicability of any assessments and an estimate for a reasonably possible amount of any such payments cannot be made.
Competition and Consumer Matters.
Over the last several years, the online travel industry has become the subject of investigations by various national competition authorities ("NCAs"), particularly in Europe. Expedia is or has been involved in investigations predominately related to whether certain parity clauses in contracts between Expedia entities and accommodation providers, sometimes also referred to as "most favored nation" or "MFN" provisions, are anti-competitive.
In Europe, investigations or inquiries into contractual parity provisions between hotels and online travel companies, including Expedia, were initiated in 2012, 2013 and 2014 by NCAs in Austria, Belgium, Czech Republic, Denmark, France, Germany, Greece, Hungary, Ireland, Italy, Poland, Sweden and Switzerland. While the ultimate outcome of some of these investigations or inquiries remains uncertain, and Expedia’s circumstances are distinguishable from other online travel companies subject to similar investigations and inquiries, we note in this context that on April 21, 2015, the French, Italian and Swedish NCAs, working in close cooperation with the European Commission, announced that they had accepted formal commitments offered by Booking.com to resolve and close the investigations against Booking.com in France, Italy and Sweden by Booking.com removing and/or modifying certain rate, conditions and availability parity provisions in its contracts with accommodation providers in France, Italy and Sweden as of July 1, 2015, among other commitments. Booking.com voluntarily extended the geographic scope of these commitments to accommodation providers throughout Europe as of the same date.
With effect from August 1, 2015, Expedia waived certain rate, conditions and availability parity clauses in its agreements with its European hotel partners for a period of five years. While Expedia maintains that its parity clauses have always been lawful and in compliance with competition law, these waivers were nevertheless implemented as a positive step towards facilitating the closure of the open investigations into such clauses on a harmonized pan-European basis. Following the implementation of Expedia's waivers, nearly all NCAs in Europe have announced either the closure of their investigation or inquiries involving Expedia or a decision not to open an investigation or inquiry involving Expedia. Below are descriptions of additional rate parity-related matters of note in Europe.
The German Federal Cartel Office ("FCO") has required another online travel company, Hotel Reservation Service ("HRS"), to remove certain clauses from its contracts with hotels. HRS’ appeal of this decision was rejected by the Higher Regional Court Düsseldorf on January 9, 2015. On December 23, 2015, the FCO announced that it had also required
F- 42
Booking.com by way of an infringement decision to remove certain clauses from its contracts with German hotels. Booking.com has appealed the decision and the appeal was heard by the Higher Regional Court Düsseldorf on February 8, 2017. Those proceedings remain ongoing.
The Italian competition authority's case closure decision against Booking.com and Expedia has subsequently been appealed by two Italian hotel trade associations,
i.e.
Federalberghi and AICA. These appeals remain at an early stage and no hearing date has been fixed.
On November 6, 2015, the Swiss competition authority announced that it had issued a final decision finding certain parity terms existing in previous versions of agreements between Swiss hotels and each of Expedia, Booking.com and HRS to be prohibited under Swiss law. The decision explicitly notes that Expedia's current contract terms with Swiss hotels are not subject to this prohibition. The Swiss competition authority imposed no fines or other sanctions against Expedia and did not find an abuse of a dominant market position by Expedia. The FCO’s case against Expedia’s contractual parity provisions with accommodation providers in Germany remains open but is still at a preliminary stage with no formal allegations of wrong-doing having been communicated to Expedia to date.
The Directorate General for Competition, Consumer Affairs and Repression of Fraud (the “DGCCRF”), a directorate of the French Ministry of Economy and Finance with authority over unfair trading practices, brought a lawsuit in France against Expedia entities objecting to certain parity clauses in contracts between Expedia entities and French hotels. In May 2015, the French court ruled that certain of the parity provisions in certain contracts that were the subject of the lawsuit were not in compliance with French commercial law, but imposed no fine and no injunction. The DGCCRF appealed the decision and, on June 21, 2017, the Paris Court of Appeal published a judgment overturning the decision. The court annulled parity clauses contained in the agreements at issue, ordered Expedia to amend its contracts, and imposed a fine. Expedia has appealed the decision. The appeal will not stay payment of the fine and we have recorded a related reserve.
Hotelverband Deutschland (“IHA”) e.V. (a German hotel association) brought proceedings before the Cologne regional court against Expedia, Inc., Expedia.com GmbH and Expedia Lodging Partner Services Sàrl. IHA applied for a ‘cease and desist’ order against these companies in relation to the enforcement of certain rate and availability parity clauses contained in contracts with hotels in Germany. On or around February 16, 2017, the court dismissed IHA’s action and declared the claimant liable for the Expedia defendants’ statutory costs. IHA appealed the decision and, on December 4, 2017, the Court of Appeals rejected IHA’s appeal. The Court of Appeals expressly confirmed that Expedia’s MFNs are in compliance both with European and German competition law. While IHA had indicated an intention to appeal the decision to the Federal Supreme Court, it has not lodged an appeal within the applicable deadline, with the consequence that the Court of Appeals judgment has now become final.
A working group of 10 European NCAs (Belgium, Czech Republic, Denmark, France, Hungary, Ireland, Italy, Netherlands, Sweden and the United Kingdom) and the European Commission has been established by the European Competition Network (“ECN”) at the end of 2015 to monitor the functioning of the online hotel booking sector, following amendments made by a number of online travel companies (including Booking.com and Expedia) in relation to certain parity provisions in their contracts with hotels. The working group issued questionnaires to online travel agencies including Expedia, metasearch sites and hotels in 2016. The underlying results of the ECN monitoring exercise were published on April 6, 2017.
Legislative bodies in France (July 2015), Austria (December 2016) and Italy (August 2017) have also adopted new domestic anti-parity clause legislation. Expedia believes each of these pieces of legislation violates both EU and national legal principles and therefore, Expedia has challenged these laws at the European Commission.
A motion requesting the Swiss government to take action on narrow price parity has been adopted in the Swiss parliament. Moreover, in Belgium, the government is also reviewing narrow parity provisions. The Company is unable to predict whether these proposals in their current form or in another form will ultimately be adopted and, if so, when this might be the case. It is not yet clear how any adopted domestic anti-parity clause legislations and/or any possible future legislation in this area may affect Expedia’s business.
Outside of Europe, a number of NCAs have also opened investigations or inquired about contractual parity provisions in contracts between hotels and online travel companies in their respective territories, including Expedia. A Brazilian hotel sector association -- Forum de Operadores Hoteleiros do Brasil -- filed a complaint with the Brazilian Administrative Council for Economic Defence (“CADE”) against a number of online travel companies, including Booking.com, Decolar.com and Expedia, on July 27, 2016 with respect to parity provisions in contracts between hotels and online travel companies. On September 13, 2016, Expedia submitted its response to the complaint to CADE. In late 2016, Expedia resolved the concerns of the Australia and New Zealand NCAs based on implementation of the waivers substantially similar to those provided to accommodation providers in Europe (on September 1, 2016 in Australia and on October 28, 2016 in New Zealand). More recently, however, the Australian NCA indicated that it has reopened its investigation. Expedia is in ongoing discussions with a limited number of NCAs in other countries in relation to its contracts with hotels. Expedia is currently unable to predict the impact the
F- 43
implementation of the waivers both in Europe and elsewhere will have on Expedia's business, on investigations or inquiries by NCAs in other countries, or on industry practice more generally.
In addition, regulatory authorities in Europe, Australia, and elsewhere have recently initiated market studies, inquiries and investigations into online marketplaces and how information is presented to consumers using those marketplaces, investigating practices such as search results rankings and algorithms, discount claims
,
disclosure of charges, and availability and similar messaging. We are unable to predict the implications of these market studies, inquiries and investigations on Expedia’s business.
Other than described above, we have not accrued a reserve in connection with the market studies, investigations, inquiries or legal proceedings described above either because the likelihood of an unfavorable outcome is not probable or the amount of any loss is not estimable.
Liberty
. Mr. Diller is the Chairman and Senior Executive of Expedia. Subject to the terms of an Amended and Restated Stockholders Agreement between Liberty Expedia Holdings, Inc. (“Liberty Expedia Holdings”) and Mr. Diller, as amended as of November 4, 2016, Mr. Diller also holds an irrevocable proxy to vote shares of Expedia common stock and Class B common stock beneficially owned by Liberty Expedia Holdings (the “Diller Proxy”), which proxy has been assigned by Mr. Diller to Liberty Expedia Holdings as described below.
On November 4, 2016, Liberty Interactive Corporation (“Liberty Interactive”) redeemed a portion of the outstanding shares of its Liberty Ventures common stock in exchange for all of the outstanding shares of Liberty Expedia Holdings, which at that time was a wholly owned subsidiary of Liberty Interactive (the “Liberty Split-Off”). At the time of the Liberty Split-Off, Liberty Expedia Holdings’ assets included all of Liberty Interactive’s interest in Expedia. Pursuant to a Transaction Agreement among Mr. Diller, Liberty Interactive, Liberty Expedia Holdings, John C. Malone and Leslie Malone, dated as of March 24, 2016 and amended and restated effective as of September 22, 2016, at the time of the Liberty Split-Off, for a period ending not later than May 4, 2018 (i) Mr. Diller assigned the Diller Proxy to Liberty Expedia Holdings (the “Diller Assignment”) and (ii) Mr. and Mrs. Malone granted Mr. Diller an irrevocable proxy to vote all shares of Liberty Expedia Holdings Series A common stock and Series B common stock beneficially owned by them upon completion of the Liberty Split-Off or thereafter (the “Malone Proxy”), in each case, subject to certain limitations. As a result, by virtue of the voting power associated with the Malone Proxy, the governance structure at Liberty Expedia Holdings and Mr. Diller’s continuing position as Chairman of Expedia’s Board of Directors, Mr. Diller indirectly controls Expedia until the termination or expiration of the Diller Assignment and Malone Proxy, at which point (and by virtue of the termination of the Diller Assignment), unless the Diller Assignment and Malone Proxy terminate as a result of Mr. Diller’s death or disability, Mr. Diller will have the power to vote directly all shares of Expedia Common Stock and Class B Common Stock beneficially owned by Liberty Expedia Holdings.
In connection with the then-pending Liberty Split-Off, on March 24, 2016, Liberty Interactive and Liberty Expedia Holdings entered into a Reimbursement Agreement with Expedia pursuant to which Liberty Interactive and Liberty Expedia Holdings agreed to reimburse Expedia, up to a specified cap, for certain costs and expenses resulting from the Liberty Split-Off and the above-described proxy arrangements that may be incurred by Expedia with respect to Expedia’s
$1.5 billion
unsecured revolving credit facility and Expedia’s
7.456%
Notes maturing in 2018 and
5.95%
Notes maturing in 2020 (as amended and restated as of September 22, 2016, the “Reimbursement Agreement”).
On September 30, 2016, Expedia received consents from the holders of more than a majority of the aggregate principal amount of its
5.95%
Notes and entered into a supplemental indenture to amend the indenture governing its
5.95%
Notes to conform the definition of “Permitted Holders” to the definition employed in Expedia’s
2.5%
Notes,
4.5%
Notes and
5.0%
Notes, including by specifying that “Permitted Holders” include certain entities succeeding to the interest of Liberty Interactive in Expedia. During 2016, Liberty Interactive reimbursed Expedia approximately
$4 million
for the cost of the consent solicitation pursuant to the terms of the Reimbursement Agreement.
The Reimbursement Agreement constitutes Expedia’s sole and exclusive remedy with respect to any claim arising out of any potential change of control under any contract, debt instrument, agreement or other similar instrument resulting, directly or indirectly, from the Liberty Split-Off or the above-described proxy arrangements entered into in connection with the Liberty Split-Off. On January 3, 2017, other than those provisions relating to Expedia’s remedies described above and certain administrative provisions, the Reimbursement Agreement terminated in accordance with its terms upon the non-occurrence within the 60 day-period following the Liberty Split-Off of certain reimbursement triggers.
F- 44
During
2015
, we issued
264,841
shares of common stock from treasury stock to Liberty Interactive at a price per share of
$85.24
and an aggregate value of approximately
$23 million
pursuant to and in accordance with the preemptive rights as detailed by the Governance Agreement with Liberty Interactive.
IAC/InterActiveCorp.
In addition to serving as our Chairman and Senior Executive, Mr. Diller also serves as Chairman of the Board of Directors and Senior Executive at IAC. The Company and Expedia are related parties since they are under common control, given that Mr. Diller serves as Chairman and Senior Executive of both Expedia and IAC. Each of IAC and Expedia has a
50%
ownership interest in two aircraft that may be used by both companies as well as one aircraft that was held-for-sale as of December 31, 2017. We share equally in fixed and nonrecurring costs for the planes; direct operating costs are pro-rated based on actual usage. As of
December 31, 2017
and
2016
, the net basis in our ownership interest in the planes was
$40 million
and
$30 million
recorded in long-term investments and other assets. In
2017
,
2016
and
2015
, operating and maintenance costs paid directly to the jointly-owned subsidiary for the airplanes were nominal.
We have
four
reportable segments: Core OTA, trivago, HomeAway and Egencia. In addition, eLong was a reportable segment through its disposal on May 22, 2015. Our Core OTA segment, which consists of the aggregation of operating segments, provides a full range of travel and advertising services to our worldwide customers through a variety of brands including: Expedia.com and Hotels.com in the United States and localized Expedia and Hotels.com websites throughout the world, Orbitz, CheapTickets, ebookers, Expedia Affiliate Network, Hotwire.com, Travelocity, Wotif Group, CarRentals.com, Classic Vacations and SilverRail Technologies, Inc. Our trivago segment generates advertising revenue primarily from sending referrals to online travel companies and travel service providers from its hotel metasearch websites. Our HomeAway segment operates an online marketplace for the vacation rental industry. Our Egencia segment provides managed travel services to corporate customers worldwide.
We determined our operating segments based on how our chief operating decision makers manage our business, make operating decisions and evaluate operating performance. Our primary operating metric is adjusted EBITDA. Adjusted EBITDA for our Core OTA and Egencia segments includes allocations of certain expenses, primarily cost of revenue and facilities, and our Core OTA segment includes the total costs of our global supply organizations as well as the realized foreign currency gains or losses related to the forward contracts hedging a component of our net merchant hotel revenue. We base the allocations primarily on transaction volumes and other usage metrics. We do not allocate certain shared expenses such as accounting, human resources, information technology and legal to our reportable segments. We include these expenses in Corporate and Eliminations. Our allocation methodology is periodically evaluated and may change.
Our segment disclosure includes intersegment revenues, which primarily consist of advertising and media services provided by our trivago segment to our Core OTA segment. These intersegment transactions are recorded by each segment at amounts that approximate fair value as if the transactions were between third parties, and therefore, impact segment performance. However, the revenue and corresponding expense are eliminated in consolidation. The elimination of such intersegment transactions is included within Corporate and Eliminations in the table below. In addition, when HomeAway properties are booked through our Core OTA websites and vice versa, the segments split the third-party revenue for management and segment reporting purposes with the majority of the third-party revenue residing with the website marketing the property or room.
Corporate and Eliminations also includes unallocated corporate functions and expenses. In addition, we record amortization of intangible assets and any related impairment, as well as stock-based compensation expense, restructuring and related reorganization charges, legal reserves, occupancy tax and other, and other items excluded from segment operating performance in Corporate and Eliminations. Such amounts are detailed in our segment reconciliation below. Included with eLong’s standalone financial statements for 2015 (through its disposal on May 22, 2015) was approximately
$20 million
of stock-based compensation and intangible amortization.
F- 45
The following tables present our segment information for
2017
,
2016
and
2015
. As a significant portion of our property and equipment is not allocated to our operating segments and depreciation is not included in our segment measure, we do not report the assets by segment as it would not be meaningful. We do not regularly provide such information to our chief operating decision makers.
|
|
Year ended December 31, 2017
|
||||||||||||||||||||||
|
|
Core OTA
|
trivago
|
HomeAway
|
Egencia
|
Corporate &
Eliminations
|
Total
|
|||||||||||||||||
|
|
(In thousands)
|
||||||||||||||||||||||
|
Third-party revenue
|
$
|
7,880,597
|
|
$
|
752,352
|
|
$
|
906,469
|
|
$
|
520,426
|
|
$
|
—
|
|
$
|
10,059,844
|
|
|||||
|
Intersegment revenue
|
—
|
|
413,855
|
|
—
|
|
—
|
|
(413,855
|
)
|
—
|
|
|||||||||||
|
Revenue
|
$
|
7,880,597
|
|
$
|
1,166,207
|
|
$
|
906,469
|
|
$
|
520,426
|
|
$
|
(413,855
|
)
|
$
|
10,059,844
|
|
|||||
|
Adjusted EBITDA
|
$
|
2,068,405
|
|
$
|
5,439
|
|
$
|
201,810
|
|
$
|
94,265
|
|
$
|
(657,414
|
)
|
$
|
1,712,505
|
|
|||||
|
Depreciation
|
(309,842
|
)
|
(9,182
|
)
|
(40,211
|
)
|
(41,077
|
)
|
(213,787
|
)
|
(614,099
|
)
|
|||||||||||
|
Amortization of intangible assets
|
—
|
|
—
|
|
—
|
|
—
|
|
(275,445
|
)
|
(275,445
|
)
|
|||||||||||
|
Stock-based compensation
|
—
|
|
—
|
|
—
|
|
—
|
|
(149,350
|
)
|
(149,350
|
)
|
|||||||||||
|
Legal reserves, occupancy tax and other
|
—
|
|
—
|
|
—
|
|
—
|
|
(25,412
|
)
|
(25,412
|
)
|
|||||||||||
|
Restructuring and related reorganization charges
|
—
|
|
—
|
|
—
|
|
—
|
|
(16,738
|
)
|
(16,738
|
)
|
|||||||||||
|
Realized (gain) loss on revenue hedges
|
(6,323
|
)
|
—
|
|
—
|
|
—
|
|
—
|
|
(6,323
|
)
|
|||||||||||
|
Operating income (loss)
|
$
|
1,752,240
|
|
$
|
(3,743
|
)
|
$
|
161,599
|
|
$
|
53,188
|
|
$
|
(1,338,146
|
)
|
625,138
|
|
||||||
|
Other expense, net
|
(208,374
|
)
|
|||||||||||||||||||||
|
Income before income taxes
|
416,764
|
|
|||||||||||||||||||||
|
Provision for income taxes
|
(45,405
|
)
|
|||||||||||||||||||||
|
Net income
|
371,359
|
|
|||||||||||||||||||||
|
Net loss attributable to non-controlling interests
|
6,605
|
|
|||||||||||||||||||||
|
Net income attributable to Expedia, Inc.
|
$
|
377,964
|
|
||||||||||||||||||||
F- 46
|
|
Year ended December 31, 2016
|
||||||||||||||||||||||
|
|
Core OTA
|
trivago
|
HomeAway
|
Egencia
|
Corporate & Eliminations
|
Total
|
|||||||||||||||||
|
|
(In thousands)
|
||||||||||||||||||||||
|
Third-party revenue
|
$
|
7,083,620
|
|
$
|
538,479
|
|
$
|
689,186
|
|
$
|
462,279
|
|
$
|
—
|
|
$
|
8,773,564
|
|
|||||
|
Intersegment revenue
|
—
|
|
297,318
|
|
—
|
|
—
|
|
(297,318
|
)
|
—
|
|
|||||||||||
|
Revenue
|
$
|
7,083,620
|
|
$
|
835,797
|
|
$
|
689,186
|
|
$
|
462,279
|
|
$
|
(297,318
|
)
|
$
|
8,773,564
|
|
|||||
|
Adjusted EBITDA
|
$
|
1,965,987
|
|
$
|
34,826
|
|
$
|
175,402
|
|
$
|
80,625
|
|
$
|
(641,168
|
)
|
$
|
1,615,672
|
|
|||||
|
Depreciation
|
(255,778
|
)
|
(7,145
|
)
|
(17,842
|
)
|
(31,340
|
)
|
(164,956
|
)
|
(477,061
|
)
|
|||||||||||
|
Amortization of intangible assets
|
—
|
|
—
|
|
—
|
|
—
|
|
(317,141
|
)
|
(317,141
|
)
|
|||||||||||
|
Impairment of intangible assets
|
—
|
|
—
|
|
—
|
|
—
|
|
(34,890
|
)
|
(34,890
|
)
|
|||||||||||
|
Stock-based compensation
|
—
|
|
—
|
|
—
|
|
—
|
|
(242,417
|
)
|
(242,417
|
)
|
|||||||||||
|
Legal reserves, occupancy tax and other
|
—
|
|
—
|
|
—
|
|
—
|
|
(26,498
|
)
|
(26,498
|
)
|
|||||||||||
|
Restructuring and related reorganization charges, excluding stock-based compensation
|
—
|
|
—
|
|
—
|
|
—
|
|
(43,217
|
)
|
(43,217
|
)
|
|||||||||||
|
Realized (gain) loss on revenue hedges
|
(12,746
|
)
|
—
|
|
—
|
|
—
|
|
—
|
|
(12,746
|
)
|
|||||||||||
|
Operating income (loss)
|
$
|
1,697,463
|
|
$
|
27,681
|
|
$
|
157,560
|
|
$
|
49,285
|
|
$
|
(1,470,287
|
)
|
461,702
|
|
||||||
|
Other expense, net
|
(185,102
|
)
|
|||||||||||||||||||||
|
Income before income taxes
|
276,600
|
|
|||||||||||||||||||||
|
Provision for income taxes
|
(15,315
|
)
|
|||||||||||||||||||||
|
Net income
|
261,285
|
|
|||||||||||||||||||||
|
Net loss attributable to non-controlling interests
|
20,563
|
|
|||||||||||||||||||||
|
Net income attributable to Expedia, Inc.
|
$
|
281,848
|
|
||||||||||||||||||||
F- 47
|
|
Year ended December 31, 2015
|
||||||||||||||||||||||||||
|
|
Core OTA
|
trivago
|
HomeAway
(1)
|
Egencia
|
eLong
(2)
|
Corporate & Eliminations
|
Total
|
||||||||||||||||||||
|
|
(In thousands)
|
||||||||||||||||||||||||||
|
Third-party revenue
|
$
|
5,877,213
|
|
$
|
333,024
|
|
$
|
20,222
|
|
$
|
400,115
|
|
$
|
41,743
|
|
$
|
—
|
|
$
|
6,672,317
|
|
||||||
|
Intersegment revenue
|
—
|
|
214,632
|
|
—
|
|
—
|
|
—
|
|
(214,632
|
)
|
—
|
|
|||||||||||||
|
Revenue
|
$
|
5,877,213
|
|
$
|
547,656
|
|
$
|
20,222
|
|
$
|
400,115
|
|
$
|
41,743
|
|
$
|
(214,632
|
)
|
$
|
6,672,317
|
|
||||||
|
Adjusted EBITDA
|
$
|
1,600,042
|
|
$
|
2,856
|
|
$
|
4,011
|
|
$
|
68,116
|
|
$
|
(62,167
|
)
|
$
|
(509,747
|
)
|
$
|
1,103,111
|
|
||||||
|
Depreciation
|
(189,318
|
)
|
(2,113
|
)
|
(742
|
)
|
(24,394
|
)
|
(3,263
|
)
|
(116,850
|
)
|
(336,680
|
)
|
|||||||||||||
|
Amortization of intangible assets
|
—
|
|
—
|
|
—
|
|
—
|
|
—
|
|
(156,458
|
)
|
(156,458
|
)
|
|||||||||||||
|
Impairment of intangible assets
|
—
|
|
—
|
|
—
|
|
—
|
|
—
|
|
(7,207
|
)
|
(7,207
|
)
|
|||||||||||||
|
Stock-based compensation
|
—
|
|
—
|
|
—
|
|
—
|
|
—
|
|
(178,068
|
)
|
(178,068
|
)
|
|||||||||||||
|
Legal reserves, occupancy tax and other
|
—
|
|
—
|
|
—
|
|
—
|
|
—
|
|
104,587
|
|
104,587
|
|
|||||||||||||
|
Restructuring and related reorganization charges, excluding stock-based compensation
|
—
|
|
—
|
|
—
|
|
—
|
|
—
|
|
(72,122
|
)
|
(72,122
|
)
|
|||||||||||||
|
Realized (gain) loss on revenue hedges
|
(43,597
|
)
|
—
|
|
—
|
|
—
|
|
—
|
|
—
|
|
(43,597
|
)
|
|||||||||||||
|
Operating income (loss)
|
$
|
1,367,127
|
|
$
|
743
|
|
$
|
3,269
|
|
$
|
43,722
|
|
$
|
(65,430
|
)
|
$
|
(935,865
|
)
|
413,566
|
|
|||||||
|
Other income, net
|
512,396
|
|
|||||||||||||||||||||||||
|
Income before income taxes
|
925,962
|
|
|||||||||||||||||||||||||
|
Provision for income taxes
|
(203,214
|
)
|
|||||||||||||||||||||||||
|
Net income
|
722,748
|
|
|||||||||||||||||||||||||
|
Net loss attributable to non-controlling interests
|
41,717
|
|
|||||||||||||||||||||||||
|
Net income attributable to Expedia, Inc.
|
$
|
764,465
|
|
||||||||||||||||||||||||
___________________________________
|
(1)
|
Includes results since our acquisition of HomeAway on December 15, 2015.
|
|
(2)
|
Includes results through our disposal of eLong on May 22, 2015.
|
F- 48
Revenue by Services
The following table presents revenue by groups of services for the years ended December 31,
2017
,
2016
and
2015
.
|
Year Ended December 31,
|
|||||||||||
|
2017
|
2016
|
2015
|
|||||||||
|
(In thousands)
|
|||||||||||
|
Lodging
(1)
|
$
|
6,851,171
|
|
$
|
6,020,668
|
|
$
|
4,638,481
|
|
||
|
Advertising and media
|
1,072,656
|
|
807,383
|
|
565,704
|
|
|||||
|
Air
|
783,573
|
|
777,696
|
|
566,123
|
|
|||||
|
Other
(2)
|
1,352,444
|
|
1,167,817
|
|
902,009
|
|
|||||
|
Total revenue
|
$
|
10,059,844
|
|
$
|
8,773,564
|
|
$
|
6,672,317
|
|
||
___________________________________
|
(1)
|
During the first quarter of 2017, we began disclosing lodging revenue, which includes both hotel accommodations as well as alternative accommodations primarily made through HomeAway.
|
|
(2)
|
Other includes car rental, insurance, destination services, cruise and fee revenue related to our corporate travel business, among other revenue streams, none of which are individually material.
|
Geographic Information
The following table presents revenue by geographic area, the United States and all other countries, based on the geographic location of our websites or points of sale with the exception of trivago, which has all been allocated to Germany, the location of its corporate headquarters, for the years ended December 31,
2017
,
2016
and
2015
. No sales to an individual country other than the United States accounted for more than 10% of revenue for the presented years.
|
|
Year Ended December 31,
|
||||||||||
|
|
2017
|
2016
|
2015
|
||||||||
|
|
(In thousands)
|
||||||||||
|
Revenue
|
|||||||||||
|
United States
|
$
|
5,534,466
|
|
$
|
5,036,539
|
|
$
|
3,703,302
|
|
||
|
All other countries
|
4,525,378
|
|
3,737,025
|
|
2,969,015
|
|
|||||
|
$
|
10,059,844
|
|
$
|
8,773,564
|
|
$
|
6,672,317
|
|
|||
The following table presents property and equipment, net for the United States and all other countries, as of December 31,
2017
and
2016
:
|
|
As of December 31,
|
||||||
|
|
2017
|
2016
|
|||||
|
|
(In thousands)
|
||||||
|
Property and equipment, net
|
|||||||
|
United States
|
$
|
1,330,808
|
|
$
|
1,217,952
|
|
|
|
All other countries
|
244,450
|
|
176,952
|
|
|||
|
$
|
1,575,258
|
|
$
|
1,394,904
|
|
||
F- 49
The following table presents the changes in our valuation and qualifying accounts. Other reserves primarily include our accrual of the cost associated with purchases made on our website related to the use of fraudulent credit cards “charged-back” due to payment disputes and cancellation fees.
|
Description
|
Balance at
Beginning of
Period
|
Charges to
Earnings
|
Charges to
Other
Accounts
(1)
|
Deductions
|
Balance at End
of Period
|
||||||||||||||
|
|
(In thousands)
|
||||||||||||||||||
|
2017
|
|||||||||||||||||||
|
Allowance for doubtful accounts
|
$
|
25,278
|
|
$
|
18,567
|
|
$
|
598
|
|
$
|
(13,747
|
)
|
$
|
30,696
|
|
||||
|
Other reserves
|
24,493
|
|
22,368
|
|
|||||||||||||||
|
2016
|
|||||||||||||||||||
|
Allowance for doubtful accounts
|
$
|
27,035
|
|
$
|
12,191
|
|
$
|
(2,554
|
)
|
$
|
(11,394
|
)
|
$
|
25,278
|
|
||||
|
Other reserves
|
29,959
|
|
24,493
|
|
|||||||||||||||
|
2015
|
|||||||||||||||||||
|
Allowance for doubtful accounts
|
$
|
13,760
|
|
$
|
11,513
|
|
$
|
10,309
|
|
$
|
(8,547
|
)
|
$
|
27,035
|
|
||||
|
Other reserves
|
25,258
|
|
29,959
|
|
|||||||||||||||
___________________________________
|
(1)
|
Charges to other accounts primarily relates to amounts acquired through acquisitions and net translation adjustments.
|
|
|
Three Months Ended
|
||||||||||||||
|
|
December 31
|
September 30
|
June 30
|
March 31
|
|||||||||||
|
|
(In thousands, except per share data)
|
||||||||||||||
|
Year ended December 31, 2017
|
|||||||||||||||
|
Revenue
|
$
|
2,319,208
|
|
$
|
2,965,848
|
|
$
|
2,586,052
|
|
$
|
2,188,736
|
|
|||
|
Operating income (loss)
|
113,475
|
|
481,728
|
|
102,768
|
|
(72,833
|
)
|
|||||||
|
Net income (loss) attributable to Expedia, Inc.
|
55,159
|
|
352,238
|
|
56,689
|
|
(86,122
|
)
|
|||||||
|
Basic earnings (loss) per share
(1)
|
$
|
0.36
|
|
$
|
2.32
|
|
$
|
0.37
|
|
$
|
(0.57
|
)
|
|||
|
Diluted earnings (loss) per share
(1)
|
0.35
|
|
2.23
|
|
0.36
|
|
(0.57
|
)
|
|||||||
|
Year ended December 31, 2016
|
|||||||||||||||
|
Revenue
|
$
|
2,092,829
|
|
$
|
2,580,905
|
|
$
|
2,195,869
|
|
$
|
1,903,961
|
|
|||
|
Operating income (loss)
(2)
|
147,186
|
|
386,152
|
|
25,662
|
|
(97,298
|
)
|
|||||||
|
Net income (loss) attributable to Expedia, Inc.
(2)
|
79,457
|
|
279,331
|
|
31,649
|
|
(108,589
|
)
|
|||||||
|
Basic earnings (loss) per share
(1)
|
$
|
0.53
|
|
$
|
1.86
|
|
$
|
0.21
|
|
$
|
(0.72
|
)
|
|||
|
Diluted earnings (loss) per share
(1)
|
0.51
|
|
1.81
|
|
0.21
|
|
(0.72
|
)
|
|||||||
___________________________________
|
(1)
|
Earnings per share is computed independently for each of the quarters presented. Therefore, the sum of the quarterly earnings per share may not equal the total computed for the year.
|
|
(2)
|
During the fourth quarter of 2016, we recognized a
$33 million
impairment charge related to indefinite lived intangible assets.
|
Condensed consolidating financial information of Expedia, Inc. (the “Parent”), our subsidiaries that are guarantors of our debt facility and instruments (the “Guarantor Subsidiaries”), and our subsidiaries that are not guarantors of our debt facility and instruments (the “Non-Guarantor Subsidiaries”) is shown below. The debt facility and instruments are guaranteed by certain of our wholly-owned domestic subsidiaries and rank equally in right of payment with all of our existing and future unsecured and unsubordinated obligations. The guarantees are full, unconditional, joint and several with the exception of certain customary automatic subsidiary release provisions. In this financial information, the Parent and Guarantor Subsidiaries account for investments in their wholly-owned subsidiaries using the equity method.
F- 50
CONDENSED CONSOLIDATING STATEMENT OF OPERATIONS
Year Ended December 31, 2017
|
Parent
|
Guarantor
Subsidiaries
|
Non-Guarantor
Subsidiaries
|
Eliminations
|
Consolidated
|
|||||||||||||||
|
|
(In thousands)
|
||||||||||||||||||
|
Revenue
|
$
|
—
|
|
$
|
7,661,878
|
|
$
|
2,817,310
|
|
$
|
(419,344
|
)
|
$
|
10,059,844
|
|
||||
|
Costs and expenses:
|
|||||||||||||||||||
|
Cost of revenue
|
—
|
|
1,342,847
|
|
430,662
|
|
(16,978
|
)
|
1,756,531
|
|
|||||||||
|
Selling and marketing
|
—
|
|
3,714,710
|
|
1,985,541
|
|
(402,419
|
)
|
5,297,832
|
|
|||||||||
|
Technology and content
|
—
|
|
991,291
|
|
395,504
|
|
(8
|
)
|
1,386,787
|
|
|||||||||
|
General and administrative
|
—
|
|
408,949
|
|
266,951
|
|
61
|
|
675,961
|
|
|||||||||
|
Amortization of intangible assets
|
—
|
|
181,778
|
|
93,667
|
|
—
|
|
275,445
|
|
|||||||||
|
Legal reserves, occupancy tax and other
|
—
|
|
25,412
|
|
—
|
|
—
|
|
25,412
|
|
|||||||||
|
Restructuring and related reorganization charges
|
—
|
|
4,924
|
|
11,814
|
|
—
|
|
16,738
|
|
|||||||||
|
Intercompany (income) expense, net
|
—
|
|
695,328
|
|
(695,328
|
)
|
—
|
|
—
|
|
|||||||||
|
Operating income
|
—
|
|
296,639
|
|
328,499
|
|
—
|
|
625,138
|
|
|||||||||
|
Other income (expense):
|
|||||||||||||||||||
|
Equity in pre-tax earnings of consolidated subsidiaries
|
493,013
|
|
336,300
|
|
—
|
|
(829,313
|
)
|
—
|
|
|||||||||
|
Other, net
|
(179,541
|
)
|
(59,547
|
)
|
30,714
|
|
—
|
|
(208,374
|
)
|
|||||||||
|
Total other income, net
|
313,472
|
|
276,753
|
|
30,714
|
|
(829,313
|
)
|
(208,374
|
)
|
|||||||||
|
Income before income taxes
|
313,472
|
|
573,392
|
|
359,213
|
|
(829,313
|
)
|
416,764
|
|
|||||||||
|
Provision for income taxes
|
64,492
|
|
(67,406
|
)
|
(42,491
|
)
|
—
|
|
(45,405
|
)
|
|||||||||
|
Net income
|
377,964
|
|
505,986
|
|
316,722
|
|
(829,313
|
)
|
371,359
|
|
|||||||||
|
Net loss attributable to non-controlling interests
|
—
|
|
846
|
|
5,759
|
|
—
|
|
6,605
|
|
|||||||||
|
Net income attributable to Expedia, Inc.
|
$
|
377,964
|
|
$
|
506,832
|
|
$
|
322,481
|
|
$
|
(829,313
|
)
|
$
|
377,964
|
|
||||
|
Comprehensive income attributable to Expedia, Inc.
|
$
|
509,430
|
|
$
|
698,106
|
|
$
|
563,978
|
|
$
|
(1,262,084
|
)
|
$
|
509,430
|
|
||||
F- 51
CONDENSED CONSOLIDATING STATEMENT OF OPERATIONS
Year Ended December 31, 2016
|
Parent
|
Guarantor
Subsidiaries
|
Non-Guarantor
Subsidiaries
|
Eliminations
|
Consolidated
|
|||||||||||||||
|
|
(In thousands)
|
||||||||||||||||||
|
Revenue
|
$
|
—
|
|
$
|
6,807,279
|
|
$
|
2,267,516
|
|
$
|
(301,231
|
)
|
$
|
8,773,564
|
|
||||
|
Costs and expenses:
|
|||||||||||||||||||
|
Cost of revenue
|
—
|
|
1,263,828
|
|
346,200
|
|
(13,330
|
)
|
1,596,698
|
|
|||||||||
|
Selling and marketing
|
—
|
|
3,071,762
|
|
1,583,993
|
|
(288,338
|
)
|
4,367,417
|
|
|||||||||
|
Technology and content
|
—
|
|
903,444
|
|
331,230
|
|
345
|
|
1,235,019
|
|
|||||||||
|
General and administrative
|
—
|
|
429,015
|
|
249,185
|
|
92
|
|
678,292
|
|
|||||||||
|
Amortization of intangible assets
|
—
|
|
248,634
|
|
68,507
|
|
—
|
|
317,141
|
|
|||||||||
|
Impairment of intangibles
|
—
|
|
—
|
|
34,890
|
|
—
|
|
34,890
|
|
|||||||||
|
Legal reserves, occupancy tax and other
|
—
|
|
26,498
|
|
—
|
|
—
|
|
26,498
|
|
|||||||||
|
Restructuring and related reorganization charges
|
—
|
|
30,322
|
|
25,585
|
|
—
|
|
55,907
|
|
|||||||||
|
Intercompany (income) expense, net
|
—
|
|
656,273
|
|
(656,273
|
)
|
—
|
|
—
|
|
|||||||||
|
Operating income
|
—
|
|
177,503
|
|
284,199
|
|
—
|
|
461,702
|
|
|||||||||
|
Other income (expense):
|
|||||||||||||||||||
|
Equity in pre-tax earnings of consolidated subsidiaries
|
383,883
|
|
286,016
|
|
—
|
|
(669,899
|
)
|
—
|
|
|||||||||
|
Other, net
|
(162,455
|
)
|
(21,206
|
)
|
(1,441
|
)
|
—
|
|
(185,102
|
)
|
|||||||||
|
Total other income (expense), net
|
221,428
|
|
264,810
|
|
(1,441
|
)
|
(669,899
|
)
|
(185,102
|
)
|
|||||||||
|
Income before income taxes
|
221,428
|
|
442,313
|
|
282,758
|
|
(669,899
|
)
|
276,600
|
|
|||||||||
|
Provision for income taxes
|
60,420
|
|
(50,168
|
)
|
(25,567
|
)
|
—
|
|
(15,315
|
)
|
|||||||||
|
Net income
|
281,848
|
|
392,145
|
|
257,191
|
|
(669,899
|
)
|
261,285
|
|
|||||||||
|
Net loss attributable to non-controlling interests
|
—
|
|
—
|
|
20,563
|
|
—
|
|
20,563
|
|
|||||||||
|
Net income attributable to Expedia, Inc.
|
$
|
281,848
|
|
$
|
392,145
|
|
$
|
277,754
|
|
$
|
(669,899
|
)
|
$
|
281,848
|
|
||||
|
Comprehensive income attributable to Expedia, Inc.
|
$
|
280,297
|
|
$
|
373,649
|
|
$
|
238,299
|
|
$
|
(611,948
|
)
|
$
|
280,297
|
|
||||
F- 52
CONDENSED CONSOLIDATING STATEMENT OF OPERATIONS
Year Ended December 31, 2015
|
Parent
|
Guarantor
Subsidiaries
|
Non-Guarantor
Subsidiaries
(1)
|
Eliminations
|
Consolidated
|
|||||||||||||||
|
|
(In thousands)
|
||||||||||||||||||
|
Revenue
|
$
|
—
|
|
$
|
5,194,549
|
|
$
|
1,682,677
|
|
$
|
(204,909
|
)
|
$
|
6,672,317
|
|
||||
|
Costs and expenses:
|
|||||||||||||||||||
|
Cost of revenue
|
—
|
|
1,009,785
|
|
308,463
|
|
(8,689
|
)
|
1,309,559
|
|
|||||||||
|
Selling and marketing
|
—
|
|
2,347,919
|
|
1,230,059
|
|
(196,892
|
)
|
3,381,086
|
|
|||||||||
|
Technology and content
|
—
|
|
584,560
|
|
245,495
|
|
189
|
|
830,244
|
|
|||||||||
|
General and administrative
|
—
|
|
373,162
|
|
200,268
|
|
483
|
|
573,913
|
|
|||||||||
|
Amortization of intangible assets
|
—
|
|
58,524
|
|
97,934
|
|
—
|
|
156,458
|
|
|||||||||
|
Impairment of intangible assets
|
—
|
|
—
|
|
7,207
|
|
—
|
|
7,207
|
|
|||||||||
|
Legal reserves, occupancy tax and other
|
—
|
|
(104,587
|
)
|
—
|
|
—
|
|
(104,587
|
)
|
|||||||||
|
Restructuring and related reorganization charges
|
—
|
|
76,422
|
|
28,449
|
|
—
|
|
104,871
|
|
|||||||||
|
Intercompany (income) expense, net
|
—
|
|
742,010
|
|
(742,010
|
)
|
—
|
|
—
|
|
|||||||||
|
Operating income
|
—
|
|
106,754
|
|
306,812
|
|
—
|
|
413,566
|
|
|||||||||
|
Other income (expense):
|
|||||||||||||||||||
|
Equity in pre-tax earnings of consolidated subsidiaries
|
839,779
|
|
870,108
|
|
—
|
|
(1,709,887
|
)
|
—
|
|
|||||||||
|
Gain on sale of business
|
—
|
|
—
|
|
508,810
|
|
—
|
|
508,810
|
|
|||||||||
|
Other, net
|
(119,451
|
)
|
64,576
|
|
58,461
|
|
—
|
|
3,586
|
|
|||||||||
|
Total other income, net
|
720,328
|
|
934,684
|
|
567,271
|
|
(1,709,887
|
)
|
512,396
|
|
|||||||||
|
Income before income taxes
|
720,328
|
|
1,041,438
|
|
874,083
|
|
(1,709,887
|
)
|
925,962
|
|
|||||||||
|
Provision for income taxes
|
44,137
|
|
(194,251
|
)
|
(53,100
|
)
|
—
|
|
(203,214
|
)
|
|||||||||
|
Net income
|
764,465
|
|
847,187
|
|
820,983
|
|
(1,709,887
|
)
|
722,748
|
|
|||||||||
|
Net loss attributable to non-controlling interests
|
—
|
|
—
|
|
41,717
|
|
—
|
|
41,717
|
|
|||||||||
|
Net income attributable to Expedia, Inc.
|
$
|
764,465
|
|
$
|
847,187
|
|
$
|
862,700
|
|
$
|
(1,709,887
|
)
|
$
|
764,465
|
|
||||
|
Comprehensive income attributable to Expedia, Inc.
|
$
|
763,202
|
|
$
|
822,898
|
|
$
|
742,132
|
|
$
|
(1,709,887
|
)
|
$
|
618,345
|
|
||||
___________________________________
|
(1)
|
Includes results through our disposal of eLong on May 22, 2015.
|
F- 53
CONDENSED CONSOLIDATING BALANCE SHEET
December 31, 2017
|
Parent
|
Guarantor
Subsidiaries
|
Non-Guarantor
Subsidiaries
|
Eliminations
|
Consolidated
|
|||||||||||||||
|
|
(In thousands)
|
||||||||||||||||||
|
ASSETS
|
|||||||||||||||||||
|
Total current assets
|
$
|
358,251
|
|
$
|
3,493,392
|
|
$
|
2,263,166
|
|
$
|
(575,220
|
)
|
$
|
5,539,589
|
|
||||
|
Investment in subsidiaries
|
10,265,237
|
|
4,249,014
|
|
—
|
|
(14,514,251
|
)
|
—
|
|
|||||||||
|
Intangible assets, net
|
—
|
|
1,735,988
|
|
572,548
|
|
—
|
|
2,308,536
|
|
|||||||||
|
Goodwill
|
—
|
|
6,366,378
|
|
1,862,487
|
|
—
|
|
8,228,865
|
|
|||||||||
|
Other assets, net
|
5,056
|
|
1,677,397
|
|
775,421
|
|
(19,236
|
)
|
2,438,638
|
|
|||||||||
|
TOTAL ASSETS
|
$
|
10,628,544
|
|
$
|
17,522,169
|
|
$
|
5,473,622
|
|
$
|
(15,108,707
|
)
|
$
|
18,515,628
|
|
||||
|
LIABILITIES AND STOCKHOLDERS’ EQUITY
|
|||||||||||||||||||
|
Total current liabilities
|
$
|
750,922
|
|
$
|
6,797,895
|
|
$
|
905,093
|
|
$
|
(575,220
|
)
|
$
|
7,878,690
|
|
||||
|
Long-term debt, excluding current maturities
|
3,749,054
|
|
—
|
|
—
|
|
—
|
|
3,749,054
|
|
|||||||||
|
Other long-term liabilities
|
—
|
|
494,134
|
|
262,084
|
|
(19,236
|
)
|
736,982
|
|
|||||||||
|
Redeemable non-controlling interests
|
—
|
|
9,673
|
|
12,661
|
|
—
|
|
22,334
|
|
|||||||||
|
Stockholders’ equity
|
6,128,568
|
|
10,220,467
|
|
4,293,784
|
|
(14,514,251
|
)
|
6,128,568
|
|
|||||||||
|
TOTAL LIABILITIES AND STOCKHOLDERS’ EQUITY
|
$
|
10,628,544
|
|
$
|
17,522,169
|
|
$
|
5,473,622
|
|
$
|
(15,108,707
|
)
|
$
|
18,515,628
|
|
||||
CONDENSED CONSOLIDATING BALANCE SHEET
December 31, 2016
|
Parent
|
Guarantor
Subsidiaries
|
Non-Guarantor
Subsidiaries
|
Eliminations
|
Consolidated
|
|||||||||||||||
|
|
(In thousands)
|
||||||||||||||||||
|
ASSETS
|
|||||||||||||||||||
|
Total current assets
|
$
|
293,759
|
|
$
|
2,535,711
|
|
$
|
1,829,191
|
|
$
|
(1,208,410
|
)
|
$
|
3,450,251
|
|
||||
|
Investment in subsidiaries
|
9,536,273
|
|
3,410,687
|
|
—
|
|
(12,946,960
|
)
|
—
|
|
|||||||||
|
Intangible assets, net
|
—
|
|
1,921,519
|
|
525,133
|
|
—
|
|
2,446,652
|
|
|||||||||
|
Goodwill
|
—
|
|
6,392,479
|
|
1,549,544
|
|
—
|
|
7,942,023
|
|
|||||||||
|
Other assets, net
|
4,107
|
|
1,608,218
|
|
331,818
|
|
(5,523
|
)
|
1,938,620
|
|
|||||||||
|
TOTAL ASSETS
|
$
|
9,834,139
|
|
$
|
15,868,614
|
|
$
|
4,235,686
|
|
$
|
(14,160,893
|
)
|
$
|
15,777,546
|
|
||||
|
LIABILITIES AND STOCKHOLDERS’ EQUITY
|
|||||||||||||||||||
|
Total current liabilities
|
$
|
981,700
|
|
$
|
5,733,755
|
|
$
|
620,153
|
|
$
|
(1,208,410
|
)
|
$
|
6,127,198
|
|
||||
|
Long-term debt, excluding current maturities
|
3,159,336
|
|
—
|
|
—
|
|
—
|
|
3,159,336
|
|
|||||||||
|
Other long-term liabilities
|
—
|
|
629,634
|
|
173,798
|
|
(5,523
|
)
|
797,909
|
|
|||||||||
|
Stockholders’ equity
|
5,693,103
|
|
9,505,225
|
|
3,441,735
|
|
(12,946,960
|
)
|
5,693,103
|
|
|||||||||
|
TOTAL LIABILITIES AND STOCKHOLDERS’ EQUITY
|
$
|
9,834,139
|
|
$
|
15,868,614
|
|
$
|
4,235,686
|
|
$
|
(14,160,893
|
)
|
$
|
15,777,546
|
|
||||
F- 54
CONDENSED CONSOLIDATING STATEMENT OF CASH FLOWS
Year Ended December 31, 2017
|
Parent
|
Guarantor
Subsidiaries
|
Non-Guarantor
Subsidiaries
|
Consolidated
|
||||||||||||
|
|
(In thousands)
|
||||||||||||||
|
Operating activities:
|
|||||||||||||||
|
Net cash provided by operating activities
|
$
|
—
|
|
$
|
1,310,451
|
|
$
|
488,703
|
|
$
|
1,799,154
|
|
|||
|
Investing activities:
|
|||||||||||||||
|
Capital expenditures, including internal-use software and website development
|
—
|
|
(546,679
|
)
|
(163,651
|
)
|
(710,330
|
)
|
|||||||
|
Purchases of investments
|
—
|
|
(1,221,821
|
)
|
(589,534
|
)
|
(1,811,355
|
)
|
|||||||
|
Sales and maturities of investments
|
—
|
|
875,497
|
|
220,907
|
|
1,096,404
|
|
|||||||
|
Acquisitions, net of cash acquired
|
—
|
|
(169,836
|
)
|
(803
|
)
|
(170,639
|
)
|
|||||||
|
Transfers (to) from related parties
|
—
|
|
(5,031
|
)
|
5,031
|
|
—
|
|
|||||||
|
Other, net
|
—
|
|
6,657
|
|
6,873
|
|
13,530
|
|
|||||||
|
Net cash used in investing activities
|
—
|
|
(1,061,213
|
)
|
(521,177
|
)
|
(1,582,390
|
)
|
|||||||
|
Financing activities:
|
|||||||||||||||
|
Proceeds from issuance of long-term debt, net of debt issuance costs
|
989,600
|
|
—
|
|
—
|
|
989,600
|
|
|||||||
|
Purchases of treasury stock
|
(312,089
|
)
|
—
|
|
—
|
|
(312,089
|
)
|
|||||||
|
Payment of dividends to stockholders
|
(175,775
|
)
|
—
|
|
—
|
|
(175,775
|
)
|
|||||||
|
Proceeds from exercise of equity awards and employee stock purchase plan
|
228,187
|
|
—
|
|
894
|
|
229,081
|
|
|||||||
|
Withholding taxes for stock option exercises
|
(5,398
|
)
|
—
|
|
(3,665
|
)
|
(9,063
|
)
|
|||||||
|
Changes in controlled subsidiaries, net
|
—
|
|
—
|
|
(18,137
|
)
|
(18,137
|
)
|
|||||||
|
Transfers (to) from related parties
|
(724,525
|
)
|
605,047
|
|
119,478
|
|
—
|
|
|||||||
|
Other, net
|
—
|
|
(14,909
|
)
|
(1,194
|
)
|
(16,103
|
)
|
|||||||
|
Net cash provided by financing activities
|
—
|
|
590,138
|
|
97,376
|
|
687,514
|
|
|||||||
|
Effect of exchange rate changes on cash and cash equivalents
|
—
|
|
36,052
|
|
109,588
|
|
145,640
|
|
|||||||
|
Net increase in cash and cash equivalents
|
—
|
|
875,428
|
|
174,490
|
|
1,049,918
|
|
|||||||
|
Cash and cash equivalents at beginning of year
|
—
|
|
425,471
|
|
1,371,340
|
|
1,796,811
|
|
|||||||
|
Cash and cash equivalents at end of year
|
$
|
—
|
|
$
|
1,300,899
|
|
$
|
1,545,830
|
|
$
|
2,846,729
|
|
|||
F- 55
CONDENSED CONSOLIDATING STATEMENT OF CASH FLOWS
Year Ended December 31, 2016
|
Parent
|
Guarantor
Subsidiaries
|
Non-Guarantor
Subsidiaries
|
Consolidated
|
||||||||||||
|
|
(In thousands)
|
||||||||||||||
|
Operating activities:
|
|||||||||||||||
|
Net cash provided by operating activities
|
$
|
—
|
|
$
|
940,191
|
|
$
|
624,143
|
|
$
|
1,564,334
|
|
|||
|
Investing activities:
|
|||||||||||||||
|
Capital expenditures, including internal-use software and website development
|
—
|
|
(635,534
|
)
|
(113,814
|
)
|
(749,348
|
)
|
|||||||
|
Purchases of investments
|
—
|
|
—
|
|
(45,352
|
)
|
(45,352
|
)
|
|||||||
|
Sales and maturities of investments
|
—
|
|
37,830
|
|
23,105
|
|
60,935
|
|
|||||||
|
Acquisitions, net of cash acquired
|
—
|
|
—
|
|
(777
|
)
|
(777
|
)
|
|||||||
|
Transfers (to) from related parties
|
—
|
|
(172,731
|
)
|
172,731
|
|
—
|
|
|||||||
|
Proceeds from sale of business, net of cash divested and disposal costs
|
—
|
|
—
|
|
67,088
|
|
67,088
|
|
|||||||
|
Other, net
|
—
|
|
(50,029
|
)
|
(838
|
)
|
(50,867
|
)
|
|||||||
|
Net cash provided by (used in) investing activities
|
—
|
|
(820,464
|
)
|
102,143
|
|
(718,321
|
)
|
|||||||
|
Financing activities:
|
|||||||||||||||
|
Proceeds from issuance of long-term debt, net of debt issuance costs
|
(2,093
|
)
|
—
|
|
—
|
|
(2,093
|
)
|
|||||||
|
Payment of HomeAway Convertible Notes
|
—
|
|
(401,424
|
)
|
—
|
|
(401,424
|
)
|
|||||||
|
Purchases of treasury stock
|
(455,746
|
)
|
—
|
|
—
|
|
(455,746
|
)
|
|||||||
|
Payment of dividends to stockholders
|
(150,159
|
)
|
—
|
|
—
|
|
(150,159
|
)
|
|||||||
|
Proceeds from exercise of equity awards and employee stock purchase plan
|
141,043
|
|
—
|
|
—
|
|
141,043
|
|
|||||||
|
Withholding taxes for stock option exercises
|
(1,282
|
)
|
—
|
|
—
|
|
(1,282
|
)
|
|||||||
|
Changes in controlled subsidiaries, net
|
—
|
|
—
|
|
208,016
|
|
208,016
|
|
|||||||
|
Transfers (to) from related parties
|
468,511
|
|
(118,179
|
)
|
(350,332
|
)
|
—
|
|
|||||||
|
Other, net
|
(274
|
)
|
(1,484
|
)
|
(27,216
|
)
|
(28,974
|
)
|
|||||||
|
Net cash used in financing activities
|
—
|
|
(521,087
|
)
|
(169,532
|
)
|
(690,619
|
)
|
|||||||
|
Effect of exchange rate changes on cash and cash equivalents
|
—
|
|
(14,865
|
)
|
(20,017
|
)
|
(34,882
|
)
|
|||||||
|
Net increase (decrease) in cash and cash equivalents
|
—
|
|
(416,225
|
)
|
536,737
|
|
120,512
|
|
|||||||
|
Cash and cash equivalents at beginning of year
|
—
|
|
841,696
|
|
834,603
|
|
1,676,299
|
|
|||||||
|
Cash and cash equivalents at end of year
|
$
|
—
|
|
$
|
425,471
|
|
$
|
1,371,340
|
|
$
|
1,796,811
|
|
|||
F- 56
CONDENSED CONSOLIDATING STATEMENT OF CASH FLOWS
Year Ended December 31, 2015
|
Parent
|
Guarantor
Subsidiaries
|
Non-Guarantor
Subsidiaries
|
Consolidated
|
||||||||||||
|
|
(In thousands)
|
||||||||||||||
|
Operating activities:
|
|||||||||||||||
|
Net cash provided by operating activities from continuing operations
|
$
|
—
|
|
$
|
624,327
|
|
$
|
743,718
|
|
$
|
1,368,045
|
|
|||
|
Investing activities:
|
|||||||||||||||
|
Capital expenditures, including internal-use software and website development
|
—
|
|
(709,679
|
)
|
(77,362
|
)
|
(787,041
|
)
|
|||||||
|
Purchases of investments
|
—
|
|
(473,538
|
)
|
(47,791
|
)
|
(521,329
|
)
|
|||||||
|
Sales and maturities of investments
|
—
|
|
327,191
|
|
83,732
|
|
410,923
|
|
|||||||
|
Acquisitions, net of cash acquired
|
(126,779
|
)
|
(1,873,079
|
)
|
(63,791
|
)
|
(2,063,649
|
)
|
|||||||
|
Transfers (to) from related parties
|
126,779
|
|
(303,846
|
)
|
177,067
|
|
—
|
|
|||||||
|
Proceeds from sale of business, net of cash divested and disposal costs
|
—
|
|
—
|
|
523,882
|
|
523,882
|
|
|||||||
|
Other, net
|
—
|
|
54,226
|
|
11,728
|
|
65,954
|
|
|||||||
|
Net cash provided by (used in) investing activities
|
—
|
|
(2,978,725
|
)
|
607,465
|
|
(2,371,260
|
)
|
|||||||
|
Financing activities:
|
|||||||||||||||
|
Proceeds from issuance of long-term debt, net of issuance costs
|
1,441,860
|
|
—
|
|
—
|
|
1,441,860
|
|
|||||||
|
Purchases of treasury stock
|
(60,546
|
)
|
—
|
|
—
|
|
(60,546
|
)
|
|||||||
|
Proceeds from issuance of treasury stock
|
22,575
|
|
—
|
|
—
|
|
22,575
|
|
|||||||
|
Payment of dividends to stockholders
|
(108,527
|
)
|
—
|
|
—
|
|
(108,527
|
)
|
|||||||
|
Proceeds from exercise of equity awards and employee stock purchase plan
|
96,526
|
|
—
|
|
1,190
|
|
97,716
|
|
|||||||
|
Withholding taxes for stock option exercises
|
(85,033
|
)
|
—
|
|
—
|
|
(85,033
|
)
|
|||||||
|
Changes in controlled subsidiaries, net
|
—
|
|
—
|
|
(8,518
|
)
|
(8,518
|
)
|
|||||||
|
Transfers (to) from related parties
|
(1,396,210
|
)
|
2,350,385
|
|
(954,175
|
)
|
—
|
|
|||||||
|
Other, net
|
89,355
|
|
(11,998
|
)
|
27,315
|
|
104,672
|
|
|||||||
|
Net cash provided by (used in) financing activities
|
—
|
|
2,338,387
|
|
(934,188
|
)
|
1,404,199
|
|
|||||||
|
Effect of exchange rate changes on cash and cash equivalents
|
—
|
|
(86,269
|
)
|
(41,116
|
)
|
(127,385
|
)
|
|||||||
|
Net increase (decrease) in cash and cash equivalents
|
—
|
|
(102,280
|
)
|
375,879
|
|
273,599
|
|
|||||||
|
Cash and cash equivalents at beginning of year
|
—
|
|
943,976
|
|
458,724
|
|
1,402,700
|
|
|||||||
|
Cash and cash equivalents at end of year
|
$
|
—
|
|
$
|
841,696
|
|
$
|
834,603
|
|
$
|
1,676,299
|
|
|||
F- 57
Index to Exhibits
|
Exhibit
No.
|
Filed
Herewith
|
Incorporated by Reference
|
||||||||||
|
Exhibit Description
|
Form
|
SEC File No.
|
Exhibit
|
Filing Date
|
||||||||
|
1.1
|
8-K
|
000-51447
|
1.1
|
06/03/2015
|
||||||||
|
2.1
|
8-K
|
000-51447
|
2.1
|
12/21/2012
|
||||||||
|
2.2
|
8-K
|
000-51447
|
2.2
|
12/21/2012
|
||||||||
|
2.3
|
8-K
|
000-51447
|
10.1
|
04/02/2015
|
||||||||
|
2.4
|
8-K
|
000-51447
|
10.2
|
04/02/2015
|
||||||||
|
2.5
|
8-K
|
000-51447
|
2.1
|
05/22/2015
|
||||||||
|
3.1
|
8-K
|
000-51447
|
3.1
|
12/27/2011
|
||||||||
|
3.2
|
8-K
|
000-51447
|
3.3
|
08/15/2005
|
||||||||
|
4.1
|
10-Q
|
000-51447
|
4.1
|
11/14/2006
|
||||||||
|
4.2
|
S-4
|
333-140195
|
4.2
|
01/25/2007
|
||||||||
|
4.3
|
8-K
|
000-51447
|
4.1
|
08/10/2010
|
||||||||
|
4.4
|
8-K
|
001-37429
|
4.1
|
10/03/2016
|
||||||||
|
4.5
|
8-K
|
000-51447
|
4.1
|
08/18/2014
|
||||||||
E- 1
|
4.6
|
8-K
|
000-51447
|
4.2
|
08/18/2014
|
||||||||
|
4.7
|
8-K
|
000-51447
|
4.2
|
06/03/2015
|
||||||||
|
4.8
|
8-K
|
001-37429
|
4.1
|
12/08/2015
|
||||||||
|
4.9
|
8-K
|
001-37429
|
4.1
|
09/21/2017
|
||||||||
|
10.1
|
8-K
|
000-51447
|
10.1
|
12/27/2011
|
||||||||
|
10.2
|
8-K*†
|
001-37938
|
10.6
|
11/07/2016
|
||||||||
|
10.3
|
10-K
|
000-51447
|
10.11
|
02/10/2012
|
||||||||
|
10.4
|
8-K*†
|
001-37938
|
10.7
|
11/07/2016
|
||||||||
|
10.5
|
8-K*†
|
001-37938
|
10.8
|
11/07/2016
|
||||||||
|
10.6
|
S-4/A*†
|
333-210377
|
10.13
|
09/23/2016
|
||||||||
|
10.7
|
8-K*†
|
001-37938
|
10.10
|
11/07/2016
|
||||||||
|
10.8
|
8-K
|
000-51447
|
10.2
|
12/27/2011
|
||||||||
|
10.9
|
10-Q
|
001-37429
|
10.1
|
07/28/2017
|
||||||||
|
10.10
|
8-K
|
000-51447
|
10.1
|
09/11/2014
|
||||||||
E- 2
|
10.11
|
8-K
|
001-37429
|
10.1
|
02/08/2016
|
||||||||
|
10.12
|
10-K
|
001-37429
|
10.14
|
02/10/2017
|
||||||||
|
10.13
|
10-Q
|
000-51447
|
10.1
|
08/03/2007
|
||||||||
|
10.14*
|
DEF 14A
|
001-37429
|
App. A
|
08/23/2016
|
||||||||
|
10.15*
|
S-8
|
333-206990
|
99.1
|
09/17/2015
|
||||||||
|
10.16*
|
S-8
|
333-208548
|
99.10
|
12/15/2015
|
||||||||
|
10.17*
|
DEF14A
|
000-51447
|
App. B
|
04/30/2013
|
||||||||
|
10.18*
|
DEF 14A
|
000-51447
|
App. C
|
04/30/2013
|
||||||||
|
10.19*
|
10-Q
|
000-51447
|
10.1
|
08/01/2014
|
||||||||
|
10.20*
|
10-K
|
001-37429
|
10.22
|
02/10/2017
|
||||||||
|
10.21*
|
10-K
|
001-37429
|
10.23
|
02/10/2017
|
||||||||
|
10.22*
|
10-K
|
000-51447
|
10.13
|
02/19/2009
|
||||||||
|
10.23*
|
10-K
|
000-51447
|
10.17
|
02/19/2009
|
||||||||
|
10.24*
|
10-K
|
000-51447
|
10.20
|
02/06/2015
|
||||||||
|
10.25*
|
8-K/A
|
001-37429
|
10.1
|
09/21/2017
|
||||||||
|
10.26*
|
8-K
|
001-37429
|
10.2
|
03/09/2016
|
||||||||
|
10.27*
|
8-K
|
001-37429
|
10.3
|
03/09/2016
|
||||||||
|
10.28*
|
8-K/A
|
001-37429
|
10.2
|
09/21/2017
|
||||||||
|
10.29*
|
8-K/A
|
001-37429
|
10.3
|
09/21/2017
|
||||||||
|
10.30*
|
8-K
|
000-51447
|
10.1
|
03/04/2015
|
||||||||
E- 3
|
10.31*
|
8-K/A
|
001-37429
|
10.4
|
09/21/2017
|
||||||||
|
10.32*
|
8-K
|
000-51447
|
10.3
|
04/01/2015
|
||||||||
|
21
|
X
|
|||||||||||
|
23.1
|
X
|
|||||||||||
|
31.1
|
X
|
|||||||||||
|
31.2
|
X
|
|||||||||||
|
31.3
|
X
|
|||||||||||
|
32.1***
|
||||||||||||
|
32.2***
|
||||||||||||
|
32.3***
|
||||||||||||
|
101
|
The following financial statements from the Company’s Annual Report on Form 10-K for the year ended December 31, 2017, formatted in XBRL: (i) Consolidated Statements of Operations, (ii) Consolidated Statements of Comprehensive Income, (iii) Consolidated Balance Sheets, (iv) Consolidated Statements of Changes in Stockholders’ Equity, (v) Consolidated Statements of Cash Flows, and (vi) Notes to Consolidated Financial Statements.
|
X
|
||||||||||
|
*
|
Indicates a management contract or compensatory plan or arrangement.
|
|
*†
|
Indicates reference to filing of Liberty Expedia Holdings, Inc.
|
|
***
|
Furnished herewith
|
E- 4
TABLE OF CONTENTS
Part I. Item 4Part II. Item 5. Market For Registrant S Common Equity, Related Stockholder Matters and Issuer Purchases Of Equity SecuritiesPart II. Item 5Part II. Item 6. Selected Financial DataPart II. Item 6Note 12 Redeemable Non-controlling InterestsPart II. Item 7. Management S Discussion and Analysis Of Financial Condition and Results Of OperationsPart II. Item 7Note 2 Significant Accounting PoliciesNote 17 Commitments and ContingenciesNote 10 Stock-based Awards and Other Equity InstrumentsNote 15 Restructuring and Related Reorganization ChargesNote 19 Segment InformationNote 11 Income TaxesNote 13 Stockholders EquityNote 18 Related Party TransactionsPart II. Item 7A. Quantitative and Qualitative Disclosures About Market RiskPart II. Item 7APart II. Item 8. Consolidated Financial Statements and Supplementary DataPart II. Item 8Part II. Item 9. Changes in and Disagreements with Accountants on Accounting and Financial DisclosurePart II. Item 9Part II. Item 9A. Controls and ProceduresPart II. Item 9APart II. Item 9B. Other InformationPart II. Item 9BPart IIIPart III. Item 10. Directors, Executive Officers and Corporate GovernancePart III. Item 10Part III. Item 11. Executive CompensationPart III. Item 11Part III. Item 12. Security Ownership Of Certain Beneficial Owners and Management and Related Stockholder MattersPart III. Item 12Part III. Item 13. Certain Relationships and Related Transactions, and Director IndependencePart III. Item 13Part III. Item 14. Principal Accounting Fees and ServicesPart III. Item 14Part IV. Item 15. Exhibits, Consolidated Financial Statements and Financial Statement SchedulesPart IV. Item 15Note 1 Organization and Basis Of PresentationNote 14 Earnings Per ShareNote 5 Fair Value MeasurementsNote 3 Acquisitions and Other InvestmentsNote 4 Disposition Of BusinessNote 6 Property and Equipment, NetNote 7 Goodwill and Intangible Assets, NetNote 8 DebtNote 22 Guarantor and Non-guarantor Supplemental Financial InformationNote 9 Employee Benefit PlansNote 16 Other Income (expense)Note 20 Valuation and Qualifying AccountsNote 21 Quarterly Financial Information (unaudited)