FORD MOTOR CO
10-Ks and 10-Qs
|
|
|
|
|
|
|
|
|
|
|
|
|
|
|
|
|
|
|
|
|
|
|
|
|
|
|
|
|
|
|
|
|
|
|
|
|
|
|
|
|
|
|
|
|
|
|
|
|
|
|
|
|
|
|
|
UNITED STATES
SECURITIES AND EXCHANGE COMMISSION
Washington, DC 20549
FORM 10-Q
|
(Mark One)
|
|
|
R
|
Quarterly report pursuant to Section 13 or 15(d) of the Securities Exchange Act of 1934
|
|
|
|
|
|
For the quarterly period ended March 31, 2012
|
|
|
|
|
|
or
|
|
|
|
|
o
|
Transition report pursuant to Section 13 or 15(d) of the Securities Exchange Act of 1934
|
|
|
|
|
|
For the transition period from __________ to __________
|
|
|
|
|
|
Commission file number 1-3950
|
Ford Motor Company
(Exact name of Registrant as specified in its charter)
|
Delaware
|
38-0549190
|
|
(State of incorporation)
|
(I.R.S. Employer Identification No.)
|
|
|
|
|
One American Road, Dearborn, Michigan
|
48126
|
|
(Address of principal executive offices)
|
(Zip Code)
|
313-322-3000
(Registrant’s telephone number, including area code)
Indicate by check mark if the registrant (1) has filed all reports required to be filed by Section 13 or 15(d) of the Securities Exchange Act of 1934 during the preceding 12 months (or for such shorter period that the registrant was required to file such reports), and (2) has been subject to such filing requirements for the past 90 days. Yes
R
No
o
Indicate by check mark whether the registrant has submitted electronically and posted on its corporate Web site, if any, every Interactive Data File required to be submitted and posted pursuant to Rule 405 of Regulation S-T (§232.405 of this chapter) during the preceding 12 months (or for such shorter period that the registrant was required to submit and post such files). Yes
R
No
o
Indicate by check mark whether the registrant is a large accelerated filer, an accelerated filer, a non-accelerated filer, or a smaller reporting company. See definitions of "large accelerated filer," "accelerated filer," and "smaller reporting company" in Rule 12b-2 of the Exchange Act. Large accelerated filer
R
Accelerated filer
o
Non-accelerated filer
o
Smaller reporting company
o
Indicate by check mark whether the registrant is a shell company (as defined in Rule 12b-2 of the Act). Yes
o
No
R
As of April 27, 2012, Ford had outstanding 3,745,515,422 shares of Common Stock and 70,852,076 shares of Class B Stock.
Exhibit Index begins on page 75
FORD MOTOR COMPANY
QUARTERLY REPORT ON FORM 10-Q
For the Quarter Ended
March 31, 2012
|
|
Table of Contents
|
Page
|
|
|
|
|
||
|
Item 1
|
Financial Statements
|
||
|
Consolidated Statement of Comprehensive Income
|
|||
|
Item 2
|
|||
|
Other Financial Information
|
|||
|
Item 3
|
|||
|
Automotive
Sector
|
|||
|
Financial Services Sector
|
|||
|
Item 4
|
|||
|
Part II
- Other Information
|
|||
|
Item 1
|
|||
|
Item 2
|
Unregistered Sales of Equity Securities and Use of Proceeds
|
||
|
Item 6
|
|||
|
Signature
|
|||
|
Exhibit Index
|
|||
ITEM 1.
Financial Statements.
FORD MOTOR COMPANY AND SUBSIDIARIES
For the Periods Ended
March 31, 2012
and
2011
(in millions, except per share amounts)
|
First Quarter
|
|||||||
|
|
2012
|
2011
|
|||||
|
|
(unaudited)
|
||||||
|
Revenues
|
|
|
|||||
|
Automotive
|
$
|
30,525
|
|
$
|
31,038
|
|
|
|
Financial Services
|
1,920
|
|
2,076
|
|
|||
|
Total revenues
|
32,445
|
|
33,114
|
|
|||
|
Costs and expenses
|
|
|
|
|
|||
|
Automotive cost of sales
|
26,854
|
|
26,776
|
|
|||
|
Selling, administrative and other expenses
|
2,886
|
|
2,734
|
|
|||
|
Interest expense
|
1,011
|
|
1,174
|
|
|||
|
Financial Services provision for credit and insurance losses
|
(13
|
)
|
(54
|
)
|
|||
|
Total costs and expenses
|
30,738
|
|
30,630
|
|
|||
|
Automotive interest income and other non-operating income/(expense), net (Note 14)
|
152
|
|
40
|
|
|||
|
Financial Services other income/(loss), net (Note 14)
|
84
|
|
85
|
|
|||
|
Equity in net income/(loss) of affiliated companies
|
95
|
|
167
|
|
|||
|
Income/(Loss) before income taxes
|
2,038
|
|
2,776
|
|
|||
|
Provision for/(Benefit from) income taxes (Note 15)
|
640
|
|
220
|
|
|||
|
Net income/(loss)
|
1,398
|
|
2,556
|
|
|||
|
Less: Income/(Loss) attributable to noncontrolling interests
|
2
|
|
5
|
|
|||
|
Net income/(loss) attributable to Ford Motor Company
|
$
|
1,396
|
|
$
|
2,551
|
|
|
|
AMOUNTS PER SHARE ATTRIBUTABLE TO FORD MOTOR COMPANY COMMON AND CLASS B STOCK (Note 16)
|
|||||||
|
Basic income/(loss)
|
$
|
0.37
|
|
$
|
0.68
|
|
|
|
Diluted income/(loss)
|
$
|
0.35
|
|
$
|
0.61
|
|
|
|
Cash dividends declared
|
$
|
0.05
|
|
$
|
—
|
|
|
CONSOLIDATED STATEMENT OF COMPREHENSIVE INCOME
For the Periods Ended
March 31, 2012
and
2011
(in millions)
|
|
First Quarter
|
||||||
|
|
2012
|
2011
|
|||||
|
|
(unaudited)
|
||||||
|
Net income/(loss)
|
$
|
1,398
|
|
$
|
2,556
|
|
|
|
Other comprehensive income/(loss), net of tax (Note 13)
|
|||||||
|
Foreign currency translation
|
523
|
|
588
|
|
|||
|
Derivative instruments
|
(63
|
)
|
117
|
|
|||
|
Pension and other postretirement benefits
|
(40
|
)
|
(78
|
)
|
|||
|
Total other comprehensive income/(loss), net of tax
|
420
|
|
627
|
|
|||
|
Comprehensive income/(loss)
|
1,818
|
|
3,183
|
|
|||
|
Less: Comprehensive income/(loss) attributable to noncontrolling interests
|
2
|
|
3
|
|
|||
|
Comprehensive income/(loss) attributable to Ford Motor Company
|
$
|
1,816
|
|
$
|
3,180
|
|
|
The accompanying notes are part of the financial statements.
1
Item 1. Financial Statements (Continued)
FORD MOTOR COMPANY AND SUBSIDIARIES
SECTOR STATEMENT OF OPERATIONS
For the Periods Ended
March 31, 2012
and
2011
(in millions, except per share amounts)
|
First Quarter
|
|||||||
|
|
2012
|
2011
|
|||||
|
|
(unaudited)
|
||||||
|
AUTOMOTIVE
|
|
|
|||||
|
Revenues
|
$
|
30,525
|
|
$
|
31,038
|
|
|
|
Costs and expenses
|
|||||||
|
Cost of sales
|
26,854
|
|
26,776
|
|
|||
|
Selling, administrative and other expenses
|
2,135
|
|
2,143
|
|
|||
|
Total costs and expenses
|
28,989
|
|
28,919
|
|
|||
|
Operating income/(loss)
|
1,536
|
|
2,119
|
|
|||
|
Interest expense
|
185
|
|
251
|
|
|||
|
Interest income and other non-operating income/(expense), net (Note 14)
|
152
|
|
40
|
|
|||
|
Equity in net income/(loss) of affiliated companies
|
79
|
|
162
|
|
|||
|
Income/(Loss) before income taxes — Automotive
|
1,582
|
|
2,070
|
|
|||
|
FINANCIAL SERVICES
|
|
|
|
|
|||
|
Revenues
|
1,920
|
|
2,076
|
|
|||
|
Costs and expenses
|
|||||||
|
Interest expense
|
826
|
|
923
|
|
|||
|
Depreciation
|
600
|
|
430
|
|
|||
|
Operating and other expenses
|
151
|
|
161
|
|
|||
|
Provision for credit and insurance losses
|
(13
|
)
|
(54
|
)
|
|||
|
Total costs and expenses
|
1,564
|
|
1,460
|
|
|||
|
Other income/(loss), net (Note 14)
|
84
|
|
85
|
|
|||
|
Equity in net income/(loss) of affiliated companies
|
16
|
|
5
|
|
|||
|
Income/(Loss) before income taxes — Financial Services
|
456
|
|
706
|
|
|||
|
TOTAL COMPANY
|
|
|
|
|
|||
|
Income/(Loss) before income taxes
|
2,038
|
|
2,776
|
|
|||
|
Provision for/(Benefit from) income taxes (Note 15)
|
640
|
|
220
|
|
|||
|
Net income/(loss)
|
1,398
|
|
2,556
|
|
|||
|
Less: Income/(Loss) attributable to noncontrolling interests
|
2
|
|
5
|
|
|||
|
Net income/(loss) attributable to Ford Motor Company
|
$
|
1,396
|
|
$
|
2,551
|
|
|
The accompanying notes are part of the financial statements.
2
Item 1. Financial Statements (Continued)
FORD MOTOR COMPANY AND SUBSIDIARIES
(in millions)
|
|
March 31,
2012 |
December 31,
2011 |
|||||
|
|
(unaudited)
|
||||||
|
ASSETS
|
|
|
|||||
|
Cash and cash equivalents
|
$
|
15,244
|
|
$
|
17,148
|
|
|
|
Marketable securities
|
20,783
|
|
18,618
|
|
|||
|
Finance receivables, net (Note 5)
|
69,897
|
|
69,976
|
|
|||
|
Other receivables, net
|
9,904
|
|
8,565
|
|
|||
|
Net investment in operating leases
|
13,476
|
|
12,838
|
|
|||
|
Inventories (Note 7)
|
7,031
|
|
5,901
|
|
|||
|
Equity in net assets of affiliated companies
|
2,964
|
|
2,936
|
|
|||
|
Net property
|
23,150
|
|
22,371
|
|
|||
|
Deferred income taxes
|
14,535
|
|
15,125
|
|
|||
|
Net intangible assets
|
97
|
|
100
|
|
|||
|
Other assets
|
4,994
|
|
4,770
|
|
|||
|
Total assets
|
$
|
182,075
|
|
$
|
178,348
|
|
|
|
LIABILITIES
|
|
|
|
|
|||
|
Payables
|
$
|
19,638
|
|
$
|
17,724
|
|
|
|
Accrued liabilities and deferred revenue (Note 9)
|
44,714
|
|
45,369
|
|
|||
|
Debt (Note 11)
|
100,490
|
|
99,488
|
|
|||
|
Deferred income taxes
|
583
|
|
696
|
|
|||
|
Total liabilities
|
165,425
|
|
163,277
|
|
|||
|
EQUITY
|
|
|
|
|
|||
|
Capital stock
|
|
|
|
|
|||
|
Common Stock, par value $.01 per share (3,763 million shares issued)
|
38
|
|
37
|
|
|||
|
Class B Stock, par value $.01 per share (71 million shares issued)
|
1
|
|
1
|
|
|||
|
Capital in excess of par value of stock
|
20,884
|
|
20,905
|
|
|||
|
Retained earnings/(Accumulated deficit)
|
14,190
|
|
12,985
|
|
|||
|
Accumulated other comprehensive income/(loss) (Note 13)
|
(18,314
|
)
|
(18,734
|
)
|
|||
|
Treasury stock
|
(193
|
)
|
(166
|
)
|
|||
|
Total equity/(deficit) attributable to Ford Motor Company
|
16,606
|
|
15,028
|
|
|||
|
Equity/(Deficit) attributable to noncontrolling interests
|
44
|
|
43
|
|
|||
|
Total equity/(deficit)
|
16,650
|
|
15,071
|
|
|||
|
Total liabilities and equity
|
$
|
182,075
|
|
$
|
178,348
|
|
|
The following table includes assets to be used to settle liabilities of the consolidated variable interest entities ("VIEs"). These assets and liabilities are included in the consolidated balance sheet above. See Note 8 for additional information on our VIEs.
|
March 31,
2012 |
December 31, 2011
|
||||||
|
(unaudited)
|
|||||||
|
ASSETS
|
|
|
|||||
|
Cash and cash equivalents
|
$
|
3,901
|
|
$
|
3,402
|
|
|
|
Finance receivables, net
|
49,977
|
|
49,795
|
|
|||
|
Net investment in operating leases
|
5,695
|
|
6,354
|
|
|||
|
Other assets
|
113
|
|
157
|
|
|||
|
LIABILITIES
|
|
|
|
|
|||
|
Accrued liabilities and deferred revenue
|
128
|
|
97
|
|
|||
|
Debt
|
42,325
|
|
41,421
|
|
|||
The accompanying notes are part of the financial statements.
3
Item 1. Financial Statements (Continued)
FORD MOTOR COMPANY AND SUBSIDIARIES
SECTOR BALANCE SHEET
(in millions)
|
March 31,
2012 |
December 31,
2011 |
||||||
|
ASSETS
|
(unaudited)
|
||||||
|
Automotive
|
|
|
|||||
|
Cash and cash equivalents
|
$
|
7,261
|
|
$
|
7,965
|
|
|
|
Marketable securities
|
15,801
|
|
14,984
|
|
|||
|
Total cash and marketable securities
|
23,062
|
|
22,949
|
|
|||
|
Receivables, less allowances of $127 and $126
|
4,880
|
|
4,219
|
|
|||
|
Inventories (Note 7)
|
7,031
|
|
5,901
|
|
|||
|
Deferred income taxes
|
1,980
|
|
1,791
|
|
|||
|
Net investment in operating leases
|
1,159
|
|
1,356
|
|
|||
|
Other current assets
|
1,066
|
|
1,053
|
|
|||
|
Current receivable from Financial Services
|
1,404
|
|
878
|
|
|||
|
Total current assets
|
40,582
|
|
38,147
|
|
|||
|
Equity in net assets of affiliated companies
|
2,821
|
|
2,797
|
|
|||
|
Net property
|
23,011
|
|
22,229
|
|
|||
|
Deferred income taxes
|
13,277
|
|
13,932
|
|
|||
|
Net intangible assets
|
97
|
|
100
|
|
|||
|
Non-current receivable from Financial Services
|
—
|
|
32
|
|
|||
|
Other assets
|
1,860
|
|
1,549
|
|
|||
|
Total Automotive assets
|
81,648
|
|
78,786
|
|
|||
|
Financial Services
|
|
|
|
|
|||
|
Cash and cash equivalents
|
7,983
|
|
9,183
|
|
|||
|
Marketable securities
|
4,982
|
|
3,835
|
|
|||
|
Finance receivables, net (Note 5)
|
73,911
|
|
73,330
|
|
|||
|
Net investment in operating leases
|
12,317
|
|
11,482
|
|
|||
|
Equity in net assets of affiliated companies
|
143
|
|
139
|
|
|||
|
Other assets
|
3,528
|
|
3,605
|
|
|||
|
Total Financial Services assets
|
102,864
|
|
101,574
|
|
|||
|
Intersector elimination
|
(1,404
|
)
|
(1,112
|
)
|
|||
|
Total assets
|
$
|
183,108
|
|
$
|
179,248
|
|
|
|
LIABILITIES
|
|
|
|
|
|||
|
Automotive
|
|
|
|
|
|||
|
Trade payables
|
$
|
15,918
|
|
$
|
14,015
|
|
|
|
Other payables
|
2,609
|
|
2,734
|
|
|||
|
Accrued liabilities and deferred revenue (Note 9)
|
15,159
|
|
15,003
|
|
|||
|
Deferred income taxes
|
57
|
|
40
|
|
|||
|
Debt payable within one year (Note 11)
|
1,142
|
|
1,033
|
|
|||
|
Total current liabilities
|
34,885
|
|
32,825
|
|
|||
|
Long-term debt (Note 11)
|
12,549
|
|
12,061
|
|
|||
|
Other liabilities (Note 9)
|
26,119
|
|
26,910
|
|
|||
|
Deferred income taxes
|
107
|
|
255
|
|
|||
|
Total Automotive liabilities
|
73,660
|
|
72,051
|
|
|||
|
Financial Services
|
|
|
|
|
|||
|
Payables
|
1,111
|
|
975
|
|
|||
|
Debt (Note 11)
|
86,799
|
|
86,595
|
|
|||
|
Deferred income taxes
|
1,452
|
|
1,301
|
|
|||
|
Other liabilities and deferred income (Note 9)
|
3,436
|
|
3,457
|
|
|||
|
Payable to Automotive
|
1,404
|
|
910
|
|
|||
|
Total Financial Services liabilities
|
94,202
|
|
93,238
|
|
|||
|
Intersector elimination
|
(1,404
|
)
|
(1,112
|
)
|
|||
|
Total liabilities
|
166,458
|
|
164,177
|
|
|||
|
EQUITY
|
|
|
|
|
|||
|
Capital stock
|
|
|
|
|
|||
|
Common Stock, par value $.01 per share (3,763 million shares issued)
|
38
|
|
37
|
|
|||
|
Class B Stock, par value $.01 per share (71 million shares issued)
|
1
|
|
1
|
|
|||
|
Capital in excess of par value of stock
|
20,884
|
|
20,905
|
|
|||
|
Retained earnings/(Accumulated deficit)
|
14,190
|
|
12,985
|
|
|||
|
Accumulated other comprehensive income/(loss) (Note 13)
|
(18,314
|
)
|
(18,734
|
)
|
|||
|
Treasury stock
|
(193
|
)
|
(166
|
)
|
|||
|
Total equity/(deficit) attributable to Ford Motor Company
|
16,606
|
|
15,028
|
|
|||
|
Equity/(Deficit) attributable to noncontrolling interests
|
44
|
|
43
|
|
|||
|
Total equity/(deficit)
|
16,650
|
|
15,071
|
|
|||
|
Total liabilities and equity
|
$
|
183,108
|
|
$
|
179,248
|
|
|
The accompanying notes are part of the financial statements.
4
Item 1. Financial Statements (Continued)
FORD MOTOR COMPANY AND SUBSIDIARIES
For the Periods Ended
March 31, 2012
and
2011
(in millions)
|
First Quarter
|
|||||||
|
|
2012
|
2011
|
|||||
|
(unaudited)
|
|||||||
|
Cash flows from operating activities of continuing operations
|
|
|
|||||
|
Net cash provided by/(used in) operating activities
|
$
|
2,075
|
|
$
|
2,497
|
|
|
|
Cash flows from investing activities of continuing operations
|
|||||||
|
Capital expenditures
|
(1,093
|
)
|
(929
|
)
|
|||
|
Acquisitions of retail and other finance receivables and operating leases
|
(8,929
|
)
|
(8,068
|
)
|
|||
|
Collections of retail and other finance receivables and operating leases
|
7,850
|
|
8,444
|
|
|||
|
Purchases of securities
|
(19,816
|
)
|
(19,194
|
)
|
|||
|
Sales and maturities of securities
|
17,704
|
|
26,479
|
|
|||
|
Proceeds from sale of business
|
5
|
|
—
|
|
|||
|
Settlements of derivatives
|
(201
|
)
|
15
|
|
|||
|
Other
|
(31
|
)
|
147
|
|
|||
|
Net cash provided by/(used in) investing activities
|
(4,511
|
)
|
6,894
|
|
|||
|
Cash flows from financing activities of continuing operations
|
|
|
|
|
|||
|
Cash dividends
|
(190
|
)
|
—
|
|
|||
|
Purchases of Common Stock
|
(27
|
)
|
—
|
|
|||
|
Changes in short-term debt
|
(1,651
|
)
|
561
|
|
|||
|
Proceeds from issuance of other debt
|
10,318
|
|
9,268
|
|
|||
|
Principal payments on other debt
|
(8,164
|
)
|
(13,199
|
)
|
|||
|
Other
|
84
|
|
88
|
|
|||
|
Net cash provided by/(used in) financing activities
|
370
|
|
(3,282
|
)
|
|||
|
Effect of exchange rate changes on cash and cash equivalents
|
162
|
|
404
|
|
|||
|
Net increase/(decrease) in cash and cash equivalents
|
$
|
(1,904
|
)
|
$
|
6,513
|
|
|
|
Cash and cash equivalents at January 1
|
$
|
17,148
|
|
$
|
14,805
|
|
|
|
Net increase/(decrease) in cash and cash equivalents
|
(1,904
|
)
|
6,513
|
|
|||
|
Cash and cash equivalents at March 31
|
$
|
15,244
|
|
$
|
21,318
|
|
|
The accompanying notes are part of the financial statements.
5
Item 1. Financial Statements (Continued)
FORD MOTOR COMPANY AND SUBSIDIARIES
CONDENSED SECTOR STATEMENT OF CASH FLOWS
For the Periods Ended
March 31, 2012
and
2011
(in millions)
|
|
First Quarter 2012
|
First Quarter 2011
|
|||||||||||||
|
|
Automotive
|
Financial
Services
|
Automotive
|
Financial
Services
|
|||||||||||
|
(unaudited)
|
|||||||||||||||
|
Cash flows from operating activities of continuing operations
|
|
|
|
|
|||||||||||
|
Net cash provided by/(used in) operating activities
|
$
|
875
|
|
$
|
1,269
|
|
$
|
2,963
|
|
$
|
1,035
|
|
|||
|
Cash flows from investing activities of continuing operations
|
|||||||||||||||
|
Capital expenditures
|
(1,083
|
)
|
(10
|
)
|
(926
|
)
|
(3
|
)
|
|||||||
|
Acquisitions of retail and other finance receivables and operating leases
|
—
|
|
(9,043
|
)
|
—
|
|
(7,990
|
)
|
|||||||
|
Collections of retail and other finance receivables and operating leases
|
—
|
|
7,850
|
|
—
|
|
8,444
|
|
|||||||
|
Net collections/(acquisitions) of wholesale receivables
|
—
|
|
45
|
|
—
|
|
(1,579
|
)
|
|||||||
|
Purchases of securities
|
(14,302
|
)
|
(5,514
|
)
|
(11,364
|
)
|
(7,830
|
)
|
|||||||
|
Sales and maturities of securities
|
13,525
|
|
4,380
|
|
16,815
|
|
9,664
|
|
|||||||
|
Settlements of derivatives
|
(174
|
)
|
(27
|
)
|
35
|
|
(20
|
)
|
|||||||
|
Proceeds from sale of business
|
—
|
|
5
|
|
—
|
|
—
|
|
|||||||
|
Investing activity (to)/from Financial Services
|
45
|
|
—
|
|
838
|
|
—
|
|
|||||||
|
Other
|
10
|
|
(41
|
)
|
130
|
|
17
|
|
|||||||
|
Net cash provided by/(used in) investing activities
|
(1,979
|
)
|
(2,355
|
)
|
5,528
|
|
703
|
|
|||||||
|
Cash flows from financing activities of continuing operations
|
|
|
|
|
|
|
|
|
|||||||
|
Cash dividends
|
(190
|
)
|
—
|
|
—
|
|
—
|
|
|||||||
|
Purchases of Common Stock
|
(27
|
)
|
—
|
|
—
|
|
—
|
|
|||||||
|
Changes in short-term debt
|
(19
|
)
|
(1,632
|
)
|
(110
|
)
|
671
|
|
|||||||
|
Proceeds from issuance of other debt
|
674
|
|
9,644
|
|
574
|
|
8,694
|
|
|||||||
|
Principal payments on other debt
|
(132
|
)
|
(8,233
|
)
|
(3,000
|
)
|
(10,199
|
)
|
|||||||
|
Financing activity to/(from) Automotive
|
—
|
|
(45
|
)
|
—
|
|
(838
|
)
|
|||||||
|
Other
|
9
|
|
75
|
|
59
|
|
29
|
|
|||||||
|
Net cash provided by/(used in) financing activities
|
315
|
|
(191
|
)
|
(2,477
|
)
|
(1,643
|
)
|
|||||||
|
Effect of exchange rate changes on cash and cash equivalents
|
85
|
|
77
|
|
229
|
|
175
|
|
|||||||
|
Net increase/(decrease) in cash and cash equivalents
|
$
|
(704
|
)
|
$
|
(1,200
|
)
|
$
|
6,243
|
|
$
|
270
|
|
|||
|
Cash and cash equivalents at January 1
|
$
|
7,965
|
|
$
|
9,183
|
|
$
|
6,301
|
|
$
|
8,504
|
|
|||
|
Net increase/(decrease) in cash and cash equivalents
|
(704
|
)
|
(1,200
|
)
|
6,243
|
|
270
|
|
|||||||
|
Cash and cash equivalents at March 31
|
$
|
7,261
|
|
$
|
7,983
|
|
$
|
12,544
|
|
$
|
8,774
|
|
|||
The accompanying notes are part of the financial statements.
6
Item 1. Financial Statements (Continued)
FORD MOTOR COMPANY AND SUBSIDIARIES
CONSOLIDATED STATEMENT OF EQUITY
For the Periods Ended
March 31, 2012
and
2011
(in millions, unaudited)
|
|
Equity/(Deficit) Attributable to Ford Motor Company
|
|
|
||||||||||||||||||||||||||||
|
|
Capital Stock
|
Cap. in
Excess of
Par Value
of Stock
|
Retained Earnings/
(Accumulated Deficit)
|
Accumulated Other Comprehensive Income/(Loss) (Note 13)
|
Treasury Stock
|
Total
|
Equity/(Deficit)
Attributable
to Non-controlling Interests
|
Total
Equity/
(Deficit)
|
|||||||||||||||||||||||
|
Balance at December 31, 2011
|
$
|
38
|
|
$
|
20,905
|
|
$
|
12,985
|
|
$
|
(18,734
|
)
|
$
|
(166
|
)
|
$
|
15,028
|
|
$
|
43
|
|
$
|
15,071
|
|
|||||||
|
Net income/(loss)
|
—
|
|
—
|
|
1,396
|
|
—
|
|
—
|
|
1,396
|
|
2
|
|
1,398
|
|
|||||||||||||||
|
Other comprehensive income/(loss), net of tax
|
—
|
|
—
|
|
—
|
|
420
|
|
—
|
|
420
|
|
—
|
|
420
|
|
|||||||||||||||
|
Common stock issued (including share-
based compensation impacts)
|
1
|
|
(21
|
)
|
—
|
|
—
|
|
—
|
|
(20
|
)
|
—
|
|
(20
|
)
|
|||||||||||||||
|
Treasury stock/other
|
—
|
|
—
|
|
—
|
|
—
|
|
(27
|
)
|
(27
|
)
|
(1
|
)
|
(28
|
)
|
|||||||||||||||
|
Cash dividends declared
|
—
|
|
—
|
|
(191
|
)
|
—
|
|
—
|
|
(191
|
)
|
—
|
|
(191
|
)
|
|||||||||||||||
|
Balance at March 31, 2012
|
$
|
39
|
|
$
|
20,884
|
|
$
|
14,190
|
|
$
|
(18,314
|
)
|
$
|
(193
|
)
|
$
|
16,606
|
|
$
|
44
|
|
$
|
16,650
|
|
|||||||
|
Balance at December 31, 2010
|
$
|
38
|
|
$
|
20,803
|
|
$
|
(7,038
|
)
|
$
|
(14,313
|
)
|
$
|
(163
|
)
|
$
|
(673
|
)
|
$
|
31
|
|
$
|
(642
|
)
|
|||||||
|
Net income/(loss)
|
—
|
|
—
|
|
2,551
|
|
—
|
|
—
|
|
2,551
|
|
5
|
|
2,556
|
|
|||||||||||||||
|
Other comprehensive income/(loss), net of tax
|
—
|
|
—
|
|
—
|
|
629
|
|
—
|
|
629
|
|
(2
|
)
|
627
|
|
|||||||||||||||
|
Common stock issued (including share-
based compensation impacts)
|
—
|
|
(74
|
)
|
—
|
|
—
|
|
—
|
|
(74
|
)
|
—
|
|
(74
|
)
|
|||||||||||||||
|
Treasury stock/other
|
—
|
|
(6
|
)
|
—
|
|
—
|
|
(1
|
)
|
(7
|
)
|
5
|
|
(2
|
)
|
|||||||||||||||
|
Cash dividends declared
|
—
|
|
—
|
|
—
|
|
—
|
|
—
|
|
—
|
|
—
|
|
—
|
|
|||||||||||||||
|
Balance at March 31, 2011
|
$
|
38
|
|
$
|
20,723
|
|
$
|
(4,487
|
)
|
$
|
(13,684
|
)
|
$
|
(164
|
)
|
$
|
2,426
|
|
$
|
39
|
|
$
|
2,465
|
|
|||||||
The accompanying notes are part of the financial statements.
7
Item 1. Financial Statements (Continued)
FORD MOTOR COMPANY AND SUBSIDIARIES
NOTES TO THE FINANCIAL STATEMENTS
Table of Contents
|
Footnote
|
|
Page
|
|
Note 1
|
Presentation
|
|
|
Note 2
|
Accounting Standards Issued But Not Yet Adopted
|
|
|
Note 3
|
Fair Value Measurements
|
|
|
Note 4
|
Restricted Cash
|
|
|
Note 5
|
Finance Receivables
|
|
|
Note 6
|
Allowance for Credit Losses
|
|
|
Note 7
|
Inventories
|
|
|
Note 8
|
Variable Interest Entities
|
|
|
Note 9
|
Accrued Liabilities and Deferred Revenue
|
|
|
Note 10
|
Retirement Benefits
|
|
|
Note 11
|
Debt and Commitments
|
|
|
Note 12
|
Derivative Financial Instruments and Hedging Activities
|
|
|
Note 13
|
Accumulated Other Comprehensive Income/(Loss)
|
|
|
Note 14
|
Other Income/(Loss)
|
|
|
Note 15
|
Income Taxes
|
|
|
Note 16
|
Amounts Per Share Attributable to Ford Motor Company Common and Class B Stock
|
|
|
Note 17
|
Segment Information
|
|
|
Note 18
|
Commitments and Contingencies
|
|
8
Item 1. Financial Statements (Continued)
FORD MOTOR COMPANY AND SUBSIDIARIES
NOTES TO THE FINANCIAL STATEMENTS
NOTE 1. PRESENTATION
Our financial statements are presented in accordance with U.S. generally accepted accounting principles ("GAAP") for interim financial information and instructions to the Quarterly Report on Form 10-Q and Rule 10-01 of Regulation S-X. We show certain of our financial statements on both a consolidated and a sector basis for our Automotive and Financial Services sectors. Intercompany items and transactions have been eliminated in both the consolidated and sector balance sheets. Where the presentation of these intercompany eliminations or consolidated adjustments differs between the consolidated and sector financial statements, reconciliations of certain line items are explained below in this Note or in related footnotes.
In the opinion of management, these unaudited financial statements reflect a fair statement of the results of operations and financial condition of Ford Motor Company, its consolidated subsidiaries, and consolidated VIEs of which we are the primary beneficiary for the periods and at the dates presented. The operating results for interim periods are not necessarily indicative of results that may be expected for any other interim period or for the full year. Reference should be made to the financial statements contained in our Annual Report on Form 10-K for the year ended
December 31, 2011
("2011 Form 10-K Report"). For purposes of this report, "Ford," the "Company," "we," "our," "us" or similar references mean Ford Motor Company, our consolidated subsidiaries, and our consolidated VIEs of which we are the primary beneficiary, unless the context requires otherwise.
We reclassified certain prior year amounts in our consolidated financial statements to conform to current year presentation.
Adoption of New Accounting Standards
Fair Value Measurement.
On January 1, 2012, we adopted the new accounting standard that requires us to report the level in the fair value hierarchy of assets and liabilities not measured at fair value in the balance sheet but for which the fair value is disclosed, and to expand existing disclosures. Refer to Note 3 for further disclosure regarding our fair value measurements.
Comprehensive Income - Presentation.
On January 1, 2012, we adopted the new accounting standard that modifies the options for presentation of other comprehensive income. The new accounting standard requires us to present comprehensive income either in a single continuous statement or two separate but consecutive statements. We have elected to present comprehensive income in two separate but consecutive statements.
On January 1, 2012, we also adopted the new accounting standards
Intangibles - Goodwill and Other, Transfers and Servicing - Repurchase Agreements,
and
Financial Services - Insurance.
The adoption of these new accounting standards did not impact our financial condition or results of operations.
9
Item 1. Financial Statements (Continued)
FORD MOTOR COMPANY AND SUBSIDIARIES
NOTES TO THE FINANCIAL STATEMENTS
NOTE 1. PRESENTATION
(Continued)
Reconciliations between Consolidated and Sector Financial Statements
Deferred Tax Assets and Liabilities.
The difference between the total assets and total liabilities as presented in our sector balance sheet and consolidated balance sheet is the result of netting deferred income tax assets and liabilities. The reconciliation between the totals for the sector and consolidated balance sheets was as follows (in millions):
|
|
March 31,
2012 |
December 31,
2011 |
|||||
|
Sector balance sheet presentation of deferred income tax assets
|
|
|
|||||
|
Automotive sector current deferred income tax assets
|
$
|
1,980
|
|
$
|
1,791
|
|
|
|
Automotive sector non-current deferred income tax assets
|
13,277
|
|
13,932
|
|
|||
|
Financial Services sector deferred income tax assets (a)
|
311
|
|
302
|
|
|||
|
Total
|
15,568
|
|
16,025
|
|
|||
|
Reclassification for netting of deferred income taxes
|
(1,033
|
)
|
(900
|
)
|
|||
|
Consolidated balance sheet presentation of deferred income tax assets
|
$
|
14,535
|
|
$
|
15,125
|
|
|
|
Sector balance sheet presentation of deferred income tax liabilities
|
|
|
|
|
|||
|
Automotive sector current deferred income tax liabilities
|
$
|
57
|
|
$
|
40
|
|
|
|
Automotive sector non-current deferred income tax liabilities
|
107
|
|
255
|
|
|||
|
Financial Services sector deferred income tax liabilities
|
1,452
|
|
1,301
|
|
|||
|
Total
|
1,616
|
|
1,596
|
|
|||
|
Reclassification for netting of deferred income taxes
|
(1,033
|
)
|
(900
|
)
|
|||
|
Consolidated balance sheet presentation of deferred income tax liabilities
|
$
|
583
|
|
$
|
696
|
|
|
__________
|
(a)
|
Financial Services deferred income tax assets are included in
Financial Services other assets
on our sector balance sheet.
|
10
Item 1. Financial Statements (Continued)
FORD MOTOR COMPANY AND SUBSIDIARIES
NOTES TO THE FINANCIAL STATEMENTS
Sector to Consolidated Cash Flow
. We present certain cash flows from wholesale receivables, finance receivables and the acquisition of intersector debt differently on our sector and consolidated statements of cash flows. The reconciliation between totals for the sector and consolidated cash flows for the periods ended March 31 was as follows (in millions):
|
First Quarter
|
|||||||
|
|
2012
|
2011
|
|||||
|
Automotive net cash provided by/(used in) operating activities
|
$
|
875
|
|
$
|
2,963
|
|
|
|
Financial Services net cash provided by/(used in) operating activities
|
1,269
|
|
1,035
|
|
|||
|
Total sector net cash provided by/(used in) operating activities
|
2,144
|
|
3,998
|
|
|||
|
Reclassifications from investing to operating cash flows
|
|
|
|
|
|||
|
Wholesale receivables (a)
|
45
|
|
(1,579
|
)
|
|||
|
Finance receivables (b)
|
(114
|
)
|
78
|
|
|||
|
Consolidated net cash provided by/(used in) operating activities
|
$
|
2,075
|
|
$
|
2,497
|
|
|
|
Automotive net cash provided by/(used in) investing activities
|
$
|
(1,979
|
)
|
$
|
5,528
|
|
|
|
Financial Services net cash provided by/(used in) investing activities
|
(2,355
|
)
|
703
|
|
|||
|
Total sector net cash provided by/(used in) investing activities
|
(4,334
|
)
|
6,231
|
|
|||
|
Reclassifications from investing to operating cash flows
|
|
|
|
|
|||
|
Wholesale receivables (a)
|
(45
|
)
|
1,579
|
|
|||
|
Finance receivables (b)
|
114
|
|
(78
|
)
|
|||
|
Reclassifications from investing to financing cash flows
|
|||||||
|
Maturity of Financial Services sector debt held by Automotive sector
|
(201
|
)
|
—
|
|
|||
|
Elimination of investing activity to/(from) Financial Services in consolidation
|
(45
|
)
|
(838
|
)
|
|||
|
Consolidated net cash provided by/(used in) investing activities
|
$
|
(4,511
|
)
|
$
|
6,894
|
|
|
|
Automotive net cash provided by/(used in) financing activities
|
$
|
315
|
|
$
|
(2,477
|
)
|
|
|
Financial Services net cash provided by/(used in) financing activities
|
(191
|
)
|
(1,643
|
)
|
|||
|
Total sector net cash provided by/(used in) financing activities
|
124
|
|
(4,120
|
)
|
|||
|
Reclassifications from investing to financing cash flows
|
|
|
|
|
|||
|
Maturity of Financial Services sector debt held by Automotive sector
|
201
|
|
—
|
|
|||
|
Elimination of investing activity to/(from) Financial Services in consolidation
|
45
|
|
838
|
|
|||
|
Consolidated net cash provided by/(used in) financing activities
|
$
|
370
|
|
$
|
(3,282
|
)
|
|
__________
|
(a)
|
In addition to the cash flow from vehicles sold by us, the cash flow from wholesale finance receivables (being reclassified from investing to operating) includes financing by Ford Credit of used and non-Ford vehicles.
100%
of cash flows from wholesale finance receivables have been reclassified for consolidated presentation as the portion of these cash flows from used and non-Ford vehicles is impracticable to separate.
|
|
(b)
|
Includes cash flows of finance receivables purchased/collected by the Financial Services sector from certain divisions and subsidiaries of the Automotive sector.
|
Venezuelan Operations
At
March 31, 2012
and
December 31, 2011
, we had
$347 million
and
$301 million
, respectively, in net monetary assets (primarily cash and receivables partially offset by payables and accrued liabilities) denominated in Venezuelan bolivars. These net monetary assets included
$404 million
and
$331 million
in cash and cash equivalents at
March 31, 2012
and
December 31, 2011
, respectively. As a result of regulation of foreign currency exchange in Venezuela, the official exchange rate of
4.3
bolivars to the U.S. dollar is used to re-measure the assets and liabilities of our Venezuelan operations for GAAP financial statement presentation. The Venezuelan government also controls securities transactions in the parallel exchange market. Our ability to obtain funds in the parallel exchange market has been limited. For any U.S. dollars that we obtain at a rate less favorable than the official rate, we realize a loss for the difference in the exchange rates at the time of the transaction. Based on our net monetary position at
March 31, 2012
, a devaluation equal to a
50%
change in the official bolivar exchange rate would have resulted in a balance sheet translation loss of approximately
$115 million
. Continuing restrictions on the foreign currency exchange market could affect our Venezuelan operations' ability to pay obligations denominated in U.S. dollars as well as our ability to benefit from those operations.
11
Item 1. Financial Statements (Continued)
FORD MOTOR COMPANY AND SUBSIDIARIES
NOTES TO THE FINANCIAL STATEMENTS
Balance Sheet - Offsetting.
In December of 2011,
the Financial Accounting Standards Board issued a new accounting standard that requires disclosures about offsetting and related arrangements for recognized financial instruments and derivative instruments. The new accounting standard is effective for us as of January 1, 2013.
NOTE 3. FAIR VALUE MEASUREMENTS
Cash equivalents, marketable securities, and derivative instruments are presented in our financial statements on a recurring basis at fair value, while other assets and liabilities are measured at fair value on a nonrecurring basis such as impairments.
Fair Value Measurements
In measuring fair value, we use various valuation methodologies and prioritize the use of observable inputs. The use of observable and unobservable inputs and their significance in measuring fair value are reflected in our fair value hierarchy assessment.
|
•
|
Level 1 — inputs include quoted prices for identical instruments and are the most observable
|
|
•
|
Level 2 — inputs include quoted prices for similar instruments and observable inputs such as interest rates, currency exchange rates, and yield curves
|
|
•
|
Level 3 — inputs include data not observable in the market and reflect management judgment about the assumptions market participants would use in pricing the instruments
|
We review the inputs to the fair value measurements to ensure they are appropriately categorized within the fair value hierarchy. Transfers into and transfers out of the hierarchy levels are recognized as if they had taken place at the end of the reporting period.
Valuation Methodologies
Cash and Cash Equivalents.
Included in
Cash and cash equivalents
are highly liquid investments that are readily convertible to known amounts of cash, and which are subject to an insignificant risk of change in value due to interest rate, market price, or penalty on withdrawal. A debt security is classified as a cash equivalent if it meets these criteria and if it has a remaining time to maturity of
90 days or less from the date of acquisition
. Amounts on deposit and available upon demand, or negotiated to provide for daily liquidity without penalty, are classified as
Cash and cash equivalents
. Time deposits, certificates of deposit, and money market accounts that meet the above criteria are classified as
Cash and cash equivalents
, reported at par value, and excluded from the tables below.
Marketable Securities
. Investments in securities with a
maturity date greater than 90 days at the date of purchase
and other securities for which there is a more than insignificant risk of change in value due to interest rate, market price, or penalty on withdrawal are classified as
Marketable securities
. We generally measure fair value using prices obtained from pricing services. Pricing methodologies and inputs to valuation models used by the pricing services depend on the security type (i.e., asset class). Where possible, fair values are generated using market inputs including quoted prices (the closing price in an exchange market), bid prices (the price at which a buyer stands ready to purchase), and other market information. For fixed income securities that are not actively traded, the pricing services use alternative methods to determine fair value for the securities, including: quotes for similar fixed-income securities, matrix pricing, income approach using benchmark curves, or other factors to determine fair value. In certain cases, when market data are not available, we use broker quotes to determine fair value.
A review is performed on the security prices received from our pricing services, which includes discussion and analysis of the inputs used by the pricing services to value our securities. We also compare the price of certain securities sold close to the quarter end to the price of the same security at the balance sheet date to ensure the reported fair value is reasonable.
12
Item 1. Financial Statements (Continued)
FORD MOTOR COMPANY AND SUBSIDIARIES
NOTES TO THE FINANCIAL STATEMENTS
NOTE 3. FAIR VALUE MEASUREMENTS
(Continued)
Derivative Financial Instruments.
Our derivatives are over-the-counter customized derivative transactions and are not exchange traded. We estimate the fair value of these instruments using industry-standard valuation models such as a discounted cash flow. These models project future cash flows and discount the future amounts to a present value using market-based expectations for interest rates, foreign exchange rates, commodity prices, and the contractual terms of the derivative instruments. The discount rate used is the relevant interbank deposit rate (e.g., LIBOR) plus an adjustment for non-performance risk. The adjustment reflects the full credit default swap ("CDS") spread applied to a net exposure, by counterparty, considering the master netting agreements and posted collateral. We use our counterparty's CDS spread when we are in a net asset position and our own CDS spread when we are in a net liability position. In certain cases, market data are not available and we use broker quotes and models (e.g., Black Scholes) to determine fair value. This includes situations where there is illiquidity for a particular currency or commodity or for longer-dated instruments.
Ford Credit's two Ford Upgrade Exchange Linked securitization transactions ("FUEL Notes") have derivative features which include a mandatory exchange to Ford Credit unsecured notes when Ford Credit's senior unsecured debt receives two investment grade credit ratings among Fitch, Moody's, and S&P, and a make-whole provision.
We estimated the fair value of these features by comparing the market value of the FUEL Notes to the value of a hypothetical debt instrument without these features.
Finance Receivables.
The fair value of finance receivables is measured for purposes of disclosure (see Note 5). We measure the fair value of finance receivables based on an income approach using internal valuation models. These models project future cash flows of financing contracts based on scheduled contract payments (including principal and interest). The projected cash flows are discounted to a present value based on assumptions regarding credit losses, pre-payment speed, and the discount rate, which is based on the characteristics of the receivables. Our assumptions regarding pre-payment speed and credit losses are based on historical performance. The fair value of finance receivables is categorized within Level 3 of the hierarchy.
On a nonrecurring basis, when retail contracts are
greater than 120 days past due or deemed to be uncollectible
, or if individual dealer loans are probable of foreclosure, we use the fair value of collateral, adjusted for estimated costs to sell, to determine the fair value adjustment to our receivables. The collateral for retail receivables is the vehicle financed, and for dealer loans is real estate or other property.
The fair value measurements for retail receivables are based on the number of contracts multiplied by the loss severity and the probability of default (
"
POD") percentage, or the outstanding receivable balances multiplied by the average recovery value (
"
ARV") percentage to determine the fair value adjustment.
The fair value measurements for dealer loans are based on an assessment of the estimated market value of collateral. The assessment is performed by reviewing various appraisals, which include total adjusted appraised value of land and improvements, alternate use appraised value, broker's opinion of value, and purchase offers. The fair value adjustment is determined by comparing the net carrying value of the dealer loan and the estimated market value of collateral.
Debt.
We measure debt at fair value for purposes of disclosure (see Note 11) using quoted market prices for our own debt with approximately the same remaining maturities, where possible. Where market prices are not available, we estimate fair value using discounted cash flow models with market-based expectations for interest rates, our own credit risk and the contractual terms of the debt instruments. For certain short-term debt issuances with an original maturity date of one year or less, we assume that book value is a reasonable approximation of the debt's fair value. For asset-backed debt issued in securitization transactions, the principal payments are based on projected payments for specific assets securing the underlying debt considering historical pre-payment speeds. The fair value of debt is categorized within Level 2 of the hierarchy.
13
Item 1. Financial Statements (Continued)
FORD MOTOR COMPANY AND SUBSIDIARIES
NOTES TO THE FINANCIAL STATEMENTS
NOTE 3. FAIR VALUE MEASUREMENTS
(Continued)
Input Hierarchy of Items Measured at Fair Value on a Recurring Basis
The following tables categorize the fair values of items measured at fair value on a recurring basis on our balance sheet (in millions):
|
|
March 31, 2012
|
||||||||||||||
|
|
Level 1 (a)
|
Level 2 (a)
|
Level 3
|
Total
|
|||||||||||
|
Automotive Sector
|
|
|
|
|
|||||||||||
|
Assets
|
|
|
|
|
|||||||||||
|
Cash equivalents – financial instruments
|
|
|
|
|
|||||||||||
|
U.S. government
|
$
|
—
|
|
$
|
—
|
|
$
|
—
|
|
$
|
—
|
|
|||
|
U.S. government-sponsored enterprises
|
—
|
|
466
|
|
—
|
|
466
|
|
|||||||
|
Non-U.S. government
|
—
|
|
84
|
|
—
|
|
84
|
|
|||||||
|
Non-U.S. government agencies (b)
|
—
|
|
175
|
|
—
|
|
175
|
|
|||||||
|
Corporate debt
|
—
|
|
49
|
|
—
|
|
49
|
|
|||||||
|
Total cash equivalents – financial instruments (c)
|
—
|
|
774
|
|
—
|
|
774
|
|
|||||||
|
Marketable securities
|
|
|
|
|
|
|
|
|
|||||||
|
U.S. government
|
3,988
|
|
—
|
|
—
|
|
3,988
|
|
|||||||
|
U.S. government-sponsored enterprises
|
—
|
|
3,716
|
|
—
|
|
3,716
|
|
|||||||
|
Non-U.S. government agencies (b)
|
—
|
|
4,630
|
|
—
|
|
4,630
|
|
|||||||
|
Corporate debt
|
—
|
|
2,074
|
|
—
|
|
2,074
|
|
|||||||
|
Mortgage-backed and other asset-backed
|
—
|
|
27
|
|
—
|
|
27
|
|
|||||||
|
Equities
|
127
|
|
—
|
|
—
|
|
127
|
|
|||||||
|
Non-U.S. government
|
—
|
|
1,222
|
|
—
|
|
1,222
|
|
|||||||
|
Other liquid investments (d)
|
—
|
|
17
|
|
—
|
|
17
|
|
|||||||
|
Total marketable securities
|
4,115
|
|
11,686
|
|
—
|
|
15,801
|
|
|||||||
|
Derivative financial instruments
|
|
|
|
|
|
|
|
|
|||||||
|
Foreign currency exchange contracts
|
—
|
|
115
|
|
—
|
|
115
|
|
|||||||
|
Commodity contracts
|
—
|
|
11
|
|
3
|
|
14
|
|
|||||||
|
Total derivative financial instruments (e)
|
—
|
|
126
|
|
3
|
|
129
|
|
|||||||
|
Total assets at fair value
|
$
|
4,115
|
|
$
|
12,586
|
|
$
|
3
|
|
$
|
16,704
|
|
|||
|
Liabilities
|
|
|
|
|
|
|
|
|
|||||||
|
Derivative financial instruments
|
|
|
|
|
|
|
|
|
|||||||
|
Foreign currency exchange contracts
|
$
|
—
|
|
$
|
437
|
|
$
|
—
|
|
$
|
437
|
|
|||
|
Commodity contracts
|
—
|
|
179
|
|
47
|
|
226
|
|
|||||||
|
Total derivative financial instruments (e)
|
—
|
|
616
|
|
47
|
|
663
|
|
|||||||
|
Total liabilities at fair value
|
$
|
—
|
|
$
|
616
|
|
$
|
47
|
|
$
|
663
|
|
|||
__________
|
(a)
|
There were no transfers between Level 1 and 2 during the period.
|
|
(b)
|
Includes notes issued by non-U.S. government agencies, as well as notes issued by supranational institutions.
|
|
(c)
|
Excludes time deposits, certificates of deposit, money market accounts, and other cash equivalents reported at par value totaling
$4.8 billion
as of
March 31, 2012
for the Automotive sector. In addition to these cash equivalents, our Automotive sector also had cash on hand totaling
$1.7 billion
as of
March 31, 2012
.
|
|
(d)
|
Includes certificates of deposit and time deposits subject to changes in value.
|
|
(e)
|
See Note 12 for additional information regarding derivative financial instruments.
|
14
Item 1. Financial Statements (Continued)
FORD MOTOR COMPANY AND SUBSIDIARIES
NOTES TO THE FINANCIAL STATEMENTS
NOTE 3. FAIR VALUE MEASUREMENTS
(Continued)
|
|
March 31, 2012
|
||||||||||||||
|
|
Level 1 (a)
|
Level 2 (a)
|
Level 3
|
Total
|
|||||||||||
|
Financial Services Sector
|
|
|
|
|
|||||||||||
|
Assets
|
|
|
|
|
|||||||||||
|
Cash equivalents – financial instruments
|
|
|
|
|
|||||||||||
|
U.S. government
|
$
|
5
|
|
$
|
—
|
|
$
|
—
|
|
$
|
5
|
|
|||
|
U.S. government-sponsored enterprises
|
—
|
|
125
|
|
—
|
|
125
|
|
|||||||
|
Non-U.S. government
|
—
|
|
255
|
|
—
|
|
255
|
|
|||||||
|
Non-U.S. government agencies (b)
|
—
|
|
—
|
|
—
|
|
—
|
|
|||||||
|
Corporate debt
|
—
|
|
—
|
|
—
|
|
—
|
|
|||||||
|
Mortgage-backed and other asset-backed
|
—
|
|
—
|
|
—
|
|
—
|
|
|||||||
|
Total cash equivalents – financial instruments (c)
|
5
|
|
380
|
|
—
|
|
385
|
|
|||||||
|
Marketable securities
|
|
|
|
|
|
|
|
|
|||||||
|
U.S. government
|
1,455
|
|
—
|
|
—
|
|
1,455
|
|
|||||||
|
U.S. government-sponsored enterprises
|
—
|
|
1,285
|
|
—
|
|
1,285
|
|
|||||||
|
Non-U.S. government agencies (b)
|
—
|
|
797
|
|
—
|
|
797
|
|
|||||||
|
Corporate debt
|
—
|
|
1,110
|
|
—
|
|
1,110
|
|
|||||||
|
Mortgage-backed and other asset-backed
|
—
|
|
85
|
|
—
|
|
85
|
|
|||||||
|
Non-U.S. government
|
—
|
|
243
|
|
—
|
|
243
|
|
|||||||
|
Other liquid investments (d)
|
—
|
|
7
|
|
—
|
|
7
|
|
|||||||
|
Total marketable securities
|
1,455
|
|
3,527
|
|
—
|
|
4,982
|
|
|||||||
|
Derivative financial instruments
|
|
|
|
|
|
|
|
|
|||||||
|
Interest rate contracts
|
—
|
|
1,169
|
|
—
|
|
1,169
|
|
|||||||
|
Foreign currency exchange contracts
|
—
|
|
2
|
|
—
|
|
2
|
|
|||||||
|
Cross-currency interest rate swap contracts
|
—
|
|
—
|
|
—
|
|
—
|
|
|||||||
|
Other (e)
|
—
|
|
—
|
|
99
|
|
99
|
|
|||||||
|
Total derivative financial instruments (f)
|
—
|
|
1,171
|
|
99
|
|
1,270
|
|
|||||||
|
Total assets at fair value
|
$
|
1,460
|
|
$
|
5,078
|
|
$
|
99
|
|
$
|
6,637
|
|
|||
|
Liabilities
|
|
|
|
|
|
|
|
|
|||||||
|
Derivative financial instruments
|
|
|
|
|
|
|
|
|
|||||||
|
Interest rate contracts
|
$
|
—
|
|
$
|
301
|
|
$
|
—
|
|
$
|
301
|
|
|||
|
Foreign currency exchange contracts
|
—
|
|
43
|
|
—
|
|
43
|
|
|||||||
|
Cross-currency interest rate swap contracts
|
—
|
|
46
|
|
—
|
|
46
|
|
|||||||
|
Total derivative financial instruments (f)
|
—
|
|
390
|
|
—
|
|
390
|
|
|||||||
|
Total liabilities at fair value
|
$
|
—
|
|
$
|
390
|
|
$
|
—
|
|
$
|
390
|
|
|||
__________
|
(a)
|
There were no transfers between Level 1 and 2 during the period.
|
|
(b)
|
Includes notes issued by non-U.S. government agencies, as well as notes issued by supranational institutions.
|
|
(c)
|
Excludes time deposits, certificates of deposit, and money market accounts reported at par value on our balance sheet totaling
$5.4 billion
as of
March 31, 2012
for the Financial Services sector. In addition to these cash equivalents, our Financial Services sector also had cash on hand totaling
$2.2 billion
as of
March 31, 2012
.
|
|
(d)
|
Includes certificates of deposit and time deposits subject to changes in value.
|
|
(e)
|
Represents derivative features included in the FUEL Notes.
|
|
(f)
|
See Note 12 for additional information regarding derivative financial instruments.
|
15
Item 1. Financial Statements (Continued)
FORD MOTOR COMPANY AND SUBSIDIARIES
NOTES TO THE FINANCIAL STATEMENTS
NOTE 3. FAIR VALUE MEASUREMENTS
(Continued)
|
|
December 31, 2011
|
||||||||||||||
|
|
Level 1 (a)
|
Level 2 (a)
|
Level 3
|
Total
|
|||||||||||
|
Automotive Sector
|
|
|
|
|
|||||||||||
|
Assets
|
|
|
|
|
|||||||||||
|
Cash equivalents – financial instruments
|
|
|
|
|
|||||||||||
|
U.S. government
|
$
|
—
|
|
$
|
—
|
|
$
|
—
|
|
$
|
—
|
|
|||
|
U.S. government-sponsored enterprises
|
—
|
|
319
|
|
—
|
|
319
|
|
|||||||
|
Non-U.S. government
|
—
|
|
168
|
|
—
|
|
168
|
|
|||||||
|
Non-U.S. government agencies (b)
|
—
|
|
820
|
|
—
|
|
820
|
|
|||||||
|
Corporate debt
|
—
|
|
2
|
|
—
|
|
2
|
|
|||||||
|
Total cash equivalents – financial instruments (c)
|
—
|
|
1,309
|
|
—
|
|
1,309
|
|
|||||||
|
Marketable securities (d)
|
|
|
|
|
|
|
|
|
|||||||
|
U.S. government
|
2,960
|
|
—
|
|
—
|
|
2,960
|
|
|||||||
|
U.S. government-sponsored enterprises
|
—
|
|
4,852
|
|
—
|
|
4,852
|
|
|||||||
|
Non-U.S. government agencies (b)
|
—
|
|
4,558
|
|
—
|
|
4,558
|
|
|||||||
|
Corporate debt
|
—
|
|
1,631
|
|
—
|
|
1,631
|
|
|||||||
|
Mortgage-backed and other asset-backed
|
—
|
|
38
|
|
—
|
|
38
|
|
|||||||
|
Equities
|
129
|
|
—
|
|
—
|
|
129
|
|
|||||||
|
Non-U.S. government
|
—
|
|
598
|
|
—
|
|
598
|
|
|||||||
|
Other liquid investments (e)
|
—
|
|
17
|
|
—
|
|
17
|
|
|||||||
|
Total marketable securities
|
3,089
|
|
11,694
|
|
—
|
|
14,783
|
|
|||||||
|
Derivative financial instruments
|
|
|
|
|
|
|
|
|
|||||||
|
Foreign currency exchange contracts
|
—
|
|
198
|
|
14
|
|
212
|
|
|||||||
|
Commodity contracts
|
—
|
|
1
|
|
1
|
|
2
|
|
|||||||
|
Other – warrants
|
—
|
|
—
|
|
4
|
|
4
|
|
|||||||
|
Total derivative financial instruments (f)
|
—
|
|
199
|
|
19
|
|
218
|
|
|||||||
|
Total assets at fair value
|
$
|
3,089
|
|
$
|
13,202
|
|
$
|
19
|
|
$
|
16,310
|
|
|||
|
Liabilities
|
|
|
|
|
|
|
|
|
|||||||
|
Derivative financial instruments
|
|
|
|
|
|
|
|
|
|||||||
|
Foreign currency exchange contracts
|
$
|
—
|
|
$
|
442
|
|
$
|
6
|
|
$
|
448
|
|
|||
|
Commodity contracts
|
—
|
|
289
|
|
83
|
|
372
|
|
|||||||
|
Total derivative financial instruments (f)
|
—
|
|
731
|
|
89
|
|
820
|
|
|||||||
|
Total liabilities at fair value
|
$
|
—
|
|
$
|
731
|
|
$
|
89
|
|
$
|
820
|
|
|||
__________
|
(a)
|
There were no transfers between Level 1 and 2 during the year.
|
|
(b)
|
Includes notes issued by non-U.S. government agencies, as well as notes issued by supranational institutions.
|
|
(c)
|
Excludes time deposits, certificates of deposit, money market accounts, and other cash equivalents reported at par value totaling
$4.6 billion
as of
December 31, 2011
for the Automotive sector. In addition to these cash equivalents, our Automotive sector also had cash on hand totaling
$2.1 billion
as of
December 31, 2011
.
|
|
(d)
|
Excludes an investment in Ford Credit debt securities held by the Automotive sector with a carrying value of
$201 million
and an estimated fair value of
$201 million
as of
December 31, 2011
.
|
|
(e)
|
Includes certificates of deposit and time deposits subject to changes in value.
|
|
(f)
|
See Note 12 for additional information regarding derivative financial instruments.
|
16
Item 1. Financial Statements (Continued)
FORD MOTOR COMPANY AND SUBSIDIARIES
NOTES TO THE FINANCIAL STATEMENTS
NOTE 3. FAIR VALUE MEASUREMENTS
(Continued)
|
|
December 31, 2011
|
||||||||||||||
|
|
Level 1 (a)
|
Level 2 (a)
|
Level 3
|
Total
|
|||||||||||
|
Financial Services Sector
|
|
|
|
|
|||||||||||
|
Assets
|
|
|
|
|
|||||||||||
|
Cash equivalents – financial instruments
|
|
|
|
|
|||||||||||
|
U.S. government
|
$
|
1
|
|
$
|
—
|
|
$
|
—
|
|
$
|
1
|
|
|||
|
U.S. government-sponsored enterprises
|
—
|
|
75
|
|
—
|
|
75
|
|
|||||||
|
Non-U.S. government
|
—
|
|
15
|
|
—
|
|
15
|
|
|||||||
|
Non-U.S. government agencies (b)
|
—
|
|
150
|
|
—
|
|
150
|
|
|||||||
|
Corporate debt
|
—
|
|
—
|
|
—
|
|
—
|
|
|||||||
|
Total cash equivalents – financial instruments (c)
|
1
|
|
240
|
|
—
|
|
241
|
|
|||||||
|
Marketable securities
|
|
|
|
|
|
|
|
|
|||||||
|
U.S. government
|
619
|
|
—
|
|
—
|
|
619
|
|
|||||||
|
U.S. government-sponsored enterprises
|
—
|
|
713
|
|
—
|
|
713
|
|
|||||||
|
Non-U.S. government agencies (b)
|
—
|
|
778
|
|
—
|
|
778
|
|
|||||||
|
Corporate debt
|
—
|
|
1,186
|
|
—
|
|
1,186
|
|
|||||||
|
Mortgage-backed and other asset-backed
|
—
|
|
88
|
|
—
|
|
88
|
|
|||||||
|
Non-U.S. government
|
—
|
|
444
|
|
—
|
|
444
|
|
|||||||
|
Other liquid investments (d)
|
—
|
|
7
|
|
—
|
|
7
|
|
|||||||
|
Total marketable securities
|
619
|
|
3,216
|
|
—
|
|
3,835
|
|
|||||||
|
Derivative financial instruments
|
|
|
|
|
|
|
|
|
|||||||
|
Interest rate contracts
|
—
|
|
1,196
|
|
—
|
|
1,196
|
|
|||||||
|
Foreign currency exchange contracts
|
—
|
|
30
|
|
—
|
|
30
|
|
|||||||
|
Cross-currency interest rate swap contracts
|
—
|
|
12
|
|
—
|
|
12
|
|
|||||||
|
Other (e)
|
—
|
|
—
|
|
137
|
|
137
|
|
|||||||
|
Total derivative financial instruments (f)
|
—
|
|
1,238
|
|
137
|
|
1,375
|
|
|||||||
|
Total assets at fair value
|
$
|
620
|
|
$
|
4,694
|
|
$
|
137
|
|
$
|
5,451
|
|
|||
|
Liabilities
|
|
|
|
|
|
|
|
|
|||||||
|
Derivative financial instruments
|
|
|
|
|
|
|
|
|
|||||||
|
Interest rate contracts
|
$
|
—
|
|
$
|
237
|
|
$
|
—
|
|
$
|
237
|
|
|||
|
Foreign currency exchange contracts
|
—
|
|
50
|
|
—
|
|
50
|
|
|||||||
|
Cross-currency interest rate swap contracts
|
—
|
|
12
|
|
—
|
|
12
|
|
|||||||
|
Total derivative financial instruments (f)
|
—
|
|
299
|
|
—
|
|
299
|
|
|||||||
|
Total liabilities at fair value
|
$
|
—
|
|
$
|
299
|
|
$
|
—
|
|
$
|
299
|
|
|||
__________
|
(a)
|
There were no transfers between Level 1 and 2 during the year.
|
|
(b)
|
Includes notes issued by non-U.S. government agencies, as well as notes issued by supranational institutions.
|
|
(c)
|
Excludes time deposits, certificates of deposit, and money market accounts reported at par value on our balance sheet totaling
$6 billion
as of
December 31, 2011
for the Financial Services sector. In addition to these cash equivalents, our Financial Services sector also had cash on hand totaling
$3 billion
as of
December 31, 2011
.
|
|
(d)
|
Includes certificates of deposit and time deposits subject to changes in value.
|
|
(e)
|
Represents derivative features included in the FUEL Notes.
|
|
(f)
|
See Note 12 for additional information regarding derivative financial instruments.
|
17
Item 1. Financial Statements (Continued)
FORD MOTOR COMPANY AND SUBSIDIARIES
NOTES TO THE FINANCIAL STATEMENTS
NOTE 3. FAIR VALUE MEASUREMENTS
(Continued)
Reconciliation of Changes in Level 3 Balances
The following tables summarize the changes recorded through income in Level 3 items measured at fair value on a recurring basis and reported on our balance sheet for the periods ended
March 31
(in millions):
|
|
|||||||||||
|
|
First Quarter 2012
|
||||||||||
|
|
Marketable Securities
|
Derivative Financial Instruments,
Net
|
Total Level 3
Fair Value
|
||||||||
|
Automotive Sector
|
|
|
|
||||||||
|
Beginning balance
|
$
|
—
|
|
$
|
(70
|
)
|
$
|
(70
|
)
|
||
|
Realized/unrealized gains/(losses)
|
|
|
|
|
|||||||
|
Cost of sales
|
—
|
|
23
|
|
23
|
|
|||||
|
Interest income and other non-operating income/(expense), net
|
—
|
|
(4
|
)
|
(4
|
)
|
|||||
|
Other comprehensive income/(loss)
|
—
|
|
—
|
|
—
|
|
|||||
|
Total realized/unrealized gains/(losses)
|
—
|
|
19
|
|
19
|
|
|||||
|
Purchases, issues, sales, and settlements
|
|
|
|
|
|
|
|||||
|
Purchases
|
—
|
|
—
|
|
—
|
|
|||||
|
Issues
|
—
|
|
—
|
|
—
|
|
|||||
|
Sales
|
—
|
|
—
|
|
—
|
|
|||||
|
Settlements
|
—
|
|
17
|
|
17
|
|
|||||
|
Total purchases, issues, sales, and settlements
|
—
|
|
17
|
|
17
|
|
|||||
|
Transfers into Level 3
|
—
|
|
—
|
|
—
|
|
|||||
|
Transfers out of Level 3 (a)
|
—
|
|
(10
|
)
|
(10
|
)
|
|||||
|
Ending balance
|
$
|
—
|
|
$
|
(44
|
)
|
$
|
(44
|
)
|
||
|
Unrealized gains/ (losses) on instruments still held
|
$
|
—
|
|
$
|
13
|
|
$
|
13
|
|
||
|
Financial Services Sector
|
|
|
|
|
|
|
|||||
|
Beginning balance
|
$
|
—
|
|
$
|
137
|
|
$
|
137
|
|
||
|
Realized/unrealized gains/(losses)
|
|
|
|
|
|||||||
|
Other income/(loss), net
|
—
|
|
(38
|
)
|
(38
|
)
|
|||||
|
Other comprehensive income/(loss)
|
—
|
|
—
|
|
—
|
|
|||||
|
Interest income/(expense)
|
—
|
|
—
|
|
—
|
|
|||||
|
Total realized/unrealized gains/(losses)
|
—
|
|
(38
|
)
|
(38
|
)
|
|||||
|
Purchases, issues, sales, and settlements
|
|
|
|
|
|
|
|||||
|
Purchases
|
—
|
|
—
|
|
—
|
|
|||||
|
Issues
|
—
|
|
—
|
|
—
|
|
|||||
|
Sales
|
—
|
|
—
|
|
—
|
|
|||||
|
Settlements
|
—
|
|
—
|
|
—
|
|
|||||
|
Total purchases, issues, sales, and settlements
|
—
|
|
—
|
|
—
|
|
|||||
|
Transfers into Level 3
|
—
|
|
—
|
|
—
|
|
|||||
|
Transfers out of Level 3
|
—
|
|
—
|
|
—
|
|
|||||
|
Ending balance
|
$
|
—
|
|
$
|
99
|
|
$
|
99
|
|
||
|
Unrealized gains/ (losses) on instruments still held
|
$
|
—
|
|
$
|
(38
|
)
|
$
|
(38
|
)
|
||
_
_________
|
(a)
|
Represents transfers out due to the increase in availability of observable data for
$10 million
of derivatives as a result of greater market activity on longer-duration foreign currency forwards.
|
18
Item 1. Financial Statements (Continued)
FORD MOTOR COMPANY AND SUBSIDIARIES
NOTES TO THE FINANCIAL STATEMENTS
NOTE 3. FAIR VALUE MEASUREMENTS
(Continued)
|
|
|||||||||||
|
|
First Quarter 2011
|
||||||||||
|
|
Marketable Securities
|
Derivative Financial Instruments,
Net
|
Total Level 3
Fair Value
|
||||||||
|
Automotive Sector
|
|
|
|
||||||||
|
Beginning balance
|
$
|
2
|
|
$
|
38
|
|
$
|
40
|
|
||
|
Realized/unrealized gains/(losses)
|
|
|
|
|
|||||||
|
Cost of sales
|
—
|
|
(10
|
)
|
(10
|
)
|
|||||
|
Interest income and other non-operating income/(expense), net
|
(1
|
)
|
—
|
|
(1
|
)
|
|||||
|
Other comprehensive income/(loss) (a)
|
—
|
|
—
|
|
—
|
|
|||||
|
Total realized/unrealized gains/(losses)
|
(1
|
)
|
(10
|
)
|
(11
|
)
|
|||||
|
Purchases, issues, sales, and settlements
|
|
|
|
|
|
|
|||||
|
Purchases
|
2
|
|
—
|
|
2
|
|
|||||
|
Issues
|
—
|
|
—
|
|
—
|
|
|||||
|
Sales
|
(1
|
)
|
—
|
|
(1
|
)
|
|||||
|
Settlements
|
—
|
|
(26
|
)
|
(26
|
)
|
|||||
|
Total purchases, issues, sales, and settlements
|
1
|
|
(26
|
)
|
(25
|
)
|
|||||
|
Transfers into Level 3
|
—
|
|
—
|
|
—
|
|
|||||
|
Transfers out of Level 3 (b)
|
(1
|
)
|
—
|
|
(1
|
)
|
|||||
|
Ending balance
|
$
|
1
|
|
$
|
2
|
|
$
|
3
|
|
||
|
Unrealized gains/ (losses) on instruments still held
|
$
|
—
|
|
$
|
(11
|
)
|
$
|
(11
|
)
|
||
|
Financial Services Sector
|
|
|
|
|
|
|
|||||
|
Beginning balance
|
$
|
1
|
|
$
|
(89
|
)
|
$
|
(88
|
)
|
||
|
Realized/unrealized gains/(losses)
|
|
|
|
|
|||||||
|
Other income/(loss), net
|
—
|
|
(23
|
)
|
(23
|
)
|
|||||
|
Other comprehensive income/(loss) (a)
|
—
|
|
(1
|
)
|
(1
|
)
|
|||||
|
Interest income/(expense)
|
—
|
|
5
|
|
5
|
|
|||||
|
Total realized/unrealized gains/(losses)
|
—
|
|
(19
|
)
|
(19
|
)
|
|||||
|
Purchases, issues, sales, and settlements
|
|
|
|
|
|
|
|||||
|
Purchases
|
—
|
|
—
|
|
—
|
|
|||||
|
Issues
|
—
|
|
—
|
|
—
|
|
|||||
|
Sales
|
—
|
|
—
|
|
—
|
|
|||||
|
Settlements
|
—
|
|
48
|
|
48
|
|
|||||
|
Total purchases, issues, sales, and settlements
|
—
|
|
48
|
|
48
|
|
|||||
|
Transfers into Level 3
|
—
|
|
—
|
|
—
|
|
|||||
|
Transfers out of Level 3 (b)
|
(1
|
)
|
(1
|
)
|
(2
|
)
|
|||||
|
Ending balance
|
$
|
—
|
|
$
|
(61
|
)
|
$
|
(61
|
)
|
||
|
Unrealized gains/(losses) on instruments still held
|
$
|
—
|
|
$
|
22
|
|
$
|
22
|
|
||
__________
|
(a)
|
Represents foreign currency translation on derivative asset and liability balances held by non-U.S. dollar foreign affiliates.
|
|
(b)
|
Represents transfers out due to the increase in availability of observable data for
$2 million
of marketable securities as a result of greater market activity for these securities and
$1 million
due to shorter duration of derivative financial instruments.
|
19
Item 1. Financial Statements (Continued)
FORD MOTOR COMPANY AND SUBSIDIARIES
NOTES TO THE FINANCIAL STATEMENTS
NOTE 3. FAIR VALUE MEASUREMENTS
(Continued)
Input Hierarchy of Items Measured at Fair Value on a Nonrecurring Basis
The following table summarizes the items measured at fair value subsequent to initial recognition on a nonrecurring basis by input hierarchy for the periods ended
March 31, 2012
and
December 31, 2011
that were still held on our balance sheet at those dates (in millions):
|
|
March 31, 2012
|
December 31, 2011
|
|||||||||||||||||||||||||||||
|
|
Level 1
|
Level 2
|
Level 3
|
Total
|
Level 1
|
Level 2
|
Level 3
|
Total
|
|||||||||||||||||||||||
|
Financial Services Sector
|
|
|
|
|
|
|
|
|
|||||||||||||||||||||||
|
North America
|
|
|
|
|
|
|
|
|
|||||||||||||||||||||||
|
Retail receivables
|
$
|
—
|
|
$
|
—
|
|
$
|
66
|
|
$
|
66
|
|
$
|
—
|
|
$
|
—
|
|
$
|
70
|
|
$
|
70
|
|
|||||||
|
Dealer loans, net
|
—
|
|
—
|
|
2
|
|
2
|
|
—
|
|
—
|
|
6
|
|
6
|
|
|||||||||||||||
|
Total North America
|
—
|
|
—
|
|
68
|
|
68
|
|
—
|
|
—
|
|
76
|
|
76
|
|
|||||||||||||||
|
International
|
|
|
|
|
|
|
|
|
|
|
|
|
|
|
|
|
|||||||||||||||
|
Retail receivables
|
—
|
|
—
|
|
35
|
|
35
|
|
—
|
|
—
|
|
39
|
|
39
|
|
|||||||||||||||
|
Total International
|
—
|
|
—
|
|
35
|
|
35
|
|
—
|
|
—
|
|
39
|
|
39
|
|
|||||||||||||||
|
Total Financial Services sector
|
$
|
—
|
|
$
|
—
|
|
$
|
103
|
|
$
|
103
|
|
$
|
—
|
|
$
|
—
|
|
$
|
115
|
|
$
|
115
|
|
|||||||
Nonrecurring Fair Value Changes
The following table summarizes the total change in value of items for which a nonrecurring fair value adjustment has been included in our statement of operations for the periods ended
March 31,
related to items still held on our balance sheet at those dates (in millions):
|
|
Total Gains / (Losses)
|
||||||
|
First Quarter
|
|||||||
|
|
2012
|
2011
|
|||||
|
Financial Services Sector
|
|||||||
|
North America
|
|||||||
|
Retail receivables
|
$
|
(11
|
)
|
$
|
(14
|
)
|
|
|
Dealer loans, net
|
—
|
|
—
|
|
|||
|
Total North America
|
(11
|
)
|
(14
|
)
|
|||
|
International
|
|||||||
|
Retail receivables
|
(5
|
)
|
(3
|
)
|
|||
|
Total International
|
(5
|
)
|
(3
|
)
|
|||
|
Total Financial Services sector
|
$
|
(16
|
)
|
$
|
(17
|
)
|
|
Fair value changes related to retail and dealer loan finance receivables that have been written down based on the fair value of the collateral adjusted for estimated costs to sell are recorded in
Financial Services provision for credit and insurance losses.
20
Item 1. Financial Statements (Continued)
FORD MOTOR COMPANY AND SUBSIDIARIES
NOTES TO THE FINANCIAL STATEMENTS
Information About Fair Value Measurements Using Significant Unobservable Inputs (Level 3)
The following table summarizes significant unobservable inputs and the variability of those inputs to alternate methodologies for the period ended March 31, 2012 (in millions):
|
Fair Value
|
Valuation Technique
|
Unobservable Input
|
Fair Value Range
|
||||
|
Automotive Sector
|
|||||||
|
Recurring basis
|
|||||||
|
Net commodity contracts
|
$(44)
|
Income Approach
|
Forward commodity prices for certain commodity types. A lower forward price will result in a lower fair value.
|
$(45) - $(43)
|
|||
|
Financial Services Sector
|
|||||||
|
Recurring basis
|
|||||||
|
Derivative features included in the FUEL Notes
|
$99
|
Market Approach
|
Credit spreads. A higher credit spread will result in a lower fair value.
|
$85 - $112
|
|||
|
Nonrecurring basis
|
|||||||
|
Retail receivables
|
|||||||
|
North America
|
$66
|
Income Approach
|
POD percentage
|
$54 - $66
|
|||
|
International
|
$35
|
Income Approach
|
ARV percentage
|
$28 - $42
|
|||
|
Dealer loans, net
|
$2
|
Income Approach
|
Estimated market value
|
$2 - $4
|
|||
21
Item 1. Financial Statements (Continued)
FORD MOTOR COMPANY AND SUBSIDIARIES
NOTES TO THE FINANCIAL STATEMENTS
Cash and cash equivalents that are restricted as to withdrawal or usage under the terms of certain contractual agreements are recorded in
Other assets
on our balance
sheet.
Our Automotive sector restricted cash balances primarily include cash collateral required to be held against loans from the European Investment Bank ("EIB") and cash collateral required for bank guarantees. Additionally, restricted cash includes various escrow agreements related to insurance, customs, judicial, and environmental matters. Our Financial Services sector restricted cash balances primarily include cash held to meet certain local governmental and regulatory
reserve requirements and cash held under the terms of certain contractual agreements.
Restricted cash does not include required minimum balances or cash securing debt issued through securitization transactions.
Restricted cash reflected on our balance sheet was as follows (in millions):
|
|
March 31,
2012 |
December 31,
2011 |
|||||
|
Automotive sector
|
$
|
323
|
|
$
|
330
|
|
|
|
Financial Services sector
|
200
|
|
149
|
|
|||
|
Total Company
|
$
|
523
|
|
$
|
479
|
|
|
NOTE 5. FINANCE RECEIVABLES
Finance receivables reflected on our consolidated balance sheet were as follows (in millions):
|
March 31,
2012 |
December 31,
2011 |
||||||
|
Automotive sector (a)
|
$
|
356
|
|
$
|
355
|
|
|
|
Financial Services sector
|
73,911
|
|
73,330
|
|
|||
|
Reclassification of receivables purchased by Financial Services sector from Automotive sector to
Other receivables, net
|
(4,370
|
)
|
(3,709
|
)
|
|||
|
Finance receivables, net
|
$
|
69,897
|
|
$
|
69,976
|
|
|
__________
|
(a)
|
Finance receivables are reported on our sector balance sheet in
Receivables, less allowances
and
Other assets
.
|
Automotive Sector
Our Automotive sector holds notes receivable, which consist primarily of notes related to the restructuring of our businesses and loans with certain suppliers. Performance of this group of receivables is evaluated based on payment activity and the financial stability of the debtor. Notes receivable initially are recorded at fair value and subsequently measured at amortized cost.
Notes receivable, net were as follows (in millions):
|
|
March 31,
2012 |
December 31,
2011 |
|||||
|
Notes receivable
|
$
|
390
|
|
$
|
384
|
|
|
|
Less: Allowance for credit losses
|
(34
|
)
|
(29
|
)
|
|||
|
Notes receivable, net
|
$
|
356
|
|
$
|
355
|
|
|
22
Item 1. Financial Statements (Continued)
FORD MOTOR COMPANY AND SUBSIDIARIES
NOTES TO THE FINANCIAL STATEMENTS
NOTE 5. FINANCE RECEIVABLES
(Continued)
Financial Services Sector
Ford Credit segments its North America and International portfolio of finance receivables into "consumer" and "non-consumer" receivables. The receivables are secured by the vehicles, inventory, or other property being financed.
Consumer Segment.
Receivables in this portfolio segment relate to products offered to individuals and businesses that finance the acquisition of Ford vehicles from dealers for personal or commercial use. The products include:
|
•
|
Retail financing
– retail installment contracts for new and used vehicles
|
|
•
|
Direct financing leases
– direct financing leases with retail customers, government entities, daily rental companies, and fleet customers
|
Non-consumer Segment.
Receivables in this portfolio segment relate to products offered to dealers. The products include:
|
•
|
Wholesale financing
– loans to dealers to finance the purchase of vehicle inventory, also known as floorplan financing
|
|
•
|
Dealer loans
– loans to dealers to finance working capital, and to finance the purchase of dealership real estate and/or make improvements to dealership facilities
|
|
•
|
Other financing
– receivables related to the sale of parts and accessories to dealers
|
At
March 31, 2012
and
December 31, 2011
, the recorded investment in Ford Credit's finance receivables excluded
$172 million
and
$180 million
of accrued uncollected interest receivable, respectively, which we report in
Other assets
on the balance sheet.
Finance receivables, net were as follows (in millions):
|
|
March 31, 2012
|
December 31, 2011
|
|||||||||||||||||||||
|
|
North
America
|
International
|
Total Finance Receivables
|
North
America
|
International
|
Total Finance Receivables
|
|||||||||||||||||
|
Consumer
|
|
|
|
|
|
|
|||||||||||||||||
|
Retail, gross
|
$
|
38,276
|
|
$
|
8,565
|
|
$
|
46,841
|
|
$
|
38,406
|
|
$
|
8,400
|
|
$
|
46,806
|
|
|||||
|
Less: Unearned interest supplements
|
(1,341
|
)
|
(210
|
)
|
(1,551
|
)
|
(1,407
|
)
|
(219
|
)
|
(1,626
|
)
|
|||||||||||
|
Retail
|
36,935
|
|
8,355
|
|
45,290
|
|
36,999
|
|
8,181
|
|
45,180
|
|
|||||||||||
|
Direct financing leases, gross
|
3
|
|
2,671
|
|
2,674
|
|
4
|
|
2,683
|
|
2,687
|
|
|||||||||||
|
Less: Unearned interest supplements
|
—
|
|
(115
|
)
|
(115
|
)
|
—
|
|
(116
|
)
|
(116
|
)
|
|||||||||||
|
Direct financing leases
|
3
|
|
2,556
|
|
2,559
|
|
4
|
|
2,567
|
|
2,571
|
|
|||||||||||
|
Consumer finance receivables
|
$
|
36,938
|
|
$
|
10,911
|
|
$
|
47,849
|
|
$
|
37,003
|
|
$
|
10,748
|
|
$
|
47,751
|
|
|||||
|
Non-consumer
|
|
|
|
|
|
|
|
|
|
|
|
|
|||||||||||
|
Wholesale
|
$
|
15,648
|
|
$
|
8,438
|
|
$
|
24,086
|
|
$
|
15,413
|
|
$
|
8,416
|
|
$
|
23,829
|
|
|||||
|
Dealer loans
|
1,084
|
|
60
|
|
1,144
|
|
1,088
|
|
63
|
|
1,151
|
|
|||||||||||
|
Other
|
818
|
|
466
|
|
1,284
|
|
723
|
|
377
|
|
1,100
|
|
|||||||||||
|
Non-consumer finance receivables
|
17,550
|
|
8,964
|
|
26,514
|
|
17,224
|
|
8,856
|
|
26,080
|
|
|||||||||||
|
Total recorded investment
|
$
|
54,488
|
|
$
|
19,875
|
|
$
|
74,363
|
|
$
|
54,227
|
|
$
|
19,604
|
|
$
|
73,831
|
|
|||||
|
Recorded investment in finance receivables
|
$
|
54,488
|
|
$
|
19,875
|
|
$
|
74,363
|
|
$
|
54,227
|
|
$
|
19,604
|
|
$
|
73,831
|
|
|||||
|
Less: Allowance for credit losses
|
(343
|
)
|
(109
|
)
|
(452
|
)
|
(388
|
)
|
(113
|
)
|
(501
|
)
|
|||||||||||
|
Finance receivables, net
|
$
|
54,145
|
|
$
|
19,766
|
|
$
|
73,911
|
|
$
|
53,839
|
|
$
|
19,491
|
|
$
|
73,330
|
|
|||||
|
Net finance receivables subject to fair value (a)
|
$
|
71,349
|
|
$
|
70,754
|
|
|||||||||||||||||
|
Fair value
|
72,936
|
|
72,294
|
|
|||||||||||||||||||
__________
|
(a)
|
At
March 31, 2012
and
December 31, 2011
, excludes
$2.6 billion
of certain receivables (primarily direct financing leases) that are not subject to fair value disclosure requirements. All finance receivables are categorized within Level 3 of the fair value hierarchy. See Note 3 for additional information.
|
23
Item 1. Financial Statements (Continued)
FORD MOTOR COMPANY AND SUBSIDIARIES
NOTES TO THE FINANCIAL STATEMENTS
NOTE 5. FINANCE RECEIVABLES
(Continued)
Included in the recorded investment in finance receivables at
March 31, 2012
and
December 31, 2011
were North America consumer receivables of
$27.9 billion
and
$29.4 billion
and non-consumer receivables of
$14.3 billion
and
$14.2 billion
, respectively, and International consumer receivables of
$7.3 billion
and
$7.1 billion
and non-consumer receivables of
$6.3 billion
and
$5.6 billion
, respectively, that secure certain debt obligations. The receivables are available only for payment of the debt and other obligations issued or arising in securitization transactions; they are not available to pay the other obligations of our Financial Services sector or the claims of its other creditors. Ford Credit holds the right to receive the excess cash flows not needed to pay the debt and other obligations issued or arising in securitization transactions (see Note 8).
Aging.
For all classes of finance receivables, Ford Credit defines "past due" as
any payment, including principal and interest, that has not been collected and is at least 31 days past the contractual due date
. The aging analysis of Ford Credit's finance receivables balances at
March 31, 2012
was as follows (in millions):
|
|
31-60
Days Past
Due
|
61-90
Days Past
Due
|
91-120
Days Past
Due
|
Greater
Than 120
Days
Past Due
|
Total Past
Due
|
Current
|
Total
Finance Receivables
|
||||||||||||||||||||
|
North America
|
|||||||||||||||||||||||||||
|
Consumer
|
|
|
|
|
|
|
|
||||||||||||||||||||
|
Retail
|
$
|
580
|
|
$
|
49
|
|
$
|
19
|
|
$
|
66
|
|
$
|
714
|
|
$
|
36,221
|
|
$
|
36,935
|
|
||||||
|
Direct financing leases
|
—
|
|
—
|
|
—
|
|
—
|
|
—
|
|
3
|
|
3
|
|
|||||||||||||
|
Non-consumer
|
|
|
|
|
|
|
|||||||||||||||||||||
|
Wholesale
|
7
|
|
—
|
|
—
|
|
2
|
|
9
|
|
15,639
|
|
15,648
|
|
|||||||||||||
|
Dealer loans
|
1
|
|
—
|
|
—
|
|
3
|
|
4
|
|
1,080
|
|
1,084
|
|
|||||||||||||
|
Other
|
1
|
|
—
|
|
—
|
|
—
|
|
1
|
|
817
|
|
818
|
|
|||||||||||||
|
Total North America recorded investment
|
589
|
|
49
|
|
19
|
|
71
|
|
728
|
|
53,760
|
|
54,488
|
|
|||||||||||||
|
International
|
|||||||||||||||||||||||||||
|
Consumer
|
|||||||||||||||||||||||||||
|
Retail
|
56
|
|
19
|
|
12
|
|
35
|
|
122
|
|
8,233
|
|
8,355
|
|
|||||||||||||
|
Direct financing leases
|
8
|
|
3
|
|
1
|
|
4
|
|
16
|
|
2,540
|
|
2,556
|
|
|||||||||||||
|
Non-consumer
|
|
|
|
|
|
|
|||||||||||||||||||||
|
Wholesale
|
2
|
|
1
|
|
—
|
|
5
|
|
8
|
|
8,430
|
|
8,438
|
|
|||||||||||||
|
Dealer loans
|
—
|
|
—
|
|
—
|
|
1
|
|
1
|
|
59
|
|
60
|
|
|||||||||||||
|
Other
|
—
|
|
—
|
|
—
|
|
1
|
|
1
|
|
465
|
|
466
|
|
|||||||||||||
|
Total International recorded investment
|
66
|
|
23
|
|
13
|
|
46
|
|
148
|
|
19,727
|
|
19,875
|
|
|||||||||||||
|
Total recorded investment
|
$
|
655
|
|
$
|
72
|
|
$
|
32
|
|
$
|
117
|
|
$
|
876
|
|
$
|
73,487
|
|
$
|
74,363
|
|
||||||
Consumer Credit Quality
. When originating all classes of consumer receivables, Ford Credit uses a proprietary scoring system that measures the credit quality of the receivables using several factors, such as credit bureau information, consumer credit risk scores (e.g., FICO score), and customer and contract characteristics. In addition to its proprietary scoring system, Ford Credit considers other individual consumer factors, such as employment history, financial stability, and capacity to pay.
Subsequent to origination, Ford Credit reviews the credit quality of retail and direct financing lease receivables based on customer payment activity. As each customer develops a payment history, Ford Credit uses an internally-developed behavioral scoring model to assist in determining the best collection strategies. Based on data from this scoring model, contracts are categorized by collection risk. Ford Credit's collection models evaluate several factors, including origination characteristics, updated credit bureau data, and payment patterns. These models allow for more focused collection activity on higher-risk accounts and are used to refine Ford Credit's risk-based staffing model to ensure collection resources are aligned with portfolio risk.
24
Item 1. Financial Statements (Continued)
FORD MOTOR COMPANY AND SUBSIDIARIES
NOTES TO THE FINANCIAL STATEMENTS
NOTE 5. FINANCE RECEIVABLES
(Continued)
Credit quality ratings for Ford Credit's consumer receivables are categorized as follows:
|
•
|
Pass
–
current to 60 days past due
|
|
•
|
Special Mention
– 61 to 120 days past due and in intensified collection status
|
|
•
|
Substandard
–
greater than 120 days past due
and for which the uncollectible portion of the receivables has already been charged-off, as measured using the fair value of the collateral
|
The credit quality analysis of Ford Credit's consumer receivables portfolio was as follows (in millions):
|
|
March 31, 2012
|
December 31, 2011
|
|||||||||||||
|
|
Retail
|
Direct Financing
Leases
|
Retail
|
Direct Financing
Leases
|
|||||||||||
|
North America
|
|
|
|
|
|||||||||||
|
Pass
|
$
|
36,801
|
|
$
|
3
|
|
$
|
36,839
|
|
$
|
4
|
|
|||
|
Special Mention
|
68
|
|
—
|
|
90
|
|
—
|
|
|||||||
|
Substandard
|
66
|
|
—
|
|
70
|
|
—
|
|
|||||||
|
Total North America recorded investment
|
36,935
|
|
3
|
|
36,999
|
|
4
|
|
|||||||
|
International
|
|
|
|
|
|
|
|
|
|||||||
|
Pass
|
8,289
|
|
2,548
|
|
8,107
|
|
2,559
|
|
|||||||
|
Special Mention
|
31
|
|
4
|
|
34
|
|
5
|
|
|||||||
|
Substandard
|
35
|
|
4
|
|
40
|
|
3
|
|
|||||||
|
Total International recorded investment
|
8,355
|
|
2,556
|
|
8,181
|
|
2,567
|
|
|||||||
|
Total recorded investment
|
$
|
45,290
|
|
$
|
2,559
|
|
$
|
45,180
|
|
$
|
2,571
|
|
|||
Non-consumer Credit Quality
. For all classes of non-consumer receivables, Ford Credit extends commercial credit to dealers primarily in the form of approved lines of credit to purchase new Ford and Lincoln vehicles as well as used vehicles. Each commercial lending request is evaluated by taking into consideration the borrower's financial condition and the underlying collateral securing the loan. Ford Credit uses a proprietary model to assign each dealer a risk rating. This model uses historical performance data to identify key factors about a dealer that Ford Credit considers significant in predicting a dealer's ability to meet its financial obligations. Ford Credit also considers numerous other financial and qualitative factors including capitalization and leverage, liquidity and cash flow, profitability, and credit history with Ford Credit and other creditors. A dealer's risk rating does not reflect any guarantees or a dealer owner's net worth.
Dealers are assigned to one of four groups according to their risk rating as follows:
|
•
|
Group I
– strong to superior financial metrics
|
|
•
|
Group II
– fair to favorable financial metrics
|
|
•
|
Group III
– marginal to weak financial metrics
|
|
•
|
Group IV
– poor financial metrics, including dealers classified as uncollectible
|
Ford Credit suspends credit lines and extends no further funding to dealers classified in Group IV.
Ford Credit regularly reviews its model to confirm the continued business significance and statistical predictability of the factors and updates the model to incorporate new factors or other information that improves its statistical predictability. In addition, Ford Credit verifies the existence of the assets collateralizing the receivables by physical audits of vehicle inventories, which are performed with increased frequency for higher-risk (i.e., Group III and Group IV) dealers. Ford Credit performs a credit review of each dealer at least annually and adjusts the dealer's risk rating, if necessary.
25
Item 1. Financial Statements (Continued)
FORD MOTOR COMPANY AND SUBSIDIARIES
NOTES TO THE FINANCIAL STATEMENTS
NOTE 5. FINANCE RECEIVABLES
(Continued)
Performance of non-consumer receivables is evaluated based on Ford Credit's internal dealer risk rating analysis, as payment for wholesale receivables generally is not required until the dealer has sold the vehicle. Wholesale and dealer loan receivables with the same dealer share the same risk rating. The credit quality analysis of wholesale and dealer loan receivables was as follows (in millions):
|
|
March 31, 2012
|
December 31, 2011
|
|||||||||||||
|
|
Wholesale
|
Dealer Loan
|
Wholesale
|
Dealer Loan
|
|||||||||||
|
North America
|
|
|
|
|
|||||||||||
|
Group I
|
$
|
12,918
|
|
$
|
857
|
|
$
|
12,645
|
|
$
|
861
|
|
|||
|
Group II
|
2,450
|
|
154
|
|
2,489
|
|
165
|
|
|||||||
|
Group III
|
258
|
|
66
|
|
273
|
|
58
|
|
|||||||
|
Group IV
|
22
|
|
7
|
|
6
|
|
4
|
|
|||||||
|
Total North America recorded investment
|
15,648
|
|
1,084
|
|
15,413
|
|
1,088
|
|
|||||||
|
International
|
|
|
|
|
|
|
|
|
|||||||
|
Group I
|
5,459
|
|
41
|
|
5,115
|
|
42
|
|
|||||||
|
Group II
|
1,847
|
|
9
|
|
1,965
|
|
10
|
|
|||||||
|
Group III
|
1,129
|
|
9
|
|
1,327
|
|
10
|
|
|||||||
|
Group IV
|
3
|
|
1
|
|
9
|
|
1
|
|
|||||||
|
Total international recorded investment
|
8,438
|
|
60
|
|
8,416
|
|
63
|
|
|||||||
|
Total recorded investment
|
$
|
24,086
|
|
$
|
1,144
|
|
$
|
23,829
|
|
$
|
1,151
|
|
|||
Non-accrual Status.
The accrual of revenue is discontinued at the earlier of the
time a receivable is determined to be uncollectible, at bankruptcy status notification, or greater than 120 days past due
. Finance receivable accounts may be restored to accrual status only when a customer settles all past-due deficiency balances and future payments are reasonably assured. For receivables in non-accrual status, subsequent financing revenue is recognized only to the extent a payment is received. Payments are generally applied first to outstanding interest and then to the unpaid principal balance.
The recorded investment of consumer receivables in non-accrual status was
$368 million
, or
0.8%
of our consumer receivables, at
March 31, 2012
, and
$402 million
, or
0.9%
of our consumer receivables, at
December 31, 2011
.
The recorded investment of non-consumer receivables in non-accrual status was
$18 million
, or
0.1%
of our non-consumer receivables, at
March 31, 2012
, and
$27 million
, or
0.1%
of our non-consumer receivables, at
December 31, 2011
.
Finance receivables greater than 90 days past due and still accruing interest was
$14 million
of non-bankrupt retail accounts at
March 31, 2012
and
December 31, 2011
, and
$1 million
of dealer loans were greater than 90 days past due and still accruing at
March 31, 2012
and
December 31, 2011
.
26
Item 1. Financial Statements (Continued)
FORD MOTOR COMPANY AND SUBSIDIARIES
NOTES TO THE FINANCIAL STATEMENTS
NOTE 5. FINANCE RECEIVABLES
(Continued)
Consumer Impairment.
Ford Credit's finance receivables are evaluated both collectively and specifically for impairment. Impaired consumer receivables represent accounts that have been re-written or modified in reorganization proceedings pursuant to the U.S. Bankruptcy Code and are considered to be Troubled Debt Restructurings ("TDRs"), as well as all accounts
greater than 120 days past due
. The recorded investment of consumer receivables that were impaired at
March 31, 2012
and
December 31, 2011
was
$394 million
, or
0.9%
of consumer receivables, and
$382 million
, or
0.8%
of consumer receivables, respectively.
Non-consumer Impairment.
Impaired non-consumer receivables represent accounts with dealers that have weak or poor financial metrics or dealer loans that have been modified in TDRs. The following factors (not necessarily in order of importance or probability of occurrence) are considered in determining whether a non-consumer receivable is impaired:
|
•
|
Delinquency in contractual payments of principal or interest
|
|
•
|
Deterioration of the borrower's competitive position
|
|
•
|
Cash flow difficulties experienced by the borrower
|
|
•
|
Breach of loan covenants or conditions
|
|
•
|
Initiation of dealer bankruptcy or other insolvency proceedings
|
|
•
|
Fraud or criminal conviction
|
The recorded investment of non-consumer receivables that were impaired at
March 31, 2012
and
December 31, 2011
, was
$70 million
, or
0.3%
of non-consumer receivables, and
$64 million
, or
0.2%
of the non-consumer receivables, respectively.
Effective July 1, 2011, Ford Credit applied the requirements of the new accounting standard related to TDRs to restructurings occurring on or after January 1, 2011.
A restructuring of debt constitutes a TDR if Ford Credit grants a concession to a customer or borrower for economic or legal reasons related to the debtor's financial difficulties that Ford Credit otherwise would not consider.
Consumer.
Payment extensions are granted to consumers in the normal course of business. Payment extensions result in a short-term deferral of the customer's normal monthly payment and do not constitute TDRs because payment concessions are not granted on the principal amount of the account or the interest rate charged and are not granted to consumers considered to be in financial difficulty.
Consumer receivable contracts may be modified to lower the customer's payment by extending the term of the contract or lowering the interest rate as a remedy to avoid or cure delinquency. Ford Credit does not grant concessions on the principal balance for re-written contracts. Contracts that have a modified interest rate that is below the market rate are considered to be TDRs.
Consumer receivables modified in reorganization proceedings pursuant to the U.S. Bankruptcy Code are considered to be TDRs. Ford Credit does not record changes to the recorded investment per the original contract for these TDRs until all payments and requirements of the reorganization plan are met.
The outstanding recorded investment at time of modification for consumer receivables that are considered to be TDRs was
$63 million
, or
0.1%
of Ford Credit's consumer receivables during the period ended
March 31, 2012
and
$119 million
, or
0.3%
of Ford Credit's consumer receivables, during the period ended
March 31, 2011
. A subsequent default occurs when contracts that were previously modified in TDRs within the last twelve months and subsequently had past due payments that resulted in repossession. The subsequent annualized default rate for consumer contracts was
6.1%
of TDRs during the period ended
March 31, 2012
.
Consumer receivables involved in TDRs are specifically assessed for impairment. A specific allowance is estimated based on the present value of the expected future cash flows of the receivable discounted at the loan's original effective interest rate or the fair value of any collateral adjusted for estimated costs to sell. For loans where foreclosure is probable, the fair value of the collateral is used to estimate the specific impairment. The allowance for credit losses related to consumer TDRs was
$17 million
at
March 31, 2012
. Ford Credit did not have any reserves for TDRs at
March 31, 2011
.
27
Item 1. Financial Statements (Continued)
FORD MOTOR COMPANY AND SUBSIDIARIES
NOTES TO THE FINANCIAL STATEMENTS
Non-consumer.
Within Ford Credit's non-consumer receivables segment, only dealer loans subject to forbearance, moratoriums, extension agreements or other actions intended to minimize economic loss and to avoid foreclosure or repossession of collateral are classified as TDRs. Ford Credit does not grant concessions on the principal balance of dealer loans. There were no dealer loans involved in TDRs during the period ended
March 31, 2012
. The outstanding recorded investment of dealer loans involved in TDRs was
$12 million
, or less than
0.1%
of Ford Credit's non-consumer receivables, during the period ended
March 31, 2011
. A subsequent default occurs when receivables that were previously modified in TDRs within the last twelve months and subsequently had past due payments that resulted in foreclosure or charge-off. There were no subsequent defaults for non-consumer contracts for the period ended
March 31, 2012
. The subsequent annualized default rate was
33.3%
of TDRs during the period ended
March 31, 2011
.
Dealer loans involved in TDRs are assessed for impairment and included in Ford Credit's allowance for credit losses based on either the present value of the expected future cash flows of the receivable discounted at the loan's original effective interest rate, or the fair value of the collateral adjusted for estimated costs to sell. For loans where foreclosure is probable, the fair value of the collateral is used to estimate the specific impairment. An impairment charge is recorded as part of the provision to the allowance for credit losses for the amount by which the recorded investment of the receivable exceeds its estimated fair value. The allowance for credit losses related to non-consumer TDRs was
$5 million
and
$8 million
at
March 31, 2012
and
2011
, respectively.
NOTE 6. ALLOWANCE FOR CREDIT LOSSES
Automotive Sector
Following is an analysis of the allowance for credit losses for the periods ended
March 31
(in millions):
|
First Quarter
|
|||||||
|
2012
|
2011
|
||||||
|
Allowance for credit losses
|
|
||||||
|
Beginning balance
|
$
|
29
|
|
$
|
120
|
|
|
|
Charge-offs
|
—
|
|
—
|
|
|||
|
Recoveries
|
(2
|
)
|
—
|
|
|||
|
Provision for credit losses
|
—
|
|
2
|
|
|||
|
Other
|
7
|
|
(21
|
)
|
|||
|
Ending balance
|
$
|
34
|
|
$
|
101
|
|
|
28
Item 1. Financial Statements (Continued)
FORD MOTOR COMPANY AND SUBSIDIARIES
NOTES TO THE FINANCIAL STATEMENTS
Financial Services Sector
Following is an analysis of the allowance for credit losses related to finance receivables and investment in operating leases for the periods ended
March 31
(in millions):
|
First Quarter 2012
|
|||||||||||||||||||
|
|
Finance Receivables
|
Net Investment in
Operating Leases
|
|
||||||||||||||||
|
|
Consumer
|
Non-consumer
|
Total
|
Total Allowance
|
|||||||||||||||
|
Allowance for credit losses
|
|
|
|
|
|
||||||||||||||
|
Beginning balance
|
$
|
457
|
|
$
|
44
|
|
$
|
501
|
|
$
|
40
|
|
$
|
541
|
|
||||
|
Charge-offs
|
(85
|
)
|
(4
|
)
|
(89
|
)
|
(13
|
)
|
(102
|
)
|
|||||||||
|
Recoveries
|
47
|
|
5
|
|
52
|
|
14
|
|
66
|
|
|||||||||
|
Provision for credit losses
|
2
|
|
(18
|
)
|
(16
|
)
|
(8
|
)
|
(24
|
)
|
|||||||||
|
Other (a)
|
3
|
|
1
|
|
4
|
|
—
|
|
4
|
|
|||||||||
|
Ending balance
|
$
|
424
|
|
$
|
28
|
|
$
|
452
|
|
$
|
33
|
|
$
|
485
|
|
||||
|
Analysis of ending balance of allowance for
credit losses
|
|
|
|
|
|
|
|
|
|
|
|||||||||
|
Collective impairment allowance
|
$
|
407
|
|
$
|
21
|
|
$
|
428
|
|
$
|
33
|
|
$
|
461
|
|
||||
|
Specific impairment allowance
|
17
|
|
7
|
|
24
|
|
—
|
|
24
|
|
|||||||||
|
Ending balance
|
$
|
424
|
|
$
|
28
|
|
$
|
452
|
|
$
|
33
|
|
$
|
485
|
|
||||
|
Analysis of ending balance of finance receivables and net investment in operating leases
|
|
|
|
|
|
|
|
|
|
|
|||||||||
|
Collectively evaluated for impairment
|
$
|
47,455
|
|
$
|
26,444
|
|
$
|
73,899
|
|
$
|
12,350
|
|
|
|
|||||
|
Specifically evaluated for impairment
|
394
|
|
70
|
|
464
|
|
—
|
|
|
|
|||||||||
|
Recorded investment (b)
|
$
|
47,849
|
|
$
|
26,514
|
|
$
|
74,363
|
|
$
|
12,350
|
|
|
|
|||||
|
Ending balance, net of allowance for credit losses
|
$
|
47,425
|
|
$
|
26,486
|
|
$
|
73,911
|
|
$
|
12,317
|
|
|
|
|||||
__________
|
(a)
|
Represents amounts related to translation adjustments.
|
|
(b)
|
Represents finance receivables and net investment in operating leases before allowance for credit losses.
|
|
First Quarter 2011
|
|||||||||||||||||||
|
|
Finance Receivables
|
Net Investment in
Operating Leases
|
|
||||||||||||||||
|
|
Consumer
|
Non-consumer
|
Total
|
Total Allowance
|
|||||||||||||||
|
Allowance for credit losses
|
|
|
|
|
|
||||||||||||||
|
Beginning balance
|
$
|
707
|
|
$
|
70
|
|
$
|
777
|
|
$
|
87
|
|
$
|
864
|
|
||||
|
Charge-offs
|
(113
|
)
|
2
|
|
(111
|
)
|
(29
|
)
|
(140
|
)
|
|||||||||
|
Recoveries
|
57
|
|
2
|
|
59
|
|
25
|
|
84
|
|
|||||||||
|
Provision for credit losses
|
(30
|
)
|
(25
|
)
|
(55
|
)
|
(9
|
)
|
(64
|
)
|
|||||||||
|
Other (a)
|
7
|
|
1
|
|
8
|
|
1
|
|
9
|
|
|||||||||
|
Ending balance
|
$
|
628
|
|
$
|
50
|
|
$
|
678
|
|
$
|
75
|
|
$
|
753
|
|
||||
|
Analysis of ending balance of allowance for
credit losses
|
|
|
|
|
|
|
|
|
|
|
|||||||||
|
Collective impairment allowance
|
$
|
628
|
|
$
|
41
|
|
$
|
669
|
|
$
|
75
|
|
$
|
744
|
|
||||
|
Specific impairment allowance
|
—
|
|
9
|
|
9
|
|
—
|
|
9
|
|
|||||||||
|
Ending balance
|
$
|
628
|
|
$
|
50
|
|
$
|
678
|
|
$
|
75
|
|
$
|
753
|
|
||||
|
Analysis of ending balance of finance receivables and net investment in operating leases
|
|
|
|
|
|
|
|
|
|
|
|||||||||
|
Collectively evaluated for impairment
|
$
|
49,395
|
|
$
|
26,370
|
|
$
|
75,765
|
|
$
|
10,467
|
|
|
|
|||||
|
Specifically evaluated for impairment
|
—
|
|
112
|
|
112
|
|
—
|
|
|
|
|||||||||
|
Recorded investment (b)
|
$
|
49,395
|
|
$
|
26,482
|
|
$
|
75,877
|
|
$
|
10,467
|
|
|
|
|||||
|
Ending balance, net of allowance for credit losses
|
$
|
48,767
|
|
$
|
26,432
|
|
$
|
75,199
|
|
$
|
10,392
|
|
|
|
|||||
__________
|
(a)
|
Represents amounts related to translation adjustments.
|
|
(b)
|
Represents finance receivables and net investment in operating leases before allowance for credit losses.
|
29
Item 1. Financial Statements (Continued)
FORD MOTOR COMPANY AND SUBSIDIARIES
NOTES TO THE FINANCIAL STATEMENTS
All inventories are stated at the lower of cost or market. Cost for a substantial portion of U.S. inventories is determined on a last-in, first-out ("LIFO") basis. LIFO was used for approximately
36%
and
32%
of total inventories at
March 31, 2012
and
December 31, 2011
, respectively. Cost of other inventories is determined by costing methods that approximate a first-in, first-out ("FIFO") basis.
Inventories were as follows (in millions):
|
|
March 31,
2012 |
December 31,
2011 |
|||||
|
Raw materials, work-in-process and supplies
|
$
|
3,409
|
|
$
|
2,847
|
|
|
|
Finished products
|
4,559
|
|
3,982
|
|
|||
|
Total inventories under FIFO
|
7,968
|
|
6,829
|
|
|||
|
Less: LIFO adjustment
|
(937
|
)
|
(928
|
)
|
|||
|
Total inventories
|
$
|
7,031
|
|
$
|
5,901
|
|
|
NOTE 8. VARIABLE INTEREST ENTITIES
A VIE is an entity that either (i) has insufficient equity to permit the entity to finance its activities without additional subordinated financial support or (ii) has equity investors who lack the characteristics of a controlling financial interest. A VIE is consolidated by its primary beneficiary. The primary beneficiary has both the power to direct the activities that most significantly impact the entity's economic performance and the obligation to absorb losses or the right to receive benefits from the entity that could potentially be significant to the VIE.
We have the power to direct the activities of an entity when our management has the ability to make key operating decisions, such as decisions regarding capital or product investment or manufacturing production schedules. We have the power to direct the activities of our special purpose entities when we have the ability to exercise discretion in the servicing of financial assets, issue additional debt, exercise a unilateral call option, add assets to revolving structures, or control investment decisions.
Assets recognized as a result of consolidating these VIEs do not represent additional assets that could be used to satisfy claims against our general assets. Conversely, liabilities recognized as a result of consolidating these VIEs do not represent additional claims on our general assets; rather, they represent claims against the specific assets of the consolidated VIEs.
Automotive Sector
VIEs of Which We are Not the Primary Beneficiary
Getrag Ford Transmissions GmbH ("GFT") is a joint venture that constitutes a significant VIE of which we are not the primary beneficiary, and which was not consolidated as of
March 31, 2012
or
December 31, 2011
. GFT is a
50
/
50
joint venture with Getrag Deutsche Venture GmbH and Co. KG. Ford and its related parties purchase substantially all of the joint venture's output. We do not, however, have the power to direct economically significant activities of the joint venture.
Zeledyne, LLC ("Zeledyne") is a VIE (that is not a joint venture) of which we are not the primary beneficiary as of
March 31, 2012
or
December 31, 2011
. Zeledyne manufactures and sells glass products for automotive glass markets. Ford provides certain guarantees to Zeledyne. In 2011, Zeledyne sold a portion of its glass business to Central Glass. As the guarantees are still in place, Zeledyne remains a VIE of which Ford is not the primary beneficiary. The carrying value of our obligation relating to the guarantees to Zeledyne's shareholders was
$6 million
at
March 31, 2012
.
Our maximum exposure to loss from VIEs of which we are not the primary beneficiary was as follows (in millions):
|
|
March 31,
2012 |
December 31,
2011 |
Change in
Maximum
Exposure
|
||||||||
|
Investments
|
$
|
243
|
|
$
|
229
|
|
$
|
14
|
|
||
|
Guarantees
|
6
|
|
6
|
|
—
|
|
|||||
|
Total maximum exposure
|
$
|
249
|
|
$
|
235
|
|
$
|
14
|
|
||
30
Item 1. Financial Statements (Continued)
FORD MOTOR COMPANY AND SUBSIDIARIES
NOTES TO THE FINANCIAL STATEMENTS
NOTE 8. VARIABLE INTEREST ENTITIES
(Continued)
Financial Services Sector
VIEs of Which We are the Primary Beneficiary
Our Financial Services sector uses special purpose entities to issue asset-backed securities in transactions to public and private investors, bank conduits, and government-sponsored entities or others who obtain funding from government programs. We have deemed most of these special purpose entities to be VIEs. The asset-backed securities are secured by finance receivables and interests in net investments in operating leases. The assets continue to be consolidated by our Financial Services sector. We retain interests in the securitization VIEs, including primarily subordinated securities issued by the VIEs, and rights to cash held for the benefit of the securitization investors.
The transactions create and pass along risks to the variable interest holders, depending on the assets securing the debt and the specific terms of the transactions. Our Financial Services sector aggregates and analyzes the following transactions based on the risk profile of the product and the type of funding structure, including:
|
•
|
Retail - consumer credit risk and prepayment risk
|
|
•
|
Wholesale - dealer credit risk
|
|
•
|
Net investments in operating lease - vehicle residual value risk, consumer credit risk, and prepayment risk
|
As a residual interest holder, we are exposed to the underlying residual and credit risk of the collateral, and are exposed to interest rate risk in some transactions. The amount of risk absorbed by our residual interests generally is represented by and limited to the amount of overcollaterization of the assets securing the debt and any cash reserves.
We have no obligation to repurchase or replace any securitized asset that subsequently becomes delinquent in payment or otherwise is in default, except under standard representations and warranties such as good and marketable title to the assets, or when certain changes are made to the underlying asset contracts. Securitization investors have no recourse to our Financial Services sector or its other assets for credit losses on the securitized assets and have no right to require our Financial Services sector to repurchase the investments. We generally have no obligation to provide liquidity or contribute cash or additional assets to the VIEs and do not guarantee any asset-backed securities, although Ford Credit is the co-obligor of the debt of a consolidated VIE up to
$250 million
for two of its securitization transactions. Ford Credit may be required to support the performance of certain securitization transactions, however, by increasing cash reserves.
Although not contractually required, Ford Credit regularly supports its wholesale securitization programs by repurchasing receivables of a dealer from the VIEs when the dealer's performance is at risk, which transfers the corresponding risk of loss from the VIE to Ford Credit. In order to continue to fund the wholesale receivables, Ford Credit also may contribute additional cash or wholesale receivables if the collateral falls below required levels. The balances of cash related to these contributions were
$125 million
and
$0
at
March 31, 2012
and
December 31, 2011
, respectively, and ranged from
$0
to
$125 million
during the first quarter of 2012. In addition, while not contractually required, Ford Credit may purchase the commercial paper issued by Ford Credit's FCAR Owner Trust asset-backed commercial paper program.
VIEs that are exposed to interest rate or currency risk have reduced their risks by entering into derivative transactions. In certain instances, Ford Credit has entered into offsetting derivative transactions with the VIE to protect the VIE from the risks that are not mitigated through the derivative transactions between the VIE and its external counterparty. In other instances, Ford Credit has entered into derivative transactions with the counterparty to protect the counterparty from risks absorbed through derivative transactions with the VIEs. See Note 3 and Note 12 for additional information regarding derivatives.
31
Item 1. Financial Statements (Continued)
FORD MOTOR COMPANY AND SUBSIDIARIES
NOTES TO THE FINANCIAL STATEMENTS
NOTE 8. VARIABLE INTEREST ENTITIES
(Continued)
The following table includes assets to be used to settle the liabilities of the consolidated VIEs. We may retain debt issued by consolidated VIEs and this debt is excluded from the table below. We hold the right to the excess cash flows from the assets that are not needed to pay liabilities of the consolidated VIEs. The assets and debt reflected on our consolidated balance sheet were as follows (in billions):
|
|
March 31, 2012
|
||||||||||
|
|
Cash and Cash
Equivalents
|
Finance
Receivables, Net
and
Net Investment in
Operating Leases
|
Debt
|
||||||||
|
Finance receivables
|
|
|
|
||||||||
|
Retail
|
$
|
2.7
|
|
$
|
31.1
|
|
$
|
25.5
|
|
||
|
Wholesale
|
0.9
|
|
18.9
|
|
12.8
|
|
|||||
|
Total finance receivables
|
3.6
|
|
50.0
|
|
38.3
|
|
|||||
|
Net investment in operating leases
|
0.3
|
|
5.7
|
|
4.0
|
|
|||||
|
Total (a)
|
$
|
3.9
|
|
$
|
55.7
|
|
$
|
42.3
|
|
||
__________
|
(a)
|
Certain notes issued by the VIEs to affiliated companies served as collateral for accessing the European Central Bank ("ECB") open market operations program. This external funding of
$187 million
at
March 31, 2012
was not reflected as debt of the VIEs and is excluded from the table above, but was included in our consolidated debt. The finance receivables backing this external funding are included in the table above.
|
|
|
December 31, 2011
|
||||||||||
|
|
Cash and Cash
Equivalents
|
Finance
Receivables, Net
and
Net Investment in
Operating Leases
|
Debt
|
||||||||
|
Finance receivables
|
|
|
|
||||||||
|
Retail
|
$
|
2.5
|
|
$
|
31.9
|
|
$
|
26.0
|
|
||
|
Wholesale
|
0.5
|
|
17.9
|
|
11.2
|
|
|||||
|
Total finance receivables
|
3.0
|
|
49.8
|
|
37.2
|
|
|||||
|
Net investment in operating leases
|
0.4
|
|
6.4
|
|
4.2
|
|
|||||
|
Total (a)
|
$
|
3.4
|
|
$
|
56.2
|
|
$
|
41.4
|
|
||
__________
|
(a)
|
Certain notes issued by the VIEs to affiliated companies served as collateral for accessing the ECB open market operations program. This external funding of
$246 million
at
December 31, 2011
was not reflected as debt of the VIEs and is excluded from the table above, but was included in our consolidated debt. The finance receivables backing this external funding are included in the table above.
|
Interest expense on securitization debt related to consolidated VIEs was
$227 million
and
$254 million
for the periods ended
March 31, 2012
and
2011
, respectively.
Ford Credit's exposure based on the fair value of derivative instruments related to consolidated VIEs that support its securitization transactions was as follows (in millions):
|
|
March 31, 2012
|
December 31, 2011
|
|||||||||||||
|
|
Derivative
Asset
|
Derivative
Liability
|
Derivative
Asset
|
Derivative
Liability
|
|||||||||||
|
VIE – Securitization entities
|
$
|
113
|
|
$
|
128
|
|
$
|
157
|
|
$
|
97
|
|
|||
|
Ford Credit related to VIE
|
82
|
|
79
|
|
81
|
|
63
|
|
|||||||
|
Total including Ford Credit related to VIE (a)
|
$
|
195
|
|
$
|
207
|
|
$
|
238
|
|
$
|
160
|
|
|||
__________
|
(a)
|
Ford Credit derivative assets and liabilities are included in
Other assets
and
Accrued liabilities
and deferred revenue
, respectively, on our consolidated balance sheet.
|
32
Item 1. Financial Statements (Continued)
FORD MOTOR COMPANY AND SUBSIDIARIES
NOTES TO THE FINANCIAL STATEMENTS
Derivative expense/(income) related to consolidated VIEs that support Ford Credit's securitization programs for the periods ended
March 31
was as follows (in millions):
|
First Quarter
|
|||||||
|
2012
|
2011
|
||||||
|
Derivative expense/(income)
|
|||||||
|
VIE - Securitization entities
|
$
|
95
|
|
$
|
(55
|
)
|
|
|
Ford Credit related to VIE
|
12
|
|
65
|
|
|||
|
Total including Ford Credit related to VIE
|
$
|
107
|
|
$
|
10
|
|
|
VIEs of Which We are Not the Primary Beneficiary
Ford Credit has an investment in Forso Nordic AB, a joint venture determined to be a VIE of which Ford Credit is not the primary beneficiary. The joint venture provides consumer and dealer financing in its local markets and is financed by external debt and additional subordinated debt provided by the joint venture partner. The operating agreement indicates that the power to direct economically significant activities is shared with the joint venture partner, and the obligation to absorb losses or right to receive benefits resides primarily with the joint venture partner. Ford Credit's investment in the joint venture is accounted for as an equity method investment and is included in
Other assets.
Ford Credit's maximum exposure to any potential losses associated with this VIE is limited to Ford Credit's equity investment, and amounted to
$75 million
and
$71 million
at
March 31, 2012
and
December 31, 2011
, respectively.
Accrued liabilities and deferred revenue were as follows (in millions):
|
|
March 31,
2012 |
December 31,
2011 |
|||||
|
Automotive Sector
|
|
|
|||||
|
Current
|
|
|
|||||
|
Dealer and customer allowances and claims
|
$
|
6,993
|
|
$
|
6,971
|
|
|
|
Deferred revenue
|
2,494
|
|
2,216
|
|
|||
|
Employee benefit plans
|
1,590
|
|
1,552
|
|
|||
|
Accrued interest
|
271
|
|
253
|
|
|||
|
Other postretirement employee benefits ("OPEB")
|
440
|
|
439
|
|
|||
|
Pension (a)
|
386
|
|
388
|
|
|||
|
Other
|
2,985
|
|
3,184
|
|
|||
|
Total Automotive accrued liabilities and deferred revenue
|
15,159
|
|
15,003
|
|
|||
|
Non-current
|
|
|
|
|
|||
|
Pension (a)
|
14,243
|
|
15,091
|
|
|||
|
OPEB
|
6,187
|
|
6,152
|
|
|||
|
Dealer and customer allowances and claims
|
2,478
|
|
2,453
|
|
|||
|
Deferred revenue
|
1,832
|
|
1,739
|
|
|||
|
Employee benefit plans
|
612
|
|
709
|
|
|||
|
Other
|
767
|
|
766
|
|
|||
|
Total Automotive other liabilities
|
26,119
|
|
26,910
|
|
|||
|
Total Automotive sector
|
41,278
|
|
41,913
|
|
|||
|
Financial Services Sector
|
3,436
|
|
3,457
|
|
|||
|
Total sectors
|
44,714
|
|
45,370
|
|
|||
|
Intersector elimination (b)
|
—
|
|
(1
|
)
|
|||
|
Total Company
|
$
|
44,714
|
|
$
|
45,369
|
|
|
__________
|
(a)
|
Balances at March 31, 2012 reflect net pension liabilities at December 31, 2011, updated for year-to-date service and interest cost, expected return on assets, separation expense, actual benefit payments, and cash contributions. The discount rate and rate of expected return assumptions are unchanged from year-end 2011.
|
|
(b)
|
Accrued interest related to Ford's acquisition of Ford Credit debt securities.
|
33
Item 1. Financial Statements (Continued)
FORD MOTOR COMPANY AND SUBSIDIARIES
NOTES TO THE FINANCIAL STATEMENTS
We provide pension benefits and OPEB, such as health care and life insurance, to employees in many of our operations around the world.
The expense for our defined benefit pension and OPEB plans for the periods ended
March 31
was as follows (in millions):
|
First Quarter
|
|||||||||||||||||||||||
|
|
Pension Benefits
|
|
|
||||||||||||||||||||
|
|
U.S. Plans
|
Non-U.S. Plans
|
Worldwide OPEB
|
||||||||||||||||||||
|
|
2012
|
2011
|
2012
|
2011
|
2012
|
2011
|
|||||||||||||||||
|
Service cost
|
$
|
130
|
|
$
|
117
|
|
$
|
93
|
|
$
|
80
|
|
$
|
17
|
|
$
|
15
|
|
|||||
|
Interest cost
|
552
|
|
594
|
|
298
|
|
303
|
|
72
|
|
82
|
|
|||||||||||
|
Expected return on assets
|
(718
|
)
|
(757
|
)
|
(334
|
)
|
(348
|
)
|
—
|
|
—
|
|
|||||||||||
|
Amortization of
|
|
|
|
|
|
|
|
|
|
|
|
|
|||||||||||
|
Prior service costs/(credits)
|
55
|
|
86
|
|
18
|
|
18
|
|
(136
|
)
|
(152
|
)
|
|||||||||||
|
(Gains)/Losses
|
106
|
|
48
|
|
103
|
|
76
|
|
32
|
|
29
|
|
|||||||||||
|
Separation programs/other
|
7
|
|
(1
|
)
|
34
|
|
12
|
|
1
|
|
—
|
|
|||||||||||
|
(Gains)/Losses from curtailments and settlements
|
—
|
|
—
|
|
—
|
|
—
|
|
(10
|
)
|
—
|
|
|||||||||||
|
Net expense/(income)
|
$
|
132
|
|
$
|
87
|
|
$
|
212
|
|
$
|
141
|
|
$
|
(24
|
)
|
$
|
(26
|
)
|
|||||
Pension Plan Contributions
In the first quarter of
2012
, we contributed about
$1.1 billion
to our worldwide funded pension plans (including
$500 million
in discretionary contributions to our U.S. plans), and made about
$100 million
of benefit payments directly by the Company for unfunded plans. We expect to contribute from Automotive cash and cash equivalents an additional
$2.3 billion
to our worldwide funded plans in 2012 (including discretionary contributions to our U.S. plans of
$1.5 billion
), and to make an additional
$300 million
of benefit payments directly by the Company for unfunded plans, for a total of about
$3.8 billion
this year.
Based on current assumptions and regulations, we do not expect to have a legal requirement to fund our major U.S. pension plans in 2012.
34
Item 1. Financial Statements (Continued)
FORD MOTOR COMPANY AND SUBSIDIARIES
NOTES TO THE FINANCIAL STATEMENTS
The carrying value of our debt was as follows (in millions):
|
March 31,
2012 |
December 31,
2011 |
||||||
|
Automotive Sector
|
|||||||
|
Debt payable within one year
|
|
|
|||||
|
Short-term with non-affiliates (a)
|
$
|
565
|
|
$
|
559
|
|
|
|
Short-term with unconsolidated affiliates
|
—
|
|
18
|
|
|||
|
Long-term payable within one year
|
|
|
|
|
|||
|
U.S. Department of Energy ("DOE") loans
|
395
|
|
240
|
|
|||
|
Other debt
|
182
|
|
216
|
|
|||
|
Total debt payable within one year
|
1,142
|
|
1,033
|
|
|||
|
Long-term debt payable after one year
|
|
|
|
|
|||
|
Public unsecured debt securities
|
5,419
|
|
5,260
|
|
|||
|
Unamortized discount
|
(75
|
)
|
(77
|
)
|
|||
|
Convertible notes
|
908
|
|
908
|
|
|||
|
Unamortized discount
|
(165
|
)
|
(172
|
)
|
|||
|
DOE loans
|
4,866
|
|
4,556
|
|
|||
|
EIB loan
|
720
|
|
698
|
|
|||
|
Other debt
|
876
|
|
888
|
|
|||
|
Total long-term debt payable after one year
|
12,549
|
|
12,061
|
|
|||
|
Total Automotive sector
|
$
|
13,691
|
|
$
|
13,094
|
|
|
|
Fair value of Automotive sector debt (c)
|
$
|
13,751
|
|
$
|
13,451
|
|
|
|
Financial Services Sector
|
|
|
|
|
|||
|
Short-term debt
|
|
|
|
|
|||
|
Asset-backed commercial paper
|
$
|
6,670
|
|
$
|
6,835
|
|
|
|
Other asset-backed short-term debt
|
1,485
|
|
2,987
|
|
|||
|
Floating rate demand notes
|
4,935
|
|
4,713
|
|
|||
|
Other short-term debt
|
1,940
|
|
2,061
|
|
|||
|
Total short-term debt
|
15,030
|
|
16,596
|
|
|||
|
Long-term debt
|
|
|
|
|
|||
|
Unsecured debt
|
|
|
|
|
|||
|
Notes payable within one year
|
4,670
|
|
6,144
|
|
|||
|
Notes payable after one year
|
26,440
|
|
26,167
|
|
|||
|
Asset-backed debt
|
|
|
|
|
|||
|
Notes payable within one year
|
17,082
|
|
16,538
|
|
|||
|
Notes payable after one year
|
23,136
|
|
20,621
|
|
|||
|
Unamortized discount
|
(123
|
)
|
(152
|
)
|
|||
|
Fair value adjustments (b)
|
564
|
|
681
|
|
|||
|
Total long-term debt
|
71,769
|
|
69,999
|
|
|||
|
Total Financial Services sector
|
$
|
86,799
|
|
$
|
86,595
|
|
|
|
Fair value of Financial Services sector debt (c)
|
$
|
89,747
|
|
$
|
88,823
|
|
|
|
Total Automotive and Financial Services sectors
|
$
|
100,490
|
|
$
|
99,689
|
|
|
|
Intersector elimination (d)
|
—
|
|
(201
|
)
|
|||
|
Total Company
|
$
|
100,490
|
|
$
|
99,488
|
|
|
__________
|
(a)
|
Includes Export-Import Bank of the United States secured loan of
$250 million
at
March 31, 2012
and
December 31, 2011
.
|
|
(b)
|
Adjustments related to designated fair value hedges of unsecured debt.
|
|
(c)
|
The fair value of debt includes
$315 million
and
$326 million
of Automotive sector short-term debt and
$7.1 billion
and
$7 billion
of Financial Services sector short-term debt at
March 31, 2012
and
December 31, 2011
, respectively, carried at cost which approximates fair value.
All debt is categorized within Level 2 of the fair value hierarchy. See Note 3 for additional information.
|
|
(d)
|
Debt related to Ford's acquisition of Ford Credit debt securities.
|
35
Item 1. Financial Statements (Continued)
FORD MOTOR COMPANY AND SUBSIDIARIES
NOTES TO THE FINANCIAL STATEMENTS
NOTE 12. DERIVATIVE FINANCIAL INSTRUMENTS AND HEDGING ACTIVITIES
In the normal course of business, our operations are exposed to global market risks, including the effect of changes in foreign currency exchange rates, certain commodity prices, and interest rates. To manage these risks, we enter into various derivatives contracts:
|
•
|
Foreign currency exchange contracts that are used to manage foreign exchange exposure;
|
|
•
|
Commodity contracts, including forwards and options, that are used to manage commodity price risk;
|
|
•
|
Interest rate contracts including swaps, caps, and floors that are used to manage the effects of interest rate fluctuations; and
|
|
•
|
Cross-currency interest rate swap contracts that are used to manage foreign currency and interest rate exposures on foreign-denominated debt.
|
Our derivatives are over-the-counter customized derivative transactions and are not exchange-traded. We review our hedging program, derivative positions, and overall risk management strategy on a regular basis.
Derivative Financial Instruments and Hedge Accounting.
All derivatives are recognized on the balance sheet at fair value. We do not net our derivative position by counterparty for purposes of balance sheet presentation and disclosure. We do, however, consider our net position for determining fair value.
We have elected to apply hedge accounting to certain derivatives. Derivatives that are designated in hedging relationships are evaluated for effectiveness using regression analysis at the time they are designated and throughout the hedge period. Cash flows and the profit impact associated with designated hedges are reported in the same category as the underlying hedged item.
Some derivatives do not qualify for hedge accounting; for others, we elect not to apply hedge accounting. Regardless, we only enter into transactions that we believe will be highly effective at offsetting the underlying economic risk. We report changes in the fair value of derivatives not designated as hedging instruments through
Automotive cost of sales
,
Automotive interest income and other non-operating income/(expense), net
,
or
Financial Services other income/(loss), net
depending on the sector and underlying exposure. Cash flows associated with non-designated or de-designated derivatives are reported in
Net cash provided by/(used in) investing activities
in our statements of cash flows.
Cash Flow Hedges.
Our Automotive sector has designated certain forward contracts as cash flow hedges of forecasted transactions with exposure to foreign currency exchange risk.
The effective portion of changes in the fair value of cash flow hedges is deferred in
Accumulated other comprehensive income/(loss)
and is recognized in
Automotive cost of sales
when the hedged item affects earnings. The ineffective portion is reported in
Automotive cost of sales
. Our policy is to de-designate cash flow hedges prior to the time forecasted transactions are recognized as assets or liabilities on the balance sheet and report subsequent changes in fair value through
Automotive cost of sales
. If it becomes probable that the originally-forecasted transaction will not occur, the related amount also is reclassified from
Accumulated other comprehensive income/(loss)
and recognized in earnings. The majority of our cash flow hedges mature in
two
years or less.
Fair Value Hedges.
Our Financial Services sector uses derivatives to reduce the risk of changes in the fair value of liabilities. We have designated certain receive-fixed, pay-float interest rate swaps as fair value hedges of fixed-rate debt. The risk being hedged is the risk of changes in the fair value of the hedged debt attributable to changes in the benchmark interest rate. If the hedge relationship is deemed to be highly effective, we record the changes in the fair value of the hedged debt related to the risk being hedged in
Financial Services debt
with the offset in
Financial Services other income/(loss), net
.
The change in fair value of the related derivative (excluding accrued interest) also is recorded in
Financial Services other income/(loss), net.
Hedge ineffectiveness, recorded directly in earnings, is the difference between the change in fair value of the derivative and the change in the value of the hedged debt that is attributable to the changes in the benchmark interest rate.
36
Item 1. Financial Statements (Continued)
FORD MOTOR COMPANY AND SUBSIDIARIES
NOTES TO THE FINANCIAL STATEMENTS
NOTE 12. DERIVATIVE FINANCIAL INSTRUMENTS AND HEDGING ACTIVITIES
(Continued)
For our Financial Services sector, net interest settlements and accruals on fair value hedges are excluded from the assessment of hedge effectiveness. We report net interest settlements and accruals on fair value hedges in
Interest expense
, with the exception of foreign currency revaluation on accrued interest, which is reported in
Selling, administrative, and other expenses
. Ineffectiveness on fair value hedges and gains and losses on interest rate contracts not designated as hedging instruments are reported in
Financial Services other income/(loss), net
.
Gains and losses on foreign exchange and cross-currency interest rate swap contracts not designated as hedging instruments are reported in
Selling, administrative, and other expenses.
When a fair value hedge is de-designated, or when the derivative is terminated before maturity, the fair value adjustment to the hedged debt continues to be reported as part of the carrying value of the debt and is amortized over its remaining life.
Net Investment Hedges.
We have used foreign currency exchange derivatives to hedge the net assets of certain foreign entities to offset the translation and economic exposures related to our investment in these entities. The effective portion of changes in the value of designated instruments is included in
Accumulated other comprehensive income/(loss)
as a foreign currency translation adjustment until the hedged investment is sold or liquidated. When the investment is sold or liquidated, the hedge gains and losses previously reported in
Accumulated other comprehensive income/(loss)
are recognized in
Automotive interest income and other non-operating income/(expense), net
as part of the gain or loss on sale.
Presently, we have had no derivative instruments in an active net investment hedging relationship. We have elected the spot-to-spot method.
Normal Purchases and Normal Sales Classification.
We have elected to apply the normal purchases and normal sales classification for physical supply contracts that are entered into for the purpose of procuring commodities to be used in production over a reasonable period in the normal course of our business.
37
Item 1. Financial Statements (Continued)
FORD MOTOR COMPANY AND SUBSIDIARIES
NOTES TO THE FINANCIAL STATEMENTS
NOTE 12. DERIVATIVE FINANCIAL INSTRUMENTS AND HEDGING ACTIVITIES
(Continued)
Income Effect of Derivative Financial Instruments
The following table summarizes by hedge designation the pre-tax gains/(losses) recorded in Other comprehensive income/(loss) ("OCI"), reclassified from
Accumulated other comprehensive income/(loss)
("AOCI") to income and/or recognized directly in income for the periods ended
March 31
(in millions):
|
|
First Quarter 2012
|
First Quarter 2011
|
|||||||||||||||||||||
|
|
Gain/(Loss) Recorded
in OCI
|
Gain/(Loss)
Reclassified
from AOCI
to Income
|
Gain/(Loss) Recognized
in Income
|
Gain/(Loss) Recorded
in OCI
|
Gain/(Loss)
Reclassified
from AOCI
to Income
|
Gain/(Loss) Recognized
in Income
|
|||||||||||||||||
|
Automotive Sector
|
|
|
|
|
|
|
|||||||||||||||||
|
Cash flow hedges
|
|
|
|
|
|
|
|||||||||||||||||
|
Foreign currency exchange contracts
|
$
|
(147
|
)
|
$
|
(52
|
)
|
$
|
1
|
|
$
|
125
|
|
$
|
(6
|
)
|
$
|
—
|
|
|||||
|
Derivatives not designated as hedging instruments
|
|
|
|
|
|
|
|
|
|
|
|
|
|||||||||||
|
Foreign currency exchange contracts - operating exposures
|
|
|
|
|
$
|
(27
|
)
|
|
|
|
|
$
|
9
|
|
|||||||||
|
Commodity contracts
|
|
|
|
|
71
|
|
|
|
|
|
15
|
|
|||||||||||
|
Other – warrants
|
|
|
|
|
(4
|
)
|
|
|
|
|
—
|
|
|||||||||||
|
Total
|
|
|
|
|
$
|
40
|
|
|
|
|
|
$
|
24
|
|
|||||||||
|
Financial Services Sector
|
|
|
|
|
|
|
|
|
|
|
|
|
|||||||||||
|
Fair value hedges
|
|
|
|
|
|
|
|
|
|
|
|
|
|||||||||||
|
Interest rate contracts
|
|
|
|
|
|
|
|
|
|
|
|
|
|||||||||||
|
Net interest settlements and accruals excluded from the assessment of hedge effectiveness
|
|
|
|
|
$
|
41
|
|
|
|
|
|
$
|
66
|
|
|||||||||
|
Ineffectiveness (a)
|
|
|
|
|
1
|
|
|
|
|
|
(18
|
)
|
|||||||||||
|
Total
|
|
|
|
|
$
|
42
|
|
|
|
|
|
$
|
48
|
|
|||||||||
|
Derivatives not designated as hedging instruments
|
|
|
|
|
|
|
|
|
|
|
|
|
|||||||||||
|
Interest rate contracts
|
|
|
|
|
$
|
(4
|
)
|
|
|
|
|
$
|
(8
|
)
|
|||||||||
|
Foreign currency exchange contracts
|
|
|
|
|
(48
|
)
|
|
|
|
|
12
|
|
|||||||||||
|
Cross-currency interest rate swap contracts
|
|
|
|
|
(48
|
)
|
|
|
|
|
(14
|
)
|
|||||||||||
|
Other (b)
|
|
|
|
|
(38
|
)
|
|
|
|
|
—
|
|
|||||||||||
|
Total
|
|
|
|
|
$
|
(138
|
)
|
|
|
|
|
$
|
(10
|
)
|
|||||||||
__________
|
(a)
|
For first quarter 2012 and 2011, hedge ineffectiveness reflects change in fair value on derivatives of
$80 million
loss and
$88 million
loss, respectively, and change in fair value on hedged debt of
$81 million
gain and
$70 million
gain, respectively.
|
|
(b)
|
Reflects gains/(losses) for derivative features included in the FUEL Notes (see Note 3).
|
38
Item 1. Financial Statements (Continued)
FORD MOTOR COMPANY AND SUBSIDIARIES
NOTES TO THE FINANCIAL STATEMENTS
NOTE 12. DERIVATIVE FINANCIAL INSTRUMENTS AND HEDGING ACTIVITIES
(Continued)
Balance Sheet Effect of Derivative Financial Instruments
The following table summarizes the notional amount and estimated fair value of our derivative financial instruments (in millions):
|
|
March 31, 2012
|
||||||||||
|
Notionals
|
Fair Value of
Assets
|
Fair Value of
Liabilities
|
|||||||||
|
Automotive Sector
|
|
|
|
||||||||
|
Cash flow hedges
|
|
|
|
||||||||
|
Foreign currency exchange contracts
|
$
|
15,035
|
|
$
|
50
|
|
$
|
362
|
|
||
|
Derivatives not designated as hedging instruments
|
|||||||||||
|
Foreign currency exchange contracts
|
7,950
|
|
65
|
|
75
|
|
|||||
|
Commodity contracts
|
2,386
|
|
14
|
|
226
|
|
|||||
|
Other – warrants
|
12
|
|
—
|
|
—
|
|
|||||
|
Total derivatives not designated as hedging instruments
|
10,348
|
|
79
|
|
301
|
|
|||||
|
Total Automotive sector derivative financial instruments
|
$
|
25,383
|
|
$
|
129
|
|
$
|
663
|
|
||
|
Financial Services Sector
|
|
|
|
|
|
|
|||||
|
Fair value hedges
|
|
|
|
|
|
|
|||||
|
Interest rate contracts
|
$
|
10,516
|
|
$
|
457
|
|
$
|
34
|
|
||
|
Derivatives not designated as hedging instruments
|
|||||||||||
|
Interest rate contracts
|
66,095
|
|
712
|
|
267
|
|
|||||
|
Foreign currency exchange contracts
|
3,423
|
|
2
|
|
43
|
|
|||||
|
Cross-currency interest rate swap contracts
|
1,379
|
|
—
|
|
46
|
|
|||||
|
Other (a)
|
2,500
|
|
99
|
|
—
|
|
|||||
|
Total derivatives not designated as hedging instruments
|
73,397
|
|
813
|
|
356
|
|
|||||
|
Total Financial Services sector derivative financial instruments
|
$
|
83,913
|
|
$
|
1,270
|
|
$
|
390
|
|
||
__________
|
(a)
|
Represents derivative features included in the FUEL Notes (see Note 3).
|
39
Item 1. Financial Statements (Continued)
FORD MOTOR COMPANY AND SUBSIDIARIES
NOTES TO THE FINANCIAL STATEMENTS
NOTE 12. DERIVATIVE FINANCIAL INSTRUMENTS AND HEDGING ACTIVITIES
(Continued)
|
|
December 31, 2011
|
||||||||||
|
Notionals
|
Fair Value of
Assets
|
Fair Value of
Liabilities
|
|||||||||
|
Automotive Sector
|
|
|
|
||||||||
|
Cash flow hedges
|
|
|
|
||||||||
|
Foreign currency exchange contracts
|
$
|
14,535
|
|
$
|
120
|
|
$
|
368
|
|
||
|
Derivatives not designated as hedging instruments
|
|||||||||||
|
Foreign currency exchange contracts
|
5,692
|
|
92
|
|
80
|
|
|||||
|
Commodity contracts
|
2,396
|
|
2
|
|
372
|
|
|||||
|
Other – warrants
|
12
|
|
4
|
|
—
|
|
|||||
|
Total derivatives not designated as hedging instruments
|
8,100
|
|
98
|
|
452
|
|
|||||
|
Total Automotive sector derivative financial instruments
|
$
|
22,635
|
|
$
|
218
|
|
$
|
820
|
|
||
|
Financial Services Sector
|
|
|
|
|
|
|
|||||
|
Fair value hedges
|
|
|
|
|
|
|
|||||
|
Interest rate contracts
|
$
|
7,786
|
|
$
|
526
|
|
$
|
—
|
|
||
|
Derivatives not designated as hedging instruments
|
|||||||||||
|
Interest rate contracts
|
70,639
|
|
670
|
|
237
|
|
|||||
|
Foreign currency exchange contracts
|
3,582
|
|
30
|
|
50
|
|
|||||
|
Cross-currency interest rate swap contracts
|
987
|
|
12
|
|
12
|
|
|||||
|
Other (a)
|
2,500
|
|
137
|
|
—
|
|
|||||
|
Total derivatives not designated as hedging instruments
|
77,708
|
|
849
|
|
299
|
|
|||||
|
Total Financial Services sector derivative financial instruments
|
$
|
85,494
|
|
$
|
1,375
|
|
$
|
299
|
|
||
__________
|
(a)
|
Represents derivative features included in the FUEL Notes (see Note 3).
|
On our consolidated balance sheet, derivative assets are reported in
Other assets
for
Automotive and Financial Services sectors, and derivative liabilities are reported in
Payables
for our Automotive sector and in
Accrued liabilities and deferred revenue
for our Financial Services sector.
The notional amounts of the derivative financial instruments do not represent amounts exchanged by the parties and, therefore, are not a direct measure of our exposure to the financial risks described above. Notional amounts are presented on a gross basis with no netting of offsetting exposure positions. The amounts exchanged are calculated by reference to the notional amounts and by other terms of the derivatives, such as interest rates, foreign currency exchange rates or commodity volumes and prices.
Counterparty Risk and Collateral
Use of derivatives exposes us to the risk that a counterparty may default on a derivative contract. We establish exposure limits for each counterparty to minimize this risk and provide counterparty diversification. Substantially all of our derivative exposures are with counterparties that have an investment grade rating. The aggregate fair value of derivative instruments in asset positions on
March 31, 2012
was
$1.4 billion
, representing the maximum loss that we would recognize at that date if all counterparties failed to perform as contracted. We enter into master agreements with counterparties that generally allow for netting of certain exposures; therefore, the actual loss we would recognize if all counterparties failed to perform as contracted would be significantly lower.
40
Item 1. Financial Statements (Continued)
FORD MOTOR COMPANY AND SUBSIDIARIES
NOTES TO THE FINANCIAL STATEMENTS
We include an adjustment for non-performance risk in the fair value of derivative instruments. Our adjustment for non-performance risk is relative to a measure based on an unadjusted inter-bank deposit rate (e.g., LIBOR). For our Automotive sector, at
March 31, 2012
and
December 31, 2011
, our adjustment reduced derivative assets by
$1 million
and
$3 million
, respectively, and reduced derivative liabilities by
$4 million
and
$10 million
, respectively. For our Financial Services sector, at
March 31, 2012
and
December 31, 2011
, our adjustment reduced derivative assets by
$25 million
and
$54 million
, respectively, and reduced derivative liabilities by
$11 million
and
$7 million
, respectively. See Note 3 for more detail on valuation methodologies.
We post cash collateral with certain counterparties based on our net position with regard to foreign currency and commodity derivative contracts. We posted
$21 million
and
$70 million
as of
March 31, 2012
and
December 31, 2011
, respectively, which is reported in
Other assets
on our consolidated balance sheet.
The following table summarizes the changes in the accumulated balances for each component of AOCI attributable to Ford Motor Company for the periods ended March 31 (in millions):
|
First Quarter
|
|||||||
|
2012
|
2011
|
||||||
|
Foreign currency translation
|
|||||||
|
Beginning balance
|
$
|
(1,383
|
)
|
$
|
(665
|
)
|
|
|
Net gain/(loss) on foreign currency translation (net of tax of $0 and $0)
|
523
|
|
607
|
|
|||
|
Reclassifications to net income (net of tax of $0 and $0)
|
—
|
|
(17
|
)
|
|||
|
Other comprehensive income/(loss), net of tax (a)
|
523
|
|
590
|
|
|||
|
Ending balance
|
$
|
(860
|
)
|
$
|
(75
|
)
|
|
|
Derivative instruments
|
|||||||
|
Beginning balance
|
$
|
(181
|
)
|
$
|
(29
|
)
|
|
|
Net gain/(loss) on derivative instruments (net of tax benefit of $48 and tax of $14)
|
(99
|
)
|
111
|
|
|||
|
Reclassifications to net income (net of tax of $16 and $0)
|
36
|
|
6
|
|
|||
|
Other comprehensive income/(loss), net of tax
|
(63
|
)
|
117
|
|
|||
|
Ending balance
|
$
|
(244
|
)
|
$
|
88
|
|
|
|
Pension and other postretirement benefits
|
|||||||
|
Beginning balance
|
$
|
(17,170
|
)
|
$
|
(13,617
|
)
|
|
|
Prior service cost arising during the period (net of tax of $0 and $0)
|
—
|
|
(45
|
)
|
|||
|
Net gain/(loss) arising during the period (net of tax of $0 and $0)
|
—
|
|
—
|
|
|||
|
Amortization of prior service cost included in net income (net of tax benefit of $28 and tax of $11)
|
(45
|
)
|
(59
|
)
|
|||
|
Amortization of (gain)/loss included in net income (net of tax of $79 and $12)
|
162
|
|
141
|
|
|||
|
Translation impact on non-U.S. plans (net of tax of $0 and $0)
|
(157
|
)
|
(115
|
)
|
|||
|
Other comprehensive income/(loss), net of tax
|
(40
|
)
|
(78
|
)
|
|||
|
Ending balance
|
$
|
(17,210
|
)
|
$
|
(13,695
|
)
|
|
|
Net holding gain/(loss)
|
|||||||
|
Beginning balance
|
$
|
—
|
|
$
|
(2
|
)
|
|
|
Reclassifications to net income (net of tax of $0 and $0)
|
—
|
|
—
|
|
|||
|
Ending balance
|
$
|
—
|
|
$
|
(2
|
)
|
|
|
Total AOCI ending balance at March 31
|
$
|
(18,314
|
)
|
$
|
(13,684
|
)
|
|
__________
|
(a)
|
For 2011, there were
$2 million
of losses attributable to noncontrolling interests.
|
41
Item 1. Financial Statements (Continued)
FORD MOTOR COMPANY AND SUBSIDIARIES
NOTES TO THE FINANCIAL STATEMENTS
Automotive Sector
The following table summarizes amounts included in
Automotive interest income and other non-operating income/(expense), net
for the periods ended
March 31
(in millions):
|
First Quarter
|
|||||||
|
|
2012
|
2011
|
|||||
|
Interest income
|
$
|
87
|
|
$
|
85
|
|
|
|
Realized and unrealized gains/(losses) on cash equivalents and marketable securities
|
26
|
|
(44
|
)
|
|||
|
Gains/(Losses) on the sale of held-for-sale operations, equity and cost investments, and other dispositions
|
(3
|
)
|
25
|
|
|||
|
Gains/(Losses) on extinguishment of debt
|
—
|
|
(60
|
)
|
|||
|
Other
|
42
|
|
34
|
|
|||
|
Total
|
$
|
152
|
|
$
|
40
|
|
|
Financial Services Sector
The following table summarizes the amounts included in
Financial Services other income/(loss), net
for the periods ended
March 31
(in millions):
|
First Quarter
|
|||||||
|
|
2012
|
2011
|
|||||
|
Interest income (investment-related)
|
$
|
16
|
|
$
|
24
|
|
|
|
Realized and unrealized gains/(losses) on cash equivalents and marketable securities
|
13
|
|
4
|
|
|||
|
Gains/(Losses) on the sale of held-for-sale operations, equity and cost investments, and other dispositions
|
1
|
|
—
|
|
|||
|
Gains/(Losses) on extinguishment of debt
|
(3
|
)
|
(8
|
)
|
|||
|
Investment and other income related to sales of receivables
|
1
|
|
—
|
|
|||
|
Insurance premiums earned, net
|
26
|
|
23
|
|
|||
|
Other
|
30
|
|
42
|
|
|||
|
Total
|
$
|
84
|
|
$
|
85
|
|
|
For interim tax reporting we estimate one single effective tax rate for tax jurisdictions not subject to a valuation allowance, which is applied to the year-to-date ordinary income/(loss). Tax effects of significant unusual or extraordinary items are excluded from the estimated annual effective tax rate calculation and recognized in the interim period in which they occur.
NOTE 16. AMOUNTS PER SHARE ATTRIBUTABLE TO FORD MOTOR COMPANY COMMON AND CLASS B STOCK
We present both basic and diluted earnings per share ("EPS") amounts in our financial reporting. EPS is computed independently each quarter for income from continuing operations, income/(loss) from discontinued operations, and net income; as a result, the sum of per-share amounts from continuing operations and discontinued operations may not equal the total per-share amount for net earnings. Basic EPS excludes dilution and is computed by dividing income available to Common and Class B Stock holders by the weighted-average number of Common and Class B Stock outstanding for the period. Diluted EPS, on the other hand, reflects the maximum potential dilution that could occur if all of our equity-linked securities and other share-based compensation, including stock options, warrants, and rights under our convertible notes, were exercised. Potential dilutive shares are excluded from the calculation if they have an anti-dilutive effect in the period.
42
Item 1. Financial Statements (Continued)
FORD MOTOR COMPANY AND SUBSIDIARIES
NOTES TO THE FINANCIAL STATEMENTS
Warrants
All warrants outstanding expire January 1, 2013. The net dilutive effect for warrants, included below, is approximately
93 million
dilutive shares for first quarter 2012, representing the net share settlement methodology for the
362 million
warrants outstanding as of
March 31, 2012
.
Dividend Declaration
On March 14, 2012, our Board of Directors declared a dividend on our Common and Class B Stock of
$0.05
per share payable on June 1, 2012, to stockholders of record on May 2, 2012. Accordingly, we recorded a reduction to retained earnings of
$191 million
in the first quarter of 2012.
Dividends will affect our diluted earnings per share calculation because they likely will cause an adjustment to the conversion and exercise prices of our outstanding convertible debt securities and the warrants described above. Pursuant to the terms of these securities, the conversion and exercise prices will be adjusted (i) when dividends on our Common and Class B stock are paid in a sufficient amount so as to trigger a
1%
or greater change in the conversion and/or exercise prices or (ii) on the anniversary date of issuance of those securities -- November 9, 2012 for the 2016 Convertible Notes, December 15, 2012 for the 2036 Convertible Notes, and December 11, 2012 for the warrants, whichever occurs first. At that time we will adjust the exercise price in the calculation of the additional dilutive shares for our convertible debt and for warrants.
Amounts Per Share Attributable to Ford Motor Company Common and Class B Stock
Basic and diluted income/(loss) per share were calculated using the following (in millions):
|
First Quarter
|
|||||||
|
|
2012
|
2011
|
|||||
|
Basic and Diluted Income/(Loss) Attributable to Ford Motor Company
|
|
|
|||||
|
Basic income/(loss) from continuing operations
|
$
|
1,396
|
|
$
|
2,551
|
|
|
|
Effect of dilutive 2016 Convertible Notes (a)
|
11
|
|
14
|
|
|||
|
Effect of dilutive 2036 Convertible Notes (a)
|
—
|
|
—
|
|
|||
|
Effect of dilutive Trust Preferred Securities (a) (b)
|
—
|
|
36
|
|
|||
|
Diluted income/(loss) from continuing operations
|
$
|
1,407
|
|
$
|
2,601
|
|
|
|
Basic and Diluted Shares
|
|
|
|
|
|||
|
Basic shares (average shares outstanding)
|
3,803
|
|
3,771
|
|
|||
|
Net dilutive options and warrants
|
154
|
|
264
|
|
|||
|
Dilutive 2016 Convertible Notes
|
95
|
|
95
|
|
|||
|
Dilutive 2036 Convertible Notes
|
3
|
|
3
|
|
|||
|
Dilutive Trust Preferred Securities (b)
|
—
|
|
133
|
|
|||
|
Diluted shares
|
4,055
|
|
4,266
|
|
|||
__________
|
(a)
|
As applicable, includes interest expense, amortization of discount, amortization of fees, and other changes in income or loss that would result from the assumed conversion.
|
|
(b)
|
The Trust Preferred Securities, which were convertible into Ford Common Stock, were fully redeemed on March 15, 2011.
|
43
Item 1. Financial Statements (Continued)
FORD MOTOR COMPANY AND SUBSIDIARIES
NOTES TO THE FINANCIAL STATEMENTS
Key operating data for our business segments for the periods ended
March 31
were as follows (in millions):
|
(In millions)
|
Automotive Sector
|
|||||||||||||||||||||||||||
|
|
Operating Segments
|
Reconciling Items
|
|
|
||||||||||||||||||||||||
|
|
Ford North
America
|
Ford South
America
|
Ford
Europe
|
Ford Asia
Pacific
Africa
|
Other
Automotive
|
Special
Items
|
Total
|
|||||||||||||||||||||
|
First Quarter 2012
|
|
|
|
|
|
|
|
|
|
|
|
|
|
|
||||||||||||||
|
Revenues
|
|
|
|
|
|
|
|
|
|
|
|
|
|
|
||||||||||||||
|
External customer
|
$
|
18,599
|
|
$
|
2,382
|
|
$
|
7,269
|
|
$
|
2,275
|
|
$
|
—
|
|
$
|
—
|
|
$
|
30,525
|
|
|||||||
|
Intersegment
|
192
|
|
—
|
|
172
|
|
—
|
|
—
|
|
—
|
|
364
|
|
||||||||||||||
|
Income
|
|
|
||||||||||||||||||||||||||
|
Income/(Loss) before income taxes
|
2,133
|
|
54
|
|
(149
|
)
|
(95
|
)
|
(106
|
)
|
(255
|
)
|
1,582
|
|
||||||||||||||
|
Total assets at March 31
|
47,970
|
|
6,518
|
|
20,546
|
|
6,614
|
|
—
|
|
—
|
|
81,648
|
|
(a)
|
|||||||||||||
|
First Quarter 2011
|
|
|
|
|
|
|
|
|
|
|
|
|
|
|
||||||||||||||
|
Revenues
|
|
|
|
|
|
|
|
|
|
|
|
|
|
|
||||||||||||||
|
External customer
|
$
|
17,957
|
|
$
|
2,319
|
|
$
|
8,705
|
|
$
|
2,057
|
|
$
|
—
|
|
$
|
—
|
|
$
|
31,038
|
|
|||||||
|
Intersegment
|
101
|
|
—
|
|
238
|
|
—
|
|
—
|
|
—
|
|
339
|
|
||||||||||||||
|
Income
|
|
|
||||||||||||||||||||||||||
|
Income/(Loss) before income taxes
|
1,844
|
|
210
|
|
293
|
|
33
|
|
(249
|
)
|
(61
|
)
|
2,070
|
|
||||||||||||||
|
Total assets at March 31
|
29,271
|
|
7,268
|
|
25,186
|
|
5,826
|
|
—
|
|
—
|
|
67,551
|
|
(a)
|
|||||||||||||
|
|
Financial Services Sector
|
Total Company
|
||||||||||||||||||||||||||
|
|
Operating Segments
|
Reconciling Items
|
|
|
|
|||||||||||||||||||||||
|
|
Ford
Credit
|
Other
Financial
Services
|
Special
Items
|
Elims
|
Total
|
Elims (b)
|
Total
|
|||||||||||||||||||||
|
First Quarter 2012
|
|
|
|
|
|
|
|
|||||||||||||||||||||
|
Revenues
|
|
|
|
|
|
|
|
|||||||||||||||||||||
|
External customer
|
$
|
1,849
|
|
$
|
71
|
|
$
|
—
|
|
$
|
—
|
|
$
|
1,920
|
|
$
|
—
|
|
$
|
32,445
|
|
|||||||
|
Intersegment
|
127
|
|
1
|
|
—
|
|
—
|
|
128
|
|
(492
|
)
|
—
|
|
||||||||||||||
|
Income
|
|
|
||||||||||||||||||||||||||
|
Income/(Loss) before income taxes
|
452
|
|
4
|
|
—
|
|
—
|
|
456
|
|
—
|
|
2,038
|
|
||||||||||||||
|
Total assets at March 31
|
101,682
|
|
8,353
|
|
—
|
|
(7,171
|
)
|
102,864
|
|
(a)
|
(2,437
|
)
|
182,075
|
|
|||||||||||||
|
First Quarter 2011
|
|
|
|
|
|
|
|
|
|
|
|
|
|
|
||||||||||||||
|
Revenues
|
|
|
|
|
|
|
|
|
|
|
|
|
|
|
||||||||||||||
|
External customer
|
$
|
1,995
|
|
$
|
81
|
|
$
|
—
|
|
$
|
—
|
|
$
|
2,076
|
|
$
|
—
|
|
$
|
33,114
|
|
|||||||
|
Intersegment
|
132
|
|
1
|
|
—
|
|
—
|
|
133
|
|
(472
|
)
|
—
|
|
||||||||||||||
|
Income
|
|
|
||||||||||||||||||||||||||
|
Income/(Loss) before income taxes
|
713
|
|
(7
|
)
|
—
|
|
—
|
|
706
|
|
—
|
|
2,776
|
|
||||||||||||||
|
Total assets at March 31
|
101,775
|
|
8,874
|
|
—
|
|
(7,479
|
)
|
103,170
|
|
(a)
|
(3,330
|
)
|
167,391
|
|
|||||||||||||
__________
|
(a)
|
As reported on our sector balance sheet.
|
|
(b)
|
Includes intersector transactions occurring in the ordinary course of business and deferred tax netting.
|
44
Item 1. Financial Statements (Continued)
FORD MOTOR COMPANY AND SUBSIDIARIES
NOTES TO THE FINANCIAL STATEMENTS
NOTE 18. COMMITMENTS AND CONTINGENCIES
Guarantees
At
March 31, 2012
and
December 31, 2011
, the following guarantees and indemnifications were issued and outstanding:
Guarantees related to affiliates and third parties.
We guarantee debt and lease obligations of certain joint ventures, as well as certain financial obligations of outside third parties, including suppliers, to support our business and economic growth. Expiration dates vary through 2017, and guarantees will terminate on payment and/or cancellation of the obligation. A payment by us would be triggered by failure of the joint venture or other third party to fulfill its obligation covered by the guarantee. In some circumstances, we are entitled to recover from the third party amounts paid by us under the guarantee. However, our ability to enforce these rights is sometimes stayed until the guaranteed party is paid in full, and may be limited in the event of insolvency of the third party or other circumstances. The maximum potential payments under guarantees and the carrying value of recorded liabilities related to guarantees were as follows(in millions):
|
|
March 31,
2012 |
December 31,
2011 |
|||||
|
Maximum potential payments
|
$
|
425
|
|
$
|
444
|
|
|
|
Carrying value of recorded liabilities related to guarantees
|
29
|
|
31
|
|
|||
We regularly review our performance risk under these guarantees, which has resulted in no changes to our initial valuations.
Indemnifications.
In the ordinary course of business, we execute contracts involving indemnifications standard in the industry and indemnifications specific to a transaction, such as the sale of a business. These indemnifications might include and are not limited to claims relating to any of the following: environmental, tax, and shareholder matters; intellectual property rights; power generation contracts; governmental regulations and employment-related matters; dealers, supplier, and other commercial contractual relationships; and financial matters, such as securitizations. Performance under these indemnities generally would be triggered by a breach of terms of the contract or by a third-party claim. We also are party to numerous indemnifications which do not limit potential payment; therefore, we are unable to estimate a maximum amount of potential future payments that could result from claims made under these indemnities.
Litigation and Claims
Various legal actions, proceedings, and claims (generally, "matters") are pending or may be instituted or asserted against us. These include but are not limited to matters arising out of alleged defects in our products; product warranties; governmental regulations relating to safety, emissions and fuel economy or other matters; government incentives; tax matters; alleged illegal acts resulting in fines or penalties; financial services; employment-related matters; dealer, supplier, and other contractual relationships; intellectual property rights; environmental matters; shareholder or investor matters; and financial reporting matters. Certain of the pending legal actions are, or purport to be, class actions. Some of the matters involve or may involve compensatory, punitive, or antitrust or other treble damage claims in very large amounts, or demands for recall campaigns, environmental remediation programs, sanctions, loss of government incentives, assessments, or other relief, which, if granted, would require very large expenditures.
The extent of our financial exposure to these matters is difficult to estimate. Many matters do not specify a dollar amount for damages, and many others specify only a jurisdictional minimum. To the extent an amount is asserted, our historical experience suggests that in most instances the amount asserted is not a reliable indicator of the ultimate outcome.
45
FORD MOTOR COMPANY AND SUBSIDIARIES
NOTES TO THE FINANCIAL STATEMENTS
In evaluating for accrual and disclosure purposes matters filed against us, we take into consideration factors such as our historical experience with matters of a similar nature, the specific facts and circumstances asserted, the likelihood of our prevailing, and the severity of any potential loss. We reevaluate and update our accruals as matters progress over time.
For the majority of matters, which generally arise out of alleged defects in our products, we establish an accrual based on our extensive historical experience with similar matters, and we do not believe that there is a reasonably possible outcome materially in excess of our accrual.
For the remaining matters, where our historical experience with similar matters is of more limited value (i.e., "non-pattern matters"), we evaluate matters primarily based on the individual facts and circumstances. For non-pattern matters, we evaluate whether there is a reasonable possibility of material loss in excess of any accrual. Our estimate of reasonably possible loss in excess of our accruals for all material matters currently reflects non-U.S. indirect tax matters, for which we estimate this aggregate risk to be a range of up to about
$1.5 billion
.
As noted, the litigation process is subject to many uncertainties, and the outcome of individual litigated matters is not predictable with assurance. Our assessments are based on our knowledge and experience, but the ultimate outcome of any matter could require payment substantially in excess of the amount that we have accrued and/or disclosed.
Warranty
Included in warranty cost accruals are the costs for basic warranty coverages and field service actions (i.e., product recalls and owner notification programs) on products sold. These costs are estimates based primarily on historical warranty claim experience. Warranty accruals accounted for in
Accrued liabilities and deferred revenue
for the periods ended
March 31
were as follows (in millions):
|
First Quarter
|
|||||||
|
|
2012
|
2011
|
|||||
|
Beginning balance
|
$
|
3,915
|
|
$
|
3,855
|
|
|
|
Payments made during the period
|
(560
|
)
|
(783
|
)
|
|||
|
Changes in accrual related to warranties issued during the period
|
526
|
|
500
|
|
|||
|
Changes in accrual related to pre-existing warranties
|
26
|
|
132
|
|
|||
|
Foreign currency translation and other
|
41
|
|
71
|
|
|||
|
Ending balance
|
$
|
3,948
|
|
$
|
3,775
|
|
|
Excluded from the table above are costs accrued for customer satisfaction actions.
46
Report of Independent Registered Public Accounting Firm
To the Board of Directors and Stockholders of
Ford Motor Company:
We have reviewed the accompanying consolidated balance sheet of Ford Motor Company and its subsidiaries as of
March 31, 2012
, and the related consolidated statements of operations, comprehensive income, and equity for the three-month periods ended
March 31, 2012
and
2011
and the condensed consolidated statement of cash flows for the three-month periods ended
March 31, 2012
and
2011
. These interim financial statements are the responsibility of the Company's management.
The accompanying sector balance sheets and the related sector statements of operations and of cash flows are presented for purposes of additional analysis and are not a required part of the basic financial statements. Such information has been subjected to the review procedures applied in the review of the basic financial statements.
We conducted our review in accordance with the standards of the Public Company Accounting Oversight Board (United States). A review of interim financial information consists principally of applying analytical procedures and making inquiries of persons responsible for financial and accounting matters. It is substantially less in scope than an audit conducted in accordance with the standards of the Public Company Accounting Oversight Board (United States), the objective of which is the expression of an opinion regarding the financial statements taken as a whole. Accordingly, we do not express such an opinion.
Based on our review, we are not aware of any material modifications that should be made to the accompanying consolidated interim financial statements for them to be in conformity with accounting principles generally accepted in the United States of America.
We previously audited, in accordance with the standards of the Public Company Accounting Oversight Board (United States), the consolidated balance sheet as of
December 31, 2011
, and the related consolidated statements of operations, equity, and cash flows for the year then ended (not presented herein), and in our report dated February 21, 2012, we expressed an unqualified opinion on those consolidated financial statements. In our opinion, the information set forth in the accompanying consolidated balance sheet information as of
December 31, 2011
, is fairly stated in all material respects in relation to the consolidated balance sheet from which it has been derived.
/s/ PricewaterhouseCoopers LLP
PricewaterhouseCoopers LLP
Detroit, Michigan
May 4, 2012
47
ITEM 2.
Management's Discussion and Analysis of Financial Condition and Results of Operations
RESULTS OF OPERATIONS
TOTAL COMPANY
Our net income attributable to Ford Motor Company was $1.4 billion or $0.35 per share of Common and Class B Stock in the first quarter of 2012, a decrease of $1.2 billion from net income attributable to Ford Motor Company of $2.6 billion or $0.61 per share of Common and Class B Stock in the first quarter of 2011. First quarter 2012 net income was affected by the impact of higher tax expense compared to a year ago, resulting from the release of the tax valuation allowance in the fourth quarter of 2011. The increase in non-cash tax expense explains about half of the decrease in net income, with the balance reflecting lower operating results and increased unfavorable special items, as discussed below.
Total Company results are shown below:
|
First Quarter
|
|||||||
|
2012
|
Better/(Worse)
2011
|
||||||
|
(Mils.)
|
(Mils.)
|
||||||
|
Income/(Loss)
|
|
||||||
|
Pre-tax results (excl. special items)
|
$
|
2,293
|
|
$
|
(544
|
)
|
|
|
Special items
|
(255
|
)
|
(194
|
)
|
|||
|
Pre-tax results (incl. special items)
|
2,038
|
|
(738
|
)
|
|||
|
(Provision for)/Benefit from income taxes
|
(640
|
)
|
(420
|
)
|
|||
|
Net income/(loss)
|
1,398
|
|
(1,158
|
)
|
|||
|
Less: Income/(Loss) attributable to noncontrolling interests
|
2
|
|
(3
|
)
|
|||
|
Net income/(loss) attributable to Ford
|
$
|
1,396
|
|
$
|
(1,155
|
)
|
|
Income/(Loss) before income taxes
includes certain items ("special items") that we have grouped into "Personnel and Dealer-Related Items" and "Other Items" to provide useful information to investors about the nature of the special items. The first category includes items related to our efforts to match production capacity and cost structure to market demand and changing model mix and therefore helps investors track amounts related to those activities. The second category includes items that we do not generally consider to be indicative of our ongoing operating activities, and therefore allows investors analyzing our pre-tax results to identify certain infrequent significant items that they may wish to exclude when considering the trend of ongoing operating results.
As detailed in Note 17 of the Notes to the Financial Statements, we allocate all Automotive sector and Financial Services sector special items to a separate reconciling item, as opposed to allocating them among the operating segments and Other Automotive, reflecting the fact that management excludes these items from its review of operating segment results for purposes of measuring segment profitability and allocating resources among the segments.
The following table details Automotive sector special items in each category:
|
First Quarter
|
|||||||
|
2012
|
2011
|
||||||
|
(Mils.)
|
(Mils.)
|
||||||
|
Personnel and Dealer-Related Items
|
|||||||
|
Personnel-reduction actions
|
$
|
(239
|
)
|
$
|
(22
|
)
|
|
|
Mercury discontinuation/Other dealer actions
|
(16
|
)
|
(1
|
)
|
|||
|
Job Security Benefits/Other
|
6
|
|
(1
|
)
|
|||
|
Total Personnel and Dealer-Related Items
|
(249
|
)
|
(24
|
)
|
|||
|
Other Items
|
|
|
|
|
|||
|
Debt reduction actions
|
—
|
|
(60
|
)
|
|||
|
Other (including foreign currency translation adjustment)
|
(6
|
)
|
23
|
|
|||
|
Total Other Items
|
(6
|
)
|
(37
|
)
|
|||
|
Total Special Items
|
$
|
(255
|
)
|
$
|
(61
|
)
|
|
48
Item 2. Management's Discussion and Analysis of Financial Condition and Results of Operations (Continued)
Discussion of Automotive sector, Financial Services sector, and total Company results of operations below is on a pre-tax basis and excludes special items unless otherwise specifically noted.
The chart below details first quarter 2012 pre-tax operating results by sector:
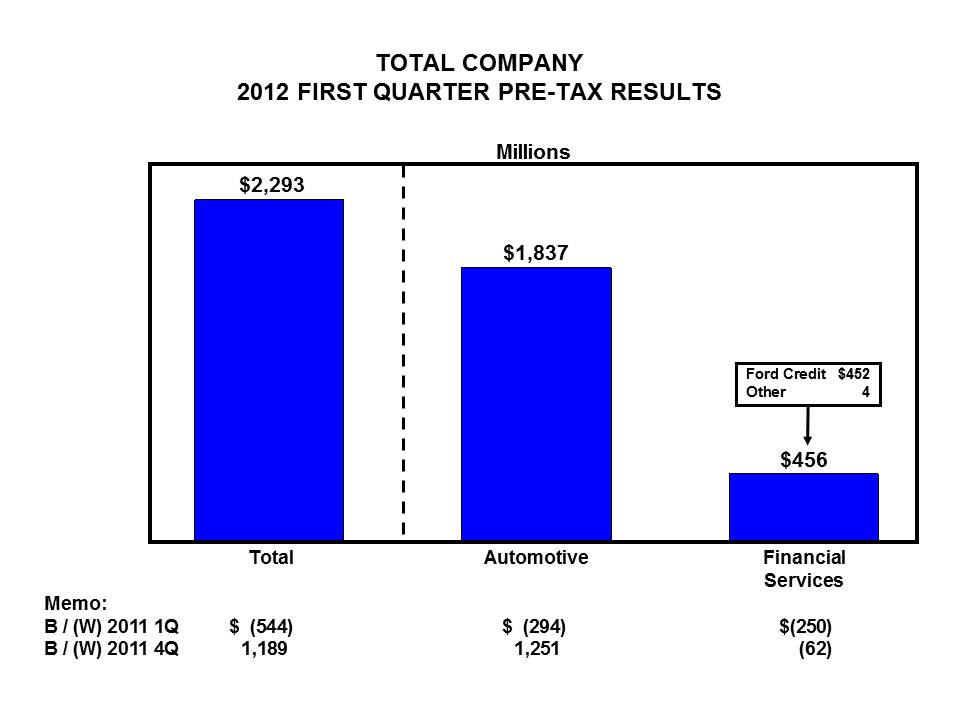
Total Company first quarter 2012 pre-tax profit of $2.3 billion reflects strong performance in Ford North America and Ford Credit. Compared with the first quarter of 2011, total Company pre-tax operating profit declined, with both sectors contributing to the decline.
49
Item 2. Management's Discussion and Analysis of Financial Condition and Results of Operations (Continued)
AUTOMOTIVE SECTOR
In general, we measure year-over-year change in Automotive pre-tax operating profit for our total Automotive sector (excluding special items) and reportable segments using the causal factors listed below, with revenue and cost variances calculated at present-year volume and mix and exchange:
|
•
|
Market Factors
:
|
|
▪
|
Volume and Mix -
Primarily measures profit variance from changes in wholesale volumes (at prior-year average margin per unit) driven by changes in industry volume, market share, and dealer stocks, as well as the profit variance resulting from changes in product mix, including mix among vehicle lines and mix of trim levels and options within a vehicle line.
|
|
▪
|
Net Pricing -
Primarily measures profit variance driven by changes in wholesale prices to dealers and marketing incentive programs such as rebate programs, low-rate financing offers, and special lease offers.
|
|
•
|
Contribution Costs -
Primarily measures profit variance driven by per-unit changes in cost categories that typically vary with volume, such as material costs (including commodity and component costs), warranty expense, and freight and duty costs.
|
|
•
|
Other Costs -
Primarily measures profit variance driven by absolute change in cost categories that typically do not have a directly proportionate relationship to production volume. These include mainly structural costs, described below, as well as all other costs, which include items such as litigation costs and costs related to our after-market parts, accessories and service business. Structural costs include the following cost categories:
|
|
▪
|
Manufacturing and Engineering -
consists primarily of costs for hourly and salaried manufacturing- and engineering-related personnel, plant overhead (such as utilities and taxes), new product launch expense, prototype materials, and outside engineering services.
|
|
▪
|
Spending-Related -
consists primarily of depreciation and amortization of our manufacturing and engineering assets, but also includes asset retirements and operating leases.
|
|
▪
|
Advertising and Sales Promotions -
includes costs for advertising, marketing programs, brand promotions, customer mailings and promotional events, and auto shows.
|
|
▪
|
Administrative and Selling -
includes primarily costs for salaried personnel and purchased services related to our staff activities and selling functions, as well as associated information technology costs.
|
|
▪
|
Pension and OPEB -
consists primarily of past service pension cost and other post-retirement employee benefit costs.
|
|
•
|
Exchange -
Primarily measures profit variance driven by one or more of the following: (i) impact of gains or losses arising from transactions denominated in currencies other than the functional currency of the locations, (ii) effect of remeasuring income, assets, and liabilities of foreign subsidiaries using U.S. dollars as the functional currency, or (iii) results of our foreign currency hedging activities.
|
|
•
|
Net Interest and Other -
Primarily measures profit variance driven by changes in our Automotive sector's centrally-managed net interest (primarily interest expense, interest income, and other adjustments) and related fair value market adjustments in our investment portfolio and marketable securities as well as other items not included in the causal factors defined above.
|
50
Item 2. Management's Discussion and Analysis of Financial Condition and Results of Operations (Continued)
Total Automotive.
The charts below detail first quarter key metrics and the change in first quarter 2012 pre-tax operating results compared with first quarter 2011 by causal factor. Automotive operating margin is defined as Automotive pre-tax operating results, excluding special items and Other Automotive, divided by Automotive revenue.
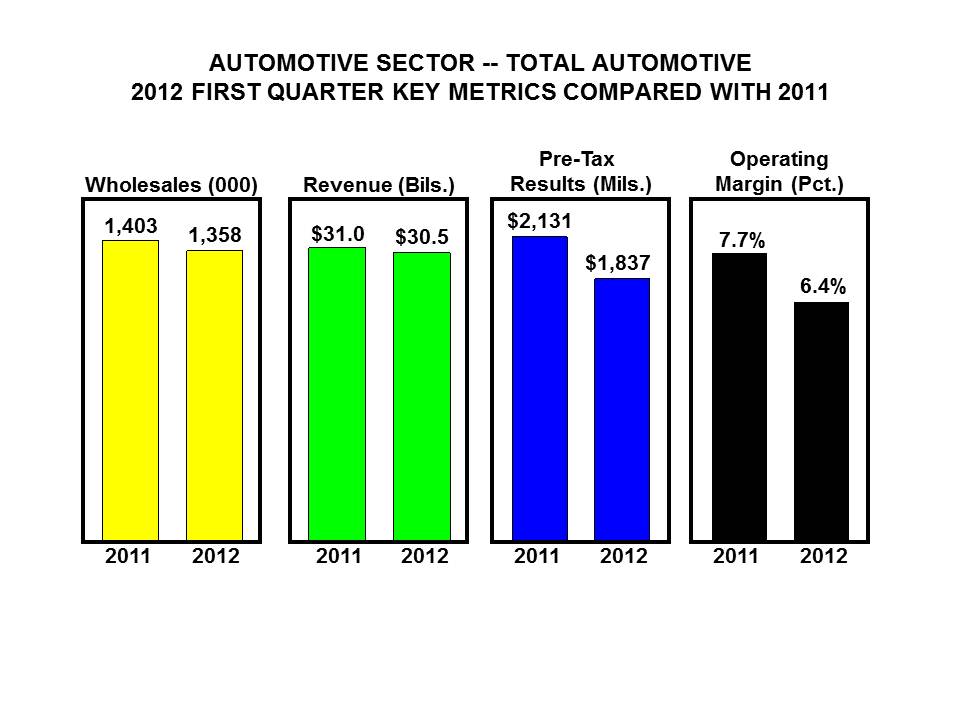
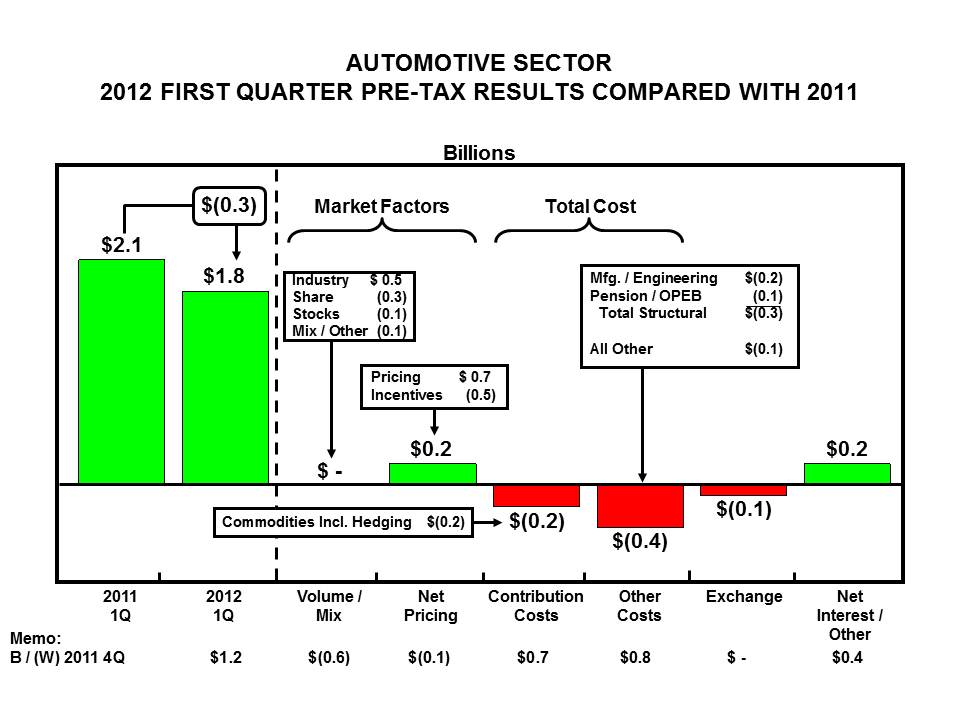
As shown above, first quarter 2012 wholesale volume and revenue decreased from a year ago, reflecting lower wholesales in Ford Europe and Ford Asia Pacific Africa that were partially offset by higher wholesales in Ford North America and Ford South America. Operating margin was 6.4%, down 1.3 percentage points from a year ago, with the decrease attributable to our Automotive operations outside North America.
Total Automotive pre-tax operating profit was $1.8 billion, a decline of about $300 million from a year ago. The decrease in earnings reflects higher costs across the regions and unfavorable exchange, offset partially by higher net pricing and lower interest expense net of interest income ("net interest expense").
51
Item 2. Management's Discussion and Analysis of Financial Condition and Results of Operations (Continued)
Total costs and expenses
for our Automotive sector for first quarter 2012 and 2011 was $29 billion and $28.9 billion, respectively, a difference of about $100 million. An explanation of the change as reconciled to our statement of operations is shown below (in billions):
|
2012
Better/(Worse)
2011
|
|||
|
First Quarter
|
|||
|
Explanation of change:
|
|||
|
Volume and mix, exchange, and other
|
$
|
0.7
|
|
|
Contribution costs (a)
|
|
|
|
|
Commodity costs (incl. hedging)
|
(0.2
|
)
|
|
|
Material costs excluding commodity costs
|
—
|
|
|
|
Warranty/Freight
|
—
|
|
|
|
Other costs (a)
|
|
|
|
|
Structural costs
|
(0.3
|
)
|
|
|
Other
|
(0.1
|
)
|
|
|
Special items
|
(0.2
|
)
|
|
|
Total
|
$
|
(0.1
|
)
|
_________
|
(a)
|
Our key cost change elements are measured primarily at present-year exchange; in addition, costs that vary directly with volume, such as material, freight and warranty costs, are measured at present-year volume and mix. Excludes special items.
|
Results by Automotive Segment.
Details by segment of
Income/(Loss) before income taxes
are shown below for the first quarter of 2012.
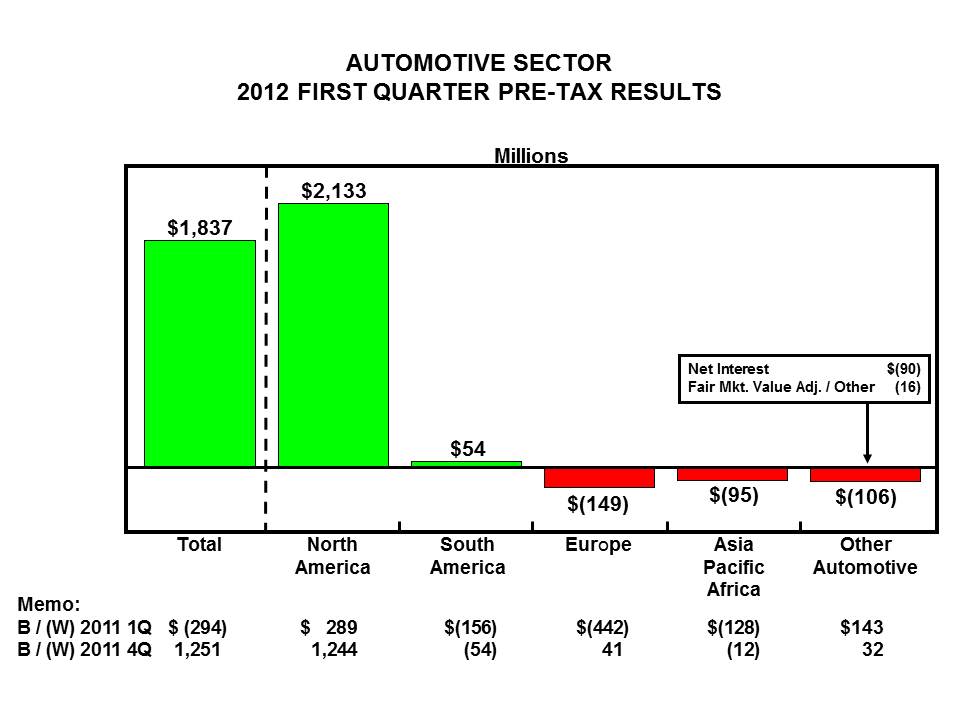
Total Automotive pre-tax operating profit of $1.8 billion was led by Ford North America. Ford South America was also profitable, but Ford Europe and Ford Asia Pacific Africa incurred losses. The loss in Other Automotive mainly reflects net interest expense. It is $143 million favorable compared to a year ago, reflecting lower interest expense attributable to our 2011 debt reduction actions and the non-recurrence of market valuation losses associated with our investment in Mazda.
We expect full-year 2012 net interest expense to be slightly higher than last year, primarily reflecting lower interest income.
52
Item 2. Management's Discussion and Analysis of Financial Condition and Results of Operations (Continued)
Ford North America Segment.
The charts below detail key first quarter metrics and the change in first quarter 2012 pre-tax operating profit compared with the first quarter of 2011 by causal factor.
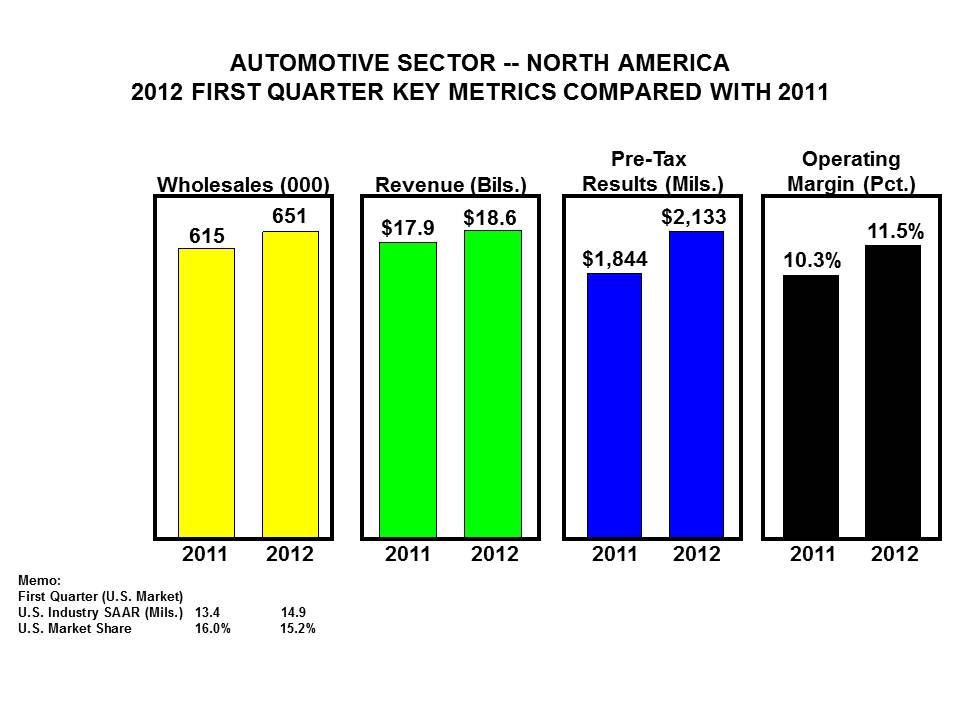
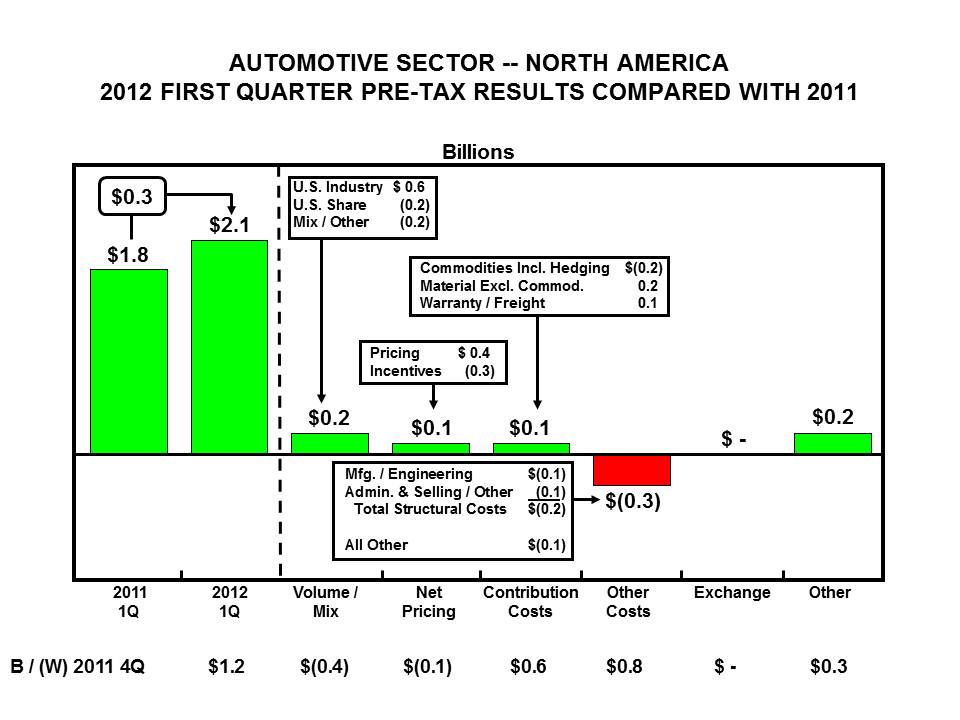
As shown above, first quarter 2012 wholesale volume and revenue increased from a year ago, improving 6% and 4%, respectively. Operating margin in the first quarter, at 11.5%, also was strong and significantly higher than a year ago.
Ford North America reported a pre-tax operating profit of $2.1 billion for the first quarter of 2012, compared with a profit of $1.8 billion a year ago. The increase in earnings is explained by favorable volume and mix -- more than explained by higher U.S. industry volume, higher net pricing, lower contribution costs, and lower compensation (reflected in the category "Other"). A partial offset is the "Other Costs" category, reflecting mainly higher structural costs.
Pre-tax operating profit was the highest since at least 2000, when we first started reflecting Ford North America as a separate business unit. The last time we achieved a similar quarterly profit was in the first quarter of 2004, when our wholesale volume was over 1 million units, more than 50% higher than in the current quarter. In addition, our volume at that time had a significantly higher mix of trucks and traditional sport utility vehicles.
Looking ahead, we expect Ford North America to achieve significantly higher full-year pre-tax operating profit and operating margin compared with 2011, which will be the key enabler for the Company to achieve about the same level of pre-tax operating profit for 2012 as in 2011.
53
Item 2. Management's Discussion and Analysis of Financial Condition and Results of Operations (Continued)
Ford South America Segment.
The charts below detail first quarter key metrics and the change in first quarter 2012 pre-tax operating profit compared with the first quarter of 2011 by causal factor.
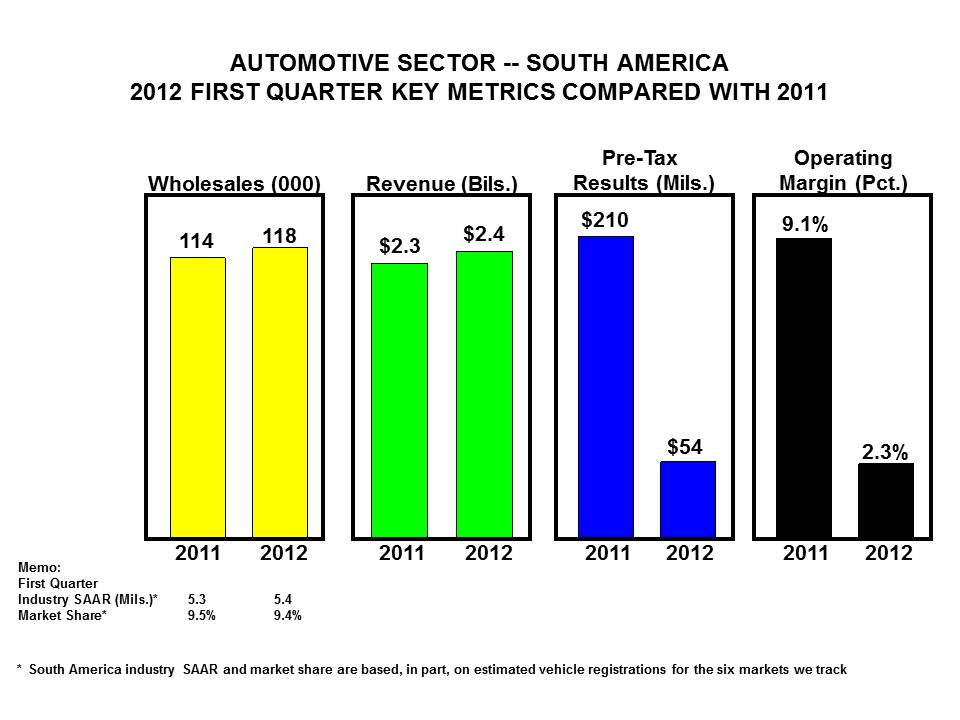
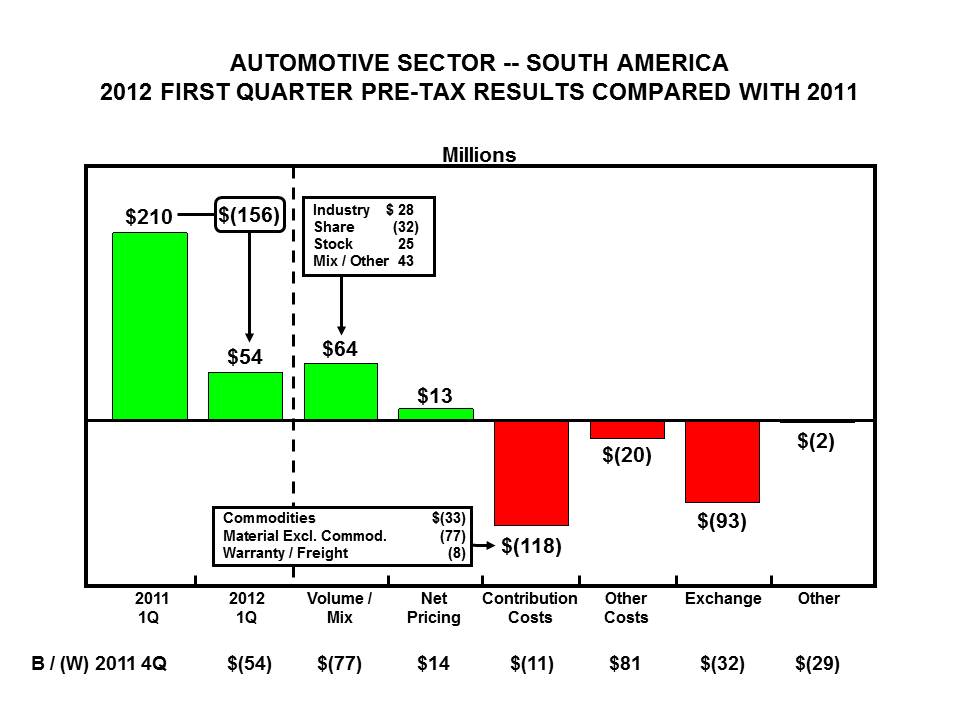
As shown above, first quarter 2012 wholesale volume and revenue increased by 4% each from a year ago, while operating margin declined.
Ford South America reported a pre-tax operating profit of $54 million, compared with a profit of $210 million a year ago. The decrease in earnings is more than explained by higher costs, primarily contribution costs, and unfavorable exchange. Although net pricing was favorable, we were not able to offset exchange and economic factors to the same degree we had in the past.
We continue to expect Ford South America to generate solid profitability this year, although lower than in 2011. Three new global products will be launched in South America this year, with the impact positively affecting results primarily in the second half. We also are facing some uncertainty in the region, including a new trade agreement between Brazil and Mexico limiting vehicle imports to Brazil, the details and impact of which we are still reviewing.
54
Item 2. Management's Discussion and Analysis of Financial Condition and Results of Operations (Continued)
Ford Europe Segment.
The charts below detail first quarter key metrics and the change in first quarter 2012 pre-tax operating profit compared with the first quarter of 2011 by causal factor.
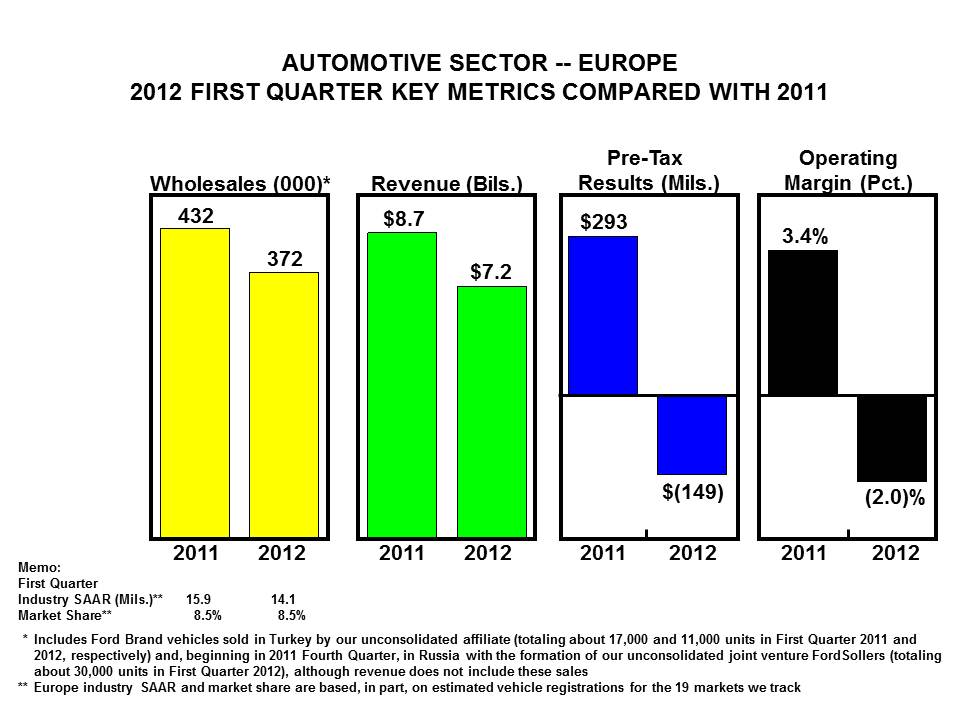
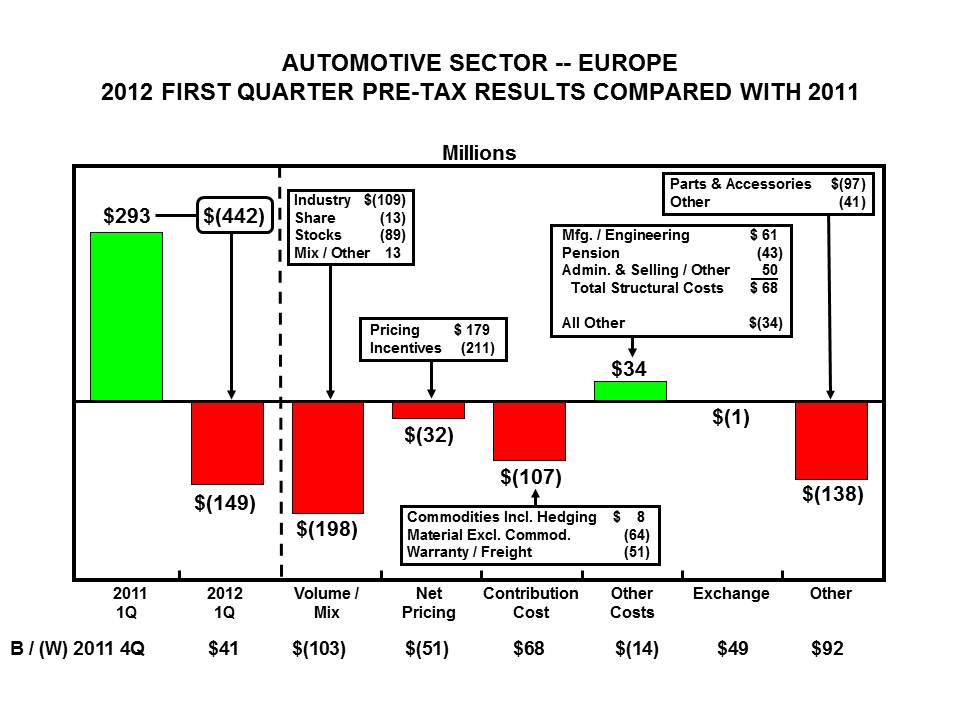
As shown above, first quarter 2012 wholesale volume and revenue declined by 14% and 17%, respectively, compared with the prior year, reflecting primarily lower industry sales and production adjustments to maintain dealer stocks at appropriate levels. Operating margin was lower than a year ago.
Ford Europe reported a pre-tax operating loss of $149 million, a decline of $442 million from a year ago. The decline in results is explained primarily by lower industry volumes, lower demand for parts and accessories, and actions to reduce stocks consistent with industry levels. Contribution and pension-related cost increases are offset partially by reductions in other structural costs.
As we look ahead to the full year, we continue to expect Ford Europe to incur a loss ranging from $500 million to $600 million. Our European operations will benefit from the launches of the new B-MAX, Transit, and Kuga products, in addition to completion of our stock reduction actions and continued cost reductions. The impact will positively affect results primarily in the second half.
55
Item 2. Management's Discussion and Analysis of Financial Condition and Results of Operations (Continued)
Ford Asia Pacific Africa Segment.
The charts below detail first quarter key metrics and the change in first quarter 2012 pre-tax operating profit compared with the first quarter of 2011 by causal factor.
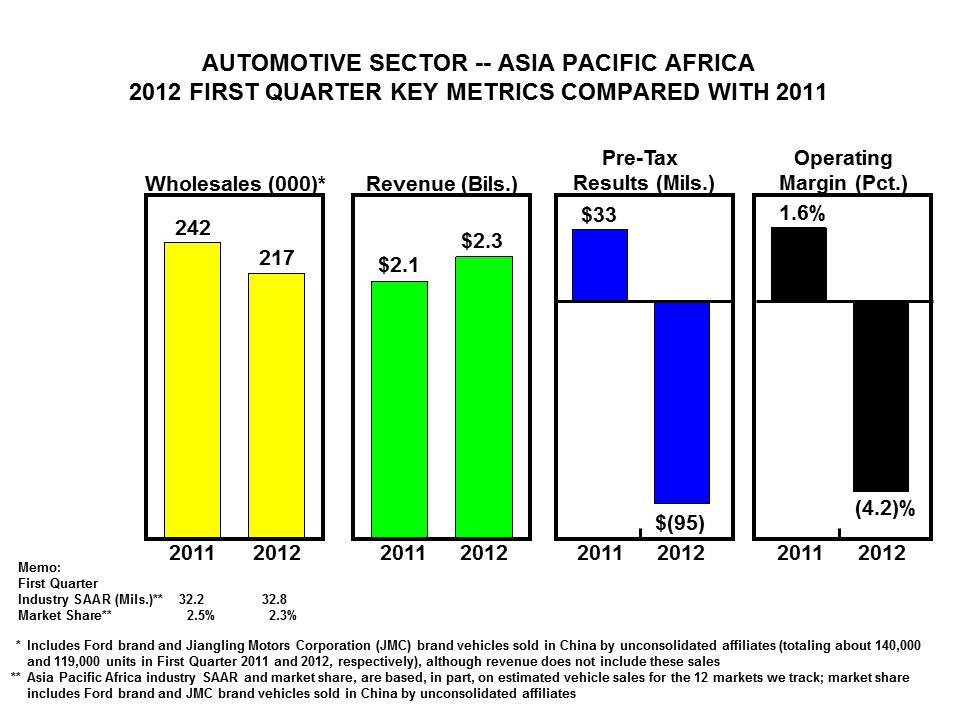
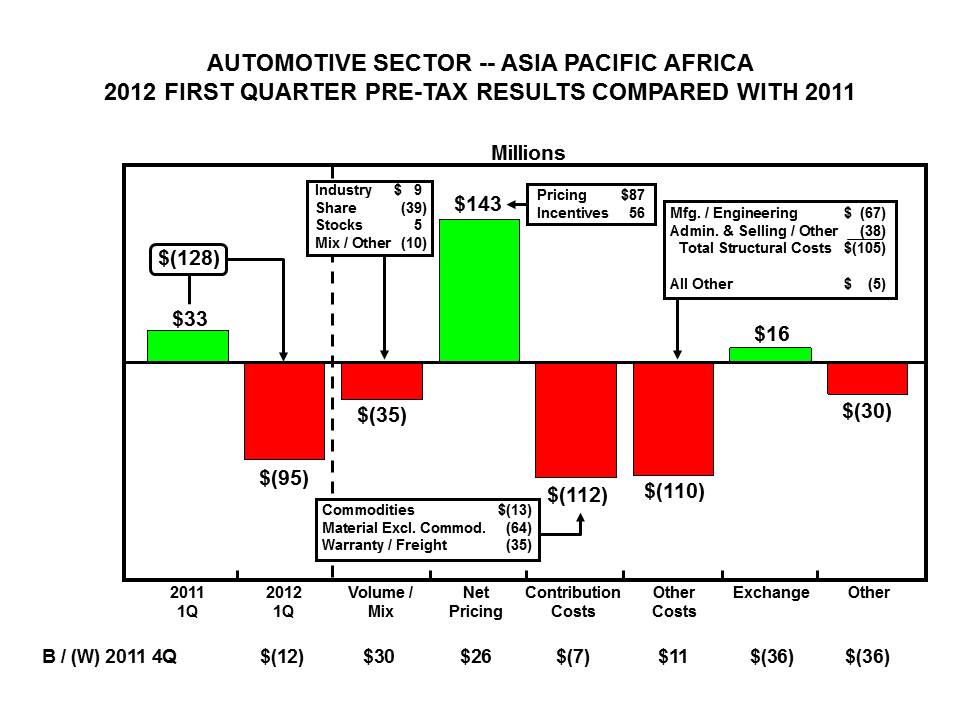
As shown above, first quarter 2012 wholesale volumes are lower than a year ago due to the production launch of the global Focus in China. Revenue, which excludes our unconsolidated joint ventures in China, increased by 10%, reflecting primarily higher net pricing on new products. Operating margin was lower than a year ago.
Ford Asia Pacific Africa reported a pre-tax operating loss of $95 million, a $128 million decline from a year ago. Results were affected adversely by higher costs associated with continued investment for future growth that precede the benefit of new products across the region. This was exacerbated, to some extent, by a slower-than-planned launch for the global Ranger pickup truck from our facilities in Thailand and South Africa.
Despite the first quarter loss, we continue to expect Ford Asia Pacific Africa to be profitable for the full year, with volumes increasing as the Ranger launch progresses, new capacity comes on line in China and Thailand, and other new product launches occur in the balance of the year.
56
Item 2. Management's Discussion and Analysis of Financial Condition and Results of Operations (Continued)
FINANCIAL SERVICES SECTOR
As shown in the total Company discussion above, we present our Financial Services sector results in two segments, Ford Credit and Other Financial Services. Ford Credit, in turn, has two segments, North America and International.
Ford Credit.
The chart below details the decrease in pre-tax operating profit by causal factor:
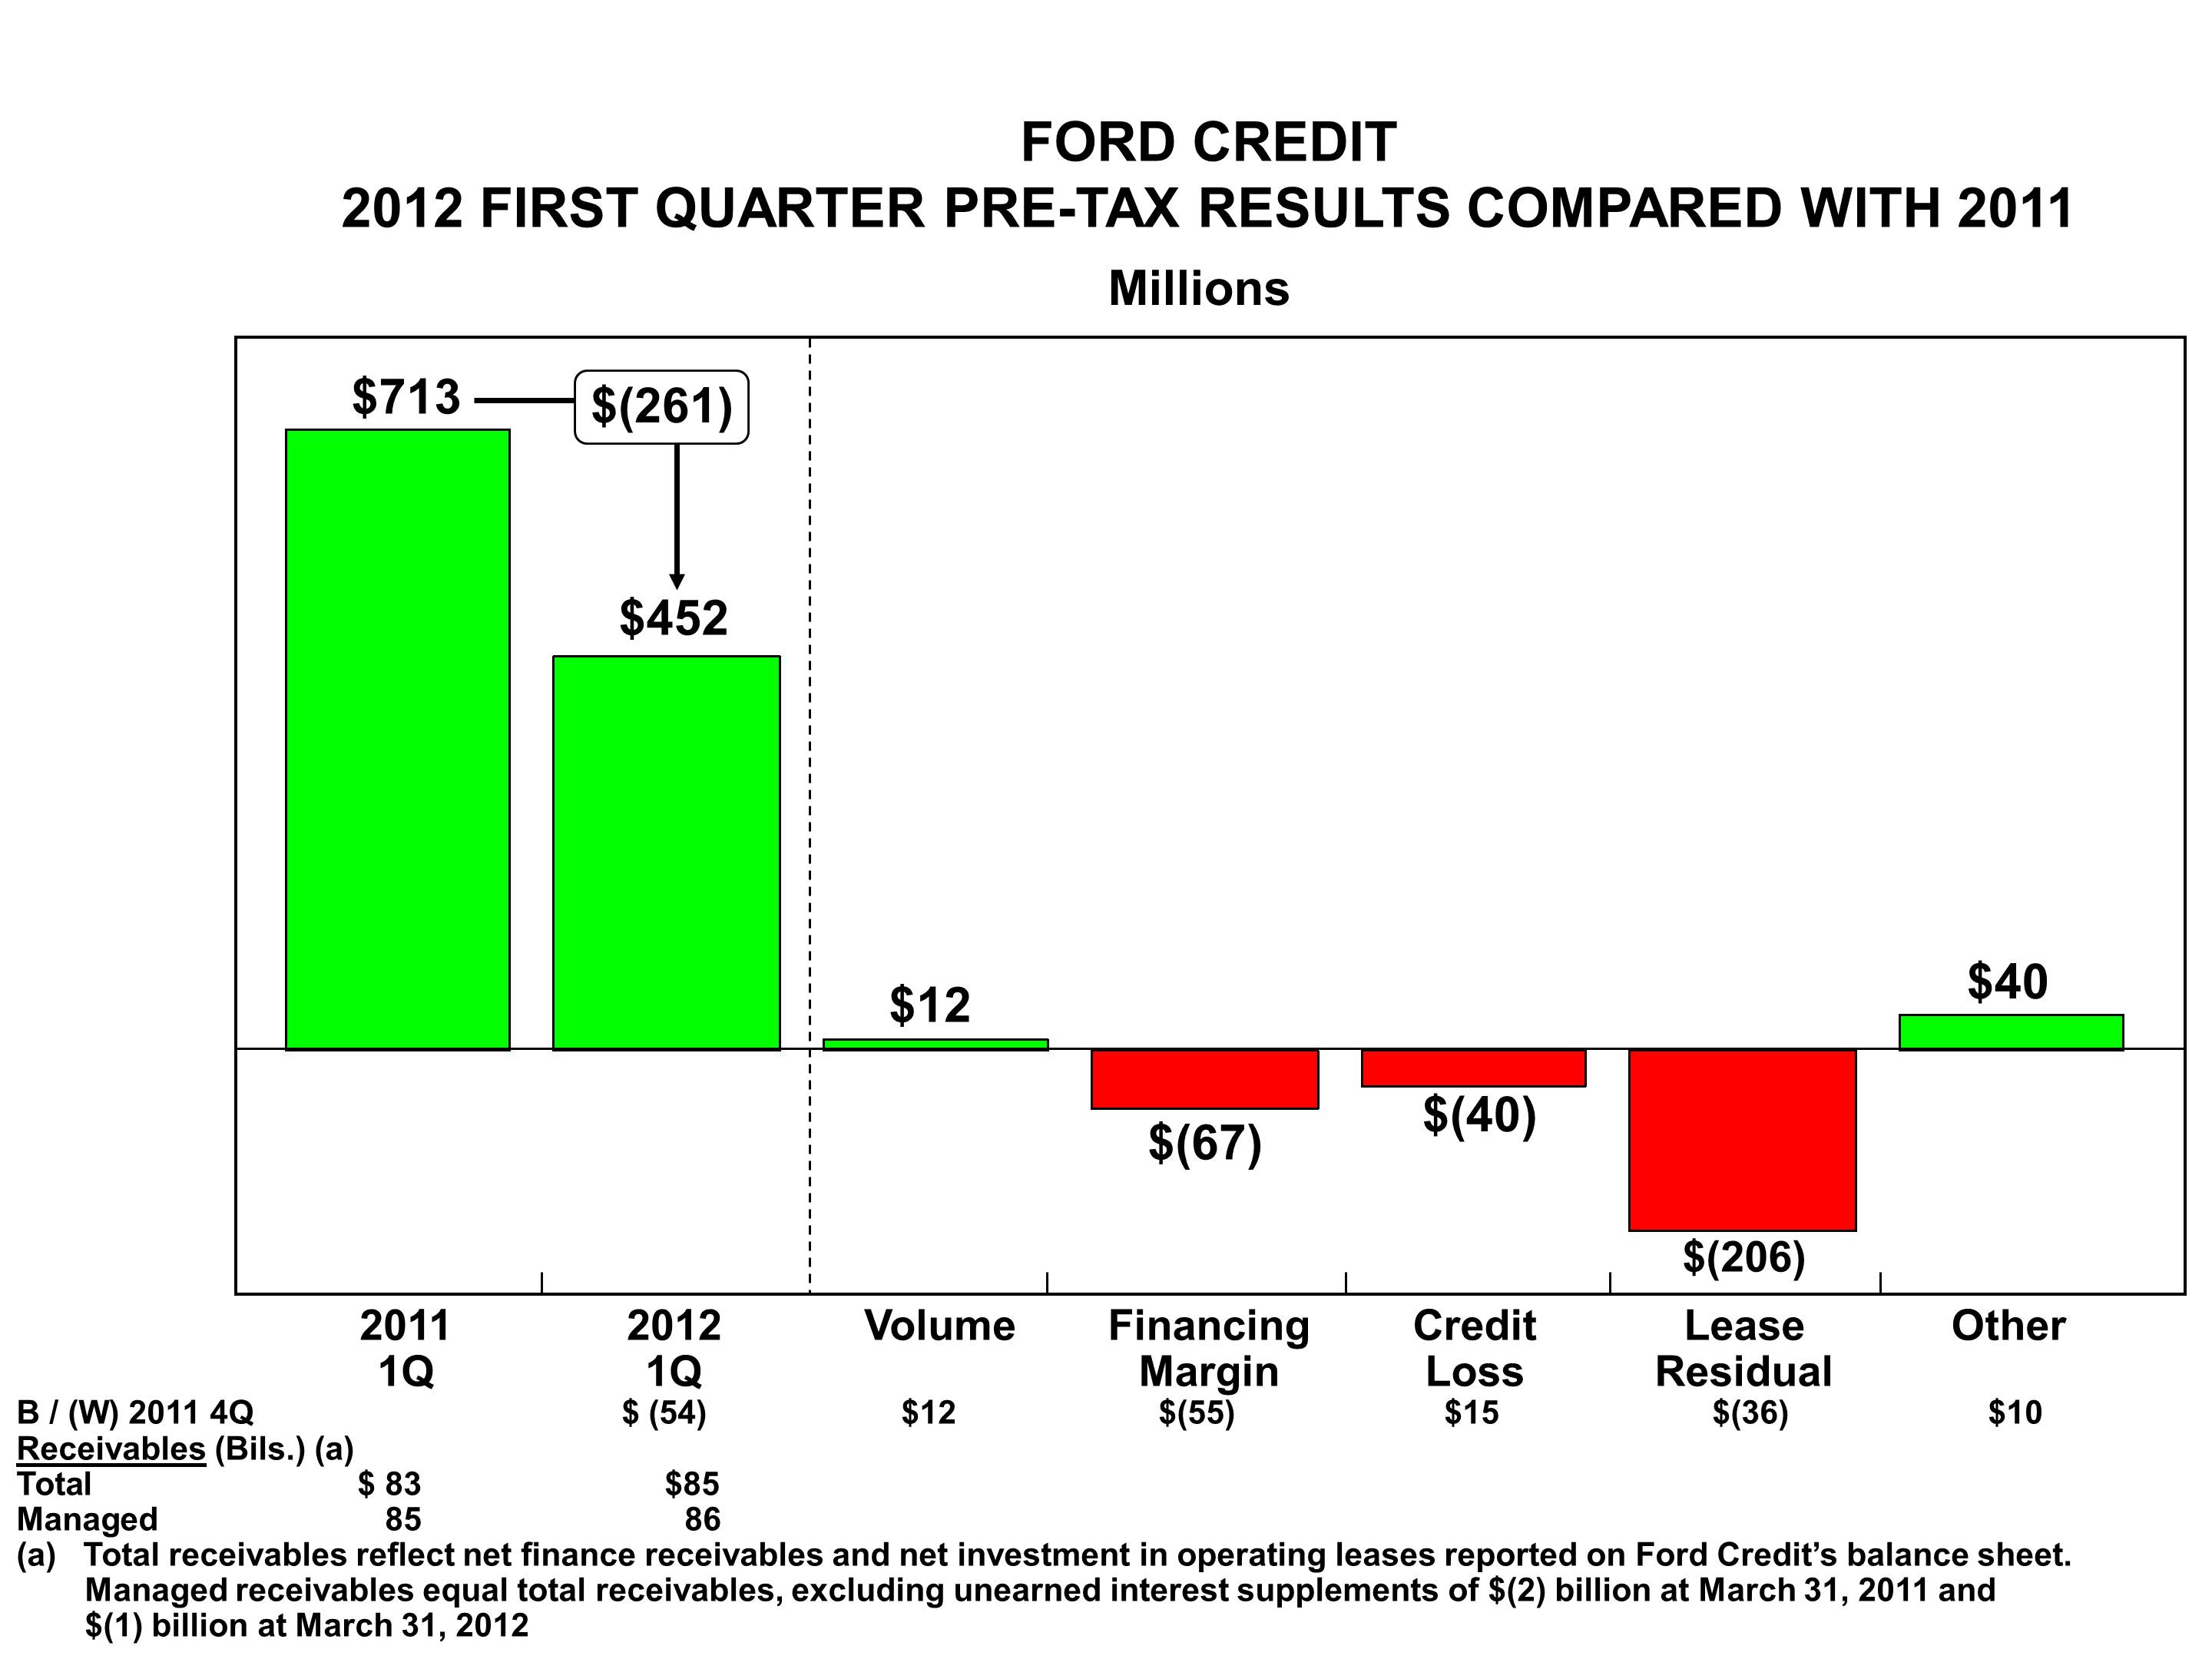
The decline reflects fewer lease terminations, which resulted in fewer vehicles sold at a gain, lower financing margin, and lower credit loss reserve reductions.
57
Item 2. Management's Discussion and Analysis of Financial Condition and Results of Operations (Continued)
Ford Credit's receivables, including finance receivables and operating leases at March 31, 2012 and December 31, 2011 were as follows (in billions):
|
March 31,
2012 |
December 31,
2011 |
||||||
|
Receivables
|
|
|
|||||
|
Finance receivables – North America Segment
|
|
|
|||||
|
Consumer
|
|
|
|||||
|
Retail installment and direct financing leases
|
$
|
38.3
|
|
$
|
38.4
|
|
|
|
Non-Consumer
|
|
|
|||||
|
Wholesale
|
15.7
|
|
15.5
|
|
|||
|
Dealer loan and other
|
2.1
|
|
2.1
|
|
|||
|
Total North America Segment – finance receivables (a)
|
56.1
|
|
56.0
|
|
|||
|
Finance receivables – International Segment
|
|
|
|||||
|
Consumer
|
|
|
|||||
|
Retail installment and direct financing leases
|
9.3
|
|
9.1
|
|
|||
|
Non-Consumer
|
|
|
|||||
|
Wholesale
|
8.7
|
|
8.5
|
|
|||
|
Dealer loan and other
|
0.5
|
|
0.4
|
|
|||
|
Total International Segment – finance receivables (a)
|
18.5
|
|
18.0
|
|
|||
|
Unearned interest supplements
|
(1.6
|
)
|
(1.6
|
)
|
|||
|
Allowance for credit losses
|
(0.4
|
)
|
(0.5
|
)
|
|||
|
Finance receivables, net
|
72.6
|
|
71.9
|
|
|||
|
Net investment in operating leases (a)
|
11.9
|
|
11.1
|
|
|||
|
Total receivables (b)
|
$
|
84.5
|
|
$
|
83.0
|
|
|
|
Memo:
|
|
|
|||||
|
Total managed receivables (c)
|
$
|
86.1
|
|
$
|
84.6
|
|
|
|
(a)
|
At March 31, 2012 and December 31, 2011, includes consumer receivables before allowance for credit losses of $34.7 billion and $36 billion, respectively, and non-consumer receivables before allowance for credit losses of $20.6 billion and $19.8 billion, respectively, that have been sold for legal purposes in securitization transactions but continue to be reported in Ford Credit's consolidated financial statements. In addition, at March 31, 2012 and December 31, 2011, includes net investment in operating leases before allowance for credit losses of $5.7 billion and $6.4 billion, respectively, that have been included in securitization transactions but continue to be reported in Ford Credit's financial statements. The receivables are available only for payment of the debt and other obligations issued or arising in the securitization transactions; they are not available to pay Ford Credit's other obligations or the claims of its other creditors. Ford Credit holds the right to receive the excess cash flows not needed to pay the debt and other obligations issued or arising in each of these securitization transactions.
|
|
(b)
|
Includes allowance for credit losses of $479 million and $534 million at March 31, 2012 and December 31, 2011, respectively.
|
|
(c)
|
Excludes unearned interest supplements related to finance receivables.
|
Receivables at March 31, 2012, increased from year-end 2011, primarily due to higher Ford and Lincoln receivables and changes in currency exchange rates, partially offset by the discontinuation of financing for Jaguar, Land Rover, Mazda, Volvo, and Mercury.
58
Item 2. Management's Discussion and Analysis of Financial Condition and Results of Operations (Continued)
Credit Losses.
The charts below detail quarterly trends of charge-offs (credit losses, net of recoveries), loss-to-receivables ratios (charge-offs on an annualized basis divided by the average amount of receivables outstanding for the period, excluding the reserve and unearned interest supplements related to finance receivables), credit loss reserve, and Ford Credit's credit loss reserve as a percentage of end-of-period ("EOP") receivables:
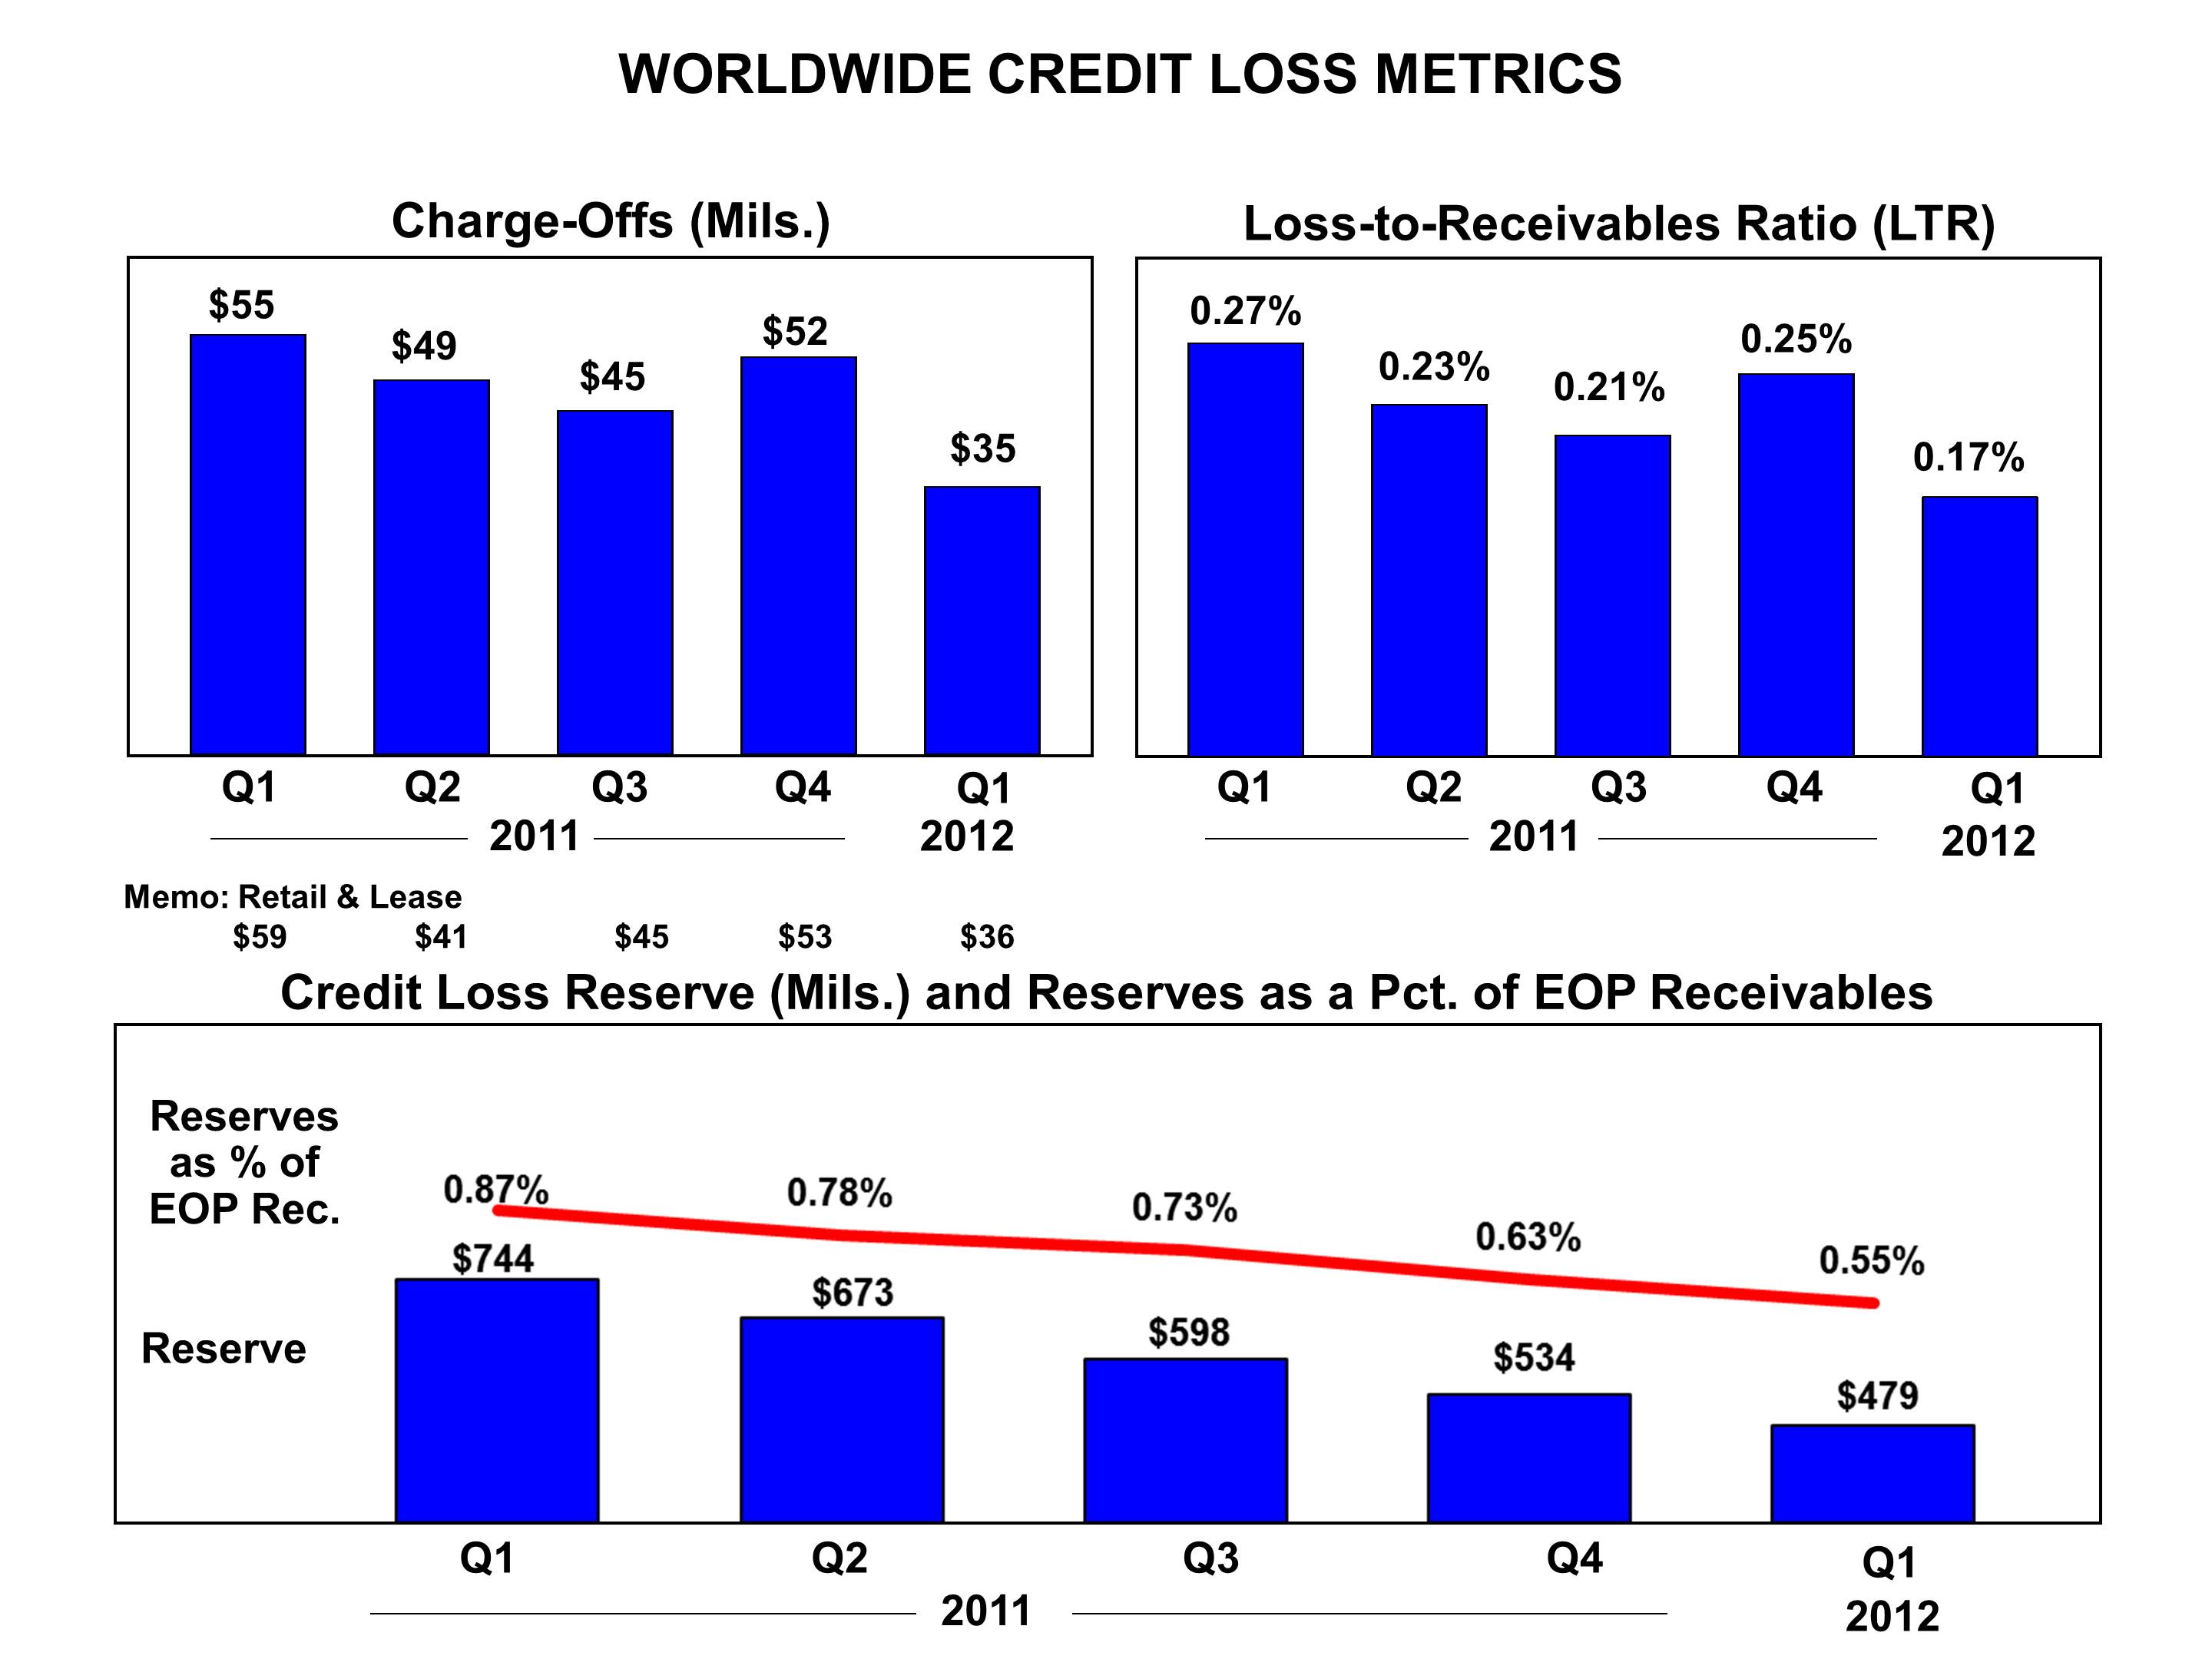
Ford Credit's first quarter credit losses continued at historically low levels.
Charge-offs in the first quarter were $35 million, down $20 million from the same period a year ago reflecting lower repossessions in the United States. Charge-offs were down $17 million from the fourth quarter of 2011, reflecting the same factor.
The credit loss reserve was $479 million, down $265 million from a year ago and down $55 million from the fourth quarter of 2011, reflecting the decrease in charge-offs.
In purchasing retail finance and lease contracts, Ford Credit uses a proprietary scoring system that classifies contracts using several factors, such as credit bureau information, credit bureau scores (e.g., FICO score), customer characteristics, and contract characteristics. In addition to Ford Credit's proprietary scoring system, it considers other factors, such as employment history, financial stability, and capacity to pay. At March 31, 2012 and December 31, 2011, Ford Credit classified between 5% - 6% of the outstanding U.S. retail finance and lease contracts in its portfolio as high risk at contract inception.
59
Item 2. Management's Discussion and Analysis of Financial Condition and Results of Operations (Continued)
Residual Risk.
Ford Credit is exposed to residual risk on operating leases and similar balloon payment products where the customer may return the financed vehicle to Ford Credit. Residual risk is the possibility that the amount Ford Credit obtains from returned vehicles will be less than its estimate of the expected residual value for the vehicle. Ford Credit estimates the expected residual value by evaluating recent auction values, return volumes for its leased vehicles, industry-wide used vehicle prices, marketing incentive plans, and vehicle quality data.
The following chart shows return volumes and auction values at constant first quarter 2012 vehicle mix for vehicles returned in the respective periods. Ford Credit's U.S. Ford and Lincoln operating lease portfolio accounted for about 85% of its total investment in operating leases at March 31, 2012.
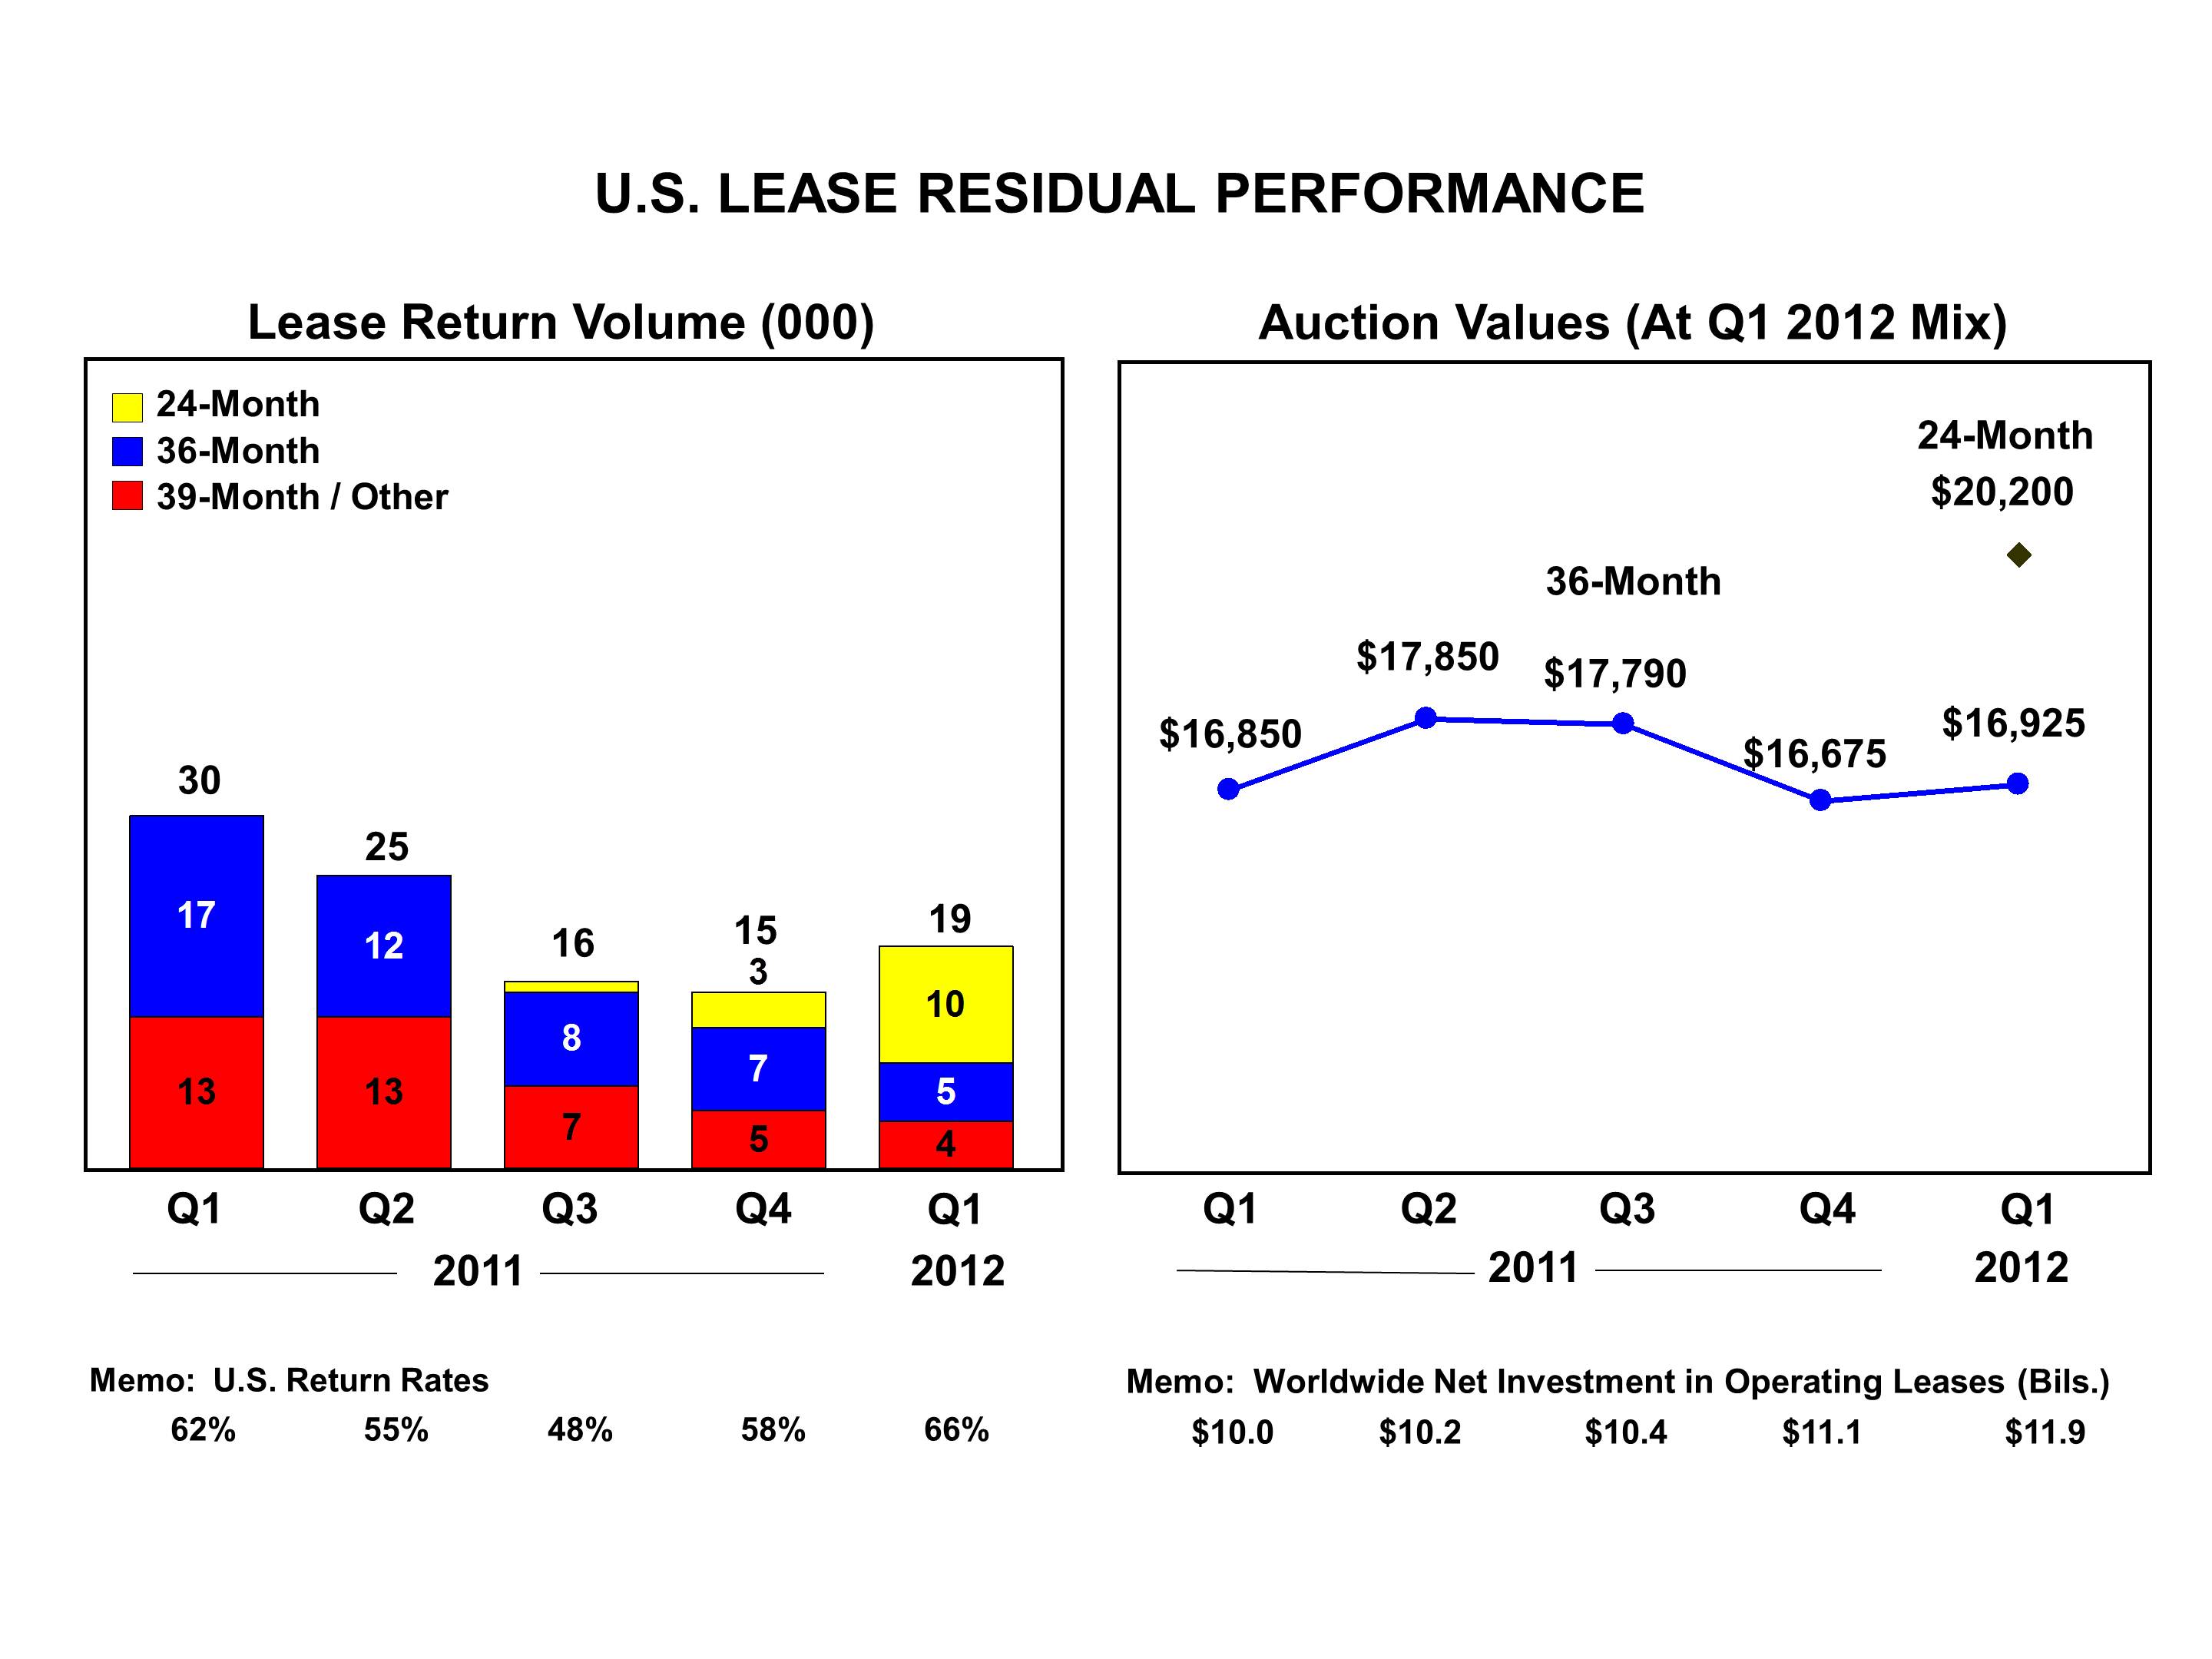
Lease return volumes in the first quarter were 37% lower than the same period last year, primarily reflecting the lower lease placements in 2009. The first quarter lease return rate was 66% up four percentage points compared with the same period last year and up eight percentage points compared with the fourth quarter of 2011. The increase reflects a higher mix of 24-month contracts, which typically have higher return rates than longer term contracts.
In the first quarter, Ford Credit's strong auction values for 36-month vehicles continued, up $75 per unit from the same period last year and up $250 from the fourth quarter.
Ford Credit's worldwide net investment in operating leases was $11.9 billion at the end of the first quarter of 2012, up from $11.1 billion at year end 2011.
60
Item 2. Management's Discussion and Analysis of Financial Condition and Results of Operations (Continued)
LIQUIDITY AND CAPITAL RESOURCES
Automotive Sector
Our Automotive liquidity strategy includes ensuring that we have sufficient liquidity available with a high degree of certainty throughout the business cycle by generating cash from operations and maintaining access to other sources of funding. For a discussion of risks to our liquidity, see "Item 1A. Risk Factors" in our 2011 Form 10-K Report, as well as Note 18 of the Notes to the Financial Statements regarding commitments and contingencies that could impact our liquidity.
Gross Cash.
Automotive gross cash includes cash and cash equivalents and marketable securities, net of any securities-in-transit. Gross cash is detailed below as of the dates shown (in billions):
|
March 31,
2012
|
December 31,
2011
|
March 31,
2011
|
December 31,
2010
|
||||||||||||
|
Cash and cash equivalents
|
$
|
7.3
|
|
$
|
7.9
|
|
$
|
12.6
|
|
$
|
6.3
|
|
|||
|
Marketable securities
|
15.8
|
|
15.0
|
|
8.8
|
|
14.2
|
|
|||||||
|
Total cash, marketable securities and loaned securities
|
23.1
|
|
22.9
|
|
21.4
|
|
20.5
|
|
|||||||
|
Securities-in-transit (a)
|
(0.1
|
)
|
—
|
|
(0.1
|
)
|
—
|
|
|||||||
|
Gross cash
|
$
|
23.0
|
|
$
|
22.9
|
|
$
|
21.3
|
|
$
|
20.5
|
|
|||
__________
|
(a)
|
The purchase or sale of marketable securities for which the cash settlement was not made by period-end and for which there was a payable or receivable recorded on the balance sheet at period-end.
|
Our cash, cash equivalents, and marketable securities are held primarily in highly liquid investments, which provide for anticipated and unanticipated cash needs. Our cash, cash equivalents, and marketable securities primarily include U.S. Department of Treasury obligations, federal agency securities, bank time deposits with investment-grade institutions, corporate investment-grade securities, commercial paper rated A-1/P-1 or higher, and debt obligations of a select group of non-U.S. governments, non-U.S. governmental agencies, and supranational institutions. The average maturity of these investments ranges from 90 days to up to one year, and is adjusted based on market conditions and liquidity needs. We monitor our cash levels and average maturity on a daily basis. Within our Automotive gross cash portfolio, we currently do not hold investments in government obligations of Greece, Ireland, Italy, Portugal, or Spain, nor did we hold any at March 31, 2012.
In managing our business, we classify changes in Automotive gross cash into operating-related and other items (which includes the impact of certain special items, contributions to funded pension plans, certain tax-related transactions, acquisitions and divestitures, capital transactions with the Financial Services sector, dividends paid to shareholders, and other - primarily financing-related). Our key liquidity metrics are operating-related cash flow (which best represents the ability of our Automotive operations to generate cash), Automotive gross cash, and Automotive liquidity. Automotive gross cash and liquidity as of the dates shown were as follows (in billions):
|
March 31,
2012
|
December 31,
2011
|
||||||
|
Gross cash
|
$
|
23.0
|
|
$
|
22.9
|
|
|
|
Available credit lines
|
|
|
|
|
|||
|
Secured credit facility, unutilized portion
|
9.2
|
|
8.8
|
|
|||
|
Local lines available to foreign affiliates, unutilized portion
|
0.7
|
|
0.7
|
|
|||
|
Automotive liquidity
|
$
|
32.9
|
|
$
|
32.4
|
|
|
We believe the cash flow analysis reflected in the table below is useful to investors because it includes in operating-related cash flow elements that we consider to be related to our Automotive operating activities (e.g., capital spending) and excludes cash flow elements that we do not consider to be related to the ability of our operations to generate cash. This differs from a GAAP cash flow statement and differs from
Net
cash provided by/(used in) operating activities
, the most directly comparable GAAP financial measure.
61
Item 2. Management's Discussion and Analysis of Financial Condition and Results of Operations (Continued)
Changes in Automotive gross cash are summarized below (in billions):
|
First Quarter
|
|||||||
|
|
2012
|
2011
|
|||||
|
Gross cash at end of period
|
$
|
23.0
|
|
$
|
21.3
|
|
|
|
Gross cash at beginning of period
|
22.9
|
|
20.5
|
|
|||
|
Total change in gross cash
|
$
|
0.1
|
|
$
|
0.8
|
|
|
|
|
|
|
|
||||
|
Automotive income/(loss) before income taxes (excluding special items)
|
$
|
1.8
|
|
$
|
2.1
|
|
|
|
Capital expenditures
|
(1.1
|
)
|
(0.9
|
)
|
|||
|
Depreciation and special tools amortization
|
0.9
|
|
0.9
|
|
|||
|
Changes in working capital (a)
|
(0.1
|
)
|
1.5
|
|
|||
|
Other/Timing differences (b)
|
(0.6
|
)
|
(1.4
|
)
|
|||
|
Total operating-related cash flows
|
0.9
|
|
2.2
|
|
|||
|
|
|
|
|
||||
|
Cash impact of personnel-reduction programs accrual
|
(0.1
|
)
|
—
|
|
|||
|
Net receipts from Financial Services sector (c)
|
0.3
|
|
1.3
|
|
|||
|
Other
|
(0.2
|
)
|
0.1
|
|
|||
|
Cash flow before other actions
|
0.9
|
|
3.6
|
|
|||
|
|
|
|
|
||||
|
Net proceeds from/(Payments on) Automotive sector debt
|
0.5
|
|
(2.5
|
)
|
|||
|
Contributions to funded pension plans
|
(1.1
|
)
|
(0.3
|
)
|
|||
|
Dividends/Other
|
(0.2
|
)
|
—
|
|
|||
|
Total change in gross cash
|
$
|
0.1
|
|
$
|
0.8
|
|
|
__________
|
(a)
|
Working capital comprised of changes in receivables, inventory and trade payables.
|
|
(b)
|
Primarily expense and payment timing differences for items such as pension and OPEB, compensation, marketing, and warranty, as well as additional factors, such as the impact of tax payments. In the first quarter of 2012, the adverse timing difference primarily reflected the seasonal impact of vehicle financing receivables.
|
|
(c)
|
Primarily distributions and tax payments received from Ford Credit.
|
With respect to "Changes in working capital," in general we carry relatively low trade receivables compared to our trade payables because the majority of our Automotive wholesales are financed (primarily by Ford Credit) immediately upon sale of vehicles to dealers, which generally occurs at the time the vehicles are gate-released shortly after being produced. In addition, our inventories are lean because we build to order, not for inventory. In contrast, our Automotive trade payables are based primarily on industry-standard production supplier payment terms generally ranging between 30 days to 45 days. As a result, our cash flow tends to improve as wholesale volumes increase, but can deteriorate significantly when wholesale volumes drop sharply. In addition, these working capital balances generally are subject to seasonal changes that can impact cash flow. For example, we typically experience cash flow timing differences associated with inventories and payables due to our annual summer and December shutdown periods, when production, and therefore inventories and wholesale volumes, are usually at their lowest levels, while payables continue to come due and be paid. The net impact of this typically results in cash outflows from changes in our working capital balances during these shutdown periods.
Shown below is a reconciliation between financial statement
Net cash provided by/(used in) operating activities
and operating-related cash flows (calculated as shown in the table above), as of the dates shown (in billions):
|
First Quarter
|
|||||||
|
|
2012
|
2011
|
|||||
|
Net cash provided by/(used in) by operating activities
|
$
|
0.9
|
|
$
|
3.0
|
|
|
|
Items included in operating-related cash flows
|
|
|
|||||
|
Capital expenditures
|
(1.1
|
)
|
(0.9
|
)
|
|||
|
Proceeds from the exercise of stock options
|
—
|
|
0.1
|
|
|||
|
Items not included in operating-related cash flows
|
|
|
|
|
|||
|
Cash impact of Job Security Benefits and personnel-reduction actions
|
0.1
|
|
—
|
|
|||
|
Contributions to funded pension plans
|
1.1
|
|
0.3
|
|
|||
|
Tax refunds, tax payments, and tax receipts from affiliates
|
(0.1
|
)
|
(0.4
|
)
|
|||
|
Other
|
—
|
|
0.1
|
|
|||
|
Operating-related cash flows
|
$
|
0.9
|
|
$
|
2.2
|
|
|
62
Item 2. Management's Discussion and Analysis of Financial Condition and Results of Operations (Continued)
Credit Agreement
. On March 15, 2012, we entered into the Seventh Amendment to our Credit Agreement which extended the maturity date of the revolving credit facility by two years from November 30, 2013 to November 30, 2015. Prior to the Seventh Amendment, lenders had revolving commitments totaling $8.9 billion that matured on November 30, 2013. As a result of the Seventh Amendment, lenders have commitments totaling $9 billion in a revolving facility that will mature on November 30, 2015, and commitments totaling an additional $307 million in a revolving facility that will mature on November 30, 2013. Our Credit Agreement continues to be free of material adverse change clauses, restrictive financial covenants (for example, debt-to-equity limitations and minimum net worth requirements) and credit rating triggers that could limit our ability to obtain funding. Furthermore, the collateral release provision, whereby the collateral securing our obligations under the Credit Agreement automatically will be released when our unsecured, long-term debt is rated investment grade by any two of Fitch, Moody's, and S&P (as defined below under "Credit Ratings"), remains unchanged. For additional details regarding the Seventh Amendment to our Credit Agreement, please see our Current Report on Form 8-K dated March 15, 2012.
At March 31, 2012, the utilized portion of the revolving credit facilities was $131 million, representing amounts utilized as letters of credit. None of the lenders under our Credit Agreement is a financial institution based in Greece, Ireland, Italy, Portugal, or Spain.
Other Automotive Credit Facilities.
At March 31, 2012, we had $856
million of local credit facilities to non-U.S. Automotive affiliates, of which $106 million has been utilized. Of the $856 million of committed credit facilities, $70 million expires in 2012, $169 million expires in 2013, $220 million expires in 2014, and $357 million expires in 2015 and $40 million thereafter.
Net Cash.
Our Automotive sector net cash calculation as of the dates shown were as follows (in billions):
|
March 31,
2012
|
December 31,
2011
|
||||||
|
Gross cash
|
$
|
23.0
|
|
$
|
22.9
|
|
|
|
Less:
|
|
|
|
|
|||
|
Long-term debt
|
12.6
|
|
12.1
|
|
|||
|
Debt payable within one year
|
1.1
|
|
1.0
|
|
|||
|
Total debt
|
13.7
|
|
13.1
|
|
|||
|
Net cash
|
$
|
9.3
|
|
$
|
9.8
|
|
|
Total debt at March 31, 2012 increased by about $600 million from December 31, 2011, primarily reflecting an increase in low-cost government loans to support advanced technology vehicle development and our renminbi-denominated debt issuance in Hong Kong.
Pension Plan Contributions and Strategy.
As part of our long-term strategy to de-risk our global funded pension plans, as described in our 2011 Form 10-K Report, we announced on April 27, 2012 that we will offer to about 90,000 eligible U.S. salaried retirees and U.S. salaried former employees (representing about one-third of our total U.S. pension obligation of $48.8 billion at December 31, 2011) the option to receive a lump-sum pension payment. If an individual elects to receive the lump-sum payment, our pension obligation to the individual will be settled. To our knowledge, this is the first time a voluntary program of this type and magnitude has been offered by a U.S. company for an ongoing pension plan. Payouts will start later this year, and will be funded from existing pension plan assets and not Automotive gross cash. This offer is in addition to the lump-sum pension payout option previously announced that will be available to future U.S. salaried retirees starting July 1, 2012. To the extent eligible individuals elect the option to receive a lump-sum pension payment, our pension obligations and balance sheet volatility will be reduced. The discount rates and actuarial assumptions used to calculate lump-sum payments under both programs will be determined according to federal regulations. We expect the discount rates to approximate those used to calculate our pension obligation for financial reporting purposes, and thus the reduction in our reported pension obligation should be relatively consistent with lump-sum payment amounts.
Liquidity Sufficiency
. One of the four key priorities of our One Ford plan is to finance our plan and strengthen our balance sheet, while at the same time having resources available to grow our business. The actions described above are consistent with this priority. Based on our planning assumptions, we believe that we have sufficient liquidity and capital resources to continue to invest in new products that customers want and value, grow our business, pay our debts and obligations as and when they come due, pay a sustainable dividend, and provide a cushion within an uncertain global economic environment. We will continue to look for opportunities to strengthen our balance sheet, primarily by working to ensure our underlying business generates positive Automotive operating-related cash flow, even as we continue to invest in the growth of our business.
63
Item 2. Management's Discussion and Analysis of Financial Condition and Results of Operations (Continued)
Financial Services Sector
Ford Credit
Funding Overview.
Ford Credit's funding strategy remains focused on diversification. Ford Credit continues to develop new products and platforms, and plans to continue accessing a variety of markets, channels, and investors. In the first quarter of 2012, Ford Credit launched an unsecured commercial paper program in the United States, and at March 31, 2012 had over $200 million outstanding. The program is unrated and is not supported by bank lines. Ford Credit's liquidity remains strong, and it maintains cash balances and committed capacity that meet its business and funding requirements in all global market conditions.
Ford Credit is on track to achieve its 2012 funding plan. Through May 3, 2012, it completed $10 billion of funding in the public markets, including over $3 billion of unsecured issuance and about $200 million issued under the Ford Credit U.S. Retail Notes program.
Ford Credit ended the quarter with about $18 billion of liquidity and about $33 billion of committed capacity, compared with about $17 billion of liquidity and $33 billion of committed capacity at December 31, 2011. It renewed about $2 billion of committed capacity in the first quarter.
At the end of the first quarter, managed receivables were $86 billion. Ford Credit ended the quarter with $12.3 billion in cash, and securitized funding was 54% of managed receivables.
Ford Credit is projecting 2012 year-end managed receivables in the range of $85 billion to $95 billion, and securitized funding is expected to represent about 49% to 54% of total managed receivables. The lower end of this range reflects in part FUEL Notes converting to unsecured debt. It is Ford Credit's expectation that securitized funding as a percent of managed receivables will decline going forward.
Public Term Funding Plan.
The following table illustrates Ford Credit's planned issuances for full-year 2012, and its public term funding issuances through May 3, 2012, and for full-years 2011 and 2010 (in billions):
|
Term Funding Plan
|
|||||||||||||
|
2012
|
|||||||||||||
|
Full-Year
Forecast
|
Through
May 3
|
Full-Year 2011
|
Full-Year 2010
|
||||||||||
|
Unsecured
|
$ 8-11
|
$
|
3
|
|
$
|
8
|
|
$
|
6
|
|
|||
|
Securitizations (a)
|
10-12
|
7
|
|
11
|
|
11
|
|
||||||
|
Total
|
$ 18-23
|
$
|
10
|
|
$
|
19
|
|
$
|
17
|
|
|||
__________
|
(a)
|
Includes Rule 144A offerings such as FUEL Notes issuance in 2011.
|
Through May 3, 2012, Ford Credit completed $10 billion of public term funding in the United States and Europe, including over $3 billion of unsecured debt. This reflects about half of its public term funding needs for the year.
For 2012, Ford Credit projects full-year public term funding in the range of $18 billion to $23 billion, consisting of $8 billion to $11 billion of unsecured debt and $10 billion to $12 billion of public securitizations.
64
Item 2. Management's Discussion and Analysis of Financial Condition and Results of Operations (Continued)
Liquidity.
The following table illustrates Ford Credit's liquidity programs and utilization (in billions):
|
March 31,
2012 |
December 31,
2011 |
||||||
|
Liquidity Sources (a)
|
|||||||
|
Cash (b)
|
$
|
12.3
|
|
$
|
12.1
|
|
|
|
Unsecured Credit Facilities
|
0.7
|
|
0.7
|
|
|||
|
FCAR Bank Lines
|
7.3
|
|
7.9
|
|
|||
|
Conduit / Bank Asset-Backed Securitizations ("ABS")
|
24.5
|
|
24.0
|
|
|||
|
Total Liquidity Sources
|
$
|
44.8
|
|
$
|
44.7
|
|
|
|
Utilization of Liquidity
|
|
|
|
|
|||
|
Securitization Cash (c)
|
$
|
(4.1
|
)
|
$
|
(3.7
|
)
|
|
|
Unsecured Credit Facilities
|
(0.2
|
)
|
(0.2
|
)
|
|||
|
FCAR Bank Lines
|
(6.7
|
)
|
(6.8
|
)
|
|||
|
Conduit / Bank ABS
|
(11.3
|
)
|
(14.5
|
)
|
|||
|
Total Utilization of Liquidity
|
(22.3
|
)
|
(25.2
|
)
|
|||
|
Gross Liquidity
|
22.5
|
|
19.5
|
|
|||
|
Capacity in Excess of Eligible Receivables
|
(4.4
|
)
|
(2.4
|
)
|
|||
|
Liquidity Available For Use
|
$
|
18.1
|
|
$
|
17.1
|
|
|
__________
|
(a)
|
FCAR and conduits subject to availability of sufficient assets and ability to obtain derivatives to manage interest rate risk; FCAR commercial paper must be supported by bank lines equal to at least 100% of the principal amount; conduits include committed securitization programs.
|
|
(b)
|
Cash, cash equivalents, and marketable securities (excludes marketable securities related to insurance activities).
|
|
(c)
|
Securitization cash is to be used only to support on-balance sheet securitization transactions.
|
At March 31, 2012 Ford Credit had $44.8 billion of committed capacity and cash diversified across a variety of markets and platforms. During the quarter, the increase to conduit and bank ABS capacity largely offset the reduction in FCAR bank lines. The utilization of its liquidity totaled $22.3 billion at quarter-end. The reduction in utilization during the quarter was primarily attributable to higher public funding. Ford Credit ended the quarter with gross liquidity of $22.5 billion, which includes about $4.4 billion in capacity in excess of eligible receivables, providing a funding source for future originations and flexibility to transfer capacity among markets and asset classes where most needed.
Liquidity available for use remained strong at $18.1 billion at the end of the quarter, compared with $17.1 billion at year end.
Cash, Cash Equivalents, and Marketable Securities.
At March 31, 2012, Ford Credit's cash, cash equivalents, and marketable securities (excluding marketable securities related to insurance activities) totaled $12.3 billion, compared with $12.1 billion at year-end 2011. In the normal course of its funding activities, Ford Credit may generate more proceeds than are required for its immediate funding needs. These excess amounts are maintained primarily as highly liquid investments, which provide liquidity for its short-term funding needs and give it flexibility in the use of its other funding programs. Ford Credit's cash, cash equivalents, and marketable securities are held primarily in highly liquid investments, which provide for anticipated and unanticipated cash needs. Ford Credit's cash, cash equivalents, and marketable securities (excluding marketable securities related to insurance activities) primarily include U.S. Department of Treasury obligations, federal agency securities, bank time deposits with investment-grade institutions and non-U.S. central banks, corporate investment-grade securities, commercial paper rated A-1/P-1 or higher, debt obligations of a select group of non-U.S. governments, non-U.S. government agencies, supranational institutions and money market funds that carry the highest possible ratings. Ford Credit currently does not hold cash, cash equivalents, or marketable securities consisting of investments in government obligations of Greece, Ireland, Italy, Portugal, or Spain, nor did it hold any at March 31, 2012. The average maturity of these investments ranges from 90 days to up to one year, and is adjusted based on market conditions and liquidity needs. Ford Credit monitors its cash levels and average maturity on a daily basis. Cash, cash equivalents, and marketable securities include amounts to be used only to support Ford Credit's securitization transactions of $4.1 billion and $3.7 billion at March 31, 2012 and December 31, 2011, respectively.
65
Item 2. Management's Discussion and Analysis of Financial Condition and Results of Operations (Continued)
Ford Credit's substantial liquidity and cash balance have provided the opportunity to selectively call and repurchase its unsecured debt on the open market. In the first quarter of 2012, Ford Credit repurchased about $50 million of its unsecured debt.
Committed Liquidity Programs.
Ford Credit and its subsidiaries, including FCE, have entered into agreements with a number of bank-sponsored asset-backed commercial paper conduits ("conduits") and other financial institutions. Such counterparties are contractually committed, at Ford Credit's option, to purchase from it eligible retail or wholesale assets or to purchase or make advances under asset-backed securities backed by retail, lease, or wholesale assets for proceeds of up to $24.5 billion at March 31, 2012 ($12.9 billion retail, $8.2 billion wholesale, and $3.4 billion lease assets), of which about $7.2 billion are commitments to FCE. These committed liquidity programs have varying maturity dates, with $22.4 billion having maturities within the next twelve months (of which $6.4 billion relates to FCE commitments), and the remaining balance having maturities between May 2013 and August 2014. Ford Credit plans to achieve capacity renewals to protect its global funding needs, optimize capacity utilization and maintain sufficient liquidity.
Ford Credit's ability to obtain funding under these programs is subject to having a sufficient amount of assets eligible for these programs as well as its ability to obtain interest rate hedging arrangements for certain securitization transactions. Ford Credit's capacity in excess of eligible receivables protects it against the risk of lower than planned renewal rates. At March 31, 2012, $11.3 billion of these commitments were in use. These programs are free of material adverse change clauses, restrictive financial covenants (for example, debt-to-equity limitations and minimum net worth requirements), and generally, credit rating triggers that could limit its ability to obtain funding. However, the unused portion of these commitments may be terminated if the performance of the underlying assets deteriorates beyond specified levels. Based on Ford Credit's experience and knowledge as servicer of the related assets, it does not expect any of these programs to be terminated due to such events.
Credit Facilities.
At March 31, 2012, Ford Credit and its majority-owned subsidiaries had $736 million of contractually-committed unsecured credit facilities with financial institutions, including FCE's £440 million (equivalent to $705 million at March 31, 2012) credit facility (the "FCE Credit Agreement") which matures in 2014. During the fourth quarter of 2011, FCE drew £125 million (equivalent to about $200 million) as part of its plans for periodic usage of the facility, and at March 21, 2012, FCE had £315 million (equivalent to about $505 million) available for use. The FCE Credit Agreement contains certain covenants, including an obligation for FCE to maintain its ratio of regulatory capital to risk weighted assets at no less than the applicable regulatory minimum, and for the support agreement between FCE and Ford Credit to remain in full force and effect (and enforced by FCE to ensure that its net worth is maintained at no less than $500 million). In addition to customary payment, representation, bankruptcy, and judgment defaults, the FCE Credit Agreement contains cross-payment and cross-acceleration defaults with respect to other debt.
At March 31, 2012, FCE had £55 million (equivalent to about $88 million) of commitments from financial institutions in Italy and Spain. There were no commitments from financial institutions in Greece, Ireland, or Portugal.
In addition, at March 31, 2012, Ford Credit had about $7.3 billion of contractually-committed liquidity facilities provided by banks to support its FCAR program, of which $4.2 billion expire in 2012 and $3.1 billion expire in 2014. Utilization of these facilities is subject to conditions specific to the FCAR program and Ford Credit having a sufficient amount of eligible retail assets for securitization. The FCAR program must be supported by liquidity facilities equal to at least 100% of its outstanding balance. At March 31, 2012, $7.3 billion of FCAR's bank liquidity facilities were available to support FCAR's asset-backed commercial paper, subordinated debt, or FCAR's purchase of its asset-backed securities. At March 31, 2012, the outstanding commercial paper balance for the FCAR program was $6.7 billion.
66
Item 2. Management's Discussion and Analysis of Financial Condition and Results of Operations (Continued)
Leverage.
Ford Credit uses leverage, or the debt-to-equity ratio, to make various business decisions, including evaluating and establishing pricing for retail, wholesale, and lease financing, and assessing its capital structure. Ford Credit refers to its shareholder's interest as equity.
The following table shows the calculation of Ford Credit's financial statement leverage (in billions, except for ratios):
|
March 31,
2012 |
December 31,
2011 |
||||||
|
Total debt
|
$
|
85.2
|
|
$
|
84.7
|
|
|
|
Equity
|
9.2
|
|
8.9
|
|
|||
|
Financial statement leverage (to 1)
|
9.3
|
|
9.5
|
|
|||
The following table shows the calculation of Ford Credit's managed leverage (in billions, except for ratios):
|
March 31,
2012 |
December 31,
2011 |
||||||
|
Total debt
|
$
|
85.2
|
|
$
|
84.7
|
|
|
|
Adjustments for cash, cash equivalents, and marketable securities (a)
|
(12.3
|
)
|
(12.1
|
)
|
|||
|
Adjustments for derivative accounting (b)
|
(0.6
|
)
|
(0.7
|
)
|
|||
|
Total adjusted debt
|
$
|
72.3
|
|
$
|
71.9
|
|
|
|
Equity
|
$
|
9.2
|
|
$
|
8.9
|
|
|
|
Adjustments for derivative accounting (b)
|
(0.3
|
)
|
(0.2
|
)
|
|||
|
Total adjusted equity
|
$
|
8.9
|
|
$
|
8.7
|
|
|
|
Managed leverage (to 1) (c)
|
8.1
|
|
8.3
|
|
|||
__________
|
(a)
|
Excludes marketable securities related to insurance activities.
|
|
(b)
|
Primarily related to market valuation adjustments to derivatives due to movements in interest rates. Adjustments to debt are related to designated fair value hedges and adjustments to equity are related to retained earnings.
|
|
(c)
|
Equals total adjusted debt over total adjusted equity.
|
Ford Credit plans its managed leverage by considering prevailing market conditions and the risk characteristics of its business. At March 31, 2012, Ford Credit's managed leverage was 8.1 to 1 compared with 8.3 to 1 at December 31, 2011, significantly below the threshold of 11.5 to 1 set forth in the Amended and Restated Support Agreement with us. In the first quarter of 2012, Ford Credit paid $200 million in distributions to its parent.
67
Item 2. Management's Discussion and Analysis of Financial Condition and Results of Operations (Continued)
Total Company
Equity/(Deficit).
At
March 31, 2012
,
Total equity/(deficit) attributable to Ford Motor Company
was $16.6 billion, an improvement of $1.6 billion compared with December 31, 2011. The improvement is more than explained by favorable changes in
Retained earnings
, primarily related to first quarter 2012 net income attributable to Ford of $1.4 billion, offset partially by cash dividends declared of $191 million, and favorable changes in
Accumulated other comprehensive income/(loss)
,
more than explained by currency translation of $523 million.
Credit Ratings.
Our short-term and long-term debt is rated by four credit rating agencies designated as NRSROs by the U.S. Securities and Exchange Commission:
|
•
|
DBRS Limited ("DBRS");
|
|
•
|
Fitch, Inc. ("Fitch");
|
|
•
|
Moody's Investors Service, Inc. ("Moody's"); and
|
|
•
|
Standard & Poor's Ratings Services, a division of The McGraw-Hill Companies, Inc. ("S&P").
|
In several markets, locally-recognized rating agencies also rate us. A credit rating reflects an assessment by the rating agency of the credit risk associated with a corporate entity or particular securities issued by that entity. Rating agencies' ratings of us are based on information provided by us and other sources. Credit ratings are not recommendations to buy, sell, or hold securities, and are subject to revision or withdrawal at any time by the assigning rating agency. Each rating agency may have different criteria for evaluating company risk and, therefore, ratings should be evaluated independently for each rating agency. Lower credit ratings generally result in higher borrowing costs and reduced access to capital markets.
The following ratings actions have been taken by these NRSROs since the filing of our 2011 Form 10-K Report:
|
•
|
On April 24, 2012, Fitch upgraded Ford's issuer rating and long-term senior unsecured debt to BBB- from BB+. Fitch also upgraded Ford Credit's issuer rating and long-term senior unsecured rating to BBB- from BB+. The outlook is stable.
|
The following chart summarizes certain of the credit ratings and outlook presently assigned by these four NRSROs:
|
|
NRSRO RATINGS
|
||||||||||||
|
|
Ford
|
Ford Credit
|
|||||||||||
|
|
Issuer Default/
Corporate/
Issuer Rating
|
Long-Term
Senior
Unsecured
|
Senior
Secured
|
Outlook /
Trend
|
Long-Term
Senior
Unsecured
|
Short-Term
Unsecured
|
Outlook /
Trend
|
||||||
|
DBRS
|
BB
|
B (high)
|
BBB (low)
|
Stable
|
BB (high)
|
R-4
|
Stable
|
||||||
|
Fitch
|
BBB-
|
BBB-
|
BBB-
|
Stable
|
BBB-
|
F3
|
Stable
|
||||||
|
Moody's
|
Ba1
|
Ba2
|
Baa2
|
Positive
|
Ba1
|
NP
|
Positive
|
||||||
|
S&P
|
BB+
|
BB+
|
BBB
|
Stable
|
BB+ *
|
NR
|
Stable
|
||||||
__________
|
*
|
S&P assigns FCE a long-term senior unsecured rating of BBB-, maintaining a one notch differential versus Ford Credit.
|
OUTLOOK
We are encouraged by our strong progress, and believe that our One Ford plan - to aggressively restructure our business to operate profitably, accelerate development of new products customers want and value, finance our plan and strengthen our balance sheet, and work together effectively as one team leveraging our global assets - provides the right strategy to achieve our objectives.
Our projected vehicle production is as follows (in thousands):
|
|
Second Quarter 2012 (a)
|
||||
|
|
Planned Vehicle Unit Production
|
Over/(Under) Second Quarter 2011
|
|||
|
Ford North America
|
730
|
|
20
|
|
|
|
Ford South America
|
115
|
|
(15
|
)
|
|
|
Ford Europe
|
370
|
|
(65
|
)
|
|
|
Ford Asia Pacific Africa
|
260
|
|
36
|
|
|
|
Total
|
1,475
|
|
(24
|
)
|
|
__________
(a) Includes production of Ford and JMC brand vehicles to be sold by our unconsolidated affiliates.
68
Item 2. Management's Discussion and Analysis of Financial Condition and Results of Operations (Continued)
The year-over-year decline in planned production is more than explained by lower industry demand in Europe. Our planned production level is consistent with our disciplined strategy to match production with consumer demand.
We expect global economic growth to continue at a pace of about 3% during 2012. Economic growth in the United States is expected to be in the range of 2% to 3% for the year. In Europe, we expect weak conditions, with some markets doing better than others as fiscal austerity programs are implemented. Several major emerging markets, including China, Brazil, India, Indonesia, and Thailand are now in cycles of fiscal policy easing to support economic growth. We expect commodity prices to increase modestly in 2012 and continue to increase longer term given global demand growth.
Given the prospect for global economic growth, supported by solid income growth and policy easing in emerging markets and improving U.S. fundamentals, we expect global automotive industry sales to total about 80 million units in 2012, compared with about 76 million units in 2011. In light of the dynamic external environment, however, 2012 industry sales volume could range between 75 million units and 85 million units.
Within the current economic environment, our planning assumptions and key metrics for 2012 include the following:
|
Memo:
First Quarter 2012
|
2012 Full-Year Plan
|
2012 Full-Year Outlook
|
|||
|
Industry Volume (million units) (a)
|
|||||
|
–United States
|
14.9
|
13.5 – 14.5
|
14.5 – 15.0
|
||
|
–Europe (b)
|
14.1
|
14.0 – 15.0
|
About 14
|
||
|
Operational Metrics
|
|
|
|||
|
Compared with prior year:
|
|
|
|||
|
–U.S. Market Share
|
15.2%
|
About Equal (compared with 16.5%)
|
Lower
|
||
|
–Europe Market Share (b)
|
8.5%
|
About Equal (compared with 8.3%)
|
On Track
|
||
|
–Quality
|
Mixed
|
Improve
|
Mixed
|
||
|
Financial Metrics
|
|
|
|||
|
Compared with prior year:
|
|
|
|||
|
–Automotive Pre-Tax Operating Profit (c)
|
$1.8 Billion
|
Higher (compared with $6.3 Billion)
|
On Track
|
||
|
–Ford Credit Pre-Tax Operating Profit
|
$0.5 Billion
|
Lower (compared with $2.4 Billion)
|
On Track
|
||
|
–Total Company Pre-Tax Operating Profit (c)
|
$2.3 Billion
|
About Equal (compared with $8.8 Billion)
|
On Track
|
||
|
–Automotive Structural Cost Increase (d)
|
$0.3 Billion
|
Less than $2 Billion
|
On Track
|
||
|
–Automotive Operating Margin (c)
|
6.4%
|
Improve (compared with 5.4%)
|
On Track
|
||
|
Absolute amount:
|
|
|
|||
|
–Capital Spending
|
$1.1 Billion
|
$5.5 Billion – $6 Billion
|
On Track
|
||
__________
|
(a)
|
Includes medium and heavy trucks; seasonally-adjusted annual rate.
|
|
(b)
|
For the 19 markets we track.
|
|
(c)
|
Excludes special items; Automotive operating margin equal to Automotive pre-tax results excluding Other Automotive divided by Automotive revenue.
|
|
(d)
|
Structural cost changes are measured primarily at present-year exchange, and exclude special items and discontinued operations.
|
We expect full-year 2012 industry volume to range from 14.5 million units to 15 million units in the United States, and to be about 14 million units for the 19 markets we track in Europe. We now expect full-year U.S. market share to be lower than 2011, as our planned capacity increases will lag demand; share for the markets we track in Europe should be about the same as 2011. Our outlook for quality is mixed as we now expect performance in the United States to be about the same as a year ago; the other regions are expected to improve.
Compared with 2011, we expect the following 2012 financial performance, excluding special items:
|
•
|
Automotive pre-tax operating profit to improve
|
|
•
|
Ford Credit to be solidly profitable, earning pre-tax operating profit of about $1.5 billion
|
|
•
|
Total Company pre-tax operating profit to be about equal
|
|
•
|
Automotive structural costs to increase by less than $2 billion, as we continue investing to support higher volumes, new product launches, and growth plans
|
|
•
|
Automotive operating margin to improve
|
We expect capital spending to be in the range of $5.5 billion to $6 billion as we continue to invest in our business. We also expect a non-material increase in our commodity costs (including hedging effects) in 2012 compared with 2011. We now expect net interest expense in 2012 to be slightly higher than 2011, primarily reflecting lower interest income.
69
Item 2. Management's Discussion and Analysis of Financial Condition and Results of Operations (Continued)
The external environment is looking somewhat better in North America, and remains encouraging for many emerging markets. Europe, in contrast, is challenging, and there are issues to address in South America. As discussed in "Results of Operations" above, we expect Ford North America to achieve significantly higher full-year pre-tax profit and operating margin compared with 2011, which will be the key enabler for the Company to achieve pre-tax operating profit for 2012 about equal to 2011. To support growing consumer demand, starting in the second quarter of this year Ford North America is taking actions to add approximately 400,000 units of annual incremental production capacity, the benefit of which primarily will impact our results beginning in the second half of this year.
We continue to expect Ford South America to generate solid profitability for full-year 2012, although lower than 2011. Ford South America is launching new global products in 2012, primarily positively affecting results in the second half of the year. We currently face some uncertainty in South America, including a new trade agreement between Brazil and Mexico limiting vehicle imports into Brazil, the details and impact of which we are still reviewing.
We continue to expect Ford Europe to incur a full-year loss in 2012 in the range of $500 million - $600 million. Our European operations will benefit from the launch of new products, in addition to completion of dealer stock reduction actions and continued cost reductions; these actions will positively affect results primarily in the second half of the year.
Despite a first quarter loss, we continue to expect Ford Asia Pacific Africa to be profitable for the full year, with increasing volumes as the launch of the Ranger pickup truck progresses, new production capacity comes on line in China and Thailand, and other new product launches occur in the balance of the year.
Consistent with prior guidance, Ford Credit expects full-year 2012 to be solidly profitable but at a lower level than 2011, primarily reflecting fewer lease terminations, which result in fewer vehicles sold at a gain, lower financing margin, and lower credit loss reserve reductions. Ford Credit projects full-year pre-tax operating profit of about $1.5 billion. At year-end 2012, Ford Credit anticipates managed receivables to be in the range of $85 billion to $95 billion. In addition, Ford Credit expects to pay total distributions between
$500 million and $1 billion, subject to available liquidity and managed leverage objectives.
Overall, we are on track to deliver full-year total Company pre-tax operating profit about equal to 2011, and strong Automotive operating-related cash flow. Our first quarter was a good start, and we expect to deliver solid financial performance this year, consistent with the glidepath to our mid-decade goals. In contrast to the past couple of years, we expect our total Company pre-tax operating profit for the second half of the year to be slightly higher than the first half, due to the cadence of our many product launches and actions to increase production capacity.
Looking ahead, we face both challenges and opportunities as we proceed on the path toward our mid-decade goals. One key opportunity is to accelerate the realization of the full potential of the global scale and operating margin benefits inherent in our One Ford plan. We also are focused on: sustaining and improving our already very strong operation in North America; strengthening and growing our profitable South American operation in the face of increasing competition and trade and other regional issues; responding to the near-term environment in Europe, while working to deliver sustainable and appropriate returns in this very important market through continued investment in great products, strengthening our brand, and improving our cost structure; executing our growth and profit plan for Asia Pacific Africa, including the launch of eight plants over the next several years that will support volume representing about one-third of our global sales by the end of the decade (compared to about 15% currently); and continuing the strong performance of our strategic asset, Ford Credit.
We will continue strengthening the Ford brand around the world and the journey of making Lincoln a world-class luxury brand. We remain focused on our One Ford plan, and we are committed to delivering great products while investing for global growth, building a strong business, and providing profitable growth for all of our stakeholders.
70
Item 2. Management's Discussion and Analysis of Financial Condition and Results of Operations (Continued)
Risk Factors
Statements included or incorporated by reference herein may constitute "forward-looking statements" within the meaning of the Private Securities Litigation Reform Act of 1995. Forward-looking statements are based on expectations, forecasts, and assumptions by our management and involve a number of risks, uncertainties, and other factors that could cause actual results to differ materially from those stated, including, without limitation:
|
•
|
Decline in industry sales volume, particularly in the United States or Europe, due to financial crisis, recession, geopolitical events, or other factors;
|
|
•
|
Decline in market share or failure to achieve growth;
|
|
•
|
Lower-than-anticipated market acceptance of new or existing products;
|
|
•
|
Market shift away from sales of larger, more profitable vehicles beyond our current planning assumption, particularly in the United States;
|
|
•
|
An increase in fuel prices, continued volatility of fuel prices, or reduced availability of fuel;
|
|
•
|
Continued or increased price competition resulting from industry excess capacity, currency fluctuations, or other factors;
|
|
•
|
Fluctuations in foreign currency exchange rates, commodity prices, and interest rates;
|
|
•
|
Adverse effects on our operations resulting from economic, geopolitical, or other events;
|
|
•
|
Economic distress of suppliers that may require us to provide substantial financial support or take other measures to ensure supplies of components or materials and could increase our costs, affect our liquidity, or cause production constraints or disruptions;
|
|
•
|
Work stoppages at Ford or supplier facilities or other limitations on production (whether as a result of labor disputes, natural or man-made disasters, tight credit markets or other financial distress, information technology issues, production constraints or difficulties, or other factors);
|
|
•
|
Single-source supply of components or materials;
|
|
•
|
Labor or other constraints on our ability to maintain competitive cost structure;
|
|
•
|
Substantial pension and postretirement health care and life insurance liabilities impairing our liquidity or financial condition;
|
|
•
|
Worse-than-assumed economic and demographic experience for our postretirement benefit plans (e.g., discount rates or investment returns);
|
|
•
|
Restriction on use of tax attributes from tax law "ownership change;"
|
|
•
|
The discovery of defects in vehicles resulting in delays in new model launches, recall campaigns, reputational damage, or increased warranty costs;
|
|
•
|
Increased safety, emissions, fuel economy, or other regulations resulting in higher costs, cash expenditures, and/or sales restrictions;
|
|
•
|
Unusual or significant litigation, governmental investigations or adverse publicity arising out of alleged defects in our products, perceived environmental impacts, or otherwise;
|
|
•
|
A change in our requirements where we have long-term supply arrangements committing us to purchase minimum or fixed quantities of certain parts, or to pay a minimum amount to the seller ("take-or-pay" contracts);
|
|
•
|
Adverse effects on our results from a decrease in or cessation or clawback of government incentives related to investments;
|
|
•
|
Inherent limitations of internal controls impacting financial statements and safeguarding of assets;
|
|
•
|
Cybersecurity risks to operational systems, security systems, or infrastructure owned by us or a third-party vendor, or at a supplier facility;
|
|
•
|
Failure of financial institutions to fulfill commitments under committed credit facilities;
|
|
•
|
Inability of Ford Credit to access debt, securitization, or derivative markets around the world at competitive rates or in sufficient amounts, due to credit rating downgrades, market volatility, market disruption, regulatory requirements, or other factors;
|
|
•
|
Higher-than-expected credit losses, lower-than-anticipated residual values or higher-than-expected return volumes for leased vehicles;
|
|
•
|
Increased competition from banks or other financial institutions seeking to increase their share of financing Ford vehicles; and
|
|
•
|
New or increased credit, consumer, or data protection or other regulations resulting in higher costs and/or additional financing restrictions.
|
We cannot be certain that any expectation, forecast, or assumption made in preparing forward-looking statements will prove accurate, or that any projection will be realized. It is to be expected that there may be differences between projected and actual results. Our forward-looking statements speak only as of the date of their initial issuance, and we do not undertake any obligation to update or revise publicly any forward-looking statement, whether as a result of new information, future events or otherwise. For additional discussion of these risks, see "Item 1A. Risk Factors" in our 2011 Form 10-K Report.
71
ACCOUNTING STANDARDS ISSUED BUT NOT YET ADOPTED
For information on accounting standards issued but not yet adopted, see Note 2 of the Notes to the Financial Statements.
OTHER FINANCIAL INFORMATION
The interim financial information included in this Quarterly Report on Form 10-Q for the periods ended
March 31, 2012
and
2011
has not been audited by PricewaterhouseCoopers LLP ("PricewaterhouseCoopers"). In reviewing such information, PricewaterhouseCoopers has applied limited procedures in accordance with professional standards for reviews of interim financial information. Readers should restrict reliance on PricewaterhouseCoopers' reports on such information accordingly. PricewaterhouseCoopers is not subject to the liability provisions of Section 11 of the Securities Act of 1933 for its reports on interim financial information, because such reports do not constitute "reports" or "parts" of registration statements prepared or certified by PricewaterhouseCoopers within the meaning of Sections 7 and 11 of the Securities Act of 1933.
ITEM 3.
Quantitative and Qualitative Disclosures About Market Risk
Automotive Sector
Foreign Currency Risk.
The net fair value of foreign exchange forward contracts (including adjustments for credit risk) as of March 31, 2012 was a liability of $322 million compared to a liability of $236 million as of December 31, 2011. The potential decrease in fair value from a 10% adverse change in the underlying exchange rates, in U.S. dollar terms, would be about $1.8 billion at March 31, 2012, compared with a decrease of about $1.7 billion as of December 31, 2011.
Commodity Price Risk.
The net fair value of commodity forward contracts (including adjustments for credit risk) as of March 31, 2012 was a liability of $212 million, compared to a liability of $370 million as of December 31, 2011. The potential decrease in fair value from a 10% adverse change in the underlying commodity prices, in U.S. dollar terms, would be about $217 million at March 31, 2012, compared with a decrease of about $203 million at December 31, 2011.
Financial Services Sector
Interest Rate Risk.
To provide a quantitative measure of the sensitivity of Ford Credit's pre-tax cash flow to changes in interest rates, Ford Credit uses interest rate scenarios that assume a hypothetical, instantaneous increase or decrease of one percentage point in all interest rates across all maturities (a "parallel shift"), as well as a base case that assumes that all interest rates remain constant at existing levels. These interest rate scenarios are purely hypothetical and do not represent Ford Credit's view of future interest rate movements. The differences in pre-tax cash flow between these scenarios and the base case over a twelve-month period represent an estimate of the sensitivity of Ford Credit's pre-tax cash flow. Under this model, Ford Credit estimates that at March 31, 2012, all else constant, such an increase in interest rates would increase pre-tax cash flow by $78 million over the next twelve months, compared with an increase of $60 million at December 31, 2011. The sensitivity analysis presented above assumes a one-percentage point interest rate change to the yield curve that is both instantaneous and parallel. In reality, interest rate changes are rarely instantaneous or parallel and rates could move more or less than the one percentage point assumed in Ford Credit's analysis. As a result, the actual impact to pre-tax cash flow could be higher or lower than the results detailed above.
ITEM 4.
Controls and Procedures
Evaluation of Disclosure Controls and Procedures.
Alan Mulally, our Chief Executive Officer ("CEO"), and Bob Shanks, our Chief Financial Officer ("CFO"), have performed an evaluation of the Company's disclosure controls and procedures, as that term is defined in Rule 13a-15(e) of the Securities Exchange Act of 1934, as amended ("Exchange Act"), as of
March 31, 2012
, and each has concluded that such disclosure controls and procedures are effective to ensure that information required to be disclosed in our periodic reports filed under the Exchange Act is recorded, processed, summarized and reported within the time periods specified by SEC rules and forms, and that such information is accumulated and communicated to the CEO and CFO to allow timely decisions regarding required disclosures.
Changes in Internal Control over Financial Reporting.
Lewis Booth, Executive Vice President and CFO, retired effective April 1, 2012. He was succeeded by Bob Shanks, formerly our Vice President and Controller.
72
ITEM 1.
Legal Proceedings
CLASS ACTIONS
Canadian Export Antitrust Class Actions (as previously reported on page 26 of our 2011 Form 10-K Report).
As previously disclosed, eighty-three purported class actions have been filed in various state and federal courts against numerous defendants, including Ford, on behalf of all purchasers of new motor vehicles in the United States since January 1, 2001. The complaints allege, among other things, that vehicle manufacturers, aided by dealer associations, conspired to prevent the sale to U.S. citizens of vehicles produced for the Canadian market and sold by dealers in Canada at lower prices than vehicles sold in the United States. The complaints seek injunctive relief under federal antitrust law and treble damages under federal and state antitrust laws. The federal actions were consolidated for coordinated pretrial proceedings in the U.S. District Court for the District of Maine and have been dismissed. Cases remain pending in state courts in Florida, New Mexico, Tennessee, and Wisconsin. In California, where a statewide class had been certified, the court granted our motion for summary judgment; plaintiffs have now filed an appeal of the dismissal.
Medium/Heavy Truck Sales Procedure Class Action (as previously reported on page 27 of our 2011 Form 10-K Report).
This action pending in the Ohio state court system alleges that we breached our Sales and Service Agreement with Ford truck dealers by failing to publish to all Ford dealers all price concessions that were approved for any dealer. As previously reported, the trial court certified a nationwide class consisting of all Ford dealers who purchased from Ford any 600-series or higher truck from 1987 to 1997, and granted plaintiffs' motion for summary judgment on liability. In February 2011, the jury awarded $4.5 million in damages to the named plaintiff dealer. In June 2011, the trial court applied the jury's findings with regard to the named plaintiff to all dealers in the class, entering a judgment of approximately $2 billion in damages (comprised of about $800 million in damages, and $1.2 billion in pre-judgment interest). The trial court also denied our motion to decertify the class.
We appealed, and on May 3, 2012, the Ohio Court of Appeals reversed the trial court's grant of summary judgment to plaintiffs, vacated the damages award, and remanded the matter for a new trial. Plaintiffs may request review by the state supreme court.
ITEM 2.
Unregistered Sales of Equity Securities and Use of Proceeds
We commenced a modest anti-dilutive share repurchase program during the first quarter of 2012 with the purchase of $27 million of Common Stock pursuant to our publicly-announced plan, which authorizes repurchase of an amount up to an estimated $150 million to offset the dilutive effect of share-based compensation. During the first quarter of
2012
, we repurchased shares of Ford Common Stock as follows:
|
Period
|
Total Number
of Shares
Purchased
|
Average
Price Paid
per Share
|
Total Number
of Shares
Purchased as
Part of Publicly-
Announced
Plans or
Programs
|
Maximum Number
(or Approximate
Dollar Value) of
Shares that May Yet
Be Purchased Under
the Plans or
Programs
|
|||||||||
|
January 1, 2012 through January 31, 2012
|
—
|
|
$
|
—
|
|
—
|
|
$150 million
|
|
||||
|
February 1, 2012 through February 29, 2012
|
415,000
|
|
12.31
|
|
415,000
|
|
$145 million
|
|
|||||
|
March 1, 2012 through March 31, 2012
|
1,734,235
|
|
(a)
|
12.56
|
|
1,720,000
|
|
$123 million
|
|
||||
|
Total/Average
|
2,149,235
|
|
$
|
12.51
|
|
2,135,000
|
|
—
|
|
||||
__________
|
(a)
|
Includes 14,235 shares that were acquired from our employees or directors in accordance with our various compensation plans as a result of share withholdings to pay: (i) income tax related to the lapse of restrictions on restricted stock or the issuance of unrestricted stock; and (ii) the exercise price and related income taxes with respect to certain exercises of stock options.
|
ITEM 6.
Exhibits.
Please see exhibit index below.
73
SIGNATURE
Pursuant to the requirements of Section 13 or 15(d) of the Securities Exchange Act of 1934, as amended, Ford has duly caused this Report to be signed on its behalf by the undersigned, thereunto duly authorized.
FORD MOTOR COMPANY
|
By:
|
/s/ Stuart Rowley
|
|
|
Stuart Rowley, Vice President and Controller
|
|
|
(chief accounting officer)
|
|
|
|
|
Date:
|
May 4, 2012
|
74
EXHIBIT INDEX
|
Designation
|
|
Description
|
|
Method of Filing
|
|
Exhibit 10.1
|
Seventh Amendment dated March 15, 2012 to the Credit Agreement dated December 15, 2006 as amended and restated as of November 24, 2009.
|
Incorporated by reference from Current Report on Form 8-K dated March 15, 2012.
|
||
|
Exhibit 10.2
|
Amended and Restated Annual Incentive Compensation Plan Metrics for 2012.
|
Filed with this Report.*
|
||
|
Exhibit 12
|
|
Calculation of Ratio of Earnings to Combined Fixed Charges.
|
|
Filed with this Report.
|
|
Exhibit 15
|
|
Letter from PricewaterhouseCoopers LLP dated May 4, 2012 relating to financial information.
|
|
Filed with this Report.
|
|
Exhibit 31.1
|
|
Rule 15d-14(a) Certification of CEO.
|
|
Filed with this Report.
|
|
Exhibit 31.2
|
|
Rule 15d-14(a) Certification of CFO.
|
|
Filed with this Report.
|
|
Exhibit 32.1
|
|
Section 1350 Certification of CEO.
|
|
Furnished with this Report.
|
|
Exhibit 32.2
|
|
Section 1350 Certification of CFO.
|
|
Furnished with this Report.
|
|
Exhibit 101.INS
|
|
XBRL Instance Document.
|
|
**
|
|
Exhibit 101.SCH
|
|
XBRL Taxonomy Extension Schema Document.
|
|
**
|
|
Exhibit 101.CAL
|
|
XBRL Taxonomy Extension Calculation Linkbase Document.
|
|
**
|
|
Exhibit 101.LAB
|
|
XBRL Taxonomy Extension Label Linkbase Document.
|
|
**
|
|
Exhibit 101.PRE
|
|
XBRL Taxonomy Extension Presentation Linkbase Document.
|
|
**
|
|
Exhibit 101.DEF
|
|
XBRL Taxonomy Extension Definition Linkbase Document.
|
|
**
|
__________
* Management contract or compensatory plan or arrangement.
** Submitted electronically with this Report in accordance with the provisions of Regulation S-T.
75
TABLE OF CONTENTS
Part I. Financial InformationItem 1. Financial StatementsItem 1. Financial Statements (continued)Item 1. Financial Statements (continued) Ford Motor Company and Subsidiariesnotes To The Financial StatementsNote 1. PresentationNote 1. Presentation (continued)Note 2. Accounting Standards Issued But Not Yet AdoptedNote 3. Fair Value MeasurementsNote 3. Fair Value Measurements (continued)Note 4. Restricted CashNote 5. Finance ReceivablesNote 5. Finance Receivables (continued)Note 6. Allowance For Credit LossesNote 6. Allowance For Credit Losses (continued)Note 7. InventoriesNote 8. Variable Interest EntitiesNote 8. Variable Interest Entities (continued)Note 9. Accrued Liabilities and Deferred RevenueNote 10. Retirement BenefitsNote 11. Debt and CommitmentsNote 12. Derivative Financial Instruments and Hedging ActivitiesNote 12. Derivative Financial Instruments and Hedging Activities (continued)Note 13. Accumulated Other Comprehensive Income/(loss)Note 14. Other Income/(loss)Note 15. Income TaxesNote 16. Amounts Per Share Attributable To Ford Motor Company Common and Class B StockNote 16. Amounts Per Share Attributable To Ford Motor Company Common and Class B Stock (continued)Note 17. Segment InformationNote 18. Commitments and ContingenciesNote 18. Commitments and Contingencies (continued)Item 2. Management's Discussion and Analysis Of Financial Condition and Results Of OperationsItem 2. Management's Discussion and Analysis Of Financial Condition and Results Of Operations (continued)Item 3. Quantitative and Qualitative Disclosures About Market RiskItem 4. Controls and ProceduresPart II. Other InformationItem 1. Legal ProceedingsItem 2. Unregistered Sales Of Equity Securities and Use Of ProceedsItem 6. Exhibits