FORD MOTOR CO
10-Ks and 10-Qs
|
|
|
|
|
|
|
|
|
|
|
|
|
|
|
|
|
|
|
|
|
|
|
|
|
|
|
|
|
|
|
|
|
|
|
|
|
|
|
|
|
|
|
|
|
|
|
|
|
|
|
|
|
|
|
|
UNITED STATES
SECURITIES AND EXCHANGE COMMISSION
Washington, DC 20549
FORM 10-Q
|
(Mark One)
|
|
|
R
|
Quarterly report pursuant to Section 13 or 15(d) of the Securities Exchange Act of 1934
|
|
|
|
|
|
For the quarterly period ended March 31, 2014
|
|
|
|
|
|
or
|
|
|
|
|
o
|
Transition report pursuant to Section 13 or 15(d) of the Securities Exchange Act of 1934
|
|
|
|
|
|
For the transition period from __________ to __________
|
|
|
|
|
|
Commission file number 1-3950
|
Ford Motor Company
(Exact name of Registrant as specified in its charter)
|
Delaware
|
38-0549190
|
|
(State of incorporation)
|
(I.R.S. Employer Identification No.)
|
|
|
|
|
One American Road, Dearborn, Michigan
|
48126
|
|
(Address of principal executive offices)
|
(Zip Code)
|
313-322-3000
(Registrant’s telephone number, including area code)
Indicate by check mark if the registrant (1) has filed all reports required to be filed by Section 13 or 15(d) of the Securities Exchange Act of 1934 during the preceding 12 months (or for such shorter period that the registrant was required to file such reports), and (2) has been subject to such filing requirements for the past 90 days. Yes
R
No
o
Indicate by check mark whether the registrant has submitted electronically and posted on its corporate Web site, if any, every Interactive Data File required to be submitted and posted pursuant to Rule 405 of Regulation S-T (§232.405 of this chapter) during the preceding 12 months (or for such shorter period that the registrant was required to submit and post such files). Yes
R
No
o
Indicate by check mark whether the registrant is a large accelerated filer, an accelerated filer, a non-accelerated filer, or a smaller reporting company. See definitions of “large accelerated filer,” “accelerated filer,” and “smaller reporting company” in Rule 12b-2 of the Exchange Act. Large accelerated filer
R
Accelerated filer
o
Non-accelerated filer
o
Smaller reporting company
o
Indicate by check mark whether the registrant is a shell company (as defined in Rule 12b-2 of the Act). Yes
o
No
R
As of April 24, 2014, Ford had outstanding 3,883,406,273 shares of Common Stock and 70,852,076 shares of Class B Stock.
Exhibit Index begins on page
FORD MOTOR COMPANY
QUARTERLY REPORT ON FORM 10-Q
For the Quarter Ended
March 31, 2014
|
|
Table of Contents
|
Page
|
|
|
|
Part I - Financial Information
|
|
|
|
Item 1
|
Financial Statements
|
||
|
Consolidated Income Statement
|
|||
|
Consolidated Statement of Comprehensive Income
|
|||
|
Sector Income Statement
|
|||
|
Consolidated Balance Sheet
|
|||
|
Sector Balance Sheet
|
|||
|
Condensed Consolidated Statement of Cash Flows
|
|||
|
Condensed Sector Statement of Cash Flows
|
|||
|
Consolidated Statement of Equity
|
|||
|
Notes to the Financial Statements
|
|||
|
Report of Independent Registered Public Accounting Firm
|
|||
|
Item 2
|
Management’s Discussion and Analysis of Financial Condition and Results of Operations
|
||
|
Results of Operations
|
|||
|
Automotive Sector
|
|||
|
Financial Services Sector
|
|||
|
Liquidity and Capital Resources
|
|||
|
Production Volumes
|
|||
|
Outlook
|
|||
|
Accounting Standards Issued But Not Yet Adopted
|
|||
|
Other Financial Information
|
|||
|
Item 3
|
Quantitative and Qualitative Disclosures About Market Risk
|
||
|
Automotive Sector
|
|||
|
Financial Services Sector
|
|||
|
Item 4
|
Controls and Procedures
|
||
|
Part II - Other Information
|
|||
|
Item 1
|
Legal Proceedings
|
||
|
Item 6
|
Exhibits
|
||
|
Signature
|
|||
|
Exhibit Index
|
|||
i
PART I. FINANCIAL INFORMATION
ITEM 1.
Financial Statements.
FORD MOTOR COMPANY AND SUBSIDIARIES
CONSOLIDATED INCOME STATEMENT
(in millions, except per share amounts)
|
For the periods ended March 31,
|
|||||||
|
|
2014
|
2013
|
|||||
|
|
First Quarter
|
||||||
|
(unaudited)
|
|||||||
|
Revenues
|
|
|
|||||
|
Automotive
|
$
|
33,876
|
|
$
|
33,858
|
|
|
|
Financial Services
|
2,000
|
|
1,791
|
|
|||
|
Total revenues
|
35,876
|
|
35,649
|
|
|||
|
Costs and expenses
|
|
|
|
|
|||
|
Automotive cost of sales
|
31,021
|
|
30,005
|
|
|||
|
Selling, administrative, and other expenses
|
3,372
|
|
3,124
|
|
|||
|
Financial Services interest expense
|
678
|
|
706
|
|
|||
|
Financial Services provision for credit and insurance losses
|
39
|
|
40
|
|
|||
|
Total costs and expenses
|
35,110
|
|
33,875
|
|
|||
|
Automotive interest expense
|
208
|
|
206
|
|
|||
|
Automotive interest income and other income/(loss), net (Note 13)
|
214
|
|
245
|
|
|||
|
Financial Services other income/(loss), net (Note 13)
|
68
|
|
96
|
|
|||
|
Equity in net income of affiliated companies
|
419
|
|
214
|
|
|||
|
Income before income taxes
|
1,259
|
|
2,123
|
|
|||
|
Provision for/(Benefit from) income taxes (Note 15)
|
270
|
|
511
|
|
|||
|
Net income
|
989
|
|
1,612
|
|
|||
|
Less: Income/(Loss) attributable to noncontrolling interests
|
—
|
|
1
|
|
|||
|
Net income attributable to Ford Motor Company
|
$
|
989
|
|
$
|
1,611
|
|
|
|
AMOUNTS PER SHARE ATTRIBUTABLE TO FORD MOTOR COMPANY COMMON AND CLASS B STOCK (Note 16)
|
|||||||
|
Basic income
|
$
|
0.25
|
|
$
|
0.41
|
|
|
|
Diluted income
|
0.24
|
|
0.40
|
|
|||
|
Cash dividends declared
|
0.125
|
|
0.10
|
|
|||
CONSOLIDATED STATEMENT OF COMPREHENSIVE INCOME
(in millions)
|
|
For the periods ended March 31,
|
||||||
|
|
2014
|
2013
|
|||||
|
|
First Quarter
|
||||||
|
(unaudited)
|
|||||||
|
Net income
|
$
|
989
|
|
$
|
1,612
|
|
|
|
Other comprehensive income/(loss), net of tax (Note 12)
|
|||||||
|
Foreign currency translation
|
(235
|
)
|
(366
|
)
|
|||
|
Derivative instruments
|
92
|
|
97
|
|
|||
|
Pension and other postretirement benefits
|
183
|
|
591
|
|
|||
|
Total other comprehensive income/(loss), net of tax
|
40
|
|
322
|
|
|||
|
Comprehensive income
|
1,029
|
|
1,934
|
|
|||
|
Less: Comprehensive income/(loss) attributable to noncontrolling interests
|
—
|
|
1
|
|
|||
|
Comprehensive income attributable to Ford Motor Company
|
$
|
1,029
|
|
$
|
1,933
|
|
|
The accompanying notes are part of the financial statements.
1
ITEM 1. Financial Statements (Continued)
FORD MOTOR COMPANY AND SUBSIDIARIES
SECTOR INCOME STATEMENT
(in millions)
|
For the periods ended March 31,
|
|||||||
|
|
2014
|
2013
|
|||||
|
|
First Quarter
|
||||||
|
(unaudited)
|
|||||||
|
AUTOMOTIVE
|
|
|
|||||
|
Revenues
|
$
|
33,876
|
|
$
|
33,858
|
|
|
|
Costs and expenses
|
|||||||
|
Cost of sales
|
31,021
|
|
30,005
|
|
|||
|
Selling, administrative, and other expenses
|
2,476
|
|
2,481
|
|
|||
|
Total costs and expenses
|
33,497
|
|
32,486
|
|
|||
|
Interest expense
|
208
|
|
206
|
|
|||
|
Interest income and other income/(loss), net (Note 13)
|
214
|
|
245
|
|
|||
|
Equity in net income of affiliated companies
|
412
|
|
209
|
|
|||
|
Income before income taxes — Automotive
|
797
|
|
1,620
|
|
|||
|
FINANCIAL SERVICES
|
|
|
|
|
|||
|
Revenues
|
2,000
|
|
1,791
|
|
|||
|
Costs and expenses
|
|||||||
|
Interest expense
|
678
|
|
706
|
|
|||
|
Depreciation on vehicles subject to operating leases
|
706
|
|
483
|
|
|||
|
Operating and other expenses
|
190
|
|
160
|
|
|||
|
Provision for credit and insurance losses
|
39
|
|
40
|
|
|||
|
Total costs and expenses
|
1,613
|
|
1,389
|
|
|||
|
Other income/(loss), net (Note 13)
|
68
|
|
96
|
|
|||
|
Equity in net income of affiliated companies
|
7
|
|
5
|
|
|||
|
Income before income taxes — Financial Services
|
462
|
|
503
|
|
|||
|
COMPANY
|
|||||||
|
Income before income taxes
|
1,259
|
|
2,123
|
|
|||
|
Provision for/(Benefit from) income taxes (Note 15)
|
270
|
|
511
|
|
|||
|
Net income
|
989
|
|
1,612
|
|
|||
|
Less: Income/(Loss) attributable to noncontrolling interests
|
—
|
|
1
|
|
|||
|
Net income attributable to Ford Motor Company
|
$
|
989
|
|
$
|
1,611
|
|
|
The accompanying notes are part of the financial statements.
2
ITEM 1. Financial Statements (Continued)
FORD MOTOR COMPANY AND SUBSIDIARIES
CONSOLIDATED BALANCE SHEET
(in millions)
|
|
March 31,
2014 |
December 31,
2013 |
|||||
|
|
(unaudited)
|
||||||
|
ASSETS
|
|
|
|||||
|
Cash and cash equivalents
|
$
|
12,983
|
|
$
|
14,468
|
|
|
|
Marketable securities
|
23,546
|
|
22,100
|
|
|||
|
Finance receivables, net (Note 3)
|
77,773
|
|
77,481
|
|
|||
|
Other receivables, net
|
12,088
|
|
9,828
|
|
|||
|
Net investment in operating leases
|
20,024
|
|
19,984
|
|
|||
|
Inventories (Note 5)
|
8,874
|
|
7,708
|
|
|||
|
Equity in net assets of affiliated companies
|
3,982
|
|
3,679
|
|
|||
|
Net property
|
28,447
|
|
27,616
|
|
|||
|
Deferred income taxes
|
13,134
|
|
13,468
|
|
|||
|
Other assets
|
6,231
|
|
5,847
|
|
|||
|
Total assets
|
$
|
207,082
|
|
$
|
202,179
|
|
|
|
LIABILITIES
|
|
|
|
|
|||
|
Payables
|
$
|
22,209
|
|
$
|
19,531
|
|
|
|
Other liabilities and deferred revenue (Note 7)
|
40,141
|
|
40,886
|
|
|||
|
Debt (Note 9)
|
117,004
|
|
114,688
|
|
|||
|
Deferred income taxes
|
590
|
|
598
|
|
|||
|
Total liabilities
|
179,944
|
|
175,703
|
|
|||
|
Redeemable noncontrolling interest (Note 11)
|
331
|
|
331
|
|
|||
|
EQUITY
|
|
|
|
|
|||
|
Capital stock
|
|
|
|
|
|||
|
Common Stock, par value $.01 per share (3,924 million shares issued of 6 billion authorized)
|
39
|
|
39
|
|
|||
|
Class B Stock, par value $.01 per share (71 million shares issued of 530 million authorized)
|
1
|
|
1
|
|
|||
|
Capital in excess of par value of stock
|
21,547
|
|
21,422
|
|
|||
|
Retained earnings
|
23,882
|
|
23,386
|
|
|||
|
Accumulated other comprehensive income/(loss) (Note 12)
|
(18,190
|
)
|
(18,230
|
)
|
|||
|
Treasury stock
|
(506
|
)
|
(506
|
)
|
|||
|
Total equity attributable to Ford Motor Company
|
26,773
|
|
26,112
|
|
|||
|
Equity attributable to noncontrolling interests
|
34
|
|
33
|
|
|||
|
Total equity
|
26,807
|
|
26,145
|
|
|||
|
Total liabilities and equity
|
$
|
207,082
|
|
$
|
202,179
|
|
|
The following table includes assets to be used to settle liabilities of the consolidated variable interest entities (“VIEs”). These assets and liabilities are included in the consolidated balance sheet above. See Note 6 for additional information on our VIEs.
|
March 31,
2014 |
December 31,
2013 |
||||||
|
(unaudited)
|
|||||||
|
ASSETS
|
|
|
|||||
|
Cash and cash equivalents
|
$
|
2,768
|
|
$
|
4,198
|
|
|
|
Finance receivables, net
|
44,443
|
|
45,796
|
|
|||
|
Net investment in operating leases
|
9,592
|
|
8,116
|
|
|||
|
Other assets
|
1
|
|
5
|
|
|||
|
LIABILITIES
|
|||||||
|
Other liabilities and deferred revenue
|
$
|
73
|
|
$
|
88
|
|
|
|
Debt
|
38,983
|
|
40,728
|
|
|||
The accompanying notes are part of the financial statements.
3
ITEM 1. Financial Statements (Continued)
FORD MOTOR COMPANY AND SUBSIDIARIES
SECTOR BALANCE SHEET (in millions)
|
March 31,
2014 |
December 31,
2013 |
||||||
|
ASSETS
|
(unaudited)
|
||||||
|
Automotive
|
|
|
|||||
|
Cash and cash equivalents
|
$
|
4,533
|
|
$
|
4,959
|
|
|
|
Marketable securities
|
20,729
|
|
20,157
|
|
|||
|
Total cash and marketable securities
|
25,262
|
|
25,116
|
|
|||
|
Receivables, less allowances of $133 and $132
|
5,742
|
|
5,641
|
|
|||
|
Inventories (Note 5)
|
8,874
|
|
7,708
|
|
|||
|
Deferred income taxes
|
1,582
|
|
1,574
|
|
|||
|
Net investment in operating leases
|
978
|
|
1,384
|
|
|||
|
Other current assets
|
1,462
|
|
1,034
|
|
|||
|
Total current assets
|
43,900
|
|
42,457
|
|
|||
|
Equity in net assets of affiliated companies
|
3,849
|
|
3,546
|
|
|||
|
Net property
|
28,222
|
|
27,492
|
|
|||
|
Deferred income taxes
|
13,312
|
|
13,436
|
|
|||
|
Other assets
|
2,508
|
|
2,824
|
|
|||
|
Non-current receivable from Financial Services
|
720
|
|
724
|
|
|||
|
Total Automotive assets
|
92,511
|
|
90,479
|
|
|||
|
Financial Services
|
|
|
|
|
|||
|
Cash and cash equivalents
|
8,450
|
|
9,509
|
|
|||
|
Marketable securities
|
2,817
|
|
1,943
|
|
|||
|
Finance receivables, net (Note 3)
|
83,310
|
|
80,816
|
|
|||
|
Net investment in operating leases
|
19,046
|
|
18,600
|
|
|||
|
Equity in net assets of affiliated companies
|
133
|
|
133
|
|
|||
|
Other assets
|
3,475
|
|
3,149
|
|
|||
|
Receivable from Automotive
|
317
|
|
907
|
|
|||
|
Total Financial Services assets
|
117,548
|
|
115,057
|
|
|||
|
Intersector elimination
|
(1,037
|
)
|
(1,631
|
)
|
|||
|
Total assets
|
$
|
209,022
|
|
$
|
203,905
|
|
|
|
LIABILITIES
|
|
|
|
|
|||
|
Automotive
|
|
|
|
|
|||
|
Payables
|
$
|
20,598
|
|
$
|
18,035
|
|
|
|
Other liabilities and deferred revenue (Note 7)
|
16,438
|
|
16,537
|
|
|||
|
Deferred income taxes
|
340
|
|
267
|
|
|||
|
Debt payable within one year (Note 9)
|
2,086
|
|
1,257
|
|
|||
|
Current payable to Financial Services
|
317
|
|
907
|
|
|||
|
Total current liabilities
|
39,779
|
|
37,003
|
|
|||
|
Long-term debt (Note 9)
|
13,623
|
|
14,426
|
|
|||
|
Other liabilities and deferred revenue (Note 7)
|
21,636
|
|
22,089
|
|
|||
|
Deferred income taxes
|
431
|
|
430
|
|
|||
|
Total Automotive liabilities
|
75,469
|
|
73,948
|
|
|||
|
Financial Services
|
|
|
|
|
|||
|
Payables
|
1,611
|
|
1,496
|
|
|||
|
Debt (Note 9)
|
101,295
|
|
99,005
|
|
|||
|
Deferred income taxes
|
1,759
|
|
1,627
|
|
|||
|
Other liabilities and deferred income (Note 7)
|
2,067
|
|
2,260
|
|
|||
|
Payable to Automotive
|
720
|
|
724
|
|
|||
|
Total Financial Services liabilities
|
107,452
|
|
105,112
|
|
|||
|
Intersector elimination
|
(1,037
|
)
|
(1,631
|
)
|
|||
|
Total liabilities
|
181,884
|
|
177,429
|
|
|||
|
Redeemable noncontrolling interest (Note 11)
|
331
|
|
331
|
|
|||
|
EQUITY
|
|
|
|
|
|||
|
Capital stock
|
|
|
|
|
|||
|
Common Stock, par value $.01 per share (3,924 million shares issued of 6 billion authorized)
|
39
|
|
39
|
|
|||
|
Class B Stock, par value $.01 per share (71 million shares issued of 530 million authorized)
|
1
|
|
1
|
|
|||
|
Capital in excess of par value of stock
|
21,547
|
|
21,422
|
|
|||
|
Retained earnings
|
23,882
|
|
23,386
|
|
|||
|
Accumulated other comprehensive income/(loss) (Note 12)
|
(18,190
|
)
|
(18,230
|
)
|
|||
|
Treasury stock
|
(506
|
)
|
(506
|
)
|
|||
|
Total equity attributable to Ford Motor Company
|
26,773
|
|
26,112
|
|
|||
|
Equity attributable to noncontrolling interests
|
34
|
|
33
|
|
|||
|
Total equity
|
26,807
|
|
26,145
|
|
|||
|
Total liabilities and equity
|
$
|
209,022
|
|
$
|
203,905
|
|
|
The accompanying notes are part of the financial statements.
4
ITEM 1. Financial Statements (Continued)
FORD MOTOR COMPANY AND SUBSIDIARIES
CONDENSED CONSOLIDATED STATEMENT OF CASH FLOWS
(in millions)
|
For the periods ended March 31,
|
|||||||
|
|
2014
|
2013
|
|||||
|
First Quarter
|
|||||||
|
(unaudited)
|
|||||||
|
Cash flows from operating activities of continuing operations
|
|
|
|||||
|
Net cash provided by/(used in) operating activities
|
$
|
2,220
|
|
$
|
211
|
|
|
|
Cash flows from investing activities of continuing operations
|
|||||||
|
Capital spending
|
(1,516
|
)
|
(1,483
|
)
|
|||
|
Acquisitions of finance receivables and operating leases
|
(11,646
|
)
|
(10,389
|
)
|
|||
|
Collections of finance receivables and operating leases
|
8,983
|
|
8,255
|
|
|||
|
Purchases of securities
|
(15,291
|
)
|
(38,953
|
)
|
|||
|
Sales and maturities of securities
|
13,780
|
|
38,761
|
|
|||
|
Cash change due to initial consolidation of businesses
|
—
|
|
9
|
|
|||
|
Settlements of derivatives
|
(72
|
)
|
(217
|
)
|
|||
|
Other
|
100
|
|
166
|
|
|||
|
Net cash provided by/(used in) investing activities
|
(5,662
|
)
|
(3,851
|
)
|
|||
|
Cash flows from financing activities of continuing operations
|
|
|
|
|
|||
|
Cash dividends
|
(493
|
)
|
(392
|
)
|
|||
|
Purchases of Common Stock
|
—
|
|
(10
|
)
|
|||
|
Changes in short-term debt
|
(1,023
|
)
|
(1,428
|
)
|
|||
|
Proceeds from issuance of other debt
|
11,773
|
|
11,242
|
|
|||
|
Principal payments on other debt
|
(8,287
|
)
|
(7,548
|
)
|
|||
|
Other
|
18
|
|
103
|
|
|||
|
Net cash provided by/(used in) financing activities
|
1,988
|
|
1,967
|
|
|||
|
Effect of exchange rate changes on cash and cash equivalents
|
(31
|
)
|
(166
|
)
|
|||
|
Net increase/(decrease) in cash and cash equivalents
|
$
|
(1,485
|
)
|
$
|
(1,839
|
)
|
|
|
Cash and cash equivalents at January 1
|
$
|
14,468
|
|
$
|
15,659
|
|
|
|
Net increase/(decrease) in cash and cash equivalents
|
(1,485
|
)
|
(1,839
|
)
|
|||
|
Cash and cash equivalents at March 31
|
$
|
12,983
|
|
$
|
13,820
|
|
|
The accompanying notes are part of the financial statements.
5
ITEM 1. Financial Statements (Continued)
FORD MOTOR COMPANY AND SUBSIDIARIES
CONDENSED SECTOR STATEMENT OF CASH FLOWS
(in millions)
|
For the periods ended March 31,
|
|||||||||||||||
|
|
2014
|
2013
|
|||||||||||||
|
First Quarter
|
|||||||||||||||
|
|
Automotive
|
Financial Services
|
Automotive
|
Financial Services
|
|||||||||||
|
(Unaudited)
|
|||||||||||||||
|
Cash flows from operating activities of continuing operations
|
|||||||||||||||
|
Net cash provided by/(used in) operating activities
|
$
|
2,026
|
|
$
|
1,698
|
|
$
|
721
|
|
$
|
1,110
|
|
|||
|
Cash flows from investing activities of continuing operations
|
|||||||||||||||
|
Capital spending
|
(1,506
|
)
|
(10
|
)
|
(1,471
|
)
|
(12
|
)
|
|||||||
|
Acquisitions of finance receivables and operating leases (excluding wholesale and other)
|
—
|
|
(11,008
|
)
|
—
|
|
(9,947
|
)
|
|||||||
|
Collections of finance receivables and operating leases (excluding wholesale and other)
|
—
|
|
8,983
|
|
—
|
|
8,255
|
|
|||||||
|
Net change in wholesale and other receivables
|
—
|
|
(2,142
|
)
|
—
|
|
(2,062
|
)
|
|||||||
|
Purchases of securities
|
(10,969
|
)
|
(4,322
|
)
|
(29,697
|
)
|
(9,256
|
)
|
|||||||
|
Sales and maturities of securities
|
10,341
|
|
3,439
|
|
29,740
|
|
9,021
|
|
|||||||
|
Cash change due to initial consolidation of businesses
|
—
|
|
—
|
|
9
|
|
—
|
|
|||||||
|
Settlements of derivatives
|
47
|
|
(119
|
)
|
(177
|
)
|
(40
|
)
|
|||||||
|
Investing activity (to)/from Financial Services
|
11
|
|
—
|
|
(129
|
)
|
—
|
|
|||||||
|
Other
|
36
|
|
64
|
|
147
|
|
19
|
|
|||||||
|
Net cash provided by/(used in) investing activities
|
(2,040
|
)
|
|
(5,115
|
)
|
|
(1,578
|
)
|
|
(4,022
|
)
|
||||
|
Cash flows from financing activities of continuing operations
|
|||||||||||||||
|
Cash dividends
|
(493
|
)
|
—
|
|
(392
|
)
|
—
|
|
|||||||
|
Purchases of Common Stock
|
—
|
|
—
|
|
(10
|
)
|
—
|
|
|||||||
|
Changes in short-term debt
|
140
|
|
(1,163
|
)
|
(240
|
)
|
(1,188
|
)
|
|||||||
|
Proceeds from issuance of other debt
|
75
|
|
11,698
|
|
2,059
|
|
9,183
|
|
|||||||
|
Principal payments on other debt
|
(190
|
)
|
(8,097
|
)
|
(823
|
)
|
(6,725
|
)
|
|||||||
|
Financing activity to/(from) Automotive
|
—
|
|
(11
|
)
|
—
|
|
129
|
|
|||||||
|
Other
|
53
|
|
(35
|
)
|
43
|
|
60
|
|
|||||||
|
Net cash provided by/(used in) financing activities
|
(415
|
)
|
2,392
|
|
637
|
|
1,459
|
|
|||||||
|
Effect of exchange rate changes on cash and cash equivalents
|
3
|
|
(34
|
)
|
(38
|
)
|
(128
|
)
|
|||||||
|
Net increase/(decrease) in cash and cash equivalents
|
$
|
(426
|
)
|
|
$
|
(1,059
|
)
|
|
$
|
(258
|
)
|
|
$
|
(1,581
|
)
|
|
Cash and cash equivalents at January 1
|
$
|
4,959
|
|
$
|
9,509
|
|
$
|
6,247
|
|
$
|
9,412
|
|
|||
|
Net increase/(decrease) in cash and cash equivalents
|
(426
|
)
|
(1,059
|
)
|
(258
|
)
|
(1,581
|
)
|
|||||||
|
Cash and cash equivalents at March 31
|
$
|
4,533
|
|
|
$
|
8,450
|
|
|
$
|
5,989
|
|
|
$
|
7,831
|
|
The accompanying notes are part of the financial statements.
6
ITEM 1. Financial Statements (Continued)
FORD MOTOR COMPANY AND SUBSIDIARIES
CONSOLIDATED STATEMENT OF EQUITY
(in millions, unaudited)
|
|
Equity/(Deficit) Attributable to Ford Motor Company
|
|
|
||||||||||||||||||||||||||||
|
|
Capital Stock
|
Cap. in
Excess of
Par Value
of Stock
|
Retained Earnings/
(Accumulated Deficit)
|
Accumulated Other Comprehensive Income/(Loss) (Note 12)
|
Treasury Stock
|
Total
|
Equity/(Deficit)
Attributable
to Non-controlling Interests
|
Total
Equity/
(Deficit)
|
|||||||||||||||||||||||
|
Balance at December 31, 2013
|
$
|
40
|
|
$
|
21,422
|
|
$
|
23,386
|
|
$
|
(18,230
|
)
|
$
|
(506
|
)
|
$
|
26,112
|
|
$
|
33
|
|
$
|
26,145
|
|
|||||||
|
Net income
|
—
|
|
—
|
|
989
|
|
—
|
|
—
|
|
989
|
|
—
|
|
989
|
|
|||||||||||||||
|
Other comprehensive income/(loss), net of tax
|
—
|
|
—
|
|
—
|
|
40
|
|
—
|
|
40
|
|
—
|
|
40
|
|
|||||||||||||||
|
Common stock issued (including share-based compensation impacts)
|
—
|
|
143
|
|
—
|
|
—
|
|
—
|
|
143
|
|
—
|
|
143
|
|
|||||||||||||||
|
Treasury stock/other
|
—
|
|
(18
|
)
|
—
|
|
—
|
|
—
|
|
(18
|
)
|
1
|
|
(17
|
)
|
|||||||||||||||
|
Cash dividends declared
|
—
|
|
—
|
|
(493
|
)
|
—
|
|
—
|
|
(493
|
)
|
—
|
|
(493
|
)
|
|||||||||||||||
|
Balance at March 31, 2014
|
$
|
40
|
|
$
|
21,547
|
|
$
|
23,882
|
|
$
|
(18,190
|
)
|
$
|
(506
|
)
|
$
|
26,773
|
|
$
|
34
|
|
$
|
26,807
|
|
|||||||
|
Balance at December 31, 2012
|
$
|
40
|
|
$
|
20,976
|
|
$
|
17,778
|
|
$
|
(22,858
|
)
|
$
|
(292
|
)
|
$
|
15,644
|
|
$
|
42
|
|
$
|
15,686
|
|
|||||||
|
Net income
|
—
|
|
—
|
|
1,611
|
|
—
|
|
—
|
|
1,611
|
|
1
|
|
1,612
|
|
|||||||||||||||
|
Other comprehensive income/(loss), net of tax
|
—
|
|
—
|
|
—
|
|
322
|
|
—
|
|
322
|
|
—
|
|
322
|
|
|||||||||||||||
|
Common stock issued (including share-based compensation impacts)
|
—
|
|
118
|
|
—
|
|
—
|
|
—
|
|
118
|
|
—
|
|
118
|
|
|||||||||||||||
|
Treasury stock/other
|
—
|
|
—
|
|
—
|
|
—
|
|
(10
|
)
|
(10
|
)
|
—
|
|
(10
|
)
|
|||||||||||||||
|
Cash dividends declared
|
—
|
|
—
|
|
(392
|
)
|
—
|
|
—
|
|
(392
|
)
|
—
|
|
(392
|
)
|
|||||||||||||||
|
Balance at March 31, 2013
|
$
|
40
|
|
$
|
21,094
|
|
$
|
18,997
|
|
$
|
(22,536
|
)
|
$
|
(302
|
)
|
$
|
17,293
|
|
$
|
43
|
|
$
|
17,336
|
|
|||||||
The accompanying notes are part of the financial statements.
7
ITEM 1. Financial Statements (Continued)
FORD MOTOR COMPANY AND SUBSIDIARIES
NOTES TO THE FINANCIAL STATEMENTS
Table of Contents
|
Footnote
|
|
Page
|
|
Note 1
|
Presentation
|
|
|
Note 2
|
Fair Value Measurements
|
|
|
Note 3
|
Financial Services Sector Finance Receivables
|
|
|
Note 4
|
Financial Services Sector Allowance for Credit Losses
|
|
|
Note 5
|
Inventories
|
|
|
Note 6
|
Variable Interest Entities
|
|
|
Note 7
|
Other Liabilities and Deferred Revenue
|
|
|
Note 8
|
Retirement Benefits
|
|
|
Note 9
|
Debt
|
|
|
Note 10
|
Derivative Financial Instruments and Hedging Activities
|
|
|
Note 11
|
Redeemable Noncontrolling Interest
|
|
|
Note 12
|
Accumulated Other Comprehensive Income/(Loss)
|
|
|
Note 13
|
Other Income/(Loss)
|
|
|
Note 14
|
Employee Separation Actions and Exit and Disposal Activities
|
|
|
Note 15
|
Income Taxes
|
|
|
Note 16
|
Amounts Per Share Attributable to Ford Motor Company Common and Class B Stock
|
|
|
Note 17
|
Segment Information
|
|
|
Note 18
|
Commitments and Contingencies
|
|
8
Item 1. Financial Statements (Continued)
FORD MOTOR COMPANY AND SUBSIDIARIES
NOTES TO THE FINANCIAL STATEMENTS
NOTE 1. PRESENTATION
Our financial statements are presented in accordance with U.S. generally accepted accounting principles (“GAAP”) for interim financial information and instructions to the Quarterly Report on Form 10-Q and Rule 10-01 of Regulation S-X. We show certain of our financial statements on both a consolidated and a sector basis for our Automotive and Financial Services sectors. Intercompany items have been eliminated in both the consolidated and sector balance sheets. Where the presentation of these intercompany eliminations or consolidated adjustments differs between the consolidated and sector financial statements, reconciliations of certain line items are explained below in this Note or in related footnotes.
In the opinion of management, these unaudited financial statements reflect a fair statement of the results of operations and financial condition of Ford Motor Company, its consolidated subsidiaries, and consolidated VIEs of which we are the primary beneficiary for the periods and at the dates presented. The results for interim periods are not necessarily indicative of results that may be expected for any other interim period or for the full year. Reference should be made to the financial statements contained in our Annual Report on Form 10-K for the year ended December 31, 2013 (“2013 Form 10-K Report”). For purposes of this report, “Ford,” the “Company,” “we,” “our,” “us” or similar references mean Ford Motor Company, our consolidated subsidiaries, and our consolidated VIEs of which we are the primary beneficiary, unless the context requires otherwise.
We reclassified certain prior year amounts in our consolidated financial statements to conform to current year presentation.
Change in accounting.
We provide medical, life, and income benefits to hourly and salary employees when they become disabled. As of January 1, 2014, we changed our accounting policy for these benefits from an event-driven model to a service-accrual model, such that our obligation now includes an estimated cost to be incurred for individuals who are disabled at the time of measurement (which was the amount recorded under our previous policy) as well as an amount that considers the probability that active employees will become disabled in the future. We believe this change in accounting method is preferable because it better aligns the recognition of expense with the periods in which the Company receives the benefit of the employees’ services, and will allow for better comparability with the method used by other companies in our industry.
We have retroactively applied this change in accounting method to all prior period amounts. As of December 31, 2012, the cumulative effect of the change decreased
Total equity
by
$303 million
and increased
Other liabilities and deferred revenue
by
$468 million
, as well as increased
Deferred income taxes
by
$165 million
. As of December 31, 2013, the cumulative effect of the change decreased
Total equity
by
$271 million
and increased
Other liabilities and deferred revenue
by
$424 million
, as well as increased
Deferred income taxes
by
$153 million
. The effect of this change was immaterial on income statement and statement of cash flow amounts for the interim period ended
March 31, 2014
, and had no impact for the interim period ended
March 31, 2013
.
Adoption of New Accounting Standards
Income Taxes - Presentation of an Unrecognized Tax Benefit When a Net Operating Loss Carryforward, a Similar Tax Loss, or a Tax Credit Carryforward Exists.
On January 1, 2014, we adopted the new accounting standard that requires an unrecognized tax benefit to be presented as a decrease in a deferred tax asset where a net operating loss, a similar tax loss, or a tax credit carryforward exists and certain criteria are met. The new accounting standard is consistent with our prior practice, thus the adoption did not impact our consolidated financial statements.
Foreign Currency Matters - Parent's Accounting for Cumulative Translation Adjustment.
On January 1, 2014, we adopted the new accounting standard that clarifies the applicable guidance for a parent company's accounting for the release of the cumulative translation adjustment into net income upon derecognition of certain subsidiaries or groups of assets within a foreign entity or of an investment in a foreign entity. The new accounting standard is consistent with our prior practice, thus the adoption did not impact our consolidated financial statements.
Liabilities - Obligations Resulting from Joint and Several Liability Arrangements.
On January 1, 2014, we adopted the new accounting standard that provides guidance for the recognition, measurement, and disclosure of obligations resulting from joint and several liability arrangements. The adoption of this accounting standard did not impact our consolidated financial statements or financial statement disclosures.
9
Item 1. Financial Statements (Continued)
FORD MOTOR COMPANY AND SUBSIDIARIES
NOTES TO THE FINANCIAL STATEMENTS
NOTE 1. PRESENTATION
(Continued)
Reconciliations between Consolidated and Sector Financial Statements
Sector to Consolidated Deferred Tax Assets and Liabilities.
The difference between the total assets and total liabilities as presented on our sector balance sheet and consolidated balance sheet is the result of netting deferred income tax assets and liabilities. The reconciliation between the totals for the sector and consolidated balance sheets was as follows (in millions):
|
|
March 31,
2014 |
December 31,
2013 |
|||||
|
Sector balance sheet presentation of deferred income tax assets
|
|
|
|||||
|
Automotive sector current deferred income tax assets
|
$
|
1,582
|
|
$
|
1,574
|
|
|
|
Automotive sector non-current deferred income tax assets
|
13,312
|
|
13,436
|
|
|||
|
Financial Services sector deferred income tax assets (a)
|
180
|
|
184
|
|
|||
|
Total
|
15,074
|
|
15,194
|
|
|||
|
Reclassification for netting of deferred income taxes
|
(1,940
|
)
|
(1,726
|
)
|
|||
|
Consolidated balance sheet presentation of deferred income tax assets
|
$
|
13,134
|
|
$
|
13,468
|
|
|
|
Sector balance sheet presentation of deferred income tax liabilities
|
|
|
|
|
|||
|
Automotive sector current deferred income tax liabilities
|
$
|
340
|
|
$
|
267
|
|
|
|
Automotive sector non-current deferred income tax liabilities
|
431
|
|
430
|
|
|||
|
Financial Services sector deferred income tax liabilities
|
1,759
|
|
1,627
|
|
|||
|
Total
|
2,530
|
|
2,324
|
|
|||
|
Reclassification for netting of deferred income taxes
|
(1,940
|
)
|
(1,726
|
)
|
|||
|
Consolidated balance sheet presentation of deferred income tax liabilities
|
$
|
590
|
|
$
|
598
|
|
|
__________
|
(a)
|
Financial Services deferred income tax assets are included in
Financial Services Other assets
on our sector balance sheet.
|
10
Item 1. Financial Statements (Continued)
FORD MOTOR COMPANY AND SUBSIDIARIES
NOTES TO THE FINANCIAL STATEMENTS
NOTE 1. PRESENTATION
(Continued)
Sector to Consolidated Cash Flow
. We present certain cash flows from wholesale and other receivables, interest supplements and residual support, and the acquisition of intersector debt differently on our sector and consolidated statements of cash flows. The reconciliation between totals for the sector and consolidated cash flows for the periods ended
March 31
was as follows (in millions):
|
First Quarter
|
|||||||
|
|
2014
|
2013
|
|||||
|
Automotive net cash provided by/(used in) operating activities
|
$
|
2,026
|
|
$
|
721
|
|
|
|
Financial Services net cash provided by/(used in) operating activities
|
1,698
|
|
1,110
|
|
|||
|
Total sector net cash provided by/(used in) operating activities
|
3,724
|
|
1,831
|
|
|||
|
Reclassifications between investing and operating cash flows
|
|
|
|
|
|||
|
Purchases/Collections of wholesale receivables (a)
|
(2,028
|
)
|
(1,844
|
)
|
|||
|
Purchases/Collections of other receivables (b)
|
(114
|
)
|
(218
|
)
|
|||
|
Payments of interest supplements and residual support (c)
|
638
|
|
442
|
|
|||
|
Consolidated net cash provided by/(used in) operating activities
|
$
|
2,220
|
|
$
|
211
|
|
|
|
Automotive net cash provided by/(used in) investing activities
|
$
|
(2,040
|
)
|
$
|
(1,578
|
)
|
|
|
Financial Services net cash provided by/(used in) investing activities
|
(5,115
|
)
|
(4,022
|
)
|
|||
|
Total sector net cash provided by/(used in) investing activities
|
(7,155
|
)
|
(5,600
|
)
|
|||
|
Reclassifications between investing and operating cash flows
|
|
|
|
|
|||
|
Purchases/Collections of wholesale receivables (a)
|
2,028
|
|
1,844
|
|
|||
|
Purchases/Collections of other receivables (b)
|
114
|
|
218
|
|
|||
|
Payments of interest supplements and residual support (c)
|
(638
|
)
|
(442
|
)
|
|||
|
Reclassifications between investing and financing cash flows
|
|||||||
|
Elimination of investing activity to/(from) Financial Services in consolidation
|
(11
|
)
|
129
|
|
|||
|
Consolidated net cash provided by/(used in) investing activities
|
$
|
(5,662
|
)
|
$
|
(3,851
|
)
|
|
|
Automotive net cash provided by/(used in) financing activities
|
$
|
(415
|
)
|
$
|
637
|
|
|
|
Financial Services net cash provided by/(used in) financing activities
|
2,392
|
|
1,459
|
|
|||
|
Total sector net cash provided by/(used in) financing activities
|
1,977
|
|
2,096
|
|
|||
|
Reclassifications between investing and financing cash flows
|
|
|
|
|
|||
|
Elimination of investing activity to/(from) Financial Services in consolidation
|
11
|
|
(129
|
)
|
|||
|
Consolidated net cash provided by/(used in) financing activities
|
$
|
1,988
|
|
$
|
1,967
|
|
|
__________
|
(a)
|
In addition to the cash flow from vehicles sold by us, the cash flow from wholesale finance receivables (being reclassified between investing and operating) includes dealer financing by Ford Credit of used and non-Ford vehicles.
One hundred
percent of cash flows from these wholesale finance receivables have been reclassified for consolidated presentation as the portion of these cash flows from used and non-Ford vehicles is impracticable to separate.
|
|
(b)
|
Includes cash flows of other receivables purchased/collected by the Financial Services sector from certain divisions and subsidiaries of the Automotive sector.
|
|
(c)
|
Payments from Automotive sector to Ford Credit on behalf of the retail customer that represent interest supplements and residual support.
|
11
Item 1. Financial Statements (Continued)
FORD MOTOR COMPANY AND SUBSIDIARIES
NOTES TO THE FINANCIAL STATEMENTS
NOTE 1. PRESENTATION
(Continued)
Venezuelan Operations
On February 13, 2013, the Venezuelan government effected a devaluation of the bolivar, from an exchange rate of
4.3
bolivars to the U.S. dollar to an exchange rate of
6.3
bolivars to the U.S. dollar. This resulted in a remeasurement loss of
$186 million
in the first quarter of 2013.
Based on changes to Venezuelan currency exchange rate mechanisms in the first quarter of 2014, we changed the exchange rate we used to remeasure our Venezuelan subsidiary’s financial statements in U.S. dollars. At
March 31, 2014
, we used the exchange rate determined by periodic auctions for U.S. dollars conducted under Venezuela’s Complementary System of Foreign Currency Administration (“SICAD I”). At
March 31, 2014
, the SICAD I exchange rate we used was
10.8
bolivars to the U.S. dollar.
Requests for U.S. dollars by our Venezuelan subsidiary for previously imported materials and spare parts will continue through the Commission for the Administration of Foreign Exchange (“CADIVI”) and the National Center for Foreign Commerce (“CENCOEX”) system, where the contracted rate is presently
6.3
bolivars to the U.S. dollar. However, as a result of a recent exchange agreement between the Central Bank of Venezuela and the Venezuelan government, we believe any future remittances for dividend payments that occur would be transacted at the SICAD I exchange rate. Accordingly, because the equity of our Venezuelan subsidiary would be realized through dividends, the SICAD I exchange rate represents a more realistic exchange rate at which to remeasure the U.S. dollar value of the assets, liabilities, and results of our Venezuelan subsidiary in our consolidated financial statements.
This change in exchange rates resulted in a remeasurement loss of
$316 million
in the first quarter of
2014
(
$310 million
related to our Automotive sector and
$6 million
related to our Financial Services sector). As indicated, the SICAD I exchange rate is determined by periodic auctions and therefore the potential exists for it to change significantly in future quarters. The SICAD I exchange rate has ranged between
10
and
11.8
bolivars to the U.S. dollar since the beginning of 2014.
At
March 31, 2014
, we had a bolivar denominated net monetary position of
$415 million
, including
$433 million
of bolivar denominated cash and cash equivalents. A further devaluation from an exchange rate of
10.8
bolivars to the U.S. dollar would result in an additional balance sheet remeasurement loss.
At
March 31, 2014
, our investment in our Venezuelan subsidiary (which includes undistributed earnings) was
$552 million
. Also, at
March 31, 2014
, it had
$307 million
of U.S. dollar currency exchange requests pending with and in transit to the governmental controlled currency exchanges, including
$296 million
payable to other Ford consolidated affiliates.
In March 2014, the Venezuelan government introduced an additional auction-based foreign exchange system
(SICAD II). The Venezuelan government has indicated that all industry sectors will be able to access SICAD II and its use will not be restricted as to purpose. The SICAD II exchange rate is expected to be published daily and has ranged between
49
and
51.9
bolivars to the U.S. dollar since being introduced.
The operating environment in Venezuela continues to be challenging. Foreign exchange control regulations have affected our Venezuelan operation’s ability to pay dividends and obligations denominated in U.S. dollars and are constraining parts availability and our ability to maintain normal production. Price controls and a very limited and uneven supply of foreign currency to support production, have adversely affected our business and results of operations. These and other restrictions could limit our ability to benefit from our investment and maintain a controlling interest in our Venezuelan subsidiary.
12
Item 1. Financial Statements (Continued)
FORD MOTOR COMPANY AND SUBSIDIARIES
NOTES TO THE FINANCIAL STATEMENTS
NOTE 2. FAIR VALUE MEASUREMENTS
Cash equivalents, marketable securities, and derivative financial instruments are presented on our financial statements on a recurring basis at fair value, while other assets and liabilities are measured at fair value on a nonrecurring basis, such as when we have an asset impairment.
Fair Value Measurements
In measuring fair value, we use various valuation methodologies and prioritize the use of observable inputs. The use of observable and unobservable inputs and their significance in measuring fair value are reflected in our fair value hierarchy assessment.
|
•
|
Level 1 - inputs include quoted prices for identical instruments and are the most observable
|
|
•
|
Level 2 - inputs include quoted prices for similar instruments and observable inputs such as interest rates, currency exchange rates, and yield curves
|
|
•
|
Level 3 - inputs include data not observable in the market and reflect management judgment about the assumptions market participants would use in pricing the instruments
|
We review the inputs to the fair value measurements to ensure they are appropriately categorized within the fair value hierarchy. Transfers into and transfers out of the hierarchy levels are recognized as if they had taken place at the end of the reporting period.
Valuation Methodologies
Cash and Cash Equivalents.
Included in
Cash and cash equivalents
are highly liquid investments that are readily convertible to known amounts of cash, and which are subject to an insignificant risk of change in value due to interest rate, quoted price, or penalty on withdrawal. A debt security is classified as a cash equivalent if it meets these criteria and if it has a remaining time to maturity of
three months or less from the date of acquisition
. Amounts on deposit and available upon demand, or negotiated to provide for daily liquidity without penalty, are classified as
Cash and cash equivalents
. Time deposits, certificates of deposit, and money market accounts that meet the above criteria are reported at par value on our balance sheet and are excluded from the tables below.
Marketable Securities
. Investments in securities with a
maturity date greater than three months at the date of purchase
and other securities for which there is more than an insignificant risk of change in value due to interest rate, quoted price, or penalty on withdrawal are classified as
Marketable securities
. We generally measure fair value using prices obtained from pricing services. Pricing methodologies and inputs to valuation models used by the pricing services depend on the security type (i.e., asset class). Where possible, fair values are generated using market inputs including quoted prices (the closing price in an exchange market), bid prices (the price at which a buyer stands ready to purchase), and other market information. For fixed income securities that are not actively traded, the pricing services use alternative methods to determine fair value for the securities, including quotes for similar fixed-income securities, matrix pricing, discounted cash flow using benchmark curves, or other factors. In certain cases, when market data are not available, we may use broker quotes to determine fair value.
An annual review is performed on the security prices received from our pricing services, which includes discussion and analysis of the inputs used by the pricing services to value our securities. We also compare the price of certain securities sold close to the quarter end to the price of the same security at the balance sheet date to ensure the reported fair value is reasonable.
Realized and unrealized gains and losses and interest income on our marketable securities are recorded in
Automotive interest income and other income/(expense), net
and
Financial Services other income/(loss), net
. Realized gains and losses are measured using the specific identification method.
We have entered into repurchase agreements with certain counterparties where we are the transferee. These agreements allow us to offset our entire gross exposure in the event of default or breach of contract. The gross value of these assets and liabilities reflected on our balance sheet at
March 31, 2014
and
December 31, 2013
was
$312 million
and
$228 million
, respectively.
13
Item 1. Financial Statements (Continued)
FORD MOTOR COMPANY AND SUBSIDIARIES
NOTES TO THE FINANCIAL STATEMENTS
NOTE 2. FAIR VALUE MEASUREMENTS
(Continued)
Derivative Financial Instruments.
Our derivatives are over-the-counter customized derivative transactions and are not exchange traded. We estimate the fair value of these instruments using industry-standard valuation models such as a discounted cash flow. These models project future cash flows and discount the future amounts to a present value using market-based expectations for interest rates, foreign exchange rates, commodity prices, and the contractual terms of the derivative instruments. The discount rate used is the relevant interbank deposit rate (e.g., LIBOR) plus an adjustment for non-performance risk. The adjustment reflects the full credit default swap (“CDS”) spread applied to a net exposure, by counterparty, considering the master netting agreements and any posted collateral. We use our counterparty’s CDS spread when we are in a net asset position and our own CDS spread when we are in a net liability position. In certain cases, market data is not available and we use broker quotes and models (e.g., Black-Scholes) to determine fair value. This includes situations where there is lack of liquidity for a particular currency or commodity or when the instrument is longer dated.
Finance Receivables.
We measure finance receivables at fair value for purposes of disclosure (see Note 3) using internal valuation models. These models project future cash flows of financing contracts based on scheduled contract payments (including principal and interest). The projected cash flows are discounted to present value based on assumptions regarding credit losses, pre-payment speed, and applicable spreads to approximate current rates. Our assumptions regarding pre-payment speed and credit losses are based on historical performance. The fair value of finance receivables is categorized within Level 3 of the hierarchy.
On a nonrecurring basis, we also measure at fair value retail contracts
greater than 120 days past due or deemed to be uncollectible
, and individual dealer loans probable of foreclosure. We use the fair value of collateral, adjusted for estimated costs to sell, to determine the fair value of our receivables. The collateral for a retail receivable is the vehicle financed, and for dealer loans is real estate or other property.
The fair value of collateral for retail receivables is calculated based on the number of contracts multiplied by the loss severity and the probability of default percentage, or the outstanding receivable balances multiplied by the average recovery value percentage to determine the fair value adjustment.
The fair value of collateral for dealer loans is determined by reviewing various appraisals, which include total adjusted appraised value of land and improvements, alternate use appraised value, broker's opinion of value, and purchase offers. The fair value adjustment is calculated by comparing the net carrying value of the dealer loan and the estimated fair value of collateral.
The fair value of retail and dealer loans measured on a non-recurring basis was
$55 million
and
$61 million
at
March 31, 2014
and
December 31, 2013
, respectively. Changes in the significant unobservable inputs will not materially affect the fair value of these loans. The fair value adjustment recorded to expense for these receivables was
$19 million
and
$25 million
for the periods ended
March 31, 2014
and
2013
, respectively.
Debt.
We measure debt at fair value for purposes of disclosure (see Note 9) using quoted prices for our own debt with approximately the same remaining maturities, where possible. Where quoted prices are not available, we estimate fair value using discounted cash flows and market-based expectations for interest rates, credit risk, and the contractual terms of the debt instruments. For certain short-term debt with an original maturity date of one year or less, we assume that book value is a reasonable approximation of the debt’s fair value. The fair value of debt is categorized within Level 2 of the hierarchy.
14
Item 1. Financial Statements (Continued)
FORD MOTOR COMPANY AND SUBSIDIARIES
NOTES TO THE FINANCIAL STATEMENTS
NOTE 2. FAIR VALUE MEASUREMENTS
(Continued)
Input Hierarchy of Items Measured at Fair Value on a Recurring Basis
The following tables categorize the fair values of items measured at fair value on a recurring basis on our balance sheet (in millions):
|
|
March 31, 2014
|
December 31, 2013
|
|||||||||||||||||||||||||||||
|
|
Level 1
|
Level 2
|
Level 3
|
Total
|
Level 1
|
Level 2
|
Level 3
|
Total
|
|||||||||||||||||||||||
|
Automotive Sector
|
|
|
|
|
|||||||||||||||||||||||||||
|
Assets
|
|
|
|
|
|||||||||||||||||||||||||||
|
Cash equivalents – financial instruments
|
|
|
|
|
|||||||||||||||||||||||||||
|
U.S. government
|
$
|
—
|
|
$
|
—
|
|
$
|
—
|
|
$
|
—
|
|
$
|
—
|
|
$
|
9
|
|
$
|
—
|
|
$
|
9
|
|
|||||||
|
U.S. government-sponsored enterprises
|
—
|
|
109
|
|
—
|
|
109
|
|
—
|
|
24
|
|
—
|
|
24
|
|
|||||||||||||||
|
Non-U.S. government
|
—
|
|
—
|
|
—
|
|
—
|
|
—
|
|
200
|
|
—
|
|
200
|
|
|||||||||||||||
|
Non-U.S. government agencies (a)
|
—
|
|
165
|
|
—
|
|
165
|
|
—
|
|
—
|
|
—
|
|
—
|
|
|||||||||||||||
|
Total cash equivalents – financial instruments (b)
|
—
|
|
274
|
|
—
|
|
274
|
|
—
|
|
233
|
|
—
|
|
233
|
|
|||||||||||||||
|
Marketable securities
|
|
|
|
|
|
|
|
|
|||||||||||||||||||||||
|
U.S. government
|
4,029
|
|
—
|
|
—
|
|
4,029
|
|
3,752
|
|
—
|
|
—
|
|
3,752
|
|
|||||||||||||||
|
U.S. government-sponsored enterprises
|
—
|
|
5,311
|
|
—
|
|
5,311
|
|
—
|
|
6,596
|
|
—
|
|
6,596
|
|
|||||||||||||||
|
Non-U.S. government agencies (a)
|
—
|
|
6,848
|
|
—
|
|
6,848
|
|
—
|
|
5,423
|
|
—
|
|
5,423
|
|
|||||||||||||||
|
Corporate debt
|
—
|
|
2,634
|
|
—
|
|
2,634
|
|
—
|
|
2,623
|
|
—
|
|
2,623
|
|
|||||||||||||||
|
Mortgage-backed and other asset-backed
|
—
|
|
296
|
|
—
|
|
296
|
|
—
|
|
295
|
|
—
|
|
295
|
|
|||||||||||||||
|
Equities
|
294
|
|
—
|
|
—
|
|
294
|
|
341
|
|
—
|
|
—
|
|
341
|
|
|||||||||||||||
|
Non-U.S. government
|
—
|
|
1,284
|
|
—
|
|
1,284
|
|
—
|
|
1,115
|
|
—
|
|
1,115
|
|
|||||||||||||||
|
Other liquid investments (c)
|
—
|
|
33
|
|
—
|
|
33
|
|
—
|
|
12
|
|
—
|
|
12
|
|
|||||||||||||||
|
Total marketable securities
|
4,323
|
|
16,406
|
|
—
|
|
20,729
|
|
4,093
|
|
16,064
|
|
—
|
|
20,157
|
|
|||||||||||||||
|
Derivative financial instruments
|
|
|
|
|
|
|
|
|
|||||||||||||||||||||||
|
Foreign currency exchange contracts
|
—
|
|
517
|
|
—
|
|
517
|
|
—
|
|
557
|
|
—
|
|
557
|
|
|||||||||||||||
|
Commodity contracts
|
—
|
|
24
|
|
3
|
|
27
|
|
—
|
|
22
|
|
1
|
|
23
|
|
|||||||||||||||
|
Total derivative financial instruments (d)
|
—
|
|
541
|
|
3
|
|
544
|
|
—
|
|
579
|
|
1
|
|
580
|
|
|||||||||||||||
|
Total assets at fair value
|
$
|
4,323
|
|
$
|
17,221
|
|
$
|
3
|
|
$
|
21,547
|
|
$
|
4,093
|
|
$
|
16,876
|
|
$
|
1
|
|
$
|
20,970
|
|
|||||||
|
Liabilities
|
|
|
|
|
|
|
|
|
|||||||||||||||||||||||
|
Derivative financial instruments
|
|
|
|
|
|
|
|
|
|||||||||||||||||||||||
|
Foreign currency exchange contracts
|
$
|
—
|
|
$
|
329
|
|
$
|
—
|
|
$
|
329
|
|
$
|
—
|
|
$
|
399
|
|
$
|
—
|
|
$
|
399
|
|
|||||||
|
Commodity contracts
|
—
|
|
12
|
|
—
|
|
12
|
|
—
|
|
17
|
|
2
|
|
19
|
|
|||||||||||||||
|
Total derivative financial instruments (d)
|
—
|
|
341
|
|
—
|
|
341
|
|
—
|
|
416
|
|
2
|
|
418
|
|
|||||||||||||||
|
Total liabilities at fair value
|
$
|
—
|
|
$
|
341
|
|
$
|
—
|
|
$
|
341
|
|
$
|
—
|
|
$
|
416
|
|
$
|
2
|
|
$
|
418
|
|
|||||||
__________
|
(a)
|
Includes notes issued by non-U.S. government agencies, as well as notes issued by supranational institutions.
|
|
(b)
|
Excludes time deposits, certificates of deposit, money market accounts, and other cash equivalents reported at par value on our balance sheet totaling
$2.6 billion
and
$2.7 billion
at
March 31, 2014
and
December 31, 2013
, respectively, for the Automotive sector. In addition to these cash equivalents, our Automotive sector also had cash on hand totaling
$1.6 billion
and
$2 billion
at
March 31, 2014
and
December 31, 2013
, respectively.
|
|
(c)
|
Includes certificates of deposit and time deposits subject to changes in value.
|
|
(d)
|
See Note 10 for additional information regarding derivative financial instruments.
|
15
Item 1. Financial Statements (Continued)
FORD MOTOR COMPANY AND SUBSIDIARIES
NOTES TO THE FINANCIAL STATEMENTS
NOTE 2. FAIR VALUE MEASUREMENTS
(Continued)
|
|
March 31, 2014
|
December 31, 2013
|
|||||||||||||||||||||||||||||
|
|
Level 1
|
Level 2
|
Level 3
|
Total
|
Level 1
|
Level 2
|
Level 3
|
Total
|
|||||||||||||||||||||||
|
Financial Services Sector
|
|
|
|
|
|||||||||||||||||||||||||||
|
Assets
|
|
|
|
|
|||||||||||||||||||||||||||
|
Cash equivalents – financial instruments
|
|
|
|
|
|||||||||||||||||||||||||||
|
Non-U.S. government
|
$
|
—
|
|
$
|
75
|
|
$
|
—
|
|
$
|
75
|
|
$
|
—
|
|
$
|
24
|
|
$
|
—
|
|
$
|
24
|
|
|||||||
|
Total cash equivalents – financial instruments (a)
|
—
|
|
75
|
|
—
|
|
75
|
|
—
|
|
24
|
|
—
|
|
24
|
|
|||||||||||||||
|
Marketable securities
|
|
|
|
|
|
|
|
|
|||||||||||||||||||||||
|
U.S. government
|
794
|
|
—
|
|
—
|
|
794
|
|
418
|
|
—
|
|
—
|
|
418
|
|
|||||||||||||||
|
U.S. government-sponsored enterprises
|
—
|
|
340
|
|
—
|
|
340
|
|
—
|
|
25
|
|
—
|
|
25
|
|
|||||||||||||||
|
Non-U.S. government agencies (b)
|
—
|
|
303
|
|
—
|
|
303
|
|
—
|
|
128
|
|
—
|
|
128
|
|
|||||||||||||||
|
Corporate debt
|
—
|
|
1,246
|
|
—
|
|
1,246
|
|
—
|
|
1,273
|
|
—
|
|
1,273
|
|
|||||||||||||||
|
Mortgage-backed and other asset-backed
|
—
|
|
41
|
|
—
|
|
41
|
|
—
|
|
43
|
|
—
|
|
43
|
|
|||||||||||||||
|
Non-U.S. government
|
—
|
|
93
|
|
—
|
|
93
|
|
—
|
|
56
|
|
—
|
|
56
|
|
|||||||||||||||
|
Total marketable securities
|
794
|
|
2,023
|
|
—
|
|
2,817
|
|
418
|
|
1,525
|
|
—
|
|
1,943
|
|
|||||||||||||||
|
Derivative financial instruments
|
|
|
|
|
|
|
|
|
|||||||||||||||||||||||
|
Interest rate contracts
|
—
|
|
663
|
|
—
|
|
663
|
|
—
|
|
584
|
|
—
|
|
584
|
|
|||||||||||||||
|
Foreign currency exchange contracts
|
—
|
|
4
|
|
—
|
|
4
|
|
—
|
|
1
|
|
—
|
|
1
|
|
|||||||||||||||
|
Cross-currency interest rate swap contracts
|
—
|
|
1
|
|
—
|
|
1
|
|
—
|
|
—
|
|
—
|
|
—
|
|
|||||||||||||||
|
Total derivative financial instruments (c)
|
—
|
|
668
|
|
—
|
|
668
|
|
—
|
|
585
|
|
—
|
|
585
|
|
|||||||||||||||
|
Total assets at fair value
|
$
|
794
|
|
$
|
2,766
|
|
$
|
—
|
|
$
|
3,560
|
|
$
|
418
|
|
$
|
2,134
|
|
$
|
—
|
|
$
|
2,552
|
|
|||||||
|
Liabilities
|
|
|
|
|
|
|
|
|
|||||||||||||||||||||||
|
Derivative financial instruments
|
|
|
|
|
|
|
|
|
|||||||||||||||||||||||
|
Interest rate contracts
|
$
|
—
|
|
$
|
284
|
|
$
|
—
|
|
$
|
284
|
|
$
|
—
|
|
$
|
305
|
|
$
|
—
|
|
$
|
305
|
|
|||||||
|
Foreign currency exchange contracts
|
—
|
|
21
|
|
—
|
|
21
|
|
—
|
|
25
|
|
—
|
|
25
|
|
|||||||||||||||
|
Cross-currency interest rate swap contracts
|
—
|
|
165
|
|
—
|
|
165
|
|
—
|
|
176
|
|
—
|
|
176
|
|
|||||||||||||||
|
Total derivative financial instruments (c)
|
—
|
|
470
|
|
—
|
|
470
|
|
—
|
|
506
|
|
—
|
|
506
|
|
|||||||||||||||
|
Total liabilities at fair value
|
$
|
—
|
|
$
|
470
|
|
$
|
—
|
|
$
|
470
|
|
$
|
—
|
|
$
|
506
|
|
$
|
—
|
|
$
|
506
|
|
|||||||
__________
|
(a)
|
Excludes time deposits, certificates of deposit, and money market accounts reported at par value on our balance sheet totaling
$6.2 billion
and
$6.7 billion
at
March 31, 2014
and
December 31, 2013
, respectively. In addition to these cash equivalents, we also had cash on hand totaling
$2.1 billion
and
$2.8 billion
at
March 31, 2014
and
December 31, 2013
, respectively.
|
|
(b)
|
Includes notes issued by non-U.S. government agencies, as well as notes issued by supranational institutions.
|
|
(c)
|
See Note 10 for additional information regarding derivative financial instruments.
|
16
Item 1. Financial Statements (Continued)
FORD MOTOR COMPANY AND SUBSIDIARIES
NOTES TO THE FINANCIAL STATEMENTS
NOTE 3. FINANCIAL SERVICES SECTOR FINANCE RECEIVABLES
Our Financial Services sector finance receivables primarily relate to Ford Credit, but also include the Other Financial Services segment and certain intersector eliminations.
Our Financial Services sector segments our finance receivables into North America and International "consumer" and "non-consumer" portfolios. The receivables are generally secured by the vehicles, inventory, or other property being financed.
Finance receivables are recorded at the time of origination or purchase at fair value and are subsequently reported at amortized cost, net of any allowance for credit losses.
Consumer Portfolio.
Receivables in this portfolio include products offered to individuals and businesses that finance the acquisition of Ford and Lincoln vehicles from dealers for personal or commercial use. Retail financing includes retail installment contracts for new and used vehicles and direct financing leases with retail customers, government entities, daily rental companies, and fleet customers.
Non-Consumer Portfolio.
Receivables in this portfolio include products offered to automotive dealers. The products include:
|
•
|
Dealer financing
– wholesale loans to dealers to finance the purchase of vehicle inventory, also known as floorplan financing, and loans to dealers to finance working capital and improvements to dealership facilities, finance the purchase of dealership real estate, and finance other dealer programs. Wholesale financing is approximately
95%
of our dealer financing
|
|
•
|
Other
– primarily related to the sale of parts and accessories to dealers
|
17
Item 1. Financial Statements (Continued)
FORD MOTOR COMPANY AND SUBSIDIARIES
NOTES TO THE FINANCIAL STATEMENTS
NOTE 3. FINANCIAL SERVICES SECTOR FINANCE RECEIVABLES
(Continued)
Finance receivables, net were as follows (in millions):
|
|
March 31, 2014
|
December 31, 2013
|
|||||||||||||||||||||
|
|
North
America
|
International
|
Total Finance Receivables
|
North
America
|
International
|
Total Finance Receivables
|
|||||||||||||||||
|
Consumer
|
|
|
|
|
|
|
|||||||||||||||||
|
Retail financing, gross
|
$
|
40,687
|
|
$
|
11,354
|
|
$
|
52,041
|
|
$
|
40,902
|
|
$
|
10,797
|
|
$
|
51,699
|
|
|||||
|
Less: Unearned interest supplements
|
(1,252
|
)
|
(249
|
)
|
(1,501
|
)
|
(1,255
|
)
|
(247
|
)
|
(1,502
|
)
|
|||||||||||
|
Consumer finance receivables
|
39,435
|
|
11,105
|
|
50,540
|
|
39,647
|
|
10,550
|
|
50,197
|
|
|||||||||||
|
Non-Consumer
|
|
|
|
|
|
|
|
|
|
|
|
|
|||||||||||
|
Dealer financing
|
23,110
|
|
8,820
|
|
31,930
|
|
22,072
|
|
7,833
|
|
29,905
|
|
|||||||||||
|
Other
|
810
|
|
364
|
|
1,174
|
|
732
|
|
339
|
|
1,071
|
|
|||||||||||
|
Non-Consumer finance receivables
|
23,920
|
|
9,184
|
|
33,104
|
|
22,804
|
|
8,172
|
|
30,976
|
|
|||||||||||
|
Total recorded investment
|
$
|
63,355
|
|
$
|
20,289
|
|
$
|
83,644
|
|
$
|
62,451
|
|
$
|
18,722
|
|
$
|
81,173
|
|
|||||
|
Recorded investment in finance receivables
|
$
|
63,355
|
|
$
|
20,289
|
|
$
|
83,644
|
|
$
|
62,451
|
|
$
|
18,722
|
|
$
|
81,173
|
|
|||||
|
Less: Allowance for credit losses
|
(258
|
)
|
(76
|
)
|
(334
|
)
|
(280
|
)
|
(77
|
)
|
(357
|
)
|
|||||||||||
|
Finance receivables, net (a)
|
$
|
63,097
|
|
$
|
20,213
|
|
$
|
83,310
|
|
$
|
62,171
|
|
$
|
18,645
|
|
$
|
80,816
|
|
|||||
|
Net finance receivables subject to fair value (b)
|
$
|
81,601
|
|
$
|
79,149
|
|
|||||||||||||||||
|
Fair value
|
83,268
|
|
80,838
|
|
|||||||||||||||||||
__________
|
(a)
|
At
March 31, 2014
and
December 31, 2013
,
Finance receivables, net
on the consolidated balance sheet were
$77.8 billion
and
$77.5 billion
, respectively. The balance is comprised of Financial Services sector finance receivables of
$83.3 billion
and
$80.8 billion
, respectively, net of
$5.5 billion
and
$3.3 billion
, respectively, of receivables purchased by Financial Services sector from Automotive sector, which are reclassified to
Other receivables, net.
|
|
(b)
|
At
March 31, 2014
and
December 31, 2013
, excludes
$1.7 billion
and
$1.7 billion
, respectively, of certain receivables (primarily direct financing leases) that are not subject to fair value disclosure requirements.
|
Excluded from finance receivables at
March 31, 2014
and
December 31, 2013
, was
$184 million
and
$196 million
, respectively, of accrued uncollected interest, which we report in
Other assets
on the balance sheet.
Included in the recorded investment in finance receivables at
March 31, 2014
and
December 31, 2013
were North America consumer receivables of
$20.4 billion
and
$21.8 billion
and non-consumer receivables of
$18.9 billion
and
$18.9 billion
, respectively, and International consumer receivables of
$6.4 billion
and
$5.9 billion
and non-consumer receivables of
$5.6 billion
and
$5 billion
, respectively, that secure certain debt obligations. The receivables are available only for payment of the debt issued by, and other obligations of, the securitization entities that are parties to those securitization transactions; they are not available to pay the other obligations of our Financial Services sector or the claims of Ford Credit’s other creditors. Ford Credit holds the right to receive the excess cash flows not needed to pay the debt issued by, and other obligations of, the securitization entities that are parties to those securitization transactions (see Notes 6 and 9).
18
Item 1. Financial Statements (Continued)
FORD MOTOR COMPANY AND SUBSIDIARIES
NOTES TO THE FINANCIAL STATEMENTS
NOTE 3. FINANCIAL SERVICES SECTOR FINANCE RECEIVABLES
(Continued)
Aging
For all finance receivables, we define “past due” as
any payment, including principal and interest, that is at least 31 days past the contractual due date
. The recorded investment of consumer receivables greater than 90 days past due and still accruing interest was
$11 million
and
$14 million
at
March 31, 2014
and
December 31, 2013
, respectively. The recorded investment of non-consumer receivables greater than 90 days past due and still accruing interest was
$21 million
and
$21 million
at
March 31, 2014
and
December 31, 2013
, respectively.
The aging analysis of our finance receivables balances were as follows (in millions):
|
March 31, 2014
|
December 31, 2013
|
||||||||||||||||||||||
|
North America
|
International
|
Total
|
North America
|
International
|
Total
|
||||||||||||||||||
|
Consumer
|
|||||||||||||||||||||||
|
31-60 days past due
|
$
|
583
|
|
$
|
50
|
|
$
|
633
|
|
$
|
715
|
|
$
|
39
|
|
$
|
754
|
|
|||||
|
61-90 days past due
|
56
|
|
15
|
|
71
|
|
88
|
|
17
|
|
105
|
|
|||||||||||
|
91-120 days past due
|
15
|
|
7
|
|
22
|
|
18
|
|
9
|
|
27
|
|
|||||||||||
|
Greater than 120 days past due
|
32
|
|
26
|
|
58
|
|
37
|
|
26
|
|
63
|
|
|||||||||||
|
Total past due
|
686
|
|
98
|
|
784
|
|
858
|
|
91
|
|
949
|
|
|||||||||||
|
Current
|
38,749
|
|
11,007
|
|
49,756
|
|
38,789
|
|
10,459
|
|
49,248
|
|
|||||||||||
|
Consumer finance receivables
|
39,435
|
|
11,105
|
|
50,540
|
|
39,647
|
|
10,550
|
|
50,197
|
|
|||||||||||
|
Non-Consumer
|
|||||||||||||||||||||||
|
Total past due
|
28
|
|
55
|
|
83
|
|
49
|
|
40
|
|
89
|
|
|||||||||||
|
Current
|
23,892
|
|
9,129
|
|
33,021
|
|
22,755
|
|
8,132
|
|
30,887
|
|
|||||||||||
|
Non-Consumer finance receivables
|
23,920
|
|
9,184
|
|
33,104
|
|
22,804
|
|
8,172
|
|
30,976
|
|
|||||||||||
|
Total recorded investment
|
$
|
63,355
|
|
$
|
20,289
|
|
$
|
83,644
|
|
$
|
62,451
|
|
$
|
18,722
|
|
$
|
81,173
|
|
|||||
Credit Quality
Consumer Portfolio
. When originating all classes of consumer receivables, we use a proprietary scoring system that measures the credit quality of the receivables using several factors, such as credit bureau information, consumer credit risk scores (e.g., FICO score), and contract characteristics. In addition to our proprietary scoring system, we consider other individual consumer factors, such as employment history, financial stability, and capacity to pay.
Subsequent to origination, we review the credit quality of retail financing based on customer payment activity. As each customer develops a payment history, we use an internally-developed behavioral scoring model to assist in determining the best collection strategies which allows us to focus collection activity on higher-risk accounts. These models are used to refine our risk-based staffing model to ensure collection resources are aligned with portfolio risk. Based on data from this scoring model, contracts are categorized by collection risk. Our collection models evaluate several factors, including origination characteristics, updated credit bureau data, and payment patterns.
Credit quality ratings for consumer receivables are based on aging. Refer to the aging table above.
Consumer receivables credit quality ratings are as follows:
|
•
|
Pass
–
current to 60 days past due
|
|
•
|
Special Mention
– 61 to 120 days past due and in intensified collection status
|
|
•
|
Substandard
–
greater than 120 days past due
and for which the uncollectible portion of the receivables has already been charged-off, as measured using the fair value of collateral
|
19
Item 1. Financial Statements (Continued)
FORD MOTOR COMPANY AND SUBSIDIARIES
NOTES TO THE FINANCIAL STATEMENTS
NOTE 3. FINANCIAL SERVICES SECTOR FINANCE RECEIVABLES
(Continued)
Non-Consumer Portfolio
. We extend credit to dealers primarily in the form of lines of credit to purchase new Ford and Lincoln vehicles as well as used vehicles. Payment is required when the dealer has sold the vehicle. Each non-consumer lending request is evaluated by taking into consideration the borrower’s financial condition and the underlying collateral securing the loan. We use a proprietary model to assign each dealer a risk rating. This model uses historical dealer performance data to identify key factors about a dealer that we consider most significant in predicting a dealer’s ability to meet its financial obligations. We also consider numerous other financial and qualitative factors of the dealer’s operations including capitalization and leverage, liquidity and cash flow, profitability, and credit history with ourselves and other creditors. A dealer’s risk rating does not reflect any guarantees or a dealer owner’s net worth.
Dealers are assigned to one of four groups according to risk ratings as follows:
|
•
|
Group I
– strong to superior financial metrics
|
|
•
|
Group II
– fair to favorable financial metrics
|
|
•
|
Group III
– marginal to weak financial metrics
|
|
•
|
Group IV
– poor financial metrics, including dealers classified as uncollectible
|
We suspend credit lines and extend no further funding to dealers classified in Group IV.
We regularly review our model to confirm the continued business significance and statistical predictability of the factors and update the model to incorporate new factors or other information that improves its statistical predictability. In addition, we regularly audit dealer inventory and dealer sales records to verify that the dealer is in possession of the financed vehicles and is promptly paying each receivable following the sale of the financed vehicle. The frequency of on-site vehicle inventory audits depends on the dealer’s risk rating. Under our policies, on-site vehicle inventory audits of low-risk dealers are conducted only as circumstances warrant in North America and at least annually internationally, and audits of higher-risk dealers are conducted with increased frequency based on risk ratings worldwide. We perform a credit review of each dealer at least annually and adjust the dealer’s risk rating, if necessary.
The credit quality of non-consumer receivables is evaluated based on our internal dealer risk rating analysis. A dealer has the same risk rating for its entire dealer financing regardless of the type of financing.
The credit quality analysis of our dealer financing receivables was as follows (in millions):
|
March 31, 2014
|
December 31, 2013
|
||||||||||||||||||||||
|
North America
|
International
|
Total
|
North America
|
International
|
Total
|
||||||||||||||||||
|
Dealer Financing
|
|||||||||||||||||||||||
|
Group I
|
$
|
19,464
|
|
$
|
5,907
|
|
$
|
25,371
|
|
$
|
18,357
|
|
$
|
5,051
|
|
$
|
23,408
|
|
|||||
|
Group II
|
3,306
|
|
2,258
|
|
5,564
|
|
3,289
|
|
2,092
|
|
5,381
|
|
|||||||||||
|
Group III
|
330
|
|
602
|
|
932
|
|
424
|
|
649
|
|
1,073
|
|
|||||||||||
|
Group IV
|
10
|
|
53
|
|
63
|
|
2
|
|
41
|
|
43
|
|
|||||||||||
|
Total recorded investment
|
$
|
23,110
|
|
$
|
8,820
|
|
$
|
31,930
|
|
$
|
22,072
|
|
$
|
7,833
|
|
$
|
29,905
|
|
|||||
Impaired Receivables.
Impaired consumer receivables include accounts that have been rewritten or modified in reorganization proceedings pursuant to the U.S. Bankruptcy Code that are considered to be troubled debt restructurings (“TDRs”), as well as all accounts
greater than 120 days past due
. Impaired non-consumer receivables represent accounts with dealers that have weak or poor financial metrics or dealer financing that has been modified in TDRs. The recorded investment of consumer receivables that were impaired at
March 31, 2014
and
December 31, 2013
was
$424 million
, or
0.8%
of consumer receivables, and
$435 million
, or
0.9%
of consumer receivables, respectively. The recorded investment of non-consumer receivables that were impaired at
March 31, 2014
and
December 31, 2013
was
$92 million
, or
0.3%
of non-consumer receivables, and
$71 million
, or
0.2%
of the non-consumer receivables, respectively. Impaired finance receivables are evaluated both collectively and specifically. See Note 4 for additional information related to the development of our allowance for credit losses.
20
Item 1. Financial Statements (Continued)
FORD MOTOR COMPANY AND SUBSIDIARIES
NOTES TO THE FINANCIAL STATEMENTS
NOTE 3. FINANCIAL SERVICES SECTOR FINANCE RECEIVABLES
(Continued)
Non-Accrual Receivables.
The accrual of revenue is discontinued at the earlier of the
time a receivable is determined to be uncollectible, at bankruptcy status notification, or greater than 120 days past due
. Accounts may be restored to accrual status only when a customer settles all past-due deficiency balances and future payments are reasonably assured. For receivables in non-accrual status, subsequent financing revenue is recognized only to the extent a payment is received. Payments are generally applied first to outstanding interest and then to the unpaid principal balance.
The recorded investment of consumer receivables in non-accrual status was
$220 million
, or
0.4%
of our consumer receivables at
March 31, 2014
, and
$238 million
, or
0.5%
of consumer receivables at
December 31, 2013
. The recorded investment of non-consumer receivables in non-accrual status was
$54 million
, or
0.2%
of our non-consumer receivables at
March 31, 2014
, and
$41 million
, or
0.1%
of non-consumer receivables at
December 31, 2013
.
Troubled Debt Restructurings.
A restructuring of debt constitutes a TDR if we grant a concession to a borrower for economic or legal reasons related to the debtor’s financial difficulties that we otherwise would not consider. Consumer and non-consumer receivables that have a modified interest rate below market rate or that were modified in reorganization proceedings pursuant to the U.S. Bankruptcy Code, except non-consumer receivables that are current with minimal risk of loss, are considered to be TDRs. We do not grant concessions on the principal balance of our receivables. If a receivable is modified in a reorganization proceeding, all payment requirements of the reorganization plan need to be met before remaining balances are forgiven. The outstanding recorded investment at time of modification for consumer receivables that are considered to be TDRs was
$50 million
, or
0.1%
of consumer receivables and
$55 million
, or
0.1%
of consumer receivables during the periods ended
March 31, 2014
and
2013
, respectively. The annualized subsequent default rate of TDRs that were previously modified in TDRs within the last twelve months and resulted in repossession for consumer receivable was
6.4%
and
6.3%
of TDRs at
March 31, 2014
and
2013
, respectively. There were no non-consumer receivables involved in TDRs during the periods ended
March 31, 2014
and
2013
.
Finance receivables involved in TDRs are specifically assessed for impairment. An impairment charge is recorded as part of the provision to the allowance for credit losses for the amount that the recorded investment of the receivable exceeds its estimated fair value. Estimated fair value is based on either the present value of the expected future cash flows of the receivable discounted at the contract’s original effective interest rate, or, for receivables where foreclosure is probable, the fair value of the collateral adjusted for estimated costs to sell. The allowance for credit losses related to all active consumer TDRs was
$23 million
and
$22 million
at
March 31, 2014
and
2013
, respectively. The allowance for credit losses related to all active non-consumer TDRs was de minimis at
March 31, 2014
and
2013
.
21
Item 1. Financial Statements (Continued)
FORD MOTOR COMPANY AND SUBSIDIARIES
NOTES TO THE FINANCIAL STATEMENTS
NOTE 4. FINANCIAL SERVICES SECTOR ALLOWANCE FOR CREDIT LOSSES
Following is an analysis of the allowance for credit losses related to finance receivables for the periods ended
March 31
(in millions):
|
First Quarter 2014
|
|||||||||||
|
|
Consumer
|
Non-Consumer
|
Total
|
||||||||
|
Allowance for credit losses
|
|
|
|
||||||||
|
Beginning balance
|
$
|
327
|
|
$
|
30
|
|
$
|
357
|
|
||
|
Charge-offs
|
(75
|
)
|
(2
|
)
|
(77
|
)
|
|||||
|
Recoveries
|
34
|
|
5
|
|
39
|
|
|||||
|
Provision for credit losses
|
23
|
|
(7
|
)
|
16
|
|
|||||
|
Other (a)
|
(2
|
)
|
1
|
|
(1
|
)
|
|||||
|
Ending balance
|
$
|
307
|
|
$
|
27
|
|
$
|
334
|
|
||
|
Analysis of ending balance of allowance for credit losses
|
|
|
|
|
|
|
|||||
|
Collective impairment allowance
|
$
|
284
|
|
$
|
24
|
|
$
|
308
|
|
||
|
Specific impairment allowance
|
23
|
|
3
|
|
26
|
|
|||||
|
Ending balance
|
307
|
|
27
|
|
334
|
|
|||||
|
Analysis of ending balance of finance receivables
|
|
|
|
|
|
|
|||||
|
Collectively evaluated for impairment
|
50,116
|
|
33,012
|
|
83,128
|
|
|||||
|
Specifically evaluated for impairment
|
424
|
|
92
|
|
516
|
|
|||||
|
Recorded investment
|
50,540
|
|
33,104
|
|
83,644
|
|
|||||
|
Ending balance, net of allowance for credit losses
|
$
|
50,233
|
|
$
|
33,077
|
|
$
|
83,310
|
|
||
__________
|
(a)
|
Represents amounts related to translation adjustments.
|
|
First Quarter 2013
|
|||||||||||
|
|
Consumer
|
Non-Consumer
|
Total
|
||||||||
|
Allowance for credit losses
|
|
|
|
||||||||
|
Beginning balance
|
$
|
360
|
|
$
|
29
|
|
$
|
389
|
|
||
|
Charge-offs
|
(80
|
)
|
(1
|
)
|
(81
|
)
|
|||||
|
Recoveries
|
39
|
|
1
|
|
40
|
|
|||||
|
Provision for credit losses
|
28
|
|
(2
|
)
|
26
|
|
|||||
|
Other (a)
|
(5
|
)
|
—
|
|
(5
|
)
|
|||||
|
Ending balance
|
$
|
342
|
|
$
|
27
|
|
$
|
369
|
|
||
|
Analysis of ending balance of allowance for credit losses
|
|
|
|
|
|
|
|||||
|
Collective impairment allowance
|
$
|
320
|
|
$
|
26
|
|
$
|
346
|
|
||
|
Specific impairment allowance
|
22
|
|
1
|
|
23
|
|
|||||
|
Ending balance
|
342
|
|
27
|
|
369
|
|
|||||
|
Analysis of ending balance of finance receivables
|
|
|
|
|
|
|
|||||
|
Collectively evaluated for impairment
|
47,015
|
|
29,502
|
|
76,517
|
|
|||||
|
Specifically evaluated for impairment
|
418
|
|
66
|
|
484
|
|
|||||
|
Recorded investment
|
47,433
|
|
29,568
|
|
77,001
|
|
|||||
|
Ending balance, net of allowance for credit losses
|
$
|
47,091
|
|
$
|
29,541
|
|
$
|
76,632
|
|
||
__________
|
(a)
|
Represents amounts related to translation adjustments.
|
22
Item 1. Financial Statements (Continued)
FORD MOTOR COMPANY AND SUBSIDIARIES
NOTES TO THE FINANCIAL STATEMENTS
NOTE 5. INVENTORIES
All inventories are stated at the lower of cost or market. Cost for a substantial portion of U.S. inventories is determined on a last-in, first-out (“LIFO”) basis. LIFO was used for
27%
and
20%
of total inventories at
March 31, 2014
and
December 31, 2013
, respectively. Cost of other inventories is determined by costing methods that approximate a first-in, first-out (“FIFO”) basis.
Inventories were as follows (in millions):
|
|
March 31,
2014 |
December 31,
2013 |
|||||
|
Raw materials, work-in-process, and supplies
|
$
|
4,027
|
|
$
|
3,613
|
|
|
|
Finished products
|
5,818
|
|
5,058
|
|
|||
|
Total inventories under FIFO
|
9,845
|
|
8,671
|
|
|||
|
Less: LIFO adjustment
|
(971
|
)
|
(963
|
)
|
|||
|
Total inventories
|
$
|
8,874
|
|
$
|
7,708
|
|
|
NOTE 6. VARIABLE INTEREST ENTITIES
VIEs of Which We are Not the Primary Beneficiary
We have invested in joint ventures that are considered VIEs and in which the power to direct economically significant activities is shared with the joint venture partner. Our investments in the joint ventures are accounted for as equity method investments and are included in
Equity in net assets of affiliated companies
. Our maximum exposure to any potential losses associated with these joint ventures is limited to our equity investment, and is
$354 million
and
$336 million
at
March 31, 2014
and
December 31, 2013
, respectively.
VIEs of Which We are the Primary Beneficiary
Through Ford Credit, we securitize, transfer, and service financial assets associated with consumer finance receivables, operating leases, and wholesale loans. Our securitization transactions typically involve the legal transfer of financial assets to bankruptcy remote special purpose entities. The third-party investors in these securitization entities have legal recourse only to the assets securing the debt and do not have recourse to us, except for the customary representation and warranty provisions. In addition, the cash flows generated by the assets are restricted only to pay such liabilities. We generally retain economic interests in the asset-backed securitization transactions, which are retained in the form of senior or subordinated interests, cash reserve accounts, residual interests, and servicing rights. For accounting purposes, we are precluded from recording the transfers of assets in securitization transactions as sales.
In most cases, the bankruptcy remote special purpose entities meet the definition of VIEs for which we have determined we have both the power to direct the activities of the entity that most significantly impact the entity's performance and the obligation to absorb losses or the right to receive benefits of the entity that could be significant, and would therefore also be consolidated. We account for all securitization transactions as if they were secured financing and therefore the assets, liabilities and related activity of these VIEs are consolidated in our financial results and are included in amounts presented on the face of our consolidated balance sheet and in the related footnotes.
23
Item 1. Financial Statements (Continued)
FORD MOTOR COMPANY AND SUBSIDIARIES
NOTES TO THE FINANCIAL STATEMENTS
NOTE 7. OTHER LIABILITIES AND DEFERRED REVENUE
Other liabilities and deferred revenue were as follows (in millions):
|
|
March 31,
2014 |
December 31,
2013 |
|||||
|
Automotive Sector
|
|
|
|||||
|
Current
|
|
|
|||||
|
Dealer and dealers’ customer allowances and claims
|
$
|
7,986
|
|
$
|
7,730
|
|
|
|
Deferred revenue
|
2,592
|
|
2,817
|
|
|||
|
Employee benefit plans
|
1,719
|
|
1,706
|
|
|||
|
Accrued interest
|
194
|
|
262
|
|
|||
|
Other postretirement employee benefits (“OPEB”)
|
384
|
|
387
|
|
|||
|
Pension (a)
|
353
|
|
327
|
|
|||
|
Other
|
3,210
|
|
3,308
|
|
|||
|
Total Automotive other liabilities and deferred revenue
|
16,438
|
|
16,537
|
|
|||
|
Non-current
|
|
|
|
|
|||
|
Pension (a)
|
8,847
|
|
9,288
|
|
|||
|
OPEB
|
5,435
|
|
5,502
|
|
|||
|
Dealer and dealers’ customer allowances and claims
|
2,367
|
|
2,028
|
|
|||
|
Deferred revenue
|
2,516
|
|
2,534
|
|
|||
|
Employee benefit plans
|
1,218
|
|
1,213
|
|
|||
|
Other
|
1,253
|
|
1,524
|
|
|||
|
Total Automotive other liabilities and deferred revenue
|
21,636
|
|
22,089
|
|
|||
|
Total Automotive sector
|
38,074
|
|
38,626
|
|
|||
|
Financial Services Sector
|
2,067
|
|
2,260
|
|
|||
|
Total
|
$
|
40,141
|
|
$
|
40,886
|
|
|
__________
|
(a)
|
Balances at
March 31, 2014
reflect net pension liabilities at
December 31, 2013
, updated for service and interest cost, expected return on assets, separation expense, actual benefit payments, and cash contributions. The discount rate and rate of expected return assumptions are unchanged from year-end
2013
.
|
24
Item 1. Financial Statements (Continued)
FORD MOTOR COMPANY AND SUBSIDIARIES
NOTES TO THE FINANCIAL STATEMENTS
NOTE 8. RETIREMENT BENEFITS
Defined Benefit Plans - Expense
The pre-tax expense for our defined benefit pension and OPEB plans for the periods ended
March 31
was as follows (in millions):
|
First Quarter
|
|||||||||||||||||||||||
|
|
Pension Benefits
|
|
|
||||||||||||||||||||
|
|
U.S. Plans
|
Non-U.S. Plans
|
Worldwide OPEB
|
||||||||||||||||||||
|
|
2014
|
2013
|
2014
|
2013
|
2014
|
2013
|
|||||||||||||||||
|
Service cost
|
$
|
127
|
|
$
|
152
|
|
$
|
118
|
|
$
|
122
|
|
$
|
13
|
|
$
|
16
|
|
|||||
|
Interest cost
|
498
|
|
478
|
|
300
|
|
287
|
|
67
|
|
65
|
|
|||||||||||
|
Expected return on assets
|
(678
|
)
|
(724
|
)
|
(379
|
)
|
(349
|
)
|
—
|
|
—
|
|
|||||||||||
|
Amortization of:
|
|
|
|
|
|
|
|
|
|
|
|
|
|||||||||||
|
Prior service costs/(credits)
|
39
|
|
43
|
|
14
|
|
17
|
|
(57
|
)
|
(71
|
)
|
|||||||||||
|
(Gains)/Losses
|
51
|
|
195
|
|
148
|
|
173
|
|
24
|
|
40
|
|
|||||||||||
|
Separation programs/other
|
—
|
|
1
|
|
16
|
|
9
|
|
1
|
|
—
|
|
|||||||||||
|
(Gains)/Losses from curtailments and settlements
|
—
|
|
—
|
|
14
|
|
—
|
|
—
|
|
—
|
|
|||||||||||
|
Net expense/(income)
|
$
|
37
|
|
$
|
145
|
|
$
|
231
|
|
$
|
259
|
|
$
|
48
|
|
$
|
50
|
|
|||||
Pension Plan Contributions
In 2014, we expect to contribute
$1.5 billion
from Automotive cash and cash equivalents to our worldwide funded pension plans (most of which are mandatory contributions), and to make
$400 million
of benefit payments to participants in unfunded plans, for a total of
$1.9 billion
. In the first quarter of 2014, we contributed
$500 million
to our worldwide funded pension plans and made
$100 million
of benefit payments to participants in unfunded plans.
25
Item 1. Financial Statements (Continued)
FORD MOTOR COMPANY AND SUBSIDIARIES
NOTES TO THE FINANCIAL STATEMENTS
NOTE 9. DEBT
The carrying value of debt was
$117 billion
and
$114.7 billion
at
March 31, 2014
and
December 31, 2013
, respectively. The following table details the carrying value of our debt by Automotive sector and Financial Services sector (in millions):
|
Automotive Sector
|
March 31,
2014 |
December 31,
2013 |
|||||
|
Debt payable within one year
|
|
|
|||||
|
Short-term
|
$
|
677
|
|
$
|
562
|
|
|
|
Long-term payable within one year
|
|
|
|
|
|||
|
U.S. Department of Energy (“DOE”) Advanced Technology Vehicles Manufacturing (“ATVM”) Incentive Program
|
591
|
|
591
|
|
|||
|
EIB Credit Facilities
|
552
|
|
—
|
|
|||
|
Unamortized (discount)/premium
|
5
|
|
—
|
|
|||
|
Other debt
|
261
|
|
104
|
|
|||
|
Total debt payable within one year
|
2,086
|
|
1,257
|
|
|||
|
Long-term debt payable after one year
|
|
|
|
|
|||
|
Public unsecured debt securities
|
6,634
|
|
6,799
|
|
|||
|
Unamortized (discount)/premium
|
(147
|
)
|
(148
|
)
|
|||
|
Convertible notes
|
883
|
|
908
|
|
|||
|
Unamortized (discount)/premium
|
(98
|
)
|
(110
|
)
|
|||
|
DOE ATVM Incentive Program
|
4,276
|
|
4,424
|
|
|||
|
EIB Credit Facilities
|
749
|
|
1,295
|
|
|||
|
Other debt
|
1,327
|
|
1,255
|
|
|||
|
Unamortized (discount)/premium
|
(1
|
)
|
3
|
|
|||
|
Total long-term debt payable after one year
|
13,623
|
|
14,426
|
|
|||
|
Total Automotive sector
|
$
|
15,709
|
|
$
|
15,683
|
|
|
|
Fair value of Automotive sector debt (a)
|
$
|
17,672
|
|
$
|
17,301
|
|
|
|
Financial Services Sector
|
|
|
|
|
|||
|
Short-term debt
|
|
|
|
|
|||
|
Asset-backed commercial paper
|
$
|
1,331
|
|
$
|
3,364
|
|
|
|
Other asset-backed short-term debt
|
1,972
|
|
1,963
|
|
|||
|
Floating rate demand notes
|
5,513
|
|
5,319
|
|
|||
|
Commercial paper
|
2,464
|
|
2,003
|
|
|||
|
Other short-term debt
|
2,522
|
|
2,345
|
|
|||
|
Total short-term debt
|
13,802
|
|
14,994
|
|
|||
|
Long-term debt
|
|
|
|
|
|||
|
Unsecured debt
|
|
|
|
|
|||
|
Notes payable within one year
|
5,575
|
|
4,475
|
|
|||
|
Notes payable after one year
|
39,906
|
|
38,914
|
|
|||
|
Asset-backed debt
|
|
|
|
|
|||
|
Notes payable within one year
|
17,425
|
|
17,337
|
|
|||
|
Notes payable after one year
|
24,478
|
|
23,273
|
|
|||
|
Unamortized (discount)/premium
|
(81
|
)
|
(91
|
)
|
|||
|
Fair value adjustments (b)
|
190
|
|
103
|
|
|||
|
Total long-term debt
|
87,493
|
|
84,011
|
|
|||
|
Total Financial Services sector
|
$
|
101,295
|
|
$
|
99,005
|
|
|
|
Fair value of Financial Services sector debt (a)
|
$
|
104,501
|
|
$
|
102,399
|
|
|
__________
|
(a)
|
The fair value of debt includes
$504 million
and
$377 million
of Automotive sector short-term debt and
$10.5 billion
and
$9.7 billion
of Financial Services sector short-term debt at
March 31, 2014
and
December 31, 2013
, respectively, carried at cost which approximates fair value. All debt is categorized within Level 2 of the fair value hierarchy. See Note 2 for additional information.
|
|
(b)
|
Adjustments related to designated fair value hedges of unsecured debt.
|
26
Item 1. Financial Statements (Continued)
FORD MOTOR COMPANY AND SUBSIDIARIES
NOTES TO THE FINANCIAL STATEMENTS
NOTE 10. DERIVATIVE FINANCIAL INSTRUMENTS AND HEDGING ACTIVITIES
In the normal course of business, our operations are exposed to global market risks, including the effect of changes in foreign currency exchange rates, certain commodity prices, and interest rates. To manage these risks, we enter into various derivatives contracts:
|
•
|
Foreign currency exchange contracts, including forwards and options, that are used to manage foreign exchange exposure;
|
|
•
|
Commodity contracts, including forwards and options, that are used to manage commodity price risk;
|
|
•
|
Interest rate contracts including swaps, caps, and floors that are used to manage the effects of interest rate fluctuations; and
|
|
•
|
Cross-currency interest rate swap contracts that are used to manage foreign currency and interest rate exposures on foreign-denominated debt.
|
Our derivatives are over-the-counter customized derivative transactions and are not exchange-traded. We review our hedging program, derivative positions, and overall risk management strategy on a regular basis.
Derivative Financial Instruments and Hedge Accounting.
Derivatives are recorded on the balance sheet at fair value and presented on a gross basis.
We have elected to apply hedge accounting to certain derivatives. Derivatives that are designated in hedging relationships are evaluated for effectiveness using regression analysis at the time they are designated and throughout the hedge period.
Some derivatives do not qualify for hedge accounting; for others, we elect not to apply hedge accounting. Regardless, we only enter into transactions that we believe will be highly effective at offsetting the underlying economic risk.
Cash Flow Hedges.
Our Automotive sector has designated certain forward contracts as cash flow hedges of forecasted transactions with exposure to foreign currency exchange and commodity price risks.
The effective portion of changes in the fair value of cash flow hedges is deferred in
Accumulated other comprehensive income/(loss)
and is recognized in
Automotive cost of sales
when the hedged item affects earnings. The ineffective portion is reported in
Automotive cost of sales
in the period of measurement. Our policy is to de-designate foreign currency exchange cash flow hedges prior to the time forecasted transactions are recognized as assets or liabilities on the balance sheet and report subsequent changes in fair value through
Automotive cost of sales
. If it becomes probable that the originally-forecasted transaction will not occur, the related amount included in
Accumulated other comprehensive income/(loss)
is reclassified and recognized in earnings. The majority of our cash flow hedges mature in
two
years or less.
Fair Value Hedges.
Our Financial Services sector
uses derivatives to reduce the risk of changes in the fair value of debt. We have designated certain receive-fixed, pay-float interest rate swaps as fair value hedges of fixed-rate debt. The risk being hedged is the risk of changes in the fair value of the hedged debt attributable to changes in the benchmark interest rate. If the hedge relationship is deemed to be highly effective, we record the changes in the fair value of the hedged debt related to the risk being hedged in
Financial Services debt
with the offset in
Financial Services other income/(loss), net
.
The change in fair value of the related derivative (excluding accrued interest) also is recorded in
Financial Services other income/(loss), net.
Net interest settlements and accruals on fair value hedges are excluded from the assessment of hedge effectiveness and are reported in
Interest expense
. The cash flows associated with fair value hedges are reported in
Net cash provided by/(used in) operating activities
on our statement of cash flows.
Hedge ineffectiveness is the difference between the change in fair value of the derivative instrument and the change in fair value of the hedged item attributable to changes in the benchmark interest rate. Ineffectiveness is recorded directly to income.
When a fair value hedge is de-designated, or when the derivative is terminated before maturity, the fair value adjustment to the hedged debt continues to be reported as part of the carrying value of the debt and is amortized over its remaining life.
27
Item 1. Financial Statements (Continued)
FORD MOTOR COMPANY AND SUBSIDIARIES
NOTES TO THE FINANCIAL STATEMENTS
NOTE 10. DERIVATIVE FINANCIAL INSTRUMENTS AND HEDGING ACTIVITIES
(Continued)
Derivatives Not Designated as Hedging Instruments.
Our Automotive sector reports changes in the fair value of derivatives not designated as hedging instruments through
Automotive cost of sales
. Cash flows associated with non-designated or de-designated derivatives are reported in
Net cash provided by/(used in) investing activities
on our statements of cash flows.
Our Financial Services sector reports net interest settlements and accruals and changes in the fair value of interest rate swaps not designated as hedging instruments in
Financial Services other income/(loss) net
. Foreign currency revaluation on accrued interest along with gains and losses on foreign exchange contracts and cross currency interest rate swaps are reported in
Financial Services other income/(loss) net
. Cash flows associated with non-designated or de-designated derivatives are reported in
Net cash provided by/(used in) investing activities
on our statements of cash flows
.
Normal Purchases and Normal Sales Classification.
We have elected to apply the normal purchases and normal sales classification for physical supply contracts that are entered into for the purpose of procuring commodities to be used in production over a reasonable period in the normal course of our business.
Income Effect of Derivative Financial Instruments
The following table summarizes by hedge designation the pre-tax gains/(losses) recorded in Other comprehensive income/(loss) (“OCI”), reclassified from
Accumulated other comprehensive income/(loss)
(“AOCI”) to income and/or recognized directly in income for the periods ended
March 31
(in millions):
|
|
First Quarter 2014
|
First Quarter 2013
|
|||||||||||||||||||||
|
|
Gains/(Losses) Recorded
in OCI
|
Gains/(Losses)
Reclassified
from AOCI
to Income
|
Gains/(Losses) Recognized
in Income
|
Gains/(Losses) Recorded
in OCI
|
Gains/(Losses)
Reclassified
from AOCI
to Income
|
Gains/(Losses) Recognized
in Income
|
|||||||||||||||||
|
Automotive Sector
|
|
|
|
|
|
|
|||||||||||||||||
|
Cash flow hedges
|
|
|
|
|
|
|
|||||||||||||||||
|
Foreign currency exchange and commodity contracts
|
$
|
130
|
|
$
|
68
|
|
$
|
—
|
|
$
|
55
|
|
$
|
(72
|
)
|
$
|
(3
|
)
|
|||||
|
Derivatives not designated as hedging instruments
|
|
|
|
|
|
|
|
|
|
|
|
|
|||||||||||
|
Foreign currency exchange contracts
|
|
|
|
|
$
|
(44
|
)
|
|
|
|
|
$
|
12
|
|
|||||||||
|
Commodity contracts
|
|
|
|
|
(12
|
)
|
|
|
|
|
(42
|
)
|
|||||||||||
|
Total
|
|
|
|
|
$
|
(56
|
)
|
|
|
|
|
$
|
(30
|
)
|
|||||||||
|
Financial Services Sector
|
|
|
|
|
|
|
|
|
|
|
|
|
|||||||||||
|
Fair value hedges
|
|
|
|
|
|
|
|
|
|
|
|
|
|||||||||||
|
Interest rate contracts
|
|
|
|
|
|
|
|
|
|
|
|
|
|||||||||||
|
Net interest settlements and accruals excluded from the assessment of hedge effectiveness
|
|
|
|
|
$
|
69
|
|
|
|
|
|
$
|
61
|
|
|||||||||
|
Ineffectiveness (a)
|
|
|
|
|
5
|
|
|
|
|
|
(6
|
)
|
|||||||||||
|
Total
|
|
|
|
|
$
|
74
|
|
|
|
|
|
$
|
55
|
|
|||||||||
|
Derivatives not designated as hedging instruments
|
|
|
|
|
|
|
|
|
|
|
|
|
|||||||||||
|
Interest rate contracts
|
|
|
|
|
$
|
(18
|
)
|
|
|
|
|
$
|
1
|
|
|||||||||
|
Foreign currency exchange contracts
|
|
|
|
|
(5
|
)
|
|
|
|
|
81
|
|
|||||||||||
|
Cross-currency interest rate swap contracts
|
|
|
|
|
(5
|
)
|
|
|
|
|
138
|
|
|||||||||||
|
Total
|
|
|
|
|
$
|
(28
|
)
|
|
|
|
|
$
|
220
|
|
|||||||||
__________
|
(a)
|
For the
first quarter
of
2014
and
2013
, hedge ineffectiveness reflects change in fair value on derivatives of
$105 million
gain and
$91 million
loss, respectively, and change in value on hedged debt attributable to the change in benchmark interest rate of
$100 million
loss and
$85 million
gain, respectively.
|
28
Item 1. Financial Statements (Continued)
FORD MOTOR COMPANY AND SUBSIDIARIES
NOTES TO THE FINANCIAL STATEMENTS
NOTE 10. DERIVATIVE FINANCIAL INSTRUMENTS AND HEDGING ACTIVITIES
(Continued)
Balance Sheet Effect of Derivative Financial Instruments
The following table summarizes the notional amount and estimated fair value of our derivative financial instruments (in millions):
|
|
March 31, 2014
|
December 31, 2013
|
|||||||||||||||||||||
|
Notional
|
Fair Value of
Assets
|
Fair Value of
Liabilities
|
Notional
|
Fair Value of
Assets
|
Fair Value of
Liabilities
|
||||||||||||||||||
|
Automotive Sector
|
|
|
|
||||||||||||||||||||
|
Cash flow hedges
|
|
|
|
||||||||||||||||||||
|
Foreign currency exchange and commodity contracts
|
$
|
17,400
|
|
$
|
402
|
|
$
|
169
|
|
$
|
16,238
|
|
$
|
413
|
|
$
|
189
|
|
|||||
|
Derivatives not designated as hedging instruments
|
|||||||||||||||||||||||
|
Foreign currency exchange contracts
|
13,780
|
|
115
|
|
160
|
|
11,599
|
|
144
|
|
210
|
|
|||||||||||
|
Commodity contracts
|
2,952
|
|
27
|
|
12
|
|
3,006
|
|
23
|
|
19
|
|
|||||||||||
|
Total derivatives not designated as hedging instruments
|
16,732
|
|
142
|
|
172
|
|
14,605
|
|
167
|
|
229
|
|
|||||||||||
|
Total Automotive sector derivative financial instruments
|
$
|
34,132
|
|
$
|
544
|
|
$
|
341
|
|
$
|
30,843
|
|
$
|
580
|
|
$
|
418
|
|
|||||
|
Financial Services Sector
|
|
|
|
|
|
|
|||||||||||||||||
|
Fair value hedges
|
|
|
|
|
|
|
|||||||||||||||||
|
Interest rate contracts
|
$
|
18,637
|
|
$
|
338
|
|
$
|
175
|
|
$
|
18,778
|
|
$
|
360
|
|
$
|
179
|
|
|||||
|
Derivatives not designated as hedging instruments
|
|||||||||||||||||||||||
|
Interest rate contracts
|
66,917
|
|
325
|
|
109
|
|
69,863
|
|
224
|
|
126
|
|
|||||||||||
|
Foreign currency exchange contracts
|
2,271
|
|
4
|
|
21
|
|
2,410
|
|
1
|
|
25
|
|
|||||||||||
|
Cross-currency interest rate swap contracts
|
2,927
|
|
1
|
|
165
|
|
2,620
|
|
—
|
|
176
|
|
|||||||||||
|
Total derivatives not designated as hedging instruments
|
72,115
|
|
330
|
|
295
|
|
74,893
|
|
225
|
|
327
|
|
|||||||||||
|
Total Financial Services sector derivative financial instruments
|
$
|
90,752
|
|
$
|
668
|
|
$
|
470
|
|
$
|
93,671
|
|
$
|
585
|
|
$
|
506
|
|
|||||
Notional amounts are presented on a gross basis. The notional amounts of the derivative financial instruments do not represent amounts exchanged by the parties and, therefore, are not a direct measure of our exposure to the financial risks described above. The amounts exchanged are calculated by reference to the notional amounts and by other terms of the derivatives, such as interest rates, foreign currency exchange rates, or commodity volumes and prices.
On our sector balance sheet, derivative assets are reported in
Other current assets
and
Other assets
for
our
Automotive sector and in
Other assets
for our Financial Services sector. Derivative liabilities are reported in
Payables
and
Other liabilities and deferred revenue
for our Automotive sector and in
Other liabilities and deferred revenue
for our Financial Services sector.
29
Item 1. Financial Statements (Continued)
FORD MOTOR COMPANY AND SUBSIDIARIES
NOTES TO THE FINANCIAL STATEMENTS
NOTE 10. DERIVATIVE FINANCIAL INSTRUMENTS AND HEDGING ACTIVITIES
(Continued)
Counterparty Risk and Collateral
The use of derivatives exposes us to the risk that a counterparty may default on a derivative contract. We establish exposure limits for each counterparty to minimize this risk and provide counterparty diversification. Substantially all of our derivative exposures are with counterparties that have an investment grade rating. The aggregate fair value of our derivative instruments in asset positions on
March 31, 2014
was
$1.2 billion
, representing the maximum loss that we would recognize at that date if all counterparties failed to perform as contracted. We enter into master agreements with counterparties that may allow for netting of exposures in the event of default or termination of the counterparty agreement due to breach of contract.
The gross and net amounts of derivative assets and liabilities were as follows (in millions):
|
March 31, 2014
|
December 31, 2013
|
||||||||||||||
|
Fair Value of Assets
|
Fair Value of Liabilities
|
Fair Value of Assets
|
Fair Value of Liabilities
|
||||||||||||
|
Automotive Sector
|
|||||||||||||||
|
Gross derivative amounts recognized in balance sheet
|
$
|
544
|
|
$
|
341
|
|
$
|
580
|
|
$
|
418
|
|
|||
|
Gross derivative amounts not offset in the balance sheet that are eligible for offsetting
|
(317
|
)
|
(317
|
)
|
(359
|
)
|
(359
|
)
|
|||||||
|
Net amount
|
$
|
227
|
|
$
|
24
|
|
$
|
221
|
|
$
|
59
|
|
|||
|
Financial Services Sector
|
|||||||||||||||
|
Gross derivative amounts recognized in balance sheet
|
$
|
668
|
|
$
|
470
|
|
$
|
585
|
|
$
|
506
|
|
|||
|
Gross derivative amounts not offset in the balance sheet that are eligible for offsetting
|
(305
|
)
|
(305
|
)
|
(296
|
)
|
(296
|
)
|
|||||||
|
Net amount
|
$
|
363
|
|
$
|
165
|
|
$
|
289
|
|
$
|
210
|
|
|||
We may receive or pledge cash collateral with certain counterparties based on our net position with regard to foreign currency and commodity derivative contracts, which is reported in
Other assets
or
Payables
on our consolidated balance sheet. As of
March 31, 2014
and
December 31, 2013
, we did not receive or pledge any cash collateral.
We include an adjustment for non-performance risk in the measurement of fair value of derivative instruments. Our adjustment for non-performance risk is relative to a measure based on an unadjusted inter-bank deposit rate (e.g., LIBOR). For our Automotive sector, at
March 31, 2014
and
December 31, 2013
, our adjustment decreased derivative assets by
$1 million
and
$1 million
, respectively, and decreased derivative liabilities by
$1 million
and
$1 million
, respectively. For our Financial Services sector, at
March 31, 2014
and
December 31, 2013
, our adjustment increased derivative assets by
$2 million
and
$2 million
, respectively, and decreased derivative liabilities by
$12 million
and
$25 million
, respectively. See Note 2 for more detail on valuation methodologies.
30
Item 1. Financial Statements (Continued)
FORD MOTOR COMPANY AND SUBSIDIARIES
NOTES TO THE FINANCIAL STATEMENTS
NOTE 11. REDEEMABLE NONCONTROLLING INTEREST
AutoAlliance International, Inc. (“AAI”) is a
50
/
50
joint venture between Ford and Mazda Motor Corporation (“Mazda”) that owns an automobile assembly plant in Flat Rock, Michigan. On September 1, 2012, we granted to Mazda a put option to sell and received a call option to purchase from Mazda the
50%
equity interest in AAI that is held by Mazda (“the Option”). The Option is exercisable at a price of
$339 million
and is recorded as a redeemable noncontrolling interest in the mezzanine section of our balance sheet. As a result of an amendment, Mazda’s share in AAI is now redeemable by Ford or Mazda for a
three
-year period commencing in the fourth quarter of 2014, instead of September 1, 2015. The change in timing does not change the Option exercise price. The following table summarizes the change in our carrying value of the redeemable noncontrolling interest for the periods ended
March 31
(in millions):
|
First Quarter
|
|||||||
|
2014
|
2013
|
||||||
|
Beginning balance
|
$
|
331
|
|
$
|
322
|
|
|
|
Accretion to the redemption value of noncontrolling interest (recognized in
Interest expense)
|
3
|
|
2
|
|
|||
|
Payments (a)
|
(3
|
)
|
—
|
|
|||
|
Ending balance
|
$
|
331
|
|
$
|
324
|
|
|
__________
|
(a)
|
Represents a return of Mazda's investment in AAI that we are contractually obligated to pay as long as they retain their ownership in AAI.
|
31
Item 1. Financial Statements (Continued)
FORD MOTOR COMPANY AND SUBSIDIARIES
NOTES TO THE FINANCIAL STATEMENTS
NOTE 12. ACCUMULATED OTHER COMPREHENSIVE INCOME/(LOSS)
The following table summarizes the changes in the accumulated balances for each component of AOCI attributable to Ford Motor Company for the periods ended
March 31
(in millions):
|
First Quarter
|
|||||||
|
2014
|
2013
|
||||||
|
Foreign currency translation
|
|||||||
|
Beginning balance
|
$
|
(1,746
|
)
|
$
|
(1,245
|
)
|
|
|
Net gains/(losses) on foreign currency translation (net of tax of $53 and $0)
|
(235
|
)
|
(357
|
)
|
|||
|
Reclassifications to net income (a)
|
—
|
|
(9
|
)
|
|||
|
Other comprehensive income/(loss), net of tax
|
(235
|
)
|
(366
|
)
|
|||
|
Ending balance
|
$
|
(1,981
|
)
|
$
|
(1,611
|
)
|
|
|
Derivative instruments (b)
|
|||||||
|
Beginning balance
|
$
|
40
|
|
$
|
(175
|
)
|
|
|
Net gains/(losses) on derivative instruments (net of tax benefit of $48 and tax of $7)
|
178
|
|
48
|
|
|||
|
Reclassifications to net income (net of tax of $18 and $23) (c)
|
(86
|
)
|
49
|
|
|||
|
Other comprehensive income/(loss), net of tax
|
92
|
|
97
|
|
|||
|
Ending balance
|
$
|
132
|
|
$
|
(78
|
)
|
|
|
Pension and other postretirement benefits
|
|||||||
|
Beginning balance
|
$
|
(16,524
|
)
|
$
|
(21,438
|
)
|
|
|
Prior service cost arising during the period
|
—
|
|
—
|
|
|||
|
Net gains/(losses) arising during the period (net of tax benefit of $3 and $0)
|
(10
|
)
|
—
|
|
|||
|
Amortization of prior service costs/(credits) included in net income (net of tax benefit of $5 and $7) (d)
|
1
|
|
(4
|
)
|
|||
|
Amortization of (gains)/losses included in net income (net of tax of $72 and $121) (d)
|
165
|
|
287
|
|
|||
|
Translation impact on non-U.S. plans
|
27
|
|
308
|
|
|||
|
Other comprehensive income/(loss), net of tax
|
183
|
|
591
|
|
|||
|
Ending balance
|
$
|
(16,341
|
)
|
$
|
(20,847
|
)
|
|
|
Total AOCI ending balance at March 31
|
$
|
(18,190
|
)
|
$
|
(22,536
|
)
|
|
__________
|
(a)
|
The accumulated translation adjustments related to an investment in a foreign subsidiary are reclassified to net income upon sale or upon complete or substantially complete liquidation of the entity and are recognized in
Automotive interest income and other income/(loss), net
or
Financial Services other income/(loss), net.
|
|
(b)
|
We expect to reclassify existing net gains of
$197 million
from
Accumulated other comprehensive income/(loss)
to
Automotive cost of sales
during the next twelve months as the underlying exposures are realized.
|
|
(c)
|
Gains/(losses) on cash flow hedges are reclassified from AOCI to income when the hedged item affects earnings and is recognized in
Automotive cost of sales.
See Note 10 for additional information.
|
|
(d)
|
These AOCI components are included in the computation of net periodic pension cost. See Note 8 for additional information.
|
32
Item 1. Financial Statements (Continued)
FORD MOTOR COMPANY AND SUBSIDIARIES
NOTES TO THE FINANCIAL STATEMENTS
NOTE 13. OTHER INCOME/(LOSS)
Automotive Sector
The following table summarizes amounts included in
Automotive interest income and other income/(loss), net
for the periods ended
March 31
(in millions):
|
First Quarter
|
|||||||
|
|
2014
|
2013
|
|||||
|
Interest income
|
$
|
70
|
|
$
|
44
|
|
|
|
Realized and unrealized gains/(losses) on cash equivalents and marketable securities
|
(33
|
)
|
75
|
|
|||
|
Gains/(Losses) on changes in investments in affiliates
|
1
|
|
(12
|
)
|
|||
|
Gains/(Losses) on extinguishment of debt
|
(5
|
)
|
(18
|
)
|
|||
|
Royalty income
|
154
|
|
113
|
|
|||
|
Other
|
27
|
|
43
|
|
|||
|
Total
|
$
|
214
|
|
$
|
245
|
|
|
Financial Services Sector
The following table summarizes amounts included in
Financial Services other income/(loss), net
for the periods ended
March 31
(in millions):
|
First Quarter
|
|||||||
|
|
2014
|
2013
|
|||||
|
Interest income (investment-related)
|
$
|
11
|
|
$
|
14
|
|
|
|
Realized and unrealized gains/(losses) on cash equivalents and marketable securities
|
3
|
|
1
|
|
|||
|
Insurance premiums earned
|
32
|
|
29
|
|
|||
|
Other
|
22
|
|
52
|
|
|||
|
Total
|
$
|
68
|
|
$
|
96
|
|
|
NOTE 14. EMPLOYEE SEPARATION ACTIONS AND EXIT AND DISPOSAL ACTIVITIES
We record costs associated with voluntary separations at the time of employee acceptance, unless the acceptance requires explicit approval by the Company. We record costs associated with involuntary separation programs when management has approved the plan for separation, the affected employees are identified, and it is unlikely that actions required to complete the separation plan will change significantly. When a plan of separation requires approval by or consultation with the relevant labor organization or government, the costs are recorded after the required approval or consultation process is complete. Costs associated with benefits that are contingent on the employee continuing to provide service are accrued over the required service period.
Automotive Sector
Business Restructuring - Europe
In October 2012, we committed to commence a transformation plan for our Europe operations. As part of this plan, we closed two manufacturing facilities in the United Kingdom in 2013 and are in the process of closing our assembly plant in Genk, Belgium at the end of 2014. The Genk closure was subject to an information and consultation process with employee representatives, which was completed in June 2013. The costs related to these closures were recorded beginning in the second quarter of 2013.
33
Item 1. Financial Statements (Continued)
FORD MOTOR COMPANY AND SUBSIDIARIES
NOTES TO THE FINANCIAL STATEMENTS
NOTE 14. EMPLOYEE SEPARATION ACTIONS AND EXIT AND DISPOSAL ACTIVITIES (
Continued
)
Separation-related costs, recorded in
Automotive cost of sales
and
Selling, administrative and other expenses
, include both the costs associated with voluntary separation programs in the United Kingdom and involuntary employee actions at Genk, as well as payments to suppliers. The following table summarizes the separation-related activity (excluding
$6 million
of pension-related changes in accruals) recorded in
Other liabilities and deferred revenue
, for the period ended
March 31
(in millions):
|
First Quarter 2014
|
|||
|
Beginning balance
|
$
|
497
|
|
|
Changes in accruals
|
112
|
|
|
|
Payments
|
(22
|
)
|
|
|
Foreign currency translation
|
1
|
|
|
|
Ending balance
|
$
|
588
|
|
Our current estimate of total separation-related costs for the U.K. and Genk facilities is approximately
$1 billion
, excluding approximately
$200 million
of pension-related costs. The separation related costs not yet recorded will be expensed as the employees and suppliers continue to support Genk plant operations.
NOTE 15. INCOME TAXES
For interim tax reporting we estimate one single effective tax rate for tax jurisdictions not subject to a valuation allowance, which is applied to the year-to-date ordinary income/(loss). Tax effects of significant unusual or extraordinary items are excluded from the estimated annual effective tax rate calculation and recognized in the interim period in which they occur.
NOTE 16. AMOUNTS PER SHARE ATTRIBUTABLE TO FORD MOTOR COMPANY COMMON AND CLASS B STOCK
We present both basic and diluted earnings per share (“EPS”) amounts in our financial reporting. Basic EPS excludes dilution and is computed by dividing income available to Common and Class B Stock holders by the weighted-average number of Common and Class B Stock outstanding for the period. Diluted EPS reflects the maximum potential dilution that could occur from our share-based compensation, including “in-the-money” stock options and unvested restricted stock units, and conversion into Ford Common Stock of our outstanding convertible notes. Potential dilutive shares are excluded from the calculation if they have an anti-dilutive effect in the period.
Basic and diluted income per share were calculated using the following (in millions):
|
First Quarter
|
|||||||
|
|
2014
|
2013
|
|||||
|
Basic and Diluted Income Attributable to Ford Motor Company
|
|
|
|||||
|
Basic income
|
$
|
989
|
|
$
|
1,611
|
|
|
|
Effect of dilutive 2016 Convertible Notes (a)
|
12
|
|
13
|
|
|||
|
Effect of dilutive 2036 Convertible Notes (a) (b)
|
—
|
|
—
|
|
|||
|
Diluted income
|
$
|
1,001
|
|
$
|
1,624
|
|
|
|
Basic and Diluted Shares
|
|
|
|
|
|||
|
Basic shares (average shares outstanding)
|
3,946
|
|
3,923
|
|
|||
|
Net dilutive options
|
48
|
|
49
|
|
|||
|
Dilutive 2016 Convertible Notes
|
100
|
|
97
|
|
|||
|
Dilutive 2036 Convertible Notes (b)
|
—
|
|
3
|
|
|||
|
Diluted shares
|
4,094
|
|
4,072
|
|
|||
__________
|
(a)
|
As applicable, includes interest expense, amortization of discount, amortization of fees, and other changes in income or loss that would result from the assumed conversion.
|
|
(b)
|
In December 2013, we elected to terminate the conversion rights of holders under the 2036 Convertible Notes in accordance with their terms effective as of the close of business on January 21, 2014. As a result, any remaining 2036 Convertible Notes after January 21, 2014 cannot be converted to shares and are no longer dilutive.
|
34
Item 1. Financial Statements (Continued)
FORD MOTOR COMPANY AND SUBSIDIARIES
NOTES TO THE FINANCIAL STATEMENTS
NOTE 17. SEGMENT INFORMATION
We have changed our Automotive sector reportable segments to establish a fifth Automotive segment — Middle East & Africa — which includes South Africa and markets that were previously direct export markets in the Middle East and Africa. Previously, South Africa results were included in Asia Pacific Africa and direct export markets were reflected in the results of the producing region or segment. We have realigned reporting of our direct export markets on a geographic basis. Results for prior periods are presented on the same basis.
Our Automotive sector is comprised of the following segments:
North America, South America, Europe, Middle East & Africa, and Asia Pacific.
Included in each segment, described below, are the associated costs to develop, manufacture, distribute, and service vehicles and parts.
North America segment primarily includes the sale of Ford- and Lincoln-brand vehicles and related service parts and accessories in North America.
South America segment primarily includes the sale of Ford-brand vehicles and related service parts and accessories in South America.
Europe segment primarily includes the sale of Ford-brand vehicles, components, and related service parts and accessories in Europe, Turkey, and Russia.
Middle East & Africa segment primarily includes the sale of Ford- and Lincoln-brand vehicles and related service parts and accessories in the Middle East & Africa region.
Asia Pacific segment primarily includes the sale of Ford-brand vehicles and related service parts and accessories in the Asia Pacific region.
Automotive segment results are presented on a “where-sold,” absolute-cost basis, which reflects the profit/(loss) on the sale within the segment in which the ultimate sale is made to our external customer.
This presentation generally eliminates the effect of legal entity transfer prices within the Automotive sector for vehicles, components, and product engineering.
35
Item 1. Financial Statements (Continued)
FORD MOTOR COMPANY AND SUBSIDIARIES
NOTES TO THE FINANCIAL STATEMENTS
NOTE 17. SEGMENT INFORMATION
(Continued)
Key operating data for our business segments for the periods ended or at
March 31
were as follows (in millions):
|
Automotive Sector
|
|||||||||||||||||||||||||||||||
|
|
Operating Segments
|
Reconciling Items
|
|
|
|||||||||||||||||||||||||||
|
|
North
America
|
South
America
|
Europe
|
Middle East & Africa
|
Asia
Pacific
|
Other
Automotive
|
Special
Items
|
Total
|
|||||||||||||||||||||||
|
First Quarter 2014
|
|
|
|
|
|
|
|
|
|
|
|
|
|
|
|||||||||||||||||
|
Revenues
|
$
|
20,445
|
|
$
|
1,891
|
|
$
|
7,754
|
|
$
|
1,155
|
|
$
|
2,631
|
|
$
|
—
|
|
$
|
—
|
|
$
|
33,876
|
|
|||||||
|
Income/(Loss) before income taxes
|
1,500
|
|
(510
|
)
|
(194
|
)
|
54
|
|
291
|
|
(222
|
)
|
(122
|
)
|
797
|
|
|||||||||||||||
|
Total assets at March 31
|
59,656
|
|
7,071
|
|
15,898
|
|
1,264
|
|
8,622
|
|
—
|
|
—
|
|
92,511
|
|
|||||||||||||||
|
First Quarter 2013
|
|
|
|
|
|
|
|
|
|
|
|
|
|
|
|||||||||||||||||
|
Revenues
|
$
|
21,493
|
|
$
|
2,308
|
|
$
|
6,569
|
|
$
|
1,279
|
|
$
|
2,209
|
|
$
|
—
|
|
$
|
—
|
|
$
|
33,858
|
|
|||||||
|
Income/(Loss) before income taxes
|
2,392
|
|
(218
|
)
|
(425
|
)
|
47
|
|
(28
|
)
|
(125
|
)
|
(23
|
)
|
1,620
|
|
|||||||||||||||
|
Total assets at March 31
|
52,370
|
|
6,980
|
|
20,628
|
|
1,119
|
|
7,105
|
|
—
|
|
—
|
|
88,202
|
|
|||||||||||||||
|
|
Financial Services Sector
|
Company
|
|||||||||||||||||||||
|
|
Operating Segments
|
Reconciling Item
|
|
|
|
||||||||||||||||||
|
|
Ford
Credit
|
Other
Financial
Services
|
Elims
|
Total
|
Elims (a)
|
Total
|
|||||||||||||||||
|
First Quarter 2014
|
|
|
|
|
|
|
|
||||||||||||||||
|
Revenues
|
$
|
2,076
|
|
$
|
35
|
|
$
|
(111
|
)
|
$
|
2,000
|
|
$
|
—
|
|
$
|
35,876
|
|
|||||
|
Income/(Loss) before income taxes
|
499
|
|
(37
|
)
|
—
|
|
462
|
|
—
|
|
1,259
|
|
|||||||||||
|
Total assets at March 31
|
118,364
|
|
5,532
|
|
(6,348
|
)
|
117,548
|
|
(2,977
|
)
|
207,082
|
|
|||||||||||
|
First Quarter 2013
|
|
|
|
|
|
|
|
|
|
|
|
|
|||||||||||
|
Revenues
|
$
|
1,854
|
|
$
|
60
|
|
$
|
(123
|
)
|
$
|
1,791
|
|
$
|
—
|
|
$
|
35,649
|
|
|||||
|
Income/(Loss) before income taxes
|
507
|
|
(4
|
)
|
—
|
|
503
|
|
—
|
|
2,123
|
|
|||||||||||
|
Total assets at March 31
|
105,936
|
|
7,285
|
|
(7,174
|
)
|
106,047
|
|
(2,280
|
)
|
191,969
|
|
|||||||||||
__________
|
(a)
|
Includes intersector transactions occurring in the ordinary course of business and deferred tax netting.
|
36
Item 1. Financial Statements (Continued)
FORD MOTOR COMPANY AND SUBSIDIARIES
NOTES TO THE FINANCIAL STATEMENTS
NOTE 18. COMMITMENTS AND CONTINGENCIES
Commitments and contingencies consist primarily of guarantees and indemnifications, litigation and claims, and warranty.
Guarantees and Indemnifications
Guarantees and indemnifications are recorded at fair value at their inception. We regularly review our performance risk under these arrangements, and in the event it becomes probable we will be required to perform under the guarantee or indemnification, the amount of probable payment is recorded.
We guarantee debt and lease obligations of certain joint ventures, as well as certain financial obligations of outside third parties, including suppliers, to support our business and economic growth. Expiration dates vary through 2033, and guarantees will terminate on payment and/or cancellation of the obligation. A payment by us would be triggered by failure of the joint venture or other third party to fulfill its obligation covered by the guarantee. In some circumstances, we are entitled to recover from the third party amounts paid by us under the guarantee. However, our ability to enforce these rights is sometimes stayed until the guaranteed party is paid in full, and may be limited in the event of insolvency of the third party or other circumstances.
In the ordinary course of business, we execute contracts involving indemnifications standard in the industry and indemnifications specific to a transaction, such as the sale of a business. These indemnifications might include and are not limited to claims relating to any of the following: environmental, tax, and shareholder matters; intellectual property rights; power generation contracts; governmental regulations and employment-related matters; dealer, supplier, and other commercial contractual relationships; and financial matters, such as securitizations. Performance under these indemnities generally would be triggered by a breach of terms of the contract or by a third-party claim. While some of these indemnifications are limited in nature, many of them do not limit potential payment. Therefore, we are unable to estimate a maximum amount of future payments that could result from claims made under these unlimited indemnities.
The maximum potential payments and the carrying value of recorded liabilities related to guarantees and limited indemnities were as follows (in millions):
|
|
March 31,
2014 |
December 31,
2013 |
|||||
|
Maximum potential payments
|
$
|
652
|
|
$
|
659
|
|
|
|
Carrying value of recorded liabilities related to guarantees and limited indemnities
|
4
|
|
5
|
|
|||
Litigation and Claims
Various legal actions, proceedings, and claims (generally, “matters”) are pending or may be instituted or asserted against us. These include but are not limited to matters arising out of alleged defects in our products; product warranties; governmental regulations relating to safety, emissions, and fuel economy or other matters; government incentives; tax matters; alleged illegal acts resulting in fines or penalties; financial services; employment-related matters; dealer, supplier, and other contractual relationships; intellectual property rights; environmental matters; shareholder or investor matters; and financial reporting matters. Certain of the pending legal actions are, or purport to be, class actions. Some of the matters involve or may involve claims for compensatory, punitive, or antitrust or other treble damages in very large amounts, or demands for field service actions, environmental remediation programs, sanctions, loss of government incentives, assessments, or other relief, which, if granted, would require very large expenditures.
The extent of our financial exposure to these matters is difficult to estimate. Many matters do not specify a dollar amount for damages, and many others specify only a jurisdictional minimum. To the extent an amount is asserted, our historical experience suggests that in most instances the amount asserted is not a reliable indicator of the ultimate outcome.
Litigation and claims are accrued when losses are deemed probable and reasonably estimable. In evaluating matters for accrual and disclosure purposes, we take into consideration factors such as our historical experience with matters of a similar nature, the specific facts and circumstances asserted, the likelihood of our prevailing, and the severity of any potential loss. We reevaluate and update our accruals as matters progress over time.
37
Item 1. Financial Statements (Continued)
FORD MOTOR COMPANY AND SUBSIDIARIES
NOTES TO THE FINANCIAL STATEMENTS
NOTE 18. COMMITMENTS AND CONTINGENCIES
(Continued)
For the majority of matters, which generally arise out of alleged defects in our products, we establish an accrual based on our extensive historical experience with similar matters, and we do not believe that there is a reasonably possible outcome materially in excess of our accrual.
For the remaining matters, where our historical experience with similar matters is of more limited value (i.e., “non-pattern matters”), we evaluate matters primarily based on the individual facts and circumstances. For non-pattern matters, we evaluate whether there is a reasonable possibility of a material loss in excess of any accrual that can be estimated. Our estimate of reasonably possible loss in excess of our accruals for all material matters currently reflects indirect tax and customs matters, for which we estimate the aggregate risk to be a range of up to a
bout
$3 billion
.
As noted, the litigation process is subject to many uncertainties, and the outcome of individual litigated matters is not predictable with assurance. Our assessments are based on our knowledge and experience, but the ultimate outcome of any matter could require payment substantially in excess of the amount that we have accrued and/or disclosed.
Warranty
Estimated warranty costs are accrued for at the time the vehicle is sold to a dealer. Included in warranty cost accruals are the costs for basic warranty coverages and field service actions (i.e., safety recalls, emission recalls, and other product campaigns) on products sold. These costs are estimates based primarily on historical warranty claim experience. Warranty accruals accounted for in
Other liabilities and deferred revenue
for the periods ended
March 31
were as follows (in millions):
|
First Quarter
|
|||||||
|
|
2014
|
2013
|
|||||
|
Beginning balance
|
$
|
3,927
|
|
$
|
3,656
|
|
|
|
Payments made during the period
|
(578
|
)
|
(583
|
)
|
|||
|
Changes in accrual related to warranties issued during the period
|
502
|
|
502
|
|
|||
|
Changes in accrual related to pre-existing warranties
|
456
|
|
7
|
|
|||
|
Foreign currency translation and other
|
(8
|
)
|
(30
|
)
|
|||
|
Ending balance
|
$
|
4,299
|
|
$
|
3,552
|
|
|
Excluded from the table above are costs accrued for customer satisfaction actions.
38
Report of Independent Registered Public Accounting Firm
To the Board of Directors and Stockholders of
Ford Motor Company
We have reviewed the accompanying consolidated balance sheet of Ford Motor Company and its subsidiaries as of
March 31, 2014
, and the related consolidated statements of income and comprehensive income for the three-month periods ended
March 31, 2014
and
2013
and the condensed consolidated statement of cash flows and the consolidated statement of equity for the three-month periods ended
March 31, 2014
and
2013
. These interim financial statements are the responsibility of the Company’s management.
The accompanying sector balance sheets and the related sector statements of income and of cash flows are presented for purposes of additional analysis and are not a required part of the basic financial statements. Such information has been subjected to the review procedures applied in the review of the basic financial statements.
We conducted our review in accordance with the standards of the Public Company Accounting Oversight Board (United States). A review of interim financial information consists principally of applying analytical procedures and making inquiries of persons responsible for financial and accounting matters. It is substantially less in scope than an audit conducted in accordance with the standards of the Public Company Accounting Oversight Board (United States), the objective of which is the expression of an opinion regarding the financial statements taken as a whole. Accordingly, we do not express such an opinion.
Based on our review, we are not aware of any material modifications that should be made to the accompanying consolidated interim financial statements for them to be in conformity with accounting principles generally accepted in the United States of America.
We previously audited, in accordance with the standards of the Public Company Accounting Oversight Board (United States), the consolidated balance sheet as of
December 31, 2013
, and the related consolidated statements of income, comprehensive income, equity, and cash flows for the year then ended (not presented herein), and in our report dated February 18, 2014, we expressed an unqualified opinion on those consolidated financial statements. As discussed in Note 1 to the accompanying consolidated interim financial statements, the Company changed its method of accounting for its disability benefits. The accompanying December 31, 2013 consolidated balance sheet reflects the cumulative impact of this change.
/s/ PricewaterhouseCoopers LLP
PricewaterhouseCoopers LLP
Detroit, Michigan
May 1, 2014
39
ITEM 2.
Management’s Discussion and Analysis of Financial Condition and Results of Operations.
RESULTS OF OPERATIONS
Our first quarter 2014 pre-tax results and net income were as follows:
|
First Quarter
|
|||||||||||
|
|
2014
|
Better/(Worse)
2013
|
Memo:
Full Year 2013
|
||||||||
|
(Mils.)
|
(Mils.)
|
(Mils.)
|
|||||||||
|
Income
|
|
|
|
||||||||
|
Pre-tax results (excl. special items)
|
$
|
1,381
|
|
$
|
(765
|
)
|
$
|
8,608
|
|
||
|
Special items
|
(122
|
)
|
(99
|
)
|
(1,568
|
)
|
|||||
|
Pre-tax results (incl. special items)
|
1,259
|
|
(864
|
)
|
7,040
|
|
|||||
|
(Provision for)/Benefit from income taxes
|
(270
|
)
|
241
|
|
135
|
|
|||||
|
Net income
|
989
|
|
|
(623
|
)
|
7,175
|
|
||||
|
Less: Income/(Loss) attributable to noncontrolling interests
|
—
|
|
(1
|
)
|
(7
|
)
|
|||||
|
Net income attributable to Ford
|
$
|
989
|
|
$
|
(622
|
)
|
$
|
7,182
|
|
||
Net income
includes certain items (“special items”) that we have grouped into “Personnel and Dealer-Related Items” and “Other Items” to provide useful information to investors about the nature of the special items. The first category includes items related to our efforts to match production capacity and cost structure to market demand and changing model mix and therefore helps investors track amounts related to those activities. The second category includes items that we do not generally consider to be indicative of our ongoing operating activities, and therefore allows investors analyzing our pre-tax results to identify certain infrequent significant items that they may wish to exclude when considering the trend of ongoing operating results.
As detailed in Note 17 of the Notes to the Financial Statements, we allocate special items to a separate reconciling item, as opposed to allocating them among the operating segments and Other Automotive, reflecting the fact that management excludes these items from its review of operating segment results for purposes of measuring segment profitability and allocating resources among the segments.
The following table details Automotive sector pre-tax special items in each category:
|
First Quarter
|
|||||||
|
2014
|
2013
|
||||||
|
(Mils.)
|
(Mils.)
|
||||||
|
Personnel and Dealer-Related Items
|
|||||||
|
Separation-related actions (a)
|
$
|
(122
|
)
|
$
|
(8
|
)
|
|
|
Other Items
|
|
|
|
|
|||
|
Ford Romania consolidation loss
|
—
|
|
(15
|
)
|
|||
|
Total Special Items
|
$
|
(122
|
)
|
$
|
(23
|
)
|
|
__________
|
(a)
|
Primarily related to separation costs for personnel at the Genk and U.K. facilities.
|
Discussion of Automotive sector, Financial Services sector, and Company results of operations below is on a pre-tax basis and excludes special items unless otherwise specifically noted. References to records by Automotive segments are since at least 2000 when we began reporting specific segment results.
40
Item 2. Management’s Discussion and Analysis of Financial Condition and Results of Operations (Continued)
The chart below shows first quarter 2014 pre-tax results by sector:
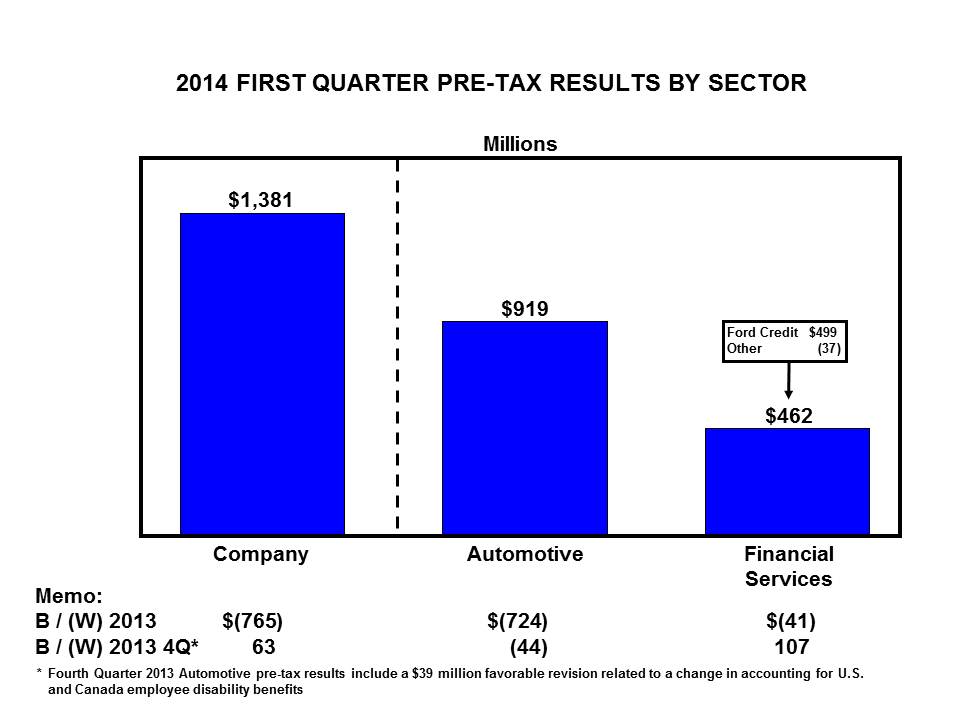
Both sectors — Automotive and Financial Services — contributed to the Company’s first quarter 2014 pre-tax profit of $1.4 billion. Compared with first quarter 2013, the decline is primarily explained by the Automotive sector. Within Automotive, lower results in North and South America were offset partially by an improvement of nearly $600 million from the other Automotive regions. Compared with fourth quarter 2013, Company pre-tax profit was $63 million higher, more than explained by Financial Services.
AUTOMOTIVE SECTOR
In general, we measure year-over-year change in Automotive pre-tax operating profit for our total Automotive sector and reportable segments using the causal factors listed below, with revenue and cost variances calculated at present-year volume and mix and exchange:
|
•
|
Market Factors
:
|
|
◦
|
Volume and Mix -
primarily measures profit variance from changes in wholesale volumes (at prior-year average margin per unit) driven by changes in industry volume, market share, and dealer stocks, as well as the profit variance resulting from changes in product mix, including mix among vehicle lines and mix of trim levels and options within a vehicle line
|
|
◦
|
Net Pricing -
primarily measures profit variance driven by changes in wholesale prices to dealers and marketing incentive programs such as rebate programs, low-rate financing offers, and special lease offers
|
|
•
|
Contribution Costs -
primarily measures profit variance driven by per-unit changes in cost categories that typically vary with volume, such as material costs (including commodity and component costs), warranty expense, and freight and duty costs
|
|
•
|
Other Costs -
primarily measures profit variance driven by absolute change in cost categories that typically do not have a directly proportionate relationship to production volume. These include mainly structural costs, described below, as well as all other costs, which include items such as litigation costs and costs related to our after-market parts, accessories, and service business. Structural costs include the following cost categories:
|
|
◦
|
Manufacturing and Engineering -
consists primarily of costs for hourly and salaried manufacturing- and engineering-related personnel, plant overhead (such as utilities and taxes), new product launch expense, prototype materials, and outside engineering services
|
|
◦
|
Spending-Related -
consists primarily of depreciation and amortization of our manufacturing and engineering assets, but also includes asset retirements and operating leases
|
41
Item 2. Management’s Discussion and Analysis of Financial Condition and Results of Operations (Continued)
|
◦
|
Advertising and Sales Promotions -
includes costs for advertising, marketing programs, brand promotions, customer mailings and promotional events, and auto shows
|
|
◦
|
Administrative and Selling -
includes primarily costs for salaried personnel and purchased services related to our staff activities and selling functions, as well as associated information technology costs
|
|
◦
|
Pension and OPEB -
consists primarily of past service pension costs and other postretirement employee benefit costs
|
|
•
|
Exchange -
primarily measures profit variance driven by one or more of the following: (i) impact of gains or losses arising from transactions denominated in currencies other than the functional currency of the locations, including currency transactions, (ii) effect of remeasuring income, assets, and liabilities of foreign subsidiaries using U.S. dollars as the functional currency, or (iii) results of our foreign currency hedging activities
|
|
•
|
Net Interest and Other
|
|
◦
|
Net Interest
- primarily measures profit variance driven by changes in our Automotive sector’s centrally-managed net interest, which consists of interest expense, interest income, fair market value adjustments on our cash equivalents and marketable securities portfolio (excluding our investment in Mazda), and other adjustments
|
|
◦
|
Other
- consists of fair market value adjustments to our investment in Mazda, as well as other items not included in the causal factors defined above
|
Total Automotive.
The charts below detail first quarter key metrics and the change in the first quarter of 2014 pre-tax results compared with the first quarter of 2013 by causal factor. Beginning with the first quarter of 2014, we are reporting global and total regional industry volume (in terms of seasonally-adjusted annual selling rate or SAAR) and market share data to improve transparency and reflect the markets covered by each of our automotive segments, as shown below under “Change in Automotive Segments.” Automotive operating margin is defined as Automotive pre-tax results, excluding special items and Other Automotive, divided by Automotive revenue.
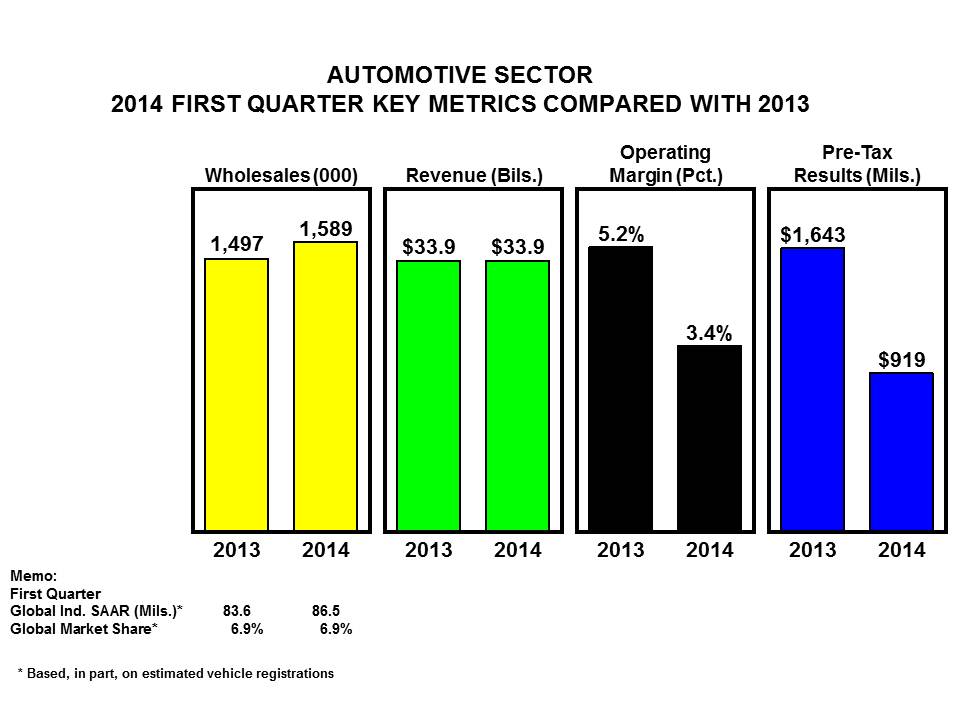
As shown above, wholesale volume increased by 6%, compared with a year ago. Automotive revenue was unchanged. The higher volume is more than explained by higher industry volumes in all regions except South America, improved market share in Asia Pacific, and a favorable change in dealer stocks. Global industry SAAR is estimated at 86.5 million units, up over 3 percent from a year ago. Our global market share is estimated at 6.9 percent, unchanged from a year ago. Operating margin was 3.4%, down 1.8 percentage points from a year ago, and Automotive pre-tax profit was $919 million, down $724 million. Lower results in North and South America more than explain the change in both metrics.
42
Item 2. Management’s Discussion and Analysis of Financial Condition and Results of Operations (Continued)
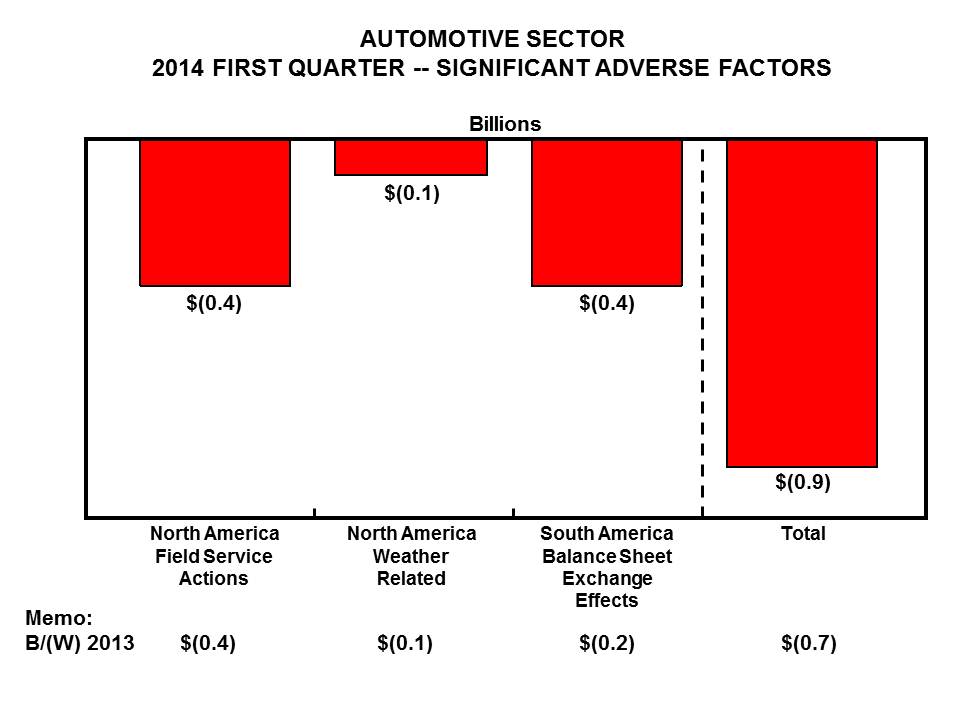
As shown above, first quarter 2014 results include several significant adverse factors that, although not special items, we do not consider to be representative of the underlying run-rate of our business.
In North America, these factors total about $500 million. They include a $400 million increase in warranty reserves for field service actions, including safety recalls and other product campaigns, related to 2008 through 2013 models, as well as expense for 2001 through 2005 models. We also experienced premium freight and labor costs of about $100 million during the quarter related to the harsh winter weather in the United States, which disrupted our operations, as well as those of many of our suppliers.
In South America, we saw significant currency devaluations across our major markets during the first quarter. In addition to the operating effect of these exchange rate movements, we recorded charges of about $400 million related to the one-time, balance sheet impact of these changes. Included is $310 million related to the Venezuela bolivar.
In total, these factors reduced pre-tax profit by about $900 million or the equivalent of 17 cents per share. They also account for a year-over-year decline in Company pre-tax profit of $700 million, as shown in the memo. While similar factors could occur in the future, it is unusual for items like these to occur in this magnitude in the same quarter. Isolating these factors provides a better understanding of what we believe to be the underlying run-rate of the Company and our North and South America segments.
43
Item 2. Management’s Discussion and Analysis of Financial Condition and Results of Operations (Continued)
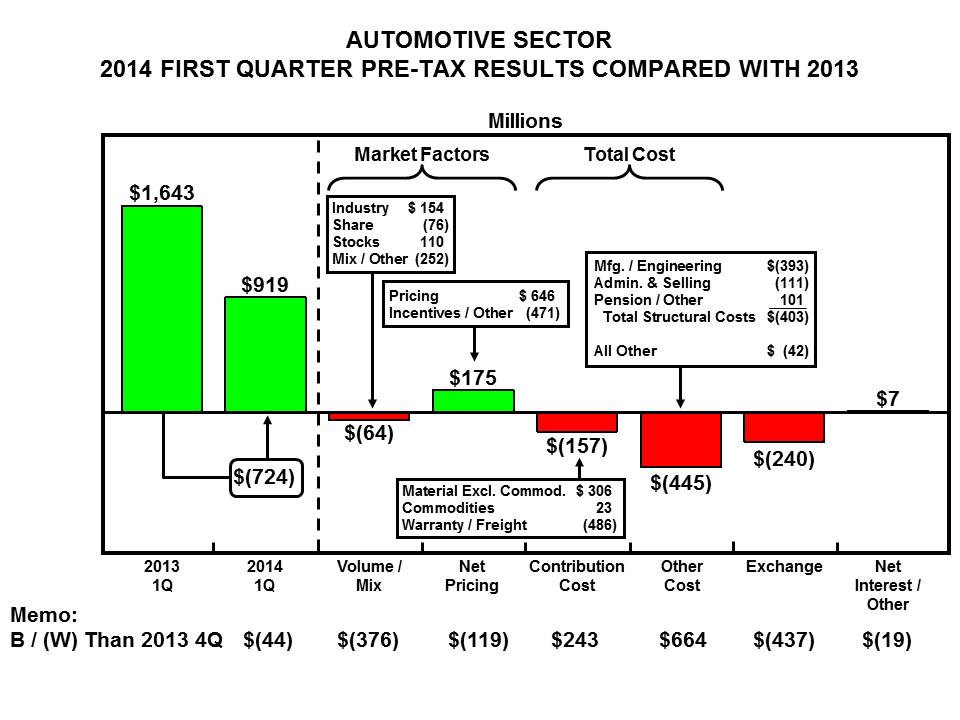
The year-over-year decline of $724 million in Automotive pre-tax profit for the first quarter of 2014, compared with first quarter of 2013, is fully explained by the warranty and premium weather-related costs in North America and the balance sheet exchange effects in South America. All other factors effectively offset one another.
Total costs and expenses
for our Automotive sector for first quarter 2014 and 2013 were $33.5 billion and $32.5 billion, respectively, a difference of $1 billion. An explanation of the change is shown below (in billions):
|
2014
Lower/(Higher)
2013
|
||||
|
First Quarter
|
||||
|
Explanation of change:
|
||||
|
Volume and mix, exchange, and other
|
$
|
(0.3
|
)
|
|
|
Contribution costs (a)
|
|
|
||
|
Commodity costs (incl. hedging)
|
—
|
|
||
|
Material costs excluding commodity costs
|
0.3
|
|
||
|
Warranty/Freight
|
(0.5
|
)
|
||
|
Other costs (a)
|
|
|
||
|
Structural costs
|
(0.4
|
)
|
||
|
Other
|
—
|
|
||
|
Special items
|
(0.1
|
)
|
||
|
Total
|
$
|
(1.0
|
)
|
|
_________
|
(a)
|
Our key cost change elements are measured primarily at present-year exchange; in addition, costs that vary directly with volume, such as material, freight and warranty costs, are measured at present-year volume and mix. Excludes special items.
|
44
Item 2. Management’s Discussion and Analysis of Financial Condition and Results of Operations (Continued)
Change in Automotive Segments.
As more fully described in Note 17 of the Notes to the Financial Statements, we have changed our Automotive sector reportable segments, as shown below.
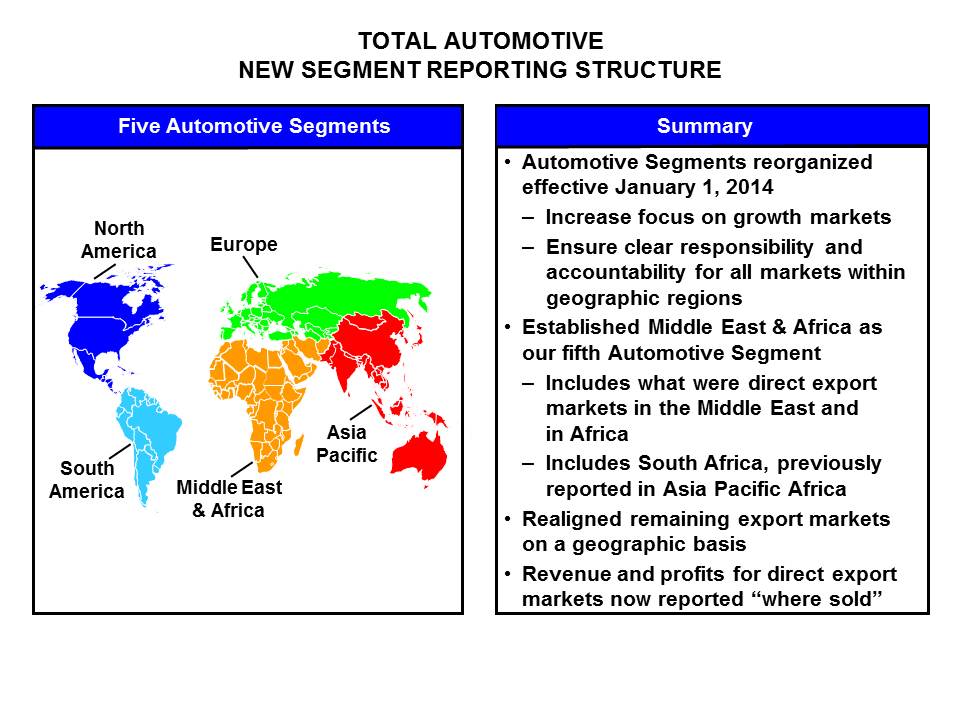
Effective this quarter, we are reporting results for Middle East & Africa, our new Automotive segment that was formed to facilitate an increased focus on this important growth region. To allow comparison, we have revised prior year financials and physicals for each of our other segments to align with this new reporting structure. Total Automotive sector results are not impacted by this change.
45
Item 2. Management’s Discussion and Analysis of Financial Condition and Results of Operations (Continued)
Results by Automotive Segment.
Details by segment of
Income before income taxes
for the first quarter 2014 are shown below.
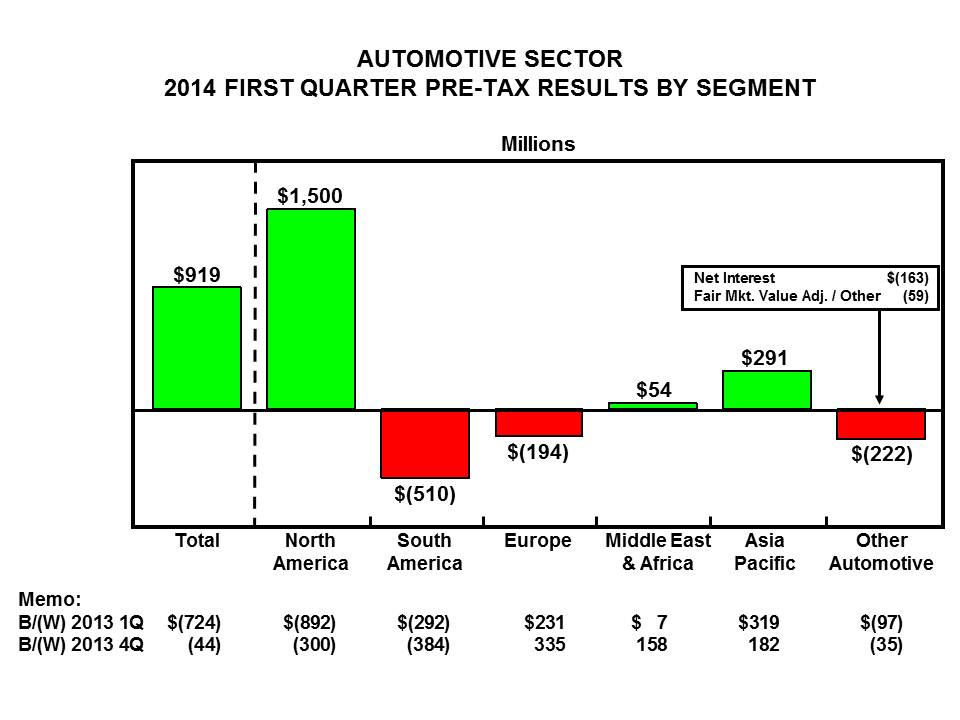
North America reported a solid first quarter result, notwithstanding the factors discussed earlier, while Asia Pacific’s profit was a record for any quarter. Europe cut its loss by more than half from a year ago and by nearly two-thirds from fourth quarter 2013. The Automotive operations outside North America improved $265 million from a year ago, notwithstanding the larger loss in South America mainly due to the factors discussed above.
The change in Other Automotive from a year ago is more than explained by an unfavorable fair value adjustment of our investment in Mazda.
For the full year, we now expect net interest expense to be about $700 million, a $100 million improvement from our prior guidance reflecting higher interest income.
46
Item 2. Management’s Discussion and Analysis of Financial Condition and Results of Operations (Continued)
North America Segment.
The charts below detail first quarter key metrics and the change in the first quarter of 2014 pre-tax results compared with the first quarter of 2013 by causal factor.

North America’s first quarter pre-tax profit continued to be driven by robust industry sales, our strong product line-up, continued discipline in matching production to demand, and a lean cost structure — even as we continue to invest for future growth.
Wholesale volume and revenue declined 2% and 5%, respectively, in the first quarter. The volume decrease is more than explained by lower market share, which reflected planned reductions in daily rental sales and lower small car retail share. This was offset, in part, by higher industry sales, including a U.S. SAAR of 16 million units that was 400,000 units higher than a year ago, and a favorable change in dealer stocks. The decline in revenue mainly reflects the lower wholesale volume, unfavorable mix, lower net pricing, and the adverse effect of a weaker Canadian dollar. Operating margin was 7.3%, down 3.8 percentage points from last year, and pre-tax profit was $1.5 billion, about $900 million lower than last year’s record profit. The adverse impact of $500 million associated with the warranty reserve and weather-related premium costs, as noted earlier, is worth 2.5 percentage points of operating margin.
47
Item 2. Management’s Discussion and Analysis of Financial Condition and Results of Operations (Continued)
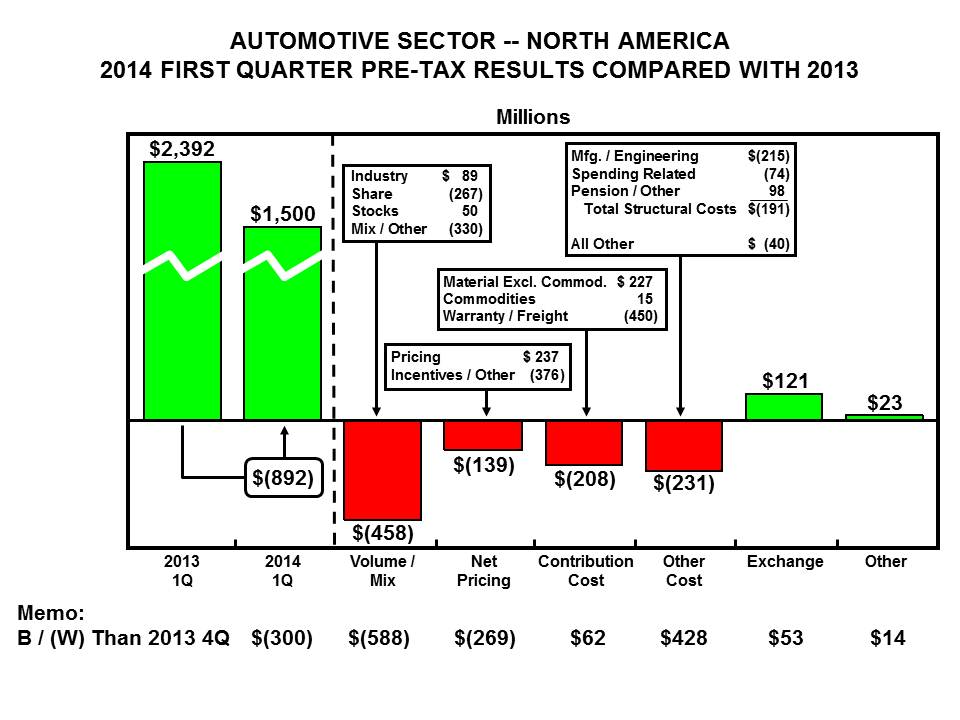
The first quarter 2014 decline in pre-tax profit compared with the first quarter of 2013 is more than explained by unfavorable market factors and higher costs. The unfavorable volume and mix is primarily explained by planned reductions in daily rental sales and lower small car share, as well as unfavorable series mix and option take rates ahead of the launch of our new products. Net pricing is lower mainly due to Fusion and Escape, which had low levels of incentives a year ago due to the launch of these models. The higher costs are more than explained by the unfavorable $500 million related to the factors previously discussed. As shown in the memo, pre-tax profit was lower than in fourth quarter 2013, more than explained by unfavorable market factors, including higher incentive spending, unfavorable product mix, and lower industry volume.
We continue to expect North America full year 2014 pre-tax profit to be lower than 2013 and operating margin to range from 8% to 9%.
48
Item 2. Management’s Discussion and Analysis of Financial Condition and Results of Operations (Continued)
South America Segment.
The charts below detail first quarter key metrics and the change in the first quarter of 2014 pre-tax results compared with the first quarter of 2013 by causal factor.
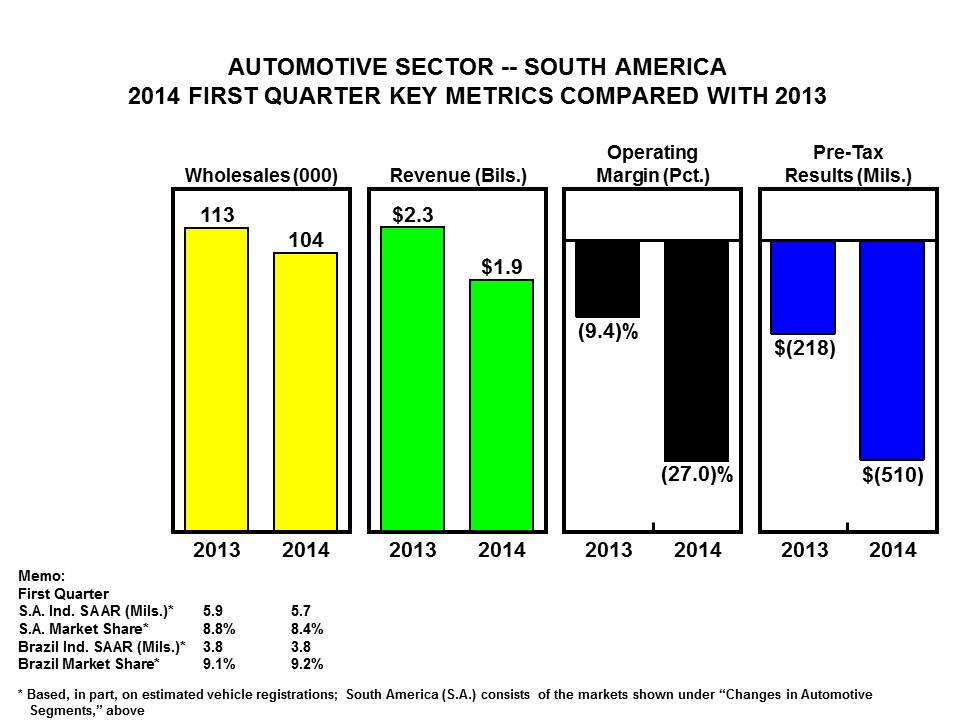
In South America, we are continuing to execute our strategy of expanding our product line-up and progressively replacing legacy products with global One Ford offerings. Now, however, we also are dealing with slower GDP growth in our larger markets, weaker currencies, high inflation, as well as political and social turmoil in some countries.
In the first quarter, wholesale volume and revenue decreased from a year ago by 8% and 18%, respectively. The lower volume is more than explained by a 200,000-unit decline from last year’s SAAR of 5.9 million units. This includes the impact of import restrictions in Argentina and lower production in Venezuela resulting from limited availability of U.S. dollars. The revenue decline is primarily explained by unfavorable exchange and unfavorable volume and mix, offset partially by higher net pricing. Operating margin was negative 27%, down significantly, and pre-tax loss was $510 million, a deterioration of $292 million. The balance sheet exchange effects discussed earlier account for about 75% of the quarterly loss.
49
Item 2. Management’s Discussion and Analysis of Financial Condition and Results of Operations (Continued)
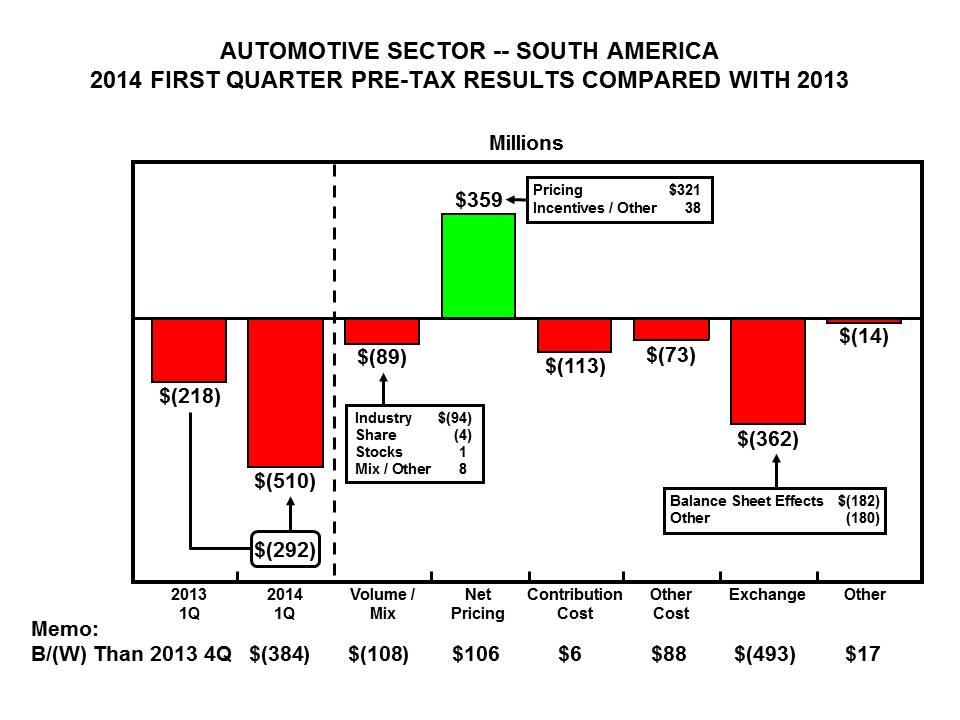
The decline is explained by unfavorable exchange, higher costs, mainly associated with economics-related effects caused by high local inflation, and lower volume, mainly due to a weaker industry. Although net pricing was substantial, including some pricing associated with new products, it was not enough to offset the currency and inflation-related effects. As shown in the memo, pre-tax results deteriorated compared with fourth quarter 2013, more than explained by unfavorable exchange.
For the full year 2014, we now expect South America to incur a larger loss than in 2013. Based on our present assumptions, we expect the rest of the year to be about breakeven to a small loss.
50
Item 2. Management’s Discussion and Analysis of Financial Condition and Results of Operations (Continued)
Europe Segment.
The charts below detail first quarter key metrics and the change in the first quarter of 2014 pre-tax results compared with the first quarter of 2013 by causal factor.
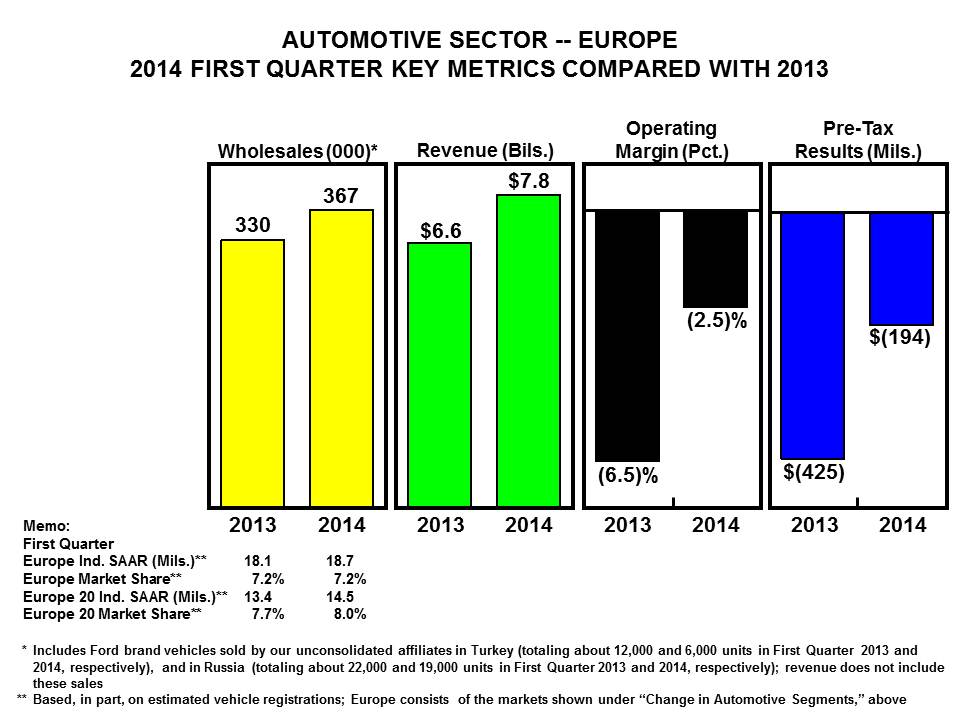
In Europe we continued to implement our transformation plan and remain on track to achieve profitability in 2015.
Wholesale volume and revenue improved from a year ago, up 11% and 18%, respectively. The volume increase is more than explained by higher industry volumes, reflecting a SAAR of 14.5 million units for the Europe 20 markets (i.e., our traditional 19 markets as listed in our 2013 Form 10-K Report, plus Romania), up over one million units, as well as favorable changes in dealer stocks and higher market share for Europe 20, reflecting improved share for Mondeo and Kuga. The increase in revenue mainly reflects the higher volume and favorable exchange. Operating margin was a negative 2.5%, an improvement of 4 percentage points from a year ago, and the pre-tax loss was $194 million, a $231 million improvement. The first quarter 2014 loss includes $76 million of restructuring costs.
51
Item 2. Management’s Discussion and Analysis of Financial Condition and Results of Operations (Continued)
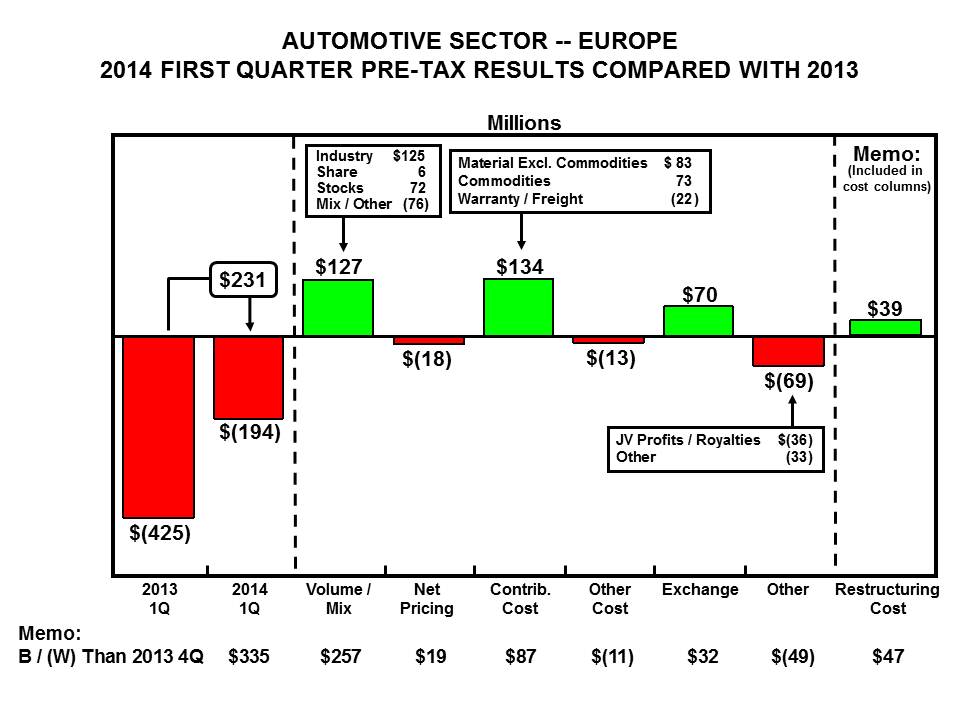
Pre-tax results in the first quarter 2014 improved, reflecting lower costs, favorable market factors, and favorable exchange. This was offset partially by lower joint venture results and royalties in Russia and Turkey, included in other. As shown in the memo below the chart, pre-tax results improved compared with fourth quarter 2013, with most factors favorable.
We are very pleased with the start to the year by our operations in Europe and the progress the team continues to make in implementing our transformation plan, notwithstanding external headwinds in Russia and Turkey. As a result, our full year guidance for Europe is unchanged. We expect results to improve in 2014, compared with 2013.
52
Item 2. Management’s Discussion and Analysis of Financial Condition and Results of Operations (Continued)
Middle East & Africa Segment.
The chart below details first quarter key metrics.
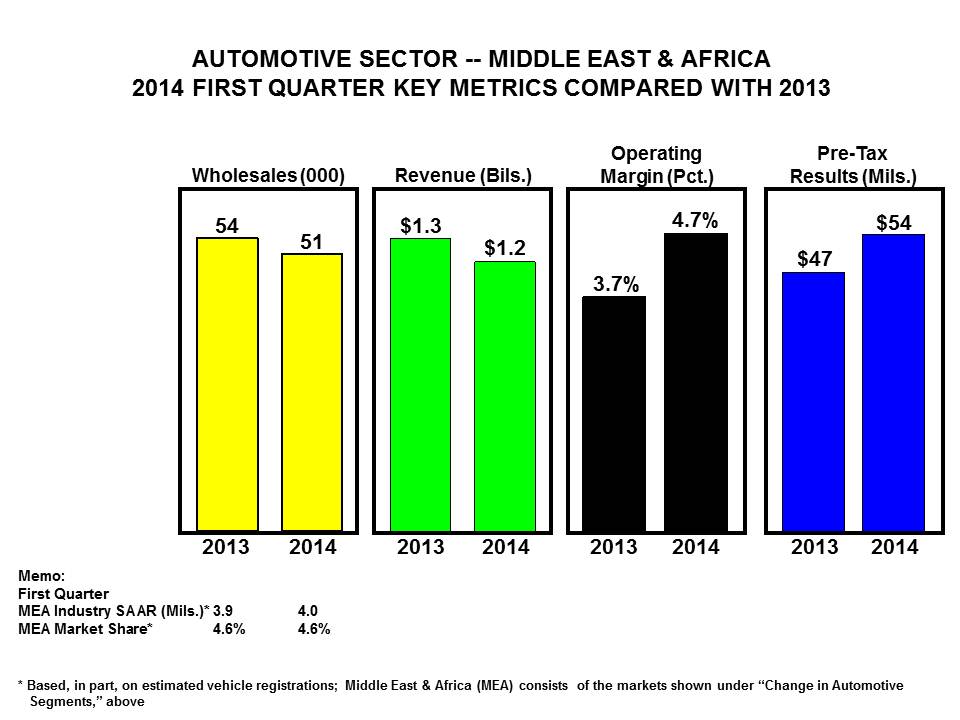
In the first quarter, we wholesaled 51,000 vehicles in the region, 3,000 fewer units than a year ago. Revenue was $1.2 billion, $100 million lower. The lower volume reflects lower dealer stock increases. The lower revenue is more than explained by the lower volume and unfavorable exchange, primarily due to a weaker South Africa rand. Operating margin was 4.7%, up 1 percentage point from a year ago, and pre-tax profit was $54 million, up $7 million.
Our full year guidance for Middle East & Africa remains unchanged — we expect results to be about breakeven.
53
Item 2. Management’s Discussion and Analysis of Financial Condition and Results of Operations (Continued)
Asia Pacific Segment.
The charts below detail first quarter key metrics and the change in the first quarter of 2014 pre-tax results compared with the first quarter of 2013 by causal factor.

Our strategy in Asia Pacific continues to be to grow aggressively with an expanding portfolio of One Ford products with manufacturing hubs in China, India, and ASEAN.
First quarter 2014 wholesale volume was up 32%, and net revenue, which excludes our China joint ventures, grew 19%. Our China wholesale volume, not shown, was up 45% in the quarter. The higher volume in the region reflects mainly improved market share. Higher industry volume also contributed. We estimate the first quarter SAAR for the region at 38.9 million units, up 1.9 million units from a year ago, explained by China. Our first quarter market share was 3.4%, seven-tenths of a percentage point higher than a year ago. This was driven by China where our market share improved nine-tenths of a percentage point to a record 4.5%, reflecting continued strong sales of EcoSport, Kuga, and Mondeo. Higher revenue is more than explained by favorable mix and the higher volume. Operating margin was 11.1%, up 12.4 percentage points from a year ago, and pre-tax profit was $291 million, up $319 million. Strong results in China drove the region’s record profit.
54
Item 2. Management’s Discussion and Analysis of Financial Condition and Results of Operations (Continued)
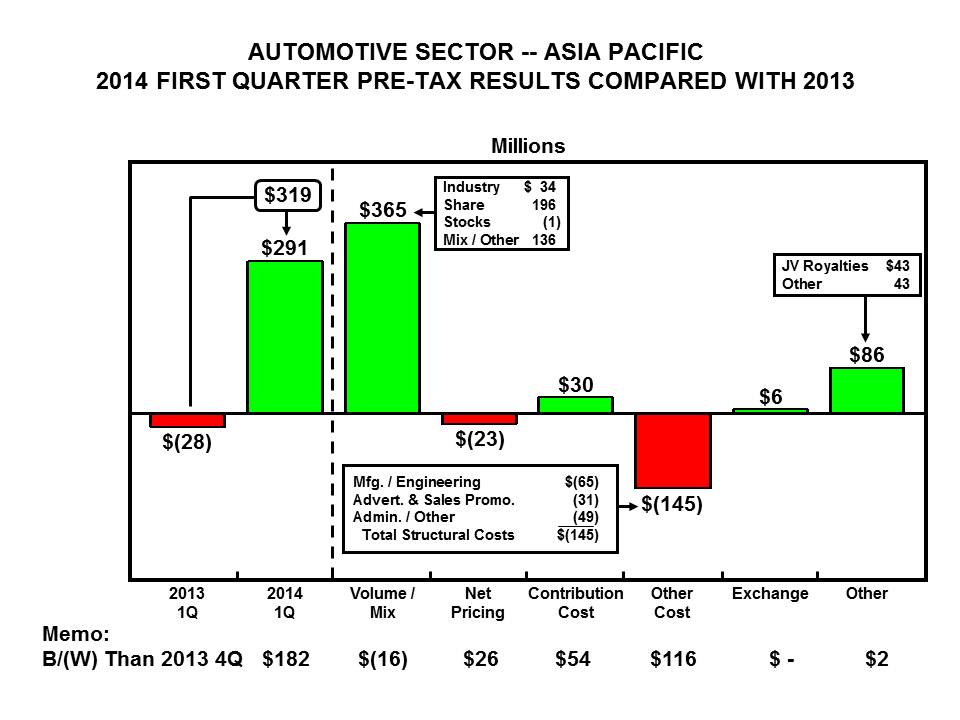
First quarter 2014 pre-tax profits improved from last year, more than explained by favorable volume and mix and higher royalties from our joint ventures, included in other. Higher costs, including investment for future growth, were a partial offset. As shown in the memo, Asia Pacific pre-tax results improved from fourth quarter 2013, primarily explained by lower costs.
For the full year 2014, we now expect Asia Pacific to earn a higher pre-tax profit than a year ago, improved from our prior guidance of about equal.
55
Item 2. Management’s Discussion and Analysis of Financial Condition and Results of Operations (Continued)
FINANCIAL SERVICES SECTOR
As shown in the total Company discussion above, we present our Financial Services sector results in two segments, Ford Credit and Other Financial Services. Ford Credit, in turn, has two operations, North America and International.
In general, we measure period-to-period changes in Ford Credit’s pre-tax results using the causal factors listed below:
|
•
|
Volume:
|
|
◦
|
Volume primarily measures changes in net financing margin driven by changes in average finance receivables and net investment in operating leases at prior period financing margin yield (defined below in financing margin).
|
|
◦
|
Volume changes are primarily driven by the volume of new and used vehicle sales and leases, the extent to which Ford Credit purchases retail installment sale and lease contracts, the extent to which Ford Credit provides wholesale financing, the sales price of the vehicles financed, the level of dealer inventories, Ford-sponsored special financing programs available exclusively through Ford Credit, and the availability of cost-effective funding for the purchase of retail installment sale and lease contracts and to provide wholesale financing.
|
•
Financing Margin:
|
◦
|
Financing margin variance is the period-to-period change in financing margin yield multiplied by the present period average receivables. Financing margin yield equals revenue, less interest expense and scheduled depreciation for the period, divided by average receivables for the same period.
|
|
◦
|
Financing margin changes are driven by changes in revenue and interest expense. Changes in revenue are primarily driven by the level of market interest rates, cost assumptions in pricing, mix of business, and competitive environment. Changes in interest expense are primarily driven by the level of market interest rates, borrowing spreads, and asset-liability management.
|
|
•
|
Credit Loss:
|
|
◦
|
Credit loss measures changes in the provision for credit losses. For analysis purposes, management splits the provision for credit losses primarily into net charge-offs and the change in the allowance for credit losses.
|
|
◦
|
Net charge-off changes are primarily driven by the number of repossessions, severity per repossession, and recoveries. Changes in the allowance for credit losses are primarily driven by changes in historical trends in credit losses and recoveries, changes in the composition and size of Ford Credit’s present portfolio, changes in trends in historical used vehicle values, and changes in economic conditions. For additional information on the allowance for credit losses, refer to the “Critical Accounting Estimates
-
Allowance for Credit Losses” section of Item 7 of Part II of our 10-K Report.
|
|
•
|
Lease Residual:
|
|
◦
|
Lease residual measures changes to residual performance. For analysis purposes, management splits residual performance primarily into residual gains and losses, and the change in accumulated supplemental depreciation.
|
|
◦
|
Residual gain and loss changes are primarily driven by the number of vehicles returned to Ford Credit and sold, and the difference between the auction value and the depreciated value of the vehicles sold. Changes in accumulated supplemental depreciation are primarily driven by changes in Ford Credit’s estimate of the number of vehicles that will be returned to it and sold, and changes in the estimate of the expected auction value at the end of the lease term. For additional information on accumulated supplemental depreciation, refer to the “Critical Accounting Estimates
-
Accumulated Depreciation on Vehicles Subject to Operating Leases” section of Item 7 of Part II of our 10-K Report.
|
|
•
|
Other:
|
|
◦
|
Primarily includes operating expenses, other revenue, and insurance expenses.
|
|
◦
|
Changes in operating expenses are primarily driven by salaried personnel costs, facilities costs, and costs associated with the origination and servicing of customer contracts.
|
|
◦
|
In general, other revenue changes are primarily driven by changes in earnings related to market valuation adjustments to derivatives (primarily related to movements in interest rates) and other miscellaneous items.
|
56
Item 2. Management’s Discussion and Analysis of Financial Condition and Results of Operations (Continued)
Ford Credit.
The chart below details the change in first quarter 2014 pre-tax results compared with first quarter 2013 by causal factor:
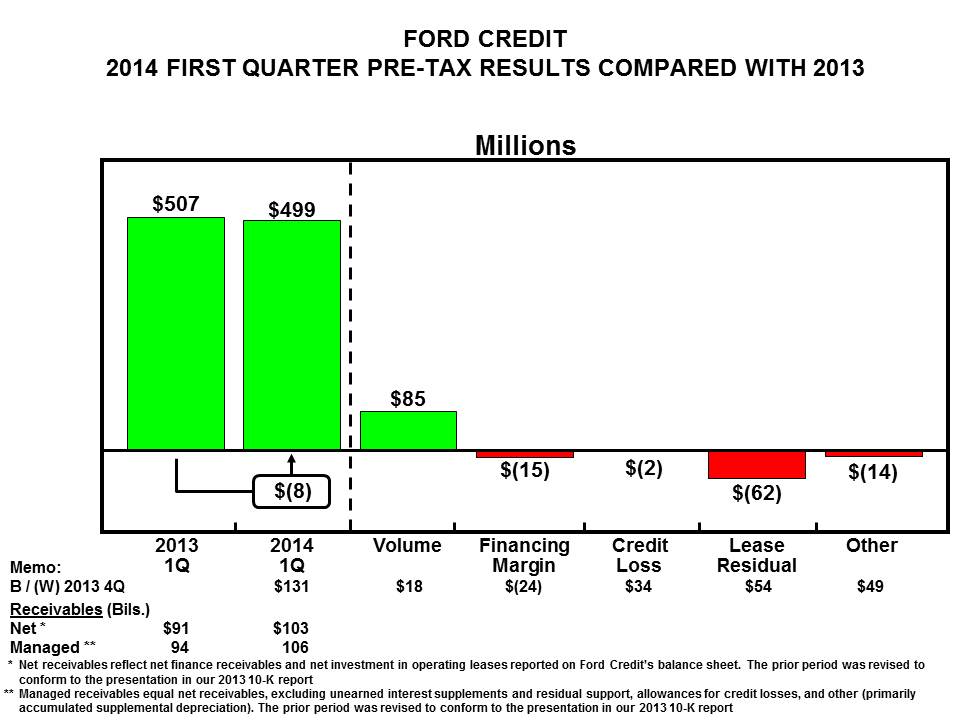
The higher volume reflected increases in nearly all products: leasing in North America, and both consumer and non-consumer finance receivables in all geographic segments. The increases in leasing and consumer finance receivables reflect improved Ford Credit financing share as a result of changes in Ford’s marketing programs. The increase in non-consumer finance receivables is due to higher dealer stocks.
The unfavorable residual performance primarily reflected revised depreciation due to expectations of lower auction values in the North America lease portfolio.
Ford Credit’s pre-tax profit was higher than fourth quarter 2013 explained primarily by favorable lease residual performance due to higher auction values, as well as lower operating costs included in Other. These factors are consistent with normal seasonality.
For the full year, we now expect Ford Credit’s pre-tax profit to be about equal to or higher than 2013. This reflects improved financing margin performance. We continue to expect Ford Credit’s managed receivables at year-end to be about $110 billion, managed leverage to continue in the range of 8:1 to 9:1, and distributions to be about $250 million.
57
Item 2. Management’s Discussion and Analysis of Financial Condition and Results of Operations (Continued)
Ford Credit’s receivables, including finance receivables and operating leases, were as follows (in billions):
|
|
March 31,
2014
|
December 31,
2013
|
|||||
|
Net Receivables
|
|
|
|||||
|
Finance receivables - North America
|
|
|
|||||
|
Consumer - Retail financing
|
$
|
40.7
|
|
$
|
40.9
|
|
|
|
Non-Consumer
|
|
|
|
|
|||
|
Dealer financing (a)
|
23.2
|
|
22.1
|
|
|||
|
Other
|
1.0
|
|
1.0
|
|
|||
|
Total finance receivables - North America (b)
|
64.9
|
|
64.0
|
|
|||
|
Finance receivables - International
|
|||||||
|
Consumer - Retail financing
|
11.3
|
|
10.8
|
|
|||
|
Non-Consumer
|
|||||||
|
Dealer financing (a)
|
9.3
|
|
8.3
|
|
|||
|
Other
|
0.4
|
|
0.4
|
|
|||
|
Total finance receivables - International (b)
|
21.0
|
|
19.5
|
|
|||
|
Unearned interest supplements
|
(1.5
|
)
|
(1.5
|
)
|
|||
|
Allowance for credit losses
|
(0.3
|
)
|
(0.4
|
)
|
|||
|
Finance receivables, net
|
84.1
|
|
81.6
|
|
|||
|
Net investment in operating leases (b)
|
18.8
|
|
18.3
|
|
|||
|
Total net receivables
|
$
|
102.9
|
|
$
|
99.9
|
|
|
|
|
|
|
|
||||
|
Managed Receivables
|
|||||||
|
Total net receivables
|
$
|
102.9
|
|
$
|
99.9
|
|
|
|
Unearned interest supplements and residual support
|
3.1
|
|
3.1
|
|
|||
|
Allowance for credit losses
|
0.4
|
|
0.4
|
|
|||
|
Other, primarily accumulated supplemental depreciation
|
0.1
|
|
—
|
|
|||
|
Total managed receivables
|
$
|
106.5
|
|
$
|
103.4
|
|
|
__________
|
(a)
|
Dealer financing primarily includes wholesale loans to dealers to finance the purchase of vehicle inventory.
|
|
(b)
|
At March 31, 2014 and December 31, 2013, includes consumer receivables before allowance for credit losses of $26.8 billion and
|
$27.7 billion, respectively, and non-consumer receivables before allowance for credit losses of $24.5 billion and $23.9 billion, respectively, that have been sold for legal purposes in securitization transactions but continue to be reported in Ford Credit’s consolidated financial statements. In addition, at March 31, 2014 and December 31, 2013, includes net investment in operating leases before allowance for credit losses of $9.6 billion and $8.1 billion, respectively, that have been included in securitization transactions but continue to be reported in Ford Credit’s financial statements. The receivables and net investment in operating leases are available only for payment of the debt issued by, and other obligations of, the securitization entities that are parties to those securitization transactions; they are not available to pay Ford Credit’s other obligations or the claims of its other creditors. Ford Credit holds the right to receive the excess cash flows not needed to pay the debt issued by, and other obligations of, the securitization entities that are parties to those securitization transactions.
Managed receivables at March 31, 2014 increased from year-end 2013, primarily driven by increases in non-consumer finance receivables in North America and International
.
58
Item 2. Management’s Discussion and Analysis of Financial Condition and Results of Operations (Continued)
Credit Losses.
The charts below detail (i) quarterly trends of charge-offs (credit losses, net of recoveries), (ii) loss-to-receivables (“LTR”) ratios (charge-offs on an annualized basis divided by average end-of-period (“EOP”) managed receivables), (iii) credit loss reserve, and (iv) Ford Credit’s credit loss reserve as a percentage of EOP managed receivables:

Year-over-year charge-offs were up $7 million. Quarter-over-quarter charge-offs were unchanged. The LTR ratio was equal to both the same period a year ago and the prior quarter. The LTR ratio of 20 basis points is still well below the 10-year average of 54 basis points.
The credit loss reserve was $358 million, down $31 million from a year ago, reflecting the continuation of low losses.
In purchasing retail finance and operating lease contracts, Ford Credit uses a proprietary scoring system that classifies contracts using several factors, such as credit bureau information, consumer credit risk scores (e.g., FICO score), and contract characteristics. In addition to Ford Credit’s proprietary scoring system, it considers other factors, such as employment history, financial stability, and capacity to pay. At March 31, 2014 and December 31, 2013, Ford Credit classified between 5% and 6% of the outstanding U.S. retail finance and operating lease contracts in its portfolio as high risk at contract inception. For additional information, see “Critical Accounting Estimates - Allowance for Credit Losses” section of Item 7 of Part II of our 10-K Report.
Residual Risk.
Ford Credit is exposed to residual risk on operating leases and similar balloon payment products where the customer may return the financed vehicle to Ford Credit. Residual risk is the possibility that the amount Ford Credit obtains from returned vehicles will be less than its estimate of the expected residual value for the vehicle. Ford Credit estimates the expected residual value by evaluating recent auction values, return volumes for its leased vehicles, industry-wide used vehicle prices, marketing incentive plans, and vehicle quality data. Changes in expected residual values impact the depreciation expense, which is recognized on a straight-line basis over the life of the lease. For additional information, see “Critical Accounting Estimates - Accumulated Depreciation on Vehicles Subject to Operating Leases” section of Item 7 of Part II of our 10-K Report.
59
Item 2. Management’s Discussion and Analysis of Financial Condition and Results of Operations (Continued)
U.S. Ford and Lincoln Brand Operating Lease Experience.
The following charts show return volumes and auction values at constant first quarter 2014 vehicle mix for vehicles returned in the respective periods. The U.S. operating lease portfolio accounted for about 88% of Ford Credit’s total net investment in operating leases at March 31, 2014.
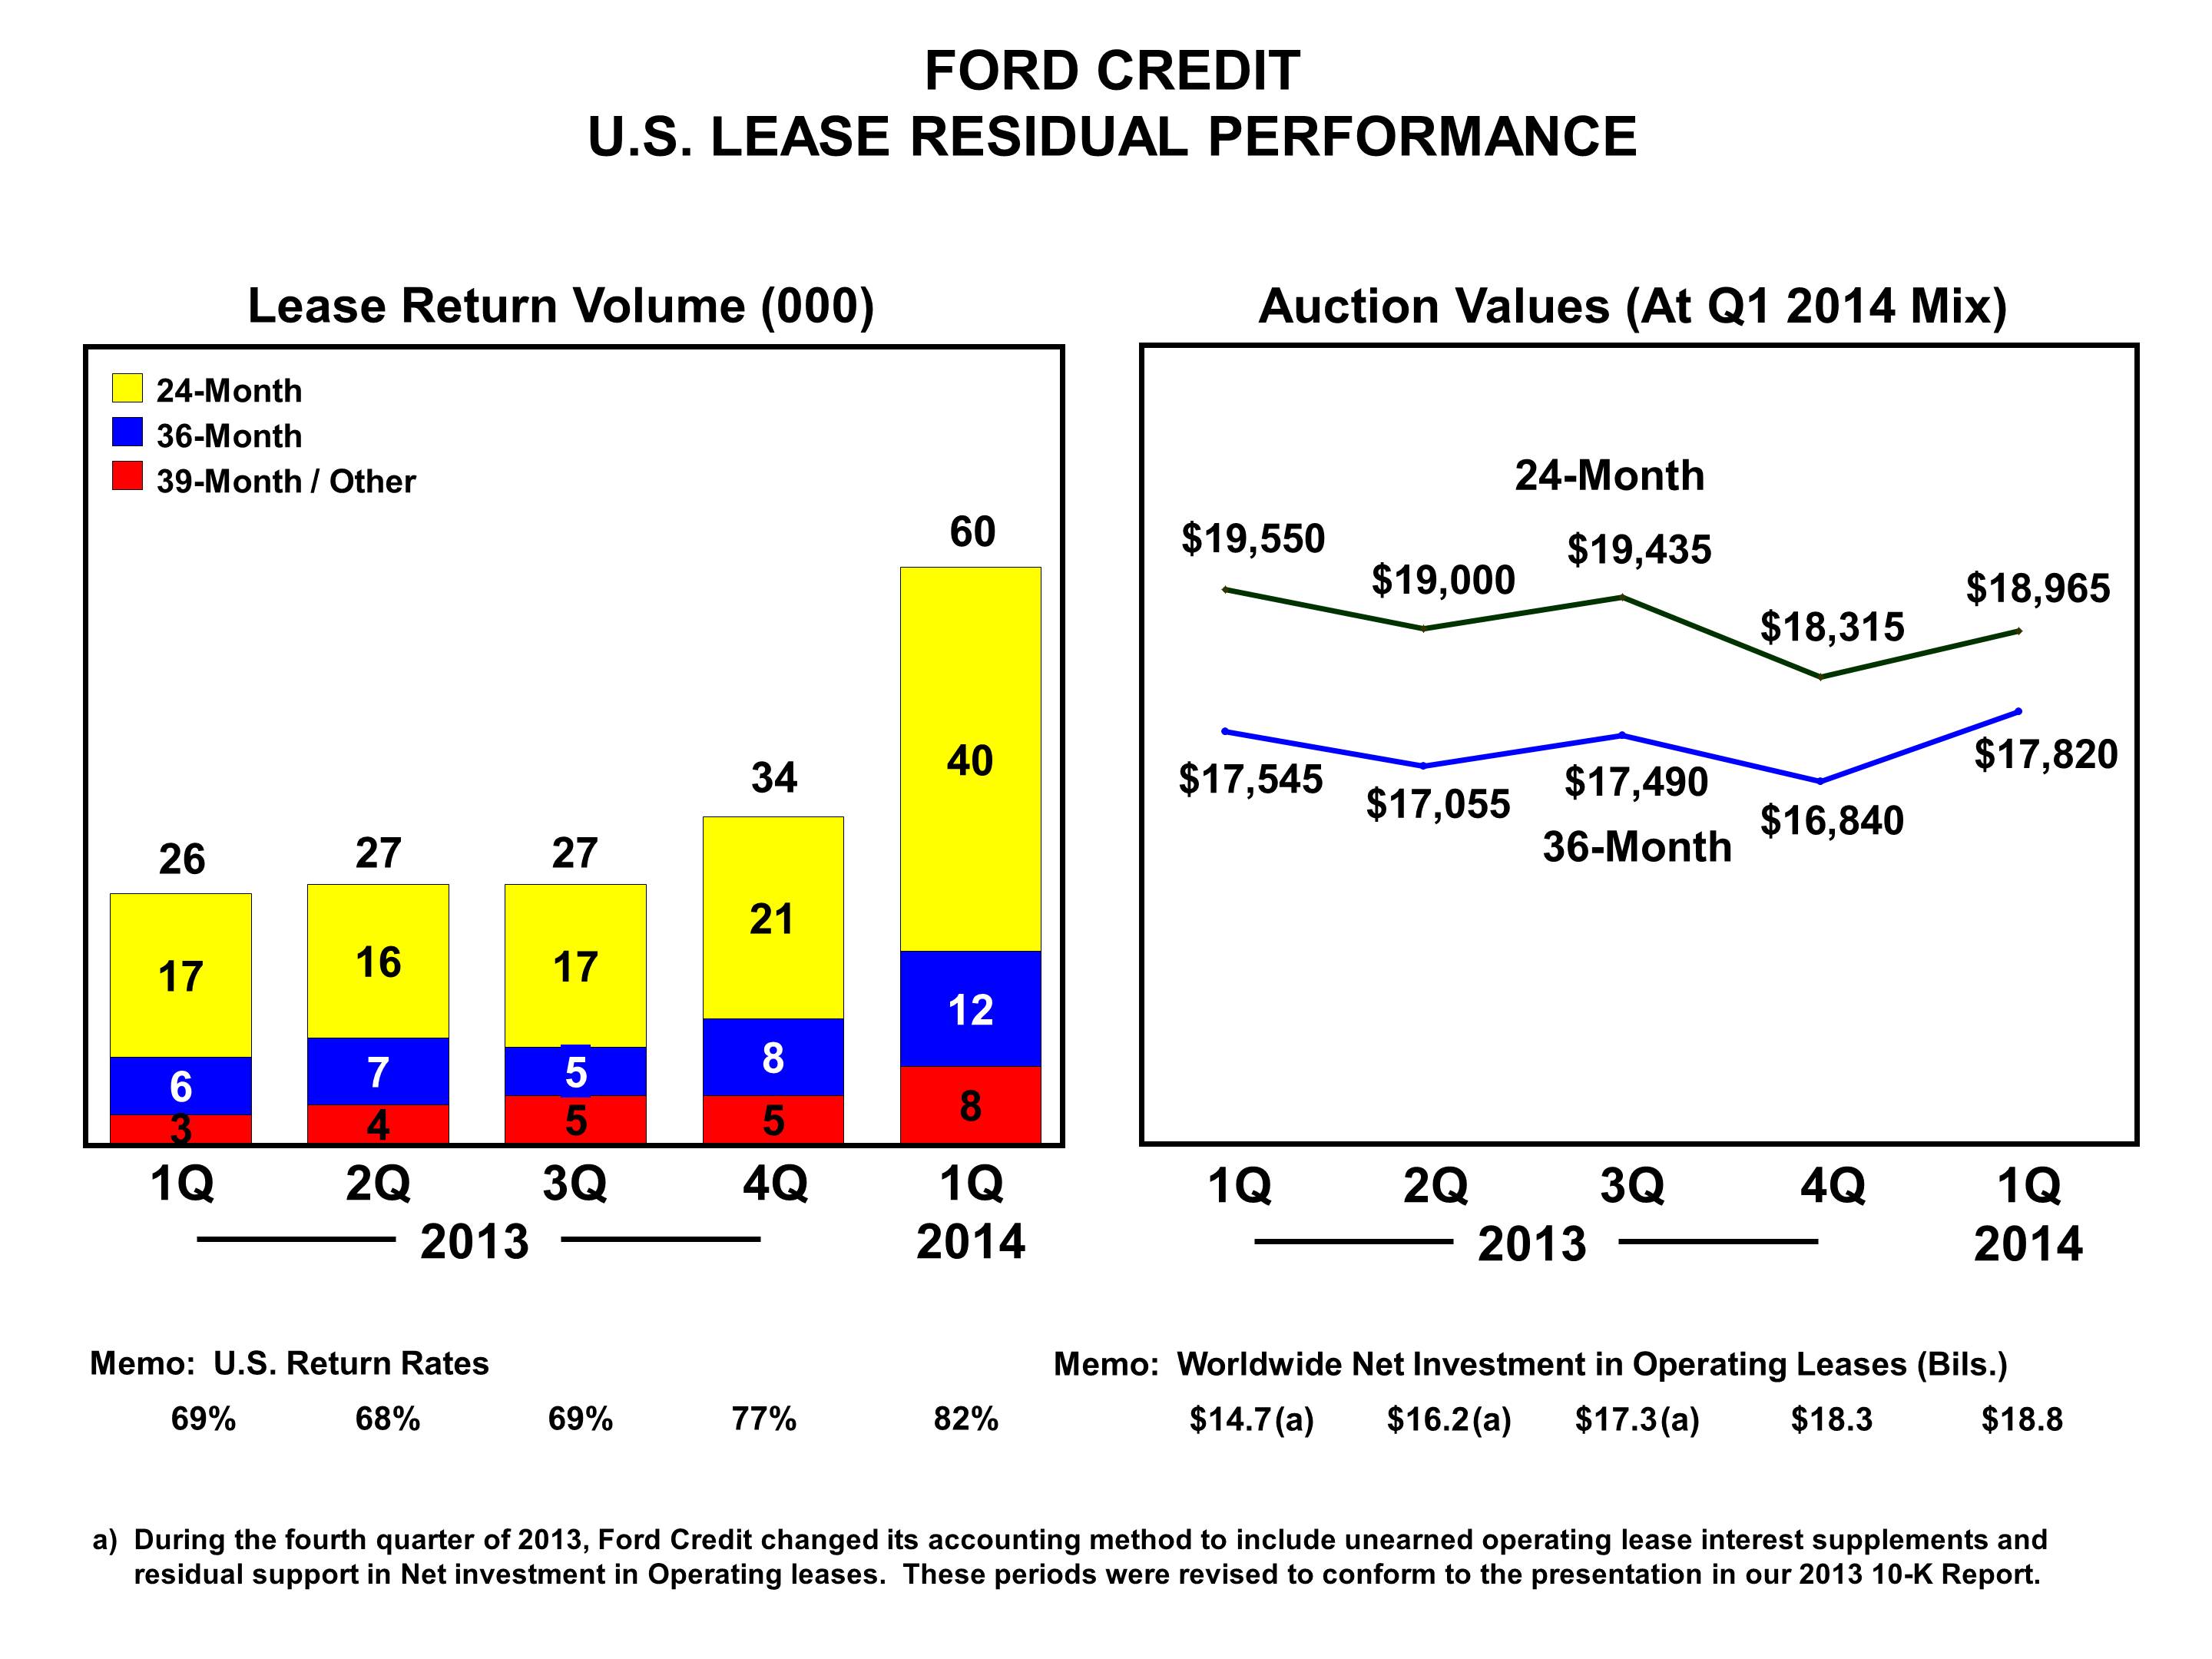
Lease return volumes in the first quarter of 2014 were 34,000 units higher than the same period last year, primarily reflecting higher lease placements in 2011 and 2012 compared with prior years. The first quarter lease return rate was 82%, up 13 percentage points compared with the same period last year, primarily reflecting a higher percent of vehicles with a lease-end purchase price above market value.
In the first quarter of 2014, Ford Credit’s auction performance was mixed. Compared to the prior year, 24-month average auction values decreased about $600, while 36-month average auction values increased about $300. The differences in Ford Credit’s 24-month and 36-month auction value trends primarily reflect vehicle content and segment mix. In addition, the trends were influenced by the non-recurrence of the effects of Hurricane Sandy in the first quarter of 2013, which positively affected later-model vehicle auction prices (primarily 24-month contracts). Both Ford Credit’s 24-month and 36-month auction values increased significantly from the fourth quarter of 2013, consistent with normal seasonality.
Ford Credit’s worldwide net investment in operating leases was $18.8 billion at the end of the first quarter of 2014, up about $500 million from year-end 2013, and up $4.1 billion from a year ago.
60
Item 2. Management’s Discussion and Analysis of Financial Condition and Results of Operations (Continued)
LIQUIDITY AND CAPITAL RESOURCES
Automotive Sector
Our Automotive liquidity strategy includes ensuring that we have sufficient liquidity available with a high degree of certainty throughout the business cycle by generating cash from operations and maintaining access to other sources of funding. We target to have an average ongoing Automotive gross cash balance of about $20 billion. We expect to have periods when we will be above or below this amount due to (i) future cash flow expectations such as for pension contributions, debt maturities, capital investments, or restructuring requirements, (ii) short-term timing differences, and (iii) changes in the global economic environment. In addition, we also target to maintain a revolving credit facility for our Automotive business of up to about $10 billion to protect against exogenous shocks. Our revolving credit facility is discussed below.
We assess the appropriate long-term target for total Automotive liquidity, comprised of Automotive gross cash and the revolving credit facility, to be about $30 billion, which is an amount we believe is sufficient to support our business priorities and to protect our business. Our Automotive gross cash and Automotive liquidity targets could be reduced over time based on improved operating performance and changes in our risk profile.
For a discussion of risks to our liquidity, see “Item 1A. Risk Factors” in our 2013 Form 10-K Report, as well as Note 18 of the Notes to the Financial Statements regarding commitments and contingencies that could impact our liquidity.
Automotive Gross Cash.
Automotive gross cash includes cash and cash equivalents and marketable securities, net of any securities-in-transit. Automotive gross cash is detailed below as of the dates shown (in billions):
|
|
March 31,
2014
|
December 31,
2013
|
March 31,
2013
|
||||||||
|
Cash and cash equivalents
|
$
|
4.5
|
|
$
|
5.0
|
|
$
|
6.0
|
|
||
|
Marketable securities
|
20.7
|
|
20.1
|
|
18.2
|
|
|||||
|
Total cash and marketable securities
|
25.2
|
|
25.1
|
|
24.2
|
|
|||||
|
Securities-in-transit (a)
|
—
|
|
(0.3
|
)
|
—
|
|
|||||
|
Automotive gross cash
|
$
|
25.2
|
|
$
|
24.8
|
|
$
|
24.2
|
|
||
__________
|
(a)
|
The purchase or sale of marketable securities for which the cash settlement was not made by period-end and a payable or receivable was recorded on the balance sheet.
|
Our cash, cash equivalents, and marketable securities are held primarily in highly liquid investments, which provide for anticipated and unanticipated cash needs. Our cash, cash equivalents, and marketable securities primarily include U.S. Department of Treasury obligations, federal agency securities, bank time deposits with investment-grade institutions, corporate investment-grade securities, commercial paper rated A-1/P-1 or higher, and debt obligations of a select group of non-U.S. governments, non-U.S. governmental agencies, and supranational institutions. The average maturity of these investments ranges from about 90 days to up to about one year, and is adjusted based on market conditions and liquidity needs. We monitor our cash levels and average maturity on a daily basis. Of our total Automotive gross cash at March 31, 2014, 86% was held by consolidated entities domiciled in the United States.
In managing our business, we classify changes in Automotive gross cash into operating-related and other items (which includes the impact of certain special items, contributions to funded pension plans, certain tax-related transactions, acquisitions and divestitures, capital transactions with the Financial Services sector, dividends paid to shareholders, and other—primarily financing-related). Our key liquidity metrics are operating-related cash flow (which best represents the ability of our Automotive operations to generate cash), Automotive gross cash, and Automotive liquidity. Automotive gross cash and liquidity as of the dates shown were as follows (in billions):
|
March 31,
2014
|
December 31, 2013
|
March 31,
2013
|
|||||||||
|
Automotive gross cash
|
$
|
25.2
|
|
$
|
24.8
|
|
$
|
24.2
|
|
||
|
Available credit lines
|
|
|
|
|
|
|
|||||
|
Revolving credit facility, unutilized portion
|
10.7
|
|
10.7
|
|
9.5
|
|
|||||
|
Local lines available to foreign affiliates, unutilized portion
|
0.7
|
|
0.7
|
|
0.8
|
|
|||||
|
Automotive liquidity
|
$
|
36.6
|
|
$
|
36.2
|
|
$
|
34.5
|
|
||
61
Item 2. Management’s Discussion and Analysis of Financial Condition and Results of Operations (Continued)
We believe the cash flow analysis reflected in the table below is useful to investors because it includes in operating-related cash flow elements that we consider to be related to our Automotive operating activities (e.g., capital spending) and excludes cash flow elements that we do not consider to be related to the ability of our operations to generate cash. This differs from a cash flow statement prepared in accordance with GAAP and differs from
Net
cash provided by/(used in) operating activities
, the most directly comparable GAAP financial measure.
Changes in Automotive gross cash are summarized below (in billions):
|
First Quarter
|
|||||||
|
|
2014
|
2013
|
|||||
|
Automotive gross cash at end of period
|
$
|
25.2
|
|
$
|
24.2
|
|
|
|
Automotive gross cash at beginning of period
|
24.8
|
|
24.3
|
|
|||
|
Change in Automotive gross cash
|
$
|
0.4
|
|
$
|
(0.1
|
)
|
|
|
Automotive income before income taxes (excluding special items)
|
$
|
0.9
|
|
$
|
1.6
|
|
|
|
Capital spending
|
(1.5
|
)
|
(1.5
|
)
|
|||
|
Depreciation and tooling amortization
|
1.0
|
|
1.0
|
|
|||
|
Changes in working capital (a)
|
1.7
|
|
0.4
|
|
|||
|
Other/Timing differences (b)
|
(0.9
|
)
|
(0.8
|
)
|
|||
|
Automotive operating-related cash flows
|
1.2
|
|
0.7
|
|
|||
|
Separation payments
|
—
|
|
(0.1
|
)
|
|||
|
Net receipts from Financial Services sector (c)
|
0.2
|
|
0.3
|
|
|||
|
Other
|
—
|
|
0.2
|
|
|||
|
Cash flow before other actions
|
1.4
|
|
1.1
|
|
|||
|
Changes in debt
|
—
|
|
1.0
|
|
|||
|
Funded pension contributions
|
(0.5
|
)
|
(1.8
|
)
|
|||
|
Dividends/Other items
|
(0.5
|
)
|
(0.4
|
)
|
|||
|
Change in Automotive gross cash
|
$
|
0.4
|
|
$
|
(0.1
|
)
|
|
_________
|
(a)
|
Working capital comprised of changes in receivables, inventory, and trade payables.
|
|
(b)
|
Primarily expense and payment timing differences for items such as pension and OPEB, compensation, marketing, warranty, and timing differences between unconsolidated affiliate profits and dividends received. Also includes other factors, such as the impact of tax payments and vehicle financing activities between Automotive and FSG sectors.
|
|
(c)
|
Primarily distributions from Ford Holdings (Ford Credit’s parent) and tax payments received from Ford Credit.
|
With respect to “Changes in working capital,” in general we carry relatively low Automotive sector trade receivables compared with our trade payables because the majority of our Automotive wholesales are financed (primarily by Ford Credit) immediately upon sale of vehicles to dealers, which generally occurs at the time the vehicles are gate-released shortly after being produced. In addition, our inventories are lean because we build to order, not for inventory. In contrast, our Automotive trade payables are based primarily on industry-standard production supplier payment terms generally ranging between 30 days to 45 days. As a result, our cash flow tends to improve as wholesale volumes increase, but can deteriorate significantly when wholesale volumes drop sharply. In addition, these working capital balances generally are subject to seasonal changes that can impact cash flow. For example, we typically experience cash flow timing differences associated with inventories and payables due to our annual summer and December shutdown periods, when production, and therefore inventories and wholesale volumes, are usually at their lowest levels, while payables continue to come due and be paid. The net impact of this typically results in cash outflows from changes in our working capital balances during these shutdown periods.
62
Item 2. Management’s Discussion and Analysis of Financial Condition and Results of Operations (Continued)
Shown below is a reconciliation between financial statement
Net cash provided by/(used in) operating activities
and operating-related cash flows (calculated as shown in the table above), as of the dates shown (in billions):
|
Memo:
|
|||||||||||
|
First Quarter
|
Full Year
|
||||||||||
|
|
2014
|
2013
|
2013
|
||||||||
|
Net cash provided by/(used in) operating activities
|
$
|
2.0
|
|
$
|
0.7
|
|
$
|
7.7
|
|
||
|
Items included in operating-related cash flows
|
|
|
|
|
|
|
|||||
|
Capital spending
|
(1.5
|
)
|
(1.5
|
)
|
(6.6
|
)
|
|||||
|
Proceeds from the exercise of stock options
|
0.1
|
|
—
|
|
0.3
|
|
|||||
|
Net cash flows from non-designated derivatives
|
—
|
|
(0.2
|
)
|
(0.3
|
)
|
|||||
|
Items not included in operating-related cash flows
|
|
|
|
|
|
|
|||||
|
Separation payments
|
—
|
|
0.1
|
|
0.3
|
|
|||||
|
Funded pension contributions
|
0.5
|
|
1.8
|
|
5.0
|
|
|||||
|
Tax refunds, tax payments, and tax receipts from affiliates
|
(0.2
|
)
|
(0.3
|
)
|
(0.3
|
)
|
|||||
|
Other
|
0.3
|
|
0.1
|
|
—
|
|
|||||
|
Operating-related cash flows
|
$
|
1.2
|
|
$
|
0.7
|
|
$
|
6.1
|
|
||
Credit Agreement
. At March 31, 2014, lenders under our Amended and Restated Credit Agreement dated as of November 24, 2009, as further amended (the “revolving credit facility”), had commitments totaling $10.7 billion with a November 30, 2017 maturity date. At March 31, 2014, the utilized portion of the revolving credit facility was $80 million, representing amounts utilized as letters of credit.
On April 30, 2014, we and the lenders under the revolving credit facility agreed to amend the facility and entered into the Second Amended and Restated Credit Agreement dated as of that date (the “amended revolving credit facility”), a copy of which is filed as an exhibit to this Report. Under the amended revolving credit facility, lenders have commitments to us totaling $12.2 billion, with about $9 billion maturing on April 30, 2019 and about $3 billion maturing on April 30, 2017. The amended revolving credit facility is unsecured and free of material adverse change conditions to borrowing, restrictive financial covenants (for example, interest or fixed charge coverage ratio, debt-to-equity ratio, and minimum net worth requirements), and credit rating triggers that could limit our ability to obtain funding. The amended revolving credit facility contains a liquidity covenant that requires us to maintain a minimum of $4 billion in aggregate of domestic cash, cash equivalents, and loaned and marketable securities and/or availability under the amended revolving credit facility. If our senior, unsecured, long-term debt does not maintain at least two investment grade ratings from Fitch, Moody’s, and S&P (each as defined under “Company” below), the guarantees of certain subsidiaries will be required.
At April 30, 2014, the utilized portion of the amended revolving credit facility was $71 million, representing amounts utilized as letters of credit.
Also on April 30, 2014, we designated Ford Credit as a subsidiary borrower under the amended revolving credit facility, which enables Ford Credit to borrow directly under the facility. Any such borrowings by Ford Credit would be guaranteed by us. Separately, at the same time, we and Ford Credit entered into a Relationship Agreement dated April 30, 2014 that, among other things, limits to $2 billion the amount Ford Credit may borrow under the amended revolving credit facility, allocates that amount of commitments to Ford Credit on an irrevocable and exclusive basis to support its liquidity, and requires Ford Credit to reimburse us for the proportionate costs of that amount of commitments under the facility. A copy of the Relationship Agreement is filed as an exhibit to this Report. As a result of this arrangement, beginning April 30, 2014, of the $12.2 billion of total commitments under the amended revolving credit facility, we will reflect $10.2 billion in Automotive liquidity and $2 billion in Ford Credit liquidity.
U.S. Department of Energy (“DOE”) Advanced Technology Vehicle Manufacturer (“ATVM”) Incentive Program.
In September 2009, we entered into a Loan Arrangement and Reimbursement Agreement (“Arrangement Agreement”) with the DOE, under which we borrowed through multiple draws $5.9 billion to finance certain costs for fuel-efficient, advanced-technology vehicles. At
March 31, 2014
, an aggregate of $4.9 billion was outstanding. The principal amount of the ATVM loan bears interest at a blended rate based on the U.S. Treasury yield curve at the time each draw was made (with the weighted-average interest rate on all such draws being about 2.3% per annum).
The ATVM loan is repayable in equal quarterly installments of $148 million, which began in September 2012 and will end in June 2022.
63
Item 2. Management’s Discussion and Analysis of Financial Condition and Results of Operations (Continued)
European Investment Bank (“EIB”) Credit Facilities.
On December 21, 2009, Ford Romania, our operating subsidiary in Romania, entered into a credit facility for an aggregate amount of €400 million (equivalent to $552 million at
March 31, 2014
) with the EIB (the “EIB Romania Facility”), and on July 12, 2010, Ford Motor Company Limited, our operating subsidiary in the United Kingdom (“Ford of Britain”), entered into a credit facility for an aggregate amount of £450 million (equivalent to $749 million at
March 31, 2014
) with the EIB (the “EIB United Kingdom Facility”). The facilities were fully drawn at
March 31, 2014
. Loans under the EIB Romania Facility and the EIB United Kingdom Facility bear interest at a fixed rate of 4.44% and 4% per annum, respectively, and mature on March 31, 2015 and September 11, 2015, respectively. Proceeds of loans drawn under the EIB Romania Facility have been used to fund upgrades to a vehicle plant in Romania, and proceeds of loans drawn under the EIB United Kingdom Facility have been used to fund costs for the research and development of fuel-efficient engines and commercial vehicles with lower emissions, and upgrades to an engine manufacturing plant in the United Kingdom. The loans under each facility are non-amortizing loans secured by respective guarantees from the governments of Romania and the United Kingdom for approximately 80% and from us for approximately 20% of the outstanding principal amounts. Ford Romania and Ford of Britain have each pledged fixed assets, receivables and/or inventory to the governments of Romania and the United Kingdom as collateral, and we have pledged 50% of the shares of Ford Romania to the government of Romania and guaranteed Ford of Britain’s obligations to the government of the United Kingdom.
Export-Import Bank of the United States (“Ex-Im”) and Private Export Funding Corporation (“PEFCO”) Secured Revolving Loan.
At
March 31, 2014
, this working capital facility, which supports vehicle exports from the United States, was fully drawn at $300 million. The facility was renewed on June 15, 2013 and will renew annually until June 15, 2015, provided that no payment or bankruptcy default exists and Ex-Im continues to have a perfected security interest in the collateral, which consists of vehicles in transit in the United States to be exported to Canada, Mexico, and other select markets.
Other Automotive Credit Facilities.
At
March 31, 2014
, we had $836 million of local credit facilities available to non-U.S. Automotive affiliates, of which $88 million had been utilized.
Net Cash.
Our Automotive sector net cash calculation as of the dates shown was as follows (in billions):
|
March 31,
2014
|
December 31, 2013
|
||||||
|
Automotive gross cash
|
$
|
25.2
|
|
$
|
24.8
|
|
|
|
Less:
|
|
|
|
|
|||
|
Long-term debt
|
13.6
|
|
14.4
|
|
|||
|
Debt payable within one year
|
2.1
|
|
1.3
|
|
|||
|
Total debt
|
15.7
|
|
15.7
|
|
|||
|
Net cash
|
$
|
9.5
|
|
$
|
9.1
|
|
|
Total debt at March 31, 2014 remained unchanged from December 31, 2013, primarily reflecting a $200 million affiliate debt increase, offset by one quarterly installment payment on the ATVM loan which totaled about $150 million and other debt retirements during the quarter. We continue to expect to reduce Automotive debt levels to about $10 billion by mid-decade. We plan to achieve this reduction by using cash from operations to make quarterly installment payments on the ATVM loan, repay the EIB loan at maturity, and take other debt reduction actions, such as causing conversions of and redeeming our outstanding convertible debt, and repurchasing other outstanding debt securities.
Liquidity Sufficiency
. One of the four key priorities of our One Ford plan is to finance our plan and improve our balance sheet, while at the same time having resources available to grow our business. The actions described above are consistent with this priority. Based on our planning assumptions, we believe that we have sufficient liquidity and capital resources to continue to invest in new products that customers want and value, transform and grow our business, pay our debts and obligations as and when they come due, pay a sustainable dividend, and provide protection within an uncertain global economic environment.
Based on improved near-term cash flows and the identification of additional opportunities for profitable growth, we plan to increase the ongoing amount of capital spending to support product development, growth, restructuring, and infrastructure to about $7.5 billion annually with variation by year. This compares to our 2013 capital spending of $6.6 billion.
We will continue to work to strengthen further our balance sheet and improve our investment grade ratings; the amount of incremental capital required to do this will diminish over time as we achieve our target debt levels and fully fund and de-risk our global funded pension plans.
64
Item 2. Management’s Discussion and Analysis of Financial Condition and Results of Operations (Continued)
Financial Services Sector
Ford Credit
Funding Overview.
Ford Credit’s funding strategy remains focused on diversification, and it plans to continue accessing a variety of markets, channels, and investors.
The chart below details the trends in the funding of Ford Credit’s managed receivables:
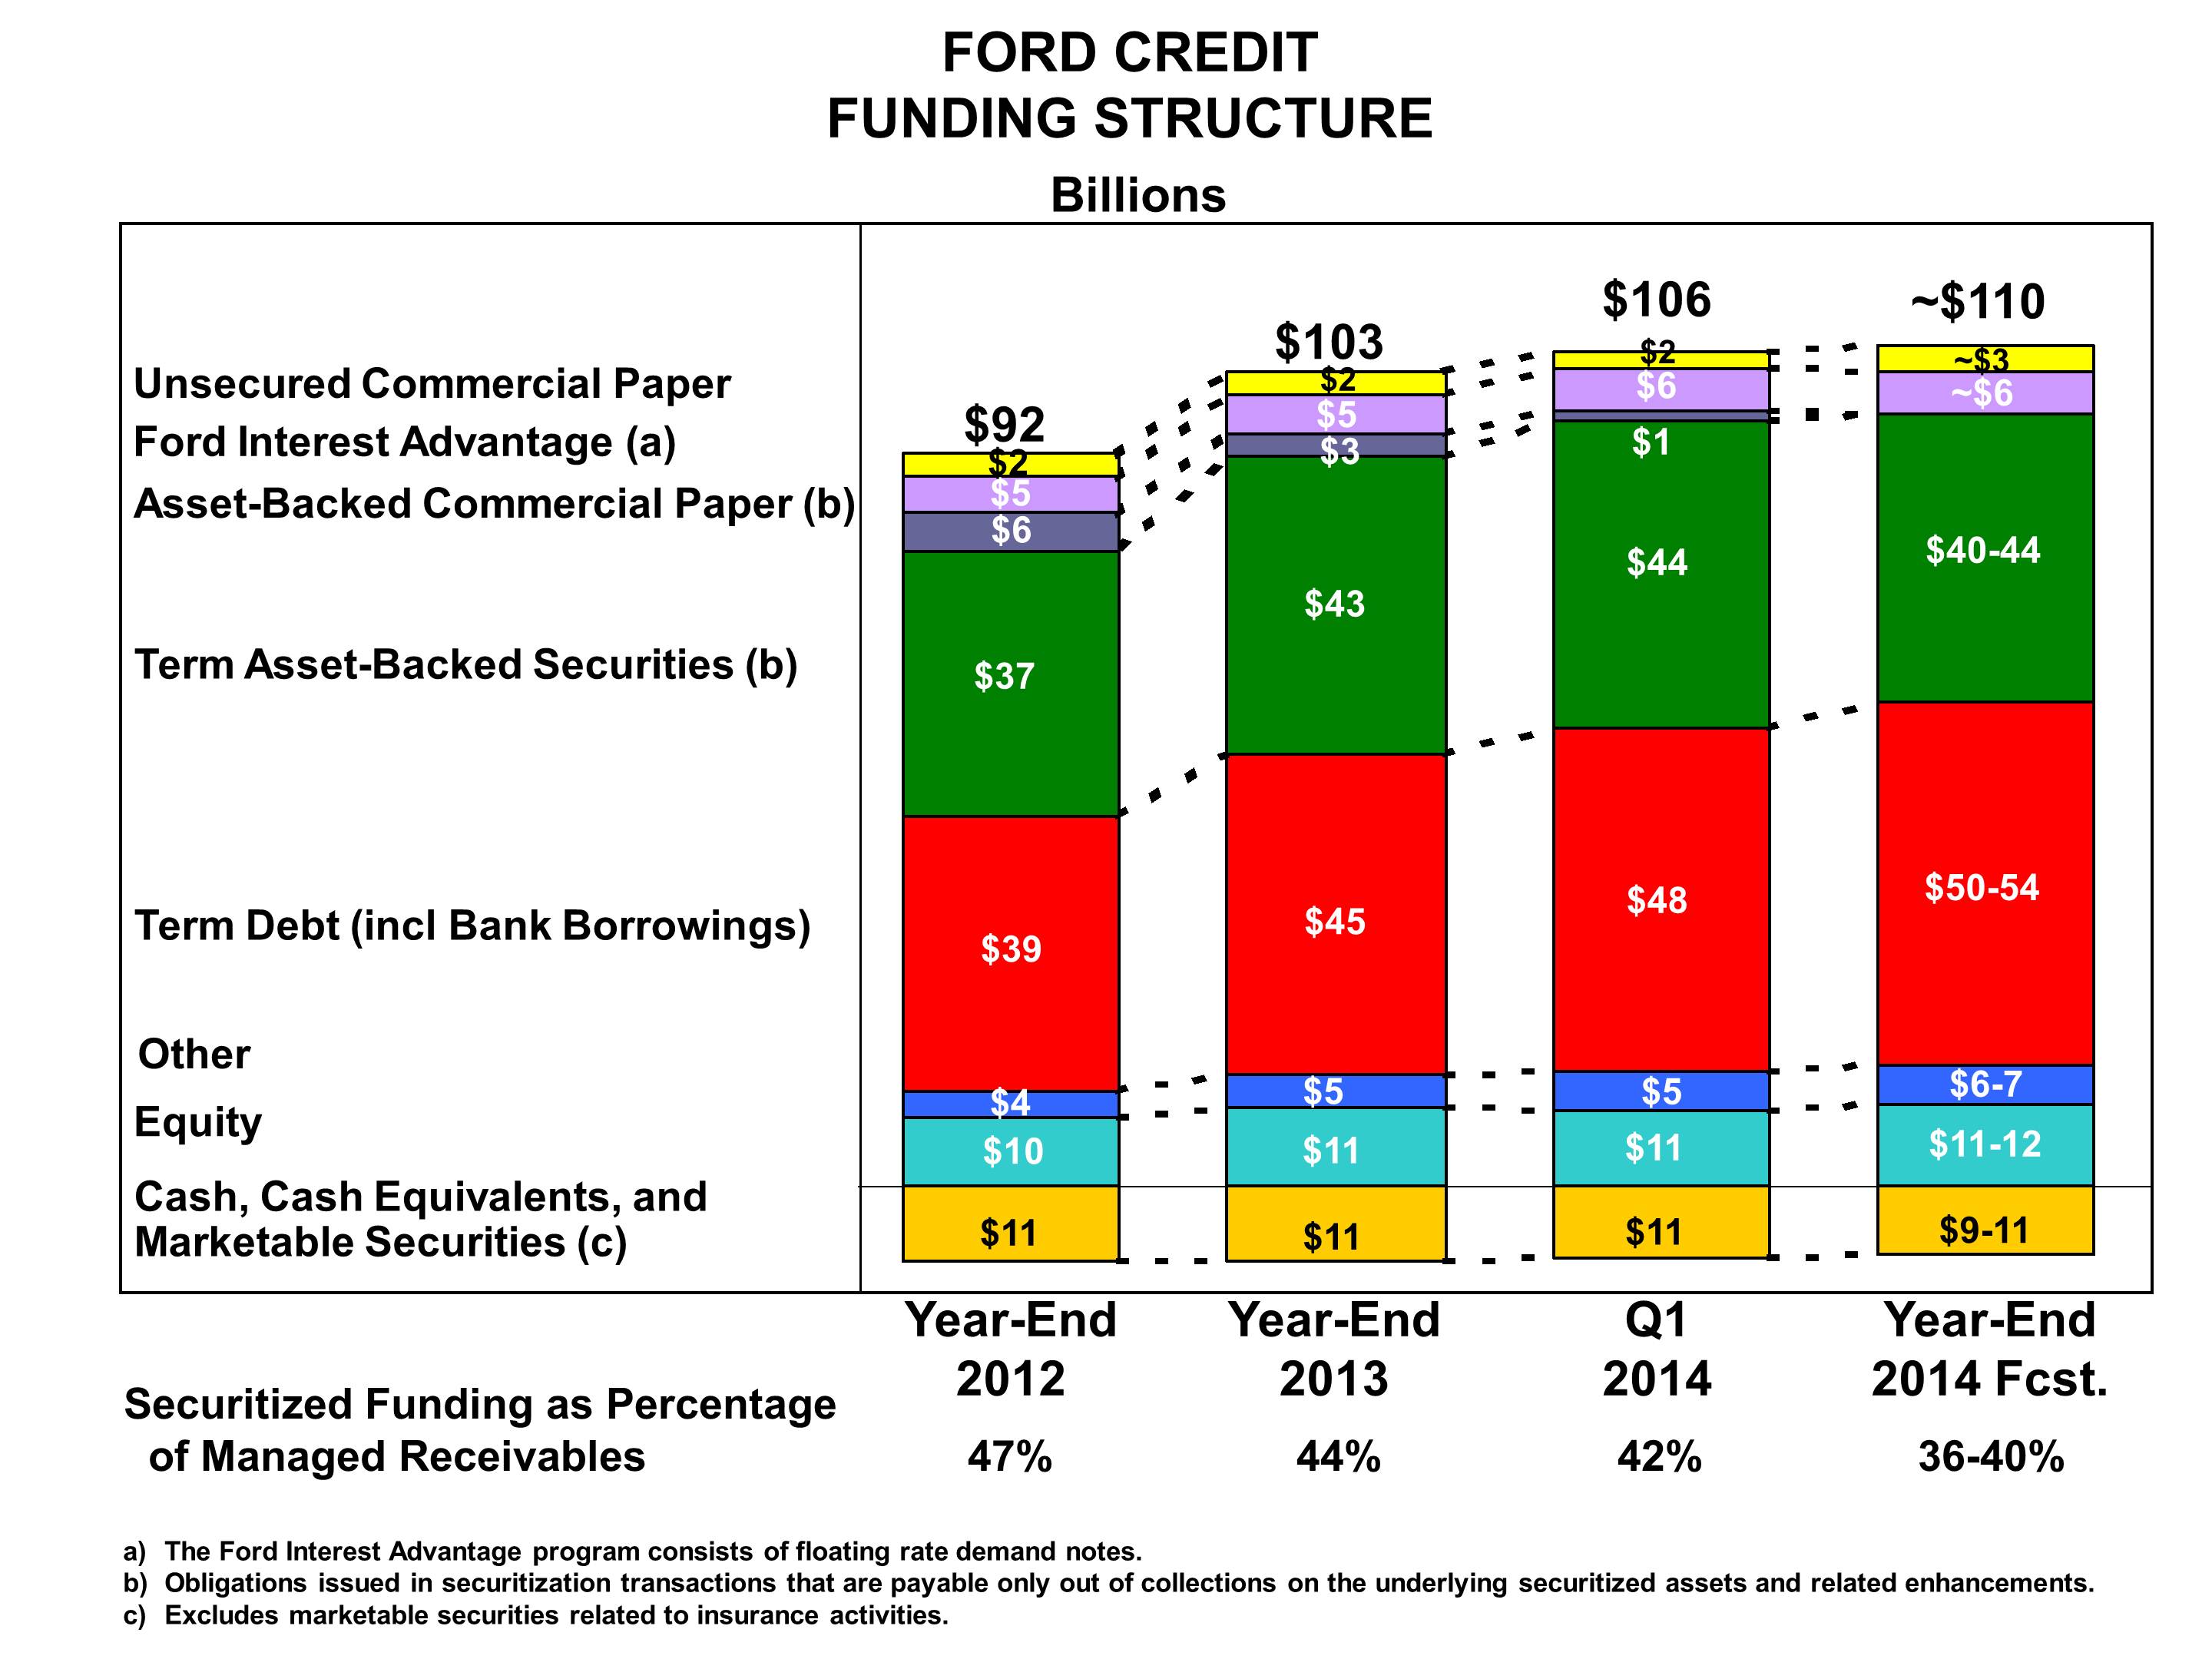
At the end of the first quarter of 2014, managed receivables were $106
billion, and Ford Credit ended the quarter with about $11 billion in cash. Securitized funding was 42% of managed receivables
.
Ford Credit is projecting 2014 year-end managed receivables of about $110 billion and securitized funding as a percentage of managed receivables in the range of 36% to 40%. This percentage will continue to decline going forward.
65
Item 2. Management’s Discussion and Analysis of Financial Condition and Results of Operations (Continued)
Public Term Funding Plan.
The following table illustrates Ford Credit’s planned issuances for full-year 2014, its public term funding issuances through April 30, 2014, and its funding issuances for full-year 2013 and 2012 (in billions), excluding short-term funding programs:
|
Public Term Funding Plan
|
|||||||||||||
|
2014
|
|||||||||||||
|
Full-Year
Forecast
|
Through
April 30
|
Full-Year
2013
|
Full-Year
2012
|
||||||||||
|
Unsecured
|
$ 9-12
|
$
|
4
|
|
$
|
11
|
|
$
|
9
|
|
|||
|
Securitizations (a)
|
12-15
|
5
|
|
14
|
|
14
|
|
||||||
|
Total
|
$ 21-27
|
$
|
9
|
|
$
|
25
|
|
$
|
23
|
|
|||
|
(a)
|
Includes Rule 144A offerings.
|
Through April 30, 2014, Ford Credit completed $9 billion of public term funding in the United States, Canada, and Europe, including about $4 billion of unsecured debt and $5 billion of securitizations.
For 2014, Ford Credit projects full-year public term funding in the range of $21 billion to $27 billion, consisting of $9
billion to $12
billion of unsecured debt and $12 billion to $15 billion of public securitizations. These are unchanged from prior guidance.
Liquidity.
The following table illustrates Ford Credit’s liquidity programs and utilization (in billions):
|
March 31,
2014
|
December 31, 2013
|
||||||
|
Liquidity Sources (a)
|
|||||||
|
Cash (b)
|
$
|
10.7
|
|
$
|
10.8
|
|
|
|
Unsecured credit facilities
|
1.6
|
|
1.6
|
|
|||
|
FCAR bank lines
|
1.6
|
|
3.5
|
|
|||
|
Conduit / Bank Asset-Backed Securitizations (“ABS”)
|
30.8
|
|
29.4
|
|
|||
|
Total liquidity sources
|
$
|
44.7
|
|
$
|
45.3
|
|
|
|
Utilization of Liquidity
|
|||||||
|
Securitization cash (c)
|
$
|
(3.1
|
)
|
$
|
(4.4
|
)
|
|
|
Unsecured credit facilities
|
(0.4
|
)
|
(0.4
|
)
|
|||
|
FCAR bank lines
|
(1.3
|
)
|
(3.3
|
)
|
|||
|
Conduit / Bank ABS
|
(16.6
|
)
|
(14.7
|
)
|
|||
|
Total utilization of liquidity
|
(21.4
|
)
|
(22.8
|
)
|
|||
|
Gross liquidity
|
23.3
|
|
22.5
|
|
|||
|
Capacity in excess of eligible receivables
|
(0.7
|
)
|
(1.1
|
)
|
|||
|
Liquidity available for use
|
$
|
22.6
|
|
$
|
21.4
|
|
|
__________
|
(a)
|
FCAR and conduits subject to availability of sufficient assets and ability to obtain derivatives to manage interest rate risk; FCAR commercial paper must be supported by bank lines equal to at least 100% of the principal amount; conduits include committed securitization programs.
|
|
(b)
|
Cash, cash equivalents, and marketable securities (excludes marketable securities related to insurance activities).
|
|
(c)
|
Securitization cash is to be used only to support on-balance sheet securitization transactions.
|
At March 31, 2014, Ford Credit had $44.7 billion of committed capacity and cash diversified across a variety of markets and platforms. The utilization of its liquidity totaled $21.4 billion at quarter end, compared with $22.8 billion at year-end 2013. The decrease of $1.4 billion reflects lower securitization cash.
Ford Credit ended the quarter with gross liquidity of $23.3 billion. Capacity in excess of eligible receivables was $0.7 billion. This provides a funding source for future originations and flexibility to transfer capacity among markets and asset classes where most needed. Total liquidity available for use continues to remain strong at $22.6
billion at quarter end, $1.2 billion higher than year-end 2013. Ford Credit is focused on maintaining liquidity levels that meet its business and funding requirements through economic cycles.
66
Item 2. Management’s Discussion and Analysis of Financial Condition and Results of Operations (Continued)
Cash, Cash Equivalents, and Marketable Securities.
At March 31, 2014, Ford Credit’s cash, cash equivalents, and marketable securities (excluding marketable securities related to insurance activities) totaled $10.7 billion, compared with $10.8 billion at year-end 2013. In the normal course of its funding activities, Ford Credit may generate more proceeds than are required for its immediate funding needs. These excess amounts are maintained primarily as highly liquid investments, which provide liquidity for its short-term funding needs and give it flexibility in the use of its other funding programs. Ford Credit’s cash, cash equivalents, and marketable securities are held primarily in highly liquid investments, which provide for anticipated and unanticipated cash needs. Ford Credit’s cash, cash equivalents, and marketable securities (excluding marketable securities related to insurance activities) primarily include U.S. Treasury obligations, federal agency securities, bank time deposits with investment-grade institutions and non-U.S. central banks, corporate investment-grade securities, A-1/P-1 (or higher) rated commercial paper, debt obligations of a select group of non-U.S. governments, non-U.S. government agencies, supranational institutions, and money market funds that carry the highest possible ratings. The maturity of these investments ranges from about 90 days to up to about one year and is adjusted based on market conditions and liquidity needs. Ford Credit monitors its cash levels and average maturity on a daily basis. Cash, cash equivalents, and marketable securities include amounts to be used only to support Ford Credit’s securitization transactions of $3.1 billion and $4.4 billion at March 31, 2014 and December 31, 2013, respectively.
Ford Credit’s substantial liquidity and cash balance have provided it the opportunity to selectively call and repurchase its unsecured and asset-backed debt through market transactions. In the first quarter of 2014, Ford Credit called an aggregate principal amount of $195 million (of which none were maturing in 2014) of its unsecured debt.
Committed Liquidity Programs
. Ford Credit and its subsidiaries, including FCE Bank plc (“FCE”), have entered into agreements with a number of bank-sponsored asset-backed commercial paper conduits (“conduits”) and other financial institutions. Such counterparties are contractually committed, at Ford Credit’s option, to purchase from Ford Credit eligible retail or wholesale assets or to purchase or make advances under asset-backed securities backed by retail financing, operating leases, or wholesale financing assets for proceeds of up to $30.8 billion ($20.5 billion of retail financing, $6.0 billion of wholesale financing, and $4.3 billion of operating lease assets) at March 31, 2014, of which $5.8 billion are commitments to FCE. These committed liquidity programs have varying maturity dates, with $28.4 billion (of which $5.4 billion relates to FCE commitments) having maturities within the next twelve months and the remaining balance having maturities in 2015 and 2016 . Ford Credit plans to achieve capacity renewals to protect its global funding needs, optimize capacity utilization, and maintain sufficient liquidity.
Ford Credit’s ability to obtain funding under these programs is subject to having a sufficient amount of assets eligible for these programs as well as its ability to obtain interest rate hedging arrangements for certain securitization transactions. Ford Credit’s capacity in excess of eligible receivables protects it against the risk of lower than planned renewal rates. At March 31, 2014, $16.6 billion of these commitments were in use. These programs are free of material adverse change clauses, restrictive financial covenants (for example, debt-to-equity limitations and minimum net worth requirements), and generally, credit rating triggers that could limit Ford Credit’s ability to obtain funding. However, the unused portion of these commitments may be terminated if the performance of the underlying assets deteriorates beyond specified levels. Based on Ford Credit’s experience and knowledge as servicer of the related assets, Ford Credit does not expect any of these programs to be terminated due to such events.
Credit Facilities
. At March 31, 2014, Ford Credit and its majority-owned subsidiaries had $1.6 billion of contractually committed unsecured credit facilities with financial institutions, including FCE’s £720 million (equivalent to $1.2 billion at March 31, 2014) syndicated credit facility (the “FCE Credit Agreement”), which matures in 2016. At March 31, 2014, $1.2 billion was available for use. The FCE Credit Agreement contains certain covenants, including an obligation for FCE to maintain its ratio of regulatory capital to risk-weighted assets at no less than the applicable regulatory minimum, and for the support agreement between FCE and Ford Credit to remain in full force and effect (and enforced by FCE to ensure that its net worth is maintained at no less than $500 million). In addition to customary payment, representation, bankruptcy, and judgment defaults, the FCE Credit Agreement contains cross-payment and cross-acceleration defaults with respect to other debt.
At March 31, 2014, FCAR’s bank liquidity facilities available to support FCAR’s asset-backed commercial paper, subordinated debt, or its purchase of Ford Credit’s asset-backed securities totaled $1.6 billion, down from $3.5 billion at December 31, 2013. This reduction has been offset by increases in other committed liquidity programs, leaving Ford Credit’s total sources of liquidity largely unchanged. Ford Credit recently completed the wind down of its FCAR program. Ford Credit began repurchasing asset-backed securities in early 2014 and completed the process in April. No FCAR commercial paper remains outstanding, and all FCAR bank liquidity facilities have been terminated. In October 2013, Ford Credit established a two-year syndicated committed asset-backed liquidity facility. The facility, along with growth in other asset-backed private capacity, offsets the liquidity effects of winding down the FCAR program.
67
Item 2. Management’s Discussion and Analysis of Financial Condition and Results of Operations (Continued)
As described above under “Liquidity and Capital Resources — Automotive Sector,” on April 30, 2014, we designated Ford Credit as a subsidiary borrower under the amended revolving credit facility and entered into a Relationship Agreement that, among other things, allocates and limits to $2 billion the amount Ford Credit may borrow under the amended revolving credit facility to grow its overall liquidity, supporting growth and expanded funding programs.
Leverage.
Ford Credit uses leverage, or the debt-to-equity ratio, to make various business decisions, including evaluating and establishing pricing for finance receivable and operating lease financing, and assessing its capital structure. Ford Credit refers to its shareholder’s interest as equity.
The following table shows the calculation of Ford Credit’s financial statement leverage (in billions, except for ratios):
|
March 31,
2014
|
December 31, 2013
|
||||||
|
Total debt (a)
|
$
|
101.0
|
|
$
|
98.7
|
|
|
|
Equity
|
10.8
|
|
10.6
|
|
|||
|
Financial statement leverage (to 1)
|
9.3
|
|
9.3
|
|
|||
__________
|
(a)
|
Includes debt issued in securitization transactions and payable only out of collections on the underlying securitized assets and related enhancements. Ford Credit holds the right to receive the excess cash flows not needed to pay the debt issued by, and other obligations of, the securitization entities that are parties to those securitization transactions.
|
The following table shows the calculation of Ford Credit’s managed leverage (in billions, except for ratios):
|
March 31,
2014
|
December 31, 2013
|
||||||
|
Total debt (a)
|
$
|
101.0
|
|
$
|
98.7
|
|
|
|
Adjustments for cash, cash equivalents, and marketable securities (b)
|
(10.7
|
)
|
(10.8
|
)
|
|||
|
Adjustments for derivative accounting (c)
|
(0.2
|
)
|
(0.2
|
)
|
|||
|
Total adjusted debt
|
$
|
90.1
|
|
$
|
87.7
|
|
|
|
Equity
|
$
|
10.8
|
|
$
|
10.6
|
|
|
|
Adjustments for derivative accounting (c)
|
(0.3
|
)
|
(0.3
|
)
|
|||
|
Total adjusted equity
|
$
|
10.5
|
|
$
|
10.3
|
|
|
|
Managed leverage (to 1) (d)
|
8.6
|
|
8.5
|
|
|||
__________
|
(a)
|
Includes debt issued in securitization transactions and payable only out of collections on the underlying securitized assets and related enhancements. Ford Credit holds the right to receive the excess cash flows not needed to pay the debt issued by, and other obligations of, the securitization entities that are parties to those securitization transactions.
|
|
(b)
|
Excludes marketable securities related to insurance activities.
|
|
(c)
|
Primarily related to market valuation adjustments to derivatives due to movements in interest rates. Adjustments to debt are related to designated fair value hedges and adjustments to equity are related to retained earnings.
|
|
(d)
|
Equals total adjusted debt over total adjusted equity.
|
Ford Credit plans its managed leverage by considering prevailing market conditions and the risk characteristics of its business. At March
31,
2014, Ford Credit’s managed leverage was 8.6:1, compared with 8.5:1 at December
31,
2013.
68
Item 2. Management’s Discussion and Analysis of Financial Condition and Results of Operations (Continued)
Company
Equity.
At
March 31, 2014
,
Total equity attributable to Ford Motor Company
was $26.8 billion, an increase of $661 million compared with
December 31, 2013
. The increase reflects favorable changes in
Retained earnings
, related to first quarter 2014
Net income attributable to Ford Motor Company
of $989 million, offset partially by cash dividends declared of $493 million; favorable changes in
Capital in excess of par value of stock,
related to compensation-related equity issuances of $125 million; and favorable changes in
Accumulated other comprehensive income/(loss)
of $40 million.
Credit Ratings.
Our short-term and long-term debt is rated by four credit rating agencies designated as nationally recognized statistical rating organizations (“NRSROs”) by the U.S. Securities and Exchange Commission:
|
•
|
DBRS Limited (“DBRS”);
|
|
•
|
Fitch, Inc. (“Fitch”);
|
|
•
|
Moody’s Investors Service, Inc. (“Moody’s”); and
|
|
•
|
Standard & Poor’s Ratings Services, a division of The McGraw-Hill Companies, Inc. (“S&P”).
|
In several markets, locally-recognized rating agencies also rate us. A credit rating reflects an assessment by the rating agency of the credit risk associated with a corporate entity or particular securities issued by that entity. Rating agencies’ ratings of us are based on information provided by us and other sources. Credit ratings are not recommendations to buy, sell, or hold securities, and are subject to revision or withdrawal at any time by the assigning rating agency. Each rating agency may have different criteria for evaluating company risk and, therefore, ratings should be evaluated independently for each rating agency. Lower credit ratings generally result in higher borrowing costs and reduced access to capital markets.
There has been one action taken by these NRSROs since the filing of our 2013 Form 10-K Report: on April 22, 2014, Fitch affirmed its ratings for Ford and Ford Credit and improved the outlook for both to positive from stable.
The following chart summarizes certain of the credit ratings and outlook presently assigned by these four NRSROs:
|
NRSRO RATINGS
|
|||||||||||||
|
Ford
|
Ford Credit
|
NRSROs
|
|||||||||||
|
Issuer
Default /
Corporate /
Issuer Rating
|
Long-Term Senior Unsecured
|
Outlook / Trend
|
Long-Term Senior Unsecured
|
Short-Term
Unsecured
|
Outlook / Trend
|
Minimum Long-Term Investment Grade Rating
|
|||||||
|
DBRS
|
BBB (low)
|
BBB (low)
|
Stable
|
BBB (low)
|
R-3
|
Stable
|
BBB (low)
|
||||||
|
Fitch
|
BBB-
|
BBB-
|
Positive
|
BBB-
|
F3
|
Positive
|
BBB-
|
||||||
|
Moody’s
|
N/A
|
Baa3
|
Stable
|
Baa3
|
P-3
|
Stable
|
Baa3
|
||||||
|
S&P *
|
BBB-
|
BBB-
|
Stable
|
BBB-
|
NR
|
Stable
|
BBB-
|
||||||
__________
|
*
|
S&P assigns FCE a long-term senior unsecured credit rating of BBB, a one-notch higher rating than Ford and Ford Credit, with a negative outlook. The negative outlook reflects the negative trend S&P has assigned to U.K. banking industry risk.
|
69
Item 2. Management’s Discussion and Analysis of Financial Condition and Results of Operations (Continued)
PRODUCTION VOLUMES (a)
Our first quarter 2014 production volumes and second quarter 2014 projected production volumes are as follows (in thousands):
|
2014
|
||||||||
|
First Quarter
Actual
|
Second Quarter
Forecast
|
|||||||
|
Units
|
O/(U) 2013
|
Units
|
O/(U) 2013
|
|||||
|
North America
|
774
|
(10)
|
810
|
(10)
|
||||
|
South America
|
94
|
(17)
|
105
|
(29)
|
||||
|
Europe
|
382
|
(4)
|
405
|
4
|
||||
|
Middle East & Africa
|
17
|
2
|
20
|
3
|
||||
|
Asia Pacific
|
346
|
75
|
360
|
64
|
||||
|
Total
|
1,613
|
46
|
1,700
|
32
|
||||
__________
(a) Includes production of Ford and JMC brand vehicles produced by our unconsolidated affiliates.
In the first quarter, total company production was about 1.6 million units, 46,000 units higher than a year ago. This is 3,000 units higher than our most recent guidance.
We expect second quarter production to be 1.7 million units, up 32,000 units from a year ago, more than explained by higher volume in Asia Pacific. Compared with the first quarter, our second quarter production is forecasted to be up 87,000 units.
Item 2. Management’s Discussion and Analysis of Financial Condition and Results of Operations (Continued)
OUTLOOK
Business Environment
We project global economic growth to be in the 2.5% to 3% range, and global industry sales to be about 85 million to 90 million units. U.S. economic growth is projected to be in the 2.5% to 3% range, with industry sales still supported by replacement demand as a result of the older age of vehicles on the road. Near-term conditions have shown signs of improvement after some weakness in January and February data. In South America, Brazil’s economy is slowing due to higher interest rates put in place to contain inflation, while the situation in Argentina and Venezuela remains volatile with both economies facing unclear economic policy direction. In Europe, an economic recovery is underway. For 2014, we expect gross domestic product growth of about 1% in the Euro Area and 2% to 2.5% in the United Kingdom. The European Central Bank left its policy interest rate unchanged at a 0.25% in April and indicated that it will keep rates low for an extended period. The Bank of England also indicated that it will keep rates low until economic growth reduces excess capacity in the U.K. economy. And in Asia Pacific, China’s economic growth is expected to be slightly below 7.5% with several challenges, including excess capacity and excess debt. The government intends to be more focused on structural reforms and is willing to accept lower growth within a reasonable range of 7.5%. Growth in India is expected to improve modestly to about 5% from last year as high inflation and high interest rates remain impediments to stronger growth. Overall, despite challenges in the emerging markets, we expect global economic growth to continue in 2014.
2014 Key Metrics — Business Units
Our profit outlook for our business units, along with our outlook for net interest expense, is as follows:
|
Memo:
|
||||||||||||||
|
2013
|
2014 Full Year
|
2014
|
||||||||||||
|
Full Year
|
Compared with 2013
|
First Quarter
|
||||||||||||
|
Results
|
Plan
|
Outlook
|
Results
|
|||||||||||
|
(Mils.)
|
(Mils.)
|
|||||||||||||
|
Automotive (a)
|
||||||||||||||
|
North America (b)
|
$
|
8,809
|
|
Lower
|
On Track
|
$
|
1,500
|
|
||||||
|
- Operating Margin
|
10.2
|
|
%
|
8 - 9%
|
On Track
|
7.3
|
|
%
|
||||||
|
South America
|
$
|
(33
|
)
|
About Equal
|
Lower
|
$
|
(510
|
)
|
||||||
|
Europe
|
(1,442
|
)
|
Better
|
On Track
|
(194
|
)
|
||||||||
|
Middle East & Africa
|
(69
|
)
|
About Breakeven
|
On Track
|
54
|
|
||||||||
|
Asia Pacific
|
327
|
|
About Equal
|
Higher
|
291
|
|
||||||||
|
Net Interest Expense
|
(801
|
)
|
About Equal
|
About $(700) million
|
(163
|
)
|
||||||||
|
Ford Credit
|
$
|
1,756
|
|
About Equal
|
About Equal/Higher
|
$
|
499
|
|
||||||
__________
(a) Excludes special items
(b) Full year 2013 North America pre-tax results include a $39 million favorable revision related to a change in accounting for U.S. and Canada employee disability benefits
Except for South America, the outlook for each of our business units is improved or unchanged.
71
Item 2. Management’s Discussion and Analysis of Financial Condition and Results of Operations (Continued)
2014 Planning Assumptions and Key Metrics
Based on the current economic environment, our planning assumptions and key metrics for 2014 include the following:
|
Memo:
|
||||||||||||||
|
2013
|
2014
|
2014
|
||||||||||||
|
Full Year
|
Full Year
|
First Quarter
|
||||||||||||
|
Results
|
Plan
|
Outlook
|
Results
|
|||||||||||
|
Planning Assumptions (Mils.)
|
||||||||||||||
|
Industry Volume (a) -- U.S.
|
15.9
|
|
16.0 - 17.0
|
On Track
|
16.0
|
|
||||||||
|
-- Europe 20
|
13.8
|
|
13.5 - 14.5
|
14.0 - 15.0
|
14.5
|
|
||||||||
|
-- China
|
22.2
|
|
22.5 - 24.5
|
On Track
|
22.9
|
|
||||||||
|
Key Metrics
|
||||||||||||||
|
Automotive (Compared with 2013):
|
||||||||||||||
|
- Revenue (Bils.)
|
$
|
139.4
|
|
About Equal
|
On Track
|
$
|
33.9
|
|
||||||
|
- Operating Margin (b)
|
5.4
|
|
%
|
Lower
|
On Track
|
3.4
|
|
%
|
||||||
|
- Operating-Related Cash Flow (Bils.) (c)
|
$
|
6.1
|
|
Substantially Lower
|
On Track
|
$
|
1.2
|
|
||||||
|
Ford Credit (Compared with 2013):
|
||||||||||||||
|
- Pre-Tax Profit (Bils.)
|
$
|
1.8
|
|
About Equal
|
About Equal/Higher
|
$
|
0.5
|
|
||||||
|
Company:
|
||||||||||||||
|
- Pre-Tax Profit (Bils.) (c)
|
$
|
8.6
|
|
$7 - $8 Billion
|
On Track
|
$
|
1.4
|
|
||||||
__________
|
(a)
|
Based, in part, on estimated vehicle registrations; includes medium and heavy trucks
|
|
(b)
|
Automotive operating margin is defined as Automotive pre-tax results, excluding special items and Other Automotive, divided by Automotive revenue
|
|
(c)
|
Excludes special items; reconciliation to GAAP provided in “Results of Operations” and “Liquidity and Capital Resources” above
|
For 2014, we continue to expect industry volume, including medium and heavy trucks, to range from 16 million to 17 million units in the United States, and from 22.5 million to 24.5 million units in China. We now expect industry volume for our Europe 20 markets to range from 14 million to 15 million units, reflecting improved economic growth prospects and replacement demand.
In terms of our financial performance, we continue to expect Automotive revenue to be about equal to 2013; Automotive operating margin to be lower than 2013; and Automotive operating-related cash flow to be substantially lower than 2013. This includes capital spending of about $7.5 billion to support new or significantly refreshed products and capacity actions.
We now expect Ford Credit pre-tax profit to be about equal to or higher than 2013.
We continue to expect our pre-tax profit, excluding special items, to be in the $7 billion to $8 billion range as we continue to create innovative products such as the all-new F-150. We also continue to expect our full-year operating effective tax rate to be about 35%.
Overall, we expect 2014 to be a solid year for Ford Motor Company and a critical next step forward in implementing our One Ford plan to continue delivering profitable growth for all.
ONE FORD PLAN
We remain focused on delivering the key aspects of the One Ford plan, which are unchanged:
|
•
|
Aggressively restructure to operate profitably at the current demand and changing model mix;
|
|
•
|
Accelerate development of new products our customers want and value;
|
|
•
|
Finance our plan and improve our balance sheet; and
|
|
•
|
Work together effectively as one team, leveraging our global assets.
|
72
Item 2. Management’s Discussion and Analysis of Financial Condition and Results of Operations (Continued)
Risk Factors
Statements included or incorporated by reference herein may constitute “forward-looking statements” within the meaning of the Private Securities Litigation Reform Act of 1995. Forward-looking statements are based on expectations, forecasts, and assumptions by our management and involve a number of risks, uncertainties, and other factors that could cause actual results to differ materially from those stated, including, without limitation:
|
•
|
Decline in industry sales volume, particularly in the United States or Europe, due to financial crisis, recession, geopolitical events, or other factors;
|
|
•
|
Decline in Ford’s market share or failure to achieve growth;
|
|
•
|
Lower-than-anticipated market acceptance of Ford’s new or existing products;
|
|
•
|
Market shift away from sales of larger, more profitable vehicles beyond Ford’s current planning assumption, particularly in the United States;
|
|
•
|
An increase in or continued volatility of fuel prices, or reduced availability of fuel;
|
|
•
|
Continued or increased price competition resulting from industry excess capacity, currency fluctuations, or other factors;
|
|
•
|
Fluctuations in foreign currency exchange rates, commodity prices, and interest rates;
|
|
•
|
Adverse effects resulting from economic, geopolitical, or other events;
|
|
•
|
Economic distress of suppliers that may require Ford to provide substantial financial support or take other measures to ensure supplies of components or materials and could increase costs, affect liquidity, or cause production constraints or disruptions;
|
|
•
|
Work stoppages at Ford or supplier facilities or other limitations on production (whether as a result of labor disputes, natural or man-made disasters, tight credit markets or other financial distress, production constraints or difficulties, or other factors);
|
|
•
|
Single-source supply of components or materials;
|
|
•
|
Labor or other constraints on Ford’s ability to maintain competitive cost structure;
|
|
•
|
Substantial pension and postretirement health care and life insurance liabilities impairing liquidity or financial condition;
|
|
•
|
Worse-than-assumed economic and demographic experience for postretirement benefit plans (e.g., discount rates or investment returns);
|
|
•
|
Restriction on use of tax attributes from tax law “ownership change;”
|
|
•
|
The discovery of defects in vehicles resulting in delays in new model launches, recall campaigns, or increased warranty costs;
|
|
•
|
Increased safety, emissions, fuel economy, or other regulations resulting in higher costs, cash expenditures, and/or sales restrictions;
|
|
•
|
Unusual or significant litigation, governmental investigations, or adverse publicity arising out of alleged defects in products, perceived environmental impacts, or otherwise;
|
|
•
|
A change in requirements under long-term supply arrangements committing Ford to purchase minimum or fixed quantities of certain parts, or to pay a minimum amount to the seller (“take-or-pay” contracts);
|
|
•
|
Adverse effects on results from a decrease in or cessation or clawback of government incentives related to investments;
|
|
•
|
Inherent limitations of internal controls impacting financial statements and safeguarding of assets;
|
|
•
|
Cybersecurity risks to operational systems, security systems, or infrastructure owned by Ford, Ford Credit, or a third-party vendor or supplier;
|
|
•
|
Failure of financial institutions to fulfill commitments under committed credit and liquidity facilities;
|
|
•
|
Inability of Ford Credit to access debt, securitization, or derivative markets around the world at competitive rates or in sufficient amounts, due to credit rating downgrades, market volatility, market disruption, regulatory requirements, or other factors;
|
|
•
|
Higher-than-expected credit losses, lower-than-anticipated residual values, or higher-than-expected return volumes for leased vehicles;
|
|
•
|
Increased competition from banks or other financial institutions seeking to increase their share of financing Ford vehicles; and
|
|
•
|
New or increased credit, consumer, or data protection or other regulations resulting in higher costs and/or additional financing restrictions.
|
We cannot be certain that any expectation, forecast, or assumption made in preparing forward-looking statements will prove accurate, or that any projection will be realized. It is to be expected that there may be differences between projected and actual results. Our forward-looking statements speak only as of the date of their initial issuance, and we do not undertake any obligation to update or revise publicly any forward-looking statement, whether as a result of new information, future events, or otherwise. For additional discussion, see “Item 1A. Risk Factors” in our 2013 Form 10-K report for additional discussion, as updated by subsequent Quarterly Reports on Form 10-Q and Current Reports on Form 8-K.
73
Item 2. Management’s Discussion and Analysis of Financial Condition and Results of Operations (Continued)
ACCOUNTING STANDARDS ISSUED BUT NOT YET ADOPTED
There are no applicable accounting standards issued but not yet adopted to report this period.
OTHER FINANCIAL INFORMATION
The interim financial information included in this Quarterly Report on Form 10-Q for the periods ended
March 31, 2014
and 2013 has not been audited by PricewaterhouseCoopers LLP ("PwC"). In reviewing such information, PwC has applied limited procedures in accordance with professional standards for reviews of interim financial information. Readers should restrict reliance on PwC’s reports on such information accordingly. PwC is not subject to the liability provisions of Section 11 of the Securities Act of 1933 for its reports on interim financial information, because such reports do not constitute "reports" or "parts" of registration statements prepared or certified by PwC within the meaning of Sections 7 and 11 of the Securities Act of 1933.
ITEM 3.
Quantitative and Qualitative Disclosures About Market Risk
Automotive Sector
Foreign Currency Risk.
The net fair value of foreign exchange forward contracts (including adjustments for credit risk), as of
March 31, 2014
, was an asset of $188 million compared with an asset of $158 million as of
December 31, 2013
. The potential decrease in fair value from a 10% adverse change in the underlying exchange rates, in U.S. dollar terms, would be $2.1 billion at
March 31, 2014
, compared with $2 billion at
December 31, 2013
.
Commodity Price Risk.
The net fair value of commodity forward and option contracts (including adjustments for credit risk) as of
March 31, 2014
was an asset of $15 million, compared with an asset of $4 million as of
December 31, 2013
. The potential decrease in fair value from a 10% adverse change in the underlying commodity prices, in U.S. dollar terms, would be $63
million at
March 31, 2014
, compared with $70
million at
December 31, 2013
.
Financial Services Sector
Interest Rate Risk
.
To provide a quantitative measure of the sensitivity of Ford Credit’s pre-tax cash flow to changes
in interest rates, Ford Credit uses interest rate scenarios that assume a hypothetical, instantaneous increase or decrease
of one percentage point
in all interest rates across all maturities (a “parallel shift”), as well as a base case that assumes
that all interest rates remain constant at existing levels
.
The differences in pre-tax cash flow between these
scenarios and the base case over a twelve-month period represent an estimate of the sensitivity of Ford Credit’s pre-tax
cash flow
.
Under this model, Ford Credit estimates that at
March 31, 2014
, all else constant, such an increase in
interest rates would increase its pre-tax cash flow by $37 million over the next twelve months, compared with an increase
of $63 million at
December 31, 2013
.
In reality, interest rate changes are rarely
instantaneous or parallel and rates could move more or less than the one percentage point assumed in Ford Credit’s
analysis. As a result, the actual impact to pre-tax cash flow could be higher or lower than the results detailed above.
ITEM 4.
Controls and Procedures.
Evaluation of Disclosure Controls and Procedures.
Alan Mulally, our Chief Executive Officer (“CEO”), and Bob Shanks, our Chief Financial Officer (“CFO”), have performed an evaluation of the Company’s disclosure controls and procedures, as that term is defined in Rule 13a-15(e) of the Securities Exchange Act of 1934, as amended (“Exchange Act”), as of March 31, 2014, and each has concluded that such disclosure controls and procedures are effective to ensure that information required to be disclosed in our periodic reports filed under the Exchange Act is recorded, processed, summarized, and reported within the time periods specified by SEC rules and forms, and that such information is accumulated and communicated to the CEO and CFO to allow timely decisions regarding required disclosures.
Changes in Internal Control over Financial Reporting.
There were no changes in internal control over financial reporting during the quarter ended March 31, 2014 that have materially affected, or are reasonably likely to materially affect, our internal control over financial reporting.
74
PART II. OTHER INFORMATION
ITEM 1.
Legal Proceedings.
OTHER MATTERS
Apartheid Litigation (as previously reported on page 28 of our 2013 Form 10-K Report).
As previously reported, we are a defendant in purported class action lawsuits seeking unspecified damages on behalf of South African citizens who suffered violence and oppression under South Africa’s apartheid regime. The lawsuits allege that the defendant companies aided and abetted the apartheid regime and its human rights violations. In August 2013, the U.S. Court of Appeals remanded the cases to the District Court with instructions to dismiss, but on April 17, 2014, the District Court ruled that plaintiffs may move for leave to file an amended complaint.
ITEM 6.
Exhibits.
Please see exhibit index below.
SIGNATURE
Pursuant to the requirements of Section 13 or 15(d) of the Securities Exchange Act of 1934, as amended, Ford has duly caused this Report to be signed on its behalf by the undersigned, thereunto duly authorized.
FORD MOTOR COMPANY
|
By:
|
/s/ Stuart Rowley
|
|
|
Stuart Rowley, Vice President and Controller
|
|
|
(principal accounting officer)
|
|
|
|
|
Date:
|
May 1, 2014
|
75
EXHIBIT INDEX
|
Designation
|
|
Description
|
|
Method of Filing
|
|
Exhibit 10.1
|
Tenth Amendment dated April 30, 2014 to the Credit Agreement dated as of December 15, 2006, as amended and restated as of November 24, 2009, and as further amended, including the Second Amended and Restated Credit Agreement.
|
Filed with this Report.
|
||
|
Exhibit 10.2
|
Relationship Agreement between Ford Motor Company and Ford Motor Credit LLC dated April 30, 2014.
|
Filed with this Report.
|
||
|
Exhibit 12
|
|
Calculation of Ratio of Earnings to Fixed Charges.
|
|
Filed with this Report.
|
|
Exhibit 15
|
Letter of PricewaterhouseCoopers LLP, dated May 1, 2014, relating to financial information.
|
Filed with this Report.
|
||
|
Exhibit 18
|
Letter of PricewaterhouseCoopers LLP, dated May 1, 2014, relating to change in accounting principle.
|
Filed with this Report.
|
||
|
Exhibit 31.1
|
|
Rule 15d-14(a) Certification of CEO.
|
|
Filed with this Report.
|
|
Exhibit 31.2
|
|
Rule 15d-14(a) Certification of CFO.
|
|
Filed with this Report.
|
|
Exhibit 32.1
|
|
Section 1350 Certification of CEO.
|
|
Furnished with this Report.
|
|
Exhibit 32.2
|
|
Section 1350 Certification of CFO.
|
|
Furnished with this Report.
|
|
Exhibit 101.INS
|
|
XBRL Instance Document.
|
|
*
|
|
Exhibit 101.SCH
|
|
XBRL Taxonomy Extension Schema Document.
|
|
*
|
|
Exhibit 101.CAL
|
|
XBRL Taxonomy Extension Calculation Linkbase Document.
|
|
*
|
|
Exhibit 101.LAB
|
|
XBRL Taxonomy Extension Label Linkbase Document.
|
|
*
|
|
Exhibit 101.PRE
|
|
XBRL Taxonomy Extension Presentation Linkbase Document.
|
|
*
|
|
Exhibit 101.DEF
|
|
XBRL Taxonomy Extension Definition Linkbase Document.
|
|
*
|
__________
* Submitted electronically with this Report in accordance with the provisions of Regulation S-T.
76
TABLE OF CONTENTS
Part I. Financial InformationItem 1. Financial StatementsItem 1. Financial Statements (continued)Item 1. Financial Statements (continued) Ford Motor Company and Subsidiaries Notes To The Financial StatementsNote 1. PresentationNote 1. Presentation (continued)Note 2. Fair Value MeasurementsNote 2. Fair Value Measurements (continued)Note 3. Financial Services Sector Finance ReceivablesNote 3. Financial Services Sector Finance Receivables (continued)Note 4. Financial Services Sector Allowance For Credit LossesNote 5. InventoriesNote 6. Variable Interest EntitiesNote 7. Other Liabilities and Deferred RevenueNote 8. Retirement BenefitsNote 9. DebtNote 10. Derivative Financial Instruments and Hedging ActivitiesNote 10. Derivative Financial Instruments and Hedging Activities (continued)Note 11. Redeemable Noncontrolling InterestNote 12. Accumulated Other Comprehensive Income/(loss)Note 13. Other Income/(loss)Note 14. Employee Separation Actions and Exit and Disposal ActivitiesNote 14. Employee Separation Actions and Exit and Disposal Activities ( Continued )Note 14. Employee Separation Actions and Exit and Disposal Activities (Note 15. Income TaxesNote 16. Amounts Per Share Attributable To Ford Motor Company Common and Class B StockNote 17. Segment InformationNote 17. Segment Information (continued)Note 18. Commitments and ContingenciesNote 18. Commitments and Contingencies (continued)Item 2. Management S Discussion and Analysis Of Financial Condition and Results Of OperationsItem 2. Management S Discussion and Analysis Of Financial Condition and Results Of Operations (continued)Item 3. Quantitative and Qualitative Disclosures About Market RiskItem 4. Controls and ProceduresPart II. Other InformationItem 1. Legal ProceedingsItem 6. Exhibits