FORD MOTOR CO
10-Ks and 10-Qs
|
|
|
|
|
|
|
|
|
|
|
|
|
|
|
|
|
|
|
|
|
|
|
|
|
|
|
|
|
|
|
|
|
|
|
|
|
|
|
|
|
|
|
|
|
|
|
|
|
|
|
|
|
|
|
|
UNITED STATES
SECURITIES AND EXCHANGE COMMISSION
Washington, DC 20549
FORM 10-Q
|
(Mark One)
|
|
|
R
|
Quarterly report pursuant to Section 13 or 15(d) of the Securities Exchange Act of 1934
|
|
|
|
|
|
For the quarterly period ended September 30, 2014
|
|
|
|
|
|
or
|
|
|
|
|
o
|
Transition report pursuant to Section 13 or 15(d) of the Securities Exchange Act of 1934
|
|
|
|
|
|
For the transition period from __________ to __________
|
|
|
|
|
|
Commission file number 1-3950
|
Ford Motor Company
(Exact name of Registrant as specified in its charter)
|
Delaware
|
38-0549190
|
|
(State of incorporation)
|
(I.R.S. Employer Identification No.)
|
|
|
|
|
One American Road, Dearborn, Michigan
|
48126
|
|
(Address of principal executive offices)
|
(Zip Code)
|
313-322-3000
(Registrant’s telephone number, including area code)
Indicate by check mark if the registrant (1) has filed all reports required to be filed by Section 13 or 15(d) of the Securities Exchange Act of 1934 during the preceding 12 months (or for such shorter period that the registrant was required to file such reports), and (2) has been subject to such filing requirements for the past 90 days. Yes
R
No
o
Indicate by check mark whether the registrant has submitted electronically and posted on its corporate Web site, if any, every Interactive Data File required to be submitted and posted pursuant to Rule 405 of Regulation S-T (§232.405 of this chapter) during the preceding 12 months (or for such shorter period that the registrant was required to submit and post such files). Yes
R
No
o
Indicate by check mark whether the registrant is a large accelerated filer, an accelerated filer, a non-accelerated filer, or a smaller reporting company. See definitions of “large accelerated filer,” “accelerated filer,” and “smaller reporting company” in Rule 12b-2 of the Exchange Act. Large accelerated filer
R
Accelerated filer
o
Non-accelerated filer
o
Smaller reporting company
o
Indicate by check mark whether the registrant is a shell company (as defined in Rule 12b-2 of the Exchange Act). Yes
o
No
R
As of October 24, 2014, Ford had outstanding 3,777,835,341 shares of Common Stock and 70,852,076 shares of Class B Stock.
Exhibit Index begins on page
FORD MOTOR COMPANY
QUARTERLY REPORT ON FORM 10-Q
For the Quarter Ended
September 30, 2014
|
|
Table of Contents
|
Page
|
|
|
|
Part I - Financial Information
|
|
|
|
Item 1
|
Financial Statements
|
||
|
Consolidated Income Statement
|
|||
|
Consolidated Statement of Comprehensive Income
|
|||
|
Sector Income Statement
|
|||
|
Consolidated Balance Sheet
|
|||
|
Sector Balance Sheet
|
|||
|
Condensed Consolidated Statement of Cash Flows
|
|||
|
Condensed Sector Statement of Cash Flows
|
|||
|
Consolidated Statement of Equity
|
|||
|
Notes to the Financial Statements
|
|||
|
Report of Independent Registered Public Accounting Firm
|
|||
|
Item 2
|
Management’s Discussion and Analysis of Financial Condition and Results of Operations
|
||
|
Results of Operations
|
|||
|
Automotive Sector
|
|||
|
Financial Services Sector
|
|||
|
Liquidity and Capital Resources
|
|||
|
Production Volumes
|
|||
|
Outlook
|
|||
|
Accounting Standards Issued But Not Yet Adopted
|
|||
|
Other Financial Information
|
|||
|
Item 3
|
Quantitative and Qualitative Disclosures About Market Risk
|
||
|
Automotive Sector
|
|||
|
Financial Services Sector
|
|||
|
Item 4
|
Controls and Procedures
|
||
|
Part II - Other Information
|
|||
|
Item 1
|
Legal Proceedings
|
||
|
Item 1A
|
Risk Factors
|
||
|
Item 2
|
Unregistered Sales of Equity Securities and Use of Proceeds
|
||
|
Item 6
|
Exhibits
|
||
|
Signature
|
|||
|
Exhibit Index
|
|||
i
PART I. FINANCIAL INFORMATION
ITEM 1.
Financial Statements.
FORD MOTOR COMPANY AND SUBSIDIARIES
CONSOLIDATED INCOME STATEMENT
(in millions, except per share amounts)
|
For the periods ended September 30,
|
|||||||||||||||
|
|
2014
|
2013
|
2014
|
2013
|
|||||||||||
|
|
Third Quarter
|
First Nine Months
|
|||||||||||||
|
(unaudited)
|
|||||||||||||||
|
Revenues
|
|
|
|||||||||||||
|
Automotive
|
$
|
32,779
|
|
$
|
33,857
|
|
$
|
102,020
|
|
$
|
103,794
|
|
|||
|
Financial Services
|
2,141
|
|
1,918
|
|
6,187
|
|
5,553
|
|
|||||||
|
Total revenues
|
34,920
|
|
35,775
|
|
108,207
|
|
109,347
|
|
|||||||
|
Costs and expenses
|
|
|
|
|
|||||||||||
|
Automotive cost of sales
|
30,197
|
|
30,030
|
|
92,465
|
|
92,559
|
|
|||||||
|
Selling, administrative, and other expenses
|
3,484
|
|
3,235
|
|
10,332
|
|
9,562
|
|
|||||||
|
Financial Services interest expense
|
673
|
|
762
|
|
2,034
|
|
2,173
|
|
|||||||
|
Financial Services provision for credit and insurance losses
|
74
|
|
46
|
|
217
|
|
139
|
|
|||||||
|
Total costs and expenses
|
34,428
|
|
34,073
|
|
105,048
|
|
104,433
|
|
|||||||
|
Automotive interest expense
|
204
|
|
204
|
|
619
|
|
617
|
|
|||||||
|
Automotive interest income and other income/(loss), net (Note 14)
|
255
|
|
200
|
|
739
|
|
686
|
|
|||||||
|
Financial Services other income/(loss), net (Note 14)
|
90
|
|
100
|
|
245
|
|
270
|
|
|||||||
|
Equity in net income of affiliated companies
|
388
|
|
293
|
|
874
|
|
780
|
|
|||||||
|
Income before income taxes
|
1,021
|
|
2,091
|
|
|
4,398
|
|
|
6,033
|
|
|||||
|
Provision for/(Benefit from) income taxes (Note 16)
|
188
|
|
818
|
|
1,261
|
|
1,914
|
|
|||||||
|
Net income
|
833
|
|
1,273
|
|
3,137
|
|
4,119
|
|
|||||||
|
Less: Income/(Loss) attributable to noncontrolling interests
|
(2
|
)
|
1
|
|
2
|
|
3
|
|
|||||||
|
Net income attributable to Ford Motor Company
|
$
|
835
|
|
$
|
1,272
|
|
$
|
3,135
|
|
$
|
4,116
|
|
|||
|
AMOUNTS PER SHARE ATTRIBUTABLE TO FORD MOTOR COMPANY COMMON AND CLASS B STOCK (Note 18)
|
|||||||||||||||
|
Basic income
|
$
|
0.22
|
|
$
|
0.32
|
|
$
|
0.80
|
|
$
|
1.05
|
|
|||
|
Diluted income
|
0.21
|
|
0.31
|
|
0.78
|
|
1.02
|
|
|||||||
|
Cash dividends declared
|
0.125
|
|
0.10
|
|
0.375
|
|
0.30
|
|
|||||||
CONSOLIDATED STATEMENT OF COMPREHENSIVE INCOME
(in millions)
|
|
For the periods ended September 30,
|
||||||||||||||
|
|
2014
|
2013
|
2014
|
2013
|
|||||||||||
|
|
Third Quarter
|
First Nine Months
|
|||||||||||||
|
(unaudited)
|
|||||||||||||||
|
Net income
|
$
|
833
|
|
$
|
1,273
|
|
$
|
3,137
|
|
$
|
4,119
|
|
|||
|
Other comprehensive income/(loss), net of tax (Note 13)
|
|||||||||||||||
|
Foreign currency translation
|
(550
|
)
|
313
|
|
(468
|
)
|
(483
|
)
|
|||||||
|
Derivative instruments
|
(48
|
)
|
(95
|
)
|
(243
|
)
|
191
|
|
|||||||
|
Pension and other postretirement benefits
|
540
|
|
109
|
|
776
|
|
1,640
|
|
|||||||
|
Total other comprehensive income/(loss), net of tax
|
(58
|
)
|
327
|
|
65
|
|
1,348
|
|
|||||||
|
Comprehensive income
|
775
|
|
1,600
|
|
3,202
|
|
5,467
|
|
|||||||
|
Less: Comprehensive income/(loss) attributable to noncontrolling interests
|
(2
|
)
|
1
|
|
2
|
|
3
|
|
|||||||
|
Comprehensive income attributable to Ford Motor Company
|
$
|
777
|
|
$
|
1,599
|
|
$
|
3,200
|
|
$
|
5,464
|
|
|||
The accompanying notes are part of the financial statements.
1
Item 1. Financial Statements (Continued)
FORD MOTOR COMPANY AND SUBSIDIARIES
SECTOR INCOME STATEMENT
(in millions)
|
For the periods ended September 30,
|
|||||||||||||||
|
|
2014
|
2013
|
2014
|
2013
|
|||||||||||
|
|
Third Quarter
|
First Nine Months
|
|||||||||||||
|
(unaudited)
|
|||||||||||||||
|
AUTOMOTIVE
|
|
|
|||||||||||||
|
Revenues
|
$
|
32,779
|
|
$
|
33,857
|
|
$
|
102,020
|
|
$
|
103,794
|
|
|||
|
Costs and expenses
|
|||||||||||||||
|
Cost of sales
|
30,197
|
|
30,030
|
|
92,465
|
|
92,559
|
|
|||||||
|
Selling, administrative, and other expenses
|
2,489
|
|
2,382
|
|
7,516
|
|
7,351
|
|
|||||||
|
Total costs and expenses
|
32,686
|
|
32,412
|
|
99,981
|
|
99,910
|
|
|||||||
|
Interest expense
|
204
|
|
204
|
|
619
|
|
617
|
|
|||||||
|
Interest income and other income/(loss), net (Note 14)
|
255
|
|
200
|
|
739
|
|
686
|
|
|||||||
|
Equity in net income of affiliated companies
|
382
|
|
287
|
|
853
|
|
763
|
|
|||||||
|
Income before income taxes — Automotive
|
526
|
|
1,728
|
|
3,012
|
|
4,716
|
|
|||||||
|
FINANCIAL SERVICES
|
|
|
|
|
|||||||||||
|
Revenues
|
2,141
|
|
1,918
|
|
6,187
|
|
5,553
|
|
|||||||
|
Costs and expenses
|
|||||||||||||||
|
Interest expense
|
673
|
|
762
|
|
2,034
|
|
2,173
|
|
|||||||
|
Depreciation on vehicles subject to operating leases
|
808
|
|
632
|
|
2,256
|
|
1,673
|
|
|||||||
|
Operating and other expenses
|
187
|
|
221
|
|
560
|
|
538
|
|
|||||||
|
Provision for credit and insurance losses
|
74
|
|
46
|
|
217
|
|
139
|
|
|||||||
|
Total costs and expenses
|
1,742
|
|
1,661
|
|
5,067
|
|
4,523
|
|
|||||||
|
Other income/(loss), net (Note 14)
|
90
|
|
100
|
|
245
|
|
270
|
|
|||||||
|
Equity in net income of affiliated companies
|
6
|
|
6
|
|
21
|
|
17
|
|
|||||||
|
Income before income taxes — Financial Services
|
495
|
|
363
|
|
1,386
|
|
1,317
|
|
|||||||
|
COMPANY
|
|||||||||||||||
|
Income before income taxes
|
1,021
|
|
2,091
|
|
4,398
|
|
6,033
|
|
|||||||
|
Provision for/(Benefit from) income taxes (Note 16)
|
188
|
|
818
|
|
1,261
|
|
1,914
|
|
|||||||
|
Net income
|
833
|
|
1,273
|
|
3,137
|
|
4,119
|
|
|||||||
|
Less: Income/(Loss) attributable to noncontrolling interests
|
(2
|
)
|
1
|
|
2
|
|
3
|
|
|||||||
|
Net income attributable to Ford Motor Company
|
$
|
835
|
|
$
|
1,272
|
|
$
|
3,135
|
|
$
|
4,116
|
|
|||
The accompanying notes are part of the financial statements.
2
Item 1. Financial Statements (Continued)
FORD MOTOR COMPANY AND SUBSIDIARIES
CONSOLIDATED BALANCE SHEET
(in millions)
|
|
September 30,
2014 |
December 31,
2013 |
|||||
|
|
(unaudited)
|
||||||
|
ASSETS
|
|
|
|||||
|
Cash and cash equivalents
|
$
|
13,320
|
|
$
|
14,468
|
|
|
|
Marketable securities
|
20,643
|
|
22,100
|
|
|||
|
Finance receivables, net (Note 4)
|
79,882
|
|
77,481
|
|
|||
|
Other receivables, net
|
11,143
|
|
9,828
|
|
|||
|
Net investment in operating leases
|
23,010
|
|
19,984
|
|
|||
|
Inventories (Note 6)
|
9,296
|
|
7,708
|
|
|||
|
Equity in net assets of affiliated companies
|
3,103
|
|
3,679
|
|
|||
|
Net property
|
30,048
|
|
27,616
|
|
|||
|
Deferred income taxes
|
12,312
|
|
13,468
|
|
|||
|
Other assets
|
6,078
|
|
5,847
|
|
|||
|
Total assets
|
$
|
208,835
|
|
$
|
202,179
|
|
|
|
LIABILITIES
|
|
|
|
|
|||
|
Payables
|
$
|
21,155
|
|
$
|
19,531
|
|
|
|
Other liabilities and deferred revenue (Note 8)
|
41,407
|
|
40,886
|
|
|||
|
Debt (Note 10)
|
119,193
|
|
114,688
|
|
|||
|
Deferred income taxes
|
576
|
|
598
|
|
|||
|
Total liabilities
|
182,331
|
|
175,703
|
|
|||
|
Redeemable noncontrolling interest (Note 12)
|
339
|
|
331
|
|
|||
|
EQUITY
|
|
|
|
|
|||
|
Capital stock
|
|
|
|
|
|||
|
Common Stock, par value $.01 per share (3,934 million shares issued of 6 billion authorized)
|
39
|
|
39
|
|
|||
|
Class B Stock, par value $.01 per share (71 million shares issued of 530 million authorized)
|
1
|
|
1
|
|
|||
|
Capital in excess of par value of stock
|
21,680
|
|
21,422
|
|
|||
|
Retained earnings
|
25,051
|
|
23,386
|
|
|||
|
Accumulated other comprehensive income/(loss) (Note 13)
|
(18,165
|
)
|
(18,230
|
)
|
|||
|
Treasury stock (Note 18)
|
(2,470
|
)
|
(506
|
)
|
|||
|
Total equity attributable to Ford Motor Company
|
26,136
|
|
26,112
|
|
|||
|
Equity attributable to noncontrolling interests
|
29
|
|
33
|
|
|||
|
Total equity
|
26,165
|
|
26,145
|
|
|||
|
Total liabilities and equity
|
$
|
208,835
|
|
$
|
202,179
|
|
|
The following table includes assets to be used to settle liabilities of the consolidated variable interest entities (“VIEs”). These assets and liabilities are included in the consolidated balance sheet above. See
Note 7
for additional information on our VIEs.
|
September 30,
2014 |
December 31,
2013 |
||||||
|
(unaudited)
|
|||||||
|
ASSETS
|
|
|
|||||
|
Cash and cash equivalents
|
$
|
2,022
|
|
$
|
4,198
|
|
|
|
Finance receivables, net
|
37,590
|
|
45,796
|
|
|||
|
Net investment in operating leases
|
9,927
|
|
8,116
|
|
|||
|
Other assets
|
13
|
|
5
|
|
|||
|
LIABILITIES
|
|||||||
|
Other liabilities and deferred revenue
|
$
|
18
|
|
$
|
88
|
|
|
|
Debt
|
35,869
|
|
40,728
|
|
|||
The accompanying notes are part of the financial statements.
3
Item 1. Financial Statements (Continued)
FORD MOTOR COMPANY AND SUBSIDIARIES
SECTOR BALANCE SHEET (in millions)
|
September 30,
2014 |
December 31,
2013 |
||||||
|
ASSETS
|
(unaudited)
|
||||||
|
Automotive
|
|
|
|||||
|
Cash and cash equivalents
|
$
|
5,980
|
|
$
|
4,959
|
|
|
|
Marketable securities
|
16,876
|
|
20,157
|
|
|||
|
Total cash and marketable securities
|
22,856
|
|
25,116
|
|
|||
|
Receivables, less allowances of $119 and $132
|
5,697
|
|
5,641
|
|
|||
|
Inventories (Note 6)
|
9,296
|
|
7,708
|
|
|||
|
Deferred income taxes
|
1,590
|
|
1,574
|
|
|||
|
Net investment in operating leases
|
1,935
|
|
1,384
|
|
|||
|
Other current assets
|
1,305
|
|
1,034
|
|
|||
|
Total current assets
|
42,679
|
|
42,457
|
|
|||
|
Equity in net assets of affiliated companies
|
2,964
|
|
3,546
|
|
|||
|
Net property
|
29,739
|
|
27,492
|
|
|||
|
Deferred income taxes
|
12,307
|
|
13,436
|
|
|||
|
Other assets
|
2,890
|
|
2,824
|
|
|||
|
Non-current receivable from Financial Services
|
694
|
|
724
|
|
|||
|
Total Automotive assets
|
91,273
|
|
90,479
|
|
|||
|
Financial Services
|
|
|
|
|
|||
|
Cash and cash equivalents
|
7,340
|
|
9,509
|
|
|||
|
Marketable securities
|
3,767
|
|
1,943
|
|
|||
|
Finance receivables, net (Note 4)
|
84,537
|
|
80,816
|
|
|||
|
Net investment in operating leases
|
21,075
|
|
18,600
|
|
|||
|
Equity in net assets of affiliated companies
|
139
|
|
133
|
|
|||
|
Other assets
|
3,161
|
|
3,149
|
|
|||
|
Receivable from Automotive
|
453
|
|
907
|
|
|||
|
Total Financial Services assets
|
120,472
|
|
115,057
|
|
|||
|
Intersector elimination
|
(1,147
|
)
|
(1,631
|
)
|
|||
|
Total assets
|
$
|
210,598
|
|
$
|
203,905
|
|
|
|
LIABILITIES
|
|
|
|
|
|||
|
Automotive
|
|
|
|
|
|||
|
Payables
|
$
|
19,892
|
|
$
|
18,035
|
|
|
|
Other liabilities and deferred revenue (Note 8)
|
18,254
|
|
16,537
|
|
|||
|
Deferred income taxes
|
313
|
|
267
|
|
|||
|
Debt payable within one year (Note 10)
|
2,727
|
|
1,257
|
|
|||
|
Current payable to Financial Services
|
453
|
|
907
|
|
|||
|
Total current liabilities
|
41,639
|
|
37,003
|
|
|||
|
Long-term debt (Note 10)
|
12,216
|
|
14,426
|
|
|||
|
Other liabilities and deferred revenue (Note 8)
|
21,190
|
|
22,089
|
|
|||
|
Deferred income taxes
|
408
|
|
430
|
|
|||
|
Total Automotive liabilities
|
75,453
|
|
73,948
|
|
|||
|
Financial Services
|
|
|
|
|
|||
|
Payables
|
1,263
|
|
1,496
|
|
|||
|
Debt (Note 10)
|
104,250
|
|
99,005
|
|
|||
|
Deferred income taxes
|
1,618
|
|
1,627
|
|
|||
|
Other liabilities and deferred income (Note 8)
|
1,963
|
|
2,260
|
|
|||
|
Payable to Automotive
|
694
|
|
724
|
|
|||
|
Total Financial Services liabilities
|
109,788
|
|
105,112
|
|
|||
|
Intersector elimination
|
(1,147
|
)
|
(1,631
|
)
|
|||
|
Total liabilities
|
184,094
|
|
177,429
|
|
|||
|
Redeemable noncontrolling interest (Note 12)
|
339
|
|
331
|
|
|||
|
EQUITY
|
|
|
|
|
|||
|
Capital stock
|
|
|
|
|
|||
|
Common Stock, par value $.01 per share (3,934 million shares issued of 6 billion authorized)
|
39
|
|
39
|
|
|||
|
Class B Stock, par value $.01 per share (71 million shares issued of 530 million authorized)
|
1
|
|
1
|
|
|||
|
Capital in excess of par value of stock
|
21,680
|
|
21,422
|
|
|||
|
Retained earnings
|
25,051
|
|
23,386
|
|
|||
|
Accumulated other comprehensive income/(loss) (Note 13)
|
(18,165
|
)
|
(18,230
|
)
|
|||
|
Treasury stock (Note 18)
|
(2,470
|
)
|
(506
|
)
|
|||
|
Total equity attributable to Ford Motor Company
|
26,136
|
|
26,112
|
|
|||
|
Equity attributable to noncontrolling interests
|
29
|
|
33
|
|
|||
|
Total equity
|
26,165
|
|
26,145
|
|
|||
|
Total liabilities and equity
|
$
|
210,598
|
|
$
|
203,905
|
|
|
The accompanying notes are part of the financial statements.
4
Item 1. Financial Statements (Continued)
FORD MOTOR COMPANY AND SUBSIDIARIES
CONDENSED CONSOLIDATED STATEMENT OF CASH FLOWS
(in millions)
|
For the periods ended September 30,
|
|||||||
|
|
2014
|
2013
|
|||||
|
First Nine Months
|
|||||||
|
(unaudited)
|
|||||||
|
Cash flows from operating activities of continuing operations
|
|
|
|||||
|
Net cash provided by/(used in) operating activities
|
$
|
12,339
|
|
$
|
10,129
|
|
|
|
Cash flows from investing activities of continuing operations
|
|||||||
|
Capital spending
|
(5,309
|
)
|
(4,659
|
)
|
|||
|
Acquisitions of finance receivables and operating leases
|
(39,368
|
)
|
(33,636
|
)
|
|||
|
Collections of finance receivables and operating leases
|
27,607
|
|
25,141
|
|
|||
|
Purchases of securities
|
(37,788
|
)
|
(96,614
|
)
|
|||
|
Sales and maturities of securities
|
39,153
|
|
94,064
|
|
|||
|
Settlements of derivatives
|
(46
|
)
|
(247
|
)
|
|||
|
Proceeds from sales of retail finance receivables (Note 17)
|
—
|
|
410
|
|
|||
|
Other
|
157
|
|
221
|
|
|||
|
Net cash provided by/(used in) investing activities
|
(15,594
|
)
|
(15,320
|
)
|
|||
|
Cash flows from financing activities of continuing operations
|
|
|
|
|
|||
|
Cash dividends
|
(1,470
|
)
|
(1,179
|
)
|
|||
|
Purchases of Common Stock
|
(1,964
|
)
|
(164
|
)
|
|||
|
Changes in short-term debt
|
(2,792
|
)
|
(3,227
|
)
|
|||
|
Proceeds from issuance of other debt
|
31,107
|
|
28,946
|
|
|||
|
Principal payments on other debt
|
(22,504
|
)
|
(20,288
|
)
|
|||
|
Other
|
36
|
|
254
|
|
|||
|
Net cash provided by/(used in) financing activities
|
2,413
|
|
4,342
|
|
|||
|
Effect of exchange rate changes on cash and cash equivalents
|
(306
|
)
|
(58
|
)
|
|||
|
Net increase/(decrease) in cash and cash equivalents
|
$
|
(1,148
|
)
|
$
|
(907
|
)
|
|
|
Cash and cash equivalents at January 1
|
$
|
14,468
|
|
$
|
15,659
|
|
|
|
Net increase/(decrease) in cash and cash equivalents
|
(1,148
|
)
|
(907
|
)
|
|||
|
Cash and cash equivalents at September 30
|
$
|
13,320
|
|
$
|
14,752
|
|
|
The accompanying notes are part of the financial statements.
5
Item 1. Financial Statements (Continued)
FORD MOTOR COMPANY AND SUBSIDIARIES
CONDENSED SECTOR STATEMENT OF CASH FLOWS
(in millions)
|
For the periods ended September 30,
|
|||||||||||||||
|
|
2014
|
2013
|
|||||||||||||
|
First Nine Months
|
|||||||||||||||
|
|
Automotive
|
Financial Services
|
Automotive
|
Financial Services
|
|||||||||||
|
(Unaudited)
|
|||||||||||||||
|
Cash flows from operating activities of continuing operations
|
|||||||||||||||
|
Net cash provided by/(used in) operating activities
|
$
|
6,733
|
|
$
|
3,878
|
|
$
|
6,378
|
|
$
|
3,172
|
|
|||
|
Cash flows from investing activities of continuing operations
|
|||||||||||||||
|
Capital spending
|
(5,236
|
)
|
(73
|
)
|
(4,635
|
)
|
(24
|
)
|
|||||||
|
Acquisitions of finance receivables and operating leases (excluding wholesale and other)
|
—
|
|
(36,911
|
)
|
—
|
|
(31,880
|
)
|
|||||||
|
Collections of finance receivables and operating leases (excluding wholesale and other)
|
—
|
|
27,607
|
|
—
|
|
25,141
|
|
|||||||
|
Net change in wholesale and other receivables
|
—
|
|
(729
|
)
|
—
|
|
(1,177
|
)
|
|||||||
|
Purchases of securities
|
(26,836
|
)
|
(10,952
|
)
|
(71,471
|
)
|
(25,143
|
)
|
|||||||
|
Sales and maturities of securities
|
30,061
|
|
9,092
|
|
69,246
|
|
24,818
|
|
|||||||
|
Settlements of derivatives
|
115
|
|
(161
|
)
|
(274
|
)
|
27
|
|
|||||||
|
Proceeds from sales of retail finance receivables (Note 17)
|
—
|
|
—
|
|
—
|
|
410
|
|
|||||||
|
Investing activity (to)/from Financial Services
|
178
|
|
—
|
|
298
|
|
—
|
|
|||||||
|
Other
|
55
|
|
102
|
|
203
|
|
18
|
|
|||||||
|
Net cash provided by/(used in) investing activities
|
(1,663
|
)
|
|
(12,025
|
)
|
|
(6,633
|
)
|
|
(7,810
|
)
|
||||
|
Cash flows from financing activities of continuing operations
|
|||||||||||||||
|
Cash dividends
|
(1,470
|
)
|
—
|
|
(1,179
|
)
|
—
|
|
|||||||
|
Purchases of Common Stock
|
(1,964
|
)
|
—
|
|
(164
|
)
|
—
|
|
|||||||
|
Changes in short-term debt
|
22
|
|
(2,814
|
)
|
(120
|
)
|
(3,107
|
)
|
|||||||
|
Proceeds from issuance of other debt
|
156
|
|
30,951
|
|
2,175
|
|
26,771
|
|
|||||||
|
Principal payments on other debt
|
(829
|
)
|
(21,675
|
)
|
(1,230
|
)
|
(19,058
|
)
|
|||||||
|
Financing activity to/(from) Automotive
|
—
|
|
(178
|
)
|
—
|
|
(298
|
)
|
|||||||
|
Other
|
122
|
|
(86
|
)
|
264
|
|
(10
|
)
|
|||||||
|
Net cash provided by/(used in) financing activities
|
(3,963
|
)
|
6,198
|
|
(254
|
)
|
4,298
|
|
|||||||
|
Effect of exchange rate changes on cash and cash equivalents
|
(86
|
)
|
(220
|
)
|
(78
|
)
|
20
|
|
|||||||
|
Net increase/(decrease) in cash and cash equivalents
|
$
|
1,021
|
|
|
$
|
(2,169
|
)
|
|
$
|
(587
|
)
|
|
$
|
(320
|
)
|
|
Cash and cash equivalents at January 1
|
$
|
4,959
|
|
$
|
9,509
|
|
$
|
6,247
|
|
$
|
9,412
|
|
|||
|
Net increase/(decrease) in cash and cash equivalents
|
1,021
|
|
(2,169
|
)
|
(587
|
)
|
(320
|
)
|
|||||||
|
Cash and cash equivalents at September 30
|
$
|
5,980
|
|
|
$
|
7,340
|
|
|
$
|
5,660
|
|
|
$
|
9,092
|
|
The accompanying notes are part of the financial statements.
6
Item 1. Financial Statements (Continued)
FORD MOTOR COMPANY AND SUBSIDIARIES
CONSOLIDATED STATEMENT OF EQUITY
(in millions, unaudited)
|
|
Equity Attributable to Ford Motor Company
|
|
|
||||||||||||||||||||||||||||
|
|
Capital Stock
|
Cap. in
Excess of
Par Value
of Stock
|
Retained Earnings
|
Accumulated Other Comprehensive Income/(Loss) (Note 13)
|
Treasury Stock (Note 18)
|
Total
|
Equity
Attributable
to Non-controlling Interests
|
Total
Equity
|
|||||||||||||||||||||||
|
Balance at December 31, 2013
|
$
|
40
|
|
$
|
21,422
|
|
$
|
23,386
|
|
$
|
(18,230
|
)
|
$
|
(506
|
)
|
$
|
26,112
|
|
$
|
33
|
|
$
|
26,145
|
|
|||||||
|
Net income
|
—
|
|
—
|
|
3,135
|
|
—
|
|
—
|
|
3,135
|
|
2
|
|
3,137
|
|
|||||||||||||||
|
Other comprehensive income/(loss), net of tax
|
—
|
|
—
|
|
—
|
|
65
|
|
—
|
|
65
|
|
—
|
|
65
|
|
|||||||||||||||
|
Common stock issued (including share-based compensation impacts)
|
—
|
|
258
|
|
—
|
|
—
|
|
—
|
|
258
|
|
—
|
|
258
|
|
|||||||||||||||
|
Treasury stock/other
|
—
|
|
—
|
|
—
|
|
—
|
|
(1,964
|
)
|
(1,964
|
)
|
(4
|
)
|
(1,968
|
)
|
|||||||||||||||
|
Cash dividends declared
|
—
|
|
—
|
|
(1,470
|
)
|
—
|
|
—
|
|
(1,470
|
)
|
(2
|
)
|
(1,472
|
)
|
|||||||||||||||
|
Balance at September 30, 2014
|
$
|
40
|
|
$
|
21,680
|
|
$
|
25,051
|
|
$
|
(18,165
|
)
|
$
|
(2,470
|
)
|
$
|
26,136
|
|
$
|
29
|
|
$
|
26,165
|
|
|||||||
|
Balance at December 31, 2012
|
$
|
40
|
|
$
|
20,976
|
|
$
|
17,778
|
|
$
|
(22,858
|
)
|
$
|
(292
|
)
|
$
|
15,644
|
|
$
|
42
|
|
$
|
15,686
|
|
|||||||
|
Net income
|
—
|
|
—
|
|
4,116
|
|
—
|
|
—
|
|
4,116
|
|
3
|
|
4,119
|
|
|||||||||||||||
|
Other comprehensive income/(loss), net of tax
|
—
|
|
—
|
|
—
|
|
1,348
|
|
—
|
|
1,348
|
|
—
|
|
1,348
|
|
|||||||||||||||
|
Common stock issued (including share-based compensation impacts)
|
—
|
|
402
|
|
—
|
|
—
|
|
—
|
|
402
|
|
—
|
|
402
|
|
|||||||||||||||
|
Treasury stock/other
|
—
|
|
—
|
|
—
|
|
—
|
|
(164
|
)
|
(164
|
)
|
(2
|
)
|
(166
|
)
|
|||||||||||||||
|
Cash dividends declared
|
—
|
|
—
|
|
(1,179
|
)
|
—
|
|
—
|
|
(1,179
|
)
|
—
|
|
(1,179
|
)
|
|||||||||||||||
|
Balance at September 30, 2013
|
$
|
40
|
|
$
|
21,378
|
|
$
|
20,715
|
|
$
|
(21,510
|
)
|
$
|
(456
|
)
|
$
|
20,167
|
|
$
|
43
|
|
$
|
20,210
|
|
|||||||
The accompanying notes are part of the financial statements.
7
Item 1. Financial Statements (Continued)
FORD MOTOR COMPANY AND SUBSIDIARIES
NOTES TO THE FINANCIAL STATEMENTS
Table of Contents
|
Footnote
|
|
Page
|
|
Note 1
|
Presentation
|
|
|
Note 2
|
Accounting Standards Issued But Not Yet Adopted
|
|
|
Note 3
|
Fair Value Measurements
|
|
|
Note 4
|
Financial Services Sector Finance Receivables
|
|
|
Note 5
|
Financial Services Sector Allowance for Credit Losses
|
|
|
Note 6
|
Inventories
|
|
|
Note 7
|
Variable Interest Entities
|
|
|
Note 8
|
Other Liabilities and Deferred Revenue
|
|
|
Note 9
|
Retirement Benefits
|
|
|
Note 10
|
Debt
|
|
|
Note 11
|
Derivative Financial Instruments and Hedging Activities
|
|
|
Note 12
|
Redeemable Noncontrolling Interest
|
|
|
Note 13
|
Accumulated Other Comprehensive Income/(Loss)
|
|
|
Note 14
|
Other Income/(Loss)
|
|
|
Note 15
|
Employee Separation Actions and Exit and Disposal Activities
|
|
|
Note 16
|
Income Taxes
|
|
|
Note 17
|
Changes in Investments in Affiliates and Assets Held for Sale
|
|
|
Note 18
|
Capital Stock and Amounts Per Share
|
|
|
Note 19
|
Segment Information
|
|
|
Note 20
|
Commitments and Contingencies
|
|
8
Item 1. Financial Statements (Continued)
FORD MOTOR COMPANY AND SUBSIDIARIES
NOTES TO THE FINANCIAL STATEMENTS
NOTE 1.
PRESENTATION
Our financial statements are presented in accordance with U.S. generally accepted accounting principles (“GAAP”) for interim financial information and instructions to the Quarterly Report on Form 10-Q and Rule 10-01 of Regulation S-X. We show certain of our financial statements on both a consolidated and a sector basis for our Automotive and Financial Services sectors. Intercompany items have been eliminated in both the consolidated and sector balance sheets. Where the presentation of these intercompany eliminations or consolidated adjustments differs between the consolidated and sector financial statements, reconciliations of certain line items are explained below in this Note or in related footnotes.
In the opinion of management, these unaudited financial statements reflect a fair statement of the results of operations and financial condition of Ford Motor Company, its consolidated subsidiaries, and consolidated VIEs of which we are the primary beneficiary for the periods and at the dates presented. The results for interim periods are not necessarily indicative of results that may be expected for any other interim period or for the full year. Reference should be made to the financial statements contained in our Annual Report on Form 10-K for the year ended
December 31, 2013
(“
2013
Form 10-K Report”). For purposes of this report, “Ford,” the “Company,” “we,” “our,” “us” or similar references mean Ford Motor Company, our consolidated subsidiaries, and our consolidated VIEs of which we are the primary beneficiary, unless the context requires otherwise.
We reclassified certain prior year amounts in our consolidated financial statements to conform to current year presentation.
Change in accounting.
We provide medical, life, and income benefits to hourly and salary employees when they become disabled. As of January 1, 2014, we changed our accounting policy for these benefits from an event-driven model to a service-accrual model, such that our obligation now includes an estimated cost to be incurred for individuals who are disabled at the time of measurement (which was the amount recorded under our previous policy) as well as an amount that considers the probability that active employees will become disabled in the future. We believe this change in accounting method is preferable because it better aligns the recognition of expense with the periods in which the Company receives the benefit of the employees’ services, and will allow for better comparability with the method used by other companies in our industry.
We have retroactively applied this change in accounting method to all prior period amounts. As of
December 31, 2012
, the cumulative effect of the change decreased
Total equity
by
$303 million
and increased
Other liabilities and deferred revenue
by
$468 million
, as well as increased
Deferred income taxes
by
$165 million
. As of December 31, 2013, the cumulative effect of the change decreased
Total equity
by
$271 million
and increased
Other liabilities and deferred revenue
by
$424 million
, as well as increased
Deferred income taxes
by
$153 million
. The effect of this change was immaterial on income statement and statement of cash flow amounts for the interim periods ended
September 30, 2014
, and had no impact for the interim periods ended
September 30, 2013
.
Adoption of New Accounting Standards
Income Taxes - Presentation of an Unrecognized Tax Benefit When a Net Operating Loss Carryforward, a Similar Tax Loss, or a Tax Credit Carryforward Exists.
On January 1, 2014, we adopted the new accounting standard that requires an unrecognized tax benefit to be presented as a decrease in a deferred tax asset when a net operating loss, a similar tax loss, or a tax credit carryforward exists, and certain criteria are met. The new accounting standard is consistent with our prior practice, and thus the adoption did not impact our consolidated financial statements.
Foreign Currency Matters - Parent’s Accounting for Cumulative Translation Adjustment.
On January 1, 2014, we adopted the new accounting standard that clarifies the applicable guidance for a parent company’s accounting for the release of the cumulative translation adjustment into net income upon derecognition of certain subsidiaries or groups of assets within a foreign entity or of an investment in a foreign entity. The new accounting standard is consistent with our prior practice, and thus the adoption did not impact our consolidated financial statements.
Liabilities - Obligations Resulting from Joint and Several Liability Arrangements.
On January 1, 2014, we adopted the new accounting standard that provides guidance for the recognition, measurement, and disclosure of obligations resulting from joint and several liability arrangements. The adoption of this accounting standard did not impact our consolidated financial statements or financial statement disclosures.
9
Item 1. Financial Statements (Continued)
FORD MOTOR COMPANY AND SUBSIDIARIES
NOTES TO THE FINANCIAL STATEMENTS
NOTE 1.
PRESENTATION
(Continued)
Reconciliations between Consolidated and Sector Financial Statements
Sector to Consolidated Deferred Tax Assets and Liabilities.
The difference between the total assets and total liabilities as presented on our sector balance sheet and consolidated balance sheet is the result of netting deferred income tax assets and liabilities. The reconciliation between the totals for the sector and consolidated balance sheets was as follows (in millions):
|
|
September 30,
2014 |
December 31,
2013 |
|||||
|
Sector balance sheet presentation of deferred income tax assets
|
|
|
|||||
|
Automotive sector current deferred income tax assets
|
$
|
1,590
|
|
$
|
1,574
|
|
|
|
Automotive sector non-current deferred income tax assets
|
12,307
|
|
13,436
|
|
|||
|
Financial Services sector deferred income tax assets (a)
|
178
|
|
184
|
|
|||
|
Total
|
14,075
|
|
15,194
|
|
|||
|
Reclassification for netting of deferred income taxes
|
(1,763
|
)
|
(1,726
|
)
|
|||
|
Consolidated balance sheet presentation of deferred income tax assets
|
$
|
12,312
|
|
$
|
13,468
|
|
|
|
Sector balance sheet presentation of deferred income tax liabilities
|
|
|
|
|
|||
|
Automotive sector current deferred income tax liabilities
|
$
|
313
|
|
$
|
267
|
|
|
|
Automotive sector non-current deferred income tax liabilities
|
408
|
|
430
|
|
|||
|
Financial Services sector deferred income tax liabilities
|
1,618
|
|
1,627
|
|
|||
|
Total
|
2,339
|
|
2,324
|
|
|||
|
Reclassification for netting of deferred income taxes
|
(1,763
|
)
|
(1,726
|
)
|
|||
|
Consolidated balance sheet presentation of deferred income tax liabilities
|
$
|
576
|
|
$
|
598
|
|
|
__________
|
(a)
|
Financial Services deferred income tax assets are included in
Financial Services Other assets
on our sector balance sheet.
|
10
Item 1. Financial Statements (Continued)
FORD MOTOR COMPANY AND SUBSIDIARIES
NOTES TO THE FINANCIAL STATEMENTS
NOTE 1.
PRESENTATION
(Continued)
Sector to Consolidated Cash Flow
. We present certain cash flows from wholesale and other receivables and interest supplements and residual support differently on our sector and consolidated statements of cash flows. The reconciliation between totals for the sector and consolidated cash flows for the periods ended
September 30
was as follows (in millions):
|
First Nine Months
|
|||||||
|
|
2014
|
2013
|
|||||
|
Automotive net cash provided by/(used in) operating activities
|
$
|
6,733
|
|
$
|
6,378
|
|
|
|
Financial Services net cash provided by/(used in) operating activities
|
3,878
|
|
3,172
|
|
|||
|
Total sector net cash provided by/(used in) operating activities
|
10,611
|
|
9,550
|
|
|||
|
Reclassifications between investing and operating cash flows
|
|
|
|
|
|||
|
Purchases/Collections of wholesale receivables (a)
|
(728
|
)
|
(1,088
|
)
|
|||
|
Purchases/Collections of other receivables (b)
|
(1
|
)
|
(89
|
)
|
|||
|
Payments of interest supplements and residual support (c)
|
2,457
|
|
1,756
|
|
|||
|
Consolidated net cash provided by/(used in) operating activities
|
$
|
12,339
|
|
$
|
10,129
|
|
|
|
Automotive net cash provided by/(used in) investing activities
|
$
|
(1,663
|
)
|
$
|
(6,633
|
)
|
|
|
Financial Services net cash provided by/(used in) investing activities
|
(12,025
|
)
|
(7,810
|
)
|
|||
|
Total sector net cash provided by/(used in) investing activities
|
(13,688
|
)
|
(14,443
|
)
|
|||
|
Reclassifications between investing and operating cash flows
|
|
|
|
|
|||
|
Purchases/Collections of wholesale receivables (a)
|
728
|
|
1,088
|
|
|||
|
Purchases/Collections of other receivables (b)
|
1
|
|
89
|
|
|||
|
Payments of interest supplements and residual support (c)
|
(2,457
|
)
|
(1,756
|
)
|
|||
|
Reclassifications between investing and financing cash flows
|
|||||||
|
Elimination of investing activity to/(from) Financial Services in consolidation
|
(178
|
)
|
(298
|
)
|
|||
|
Consolidated net cash provided by/(used in) investing activities
|
$
|
(15,594
|
)
|
$
|
(15,320
|
)
|
|
|
Automotive net cash provided by/(used in) financing activities
|
$
|
(3,963
|
)
|
$
|
(254
|
)
|
|
|
Financial Services net cash provided by/(used in) financing activities
|
6,198
|
|
4,298
|
|
|||
|
Total sector net cash provided by/(used in) financing activities
|
2,235
|
|
4,044
|
|
|||
|
Reclassifications between investing and financing cash flows
|
|
|
|
|
|||
|
Elimination of investing activity to/(from) Financial Services in consolidation
|
178
|
|
298
|
|
|||
|
Consolidated net cash provided by/(used in) financing activities
|
$
|
2,413
|
|
$
|
4,342
|
|
|
__________
|
(a)
|
In addition to the cash flows from vehicles sold by us, the cash flow from wholesale finance receivables (being reclassified between investing and operating) includes dealer financing by Ford Credit of used and non-Ford vehicles.
One hundred
percent of cash flows from these wholesale finance receivables have been reclassified for consolidated presentation as the portion of these cash flows from used and non-Ford vehicles is impracticable to separate.
|
|
(b)
|
Includes cash flows of other receivables purchased/collected by the Financial Services sector from certain divisions and subsidiaries of the Automotive sector.
|
|
(c)
|
Payments from Automotive sector to Ford Credit on behalf of the retail customer that represent interest supplements and residual support.
|
11
Item 1. Financial Statements (Continued)
FORD MOTOR COMPANY AND SUBSIDIARIES
NOTES TO THE FINANCIAL STATEMENTS
NOTE 1.
PRESENTATION
(Continued)
Venezuelan Operations
On February 13, 2013, the Venezuelan government effected a devaluation of the bolivar, from an exchange rate of
4.3
bolivars to the U.S. dollar to an exchange rate of
6.3
bolivars to the U.S. dollar. This resulted in a remeasurement loss of
$186 million
in the first quarter of 2013.
Based on changes to Venezuelan currency exchange rate mechanisms in the first quarter of 2014, we changed the exchange rate we used to remeasure the financial statements of our Venezuelan subsidiaries in U.S. dollars. Since March 31, 2014, we have used the exchange rate determined by periodic auctions for U.S. dollars conducted under Venezuela’s Complementary System of Foreign Currency Administration (“SICAD I”). The exchange rate we used at March 31, 2014 was
10.8
bolivars to the U.S. dollar and resulted in a remeasurement loss of
$316 million
in the first quarter of 2014 (
$310 million
related to our Automotive sector and
$6 million
related to our Financial Services sector). At
September 30, 2014
, the SICAD I exchange rate was
12.0
bolivars to the U.S. dollar.
The operating environment in Venezuela continues to be challenging. Foreign exchange control regulations have affected our Venezuelan operation’s ability to pay dividends and obligations denominated in U.S. dollars and are constraining parts availability and our ability to maintain normal production. At
September 30, 2014
, our investment in our Venezuelan subsidiaries (which includes undistributed earnings) was
$483 million
. Also, at
September 30, 2014
, those subsidiaries had
$261 million
of U.S. dollar currency exchange requests pending with and in transit to the governmental controlled currency exchanges, including
$257 million
payable to other Ford consolidated affiliates.
At
September 30, 2014
, our Venezuelan subsidiaries had a bolivar-denominated net monetary position of
$352 million
, including
$342 million
of bolivar-denominated cash and cash equivalents. A further devaluation from an exchange rate of
12.0
bolivars to the U.S. dollar would result in a balance sheet remeasurement loss.
12
Item 1. Financial Statements (Continued)
FORD MOTOR COMPANY AND SUBSIDIARIES
NOTES TO THE FINANCIAL STATEMENTS
NOTE 2.
ACCOUNTING STANDARDS ISSUED BUT NOT YET ADOPTED
Revenue - Revenue from Contracts with Customers
. In May 2014, the Financial Accounting Standards Board (“FASB”) issued a new accounting standard that requires recognition of revenue to depict the transfer of promised goods or services to customers in an amount that reflects the consideration to which we expect to be entitled in exchange for those goods or services. The new standard supersedes virtually all present U.S. GAAP guidance on revenue recognition, and requires the use of more estimates and judgments than the present standards as well as additional disclosures. The new accounting standard is effective as of January 1, 2017 and we are assessing the potential impact to our consolidated financial statements and financial statement disclosures.
Transfers and Servicing - Repurchase-to-Maturity Transactions, Repurchase Financings and Disclosures.
In June 2014, the FASB issued a new accounting standard that changes the accounting for repurchase-to-maturity transactions and repurchase financing arrangements. The new standard also requires additional disclosures for certain transfers of financial assets with agreements that both entitle and obligate the transferor to repurchase the transferred assets from the transferee. The new accounting standard is effective as of January 1, 2015 and we do not expect it to have an impact on our consolidated financial statements and financial statement disclosures.
Stock Compensation - Accounting for Share-Based Payments When the Terms of an Award Provide That a Performance Target Could Be Achieved after the Requisite Service Period.
In June 2014, the FASB issued a new accounting standard that requires performance targets that could be achieved after the requisite service period be treated as performance conditions that affect the vesting of the award. The new accounting standard is effective as of January 1, 2016 and we do not expect it to have an impact on our consolidated financial statements and financial statement disclosures.
Consolidation - Measuring the Financial Assets and the Financial Liabilities of a Consolidated Collateralized Financing Entity.
In August 2014, the FASB issued a new accounting standard that provides an entity the option to elect to measure the financial assets and financial liabilities of a consolidated collateralized financing entity (“CFE”) at a value that is reflective of its economic interest in the CFE. The new accounting standard is effective as of January 1, 2016 and we are assessing the potential impact to our consolidated financial statements and financial statement disclosures.
Going Concern - Disclosure of Uncertainties about an Entity’s Ability to Continue as a Going Concern.
In
August 2014, the FASB issued a new accounting standard that requires management to assess if there is substantial doubt about an entity’s ability to continue as a going concern for each annual and interim period. If conditions or events give rise to substantial doubt, disclosures are required. The new accounting standard is effective as of December 31, 2016 and we do not expect it to have an impact on our financial statement disclosures.
NOTE 3.
FAIR VALUE MEASUREMENTS
Cash equivalents, marketable securities, and derivative financial instruments are presented on our financial statements on a recurring basis at fair value, while other assets and liabilities are measured at fair value on a nonrecurring basis, such as when we have an asset impairment. There have been no changes to the types of inputs used or the valuation techniques since year end. During the second quarter of 2014, we impaired our equity in net assets of Ford Sollers Netherlands B.V. (“Ford Sollers”), which resulted in a fair value measurement on a non-recurring basis. See
Note 17
for additional information.
13
Item 1. Financial Statements (Continued)
FORD MOTOR COMPANY AND SUBSIDIARIES
NOTES TO THE FINANCIAL STATEMENTS
NOTE 3.
FAIR VALUE MEASUREMENTS
(Continued)
Input Hierarchy of Items Measured at Fair Value on a Recurring Basis
The following table categorizes the fair values of items measured at fair value on a recurring basis on our balance sheet (in millions):
|
|
September 30, 2014
|
December 31, 2013
|
|||||||||||||||||||||||||||||
|
|
Level 1
|
Level 2
|
Level 3
|
Total
|
Level 1
|
Level 2
|
Level 3
|
Total
|
|||||||||||||||||||||||
|
Automotive Sector
|
|
|
|
|
|||||||||||||||||||||||||||
|
Assets
|
|
|
|
|
|||||||||||||||||||||||||||
|
Cash equivalents – financial instruments
|
|
|
|
|
|||||||||||||||||||||||||||
|
U.S. government and agencies
|
$
|
—
|
|
$
|
58
|
|
$
|
—
|
|
$
|
58
|
|
$
|
—
|
|
$
|
33
|
|
$
|
—
|
|
$
|
33
|
|
|||||||
|
Non-U.S. government and agencies
|
—
|
|
—
|
|
—
|
|
—
|
|
—
|
|
200
|
|
—
|
|
200
|
|
|||||||||||||||
|
Corporate debt
|
—
|
|
40
|
|
—
|
|
40
|
|
—
|
|
—
|
|
—
|
|
—
|
|
|||||||||||||||
|
Total cash equivalents (a)
|
—
|
|
98
|
|
—
|
|
98
|
|
—
|
|
233
|
|
—
|
|
233
|
|
|||||||||||||||
|
Marketable securities
|
|
|
|
|
|
|
|||||||||||||||||||||||||
|
U.S. government and agencies
|
978
|
|
5,056
|
|
—
|
|
6,034
|
|
3,752
|
|
6,596
|
|
—
|
|
10,348
|
|
|||||||||||||||
|
Non-U.S. government and agencies
|
—
|
|
7,487
|
|
—
|
|
7,487
|
|
—
|
|
6,538
|
|
—
|
|
6,538
|
|
|||||||||||||||
|
Corporate debt
|
—
|
|
2,685
|
|
—
|
|
2,685
|
|
—
|
|
2,623
|
|
—
|
|
2,623
|
|
|||||||||||||||
|
Equities
|
328
|
|
—
|
|
—
|
|
328
|
|
341
|
|
—
|
|
—
|
|
341
|
|
|||||||||||||||
|
Other marketable securities
|
—
|
|
342
|
|
—
|
|
342
|
|
—
|
|
307
|
|
—
|
|
307
|
|
|||||||||||||||
|
Total marketable securities
|
1,306
|
|
15,570
|
|
—
|
|
16,876
|
|
4,093
|
|
16,064
|
|
—
|
|
20,157
|
|
|||||||||||||||
|
Derivative financial instruments (b)
|
—
|
|
535
|
|
2
|
|
537
|
|
—
|
|
579
|
|
1
|
|
580
|
|
|||||||||||||||
|
Total assets at fair value
|
$
|
1,306
|
|
$
|
16,203
|
|
$
|
2
|
|
$
|
17,511
|
|
$
|
4,093
|
|
$
|
16,876
|
|
$
|
1
|
|
$
|
20,970
|
|
|||||||
|
Liabilities
|
|
|
|
|
|
|
|||||||||||||||||||||||||
|
Derivative financial instruments (b)
|
$
|
—
|
|
$
|
697
|
|
$
|
2
|
|
$
|
699
|
|
$
|
—
|
|
$
|
416
|
|
$
|
2
|
|
$
|
418
|
|
|||||||
|
Total liabilities at fair value
|
$
|
—
|
|
$
|
697
|
|
$
|
2
|
|
$
|
699
|
|
$
|
—
|
|
$
|
416
|
|
$
|
2
|
|
$
|
418
|
|
|||||||
|
Financial Services Sector
|
|
|
|
|
|||||||||||||||||||||||||||
|
Assets
|
|
|
|
|
|||||||||||||||||||||||||||
|
Cash equivalents – financial instruments
|
|
|
|
|
|||||||||||||||||||||||||||
|
U.S. government and agencies
|
$
|
40
|
|
$
|
—
|
|
$
|
—
|
|
$
|
40
|
|
$
|
—
|
|
$
|
—
|
|
$
|
—
|
|
$
|
—
|
|
|||||||
|
Non-U.S. government and agencies
|
—
|
|
341
|
|
—
|
|
341
|
|
—
|
|
24
|
|
—
|
|
24
|
|
|||||||||||||||
|
Corporate debt
|
—
|
|
60
|
|
—
|
|
60
|
|
—
|
|
—
|
|
—
|
|
—
|
|
|||||||||||||||
|
Total cash equivalents (a)
|
40
|
|
401
|
|
—
|
|
441
|
|
—
|
|
24
|
|
—
|
|
24
|
|
|||||||||||||||
|
Marketable securities
|
|
|
|
|
|
|
|||||||||||||||||||||||||
|
U.S. government and agencies
|
341
|
|
1,222
|
|
—
|
|
1,563
|
|
418
|
|
25
|
|
—
|
|
443
|
|
|||||||||||||||
|
Non-U.S. government and agencies
|
—
|
|
644
|
|
—
|
|
644
|
|
—
|
|
184
|
|
—
|
|
184
|
|
|||||||||||||||
|
Corporate debt
|
—
|
|
1,525
|
|
—
|
|
1,525
|
|
—
|
|
1,273
|
|
—
|
|
1,273
|
|
|||||||||||||||
|
Other marketable securities
|
—
|
|
35
|
|
—
|
|
35
|
|
—
|
|
43
|
|
—
|
|
43
|
|
|||||||||||||||
|
Total marketable securities
|
341
|
|
3,426
|
|
—
|
|
3,767
|
|
418
|
|
1,525
|
|
—
|
|
1,943
|
|
|||||||||||||||
|
Derivative financial instruments (b)
|
—
|
|
751
|
|
—
|
|
751
|
|
—
|
|
585
|
|
—
|
|
585
|
|
|||||||||||||||
|
Total assets at fair value
|
$
|
381
|
|
$
|
4,578
|
|
$
|
—
|
|
$
|
4,959
|
|
$
|
418
|
|
$
|
2,134
|
|
$
|
—
|
|
$
|
2,552
|
|
|||||||
|
Liabilities
|
|
|
|
|
|
|
|||||||||||||||||||||||||
|
Derivative financial instruments (b)
|
$
|
—
|
|
$
|
291
|
|
$
|
—
|
|
$
|
291
|
|
$
|
—
|
|
$
|
506
|
|
$
|
—
|
|
$
|
506
|
|
|||||||
|
Total liabilities at fair value
|
$
|
—
|
|
$
|
291
|
|
$
|
—
|
|
$
|
291
|
|
$
|
—
|
|
$
|
506
|
|
$
|
—
|
|
$
|
506
|
|
|||||||
__________
|
(a)
|
Excludes time deposits, certificates of deposit, money market accounts, and other cash equivalents reported at par value on our balance sheet totaling
$4.7 billion
and
$2.8 billion
for Automotive sector and
$4.2 billion
and
$6.7 billion
for Financial Services sector at
September 30, 2014
and
December 31, 2013
, respectively. In addition to these cash equivalents, we also had cash on hand totaling
$1.2 billion
and
$2 billion
for Automotive sector and
$2.7 billion
and
$2.8 billion
for Financial Services sector at
September 30, 2014
and
December 31, 2013
, respectively.
|
|
(b)
|
See
Note 11
for additional information regarding derivative financial instruments.
|
14
Item 1. Financial Statements (Continued)
FORD MOTOR COMPANY AND SUBSIDIARIES
NOTES TO THE FINANCIAL STATEMENTS
NOTE 4.
FINANCIAL SERVICES SECTOR FINANCE RECEIVABLES
Our Financial Services sector finance receivables primarily relate to Ford Credit, but also include the Other Financial Services segment and certain intersector eliminations.
Our Financial Services sector segments our finance receivables into North America and International “consumer” and “non-consumer” portfolios. The receivables are generally secured by the vehicles, inventory, or other property being financed.
Finance receivables are recorded at the time of origination or purchase at fair value and are subsequently reported at amortized cost, net of any allowance for credit losses.
Consumer Portfolio.
Receivables in this portfolio include products offered to individuals and businesses that finance the acquisition of Ford and Lincoln vehicles from dealers for personal or commercial use. Retail financing includes retail installment contracts for new and used vehicles and direct financing leases with retail customers, government entities, daily rental companies, and fleet customers.
Non-Consumer Portfolio.
Receivables in this portfolio include products offered to automotive dealers. The products include:
|
•
|
Dealer financing
– includes wholesale loans to dealers to finance the purchase of vehicle inventory, also known as floorplan financing, as well as loans to dealers to finance working capital and improvements to dealership facilities, finance the purchase of dealership real estate, and finance other dealer programs. Wholesale financing is approximately
94%
of dealer financing
|
|
•
|
Other
– primarily related to the sale of parts and accessories to dealers
|
15
Item 1. Financial Statements (Continued)
FORD MOTOR COMPANY AND SUBSIDIARIES
NOTES TO THE FINANCIAL STATEMENTS
NOTE 4.
FINANCIAL SERVICES SECTOR FINANCE RECEIVABLES
(Continued)
Finance receivables, net were as follows (in millions):
|
|
September 30, 2014
|
December 31, 2013
|
|||||||||||||||||||||
|
|
North
America
|
International
|
Total Finance Receivables
|
North
America
|
International
|
Total Finance Receivables
|
|||||||||||||||||
|
Consumer
|
|
|
|
|
|
|
|||||||||||||||||
|
Retail financing, gross
|
$
|
43,537
|
|
$
|
11,784
|
|
$
|
55,321
|
|
$
|
40,902
|
|
$
|
10,797
|
|
$
|
51,699
|
|
|||||
|
Less: Unearned interest supplements
|
(1,511
|
)
|
(239
|
)
|
(1,750
|
)
|
(1,255
|
)
|
(247
|
)
|
(1,502
|
)
|
|||||||||||
|
Consumer finance receivables
|
42,026
|
|
11,545
|
|
53,571
|
|
39,647
|
|
10,550
|
|
50,197
|
|
|||||||||||
|
Non-Consumer
|
|
|
|
|
|
|
|
|
|
|
|
|
|||||||||||
|
Dealer financing
|
21,454
|
|
8,779
|
|
30,233
|
|
22,072
|
|
7,833
|
|
29,905
|
|
|||||||||||
|
Other
|
748
|
|
310
|
|
1,058
|
|
732
|
|
339
|
|
1,071
|
|
|||||||||||
|
Non-Consumer finance receivables
|
22,202
|
|
9,089
|
|
31,291
|
|
22,804
|
|
8,172
|
|
30,976
|
|
|||||||||||
|
Total recorded investment
|
$
|
64,228
|
|
$
|
20,634
|
|
$
|
84,862
|
|
$
|
62,451
|
|
$
|
18,722
|
|
$
|
81,173
|
|
|||||
|
Recorded investment in finance receivables
|
$
|
64,228
|
|
$
|
20,634
|
|
$
|
84,862
|
|
$
|
62,451
|
|
$
|
18,722
|
|
$
|
81,173
|
|
|||||
|
Less: Allowance for credit losses
|
(256
|
)
|
(69
|
)
|
(325
|
)
|
(280
|
)
|
(77
|
)
|
(357
|
)
|
|||||||||||
|
Finance receivables, net (a)
|
$
|
63,972
|
|
$
|
20,565
|
|
$
|
84,537
|
|
$
|
62,171
|
|
$
|
18,645
|
|
$
|
80,816
|
|
|||||
|
Net finance receivables subject to fair value (b)
|
$
|
82,869
|
|
$
|
79,149
|
|
|||||||||||||||||
|
Fair value
|
84,520
|
|
80,838
|
|
|||||||||||||||||||
__________
|
(a)
|
At
September 30, 2014
and
December 31, 2013
,
Finance receivables, net
on the consolidated balance sheet were
$79.9 billion
and
$77.5 billion
, respectively. The balance is comprised of Financial Services sector finance receivables of
$84.5 billion
and
$80.8 billion
, respectively, net of
$4.6 billion
and
$3.3 billion
, respectively, of receivables purchased by Financial Services sector from Automotive sector, which are reclassified to
Other receivables, net.
|
|
(b)
|
At
September 30, 2014
and
December 31, 2013
, excludes
$1.7 billion
and
$1.7 billion
, respectively, of certain receivables (primarily direct financing leases) that are not subject to fair value disclosure requirements.
|
Excluded from finance receivables at
September 30, 2014
and
December 31, 2013
, was
$184 million
and
$196 million
, respectively, of accrued uncollected interest, which we report in
Other assets
on the balance sheet.
Included in the recorded investment in finance receivables at
September 30, 2014
and
December 31, 2013
were North America consumer receivables of
$19.3 billion
and
$21.8 billion
and non-consumer receivables of
$17.3 billion
and
$18.9 billion
, respectively, and International consumer receivables of
$4.7 billion
and
$5.9 billion
and non-consumer receivables of
$3.8 billion
and
$5 billion
, respectively, that secure certain debt obligations. The receivables are available only for payment of the debt issued by, and other obligations of, the securitization entities that are parties to those securitization transactions; they are not available to pay the other obligations of our Financial Services sector or the claims of Ford Credit’s other creditors. Ford Credit holds the right to receive the excess cash flows not needed to pay the debt issued by, and other obligations of, the securitization entities that are parties to those securitization transactions (see Notes
7
and
10
).
16
Item 1. Financial Statements (Continued)
FORD MOTOR COMPANY AND SUBSIDIARIES
NOTES TO THE FINANCIAL STATEMENTS
NOTE 4.
FINANCIAL SERVICES SECTOR FINANCE RECEIVABLES
(Continued)
Aging
For all finance receivables, we define “past due” as
any payment, including principal and interest, that is at least 31 days past the contractual due date
. The recorded investment of consumer receivables greater than 90 days past due and still accruing interest was
$15 million
and
$14 million
at
September 30, 2014
and
December 31, 2013
, respectively. The recorded investment of non-consumer receivables greater than 90 days past due and still accruing interest was
$3 million
and
$21 million
at
September 30, 2014
and
December 31, 2013
, respectively.
The aging analysis of our finance receivables balances were as follows (in millions):
|
September 30, 2014
|
December 31, 2013
|
||||||||||||||||||||||
|
North America
|
International
|
Total
|
North America
|
International
|
Total
|
||||||||||||||||||
|
Consumer
|
|||||||||||||||||||||||
|
31-60 days past due
|
$
|
583
|
|
$
|
41
|
|
$
|
624
|
|
$
|
715
|
|
$
|
39
|
|
$
|
754
|
|
|||||
|
61-90 days past due
|
70
|
|
19
|
|
89
|
|
88
|
|
17
|
|
105
|
|
|||||||||||
|
91-120 days past due
|
17
|
|
9
|
|
26
|
|
18
|
|
9
|
|
27
|
|
|||||||||||
|
Greater than 120 days past due
|
40
|
|
22
|
|
62
|
|
37
|
|
26
|
|
63
|
|
|||||||||||
|
Total past due
|
710
|
|
91
|
|
801
|
|
858
|
|
91
|
|
949
|
|
|||||||||||
|
Current
|
41,316
|
|
11,454
|
|
52,770
|
|
38,789
|
|
10,459
|
|
49,248
|
|
|||||||||||
|
Consumer finance receivables
|
42,026
|
|
11,545
|
|
53,571
|
|
39,647
|
|
10,550
|
|
50,197
|
|
|||||||||||
|
Non-Consumer
|
|||||||||||||||||||||||
|
Total past due
|
3
|
|
92
|
|
95
|
|
49
|
|
40
|
|
89
|
|
|||||||||||
|
Current
|
22,199
|
|
8,997
|
|
31,196
|
|
22,755
|
|
8,132
|
|
30,887
|
|
|||||||||||
|
Non-Consumer finance receivables
|
22,202
|
|
9,089
|
|
31,291
|
|
22,804
|
|
8,172
|
|
30,976
|
|
|||||||||||
|
Total recorded investment
|
$
|
64,228
|
|
$
|
20,634
|
|
$
|
84,862
|
|
$
|
62,451
|
|
$
|
18,722
|
|
$
|
81,173
|
|
|||||
Credit Quality
Consumer Portfolio
. When originating all classes of consumer receivables, we use a proprietary scoring system that measures the credit quality of the receivables using several factors, such as credit bureau information, consumer credit risk scores (e.g., FICO score), and contract characteristics. In addition to our proprietary scoring system, we consider other individual consumer factors, such as employment history, financial stability, and capacity to pay.
Subsequent to origination, we review the credit quality of retail financing based on customer payment activity. As each customer develops a payment history, we use an internally-developed behavioral scoring model to assist in determining the best collection strategies which allows us to focus collection activity on higher-risk accounts. These models are used to refine our risk-based staffing model to ensure collection resources are aligned with portfolio risk. Based on data from this scoring model, contracts are categorized by collection risk. Our collection models evaluate several factors, including origination characteristics, updated credit bureau data, and payment patterns.
Credit quality ratings for consumer receivables are based on aging. Refer to the aging table above.
Consumer receivables credit quality ratings are as follows:
|
•
|
Pass
–
current to 60 days past due
|
|
•
|
Special Mention
–
61 to 120 days past due
and in intensified collection status
|
|
•
|
Substandard
–
greater than 120 days past due
and for which the uncollectible portion of the receivables has already been charged-off, as measured using the fair value of collateral
|
17
Item 1. Financial Statements (Continued)
FORD MOTOR COMPANY AND SUBSIDIARIES
NOTES TO THE FINANCIAL STATEMENTS
NOTE 4.
FINANCIAL SERVICES SECTOR FINANCE RECEIVABLES
(Continued)
Non-Consumer Portfolio
. We extend credit to dealers primarily in the form of lines of credit to purchase new Ford and Lincoln vehicles as well as used vehicles. Payment is required when the dealer has sold the vehicle. Each non-consumer lending request is evaluated by taking into consideration the borrower’s financial condition and the underlying collateral securing the loan. We use a proprietary model to assign each dealer a risk rating. This model uses historical dealer performance data to identify key factors about a dealer that we consider most significant in predicting a dealer’s ability to meet its financial obligations. We also consider numerous other financial and qualitative factors of the dealer’s operations including capitalization and leverage, liquidity and cash flow, profitability, and credit history with ourselves and other creditors. A dealer’s risk rating does not reflect any guarantees or a dealer owner’s net worth.
Dealers are assigned to one of four groups according to risk ratings as follows:
|
•
|
Group I
– strong to superior financial metrics
|
|
•
|
Group II
– fair to favorable financial metrics
|
|
•
|
Group III
– marginal to weak financial metrics
|
|
•
|
Group IV
– poor financial metrics, including dealers classified as uncollectible
|
We suspend credit lines and extend no further funding to dealers classified in Group IV.
We regularly review our model to confirm the continued business significance and statistical predictability of the factors and update the model to incorporate new factors or other information that improves its statistical predictability. In addition, we regularly audit dealer inventory and dealer sales records to verify that the dealer is in possession of the financed vehicles and is promptly paying each receivable following the sale of the financed vehicle. The frequency of on-site vehicle inventory audits depends on factors such as the dealer’s risk rating and our security position. Under our policies, on-site vehicle inventory audits of low-risk dealers are conducted only as circumstances warrant. Audits of higher-risk dealers are conducted with increased frequency based on risk ratings and our security position. We perform a credit review of each dealer at least annually and adjust the dealer’s risk rating, if necessary.
The credit quality of dealer financing receivables is evaluated based on our internal dealer risk rating analysis. A dealer has the same risk rating for its entire dealer financing regardless of the type of financing.
The credit quality analysis of our dealer financing receivables was as follows (in millions):
|
September 30, 2014
|
December 31, 2013
|
||||||||||||||||||||||
|
North America
|
International
|
Total
|
North America
|
International
|
Total
|
||||||||||||||||||
|
Dealer Financing
|
|||||||||||||||||||||||
|
Group I
|
$
|
18,254
|
|
$
|
4,325
|
|
$
|
22,579
|
|
$
|
18,357
|
|
$
|
5,051
|
|
$
|
23,408
|
|
|||||
|
Group II
|
2,941
|
|
3,073
|
|
6,014
|
|
3,289
|
|
2,092
|
|
5,381
|
|
|||||||||||
|
Group III
|
252
|
|
1,298
|
|
1,550
|
|
424
|
|
649
|
|
1,073
|
|
|||||||||||
|
Group IV
|
7
|
|
83
|
|
90
|
|
2
|
|
41
|
|
43
|
|
|||||||||||
|
Total recorded investment
|
$
|
21,454
|
|
$
|
8,779
|
|
$
|
30,233
|
|
$
|
22,072
|
|
$
|
7,833
|
|
$
|
29,905
|
|
|||||
18
Item 1. Financial Statements (Continued)
FORD MOTOR COMPANY AND SUBSIDIARIES
NOTES TO THE FINANCIAL STATEMENTS
NOTE 4.
FINANCIAL SERVICES SECTOR FINANCE RECEIVABLES
(Continued)
Impaired Receivables.
Impaired consumer receivables include accounts that have been rewritten or modified in reorganization proceedings pursuant to the U.S. Bankruptcy Code that are considered to be troubled debt restructurings (“TDRs”), as well as all accounts
greater than 120 days past due
. Impaired non-consumer receivables represent accounts with dealers that have weak or poor financial metrics or dealer financing that has been modified in TDRs. The recorded investment of consumer receivables that were impaired at
September 30, 2014
and
December 31, 2013
was
$421 million
, or
0.8%
of consumer receivables, and
$435 million
, or
0.9%
of consumer receivables, respectively. The recorded investment of non-consumer receivables that were impaired at
September 30, 2014
and
December 31, 2013
was
$115 million
, or
0.4%
of non-consumer receivables, and
$71 million
, or
0.2%
of non-consumer receivables, respectively. Impaired finance receivables are evaluated both collectively and specifically. See
Note 5
for additional information related to the development of our allowance for credit losses.
The accrual of revenue is discontinued at the
time a receivable is determined to be uncollectible
. Accounts may be restored to accrual status only when a customer settles all past-due deficiency balances and future payments are reasonably assured. For receivables in non-accrual status, subsequent financing revenue is recognized only to the extent a payment is received. Payments are generally applied first to outstanding interest and then to the unpaid principal balance.
A restructuring of debt constitutes a TDR if we grant a concession to a debtor for economic or legal reasons related to the debtor’s financial difficulties that we otherwise would not consider. Consumer and non-consumer receivables that have a modified interest rate below market rate or that were modified in reorganization proceedings pursuant to the U.S. Bankruptcy Code, except non-consumer receivables that are current with minimal risk of loss, are considered to be TDRs. We do not grant concessions on the principal balance of our receivables. If a receivable is modified in a reorganization proceeding, all payment requirements of the reorganization plan need to be met before remaining balances are forgiven. Finance receivables involved in TDRs are specifically assessed for impairment.
19
Item 1. Financial Statements (Continued)
FORD MOTOR COMPANY AND SUBSIDIARIES
NOTES TO THE FINANCIAL STATEMENTS
NOTE 5.
FINANCIAL SERVICES SECTOR ALLOWANCE FOR CREDIT LOSSES
An analysis of the allowance for credit losses related to finance receivables for the periods ended
September 30
(in millions) is as follows:
|
Third Quarter 2014
|
First Nine Months 2014
|
||||||||||||||||||||||
|
|
Consumer
|
Non-Consumer
|
Total
|
Consumer
|
Non-Consumer
|
Total
|
|||||||||||||||||
|
Allowance for credit losses
|
|
|
|
||||||||||||||||||||
|
Beginning balance
|
$
|
303
|
|
$
|
24
|
|
$
|
327
|
|
$
|
327
|
|
$
|
30
|
|
$
|
357
|
|
|||||
|
Charge-offs
|
(67
|
)
|
(2
|
)
|
(69
|
)
|
(200
|
)
|
(7
|
)
|
(207
|
)
|
|||||||||||
|
Recoveries
|
33
|
|
2
|
|
35
|
|
101
|
|
8
|
|
109
|
|
|||||||||||
|
Provision for credit losses
|
42
|
|
(3
|
)
|
39
|
|
82
|
|
(10
|
)
|
72
|
|
|||||||||||
|
Other (a)
|
(6
|
)
|
(1
|
)
|
(7
|
)
|
(5
|
)
|
(1
|
)
|
(6
|
)
|
|||||||||||
|
Ending balance
|
$
|
305
|
|
$
|
20
|
|
$
|
325
|
|
$
|
305
|
|
$
|
20
|
|
$
|
325
|
|
|||||
|
Analysis of ending balance of allowance for credit losses
|
|
|
|
|
|
|
|||||||||||||||||
|
Collective impairment allowance
|
$
|
283
|
|
$
|
19
|
|
$
|
302
|
|
||||||||||||||
|
Specific impairment allowance
|
22
|
|
1
|
|
23
|
|
|||||||||||||||||
|
Ending balance
|
305
|
|
20
|
|
325
|
|
|||||||||||||||||
|
Analysis of ending balance of finance receivables
|
|
|
|
|
|
|
|||||||||||||||||
|
Collectively evaluated for impairment
|
53,150
|
|
31,176
|
|
84,326
|
|
|||||||||||||||||
|
Specifically evaluated for impairment
|
421
|
|
115
|
|
536
|
|
|||||||||||||||||
|
Recorded investment
|
53,571
|
|
31,291
|
|
84,862
|
|
|||||||||||||||||
|
Ending balance, net of allowance for credit losses
|
$
|
53,266
|
|
$
|
31,271
|
|
$
|
84,537
|
|
||||||||||||||
__________
|
(a)
|
Primarily represents amounts related to translation adjustments.
|
|
Third Quarter 2013
|
First Nine Months 2013
|
||||||||||||||||||||||
|
|
Consumer
|
Non-Consumer
|
Total
|
Consumer
|
Non-Consumer
|
Total
|
|||||||||||||||||
|
Allowance for credit losses
|
|
|
|
||||||||||||||||||||
|
Beginning balance
|
$
|
324
|
|
$
|
31
|
|
$
|
355
|
|
$
|
360
|
|
$
|
29
|
|
$
|
389
|
|
|||||
|
Charge-offs
|
(71
|
)
|
(3
|
)
|
(74
|
)
|
(212
|
)
|
(13
|
)
|
(225
|
)
|
|||||||||||
|
Recoveries
|
32
|
|
1
|
|
33
|
|
109
|
|
4
|
|
113
|
|
|||||||||||
|
Provision for credit losses
|
32
|
|
(1
|
)
|
31
|
|
65
|
|
8
|
|
73
|
|
|||||||||||
|
Other (a)
|
3
|
|
1
|
|
4
|
|
(2
|
)
|
1
|
|
(1
|
)
|
|||||||||||
|
Ending balance
|
$
|
320
|
|
$
|
29
|
|
$
|
349
|
|
$
|
320
|
|
$
|
29
|
|
$
|
349
|
|
|||||
|
Analysis of ending balance of allowance for credit losses
|
|
|
|
|
|
|
|||||||||||||||||
|
Collective impairment allowance
|
$
|
298
|
|
$
|
27
|
|
$
|
325
|
|
||||||||||||||
|
Specific impairment allowance
|
22
|
|
2
|
|
24
|
|
|||||||||||||||||
|
Ending balance
|
320
|
|
29
|
|
349
|
|
|||||||||||||||||
|
Analysis of ending balance of finance receivables
|
|
|
|
|
|
|
|||||||||||||||||
|
Collectively evaluated for impairment
|
48,897
|
|
28,991
|
|
77,888
|
|
|||||||||||||||||
|
Specifically evaluated for impairment
|
424
|
|
58
|
|
482
|
|
|||||||||||||||||
|
Recorded investment
|
49,321
|
|
29,049
|
|
78,370
|
|
|||||||||||||||||
|
Ending balance, net of allowance for credit losses
|
$
|
49,001
|
|
$
|
29,020
|
|
$
|
78,021
|
|
||||||||||||||
__________
|
(a)
|
Primarily represents amounts related to translation adjustments.
|
20
Item 1. Financial Statements (Continued)
FORD MOTOR COMPANY AND SUBSIDIARIES
NOTES TO THE FINANCIAL STATEMENTS
NOTE 6.
INVENTORIES
All inventories are stated at the lower of cost or market. Cost for a substantial portion of U.S. inventories is determined on a last-in, first-out (“LIFO”) basis. LIFO was used for
28%
and
20%
of total inventories at
September 30, 2014
and
December 31, 2013
, respectively. Cost of other inventories is determined by costing methods that approximate a first-in, first-out (“FIFO”) basis.
Inventories were as follows (in millions):
|
|
September 30,
2014 |
December 31,
2013 |
|||||
|
Raw materials, work-in-process, and supplies
|
$
|
4,199
|
|
$
|
3,628
|
|
|
|
Finished products
|
6,126
|
|
5,081
|
|
|||
|
Total inventories under FIFO
|
10,325
|
|
8,709
|
|
|||
|
LIFO adjustment
|
(1,029
|
)
|
(1,001
|
)
|
|||
|
Total inventories
|
$
|
9,296
|
|
$
|
7,708
|
|
|
NOTE 7.
VARIABLE INTEREST ENTITIES
VIEs of Which We are Not the Primary Beneficiary
We have invested in joint ventures that are VIEs and in which the power to direct economically significant activities is shared with the joint venture partner. Our investments in the joint ventures are accounted for as equity method investments. Our maximum exposure to any potential losses associated with these joint ventures is limited to our investment, including loans, and was
$330 million
and
$336 million
at
September 30, 2014
and
December 31, 2013
, respectively.
VIEs of Which We are the Primary Beneficiary
Through Ford Credit, we securitize, transfer, and service financial assets associated with consumer finance receivables, operating leases, and wholesale loans. Our securitization transactions typically involve the legal transfer of financial assets to bankruptcy remote special purpose entities. The third-party investors in these securitization entities have legal recourse only to the assets securing the debt and do not have recourse to us, except for the customary representation and warranty provisions. In addition, the cash flows generated by the assets are restricted only to pay such liabilities. We generally retain economic interests in the asset-backed securitization transactions, which are retained in the form of senior or subordinated interests, cash reserve accounts, residual interests, and servicing rights. For accounting purposes, we are precluded from recording the transfers of assets in securitization transactions as sales.
In most cases, the bankruptcy remote special purpose entities meet the definition of VIEs for which we have determined we have both the power to direct the activities of the entity that most significantly impact the entity’s performance and the obligation to absorb losses or the right to receive benefits of the entity that could be significant, and would therefore also be consolidated. We account for all securitization transactions as if they were secured financing and therefore the assets, liabilities and related activity of these VIEs are consolidated in our financial results and are included in amounts presented on the face of our consolidated balance sheet and in the related footnotes.
21
Item 1. Financial Statements (Continued)
FORD MOTOR COMPANY AND SUBSIDIARIES
NOTES TO THE FINANCIAL STATEMENTS
NOTE 8.
OTHER LIABILITIES AND DEFERRED REVENUE
Other liabilities and deferred revenue were as follows (in millions):
|
|
September 30,
2014 |
December 31,
2013 |
|||||
|
Automotive Sector
|
|
|
|||||
|
Current
|
|
|
|||||
|
Dealer and dealers’ customer allowances and claims
|
$
|
7,856
|
|
$
|
7,730
|
|
|
|
Deferred revenue
|
4,272
|
|
2,817
|
|
|||
|
Employee benefit plans
|
1,985
|
|
1,706
|
|
|||
|
Accrued interest
|
182
|
|
262
|
|
|||
|
Other postretirement employee benefits (“OPEB”)
|
383
|
|
387
|
|
|||
|
Pension (a)
|
338
|
|
327
|
|
|||
|
Other
|
3,238
|
|
3,308
|
|
|||
|
Total Automotive other liabilities and deferred revenue
|
18,254
|
|
16,537
|
|
|||
|
Non-current
|
|
|
|
|
|||
|
Pension (a)
|
8,036
|
|
9,288
|
|
|||
|
OPEB
|
5,403
|
|
5,502
|
|
|||
|
Dealer and dealers’ customer allowances and claims
|
2,591
|
|
2,028
|
|
|||
|
Deferred revenue
|
2,622
|
|
2,534
|
|
|||
|
Employee benefit plans
|
1,183
|
|
1,213
|
|
|||
|
Other
|
1,355
|
|
1,524
|
|
|||
|
Total Automotive other liabilities and deferred revenue
|
21,190
|
|
22,089
|
|
|||
|
Total Automotive sector
|
39,444
|
|
38,626
|
|
|||
|
Financial Services Sector
|
1,963
|
|
2,260
|
|
|||
|
Total
|
$
|
41,407
|
|
$
|
40,886
|
|
|
__________
|
(a)
|
Balances at
September 30, 2014
reflect net pension liabilities at
December 31, 2013
, updated for service and interest cost, expected return on assets, separation expense, actual benefit payments, and cash contributions. The discount rate and rate of expected return assumptions are unchanged from year-end
2013
.
|
22
Item 1. Financial Statements (Continued)
FORD MOTOR COMPANY AND SUBSIDIARIES
NOTES TO THE FINANCIAL STATEMENTS
NOTE 9.
RETIREMENT BENEFITS
Defined Benefit Plans - Expense
The pre-tax expense for our defined benefit pension and OPEB plans for the periods ended
September 30
was as follows (in millions):
|
Third Quarter
|
|||||||||||||||||||||||
|
|
Pension Benefits
|
|
|
||||||||||||||||||||
|
|
U.S. Plans
|
Non-U.S. Plans
|
Worldwide OPEB
|
||||||||||||||||||||
|
|
2014
|
2013
|
2014
|
2013
|
2014
|
2013
|
|||||||||||||||||
|
Service cost
|
$
|
127
|
|
$
|
140
|
|
$
|
118
|
|
$
|
119
|
|
$
|
13
|
|
$
|
16
|
|
|||||
|
Interest cost
|
498
|
|
479
|
|
302
|
|
280
|
|
68
|
|
63
|
|
|||||||||||
|
Expected return on assets
|
(678
|
)
|
(685
|
)
|
(383
|
)
|
(339
|
)
|
—
|
|
—
|
|
|||||||||||
|
Amortization of:
|
|
|
|
|
|
|
|
|
|
|
|
|
|||||||||||
|
Prior service costs/(credits)
|
38
|
|
44
|
|
15
|
|
16
|
|
(58
|
)
|
(71
|
)
|
|||||||||||
|
(Gains)/Losses
|
52
|
|
136
|
|
149
|
|
170
|
|
24
|
|
39
|
|
|||||||||||
|
Separation programs/other
|
8
|
|
1
|
|
15
|
|
69
|
|
1
|
|
2
|
|
|||||||||||
|
Recognition of (gains)/losses due to:
|
|||||||||||||||||||||||
|
Curtailments
|
—
|
|
—
|
|
—
|
|
—
|
|
—
|
|
(2
|
)
|
|||||||||||
|
Settlements
|
—
|
|
145
|
|
—
|
|
—
|
|
—
|
|
—
|
|
|||||||||||
|
Total expense/(income)
|
$
|
45
|
|
$
|
260
|
|
$
|
216
|
|
$
|
315
|
|
$
|
48
|
|
$
|
47
|
|
|||||
|
First Nine Months
|
|||||||||||||||||||||||
|
|
Pension Benefits
|
|
|
||||||||||||||||||||
|
|
U.S. Plans
|
Non-U.S. Plans
|
Worldwide OPEB
|
||||||||||||||||||||
|
|
2014
|
2013
|
2014
|
2013
|
2014
|
2013
|
|||||||||||||||||
|
Service cost
|
$
|
380
|
|
$
|
443
|
|
$
|
356
|
|
$
|
360
|
|
$
|
40
|
|
$
|
48
|
|
|||||
|
Interest cost
|
1,494
|
|
1,434
|
|
904
|
|
847
|
|
202
|
|
192
|
|
|||||||||||
|
Expected return on assets
|
(2,034
|
)
|
(2,133
|
)
|
(1,145
|
)
|
(1,029
|
)
|
—
|
|
—
|
|
|||||||||||
|
Amortization of:
|
|
|
|
|
|||||||||||||||||||
|
Prior service costs/(credits)
|
116
|
|
131
|
|
42
|
|
49
|
|
(172
|
)
|
(213
|
)
|
|||||||||||
|
(Gains)/Losses
|
155
|
|
526
|
|
445
|
|
513
|
|
73
|
|
119
|
|
|||||||||||
|
Separation programs/other
|
9
|
|
5
|
|
54
|
|
220
|
|
1
|
|
2
|
|
|||||||||||
|
Recognition of (gains)/losses due to:
|
|||||||||||||||||||||||
|
Curtailments
|
—
|
|
—
|
|
—
|
|
—
|
|
—
|
|
(2
|
)
|
|||||||||||
|
Settlements
|
—
|
|
439
|
|
14
|
|
—
|
|
—
|
|
—
|
|
|||||||||||
|
Total expense/(income)
|
$
|
120
|
|
$
|
845
|
|
$
|
670
|
|
$
|
960
|
|
$
|
144
|
|
$
|
146
|
|
|||||
Pension Plan Contributions
In
2014
, we expect to contribute
$1.5 billion
from Automotive cash and cash equivalents to our worldwide funded pension plans (most of which are mandatory contributions), and to make
$400 million
of benefit payments to participants in unfunded plans, for a total of
$1.9 billion
. In the
first nine months
of
2014
, we contributed
$1.1 billion
to our worldwide funded pension plans and made about
$300 million
of benefit payments to participants in unfunded plans.
23
Item 1. Financial Statements (Continued)
FORD MOTOR COMPANY AND SUBSIDIARIES
NOTES TO THE FINANCIAL STATEMENTS
NOTE 10.
DEBT
The carrying value of debt was
$119.2 billion
and
$114.7 billion
at
September 30, 2014
and
December 31, 2013
, respectively. The following table details the carrying value of our debt by Automotive sector and Financial Services sector (in millions):
|
Automotive Sector
|
September 30,
2014 |
December 31,
2013 |
|||||
|
Debt payable within one year
|
|
|
|||||
|
Short-term
|
$
|
535
|
|
$
|
562
|
|
|
|
Long-term payable within one year
|
|
|
|
|
|||
|
U.S. Department of Energy (“DOE”) Advanced Technology Vehicles Manufacturing (“ATVM”) Incentive Program
|
591
|
|
591
|
|
|||
|
European Investment Bank (“EIB”) loans
|
1,231
|
|
—
|
|
|||
|
Unamortized (discount)/premium
|
3
|
|
—
|
|
|||
|
Other debt
|
367
|
|
104
|
|
|||
|
Total debt payable within one year
|
2,727
|
|
1,257
|
|
|||
|
Long-term debt payable after one year
|
|
|
|
|
|||
|
Public unsecured debt securities
|
6,634
|
|
6,799
|
|
|||
|
Unamortized (discount)/premium
|
(145
|
)
|
(148
|
)
|
|||
|
Convertible notes
|
883
|
|
908
|
|
|||
|
Unamortized (discount)/premium
|
(82
|
)
|
(110
|
)
|
|||
|
DOE ATVM Incentive Program
|
3,981
|
|
4,424
|
|
|||
|
EIB loans
|
—
|
|
1,295
|
|
|||
|
Other debt
|
947
|
|
1,255
|
|
|||
|
Unamortized (discount)/premium
|
(2
|
)
|
3
|
|
|||
|
Total long-term debt payable after one year
|
12,216
|
|
14,426
|
|
|||
|
Total Automotive sector
|
$
|
14,943
|
|
$
|
15,683
|
|
|
|
Fair value of Automotive sector debt (a)
|
$
|
17,181
|
|
$
|
17,301
|
|
|
|
Financial Services Sector
|
|
|
|
|
|||
|
Short-term debt
|
|
|
|
|
|||
|
Floating rate demand notes
|
$
|
5,689
|
|
$
|
5,319
|
|
|
|
Commercial paper
|
2,137
|
|
2,003
|
|
|||
|
Other short-term debt
|
2,935
|
|
2,345
|
|
|||
|
Asset-backed commercial paper
|
—
|
|
3,364
|
|
|||
|
Other asset-backed short-term debt
|
1,375
|
|
1,963
|
|
|||
|
Total short-term debt
|
12,136
|
|
14,994
|
|
|||
|
Long-term debt
|
|
|
|
|
|||
|
Unsecured debt
|
|
|
|
|
|||
|
Notes payable within one year
|
9,361
|
|
4,475
|
|
|||
|
Notes payable after one year
|
41,189
|
|
38,914
|
|
|||
|
Asset-backed debt
|
|
|
|
|
|||
|
Notes payable within one year
|
16,577
|
|
17,337
|
|
|||
|
Notes payable after one year
|
24,820
|
|
23,273
|
|
|||
|
Unamortized (discount)/premium
|
(61
|
)
|
(91
|
)
|
|||
|
Fair value adjustments (b)
|
228
|
|
103
|
|
|||
|
Total long-term debt
|
92,114
|
|
84,011
|
|
|||
|
Total Financial Services sector
|
$
|
104,250
|
|
$
|
99,005
|
|
|
|
Fair value of Financial Services sector debt (a)
|
$
|
107,094
|
|
$
|
102,399
|
|
|
__________
|
(a)
|
The fair value of debt includes
$279 million
and
$377 million
of Automotive sector short-term debt and
$10.8 billion
and
$9.7 billion
of Financial Services sector short-term debt at
September 30, 2014
and
December 31, 2013
, respectively, carried at cost which approximates fair value. All debt is categorized within Level 2 of the fair value hierarchy.
|
|
(b)
|
Adjustments related to designated fair value hedges of unsecured debt.
|
24
Item 1. Financial Statements (Continued)
FORD MOTOR COMPANY AND SUBSIDIARIES
NOTES TO THE FINANCIAL STATEMENTS
NOTE 11.
DERIVATIVE FINANCIAL INSTRUMENTS AND HEDGING ACTIVITIES
In the normal course of business, our operations are exposed to global market risks, including the effect of changes in foreign currency exchange rates, certain commodity prices, and interest rates. To manage these risks, we enter into various derivatives contracts. We have elected to apply hedge accounting to certain derivatives. Derivatives that are designated in hedging relationships are evaluated for effectiveness using regression analysis at the time they are designated and throughout the hedge period. Some derivatives do not qualify for hedge accounting; for others, we elect not to apply hedge accounting. Regardless, we only enter into transactions that we believe will be highly effective at offsetting the underlying economic risk.
Income Effect of Derivative Financial Instruments
The following table summarizes by hedge designation the pre-tax gains/(losses) recorded in income for the periods ended
September 30
(in millions):
|
Third Quarter
|
First Nine Months
|
||||||||||||||
|
|
2014
|
2013
|
2014
|
2013
|
|||||||||||
|
Automotive Sector
|
|||||||||||||||
|
Cash flow hedges (a)
|
|||||||||||||||
|
Reclassified from AOCI to income
|
$
|
(61
|
)
|
$
|
23
|
|
$
|
99
|
|
$
|
(105
|
)
|
|||
|
Derivatives not designated as hedging instruments
|
|||||||||||||||
|
Foreign currency exchange contracts
|
168
|
|
(24
|
)
|
107
|
|
21
|
|
|||||||
|
Commodity contracts
|
(28
|
)
|
8
|
|
7
|
|
(67
|
)
|
|||||||
|
Total
|
$
|
79
|
|
$
|
7
|
|
$
|
213
|
|
$
|
(151
|
)
|
|||
|
Financial Services Sector
|
|||||||||||||||
|
Fair value hedges
|
|||||||||||||||
|
Interest rate contracts
|
|||||||||||||||
|
Net interest settlements and accruals excluded from the assessment of hedge effectiveness
|
$
|
79
|
|
$
|
63
|
|
$
|
220
|
|
$
|
186
|
|
|||
|
Ineffectiveness (b)
|
(2
|
)
|
(3
|
)
|
8
|
|
(33
|
)
|
|||||||
|
Derivatives not designated as hedging instruments
|
|||||||||||||||
|
Interest rate contracts
|
(10
|
)
|
(19
|
)
|
(37
|
)
|
(25
|
)
|
|||||||
|
Foreign currency exchange contracts
|
52
|
|
(55
|
)
|
22
|
|
37
|
|
|||||||
|
Cross-currency interest rate swap contracts
|
118
|
|
(131
|
)
|
102
|
|
(37
|
)
|
|||||||
|
Total
|
$
|
237
|
|
$
|
(145
|
)
|
$
|
315
|
|
$
|
128
|
|
|||
__________
|
(a)
|
For the
third quarter
and
first nine months
of
2014
, a
$128 million
loss and a
$336 million
loss, respectively, were recorded in OCI. For the
third quarter
and
first nine months
of
2013
, a
$126 million
loss and a
$169 million
gain, respectively, were recorded in OCI.
|
|
(b)
|
For the
third quarter
and
first nine months
of
2014
, hedge ineffectiveness reflects the net change in fair value on derivatives of
$88 million
loss and
$179 million
gain, respectively, and change in value on hedged debt attributable to the change in benchmark interest rate of
$86 million
gain and
$171 million
loss, respectively. For the
third quarter
and
first nine months
of
2013
, hedge ineffectiveness reflects the net change in fair value on derivatives of
$67 million
gain and
$501 million
loss, respectively, and change in value on hedged debt attributable to the change in benchmark interest rate of
$70 million
loss and
$468 million
gain, respectively.
|
25
Item 1. Financial Statements (Continued)
FORD MOTOR COMPANY AND SUBSIDIARIES
NOTES TO THE FINANCIAL STATEMENTS
NOTE 11.
DERIVATIVE FINANCIAL INSTRUMENTS AND HEDGING ACTIVITIES
(Continued)
Balance Sheet Effect of Derivative Financial Instruments
The following table summarizes the notional amount and estimated fair value of our derivative financial instruments (in millions). Derivatives are recorded on the balance sheet at fair value and presented on a gross basis.
|
|
September 30, 2014
|
December 31, 2013
|
|||||||||||||||||||||
|
Notional
|
Fair Value of
Assets
|
Fair Value of
Liabilities
|
Notional
|
Fair Value of
Assets
|
Fair Value of
Liabilities
|
||||||||||||||||||
|
Automotive Sector
|
|
|
|
||||||||||||||||||||
|
Cash flow hedges
|
|
|
|
||||||||||||||||||||
|
Foreign currency exchange and commodity contracts
|
$
|
17,205
|
|
$
|
233
|
|
$
|
492
|
|
$
|
16,238
|
|
$
|
413
|
|
$
|
189
|
|
|||||
|
Derivatives not designated as hedging instruments
|
|||||||||||||||||||||||
|
Foreign currency exchange contracts
|
13,406
|
|
291
|
|
186
|
|
11,599
|
|
144
|
|
210
|
|
|||||||||||
|
Commodity contracts
|
675
|
|
13
|
|
21
|
|
3,006
|
|
23
|
|
19
|
|
|||||||||||
|
Total derivative value, gross
|
$
|
31,286
|
|
537
|
|
699
|
|
$
|
30,843
|
|
580
|
|
418
|
|
|||||||||
|
Derivative value eligible for offset
|
|
|
(480
|
)
|
(480
|
)
|
|
|
(359
|
)
|
(359
|
)
|
|||||||||||
|
Total derivative value, net
|
|
|
$
|
57
|
|
$
|
219
|
|
|
|
$
|
221
|
|
$
|
59
|
|
|||||||
|
Financial Services Sector
|
|
|
|
|
|
|
|||||||||||||||||
|
Fair value hedges
|
|
|
|
|
|
|
|||||||||||||||||
|
Interest rate contracts
|
$
|
22,943
|
|
$
|
424
|
|
$
|
157
|
|
$
|
18,778
|
|
$
|
360
|
|
$
|
179
|
|
|||||
|
Derivatives not designated as hedging instruments
|
|||||||||||||||||||||||
|
Interest rate contracts
|
56,607
|
|
254
|
|
78
|
|
69,863
|
|
224
|
|
126
|
|
|||||||||||
|
Foreign currency exchange contracts
|
2,324
|
|
56
|
|
12
|
|
2,410
|
|
1
|
|
25
|
|
|||||||||||
|
Cross-currency interest rate swap contracts
|
2,513
|
|
17
|
|
44
|
|
2,620
|
|
—
|
|
176
|
|
|||||||||||
|
Total derivative value, gross
|
$
|
84,387
|
|
751
|
|
291
|
|
$
|
93,671
|
|
585
|
|
506
|
|
|||||||||
|
Derivative value eligible for offset
|
(240
|
)
|
(240
|
)
|
(296
|
)
|
(296
|
)
|
|||||||||||||||
|
Total derivative value, net
|
|
|
$
|
511
|
|
$
|
51
|
|
|
|
|
$
|
289
|
|
$
|
210
|
|
||||||
Notional amounts are presented on a gross basis. The notional amounts of the derivative financial instruments do not represent amounts exchanged by the parties and, therefore, are not a direct measure of our exposure to the financial risks described above. We enter into master agreements with counterparties that may allow for netting of exposures in the event of default or termination of the counterparty agreement due to breach of contract.
26
Item 1. Financial Statements (Continued)
FORD MOTOR COMPANY AND SUBSIDIARIES
NOTES TO THE FINANCIAL STATEMENTS
NOTE 12.
REDEEMABLE NONCONTROLLING INTEREST
AutoAlliance International, Inc. (“AAI”) is a
50
/
50
joint venture between Ford and Mazda Motor Corporation (“Mazda”) that owns an automobile assembly plant in Flat Rock, Michigan. On September 1, 2012, we granted to Mazda a put option to sell and received from Mazda a call option to purchase the
50%
equity interest in AAI that is held by Mazda (the “Option”). The Option is exercisable at a price of
$339 million
and is recorded as a redeemable noncontrolling interest in the mezzanine section of our balance sheet. As a result of an amendment in the second quarter of 2014, the Option is now exercisable by Ford or Mazda during a
three
-year period commencing in the fourth quarter of 2014, instead of September 1, 2015. The change in timing does not change the Option exercise price. The following table summarizes the change in our carrying value of the redeemable noncontrolling interest for the periods ended
September 30
(in millions):
|
First Nine Months
|
|||||||
|
2014
|
2013
|
||||||
|
Beginning balance
|
$
|
331
|
|
$
|
322
|
|
|
|
Accretion to the redemption value of noncontrolling interest (a)
|
11
|
|
7
|
|
|||
|
Payments (b)
|
(3
|
)
|
—
|
|
|||
|
Ending balance
|
$
|
339
|
|
$
|
329
|
|
|
__________
|
(a)
|
For the first nine months of
2014
and
2013
, respectively,
$7 million
and
$7 million
were recognized in
Interest expense
and
$4 million
and
$0
were recognized in
Income/(Loss) attributable to noncontrolling interests
.
|
|
(b)
|
Represents a return of Mazda’s investment in AAI that we are contractually obligated to pay as long as Mazda retains its ownership in AAI.
|
27
Item 1. Financial Statements (Continued)
FORD MOTOR COMPANY AND SUBSIDIARIES
NOTES TO THE FINANCIAL STATEMENTS
NOTE 13.
ACCUMULATED OTHER COMPREHENSIVE INCOME/(LOSS)
The following table summarizes the changes in the accumulated balances for each component of AOCI attributable to Ford Motor Company for the periods ended
September 30
(in millions):
|
Third Quarter
|
First Nine Months
|
||||||||||||||
|
2014
|
2013
|
2014
|
2013
|
||||||||||||
|
Foreign currency translation
|
|||||||||||||||
|
Beginning balance
|
$
|
(1,664
|
)
|
$
|
(2,041
|
)
|
$
|
(1,746
|
)
|
$
|
(1,245
|
)
|
|||
|
Gains/(Losses) on foreign currency translation
|
(550
|
)
|
210
|
|
(434
|
)
|
(594
|
)
|
|||||||
|
Less: Tax/(Tax benefit)
|
—
|
|
—
|
|
53
|
|
—
|
|
|||||||
|
Net gains/(losses) on foreign currency translation
|
(550
|
)
|
210
|
|
(487
|
)
|
(594
|
)
|
|||||||
|
(Gains)/Losses reclassified from AOCI to income (a)
|
—
|
|
103
|
|
19
|
|
111
|
|
|||||||
|
Other comprehensive income/(loss), net of tax
|
(550
|
)
|
313
|
|
(468
|
)
|
(483
|
)
|
|||||||
|
Ending balance
|
$
|
(2,214
|
)
|
$
|
(1,728
|
)
|
$
|
(2,214
|
)
|
$
|
(1,728
|
)
|
|||
|
Derivative instruments (b)
|
|||||||||||||||
|
Beginning balance
|
$
|
(155
|
)
|
$
|
111
|
|
$
|
40
|
|
$
|
(175
|
)
|
|||
|
Gains/(Losses) on derivative instruments
|
(128
|
)
|
(126
|
)
|
(336
|
)
|
169
|
|
|||||||
|
Less: Tax/(Tax benefit)
|
(35
|
)
|
(42
|
)
|
(125
|
)
|
52
|
|
|||||||
|
Net gains/(losses) on derivative instruments
|
(93
|
)
|
(84
|
)
|
(211
|
)
|
117
|
|
|||||||
|
(Gains)/Losses reclassified from AOCI to income
|
61
|
|
(23
|
)
|
(99
|
)
|
102
|
|
|||||||
|
Less: Tax/(Tax benefit)
|
16
|
|
(12
|
)
|
(67
|
)
|
28
|
|
|||||||
|
Net gains/(losses) reclassified from AOCI to net income (c)
|
45
|
|
(11
|
)
|
(32
|
)
|
74
|
|
|||||||
|
Other comprehensive income/(loss), net of tax
|
(48
|
)
|
(95
|
)
|
(243
|
)
|
191
|
|
|||||||
|
Ending balance
|
$
|
(203
|
)
|
$
|
16
|
|
$
|
(203
|
)
|
$
|
16
|
|
|||
|
Pension and other postretirement benefits
|
|||||||||||||||
|
Beginning balance
|
$
|
(16,288
|
)
|
$
|
(19,907
|
)
|
$
|
(16,524
|
)
|
$
|
(21,438
|
)
|
|||
|
Gains/(Losses) arising during the period
|
—
|
|
75
|
|
(13
|
)
|
769
|
|
|||||||
|
Less: Tax/(Tax benefit)
|
—
|
|
35
|
|
(5
|
)
|
271
|
|
|||||||
|
Net gains/(losses) arising during the period
|
—
|
|
40
|
|
(8
|
)
|
498
|
|
|||||||
|
Amortization of prior service costs/(credits) (d)
|
(5
|
)
|
(11
|
)
|
(14
|
)
|
(33
|
)
|
|||||||
|
Amortization of (gains)/losses (d)
|
225
|
|
345
|
|
673
|
|
1,158
|
|
|||||||
|
Recognition of (gains)/losses due to curtailments (d)
|
—
|
|
(2
|
)
|
—
|
|
(2
|
)
|
|||||||
|
Recognition of (gains)/losses due to settlements (d)
|
—
|
|
145
|
|
14
|
|
439
|
|
|||||||
|
Less: Tax/(Tax benefit)
|
52
|
|
120
|
|
185
|
|
460
|
|
|||||||
|
Net amortization and (gains)/losses reclassified from AOCI
to net income
|
168
|
|
357
|
|
488
|
|
1,102
|
|
|||||||
|
Translation impact on non-U.S. plans
|
372
|
|
(288
|
)
|
296
|
|
40
|
|
|||||||
|
Other comprehensive income/(loss), net of tax
|
540
|
|
109
|
|
776
|
|
1,640
|
|
|||||||
|
Ending balance
|
$
|
(15,748
|
)
|
$
|
(19,798
|
)
|
$
|
(15,748
|
)
|
$
|
(19,798
|
)
|
|||
|
Total AOCI ending balance at September 30
|
$
|
(18,165
|
)
|
$
|
(21,510
|
)
|
$
|
(18,165
|
)
|
$
|
(21,510
|
)
|
|||
__________
|
(a)
|
Accumulated translation adjustments related to investments in foreign subsidiaries are reclassified to
Automotive interest income and other income/(loss), net,
Financial Services other income/(loss), net,
or
Equity in net income of affiliated companies.
|
|
(b)
|
We expect to reclassify existing net losses of
$206 million
from
Accumulated other comprehensive income/(loss)
to
Automotive cost of sales
during the next twelve months as the underlying exposures are realized.
|
|
(c)
|
Gains/(losses) on cash flow hedges are reclassified from AOCI to income when the hedged item affects earnings and is recognized in
Automotive cost of sales.
|
|
(d)
|
These AOCI components are included in the computation of total pension and OPEB expense and are recorded in
Automotive cost of sales
and
Selling, administrative and other expenses
. See
Note 9
for additional information.
|
28
Item 1. Financial Statements (Continued)
FORD MOTOR COMPANY AND SUBSIDIARIES
NOTES TO THE FINANCIAL STATEMENTS
NOTE 14.
OTHER INCOME/(LOSS)
Automotive Sector
The following table summarizes amounts included in
Automotive interest income and other income/(loss), net
for the periods ended
September 30
(in millions):
|
Third Quarter
|
First Nine Months
|
||||||||||||||
|
|
2014
|
2013
|
2014
|
2013
|
|||||||||||
|
Investment-related interest income
|
$
|
65
|
|
$
|
38
|
|
$
|
145
|
|
$
|
125
|
|
|||
|
Interest income/(expense) on income taxes
|
(3
|
)
|
—
|
|
34
|
|
—
|
|
|||||||
|
Realized and unrealized gains/(losses) on cash equivalents and marketable securities
|
7
|
|
67
|
|
7
|
|
147
|
|
|||||||
|
Gains/(Losses) on changes in investments in affiliates
|
—
|
|
(104
|
)
|
1
|
|
(114
|
)
|
|||||||
|
Gains/(Losses) on extinguishment of debt
|
—
|
|
—
|
|
(5
|
)
|
(18
|
)
|
|||||||
|
Royalty income
|
142
|
|
148
|
|
444
|
|
409
|
|
|||||||
|
Other
|
44
|
|
51
|
|
113
|
|
137
|
|
|||||||
|
Total
|
$
|
255
|
|
$
|
200
|
|
$
|
739
|
|
$
|
686
|
|
|||
Financial Services Sector
The following table summarizes amounts included in
Financial Services other income/(loss), net
for the periods ended
September 30
(in millions):
|
Third Quarter
|
First Nine Months
|
||||||||||||||
|
|
2014
|
2013
|
2014
|
2013
|
|||||||||||
|
Investment-related interest income
|
$
|
14
|
|
$
|
12
|
|
$
|
35
|
|
$
|
40
|
|
|||
|
Interest income/(expense) on income taxes
|
1
|
|
—
|
|
(9
|
)
|
—
|
|
|||||||
|
Realized and unrealized gains/(losses) on cash equivalents and marketable securities
|
(1
|
)
|
5
|
|
7
|
|
(2
|
)
|
|||||||
|
Insurance premiums earned
|
31
|
|
28
|
|
94
|
|
87
|
|
|||||||
|
Other
|
45
|
|
55
|
|
118
|
|
145
|
|
|||||||
|
Total
|
$
|
90
|
|
$
|
100
|
|
$
|
245
|
|
$
|
270
|
|
|||
NOTE 15.
EMPLOYEE SEPARATION ACTIONS AND EXIT AND DISPOSAL ACTIVITIES
We record costs associated with voluntary separations at the time of employee acceptance, unless the acceptance requires explicit approval by the Company. We record costs associated with involuntary separation programs when management has approved the plan for separation, the affected employees are identified, and it is unlikely that actions required to complete the separation plan will change significantly. When a plan of separation requires approval by or consultation with the relevant labor organization or government, the costs are recorded after the required approval or consultation process is complete. Costs associated with benefits that are contingent on the employee continuing to provide service are accrued over the required service period.
Automotive Sector
Business Restructuring - Europe
In October 2012, we committed to commence a transformation plan for our Europe operations. As part of this plan, we closed two manufacturing facilities in the United Kingdom in 2013 and are in the process of closing our assembly plant in Genk, Belgium at the end of 2014. The Genk closure was subject to an information and consultation process with employee representatives, which was completed in June 2013. The costs related to these closures were recorded beginning in the second quarter of 2013.
29
Item 1. Financial Statements (Continued)
FORD MOTOR COMPANY AND SUBSIDIARIES
NOTES TO THE FINANCIAL STATEMENTS
NOTE 15.
EMPLOYEE SEPARATION ACTIONS AND EXIT AND DISPOSAL ACTIVITIES
(Continued)
Separation-related costs, recorded in
Automotive cost of sales
and
Selling, administrative and other expenses
, include both the costs associated with voluntary separation programs in the United Kingdom and involuntary employee actions at Genk, as well as payments to suppliers. The following table summarizes the separation-related activity recorded in
Other liabilities and deferred revenue
, for the periods ended
September 30
(in millions):
|
Third Quarter
|
First Nine Months
|
||||||||||||||
|
2014
|
2013
|
2014
|
2013
|
||||||||||||
|
Beginning balance
|
$
|
643
|
|
$
|
287
|
|
$
|
497
|
|
$
|
—
|
|
|||
|
Changes in accruals (a)
|
146
|
|
196
|
|
365
|
|
483
|
|
|||||||
|
Payments
|
(30
|
)
|
(93
|
)
|
(99
|
)
|
(95
|
)
|
|||||||
|
Foreign currency translation
|
(57
|
)
|
11
|
|
(61
|
)
|
13
|
|
|||||||
|
Ending balance
|
$
|
702
|
|
$
|
401
|
|
$
|
702
|
|
$
|
401
|
|
|||
__________
|
(a)
|
Excludes
$6 million
and
$18 million
for the
third quarter
and
first nine months
of
2014
, respectively, and
$48 million
and
$180 million
for the
third quarter
and
first nine months
of
2013
, respectively, of pension related costs.
|
Our current estimate of total separation-related costs for the U.K. and Genk facilities is approximately
$1.1 billion
, excluding approximately
$200 million
of pension-related costs. The separation-related costs not yet recorded will be expensed as the employees and suppliers continue to support Genk plant operations.
NOTE 16.
INCOME TAXES
For interim tax reporting we estimate one single effective tax rate for tax jurisdictions not subject to a valuation allowance, which is applied to the year-to-date ordinary income/(loss). Tax effects of significant unusual or extraordinary items are excluded from the estimated annual effective tax rate calculation and recognized in the interim period in which they occur.
During the third quarter of 2014, we recorded tax benefits of
$245 million
resulting from a change in our methodology for measuring currency gains and losses in computing earnings of Ford Credit’s European operations under U.S. law, as well as changes to tax depreciation related to assets used in our Automotive export operations. Implementation of the change in methodology for measuring currency gains and losses substantially reduced the accumulated earnings of Ford Credit’s European operations under U.S. tax law and resulted in the realization of additional foreign tax credits. As a result of this reduction in accumulated tax earnings, our measure of earnings indefinitely reinvested in operations outside the United States is substantially reduced as it is based on accumulated earnings determined under U.S. tax law. Our cash repatriation plans remain unchanged.
30
Item 1. Financial Statements (Continued)
FORD MOTOR COMPANY AND SUBSIDIARIES
NOTES TO THE FINANCIAL STATEMENTS
NOTE 17.
CHANGES IN INVESTMENTS IN AFFILIATES AND ASSETS HELD FOR SALE
Automotive Sector
Changes in Investments in Affiliates
Impairment of Equity in Net Assets of Affiliates.
During the second quarter of 2014, we recorded a
$329 million
pre-tax impairment for our Ford Sollers joint venture as a result of factors in the Russian market including a weaker ruble, lower industry volume, and industry segmentation changes that negatively impacted the sales of Focus. These factors reduced our expected cash flows for Ford Sollers in the near-term, thereby reducing the investment’s fair value. The non-cash charge was reported in
Equity in net income of affiliated companies
.
We measured the fair value of our equity in net assets of Ford Sollers using a discounted cash flow analysis. We used cash flows that reflect Ford Sollers present plan, aligned with assumptions a market participant would have made. We assumed a discount rate of
15%
based on the appropriate weighted average cost of capital, adjusted for perceived business risks related to regulatory concerns, political tensions, foreign exchange volatility, and risk associated with the Russian automotive industry.
Liquidation of a Foreign Subsidiary.
During the third quarter of 2013, we completed the liquidation of a foreign subsidiary holding company, Ford LRH, and, as a result, reclassified
a foreign currency translation loss of
$103 million
related to the investment from
Accumulated other comprehensive income/(loss)
to
Automotive interest income and other income/(loss), net.
Financial Services Sector
Assets Held for Sale
Other Financial Services Segment.
During April and August 2013, we executed agreements to sell certain Volvo-related retail financing receivables in tranches to a third-party financing company. We received cash proceeds of
$160 million
and
$410 million
and recognized pre-tax gains of
$2 million
and
$7 million
for receivables sold in the third quarter and the first nine months of 2013, respectively.
The pre-tax gains are reported in
Financial Services other income(loss), net.
All servicing obligations were transferred to the third party upon sale of the receivables. As a consequence of the sale of receivables, we also recognized other expenses of
$56 million
.
NOTE 18.
CAPITAL STOCK AND AMOUNTS PER SHARE
We present both basic and diluted earnings per share (“EPS”) amounts in our financial reporting. Basic EPS excludes dilution and is computed by dividing income available to Common and Class B Stock holders by the weighted-average number of Common and Class B Stock outstanding for the period. Diluted EPS reflects the maximum potential dilution that could occur from our share-based compensation, including “in-the-money” stock options and unvested restricted stock units, and conversion into Ford Common Stock of our outstanding convertible notes. Potential dilutive shares are excluded from the calculation if they have an anti-dilutive effect in the period.
Share Repurchase Program
In August 2014, we completed our repurchase program for approximately
116 million
shares of Ford Common Stock, or
3%
of diluted shares. Approximately
12.6 million
shares were repurchased to offset the dilutive effect of share-based employee incentive compensation granted in 2014. In addition, approximately
103 million
shares were repurchased to offset the dilutive effect of our
4.25%
Senior Convertible Notes due November 15, 2016, as well as to offset the increase in outstanding shares that would result from settling conversions with shares. On October 21, 2014, we announced that we have elected to terminate holders’ conversion rights with respect to these convertible notes, effective November 20, 2014. Until November 19, 2014, holders will have the right to convert their notes. Although we have the right to settle any conversion with shares, cash, or a combination of shares and cash, we intend to settle conversions with shares. We also announced on October 21, 2014 that any convertible notes remaining outstanding on November 21, 2014 will be redeemed on that date for cash at a redemption price of the full principal amount, plus accrued interest.
31
Item 1. Financial Statements (Continued)
FORD MOTOR COMPANY AND SUBSIDIARIES
NOTES TO THE FINANCIAL STATEMENTS
NOTE 18.
CAPITAL STOCK AND AMOUNTS PER SHARE
(Continued)
Amounts Per Share Attributable to Ford Motor Company Common and Class B Stock
Basic and diluted income per share were calculated using the following (in millions):
|
Third Quarter
|
First Nine Months
|
||||||||||||||
|
|
2014
|
2013
|
2014
|
2013
|
|||||||||||
|
Basic and Diluted Income Attributable to Ford Motor Company
|
|
|
|||||||||||||
|
Basic income
|
$
|
835
|
|
$
|
1,272
|
|
$
|
3,135
|
|
$
|
4,116
|
|
|||
|
Effect of dilutive 2016 Convertible Notes (a)
|
12
|
|
10
|
|
36
|
|
33
|
|
|||||||
|
Effect of dilutive 2036 Convertible Notes (a) (b)
|
—
|
|
—
|
|
—
|
|
1
|
|
|||||||
|
Diluted income
|
$
|
847
|
|
$
|
1,282
|
|
$
|
3,171
|
|
$
|
4,150
|
|
|||
|
Basic and Diluted Shares
|
|
|
|
|
|||||||||||
|
Basic shares (average shares outstanding)
|
3,861
|
|
3,942
|
|
3,915
|
|
3,933
|
|
|||||||
|
Net dilutive options
|
48
|
|
53
|
|
47
|
|
52
|
|
|||||||
|
Dilutive 2016 Convertible Notes
|
101
|
|
98
|
|
100
|
|
98
|
|
|||||||
|
Dilutive 2036 Convertible Notes (b)
|
—
|
|
3
|
|
—
|
|
3
|
|
|||||||
|
Diluted shares
|
4,010
|
|
4,096
|
|
4,062
|
|
4,086
|
|
|||||||
__________
|
(a)
|
As applicable, includes interest expense, amortization of discount, amortization of fees, and other changes in income or loss that would result from the assumed conversion.
|
|
(b)
|
In December 2013, we elected to terminate the conversion rights of holders under the 2036 Convertible Notes in accordance with their terms effective as of the close of business on January 21, 2014. As a result, any 2036 Convertible Notes remaining after January 21, 2014 cannot be converted to shares and are no longer dilutive.
|
NOTE 19.
SEGMENT INFORMATION
Effective January 1, 2014, we changed our Automotive sector reportable segments to establish a fifth Automotive segment—Middle East & Africa—which includes South Africa and markets that were previously direct export markets in the Middle East and Africa regions. Previously, South Africa results were included in Asia Pacific Africa and direct export markets were reflected in the results of the producing region or segment. We have realigned reporting of our direct export markets on a geographic basis. Results for prior periods are presented on the new basis.
Our Automotive sector is comprised of the following segments:
North America, South America, Europe, Middle East & Africa, and Asia Pacific.
Included in each segment, described below, are the associated costs to develop, manufacture, distribute, and service vehicles and parts.
North America segment primarily includes the sale of Ford and Lincoln brand vehicles and related service parts and accessories in North America.
South America segment primarily includes the sale of Ford brand vehicles and related service parts and accessories in South America.
Europe segment primarily includes the sale of Ford brand vehicles, components, and related service parts and accessories in Europe, Turkey, and Russia.
Middle East & Africa segment primarily includes the sale of Ford and Lincoln brand vehicles and related service parts and accessories in the Middle East and Africa region.
Asia Pacific segment primarily includes the sale of Ford brand vehicles and related service parts and accessories in the Asia Pacific region.
Automotive segment results are presented on a “where-sold,” absolute-cost basis, which reflects the profit/(loss) on the sale within the segment in which the ultimate sale is made to our external customer.
This presentation generally eliminates the effect of legal entity transfer prices within the Automotive sector for vehicles, components, and product engineering.
32
Item 1. Financial Statements (Continued)
FORD MOTOR COMPANY AND SUBSIDIARIES
NOTES TO THE FINANCIAL STATEMENTS
NOTE 19.
SEGMENT INFORMATION
(Continued)
Key operating data for our business segments for the periods ended or at
September 30
were as follows (in millions):
|
Automotive Sector
|
|||||||||||||||||||||||||||||||
|
|
Operating Segments
|
Reconciling Items
|
|
|
|||||||||||||||||||||||||||
|
|
North
America
|
South
America
|
Europe
|
Middle East & Africa
|
Asia
Pacific
|
Other
Automotive
|
Special
Items
|
Total
|
|||||||||||||||||||||||
|
Third Quarter 2014
|
|
|
|
|
|
|
|
|
|
|
|
|
|
|
|||||||||||||||||
|
Revenues
|
$
|
19,942
|
|
$
|
2,335
|
|
$
|
6,844
|
|
$
|
1,077
|
|
$
|
2,581
|
|
$
|
—
|
|
$
|
—
|
|
$
|
32,779
|
|
|||||||
|
Income/(Loss) before income taxes
|
1,410
|
|
(170
|
)
|
(439
|
)
|
(15
|
)
|
44
|
|
(144
|
)
|
(160
|
)
|
526
|
|
|||||||||||||||
|
Total assets at September 30
|
60,158
|
|
6,710
|
|
15,079
|
|
1,258
|
|
8,068
|
|
—
|
|
—
|
|
91,273
|
|
|||||||||||||||
|
Third Quarter 2013
|
|
|
|
|
|
|
|
|
|
|
|
|
|
|
|||||||||||||||||
|
Revenues
|
$
|
21,121
|
|
$
|
2,820
|
|
$
|
6,400
|
|
$
|
1,021
|
|
$
|
2,495
|
|
$
|
—
|
|
$
|
—
|
|
$
|
33,857
|
|
|||||||
|
Income/(Loss) before income taxes
|
2,296
|
|
160
|
|
(182
|
)
|
(25
|
)
|
116
|
|
(139
|
)
|
(498
|
)
|
1,728
|
|
|||||||||||||||
|
Total assets at September 30
|
59,059
|
|
7,108
|
|
16,090
|
|
1,147
|
|
7,931
|
|
—
|
|
—
|
|
91,335
|
|
|||||||||||||||
|
Automotive Sector
|
|||||||||||||||||||||||||||||||
|
|
Operating Segments
|
Reconciling Items
|
|
|
|||||||||||||||||||||||||||
|
|
North
America |
South
America |
Europe |
Middle East & Africa
|
Asia
Pacific |
Other
Automotive |
Special
Items |
Total
|
|||||||||||||||||||||||
|
First Nine Months 2014
|
|
|
|
|
|
|
|
|
|
|
|
|
|
|
|||||||||||||||||
|
Revenues
|
$
|
61,495
|
|
$
|
6,337
|
|
$
|
22,680
|
|
$
|
3,404
|
|
$
|
8,104
|
|
$
|
—
|
|
$
|
—
|
|
$
|
102,020
|
|
|||||||
|
Income/(Loss) before income taxes
|
5,350
|
|
(975
|
)
|
(619
|
)
|
62
|
|
494
|
|
(537
|
)
|
(763
|
)
|
3,012
|
|
|||||||||||||||
|
First Nine Months 2013
|
|
|
|
|
|
|
|
|
|
|
|
|
|
|
|||||||||||||||||
|
Revenues
|
$
|
64,459
|
|
$
|
8,142
|
|
$
|
20,328
|
|
$
|
3,511
|
|
$
|
7,354
|
|
$
|
—
|
|
$
|
—
|
|
$
|
103,794
|
|
|||||||
|
Income/(Loss) before income taxes
|
7,009
|
|
93
|
|
(913
|
)
|
35
|
|
218
|
|
(469
|
)
|
(1,257
|
)
|
4,716
|
|
|||||||||||||||
33
Item 1. Financial Statements (Continued)
FORD MOTOR COMPANY AND SUBSIDIARIES
NOTES TO THE FINANCIAL STATEMENTS
NOTE 19.
SEGMENT INFORMATION
(Continued)
|
|
Financial Services Sector
|
Company
|
|||||||||||||||||||||
|
|
Operating Segments
|
Reconciling Item
|
|
|
|
||||||||||||||||||
|
|
Ford
Credit
|
Other
Financial
Services
|
Elims
|
Total
|
Elims (a)
|
Total
|
|||||||||||||||||
|
Third Quarter 2014
|
|
|
|
|
|
|
|
||||||||||||||||
|
Revenues
|
$
|
2,214
|
|
$
|
37
|
|
$
|
(110
|
)
|
$
|
2,141
|
|
$
|
—
|
|
$
|
34,920
|
|
|||||
|
Income/(Loss) before income taxes
|
498
|
|
(3
|
)
|
—
|
|
495
|
|
—
|
|
1,021
|
|
|||||||||||
|
Total assets at September 30
|
121,216
|
|
5,577
|
|
(6,321
|
)
|
120,472
|
|
(2,910
|
)
|
208,835
|
|
|||||||||||
|
Third Quarter 2013
|
|
|
|
|
|
|
|
|
|
|
|
|
|||||||||||
|
Revenues
|
$
|
1,974
|
|
$
|
45
|
|
$
|
(101
|
)
|
$
|
1,918
|
|
$
|
—
|
|
$
|
35,775
|
|
|||||
|
Income/(Loss) before income taxes
|
427
|
|
(64
|
)
|
—
|
|
363
|
|
—
|
|
2,091
|
|
|||||||||||
|
Total assets at September 30
|
111,834
|
|
5,749
|
|
(6,946
|
)
|
110,637
|
|
(2,190
|
)
|
199,782
|
|
|||||||||||
|
|
Financial Services Sector
|
Company
|
|||||||||||||||||||||
|
|
Operating Segments
|
Reconciling Item
|
|
|
|
||||||||||||||||||
|
|
Ford
Credit
|
Other
Financial
Services
|
Elims
|
Total
|
Elims (a)
|
Total
|
|||||||||||||||||
|
First Nine Months 2014
|
|
|
|
|
|
|
|
||||||||||||||||
|
Revenues
|
$
|
6,427
|
|
$
|
105
|
|
$
|
(345
|
)
|
$
|
6,187
|
|
$
|
—
|
|
$
|
108,207
|
|
|||||
|
Income/(Loss) before income taxes
|
1,431
|
|
(45
|
)
|
—
|
|
1,386
|
|
—
|
|
4,398
|
|
|||||||||||
|
First Nine Months 2013
|
|
|
|
|
|
|
|
|
|
|
|
|
|||||||||||
|
Revenues
|
$
|
5,735
|
|
$
|
158
|
|
$
|
(340
|
)
|
$
|
5,553
|
|
$
|
—
|
|
$
|
109,347
|
|
|||||
|
Income/(Loss) before income taxes
|
1,388
|
|
(71
|
)
|
—
|
|
1,317
|
|
—
|
|
6,033
|
|
|||||||||||
__________
|
(a)
|
Includes intersector transactions occurring in the ordinary course of business and deferred tax netting.
|
34
Item 1. Financial Statements (Continued)
FORD MOTOR COMPANY AND SUBSIDIARIES
NOTES TO THE FINANCIAL STATEMENTS
NOTE 20.
COMMITMENTS AND CONTINGENCIES
Commitments and contingencies consist primarily of guarantees and indemnifications, litigation and claims, and warranty.
Guarantees and Indemnifications
Guarantees and indemnifications are recorded at fair value at their inception. We regularly review our performance risk under these arrangements, and in the event it becomes probable we will be required to perform under the guarantee or indemnification, the amount of probable payment is recorded.
We guarantee debt and lease obligations of certain joint ventures, as well as certain financial obligations of outside third parties, including suppliers, to support our business and economic growth. Expiration dates vary through 2033, and guarantees will terminate on payment and/or cancellation of the obligation. A payment by us would be triggered by failure of the joint venture or other third party to fulfill its obligation covered by the guarantee. In some circumstances, we are entitled to recover from the third party amounts paid by us under the guarantee. However, our ability to enforce these rights is sometimes stayed until the guaranteed party is paid in full, and may be limited in the event of insolvency of the third party or other circumstances.
In the ordinary course of business, we execute contracts involving indemnifications standard in the industry and indemnifications specific to a transaction, such as the sale of a business. These indemnifications might include and are not limited to claims relating to any of the following: environmental, tax, and shareholder matters; intellectual property rights; power generation contracts; governmental regulations and employment-related matters; dealer, supplier, and other commercial contractual relationships; and financial matters, such as securitizations. Performance under these indemnities generally would be triggered by a breach of terms of the contract or by a third-party claim. While some of these indemnifications are limited in nature, many of them do not limit potential payment. Therefore, we are unable to estimate a maximum amount of future payments that could result from claims made under these unlimited indemnities.
The maximum potential payments and the carrying value of recorded liabilities related to guarantees and limited indemnities were as follows (in millions):
|
|
September 30,
2014 |
December 31,
2013 |
|||||
|
Maximum potential payments
|
$
|
601
|
|
$
|
659
|
|
|
|
Carrying value of recorded liabilities related to guarantees and limited indemnities
|
9
|
|
5
|
|
|||
Litigation and Claims
Various legal actions, proceedings, and claims (generally, “matters”) are pending or may be instituted or asserted against us. These include but are not limited to matters arising out of alleged defects in our products; product warranties; governmental regulations relating to safety, emissions, and fuel economy or other matters; government incentives; tax matters; alleged illegal acts resulting in fines or penalties; financial services; employment-related matters; dealer, supplier, and other contractual relationships; intellectual property rights; environmental matters; shareholder or investor matters; and financial reporting matters. Certain of the pending legal actions are, or purport to be, class actions. Some of the matters involve or may involve claims for compensatory, punitive, or antitrust or other treble damages in very large amounts, or demands for field service actions, environmental remediation programs, sanctions, loss of government incentives, assessments, or other relief, which, if granted, would require very large expenditures.
The extent of our financial exposure to these matters is difficult to estimate. Many matters do not specify a dollar amount for damages, and many others specify only a jurisdictional minimum. To the extent an amount is asserted, our historical experience suggests that in most instances the amount asserted is not a reliable indicator of the ultimate outcome.
Litigation and claims are accrued when losses are deemed probable and reasonably estimable. In evaluating matters for accrual and disclosure purposes, we take into consideration factors such as our historical experience with matters of a similar nature, the specific facts and circumstances asserted, the likelihood that we will prevail, and the severity of any potential loss. We reevaluate and update our accruals as matters progress over time.
35
Item 1. Financial Statements (Continued)
FORD MOTOR COMPANY AND SUBSIDIARIES
NOTES TO THE FINANCIAL STATEMENTS
NOTE 20.
COMMITMENTS AND CONTINGENCIES
(Continued)
For the majority of matters, which generally arise out of alleged defects in our products, we establish an accrual based on our extensive historical experience with similar matters, and we do not believe that there is a reasonably possible outcome materially in excess of our accrual.
For the remaining matters, where our historical experience with similar matters is of more limited value (i.e., “non-pattern matters”), we evaluate matters primarily based on the individual facts and circumstances. For non-pattern matters, we evaluate whether there is a reasonable possibility of a material loss in excess of any accrual that can be estimated. Our estimate of reasonably possible loss in excess of our accruals for all material matters currently reflects indirect tax and customs matters, for which we estimate the aggregate risk to be a range of up to a
bout
$3 billion
.
As noted, the litigation process is subject to many uncertainties, and the outcome of individual matters is not predictable with assurance. Our assessments are based on our knowledge and experience, but the ultimate outcome of any matter could require payment substantially in excess of the amount that we have accrued and/or disclosed.
Warranty
Estimated warranty costs are accrued for at the time the vehicle is sold to a dealer. Included in warranty cost accruals are the costs for basic warranty coverages and field service actions (i.e., safety recalls, emission recalls, and other product campaigns) on products sold. These costs are estimates based primarily on historical experience. Warranty accruals accounted for in
Other liabilities and deferred revenue
for the periods ended
September 30
were as follows (in millions):
|
First Nine Months
|
|||||||
|
|
2014
|
2013
|
|||||
|
Beginning balance
|
$
|
3,927
|
|
$
|
3,656
|
|
|
|
Payments made during the period
|
(2,186
|
)
|
(1,763
|
)
|
|||
|
Changes in accrual related to warranties issued during the period
|
1,506
|
|
1,471
|
|
|||
|
Changes in accrual related to pre-existing warranties
|
1,522
|
|
227
|
|
|||
|
Foreign currency translation and other
|
(67
|
)
|
(54
|
)
|
|||
|
Ending balance
|
$
|
4,702
|
|
$
|
3,537
|
|
|
Excluded from the table above are costs accrued for customer satisfaction actions.
36
Report of Independent Registered Public Accounting Firm
To the Board of Directors and Stockholders of
Ford Motor Company:
We have reviewed the accompanying consolidated balance sheet of Ford Motor Company and its subsidiaries as of
September 30, 2014
, and the related consolidated statements of income and comprehensive income for the three-month and nine-month periods ended
September 30, 2014
and
2013
and the condensed consolidated statement of cash flows and the consolidated statement of equity for the nine-month periods ended
September 30, 2014
and
2013
. These interim financial statements are the responsibility of the Company’s management.
The accompanying sector balance sheets and the related sector statements of income and of cash flows are presented for purposes of additional analysis and are not a required part of the basic financial statements. Such information has been subjected to the review procedures applied in the review of the basic financial statements.
We conducted our review in accordance with the standards of the Public Company Accounting Oversight Board (United States). A review of interim financial information consists principally of applying analytical procedures and making inquiries of persons responsible for financial and accounting matters. It is substantially less in scope than an audit conducted in accordance with the standards of the Public Company Accounting Oversight Board (United States), the objective of which is the expression of an opinion regarding the financial statements taken as a whole. Accordingly, we do not express such an opinion.
Based on our review, we are not aware of any material modifications that should be made to the accompanying consolidated interim financial statements for them to be in conformity with accounting principles generally accepted in the United States of America.
We previously audited, in accordance with the standards of the Public Company Accounting Oversight Board (United States), the consolidated balance sheet as of
December 31, 2013
, and the related consolidated statements of income, comprehensive income, equity, and cash flows for the year then ended (not presented herein), and in our report dated February 18, 2014, we expressed an unqualified opinion on those consolidated financial statements. As discussed in Note 1 to the accompanying consolidated interim financial statements, the Company changed its method of accounting for its disability benefits. The accompanying
December 31, 2013
consolidated balance sheet reflects the cumulative impact of this change.
/s/ PricewaterhouseCoopers LLP
PricewaterhouseCoopers LLP
Detroit, Michigan
October 31, 2014
37
ITEM 2.
Management’s Discussion and Analysis of Financial Condition and Results of Operations.
RESULTS OF OPERATIONS
Our third quarter and first nine months 2014 pre-tax results and net income were as follows:
|
Third Quarter
|
First Nine Months
|
Memo:
|
|||||||||||||||||
|
|
2014
|
Better/(Worse)
2013
|
2014
|
Better/(Worse)
2013
|
Full Year
2013
|
||||||||||||||
|
(Mils.)
|
(Mils.)
|
(Mils.)
|
(Mils.)
|
(Mils.)
|
|||||||||||||||
|
Income
|
|
|
|
|
|
||||||||||||||
|
Pre-tax results (excl. special items)
|
$
|
1,181
|
|
$
|
(1,408
|
)
|
$
|
5,161
|
|
$
|
(2,129
|
)
|
$
|
8,608
|
|
||||
|
Special items
|
(160
|
)
|
338
|
|
(763
|
)
|
494
|
|
(1,568
|
)
|
|||||||||
|
Pre-tax results (incl. special items)
|
1,021
|
|
(1,070
|
)
|
4,398
|
|
(1,635
|
)
|
7,040
|
|
|||||||||
|
(Provision for)/Benefit from income taxes
|
(188
|
)
|
630
|
|
(1,261
|
)
|
653
|
|
135
|
|
|||||||||
|
Net income
|
833
|
|
|
(440
|
)
|
3,137
|
|
(982
|
)
|
7,175
|
|
||||||||
|
Less: Income/(Loss) attributable to noncontrolling interests
|
(2
|
)
|
(3
|
)
|
2
|
|
(1
|
)
|
(7
|
)
|
|||||||||
|
Net income attributable to Ford
|
$
|
835
|
|
$
|
(437
|
)
|
$
|
3,135
|
|
$
|
(981
|
)
|
$
|
7,182
|
|
||||
Net income
includes certain items (“special items”) that we have grouped into “Personnel and Dealer-Related Items” and “Other Items” to provide useful information to investors about the nature of the special items. The first category includes items related to our efforts to match production capacity and cost structure to market demand and changing model mix and therefore helps investors track amounts related to those activities. The second category includes items that we do not generally consider to be indicative of our ongoing operating activities, and therefore allows investors analyzing our pre-tax results to identify certain infrequent significant items that they may wish to exclude when considering the trend of ongoing operating results.
As detailed in Note 19 of the Notes to the Financial Statements, we allocate special items to a separate reconciling item, as opposed to allocating them among the operating segments and Other Automotive, reflecting the fact that management excludes these items from its review of operating segment results for purposes of measuring segment profitability and allocating resources among the segments.
The following table details Automotive sector pre-tax special items in each category:
|
Memo:
|
|||||||||||||||||||
|
Third Quarter
|
First Nine Months
|
Full Year
|
|||||||||||||||||
|
2014
|
2013
|
2014
|
2013
|
2013
|
|||||||||||||||
|
(Mils.)
|
(Mils.)
|
(Mils.)
|
(Mils.)
|
(Mils.)
|
|||||||||||||||
|
Personnel and Dealer-Related Items
|
|||||||||||||||||||
|
Separation-related actions (a)
|
$
|
(160
|
)
|
$
|
(250
|
)
|
$
|
(434
|
)
|
$
|
(700
|
)
|
$
|
(856
|
)
|
||||
|
Other Items
|
|
|
|
|
|
|
|
|
|||||||||||
|
Ford Sollers equity impairment
|
—
|
|
—
|
|
(329
|
)
|
—
|
|
—
|
|
|||||||||
|
U.S. pension lump-sum program
|
—
|
|
(145
|
)
|
—
|
|
(439
|
)
|
(594
|
)
|
|||||||||
|
FCTA -- subsidiary liquidation
|
—
|
|
(103
|
)
|
—
|
|
(103
|
)
|
(103
|
)
|
|||||||||
|
Ford Romania consolidation loss
|
—
|
|
—
|
|
—
|
|
(15
|
)
|
(15
|
)
|
|||||||||
|
Total Other Items
|
—
|
|
(248
|
)
|
(329
|
)
|
(557
|
)
|
(712
|
)
|
|||||||||
|
Total Special Items
|
$
|
(160
|
)
|
$
|
(498
|
)
|
$
|
(763
|
)
|
$
|
(1,257
|
)
|
$
|
(1,568
|
)
|
||||
__________
|
(a)
|
Primarily related to separation costs for personnel at the Genk and U.K. facilities.
|
38
Item 2. Management’s Discussion and Analysis of Financial Condition and Results of Operations (Continued)
Discussion of Automotive sector, Financial Services sector, and Company results of operations below is on a pre-tax basis and excludes special items unless otherwise specifically noted. References to records by Automotive segments are since at least 2000 when we began reporting specific segment results.
The chart below shows third quarter 2014 pre-tax results by sector:
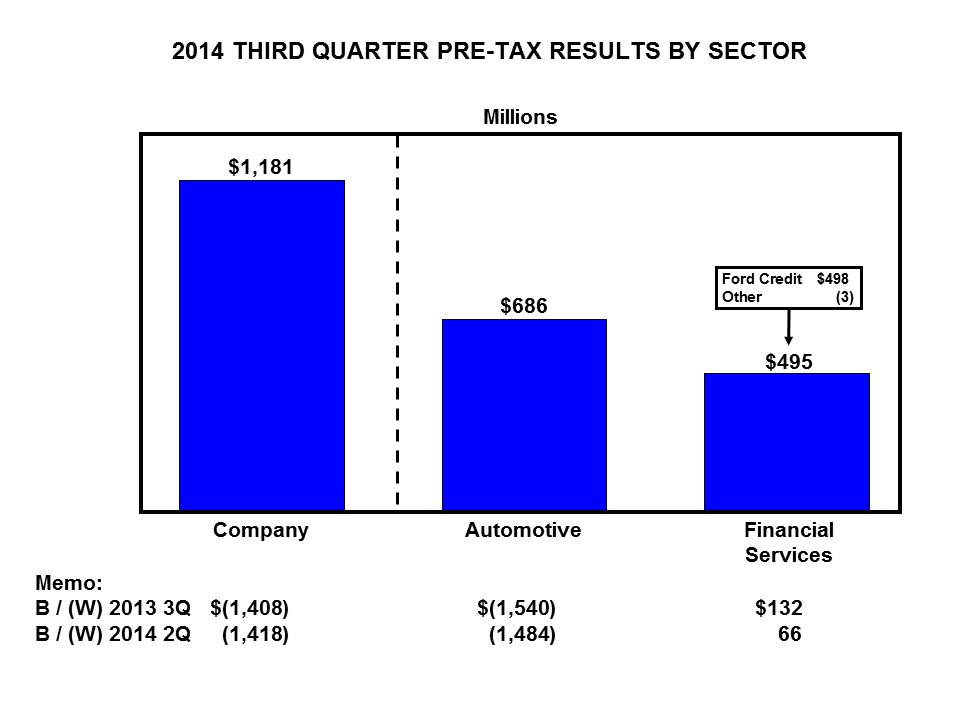
Both the Automotive and Financial Services sectors contributed to the Company’s third quarter 2014 pre-tax profit of $1.2 billion. The decline, compared to the prior year and the prior quarter, is more than explained by the Automotive sector.
39
Item 2. Management’s Discussion and Analysis of Financial Condition and Results of Operations (Continued)
AUTOMOTIVE SECTOR
In general, we measure year-over-year change in Automotive pre-tax operating profit for our total Automotive sector and reportable segments using the causal factors listed below, with revenue and cost variances calculated at present-year volume and mix and exchange:
|
•
|
Market Factors
:
|
|
◦
|
Volume and Mix -
primarily measures profit variance from changes in wholesale volumes (at prior-year average margin per unit) driven by changes in industry volume, market share, and dealer stocks, as well as the profit variance resulting from changes in product mix, including mix among vehicle lines and mix of trim levels and options within a vehicle line
|
|
◦
|
Net Pricing -
primarily measures profit variance driven by changes in wholesale prices to dealers and marketing incentive programs such as rebate programs, low-rate financing offers, and special lease offers
|
|
•
|
Contribution Costs -
primarily measures profit variance driven by per-unit changes in cost categories that typically vary with volume, such as material costs (including commodity and component costs), warranty expense, and freight and duty costs
|
|
•
|
Other Costs -
primarily measures profit variance driven by absolute change in cost categories that typically do not have a directly proportionate relationship to production volume. These include mainly structural costs, described below, as well as all other costs, which include items such as litigation costs and costs related to our after-market parts, accessories, and service business. Structural costs include the following cost categories:
|
|
◦
|
Manufacturing and Engineering -
consists primarily of costs for hourly and salaried manufacturing- and engineering-related personnel, plant overhead (such as utilities and taxes), new product launch expense, prototype materials, and outside engineering services
|
|
◦
|
Spending-Related -
consists primarily of depreciation and amortization of our manufacturing and engineering assets, but also includes asset retirements and operating leases
|
|
◦
|
Advertising and Sales Promotions -
includes costs for advertising, marketing programs, brand promotions, customer mailings and promotional events, and auto shows
|
|
◦
|
Administrative and Selling -
includes primarily costs for salaried personnel and purchased services related to our staff activities and selling functions, as well as associated information technology costs
|
|
◦
|
Pension and OPEB -
consists primarily of past service pension costs and other postretirement employee benefit costs
|
|
•
|
Exchange -
primarily measures profit variance driven by one or more of the following: (i) impact of gains or losses arising from transactions denominated in currencies other than the functional currency of the locations, including currency transactions, (ii) effect of remeasuring income, assets, and liabilities of foreign subsidiaries using U.S. dollars as the functional currency, or (iii) results of our foreign currency hedging activities
|
|
•
|
Net Interest and Other
|
|
◦
|
Net Interest
- primarily measures profit variance driven by changes in our Automotive sector’s centrally-managed net interest, which consists of interest expense, interest income, fair market value adjustments on our cash equivalents and marketable securities portfolio (excluding our investment in Mazda), and other adjustments
|
|
◦
|
Other
- consists of fair market value adjustments to our investment in Mazda, as well as other items not included in the causal factors defined above
|
40
Item 2. Management’s Discussion and Analysis of Financial Condition and Results of Operations (Continued)
Total Automotive.
The following charts detail third quarter key metrics and the change in the third quarter of 2014 pre-tax results compared with the third quarter of 2013 by causal factor. Automotive operating margin is defined as Automotive pre-tax results, excluding special items and Other Automotive, divided by Automotive revenue.
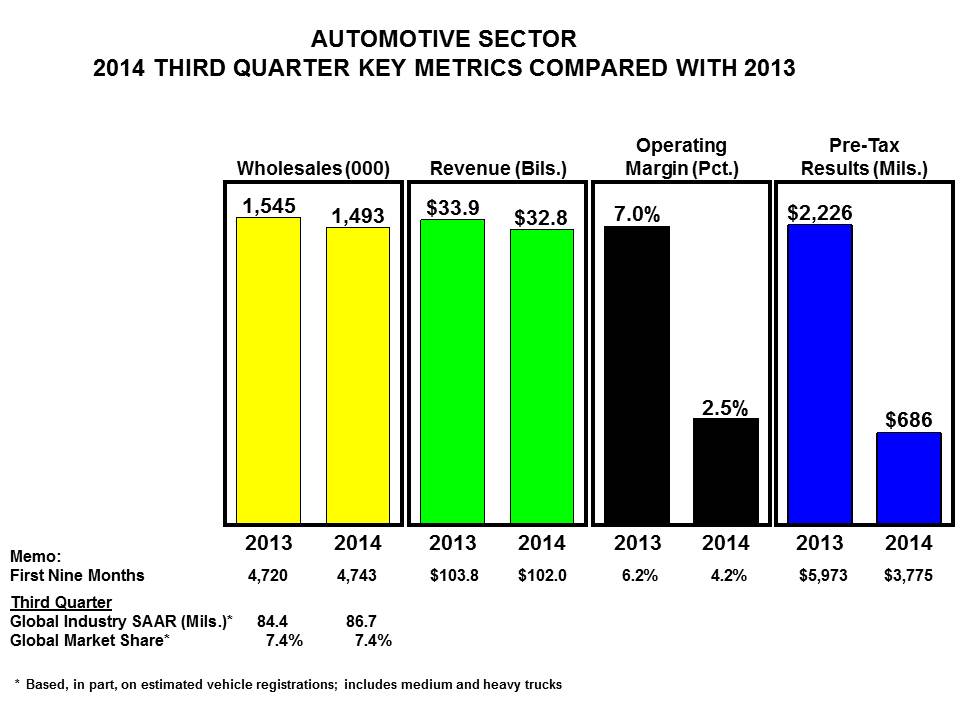
As shown above, wholesale volume and revenue decreased by 3% compared with a year ago. The lower volume is more than explained by an unfavorable change in dealer stocks related to product launch effects and the supplier parts shortages referenced below in
North America Segment
, as well as declining industry volume in South America. Higher industry volumes in other regions were a partial offset.
Global industry SAAR is estimated at 86.7 million units, up 3% from a year ago. Our global market share is estimated at 7.4%, unchanged from a year ago. Operating margin was 2.5%, down 4.5 percentage points from a year ago, and Automotive pre-tax profit was $686 million, down $1.5 billion.
As shown in the memo below the chart, first nine month volume was up slightly from a year ago while Automotive revenue was down 2%. Operating margin, at 4.2%, was down 2 percentage points. Total Automotive pre-tax profit, at $3.8 billion, was down $2.2 billion. The lower results were driven by North and South America; all other business units improved.
41
Item 2. Management’s Discussion and Analysis of Financial Condition and Results of Operations (Continued)
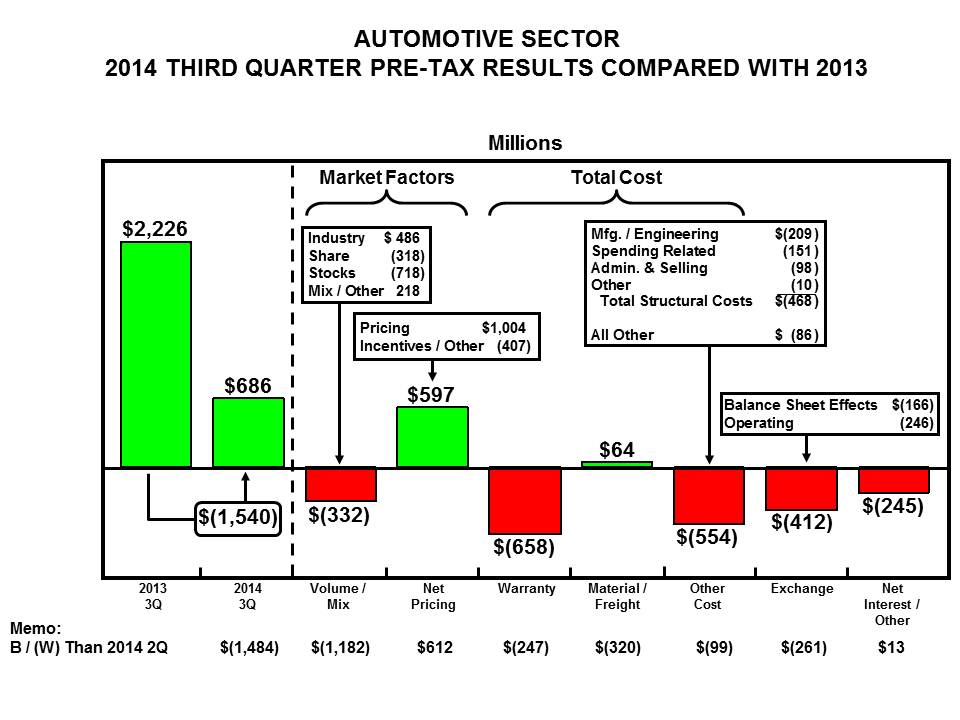
The lower profit in the third quarter of 2014, compared with the third quarter of 2013, is largely explained by higher warranty costs, including recalls, mainly in North America, and lower volume in North and South America, as well as $166 million of adverse balance sheet exchange effects, mainly in South America. All other factors largely offset each other.
As shown in the memo, pre-tax profit was $1.5 billion lower than the second quarter, largely explained by lower volume mainly in North America and Europe, as well as higher warranty costs in North America.
Total costs and expenses.
In the third quarter of 2014 and 2013, total costs and expenses, including special items, for our Automotive sector were $32.7 billion and $32.4 billion, respectively, a difference of $300 million; for the first nine months of 2014 and 2013 these were $100 billion and $99.9 billion, respectively, a difference of $100 million. An explanation of these changes is shown below (in billions):
|
2014 Lower/(Higher) 2013
|
|||||||
|
Third
Quarter
|
First
Nine Months
|
||||||
|
Explanation of change:
|
|||||||
|
Volume and mix, exchange, and other
|
$
|
0.7
|
|
$
|
0.8
|
|
|
|
Contribution costs (a)
|
|
|
|
|
|||
|
Material/Freight
|
0.1
|
|
1.0
|
|
|||
|
Warranty
|
(0.7
|
)
|
(1.4
|
)
|
|||
|
Other costs (a)
|
|
|
|
|
|||
|
Structural costs
|
(0.5
|
)
|
(1.1
|
)
|
|||
|
Other
|
(0.1
|
)
|
(0.1
|
)
|
|||
|
Special items
|
0.2
|
|
0.7
|
|
|||
|
Total
|
$
|
(0.3
|
)
|
$
|
(0.1
|
)
|
|
_________
|
(a)
|
Our key cost change elements are measured primarily at present-year exchange; in addition, costs that vary directly with volume, such as material, freight and warranty costs, are measured at present-year volume and mix. Excludes special items.
|
42
Item 2. Management’s Discussion and Analysis of Financial Condition and Results of Operations (Continued)
Results by Automotive Segment.
Details by segment of pre-tax results
for the third quarter of 2014 are shown below.
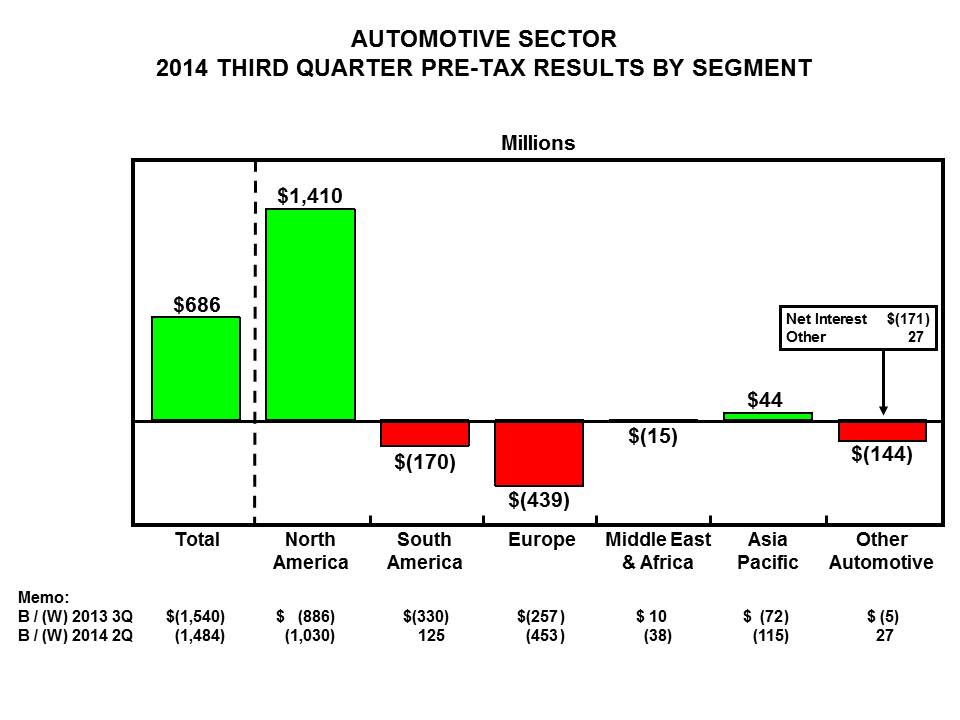
North America and Asia Pacific were profitable, but the other segments reported losses.
Other Automotive reflects net interest expense. For the full year, we continue to expect net interest expense to be about $700 million.
43
Item 2. Management’s Discussion and Analysis of Financial Condition and Results of Operations (Continued)
North America Segment.
The following charts detail third quarter key metrics and the change in third quarter 2014 pre-tax results compared with the third quarter of 2013 by causal factor.
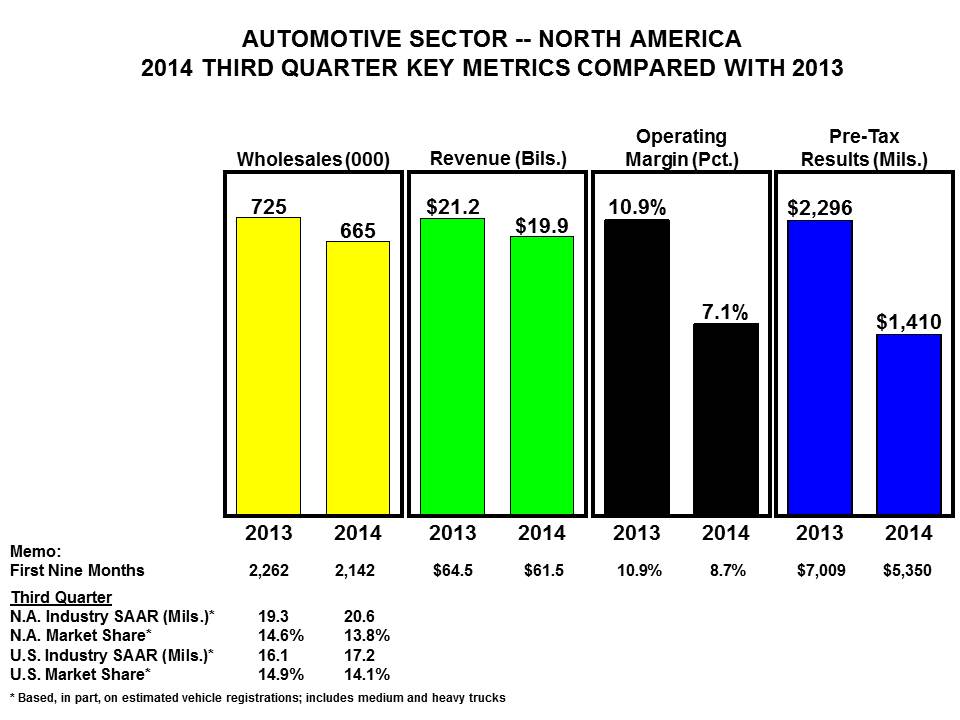
North America continued to benefit from robust industry sales, our strong product lineup, continued discipline in matching production to demand, and a lean cost structure, but our third quarter results were affected adversely by higher warranty costs and lower volume.
North America third quarter wholesale volume and revenue declined 8% and 6%, respectively, from a year ago. This decrease is primarily explained by product launch effects, including five weeks of downtime in the quarter at the Dearborn Truck Plant for the F-150 launch, and supplier parts shortages. The parts shortage issues that affected us in the third quarter have now been resolved. U.S. third quarter industry SAAR was 17.2 million units, 1.1 million units higher than a year ago.
Our U.S. market share deteriorated eight-tenths of a percentage point, to 14.1%, reflecting a planned reduction in daily rental sales and lower F-150 share as we prepare for the new vehicle by continuing to balance share, transaction prices, and stocks. Although not shown, our U.S. retail market share of the retail industry was 13.0%, down two-tenths of a percentage point from a year ago.
North America’s decline in revenue is more than explained by the lower wholesale volume. North America operating margin was 7.1%, down 3.8 percentage points from last year, and pre-tax profit was $1.4 billion, down $886 million.
As shown in the memo below the chart, all first nine month metrics declined from a year ago. Lower volume and higher warranty costs, including recalls, more than explain the lower operating margin and pre-tax profit.
44
Item 2. Management’s Discussion and Analysis of Financial Condition and Results of Operations (Continued)
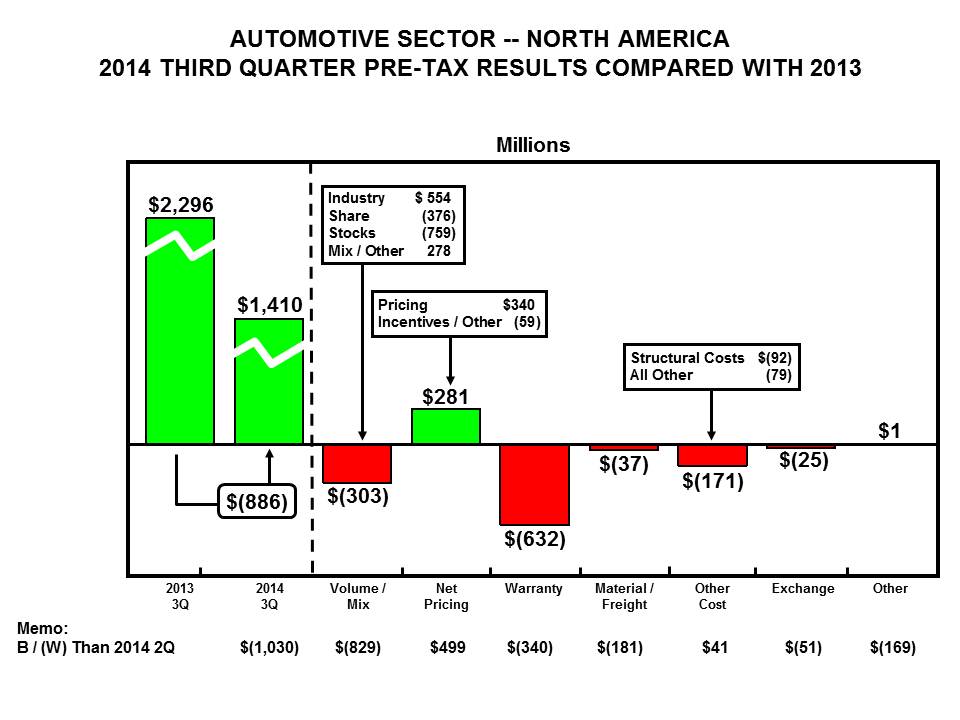
The decline in pre-tax profits is more than explained by higher warranty costs and lower volume. The warranty costs reflect the restraint control module recall announced last month, as well as reserve changes related to other field service actions. As mentioned above, product launch effects and supplier parts shortages drove the lower volume.
As shown in the memo, pre-tax profit was lower than the second quarter, more than explained by unfavorable volume and mix and higher warranty costs.
For the full year, we continue to expect North America pre-tax profit to be lower than 2013, and operating margin at the low end of the 8% to 9% range.
45
Item 2. Management’s Discussion and Analysis of Financial Condition and Results of Operations (Continued)
South America Segment.
The following charts detail third quarter key metrics and the change in third quarter 2014 pre-tax results compared with the third quarter of 2013 by causal factor.
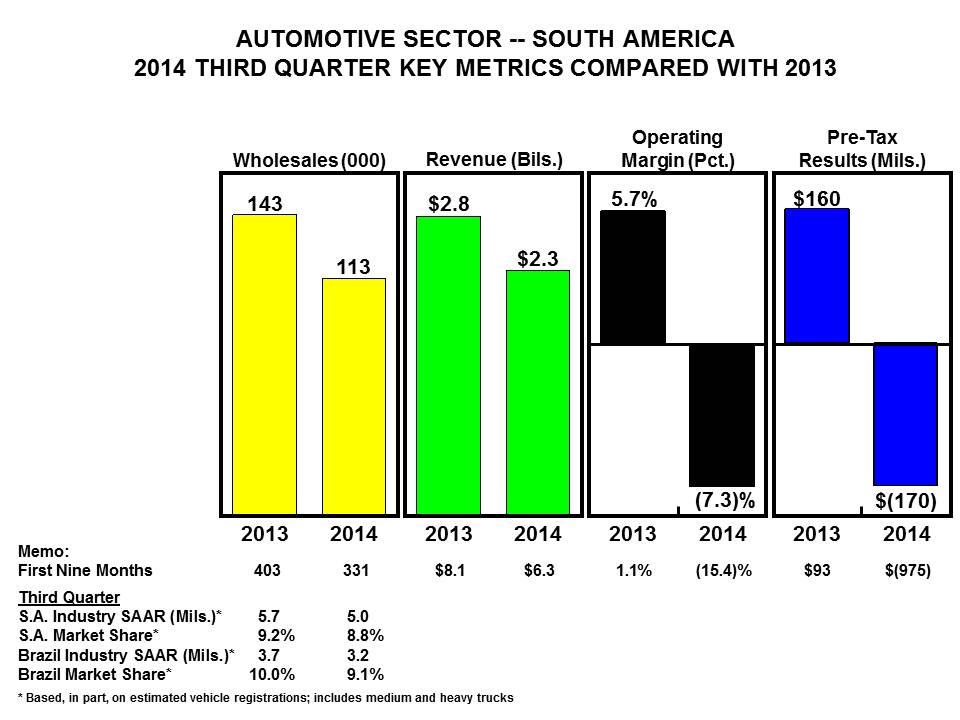
In South America we are continuing to execute our strategy of expanding our product line-up and have replaced legacy products with global One Ford offerings. We also are working to manage the effects of slowing GDP growth, declining industry volumes in our larger markets, weaker currencies, high inflation, as well as policy uncertainty in some countries.
In the third quarter, wholesale volume and revenue decreased from a year ago by 21% and 17%, respectively. The lower volume is primarily explained by a 700,000-unit decline from last year’s SAAR of 5.7 million units. This reflects the impact of the weakening economy in Brazil, import restrictions in Argentina, and lower production in Venezuela resulting from limited availability of U.S. dollars. Also contributing is a non-repeat of last year’s stock build.
South America market share, at 8.8%, was down four-tenths of a percentage point, more than explained by the phase-out of Fiesta Classic.
The revenue decline is more than explained by lower volume and weaker currencies; higher pricing was a partial offset. Operating margin was negative 7.3%, down significantly from a year ago, and pre-tax loss was $170 million, a deterioration of $330 million.
As shown in the memo below the chart, all first nine month metrics deteriorated from a year ago, driven by the adverse change in external factors. The first nine months loss includes $426 million of adverse balance sheet exchange effects.
46
Item 2. Management’s Discussion and Analysis of Financial Condition and Results of Operations (Continued)
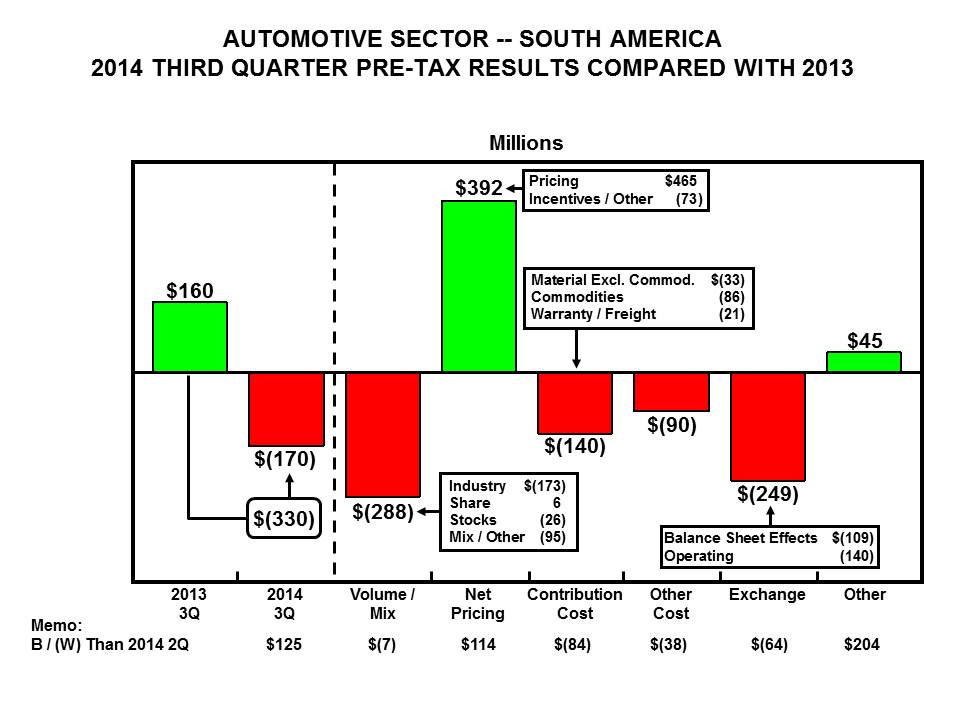
South America’s third quarter pre-tax results declined from a year ago. The lower results were driven primarily by lower volume and adverse balance sheet exchange effects.
As shown in the memo, pre-tax results improved compared with the second quarter, more than explained by higher pricing and other effects associated with introduction of the new Ka in Brazil. Ka has been well received by media, and initial reaction from customers is very encouraging.
For the full year, we continue to expect South America to incur a loss of about $1 billion.
47
Item 2. Management’s Discussion and Analysis of Financial Condition and Results of Operations (Continued)
Europe Segment.
The following charts detail third quarter key metrics and the change in third quarter 2014 pre-tax results compared with the third quarter of 2013 by causal factor.
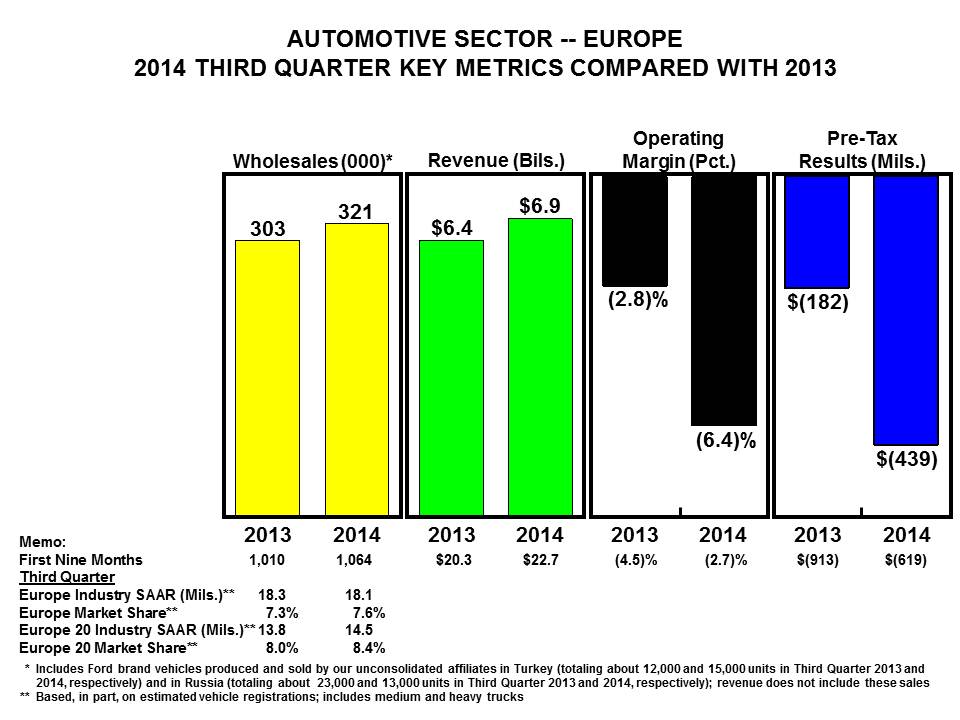
In Europe, we continue to implement our transformation plan focused on product, brand, and cost.
Europe’s wholesale volume and revenue improved from a year ago by 6% and 7%, respectively. The higher volume reflects a 700,000 unit increase in Europe 20 SAAR, to 14.5 million units, higher market share, and lower dealer stock reductions than a year ago. Lower volumes in Russia and Turkey were a partial offset.
The focus of our transformation plan on improved product and brand led to great progress in the third quarter. Our Europe 20 market share improved by four tenths of a percentage point to 8.4%, driven by a half percentage point improvement in our retail passenger share of the five major European markets, to 8.8%, including the effect of our expanded SUV line-up; and a 2 percentage point improvement in our commercial vehicle share, to 13%, reflecting the success of our full line of new Transit vehicles and continued strong performance of the Ranger compact pick-up.
The increase in Europe’s revenue is explained by the higher volume in the Europe 20 markets. Europe’s operating margin was negative 6.4%, down 3.6 percentage points from a year ago, and pre-tax loss was $439 million, a $257 million decline.
As shown in the memo below the chart, all first nine month metrics improved from a year ago.
48
Item 2. Management’s Discussion and Analysis of Financial Condition and Results of Operations (Continued)
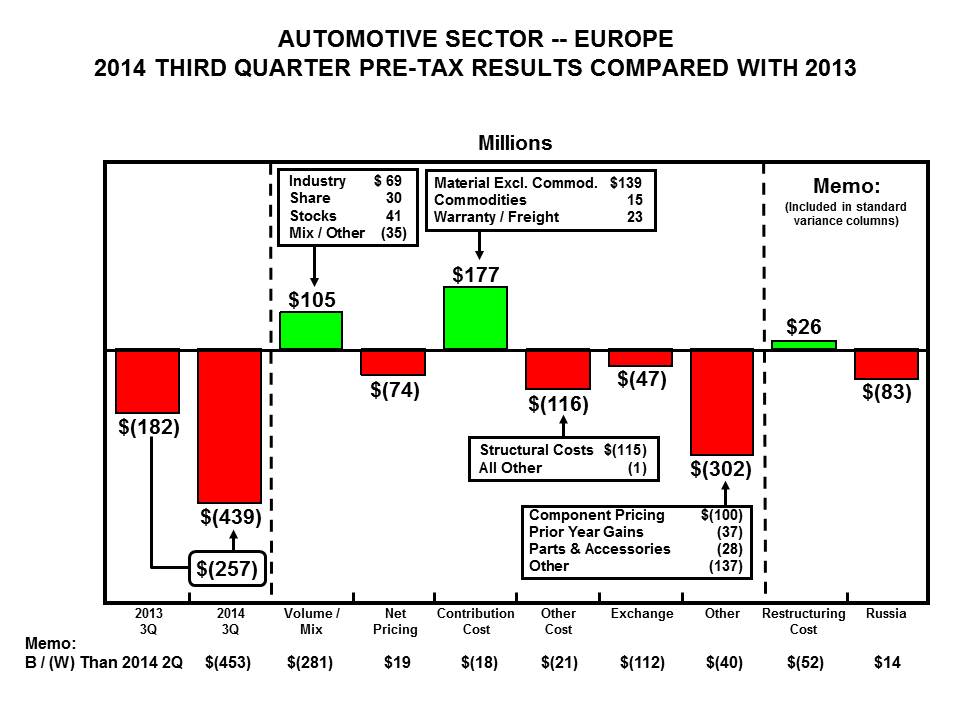
The decline in Europe’s pre-tax profit is more than explained by Russia, balance sheet exchange effects, and other factors including lower component pricing and non-recurrence of prior year gains.
As shown in the memo below the chart, pre-tax results were lower than the second quarter. This was more than explained by lower volume due to Europe’s seasonal plant shutdowns for summer holidays, unfavorable exchange, and higher costs including the non-recurrence of a restructuring-related reserve release last quarter.
For the full year, we continue to expect a loss of about $1.2 billion, an improvement compared with 2013.
49
Item 2. Management’s Discussion and Analysis of Financial Condition and Results of Operations (Continued)
Middle East & Africa Segment.
The following chart details third quarter key metrics.
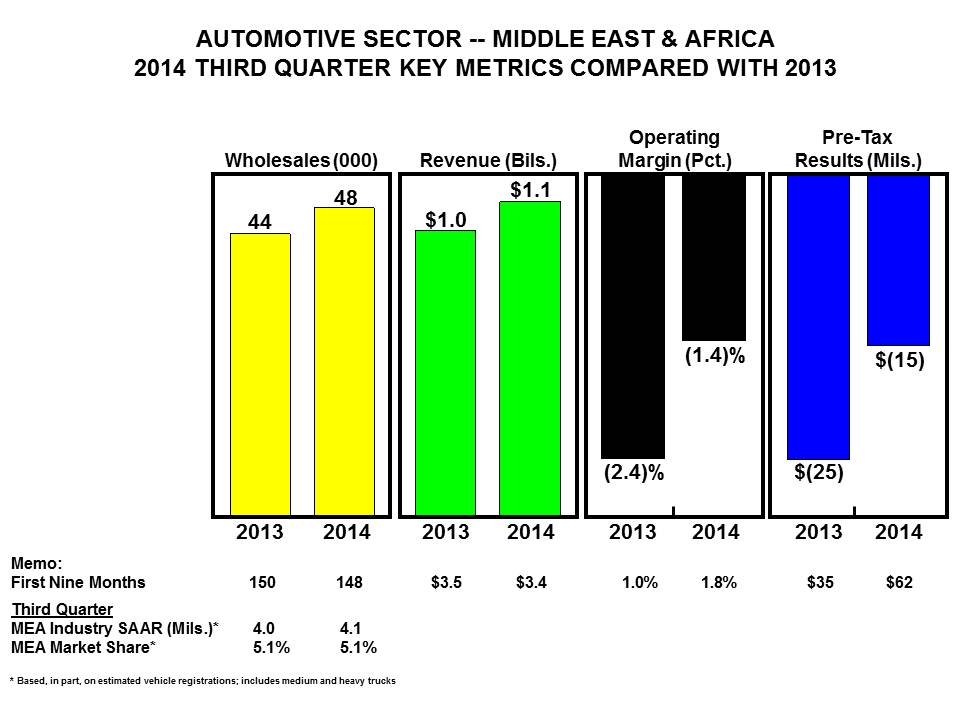
The Middle East & Africa segment was created to facilitate better customer service and further expand Ford’s presence in this fast-growing region.
In the third quarter, wholesale volume and revenue improved from a year ago by 9% and 5%, respectively. Operating margin was negative 1.4%, one percentage point better than a year ago, and pre-tax loss was $15 million, $10 million better.
As shown in the memo below the chart, first nine months wholesale volume and revenue deteriorated slightly compared with a year ago, while operating margin and profit both improved.
For the full year, we continue to expect Middle East & Africa results to be about breakeven.
50
Item 2. Management’s Discussion and Analysis of Financial Condition and Results of Operations (Continued)
Asia Pacific Segment.
The following charts detail third quarter key metrics and the change in third quarter 2014 pre-tax results compared with the third quarter of 2013 by causal factor.
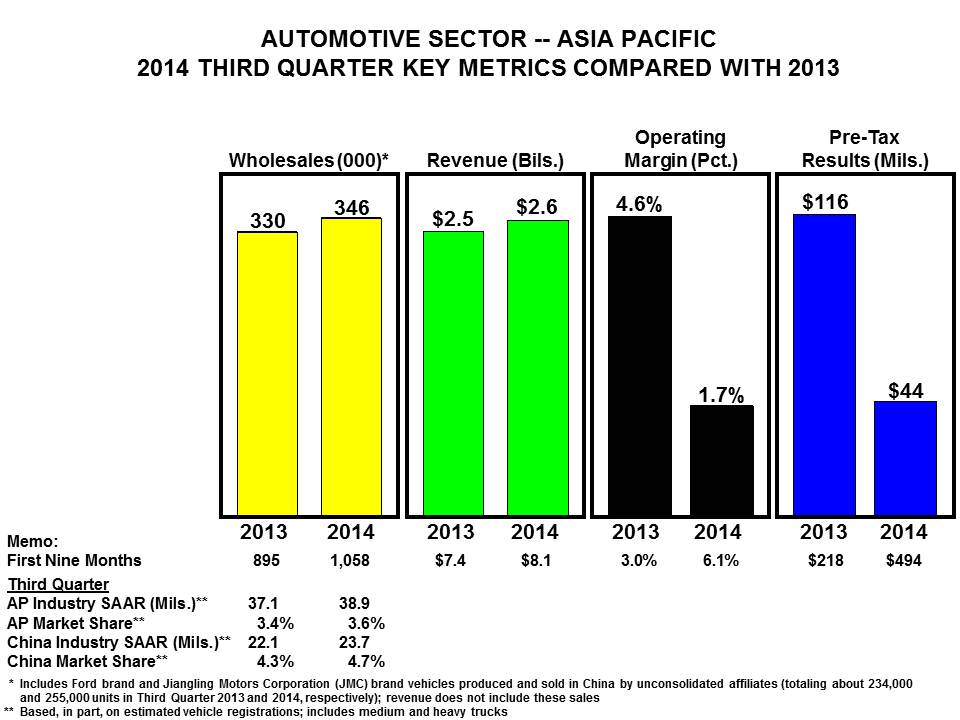
Our strategy in Asia Pacific continues to be to invest for growth through both new and expanded plants, new products, and the introduction of Lincoln in China.
Third quarter wholesale volume was up 5% compared with a year ago, and net revenue—which excludes our China joint ventures—grew 3%. Our China wholesale volume, not shown, was up 10% in the quarter. The higher volume in the region is more than explained by higher market share and industry volume. We estimate third quarter SAAR for the region at 38.9 million units, up 1.8 million units from a year ago, explained primarily by China.
Our market share, at 3.6%, was a record for the third quarter and was two-tenths of a percentage point higher than a year ago. This was driven by China, where our market share improved four-tenths of a percentage point to a record 4.7%, reflecting continued strong sales across our vehicle line-up.
Asia Pacific’s higher revenue is more than explained by favorable mix. Operating margin was 1.7%, down 2.9 percentage points from a year ago, and pre-tax profit was $44 million, down $72 million.
As shown in the memo below the chart, all first nine month metrics improved from a year earlier.
51
Item 2. Management’s Discussion and Analysis of Financial Condition and Results of Operations (Continued)
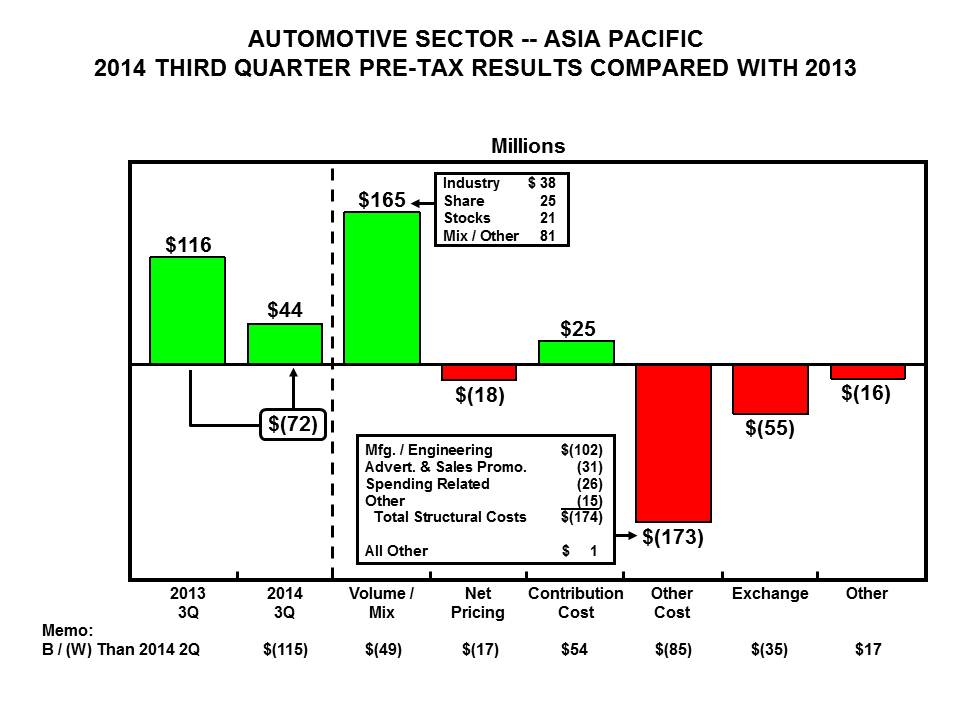
Third quarter 2014 pre-tax profits in Asia Pacific declined from a year ago, more than explained by higher structural costs and unfavorable exchange; favorable market factors were a partial offset. The higher structural costs reflect our continued investment in products and growth, including five new plants that will come on line over the next nine months—as well as the launch of Lincoln.
As shown in the memo, Asia Pacific pre-tax results declined from the second quarter, with most factors unfavorable.
For the full year, we continue to expect Asia Pacific to earn a pre-tax profit of about $700 million, which is higher than a year ago.
52
Item 2. Management’s Discussion and Analysis of Financial Condition and Results of Operations (Continued)
FINANCIAL SERVICES SECTOR
As shown in the total Company discussion above, we present our Financial Services sector results in two segments, Ford Credit and Other Financial Services. Ford Credit, in turn, has two operations, North America and International.
In general, we measure period-to-period changes in Ford Credit’s pre-tax results using the causal factors listed below:
|
•
|
Volume:
|
|
◦
|
Volume primarily measures changes in net financing margin driven by changes in average finance receivables and net investment in operating leases at prior period financing margin yield (defined below in financing margin).
|
|
◦
|
Volume changes are primarily driven by the volume of new and used vehicle sales and leases, the extent to which Ford Credit purchases retail installment sale and lease contracts, the extent to which Ford Credit provides wholesale financing, the sales price of the vehicles financed, the level of dealer inventories, Ford-sponsored special financing programs available exclusively through Ford Credit, and the availability of cost-effective funding for the purchase of retail installment sale and lease contracts and to provide wholesale financing.
|
•
Financing Margin:
|
◦
|
Financing margin variance is the period-to-period change in financing margin yield multiplied by the present period average receivables. Financing margin yield equals revenue, less interest expense and scheduled depreciation for the period, divided by average receivables for the same period.
|
|
◦
|
Financing margin changes are driven by changes in revenue and interest expense. Changes in revenue are primarily driven by the level of market interest rates, cost assumptions in pricing, mix of business, and competitive environment. Changes in interest expense are primarily driven by the level of market interest rates, borrowing spreads, and asset-liability management.
|
|
•
|
Credit Loss:
|
|
◦
|
Credit loss measures changes in the provision for credit losses. For analysis purposes, management splits the provision for credit losses primarily into net charge-offs and the change in the allowance for credit losses.
|
|
◦
|
Net charge-off changes are primarily driven by the number of repossessions, severity per repossession, and recoveries. Changes in the allowance for credit losses are primarily driven by changes in historical trends in credit losses and recoveries, changes in the composition and size of Ford Credit’s present portfolio, changes in trends in historical used vehicle values, and changes in economic conditions. For additional information on the allowance for credit losses, refer to the “Critical Accounting Estimates
-
Allowance for Credit Losses” section of Item 7 of Part II of our 2013 Form 10-K Report.
|
|
•
|
Lease Residual:
|
|
◦
|
Lease residual measures changes to residual performance. For analysis purposes, management splits residual performance primarily into residual gains and losses, and the change in accumulated supplemental depreciation.
|
|
◦
|
Residual gain and loss changes are primarily driven by the number of vehicles returned to Ford Credit and sold, and the difference between the auction value and the depreciated value of the vehicles sold. Changes in accumulated supplemental depreciation are primarily driven by changes in Ford Credit’s estimate of the number of vehicles that will be returned to it and sold, and changes in the estimate of the expected auction value at the end of the lease term. For additional information on accumulated supplemental depreciation, refer to the “Critical Accounting Estimates
-
Accumulated Depreciation on Vehicles Subject to Operating Leases” section of Item 7 of Part II of our 2013 Form 10-K Report.
|
|
•
|
Other:
|
|
◦
|
Primarily includes operating expenses, other revenue, and insurance expenses.
|
|
◦
|
Changes in operating expenses are primarily driven by salaried personnel costs, facilities costs, and costs associated with the origination and servicing of customer contracts.
|
|
◦
|
In general, other revenue changes are primarily driven by changes in earnings related to market valuation adjustments to derivatives (primarily related to movements in interest rates) and other miscellaneous items.
|
53
Item 2. Management’s Discussion and Analysis of Financial Condition and Results of Operations (Continued)
Ford Credit.
The chart below details the change in third quarter of 2014 pre-tax results compared with the third quarter of 2013 by causal factor.
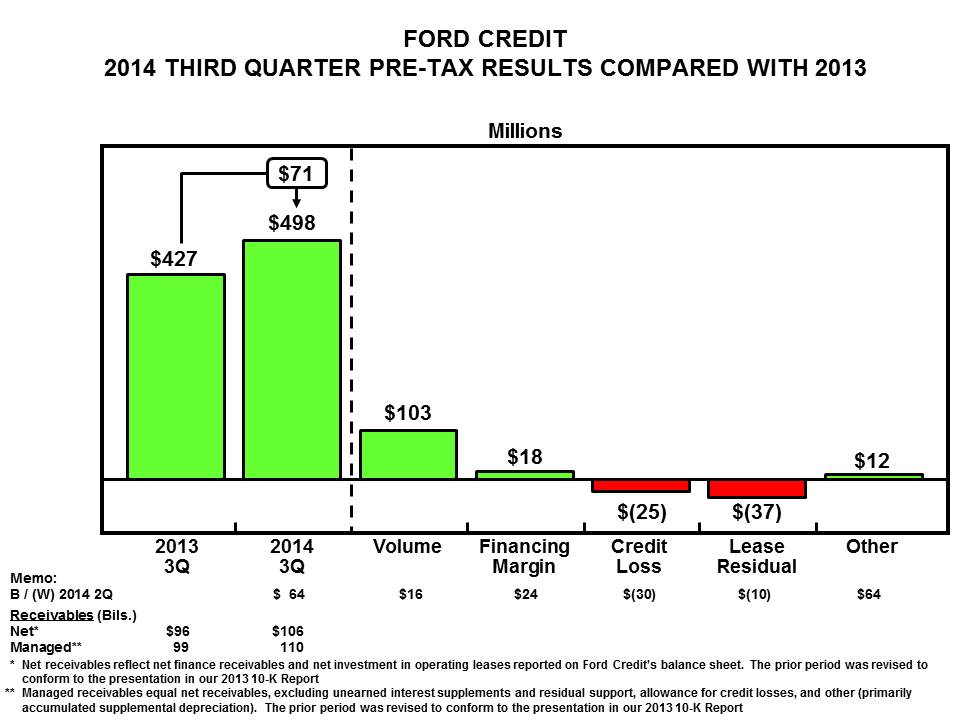
Ford Credit is an integral part of our global growth and value creation strategy. Ford Credit provides world-class dealer and customer financial services, supported by a strong balance sheet, providing solid profits and distributions to Ford.
The higher pre-tax profit for the third quarter of 2014 compared with a year ago is more than explained by higher volume. This reflects increases in nearly all financing products, including non-consumer and consumer finance receivables globally
,
as well as leasing in North America.
As shown in the memo, pre-tax profit was higher than the second quarter, explained primarily by a lower level of insurance losses in North America, included in other in the chart above
.
For the full year, we continue to expect Ford Credit’s pre-tax profit to be $1.8 billion to $1.9 billion, year-end managed receivables of $112 billion to $115 billion, and managed leverage in the range of 8:1 to 9:1. We now expect Ford Credit’s distributions to its parent to be about $400 million, up from our prior guidance of about $250 million. This increase is primarily driven by higher net income at Ford Credit.
54
Item 2. Management’s Discussion and Analysis of Financial Condition and Results of Operations (Continued)
Ford Credit’s receivables, including finance receivables and operating leases, were as follows (in billions):
|
|
September 30,
2014
|
December 31,
2013
|
|||||
|
Net Receivables
|
|
|
|||||
|
Finance receivables - North America
|
|
|
|||||
|
Consumer - Retail financing
|
$
|
43.5
|
|
$
|
40.9
|
|
|
|
Non-Consumer
|
|
|
|
|
|||
|
Dealer financing (a)
|
21.5
|
|
22.1
|
|
|||
|
Other
|
0.9
|
|
1.0
|
|
|||
|
Total finance receivables - North America (b)
|
65.9
|
|
64.0
|
|
|||
|
Finance receivables - International
|
|||||||
|
Consumer - Retail financing
|
11.8
|
|
10.8
|
|
|||
|
Non-Consumer
|
|||||||
|
Dealer financing (a)
|
9.3
|
|
8.3
|
|
|||
|
Other
|
0.3
|
|
0.4
|
|
|||
|
Total finance receivables - International (b)
|
21.4
|
|
19.5
|
|
|||
|
Unearned interest supplements
|
(1.7
|
)
|
(1.5
|
)
|
|||
|
Allowance for credit losses
|
(0.4
|
)
|
(0.4
|
)
|
|||
|
Finance receivables, net
|
85.2
|
|
81.6
|
|
|||
|
Net investment in operating leases (b)
|
20.9
|
|
18.3
|
|
|||
|
Total net receivables
|
$
|
106.1
|
|
$
|
99.9
|
|
|
|
|
|
|
|
||||
|
Managed Receivables
|
|||||||
|
Total net receivables
|
$
|
106.1
|
|
$
|
99.9
|
|
|
|
Unearned interest supplements and residual support
|
3.8
|
|
3.1
|
|
|||
|
Allowance for credit losses
|
0.4
|
|
0.4
|
|
|||
|
Other, primarily accumulated supplemental depreciation
|
0.1
|
|
—
|
|
|||
|
Total managed receivables
|
$
|
110.4
|
|
$
|
103.4
|
|
|
__________
|
(a)
|
Dealer financing primarily includes wholesale loans to dealers to finance the purchase of vehicle inventory.
|
|
(b)
|
At September 30, 2014 and December 31, 2013, includes consumer receivables before allowance for credit losses of $24 billion and
|
$27.7 billion, respectively, and non-consumer receivables before allowance for credit losses of $21.1 billion and $23.9 billion, respectively, that have been sold for legal purposes in securitization transactions but continue to be reported in Ford Credit’s consolidated financial statements. In addition, at September 30, 2014 and December 31, 2013, includes net investment in operating leases before allowance for credit losses of $9.9 billion and $8.1 billion, respectively, that have been included in securitization transactions but continue to be reported in Ford Credit’s consolidated financial statements. The receivables and net investment in operating leases are available only for payment of the debt issued by, and other obligations of, the securitization entities that are parties to those securitization transactions; they are not available to pay Ford Credit’s other obligations or the claims of its other creditors. Ford Credit holds the right to receive the excess cash flows not needed to pay the debt issued by, and other obligations of, the securitization entities that are parties to those securitization transactions.
Managed receivables at September 30, 2014 increased from year-end 2013, primarily driven by increases in consumer finance receivables globally and leasing in North America
.
55
Item 2. Management’s Discussion and Analysis of Financial Condition and Results of Operations (Continued)
Credit Losses.
The charts below detail (i) quarterly trends of charge-offs (credit losses, net of recoveries), (ii) loss-to-receivables (“LTR”) ratios (charge-offs on an annualized basis divided by average end-of-period (“EOP”) managed receivables), (iii) credit loss reserve, and (iv) Ford Credit’s credit loss reserve as a percentage of EOP managed receivables:
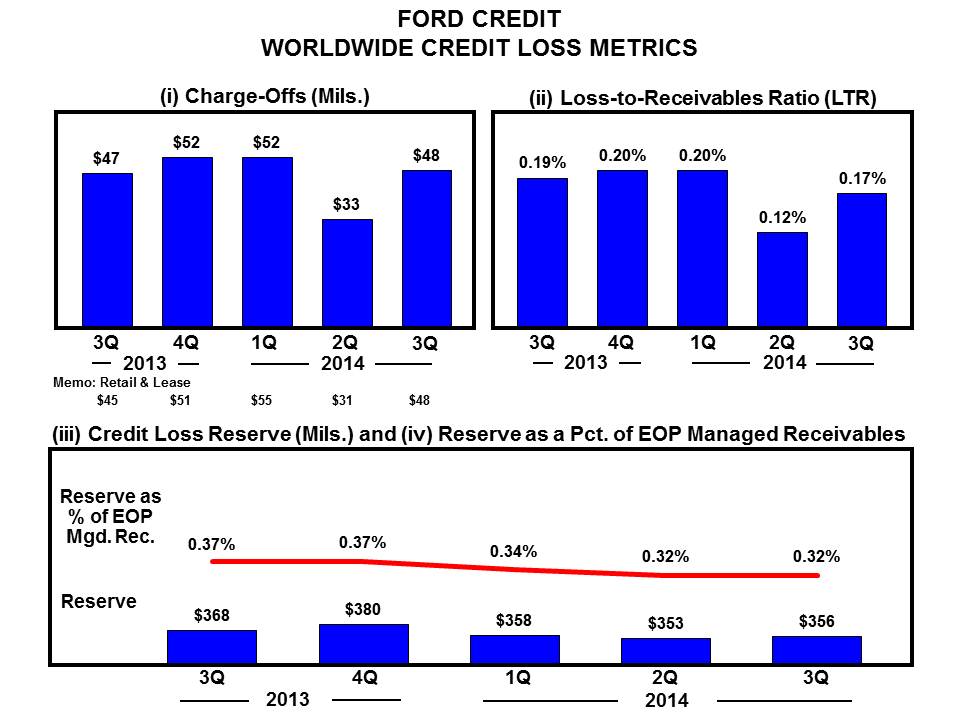
Year-over-year charge-offs were consistent, while the LTR ratio was two basis points lower than a year ago.
Ford Credit’s quarter-over-quarter increases in charge-offs of $15 million and the LTR ratio of five basis points are consistent with normal seasonality. The LTR ratio of 17 basis points is well below Ford Credit’s 10-year average of 54 basis points.
The credit loss reserve was $356 million, down $12 million from a year ago, reflecting the continuation of low losses.
For additional information, see the “Critical Accounting Estimates - Allowance for Credit Losses” section of Item 7 of Part II of our 2013 Form 10-K Report.
Residual Risk.
Ford Credit is exposed to residual risk on operating leases and similar balloon payment products where the customer may return the financed vehicle to Ford Credit. Residual risk is the possibility that the amount Ford Credit obtains from returned vehicles will be less than its estimate of the expected residual value for the vehicle. Ford Credit estimates the expected residual value by evaluating recent auction values, return volumes for its leased vehicles, industrywide used vehicle prices, marketing incentive plans, and vehicle quality data. Changes in expected residual values impact the depreciation expense, which is recognized on a straight-line basis over the life of the lease. For additional information, see the “Critical Accounting Estimates - Accumulated Depreciation on Vehicles Subject to Operating Leases” section of Item 7 of Part II of our 2013 Form 10-K Report.
56
Item 2. Management’s Discussion and Analysis of Financial Condition and Results of Operations (Continued)
U.S. Ford and Lincoln Brand Operating Lease Experience.
The following charts show return volumes and auction values at constant third quarter 2014 vehicle mix for vehicles returned in the respective periods. The U.S. operating lease portfolio accounted for about 87% of Ford Credit’s total net investment in operating leases at September 30, 2014.
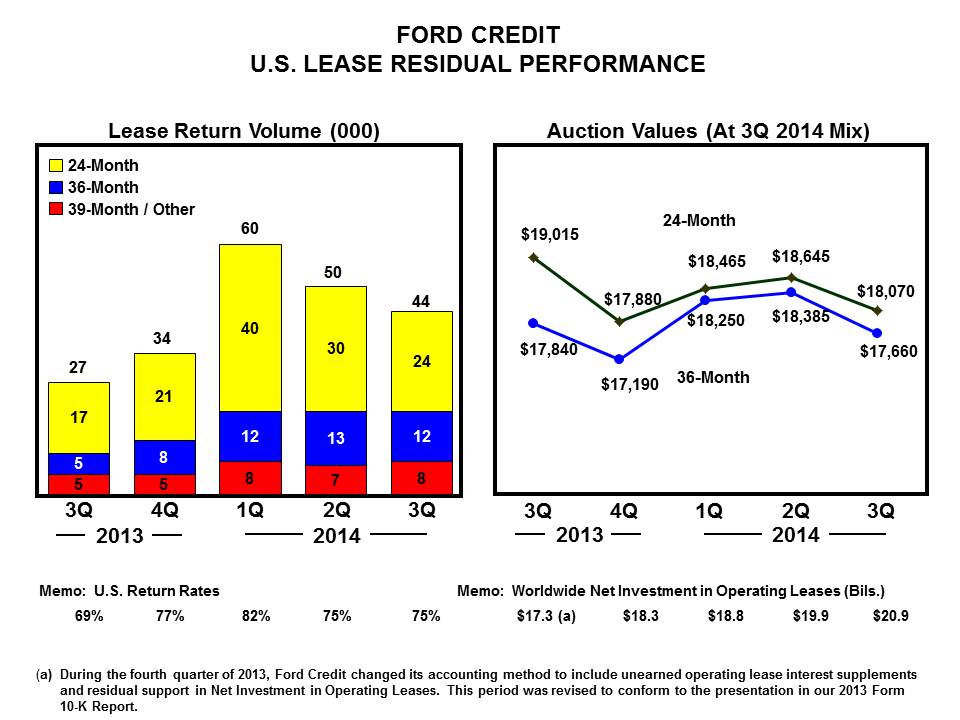
Lease return volumes in the third quarter of 2014 were 17,000 units higher than the same period last year, primarily reflecting higher lease placements in 2011 and 2012 compared with prior years. The third quarter lease return rate was 75%, up six percentage points compared with the same period last year
.
In the third quarter of 2014, Ford Credit’s auction values for 24-month contracts decreased by about $950 while 36-month average auction values decreased by about $200 compared to the same period last year
.
The differences in Ford Credit’s 24-month and 36-month auction value performance primarily reflect differences in mix and model-year refresh timing. Both Ford Credit’s 24-month and 36-month auction values decreased from the second quarter of 2014
.
The declines in its third quarter auction values were consistent with Manheim (a proxy for industrywide used vehicle prices) when adjusted to Ford Credit’s mix of vehicles, with reductions particularly pronounced in later-model used vehicles, which are typical of Ford Credit’s repossessions. Ford Credit expects its auction values to decline further in the fourth quarter, consistent with normal seasonality.
Ford Credit’s worldwide net investment in operating leases was $20.9 billion at the end of the third quarter of 2014, up about $2.6 billion from year-end 2013, and up $3.6 billion from a year ago.
57
Item 2. Management’s Discussion and Analysis of Financial Condition and Results of Operations (Continued)
LIQUIDITY AND CAPITAL RESOURCES
Automotive Sector
Our Automotive liquidity strategy includes ensuring that we have sufficient liquidity available with a high degree of certainty throughout the business cycle by generating cash from operations and maintaining access to other sources of funding. We target to have an average ongoing Automotive gross cash balance of about $20 billion. We expect to have periods when we will be above or below this amount due to (i) future cash flow expectations such as for pension contributions, debt maturities, capital investments, or restructuring requirements, (ii) short-term timing differences, and (iii) changes in the global economic environment. In addition, we also target to maintain a revolving credit facility for our Automotive business of up to about $10 billion to protect against exogenous shocks. Our revolving credit facility is discussed below.
We assess the appropriate long-term target for total Automotive liquidity, comprised of Automotive gross cash and the revolving credit facility, to be about $30 billion, which is an amount we believe is sufficient to support our business priorities and to protect our business. Our Automotive gross cash and Automotive liquidity targets could be reduced over time based on improved operating performance and changes in our risk profile.
For a discussion of risks to our liquidity, see “Item 1A. Risk Factors” in our 2013 Form 10-K Report, as well as Note 20 of the Notes to the Financial Statements, regarding commitments and contingencies that could impact our liquidity.
Our key liquidity metrics are Automotive gross cash, Automotive liquidity, and operating-related cash flow (which best represents the ability of our Automotive operations to generate cash).
Automotive gross cash includes cash and cash equivalents and marketable securities, net of any securities-in-transit. Automotive gross cash is detailed below as of the dates shown (in billions):
|
|
September 30,
2014
|
December 31,
2013
|
September 30,
2013
|
||||||||
|
Cash and cash equivalents
|
$
|
6.0
|
|
$
|
5.0
|
|
$
|
5.7
|
|
||
|
Marketable securities
|
16.9
|
|
20.1
|
|
20.4
|
|
|||||
|
Total cash and marketable securities
|
22.9
|
|
25.1
|
|
26.1
|
|
|||||
|
Securities-in-transit (a)
|
(0.1
|
)
|
(0.3
|
)
|
—
|
|
|||||
|
Automotive gross cash
|
$
|
22.8
|
|
$
|
24.8
|
|
$
|
26.1
|
|
||
__________
|
(a)
|
The purchase or sale of marketable securities for which the cash settlement was not made by period-end and a payable or receivable was recorded on the balance sheet.
|
Our cash, cash equivalents, and marketable securities are held primarily in highly liquid investments, which provide for anticipated and unanticipated cash needs. Our cash, cash equivalents, and marketable securities primarily include U.S. Department of Treasury obligations, federal agency securities, bank time deposits with investment-grade institutions, corporate investment-grade securities, commercial paper rated A-1/P-1 or higher, and debt obligations of a select group of non-U.S. governments, non-U.S. governmental agencies, and supranational institutions. The average maturity of these investments ranges from about 90 days to up to about one year, and is adjusted based on market conditions and liquidity needs. We monitor our cash levels and average maturity on a daily basis. Of our total Automotive gross cash at September 30, 2014, 87% was held by consolidated entities domiciled in the United States.
In managing our business, we classify changes in Automotive gross cash into operating-related and other items (which includes the impact of certain special items, contributions to funded pension plans, certain tax-related transactions, acquisitions and divestitures, capital transactions with the Financial Services sector, dividends paid to shareholders, and other—primarily financing-related). Automotive gross cash and liquidity as of the dates shown were as follows (in billions):
|
September 30,
2014
|
December 31, 2013
|
September 30,
2013
|
|||||||||
|
Automotive gross cash
|
$
|
22.8
|
|
$
|
24.8
|
|
$
|
26.1
|
|
||
|
Available credit lines
|
|
|
|
|
|||||||
|
Revolving credit facility, unutilized portion
|
10.1
|
|
10.7
|
|
10.7
|
|
|||||
|
Local lines available to foreign affiliates, unutilized portion
|
0.7
|
|
0.7
|
|
0.7
|
|
|||||
|
Automotive liquidity
|
$
|
33.6
|
|
$
|
36.2
|
|
$
|
37.5
|
|
||
58
Item 2. Management’s Discussion and Analysis of Financial Condition and Results of Operations (Continued)
We believe the cash flow analysis reflected in the table below is useful to investors because it includes in operating-related cash flow elements that we consider to be related to our Automotive operating activities (e.g., capital spending) and excludes cash flow elements that we do not consider to be related to the ability of our operations to generate cash. This differs from a cash flow statement prepared in accordance with GAAP and differs from
Net
cash provided by/(used in) operating activities
, the most directly comparable GAAP financial measure.
Changes in Automotive gross cash are summarized below (in billions):
|
Third Quarter
|
First Nine Months
|
||||||||||||||
|
|
2014
|
2013
|
2014
|
2013
|
|||||||||||
|
Automotive gross cash at end of period
|
$
|
22.8
|
|
$
|
26.1
|
|
$
|
22.8
|
|
$
|
26.1
|
|
|||
|
Automotive gross cash at beginning of period
|
25.8
|
|
25.7
|
|
24.8
|
|
24.3
|
|
|||||||
|
Change in Automotive gross cash
|
$
|
(3.0
|
)
|
$
|
0.4
|
|
$
|
(2.0
|
)
|
$
|
1.8
|
|
|||
|
Automotive income before income taxes (excluding special items)
|
$
|
0.7
|
|
$
|
2.3
|
|
$
|
3.8
|
|
$
|
6.0
|
|
|||
|
Capital spending
|
(1.8
|
)
|
(1.5
|
)
|
(5.2
|
)
|
(4.6
|
)
|
|||||||
|
Depreciation and tooling amortization
|
1.1
|
|
1.0
|
|
3.1
|
|
3.1
|
|
|||||||
|
Changes in working capital (a)
|
(1.5
|
)
|
(0.5
|
)
|
(0.5
|
)
|
0.4
|
|
|||||||
|
Other/Timing differences (b)
|
0.8
|
|
0.3
|
|
1.9
|
|
0.7
|
|
|||||||
|
Automotive operating-related cash flows
|
(0.7
|
)
|
1.6
|
|
3.1
|
|
5.6
|
|
|||||||
|
Separation payments
|
—
|
|
(0.1
|
)
|
(0.1
|
)
|
(0.2
|
)
|
|||||||
|
Net receipts from Financial Services sector (c)
|
0.2
|
|
—
|
|
0.4
|
|
0.3
|
|
|||||||
|
Other
|
(0.3
|
)
|
0.5
|
|
(0.2
|
)
|
0.5
|
|
|||||||
|
Cash flow before other actions
|
(0.8
|
)
|
2.0
|
|
3.2
|
|
6.2
|
|
|||||||
|
Changes in debt
|
(0.3
|
)
|
(0.1
|
)
|
(0.7
|
)
|
0.8
|
|
|||||||
|
Funded pension contributions
|
(0.3
|
)
|
(1.1
|
)
|
(1.1
|
)
|
(3.9
|
)
|
|||||||
|
Dividends/Other items (d)
|
(1.6
|
)
|
(0.4
|
)
|
(3.4
|
)
|
(1.3
|
)
|
|||||||
|
Change in Automotive gross cash
|
$
|
(3.0
|
)
|
$
|
0.4
|
|
$
|
(2.0
|
)
|
$
|
1.8
|
|
|||
_________
|
(a)
|
Working capital comprised of changes in receivables, inventory, and trade payables.
|
|
(b)
|
Primarily expense and payment timing differences for items such as pension and OPEB, compensation, marketing, warranty, and timing differences between unconsolidated affiliate profits and dividends received. Also includes other factors, such as the impact of tax payments and vehicle financing activities between Automotive and FSG sectors.
|
|
(c)
|
Primarily distributions from Ford Holdings (Ford Credit’s parent) and tax payments received from Ford Credit.
|
|
(d)
|
In the third quarter of 2014, we used about $1.1 billion in cash to settle repurchases of 63.4 million shares of Ford Common Stock.
|
With respect to “Changes in working capital,” in general we carry relatively low Automotive sector trade receivables compared with our trade payables because the majority of our Automotive wholesales are financed (primarily by Ford Credit) immediately upon sale of vehicles to dealers, which generally occurs at the time the vehicles are gate-released shortly after being produced. In addition, our inventories are lean because we build to order, not for inventory. In contrast, our Automotive trade payables are based primarily on industry-standard production supplier payment terms generally ranging between 30 days to 45 days. As a result, our cash flow tends to improve as wholesale volumes increase, but can deteriorate significantly when wholesale volumes drop sharply. In addition, these working capital balances generally are subject to seasonal changes that can impact cash flow. For example, we typically experience cash flow timing differences associated with inventories and payables due to our annual summer and December shutdown periods, when production, and therefore inventories and wholesale volumes, are usually at their lowest levels, while payables continue to come due and be paid. The net impact of this typically results in cash outflows from changes in our working capital balances during these shutdown periods. In the third quarter of 2014, the unfavorable changes in working capital include the effects of the five weeks of downtime in the quarter at the Dearborn Truck Plant as we transition to the new F-150, as well as supplier parts shortages. As previously mentioned, the parts shortage issues that affected us in the third quarter have now been resolved.
59
Item 2. Management’s Discussion and Analysis of Financial Condition and Results of Operations (Continued)
Shown below is a reconciliation between financial statement
Net cash provided by/(used in) operating activities
and operating-related cash flows (calculated as shown in the table above), as of the dates shown (in billions):
|
Memo:
|
|||||||||||||||||||
|
Third Quarter
|
First Nine Months
|
Full Year
|
|||||||||||||||||
|
|
2014
|
2013
|
2014
|
2013
|
2013
|
||||||||||||||
|
Net cash provided by/(used in) operating activities
|
$
|
0.6
|
|
$
|
2.0
|
|
$
|
6.7
|
|
$
|
6.4
|
|
$
|
7.7
|
|
||||
|
Items included in operating-related cash flows
|
|
|
|
|
|
|
|
|
|||||||||||
|
Capital spending
|
(1.8
|
)
|
(1.5
|
)
|
(5.2
|
)
|
(4.6
|
)
|
(6.6
|
)
|
|||||||||
|
Proceeds from the exercise of stock options
|
0.1
|
|
0.1
|
|
0.2
|
|
0.3
|
|
0.3
|
|
|||||||||
|
Net cash flows from non-designated derivatives
|
—
|
|
(0.1
|
)
|
0.1
|
|
(0.3
|
)
|
(0.3
|
)
|
|||||||||
|
Items not included in operating-related cash flows
|
|
|
|
|
|
|
|
|
|
|
|||||||||
|
Separation payments
|
—
|
|
0.1
|
|
0.1
|
|
0.2
|
|
0.3
|
|
|||||||||
|
Funded pension contributions
|
0.3
|
|
1.1
|
|
1.1
|
|
3.9
|
|
5.0
|
|
|||||||||
|
Tax refunds, tax payments, and tax receipts from affiliates
|
—
|
|
—
|
|
(0.2
|
)
|
(0.3
|
)
|
(0.3
|
)
|
|||||||||
|
Other
|
0.1
|
|
(0.1
|
)
|
0.3
|
|
—
|
|
—
|
|
|||||||||
|
Operating-related cash flows
|
$
|
(0.7
|
)
|
$
|
1.6
|
|
$
|
3.1
|
|
$
|
5.6
|
|
$
|
6.1
|
|
||||
Credit Agreement
. Lenders under our Second Amended and Restated Credit Agreement dated as of April 30, 2014 (the “revolving credit facility”) have commitments to us totaling $12.2 billion, with about $9 billion maturing on April 30, 2019 and about $3 billion maturing on April 30, 2017. We have allocated $2 billion of commitments to Ford Credit on an irrevocable and exclusive basis to support its liquidity. Any borrowings by Ford Credit under the revolving credit facility would be guaranteed by us.
The revolving credit facility is unsecured and free of material adverse change conditions to borrowing, restrictive financial covenants (for example, interest or fixed charge coverage ratio, debt-to-equity ratio, and minimum net worth requirements), and credit rating triggers that could limit our ability to obtain funding. The revolving credit facility contains a liquidity covenant that requires us to maintain a minimum of $4 billion in aggregate of domestic cash, cash equivalents, and loaned and marketable securities and/or availability under the revolving credit facility. If our senior, unsecured, long-term debt does not maintain at least two investment grade ratings from Fitch, Moody’s, and S&P (each as defined under “Company” below), the guarantees of certain subsidiaries will be required.
At September 30, 2014, the utilized portion of the revolving credit facility was $58 million, representing amounts utilized as letters of credit.
U.S. Department of Energy (“DOE”) Advanced Technology Vehicle Manufacturer (“ATVM”) Incentive Program.
In September 2009, we entered into a Loan Arrangement and Reimbursement Agreement (“Arrangement Agreement”) with the DOE, under which we borrowed through multiple draws $5.9 billion to finance certain costs for fuel-efficient, advanced-technology vehicles. At September 30, 2014, an aggregate of $4.6 billion was outstanding. The principal amount of the ATVM loan bears interest at a blended rate based on the U.S. Treasury yield curve at the time each draw was made (with the weighted-average interest rate on all such draws being about 2.3% per annum).
The ATVM loan is repayable in equal quarterly installments of $148 million, which began in September 2012 and will end in June 2022.
European Investment Bank (“EIB”) Loans.
On December 21, 2009, Ford Romania, our operating subsidiary in Romania, entered into a credit facility for an aggregate amount of €400 million (equivalent to $503 million at September 30, 2014) with the EIB (the “EIB Romania Facility”), and on July 12, 2010, Ford Motor Company Limited, our operating subsidiary in the United Kingdom (“Ford of Britain”), entered into a credit facility for an aggregate amount of £450 million (equivalent to $728 million at September 30, 2014) with the EIB (the “EIB United Kingdom Facility”). The facilities were fully drawn at September 30, 2014. Loans under the EIB Romania Facility and the EIB United Kingdom facility bear interest at a fixed rate of 4.44% and 4% per annum, respectively, and mature on March 31, 2015 and September 11, 2015, respectively.
Other Automotive Credit Facilities.
At September 30, 2014, we had $852 million of local credit facilities available to non-U.S. Automotive affiliates, of which $172 million had been utilized.
60
Item 2. Management’s Discussion and Analysis of Financial Condition and Results of Operations (Continued)
Net Cash.
Our Automotive sector net cash calculation as of the dates shown was as follows (in billions):
|
September 30,
2014
|
December 31, 2013
|
||||||
|
Automotive gross cash
|
$
|
22.8
|
|
$
|
24.8
|
|
|
|
Less:
|
|
|
|
|
|||
|
Long-term debt
|
12.2
|
|
14.4
|
|
|||
|
Debt payable within one year
|
2.7
|
|
1.3
|
|
|||
|
Total debt
|
14.9
|
|
15.7
|
|
|||
|
Net cash
|
$
|
7.9
|
|
$
|
9.1
|
|
|
Total debt at September 30, 2014 was $800 million lower than December 31, 2013, primarily reflecting three quarterly installment payments on the ATVM loan which totaled about $450 million and the repayment of a $300 million U.S. Export-Import Bank loan.
On October 21, 2014, we announced that we have elected to terminate holders’ conversion rights with respect to $883 million principal amount outstanding (carrying value of about $800 million, net of discount) of our 4.25% Senior Convertible Notes due November 15, 2016, effective November 20, 2014. Until November 19, 2014, holders will have the right to convert their notes. Although we have the right to settle any conversion with shares, cash, or a combination of shares and cash, we intend to settle conversions with shares. We also announced on October 21, 2014, that any convertible notes remaining outstanding on November 21, 2014 will be redeemed on that date for cash at a redemption price of the full principal amount, plus accrued and unpaid interest. This action will reduce Automotive debt by about $800 million in the fourth quarter of 2014, with no significant impact on cash flow expected.
We expect to reduce Automotive debt levels to about $10 billion by 2018. We previously planned to achieve this by mid-decade, but because interest rates have not increased to more normal levels it became uneconomical to repurchase our outstanding debt securities, which continue to trade at significant premiums. We plan to achieve the debt reduction by 2018 by using cash from operations to make quarterly installment payments on the ATVM loan and repay the EIB loans and other debt at maturity.
Liquidity Sufficiency
. One of the four key priorities of our One Ford plan is to finance our plan and improve our balance sheet, while at the same time having resources available to grow our business. The actions described above are consistent with this priority. Based on our planning assumptions, we believe that we have sufficient liquidity and capital resources to continue to invest in new products that customers want and value, transform and grow our business, pay our debts and obligations as and when they come due, pay a sustainable dividend, and provide protection within an uncertain global economic environment.
Based on improved near-term cash flows and the identification of additional opportunities for profitable growth, the ongoing amount of capital spending to support product development, growth, restructuring, and infrastructure is expected to be at least $7.5 billion annually, and increasing to about $9 billion by 2020. Our capital spending was $6.6 billion in 2013 and $5.2 billion for the first nine months of 2014.
We will continue to work to strengthen further our balance sheet and improve our investment grade ratings; the amount of incremental capital required to do this will diminish over time as we achieve our target debt levels and fully fund and de-risk our global funded pension plans.
61
Item 2. Management’s Discussion and Analysis of Financial Condition and Results of Operations (Continued)
Financial Services Sector
Ford Credit
Funding Overview.
Ford Credit’s funding strategy remains focused on diversification, and it plans to continue accessing a variety of markets, channels, and investors.
The following chart shows the trends in the funding of Ford Credit’s managed receivables:
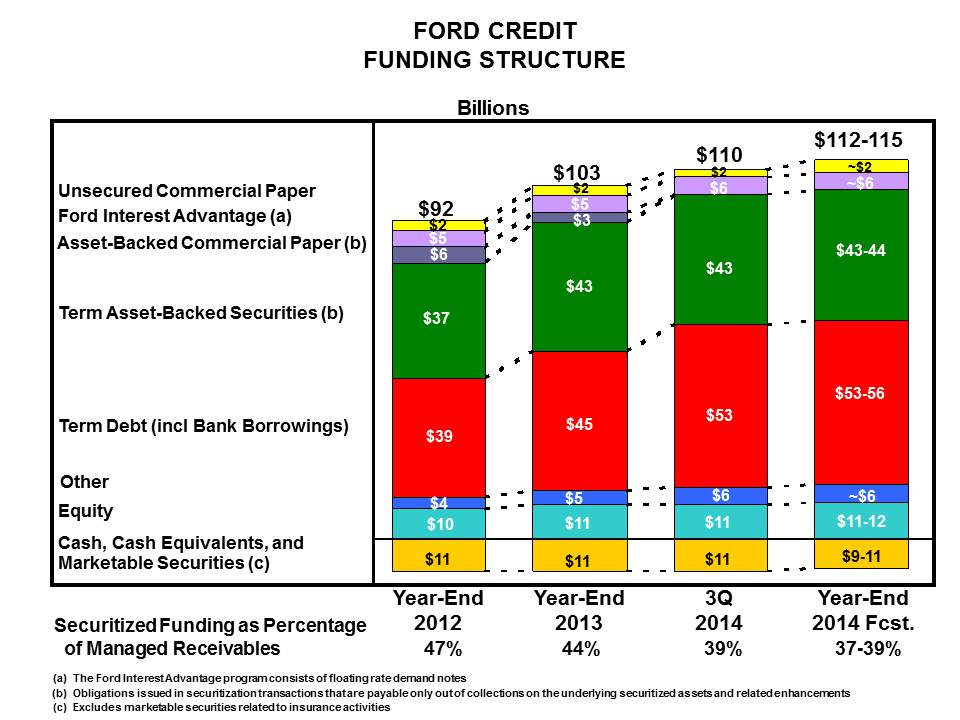
At the end of the third quarter of 2014, managed receivables were $110 billion, and Ford Credit ended the quarter with about $11 billion in cash. Securitized funding was 39% of managed receivables.
Ford Credit is projecting 2014 year-end managed receivables of $112 billion to $115 billion and securitized funding as a percentage of managed receivables in the range of 37% to 39%. This percentage will continue to decline over time.
Public Term Funding Plan.
The following table illustrates Ford Credit’s planned issuances for full-year 2014, its public term funding issuances through October 30, 2014, and its funding issuances for full-year 2013 and 2012 (in billions), excluding short-term funding programs:
|
Public Term Funding Plan
|
|||||||||||||
|
2014
|
|||||||||||||
|
Full-Year
Forecast
|
Through
October 30
|
Full-Year
2013
|
Full-Year
2012
|
||||||||||
|
Unsecured
|
$ 11-14
|
$
|
11
|
|
$
|
11
|
|
$
|
9
|
|
|||
|
Securitizations (a)
|
14-15
|
13
|
|
14
|
|
14
|
|
||||||
|
Total
|
$ 26-29
|
$
|
24
|
|
$
|
25
|
|
$
|
23
|
|
|||
|
(a)
|
Includes Rule 144A offerings.
|
62
Item 2. Management’s Discussion and Analysis of Financial Condition and Results of Operations (Continued)
Through October 30, 2014, Ford Credit completed $24 billion of public term funding in the United States, Canada, Europe, Brazil, Mexico, and China, including about $11 billion of unsecured debt and $13 billion of securitizations.
For 2014, Ford Credit projects full-year public term funding in the range of $26 billion to $29 billion, consisting of $11
billion to $14
billion of unsecured debt and $14 billion to $15 billion of public securitizations.
Liquidity.
The following table illustrates Ford Credit’s liquidity programs and utilization (in billions):
|
September 30,
2014
|
December 31, 2013
|
||||||
|
Liquidity Sources
|
|||||||
|
Cash (a)
|
$
|
10.6
|
|
$
|
10.8
|
|
|
|
Committed ABS lines (b)
|
33.0
|
|
29.4
|
|
|||
|
FCAR bank lines
|
—
|
|
3.5
|
|
|||
|
FCE/Other unsecured credit facilities
|
1.9
|
|
1.6
|
|
|||
|
Ford revolving credit facility allocation
|
2.0
|
|
—
|
|
|||
|
Total liquidity sources
|
$
|
47.5
|
|
$
|
45.3
|
|
|
|
Utilization of Liquidity
|
|||||||
|
Securitization cash (c)
|
$
|
(2.4
|
)
|
$
|
(4.4
|
)
|
|
|
Committed ABS lines
|
(15.7
|
)
|
(14.7
|
)
|
|||
|
FCAR bank lines
|
—
|
|
(3.3
|
)
|
|||
|
FCE/Other unsecured credit facilities
|
(0.7
|
)
|
(0.4
|
)
|
|||
|
Ford revolving credit facility allocation
|
—
|
|
—
|
|
|||
|
Total utilization of liquidity
|
(18.8
|
)
|
(22.8
|
)
|
|||
|
Gross liquidity
|
28.7
|
|
22.5
|
|
|||
|
Adjustments (d)
|
(1.7
|
)
|
(1.1
|
)
|
|||
|
Net liquidity available for use
|
$
|
27.0
|
|
$
|
21.4
|
|
|
__________
|
(a)
|
Cash, cash equivalents, and marketable securities (excludes marketable securities related to insurance activities).
|
|
(b)
|
Committed ABS lines are subject to availability of sufficient assets and ability to obtain derivatives to manage interest rate risk.
|
|
(c)
|
Used only to support on-balance sheet securitization transactions.
|
|
(d)
|
Adjustments include other committed ABS lines in excess of eligible receivables and certain cash within FordREV available through future sales of receivables.
|
At September 30, 2014, Ford Credit had $47.5 billion of committed capacity and cash diversified across a variety of markets and platforms. The utilization of its liquidity totaled $18.8 billion at quarter end, compared with $22.8 billion at year-end 2013. The decrease of $4 billion reflects lower securitization cash and the termination of the FCAR program.
Ford Credit ended the quarter with gross liquidity of $28.7 billion. Adjustments of $1.7 billion included other committed ABS lines in excess of eligible receivables and certain cash within FordREV available through future sales of receivables. Total liquidity available for use continues to remain strong at $27 billion at quarter end, $5.6 billion higher than year-end 2013. Ford Credit is focused on maintaining liquidity levels that meet its business and funding requirements through economic cycles.
Cash, Cash Equivalents, and Marketable Securities.
At September 30, 2014, Ford Credit’s cash, cash equivalents, and marketable securities (excluding marketable securities related to insurance activities) totaled $10.6 billion, compared with $10.8 billion at year-end 2013. In the normal course of its funding activities, Ford Credit may generate more proceeds than are required for its immediate funding needs. These excess amounts are maintained primarily as highly liquid investments, which provide liquidity for its short-term funding needs and give it flexibility in the use of its other funding programs. Ford Credit’s cash, cash equivalents, and marketable securities are held primarily in highly liquid investments, which provide for anticipated and unanticipated cash needs. Ford Credit’s cash, cash equivalents, and marketable securities (excluding marketable securities related to insurance activities) primarily include U.S. Treasury obligations, federal agency securities, bank time deposits with investment-grade institutions and non-U.S. central banks, corporate investment-grade securities, A-1/P-1 (or higher) rated commercial paper, debt obligations of a select group of non-U.S. governments, non-U.S. government agencies, supranational institutions, and money market funds that carry the highest possible ratings. The maturity of these investments ranges from about 90 days to up to about one year and is adjusted based on market conditions and liquidity needs. Ford Credit monitors its cash levels and average maturity on a daily basis. Cash, cash equivalents, and marketable securities include amounts to be used only to support Ford Credit’s securitization transactions of $2.4 billion and $4.4 billion at September 30, 2014 and December 31, 2013, respectively.
63
Item 2. Management’s Discussion and Analysis of Financial Condition and Results of Operations (Continued)
Ford Credit’s substantial liquidity and cash balance have provided it the opportunity to selectively call and repurchase its unsecured and asset-backed debt through market transactions. In the third quarter and first nine months of 2014, Ford Credit called an aggregate principal amount of $0 and $216 million, respectively, of its unsecured debt, none of which would have matured in 2014.
Committed Liquidity Programs
. Ford Credit and its subsidiaries, including FCE Bank plc (“FCE”), have entered into agreements with a number of bank-sponsored asset-backed commercial paper conduits (“conduits”) and other financial institutions. Such counterparties are contractually committed, at Ford Credit’s option, to purchase from Ford Credit eligible retail or wholesale assets or to purchase or make advances under asset-backed securities backed by retail financing, operating leases, or wholesale financing assets for proceeds of up to $33 billion ($20.7 billion of retail financing, $7 billion of wholesale financing, and $5.3 billion of operating lease assets) at September 30, 2014, of which $5.4 billion are commitments to FCE. These committed liquidity programs have varying maturity dates, with $19.6 billion (of which $4.1 billion relates to FCE commitments) having maturities within the next 12 months and the remaining balance having maturities through 2017. Ford Credit plans to achieve capacity renewals to protect its global funding needs, optimize capacity utilization, and maintain sufficient liquidity.
Ford Credit’s ability to obtain funding under these programs is subject to having a sufficient amount of assets eligible for these programs as well as its ability to obtain interest rate hedging arrangements for certain securitization transactions. Ford Credit’s capacity in excess of eligible receivables protects it against the risk of lower than planned renewal rates. At September 30, 2014, $15.7 billion of these commitments were in use. These programs are free of material adverse change clauses, restrictive financial covenants (for example, debt-to-equity limitations and minimum net worth requirements), and generally, credit rating triggers that could limit Ford Credit’s ability to obtain funding. However, the unused portion of these commitments may be terminated if the performance of the underlying assets deteriorates beyond specified levels. Based on Ford Credit’s experience and knowledge as servicer of the related assets, Ford Credit does not expect any of these programs to be terminated due to such events.
Credit Facilities
. At September 30, 2014, Ford Credit and its majority-owned subsidiaries had $3.9 billion of contractually committed unsecured credit facilities with financial institutions, including the FAFC Credit Agreement (as defined below), the FCE Credit Agreement (as defined below), and the allocation under our revolving credit facility. At September 30, 2014, $3.2 billion was available for use.
On September 29, 2014, Ford Automotive Finance (China) Ltd. (“FAFC”) entered into a RMB 2 billion (equivalent to $0.3 billion at September 30, 2014) three-year syndicated term loan credit facility (the “FAFC Credit Agreement”), which became fully drawn on October 15, 2014. The FAFC Credit Agreement contains certain covenants, including an obligation for FAFC to maintain its capital adequacy ratio and core capital adequacy ratio at no less than the applicable regulatory minimums (currently 8.5% and 5.5%, respectively) and to comply with other regulatory requirements.
FCE’s £760 million (equivalent to $1.2 billion at September 30, 2014), syndicated credit facility (the “FCE Credit Agreement”) matures in 2017. At September 30, 2014, $0.6 billion was available for use. The FCE Credit Agreement contains certain covenants, including an obligation for FCE to maintain its ratio of regulatory capital to risk-weighted assets at no less than the applicable regulatory minimum, and for the support agreement between FCE and Ford Credit to remain in full force and effect (and enforced by FCE to ensure that its net worth is maintained at no less than $500 million). In addition to customary payment, representation, bankruptcy, and judgment defaults, the FCE Credit Agreement contains cross-payment and cross-acceleration defaults with respect to other debt.
As described above under “Liquidity and Capital Resources - Automotive Sector,” we have allocated $2 billion of commitments under the revolving credit facility to Ford Credit to grow its overall liquidity, supporting growth and expanded funding programs. At September 30, 2014, all $2 billion was available for use.
64
Item 2. Management’s Discussion and Analysis of Financial Condition and Results of Operations (Continued)
Leverage.
Ford Credit uses leverage, or the debt-to-equity ratio, to make various business decisions, including evaluating and establishing pricing for finance receivable and operating lease financing, and assessing its capital structure. Ford Credit refers to its shareholder’s interest as equity.
The following table shows the calculation of Ford Credit’s financial statement leverage (in billions, except for ratios):
|
September 30,
2014
|
December 31, 2013
|
||||||
|
Total debt (a)
|
$
|
104.0
|
|
$
|
98.7
|
|
|
|
Equity
|
11.3
|
|
10.6
|
|
|||
|
Financial statement leverage (to 1)
|
9.2
|
|
9.3
|
|
|||
__________
|
(a)
|
Includes debt issued in securitization transactions and payable only out of collections on the underlying securitized assets and related enhancements. Ford Credit holds the right to receive the excess cash flows not needed to pay the debt issued by, and other obligations of, the securitization entities that are parties to those securitization transactions.
|
The following table shows the calculation of Ford Credit’s managed leverage (in billions, except for ratios):
|
September 30,
2014
|
December 31, 2013
|
||||||
|
Total debt (a)
|
$
|
104.0
|
|
$
|
98.7
|
|
|
|
Adjustments for cash, cash equivalents, and marketable securities (b)
|
(10.6
|
)
|
(10.8
|
)
|
|||
|
Adjustments for derivative accounting (c)
|
(0.3
|
)
|
(0.2
|
)
|
|||
|
Total adjusted debt
|
$
|
93.1
|
|
$
|
87.7
|
|
|
|
Equity
|
$
|
11.3
|
|
$
|
10.6
|
|
|
|
Adjustments for derivative accounting (c)
|
(0.3
|
)
|
(0.3
|
)
|
|||
|
Total adjusted equity
|
$
|
11.0
|
|
$
|
10.3
|
|
|
|
Managed leverage (to 1) (d)
|
8.5
|
|
8.5
|
|
|||
__________
|
(a)
|
Includes debt issued in securitization transactions and payable only out of collections on the underlying securitized assets and related enhancements. Ford Credit holds the right to receive the excess cash flows not needed to pay the debt issued by, and other obligations of, the securitization entities that are parties to those securitization transactions.
|
|
(b)
|
Excludes marketable securities related to insurance activities.
|
|
(c)
|
Primarily related to market valuation adjustments to derivatives due to movements in interest rates. Adjustments to debt are related to designated fair value hedges and adjustments to equity are related to retained earnings.
|
|
(d)
|
Equals total adjusted debt over total adjusted equity.
|
Ford Credit plans its managed leverage by considering prevailing market conditions and the risk characteristics of its business. At September 30,
2014, Ford Credit’s managed leverage was 8.5:1, equal to December
31,
2013.
65
Item 2. Management’s Discussion and Analysis of Financial Condition and Results of Operations (Continued)
Company
Equity.
At
September 30, 2014
,
Total equity attributable to Ford Motor Company
was $26.1 billion, about equal compared with
December 31, 2013
. This reflects favorable changes in
Retained earnings
, related to first nine months 2014
Net income attributable to Ford Motor Company
of $3.1 billion, offset partially by cash dividends declared of $1.5 billion; favorable changes in
Capital in excess of par value of stock,
related to compensation-related equity issuances of about $300 million; favorable changes in
Accumulated other comprehensive income/(loss)
of about $100 million; and an increase in
Treasury stock
related to stock re-purchases of $2 billion.
Credit Ratings.
Our short-term and long-term debt is rated by four credit rating agencies designated as nationally recognized statistical rating organizations (“NRSROs”) by the U.S. Securities and Exchange Commission:
|
•
|
DBRS Limited (“DBRS”);
|
|
•
|
Fitch, Inc. (“Fitch”);
|
|
•
|
Moody’s Investors Service, Inc. (“Moody’s”); and
|
|
•
|
Standard & Poor’s Ratings Services, a division of The McGraw-Hill Companies, Inc. (“S&P”).
|
In several markets, locally recognized rating agencies also rate us. A credit rating reflects an assessment by the rating agency of the credit risk associated with a corporate entity or particular securities issued by that entity. Rating agencies’ ratings of us are based on information provided by us and other sources. Credit ratings are not recommendations to buy, sell, or hold securities, and are subject to revision or withdrawal at any time by the assigning rating agency. Each rating agency may have different criteria for evaluating company risk and, therefore, ratings should be evaluated independently for each rating agency. Lower credit ratings generally result in higher borrowing costs and reduced access to capital markets.
The following ratings actions have been taken on us by these NRSROs since the filing of our Quarterly Report on Form 10-Q for the quarter ended June 30, 2014:
|
•
|
On October 1, 2014, Fitch affirmed its ratings for Ford and Ford Credit, and maintained a positive outlook for both.
|
The following chart summarizes certain of the credit ratings and outlook presently assigned by these four NRSROs:
|
NRSRO RATINGS
|
|||||||||||||
|
Ford
|
Ford Credit
|
NRSROs
|
|||||||||||
|
Issuer
Default /
Corporate /
Issuer Rating
|
Long-Term Senior Unsecured
|
Outlook / Trend
|
Long-Term Senior Unsecured
|
Short-Term
Unsecured
|
Outlook / Trend
|
Minimum Long-Term Investment Grade Rating
|
|||||||
|
DBRS
|
BBB (low)
|
BBB (low)
|
Stable
|
BBB (low)
|
R-3
|
Stable
|
BBB (low)
|
||||||
|
Fitch
|
BBB-
|
BBB-
|
Positive
|
BBB-
|
F3
|
Positive
|
BBB-
|
||||||
|
Moody’s
|
N/A
|
Baa3
|
Stable
|
Baa3
|
P-3
|
Stable
|
Baa3
|
||||||
|
S&P *
|
BBB-
|
BBB-
|
Stable
|
BBB-
|
A-3
|
Stable
|
BBB-
|
||||||
__________
|
*
|
S&P assigns FCE a long-term senior unsecured credit rating of BBB, a one-notch higher rating than Ford and Ford Credit, with a stable outlook.
|
66
Item 2. Management’s Discussion and Analysis of Financial Condition and Results of Operations (Continued)
PRODUCTION VOLUMES (a)
Our third quarter 2014 production volumes and fourth quarter 2014 projected production volumes are as follows (in thousands):
|
2014
|
||||||||||||
|
Third Quarter
Actual
|
Fourth Quarter
Forecast
|
|||||||||||
|
Units
|
O/(U) 2013
|
Units
|
O/(U) 2013
|
|||||||||
|
North America
|
695
|
|
(56
|
)
|
715
|
|
(41
|
)
|
||||
|
South America
|
97
|
|
(28
|
)
|
108
|
|
4
|
|
||||
|
Europe
|
326
|
|
3
|
|
320
|
|
(13
|
)
|
||||
|
Middle East & Africa
|
20
|
|
7
|
|
19
|
|
2
|
|
||||
|
Asia Pacific
|
352
|
|
17
|
|
375
|
|
13
|
|
||||
|
Total
|
1,490
|
|
(57
|
)
|
|
1,537
|
|
(35
|
)
|
|||
__________
(a) Includes production of Ford and JMC brand vehicles produced by our unconsolidated affiliates.
In the third quarter, total company production was about 1.5 million units, 57,000 units lower than a year ago. This was 45,000 units lower than our previous guidance.
The company expects fourth quarter production to be about 1.5 million units, down 35,000 units from a year ago because of planned shutdowns, including three weeks of downtime at the Dearborn Truck Plant for the new F-150. Compared with the third quarter, fourth quarter production is up 47,000 units. The increase is largely driven by the launch of new and freshened products, including Transit and Mustang.
67
Item 2. Management’s Discussion and Analysis of Financial Condition and Results of Operations (Continued)
OUTLOOK
Business Environment
We project global economic growth to be in the 2.5% range, with conditions in Europe and South America of particular concern. Global industry sales are expected to be about 87 million units. U.S. economic indicators and industry sales have remained steady through the third quarter, consistent with economic growth in the 3% range. In South America, Brazil is in a recession with post-election related policy uncertainty. Negative growth also is expected in Argentina and Venezuela with ongoing policy and exchange risks. In Europe, incoming data has weakened, with Euro Area GDP growth projected to be less than 1% this year. Conditions in the U.K. are more favorable, with growth projected in the 3% range. The outlook for Russia is challenging and fluid, with very slow GDP growth, inflationary pressures, and a weaker currency. In Asia Pacific, China’s economic growth is projected in the 7.5% range, with the ongoing property market weakness reflected in our outlook for 2014; consumer sentiment supports continued growth in vehicle sales, but at a more modest pace in the second half of the year. With initial signs of improvement, growth in India is now projected to be in the 5% to 5.5% range. Challenges remain, however, with high inflation and interest rates as impediments to stronger growth.
2014 Key Metrics — Business Units
Our profit outlook for our business units, along with our outlook for net interest expense, is as follows:
|
Memo:
|
||||||||||||||
|
2013
|
2014 Full Year
|
2014 First
|
||||||||||||
|
Full Year
|
Compared with 2013
|
Nine Months
|
||||||||||||
|
Results
|
Plan
|
Outlook
|
Results
|
|||||||||||
|
Automotive
(Mils.) (a)
|
||||||||||||||
|
North America
|
$
|
8,809
|
|
Lower
|
On Track
|
$
|
5,350
|
|
||||||
|
- Operating Margin
|
10.2
|
|
%
|
8 - 9%
|
Low End Of Range
|
8.7
|
|
%
|
||||||
|
South America
|
$
|
(33
|
)
|
About Equal
|
About $(1,000)
|
$
|
(975
|
)
|
||||||
|
Europe
|
(1,442
|
)
|
Better
|
About $(1,200)
|
(619
|
)
|
||||||||
|
Middle East & Africa
|
(69
|
)
|
About Breakeven
|
On Track
|
62
|
|
||||||||
|
Asia Pacific
|
327
|
|
About Equal
|
About $700
|
494
|
|
||||||||
|
Net Interest Expense
|
(801
|
)
|
About Equal
|
About $(700)
|
(500
|
)
|
||||||||
|
Ford Credit
(Mils.)
|
$
|
1,756
|
|
About Equal
|
$1,800 - $1,900
|
$
|
1,431
|
|
||||||
__________
(a) Excludes special items
68
Item 2. Management’s Discussion and Analysis of Financial Condition and Results of Operations (Continued)
2014 Planning Assumptions and Key Metrics
Based on the current economic environment, our planning assumptions and key metrics for 2014 include the following:
|
Memo:
|
||||||||||||||
|
2013
|
2014
|
2014 First
|
||||||||||||
|
Full Year
|
Full Year
|
Nine Months
|
||||||||||||
|
Results
|
Plan
|
Outlook
|
Results
|
|||||||||||
|
Planning Assumptions
(Mils.)
|
||||||||||||||
|
Industry Volume (a) -- U.S.
|
15.9
|
|
16.0 - 17.0
|
16.8
|
16.7
|
|
||||||||
|
-- Europe 20
|
13.8
|
|
13.5 - 14.5
|
14.5
|
14.5
|
|
||||||||
|
-- China
|
22.2
|
|
22.5 - 24.5
|
23.8
|
23.5
|
|
||||||||
|
Key Metrics
|
||||||||||||||
|
Automotive (Compared with 2013):
|
||||||||||||||
|
- Revenue (Bils.)
|
$
|
139.4
|
|
About Equal
|
On Track
|
$
|
102.0
|
|
||||||
|
- Operating Margin (b)
|
5.4
|
|
%
|
Lower
|
On Track
|
4.2
|
|
%
|
||||||
|
- Operating-Related Cash Flow (Bils.) (c)
|
$
|
6.1
|
|
Substantially Lower
|
Lower
|
$
|
3.1
|
|
||||||
|
Ford Credit (Compared with 2013):
|
||||||||||||||
|
- Pre-Tax Profit (Bils.)
|
$
|
1.8
|
|
About Equal
|
$1.8 - $1.9
|
$
|
1.4
|
|
||||||
|
Company:
|
||||||||||||||
|
- Pre-Tax Profit (Bils.) (c)
|
$
|
8.6
|
|
$7 - $8
|
About $6
|
$
|
5.2
|
|
||||||
__________
|
(a)
|
Based, in part, on estimated vehicle registrations; includes medium and heavy trucks
|
|
(b)
|
Automotive operating margin is defined as Automotive pre-tax results, excluding special items and Other Automotive, divided by Automotive revenue
|
|
(c)
|
Excludes special items; reconciliation to GAAP provided in “Results of Operations” and “Liquidity and Capital Resources” above
|
For 2014, we now expect full year industry volume of about 16.8 million units in the U.S., about 14.5 million units in the Europe 20 markets, and about 23.8 million units in China.
In terms of our financial performance, we continue to expect Automotive revenue to be about equal to 2013, Automotive operating margin to be lower than 2013, and Automotive operating-related cash flow to be lower than 2013, including capital spending of about $7.5 billion.
We continue to expect Ford Credit pre-tax profit of $1.8 billion to $1.9 billion.
We also continue to expect our full-year operating effective tax rate to be about 35%, assuming retroactive extension of U.S. research credit legislation in the fourth quarter.
This year is a critical building block in the One Ford plan. We continue to expect our full year total pre-tax profit, excluding special items, to be about $6 billion. We are on track with our record 23 global new product launches in preparation for a more profitable 2015.
69
Item 2. Management’s Discussion and Analysis of Financial Condition and Results of Operations (Continued)
2015 Planning Assumptions and Key Metrics
Based on the current economic environment, our planning assumptions and key metrics for 2015 include the following:
|
Outlook
|
||
|
Planning Assumptions
(Mils.)
|
||
|
Industry Volume (a) -- U.S.
|
16.8 - 17.5
|
|
|
-- Europe 20
|
14.8 - 15.3
|
|
|
-- China
|
24.0 - 26.0
|
|
|
Key Metrics
|
||
|
Automotive:
|
||
|
- Revenue
|
Higher (c)
|
|
|
- Operating Margin (b)
|
Higher (c)
|
|
|
- Operating-Related Cash Flow (b)
|
Positive
|
|
|
Ford Credit:
|
||
|
- Pre-Tax Profit
|
Equal To Or Higher (c)
|
|
|
Company:
|
||
|
- Pre-Tax Profit (Bils.) (b)
|
$8.5 - $9.5
|
|
|
__________
|
||
|
(a)
|
Includes medium and heavy trucks
|
|
|
(b)
|
Excludes special items
|
|
|
(c)
|
Compared with 2014
|
|
In 2015, we expect to realize the benefits of our global product investment and growth strategies, and will continue our strong product push with 16 global vehicle launches. We expect total pre-tax profit, excluding special items, to be significantly higher — in the $8.5 billion to $9.5 billion range — with all five Automotive regions improving on 2014 results.
ONE FORD PLAN
We remain focused on delivering the key aspects of the One Ford plan, which are unchanged:
|
•
|
Aggressively restructure to operate profitably at the current demand and changing model mix;
|
|
•
|
Accelerate development of new products our customers want and value;
|
|
•
|
Finance our plan and improve our balance sheet; and
|
|
•
|
Work together effectively as one team, leveraging our global assets.
|
70
Item 2. Management’s Discussion and Analysis of Financial Condition and Results of Operations (Continued)
Risk Factors
Statements included or incorporated by reference herein may constitute “forward-looking statements” within the meaning of the Private Securities Litigation Reform Act of 1995. Forward-looking statements are based on expectations, forecasts, and assumptions by our management and involve a number of risks, uncertainties, and other factors that could cause actual results to differ materially from those stated, including, without limitation:
|
•
|
Decline in industry sales volume, particularly in the United States or Europe, due to financial crisis, recession, geopolitical events, or other factors;
|
|
•
|
Decline in Ford’s market share or failure to achieve growth;
|
|
•
|
Lower-than-anticipated market acceptance of Ford’s new or existing products;
|
|
•
|
Market shift away from sales of larger, more profitable vehicles beyond Ford’s current planning assumption, particularly in the United States;
|
|
•
|
An increase in or continued volatility of fuel prices, or reduced availability of fuel;
|
|
•
|
Continued or increased price competition resulting from industry excess capacity, currency fluctuations, or other factors;
|
|
•
|
Fluctuations in foreign currency exchange rates, commodity prices, and interest rates;
|
|
•
|
Adverse effects resulting from economic, geopolitical, or other events;
|
|
•
|
Economic distress of suppliers that may require Ford to provide substantial financial support or take other measures to ensure supplies of components or materials and could increase costs, affect liquidity, or cause production constraints or disruptions;
|
|
•
|
Work stoppages at Ford or supplier facilities or other limitations on production (whether as a result of labor disputes, natural or man-made disasters, tight credit markets or other financial distress, production constraints or difficulties, or other factors);
|
|
•
|
Single-source supply of components or materials;
|
|
•
|
Labor or other constraints on Ford’s ability to maintain competitive cost structure;
|
|
•
|
Substantial pension and postretirement health care and life insurance liabilities impairing liquidity or financial condition;
|
|
•
|
Worse-than-assumed economic and demographic experience for postretirement benefit plans (e.g., discount rates or investment returns);
|
|
•
|
Restriction on use of tax attributes from tax law “ownership change;”
|
|
•
|
The discovery of defects in vehicles resulting in delays in new model launches, recall campaigns, or increased warranty costs;
|
|
•
|
Increased safety, emissions, fuel economy, or other regulations resulting in higher costs, cash expenditures, and/or sales restrictions;
|
|
•
|
Unusual or significant litigation, governmental investigations, or adverse publicity arising out of alleged defects in products, perceived environmental impacts, or otherwise;
|
|
•
|
A change in requirements under long-term supply arrangements committing Ford to purchase minimum or fixed quantities of certain parts, or to pay a minimum amount to the seller (“take-or-pay” contracts);
|
|
•
|
Adverse effects on results from a decrease in or cessation or clawback of government incentives related to investments;
|
|
•
|
Inherent limitations of internal controls impacting financial statements and safeguarding of assets;
|
|
•
|
Cybersecurity risks to operational systems, security systems, or infrastructure owned by Ford, Ford Credit, or a third-party vendor or supplier;
|
|
•
|
Failure of financial institutions to fulfill commitments under committed credit and liquidity facilities;
|
|
•
|
Inability of Ford Credit to access debt, securitization, or derivative markets around the world at competitive rates or in sufficient amounts, due to credit rating downgrades, market volatility, market disruption, regulatory requirements, or other factors;
|
|
•
|
Higher-than-expected credit losses, lower-than-anticipated residual values, or higher-than-expected return volumes for leased vehicles;
|
|
•
|
Increased competition from banks or other financial institutions seeking to increase their share of financing Ford vehicles; and
|
|
•
|
New or increased credit, consumer, or data protection or other regulations resulting in higher costs and/or additional financing restrictions.
|
We cannot be certain that any expectation, forecast, or assumption made in preparing forward-looking statements will prove accurate, or that any projection will be realized. It is to be expected that there may be differences between projected and actual results. Our forward-looking statements speak only as of the date of their initial issuance, and we do not undertake any obligation to update or revise publicly any forward-looking statement, whether as a result of new information, future events, or otherwise. For additional discussion, see “Item 1A. Risk Factors” in our 2013 Form 10-K report, as updated by our subsequent Quarterly Reports on Form 10-Q and Current Reports on Form 8-K.
71
Item 2. Management’s Discussion and Analysis of Financial Condition and Results of Operations (Continued)
ACCOUNTING STANDARDS ISSUED BUT NOT YET ADOPTED
For information on accounting standards issued but not yet adopted, see Note 2 of the Notes to the Financial Statements.
OTHER FINANCIAL INFORMATION
The interim financial information included in this Quarterly Report on Form 10-Q for the periods ended
September 30, 2014
and 2013 has not been audited by PricewaterhouseCoopers LLP (“PwC”). In reviewing such information, PwC has applied limited procedures in accordance with professional standards for reviews of interim financial information. Readers should restrict reliance on PwC’s reports on such information accordingly. PwC is not subject to the liability provisions of Section 11 of the Securities Act of 1933 for its reports on interim financial information, because such reports do not constitute “reports” or “parts” of registration statements prepared or certified by PwC within the meaning of Sections 7 and 11 of the Securities Act of 1933.
ITEM 3.
Quantitative and Qualitative Disclosures About Market Risk.
Automotive Sector
Foreign Currency Risk.
The net fair value of foreign exchange forward contracts (including adjustments for credit risk), as of
September 30, 2014
, was a liability of $154 million compared with an asset of $158 million as of
December 31, 2013
. The potential decrease in fair value from a 10% adverse change in the underlying exchange rates, in U.S. dollar terms, would be $2.2 billion at
September 30, 2014
, compared with $2 billion at
December 31, 2013
.
Commodity Price Risk.
The net fair value of commodity forward and option contracts (including adjustments for credit risk) as of
September 30, 2014
was a liability of $8 million, compared with an asset of $4 million as of
December 31, 2013
. The potential decrease in fair value from a 10% adverse change in the underlying commodity prices, in U.S. dollar terms, would be $64 million at
September 30, 2014
, compared with $70
million at
December 31, 2013
.
Financial Services Sector
Interest Rate Risk
. To provide a quantitative measure of the sensitivity of Ford Credit’s pre-tax cash flow to changes
in interest rates, Ford Credit uses interest rate scenarios that assume a hypothetical, instantaneous increase or decrease
of one percentage point
in all interest rates across all maturities (a “parallel shift”), as well as a base case that assumes
that all interest rates remain constant at existing levels
.
The differences in pre-tax cash flow between these
scenarios and the base case over a twelve-month period represent an estimate of the sensitivity of Ford Credit’s pre-tax
cash flow
.
Under this model, Ford Credit estimates that at
September 30, 2014
, all else constant, such an increase in
interest rates would decrease its pre-tax cash flow by $34 million over the next 12 months, compared with an increase
of $63 million at
December 31, 2013
.
In reality, interest rate changes are rarely
instantaneous or parallel and rates could move more or less than the one percentage point assumed in Ford Credit’s
analysis. As a result, the actual impact to pre-tax cash flow could be higher or lower than the results detailed above.
ITEM 4.
Controls and Procedures.
Evaluation of Disclosure Controls and Procedures.
Mark Fields, our Chief Executive Officer (“CEO”), and Bob Shanks, our Chief Financial Officer (“CFO”), have performed an evaluation of the Company’s disclosure controls and procedures, as that term is defined in Rule 13a-15(e) of the Securities Exchange Act of 1934, as amended (“Exchange Act”), as of September 30, 2014, and each has concluded that such disclosure controls and procedures are effective to ensure that information required to be disclosed in our periodic reports filed under the Exchange Act is recorded, processed, summarized, and reported within the time periods specified by SEC rules and forms, and that such information is accumulated and communicated to the CEO and CFO to allow timely decisions regarding required disclosures.
Changes in Internal Control over Financial Reporting.
There were no changes in internal control over financial reporting during the quarter ended September 30, 2014 that have materially affected, or are reasonably likely to materially affect, our internal control over financial reporting.
72
PART II. OTHER INFORMATION
ITEM 1.
Legal Proceedings.
OTHER MATTERS
Apartheid Litigation (as previously reported on page 28 of our 2013 Form 10-K Report).
As previously reported, we are a defendant in purported class action lawsuits seeking unspecified damages on behalf of South African citizens who suffered violence and oppression under South Africa’s apartheid regime. The lawsuits allege that the defendant companies aided and abetted the apartheid regime and its human rights violations. On August 28, 2014, the District Court denied plaintiffs' motions for leave to amend their complaints and dismissed the complaints with prejudice. Plaintiffs have appealed.
ITEM 1A.
Risk Factors.
In Item 1A of our 2013 Form 10-K Report, we included the risk factor “
New or increased credit, consumer, or data protection or other regulations resulting in higher costs and/or additional financing restrictions.
” The following is an update to that risk factor:
In September 2014, the Consumer Financial Protection Bureau (“CFPB”) proposed supervising the largest nonbank automotive finance companies, such as Ford Credit, which is the initial step that is expected to lead to examinations of such nonbank automotive finance companies for compliance with consumer finance protection laws as early as 2015.
ITEM 2.
Unregistered Sales of Equity Securities and Use of Proceeds.
In May 2014, we announced a share repurchase program for up to approximately 116 million shares of our Common Stock. The program was completed in August 2014. About 103 million shares were repurchased to offset the dilutive effect of our 4.25% Senior Convertible Notes due Nov. 15, 2016, and 12.6 million shares were repurchased to offset the dilutive effect of share-based employee incentive compensation granted in 2014. During the third quarter of 2014, we repurchased shares of Ford Common Stock as follows:
|
Period
|
Total Number
of Shares
Purchased
|
Average
Price Paid
per Share
|
Total Number
of Shares
Purchased as
Part of Publicly-
Announced
Plans or
Programs
|
Maximum Number
(or Approximate
Dollar Value) of
Shares that May Yet
Be Purchased Under
the Plans or
Programs
|
||||||||
|
July 1, 2014 through July 31, 2014
|
39,599,884
|
|
$
|
17.54
|
|
39,599,884
|
|
18.4 million shares
|
|
|||
|
August 1, 2014 through August 31, 2014
|
18,400,116
|
|
17.11
|
|
18,400,116
|
|
—
|
|
||||
|
September 1, 2014 through September 30, 2014
|
—
|
|
—
|
|
—
|
|
—
|
|
||||
|
Total/Average
|
58,000,000
|
|
$
|
17.40
|
|
58,000,000
|
|
|||||
ITEM 6.
Exhibits.
Please see exhibit index below.
73
SIGNATURE
Pursuant to the requirements of Section 13 or 15(d) of the Securities Exchange Act of 1934, as amended, Ford has duly caused this Report to be signed on its behalf by the undersigned, thereunto duly authorized.
FORD MOTOR COMPANY
|
By:
|
/s/ Stuart Rowley
|
|
|
Stuart Rowley, Vice President and Controller
|
|
|
(principal accounting officer)
|
|
|
|
|
Date:
|
October 31, 2014
|
74
EXHIBIT INDEX
|
Designation
|
|
Description
|
|
Method of Filing
|
|
Exhibit 12
|
|
Calculation of Ratio of Earnings to Fixed Charges.
|
|
Filed with this Report.
|
|
Exhibit 15
|
Letter of PricewaterhouseCoopers LLP, dated October 31, 2014, relating to financial information.
|
Filed with this Report.
|
||
|
Exhibit 31.1
|
|
Rule 15d-14(a) Certification of CEO.
|
|
Filed with this Report.
|
|
Exhibit 31.2
|
|
Rule 15d-14(a) Certification of CFO.
|
|
Filed with this Report.
|
|
Exhibit 32.1
|
|
Section 1350 Certification of CEO.
|
|
Furnished with this Report.
|
|
Exhibit 32.2
|
|
Section 1350 Certification of CFO.
|
|
Furnished with this Report.
|
|
Exhibit 101.INS
|
|
XBRL Instance Document.
|
|
*
|
|
Exhibit 101.SCH
|
|
XBRL Taxonomy Extension Schema Document.
|
|
*
|
|
Exhibit 101.CAL
|
|
XBRL Taxonomy Extension Calculation Linkbase Document.
|
|
*
|
|
Exhibit 101.LAB
|
|
XBRL Taxonomy Extension Label Linkbase Document.
|
|
*
|
|
Exhibit 101.PRE
|
|
XBRL Taxonomy Extension Presentation Linkbase Document.
|
|
*
|
|
Exhibit 101.DEF
|
|
XBRL Taxonomy Extension Definition Linkbase Document.
|
|
*
|
__________
* Submitted electronically with this Report in accordance with the provisions of Regulation S-T.
75
TABLE OF CONTENTS
Part I. Financial InformationItem 1. Financial StatementsItem 1. Financial Statements (continued)Item 1. Financial Statements (continued) Ford Motor Company and Subsidiaries Notes To The Financial StatementsNote 1. PresentationNote 1. Presentation (continued)Note 2. Accounting Standards Issued But Not Yet AdoptedNote 3. Fair Value MeasurementsNote 17 For Additional InformationNote 3. Fair Value Measurements (continued)Note 4. Financial Services Sector Finance ReceivablesNote 4. Financial Services Sector Finance Receivables (continued)Note 5. Financial Services Sector Allowance For Credit LossesNote 6. InventoriesNote 7. Variable Interest EntitiesNote 8. Other Liabilities and Deferred RevenueNote 9. Retirement BenefitsNote 10. DebtNote 11. Derivative Financial Instruments and Hedging ActivitiesNote 11. Derivative Financial Instruments and Hedging Activities (continued)Note 12. Redeemable Noncontrolling InterestNote 13. Accumulated Other Comprehensive Income/(loss)Note 14. Other Income/(loss)Note 15. Employee Separation Actions and Exit and Disposal ActivitiesNote 15. Employee Separation Actions and Exit and Disposal Activities (continued)Note 16. Income TaxesNote 17. Changes in Investments in Affiliates and Assets Held For SaleNote 18. Capital Stock and Amounts Per ShareNote 18. Capital Stock and Amounts Per Share (continued)Note 19. Segment InformationNote 19. Segment Information (continued)Note 20. Commitments and ContingenciesNote 20. Commitments and Contingencies (continued)Item 2. Management S Discussion and Analysis Of Financial Condition and Results Of OperationsItem 2. Management S Discussion and Analysis Of Financial Condition and Results Of Operations (continued)Item 3. Quantitative and Qualitative Disclosures About Market RiskItem 4. Controls and ProceduresPart II. Other InformationItem 1. Legal ProceedingsItem 1A. Risk FactorsItem 2. Unregistered Sales Of Equity Securities and Use Of ProceedsItem 6. Exhibits